SECURITIES AND EXCHANGE COMMISSION
Washington, D.C. 20549
FORM 20-F
| (Mark One) | |||||
| REGISTRATION STATEMENT PURSUANT TO SECTION 12(b) OR (g) OF THE SECURITIES EXCHANGE ACT OF 1934 | |||||
| OR | |||||
| ANNUAL REPORT PURSUANT TO SECTION 13 OR 15(d) OF THE SECURITIES EXCHANGE ACT OF 1934 | |||||
For the fiscal year ending | |||||
| OR | |||||
| TRANSITION REPORT PURSUANT TO SECTION 13 OR 15(d) OF THE SECURITIES EXCHANGE ACT OF 1934 | |||||
For the transition period from to
| SHELL COMPANY REPORT PURSUANT TO SECTION 13 OR 15(d) OF THE SECURITIES EXCHANGE ACT OF 1934 | |||||
Date of event requiring this shell company report
Commission file number 001-12518
(Exact name of Registrant as specified in its charter)
Kingdom of Spain
(Jurisdiction of incorporation)
(address of principal executive offices)
Banco Santander, S.A.
Tel: +34 91 259 65 20
(Name, Telephone, E-mail and/or Facsimile number and Address of Company Contact Person)
Securities registered or to be registered, pursuant to Section 12(b) of the Act
| Title of each class | Name of each exchange on which registered | |||||||
| Not applicable | ||||||||
*Banco Santander Shares are not listed for trading, but are only listed in connection with the registration of the American Depositary Shares, pursuant to requirements of the New York Stock Exchange.
Securities registered or to be registered pursuant to Section 12(g) of the Act: None (Title of Class)
Securities for which there is a reporting obligation pursuant to Section 15(d) of the Act: None (Title of Class)
Indicate the number of outstanding shares of each of the issuer’s classes of capital stock or common stock as of the close of business covered by the annual report 16,184,146,059 shares
Indicate by check mark if the registrant is a well-known seasoned issuer, as defined in Rule 405 of the Securities Act. Yes ☒ No ☐
If this report is an annual or transition report, indicate by check mark if the registrant is not required to file reports pursuant to Section 13 or 15(d) of the Securities Exchange Act of 1934. Yes ☐ No ☒
Indicate by check mark whether the registrant (1) has filed all reports required to be filed by Section 13 or 15(d) of the Securities Exchange Act of 1934 during the preceding 12 months (or for such shorter period that the registrant was required to file such reports), and (2) has been subject to such filing requirements for the past 90 days. Yes ☒ No ☐
Indicate by check mark whether the registrant has submitted electronically every Interactive Data File required to be submitted pursuant to Rule 405 of Regulation S-T during the preceding 12 months (or for such shorter period that the registrant was required to submit such files). Yes ☒ No ☐
Indicate by check mark whether the registrant is a large accelerated filer, an accelerated filer, a non-accelerated filer, or an emerging growth company. See definition of “large accelerated filer”, "accelerated filer", and "emerging growth company" in Rule 12b-2 of the Exchange Act. (Check one):
Accelerated filer ☐ | Non-accelerated filer ☐ | |||||||
Emerging growth company ☐
If an emerging growth company that prepares its financial statements in accordance with U.S. GAAP, indicate by check mark if the registrant has elected not to use the extended transition period for complying with any new or revised financial accounting standards† provided pursuant to Section 13(a) of the Exchange Act. ☐
† The term “new or revised financial accounting standard” refers to any update issued by the Financial Accounting Standards Board to its Accounting Standards Codification after April 5, 2012.
Indicate by check mark whether the registrant has filed a report on and attestation to its management’s assessment of the effectiveness of its internal
control over financial reporting under Section 404(b) of the Sarbanes-Oxley Act (15 U.S.C. 7262(b)) by the registered public accounting firm that prepared or issued its
audit report. Yes ☒ No ☐
If securities are registered pursuant to Section 12(b) of the Act, indicate by check mark whether the financial statements of the registrant included in the filing reflect the correction of an error to previously issued financial statements. ☐
Indicate by check mark whether any of those error corrections are restatements that required a recovery analysis of incentive-based compensation received by any of the registrant’s executive officers during the relevant recovery period pursuant to §240.10D-1(b). ☐
Indicate by check mark which basis of accounting the registrant has used to prepare the financial statements included in this filing:
U.S. GAAP ☐ | Other ☐ | |||||||
If “Other” has been checked in response to the previous question indicate by check mark which financial statement item the registrant has elected to follow. Item 17 ☐ Item 18 ☐
If this is an annual report, indicate by check mark whether the registrant is a shell company (as defined in Rule 12b-2 of the Exchange Act). Yes ☐No ☒
| Cross-reference to Form 20-F | Consolidated directors' report | Consolidated financial statements | Supplemental information | |||||||||||||||||
BANCO SANTANDER, S.A.
This annual report on Form 20-F for the year ended 31 December 2023, includes two parts: (i) consolidated directors’ report, auditor's report and consolidated financial statements, and (ii) supplemental information. Set forth below is a table listing the required items for Form 20-F and the location where the relevant disclosure in this annual report can be found.
CROSS REFERENCE TO FORM 20-F
Form 20-F Item Number and Caption | Location | Page | |||||||||
Presentation of Financial and Other Information | |||||||||||
Cautionary Statement Regarding Forward-Looking Statements | |||||||||||
PART I | |||||||||||
ITEM 1. | IDENTITY OF DIRECTORS, SENIOR MANAGEMENT AND ADVISERS | ||||||||||
A. Directors and Senior Management | Not required for Annual Report on Form 20-F | - | |||||||||
B. Advisers | Not required for Annual Report on Form 20-F | - | |||||||||
C. Auditors | Not required for Annual Report on Form 20-F | - | |||||||||
ITEM 2. | OFFER STATISTICS AND EXPECTED TIMETABLE | ||||||||||
A. Offer Statistics | Not required for Annual Report on Form 20-F | - | |||||||||
B. Method and Expected Timetable | Not required for Annual Report on Form 20-F | - | |||||||||
ITEM 3. | KEY INFORMATION | ||||||||||
| Selected financial data | |||||||||||
| A. [Reserved] | |||||||||||
B. Capitalization and indebtedness | Not required for Annual Report on Form 20-F | - | |||||||||
C. Reasons for the offer and use of proceeds | Not required for Annual Report on Form 20-F | - | |||||||||
D. Risk factors | |||||||||||
ITEM 4. | INFORMATION ON THE COMPANY | ||||||||||
A. History and development of the company | |||||||||||
Acquisitions, Dispositions, Reorganizations | |||||||||||
Capital Increases | |||||||||||
Recent Events | |||||||||||
B. Business overview | |||||||||||
Selected Statistical information | |||||||||||
Competition in Spain | |||||||||||
Supervision and Regulation | |||||||||||
C. Organizational structure | |||||||||||
| D. Property, plants and equipment | |||||||||||
ITEM 4A. | UNRESOLVED STAFF COMMENTS | ||||||||||
ITEM 5. | OPERATING AND FINANCIAL REVIEW AND PROSPECTS | ||||||||||
| A. Operating results | |||||||||||
| B. Liquidity and capital resources | |||||||||||
| Tabular disclosure of contractual obligations | |||||||||||
| Off balance sheet arrangements | |||||||||||
| C. Research and development, patents and licenses, etc. | |||||||||||
| D. Trend information | |||||||||||
| Cross-reference to Form 20-F | Consolidated directors' report | Consolidated financial statements | Supplemental information | |||||||||||||||||
Form 20-F Item Number and Caption | Location | Page | |||||||||
| E. Critical accounting estimates | |||||||||||
ITEM 6. | DIRECTORS, SENIOR MANAGEMENT AND EMPLOYEES | ||||||||||
A. Directors and senior management | |||||||||||
B. Compensation | |||||||||||
C. Board practices | |||||||||||
D. Employees | |||||||||||
E. Share ownership | |||||||||||
| F. Disclosure of a registrant's action to recover erroneously awarded compensation | None | ||||||||||
ITEM 7. | MAJOR SHAREHOLDERS AND RELATED PARTY TRANSACTIONS | ||||||||||
A. Major shareholders | |||||||||||
B. Related party transactions | |||||||||||
C. Interests of experts and counsel | Not required for Annual Report on Form 20-F | - | |||||||||
ITEM 8. | FINANCIAL INFORMATION | ||||||||||
A. Consolidated statements and other financial information | |||||||||||
Financial statements | |||||||||||
Legal proceedings | |||||||||||
Shareholders remuneration | |||||||||||
B. Significant Changes | Not applicable | - | |||||||||
ITEM 9. | THE OFFER AND LISTING | ||||||||||
A. Offer and listing details | |||||||||||
B. Plan of distribution | Not required for Annual Report on Form 20-F | - | |||||||||
C. Markets | |||||||||||
D. Selling shareholders | Not required for Annual Report on Form 20-F | - | |||||||||
E. Dilution | Not required for Annual Report on Form 20-F | - | |||||||||
| F. Expenses of the issue | Not required for Annual Report on Form 20-F | - | |||||||||
ITEM 10. | ADDITIONAL INFORMATION | ||||||||||
A. Share capital | Not required for Annual Report on Form 20-F | - | |||||||||
B. Memorandum and articles of association | |||||||||||
C. Material contracts | |||||||||||
D. Exchange controls | |||||||||||
E. Taxation | |||||||||||
F. Dividends and paying agents | Not required for Annual Report on Form 20-F | - | |||||||||
G. Statement by experts | Not required for Annual Report on Form 20-F | - | |||||||||
H. Documents on display | |||||||||||
I. Subsidiary information | Not required for Annual Report on Form 20-F | - | |||||||||
| J. Annual report to security holders | Not required for Annual Report on Form 20-F | - | |||||||||
| Cross-reference to Form 20-F | Consolidated directors' report | Consolidated financial statements | Supplemental information | |||||||||||||||||
Form 20-F Item Number and Caption | Location | Page | |||||||||
ITEM 11. | QUANTITATIVE AND QUALITATIVE DISCLOSURES ABOUT MARKET RISK | ||||||||||
ITEM 12. | DESCRIPTION OF SECURITIES OTHER THAN EQUITY SECURITIES | ||||||||||
| A. Debt securities | Not required for Annual Report on Form 20-F | - | |||||||||
| B. Warrants and rights | Not required for Annual Report on Form 20-F | - | |||||||||
| C. Other securities | Not required for Annual Report on Form 20-F | - | |||||||||
D. American Depositary Shares | |||||||||||
PART II | |||||||||||
ITEM 13. | DEFAULTS, DIVIDEND ARREARAGES AND DELINQUENCIES | Not applicable | - | ||||||||
ITEM 14. | MATERIAL MODIFICATIONS TO THE RIGHTS OF SECURITY HOLDERS AND USE OF PROCEEDS | Not applicable | - | ||||||||
ITEM 15. | CONTROLS AND PROCEDURES | ||||||||||
ITEM 16 | [Reserved] | ||||||||||
| A. Audit committee financial expert | |||||||||||
| B. Code of ethics | |||||||||||
| C. Principal accountant fees and services | |||||||||||
| D. Exemptions from the listing standards for audit committees | Not applicable | - | |||||||||
| E. Purchases of equity securities by the issuer and affiliated purchasers | |||||||||||
| F. Change in registrant’s certifying accountant | Not applicable | - | |||||||||
| G. Corporate governance | |||||||||||
| H. Mine safety disclosure | Not applicable | - | |||||||||
| I. Disclosure regarding foreign jurisdictions that prevent inspections | Not applicable | - | |||||||||
| J. Insider trading policies | Not applicable | - | |||||||||
| K. Cybersecurity | |||||||||||
PART III | |||||||||||
ITEM 17. | FINANCIAL STATEMENTS | ||||||||||
ITEM 18. | FINANCIAL STATEMENTS | ||||||||||
ITEM 19 | EXHIBITS | ||||||||||
BANCO SANTANDER, S.A.
TABLE OF CONTENTS
| Part 1 | |||||
| Part 2 | |||||
Part 1.
Consolidated directors´ report, auditor's report and consolidated financial statements
Think Value
Think Customer
Think Global

2023 Annual report
santander.com 

2023 Annual report Unless otherwise specified, references in this annual report to other documents, including but not limited to other reports and websites, including our own, are for information purposes only. If the contents of such other documents and websites refer to this annual report, they are not nor should be considered part of it. Unless the context suggests otherwise, 'Banco Santander' means Banco Santander, S.A., and 'Santander', 'the Group' and 'Grupo Santander' mean Banco Santander, S.A. and subsidiaries. | ||||||||
Consolidated non-financial information statement
106 Sustainability reporting standards and references
507 ESG risk factors


2023 consolidated
directors’ report
directors’ report
This report was approved unanimously by our board of directors on 19 February 2024
Our approach to this document
We changed the layout of our consolidated directors’ report in 2018 to include the contents previously provided in these documents, which we no longer prepare separately:
•Annual report
•Consolidated directors’ report
•Annual corporate governance report (CNMV format document)
•Board committee reports
•Sustainability report
•Annual report on our directors’ remuneration (CNMV format document)
The consolidated directors’ report also includes all information required by Spanish Act 11/2018 on non-financial information and diversity. It can be found in the 'Responsible banking' chapter, which constitutes the consolidated non-financial information statement (NFI).
Non-IFRS and alternative performance measures
This report contains financial information prepared according to International Financial Reporting Standards (IFRS) and taken from our consolidated financial statements, as well as alternative performance measures (APMs) as defined in the Guidelines on Alternative Performance Measures issued by the European Securities and Markets Authority (ESMA) on 5 October 2015, and other non-IFRS measures. The APMs and non-IFRS measures were calculated with information from Grupo Santander; however, they are neither defined or detailed in the applicable financial reporting framework nor audited or reviewed by our auditors.
We use the APMs and non-IFRS measures when planning, monitoring and evaluating our performance. We consider them
to be useful metrics for our management and investors to compare operating performance between accounting periods.
Nonetheless, the APMs and non-IFRS measures are supplemental information; their purpose is not to substitute the IFRS measures. Furthermore, companies in our industry and others may calculate or use APMs and non-IFRS measures differently, thus making them less useful for comparison purposes.
For more details on APMs and non-IFRS measures, see section 8. 'Alternative performance measures (APMs)' of the 'Economic and financial review' chapter and section 9.8 'Alternative performance measures (APMs)' of the 'Responsible banking' chapter.
Non-financial information
This report contains, in addition to financial information, non-financial information (NFI), including environmental, social and governance-related metrics, statements, goals, commitments and opinions. The NFI can be found throughout the report but mostly in the 'Responsible banking' chapter.
NFI is included to comply with Spanish Act 11/2018 on non-financial information and diversity and to provide a broader view of our impact. NFI is prepared following various external and internal frameworks, reporting guidelines and measurement, collection and verification methods and practices, which are materially different from those applicable to financial information and are in many cases emerging and
evolving. NFI is based on various materiality thresholds, estimates, assumptions, judgments and underlying data derived internally and from third parties. NFI is thus subject to significant measurement uncertainties, may not be comparable to NFI of other companies or over time or across periods and its inclusion is not meant to imply that the information is fit for any particular purpose or that it is material to us under mandatory reporting standards. NFI is for informational purposes only, without any liability being accepted in connection with it except where such liability cannot be limited under overriding provisions of applicable law.
4
Forward-looking statements
Banco Santander hereby warns that this annual report contains 'forward-looking statements', as defined by the US Private Securities Litigation Reform Act of 1995. Such statements can be understood through words and expressions like 'expect', 'project', 'anticipate', 'should', 'intend', 'probability', 'risk', 'VaR', 'RoRAC', 'RoRWA', 'TNAV', 'target', 'goal', 'objective', 'estimate', 'future', 'commitment', 'commit', 'focus', 'pledge' and similar expressions. They include (but are not limited to) statements on future business development, shareholder remuneration policy and NFI. However, risks, uncertainties and other important factors may lead to developments and results that differ materially from those anticipated, expected, projected or assumed in forward-looking statements.
The important factors below (and others described elsewhere in this report), as well as other unknown or unpredictable factors, could affect our future development and results and could lead to outcomes materially different from what our forward-looking statements anticipate, expect, project or assume:
•general economic or industry conditions (e.g., an economic downturn; higher volatility in the capital markets; inflation; deflation; changes in demographics, consumer spending, investment or saving habits; and the effects of the war in Ukraine or the COVID-19 pandemic in the global economy) in areas where we have significant operations or investments;
•climate-related conditions, regulations, targets and weather events;
•exposure to market risks (e.g., risks from interest rates, foreign exchange rates, equity prices and new benchmark indices);
•potential losses from early loan repayment, collateral depreciation or counterparty risk;
•political instability in Spain, the UK, other European countries, Latin America and the US;
•legislative, regulatory or tax changes (including regulatory capital and liquidity requirements), especially in view of the UK's exit from the European Union and greater regulation prompted by financial crises;
•acquisition integration and challenges arising from deviating management’s resources and attention from other strategic opportunities and operational matters;
•uncertainty over the scope of actions that may be required by us, governments and other to achieve goals relating to climate, environmental and social matters, as well as the evolving nature of underlying science and industry and governmental standards and regulations; and
•changes affecting our access to liquidity and funding on acceptable terms, especially due to credit spread shifts or credit rating downgrade for the entire group or core subsidiaries.
Forward looking statements are based on current expectations and future estimates about Santander’s and third-parties’ operations and businesses and address matters that are uncertain to varying degrees, including, but not limited to developing standards that may change in the future; plans,
projections, expectations, targets, objectives, strategies and goals relating to environmental, social, safety and governance performance, including expectations regarding future execution of Santander’s and third parties’ energy and climate strategies, and the underlying assumptions and estimated impacts on Santander’s and third-parties’ businesses related thereto; Santander’s and third-parties’ approach, plans and expectations in relation to carbon use and targeted reductions of emissions; changes in operations or investments under existing or future environmental laws and regulations; and changes in government regulations and regulatory requirements, including those related to climate-related initiatives.
Forward-looking statements are aspirational, should be regarded as indicative, preliminary and for illustrative purposes only, speak only as of the date of approval of this annual report and are informed by the knowledge, information and views available on such date and are subject to change without notice. Banco Santander is not required to update or revise any forward-looking statements, regardless of new information, future events or otherwise, except as required by applicable law.
5
Past performance does not indicate future outcomes
Statements about historical performance or growth rates must not be construed as suggesting that future performance, share price or earnings (including earnings per share) will necessarily
be the same or higher than in a previous period. Nothing in this annual report should be taken as a profit and loss forecast.
Not a securities offer
This annual report and the information it contains does not constitute an offer to sell, nor a solicitation of an offer to buy any securities.
To facilitate a better understanding of this annual report, a glossary of terms, acronyms and abbreviations has been included at the end of the consolidated directors' report.
6
Business model and strategy | ||||||||||||||
 | ||||||||||||||
7
The Santander Way
 Our purpose |  Our aim |  Our how | ||||||||||||||||||||||||||||||
| To help people and businesses prosper | To be the best open financial services platform by acting responsibly and earning the lasting loyalty of our people, customers, shareholders and communities | Everything we do should be Simple, Personal and Fair | ||||||||||||||||||||||||||||||
which motivates | ||
support for our communities | ||
so we deliver | ||
An engaged and talented team | ||

strong financial results for our shareholders | ||
generates | ||
customer loyalty | ||
leading to | ||
8
Our business model
Generating value for our stakeholders
CUSTOMER FOCUS
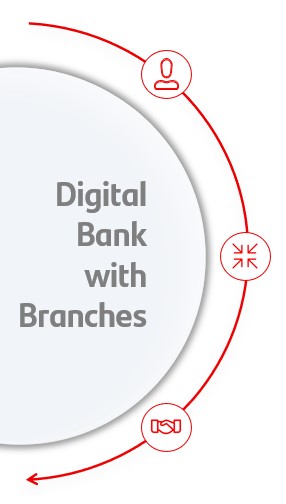
Building a digital bank with branches
→Customer focus is the essence of our strategy. Our multichannel offering enables us to fulfil all our customers' financial needs, making us their global, trusted and responsive partner.
→Our customer growth investments are centred around three basic things: competitive prices, a frictionless digital experience and being a trusted financial partner.
→We are building a digital bank with branches to make our customers' lives easier, giving them the power to decide how they want to interact with us (in person at our over 8,000 branches, contact centres, digital channels, …).
→Every year, we strive to enhance our customer experience and satisfaction. All this is reflected in customer growth.
| 2023 | 2022 | |||||||
| Total customers (mn) | 165 | 160 | ||||||
| Active customers (mn) | 100 | 99 | ||||||
SCALE
Global & in-market scale
→Santander has a unique combination of global scale and local leadership (top 3 in lending, deposits and mutual funds in most of our markets).
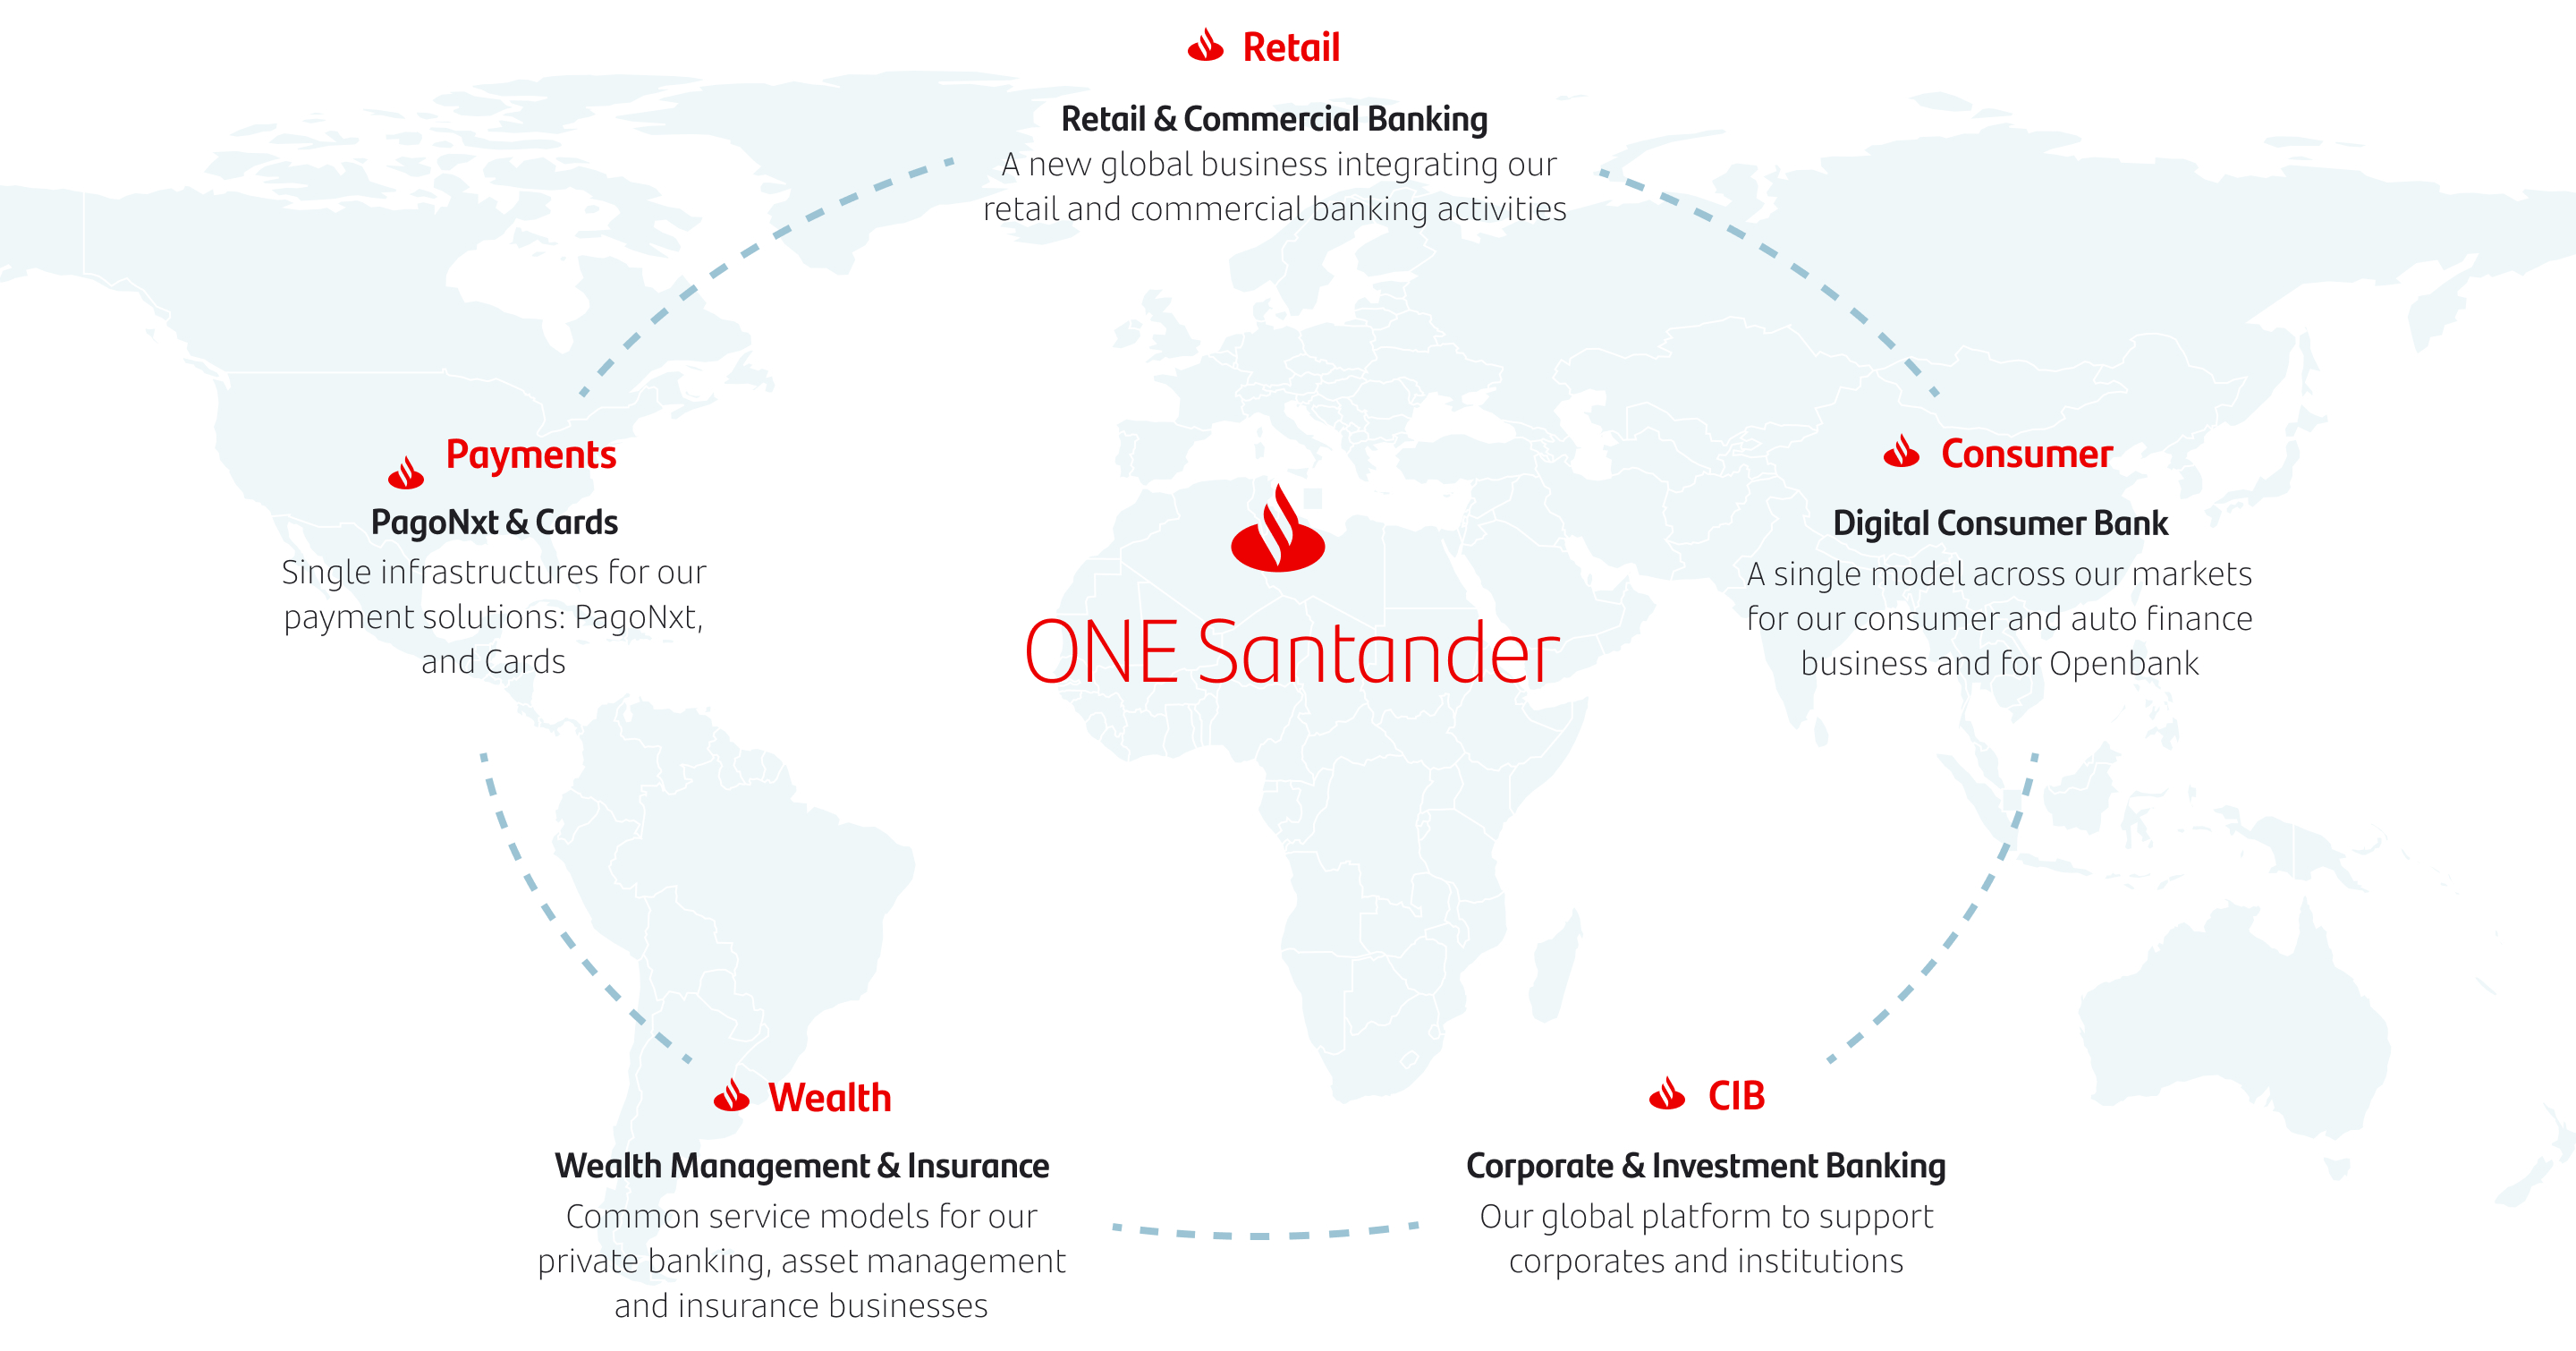
→Our activities are organized under five global businesses: Retail & Commercial Banking, Digital Consumer Bank, Corporate & Investment Banking, Wealth Management & Insurance, and Payments.
→These five global businesses support value creation based on the profitable growth and operational leverage that ONE Santander provides.
→Our global approach to technology and development of global platforms is helping provide our customers with a frictionless digital experience.
Tangible progress on our transformation
 ONE Santander | |||||||||||||||||||||||||||||||||||||||||
| Global businesses |  | Retail & Commercial Banking |  | ||||||||||||||||||||||||||||||||||||||
 | Digital Consumer Bank | | |||||||||||||||||||||||||||||||||||||||
 | Corporate & Investment Banking | | |||||||||||||||||||||||||||||||||||||||
 | Wealth Management & Insurance | | |||||||||||||||||||||||||||||||||||||||
 | Payments | | |||||||||||||||||||||||||||||||||||||||
Europe  | North America  | South America  | DCB Europe  | ||||||||||||||||||||||||||||||||||||||
DIVERSIFICATION
Business, geographical and balance sheet
→Our simple and well-targeted range of products and services meets the needs of a wide spectrum of customers: individuals, SMEs, mid-market companies, large corporates, wealthy customers, first-time banking customers, auto customers and dealers, and card customers.
→Our diversified geographical footprint is well balanced between developing and mature markets.
→Santander has a strong, simple and diversified balance sheet, with a low exposure to market risk and is highly collateralized and made up mainly of loans.
→Diversification and a medium-low risk profile deliver recurrent pre-provision profit, with among the lowest volatility across peers.
| Group net operating income (pre-provision profit) | ||
| EUR billion | ||

These are the foundations of our new phase of value creation for our shareholders
9
2023 results
We delivered record profit...
→Record results with 5mn new customers YoY contributing to double-digit revenue growth →First year of ONE Transformation driving profitable growth and structural efficiency improvement →Strong balance sheet, with solid credit quality metrics and a higher capital ratio →Delivering double-digit value creation and higher shareholder remuneration | ||
| FY’23 Attributable Profit | FY’23 Revenue | |||||||
€11.1bn +15% | €58bn +11% | |||||||
| Cost-to-income | RoTE | |||||||
44.1% –173bps | 15.1% +169bps | |||||||
| CoR | FL CET1 | |||||||
1.18% +0.19pp | 12.3% +0.2pp | |||||||
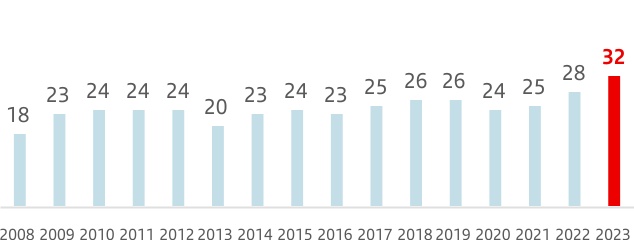
| TNAVps + DPS | EPS | |||||||
+15% Cash DPS +c.50% | +21.5% | |||||||
Note: Based on underlying P&L. YoY changes in euros. In constant euros: attributable profit +18% and revenue +13%.
TNAVps + dividend per share (DPS) includes the €5.95 cent cash dividend paid in May 2023 and the €8.10 cent cash dividend paid in November 2023. Implementation of 2023 shareholder remuneration policy is subject to future corporate and regulatory decisions and approvals. For more details, see section 3.3 ‘Dividends and shareholder remuneration’ in the ‘Corporate Governance’ chapter.
… and achieved all our 2023 financial targets
| 2023 targets | 2023 achievement | |||||||||||||
RevenueA |  | Double-digit growth | +13% | ü | ||||||||||
| Efficiency ratio | | 44-45% | 44.1% | ü | ||||||||||
| CoR | | <1.2% | 1.18% | ü | ||||||||||
| FL CET1 | | >12% | 12.3% | ü | ||||||||||
| RoTE | | >15% | 15.1% | ü | ||||||||||
A. YoY change in constant euros.
10
2023 highlights for our regions
| 2023 vs. 2022 | Attributable profit (€ bn) | Contribution to Group's profitA | Efficiency | RoTE | |||||||||||||
| Europe | 5.5 | 45% | 42.1% | 14.5% | |||||||||||||
| North America | 2.4 | 20% | 49.1% | 9.8% | |||||||||||||
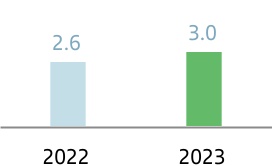
| South America | 3.0 | 25% | 38.5% | 14.4% | |||||||||||||
| DCB Europe | 1.2 | 10% | 47.6% | 12.3% | |||||||||||||
DCB Europe is the Digital Consumer Bank defined under the criteria prior to the 20 December 2023 announcement. A. As % of total operating areas, excluding the Corporate Centre. | |||||||||||||||||
 |  | |||||||
North America | Europe | |||||||
We are leveraging the strength of our global businesses to accelerate the transformation of our businesses in the US and Mexico | We remain focused on customer experience and service quality, and on making the structural changes needed to develop a common operating model for Europe | |||||||
 |  | |||||||
South America | DCB Europe (former DCB) | |||||||
We are focused on increasing the value we bring to the Group and on working to become the most profitable bank in each of the countries where we operate in the region | Continue to reinforce our auto leadership through strategic alliances, leasing and subscription. In non-auto, keep upscaling our buy now, pay later business. Transformation for future growth deploying a simpler organizational structure to deliver through best-in-class digital platforms, launching new channels and products | |||||||
For more details, see section 4 'Financial information by segment’ in the ‘Economic and financial review' chapter.
11
Looking ahead
We are well positioned to continue driving additional profitable growth in 2024
Our consistent track record and the implementation of ONE Santander make us confident of delivering the following 2024 targets
| 2024 Group targets | ||||||||||||||||||||||||||
| Revenue | Efficiency | CoR | FL CET1 after Basel III implementation | RoTE | ||||||||||||||||||||||
Mid-single digitA growth | <43% | c.1.2% | >12.0% | 16% | ||||||||||||||||||||||
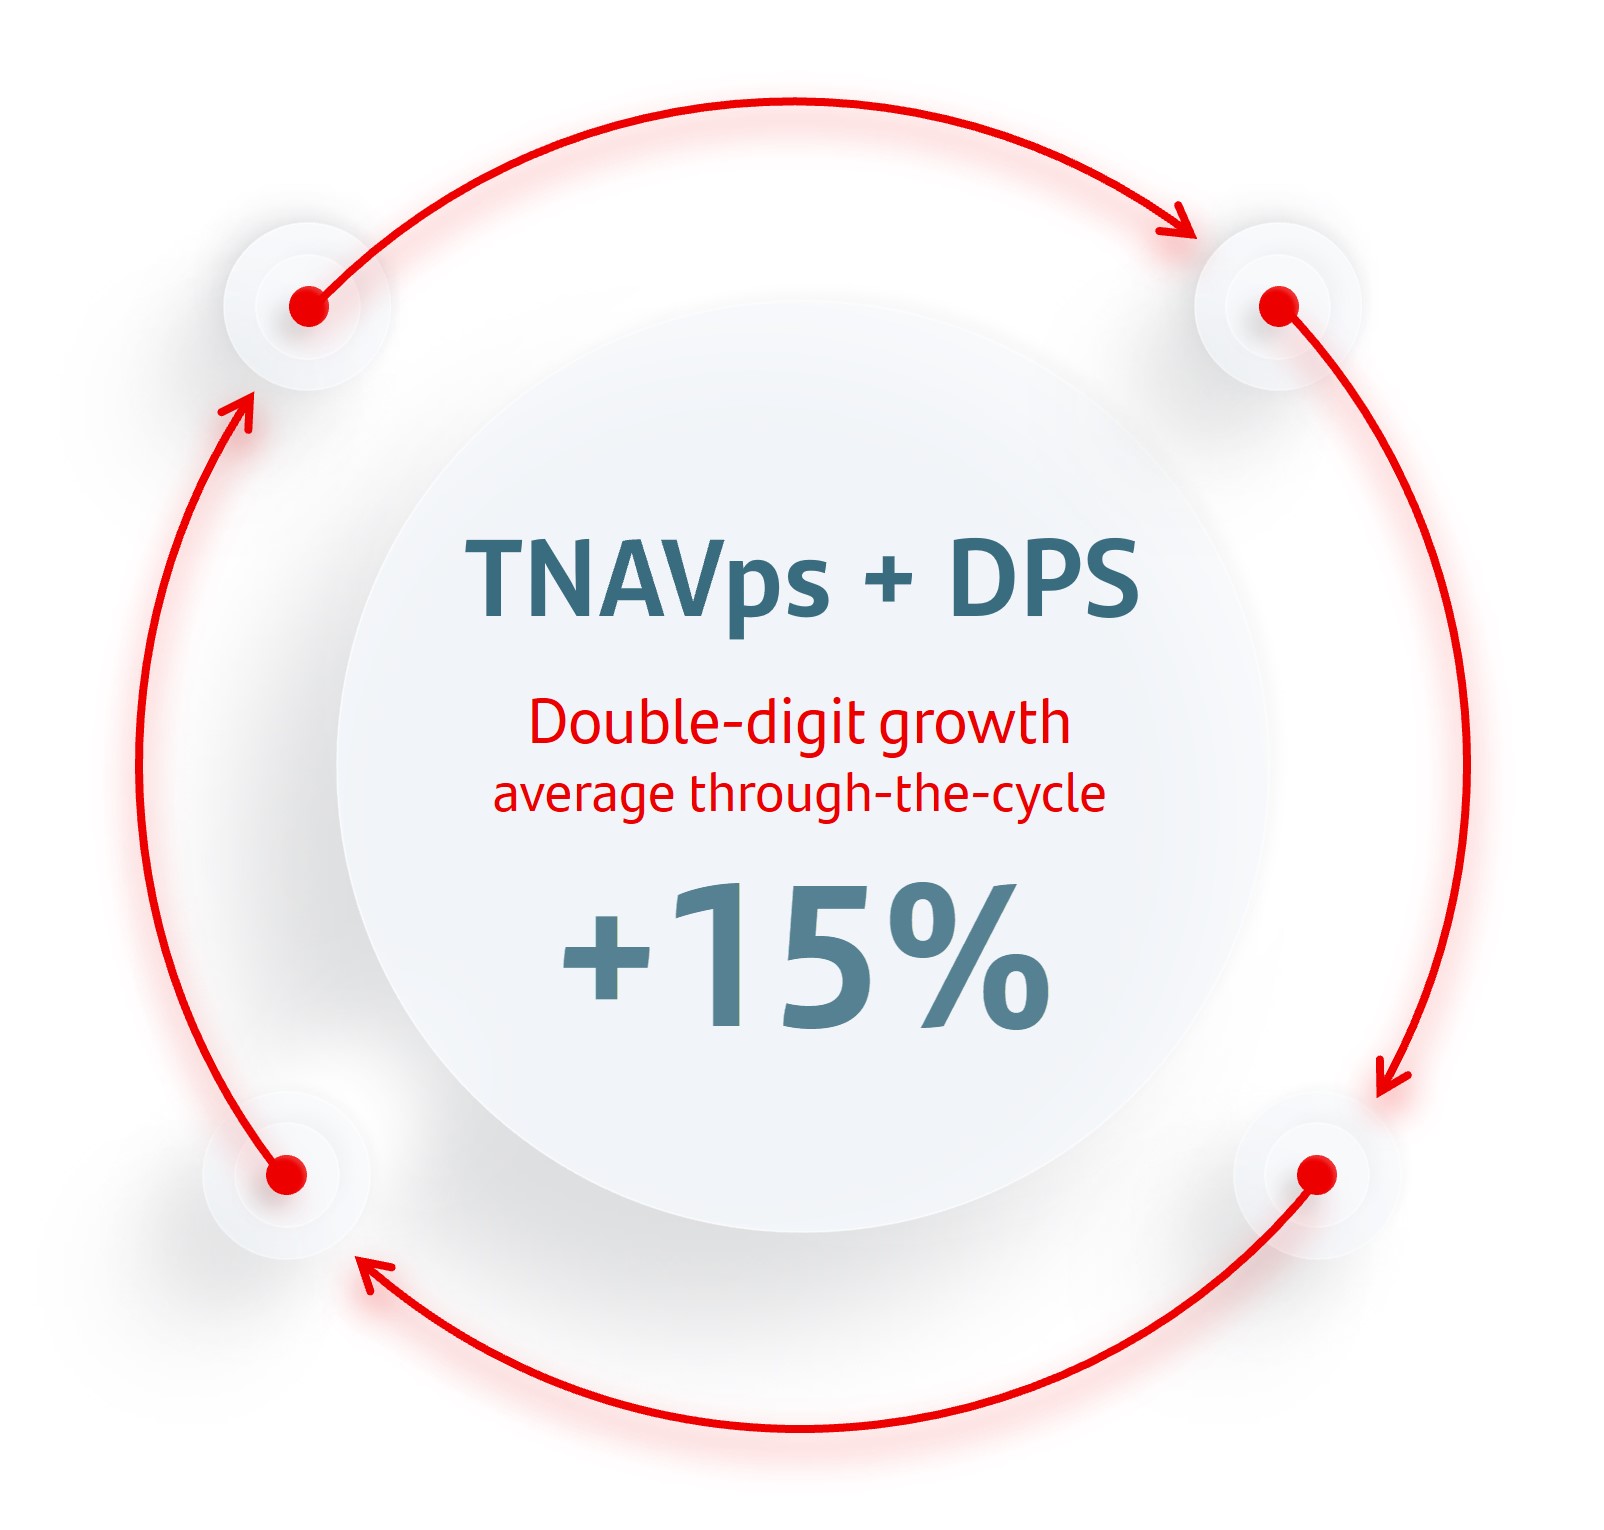
Double-digit growth of TNAV per share + dividend per share through-the-cycle | ||||||||||||||||||||||||||
A.YoY revenue growth in constant euros, but Argentina in current euros. Note: All targets presented in this chapter are market dependent and do not represent guidance. Actual results may vary materially. | ||||||||||||||||||||||||||
A new phase of profitability and growth underpinned by three tenets
 | Think Value | Delivering double-digit value creation, on average through-the-cycle | |||||||||||||||
 | Think Customer | Building a digital bank with branches with well targeted products and services to grow our customer base | |||||||||||||||
 | Think Global | Best customer experience leveraging our global and in-market scale, network and technology capabilities to accelerate profitable growth | |||||||||||||||
12
Think Value
Delivering double-digit value creation, on average through-the-cycle
2025 targets vs. 2023 figures
| Strength | ||||||||
FL CET1 >12% 12.3% | ||||||||
| Shareholder remuneration | ||||||||
Payout 50% Cash dividend + SBB 50% annually | ||||||||
| Disciplined capital allocation | ||||||||
RWAs with RoRWA > CoE c.85% 84% | ||||||||
| Profitability | ||||||||
RoTE 15-17% 15.1% | ||||||||
Note: our shareholder remuneration policy is approximately 50% payout split in approximately equal parts (cash and share buybacks). Cash DPS against 2023 results estimated as 25% of the profit for the year. Implementation of 2023 shareholder remuneration policy is subject to future corporate and regulatory decisions and approvals. For more details, see section 3.3 ‘Dividends and shareholder remuneration’ in the ‘Corporate Governance’ chapter.
Think Customer
Building a digital bank with branches with well targeted products and services to grow our customer base
| 2023 | 2025 targets | ||||||||||||||||
| Customer centric | Total customers (mn) | 165 | | c. 200 | |||||||||||||
| Active customers (mn) | 100 | | c. 125 | ||||||||||||||
| Simplification & automation | Efficiency ratio (%) | 44.1 | | c.42 | |||||||||||||
| Customer activity | Transactions volume per active customer (month, % growth) | 10 | | c. +8% | |||||||||||||
Note: total transactions include merchant payments, cards and electronic A2A payments. Target: c.+8% CAGR 2022-25.
13
Think Global
Best customer experience leveraging global and in-market scale, network and technological capabilities to accelerate profitable growth
→A simpler and more efficient operating model that enables us to capture the full potential of our business model to deliver profitable growth.
| Our new model capitalizes on our strategic advantage of combining global capabilities with local expertise | ||||||||||||||||||||
Serve our customers better | Be more efficient | |||||||||||||||||||
Better risk management from a global perspective across business lines | ||||||||||||||||||||
Grow more and faster | More resilient balance sheet | |||||||||||||||||||
Improved and more disciplined capital allocation for higher profitability | ||||||||||||||||||||
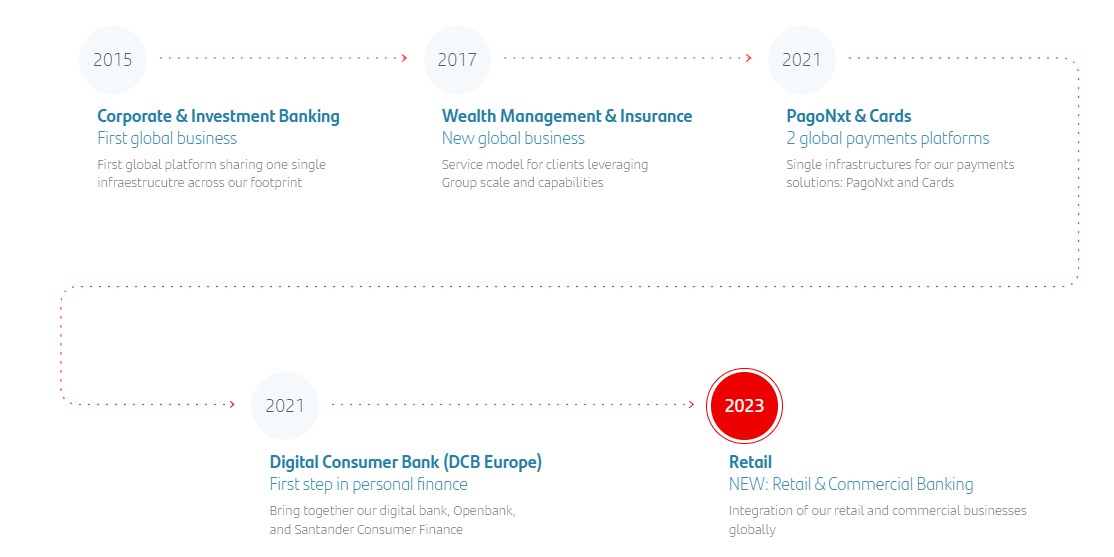
→Our transformation started in 2015 with CIB, the first business we managed as a global platform, followed by Wealth Management & Insurance, PagoNxt and Cards.
In 2023, we completed the last step towards ONE Santander consolidating retail and commercial and consumer banking activities under two new global businesses: Retail & Commercial Banking and Digital Consumer Bank.
14
Our five global businesses
Retail & Commercial Banking
Driving growth and efficiency on the back of our new model and proprietary technology
 Customer experience |  Operational leverage |  Global platform |  2025 target | |||||||||||||||||||||||||||||||||||||||||
Product simplification and digital first | Common operating model, globally leveraging process automation | Proprietary back-end (Gravity) and our cloud based front-end (ODS) technologies | c.17% RoTE 15.1% 2023 <42% C/I 43.1% 2023 | |||||||||||||||||||||||||||||||||||||||||
| Key drivers | ||
 | ||
Active customers (mn)
+1%
# of productsA (k)
–16%
# of non-commercial FTEsA
per mn total customers
per mn total customers
–1.5%

A.Metrics cover all products and employees in the branch network.
Note: new global business definitions as published on 20 December 2023.
15
Digital Consumer Bank
Transforming into a best-in-class, global business and operating model
Customer experience | Operational leverage | Global platform | 2025 target | |||||||||||||||||||||||||||||||||||||||||
Global relationship management (OEMs, importers and retailers) | Operational & commercial benchmark to maximize profitability and growth | From multiple country-specific platforms to global platforms (e.g. leasing, BNPL) | >14% RoTE 11.5% 2023 c.40% C/I 42.8% 2023 | |||||||||||||||||||||||||||||||||||||||||
| Key drivers | ||
| ||
Total customers (mn)
+1%
Retail deposits
cost-to-serve (bps)
cost-to-serve (bps)
–8bps
# of non-commercial FTEsA per mn total customers
–0.4%
A. DCB Europe only.
Note: new global business definitions as published on 20 December 2023.
Corporate & Investment Banking
Playing to our strengths to better serve our corporate customers and institutions
Customer experience | Operational leverage | Global platform | 2025 target | |||||||||||||||||||||||||||||||||||||||||
Trusted advisor for our customers, leveraging our global and local products | Continue growing fee and transactional business through our global centres of expertise and tech | Optimize capital returns on the back of global origination and distribution capabilities | >20% RoTE 17.5% 2023 <45% C/I 45.0% 2023 | |||||||||||||||||||||||||||||||||||||||||
| Key drivers | ||
| ||
% customer
related revenue
related revenue
+1.7pp
Fee growth
(constant € bn)
(constant € bn)
+14%
% Total revenue /
RWA
RWA
+0.8pp
Note: new global business definitions as published on 20 December 2023.
16
Wealth Management & Insurance
Accelerating our customers' connectivity with our global product platforms
Customer experience | Operational leverage | Global platform | 2025 target | |||||||||||||||||||||||||||||||||||||||||
Providing our customers with a specialized product & service proposition in all countries | Leverage our global operations and factories to connect countries and increase collaboration with CIB and Retail | Global platforms and infrastructure to improve efficiency and time-to-market | c.60% RoTE 72.2% 2023 c.10% Revenue growth +22% 2023 | |||||||||||||||||||||||||||||||||||||||||
| Key drivers | ||
| ||
Assets under
managementA (€ bn)
managementA (€ bn)
+14%
Collaboration
fees (€ bn)
fees (€ bn)
+6%
Revenue growth
including ceded feesB (€ bn)
including ceded feesB (€ bn)
+11%
A. Includes off-balance sheet assets and deposits.
B. Includes all fees generated by asset management and insurance businesses, even those ceded to the commercial network.
Note: new global business definitions as published on 20 December 2023. Revenue CAGR 22-25 target.
Payments
Seizing a growing opportunity by capturing scale through global platforms
Customer experience | Operational leverage | Global platform | 2025 target | |||||||||||||||||||||||||||||||||||||||||
Deliver best-in-class payment solutions leveraging our global and local scale | Reduce cost per transaction through capex optimization and operational efficiency | Migrate volumes to common global platforms to gain scale and offer competitive pricing in the open market | PagoNxt >30% EBITDA margin 24.8% 2023 c.30% Revenue growth +17% 2023 | |||||||||||||||||||||||||||||||||||||||||
| Key drivers | ||
| ||
# transactions (bn per month)
+15%
Cost per transaction
(€ cents, PagoNxt)
(€ cents, PagoNxt)
–16%
% open market
revenue (PagoNxt)
revenue (PagoNxt)
+2.2pp
Note: transactions include merchant payments, cards and electronic A2A payments. New global business definitions as published on 20 December 2023. PagoNxt revenue CAGR 22-25 target.
17
In summary, our common operating model supports value creation based on the profitable growth and operational leverage that our global platforms provide
| 2023 vs. 2022 | Revenue (€bn) | Contribution to Group revenueA | Efficiency | RoTEB | 2025 RoTEB target | |||||||||||||||
 | 30 +12% | 51% | 43.1% -157bps | 15.1% +1.0pp | c.17% | |||||||||||||||
 | 12 +1% | 21% | 42.8% +86bps | 11.5% -4.0pp | >14% | |||||||||||||||
 | 8 +17% | 13% | 45.0% +171bps | 17.5% +1.6pp | >20% | |||||||||||||||
 | 3 +22% | 6% | 37.9% -333bps | 72.2% +19.8pp | c.60% | |||||||||||||||
Revenue (€bn) | Contribution to Group's revenueA | Efficiency | EBITDA margin PagoNxt | 2025 EBITDA margin PagoNxt target | ||||||||||||||||
 | 5 +12% | 9% | 44.2% -235bps | 24.8% +15.7pp | >30% | |||||||||||||||
Note: YoY change in constant euros. New global business definitions as published on 20 December 2023. A.As % of total operating units, excluding the Corporate Centre. B. Global businesses’ RoTEs are adjusted based on the Group’s deployed capital. For more information, see section 8 'Alternative Performance Measures' of 'Economic and financial review' chapter. | ||||||||||||||||||||
ESG commitments: we are creating value for our shareholders by focusing on delivering profitable growth in a responsible way
| 2023 | 2025 targets | |||||||||||||
| Green finance raised and facilitated (since 2019) | €114.6bn | | €120bn | |||||||||||
| Socially responsible investments (AuMs) | €67.7bn | | €100bn | |||||||||||
Financial inclusion (# People) | 1.8mn | | 5mn | |||||||||||
Note: information has been verified with limited assurance by PricewaterhouseCoopers Auditores, S.L. For more details, see the 'Responsible banking' chapter and metrics definitions in 9.8 'Alternative performance measures (APMs)' in the same chapter.
Not taxonomy. Financial inclusion (#people, mn): starting Jan-23. Does not include financial education.
18
Responsible banking Consolidated non-financial information statement | |||||
 | |||||
19
Our sustainability strategy supports our purpose to help people and businesses prosper.
We are on track to meet our targets announced at our Investor Day
Green finance EUR 114.6 bnA EUR 120 bn target by 2025 EUR 220 bn target by 2023 | Socially responsible investment AUM EUR 67.7 bn EUR 100 bn target by 2025 | Financial inclusion 1.8 mn EUR 5 mn target by 2025 | ||||||||||||
We are progressing towards our net zero ambition
 | Set 2 new decarbonization targets for 2030 for corporate auto manufacturing portfolio and auto lending portfolio in Europe. | | Progress on portfolio alignment in relevant portfolios, including disclosure of financed emissions for UK Mortgages and Brazil Agriculture. | | Progress embedding climate and environmental factors in our risk management practices, leveraging on market good practices and supervisory expectations, including setting three additional risk appetite limits consistent with our decarbonization strategy. | ||||||||||||||||||
We are helping society
→EUR 352,181 million to finance homes and EUR 208,276 million to purchase other goods.B
→EUR 346,211 million to help set up or grow companies (39% to individuals and SMEs).B
→212,764 employees. EUR 13,726 million paid in wages and benefits.
→EUR 174 million invested in communities, including EUR 105 million to promote higher education, employability and entrepreneurship, benefitting 2.7 million people. We have a target to deploy EUR 400 million in education, employability and entrepreneurship between 2023 and 2026.
A. Preliminary data as final League Tables for 2023 were not yet available at date of editorial closing.. This information will be updated to year end in the next Climate Finance Report..
B. Credit stock as of 31 December 2023.
20
About this chapter
GRI 1, 2-2, 2-3, 2-5
This chapter is the consolidated non-financial information statement of Banco Santander, S.A. and its subsidiaries. It provides detailed information in accordance with Art. 49, sections 5, 6, 7, 8 and 9 of the Spanish Commercial Code as amended by Act 11/2018, which transposes into Spanish law Directive 2014/95/EU of the European Parliament and of the Council of 22 October 2014 amending Directive 2013/34/EU as regards disclosure of non-financial and diversity information.
Scope
This chapter covers the core activities of Banco Santander and its subsidiaries from 1 January to 31 December 2023 (for more details, see Notes 3 and 53 to the consolidated financial statements and sections 3 and 4 in the 'Economic and financial review' chapter). It gives economic information according to the bank’s accounting principles. Social and environmental information has been prepared according to the same definition, where available. Significant criteria differences from the 2022 Responsible banking chapter are explained in the related section as well as in the 9.7 'Scope of information' and the 10.4 'Global Reporting Initiative (GRI) content index' sections.
Regulation, reporting standards and other references that this chapter addresses
This chapter meets Spain’s Act 11/2018, EU guidelines 2017/C215/01 on non-financial reporting, European Taxonomy regulation (Regulation (EU) 2020/852 and Commission Delegated Regulations 2021/2139 and 2021/2178 amended by Delegated Regulations 2022/1214, 2023/2485 and 2023/2486), GRI Standards, and the GRI G4 guidelines on financial services disclosures.
It also takes into account the Sustainability Accounting Standards Board’s (SASB) 2018-10 industry standards, and the World Economic Forum's Stakeholder Capitalism Metrics. It shows Santander's progress with respect to the UN Global Compact, UNEP FI Principles for Responsible Banking, the TCFD recommendations and the UN Sustainable Development Goals.
Each section of the chapter relates to GRI and SASB indicators to which the content responds. Likewise, section 10. 'Sustainability reporting standards and references' provides the regulation, reporting standards and other references mentioned above; with tables showing where information on each one can be found in the report.
Material aspects and stakeholder involvement
Santander maintains an active dialogue with its stakeholders to understand their expectations. It conducts a materiality assessment of ESG matters and closely monitors questionnaires and recommendations of ESG ratings (MSCI, Sustainalytics, CDP, S&P-DJSI, ISS, Moody's, FTSE4Good and Bloomberg Gender Equality Index), as well as other international sustainability initiatives it takes part in.
This chapter illustrates the sustainability of the bank’s local and global operations, especially in terms of internal and external impact. For details on its preparation and on our materiality assessment findings, see 9.1 'Stakeholder engagement' and 1. 'Materiality assessment' sections of this chapter.
The use by Banco Santander, S.A. of any MSCI ESG RESEARCH LLC or its affiliates (“MSCI”) data, and the use of MSCI logos, trademarks, service marks or index names herein, do not constitute a sponsorship, endorsement, recommendation, or promotion of Banco Santander, S.A. by MSCI. MSCI services and data are the property of MSCI or its information providers, and are provided ‘as-is’ and without warranty. MSCI names and logos are trademarks or service marks of MSCI.
21
Responsible banking overview 23
22
Responsible banking overview
Our purpose is to help people and businesses prosper.
I. Santander's support for society
 | 1. We drive economic growth by helping people and businesses prosper. | ||||
→EUR 352,181 million to help people buy homes and EUR 208,276 million to purchase other goods.A →EUR 346,211 million to help set up or grow companies (39% to individuals and SMEs).A →EUR 10,937 million paid to suppliers. 91% are local and account for 94% of total procurement turnover. →EUR 9,664 million in total taxes paid by the Group. EUR 10,250 million in taxes channelled from customers to tax authorities. →Santander’s stock of credit contributes to generating economic activity of more than EUR 290 billion, around 2.5% of GDP on average in the main countries where we operate.B | ||||||||
 | 2. We help create jobs. | ||||
→212,764 employees. EUR 13,726 million paid in wages and benefits. →53% of our workforce are women, 31.4% of whom are in senior executive positions. 40% of our board members are women. →In 2023 we achieved our target of ~0% Equal Pay GapC two years ahead. →Santander’s stock of credit helps support more than 8 million jobs in the main countries where we operate.B | ||||||||
| 3. We tackle global challenges. | ||||
→EUR 20.2 billionD in green finance raised and facilitated and EUR 67.7 billion assets under management in Socially Responsible Investment. →1.8 million new people financially included and a total of 1.2 million underbanked entrepreneurs supported through EUR 1,172 million in credit disbursed. →EUR 174 million invested in communities, including 105 million to promote higher education, employability and entrepreneurship, benefitting 2.7 million people. | ||||||||
A. Credit stock as of 31 December 2023.
B. Source: Deloitte.
C. The year-end figure is 0.44%. Having met the target set the Group has set itself the objective of maintaining a EPG in line with best market practices.
D. Preliminary data as final League Tables for 2023 were not yet available at date of editorial closing. This information will be updated to year end in the next Climate Finance Report.
23
II. Our culture
Santander’s corporate culture, The Santander Way, is the bedrock of our success. Our values (Simple, Personal and Fair), our corporate behaviours (T.E.A.M.S), our leadership principles and our robust risk culture (Risk Pro) guide us every day. In 2022 we launched our new corporate behaviours and in 2023 we progressed in their implementation:
•We continued to hold regular Town Halls and share communications reinforcing the importance of displaying our behaviours on a daily basis.
•Some of our HQ offices have been decorated with T.E.A.M.S signage to make our behaviours visible to all employees and customers.
•We continued to assess how to improve our efforts through our employee listening programme - YourVoice.
•We aligned our processes with our culture and adapted our succession planning to ensure that employees earmarked for promotion were also cultural ambassadors.
•We continued to promote our culture through our performance review, MyContribution, where 50% is based on 'what' we do, 40% on 'how' we do it and 10% on our risk management.
•We held the Santander Week, which saw all our units celebrate our culture together, with a kick-off to the week given by the chair, CEO and regional heads.
•Local CEOs held events with the participation of their executive teams to reinforce the T.E.A.M.S behaviours and to celebrate The Santander Way as one team.
Our values Simple Personal Fair | ||||||||
Our behaviours  | ||||||||
Our leadership principles →Promote a 'Group First' mindset →Lead transformation →Build, develop and grow talent →Display T.E.A.M.S. flawlessly →Drive diversity, equity and inclusion | ||||||||
Our strong risk management culture  | ||||||||
24
III. Our sustainability strategy
GRI 2-22, 2-23
Our sustainability strategy focuses on issues that are material to Santander. We conduct a double materiality assessment to identify the topics that pose the biggest risks to, and create commercial opportunity for the bank; and where we can have the biggest impact.
| Ambition | Action | |||||||||||||||||||
E Support the transition to a low-carbon economy | →Support and engage with customers in accelerating their transition, and develop a best-in-class sustainable finance and investment proposition. →Progress with decarbonizing our portfolios to align to net zero by 2050, while considering other environmental goals. | |||||||||||||||||||
S Promote inclusive growth | →Promote employees' wellbeing and equal treatment and opportunity for all. →Support financial inclusion by promoting access to financial products and services and financial health, including financial literacy. →Foster customer information transparency and data privacy. →Support education, employability and entrepreneurship. | |||||||||||||||||||
G Strong governance and culture across the organization | →Drive culture, conduct and ethical behaviour, doing everything the Santander Way: Simple, Personal and Fair. →Continue integrating ESG in governance and our core activities, and enhancing capabilities across teams including business, risk management and data reporting. | |||||||||||||||||||
Our sustainability strategy aims to help the business grow, be aligned to our stakeholders’ expectations, and make Santander more resilient through strong risk management, robust data quality and privacy, transparency, a vibrant culture and clear governance.
Our sustainability goals are consistent with the Group’s business approach – Think Value, Think Customer and Think Global. We want to:
1.create value for shareholders;
2.be the partner of choice for our customers in their transition to a low carbon economy and support their financial inclusion;
3.use our scale and local leadership to tackle global challenges in the markets where we operate.
25
IV. 2023 highlights
New targets and commitments:
→We increased two ESG targets at our Investor Day: 35% of senior executive positions to be held by women by 2025 and to financially include 5 million people between 2023 and 2025. | →To help fulfil our ambition to be net zero by 2050, in 2023 we have set two new decarbonization targets for 2030 in the transport sector: auto lending in Europe and auto manufacturing. This way, we now have seven targets in five high emitting sectors. | →We have set a target to invest EUR 400 million between 2023-2026 to foster education, employability and entrepreneurship. | ||||||||||||||||||||||||||||||
Progress on ESG:
→In Corporate & Investment Banking, we raised and facilitated EUR 20.2 bnA in greenB finance in 2023, reaching EUR 114.6 bn since 2019: •Santander remains among the top banks in renewable energy project finance, with 85 transactions and EUR 6.7 bn in financing. •We financed the construction of green assets and an EV battery gigafactory plant, signed green loans with clients such as Grenergy, structured sustainable transactions in Export and Supply Chain finance, and launched Green Deposits. •We advised on several corporate finance transactions in the renewable energy sector and acted as sole financial advisor in one of the largest ever hydrogen transactions globally at the time. | ||||||||
→In Retail & Commercial Banking, in 2023, we strengthened our green proposition with new solutions for clients, e.g.: •Green mortgages, electric vehicles or financing of solar panel installations (11 partnerships for solar panel solutions across our three regions). At the end of the year, we had a stock of EUR 22.6 bn in mortgages aligned with the EU Taxonomy. •EUR 1.4 bn in new financing agreements with multilateral development banks to finance the investment and liquidity needs of our customers in Europe and Latin America. •The EIB granted EUR 300 million to Banco Santander Brasil for small-scale solar energy investments. | ||||||||
→Our SRI AUM amounted to EUR 67.7 bn, of which EUR 48.1 bn are from SAM and EUR 19.6 bn from our Private Banking services associated with third party funds: •70.8% of financed emissions from SAM’s portfolio were either aligning to net zero or under either individual or collective engagement in which SAM is involved. •SAM Spain was the first asset manager to adhere to and report on the CNMV stewardship code compliance. | ||||||||
→In Digital Consumer Bank, in 2023, in Europe we financed more than 208,000 new electric vehicles, with volume of EUR 6.5 bn. This equals a market share of EV sales in Europe of over 10%. | |||||||||||
→In Cards, in 2023, we acquired 37 million cards (72% of the year's total) made of sustainable materials (recycled PVC or PLA).C | |||||||||||
→We exceeded our target for 30% of senior executive positions by 2025 to be held by women in Q2, reaching 31.4% by year end. Additionally, we have reached our target of Equal Pay gap close to zero two years in advance. | |||||||||||
→We financially included 1.8 million new people through our access and finance initiatives and granted EUR 1,172 m in microloans to a total of 1.2 million underbanked entrepreneurs during the year. In addition, we reached 11.5 million people with financial education initiatives, including content in social media. | |||||||||||
→We invested EUR 174 million in our communities: •EUR 105 million in supporting education, employment and entrepreneurship through Santander Universities, our unique global initiative. In 2023 we granted 28,849 scholarships. •EUR 69 million in other programmes with 2.2 million people helped. | |||||||||||
 | |||||||||||
A. Preliminary data as final League Tables for 2023 were not yet available at date of editorial closing. This information will be updated to year end in the next Climate Finance Report.
B. When referred to 'green' or 'sustainable' products or services without further detail, these comply with SFICS. For more information, see section 9.6 'Sustainable Finance and Investment Classification System (SFICS)' of this chapter.
C. PLA cards: Polylactic acid (PLA) is a sustainable plastic substitute made with renewable bio-sourced resources. Recycled PVC cards: manufactured using plastic waste from the packaging and printing industries reducing first-use plastic.
26
V. Recognition
Ratings
In 2023, we maintained our position in MSCI (AA) and remain in the DJSI World and European Index for Banks. In CDP we maintained our positioning at Leadership level, however decreased from A to A-.
We improved our position in Sustainalytics, scoring 19.7 points (-2.7 points) and placing in the 'low risk' category.
We scored 65 points (+4 points) in Moody’s and 4.7 points (+0.6 points) in FTSE4Good.
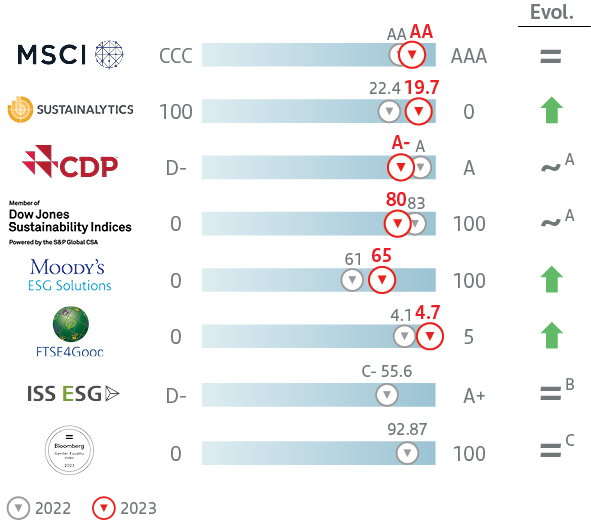
A. In CDP we remain in Leadership level and in DJSI we remain in the World and European Indexes.
B. Not rated in 2023.
C. Based on 2022 information. Updated score not available on the date this Annual Report was issued.
Awards
 | World’s best bank for financial inclusion by Euromoney for the third year in a row; World’s best bank for SMEs and World’s best bank for emerging markets by Euromoney (Euromoney Awards for Excellence). |  | We were the highest ranked bank on Fortune's list of 50 companies that are changing the world, owing to Santander Universities support for education, entrepreneurship and employability over the past 27 years. | |||||||||||||||||
VI. Governance
Supervision
The responsible banking, sustainability and culture committee (RBSCC) is the highest governance body that oversees drawing up and implementing the Group’s sustainability strategy and policies, supporting the board of directors. The RBSCC met six times in 2023. The audit, remuneration and risk committees also supported and reviewed sustainability topics.
Accountability
The Responsible Banking Forum, which comprises senior Group executives, monitors and guides the execution of our sustainability strategy. It met six times in 2023. The Management meeting, chaired by the CEO, reviewed progress with the Group’s sustainability agenda on three occasions.
The Group’s Responsible Banking unit works continuously to define, execute and monitor our sustainability strategy with the Responsible Banking network in our core markets, global businesses and corporate functions.
Incentives
In 2023, our reward schemes included ESG as a lever to make Santander teams’ actions consistent with our goals. Variable remuneration (which applies to all units) has included ESG since 2020 and long-term incentives (which apply to senior executives) since 2022. In both cases, the scorecards leverage on Santander ESG public targets, including climate, green finance, financial inclusion, DE&I and SRI.
 | For more details on our policies and governance structure, see section 9.2 'Main internal regulations and governance' | ||||
27
1. Materiality assessment
1.1 Material sustainability matters
GRI 3-2
In 2023, we carried out a double materiality assessment based on the Global Reporting Initiative (GRI) and elements from the Corporate Sustainability Reporting Directive (CSRD).
It covered two dimensions:
Impact materiality |  | How business affects people and/or the environment through positive and negative impacts. | ||||||
Financial materiality | | How sustainability matters can affect financial results through risk and opportunity. | ||||||
The sustainability matters we consider in this assessment are those set out in the European Sustainability Reporting Standards (ESRS). We carried out the exercise at subtopic-level, even though the final results are presented at topic-level; and the scope is Grupo Santander.
The thresholds used to categorize the material aspects are Critical, Significant, Important, Informative and Minimal. According CSRD, a sustainability matter is material if it is above the category of Important, regardless of whether the relevance comes from the impact side or from the financial side (risks and opportunities).
The table below shows the assessment and materiality for each sustainability matter with a breakdown by impact, risk and opportunity.
Three sustainability matters – Climate Change, Consumers and End Users, and Business Conduct - are material (Significant or Critical), and two – Own Workforce and Affected Communities – are informative. The results have been carried out with a mid-term time horizon (~3 years).
| Financial materiality | |||||||||||||||||
| Sustainability matters | Impact materiality | Risk | Opportunity | Double materiality (final output) | |||||||||||||
| ESRS E1: Climate Change | |||||||||||||||||
| ESRS E2: Pollution | |||||||||||||||||
| ESRS E3: Water and marine resources | |||||||||||||||||
| ESRS E4: Biodiversity and ecosystems | |||||||||||||||||
| ESRS E5: Resource use & circular economy | |||||||||||||||||
| ESRS S1: Own workforce | |||||||||||||||||
| ESRS S2: Workers in the value chain | |||||||||||||||||
| ESRS S3: Affected Communities | |||||||||||||||||
| ESRS S4: Consumers and end-users | |||||||||||||||||
| ESRS G1: Business conduct | |||||||||||||||||
Thresholds: ¢ Critical ¢ Significant ¢ Important ¢ Informative ¢ Minimal | |||||||||||||||||
We conducted this assessment using the best available information and tools, and consulting Santander’s key stakeholders. See section 9.4 'Double Materiality Assessment sources'.
The materiality assessment informs our sustainability strategy (see section III 'Our sustainability strategy').
The materiality assessment is connected to key risk management processes across the Group, as it is an input for the top & emerging risks exercise, and it is connected to the Climate Risk materiality (see section 10.2 'ESG factors risk management'). This climate materiality serves to prioritize our climate strategy and targets and inform risk appetite.
28
1.2 Impacts, risks and opportunities
GRI 3-1
To assess the materiality of each sustainability matter, we have identified the derived impacts, risks and opportunities (IROs).
The table below details the IROs for the three material sustainability matters and the two informative matters.
| Impact | Risk | Opportunities | ||||||||||||||||||||||||
| Climate change | Santander can have a positive impact by financing customers’ transition to a low-carbon economy. This transition will benefit the reduction of total emissions released into the atmosphere, thus making a positive contribution to the Paris Agreement. | Climate change can cause economic losses to our customers, who might be affected by physical or transition risk. These risks could lead to increased default rates or reduced value of collaterals. Our diversification by geography and sector reduces this risk across our balance sheet and we manage this risk by embedding climate into risk management. For more details, see section 2.3 Risk Management. | Supporting our customers in their transition has become a key business driver. Our target is to raise or facilitate €220 bn in green finance by 2030. To do so, we are building capabilities and developing our value proposition for customers across sectors and activities (finance, investment, advisory etc.). | |||||||||||||||||||||||
| Business conduct | Santander’s behaviour and actions have an influence due to the bank’s leadership in the markets where we operate. | Inadequate behaviour or conduct could lead to fines and reputational risk. Fostering a solid corporate culture in which everything we do should be Simple, Personal and Fair is how we mitigate this risk. | Applying a solid corporate culture and conduct when dealing with customers can earn their trust and help set us apart. | |||||||||||||||||||||||
| Consumers and end-users | Santander can have a positive impact on consumers and end users due to our ability to help customers access financial services and in promoting their financial health. | Lack of transparency in customer information or unfair disclosure may lead to customer dissatisfaction and complaints, which would entail direct and indirect costs. Data privacy events may hamper customers’ trust. A deterioration in the financial health of our customers may increase the risk of default on loans. We mitigate this risk by developing a solid corporate culture and behaviours and policies to set clear guidelines about how we deal with customers, process customer data and interact with vulnerable customers. | Robust data privacy measures and Know Your Customer protocols can boost our revenue by building trust with customers. Our financial inclusion proposition is also a source of new customers. | |||||||||||||||||||||||
| Own workforce | Santander employs over 200,000 people worldwide. We aim to have a positive impact on our workforce through working conditions, remuneration schemes and Diversity, Equity and Inclusion policies. | Less motivated people could lead to higher rotation and absenteeism, which could increase our cost base. Poor talent retention can also harm our performance. Our own workforce strategy seeks to mitigate this risk with initiatives in areas such as diversity, equity and inclusion, culture, and health and well-being. | A well skilled and diverse workforce boosts results by increasing productivity, fostering innovation and enhancing customer satisfaction. | |||||||||||||||||||||||
| Affected communities | Santander can have a positive impact by using our scale and local leadership to help the communities where we operate access basic needs (affordable housing, water and sanitation, etc.) and make a positive contribution to the sustainable development goals (SDGs). | Some of the activities we finance can pose environmental and social risk related to the communities where these operations take place. We mitigate this risk through our Environmental, Social and Climate Change (ESCC) policy and other internal controls. | Financing basic needs in the regions where we operate (affordable housing, water and sanitation, etc.) is an opportunity to increase revenue. Our financial education proposition and our support for higher education, employability and entrepreneurship help build trust and enhance the perception of the bank in the communities where we operate. | |||||||||||||||||||||||
Thresholds: ¢ Critical ¢ Significant ¢ Important ¢ Informative ¢ Minimal | ||||||||||||||||||||||||||
29
2. Supporting the green transition
Our ambition is to achieve net zero carbon emissions by 2050. We support the green transition in four ways:
| ó | ó | ó | ó | |||||||||||||||||||||||||||||||||||||||||
Aligning our portfolio with the Paris Agreement goals  Contribute to limiting temperature increases to 1.5ºC in line with the NZBA and NZAMi | Supporting our customers in the transition  Provide customers with a wide range of solutions to support their transition to a low-carbon economy | Reducing our environmental impact  Remain carbon neutral in own operations and consume 100% electricity from renewable sources by 2025A | Embedding climate in risk management  Manage climate and environmental risk according to regulatory and supervisory expectations | |||||||||||||||||||||||||||||||||||||||||
Our targets:
| 2018 | 2019 | 2020 | 2021 | 2022 | 2023 | 2025/2030 target | |||||||||||||||||||||||||||||||||||||||||
Electricity from renewable sourcesA | 43% | 50% | 57% | 75% | 88% | 97% |  | 100% by 2025 | |||||||||||||||||||||||||||||||||||||||
Carbon neutral in our own operationsB | |  | | | | Every year | |||||||||||||||||||||||||||||||||||||||||
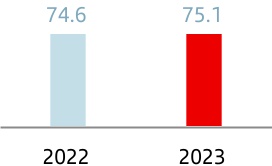
Green finance raised and facilitated (EUR bn)C | 19 | 33.8 | 65.7 | 94.5 | 114.6 | 120 bn by 2025 220 bn by 2030 | |||||||||||||||||||||||||||||||||||||||||
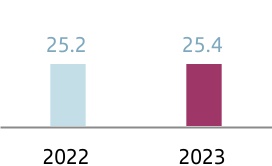
AuMs in Socially Responsible Investments (SRI) (EUR bn) | 27.1 | 53.2 | 67.7 | | 100 bn by 2025 | ||||||||||||||||||||||||||||||||||||||||||
Thermal coal-related power & mining phase out (EUR bn) | 7 | 5.9 | 4.9 | | 0 by 2030 | ||||||||||||||||||||||||||||||||||||||||||
Emissions intensity of power generation portfolio | 0.21 | 0.17 | 0.19 | | 0.11 tCO2e / MWh in 2030 | ||||||||||||||||||||||||||||||||||||||||||
Absolute emissions of energy (oil & gas) portfolio | 23.84 | 22.58 | 27.43 | | 16.98 mtCO2e in 2030 | ||||||||||||||||||||||||||||||||||||||||||
Emissions intensity of aviation portfolio | 92.47 | 93.05 | 97.21 | | 61.71 gCO2e/ RPK in 2030 | ||||||||||||||||||||||||||||||||||||||||||
Emissions intensity of steel portfolio | 1.58 | 1.40 | 1.36 | | 1.07 tCO2e/ tS in 2030 | ||||||||||||||||||||||||||||||||||||||||||
| New in 2023 | Emissions intensity of auto manufacturing portfolio | 149 | 138 | | 103 gCO2/vkm in 2030 | ||||||||||||||||||||||||||||||||||||||||||
Emissions intensity of auto lending portfolioD | 137 | | 75-89 gCO2e/vkm in 2030 | ||||||||||||||||||||||||||||||||||||||||||||
| From…To | Cumulative target | | Commitment Achieved | ||||||||||||||||
A. In countries where we can verify electricity from renewable sources at Banco Santander properties. It considers the 10 main countries in which we operate.
B. Scope 1 and 2 emissions and scope 3 emissions from employee commuting and business travel. It considers wholly owned companies in Argentina, Brazil, Chile, Germany, Mexico, Poland, Portugal, Spain, the United Kingdom and the United States.
C. Preliminary data as final League Tables for 2023 were not yet available at the date of editorial closing. CIB contributed EUR 20.2 billion to the green finance target, including EUR 5.6 bn in Project Finance; EUR 2.8 bn in financial advice; EUR 5.8 bn in green bonds (DCM); EUR 0.2 bn in export finance (ECAs); and EUR 5.8 bn in M&A, according to Dealogic, Infralogic, TXF and Mergermarket league tables. In 2023 there was no significant contributions from ECM and Project bonds. This refers to all roles undertaken by Banco Santander in the same project. It does not include financial inclusion and entrepreneurship. Green Finance raised and facilitated is not a synonym of EU Taxonomy. Please refer to specific section on EU taxonomy-related requirements for further details in this regard. This information will be updated to year end in the next Climate Finance Report.
D. Consumer lending for acquisition of passenger cars, covering a significant majority of the exposure in Europe.
30
2.1 Our strategy and ambition
GRI 2-24, 2-25, 3-3
Santander aims to be net zero in carbon emissions by 2050. This applies to the Group’s operations and emissions from our lending, advisory and investment services.
Since 2021, we are a founding member of the Net Zero Banking Alliance (NZBA, under the United Nations Environment Programme Finance Initiative), committing the Group to: →support the transition of operational and attributable greenhouse gas (GHG) emissions from lending and investment portfolios towards pathways to net zero by mid-century; and →set intermediate targets for priority GHG emitting sectors for 2030 (or sooner). | ||||||||
Santander Asset Management (SAM) aims to achieve net zero greenhouse gas emissions with its assets under management by 2050. SAM joined the global Net Zero Asset Managers initiative (NZAMi) in 2021 as part of its commitment to fight climate change and set an interim target to halve net emissions for 50% of its AUM in scope by 2030. | ||||||||
We have a four-pronged climate strategy to support the green transition and achieve net zero carbon emissions by 2050:
1) Align our portfolio with the Paris Agreement goals to help limit warming to a 1.5ºC rise above preindustrial levels; and set sector portfolio alignment targets in line with the NZBA and with NZAMi.
2) Help our customers' green transition, raising or facilitating EUR 120 bn in green finance between 2019 and 2025 and EUR 220 bn by 2030; offer our customers guidance, advice and specific business solutions; and enable them to invest in a wide-range of products according to their sustainability preferences, with the target of reaching EUR 100 bn AuM in SRI by 2025.
3) Reduce our impact on the environment, implementing efficiency measures, sourcing all our electricity from renewable energy by 2025 and remaining carbon neutral in our operational1 carbon footprint.
4) Embed climate in risk management and understand and manage the sources of climate change risks in our portfolios.
| For more details on our 'Climate Finance Report' and the net zero announcement press release, see our corporate website santander.com. | ||||
| For more details on SAM’s strategy, see 'Our net zero strategy' in section 3. 'Responsible Investment'. | ||||
Our approach
Transitioning entails allocating the correct resources and focus capabilities on decarbonizing the most material, high-emitting sector portfolios. The methodologies we have developed inform our plans to decarbonize our credit portfolios, especially the ones directly related to fossil fuels.
To support our approach, the Group’s climate risk management area performs a climate transition assessment for wholesale corporate customers in the oil and gas, power generation, metals and mining, auto manufacturing, aviation and cement sectors. This goes beyond sectors for which we have targets and covers others that are highly prone to transition risk.
Our key governance bodies regularly review progress with our main climate-related pillars, which consist of portfolio alignment, support our customers' green transition, reduce our environmental impact and embed climate in risk management.
Disclosing our approach is key to helping markets and other stakeholders assess how we embed climate-related initiatives in our processes and policies, and report on our climate-related performance. We use the Taskforce on Climate-related Financial Disclosures (TCFD) and GFANZ Financial Institutions Net Zero Transition Plans as the frameworks to disclose our approach to integrating climate in our investment strategy and help us draw up our transition plan.
2023 highlights
→We raised or facilitated EUR 20.2 bn2 (EUR 114.6 bn since 2019) and took advantage of climate finance opportunities to make progress with our green finance target (See 'Supporting our customers in the transition').
→We set additional decarbonization targets for the automotive sector for 2030: one for the auto manufacturing portfolio (-31% intensity emissions vs 2020); and one for the auto lending sector portfolio in Europe (range between -35% and -45% intensity emissions vs 2022).
→We updated our Sustainable Finance and Investment Classification System (SFICS) based on lessons learned and market trends. The SFICS provides criteria to flag the Group's financing and investment activities as sustainable (that help mitigate or adapt to climate change).
→We developed a methodology for tiering customers according to their degree of alignment forecast for 2030 for the energy, steel and aviation sectors. We enhanced quality assessments
1 Scope 1 and 2 emissions and scope 3 emissions from employee commuting and business travel. It considers wholly owned companies in Argentina, Brazil, Chile, Germany, Mexico, Poland, Portugal, Spain, the United Kingdom and the United States.
2 Preliminary data as final League Tables for 2023 were not yet available at the date of editorial closing. This information will be updated to year end in the next Climate Finance Report.
31
of transition plans, based on updated benchmark methodologies and sector research. The tiering assessment helped set risk appetites in relation to these targets.
→We supported the University of Oxford with funding for a Transition Finance Centre of Excellence, which works in developing transition finance, best practice, new tools and insights. We also participated in the Banking for Impact on Climate in Agriculture (B4ICA) initiative, contributing through the development of methodologies to help the sector transition to low carbon.
→We continued to embed environmental and climate factors in policies, risk appetite and risk management. We strengthen
our risk management cycle with initiatives such as 'The Climate Race', a target operating model to embed environmental and climate change (E&CC) factors in all stages of credit approval.
→We conducted an internal assessment of dependencies and impacts with the available data and methodologies regarding nature and biodiversity.
→In 2023, 97% of our electricity came from renewable sources. We have been reducing our carbon footprint since 2011 and mitigating beyond the value chain the remaining CO2e emissions from our own operations since 2020.
2.2 Governance
201-2, FS1, FS2, FS3
Climate change and green transition oversight bodies:
•The board of directors oversees our activity regarding climate change and the green transition. In 2023, the board discussed these topics at seven meetings, including the Climate-Net Zero ambition plan, the ESCC policy review and disclosure reports. Additionally, business units and global businesses report annually to the board on their main ESG initiatives.
•The responsible banking, sustainability and culture committee (RBSCC) assists the board of directors in fulfilling its oversight responsibilities with respect to the responsible business strategy and sustainability issues of the Company and its Group. During 2023, this board committee has reviewed and discussed items related to climate change at five sessions in 2023.
•The RBSCC coordinates its activities with the other board committees, in particular with the risk supervision, regulation, and compliance committee and with the board audit committee. The first one, has assessed the ESG policies and ESG risk appetite and the latter has supervised financial and non-financial reporting and disclosures, as well as related ESG processes and controls.
•At the level of the Group's executive committees, other governance bodies such as the risk control committee, the strategy committee and the financial accounting and reporting
committee are involved in the review of: ESCC risk policies, risk appetite and risk management; the definition of ESG strategy; and the review of ESG disclosure, reporting, processes and controls.
•The Responsible Banking Forum (RBF) discussed climate change and/or green finance at its six meetings in 2023. As this body supervises consistency across the Group on key issues, it reviewed and escalated the mentioned topics, as well as criteria tools to label products and services as sustainable, developments in tagging standards, and decarbonization plan overviews.
•The management meeting chaired by the CEO, reviews the day-to-day implementation of ESG activities related to climate change and green finance.
| For more details on the topics discussed by the RBSCC and actions taken, see section 4.9 'Responsible banking, sustainability and culture committee' in the 'Corporate governance' chapter. | ||||
| |||||
Main areas involved in implementing our climate change strategy
| | | | |||||||||||||||||||||||
| Pillar of the climate change strategy | Aligning our portfolio with the Paris Agreement goals | Supporting our customers in the green transition | Reducing our environmental impact | Embedding climate in risk management | ||||||||||||||||||||||
| Main areas | Responsible banking, global businesses and local units set alignment targets | Green Finance, CIB (ESG solutions), SCF and Wealth Management & Insurance | Facilities, General services and Responsible banking | Global and local teams across all areas of Risk and Compliance | ||||||||||||||||||||||
32
•In 2023 we continued to embed climate management in business-as-usual across CIB, Risk and Responsible Banking. For instance, CIB set up a dedicated team for portfolio alignment and strengthened its corresponding governance.
•Beyond CIB, a number of local units are engaged in a process coordinated by Group Responsible Banking. The objective is to progress the decarbonization agenda, promote knowledge and expertise sharing among local teams, and seek out synergy to design reliable transition plans.
•Other corporate-level initiatives and groups that support governance meet regularly to implement or advise on our climate change agenda. For example, our public policy sustainability working group advises on regulation; the environmental footprint working group measures our footprint and reviews ways to reduce it; and the sustainable bonds working group oversees sustainable bonds issues.
•The 2023 internal audit plan, based on the annual risk assessment, continued to uphold the monitoring of ESG criteria and embedding of climate risk. In 2023, the Internal audit function monitored the progress of our key initiatives to meet ESG disclosure requirements and embed climate change in the bank’s business processes and risk management.
•Since 2020, Santander has assessed green finance and progress made on climate targets and other ESG targets for the Group's variable remuneration scheme.
| For more details on ESG in remuneration schemes, see section 6.4 'Directors' remuneration policy for 2024, 2025 and 2026' in the 'Corporate governance' chapter. | ||||
2.3 Risk management
GRI 2-25, 201-2
•We’re gradually embedding climate and environmental factors in our risk management and cross-cutting enterprise risk management processes such as the risk appetite and the identification of emerging risks exercise, among others.
•Risk appetite: In 2023, we approved new quantitative metrics for energy (oil and gas), steel, and aviation, which will be implemented in 2024.
•Emerging risks: Exercise with the spotlight on such emerging ESG risks as greenwashing, the environment and biodiversity.
•Materiality assessment: We run a quarterly materiality assessment to pinpoint the loan portfolios with the highest physical and transition risk. Additionally, we progressed in our materiality assessment' methodology beyond credit risk during 2023.
•Embedding ESCC factors in loan approval and monitoring: Including ESCC factors in loan approval and tracking through our 'The Climate Race' operating model has helped us embed ESCC in our strategy. This model is underpinned by strategic planning, risk management, loan approval and monitoring, models and systems, and culture and governance.
•Evolution of the Klima management tool: In Q3’23 we have integrated a physical risk assessment module into our tool, which allows the identification of physical risks in collaterals and client portfolios, adjusting their vulnerability by economic activity.
•ESG training: Grupo Santander employees can undertake specific ESG training. We also have training pills and top case studies to share best practice. Course content includes materiality assessments, scenario analyses, physical risk, and analysis of sectors subject to ESCC factors.
•Increase awareness on nature and biodiversity: At Santander we know some of our customers’ endeavours may have bad consequences for the environment. That’s why we run two simultaneous exercises under an internal risk assessment methodology to assess environmental impact and dependency.
•Regulatory exercise: in 2023, we took part in the EBA regulatory exercise climate risk scenario analysis (Fit-for-55), covering credit risk, market risk, commissions and incomes, and real estate risks.
| For more details on our risk management approach and progress, see section 10.'ESG risk factors' in 'Risk, compliance and conduct management.' chapter. For more details on our Climate Finance Report, visit our corporate website santander.com. | ||||
2.4 Metrics and targets
GRI 2-24, 3-3, 201-2
To reach net zero in carbon emissions by 2050, our initial focus has been on the most material sectors and lending, which is our most material financial activity.
We disclose scope 1, 2 and 3 emissions performance data and other climate relevant metrics (e.g., energy consumption). We report on our renewable electricity and carbon neutrality in our own operation targets. We also began to disclose financed scope 3 emissions (category 15) in 2021, in relation to our decarbonization commitments.
Portfolio alignment
We joined the UN Collective Commitment to Climate Action (CCCA) when it launched in September 2019. We announced our ambition to achieve net zero carbon emissions by 2050 in February 2021, which was already stated in the 2020 Annual Report. We’re a founding member of the UNEP FI Net Zero Banking Alliance (NZBA) as a key initiative to help us drive progress with our net zero ambition.
33
We use internal methodologies that take input and recommendations from the NZBA guidelines, the PCAF standard, GFANZ (Glasgow Financial Alliance for Net Zero) publications, SBTi (Science Based Targets initiative) and other standards. We also use external data and models from third parties with recognised market reputation/expertise.
We rely on financial information from our customers (e.g., total equity and total debt), as well as non-financial information (e.g., GHG emissions, production data, and physical emissions intensities). Though the non-financial information required is becoming more available as more companies begin to report GHG emissions, it still falls short in certain sectors and regions. Where available, such metrics may not be timely or fully accurate. If no public emissions data exist, we estimate them based on a proxy (average emissions by industry, country, etc.). Once we can quantify our customers' total emissions, we would be able to apply our attribution factor in line with the PCAF approach to determine Santander’s financed emissions.
Roadmap for delivery on net zero
•Our materiality assessment of physical and transition risks enables us to focus on high GHG emission intensity sectors and begin developing specific decarbonization strategies for sectors defined within NZBA, which are relevant in view of our clients' profile.
•We monitor and review our targets, as new methodologies and more precise and timely information become available in the market.
Decarbonization targets
As part of our ambition to reach net zero carbon emissions by 2050, we prioritize the high-emitting sectors (which also bear high and very high transition risk according to our climate materiality) to which we have a material exposure and must act now to support the transition to a low-carbon economy. In 2021 and 2022 we set targets for the wholesale segment in the power generation, coal and oil and gas, aviation and steel portfolios. In 2023, we focused on the automotive sector from two perspectives: auto manufacturing (wholesale segment) and auto lending (consumer lending for the acquisition of passenger cars in Europe). Under our current assessment of NZBA sectors3, aluminium, cement and shipping are not deemed material. Therefore, we are not setting targets for these sectors.
Within the NZBA sectors, we are also making headway with analysing, measuring and acting to help decarbonize other climate-related sectors such as agriculture, mortgages and commercial real estate, which are key in the retail segments. The climate performance dynamics of these sectors are heavily dependent on their regulatory landscape. There is currently a lack of public policies, actions and specific plans and measures at the level the changes require for a net zero pathway. We continue to work with clients in these sectors on their decarbonization efforts and internal monitoring of their performance; but we understand we should refrain from setting public targets until their regulatory landscape is sufficiently supportive. We have been actively and constructively sharing our understanding and experience of these policy gaps with authorities, as well as other sectors, and plan to keep doing so.
Given our footprint, we see markedly different environment landscapes in the regions where we operate. Our aim is to help our customers transition and contribute to their decarbonization, while understanding the constraints and limitations they may face in different jurisdictions and the gaps that make setting targets in certain sectors unfeasible. Weighting the E, the S and the G appropriately across our strategy is key to avoid undermining other ESG goals, while we pursue tackling climate change. The transition must be just and orderly.
In this 2023 annual report, we publish two additional decarbonization targets for the automotive sector. These targets focus on the most important sources of emissions in the auto sector value chain: (i) emissions from cars produced by manufacturers (scope 3 - use of sold products); and (ii) emissions from cars financed to end-users, plus grid emissions (in line with PCAF guidelines). Achieving these targets relies heavily on public policies, build-up of EV-infrastructure (e.g., charging points), and consumer behaviour in key auto markets.
In addition, we publish the financed emissions of two relevant portfolios of the group, mortgages in the United Kingdom and agriculture in Brazil, and the progress in the alignment of these portfolios.
3 The NZBA guidelines consider these sectors: agriculture; aluminium; cement; coal; commercial and residential real estate; iron and steel; oil and gas; power generation; and transport.
34
| Decarbonization targets | ||||||||||||||||||||||||||
| Sector | Scenario | Emissions | Metric | Baseline | 2020 | 2021 | 2030 targets | |||||||||||||||||||
 | Power generation | IEA Net Zero 2050 | Scope 1 | tCO2e/MWh | 0.21 (2019 baseline year) | 0.17 | 0.19 | 0.11 (-46%) | ||||||||||||||||||
 | Energy (Oil & Gas) | IEA Net Zero 2050 | Scope 1 + 2 + 3A | mtCO2e | 23.84 (2019 baseline year) | 22.58 | 27.43 | 16.98 (-29%) | ||||||||||||||||||
 | Aviation | IEA Net Zero 2050 | Scope 1 + 2 | gCO2e/RPK | 92.47 (2019 baseline year) | 93.05 | 97.21 | 61.71 (-33%) | ||||||||||||||||||
 | Steel | IEA Net Zero 2050 | Scope 1 + 2 | tCO2e/tS | 1.58 (2019 baseline year) | 1.40 | 1.36 | 1.07 (-32%) | ||||||||||||||||||
 | Auto manufacturing | IEA Net Zero 2050 | Scope 3A | gCO2/vkm | 149 (2020 baseline year) | 149 | 138 | 103 (-31%)B | ||||||||||||||||||
 | Auto lendingC | IEA Net Zero 2050 | Scope 1 + 2 | gCO2e/vkm | 137 (2022 baseline year) | N/A | N/A | 75-89 (-35-45%) | ||||||||||||||||||
 | Thermal coal | Phase-out targets to eliminate exposure by 2030 to power generation customers with a revenue dependency on coal of over 10%, and thermal coal mining | ||||||||||||||||||||||||
A Use of sold products. B Target reduction is -25% vs 2021 reference C Consumer lending for the acquisition of passenger cars, covering a significant majority of the exposure in Europe. | ||||||||||||||||||||||||||
Power generation
Our portfolio includes corporate clients as well as project finance (PF) deals. In 2021, our emission intensities slightly increased from 0.17 in 2020 to 0.19 tCO2e/MWh. The main causes were (i) reduction of the relative weight of renewable PF in the overall portfolio; and (ii) temporary adverse climate conditions such as drought in Brazil (which caused hydroelectric generation to be replaced by conventional generation). However, our corporate clients’ emission intensities improved.
Energy (Oil & Gas)
The absolute financed emissions of our portfolio increased 4.85 mtCO2e from 2020 to 2021. According to the IEA (International Energy Agency), global energy-related carbon dioxide emissions rose 6% in 2021 to 36.3 billion CO2e tons, their highest ever level. The increase in drawn exposure (used to calculate financed emissions) has been driven by the post-COVID economic recovery and the global price increases in 2021, causing financed emissions to rise with it.
Aviation
Emission intensity increased from 93.05 in 2020 to 97.21 gCO2e/RPK in 2021, driven by a reduction in the exposure to some of the less polluting customers, while the emission intensities of individual airlines started to normalize in the second COVID-affected year. The materiality of this sector in terms of exposure and financed emissions declined in a trend that should spill over into the coming years. With the current levels of sustainable aviation fuel (SAF) and efficiency gains, we see the decarbonization in the aviation sector happening slower than expected.
Steel
Reduction in emission intensity from 1.40 to 1.36 tCO2e/tonS was mainly driven by improvements of individual clients. Availability of reliable data is especially challenging in this sector as a significant amount of our customer base is yet to report GHG emissions.
The automotive sector is one of the key sectors to tackle in the transition to a low-carbon economy. According to the International Energy Agency (IEA), road transport accounts for over 15% of global energy-related emissions. The switch from internal-combustion engines (ICE) to electric vehicles (EV) and plug-in hybrid electric vehicles (PHEV) is the most important decarbonization lever for this sector. We are helping our auto manufacturer customers adapt their business models and product offering towards EVs and PHEVs. As we are a leading auto end-user lender in Europe, we are also helping our retail customers finance purchases of an increasing number of EVs and PHEVs. As part of our net zero ambition, we are committing to decarbonize our global auto manufacturing and European auto lending loan portfolios, with a 2030 target and a 2030 target range, respectively. | ||||||||
35
Auto manufacturing
We set our 2030 target based on the NZE 2050 scenario from the IEA, in line with existing decarbonization targets. The key component for decarbonizing the sector is the switch to electric cars. Emission intensity improved from 149 gCO2/vkm in 2020 to 138 in 2021, mostly due to a general reduction of emissions in the industry, complemented by a slight contribution of the portfolio effect. The 2030 target entails a 31% reduction, from 149 gCO2/vkm in 2020 to 103 gCO2/vkm in 2030.
Auto lending
Santander Digital Consumer Bank measured the financed emissions of its auto lending portfolio in 16 units (13 countries in Europe) following the PCAF (Partnership for Carbon Accounting Financials) methodology, and used the IEA NZE 2050 as a reference pathway. In 2022, which was taken as the baseline year, SCF Auto emissions were 137 gCO2e/vkm. SCF set a decarbonization range for 2030 of 75-89 gCO2e/vkm, which would entail a reduction of 35-45% in its financed emissions.
The fulfillment of both targets for the automotive sector will depend on, among other conditions, several external factors such as: →Regulation and policy: Effective government measures and policies are needed to reach the EV sales and decarbonization levels that net zero scenario requires. Countries will need to meet the timelines set to end sales of ICE. The introduction of low emissions zones would support this change. Further adoption of subsidies on EV purchases will be key to drive up penetration, as we have seen in the Nordic countries. →Technology: A guaranteed supply of the required materials to produced EVs and PHEVs at scale is needed, to match demand. Also, reducing EV and PHEV production costs is needed to ensure affordability in comparison with the less clean alternative (ICE), and thus ensure a just transition. →Infrastructure: Reaching a high penetration of EVs and PHEVs will require a deep transformation of the supply chains and the infrastructure that powers them (increasing the number of charging points and their performance) to shift from a model of predominantly ICE cars to an EV and PHEV majority. The investment needed for this infrastructure will require support from governments and other actors, which could be affected by conflicting interests such as energy security. | ||||||||
Decarbonization plans
Further to the five existing decarbonization targets published in 2021 and 2022, and the two new targets in automotive sector, in 2023 we also worked on the decarbonization assessments of other climate-relevant portfolios including mortgages, commercial real estate and agriculture sectors. The selection of sector portfolios for this exercise considered their materiality both at group and country level within the NZBA list of high emitting sectors. The objective of these sectors/portfolios assessments is to understand the level of financed emissions in each case, identify levers to progress on decarbonization and understand the feasibility of a net zero decarbonization pathway. The exercise comprised: baseline-financed emissions calculations, expected trajectory towards 2030, internal and external decarbonization levers analysis (considering supply and demand aspects, the regulatory framework and support for sectors decarbonization), internal governance established to monitor the decarbonization progress of each portfolio, identification of commercial opportunities and initiatives to improve data quality to help decarbonize the customers from these portfolios. Further details are provided below in relation to the UK mortgage and Brazil agriculture exercises.
Mortgages
Santander UK adopted the Partnership for Carbon Accounting Financials (PCAF) framework to calculate financed emissions associated with the Mortgages portfolio. Financed emissions were calculated at property level using the value at origination, the outstanding loan amount as at 31 December 2022, and building emissions taken from the EPC assessment for the property. Where no EPC exists, we used nearby properties with a similar age and type to infer the EPC or, where this wasn’t possible, a regression model trained with multiple known property characteristics. This
resulted in a PCAF score of 3.3 and portfolio coverage of over 99% over a EUR 211.05 bn portfolio. Our baseline emissions as at 31 December 2022 were 39.72 kgCO2e/m2.
We also undertook an analysis to understand how we could decarbonize our mortgage lending across two scenarios (a low success scenario broadly aligned to current UK policy and a high
success scenario reflecting plausible but more ambitious policy action). In both scenarios we assessed the actions within or outside our control. This analysis will be used to inform our ongoing green finance strategy and public policy engagement over the coming years. In both scenarios we believe the 2030 net zero targets will be challenging to achieve and require further market and policy developments outside of our control.
In light of this analysis and while we will continue to advocate for policy change and maintain our existing green proposition, the key is to enhance our knowledge of the barriers people face in taking action; and to develop the partnerships and propositions required so that we’re best placed to meet our customers’ needs when the policy landscape changes.
Agriculture
Agriculture and land-use change account for 75% of gross CO2e emissions in Brazil. The agribusiness sector makes up more than 20% of Brazil’s GDP. Measuring the sector's financed emissions is, however, not trivial. Agriculture comprises a complex and extensive value chain, with varying sources, types, and quantities of GHG emissions. Moreover, agriculture practices and emissions vary depending on the commodity, management techniques and geographic location, among other factors.
36
Given the core role of farms in the agriculture value chain, our initial assessment covered scope 1 and 2 emissions originating from farm-gate activities and the land use change (LUC) associated with farmland.
Guidelines for setting net zero targets in the agricultural sector are still under development. To overcome the lack of methodology, Santander Brasil, in collaboration with WayCarbon, estimated its financed emissions based on the PCAF methodology, the GHG Protocol and IPCC accounting guidelines, adapted to the landscape in Brazil and the agricultural sector.
Santander Brasil’s on-balance credit exposure to farms with primary production was EUR 1.80 bn in March 2022. We estimated financed emissions from that portfolio4 amount to 6.20mtCO2e/year: 81.9% estimated for land management, 18% for LUC and less than 1% for energy consumption. The PCAF quality score is 3.35.
Though land use change is Brazil's main source of emissions, this category is not the most representative for us. Santander Brasil monitors all financed properties against illegal deforestation daily (see more details in ‘Santander and the Amazon’), which contributed to lower emissions in this category.
Following GHG Protocol guidance, we measure LUC emissions considering a 20-year legacy, including legal deforestation, which is characteristic of some properties in the country.
In addition to its importance in food production, agriculture can be an agent of transformation to decarbonize a country through nature-based solutions.
Our approach to support decarbonization levers towards a low-carbon agriculture portfolio. It includes:
•helping customers build a low-carbon agriculture future though green finance solutions and innovative financial transactions (for more details, see Sustainable Innovation);
•engaging with the Government and local and global forums to share methodologies, open the broader debate to improve data and accelerate decarbonization in agriculture; and
•taking part in the Banking for Impact on Climate in Agriculture (B4ICA) initiative, led by the World Business Council for Sustainable Development (WBCSD), contributing with the development of methodologies to guide the sector in the transition to a low-carbon economy.
Customer engagement in CIB
Our approach aims to facilitate the achievement of our emissions targets and to develop a strong understanding of our customers’ transition strategies towards low carbon business models.
To do this, we have established a two-step approach to categorize our customers according to their emissions pathway and perceived quality of their transition plans. In 2023 we implemented this approach for additional sectors beyond Power, where targets have been set and adapted where necessary to account for sector differences.
The first step involves assessing how our customers’ emissions trajectory aligns with our current sectoral baseline and future sectoral portfolio targets. The second step focuses on four pillars: Targets, Action Plan, Disclosure and Governance. We draw on established transition plan assessment methodologies to inform our assessment. How strong we perceive each customer’s transition plan to be across each pillar will influence how we ultimately tier them.
| Two-step tiering system | ||||||||
 GHG emissions profile alignment | •Current GHG emissions profile •Future targeted GHG emissions trajectory •Assessment of alignment with Santander’s pathway | |||||||
 | ||||||||
 Transition plan quality assessment | •Internal methodology to assess perceived quality of transition plans •Developed using established transition plan assessment methodologies | |||||||
| Transition Pillar | Overview | |||||||
1. Targets | Quality and ambition of quantitative targets to reduce GHG emissions | |||||||
| 2. Action plan | Depth of decarbonization strategy to achieve GHG emissions reduction targets | |||||||
| 3. Disclosure | Transparency on GHG emissions reporting across relevant scopes | |||||||
| 4. Governance | Management oversight and governance of transition strategy | |||||||
In 2023, we expanded the two-step tiering assessment to include Energy, Steel and Aviation. Initial assessments were completed for both steps. Subsequently, transition plan quality assessments were reviewed and enhanced, drawing on updated reference methodologies and sector-specific research. This led to the inclusion of additional sector-specific questions for assessing transition plan quality.
4 Considering different commodities (such as soy, corn, rice, sugarcane, cotton, and coffee, measured in tons) and meat and dairy products (measured per head of cattle), in addition to the land use change (measured in hectares), currently not consolidated into a single physical emission intensity.
5 Since there is no specific methodology for agriculture, PCAF score was adapted considering the data available in primary production portfolio that made possible to measure land management emissions.
37
We have also implemented training for senior staff in CIB on transition topics, in collaboration with external experts. In 2023, multiple sessions took place involving senior bankers on climate regulations and taxonomies; greenwashing; climate pathways to net zero; frameworks to assess customers' transition plans; and others.
Our tiering system output has four categories (Leader, Strong, Moderate and Weak) that help inform how we prioritize engagement topics and enrich dialogue with our customers, while contributing to meeting our own portfolio emissions targets. Our client tiering allows for tailored transition dialogue to support them in navigating the low carbon transition, with the expectation that initially worse-tiered customers will migrate to better tiers over time.
| Tier Categories | Description | |||||||||||||
Tier 1 | Leader | •Emissions profile fully aligned with Santander’s pathway •Strong transition plan | ||||||||||||
| Tier 2 | Strong | •Emissions profile fully aligned with Santander’s pathway but improvement needed in transition plan; or •Strong transition plan but emissions profile partially aligned with Santander’s pathway | ||||||||||||
| Tier 3 | Moderate | •Emissions profile partially aligned with Santander’s pathway, but improvement needed in transition plan; or •Emissions profile not aligned with Santander’s pathway, but strong transition plan | ||||||||||||
| Tier 4 | Weak | •Emissions profile not aligned with Santander’s pathway •Weak transition plan | ||||||||||||
2.5 Supporting our customers in the green transition
GRI 3-3, FS8, SASB FN-IB-410a.2, FN-IB-410a.3
As a large financial institution, we have a responsibility and an opportunity to help our customers in their transition to a low-carbon economy. Enhancing our sustainable finance and advisory proposition in all our divisions and regions is critical to meeting our green and climate transition objectives.
Corporate and Investment Banking (CIB)
In 2023, CIB continued building its ESG platform and embedding ESG in the organization. We integrated ESG experts within business, risk, portfolio management and compliance teams.
We further embedded our sustainable finance classification system governance across regions and businesses to ensure a consistent approach to our sustainable finance activity.
Santander has been a leader in renewable energy project finance over the last decade. In 2023, we remained among the top banks in number of deals and deal value globally, with 85 transactions and EUR 6.7 bn in financing. The following section shows how CIB supported customers in their transition to low carbon business models in 2023.
CIB highlights
Project Finance (PF)
CIB acted as Mandated Lead Arranger, Bookrunner and Underwriter in the EUR 727 million financing of the construction of 21 photovoltaic (PV) generation assets with a total capacity of 1.2GW for Cobra Instalaciones y Servicios in Spain.
CIB also acted as Sole Commercial Underwriter for 50% of the financing for Solaria Energía y Medio Ambiente, S.A, MLA, and Sole Hedge Provider and Account Bank in green financing for the
construction of 24 PV assets in Spain with a total capacity of 1,085MW and total financing of EUR 553 million. This is a landmark transaction and an important milestone for Banco Santander as it is one of the largest renewable project financings in Spain with a fully merchant revenue stream.
CIB acted as Mandated Lead Arranger, BPIAE and Sinosure Facility Agent, Green Loan Coordinator and Hedge Provider in financing the first NMC Batteries EV battery gigafactory plant. The plant is being built by Envision in France and will supply batteries to Renault as part of its electrification strategy. A ‘first of its kind’ for Santander, this transaction represents an important milestone for our Sustainable Tech Platform.
Debt Capital Markets (DCM)
During 2023, CIB continued to help clients strengthen their sustainability commitments within debt capital markets. Santander acted as Sustainability Structurer for a number of inaugural bond transactions in several countries. In Europe, we assisted Electricity North West (ENW), a UK distribution network operator that issued an inaugural £425m green bond, with proceeds used to finance their clean energy and environmentally friendly projects; PSA Banque France, the financing arm of Groupe PSA, that issued a €500m green bond with proceeds that will finance the acquisition of zero specific CO2 emissions vehicles; and Cyfrowy Polsat, the largest media and telecommunications group in Poland, that issued a PLN 2.67bn sustainability-linked bond to increase its share of energy consumption to 30% from zero-emission sources.
38
In Latin America, CIB acted as Joint Sustainability Structurer for a number of bond issuers, such as the Federative Republic of Brazil, that issued a US$2bn inaugural sustainable bond; and Grupo Energía de Bogotá (GEB), an integrated energy and utility company with presence in Colombia, Peru, Guatemala and Brazil, that issued its first US$400m sustainable bond. We also acted as Joint Sustainability Structurer for the Republic of Chile, that issued US$2.25bn and €750m dual-tranche sustainability-linked bonds, the first sovereign instruments to include a social target around the percentage of women members on the boards of companies that report to the local market regulator. In addition, CIB was named the 'Most impressive bank for ESG Capital Markets in LatAm' at the 2023 Global Capital Bond Awards.
Global Transaction Banking (GTB)
In 2023, CIB continued to embed sustainability in our Global Transaction Banking products. In Export Finance, we provided a sustainability-linked Export Development Guarantee with the British ECA (UKEF) to Easyjet, which was structured with bespoke ESG KPIs. We signed a green loan with Grenergy,
secured with the coverage of a Cesce Green Investment Policy,
aimed at financing projects that contribute to the fight against
climate change and that also includes a hybrid derivative as part of the structure. CIB acted as export finance financial advisor for the development of two gigafactories for battery manufacturing in Europe and the US. We also acted as Green Coordinator for an ECA Buyer Credit with the German ECA, Euler Hermes, for the National Authority of Tunnels in Egypt.
In Supply Chain Finance, we structured a sustainability-linked solution with Cellnex, a Spanish telco company with presence in 11 countries across Europe, to improve the adoption of sustainability practices for their supply chain through CDP’s Supply Chain assessment programme. The programme relies on Santander to onboard and actively manage more than 3,000 of its suppliers. We also signed a confirming solution with Henkel, a global chemical and consumer goods company, to structure its ESG Confirming programme in Latin America. In addition, we signed a confirming solution with a leading US energy company for the provision of solar and wind turbine equipment to generate renewable energy.
In Cash Management, we launched Green Deposits to help our clients align their liquidity management needs with environmentally sustainable activities. In Trade and Working Capital Solutions, we signed a sustainability-linked guarantee line with two European aerospace companies. We also provided Structured Secured Inventory Finance to one of our clients whose objective was to invest in renewable PV projects in Spain.
As recognition for our work in ESG, the MacIntyre Wind Farm transaction won 'Renewable Energy Deal of the Year' at the TXF Export Finance Deals of the Year 2022 awards for the construction of the largest wind farm in the southern hemisphere – CIB’s Export & Agency Finance team acted as lender and facility agent.
Corporate Finance
In 2023, CIB advised on several corporate finance transactions in the renewable energy sector. On the Iberian Peninsula, Santander supported Bruc Energy in the sale of a 49% stake in a 1.1GW solar PV portfolio to Interogo; and supported Ardian on the sale of a 422MW portfolio of wind farms and 435MW hybrid PV farms to Naturgy. In Poland, CIB advised EDP on the sale of 300MW operating wind farms and PV pipeline to Orlen. In the offshore wind sector, we were sell-side advisor to Iberdrola in the sale of a 49% stake in Baltic Eagle offshore wind farm to Masdar, the largest ever M&A deal involving an offshore wind asset in the Baltic Sea.
Our ESG Sustainable Tech team advised PATRIZIA Infrastructure on its equity investment in an EV charging rollout programme in Germany managed by Numbat, a specialist developer and operator of high-power EV charging solutions. PATRIZIA will invest over EUR 70 million to install 400 ultrafast EV charging stations at 200 supermarkets in Germany.
Combining our hydrogen expertise and our capabilities in France, CIB acted as sole financial advisor to Forvia and Michelin in the sale of a stake in Symbio to Stellantis, one of the largest ever hydrogen transactions globally at the time.
Building on our successful year-and-a-half strategic partnership, in September 2023, CIB acted as joint advisor to EIT InnoEnergy, a leading innovation engine in sustainable energy, in raising over €140m in private capital. The proceeds will be used to accelerate and de-risk the development of hundreds of EIT InnoEnergy portfolio companies. Since signing a collaboration agreement with EIT InnoEnergy in April 2022, Santander CIB has supported several InnoEnergy startups. This includes advising France’s biggest battery manufacturer, Verkor, on its partnership with Renault, and financing to Germany’s leading hydrogen power solutions company, HPS.
39
Retail and Commercial banking
Our Green Finance strategy aims to: put our clients at the centre to help them address energy transition challenges; implement a global green finance Target Operating Guidelines across all our markets leveraging global systems; and become a business engine of profitable growth for the Group.
Our ambition is to be a world leader in environmental finance that delivers value to our clients.
2023 highlights
1. Grow the Bank
To grow environmental finance, we have developed a business strategy of end-to-end solutions, and trained Retail and Commercial banking teams to meet customers’ and client´s needs. The global Green Finance team leverages its synergy with CIB, where we serve big corporates, being a driver of transition for the rest of the value chain. We offer sustainability-linked loans to our clients to support their transition needs, irrespective of sector.
In 2023, Santander signed several agreements to help our clients in their sustainable transition journey through the referral and financing of solar panel installations or to support them decarbonizing their real estate portfolio.
We partnered with selected providers of energy transition services, among others: CBRE, ANERR and Holaluz in Spain; Myenergi in the UK for EV chargers; Powen and Edge-IFC in Mexico; Solarity in Chile; and YPF Solar in Argentina. We’ve also launched pilot projects in other geographies.
At Santander we are currently offering 11 partnerships for solar panel solutions across our three regions (Europe, South America and North America).
2. Protect the Bank: zero tolerance to greenwashing
We drew up Green Finance Target Operating Guidelines to protect the Group from greenwashing risk, aligned with supervisory expectations on climate matters.
We set up ESG certification forums in Europe and South America to ensure transactions and products are consistent with the sustainable finance and investment classification system (SFICS) before labelling them as green.
In addition, we created Green Product Inventories in our core markets where we have implemented standards, validated evidences and established robust control and approval procedures.
The Global Green Finance team is developing a global training course to upskill all employees who manage green finance in our markets to support the transition of our clients.
3. Infrastructure: tools and systems
These common infrastructure tools already implemented or under implementation provide technical and operational efficiencies and scalability: the SFICS System, an automated tool for panels that we introduced in our core markets to support with the assessment and tagging of transactions against our classification system; and the global Green Dashboard and ESG Data Hub, which enable us to track business performance and the integrity of the data used.
40
Our customer propositions
| Sector | What we finance | Value proposition 2023 | |||||||||||||||||||||||||||||||||
Renewables  | Renewable energy production and transportation. Energy storage. | Financing of solar panels, wind farms and battery and storage battery production. |  |  |  |  |  | ||||||||||||||||||||||||||||
 |  |  | |||||||||||||||||||||||||||||||||
Real Estate  | Purchase, construction and renovation of energy-efficient buildings. Renewable power system installation and refurbishments that use 30% less energy. | Developer loans, private solar panel installation, smart meters, energy-efficient lighting, mortgages with an A or B energy rating. | | | |  | | ||||||||||||||||||||||||||||
|  | |  | | |||||||||||||||||||||||||||||||
Mobility  | Clean transport and infrastructure. | Leasing and financing of electric and hybrid vehicles (<50 g CO2 per passenger-km), charging stations, bicycle lanes and others. | | | | | | | |||||||||||||||||||||||||||
| | | | | |||||||||||||||||||||||||||||||
Agriculture  | Sustainable and protected agriculture. Land and forest conservation. Sustainable farming. | Financing of sustainable agriculture practice such as more efficient irrigation systems, machinery and reduced fertilizer use. | | | | | | | |||||||||||||||||||||||||||
Waste & Water Management  | Activities to adapt to, or mitigate, climate change; preserve biodiversity; boost the circular economy and waste & water management. | Financing of water, waste and soil treatment, greater energy efficiency, lower emissions and conservation. | | | | ||||||||||||||||||||||||||||||
Circular economy  | |||||||||||||||||||||||||||||||||||
Global collaborations in 2023
International Financial Corporation (IFC)
We signed the first agreement with the IFC to promote sustainable construction practices in Mexico in terms of energy efficiency and the environment. This is a certificate of excellence that ensures sustainable construction (EDGE).
Coldwell Banker Richard Ellis (CBRE)
We entered into a collaboration agreement with CBRE, one of the world’s largest commercial real estate services and investment firms, to contribute to the decarbonization of the real estate sector in Spain, with advice and financing aimed at improving the energy efficiency of buildings.
European Investment Bank (EIB)
In March, the EIB and Banco Santander in Spain signed off an advisory agreement to support the Bank in green product development, eligibility screening and the integration of the regulatory requirements of the EU Taxonomy for sustainable activities into banking operations.
In July, the EIB granted €300 million to Banco Santander Brasil for small-scale solar energy investments.
Global Gateway
Global Gateway is a new strategy promoted by the European Commission to support EU Member States’ financial and development institutions and private sectors through investments to improve supply chains around the world and help developing countries fight climate change.
Strategic partnerships to drive transition
Santander cooperates with multilateral development banks (MDBs) to finance the investment and liquidity needs of our customers in Europe and Latin America. 14 out of the 25 new financing agreements we signed in 2023 worth a total EUR 1,388 million will contribute to providing competitive financing to projects that promote a low-carbon economy and environmental sustainability. They include sustainable building construction, renewable energy generation, energy efficiency investment, green mortgages, and clean mobility.
41
2.6 Nature and biodiversity
GRI 304-2
In 2023 we continued making progress with our nature and biodiversity assessment on dependencies and impacts. We carried out an internal exercise based on the LEAP approach combining Science Based Targets Network's (SBTN) sectoral materiality tool and the Exploring Natural Capital Opportunities, Risks and Exposure (ENCORE) tool methodologies.
We continue to monitor and engage with working groups that draw up future regulatory and market standards in nature and biodiversity disclosure, such as the Task force on Nature-related Financial Disclosures (TNFD) Forum, PRB Biodiversity community, and Banking Environmental Initiative (BEI).
Santander and the Amazon in Brazil
Santander is working to protect the Amazon rainforest and promote sustainable development, which is critical to tackling climate change and conserving biodiversity. We need economic growth, but it must be green.
For decades, deforestation has been destroying the Amazon in Brazil. While logging, mining and large infrastructure projects in the region have all played a role, agriculture, cattle ranching, property speculation and a lack of clear land titles are key drivers.
In addition to our global policy on environmental, social and climate change risk management and our commitment to the Equator Principles, we are taking extra care when lending to customers in Brazil with operations in the Amazon, for instance:
•In addition to the Plano Amazônia coalition (see below), we have cooperated with Brazil’s banking federation, Febraban, in setting best practices in a protocol for the financing of the beef sector so that it does not contribute to deforestation. By signing the protocol, Santander aligned its commitment with that of the Brazilian financial industry to require beef processing clients with slaughterhouses in the Brazilian Legal Amazon region to end illegal deforestation by December 2025 from direct suppliers of cattle and Tier 16 indirect suppliers.
•Well before the publication of the Febraban protocol, Santander Brasil began engaging with meatpacking clients about ending deforestation in their supply chain by 2025. This engagement led to several of them declaring commitments online in 2022 and developing plans to check on indirect Tier 1 suppliers.
•All loan requests by farmers and ranchers (not just those in the Amazon) are checked for embargoes issued by the government because of illegal deforestation, not only on the property financed but also on nearby properties. We run daily checks for recent deforestation on farms and ranches we have lent to (throughout the entire loan term), even before the government has imposed fines. We also screen properties to check they don’t encroach on officially recognized indigenous land.
•We review clients’ practices in Brazil regularly. We conduct annual ESG reviews of more than 2,000 customers, including beef processors, soy traders and logging companies.
Plano Amazônia
In July 2020, Santander Brasil announced an alliance with the two other largest private sector banks in Brazil called 'Plano Amazônia' to promote sustainable development in the Amazon.
Three years on from the creation of Plano Amazônia, we assessed the progress, challenges and lessons learned, which led us to restructure the 10 measures initially set out under three strategic objectives: Forest Conservation, Promotion of the Bioeconomy, and Access to Connectivity.
We have projects for each new strategic objective. In ‘Forest Conservation’, we shared with Febraban the lessons learned from the implementation of the document of good practices in the meat supply chain, which prompted the creation of a self-regulatory Febraban Protocol.
Regarding ‘Promoting the Bioeconomy’, the Jornada Amazônia Platform progressed as planned, with five announcements to launch the training of 508 people, the selection of 70 startups for the pre-acceleration cycle and 22 startups for the acceleration cycle. The Platform also launched a micro corporate venture capital programme that will help attract investment in the market and create partnerships with large companies to accelerate the growth of startups.
In 2023, Santander supported the Instituto Povos da Floresta (Forest People Institute) to provide fast and quality internet service for around 4,000 remote communities in the Amazon by 2025. Our support enabled a pilot project involving 30 communities to test the Startlink service. Communities that did not have access to electricity also received a kit with photovoltaic panels and batteries, so they were able to access the Starlink service. Now 300 communities have access to the Internet, with 7,450 registered users and 23,000 beneficiaries.
Sustainable Innovation
In 2023, Santander Brasil created the Sustainable Innovation area to carry out scalable innovative operations in emerging technologies and businesses, provide sustainable funding and perform actions that position the bank as a leader in innovative sustainable finance. We identified 12 priority segments in the bioeconomy, transport, low-carbon agriculture and renewable energy sectors with high market potential.
Through Alliance for Sustainable Mobility and other strategic alliances, we signed a deal with Didi Group (known as '99' in Brazil) to create one of the largest electric car fleets in Brazil. It included the acquisition of 300 BYD electric cars by the company Dahruj that will make up the fleet of the company '99'. Under the Innovative Finance for the Amazon, Cerrado and Chaco Initiative (IFACC), we issued a green CRA worth USD 47.24m, together with Rabobank, the AGRI3 fund and British retailers Tesco, Sainsbury's and Waitrose for the Responsible Commodities Facility (RCF) initiative, with the aim of producing deforestation-free soy in the Cerrado, following IFACC socio-environmental standards.
| For more details on 'Santander and the Brazilian Amazon', visit our corporate website santander.com or our 'Climate Finance Report'. | ||||
6 Tier 1 indirect supplier: supplier of the direct supplier
42
2.7 Our environmental footprint
GRI 3-3, 301-1, 302-1, 302-2, 302-3, 302-4, 303-5, 305-1, 305-2, 305-3, 305-5, 306-1, 306-2, 306-3
As part of our ambition to achieve net zero carbon emissions by 2050, our strategy to lessen the environmental impact of our operations involves: reducing and offsetting CO2e emissions we're unable to reduce by mitigating beyond our value chain; reducing and handling waste responsibly; and raising employees’ and other stakeholders’ awareness of environmental issues.
We’ve been measuring our environmental footprint since 2001. Since 2011, our energy efficiency and sustainability initiatives have helped us cut:
•electricity consumption by 38%
•CO2e emissions by 69%, and
•paper consumption by 83%.
Our 2022-2025 Energy efficiency and sustainability plan includes more than 100 measures to reduce our electricity consumption by 18% and emissions from our own operations7 by 68% compared to 2019 (the last comparable year prior to the pandemic). Some of them are:
•installing 8 MW of solar panels on our buildings across our footprint for self-consumption. We have 8.8 MW installed in Brazil, Chile and Spain, with further projects under way in 2024.
•purchasing renewable electricity in every country where it’s possible to certify its origin. The renewable energy we purchase and produce accounts for 97% of our total consumption, which is close to our 100% target by 2025;
•using new technology to reduce paper consumption and waste;
•continuing to obtain environmental and sustainability certifications for our buildings:
•38% of our employees work in buildings certified to ISO 14001 or ISO 50001 management systems; this is above the 36% ambition considered in our 2022-2025 plan.
•Today, almost all of Santander’s headquarters in our core markets are LEED, BREEAM or ISO 14001-certified.
•creating more parking spaces at our buildings for electric and plug-in hybrid vehicles – charging these vehicles is free for employees. We have over 1,709 of these spaces in the Group's core markets, exceeding our target of 1,250 by 2025;
•raising awareness among employees through global and local comms campaigns and surveys on the importance of reducing waste and consumption. Each subsidiary’s internal portal also posts news and topics of interest relating to the environment and the Group’s ESG initiatives.
Our measures are consistent with Santander's targets to source 100% of our electricity from renewable energy sources8, in addition to other measures to reduce emissions (our main goal), and to remain carbon neutral in our own operations9 by mitigating beyond value chain the emissions we’re unable to in our own operations.
We follow a strict carbon credits selection process that includes due diligence on compliance and consistency with our environmental policies. These are also certified under some of the industry's most well-known standards. Moreover, all of the carbon credits we purchased in 2023 were ratified by an independent rating agency to ensure their integrity. Santander monitors voluntary carbon credit markets to adapt our offsetting strategy to best practice.
Using electricity from renewable sources
97% of the electricity our buildings consume comes from renewable sources; in Brazil, Chile, Germany, Mexico, Portugal, Spain and the UK, that figure is 100%. Our target is to reach 100% for our entire footprint by 20258.
Waste management
Since 2021, our offices and buildings in our core markets have been free of single-use plastics to meet our public target.
The Grupo Santander City and Santander España’s central services buildings have ‘Zero waste’ certification.
2023 Environmental footprint10
805 million kWh total electricity | 97% renewable electricity | 3,444,543 GJ energy consumption | ||||||||||||
172,711 t CO2e total emissions (market based) | ||||||||||||||
Scope 1 25,755 t CO2e direct emissions | Scope 2 21,516 t CO2e indirect emissions from electricity and other (market based) | Scope 3 125,441 t CO2e indirect emissions from employee commuting and business travel | ||||||||||||
7 Scope 1 and 2 emissions and scope 3 emissions from employee commuting and business travel from the operational control approach of GHG Protocol, where we have full authority to introduce and implement Group's operational policies.
8 In countries where we can verify electricity from renewable sources at Banco Santander properties of wholly owned companies in Argentina, Brazil, Chile, Germany, Mexico, Poland, Portugal, Spain, the United Kingdom and the United States.
9 Scope 1 and 2 emissions and scope 3 emissions from employee commuting and business travel. It considers wholly owned companies in Argentina, Brazil, Chile, Germany, Mexico, Poland, Portugal, Spain, the United Kingdom and the United States.
10 A two-year environmental footprint table, showing employee consumption and emissions is available under 8.'Our progress in figures' section in this chapter. Scope 3 - Category 15 Investments (Financed emissions) is also disclosed in this section.
43
3. Responsible investment
SASB FN-CB-240a.1, FN-CB-240a.3, FN-CB-240a.4,
Sustainable investment
GRI FS8, FS11
We continue to expand our sustainable investment proposition for customers and progress towards our goal of reaching EUR 100 billion of socially responsible investment (SRI)11 AUM by 2025.
Our SRI AUM in Wealth Management & Insurance grew 27% year on year to EUR 67.7 billion12: EUR 48.1 bn in Santander Asset Management and EUR 19.6 bn from third party funds in Private Banking. This was on the back of our successful investment product strategy, which drew on the Sustainable Finance Disclosure Regulation (SFDR), the Green MiFID regulation in the EU, and enhancements we made to our advisory services on socially responsible investment.
We continued the work on decarbonizing Santander Asset Management's (SAM) portfolio as part of the Net Zero Asset Managers initiative (NZAMi)13 and through engagement with the companies we invest in. In 2023, SAM España and Santander Pensiones signed up to the CNMV’s Code of Good Practices — SAM España was the first fund manager to do so. Our voting activity earned us a special mention from ShareAction in their latest voting report 'Voting Matters'.
SRI AUM (EUR billion)12 | ||
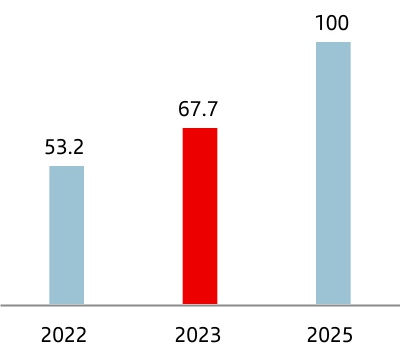
| +27% | ||
| 2022 vs 2023 | ||
Santander Asset Management
GRI FS8, FS11
In 2023, we continued to broaden our SRI product and service range, with a focus on the transformation of personalized pension plans under article 8 of the SFDR. We also launched new products such as Santander US Equity ESG. We enhanced our voting and engagement policy and methodology.
We made progress on our goal to reach net zero by 2050 and strengthened our leadership in the ESG investment community. In 2023, 70.8% of financed emissions in high-impact climate sectors were subject to Santander engagement or aligned with Net Zero — a target set by the initiative.
Innovating and transforming SRI products
We have EUR 48.1 billion in SRI AUM in Santander Asset Management (+28% YoY) in 8 countries. We broadened our SFDR-compliant product range (article 8 and 9 funds). Our thematic proposition includes funds that focus on climate (Santander Innoenergy Climate and Santander Sostenible Bonos), renewable energy (Santander Iberia Renewable Energy), and social objectives (Santander Prosperity).
In 2023, our solidarity funds donated to several NGOs to educate young people at risk of exclusion and help vulnerable women search for jobs, among other causes. Our Santander Responsabilidad Solidario fund won 'Best solidarity fund' at the Expansión-Allfunds Awards.
SAM’s SRI products
SRI products in SAM’s core markets
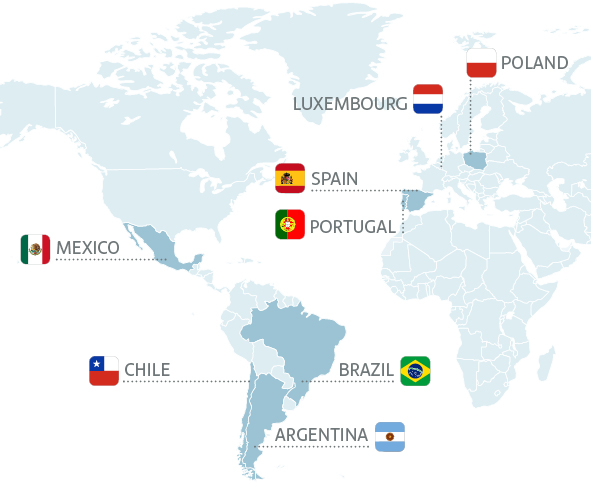
11 Funds registered under article 8 and 9 (SFDR) in the EU, including third-party funds and SAM´s Latin American funds that meet equivalent criteria.
12 Does not include SAM funds distributed by Private Banking to avoid double counting.
13 We have committed to cutting CO2 emissions in half from 50% of our AUM that have targets to align with the NZAMi by 2030. We could increase this target as more data becomes available. For more details, visit our website santanderassetmanagement.es/sostenibilidad.
44
Team, methodology and policies
We have a global ESG team and leaders who promote Santander’s global SRI investment strategy in our core markets.
We continue to enhance our methodology to embed ESG factors in our processes and manage the principal adverse impacts of our portfolio in the EU and in our SRI products.
We revised our voting and engagement policy and strategies. We continue to promote better climate performance and transparency through Climate Action 100+. We also joined the IIGCC Net Zero initiative and published our second stewardship report. SAM España published its first voting and engagement report on compliance with the CNMV's Code of Good Practices.
| For more details on our ESG approach, visit our website santanderassetmanagement.com/sustainability. | ||||
| For more details, see our stewardship activities report at santanderassetmanagement.com/content/view/11966/file/SAM_Stewardship_Report_221123_EN.pdf | ||||
Private Banking
GRI FS8, FS11
Our third-party funds SRI AUM amounted EUR 19.6 billion at 2023 year end. Our global list of funds that can be advised to clients comprised mostly article 8 and 9 funds (SFDR) (over 80% of the total). We also added new article 8 and 9 funds to our alternative investment proposition.
In 2023, we introduced reports for Private Banking International (PBI) clients with easy-to-understand environmental and social metrics. We also rolled out SRI mandates to other markets. We want to embed ESG in portfolio management and advisory services in eight markets by 2025.
In 2023, Euromoney named us 'Best private bank for ESG investing' in Chile, while Citywire named us 'Best private bank for ESG positioning' in Spain.


| For more details, visit our website santanderprivatebanking.com | ||||
Insurance
By 2023 year end, we had extended our insurance offering to protect sustainable assets, activities and vulnerable individuals based on the Group’s sustainable finance and investment classification system (SFICS)14 to 8 countries.
We’re also cooperating with our partners to broaden SRI in their investment policies and product ranges to cover risk associated to sustainability factors.
Insurance products aligned with SFICS14 | ||||||||||||||
| Core insurance products in our geographies | ||||||||||||||
| Personal accident insurance for Seniors Auto Insurance Dependency Insurance Senior Home Insurance | | Life Insurance for low income people Health Insurance for self employed or low income people | |||||||||||
| Life Insurance for low income people Personal accident insurance for low income people | | Life Insurance for low income women Life Insurance for micro-entrepreneurs | |||||||||||
| Micro mobility Insurance |  | Life Insurance for low income people | |||||||||||
| Motor insurance for EV | | Multirisk Insurance for SMEs (photovoltaic pannels) | |||||||||||
14 For more details on our SFICS see section 9.6 'Sustainable Finance and Investment Classification System (SFICS)' of this chapter.
45
4. Acting responsibly towards employees
We want to be an employer of choice. Our approach is based on three pillars: | Main regulations | |||||||||||||
| Human resources framework | ||||||||||||||
| Remuneration policy | Performance management policy | Learning and development policy | Group Succession policy | |||||||||||||||||||||||||||||
| Having the right talent and skills in place to enable the Bank's transformation; attracting and engaging the best talent, with a strong focus on employee development; and having a best-in-class employee value proposition. | ||||||||||||||||||||||||||||||||
| Culture policy | General health, safety and wellbeing policy | |||||||||||||||||||
| Putting the employee at the centre of all we do; working to have the best culture and a great employee experience delivered through diversity, equity and inclusion, culture, and health and well-being initiatives; and listening to employees so we can continuously improve. | ||||||||||||||||||||
| International mobility policy | ||||||||||||||
| Driving change in the company; shaping a more dynamic organization that’s ready to face the future with a positive impact on society; having the best organizational design; utilizing new ways of working to drive value; and holding meaningful conversations with our stakeholders. | ||||||||||||||
| For more information related to the level of approval and public disclosure, see section 9.2 'Main internal regulations and governance' | ||||
4.1 Talent
GRI 2-17, 3-3, 404-2, FS4
Attracting talent
Our talent attraction strategy focuses on positioning ourselves as an employer of choice, providing a great candidate experience when hiring and onboarding, and moving fast to respond to the ever-changing needs of our business.
In 2023 we delivered:
a.Digital Transformation: We adopted a Group-wide Acquisition Tracking System in our core markets which enabled us to become more efficient in our hiring. Through digitalization, we reduced time to hire and improved the candidate experience. We also launched a test of a new platform to help us screen high volumes of applications quickly, as well as other machine learning solutions to assist with candidate selection.
b.Graduate Programmes: We have programmes to attract young and emerging talent across all our markets, staying well positioned with new candidates joining the market. In 2023 we attended key local and global e-employment events and worked with Universia to reach into University talent.
c.We bolstered our employee value proposition (EVP): our focus in 2023 was specifically on STEM talent. Through our Global BeTech! programme we offer hybrid working models for tech teams and more agile ways of working. In 2023 we:
i.launched a website which shares the STEM EVP and tech job offers;
ii.simplified the way candidates find their ideal role (through improving the search) and enhanced the application process to improve the candidate experience;
46
iii.launched campaigns to position technical content strategically on social networks to reach a wider STEM audience;
iv.created a sense of community with over 100 Santander IT experts worldwide who now create technical content and share it on social media to help position the Santander brand;
v.opened new technology hubs in Malaga, Warsaw and Valencia in order to attract a wider range of STEM talent to Santander, outside of our normal catchment areas; and
vi.held inclusion initiatives to hire and train talent with people with disabilities in the tech field, such as the Technology for persons with disabilities programme in Brazil that attracted 1,100 candidates (87 individuals hired and 100 hours training per person).
Developing talent
Talent management
In 2023 we put a keen focus on being close to the needs of our businesses and helping them anticipate their future talent needs. We created talent programmes that help individuals meet their individual growth aspirations, while considering business demands.
Our Potential
Our Potential
In 2023 implemented a 'potential assessment model' in all units which saw 109,946 current employees go through a thorough assessment of their potential in order to propose personalized development actions based on individual needs.
The implementation of the model helped us improve our succession planning and we are meritocratic in our decision making by using data-driven insights captured during this process.
Mobility matters
We simplified our internal mobility proposition with four simple and transparent forms of mobility that are consistent with the business and employee needs:
| LONG-TERM POSITIONS | 1. International assignments (EXPATS) 2. Permanent movements | |||||||
| TEMPORARY COLLABORATIONS (GIGs) | 1. Project-based assignments (Mundo Santander) 2. SWAP programme | |||||||
This year we promoted both permanent and temporary mobility as the best way to meet business needs and offer our employees real development opportunities.
We posted our internal opportunities on our Global Job Posting website, which is accessible to employees, and we saw 18,134 opportunities posted there and 14.7% of our current workforce had an upward change to higher management level on 2023.
Our Global Project Marketplace allows any business or support area to form temporary teams of the Group's best professionals. A project is proposed and posted on our Global Job Posting website and is visible to all employees of the Group, and anyone who meets the requirements can apply.
Learning and development
Our learning and development policy sets the standards for the programmes we offer our employees. We continued to enhance our catalogue of learning solutions aligned to the most critical skills our businesses demand.
We continued to reinforce a culture where employees are encouraged to lead their own development and ensure their skills and knowledge stay relevant. They can do this by taking advantage of our digital learning platform, accessible to them 24/7.
Current and future leaders
We put specific attention on development programmes for key segments of our employee base with two key programmes in 2023:
a.Young Leaders: It’s a nine-month development programme for our younger generation to contribute to the Bank's strategy, increase their exposure and grow as leaders through new experiences. In 2023, its third edition took place.
b. Elevate: Our global executive learning ecosystem for professionals in leadership positions once again enabled a cohort of employees to enjoy five tailor-made learning experiences while interacting and collaborating with their peers from other countries or business areas.
47
Global training
We build skills from the ground up with on-demand and sequential learning. We use proven, easy-to-follow, self-paced learning paths so employees can form a knowledge base, build proficiencies and develop new skills — their way:
•Fostering innovation and digital skills: We ran expert programmes and boot camps focused on data analytics, programming, computational thinking, cybersecurity, cloud and artificial intelligence, which are key disciplines in the transformation of our people and businesses.
•Core banking skills: We continue to develop core knowledge through our Global Risk and Internal Audit schools, as well as specific content for the Finance, Corporate & Investment Banking, Wealth Management & Insurance, Digital Consumer Bank and Payments areas.
•Global mandatory training: According to our risk culture and strategy, we delivered the required pills and e-learning courses to ensure our knowledge on regulation and alignment with core risks. In addition, each subsidiary has mandatory courses on the laws of its jurisdiction.
•ESG: We have progressed with our training strategy with the development of new content required for all employees. We have also certified more employees as experts in Sustainable Finance. In addition to this, we continued promoting our ESG Talks, a series sharing knowledge and insights related to ESG topics, with internal experts from Corporate & Investment Banking, Risk, Human Resources, Digital Consumer Bank, Wealth Management & Insurance and Retail & Commercial Banking for the areas involved in our sustainability agenda. We also trained our employees on diversity and inclusion, health and safety, customer and supplier relations, the environment and anti-corruption. And finally, we increased our library of learning related to responsible banking topics.
In 2023, the board of directors completed training programmes on climate change, ESG risks, and regulation.
4.2 Employee experience
GRI 2-7, 2-29, 2-30, 3-3, 401-1, 401-2, 403-2, 403-3, 403-5, 403-6, 403-9, 403-10, 405-1, 405-2
Diversity, equity and inclusion (DE&I)
SASB FN-AC-330a.1, FN-IB-330a.1
At Santander, diversity, equity and inclusion (DE&I) are part of the common enablers of our Corporate Culture Policy (linked to the Group's transformation) and are governed at the highest level.
We have an ongoing Strategic DE&I Plan (2020-2025) to promote an inclusive working environment where everyone can be themselves. Our three DE&I principles can be found in the Corporate Culture policy.
 | In 2023, our employees' inclusion sentiment (in terms of gender, nationality, sexual orientation, religion, etc.) was 9.3 out of 10 (+0.5 above the finance sector benchmark and in the top 5% of the finance sectorA) A.2023 Your Voice Survey | ||||
We maintain rigorous standards for hiring, promotions, succession planning and talent pipelines to strengthen diversity. We also promote implicit bias training, as well as mentoring, networking and other actions aimed at creating a more inclusive environment.
We are also part of global initiatives that support DE&I, such as:


Gender equity
Women represents 53% of our workforce and 31.4% in senior executive positions. We work to have more balanced presence between women and men across the Group:
| 1. Women on the board | 2. Women in senior executive positions | |||||||||||||||||||
40% | 31.4% | |||||||||||||||||||
| We are committed to having women members make up between 40% and 60% of our board of directors | In early 2023, we raised our public target to have women in at least 35% of our senior executive positions in 2025. Santander leaders are involved in achieving this target as part of their long-term incentives | |||||||||||||||||||
48
We commit to reduce the equal pay gap between women and men performing similar roles to ~0% by 2025.
| 1. Equal Pay | 2. Gender Pay Gap | |||||||||||||||||||
c. 0% | 27.8% | |||||||||||||||||||
| We have accomplished the target for 2025 (~0%) two years early. We set up fair pay programmes to eliminate the equal pay gap. They include systematic reviews tied to remuneration cycles (merit-based promotions and bonuses). | Santander addresses the gender pay gap with a methodology based on best practices and common guidelines for the Group. The pay gap in 2023 decreased compared to the previous year (30.2% in 2022). | |||||||||||||||||||
1. The equal pay gap measures 'equal pay for equal work' for women and men in the same job at the same level. Our comparison does not consider such factors as tenure, length of service, previous experience and background. The year-end figure is 0.44%. Having met the target set the Group has set itself the objective of maintaining a pay equity ratio in line with best market practices. 2. The gender pay gap measures differences in remuneration between women and men in an organization, business, industry or the broader economy, irrespective of the type of work. At Santander, fewer women hold senior and business management roles than men (something we are focused on addressing), while more women work in Retail & Commercial Banking and support roles. We calculate the gender pay gap as the difference in the median remuneration paid to male and female employees, expressed as a percentage of the male remuneration. | ||||||||||||||||||||
We run initiatives to promote gender equality in the job market:
→The group has a minimum standard in each unit of 14 guaranteed weeks in primary parental leave and 4 weeks in secondary available to 88.9% of our employees.
→We support' Women in Tech' programmes in order to attract female talent in technology and digital. Currently, 30.1% of STEM jobs are held by women.
Several prestigious bodies praised our work in this area in 2023. We were the highest ranked bank and received the second highest score among all the companies analysed in the Bloomberg Gender-Equality Index (GEI).
Persons with disabilities
We closed 2023 with 4,701 employees with disabilities (2.2% of our workforce).
As part of our DE&I strategy, we want to boost the inclusion of people with disabilities by increasing the number of hires and promotions and foster accessibility.
In 2023, we developed a comprehensive guide on supporting colleagues with neurodiversity with the aim of making reasonable adjustments during the assessment (MyContribution) process to make it fairer.
LGBTIQ+
Building a strong culture of inclusion and creating a safe and supportive environment where everyone can be themselves are crucial for LGTBIQ+ people.
Ethnic and cultural diversity
We are monitoring ethnicity data in three of our geographies: the UK, the US and Brazil. Across our units we are making efforts to enhance visibility and awareness of cultural diversity.
Employee resource groups
Various employee resource groups help us promote and support diversity in our local units, for example:
| Women | LGBTIQ+ | |||||||
Santander Woman Network (2019) EmpowHer (2017) Women in Business (2015) >8,000 members in 10 countries | Embrace (2015) >5,000 members in 5 countries | |||||||
| Persons with disabilities | Black colleagues | |||||||
Enable (2022) Thrive (2020) Habilidade não tem limites (2018) >1,000 members | BOLD (2017) Reach (2015) Talento não tem cor (2018) >1,300 members | |||||||
2023 highlights:
Anti-harassment protocol
We prepared a global anti-harassment protocol as a common framework to establish minimum standards and to fight against discrimination and behaviour that contravenes sexual freedom and moral integrity. Across all of our units, 30,086 current employees were trained in non-discriminatory behaviours and 19,485 in anti-sexual harassment during the year.
Training
We offered unconscious bias training and inclusive mindset training to employees, both of which are mandatory for all of our executives.
Local units have action plans in place based on their own characteristics and conditions to further support quality DE&I training.
Employee health and well-being
Santander is committed to being one of the world's healthiest companies and to building a culture of care and awareness for our organization and for society.
Our Health and Well-being strategy sets out how we protect the health, safety and well-being of all employees, associates and customers; promote a healthy lifestyle; and create long-term value. At the core of this strategy is our global policy on health, safety and well-being.
The consistent, Group-wide deployment of this strategy saw our units implement hundreds of actions worldwide, aligned to mental and emotional health, nutrition and obesity, employees with disabilities, and other health priorities in 2023.
49
To review the right focus and successful implementation, we continued to check our employees’ satisfaction and opinions through internal surveys. In 2023, we asked them about general health and well-being, physical health, mental and emotional well-being, social care, and Santander’s support.
We continue to promote our employees’ health and wellness, and help them get trusted, affordable solutions through a range of benefits. In 2023, all employees could access health-related services, platforms (like 'Gympass' for sports centres) and apps for nutrition, mental health, exercise, meditation, specialist care, physiotherapy and other services free of charge or at reduced market rates.
8.4 (out of 10) Average employee rating of the statement 'Employee health and well-being is a priority at Santander' (+0.4 above the finance sector benchmark, and in the top 25% of the finance sectorA). | ||
| A. 2023 Your Voice Survey | ||
Occupational health
We have collective agreements at bank and sector level, which consider employee health and occupational risk prevention, offering our employees check-ups regularly and after extended absences. Santander cooperated with competent local institutions on public health initiatives during the year.
We revised our occupational risk prevention plans with employees' councils, implementing them through:
a.regular workplace and ergonomic assessments of health and safety risks and preventative measures to handle or eliminate them;
b.regular psychosocial risk assessments;
c.prevention measures when designing, procuring or acquiring offices, furniture, equipment, products and IT equipment; and
d.procedures to safe working conditions.
The Occupational Risk Prevention area draws up plans with other units, including these measures to prevent or minimize the risks they detect and review:
a.Employee awareness and continuous training in postural hygiene, emergencies and first aid.
b.Occupational risk prevention in all operations that may impact on employees' health and safety.
Our offices have achieved several security, quality and sustainability certifications, such as LEED O+M , Gold Level in the US, ISO 14001 in Brazil or ISO 45001 and ISO 14001 for our corporate centre, the Grupo Santander City, in Spain.
| For more details on absenteeism, see section 8. 'Our progress in figures'. | ||||
 BeHealthy
We aim to raise awareness about health and well-being through our global BeHealthy programme, which celebrated its seventh year in 2023.
Throughout the year, we ran hundreds of initiatives, activities and events around the world, involving thousands of employees and following the programme’s four pillars: know your numbers (self-awareness), eat well (healthy nutrition), move (physical health) and be balanced (mental & emotional well-being).
In April, to celebrate World Health Day, we held BeHealthy Week, bringing health and well-being to the focus of Santander worldwide, with daily, in-person and virtual events. Through an online campaign, #SantanderBeHealthy, our employees were encouraged to share their own healthy habits and nominate a colleague to do the same.
During the year, we also joined global initiatives run by the World Health Organization, including Global Mental Health Week, Women’s Health Month and Men’s Health Month. Dr Robert Waldinger, from Harvard Medical School, joined us for a global event to celebrate World Mental Health Day, which over 3,000 employees followed live.

50
Employee feedback
SASB FN-AC-510a.2, FN-CB-510a.2, FN-IB-510a.2
Your Voice is our regular listening strategy to gather employees’ feedback. In 2023 we undertook three global surveys, using cutting edge technology:
•Managers can access Your Voice results in real time and review qualitative opinions and sensitive observations to pinpoint areas with a high risk of employees leaving and the drivers to boost higher engagement. It helps managers promote dialogue, trust and transparency to raise employees' performance and reduce resignation and absenteeism.
Key findings of our 2023 Your Voice survey
8.5
Engagement
In line with the financial and other sectors benchmark
Stable across all three rounds in 2023
Support from managers and colleagues highlighted as positive. Simplification of processes is an improvement area, with plans underway.
62
eNPSA
22 above finance sector benchmark
26 above all sectors benchmark
Top 10% for financial sector
eNPS distribution
22% Passives | |||||
70% Promoters | 8% Detractors | |||||||
91%
Aggregated participationB
1.6 million
Comments received
A.eNPS (employee Net Promoter Score) is a method of measuring employee satisfaction.
B.169,590 employees participated in the survey out of the total base of employees eligible to participate, i.e. those who met some criteria such as not being on leave, working in the company for at least 3 months.
Volunteering
Every year, we enhance our volunteering programme to help our communities prosper, promote our volunteer employees’ commitment to social causes and pride in belonging to Santander, and develop their cross-cutting skills.
In 2023, financial education was a key strategic pillar in every market where we operate. Preventing early school-leaving and boosting the job skills of people with disabilities, women, children in difficulty and other vulnerable groups also remained a priority.
Each subsidiary develops its own programme based on local needs. In Spain, we ran several programmes to bolster the digital skills of girls in deprived areas, senior citizens, and other vulnerable groups.
We worked with Fundación Banco Santander to launch Santander Best Africa, a programme where 30 volunteers spent a week visiting and assessing the social and sustainability projects that Fundación funds in Senegal and Gambia.
+27K employees participating in social activities | +83K labour hours volunteered | |||||||
| For more details, see section 6.2 'Other community support programmes’. | ||||
51
4.3 Working conditions and social dialogue
GRI 2-17, 2-19, 3-3, 404-2, 404-3
Performance management and remuneration
Our comprehensive remuneration framework combines fixed and variable pay schemes based on targets for employees and the Group. Short- and long-term variable remuneration reflects what we have accomplished and how, according to Group-wide quantitative and qualitative targets as well as individual and team targets, behaviour, leadership, sustainability, commitment, growth and risk management. It includes pension plans, banking products and services, life insurance, medical insurance and other corporate benefits our employees can choose.
Fixed remuneration schemes reflect local market conditions. To set pay, we strictly abide by the practices, regulations and collective agreements in force in each jurisdiction where we operate.
Our remuneration policy for all Group employees forbids differential treatment that is not based on a review of performance and corporate behaviours. It also promotes equal pay between men and women.
To comply with EU regulations on remuneration, we identified 1,152 employees subject to a deferred variable pay scheme because their decisions can have a material impact. The policy defers a significant amount of their variable pay (40%-60% depending on remit) for four to seven years, in accordance with internal and local regulation. 50% of variable pay is delivered to them in instruments and subject to potential reduction ('malus') or recovery ('clawback').
Key initiatives in 2023
→We updated short-term variable remuneration for executive directors. For 2023, corporate bonus metrics included the new strategic priorities announced at the 2023 Investor Day, maintaining the focus on customers (with active customers as the main metric), as well as RoTE (which continues to be part of the scheme). The third pillar included as a metric is capital, to outline the importance of capital generation throughout the business.
→We introduced a relative performance multiplier that may reduce or increase the result from the metrics mentioned above, based on results versus top peers in each market on metrics considered more relevant for each country/business (and for the Group, the weighted average of countries results): such as Net Interest Margin, Cost/Income Ratio, Non-Performing Loans etc.
→We simplified the qualitative assessment for the short-term bonus by reducing the number of components from seven to four, covering risk, compliance, network collaboration and ESG (responsible banking).
| For more details on board remuneration, see section 6. 'Remuneration' in the 'Corporate governance’ chapter. | ||||
MyContribution
MyContribution is our common performance management model. We update it regularly, and it is aligned to our culture.
52
Corporate benefits
We offer several benefits to our employees in all geographies. Each local unit has programmes that adapt to local circumstances. Benefits range from free services for employees and their families to discounts on products and services. In 2023, 13,726 million euros were paid in wages and benefits.
We focus on well-being to help employees stay in sound physical and mental shape, to support their families and to adapt health cover to new circumstances and needs. For example, in Spain, our Santander Contigo programme helps employees with daily tasks, legal and IT support, and other services.
| |||||
Enhancing our ways of working
In 2023 we focused on:
1.Strengthening our new ways of working framework with local adaptations (based on local regulations on flexible working);
2.Monitoring the impact of new ways of working on our productivity, engagement, and employer attractiveness.
a.For productivity, we created a new dashboard to measure the new ways of working across the Group and measured KPIs for contact centres and operations.
b. For engagement, we asked employees to provide feedback on the new ways of working.
c. For attractiveness, we followed up with job applicants to learn their views on our new ways of working;
3.Taking steps to evolve our 'hybrid with flexibility' culture by:
a.Reviewing our office strategy – rationalizing location and space arrangements to improve access and collaboration;
b.Implementing technology that enables employees to be productive and engaged in a hybrid environment (to understand their workload and ways to improve individual digital balance).
Agile working
We continued to implement agile methodologies and organizational structures across the business to improve a strong customer focus and promote a more collaborative and multidisciplinary way of working. To enable change, we created an Agile Transformation Blueprint and practices to help subsidiaries facilitate business agility.
We also boosted our Agile Training Academy with several learning modules available for all levels and specializations. Agile skills are one of the 'critical skills' for all employees to encourage them to take advantage of reskilling opportunity. We also piloted the tools that will help teams set and manage objectives in more agile way.
8.7 (out of 10) Employees’ rating of the question on whether they are satisfied with the amount of flexibility they have in their work schedulesA | ||
| A. 2023 Your Voice Survey | ||
We set out five 'ways of working' principles
 | →The customer comes first. Customer and business impact must take precedence in any working arrangement. | ||||
 | →Managers play a critical role in organizing their team's work. Team and individual productivity are key to building working models. | ||||
| →The office is our main place of work. Workplaces are no longer just where we do our job; they're also social space that meets diverse working needs and affords the best opportunity for collaboration, innovation and creativity. Building critical mass at workspaces is key to our culture. | ||||
 | →Test and learn approach trough constant listening that evolves over time, with the focus on customer, individual performance, productivity outputs, and employer branding. | ||||
 | →Flexibility, fairness, inclusion and equal opportunity are guiding principles in decision-making. | ||||
Enabling the business
In 2023 we continued to use our common global platforms for human capital management. We promoted data-driven people decisions and enabled both business leaders and people managers to be fully informed about their teams by:
•offering new chatbots to interact with HR;
•providing a OneHR portal for all enquiries to be routed through;
•promoting mobile first technology across key HR processes; and
•using the data of their teams for talent processes.
Social protection
Santander offers additional protection to public programmes related to loss of income due to sickness, occupational accident, acquired disability and paternal leave.
In the markets where Santander operates, we strive to offer employees enhanced conditions regarding sickness and occupational accident. For example, in Spain, employees receive full pay during periods of sickness and absence due to occupational accident. Moreover, actions to complement public pension in case of death or temporary disability.
53
Collective bargaining
In 2023, we continued to guarantee freedom of association and the right to collective bargaining. Our Responsible Banking and Sustainability policy considers forming or joining unions and other representative bodies a basic right of workers, in accordance with Article 10 of our General code of conduct.
We also ensured respect for freedom of association, trade unions, collective bargaining and protections for employees’ representatives under the laws of each country where we operate.
We continued to promote and comply with the International Labour Organization’s Fundamental Conventions.
We also remained in constant dialogue with employees’ legal representatives in bilateral and special committee meetings where all parties could discuss reporting, queries and negotiations about work conditions and employee benefits.
Meetings held in 2023:
•Occupational health and safety committees
•Equality plan follow-up committee
•Subsidiaries’ equality plan negotiation
•Santander employee pension plan control committee
•Training committee
•Employment committee
•Other meetings:
•Meetings with subsidiaries’ union committees
•Bilateral meetings with trade union representatives
54
5. Acting responsibly towards customers
| Our approach is to make every customer experience Simple, Personal, and Fair. | Main regulations | |||||||||||||||||||
Compliance and conduct; Cybersecurity Corporate frameworks | ||||||||||||||||||||
| Customer conduct risk management model | Approval of products and services policy | |||||||||||||||||||
| The customer is at the centre of everything we do. We constantly listen to our customers to deliver the best practices. | ||||||||||||||||||||
| Customer service, dissatisfactions handling and root-cause analysis policy | ||||||||||||||||||||
Vulnerable customers, consideration of special circumstances and prevention of overindebtedness policy | ||||||||||||||||||||
| We place great importance on protecting vulnerable groups who may be susceptible to financial vulnerability or situations that may impact their ability to make informed decisions through solutions to financially include people and boost our customers' financial health. | ||||||||||||||||||||
| Data protection policy | ||||||||||||||||||||
| We apply high standards to enable individuals to maintain control over their personal data, while protecting and providing resources to keep it safe online. | ||||||||||||||||||||
| For more information related to the level of approval and public disclosure, see section 9.2 'Main internal regulations and governance' | ||||
5.1 Customer experience and satisfaction
GRI 2-29, 3-3, FS5, FS6
Customer satisfaction
We measure individual and SME customer satisfaction (Net promoter score — NPS) and experience through surveys on service, reputation and products in each of our core markets. We draw up and execute actions plans on the back of the survey findings. The management committee monitors these plans and NPS is included as part of our remuneration schemes for all employees.
In 2023, we sent over 9 million surveys to customers from all segments to find out how we can enhance their experience and our products and services. Results showed improvements in customer service at our contact centres and in the perception of the bank’s innovation.
In 2023, we ranked in the top 3 for NPS in seven of our core markets.
| |||||
 | ||
Top 3 for NPS in 7 marketsA A.Santander US has a separate target and is not included. | ||
55
5.2 Consumer protection
GRI 2-26, 3-3, 416-1, 417-1, FS15
Customer conduct risk model
Being responsible means going above and beyond minimum legal requirements to offer customers products and services that are Simple, Personal, and Fair (SPF).
Our Product governance and consumer protection area oversees and reviews how we follow our customer conduct risk model. The model sets out the requirements applicable to the product and service design, sales, post-sales, and execution.
We focus on the following areas.
| For more details, see section 7.2 'Compliance and conduct risk management' in 'Risk, compliance & conduct management' chapter. | ||||
Product governance
Santander’s product and service approval policy, supported by local decision-making bodies and the corporate product governance forum, helps to provide that products and services are designed to meet the needs of the target market, at a fair price and in a transparent manner. Processes and controls set across life cycle taking into account the interests of our customers.
Conduct in sales
We assess the customers´ needs and characteristics to offer the most adequate products for each of them.
Commercial teams training and remuneration schemes play a vital role in embedding conduct standards in our culture and daily operations:
→In 2023, we revised mandatory training on customer conduct risk management for all employees in the Group. It complements specific programmes that sales teams must complete to master the skills needed to explain and sell products and services properly to customers.
→At least 40% of sales units' variable pay was based on customer satisfaction and quality metrics. Our commercial banking model promotes Rating de Oficinas, a scheme to give branches a customer conduct and quality rating that impacts on employees’ pay, raises greater awareness and encourages proactive management of conduct-related risk. In 2023, we rolled out these pay schemes to our call centres, which are becoming increasingly crucial in a multi-channel environment.
Conduct in fraud management
In 2023, we continued to build on the customer impact component of our fraud management analysis that we began rolling out in 2022. The Compliance and conduct, Cybersecurity and Secure User Experience, Cards, and Non-financial risk areas worked together on drawing up lines of action to embed conduct in fraud management.
Vulnerable customers
In 2023, we continued consolidating our strategy to serve vulnerable customers, and specially to prevent over-indebtedness. In addition, the Group best practices were upgraded to internal regulation for the subsidiaries. This will ensure a common approach throughout the Group for employee training, recognition of vulnerable customers, case escalation, product and service design, recoveries, fraud management and assistance for senior citizens and people with disabilities.
We defined metrics to proactively identify and address the needs of customers in vulnerable circumstances.
We launched a global awareness training programme on helping vulnerable customers.
Some clear indications of our vulnerable customer strategy's forward momentum are:
→We instituted customer protocol for senior citizens and people with disabilities to prevent exclusion and enhance their experience.
→In Brazil, we published Febraban’s practices for engaging with vulnerable customers, in which Santander had a prominent role.
| For more details on our vulnerable customer initiatives, see section 5.3 'Financial health and inclusion’. | ||||
Complaints handling
We manage customer issues and complaints proactively by carrying out root-cause analysis and learning from our mistakes.
In 2023 we evolved the complaints management procedure to the customer service and dissatisfaction management policy, to align it with the SPJ strategy and with the global businesses operating model. We introduced guidelines for local units to implement standards for access, management, communication, review, reporting and governance that produce the best services possible for our customers. We're also working on a guide for customer service in contact centres using behavioural economics, with the aim of identifying the key moments and actions in the process, minimising the process biases.
56
To manage customers’ expectations better, most units have invested in upgrades of dissatisfaction management tools and advanced analysis techniques to recognize the root causes of complaints and get the most out of customer feedback.
We continued our comprehensive analysis of customer complaints and survey data, using artificial intelligence to identify the root cause. Our proof of concept in Brazil and Mexico used over 27 million data sets.
The developed methodology takes advantage of the benefits of applying algorithms to customer voice, maximizing the analysis of structured and unstructured information available in our systems
Complaint typeA,B (%) | ||
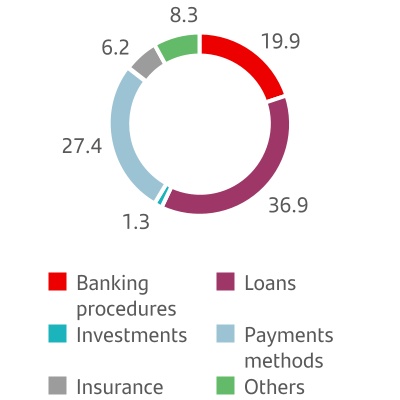
ResolutionA,B (%) | ||
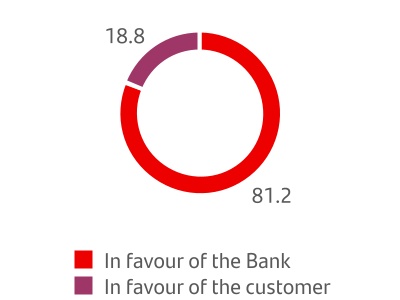
A. Personal protection insurance (PPI) claims are not factored into volume, product distribution or resolution time figures.
B. The Group uses the same standard claims metric for all geographies.
5.3 Financial health and inclusion
GRI 3-3, 203-1, 203-2, 413-1, FS7, FS13, FS14, FS16
Financial inclusion and health are a priority for Santander in reducing inequality and promoting prosperity and entrepreneurship, and a component of how we identify customers facing financial distress.
To deliver on this, we established processes for developing products and services, training our teams, and engaging with external parties15 .
Santander wants to help tackle the financial inclusion challenges in the markets where we operate. In Latin America, our main objective is to provide access to the financial system. In mature markets, we want to make sure nobody has to exit it.
In 2023, we were named the world's best bank for financial inclusion.
→The World's Best Bank for Financial Inclusion (Euromoney) for the second year in a row. |  | ||||
Having exceeded our target to financially empower 10 million people between 2019 and 2025 (reaching 11.8 million in 2022), we set a new target to financially include 5 million more between 2023 and 2025. We use the UNEP FI Principles as a guide.
Our analysis of the World Bank’s Global Findex Database 2021 in relation to our targets and the gap in access to the banking system in each of our markets confirmed that our target is consistent with our market share.
 Our targets Our targets | ||
Financially empowered people
 | 11.8 mnB | Target achieved three years early | |||||||||
| 2019 | 2022 | ||||||||||
Financially included peopleA | Target | |||||||
+5 mnB | ||||||||
1.8 mn | ||||||||
| 2023 | 2024 | 2025 | ||||||
In 2023, we financially included 1.0 mn people through access initiatives; and 0.8 mn people through finance initiatives.
A. Based on internal financial inclusion methodology that takes into account international best practice and has been endorsed by an independent third party. Includes the principles, definitions and standards we use consistently across our footprint to count the number of people we include financially through initiatives, products and services for access and finance.
B. Cumulative figure since 2019.
15 Check out what we do at santander.com/financial-inclusion-report
57
Access
GRI FS7, FS13, FS14
Promoting access to cash and transactions We aim to ensure underserved communities can get cash anywhere, through our remote branches and agreements with private and state-run entities that widen our footprint. | Branches in underbanked and remote regionsA | | | | | | ||||||||||||||||||||||||||
Partnerships to reach underserved communitiesB | | | | |||||||||||||||||||||||||||||
Promoting digital access We help people access the banking system so they can make payments; use basic, tailored financial services; take greater control of their finances; and make faster and more secure transactions. | Digital wallets and points of saleC | | | |||||||||||||||||||||||||||||
Basic accountsD | | | ||||||||||||||||||||||||||||||
Financial solutions for vulnerable groups We offer financial support to vulnerable groups so customers will have access to basic products and know how to use them. | Support to senior citizen customersE | | | | ||||||||||||||||||||||||||||
| | |||||||||||||||||||||||||||||||
We also have global initiatives such as GetNet provides payment services to merchants to boost simplicity, speed and security.
Finance
GRI 203-1, 203-2, 413-1, FS7, FS13. SASB FN-CB-240a.1, FN-CB-240a.3, FN-CB-240a.4,
Microfinance We promote social mobility and help low-income and underbanked entrepreneurs set up and grow businesses. | Microfinance programmes | | |  | ||||||||||||||||||||||||||||
 | ||||||||||||||||||||||||||||||||
Supporting customers in financial distress We have debt relief programmes that include payment deferrals and line of credit extensions. | Supporting customers in financial distressF | | | | ||||||||||||||||||||||||||||
Financing low-income households' basic needs We offer products and services that enable low-income households to access housing and meet other basic financial needs. | Affordable housing supplyG | | | |||||||||||||||||||||||||||||
Credit support for low-income households/people with difficulty getting creditH | | | | | ||||||||||||||||||||||||||||
A.In Spain, branches in remote (or sparsely populated) areas to facilitate access to credit and combat social exclusion in communities of less than 10,000 inhabitants. In Portugal, branches in low-income, small or isolated regions, such as the Azores and Madeira. In Argentina, we have financial inclusion branches and remote agents in the marginal environment of Buenos Aires and vulnerable communities. In Poland, ATMs in municipalities where there is no Santander branch or partner point of sale. In Uruguay, 3 mobile branches have been installed in the country since 2020 to reach areas with low levels of banking penetration.
B.Agreements with Correos Cash in Spain, partnerships with retailers such as Oxxo or 7Eleven in Mexico, and agreements with third parties in Uruguay (e.g. Abitab, Red Pagos).
C.In Poland, we included the Cashless Poland programme to promote the use of payment terminals in localities where the use of digital media is low and the use of our associated Partners Outlets. In Chile we included Mas Lucas.
D.In some countries, we have basic bank accounts that go beyond regulation in order to serve the bottom of the pyramid. For example, the Cuenta LIfe in Chile or the no-fee account for vulnerable customers in Spain.
E.In several countries we have value propositions aimed at the elderly. For example, tailor-made products for retirees in Mexico and Argentina, services such as Here & Now in Portugal to help seniors with limited digital skills, or third-party access initiatives in the UK to support seniors who need to be cared for.
F.We have programmes in many countries to help people with debt problems. In Portugal, we have the Iris programme to help customers manage defaults. In the UK, we help vulnerable customers get out of arrears with self-service tools and direct financial assistance, and in Spain, we have financing programmes for vulnerable groups to relieve their mortgage debts.
G.In Spain, the bank participates in the Social Housing Fund, which facilitates renting for people on low income. It also has affordable rental housing. In the US, as part of its Inclusive Communities plan, Santander provides low-interest mortgages and mortgage insurance for low-income homebuyers.
H.We have initiatives to help groups with difficulties in accessing credit; among them, in Spain, we lend to SMEs at their risk limit; in the US, we lend to small businesses operating in low- and moderate-income communities; in Argentina, we lend to entrepreneurs with low credit histories. In Mexico, special credit programmes are offered to people at the bottom of the pyramid.
58
Promoting financial education
GRI FS7 y FS16
Financial education is fundamental to financial health and inclusion, and to helping people and businesses prosper.
We aim to help our customers better understand banking products and financial concepts and risks to make the right decisions for their financial well-being, while promoting market stability.
In 2023, 11.5 million people accessed our financial education initiatives, includes social media as a tool to boost our younger customers’ financial knowledge.
| For more details on financial education, visit our website santander.com/en/our-approach/inclusive-and-sustainable-growth/financial-education | ||||
5.4 Privacy, data protection and cybersecurity
GRI 418-1; SASB FN-CF-230a.2, FN-CF-230a.3
Privacy and data protection
Our standards give people greater control over their data, and ensure we only use data where strictly necessary and for the specific purposes for which we collect it. We apply all reasonable measures designed to erase or rectify data that are inappropriate, inaccurate or incomplete and to only store personal data for as long as strictly necessary for their legitimate use. Our security measures are aimed at preserving the confidentiality, integrity, availability and resilience of our data processing systems and services.
Our compliance programme guarantees robust management of data protection risks. It includes:
•corporate-based criteria as general lines of action to meet regulatory requirements;
•local subsidiaries’ responsibility to abide by the General Data Protection Regulation (GDPR) and local regulation on data protection;
•a solid governance model consisting of:
•corporate and local policies;
•a data protection officer (DPO) and managers in each unit. We formally disclosed appointees to local authorities; and
•a corporate oversight programme based on management indicators; annual reviews; and an annual monitoring forum chaired by the Group Chief Compliance Officer, where subsidiaries report on compliance status and other key data protection matters.
Other items that strengthen our commitment to personal data protection are:
•standardized approach to monitoring and reporting model among units;
•cooperation with third-party service providers that must comply with data protection regulation;
•data protection compliance embedded in the annual internal audit programme;
•data protection management tools to maintain a Group-wide register of processing activities, regular KPI reports and security incidents management;
•special training on data protection for DPOs and data controllers; promotion of corporate initiatives and the exchange of best practices among units;
•employee training and awareness; and
•constant monitoring of regulatory developments to update and consolidate criteria, methodologies and documents.
Cybersecurity
At Santander, cybersecurity is embedded in our culture. It is a part of our employee performance reviews.
In 2023, we made our teams more aware of cybersecurity, with:
•an update to our mandatory cybersecurity course;
•specialized training for high-risk groups such as payment agents, IT professionals and developers, board members and executives;
•awareness campaigns about new hacking techniques; and
•regular phishing testing that helps us become more resilient to threats and encourages employees and third-party contractors to report incidents or suspicious messages through the relevant channels.
We implemented these initiatives to help our customers and broader society stay safe online:
•'Cyber Heroes' interactive training, where our employees and the public can test their knowledge of online safety and fraud prevention. Available in Argentina, Brazil, Chile, Mexico, Portugal, Spain, Poland, and the UK, with a 9 out of 10 rating.
•Awareness workshops for retail and corporate customers at our branches to explain online threats and how they can reduce them.
•Por una vida online y corriente ('Everyday Cyber'), a global cybersecurity awareness campaign to help our customers and society adopt better security habits for enhanced protection against fraud. We leverage our reach through our corporate sponsorships, such as Rafa Nadal and League of Legends (strategy online game), to engage more audiences using their unique tones and language. These campaigns provide our audiences with a multichannel conversation experience across websites, social media, mass media outlets, and targeted communication.
59
•In other Santander markets, the cyber awareness campaign 'Tarot' in Uruguay was awarded the best radio programme in the Health & Education and Institutional categories in the 'Campana de Oro' Awards.
•Titania: Santander’s latest initiative to raise awareness and promote learning about cybersecurity in the form of a fiction podcast. With over 1 million plays, this podcast was named as the Best Podcast at the National Radio Ondas Awards and has received a bronze award from the International Advertisement Bureau (IAB) for Best Branded Content Strategy.
In 2023, we continued to promote collaboration on cybersecurity with public and private organizations:
•Santander has had a key role in the creation of FS-ISAC Europe (Financial Services Information Sharing and Analysis Center) for the exchange of information in Europe and currently Santander holds the European Board’s Chair. This organization, established in The Hague, has more than 1,000 members from 174 entities, including major banks, Swift and Europol.
•Santander is part of the leadership team of the US Ransomware Task Force, whose objective is to improve the prevention and response capabilities against ransomware attacks.
•Santander actively contributes to the World Economic Forum (WEF) in the fight against cybercrime, highlighting the Cybercrime Atlas initiative, whose objective is the disruption of cybercriminal networks.
| For more information on our cybersecurity plan and the initiatives undertaken during the year, see section 5. 'Research, development and innovation (R&D&I)' in 'Economic and financial review' chapter; and section '6.2 Operational risk management' in 'Risk, compliance & conduct management' chapter. | ||||
60
6. Supporting communities
Progress in 2023 GRI 3-3, 203-1, 203-2, 413-1 | ||||||||||||||||||||
| ó | ||||||||||||||||||||
Over 174 million euros in community investment in 202316 | ||||||||||||||||||||
| ó | ó | |||||||||||||||||||
Support for higher education, employability and entrepreneurship  | Other community support programmes  | |||||||||||||||||||
105 million euros invested | 69 million euros invested16 | |||||||||||||||||||
6.1 Support for higher education,
employability, and entrepreneurship
employability, and entrepreneurship
GRI 3-3, 203-1, 203-2, 413-1
105 million euros invested | 498,930 people and businesses helped17 | 1,238 partner universities and academic institutions in 26 countries18 | ||||||||||||
Banco Santander has supported education, employability, and entrepreneurship for over 27 years.
Over this period, we have invested over 2.3 billion euros in partnership with more than 1,200 universities and institutions in 26 countries, helping over 1.5 million people and businesses17. In 2023 alone, we invested 105 million euros and helped nearly 499,000 people and businesses. We plan to invest 400 million euros between 2023 and 2026.
We want to boost people’s job prospects and help entrepreneurs and SMEs develop their businesses through support for education, employability and entrepreneurship.
We help adults at university and beyond, when continuous learning and job skills are vital in an ever-changing landscape. We provide training and resources to help businesses create opportunity, take root and grow through each stage of their development.
In 2023, Fortune magazine named Santander as one of the companies giving back the most to make the world a better place in its 'Change the World' list of 50 companies that are helping address some of society’s biggest challenges. Santander is the highest ranked bank in the list, thanks to this support for the past 27 years.
1. Education
Our support for education involves promoting access to higher education, training and the resources that students need, and helping to the institutional transformation, mainly in the digital field. We do this through:
→Partnerships with 1,23818 universities, institutions and organizations in 26 countries.
→MetaRed, a collaborative network of heads of public and private higher education institutions in Latin America, Spain and Portugal. It focuses on three of the biggest challenges that universities are facing: Digital transformation (MetaRed TIC), student startups (MetaRed X), and sustainability (MetaRed ESG).
| For more details, visit the website metared.org | ||||
16 Includes social contributions of foundations. In addition, Banco Santander made a donation of 6,617,008 Banco Santander shares to Fundación Banco Santander as financial support for it to bear (at least partially) the costs of fulfilling its founding purposes with the return on the shares. For more details, see note 34.' Other equity instruments and own shares' of the Consolidated financial statements
17 The variation in respect to previous years responds to a reclassification as explained in section 8.4 of this chapter
18 Includes universities, institutions and organizations that have an agreement with Santander Universities, Universia and Fundación Universia. For Santander Universities alone, the figure is 904 academic entities in 12 countries.
61
→Campus Digital, which offers a new model for universities to engage with students. With a user-friendly digital experience, it enhances university life by streamlining student procedures and communications, adapting to users’ needs, and ensuring data privacy. It offers services such as digital credentials, tuition fee payments, certificates, timetables and discounts.
| For more details, visit the website mycampusdigital.com | ||||
→5th Universia International Rectors’ Summit, (Valencia, Spain), one of the world’s leading events for rectors. 1,200 people attended, including 700 academic leaders from 14 countries. Over 4,500 students and entrepreneurs were connected, representing our 1.5 million people and businesses supported.
| For more details, visit the website santander.com/universities | ||||
2. Employability
Our support for employability involves promoting job skills and access to the job market. We do this through these initiatives:
→Santander Open Academy (formerly Santander Scholarships), a global learning and professional development platform that offers scholarships and job skills training for people of all ages.
It offers grants and scholarships for top institutions all over the world, fully subsidized courses and free learning for skills in high demand.
| For more details, visit the website santanderopenacademy.com | ||||
→Universia, our initiative to help universities and training centres connect young people with companies so they can find a job.
636 partner universities and institutions with Universia in 22 countries | ||
| For more details, visit the website universia.net | ||||
→Fundación Universia, a global torch-bearer in diversity, equity and inclusion, which participates in international forums of the United Nations, the International Labour Organization and UNESCO.
475 scholarships for university students with disabilities | 50 people with disabilities hired by companies | 160 people helped through the Plan Circular19 | ||||||||||||
| For more details, visit the website fundacionuniversia.net | ||||
3. Entrepreneurship
Our support for entrepreneurship is channelled through Santander X, where we help small business owners and SMEs create opportunity, take root and grow. We provide access to the training, advice and resources needed to launch and scale up a business.
We help entrepreneurs give visibility to the most outstanding projects, and to connect with other businesses through a global community.
7,036 entrepreneurship and business initiatives helped | ||
| For more details, visit the website santanderx.com | ||||
19 Plan Circular is supported by the European Investment Fund and boosts the access to training in digital skills.
62
6.2 Other community support programmes
GRI 3-3, 203-1, 203-2, 413-1
|  | ||||
69 million euros in social investment20 | 2.2 million people helped21 | ||||
We aim to improve people's access to education and culture and support well-being:
| ó | ó | ó | ||||||||||||||||||||||||||||||
Childhood education  Helping children and young people get a well-rounded, quality education. | Social welfare  Helping vulnerable people and those at risk of social exclusion. | Arts and sciences  Helping people access cultural events and programmes. | ||||||||||||||||||||||||||||||
We channel our investment through partnerships with NGOs and humanitarian organizations. Some partnerships are with the bank’s foundations in Argentina, Spain, the US, Portugal, Poland and the UK.
In Spain, Fundación Banco Santander works to build a fair, inclusive and sustainable society by financing and running several cultural, educational, social and environmental projects.
In 2023, Santander made a donation to Fundación Banco Santander for a total of 6,617,008 Banco Santander shares. The donated shares are meant to help the foundation financially: it can use the dividends to cover some (if not all) of the cost of fulfilling its founding purposes22. These include managing the Bank's art collection and financing numerous literary, educational, social, cultural and environmental productions and activities, in which the reconfiguration of the Bank's headquarters on Paseo de Pereda in Santander and our relations with universities in Spain will play an important role. For more details, go to the website fundacionbancosantander.com/es/fundacion/transparencia.
Fundación Banco Santander also encourages employees and customers to get involved in its initiatives and programmes. For more details, see ‘Volunteering’ in section 4. 'Acting responsibly towards employees'.
Links and descriptions of our main initiatives are available on our corporate website and in our local responsible banking reports (also available on our corporate website).
| For more details on Fundación Banco Santander’s core work, visit the website fundacionbancosantander.com/es/fundacion/memorias | ||||
20 Includes social contributions from the Group’s foundations.
21 Based on the People Helped internal methodology, which considers international best practices. Calculated with partners’ certified data or with conservative estimates based on recognized conversion factors.
22 For more details, see Note '34. Other equity instruments and own shares' in the 'Consolidated financial statements'.
63
7. Business conduct
| Our approach is to act responsibly and with integrity across our value chain | Main regulations | |||||||||||||||||||||||||||||||||||||||||||
| Risk corporate ; Compliance and conduct corporate; and Financial crime and compliance corporate frameworks | ||||||||||||||||||||||||||||||||||||||||||||
| General code of conduct | Code of conduct in securities markets | Corporate defence policy | ||||||||||||||||||||||||
| Our code of conduct sets out shared principles and values set out in The Santander Way. | ||||||||||||||||||||||||||
Canal Abierto (whistleblowing) policy | Environmental, social and climate change risk | Tax policy | ||||||||||||||||||||||||
| Conflict of interest Policy | Defense sector | Financing for sensitive sectors | ||||||||||||||||||||||||
| Anti-bribery and corruption policy (ABC policy) | Anti-money laundering and countering the financing terrorism policy | |||||||||||||||||||||||||||||||||||||
| Our commitment to ethical principles is reflected in our determination to fight corruption, and our status as a signatory to the United Nations Global Compact. | ||||||||||||||||||||||||||||||||||||||
| Financing of political parties policy | ||||||||||||||||||||||||||||||||||||||
| Third-party certification policy | ||||||||||||||||||||||||||||||||||||||
| Our business conduct principles apply to vendors. | ||||||||||||||||||||||||||||||||||||||
| Outsourcing and third-party management model | ||||||||||||||||||||||||||||||||||||||
| For more information related to the level of approval and public disclosure, see section 9.2 'Main internal regulations and governance' | ||||
64
7.1 Conduct standards
GRI 2-15, 2-25, 3-3, FS1, 207-1, 207-2, 207-3
7.1.1. Code of conduct
Our General code of conduct (GCC) promotes equal opportunity, diversity and non-discrimination, zero tolerance for sexual or work-related harassment, respect for others, work-life balance, human rights, and environmental protection. It is also one the core elements to prevent criminal risk.
All Group employees — general workforce, top management and members of the management bodies of the companies that make up Grupo Santander — must be aware of and comply with the GCC. The Internal Audit area regularly reviews compliance with the GCC, with autonomy to check that it and subsidiary-level versions are appropriate and effective.
| For more details, see section 7.2 ‘Compliance and conduct risk management’ in the ‘Risk management and compliance’ chapter. | ||||
Core initiatives
→#Yourconductmatters: campaigns via email, Intranet and other media to boost employees’ awareness of the GCC and related policy, as well as of Canal Abierto and the latest whistleblower protection laws.
→Recommendations posted on the Intranet to prevent conflicts of interest between employees and the Group, and to review and manage conflicts.
→Handling reports received through our ethical channel, Canal Abierto, enhancing processes based on lessons learned.
→Common principles and guidelines on offering and receiving courtesies or invitations from third parties, according to the terms of our ABC policy.
→Managing employees´ queries on ethics and rules in the GCC.
Training
Every year, all our employees undertake mandatory training on the GCC and conduct rules they must follow in their day-to-day, learn why every employee's conduct matters; and how to handle conflicts of interest and gifts and invitations from people outside Grupo Santander.
In 2023, several of the Group’s units ran sessions for core service providers on our culture of compliance and ethical behaviour.
We also trained the Group’s board members, who are key to avoiding and mitigating risk, setting a global corporate culture based on ethical principles and complying with internal and external rules. Sessions included compliance risks they are exposed to, how these risks may arise, and how to avoid them.
7.1.2. Procurement management policy
Our procurement management policy sets out how employees negotiating with vendors should conduct themselves to prevent conflict of interest and keep information confidential.
7.1.3. Code of conduct in securities markets (CCSM)
Approved by the board in 2020, the CCSM sets out the standards that board members and employees must abide by when handling sensitive information or trading in securities markets on their own behalf. It outlines the necessary controls and transparency to safeguard the interests of the Group’s investors as well as market integrity.
Our core units have relevant policies and tools to help detect potential violations and consistent management through a conduct framework.
Employees who are bound by the CCSM must complete mandatory training23 which outlines on the obligations contained in this code.
7.1.4. Principles of action in tax matters
Santander’s tax strategy sets out the tax principles that the entire Group must follow. The board of directors approves it and revises it regularly24.
The Group’s tax risk management and control, which draws on our internal control model, must be consistent with the principles in the tax strategy.
Since 2010, we've adhered to the Spanish Code of Good Tax Practices and the UK Code of Practice on Taxation for Banks, and more recently to the Portuguese Code of Good Tax Practices. We also participate in cooperative compliance initiatives led by tax authorities. Since 2015, we've voluntarily submitted an annual Tax Transparency Report to Spain's Tax Authority.
| For more details on the Group's tax contribution, see section 8. 'Our progress in figures'. | ||||
23 When joining and renewing every three years
24 Last updated in October 2022.
65
Core principles of Santander’s tax strategy
→Satisfy our tax obligations based on a reasonable interpretation of tax laws, grounded on their spirit and intention.
→Respect the rules on transfer pricing and pay taxes in each jurisdiction according to our operations, assumed risks and profits.
→Not give tax advice or planning strategies when marketing and selling financial products and services. Not engage in transactions or activities that enable our customers to avoid paying taxes.
→Communicate Santander's total tax contribution clearly, distinguishing between taxes borne by the Group and by third parties for each jurisdiction as well as any other information necessary to comply with generally accepted reporting standards on sustainability.
→Not create, or acquire a stake in, entities registered in countries or territories considered 'non-cooperative jurisdictions' without board approval; and properly monitor the Group's operations in such territories25.
| For more details on the Group’s tax strategy, visit our corporate website santander.com. | ||||
7.2 Ethical channels
GRI 2-26, 205-3, 406-1
Canal Abierto is our global ethical, anonymous and confidential channel for reporting misconduct. It protects whistleblowers by expressly prohibiting reprisals or any negative consequence against them. Every unit in the Group administers its own ethical channel in different languages including local according to the common standards of the corporate Canal Abierto.
Minimum standards include subsidiary CEOs endorsement, communication to employees of the importance of using the channel, information on how incidents have been handled and lessons learned, easy access to the channel and anonymity (if desired), external platforms to receive reports according to best practice, mechanisms to manage conflicts of interest in internal investigations of the reports, and regular internal audits. These standards have been part of our Canal Abierto policy since 2020.
Canal Abierto is mainly set up to receive reports from employees; however, some subsidiaries’ local channels are open to vendors, customers, investors and other stakeholders, who can report violations of the GCC. Business incidents or complaints outside of Canal Abierto’s scope are not accepted on these channels.
In 2023, Banco Santander, S.A. made these amendments to Canal Abierto to comply with Spain's law (Whistleblower Protection Act):
•Revised the Canal Abierto policy and the related usage and operation procedure, which the board of directors had approved in June. Both are available on our corporate website and the Canal Abierto platform.
•The Chief Compliance Officer appointed as responsible for Canal Abierto at Banco Santander, S.A..
•We made these changes to the channels we run in our other units in Spain (Santander Digital Consumer Bank, Openbank and PagoNxt) and shared them with the rest of the Group’s units as best practice.
We also worked on a protocol to standardize internal investigations in the Group´s units with less tradition in this matter.
In 2023, the Group’s channels received 3,611 reports26, relating to: i) violations of our General code of conduct (63.4%), with key concerns over workplace harassment, internal fraud, product marketing, and anti-money laundering; ii) human resources-related conduct (30.2%), with key concerns over conflict due to a lack of leadership, and a failure to demonstrate corporate behaviours; and iii) other categories (6.4%).
The Group received 125 reports about equal opportunity and non-discrimination; 12 led to disciplinary action, including 6 dismissals. There is no record of any lawsuits filed by an employee or their representatives against Banco Santander, S.A. in relation to incidents of discrimination or violation of fundamental rights.27
The Group also received 15 reports regarding corruption, which led to 2 dismissals.
We received 267 reports from third parties (207 from customers and 60 from vendors).
All reports submitted on Canal Abierto are handled appropriately, whether they are found to be substantiated or not.
In 2023, the number of closed reports and disciplinary actions has decreased due to the fact that in Brazil, cases identified by the control areas are no longer considered for Canal abierto purposes.
| 2023 | 2022 | |||||||
Received reports | 3,611 | 3,935 | ||||||
Closed reports | 2,929 | 3,477 | ||||||
| Disciplinary action | 655 | 907 | ||||||
which led to dismissal | 366 | 387 | ||||||
25 At 2023 year end, we had one subsidiary and three branches in offshore jurisdictions. For more details, see Note 3 c) to the consolidated financial statements.
26 Not including PagoNxt entities outside Headquarters or the SCF joint ventures with Stellantis.
66
7.3 Environmental, social and climate change risk management
GRI 2-23, 2-24, 2-25, 3-3, 411-1, 413-2, FS2, FS3, FS10, FS11
Santander embeds environmental and social standards in risk management, focusing on priority sectors to support sustainable and inclusive growth and uphold human rights.
Our Environmental, social and climate change (ESCC) risk management policy (which we review every year) sets out the standards for investing in, and providing financial products and services28 to companies and customers in oil and gas, power generation and distribution, mining and metals, and soft commodities (especially retail customers dedicated to farming and ranching in the Amazon).
A financial manager completes a questionnaire before a team of analysts conducts an overall assessment of the client's ESCC risks in the applicable sectors29.
The ESCC risk and compliance departments delve deeper into cases that uncover red flags. They submit the findings of their analysis (and its impact on credit and other risks) to the bank’s risk approval committees, who use them in decision-making.
According to the methodology we use to analyse customers’ climate transition plans, we carry out an annual assessment of ESCC risk for CIB clients in sectors where we have set decarbonization targets (oil and gas, power generation, automotive, steel, and aviation) to categorize them based on their greenhouse gas emissions, emissions targets, and transition risk management.
The Group applies the precautionary principle to its analysis and management of core ESCC risk.
In 2023, the ESCC risk and compliance departments worked with the business units to strengthen governance and ESCC risk management in sustainable finance transactions. We set up teams of experts to assess sustainable finance for new customer segments. These teams participate in expert panels to establish criteria and ensure consistency in operations tagging. We continued to ensure that we understand how ESCC risk affects our customers so as to make our risk assessments more rounded and to offer customers support in their transition.
In addition to the analysis performed by the ESCC risk teams, the Financial crime compliance (FCC) teams establish controls to mitigate environmental crimes detailed in the following section.
| |||||
| For more information on Santander’s environmental, social and climate change risk management policy, see section 9.2 'Main internal regulations and governance'. | ||||
Equator Principles
Equator Principles (EP) is a voluntary framework for financial institutions to identify, assess, and manage environmental and social risks when financing projects. We have been applying these principles to project-related transactions (especially project finance) since 2009.
The Group has an internal procedure to manage the environmental and social (E&S) risks of project-related transactions. This procedure guides the application of the EP.
The assessment of transactions that potentially require application of EP starts with a Preliminary Assessment conducted by Front Office. The ESCC Risk Global function sits at CIB, reporting directly to Global Head of CIB Risk. ESCC Risk oversees Front Office´s Preliminary Assessment; also providing training and ad-hoc support to Front Office. Based on the conclusions of the Preliminary Assessment, an environmental and social risk review is conducted for applicable transactions, according to the following guidelines:
•For projects with minimal or no adverse environmental and social risks and/or impacts (category C), the initial assessment is considered sufficient.
•For projects with potential limited adverse environmental and social risks and/or impacts that are few in number, generally site-specific, largely reversible and readily addressed through mitigation measures (category B) in designated countries, the Front Office must complete a due diligence questionnaire that includes the findings of the E&S risk assessment. The ESCC risk area provides guidance throughout this process.
•For category A (with potential significant adverse environmental and social risks and/or impacts that are diverse, irreversible or unprecedented) and B projects that involve high-risk factors or are in non-designated countries, the ESCC risk area manages the due diligence procedure and prepares an E&S risk assessment report.
•The findings of the E&S assessment form part of the application for financing that is submitted to the risk approval committees before a decision is made.
•We also use other E&S policies, procedures and rules when deciding to grant project financing or project-related business loans.
In 2023, we analysed 41 projects that fell within the scope of the Equator Principles (for more details, see table 8.7 ’Equator Principles).
Human rights protection
Our board-approved Responsible banking and sustainability policy sets out Santander’s ESG commitments, including human rights protection for our employees, customers, suppliers and the communities we serve. It upholds the highest standards, such as the United Nations Guiding Principles on Business and Human Rights (UNGPs) and the Universal Declaration of Human Rights.
•We run initiatives to combat discrimination, forced labour, and child exploitation as well as to preserve freedom of association and collective bargaining, our employees’ health, and decent employment.
28 Transactions that entail credit risk, insurance, advisory services, equity, and asset management.
29 Sectors covered by the ESCC Risk management policy and additional tactical sectors included in the CIB Procedure, as well as other material businesses and sectors depending on the geography and local legal requirements
67
•We protect our customers’ human rights through responsible business practices and the protection of their data.
| |||||
•We improved our supplier questionnaires and environmental, social and human rights analysis to respect for human rights throughout our supply chain.
| |||||
We're also enhancing human rights questionnaires to include risks to customers in the supply chain under our ESCC risk management policy.
We also assess the human rights impact on transactions that fall within the scope of the Equator Principles.
Grievances mechanism
Canal Abierto is our grievance mechanism to protect human rights in the Group’s operations, according to principle 31 of the UNGPs. It can be found at https://secure.ethicspoint.eu/domain/media/eseu/gui/105329/index.html
| |||||
7.4 Financial crime compliance and relations with political parties
GRI 205-2, 3-3, 415-1
SASB FN-AC-510a.1, FN-CB-510a.1, FN-IB-510a.1
SASB FN-AC-510a.1, FN-CB-510a.1, FN-IB-510a.1
Financial crime compliance (FCC) for vulnerable customers
Our FCC due diligence for customers supports the Group's commitment to 'reducing the stigma in providing financial services to vulnerable customers', so that our business units mitigate financial crime risk responsibly. In 2023, the United Nations singled out Santander’s leading practices in its report Strengthening Financial Inclusion to Protect Against Modern Slavery: Applying Lessons to Bank Forcibly Displaced Persons/ Refugees. Three of the report’s five case studies were on Santander: Openbank, Santander España and Santander Polska.
FCC tackling environmental crime
Sectors with high exposure to environmental crime are considered 'restricted' and subject to further due diligence requirements. Our customer screening tools include specific terms and content related to environmental crime.
We engage in various public-private partnerships as part of our commitment to detect, disrupt and deter environmental crime. Our Head of Financial Crime Compliance Framework & Policies continues to chair the quarterly United Nations Office on Drugs and Crime's (UNODC) private sector dialogue on the disruption of financial crimes related to forestry crimes. In 2023 this initiative extended to cover all environmental crime. Financial institutions, authorities, investigative law enforcement units and supranational governmental bodies came together to discuss intelligence sharing, typologies and policy strategies on disrupting the financial crime networks behind all crimes against nature. In 2023, Santander continued to play a pivotal role in the launch of the Latin American chapter of the United for Wildlife’s Financial Taskforce against illegal wildlife trade.
FCC for anti-bribery and corruption, and training
The Group continued to prioritize embedding its anti-bribery and corruption (ABC) compliance framework in 2023, with a strong commitment from marketing, sponsorships, supplier management, human resources and other key functions that are exposed to high ABC risk. The Group’s training plan continued to combine introductory ABC courses with more detailed and customized content for certain teams. In 2023, stand-out sessions included technical training on penalty enforcement,
ABC risk awareness workshops with staff from the Acquisitions team, and courses for board members.
Relations with political parties
Santander is committed to the principles of transparency, honesty and impartiality in its engagement with political parties and other entities with public and social purposes that are also political in nature. These principles prohibit any act of corruption by Santander’s employees and managers.
Our board executive committee-approved policy on political party funding (available on our corporate website) has applied to all our subsidiaries worldwide since 2016. Except as provided below, it prohibits making monetary or in-kind donations and contributions to elections. However, it allows subsidiaries to sponsor special events or activities, provided they have been approved by the Group executive committee and are consistent with Santander's objectives and operations. Santander US participates in a US political action committee with full transparency and in compliance with US law.
Grupo Santander may only finance political parties on an exceptional and arm's length basis approved by the Group executive committee. The policy prohibits total or partial debt cancellation for political parties and their affiliates. While the terms of any debt may be negotiated, the interest rate charged may never be below the market rate. In addition, this policy applies to electoral candidates of political parties to the extent provided by local law.
| For more details on financial crime, see section 7.2 ‘Compliance and conduct risk management’ in ‘Risk management and compliance’ chapter. | ||||
68
7.5 Acting responsibly towards suppliers
GRI 3-3, 204-1, 308-1, 308-2, 414-1, 414-2
Our corporate third-party certification policy provides a methodology for all subsidiaries to make sure that our suppliers meet the Group’s minimum requirements. In addition to traditional legal, tax, technical and ethical standards, it includes such sustainability standards as human rights and diversity and inclusion for suppliers that provide risk services to the Group. Risk services are services provided by suppliers that handle highly sensitive data or where a disruption in their services could severely damage the business.
ESG standards in procurement
In 2023 we continued to work on procedures to assess our suppliers’ compliance with ESG standards.
•3,001 suppliers30 representing 43%31 of those that provide risk services32, have completed a Group33 certification that includes, among others, ESG aspects such as the existence of codes of conduct and anti-corruption policies, human and labour rights, or other elements included in international standards such as UN Global Compact.
•We worked on drawing up and implementing a new ESG approval methodology to classify our suppliers according to risk, including a criticality assessment.
The assessment consists of questionnaires on carbon footprint, gender and disability inclusion, flexible working, minimum wage, good corporate governance and other factors.
We use the assessment findings to work with suppliers on remediation plans and specific ESG training.
ESG standards in suppliers' negotiations
In 2023 we introduced ESG standards in tenders for certain product and service taxonomies with an environmental and social impact.
The ESG standards we require in tenders include the product or service's carbon footprint, the use of recycled or renewable materials, energy efficiency, accessibility for people with disabilities, and corporate social responsibility compliance in the supply chain.
Supporting our suppliers’ sustainability transition
We have created initiatives to support our suppliers and help them meet the requirements of domestic, European and international ESG regulatory frameworks:
→We work with our most important suppliers on sustainability action plans to enhance their understanding of ESG.
→We promote the UN Global Compact training programme to help our suppliers access knowledge and tools to tackle sustainability challenges.
Other key aspects
→10,937 million euros were paid to suppliers. 91% of our suppliers are locally based, accounting for 94%34 of our turnover.
→In 2023, we implemented a new corporate tool to standardize certification in all our core markets as well as to review key risks such as cybersecurity, business continuity, physical security, facilities and data protection, anti-bribery and corruption, data integrity and other additional risks.
→We built up expert teams in our markets to consider ESG standards in negotiations and risks assessments under the new methodology.
→We’re working to extend our ethical channels for suppliers to the rest of our core markets.
30 Geographies with other local certification processes that do not include review of similar ESG criteria (USA, Peru, Colombia, Asia, Poland and wholesale branches) are not considered.
31 The remaining 57% have been exempted on the basis of the criteria defined in the Group's third-party certification policy.
32 Data at the end of November
33 This certification is done through specific questionnaires about different topics (including ESG issues), and is subject to the approval of the corresponding local supplier forum, in case that any of these questionnaires are not passed. If this situation occurs, the forum will assess each case based on the Group's risk appetite in the matter and the mitigation plans which mitigate that risk.
34 Geographies with local payment systems such as Poland, Uruguay and some Santander Digital Consumer Bank companies are not considered in the data.
69
8. Our progress in figures
GRI 2-4
70
8.1 Tax contribution
GRI 201-1
In 2023, our tax contribution totalled EUR 19,914 million, including EUR 9,664 million in taxes directly paid by the Group and the rest in collected taxes originating from our business operations with third parties. We pay taxes in the jurisdictions where we earn a profit. Thus, the profits obtained, and the taxes accrued and paid, correspond to the countries where we operate.
For every EUR 100 in total income, EUR 35 are taxed, including EUR 17 in taxes paid directly by Santander and EUR 18 in taxes collected from third parties.
The taxes Santander pays directly (see table below) are included in the cash flow statement and mainly stem from the corporate income tax paid (EUR 5,214 million, which represents an effective rate of 31.7%). They also include non-recoverable value added tax (VAT), employers' social security contributions, charges levied on banks and financial transactions in Spain, the UK, Poland, Portugal, Brazil and Argentina, and other taxes. Total taxes paid directly by the Group amount to 58.7% of the profit before tax.
The taxes we accrue and the amounts we pay do not usually match because the laws in some countries dictate a different payment date than when income was generated or an operation was taxed. Therefore, the corporate income tax accrued during the accounting period is EUR 4,276 million, which represents an effective rate of 26% (see note 27 of the consolidated annual accounts).
| 1. Total taxes paid | |||||||||||||||||
| EUR million | |||||||||||||||||
| 2023 | |||||||||||||||||
| Jurisdiction | Corporate income taxA | Other taxes paid | Total taxes paid by the GroupB | Third-party taxesC | Total contribution | ||||||||||||
| Spain | 323 | 1,310 | 1,633 | 1,642 | 3,275 | ||||||||||||
| UK | 728 | 500 | 1,228 | 569 | 1,797 | ||||||||||||
| Portugal | 302 | 190 | 492 | 220 | 712 | ||||||||||||
| Poland | 150 | 281 | 431 | 252 | 683 | ||||||||||||
| Germany | 173 | 90 | 263 | 2 | 265 | ||||||||||||
| Rest of Europe | 518 | 282 | 800 | (3) | 797 | ||||||||||||
| Total Europe | 2,194 | 2,653 | 4,847 | 2,682 | 7,529 | ||||||||||||
| Brazil | 1,396 | 583 | 1,979 | 3,141 | 5,120 | ||||||||||||
| Mexico | 840 | 497 | 1,337 | 916 | 2,253 | ||||||||||||
| Chile | 167 | 93 | 260 | 352 | 612 | ||||||||||||
| Argentina | 54 | 389 | 443 | 2,186 | 2,629 | ||||||||||||
| Uruguay | 57 | 100 | 157 | 50 | 207 | ||||||||||||
| Rest of Latin America | 48 | 20 | 68 | 16 | 84 | ||||||||||||
| Total Latin America | 2,562 | 1,682 | 4,244 | 6,661 | 10,905 | ||||||||||||
| United States | 446 | 111 | 557 | 898 | 1,455 | ||||||||||||
| Other | 12 | 4 | 16 | 9 | 25 | ||||||||||||
| TOTAL | 5,214 | 4,450 | 9,664 | 10,250 | 19,914 | ||||||||||||
A. The Group's income tax for the year 2022 amounted to EUR 5,498 million.
B. Total own taxes paid for all these concepts amounted to EUR 9,664 mn, broken down as EUR 5,214 mn in corporate income tax, EUR 1,004 mn in non-recoverable VAT and other sales taxes, EUR 1,766 mn in employer-paid payroll taxes, EUR 85 mn in property taxes, EUR 224 mn in Spanish temporary bank levy, EUR 385 mn in bank levies and EUR 986 mn in other taxes.
C. Total third-party taxes amounted to EUR 10,250 mn, broken down as EUR 2,946 mn in salary withholdings and employees' social security contributions, EUR 768 mn in recoverable VAT, EUR 2,217 mn in tax deducted at source on capital, EUR 310 mn in non-resident taxes, EUR 417 mn in property taxes, EUR 217 mn in stamp taxes, EUR 2,017 mn in taxes related to the financial activity and EUR 1,358 mn in other taxes.
71
8.2 Customers
GRI 2-26,2-29, FS6
2. GROUP CUSTOMERSA | |||||||||||
| 2023 | 2022 | var. | |||||||||
Europe | 46,293,433 | 45,563,811 | 2% | ||||||||
| Spain | 15,022,877 | 14,319,525 | 5% | ||||||||
| United Kingdom | 22,480,761 | 22,402,482 | —% | ||||||||
| Portugal | 2,908,192 | 2,922,944 | (1)% | ||||||||
| Poland | 5,877,433 | 5,696,967 | 3% | ||||||||
Others EuropeB | 4,170 | 221,894 | (98)% | ||||||||
South America | 73,028,442 | 69,553,448 | 5% | ||||||||
BrazilC | 62,804,350 | 60,117,170 | 4% | ||||||||
Chile | 4,052,314 | 3,577,094 | 13% | ||||||||
Argentina | 4,771,370 | 4,385,406 | 9% | ||||||||
Others South AmericaD | 1,400,408 | 1,473,778 | (5)% | ||||||||
| North America | 25,027,302 | 24,980,487 | —% | ||||||||
United StatesF | 4,510,043 | 4,523,339 | —% | ||||||||
| México | 20,517,259 | 20,239,179 | 1% | ||||||||
Others- North AmericaF | 0 | 217,969 | (100)% | ||||||||
Digital Consumer Bank | 20,192,858 | 19,746,178 | 2% | ||||||||
Santander Consumer BankG | 17,665,556 | 17,793,206 | (1)% | ||||||||
Santander Digital | 2,527,302 | 1,952,972 | 29% | ||||||||
Total | 164,542,034 | 159,843,924 | 3% | ||||||||
A. Figures corresponding to total customers. 2022 data has been redefined to accommodate 2023 reporting segments.
B. Includes the rest of Private Banking and other CIB Europe. In 2023 Superdigital is not included, because it is a business that has been discontinued.
C. Private Banking: Decision groups.
D. Includes Uruguay, Peru and Colombia. In 2023 Superdigital is not included, because it is a business that has been discontinued.
E. Includes BPI Miami
F. In 2023 Superdigital is not included, because it is a business that has been discontinued.
G. SCF includes customers in all European countries, including the UK.
| 3. DIALOGUE BY CHANNEL | |||||||||||
| 2023 | 2022 | Var .2023/2022 %. | |||||||||
Branches | |||||||||||
Number of branches | 8,518 | 9,019 | (5.6) | % | |||||||
Digital bankingA | |||||||||||
Digital customersB (millions) | 54.2 | 51.5 | 5.2 | % | |||||||
A. Santander Consumer Finance not included.
B. Counts once for customers of both Internet and mobile banking.
72
| 4. GROUP NPS | ||||||||||||||
| 2022 | 2021 | 2020 | 2019 | |||||||||||
| Argentina | 1 | 1 | 2 | 3 | ||||||||||
| Brazil | 4 | 3 | 1 | 2 | ||||||||||
| Chile | 1 | 1 | 1 | 1 | ||||||||||
| Uruguay | 2 | 2 | 2 | 3 | ||||||||||
| Spain | 3 | 2 | 2 | 2 | ||||||||||
| Poland | 3 | 3 | 3 | 4 | ||||||||||
| Portugal | 2 | 2 | 3 | 1 | ||||||||||
| UK | 5 | 6 | 3 | 6 | ||||||||||
| Mexico | 2 | 3 | 4 | 4 | ||||||||||
| USA | 9 | 9 | 8 | 9 | ||||||||||
NPS to measure customer satisfaction, audited by Stiga/Deloitte.
Santander position vs competitors (Official Peer Group by countries). Key peers by country: Argentina: Galicia, BBVA, ICBC, HSBC, Banco Macro, Banco de la Nación; Brazil: Itaú, CEF, Bradesco, Banco do Brasil; Chile: BCI, Banco de Chile, Itaú, Scotiabank, Banco Estado; Uruguay: Brou, Itaú, BBVA, Scotiabank; Spain: BBVA, Caixabank, Sabadell, Bankia, Unicaja; Poland: ING, Millenium, MBank, Bank Polski, Bank Pekao, BNP Paribas; Portugal: BPI, Millenium BCP, CGD, Novo Banco; UK: Nationwide, Barclays, Halifax, NatWest, Lloyds, HSBC, TSB, RBS; Mexico: Scotiabank, Banorte, HSBC, Banamex; US: JP Morgan, Bank of America, Capital One, PNC, M&T Bank, TD Bank, Citigroup, Citizens, Wells Fargo.
5. GROUP NPS BY CHANNELA | |||||||||||
| 2023 | 2022 | 2021 | |||||||||
| Branch | 70 | 66 | 64 | ||||||||
| Contact center | 72 | 60 | 43 | ||||||||
InternetB | 67 | 62 | 58 | ||||||||
| Mobile | 67 | 65 | 69 | ||||||||
A. Internal NPS. Monthly data. Last information available from December 2023 (it may vary throughout the year). Obtained from customer surveys issued within 48 hours of their contact with the bank via any channel. Weighted average of active Group customers.
B. Internet: Excluding Chile and Uruguay.
6. CUSTOMER SATISFACTIONA | ||||||||||||||
| 2023 | 2022 | 2021 | 2020 | |||||||||||
| Argentina | 92 | 93 | 91 | 90 | ||||||||||
| Brazil | 88 | 88 | n/a | 89 | ||||||||||
| Chile | 89 | 90 | 90 | 87 | ||||||||||
| Uruguay | 95 | 97 | 96 | 93 | ||||||||||
| Spain | 89 | 89 | 84 | 87 | ||||||||||
| Poland | 95 | 95 | 96 | 99 | ||||||||||
| Portugal | 86 | 90 | 90 | 86 | ||||||||||
| UK | 96 | 96 | 95 | 94 | ||||||||||
| Mexico | 98 | 94 | 94 | 95 | ||||||||||
| USA | 89 | 89 | 88 | 87 | ||||||||||
GroupB | 91 | 92 | 92 | 91 | ||||||||||
A. Net customer satisfaction: calculation of 100% of customers minus percentage of dissatisfied customers.
B. Linear average of net satisfaction across all geographies.
73
7. TOTAL COMPLAINTSA | |||||||||||
| 2023 | 2022 | 2021 | |||||||||
SpainB | 88,326 | 76,272 | 120,953 | ||||||||
PortugalC | 4,789 | 3,584 | 3,570 | ||||||||
United KingdomD | 25,309 | 20,624 | 20,069 | ||||||||
PolandE | 6,272 | 5,169 | 5,179 | ||||||||
Brazil | 207,211 | 215,906 | 195,340 | ||||||||
Mexico | 68,565 | 70,100 | 82,033 | ||||||||
Chile | 8,441 | 7,873 | 8,009 | ||||||||
Argentina | 5,525 | 5,294 | 5,013 | ||||||||
USF | 5,712 | 1,717 | 3,205 | ||||||||
SCFG | 33,074 | 29,777 | 35,215 | ||||||||
A. Compliance metrics based on group-wide criteria, homogeneous for all geographies.
B. Spain increases only due to a rebound in claims for mortgage formalization expenses, with a general reduction in the rest of the cases.. Includes Open Bank S.A.
C. Portugal increased mainly due to cost of living crisis with regulatory changes in mortgages
D. The United Kingdom is affected by a change in the perimeter where insurance has been included, once complaints for personal protection insurance (PPI) have been standardized.
E. Poland increased due to changes in terms and conditions and operational changes.
F. The United States has included the Santander Consumer unit in the report.
G. The increase in SCF is mainly due to complaints for the reduction of upfront costs in case of early repayment of CQS in SCF Italy and discretionary management fees in SCF UK.
8.3 Financial inclusion
GRI 203-1, 203-2, 413-1
8.1 Financially included peopleA | |||||
| million people (Accumulated since 2023) | 2023 | ||||
Access | 1.0 | ||||
Finance | 0.8 | ||||
| Total | 1.8 | ||||
A. During 2023 a new public target of Financially Included People has been made, which considers Access and Finance initiatives (the previous commitment also considered Financial Education initiatives). As a result, the methodology for calculating Financially Included People has been redefined, and the difference with the previous year does not allow full comparability (-0.2 million vs 2022). Data for 2023 reflect only new financially included persons vs. previous year. Unique people. Each year only new financially included people are added.
8.2 People helped through Financial education initiativesA,B | |||||||||||
| million people | 2023 | 2022 | 2021 | ||||||||
Financial educationA | 11.5 | 2.7 | 1.3 | ||||||||
A. As a result of what is explained in note A of the table above, the methodology for calculating the number of people helped through financial education initiatives has also been redefined, and the difference with the previous year is not comparable. 2023 figures now includes social media initiatives to promote financial education, which makes the figure increase significantly year on year.
B. Unique people. Each year only new people helped are added.
| 9. Microfinance | |||||||||||
| million euros / people | 2023 | 2022 | 2021 | ||||||||
Total credit disbursedA | 1,172.3 | 950.0 | 571.0 | ||||||||
Total micro-entrepreneurs supportedB | 1.2 | 1.6 | 1.0 | ||||||||
A.The increase in credit disbursed is mainly due to the bank's commitment to expand its microfinance programmes in Latin America.
74
8.4 Community investment
GRI 203-1, 203-2, 413-1, FS7
10. Community investment
At Banco Santander, we measure our investment in community outreach according to the Business for Societal Impact (B4SI)1 methodology, which is an international benchmark for the Global Reporting Initiative (GRI), S&P Dow Jones Sustainability Index and other standards and indices.
| million euros | 2023 | 2022 | 2021 | ||||||||
Support for higher education, employability, and entrepreneurship | 105 | 100 | 106 | ||||||||
Other local initiatives | 69 | 63 | 46 | ||||||||
Total | 174 | 163 | 152 | ||||||||
11. Outputs and outcomes
We have developed internal methodologies to measure people helped of our Santander Universities programme and our local community support initiatives, respectively.
| 11.1 People helped through Santander Universities programmes | |||||||||||
| people helped | 2023 | 2022 | 2021 | ||||||||
Higher educationA | 28,849 | 49,490 | 40,632 | ||||||||
EmployabilityB | 463,045 | 195,798 | 98,480 | ||||||||
EntrepreneurshipA | 7,036 | 20,739 | 23,120 | ||||||||
TotalA | 498,930 | 266,027 | 162,232 | ||||||||
A. The variation in Education and Entrepreneurship programmes respond to the reclassification derived from the new taxonomy of Santander Universities, approved in 2023 and aligned to the People Helped internal methodology. This new taxonomy also includes a correction factor of 10% on the total consolidated data for the year to avoid duplication.
B. The increase in the number of people helped in Employability is mainly due to the extension of our portfolio programmes to new types of courses as part of Santander Universities' strategy to support employability. Furthermore this also considers changes in taxonomy to align to the People Helped internal methodology.
11.2 People helped from local initiativesA | |||||||||||
| million people | 2023 | 2022 | 2021 | ||||||||
Support for childhood education | 0.6 | 0.4 | 0.8 | ||||||||
Support for social welfare | 1.0 | 0.9 | 1.3 | ||||||||
| Support for the arts and science | 0.1 | 0.0 | 0.0 | ||||||||
| Others | 0.5 | 1.0 | 0.0 | ||||||||
Total | 2.2 | 2.3 | 2.1 | ||||||||
A. The nature and depth of initiatives is very diverse, both between them and comparing to initiatives of
Santander Universities.
75
8.5 Employees
GRI 2-7, 2-30, 202-1, 202-2, 401-1, 403-9, 403-10, 404-1, 405-1, 405-2
SASB FN-AC-330a.1, FN-IB-330a.1, FN0102-06
SASB FN-AC-330a.1, FN-IB-330a.1, FN0102-06
12. EMPLOYEES BY REGION AND GENDERA | ||||||||||||||||||||||||||
No employees | % men | % women | ||||||||||||||||||||||||
| Region | 2023 | 2022 | 2023 | 2022 | 2023 | 2022 | ||||||||||||||||||||
| Spain | 35,266 | 34,153 | 53 | 52 | 47 | 48 | ||||||||||||||||||||
| Brazil | 57,868 | 55,632 | 46 | 44 | 54 | 56 | ||||||||||||||||||||
| Chile | 9,576 | 9,544 | 44 | 44 | 56 | 56 | ||||||||||||||||||||
| Poland | 13,361 | 13,053 | 34 | 33 | 66 | 67 | ||||||||||||||||||||
| Argentina | 8,365 | 8,228 | 51 | 52 | 49 | 48 | ||||||||||||||||||||
| Mexico | 31,239 | 29,389 | 47 | 47 | 53 | 53 | ||||||||||||||||||||
| Portugal | 5,303 | 5,251 | 51 | 51 | 49 | 49 | ||||||||||||||||||||
| UK | 24,221 | 22,905 | 47 | 45 | 53 | 55 | ||||||||||||||||||||
| USA | 12,579 | 13,971 | 44 | 43 | 56 | 57 | ||||||||||||||||||||
| Others | 14,986 | 14,336 | 51 | 50 | 49 | 50 | ||||||||||||||||||||
| Total | 212,764 | 206,462 | 47 | 46 | 53 | 54 | ||||||||||||||||||||
A. At year end. Employee data is broken down according to geographical criteria (2022 data has been updated to this criteria) and cannot be compared to the figures in the 'Economic and financial review' chapter, which follow management criteria.
13.1 DISTRIBUTION BY ROLE AND GENDER 2023A | |||||||||||||||||||||||||||||||||||||||||||||||||||||
Senior executivesB | Other executivesC | Other employees | |||||||||||||||||||||||||||||||||||||||||||||||||||
Men | Women | Total | Men | Women | Total | Men | Women | Total | |||||||||||||||||||||||||||||||||||||||||||||
| Europe | 1,073 | 68.2 | % | 500 | 31.8 | % | 1,573 | 10,704 | 58.4 | % | 7,629 | 41.6 | % | 18,333 | 31,413 | 45.2 | % | 38,062 | 54.8 | % | 69,475 | ||||||||||||||||||||||||||||||||
| North America | 202 | 71.1 | % | 82 | 28.9 | % | 284 | 3,778 | 60.0 | % | 2,522 | 40.0 | % | 6,300 | 16,387 | 43.7 | % | 21,111 | 56.3 | % | 37,498 | ||||||||||||||||||||||||||||||||
| South America | 305 | 68.4 | % | 141 | 31.6 | % | 446 | 3,878 | 58.9 | % | 2,708 | 41.1 | % | 6,586 | 32,709 | 45.3 | % | 39,560 | 54.7 | % | 72,269 | ||||||||||||||||||||||||||||||||
| Group total | 1,580 | 68.6 | % | 723 | 31.4 | % | 2,303 | 18,360 | 58.8 | % | 12,859 | 41.2 | % | 31,219 | 80,509 | 44.9 | % | 98,733 | 55.1 | % | 179,242 | ||||||||||||||||||||||||||||||||
A. At year end.
B. Includes Group Sr. Executive VP. Executive VP and VP.
C. The variation in executives includes the effect of internal reclassification and harmonization of the management levels of employees carried out across Grupo Santander.
13.2 DISTRIBUTION BY ROLE AND GENDER 2022A | |||||||||||||||||||||||||||||||||||||||||||||||||||||
Senior executivesB | Other executives | Other employees | |||||||||||||||||||||||||||||||||||||||||||||||||||
Men | Women | Total | Men | Women | Total | Men | Women | Total | |||||||||||||||||||||||||||||||||||||||||||||
| Europe | 1,093 | 69.6 | % | 478 | 30.4 | % | 1,571 | 6,779 | 63.5 | % | 3,893 | 36.5 | % | 10,672 | 33,041 | 44.7 | % | 40,919 | 55.3 | % | 73,960 | ||||||||||||||||||||||||||||||||
| North America | 221 | 77.0 | % | 66 | 23.0 | % | 287 | 1,334 | 68.2 | % | 621 | 31.8 | % | 1,955 | 18,300 | 44.3 | % | 23,055 | 55.7 | % | 41,355 | ||||||||||||||||||||||||||||||||
| South America | 320 | 70.5 | % | 134 | 29.5 | % | 454 | 3,147 | 60.0 | % | 2,096 | 40.0 | % | 5,243 | 31,108 | 43.8 | % | 39,857 | 56.2 | % | 70,965 | ||||||||||||||||||||||||||||||||
| Group total | 1,634 | 70.7 | % | 678 | 29.3 | % | 2,312 | 11,260 | 63.0 | % | 6,610 | 37.0 | % | 17,870 | 82,449 | 44.3 | % | 103,831 | 55.7 | % | 186,280 | ||||||||||||||||||||||||||||||||
A. At year end.
B. The higher number of women senior executives is due to the progress made on the public Responsible Banking commitment regarding women in senior executive positions, which aims to have women in 35% of senior management roles by 2025.
14.1. WORKFORCE BY AGE BRACKET 2023A | ||||||||||||||||||||||||||||||||||||||||||||
| Number and % of total | ||||||||||||||||||||||||||||||||||||||||||||
aged <= 25 | aged 26 - 35 | aged 36 - 45 | aged 46 - 50 | age over 50 | ||||||||||||||||||||||||||||||||||||||||
| Europe | 5,563 | 6.22 | % | 19,992 | 22.37 | % | 29,111 | 32.57 | % | 14,320 | 16.02 | % | 20,395 | 22.82 | % | |||||||||||||||||||||||||||||
| North America | 5,206 | 11.81 | % | 17,859 | 40.51 | % | 11,713 | 26.57 | % | 3,427 | 7.77 | % | 5,877 | 13.33 | % | |||||||||||||||||||||||||||||
| South America | 12,311 | 15.52 | % | 30,516 | 38.48 | % | 24,156 | 30.46 | % | 6,101 | 7.69 | % | 6,217 | 7.84 | % | |||||||||||||||||||||||||||||
| Group total | 23,080 | 10.85 | % | 68,367 | 32.13 | % | 64,980 | 30.54 | % | 23,848 | 11.21 | % | 32,489 | 15.27 | % | |||||||||||||||||||||||||||||
A. At year end.
76
14.2. WORKFORCE BY AGE BRACKET 2022A,B | ||||||||||||||||||||||||||||||||||||||||||||
| Number and % of total | ||||||||||||||||||||||||||||||||||||||||||||
aged <= 25 | aged 26 - 35 | aged 36 - 45 | aged 46 - 50 | age over 50 | ||||||||||||||||||||||||||||||||||||||||
| Europe | 4,875 | 5.66 | % | 19,393 | 22.49 | % | 29,500 | 34.22 | % | 13,775 | 15.98 | % | 18,660 | 21.65 | % | |||||||||||||||||||||||||||||
| North America | 5,114 | 11.73 | % | 17,634 | 40.45 | % | 11,430 | 26.22 | % | 3,448 | 7.91 | % | 5,971 | 13.70 | % | |||||||||||||||||||||||||||||
| South America | 12,306 | 16.05 | % | 29,663 | 38.69 | % | 23,034 | 30.05 | % | 5,863 | 7.65 | % | 5,796 | 7.56 | % | |||||||||||||||||||||||||||||
| Group total | 22,295 | 10.80 | % | 66,690 | 32.30 | % | 63,964 | 30.98 | % | 23,086 | 11.18 | % | 30,427 | 14.74 | % | |||||||||||||||||||||||||||||
A. At year end.
15.1. TYPE OF EMPLOYMENT CONTRACT IN 2023A | |||||||||||||||||||||||||||||||||||
Permanent/Full-time | Permanent/Part-time | ||||||||||||||||||||||||||||||||||
Men | Women | Total | Men | Women | Total | ||||||||||||||||||||||||||||||
| Europe | 40,888 | 51.4 | % | 38,681 | 48.6 | % | 79,569 | 860 | 13.7 | % | 5,434 | 86.3 | % | 6,294 | |||||||||||||||||||||
| North America | 20,216 | 46.5 | % | 23,246 | 53.5 | % | 43,462 | 107 | 21.7 | % | 386 | 78.3 | % | 493 | |||||||||||||||||||||
| South America | 36,654 | 46.6 | % | 41,962 | 53.4 | % | 78,616 | 27 | 33.3 | % | 54 | 66.7 | % | 81 | |||||||||||||||||||||
| Group total | 97,758 | 48.5 | % | 103,889 | 51.5 | % | 201,647 | 994 | 14.5 | % | 5,874 | 85.5 | % | 6,868 | |||||||||||||||||||||
Temporary/Full-time | Temporary/Part-time | ||||||||||||||||||||||||||||||||||
Men | Women | Total | Men | Women | Total | ||||||||||||||||||||||||||||||
| Europe | 1,270 | 40.6 | % | 1,855 | 59.4 | % | 3,125 | 172 | 43.8 | % | 221 | 56.2 | % | 393 | |||||||||||||||||||||
| North America | 44 | 35.5 | % | 80 | 64.5 | % | 124 | 0 | 0 | % | 3 | 100 | % | 3 | |||||||||||||||||||||
| South America | 211 | 35.2 | % | 389 | 64.8 | % | 600 | 0 | 0 | % | 4 | 100 | % | 4 | |||||||||||||||||||||
| Group total | 1,525 | 39.6 | % | 2,324 | 60.4 | % | 3,849 | 172 | 43.0 | % | 228 | 57.0 | % | 400 | |||||||||||||||||||||
A. At year end.
B. From 2023 the type of contract in Brazilian contact center units will be computed as 'full-time', taking into account the standard 6-hour working day.
15.2. TYPE OF EMPLOYMENT CONTRACT IN 2022A | |||||||||||||||||||||||||||||||||||
Permanent/Full-time | Permanent/Part-time | ||||||||||||||||||||||||||||||||||
Men | Women | Total | Men | Women | Total | ||||||||||||||||||||||||||||||
| Europe | 38,361 | 50.7 | % | 37,371 | 49.3 | % | 75,732 | 783 | 12.8 | % | 5,332 | 87.2 | % | 6,115 | |||||||||||||||||||||
| North America | 19,408 | 45.7 | % | 23,054 | 54.3 | % | 42,462 | 104 | 23.2 | % | 345 | 76.8 | % | 449 | |||||||||||||||||||||
| South America | 33,232 | 46.4 | % | 38,409 | 53.6 | % | 71,641 | 1,074 | 23.5 | % | 3,499 | 76.5 | % | 4,573 | |||||||||||||||||||||
| Group total | 91,001 | 47.9 | % | 98,834 | 52.1 | % | 189,835 | 1,961 | 17.6 | % | 9,176 | 82.4 | % | 11,137 | |||||||||||||||||||||
Temporary/Full-time | Temporary/Part-time | ||||||||||||||||||||||||||||||||||
Men | Women | Total | Men | Women | Total | ||||||||||||||||||||||||||||||
| Europe | 1,608 | 40.4 | % | 2,372 | 59.6 | % | 3,980 | 161 | 42.8 | % | 215 | 57.2 | % | 376 | |||||||||||||||||||||
| North America | 339 | 49.8 | % | 342 | 50.2 | % | 681 | 3 | 60.0 | % | 2 | 40.0 | % | 5 | |||||||||||||||||||||
| South America | 245 | 61.7 | % | 152 | 38.3 | % | 397 | 24 | 47.1 | % | 27 | 52.9 | % | 51 | |||||||||||||||||||||
| Group total | 2,192 | 43.3 | % | 2,866 | 56.7 | % | 5,058 | 188 | 43.5 | % | 244 | 56.5 | % | 432 | |||||||||||||||||||||
A. At year end.
| 16. YEARLY AVERAGE OF CONTRACTS BY GENDER | |||||||||||||||||||||||
| 2023 | 2022 | ||||||||||||||||||||||
Men | Women | Total | Men | Women | Total | ||||||||||||||||||
| Employees with permanent/full-time contract | 95,851 | 104,281 | 200,133 | 88,260 | 97,216 | 185,476 | |||||||||||||||||
| Employees with permanent/part-time contracts | 1,052 | 6,080 | 7,132 | 1,924 | 9,199 | 11,123 | |||||||||||||||||
| Employees with temporary/full-time contracts | 1,516 | 2,310 | 3,826 | 1,921 | 2,545 | 4,466 | |||||||||||||||||
| Employees with temporary/part-time contracts | 179 | 245 | 424 | 176 | 275 | 451 | |||||||||||||||||
| Group total | 98,598 | 112,916 | 211,514 | 92,281 | 109,235 | 201,516 | |||||||||||||||||
77
| 17.1. YEARLY AVERAGE OF CONTRACTS BY AGE BRACKET IN 2023 | ||||||||||||||||||||
aged <= 25 | aged 26-35 | aged 36-45 | aged 46-50 | aged over 50 | Total | |||||||||||||||
| Employees with permanent/full-time contract | 19,753 | 64,064 | 62,171 | 22,962 | 31,183 | 200,133 | ||||||||||||||
| Employees with permanent/part-time contracts | 643 | 1,567 | 2,261 | 793 | 1,867 | 7,132 | ||||||||||||||
| Employees with temporary/full-time contracts | 820 | 1,682 | 854 | 207 | 264 | 3,826 | ||||||||||||||
| Employees with temporary/part-time contracts | 131 | 137 | 84 | 23 | 50 | 424 | ||||||||||||||
| Group total | 21,347 | 67,450 | 65,370 | 23,985 | 33,363 | 211,514 | ||||||||||||||
| 17.2. YEARLY AVERAGE OF CONTRACTS BY AGE BRACKET IN 2022 | ||||||||||||||||||||
| aged <= 25 | aged 26-35 | aged 36-45 | aged 46-50 | aged over 50 | Total | |||||||||||||||
| Employees with permanent/full-time contract | 16,667 | 59,627 | 60,092 | 21,592 | 27,498 | 185,476 | ||||||||||||||
| Employees with permanent/part-time contracts | 3,169 | 2,554 | 2,649 | 904 | 1,847 | 11,123 | ||||||||||||||
| Employees with temporary/full-time contracts | 1,153 | 1,966 | 893 | 208 | 246 | 4,466 | ||||||||||||||
| Employees with temporary/part-time contracts | 150 | 144 | 83 | 16 | 58 | 451 | ||||||||||||||
| Group total | 21,139 | 64,291 | 63,717 | 22,720 | 29,649 | 201,516 | ||||||||||||||
| 18. YEARLY AVERAGE OF CONTRACTS BY ROLE | |||||||||||||||||||||||||||||
| 2023 | 2022 | ||||||||||||||||||||||||||||
| Executives | Managers | Other employees | Total | Executives | Managers | Other employees | Total | ||||||||||||||||||||||
| Employees with permanent/full-time contract | 2,262 | 31,531 | 166,340 | 200,133 | 2,194 | 16,304 | 166,978 | 185,476 | |||||||||||||||||||||
| Employees with permanent/part-time contracts | 6 | 456 | 6,669 | 7,132 | 7 | 163 | 10,953 | 11,123 | |||||||||||||||||||||
| Employees with temporary/full-time contracts | 18 | 382 | 3,426 | 3,826 | 20 | 104 | 4,342 | 4,466 | |||||||||||||||||||||
| Employees with temporary/part-time contracts | 0 | 83 | 341 | 424 | 0 | 17 | 434 | 451 | |||||||||||||||||||||
| Group total | 2,287 | 32,452 | 176,776 | 211,514 | 2,221 | 16,588 | 182,707 | 201,516 | |||||||||||||||||||||
19. EMPLOYEES WORKING IN THEIR HOME COUNTRYA,B | ||||||||||||||||||||||||||
Executives | Other employees | Total | ||||||||||||||||||||||||
| % | 2023 | 2022 | 2023 | 2022 | 2023 | 2022 | ||||||||||||||||||||
| Europe | 90.21 | 88.22 | 91.26 | 94.33 | 91.03 | 94.22 | ||||||||||||||||||||
| North America | 77.73 | 91.29 | 94.15 | 99.69 | 91.70 | 99.63 | ||||||||||||||||||||
| South America | 97.06 | 91.85 | 98.23 | 98.23 | 98.12 | 98.19 | ||||||||||||||||||||
| Group total | 89.20 | 89.32 | 94.68 | 96.92 | 93.81 | 96.84 | ||||||||||||||||||||
A. At year end.
B. We gather the country of birth following local regulations and requirements in most of our units. Employees who preferred not to disclose this information (representing 17.8% of the total, mainly in Poland, the United Kingdom and the United States) are counted as born in the country where they are employed at the end of the year..
20.1 EMPLOYEES WITH DISABILITIES BY REGIONA,B | ||||||||
| % | 2023 | 2022 | ||||||
| Europe | 2.19 | 1.98 | ||||||
| North America | 0.92 | 0.67 | ||||||
| South America | 2.94 | 2.80 | ||||||
| Group total | 2.21 | 1.99 | ||||||
A. At year end.
B. In US and UK, employees with disabilities are counted through self-identification.
20.2. EMPLOYEES WITH DISABILITIESA,B | ||||||||
| Number of employees | 2023 | 2022 | ||||||
| Spain | 570 | 564 | ||||||
| Rest of the Group | 4,131 | 3,550 | ||||||
| Group total | 4,701 | 4,114 | ||||||
A. At year end.
B. In US and UK, employees with disabilities are counted through self-identification.
78
21. HEADCOUNT COVERED BY COLLECTIVE AGREEMENTA | |||||||||||||||||
| 2023 | 2022 | ||||||||||||||||
| Countries | % | Employees | % | Employees | |||||||||||||
| Spain | 99.95 | 35,247 | 99.94 | 34,132 | |||||||||||||
| Brazil | 96.77 | 55,998 | 97.18 | 54,061 | |||||||||||||
| Chile | 100.00 | 9,576 | 99.48 | 9,494 | |||||||||||||
| Poland | 0.00 | 0 | 0.00 | 0 | |||||||||||||
| Argentina | 81.06 | 6,781 | 86.05 | 7,080 | |||||||||||||
| Mexico | 28.24 | 8,823 | 27.64 | 8,122 | |||||||||||||
| Portugal | 88.25 | 4,680 | 90.46 | 4,750 | |||||||||||||
| UK | 99.32 | 24,057 | 96.63 | 22,134 | |||||||||||||
| US | 0.00 | 0 | 0.00 | 0 | |||||||||||||
| Other business units | 37.51 | 5,621 | 45.98 | 6,592 | |||||||||||||
| Total Group | 70.3 | 149,575 | 70.89 | 146,365 | |||||||||||||
A. At year end. Data is broken down according to geographical criteria (2022 data has been updated to this criteria).
22.1. NEW HIRES BY AGE BRACKET IN 2023A | |||||||||||||||||
| % of total | |||||||||||||||||
aged <= 25 | aged 26-35 | aged 36-45 | aged over 45 | aged > 50 | |||||||||||||
| Europe | 25.61 | 40.44 | 20.75 | 6.32 | 6.87 | ||||||||||||
| North America | 29.44 | 44.68 | 16.94 | 4.40 | 4.53 | ||||||||||||
| South America | 32.23 | 42.37 | 18.94 | 3.57 | 2.89 | ||||||||||||
| Group total | 29.79 | 42.40 | 18.95 | 4.50 | 4.35 | ||||||||||||
A.In 2023, the calculation criteria and systems for all geographies have been unified.
22.2. NEW HIRES BY AGE BRACKET IN 2022A | |||||||||||||||||
| % of total | |||||||||||||||||
aged <= 25 | aged 26-35 | aged 36-45 | aged over 45 | aged > 50 | |||||||||||||
| Europe | 31.23 | 39.98 | 19.94 | 4.84 | 4.02 | ||||||||||||
| North America | 34.00 | 40.65 | 16.22 | 4.04 | 5.09 | ||||||||||||
| South America | 41.69 | 38.02 | 15.59 | 2.54 | 2.15 | ||||||||||||
| Group total | 37.01 | 39.20 | 16.88 | 3.52 | 3.39 | ||||||||||||
A. UK categorises all new employee registrations as new hires.
23. NEW HIRES BY GENDERA | |||||||||||||||||||||||
| 2023 | 2022 | ||||||||||||||||||||||
| Men | Women | Total | Men | Women | Total | ||||||||||||||||||
| Europe | 14.66 | % | 12.79 | % | 13.68 | % | 15.10 | % | 13.55 | % | 14.28 | % | |||||||||||
| North America | 26.74 | % | 22.27 | % | 24.31 | % | 30.00 | % | 26.42 | % | 28.05 | % | |||||||||||
| South America | 27.84 | % | 28.29 | % | 28.09 | % | 28.97 | % | 31.02 | % | 30.10 | % | |||||||||||
| Group total | 21.97% | 20.71% | 21.29% | 23.23% | 22.92% | 23.06% | |||||||||||||||||
A. UK categorises all new hires as new hires.
24. DISMISSALSA | |||||||||||||||||||||||||||||||||||||||||
by gender and role | 2023 | 2022 | |||||||||||||||||||||||||||||||||||||||
Men | %B | Women | %B | Total | %B | Men | %B | Women | %B | Total | %B | ||||||||||||||||||||||||||||||
| Senior executives | 57 | 3.58 | % | 18 | 2.63 | % | 75 | 3.28 | % | 58 | 3.55 | % | 17 | 2.51 | % | 75 | 3.24 | % | |||||||||||||||||||||||
Other executivesC | 759 | 4.17 | % | 612 | 4.72 | % | 1,371 | 4.22 | % | 378 | 3.36 | % | 216 | 3.27 | % | 594 | 3.32 | % | |||||||||||||||||||||||
| Other employees | 5,226 | 6.89 | % | 7,497 | 7.77 | % | 12,723 | 7.20 | % | 5,771 | 7.00 | % | 7,837 | 7.55 | % | 13,608 | 7.31 | % | |||||||||||||||||||||||
| Total Group | 6,042 | 6.13 | % | 8,127 | 7.20 | % | 14,169 | 6.70 | % | 6,207 | 6.51 | % | 8,070 | 7.26 | % | 14,277 | 6.92 | % | |||||||||||||||||||||||
79
| by gender and age | 2023 | 2022 | |||||||||||||||||||||
| Men | Women | Total | Men | Women | Total | ||||||||||||||||||
| aged <=25 | 960 | 1,547 | 2,507 | 1,002 | 1,546 | 2,548 | |||||||||||||||||
| aged 26-35 | 2,100 | 2,608 | 4,708 | 2,025 | 2,719 | 4,744 | |||||||||||||||||
| aged 36-45 | 1,609 | 2,308 | 3,917 | 1,539 | 2,229 | 3,768 | |||||||||||||||||
| aged 46-50 | 502 | 619 | 1,121 | 558 | 594 | 1,152 | |||||||||||||||||
| aged >50 | 871 | 1,045 | 1,916 | 1,083 | 982 | 2,065 | |||||||||||||||||
| Total Group | 6,042 | 8,127 | 14,169 | 6,207 | 8,070 | 14,277 | |||||||||||||||||
A. Dismissal: termination of permanent employment determined unilaterally by the company. It includes voluntary resignations in restructuring processes.
B. Ratio of dismissals to the total number of employees in each group.
C. The variation in executives includes the effect of internal reclassification and harmonization of the management levels of employees carried out across Grupo Santander.
25. EXTERNAL TURNOVER RATE BY GENDERA | |||||||||||||||||||||||
| % of total | 2023 | 2022 | |||||||||||||||||||||
| Men | Women | Total | Men | Women | Total | ||||||||||||||||||
| Europe | 9.60 | 10.49 | 10.07 | 10.36 | 10.30 | 10.33 | |||||||||||||||||
| North America | 25.31 | 23.29 | 24.21 | 31.28 | 28.35 | 29.68 | |||||||||||||||||
| South America | 22.88 | 29.37 | 26.41 | 24.68 | 30.89 | 28.09 | |||||||||||||||||
| Group total | 17.69 | 20.40 | 19.14 | 19.90 | 21.93 | 20.99 | |||||||||||||||||
A. Excludes temporary leaves of absence and transfers to other Group companies.
26.1 EXTERNAL TURNOVER RATE BY AGE BRACKETA 2023 | ||||||||||||||||||||
| % of total | ||||||||||||||||||||
| aged <= 25 | aged 26-35 | aged 36-45 | aged 46-50 | aged over 50 | Total | |||||||||||||||
| Europe | 28.31 | 15.38 | 7.30 | 4.57 | 8.45 | 10.07 | ||||||||||||||
| North America | 39.96 | 25.87 | 19.06 | 18.75 | 20.74 | 24.21 | ||||||||||||||
| South America | 51.95 | 25.17 | 20.17 | 16.25 | 18.71 | 26.41 | ||||||||||||||
| Group total | 43.94 | 22.55 | 14.26 | 9.68 | 12.72 | 19.14 | ||||||||||||||
A. Excludes temporary leaves of absence and transfers to other Group companies.
80
26.2. EXTERNAL TURNOVER RATE BY AGE BRACKETA 2022 | ||||||||||||||||||||
| % of total | ||||||||||||||||||||
| aged <= 25 | aged 26-35 | aged 36-45 | aged 46-50 | aged over 50 | Total | |||||||||||||||
| Europe | 31.10 | 16.62 | 6.96 | 4.27 | 8.29 | 10.33 | ||||||||||||||
| North America | 60.66 | 30.29 | 21.09 | 20.04 | 23.38 | 29.68 | ||||||||||||||
| South America | 51.78 | 27.80 | 20.06 | 16.65 | 22.76 | 28.09 | ||||||||||||||
| Group total | 49.29 | 25.21 | 14.20 | 9.77 | 14.00 | 20.99 | ||||||||||||||
A. Excludes temporary leaves of absence and transfers to other Group companies.
27. REMUNERATION BY ROLE, GENDER AND REGIONA | |||||||||||||||||||||||||||||
Senior executivesB | Other executives | ||||||||||||||||||||||||||||
| Men | Women | GPG ratio (Median)C | GPG-SAB ratio (Median)D | Men | Women | GPG ratio (Median)C | GPG-SAB ratio (Median)D | ||||||||||||||||||||||
| Europe | 498,350 | 348,263 | 18.8 | % | 13.3 | % | 147,649 | 108,662 | 15.1 | % | 15.1 | % | |||||||||||||||||
| North America | 796,406 | 576,925 | 29.0 | % | 13.7 | % | 150,795 | 97,475 | 29.3 | % | 30.5 | % | |||||||||||||||||
| South America | 584,353 | 325,287 | 35.6 | % | 20.0 | % | 158,856 | 134,045 | 12.7 | % | 9.9 | % | |||||||||||||||||
| Group total | 550,670 | 368,162 | 28.0 | % | 17.9 | % | 150,169 | 108,384 | 20.0 | % | 18.8 | % | |||||||||||||||||
| 2023 average remuneration | 493,914 | 134,691 | |||||||||||||||||||||
| 2022 average remuneration | 469,180 | 132,943 | |||||||||||||||||||||
| Variation 2023 vs. 2022 (%) | 5.3% | 1.3% | |||||||||||||||||||||
| Other employees | Total | ||||||||||||||||||||||||||||||||||
Men | Women | Ratio GPG (Median)C | GPG-SAB ratio (Median)D | Men | Women | Ratio GPG (Median)C | GPG-SAB ratio (Median)D | Total employees | |||||||||||||||||||||||||||
| Europe | 54,880 | 43,839 | 17.9 | % | 16.3 | % | 80,843 | 52,404 | 22.4 | % | 19.8 | % | 65,983 | ||||||||||||||||||||||
| North America | 51,546 | 36,278 | 19.8 | % | 22.6 | % | 74,118 | 43,176 | 30.2 | % | 28.0 | % | 57,110 | ||||||||||||||||||||||
| South America | 30,464 | 22,611 | 21.8 | % | 24.5 | % | 40,607 | 25,735 | 25.9 | % | 29.1 | % | 32,666 | ||||||||||||||||||||||
| Group total | 44,223 | 33,846 | 23.3 | % | 22.4 | % | 64,318 | 40,310 | 27.8 | % | 29.0 | % | 51,535 | ||||||||||||||||||||||
| 2023 average remuneration | 38,516 | 64,318 | 40,310 | 27.8 | % | 29.0 | % | 51,535 | |||||||||||||||||||||||||||
| 2022 average remuneration | 38,276 | 60,793 | 37,606 | 30.2 | % | 29.8 | % | 48,232 | |||||||||||||||||||||||||||
| Variation 2023 vs 2022 (%) | 0.6% | 5.8 | % | 7.2 | % | (7.8 | %) | (2.6 | %) | 6.8 | % | ||||||||||||||||||||||||
| By age bracket | ||||||||||||||||||||
aged <= 25 | aged 26-35 | aged 36-45 | aged 46-50 | aged over 50 | Total | |||||||||||||||
| 2023 average remuneration | 14,792 | 29,882 | 51,887 | 70,415 | 79,958 | 51,535 | ||||||||||||||
| 2022 average remuneration | 14,060 | 27,551 | 48,002 | 65,336 | 74,744 | 48,232 | ||||||||||||||
| Variation 2023 vs 2022 (%) | 5.2 | % | 8.5 | % | 8.1 | % | 7.8 | % | 7.0 | % | 6.8 | % | ||||||||
A. The average total remuneration of employees includes annual base salary, pensions and variable remuneration paid in the year.
B. Includes Group Sr. Executive VP. Executive VP and VP.
C. GPG Ratio (median) includes annual base salary and variable remuneration paid in the year.Gender Pay Gap has decreased for 2nd consecutive year and it becomes the lowest historical data.
D. GPG Ratio - ABS (median) includes annual base salary paid in the year.
| 28.1 AVERAGE REMUNERATION OF SENIOR MANAGEMENT (with variable remuneration not linked to long-term objectives) | |||||||||||||||||||||||
| Thousand euros | 2023 | 2022 | |||||||||||||||||||||
Men | Women | Total | Men | Women | Total | ||||||||||||||||||
Executive directors | 8,257 | 11,544 | 9,900 | 9,086 | 11,001 | 10,044 | |||||||||||||||||
Non-executive directors | 368 | 327 | 352 | 285 | 304 | 292 | |||||||||||||||||
Senior management | 4,112 | 1,645 | 3,583 | 4,365 | 1,574 | 3,767 | |||||||||||||||||
81
| 28.2 AVERAGE VARIABLE REMUNERATION OF SENIOR MANAGEMENT LINKED TO LONG-TERM OBJECTIVES (fair value) | |||||||||||||||||||||||
| Thousand euros | 2023 | 2022 | |||||||||||||||||||||
Men | Women | Total | Men | Women | Total | ||||||||||||||||||
Executive directors | 1,537 | 2,243 | 1,890 | 1,436 | 2,128 | 1,782 | |||||||||||||||||
Senior managementA | 563 | 189 | 483 | 597 | 191 | 510 | |||||||||||||||||
A. Additionally, in 2023, one senior executive received EUR 200,000 of the Digital Transformation award from PagoNxt S.L. In 2022, one senior executive also received EUR 500,000 of the Digital Transformation award from PagoNxt S.L.
| 28.3 SENIOR MANAGEMENT COMPOSITION | |||||||||||||||||||||||
| Number | 2023 | 2022 | |||||||||||||||||||||
Men | Women | Total | Men | Women | Total | ||||||||||||||||||
Executive directors | 1 | 1 | 2 | 1 | 1 | 2 | |||||||||||||||||
Non-executive directors | 8 | 5 | 13 | 8 | 5 | 13 | |||||||||||||||||
Senior management | 11 | 3 | 14 | 11 | 3 | 14 | |||||||||||||||||
29.1 RATIO OF THE BANK’S MINIMUM ANNUAL SALARY TO THE LEGAL MINIMUM ANNUAL SALARY BY COUNTRY AND GENDER, 2023A | |||||||||||
| % Legal minimum wage | |||||||||||
| Men | Women | % legal minimum wage | |||||||||
| Argentina | 315 | % | 315 | % | 315 | % | |||||
| Brazil | 121 | % | 121 | % | 121 | % | |||||
| Chile | 213 | % | 213 | % | 213 | % | |||||
| US | 276 | % | 276 | % | 276 | % | |||||
| Spain | 141 | % | 141 | % | 141 | % | |||||
| Mexico | 100 | % | 100 | % | 100 | % | |||||
| Poland | 101 | % | 101 | % | 101 | % | |||||
| Portugal | 184 | % | 184 | % | 184 | % | |||||
UKB | 112 | % | 112 | % | 112 | % | |||||
A.The lowest salary paid by the companies in the country over the minimum legal salary of the country.
B.From 2023 for the UK, the legal minimum wage is considered to be that for employees over 23, which is higher than the +18 and apprentices considered in 2022.
29.2 RATIO OF THE BANK’S MINIMUM ANNUAL SALARY TO THE LEGAL MINIMUM ANNUAL SALARY BY COUNTRY AND GENDER, 2022A,B | |||||||||||
| % Legal minimum wage | |||||||||||
| Men | Women | % Legal minimum wage | |||||||||
| Germany | 191 | % | 191 | % | 191 | % | |||||
| Argentina | 377 | % | 377 | % | 377 | % | |||||
| Brazil | 241 | % | 241 | % | 241 | % | |||||
| Chile | 160 | % | 140 | % | 150 | % | |||||
| US | 234 | % | 232 | % | 233 | % | |||||
| Spain | 154 | % | 150 | % | 152 | % | |||||
| Mexico | 145 | % | 145 | % | 145 | % | |||||
| Poland | 100 | % | 100 | % | 100 | % | |||||
| Portugal | 170 | % | 170 | % | 170 | % | |||||
| UK | 223 | % | 223 | % | 223 | % | |||||
A.The lowest salary paid by the companies in the country over the minimum legal salary of the country.
B.In 2022 only the employees of Banco Santander Brazil, Banco Santander Chile and Banco Santander Mexico were taken into account; and from 2023 we have also compared the employees of the other companies in these three countries.
82
| 30. TRAINING | ||||||||
| 2023 | 2022 | |||||||
Total hours of training | 6,067,569 | 6,884,251 | ||||||
% employees trainedA | 89.48 | 100.00 | ||||||
Total attendees | 6,775,921 | 5,748,422 | ||||||
Hours of training per employeeB | 28.69 | 33.34 | ||||||
Total investment in trainingC | 60,162,751 | 71,630,151 | ||||||
Investment per employee | 284.44 | 346.94 | ||||||
Cost per hour | 9.92 | 10.40 | ||||||
% women participants | 50.42 | 55.18 | ||||||
Employee satisfaction (up to 10) | 8.93 | 9.81 | ||||||
A. Calculation based on year-end headcount.
B. Calculation based on average headcount for the year.
C. The decrease in investment in training is due to Banco Santander's efforts to optimise the resources invested by increasing e-learning training.
| 31. HOURS OF TRAINING BY CATEGORY | |||||||||||||||||
| 2023 | 2022 | ||||||||||||||||
Hours | Average | Hours | Average | ||||||||||||||
Senior executives | 77,889 | 34.06 | 87,353 | 37.78 | |||||||||||||
Other executives | 857,455 | 26.42 | 493,474 | 27.61 | |||||||||||||
Other employees | 5,132,225 | 29.03 | 6,303,424 | 33.84 | |||||||||||||
Group total | 6,067,569 | 28.69 | 6,884,251 | 33.34 | |||||||||||||
| 32. HOURS OF TRAINING BY GENDER | ||||||||
| 2023 | 2022 | |||||||
Average | Average | |||||||
Men | 29.6 | 33.15 | ||||||
Women | 27.88 | 33.51 | ||||||
| Group total | 28.69 | 33.34 | ||||||
33. ABSENTEEISM BY GENDER AND REGIONA,B | |||||||||||||||||||||||
| 2023 | 2022 | ||||||||||||||||||||||
Men | Women | Total | Men | Women | Total | ||||||||||||||||||
| Europe | 2.13 | 4.55 | 3.39 | 2.68 | 5.36 | 4.11 | |||||||||||||||||
| North America | 0.84 | 1.66 | 1.28 | 0.95 | 2.05 | 1.55 | |||||||||||||||||
South AmericaC | 2.18 | 5.29 | 3.87 | 1.45 | 3.14 | 2.34 | |||||||||||||||||
| Group total | 1.89 | 4.22 | 3.13 | 1.80 | 3.73 | 2.83 | |||||||||||||||||
A..Days missed due to occupational accidents. non-work related illness and non-work related accident for every 100 days worked.
B. Santander Brasil only considers accidents recognized as work-related and reported in a comunicação de acidente de trabalho (CAT, work-related accident notice) to Brazil's Instituto Nacional do Seguro Social (INSS, National Social Security Institute) following an internal expert review in 2023. This indicator only considers absences of at least 15 days due to accidents or common illness.
C. Criteria, processes and systems have been harmonized to homogenize the calculation of medical absences and non-occupational accidents in all countries.
D. In 2023, 16.9 million equivalent hours of absenteeism due to common illness and non-occupational accidents, counted in calendar days from the day of onset to the reinstatement of the medical leave, a criterion that will be applied from 2023. In 2022, there were 9.8 million hours counted in working days.
34. ACCIDENT RATEA,B | |||||||||||||||||||||||
| % | 2023 | 2022 | |||||||||||||||||||||
Men | Women | Total | Men | Women | Total | ||||||||||||||||||
| Europe | 0.02 | 0.09 | 0.06 | 0.04 | 0.12 | 0.08 | |||||||||||||||||
| North America | 0.03 | 0.03 | 0.03 | 0.01 | 0.04 | 0.02 | |||||||||||||||||
| South America | 0.01 | 0.00 | 0.00 | 0.02 | 0.03 | 0.02 | |||||||||||||||||
| Group total | 0.02 | 0.04 | 0.03 | 0.02 | 0.06 | 0.05 | |||||||||||||||||
A. Ratio of hours missed due to an occupational accident involving leave to total hours worked. Hours worked are theoretical and include commute-related accidents.
B. Santander Brasil only considers accidents recognized as work-related and reported in a comunicação de acidente de trabalho (CAT, work-related accident notice) to Brazil's Instituto Nacional do Seguro Social (INSS, National Social Security Institute) following an internal expert review in 2023. This indicator only considers accidents of at least 15 days.
83
35. OCCUPATIONAL HEALTH AND SAFETYA,B | |||||||||||||||||||||||
| 2023 | 2022 | ||||||||||||||||||||||
| Men | Women | Total | Men | Women | Total | ||||||||||||||||||
Frequency rateC | 1 | 1 | 1 | 1 | 2 | 1 | |||||||||||||||||
Severity rateD | 0.03 | 0.06 | 0.04 | 0.04 | 0.09 | 0.06 | |||||||||||||||||
No. of fatal occupational accidents | 0 | 0 | 0 | 1 | 0 | 1 | |||||||||||||||||
Work-related illnessE | 3 | 12 | 15 | 0 | 0 | 0 | |||||||||||||||||
Total number of accidentsF | 128 | 271 | 399 | 239 | 477 | 716 | |||||||||||||||||
A. Occupational injuries that can be documented are reported, without exception for serious injuries. There have been no significant changes in occupational health and safety trends, apart from natural evolution and prevention actions. Criteria, processes and systems have been harmonized to homogenize the calculation of medical absences and non-occupational accidents in all countries, with global criteria.
B. Santander Brasil only considers accidents recognized as work-related and reported in a comunicação de acidente de trabalho (CAT, work-related accident notice) to Brazil's Instituto Nacional do Seguro Social (INSS, National Social Security Institute) following an internal expert review in 2023. This indicator only considers accidents of at least 15 days.
C. Number of occupational accidents with leave for every 1,000,000 hours worked. Hours worked are theoretical and include commute-related accidents.
D. Days not worked due to work accident with leave for every 1,000 hours worked. Hours worked are theoretical. Commute-related accidents are included.
E. Starting in 2023 it’s been reported globally, following the local regulation for occupational illnesses where they are regulated country-wide or for specific jobs.
F. Refers to occupational accidents with sick leave and includes commute-related accidents.
8.6 Green transition
GRI 301-1, 302-1, 302-2, 302-3, 303-5, 305-1, 305-2, 305-3, 305-4, 305-5, 306-3, 306-4, 306-5, FS8, FS11
36. Green financeA | ||||||||||||||
| EUR bn | 2023 | 2022 | 2021 | 2020 | ||||||||||
Raised and facilitated | 20.2 | 28.8 | 31.9 | 14.8 | ||||||||||
Accumulated since 2019 | 114.6 | 94.5 | 65.7 | 33.8 | ||||||||||
A. From January to September 2023, CIB contributed EUR 20.2 billion to the green finance target. According to Dealogic, Infralogic, TXF and Mergermarket league tables. This refers to all roles undertaken by Banco Santander in the same project. It does not include financial inclusion and entrepreneurship. Green Finance raised and facilitated is not a synonym of EU Taxonomy. This information will be updated to year end in the next Climate Finance Report. Preliminary figures as final league tables were not yet available at editorial close.
37. Financed emissions for alignmentA | |||||||||||||||||||||||
| Sector | YearB | Exposure (drawn amount €bn) | Emissions scope | Absolute emissions (mtCO2e) | Physical emissions intensity | Financial emissions intensity (mtCO2e/EUR bn lent) | Overall PCAF scoreC | ||||||||||||||||
| Power generation | 2020 | 10.31 | 1 | 4.59 | 0.17 tCO2e/MWh | 0.45 | 2.5 | ||||||||||||||||
| 2021 | 10.23 | 4.24 | 0.19 tCO2e/MWh | 0.41 | 2.8 | ||||||||||||||||||
| Energy (Oil & Gas) | 2020 | 6.67 | 1 + 2 + 3D | 22.58 | 73.60 tCO2e/TJ | 3.38 | 3.6 | ||||||||||||||||
| 2021 | 8.25 | 27.43 | 74.36 tCO2e/TJ | 3.33 | 3.9 | ||||||||||||||||||
| Aviation | 2020 | 2.44 | 1 + 2 | 1.08 | 93.05 grCO2e/RPK | 0.44 | 3.7 | ||||||||||||||||
| 2021 | 2.02 | 0.84 | 97.21 grCO2e/RPK | 0.42 | 3.2 | ||||||||||||||||||
| Steel | 2020 | 1.31 | 1 + 2 | 2.14 | 1.40 tCO2e/tS | 1.63 | 3.1 | ||||||||||||||||
| 2021 | 1.42 | 1.90 | 1.36 tCO2e/tS | 1.33 | 3.1 | ||||||||||||||||||
| Auto - manufacturing | 2020 | 4.45 | 3D | 3.49 | 149 gCO2/vkm | 0.79 | 3.1 | ||||||||||||||||
| 2021 | 3.90 | 2.67 | 138 gCO2/vkm | 0.68 | 3.0 | ||||||||||||||||||
AgroE | 2022 | 1.80 | 1 + 2 | 6.20 | N/A | 3.52 | 3.3 | ||||||||||||||||
Auto - lendingF | 2022 | 55.27 | 1 + 2 | 5.84 | 137 gCO2e/vkm | 0.11 | 3.2 | ||||||||||||||||
MortgagesG | 2022 | 211.05 | 1 + 2 | 2.63 | 39.72 kgCO2e/m2 | 0.01 | 3.3 | ||||||||||||||||
A. In the case of corporate business loans, Banco Santander calculates the Total Value of the Company (used to obtain the emissions attribution factor) by adding the total equity and debt of the company in order to avoid the high volatility in market capitalization.
B. Obtaining emissions data from our customers is a challenge. As they disclose more non-financial information worldwide, the quality of our reporting on finance emissions will improve. In some other retail sectors, we rely on availability of emissions information for the different asset types as well as business information.
C. Scores illustrate the data quality used to calculate the financed emissions (with 1 being the best). Financed emissions information comes from a wide range of sources for emissions, physical intensity, and production data. For CIB portfolios CDP is the main source for GHG emissions and Trucost for production, we also used Asset Impact and Annual Reports as secondary sources to cover information gaps. We rely on Transition Pathway Initiative to measure physical intensity for certain sectors, such as Autos, O&G and Steel. In other retail sectors, we rely on the good quality of business information but also on data suppliers to improve and expand their emission databases.
D. Scope 3 - category 11: use of sold products.
E. Agriculture portfolio in Brazil. Considering different commodities (such as soy, corn, rice, sugarcane, cotton, and coffee, measured in tons) and meat and dairy products (measured per head of cattle), in addition to the land use change (measured in hectares), currently not consolidated into a single physical emission intensity. Since there is no specific methodology for agriculture, PCAF score was adapted considering the data available in primary production portfolio that made possible to measure land management emissions. Data as of March 2022.
F. Consumer lending for the acquisition of passenger cars, covering a significant majority of the exposure in Europe.
G. Mortgages portfolio in the United Kingdom. Assessment includes Scope 1 and 2 emissions based on actual (where available) and modelled EPC's.
From our total lending on the balance sheet, about 8.0% of our exposure are from sectors for which Santander published emissions decarbonization targets for high-emitting sectors (power generation, energy (oil and gas), aviation, steel, auto manufacturing and auto lending) and around 17.8% of total SCIB lending. Using baselines exposures with different time horizons as per above table, and balance sheet exposures as of December 2022.
84
38. ENVIRONMENTAL FOOTPRINT 2022-2023A
| 2023 | 2022 | Var. 2023-2022 (%) | |||||||||
Consumption | |||||||||||
Water (m3)B | 1,858,645 | 1,887,857 | -1.5 | ||||||||
Water (m3/employee) | 9.56 | 9.75 | -1.9 | ||||||||
Normal electricity (millions of kwh) | 25.63 | 97.42 | -73.7 | ||||||||
Green electricity (millions of kwh) | 779.68 | 745.82 | 4.5 | ||||||||
Total electricity (millions of kwh) | 805.31 | 843.24 | -4.5 | ||||||||
Total internal energy consumption (GJ) | 3,444,543 | 3,431,272 | 0.4 | ||||||||
Total internal energy consumption per employee (GJ/employee) | 17.72 | 17.73 | 0.0 | ||||||||
Total paper (t)C | 4,932 | 5,849 | -15.7 | ||||||||
Recycled or certified paper (t)C | 4,417 | 4,860 | -9.1 | ||||||||
Total paper per employee (t/employee)C | 0.025 | 0.030 | -15.9 | ||||||||
Waste | |||||||||||
Paper and cardboard waste (kg)C | 3,787,667 | 4,123,740 | -8.1 | ||||||||
Paper and cardboard waste per employee (kg/employee)C | 19.49 | 21.30 | -8.5 | ||||||||
Greenhouse gas emissionsH | |||||||||||
Direct emissions (t CO2e)D | 25,755 | 21,967 | 17.2 | ||||||||
Indirect electricity emissions and other (t CO2e)-market basedE,F | 21,516 | 30,917 | -30.4 | ||||||||
Indirect electricity emissions and other (t CO2e)-location basedE,F | 205,292 | 217,906 | -5.8 | ||||||||
Indirect emissions from displacement of employees (t CO2e)G | 125,441 | 81,535 | 53.8 | ||||||||
Total emissions (t CO2 e)- market based | 172,711 | 134,419 | 28.5 | ||||||||
Total emissions per employee(t CO2e/employee) | 0.89 | 0.69 | 28.0 | ||||||||
A. For 2023 information is included for more than 96% of the employees in the main countries of operation: Germany, Argentina, Brazil, Chile, Spain, Mexico, Poland, Portugal, United Kingdom and the United States; the data consolidation approach is based on operational control of GHG Protocol, where we have full authority to introduce and implement Group's operational policies.
B. Santander consumes water exclusively from public water supply networks.
C. The reduction in paper consumption and paper waste continues the downward trend of recent years, in line with the digitalization of the Group and society.
D. These emissions are from direct energy consumption: natural gas, diesel and fleet fuel consumption where applicable (Mexico, Brazil, Chile and Poland this year), and correspond to Scope 1, as defined by the GHG Protocol standard. To calculate these emissions, emission factors DEFRA 2023 for fiscal year 2023 and DEFRA 2022 for fiscal year 2022 have been applied. The increase in Scope 1 is due to the increase in the vehicle fleet and the higher commercial activity post-pandemic. On the other hand, the consumption of natural gas and diesel continues the downward trend of recent years.
E. These emissions include those derived from electricity consumption and correspond to scope 2 as defined by the GHG Protocol standard. For 2023, they have been calculated with the International Energy Agency (IEA) 2023 emission factors. For 2022, the 2021 IEA emission factors were used.
Indirect electricity emissions - market-based: for the calculation of these emissions, it has been taken into account that the countries of Germany, Spain, Mexico, Brazil, Chile, Portugal and the UK consume 100% electricity from renewable sources, and for Argentina, Poland and USA this percentage is 79.7%. For the remaining non-renewable electricity consumed, the IEA emission factor for each country has been applied.
Indirect electricity - location-based emissions: the IEA emission factor corresponding to each country has been applied for all purchased electricity consumed, regardless of its source of origin (renewable or non-renewable).
These emissions also include district heating consumption of buildings in Poland. The emission factor used is the 2022 factor from the URE - Urząd Regulacji Energetyki (ure.gov.pl).
F. The reduction in indirect electricity emissions is due to the increase in the purchase of electricity from renewable sources, self-production in our own buildings with solar panels (5.8 million of kWh of auto produced in 2023) and energy efficiency measures.
G. These emissions include emissions from employee commuting in each country (networks and central services) by individual car, company car and/or public transport (75,380 t CO2e in 2023), and from employee business travel by plane, train and/or car (50,061 t CO2e in 2023). The distribution of employees by type of travel is based on surveys, statistics or reasonable estimates. For the calculation of emissions from employee commuting, the conversion factors DEFRA 2023 for fiscal year 2023 and DEFRA 2022 for fiscal year 2022 have been applied. For the conversion of aviation kms, the DEFRA 2023 factors that include the direct effects of CO2, CH4 and N2O have been used in 2023, aligned with market practice. In 2022 indirect impacts were included. Emissions derived from the use of courier services are not included, nor those derived from the transport of funds, nor those from any other purchase of products or services, nor those indirectly motivated by the financial services provided.
H. Group's total emissions increased in 2023, mainly due to the return of employees to branches after the lifting of restrictions and the recovery of business travel and the improvement of the group's operational control procedures in the countries.
85
8.7 Equator principles
GRI 411-1, 413-2, FS10, FS11
39. Equator Principles | |||||||||||||||||||||||||||||||||||
| Number of projects | Project Finance | Project Related Corporate Loans | Project-Related Refinance and Project-Related Acquisition for Project Finance | ||||||||||||||||||||||||||||||||
| Category | A | B | C | A | B | C | A | B | C | ||||||||||||||||||||||||||
TOTAL | 8 | 24 | 4 | 4 | 0 | 1 | 0 | 0 | 0 | ||||||||||||||||||||||||||
 Sector Sector | |||||||||||||||||||||||||||||||||||
| Mining | 0 | 0 | 0 | 0 | 0 | 0 | 0 | 0 | 0 | ||||||||||||||||||||||||||
| Infrastructure | 2 | 2 | 0 | 0 | 0 | 0 | 0 | 0 | 0 | ||||||||||||||||||||||||||
| Oil & Gas | 3 | 1 | 0 | 1 | 0 | 0 | 0 | 0 | 0 | ||||||||||||||||||||||||||
| Power | 1 | 19 | 4 | 0 | 0 | 0 | 0 | 0 | 0 | ||||||||||||||||||||||||||
| Others | 2 | 2 | 0 | 3 | 0 | 1 | 0 | 0 | 0 | ||||||||||||||||||||||||||
 Region Region | |||||||||||||||||||||||||||||||||||
Americas | 4 | 3 | 2 | 0 | 0 | 1 | 0 | 0 | 0 | ||||||||||||||||||||||||||
Europe, Middle East & Africa | 4 | 21 | 2 | 2 | 0 | 0 | 0 | 0 | 0 | ||||||||||||||||||||||||||
| Asia pacific | 0 | 0 | 0 | 2 | 0 | 0 | 0 | 0 | 0 | ||||||||||||||||||||||||||
 Type Type | |||||||||||||||||||||||||||||||||||
Designated countriesA | 5 | 22 | 4 | 0 | 0 | 0 | 0 | 0 | 0 | ||||||||||||||||||||||||||
Non-designated countries | 3 | 2 | 0 | 4 | 0 | 1 | 0 | 0 | 0 | ||||||||||||||||||||||||||
 Independent review Independent review | |||||||||||||||||||||||||||||||||||
Yes | 8 | 24 | 4 | 4 | 0 | 1 | 0 | 0 | 0 | ||||||||||||||||||||||||||
No | 0 | 0 | 0 | 0 | 0 | 0 | 0 | 0 | 0 | ||||||||||||||||||||||||||
A. In accordance with the definition of designated countries included in the Equator Principles, with solid environmental and sociaI governance, legislation and institutions to protect their inhabitants and the environment.
Category A – Projects with potential significant adverse environmental and social risks and/or impacts that are diverse, irreversible or unprecedented;
Category B – Projects with potential limited adverse environmental and social risks and/or impacts that are few in number, generally site-specific, largely reversible and readily addressed through mitigation measures2; and
Category C – Projects with minimal or no adverse environmental and social risks and/or impacts.
86
8.8 Country by country report (according to GRI 207-4)
GRI 207-4
According GRI 207-4 TAX, a report of financial, economic and tax-related information is required for each country where Santander operates. Profit/loss before tax, corporate income tax paid in cash, and the calculation of the number of employees are already included in Appendix VI of the consolidated financial statements (Annual Banking Report):
| Table 40. Country by country report (according to GRI 207-4). | ||||||||||||||
| EUR million | ||||||||||||||
| 2023 | ||||||||||||||
| Jurisdiction | Revenue from third-party salesA | Revenue from intra-group transactions with other tax jurisdictionsA | Tangible assets other than cash and cash equivalentsB | Corporate income tax accrued on profit/lossC | ||||||||||
| Germany | 1,635 | -97 | 3,675 | 76 | ||||||||||
| Argentina | 1,643 | -67 | 449 | 235 | ||||||||||
| Australia | 6 | 0 | 2 | 0 | ||||||||||
| Austria | 238 | -20 | 14 | 18 | ||||||||||
| Bahamas | 36 | 9 | 1 | 0 | ||||||||||
| Belgium | 70 | 51 | 66 | 7 | ||||||||||
BrazilD | 12,568 | -137 | 1,731 | 1,353 | ||||||||||
| Canada | 90 | -16 | 1 | 3 | ||||||||||
| Chile | 2,241 | 4 | 521 | 289 | ||||||||||
| China | 13 | 16 | 2 | 0 | ||||||||||
| Colombia | 89 | 4 | 2 | 1 | ||||||||||
| United Arab Emirates | 4 | 4 | 1 | 0 | ||||||||||
SpainE | 8,565 | 1,986 | 10,806 | 378 | ||||||||||
| United States | 7,335 | -272 | 13,550 | 479 | ||||||||||
| Denmark | 219 | -4 | 143 | 26 | ||||||||||
| Finland | 122 | -21 | 39 | 10 | ||||||||||
| France | 1,158 | -236 | 90 | 31 | ||||||||||
| Greece | 14 | -5 | 1 | 0 | ||||||||||
| Hong Kong | 175 | -57 | 8 | 5 | ||||||||||
| India | 0 | 2 | 0 | 0 | ||||||||||
| Ireland | 2 | 18 | 824 | 3 | ||||||||||
| Isle of Man | -78 | 128 | 10 | 3 | ||||||||||
| Italy | 850 | -269 | 93 | 52 | ||||||||||
| Jersey | -39 | 72 | 11 | 1 | ||||||||||
| Luxembourg | 460 | 72 | 0 | 216 | ||||||||||
| Mexico | 5,991 | -51 | 1,962 | 737 | ||||||||||
| Norway | 344 | -101 | 8 | -7 | ||||||||||
| Netherlands | 138 | 25 | 119 | 98 | ||||||||||
| Peru | 202 | -6 | 5 | 21 | ||||||||||
| Poland | 3,584 | 18 | 268 | 390 | ||||||||||
| Portugal | 2,113 | -55 | 461 | 399 | ||||||||||
| United Kingdom | 6,623 | -9 | 1,917 | 685 | ||||||||||
| Romania | 5 | 0 | 0 | 0 | ||||||||||
| Singapore | 45 | -25 | 1 | 1 | ||||||||||
| Sweden | 187 | -33 | 2 | -3 | ||||||||||
| Switzerland | 174 | -9 | 66 | 10 | ||||||||||
| Uruguay | 601 | -8 | 53 | 51 | ||||||||||
| Consolidated group total | 57,423 | 911 | 36,902 | 5,568 | ||||||||||
A.Revenue from intra-group transactions with other tax jurisdictions includes interest income; interest expenses; commission income and expenses for transactions between Santander companies whose residence is in different tax jurisdictions; and intra-group income, excluded from total income in the consolidated income statement because counterparty expense is recorded under another item of the consolidated income statement not included in total income.
B.Tangible assets: Composed of tangible assets, non-current assets held for sale and inventories.
C.The accrued corporate income tax is a current-year expense and does not include deferred taxes.
D.Including the information about a branch in the Cayman Islands with EUR 194 million in accrued corporate income tax.
E.Includes Corporate Centre.
87
Corporate income tax accrued on profit/loss and the tax due if the statutory tax rate is applied to profit/loss before tax are different mainly because of tax calculation standards, which establish temporary or permanent restrictions on the deduction of expenses, exemptions, deductions and other adjustments that cause the tax and accounting result to differ.
Some adjustments to the taxable income in the Group’s relevant jurisdictions are:
•the monetary correction in Chile and Mexico;
•the hyperinflation adjustments in Argentina;
•the deduction of juros and taxes on margins in Brazil;
•and permanent adjustments in Poland and other jurisdictions due to non-deductible expenses (like Bank Levy) or recognized provisions.
88
9. Further information
9.1 Stakeholder engagement
GRI 2-29, 3-3, FS5
9.1.1 Listening to our stakeholders and creating value
We run surveys and speak-up channels for employees and customers. We assess externalities to identify risks and opportunities and to appraise our impact on the community. We respond to demands from analysts, investors and ratings and NGOs; keep pace with new regulation and best practices worldwide; and take part in consultations with authorities, trade bodies and other organizations that influence policymaking on sustainable development.
We’re also involved in major local and international initiatives to support inclusive and sustainable growth.
Regarding the relationship with our shareholders, Banco Santander’s priority is to maximize value for, and retain the trust and loyalty of our 3.7 million shareholders worldwide. Our Shareholder and Investor Relations team works to uphold shareholders’ rights, ensure we are transparent, strengthen shareholder relations, foster fluid dialogue, promote shareholder involvement in the bank’s business, and facilitate their engagement with top management
| For more details, see section 1. 'Economy, regulation and competition'' in the 'Economic and financial review' chapter. | ||||
| For more details, see sections 2.1 'Share capital', 2.6 'Stock market information', 3.1 'Shareholder communication and engagement' and 3.3 'Dividends and shareholder remuneration' in the Corporate Governance chapter. | ||||
Key dialogue channels for stakeholders
People  | 91% aggregated participation in Your voice SurveyA | 3,611 complaints received through ethical channels | ||||||||||||||||||||||||
Customers | +9 million customer satisfaction surveys | 453,224 complaints received | ||||||||||||||||||||||||
Shareholders | 9,120 responses from retail shareholders on their perception of Santander as a bank that is Simple, Personal and Fair | 239,238 responses from retail shareholders and institutional investors in quality studies and surveysC | 206 events with retail shareholders | 930 contacts with institutional investors (47 on ESG matters) | ||||||||||||||||||||||
Communities | 1,238 partner universities and institutionsB | +400 social media profiles +30 million followers | ||||||||||||||||||||||||
A.169,590 employees participated in the survey out of the total base of employees eligible to participate in the survey, i.e. who met some criteria such as not being on leave, working in the company for at least 3 months, etc.
B.This figure includes universities that have an agreement with Santander Universities, Universia and Fundación Universia´s in 26 countries. Taking Santander Universities alone, the figure is 904 universities and academic institutions in 12 countries.
C.Includes 9,120 retail shareholder responses received through the Santander perception survey as Simple, Personal and Fair.
89
9.1.2 Helping society tackle global challenges: 2030 agenda
Our activity contributes to several United Nations' Sustainable Development Goals and to the Paris Agreement.
We analysed our agenda’s contribution to the SDGs and determined the most relevant goals to Banco Santander’s business, commitments and strategy.
For more details, see the ´Banco Santander and the SDGs´ brochure on our corporate website.

| The SDGs on which Banco Santander has the greatest impact | Other SDGs on which Banco Santander also has an impact | ||||||||||||||||||||||
 | SDG 8. Decent Work and Economic Growth We guarantee the best employee experience and an inclusive workplace. Our financial inclusion and community support programmes help entrepreneurs create businesses and jobs; and strength local economies. |  | SDG 1. No Poverty We want to reduce poverty and boost wealth and well-being in the countries where we operate. Our financial inclusion products and services and our community investment programmes empower millions each year. |  | SDG 4. Quality Education Our pioneering Santander Universities programme promotes education, entrepreneurship and employment so universities and students can prosper. Also, Santander Scholarships is one of the world's largest private education grant funds. | ||||||||||||||||||
 | SDG 13. Climate Action We tackle climate change with the ambition to be net zero by 2050, helping our customers transition to a sustainable economy and reducing our own carbon footprint and environmental impact. |  | SDG 5. Gender Equality We promote an inclusive and diverse workplace, ensuring equal opportunity as a strategic priority. We also run initiatives to drive diversity. |  | SDG 7. Affordable and Clean Energy We're the global leader in renewable energy financing, and finance energy efficiency projects; low-emission, electric and hybrid vehicles; and other cleaner transport solutions. | ||||||||||||||||||
 | SDG 16. Peace, Justice, and Strong Institutions We promote transparency, the fight against corruption and robust governance across our organization. Our policies and codes of conduct regulate our business and behaviour and steer our commitments towards a more responsible banking system. |  | SDG 10. Reducing Inequality Our products and services give society's most vulnerable better access to financial services, and we teach them the concepts and skills they need to manage their finances effectively. |  | SDG 11. Sustainable Cities and Communities We finance sustainable infrastructure and promote access to affordable housing to guarantee basic services and inclusive economic growth. | ||||||||||||||||||
 | SDG 12. Responsible Consumption and Production We are firmly committed to reducing our environmental footprint, implementing energy efficiency plans, promoting the use of renewable energies and offsetting the consumption of our internal operations. |  | SDG 17. Partnerships for the Goals We participate in prominent local and international initiatives and working groups. | ||||||||||||||||||||
| |||||
90
9.1.3 Partnerships to promote
our sustainability agenda
our sustainability agenda
GRI 2-23
We drive our responsible banking agenda through a number of local and international initiatives and working groups, including:
UNEP Finance Initiative
We are an active member of UNEP FI and a founding signatory to the United Nations Principles for Responsible Banking.
United Nations Global Compact
We've been part of the Global Compact network since 2002 and a member signatory of the United Nations Global Compact's gender equality programme since 2020.
Glasgow Financial Alliance for Net Zero, Net Zero Banking Alliance and Net Zero Asset Management
In support of our net-zero ambition, we joined the Glasgow Financial Alliance for Net Zero, Net Zero Asset Managers and were co-founders to the Net Zero Banking Alliance. Within GFANZ, we co-led the Net Zero Public Policy and their call to action launched in October.
World Business Council for Sustainable Development (WBCSD)
As members of WBCSD, in 2023, we continued participating in the Banking for Impact on Climate in Agriculture (B4ICA) initiative.
Banking Environment Initiative (BEI)
We continued to participate in the Bank 2030 initiative, aimed at building a roadmap for the banking industry to help society in the transition towards a low-carbon economy.
CEO Partnership for Economic Inclusion
Since 2018 we have been part of a private-sector alliance for financial inclusion, led by Queen Máxima of the Netherlands, Special Representative of the United Nations, to promote inclusive financing for development. The Partnership has concluded by end of 2023.
| Other international and local initiatives that Santander supports | ||||||||||||||||||||
→UN Women's Empowerment Principles →The Valuable 500 →UN Principles for Responsible Investment →CDP →UN Global Investors for Sustainable Development (GISD) Alliance →Green Recovery Alliance of the European Union →Equator Principles →Partnership for Carbon Accounting Financials (PCAF) | →Round Table on Responsible Soy →Working Group on Sustainable Livestock →Climate Leadership Council →The Wolfsberg Group →United For Wildlife’s Financial Taskforce against the illegal wildlife trade →United Nations Office on Drugs and Crime's (UNODC) Private Sector Dialogue on the Disruption of Financial Crimes Related to Environmental Crimes | |||||||||||||||||||
91
9.2 Main internal regulations and governance
GRI 2-23, 2-24, 3-3, FS1
In 2023, we continued to work on embedding ESG standards in all the Group’s operations and procedures. We rolled out our Responsible banking model to local units. This model sets out
the roles and responsibilities in critical sustainability management and underpinned the development of operating models for Green Finance, risk, ESG reporting and other areas
Cross-cutting regulations to embed ESG standards in our business model
Responsible banking frameworkA | Responsible banking and sustainability policy | Responsible banking model | ||||||||||||||||||||||||||||||
| Establishes responsible banking as a strategic topic for Grupo Santander and all local units. | Sets out our sustainability principles, commitments, targets and strategy (including human rights protection) to create long-term stakeholder value. | Sets out the roles and responsibilities of the first, second and third line of defence in all responsible banking-related activity to drive our sustainability agenda, embed ESG standards and achieve our goals. | ||||||||||||||||||||||||||||||
In addition to these regulations , which apply to all the Group’s units and businesses, we have regulations on Own workforce (see section 4.'Acting responsibly towards employees' ); Consumers and end users (see section 5.'Acting responsibly towards customers' ); donations policy (see section 6.'Supporting communities' ); and Business conduct (see section 7.'Business conduct' ).
All regulations (corporate frameworks, models, policies and procedures) referred to maintain a high level of governance, and the highest standards in terms of their elaboration, approval, and in the monitoring of their local transposition.
The approval of the regulations shall be the responsibility of the board of directors or its committees, when the regulated matter falls within their scope of responsibility according to their rules and regulations35. Corporate frameworks in all cases must be approved by the board of directors. The regulations approved by the board under this chapter are as follows:
→Relevant corporate frameworks related to sustainability: Responsible Banking, Risk; Cybersecurity; Compliance and conduct ; Financial Crime and compliance; Human resources.
→Relevant policies related to sustainability: Responsible banking and sustainable; Code of conduct; Code of conduct in securities markets; Corporate Defence; Environmental, social and climate change risk; Tax ; Conflict of interest; Defence sector; Anti-money laundering and countering the financing terrorism; Remuneration; Performance management; Group Succession; Culture.
Santander publicly maintains key regulations at our website santander.com/en/our-approach/policies and santander.com/codes-of-conduct.
35 For more information, please visit our website santander.com/rules-and-regulations-board-of-directors.
92
Governance
GRI 2-9, 2-12, 2-13, 2-14, 3-3, FS1, FS2, FS3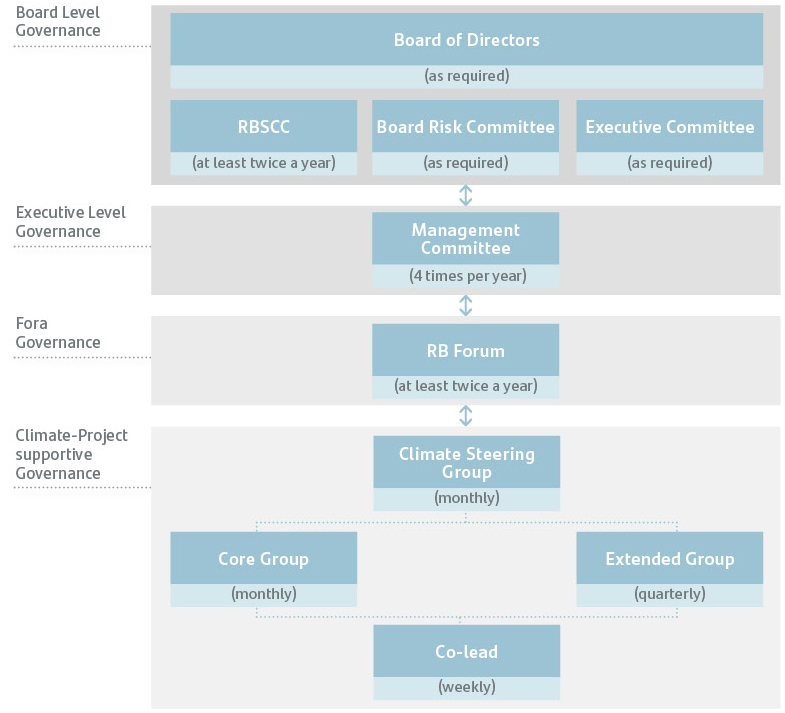
Board of directors
The board of directors performs the following functions:
•approves the Responsible Banking agenda and set the strategy
•approves the culture policy and related policies on responsible business and sustainability matters and, in particular, on environmental and social matters;
•ensures that the alignment of the responsible banking strategy is consistent with Group strategy;
•reviews the performance against the public commitments and that the metrics are covered within the responsible banking agenda;
•tracks key initiatives
•reviews subsidiaries’ strategies.
Responsible banking, sustainability & culture committee (RBSCC)
The committee supports the board and oversees the Group's responsible banking agenda and strategy.
| For more details, see section 4.9 ´Responsible banking, sustainability and culture committee activities in 2023´ in the Corporate governance chapter | ||||
The RBSCC coordinates its activities with the other board committees, in particular with the risk supervision, regulation, and compliance committee, the board audit committee and the remuneration committee. The first one has assessed the ESG policies and ESG risk appetite, the second has supervised financial and non-financial reporting and disclosures, as well as related ESG processes and controls and the third has approved the sustainability incentives in reward schemes .
Management meeting
Chaired by the CEO, it discusses our progress on the responsible banking agenda, especially as regards to climate change, TCFD and ESG business opportunities.
In 2023, the committee was informed 3 times on progress made with the responsible banking agenda.
Responsible banking forum
Executes the responsible banking agenda across the Group; drives decision-making on responsible banking issues; ensures the execution of any mandates from the RBSCC, other board committees and the board of directors; and ensures alignment with key issues, including the review and escalation of reports to the RBSCC.
Group responsible banking unit
Coordinates and drives the responsible banking agenda, with support from a senior adviser on responsible business practices who reports directly to the executive chair.
Responsible banking network
Our subsidiaries' Responsible banking teams execute the sustainability agenda according to our corporate strategy and policies.
We issue guiding principles for subsidiaries and global business units to embed our responsible banking agenda across the Group.
In 2023, the network held 5 virtual meetings to discuss progress on the Group's agenda and we ran the fifth Responsible Banking workshop, which was physically attended by representatives from all businesses and geographies. The network discussed priority areas of sustainability strategy, including climate and environment, social agenda, ESG risk management, sustainable business, materiality assessment, and reporting.
93
9.3 Our targets
Meeting our public targets
Following the UN Principles for Responsible Banking, of which we are a founding member, we have set targets in those areas where we have the greatest potential impact.
| 2018 | 2019 | 2020 | 2021 | 2022 | 2023 | Target | ||||||||||||||||||||
Green finance raised and facilitated (cumulative)(EUR bn)A | 19 bn | 33.8 bn | 65.7 bn | 94.5 bn | 114.6 bn | 120 bn by 2025 220 bn by 2030 | ||||||||||||||||||||
| Socially Responsible Investments AuMs (EUR bn) | 27.1 bn | 53.2 bn | 67.7 bn |  | 100 bn by 2025 | |||||||||||||||||||||
Electricity used from renewable energy sourcesB | 43% | 50% | 57% | 75% | 88% | 97% | | 100% by 2025 | ||||||||||||||||||
| Thermal coal-related power & mining phase-out (EUR bn) | 7 bn | 5.9 bn | 4.9 bn | | 0 by 2030 | |||||||||||||||||||||
Emissions intensity of power generation portfolioC,D | 0.21 | 0.17 | 0.19 | | 0.11 tCO2e / MWh in 2030 | |||||||||||||||||||||
Absolute emissions of energy (oil & gas) portfolioC | 23.84 | 22.58 | 27.43 | | 16.98 mtCO2e in 2030 | |||||||||||||||||||||
Emissions intensity of aviation portfolioC | 92.47 | 93.05 | 97.21 | | 61.71 grCO2e / RPK in 2030 | |||||||||||||||||||||
Emissions intensity of steel portfolioC | 1.58 | 1.40 | 1.36 | | 1.07 tCO2e / tS in 2030 | |||||||||||||||||||||
Emissions intensity of auto manufacturing portfolio | 149 | 138 | | 103 gCO2/vkm in 2030 | ||||||||||||||||||||||
Emissions intensity of auto lending portfolioE | 137 | | 75-89 gCO2e/vkm in 2030 | |||||||||||||||||||||||
Women in senior executives positions (%)F | 20% | 22.7% | 23.7% | 26.3% | 29.3% | 31.4% | | 35% by 2025 | ||||||||||||||||||
Equal pay gapG | 3% | 2% | 2% | 1% | 1% | c. 0%  | | ~0% by 2025 | ||||||||||||||||||
Financially empowered people (cumulative)H | 2.0 mn | 4.9 mn | 7.5 mn | 11.8 mn | 10 mn by 2025 | |||||||||||||||||||||
Financially included people (cumulative)I | 1.8 mn | 5mn between 2023-2025 | ||||||||||||||||||||||||
| Investment to foster education, employability and entrepreneurship | 105 mn | €400m between 2023-2026 | ||||||||||||||||||||||||
| Cumulative target |  From… to… From… to… | | Commitment Achieved | ||||||||||||||
In 2023, we also continued to:
→make progress on aligning key portfolios, including disclosure of emissions for UK Mortgages and Agriculture in Brazil.
→have 40-60% women members on the board of directors.
→be carbon neutral in our own operationsJ in our core markets.
→keep our offices and buildings in our core markets free of single-use plastics in fulfilment of our public target.
A.Includes Grupo Santander's contribution to green finance: project finance; syndicated loans; green bonds; capital finance; export finance, advisory services, structuring and other products, to help customers transition to a low-carbon economy. Preliminary data as final League Tables for 2023 were not yet available at date of editorial closing; data will be updated to year end in the next Climate Finance Report.
B.In countries where we can verify electricity from renewable sources at Banco Santander properties. It considers the 10 main countries in which we operate.
C.The figures displayed are the latest available. Given limited data availability from customers to assess financed emission, we plan to provide target progress update in the upcoming Climate Finance Report. Banco Santander's internal calculation methodology has been used, based on the Partnership for Carbon Accounting Financials (PCAF). See more information in section 6.Supporting the green transition.
D.In 2021 Annual report and Climate Finance report, we assessed the 2019 financed emissions of our power generation portfolio, including guarantees and other types of off-balance exposure to our customers that do not entail current funding. Because, according to the PCAF standard, such exposure should not be calculated if its attribution factor is 'outstanding', we were over-attributed with our corporate customers’ emissions. Therefore, the 2019 baseline emissions intensity has been restated from 0.23 to 0.21. The target and climate ambition remains for this sector.
E.Consumer lending for acquisition of passenger cars in Europe, covering a significant majority of the exposure.
F.Senior executive positions make up 1% of the total workforce
G.Equal pay gap based on same jobs, levels and functions. The year-end figure is 0.44%. Having met the target set (two years ahead of schedule), the Group has set itself the objective of maintaining a pay equity ratio in line with best market practices.
H.Unbanked, underbanked and financially vulnerable individuals who receive tailored finance solutions and become more aware and resilient through financial education.
I.Additional 5 million of included people, considering unbanked, underbanked and financially vulnerable individuals who receive tailored finance solutions relates to access and finance.
J.Scope 1 and 2 emissions and scope 3 emissions from employee commuting and business travel.It considers wholly owned companies in Argentina, Brazil, Chile, Germany, Mexico, Poland, Portugal, Spain, the United Kingdom and the United States.
94
9.4 Double Materiality Assessment and sources
GRI 2-29, 3-1, 3-2
We’re enhancing our methodology based on the Corporate Sustainability Reporting Directive (CSRD). We made two key updates in 2023:
•The list of topics considered for the assessment are the sustainability matters described in the European Sustainability Reporting Standards (ESRS 1- Appendix A).
•We used quantitative data (where possible) to assess impact, risk, and opportunity (IROs) more comprehensively. We also used stakeholder input to complement data-based analysis.
In line with double materiality assessment requirements, Santander assessed impact materiality and financial materiality separately using the best available tools and data.
•We used the UNEP FI36 impact tool to assess impact materiality.
•To assess financially material risks, Santander leverages on internal risk exercises (such as the Klima tool –see section 10.2 'Climate and environmental risk management' in 'Risk, compliance & conduct management' chapter – and initial assessments on Nature) and external data sources such as SASB37. Financial opportunities are informed by Santander’s internal forecasts and supplemented with industry research.
| Description | ||||||||
| External | UNEP-FI Impact tool | Assess positive and negative impacts of Santander’s business, including exposure to different sectors and products. | ||||||
| SASB | Main source for the assessment of risks in Social and Governance sustainability -related matters. | |||||||
| Additional market research | Consulted sources such as IEA, CDP, OECD, and WEF to complement the internal forecasts when evaluating sustainability business opportunity assessments.38 | |||||||
| Internal | Klima tool | Santander’s internal climate risk assessment tool, which analyses climate physical and transition risk per sector. | ||||||
Nature internal assessment | Leveraging on Encore, Santander has performed an assessment to identifying main key impacts and dependencies to nature sustainability related matters. | |||||||
Financial planning forecasts | Santander’s internal revenue forecast per business sector. | |||||||
We conducted the double materiality assessment at ESRS sub-topic level. We considered Santander’s business model for each sub-topic, with results by business segment (including private individuals, consumers, corporates, payments, Wealth Management & Insurance) and own operations. The results have been carried out with a mid-term time horizon (~3 years).
Stakeholders input
As part of our DMA exercise, we consulted an extensive list of internal and external stakeholders. Their input was key to understand the relevance of the opportunities arising from sustainability matters and overlayed our quantitative exercise.
We gathered stakeholder feedback in different ways. This table shows each stakeholder group and sample size.
 Retail Customers |  Investors |  NGOs |  Senior management |  Employees |  Regulators and supervisors39 | |||||||||||||||||||||||||||
| N = 9000+ | N = 8 | N = 5 | N = 8 | N = c.200 | N = 2 | |||||||||||||||||||||||||||
Engagement was mainly through surveys as the most straightforward way to quantify their feedback and embed it in the exercise. We also interviewed different teams to enlarge and contextualize the information received.
The survey demonstrates some consistency among all six stakeholder groups. Three topics consistently arise among their priorities: fighting climate change, protecting customer data, and ensuring transparency and inclusivity. However, there are also some differences:
The survey demonstrates some consistency among all six stakeholder groups. Three topics consistently arise among their priorities: fighting climate change, protecting customer data, and ensuring transparency and inclusivity. However, there are also some differences:
•Retail customers prioritize social (privacy and security personal data) and governance matters (transparency and honesty).
•Employees and senior management have balanced priorities across E, S and G.
•Investors’, regulators’ and NGOs’ top priorities are environmental matters.
36 United Nations Environment - Finance Initiative.The context module was conducted in the Group's five largest geographies as allowed by the tool. The consumer banking and institutional banking modules included entire Group's perimeter.
37 Sustainability Accounting Standards Board.
38 IEA-Internationa Energy Agency, CDP-Carbon Disclosure Project, OECD-Organisation for Economic Co-operation and Development, WEF-World Economic Forum.
39 We consulted the two main functions of the Group that monitor this activity.
95
As the final step, we scaled each of the matters based on quantitative data and stakeholders' input. Then, we set the thresholds for an item to be material.
We applied a five point scale of Critical, Significant, Important, Informative and Minimal.
For Santander, a sustainability matter is material if it is above the category of Important, regardless of whether it comes from the impact side or from the financial side (risks and opportunities).
Summary of the model
Impact materiality 'Material if connected to actual or potential significant impacts related to the matter on people or the environment' | Financial materiality 'Material if it triggers or may trigger financial effects on undertakings, i.e., generates or may generate risks or opportunities that influence or are likely to influence the future cash flows' | |||||||||||||||||||||||||||||||||||||||||||||||||||||||||||||
| OR | ||||||||||||||||||||||||||||||||||||||||||||||||||||||||||||||
Positive and negative impact | Risks | Opportunities | ||||||||||||||||||||||||||||||||||||||||||||||||||||||||||||
 UNEP-FI | + | Portfolio data | Climate Tool scores (ESRS E1) |  + + Biodiversity Internal analysis (ESRS E2-5) |  Assessment (ESRS S & G) | Internal revenue forecast per business sector | Industry research | |||||||||||||||||||||||||||||||||||||||||||||||||||||||
Stakeholder overlay (surveys inputs from NGOs, Retail customers, Employees, Senior management, regulatory views, and investors) | ||||||||||||||||||||||||||||||||||||||||||||||||||||||||||||||
Changes in our methodology as we based on CSRD
One of the main changes to the CSRD is the list of sustainability matters. This renders Santander’s previous exercise slightly incomparable to 2023's.
Nevertheless, we mapped and assessed the consistency of current materiality with the previous materiality assessment list of topics. The results, as shown below, reflect high consistency between both exercises considering the topics that were material in 2022 (crucial topics).
| Material topics in 2022 | ESRS topic 2023 | |||||||||||||||||||
| Customer experience and satisfaction | Consumers and end-users: •Material topic. •Strong mapping. Customer experience and satisfaction included having a value proposition and service tailored to customer needs. | |||||||||||||||||||
| Financial health | Consumers and end-users: •Material topic •Strong mapping. We considered all our efforts to foster financial health as a key strategy to promote social inclusion of consumers and end-users. | |||||||||||||||||||
| Green finance and SRI | Climate change: •Material topic. •Strong mapping. Green finance and socially responsible investment referred specifically to business opportunities arising from climate change. | |||||||||||||||||||
| Environmental and social risk management | •No mapping. The 2022 topic included all the risks arising from sustainability matters. Our approach in 2023 was to consider this topic as represented in the risk dimension across all sustainability matters. | |||||||||||||||||||
| Culture, conduct and ethical behaviour | Business conduct •Material topic •Strong mapping. We consider culture and doing everything simple, personal and fair as one of the key levers of business conduct. | |||||||||||||||||||
96
9.5 EU Taxonomy
Information about Article 8 of the EU Taxonomy Regulation
In 2020, the European Union adopted the Taxonomy Regulation establishing a list of activities that can qualify as environmentally sustainable40 and the obligation for companies subject to the Non-Financial Reporting Directive (NFRD)41 disclose how their operations align with the EU Taxonomy.
In response to the disclosure requirement, in 2021 and 2022 Santander published the eligibility ratio. This ratio shows the proportion of activities on our balance sheet that are included in the list of EU Taxonomy activities, but without determining if they are aligned.
For the first time in 2023, financial institutions are required to publish the green asset ratio (GAR) for two climate objectives and the eligibility ratio of the four remaining objectives. To be aligned to the European taxonomy, activities must meet the specific taxonomy criteria and ensure that it causes no significant harm to any of the other environmental objectives (DNSH) and meets minimum social safeguards (MSS).
As required under the Disclosures Delegated Act, our GAR represents the exposures aligned with the EU Taxonomy in the numerator divided by total on-balance sheet volumes42, and amounts for 2.6 (CapEx-based) and 2.4 (turnover-based). The exposures aligned to the EU Taxonomy and included in the numerator are:
→Aligned exposures in the household loan portfolio: residential property loans (mortgages) and vehicle loans.43
→Aligned exposures to financial and non-financial corporations subject to NFRD based on the alignment ratio publicly disclosed by the counterparties (both CapEx and turnover-based alignment).
As for the eligible volumes, our eligibility ratio for the two climate-related objectives is 36% (both CapEx and turnover-based), considering eligible vehicles, mortgages and building renovation portfolios, as well as information disclosed by financial and non-financial counterparties. As for the additional eligibility ratio corresponding to the volumes of the four remaining objectives and the additional activities of the two climate-related objectives recently included in the EU Taxonomy, the ratio is 0,7% (both CapEx and turnover-based)44. In this ratio the eligible volumes corresponding to counterparties have been estimated based on the Statistical Classification of Economic Activities in the European Community (NACE), as the counterparties have not made their ratio publicly available yet to be able to consider them in our calculation.
On December 21 the European Commission disclosed additional guidelines on the interpretation and implementation of the EU Taxonomy disclosure obligations regarding aligned and eligible activities by financial undertakings. In order to comply with the criteria established in these guidelines, a best-effort analysis has been performed to incorporate these criteria into the information disclosed.
Santander's GAR is 2.6 (CapEx-based)
& 2.4 (turnover-based)45. Santander´s eligibility is 36%.
& 2.4 (turnover-based)45. Santander´s eligibility is 36%.
The difference between the eligible volumes and aligned volumes (i.e., eligibility ratio vs GAR) is mainly driven by three reasons:
→European Taxonomy criteria is strict. Many activities which do not meet its thresholds, do contribute to the transition of a greener economy. In fact, the Platform for Sustainable Finance recently released a report showing that the average CAPEX alignment ratio from corporates disclosing the information was 18%.
→The numerator and denominator are not symmetric. Santander has 18% of the adjusted balance sheet exposure (GAR denominator) to non-financial corporations not subject to NFRD (mainly SMEs and companies from outside EU), which cannot be included as eligible or aligned financing, therefore environmentally sustainable.
→There are limitations to the available data and documentation. For example, according to the Platform report, only ~1,400 corporates subject to NFRD are disclosing alignment information (whereas the universe is ~11,500). Also, there is still a lack of robust evidence to verify alignment in specific purpose lending, especially when it comes to validate DNSH and MSS.
40 These are: 1) climate change mitigation 2) climate change adaptation, 3) sustainable use and protection of water and marine resources, transition to a circular economy, pollution prevention and control and protection and restoration of biodiversity and ecosystems.
41 NFRD applies to large, listed companies, banks, or insurance companies that meet certain criteria, such as having a balance sheet total in excess of EUR 20 million, a turnover in excess of EUR 40 million, or an average number of employees in excess of 500 during the fiscal year.
42 Not including exposure to sovereigns, central banks, and the trading portfolio.
43 Following the technical screening criteria of the EU Taxonomy Regulation. As for compliance with DNSH criteria, we followed EU Taxonomy requirements based on prudence and efficient assessment. We ran MSS criteria validation according to the recommendations of the Platform on Sustainable Finance and respective regulation.
44Including only exposures to non-financial corporates subject to NFRD (totalling 26bn) and excluding eligibility volumes already reported for the same NACE codes under the eligibility ratio for the climate-related objectives (objectives 1 and 2).
45 Calculation for the two climate-related objectives. For the flow of volumes, the Green Asset Ratio is 1.9 (CapEx-based) and 1.6 (turnover-based).
97
Based on a voluntary disclosure, we complement the GAR with an additional ratio to overcome some of these limitations:
→Voluntary GAR (European & symmetric): 6.1%
•The numerator of this ratio remains the same as in the previous ratio, purely exposures to the EU Taxonomy aligned in Europe.
•In the denominator, we only keep portfolios where we can tag exposures as environmentally sustainable: NFRD European financial and non-financial corporations, households, and local governments. We excluded (non-exhaustive list): Non-NFRD companies (since they do not have reporting obligations), cash & interbank loans, derivatives, goodwill, etc.
In the following pages there is the complete disclosure, including the templates set out in the Taxonomy Regulation.
| For more details on how our financial strategy, product design and relations with customers and counterparties comply with the EU Taxonomy, please see the sections 2. 'Supporting the green transition' and 10.9 'GFANZ transition planning'. | ||||
98
0. Summary of KPIs to be disclosed by credit institutions under Article 8 Taxonomy Regulation
| Total environmentally sustainable assets (1) | KPI (3) | KPI (4) | % coverage (over total assets) (5) | % of assets excluded from the numerator of the GAR (Article 7.2 and 7.3 and Section 1.1.2. of Annex V) | % of assets excluded from the denominator of the GAR (Article 7.1 and Section 1.2.4 of Annex V) | ||||||||||||||||||
| Main KPI | Green asset ratio (GAR) stock | 31,151 | 2.4 | 2.6 | 70.3 | 33.9 | 29.7 | ||||||||||||||||
| Total environmentally sustainable activities (2) | KPI | KPI | % coverage (over total assets) | % of assets excluded from the numerator of the GAR (Article 7.2 and 7.3 and Section 1.1.2. of Annex V) | % of assets excluded from the denominator of the GAR (Article 7.1 and Section 1.2.4 of Annex V) | ||||||||||||||||||
| Additional KPIs | GAR (flow) | 7,079 | 1.6 | 1.9 | 50.6 | 36.0 | 49.4 | ||||||||||||||||
| Trading book(6) | |||||||||||||||||||||||
| Financial guarantees | 142 | 0.9 | 1.8 | ||||||||||||||||||||
| Assets under management | 829 | 0.6 | 1.1 | ||||||||||||||||||||
| Fees and commissions income(6) | |||||||||||||||||||||||
| (1) Total environmentally sustainable assets used for turnover KPI. Total environmentally sustainable assets used for Capex KPI amounts to EUR 33,422 million | ||
| (2) Total environmentally sustainable assets used for turnover KPI. Total environmentally sustainable assets used for Capex KPI amounts to EUR 8,435 million for GAR flow, EUR 289 million for financial guarantees and EUR 1,550 million for assets under management | ||
| (3) Based on the Turnover KPI of the counterparty | ||
| (4) Based on the CapEx KPI of the counterparty | ||
| (5) % of assets covered by the KPI over banks´ total assets | ||
| (6) Fees and Commissions and Trading Book KPIs shall only apply starting 2026 | ||
99
1.Assets for the calculation of GAR (Capex)
| Million EUR | 2023 | |||||||||||||||||||||||||||||||||||||||||||||||||||||||
| Climate Change Mitigation (CCM) | Climate Change Adaptation (CCA) | TOTAL (CCM + CCA) | ||||||||||||||||||||||||||||||||||||||||||||||||||||||
| Total [gross] carrying amount | Of which towards taxonomy relevant sectors (Taxonomy-eligible) | Of which towards taxonomy relevant sectors (Taxonomy-eligible) | Of which towards taxonomy relevant sectors (Taxonomy-eligible) | |||||||||||||||||||||||||||||||||||||||||||||||||||||
| Of which environmentally sustainable (Taxonomy-aligned) | Of which environmentally sustainable (Taxonomy-aligned) | Of which environmentally sustainable (Taxonomy-aligned) | ||||||||||||||||||||||||||||||||||||||||||||||||||||||
| Of which Use of Proceeds | Of which transitional | Of which enabling | Of which Use of Proceeds | Of which enabling | Of which Use of Proceeds | Of which transitional | Of which enabling | |||||||||||||||||||||||||||||||||||||||||||||||||
| GAR - Covered assets in both numerator and denominator | ||||||||||||||||||||||||||||||||||||||||||||||||||||||||
| 1 | Loans and advances, debt securities and equity instruments not HfT eligible for GAR calculation | 661,433 | 465,892 | 33,416 | 29,115 | 6,975 | 1,640 | 60 | 7 | 0 | 5 | 465,953 | 33,422 | 29,115 | 6,975 | 1,645 | ||||||||||||||||||||||||||||||||||||||||
| 2 | Financial undertakings | 28,156 | 7,544 | 510 | 0 | 11 | 349 | 4 | 0 | 0 | 0 | 7,548 | 510 | 0 | 11 | 349 | ||||||||||||||||||||||||||||||||||||||||
| 3 | Credit institutions | 22,517 | 6,241 | 3 | 0 | 0 | 2 | 4 | 0 | 0 | 0 | 6,245 | 3 | 0 | 0 | 2 | ||||||||||||||||||||||||||||||||||||||||
| 4 | Loans and advances | 20,257 | 5,232 | 3 | 0 | 0 | 2 | 4 | 0 | 0 | 0 | 5,236 | 3 | 0 | 0 | 2 | ||||||||||||||||||||||||||||||||||||||||
| 5 | Debt securities, including UoP | 2,261 | 1,009 | 0 | 0 | 0 | 0 | 0 | 0 | 0 | 0 | 1,009 | 0 | 0 | 0 | 0 | ||||||||||||||||||||||||||||||||||||||||
| 6 | Equity instruments | 0 | 0 | 0 | 0 | 0 | 0 | 0 | 0 | 0 | 0 | 0 | 0 | |||||||||||||||||||||||||||||||||||||||||||
| 7 | Other financial corporations | 5,639 | 1,303 | 507 | 0 | 10 | 347 | 0 | 0 | 0 | 0 | 1,303 | 507 | 0 | 10 | 347 | ||||||||||||||||||||||||||||||||||||||||
| 8 | of which investment firms | 1,987 | 438 | 349 | 0 | 0 | 307 | 0 | 0 | 0 | 0 | 438 | 349 | 0 | 0 | 307 | ||||||||||||||||||||||||||||||||||||||||
| 9 | Loans and advances | 1,455 | 138 | 49 | 0 | 0 | 7 | 0 | 0 | 0 | 0 | 138 | 49 | 0 | 0 | 7 | ||||||||||||||||||||||||||||||||||||||||
| 10 | Debt securities, including UoP | 313 | 300 | 300 | 0 | 0 | 300 | 0 | 0 | 0 | 0 | 300 | 300 | 0 | 0 | 300 | ||||||||||||||||||||||||||||||||||||||||
| 11 | Equity instruments | 219 | 0 | 0 | 0 | 0 | 0 | 0 | 0 | 0 | 0 | 0 | 0 | |||||||||||||||||||||||||||||||||||||||||||
| 12 | of which management companies | 141 | 102 | 11 | 0 | 1 | 1 | 0 | 0 | 0 | 0 | 102 | 11 | 0 | 1 | 1 | ||||||||||||||||||||||||||||||||||||||||
| 13 | Loans and advances | 141 | 102 | 11 | 0 | 1 | 1 | 0 | 0 | 0 | 0 | 102 | 11 | 0 | 1 | 1 | ||||||||||||||||||||||||||||||||||||||||
| 14 | Debt securities, including UoP | 0 | 0 | 0 | 0 | 0 | 0 | 0 | 0 | 0 | 0 | 0 | 0 | 0 | 0 | 0 | ||||||||||||||||||||||||||||||||||||||||
| 15 | Equity instruments | 0 | 0 | 0 | 0 | 0 | 0 | 0 | 0 | 0 | 0 | 0 | 0 | |||||||||||||||||||||||||||||||||||||||||||
| 16 | of which insurance undertakings | 1,892 | 318 | 0 | 0 | 0 | 0 | 0 | 0 | 0 | 0 | 318 | 0 | 0 | 0 | 0 | ||||||||||||||||||||||||||||||||||||||||
| 17 | Loans and advances | 1,892 | 318 | 0 | 0 | 0 | 0 | 0 | 0 | 0 | 0 | 318 | 0 | 0 | 0 | 0 | ||||||||||||||||||||||||||||||||||||||||
| 18 | Debt securities, including UoP | 0 | 0 | 0 | 0 | 0 | 0 | 0 | 0 | 0 | 0 | 0 | 0 | 0 | 0 | 0 | ||||||||||||||||||||||||||||||||||||||||
| 19 | Equity instruments | 0 | 0 | 0 | 0 | 0 | 0 | 0 | 0 | 0 | 0 | 0 | 0 | |||||||||||||||||||||||||||||||||||||||||||
| 20 | Non-financial undertakings | 25,910 | 10,901 | 3,791 | 0 | 395 | 1,291 | 56 | 7 | 0 | 5 | 10,957 | 3,798 | 0 | 395 | 1,296 | ||||||||||||||||||||||||||||||||||||||||
| 21 | Loans and advances | 24,347 | 10,367 | 3,315 | 0 | 395 | 1,063 | 49 | 7 | 0 | 5 | 10,416 | 3,322 | 0 | 395 | 1,068 | ||||||||||||||||||||||||||||||||||||||||
| 22 | Debt securities, including UoP | 1,563 | 534 | 476 | 0 | 0 | 228 | 7 | 0 | 0 | 0 | 541 | 476 | 0 | 0 | 228 | ||||||||||||||||||||||||||||||||||||||||
| 23 | Equity instruments | 0 | 0 | 0 | 0 | 0 | 0 | 0 | 0 | 0 | 0 | 0 | 0 | |||||||||||||||||||||||||||||||||||||||||||
| 24 | Households | 607,245 | 447,326 | 29,115 | 29,115 | 6,569 | 0 | 0 | 0 | 0 | 0 | 447,326 | 29,115 | 29,115 | 6,569 | 0 | ||||||||||||||||||||||||||||||||||||||||
| 25 | of which loans collateralised by residential immovable property | 366,626 | 356,979 | 22,545 | 22,545 | 0 | 0 | 0 | 0 | 0 | 0 | 356,979 | 22,545 | 22,545 | 0 | 0 | ||||||||||||||||||||||||||||||||||||||||
| 26 | of which building renovation loans | 528 | 528 | 0 | 0 | 0 | 0 | 0 | 0 | 0 | 0 | 528 | 0 | 0 | 0 | 0 | ||||||||||||||||||||||||||||||||||||||||
| 27 | of which motor vehicle loans | 89,820 | 89,820 | 6,569 | 6,569 | 6,569 | 0 | 89,820 | 6,569 | 6,569 | 6,569 | 0 | ||||||||||||||||||||||||||||||||||||||||||||
100
| Million EUR | 2023 | |||||||||||||||||||||||||||||||||||||||||||||||||||||||
| Climate Change Mitigation (CCM) | Climate Change Adaptation (CCA) | TOTAL (CCM + CCA) | ||||||||||||||||||||||||||||||||||||||||||||||||||||||
| Total [gross] carrying amount | Of which towards taxonomy relevant sectors (Taxonomy-eligible) | Of which towards taxonomy relevant sectors (Taxonomy-eligible) | Of which towards taxonomy relevant sectors (Taxonomy-eligible) | |||||||||||||||||||||||||||||||||||||||||||||||||||||
| Of which environmentally sustainable (Taxonomy-aligned) | Of which environmentally sustainable (Taxonomy-aligned) | Of which environmentally sustainable (Taxonomy-aligned) | ||||||||||||||||||||||||||||||||||||||||||||||||||||||
| Of which Use of Proceeds | Of which transitional | Of which enabling | Of which Use of Proceeds | Of which enabling | Of which Use of Proceeds | Of which transitional | Of which enabling | |||||||||||||||||||||||||||||||||||||||||||||||||
| 28 | Local governments financing | 122 | 122 | 0 | 0 | 0 | 0 | 0 | 0 | 0 | 0 | 122 | 0 | 0 | 0 | 0 | ||||||||||||||||||||||||||||||||||||||||
| 29 | Housing financing | 75 | 75 | 0 | 0 | 0 | 0 | 0 | 0 | 0 | 0 | 75 | 0 | 0 | 0 | 0 | ||||||||||||||||||||||||||||||||||||||||
| 30 | Other local government financing | 46 | 46 | 0 | 0 | 0 | 0 | 0 | 0 | 0 | 0 | 46 | 0 | 0 | 0 | 0 | ||||||||||||||||||||||||||||||||||||||||
| 31 | Collateral obtained by taking possession: residential and commercial immovable properties | 5,595 | 0 | 0 | 0 | 0 | 0 | 0 | 0 | 0 | 0 | 0 | 0 | 0 | 0 | 0 | ||||||||||||||||||||||||||||||||||||||||
| 32 | Assets excluded from the numerator for GAR calculation (covered in the denominator) | 621,271 | 0 | 0 | 0 | 0 | 0 | 0 | 0 | 0 | 0 | 0 | 0 | 0 | 0 | 0 | ||||||||||||||||||||||||||||||||||||||||
| 33 | Financial and Non-financial undertakings | 478,101 | ||||||||||||||||||||||||||||||||||||||||||||||||||||||
| 34 | SMEs and NFCs (other than SMEs) not subject to NFRD disclosure obligations | 141,389 | ||||||||||||||||||||||||||||||||||||||||||||||||||||||
| 35 | Loans and advances | 139,095 | ||||||||||||||||||||||||||||||||||||||||||||||||||||||
| 36 | of which loans collateralised by commercial immovable property | 22,909 | ||||||||||||||||||||||||||||||||||||||||||||||||||||||
| 37 | of which building renovation loans | 141 | ||||||||||||||||||||||||||||||||||||||||||||||||||||||
| 38 | Debt securities | 2,140 | ||||||||||||||||||||||||||||||||||||||||||||||||||||||
| 39 | Equity instruments | 155 | ||||||||||||||||||||||||||||||||||||||||||||||||||||||
| 40 | Non-EU country counterparties not subject to NFRD disclosure obligations | 296,567 | ||||||||||||||||||||||||||||||||||||||||||||||||||||||
| 41 | Loans and advances | 272,256 | ||||||||||||||||||||||||||||||||||||||||||||||||||||||
| 42 | Debt securities | 21,525 | ||||||||||||||||||||||||||||||||||||||||||||||||||||||
| 43 | Equity instruments | 2,787 | ||||||||||||||||||||||||||||||||||||||||||||||||||||||
| 44 | Derivatives | 5,421 | ||||||||||||||||||||||||||||||||||||||||||||||||||||||
| 45 | On demand interbank loans | 11,911 | ||||||||||||||||||||||||||||||||||||||||||||||||||||||
| 46 | Cash and cash-related assets | 8,621 | ||||||||||||||||||||||||||||||||||||||||||||||||||||||
| 47 | Other categories of assets (e.g. Goodwill, commodities etc.) | 117,217 | ||||||||||||||||||||||||||||||||||||||||||||||||||||||
| 48 | Total GAR assets | 1,288,300 | 465,892 | 33,416 | 29,115 | 6,975 | 1,640 | 60 | 7 | 0 | 5 | 465,953 | 33,422 | 29,115 | 6,975 | 1,645 | ||||||||||||||||||||||||||||||||||||||||
| 49 | Assets not covered for GAR calculation | 545,242 | ||||||||||||||||||||||||||||||||||||||||||||||||||||||
| 50 | Central governments and Supranational issuers | 137,606 | ||||||||||||||||||||||||||||||||||||||||||||||||||||||
| 51 | Central banks exposure | 230,835 | ||||||||||||||||||||||||||||||||||||||||||||||||||||||
101
| Million EUR | 2023 | |||||||||||||||||||||||||||||||||||||||||||||||||||||||
| Climate Change Mitigation (CCM) | Climate Change Adaptation (CCA) | TOTAL (CCM + CCA) | ||||||||||||||||||||||||||||||||||||||||||||||||||||||
| Total [gross] carrying amount | Of which towards taxonomy relevant sectors (Taxonomy-eligible) | Of which towards taxonomy relevant sectors (Taxonomy-eligible) | Of which towards taxonomy relevant sectors (Taxonomy-eligible) | |||||||||||||||||||||||||||||||||||||||||||||||||||||
| Of which environmentally sustainable (Taxonomy-aligned) | Of which environmentally sustainable (Taxonomy-aligned) | Of which environmentally sustainable (Taxonomy-aligned) | ||||||||||||||||||||||||||||||||||||||||||||||||||||||
| Of which Use of Proceeds | Of which transitional | Of which enabling | Of which Use of Proceeds | Of which enabling | Of which Use of Proceeds | Of which transitional | Of which enabling | |||||||||||||||||||||||||||||||||||||||||||||||||
| 52 | Trading book | 176,800 | ||||||||||||||||||||||||||||||||||||||||||||||||||||||
| 53 | Total assets | 1,833,542 | 465,892 | 33,416 | 29,115 | 6,975 | 1,640 | 60 | 7 | 0 | 5 | 465,953 | 33,422 | 29,115 | 6,975 | 1,645 | ||||||||||||||||||||||||||||||||||||||||
| Off-balance sheet exposures - Undertakings subject to NFRD disclosure obligations | ||||||||||||||||||||||||||||||||||||||||||||||||||||||||
| 54 | Financial guarantees | 15,573 | 644 | 285 | 0 | 4 | 152 | 26 | 0 | 0 | 0 | 669 | 286 | 0 | 4 | 152 | ||||||||||||||||||||||||||||||||||||||||
| 55 | Assets under management | 137,531 | 4,979 | 1,550 | 0 | 77 | 665 | 36 | 0 | 0 | 0 | 5,015 | 1,550 | 0 | 77 | 665 | ||||||||||||||||||||||||||||||||||||||||
| 56 | Of which debt securities | 39,836 | 3,613 | 837 | 0 | 26 | 440 | 7 | 0 | 0 | 0 | 3,621 | 837 | 0 | 26 | 440 | ||||||||||||||||||||||||||||||||||||||||
| 57 | Of which equity instruments | 43,158 | 1,365 | 713 | 0 | 52 | 225 | 29 | 0 | 0 | 0 | 1,394 | 713 | 0 | 52 | 225 | ||||||||||||||||||||||||||||||||||||||||
102
1.Assets for the calculation of GAR (Turnover)
| Million EUR | 2023 | |||||||||||||||||||||||||||||||||||||||||||||||||||||||
| Climate Change Mitigation (CCM) | Climate Change Adaptation (CCA) | TOTAL (CCM + CCA) | ||||||||||||||||||||||||||||||||||||||||||||||||||||||
| Total [gross] carrying amount | Of which towards taxonomy relevant sectors (Taxonomy-eligible) | Of which towards taxonomy relevant sectors (Taxonomy-eligible) | Of which towards taxonomy relevant sectors (Taxonomy-eligible) | |||||||||||||||||||||||||||||||||||||||||||||||||||||
| Of which environmentally sustainable (Taxonomy-aligned) | Of which environmentally sustainable (Taxonomy-aligned) | Of which environmentally sustainable (Taxonomy-aligned) | ||||||||||||||||||||||||||||||||||||||||||||||||||||||
| Of which Use of Proceeds | Of which transitional | Of which enabling | Of which Use of Proceeds | Of which enabling | Of which Use of Proceeds | Of which transitional | Of which enabling | |||||||||||||||||||||||||||||||||||||||||||||||||
| GAR - Covered assets in both numerator and denominator | ||||||||||||||||||||||||||||||||||||||||||||||||||||||||
| 1 | Loans and advances, debt securities and equity instruments not HfT eligible for GAR calculation | 661,433 | 464,201 | 31,142 | 29,115 | 6,834 | 799 | 474 | 9 | 0 | 8 | 464,675 | 31,151 | 29,115 | 6,834 | 807 | ||||||||||||||||||||||||||||||||||||||||
| 2 | Financial undertakings | 28,156 | 7,899 | 310 | 0 | 4 | 208 | 373 | 0 | 0 | 0 | 8,272 | 310 | 0 | 4 | 208 | ||||||||||||||||||||||||||||||||||||||||
| 3 | Credit institutions | 22,517 | 6,892 | 1 | 0 | 0 | 0 | 15 | 0 | 0 | 0 | 6,907 | 1 | 0 | 0 | 0 | ||||||||||||||||||||||||||||||||||||||||
| 4 | Loans and advances | 20,257 | 5,883 | 1 | 0 | 0 | 0 | 15 | 0 | 0 | 0 | 5,898 | 1 | 0 | 0 | 0 | ||||||||||||||||||||||||||||||||||||||||
| 5 | Debt securities, including UoP | 2,261 | 1,009 | 0 | 0 | 0 | 0 | 0 | 0 | 0 | 0 | 1,009 | 0 | 0 | 0 | 0 | ||||||||||||||||||||||||||||||||||||||||
| 6 | Equity instruments | 0 | 0 | 0 | 0 | 0 | 0 | 0 | 0 | 0 | 0 | 0 | 0 | |||||||||||||||||||||||||||||||||||||||||||
| 7 | Other financial corporations | 5,639 | 1,006 | 309 | 0 | 4 | 208 | 358 | 0 | 0 | 0 | 1,365 | 309 | 0 | 4 | 208 | ||||||||||||||||||||||||||||||||||||||||
| 8 | of which investment firms | 1,987 | 280 | 172 | 0 | 0 | 155 | 41 | 0 | 0 | 0 | 321 | 172 | 0 | 0 | 155 | ||||||||||||||||||||||||||||||||||||||||
| 9 | Loans and advances | 1,455 | 127 | 19 | 0 | 0 | 2 | 41 | 0 | 0 | 0 | 168 | 19 | 0 | 0 | 2 | ||||||||||||||||||||||||||||||||||||||||
| 10 | Debt securities, including UoP | 313 | 153 | 153 | 0 | 0 | 153 | 0 | 0 | 0 | 0 | 153 | 153 | 0 | 0 | 153 | ||||||||||||||||||||||||||||||||||||||||
| 11 | Equity instruments | 219 | 0 | 0 | 0 | 0 | 0 | 0 | 0 | 0 | 0 | 0 | 0 | |||||||||||||||||||||||||||||||||||||||||||
| 12 | of which management companies | 141 | 99 | 17 | 0 | 0 | 0 | 0 | 0 | 0 | 0 | 99 | 17 | 0 | 0 | 0 | ||||||||||||||||||||||||||||||||||||||||
| 13 | Loans and advances | 141 | 99 | 17 | 0 | 0 | 0 | 0 | 0 | 0 | 0 | 99 | 17 | 0 | 0 | 0 | ||||||||||||||||||||||||||||||||||||||||
| 14 | Debt securities, including UoP | 0 | 0 | 0 | 0 | 0 | 0 | 0 | 0 | 0 | 0 | 0 | 0 | 0 | 0 | 0 | ||||||||||||||||||||||||||||||||||||||||
| 15 | Equity instruments | 0 | 0 | 0 | 0 | 0 | 0 | 0 | 0 | 0 | 0 | 0 | 0 | |||||||||||||||||||||||||||||||||||||||||||
| 16 | of which insurance undertakings | 1,892 | 317 | 0 | 0 | 0 | 0 | 317 | 0 | 0 | 0 | 634 | 0 | 0 | 0 | 0 | ||||||||||||||||||||||||||||||||||||||||
| 17 | Loans and advances | 1,892 | 317 | 0 | 0 | 0 | 0 | 317 | 0 | 0 | 0 | 634 | 0 | 0 | 0 | 0 | ||||||||||||||||||||||||||||||||||||||||
| 18 | Debt securities, including UoP | 0 | 0 | 0 | 0 | 0 | 0 | 0 | 0 | 0 | 0 | 0 | 0 | 0 | 0 | 0 | ||||||||||||||||||||||||||||||||||||||||
| 19 | Equity instruments | 0 | 0 | 0 | 0 | 0 | 0 | 0 | 0 | 0 | 0 | 0 | 0 | |||||||||||||||||||||||||||||||||||||||||||
| 20 | Non-financial undertakings | 25,910 | 8,855 | 1,718 | 0 | 260 | 591 | 101 | 9 | 0 | 7 | 8,955 | 1,727 | 0 | 260 | 598 | ||||||||||||||||||||||||||||||||||||||||
| 21 | Loans and advances | 24,347 | 8,617 | 1,509 | 0 | 258 | 552 | 83 | 9 | 0 | 7 | 8,700 | 1,518 | 0 | 258 | 560 | ||||||||||||||||||||||||||||||||||||||||
| 22 | Debt securities, including UoP | 1,563 | 237 | 208 | 0 | 2 | 39 | 18 | 0 | 0 | 0 | 255 | 208 | 0 | 2 | 39 | ||||||||||||||||||||||||||||||||||||||||
| 23 | Equity instruments | 0 | 0 | 0 | 0 | 0 | 0 | 0 | 0 | 0 | 0 | 0 | 0 | |||||||||||||||||||||||||||||||||||||||||||
| 24 | Households | 607,245 | 447,326 | 29,115 | 29,115 | 6,569 | 0 | 0 | 0 | 0 | 0 | 447,326 | 29,115 | 29,115 | 6,569 | 0 | ||||||||||||||||||||||||||||||||||||||||
| 25 | of which loans collateralised by residential immovable property | 366,626 | 356,979 | 22,545 | 22,545 | 0 | 0 | 0 | 0 | 0 | 0 | 356,979 | 22,545 | 22,545 | 0 | 0 | ||||||||||||||||||||||||||||||||||||||||
| 26 | of which building renovation loans | 528 | 528 | 0 | 0 | 0 | 0 | 0 | 0 | 0 | 0 | 528 | 0 | 0 | 0 | 0 | ||||||||||||||||||||||||||||||||||||||||
| 27 | of which motor vehicle loans | 89,820 | 89,820 | 6,569 | 6,569 | 6,569 | 0 | 89,820 | 6,569 | 6,569 | 6,569 | 0 | ||||||||||||||||||||||||||||||||||||||||||||
| 28 | Local governments financing | 122 | 122 | 0 | 0 | 0 | 0 | 0 | 0 | 0 | 0 | 122 | 0 | 0 | 0 | 0 | ||||||||||||||||||||||||||||||||||||||||
| 29 | Housing financing | 75 | 75 | 0 | 0 | 0 | 0 | 0 | 0 | 0 | 0 | 75 | 0 | 0 | 0 | 0 | ||||||||||||||||||||||||||||||||||||||||
103
| Million EUR | 2023 | |||||||||||||||||||||||||||||||||||||||||||||||||||||||
| Climate Change Mitigation (CCM) | Climate Change Adaptation (CCA) | TOTAL (CCM + CCA) | ||||||||||||||||||||||||||||||||||||||||||||||||||||||
| Total [gross] carrying amount | Of which towards taxonomy relevant sectors (Taxonomy-eligible) | Of which towards taxonomy relevant sectors (Taxonomy-eligible) | Of which towards taxonomy relevant sectors (Taxonomy-eligible) | |||||||||||||||||||||||||||||||||||||||||||||||||||||
| Of which environmentally sustainable (Taxonomy-aligned) | Of which environmentally sustainable (Taxonomy-aligned) | Of which environmentally sustainable (Taxonomy-aligned) | ||||||||||||||||||||||||||||||||||||||||||||||||||||||
| Of which Use of Proceeds | Of which transitional | Of which enabling | Of which Use of Proceeds | Of which enabling | Of which Use of Proceeds | Of which transitional | Of which enabling | |||||||||||||||||||||||||||||||||||||||||||||||||
| 30 | Other local government financing | 46 | 46 | 0 | 0 | 0 | 0 | 0 | 0 | 0 | 0 | 46 | 0 | 0 | 0 | 0 | ||||||||||||||||||||||||||||||||||||||||
| 31 | Collateral obtained by taking possession: residential and commercial immovable properties | 5,595 | 0 | 0 | 0 | 0 | 0 | 0 | 0 | 0 | 0 | 0 | 0 | 0 | 0 | 0 | ||||||||||||||||||||||||||||||||||||||||
| 32 | Assets excluded from the numerator for GAR calculation (covered in the denominator) | 621,271 | 0 | 0 | 0 | 0 | 0 | 0 | 0 | 0 | 0 | 0 | 0 | 0 | 0 | 0 | ||||||||||||||||||||||||||||||||||||||||
| 33 | Financial and Non-financial undertakings | 478,101 | ||||||||||||||||||||||||||||||||||||||||||||||||||||||
| 34 | SMEs and NFCs (other than SMEs) not subject to NFRD disclosure obligations | 141,389 | ||||||||||||||||||||||||||||||||||||||||||||||||||||||
| 35 | Loans and advances | 139,095 | ||||||||||||||||||||||||||||||||||||||||||||||||||||||
| 36 | of which loans collateralised by commercial immovable property | 22,909 | ||||||||||||||||||||||||||||||||||||||||||||||||||||||
| 37 | of which building renovation loans | 141 | ||||||||||||||||||||||||||||||||||||||||||||||||||||||
| 38 | Debt securities | 2,140 | ||||||||||||||||||||||||||||||||||||||||||||||||||||||
| 39 | Equity instruments | 155 | ||||||||||||||||||||||||||||||||||||||||||||||||||||||
| 40 | Non-EU country counterparties not subject to NFRD disclosure obligations | 296,567 | ||||||||||||||||||||||||||||||||||||||||||||||||||||||
| 41 | Loans and advances | 272,256 | ||||||||||||||||||||||||||||||||||||||||||||||||||||||
| 42 | Debt securities | 21,525 | ||||||||||||||||||||||||||||||||||||||||||||||||||||||
| 43 | Equity instruments | 2,787 | ||||||||||||||||||||||||||||||||||||||||||||||||||||||
| 44 | Derivatives | 5,421 | ||||||||||||||||||||||||||||||||||||||||||||||||||||||
| 45 | On demand interbank loans | 11,911 | ||||||||||||||||||||||||||||||||||||||||||||||||||||||
| 46 | Cash and cash-related assets | 8,621 | ||||||||||||||||||||||||||||||||||||||||||||||||||||||
| 47 | Other categories of assets (e.g. Goodwill, commodities etc.) | 117,217 | ||||||||||||||||||||||||||||||||||||||||||||||||||||||
| 48 | Total GAR assets | 1,288,300 | 464,201 | 31,142 | 29,115 | 6,834 | 799 | 474 | 9 | 0 | 8 | 464,675 | 31,151 | 29,115 | 6,834 | 807 | ||||||||||||||||||||||||||||||||||||||||
| 49 | Assets not covered for GAR calculation | 545,242 | ||||||||||||||||||||||||||||||||||||||||||||||||||||||
| 50 | Central governments and Supranational issuers | 137,606 | ||||||||||||||||||||||||||||||||||||||||||||||||||||||
| 51 | Central banks exposure | 230,835 | ||||||||||||||||||||||||||||||||||||||||||||||||||||||
| 52 | Trading book | 176,800 | ||||||||||||||||||||||||||||||||||||||||||||||||||||||
| 53 | Total assets | 1,833,542 | 464,201 | 31,142 | 29,115 | 6,834 | 799 | 474 | 9 | 0 | 8 | 464,675 | 31,151 | 29,115 | 6,834 | 807 | ||||||||||||||||||||||||||||||||||||||||
104
| Million EUR | 2023 | |||||||||||||||||||||||||||||||||||||||||||||||||||||||
| Climate Change Mitigation (CCM) | Climate Change Adaptation (CCA) | TOTAL (CCM + CCA) | ||||||||||||||||||||||||||||||||||||||||||||||||||||||
| Total [gross] carrying amount | Of which towards taxonomy relevant sectors (Taxonomy-eligible) | Of which towards taxonomy relevant sectors (Taxonomy-eligible) | Of which towards taxonomy relevant sectors (Taxonomy-eligible) | |||||||||||||||||||||||||||||||||||||||||||||||||||||
| Of which environmentally sustainable (Taxonomy-aligned) | Of which environmentally sustainable (Taxonomy-aligned) | Of which environmentally sustainable (Taxonomy-aligned) | ||||||||||||||||||||||||||||||||||||||||||||||||||||||
| Of which Use of Proceeds | Of which transitional | Of which enabling | Of which Use of Proceeds | Of which enabling | Of which Use of Proceeds | Of which transitional | Of which enabling | |||||||||||||||||||||||||||||||||||||||||||||||||
| Off-balance sheet exposures - Undertakings subject to NFRD disclosure obligations | ||||||||||||||||||||||||||||||||||||||||||||||||||||||||
| 54 | Financial guarantees | 15,573 | 494 | 142 | 0 | 3 | 98 | 6 | 0 | 0 | 0 | 500 | 142 | 0 | 3 | 99 | ||||||||||||||||||||||||||||||||||||||||
| 55 | Assets under management | 137,531 | 4,302 | 825 | 0 | 57 | 431 | 406 | 4 | 0 | 4 | 4,708 | 829 | 0 | 57 | 435 | ||||||||||||||||||||||||||||||||||||||||
| 56 | Of which debt securities | 39,836 | 3,308 | 445 | 0 | 11 | 269 | 233 | 0 | 0 | 0 | 3,541 | 446 | 0 | 11 | 269 | ||||||||||||||||||||||||||||||||||||||||
| 57 | Of which equity instruments | 43,158 | 993 | 380 | 0 | 46 | 162 | 173 | 3 | 0 | 3 | 1,167 | 384 | 0 | 46 | 165 | ||||||||||||||||||||||||||||||||||||||||
105
2. GAR sector information (Capex)
| Breakdown by sector - NACE 4 digits level (code and label) | 2023 | |||||||||||||||||||||||||||||||||||||||||||||||||||||||
| Climate Change Mitigation (CCM) | Climate Change Adaptation (CCA) | TOTAL (CCM + CCA) | ||||||||||||||||||||||||||||||||||||||||||||||||||||||
| Non-Financial corporates (Subject to NFRD) | SMEs and other NFC not subject to NFRD | Non-Financial corporates (Subject to NFRD) | SMEs and other NFC not subject to NFRD | Non-Financial corporates (Subject to NFRD) | SMEs and other NFC not subject to NFRD | |||||||||||||||||||||||||||||||||||||||||||||||||||
| [Gross] carrying amount | [Gross] carrying amount | [Gross] carrying amount | [Gross] carrying amount | [Gross] carrying amount | [Gross] carrying amount | |||||||||||||||||||||||||||||||||||||||||||||||||||
| Mn EUR | Of which environmentally sustainable (CCM) | Mn EUR | Of which environmentally sustainable (CCM) | Mn EUR | Of which environmentally sustainable (CCA) | Mn EUR | Of which environmentally sustainable (CCA) | Mn EUR | Of which environmentally sustainable (CCM+CCA) | Mn EUR | Of which environmentally sustainable (CCM+CCA) | |||||||||||||||||||||||||||||||||||||||||||||
| 1 | A Agriculture, forestry and fishing | 6 | 5 | 0 | 0 | 6 | 5 | |||||||||||||||||||||||||||||||||||||||||||||||||
| 2 | B910 - Support activities for petroleum and natural gas extraction | 151 | 77 | 0 | 0 | 151 | 77 | |||||||||||||||||||||||||||||||||||||||||||||||||
| 3 | Other B Mining and quarrying | 37 | 14 | 0 | 0 | 37 | 14 | |||||||||||||||||||||||||||||||||||||||||||||||||
| 4 | C1086 - Manufacture of homogenised food preparations and dietetic food | 69 | 0 | 0 | 0 | 69 | 0 | |||||||||||||||||||||||||||||||||||||||||||||||||
| 5 | C1920 - Manufacture of refined petroleum products | 121 | 90 | 0 | 0 | 121 | 90 | |||||||||||||||||||||||||||||||||||||||||||||||||
| 6 | C2410 - Manufacture of basic iron and steel and of ferro-alloys | 120 | 51 | 0 | 0 | 120 | 51 | |||||||||||||||||||||||||||||||||||||||||||||||||
| 7 | C2442 - Aluminium production | 62 | 39 | 0 | 0 | 62 | 39 | |||||||||||||||||||||||||||||||||||||||||||||||||
| 8 | C2732 - Manufacture of other electronic and electric wires and cables | 99 | 57 | 0 | 0 | 99 | 57 | |||||||||||||||||||||||||||||||||||||||||||||||||
| 9 | C2733 - Manufacture of wiring devices | 55 | 40 | 0 | 0 | 55 | 40 | |||||||||||||||||||||||||||||||||||||||||||||||||
| 10 | C2910 - Manufacture of motor vehicles | 516 | 190 | 0 | 0 | 516 | 190 | |||||||||||||||||||||||||||||||||||||||||||||||||
| 11 | C3011 - Building of ships and floating structures | 74 | 7 | 0 | 0 | 74 | 7 | |||||||||||||||||||||||||||||||||||||||||||||||||
| 12 | C3020 - Manufacture of railway locomotives and rolling stock | 143 | 76 | 0 | 0 | 143 | 76 | |||||||||||||||||||||||||||||||||||||||||||||||||
| 13 | Other C Manufacturing | 482 | 84 | 0 | 0 | 482 | 84 | |||||||||||||||||||||||||||||||||||||||||||||||||
| 14 | D3511 - Production of electricity | 1,594 | 1,343 | 0 | 0 | 1,594 | 1,343 | |||||||||||||||||||||||||||||||||||||||||||||||||
| 15 | D3512 - Transmission of electricity | 145 | 138 | 0 | 0 | 145 | 138 | |||||||||||||||||||||||||||||||||||||||||||||||||
| 16 | D3513 - Distribution of electricity | 512 | 399 | 0 | 0 | 512 | 399 | |||||||||||||||||||||||||||||||||||||||||||||||||
| 17 | D3514 - Trade of electricity | 315 | 295 | 0 | 0 | 315 | 295 | |||||||||||||||||||||||||||||||||||||||||||||||||
| 18 | Other D Electricity, gas, steam and air conditioning supply | 74 | 66 | 1 | 1 | 75 | 67 | |||||||||||||||||||||||||||||||||||||||||||||||||
| 19 | E Water supply | 89 | 1 | 0 | 0 | 89 | 1 | |||||||||||||||||||||||||||||||||||||||||||||||||
| 20 | F4110 - Development of building projects | 192 | 10 | 0 | 0 | 192 | 10 | |||||||||||||||||||||||||||||||||||||||||||||||||
106
| Breakdown by sector - NACE 4 digits level (code and label) | 2023 | |||||||||||||||||||||||||||||||||||||||||||||||||||||||
| Climate Change Mitigation (CCM) | Climate Change Adaptation (CCA) | TOTAL (CCM + CCA) | ||||||||||||||||||||||||||||||||||||||||||||||||||||||
| Non-Financial corporates (Subject to NFRD) | SMEs and other NFC not subject to NFRD | Non-Financial corporates (Subject to NFRD) | SMEs and other NFC not subject to NFRD | Non-Financial corporates (Subject to NFRD) | SMEs and other NFC not subject to NFRD | |||||||||||||||||||||||||||||||||||||||||||||||||||
| [Gross] carrying amount | [Gross] carrying amount | [Gross] carrying amount | [Gross] carrying amount | [Gross] carrying amount | [Gross] carrying amount | |||||||||||||||||||||||||||||||||||||||||||||||||||
| Mn EUR | Of which environmentally sustainable (CCM) | Mn EUR | Of which environmentally sustainable (CCM) | Mn EUR | Of which environmentally sustainable (CCA) | Mn EUR | Of which environmentally sustainable (CCA) | Mn EUR | Of which environmentally sustainable (CCM+CCA) | Mn EUR | Of which environmentally sustainable (CCM+CCA) | |||||||||||||||||||||||||||||||||||||||||||||
| 21 | F4120 - Construction of residential and non-residential buildings | 84 | 18 | 0 | 0 | 84 | 18 | |||||||||||||||||||||||||||||||||||||||||||||||||
| 22 | F4211 - Construction of roads and motorways | 187 | 3 | 1 | 0 | 187 | 3 | |||||||||||||||||||||||||||||||||||||||||||||||||
| 23 | F4222 - Construction of utility projects for electricity and telecommunications | 328 | 3 | 0 | 0 | 328 | 3 | |||||||||||||||||||||||||||||||||||||||||||||||||
| 24 | F4299 - Construction of other civil engineering projects n.e.c. | 156 | 5 | 0 | 0 | 156 | 5 | |||||||||||||||||||||||||||||||||||||||||||||||||
| 25 | F4312 - Site preparation | 130 | 5 | 0 | 0 | 130 | 5 | |||||||||||||||||||||||||||||||||||||||||||||||||
| 26 | F4321 - Electrical installation | 94 | 6 | 0 | 0 | 94 | 6 | |||||||||||||||||||||||||||||||||||||||||||||||||
| 27 | Other F Construction | 105 | 5 | 0 | 0 | 105 | 5 | |||||||||||||||||||||||||||||||||||||||||||||||||
| 28 | G4711 - Retail sale in non-specialised stores with food, beverages or tobacco predominating | 92 | 5 | 0 | 0 | 92 | 5 | |||||||||||||||||||||||||||||||||||||||||||||||||
| 29 | G4778 - Other retail sale of new goods in specialised stores | 94 | 0 | 0 | 0 | 94 | 0 | |||||||||||||||||||||||||||||||||||||||||||||||||
| 30 | Other G Wholesale and retail trade | 349 | 62 | 1 | 1 | 350 | 62 | |||||||||||||||||||||||||||||||||||||||||||||||||
| 31 | H4910 - Passenger rail transport, interurban | 57 | 7 | 0 | 0 | 57 | 7 | |||||||||||||||||||||||||||||||||||||||||||||||||
| 32 | H4950 - Transport via pipeline | 92 | 84 | 0 | 0 | 92 | 84 | |||||||||||||||||||||||||||||||||||||||||||||||||
| 33 | H5221 - Service activities incidental to land transportation | 425 | 2 | 0 | 0 | 425 | 2 | |||||||||||||||||||||||||||||||||||||||||||||||||
| 34 | Other H Transport and storage | 71 | 4 | 0 | 0 | 71 | 4 | |||||||||||||||||||||||||||||||||||||||||||||||||
| 35 | I5510 - Hotels and similar accommodation | 321 | 0 | 0 | 0 | 321 | 0 | |||||||||||||||||||||||||||||||||||||||||||||||||
| 36 | Other I Accommodation and food service activities | 29 | 0 | 0 | 0 | 29 | 0 | |||||||||||||||||||||||||||||||||||||||||||||||||
| 37 | J6110 - Wired telecommunications activities | 91 | 3 | 0 | 0 | 91 | 3 | |||||||||||||||||||||||||||||||||||||||||||||||||
| 38 | J6120 - Wireless telecommunications activities | 228 | 5 | 27 | 1 | 255 | 6 | |||||||||||||||||||||||||||||||||||||||||||||||||
| 39 | J6399 - Other information service activities n.e.c. | 504 | 0 | 0 | 0 | 504 | 0 | |||||||||||||||||||||||||||||||||||||||||||||||||
| 40 | Other J Information and communication | 110 | 2 | 18 | 4 | 128 | 6 | |||||||||||||||||||||||||||||||||||||||||||||||||
| 41 | L6810 - Buying and selling of own real estate | 68 | 8 | 0 | 0 | 68 | 8 | |||||||||||||||||||||||||||||||||||||||||||||||||
107
| Breakdown by sector - NACE 4 digits level (code and label) | 2023 | |||||||||||||||||||||||||||||||||||||||||||||||||||||||
| Climate Change Mitigation (CCM) | Climate Change Adaptation (CCA) | TOTAL (CCM + CCA) | ||||||||||||||||||||||||||||||||||||||||||||||||||||||
| Non-Financial corporates (Subject to NFRD) | SMEs and other NFC not subject to NFRD | Non-Financial corporates (Subject to NFRD) | SMEs and other NFC not subject to NFRD | Non-Financial corporates (Subject to NFRD) | SMEs and other NFC not subject to NFRD | |||||||||||||||||||||||||||||||||||||||||||||||||||
| [Gross] carrying amount | [Gross] carrying amount | [Gross] carrying amount | [Gross] carrying amount | [Gross] carrying amount | [Gross] carrying amount | |||||||||||||||||||||||||||||||||||||||||||||||||||
| Mn EUR | Of which environmentally sustainable (CCM) | Mn EUR | Of which environmentally sustainable (CCM) | Mn EUR | Of which environmentally sustainable (CCA) | Mn EUR | Of which environmentally sustainable (CCA) | Mn EUR | Of which environmentally sustainable (CCM+CCA) | Mn EUR | Of which environmentally sustainable (CCM+CCA) | |||||||||||||||||||||||||||||||||||||||||||||
| 42 | L6820 - Renting and operating of own or leased real estate | 264 | 1 | 0 | 0 | 264 | 1 | |||||||||||||||||||||||||||||||||||||||||||||||||
| 43 | L6831 - Real estate agencies | 205 | 26 | 0 | 0 | 205 | 26 | |||||||||||||||||||||||||||||||||||||||||||||||||
| 44 | Other L Real estate activities | 26 | 0 | 0 | 0 | 26 | 0 | |||||||||||||||||||||||||||||||||||||||||||||||||
| 45 | M6920 - Accounting, bookkeeping and auditing activities; tax consultancy | 115 | 99 | 0 | 0 | 115 | 99 | |||||||||||||||||||||||||||||||||||||||||||||||||
| 46 | M7010 - Activities of head offices | 534 | 251 | 0 | 0 | 534 | 251 | |||||||||||||||||||||||||||||||||||||||||||||||||
| 47 | M7022 - Business and other management consultancy activities | 77 | 7 | 0 | 0 | 77 | 7 | |||||||||||||||||||||||||||||||||||||||||||||||||
| 48 | M7490 - Other professional, scientific and technical activities n.e.c. | 134 | 45 | 0 | 0 | 134 | 45 | |||||||||||||||||||||||||||||||||||||||||||||||||
| 49 | Other M Professional, scientific and technical activities | 46 | 12 | 0 | 0 | 46 | 12 | |||||||||||||||||||||||||||||||||||||||||||||||||
| 50 | N7711 - Renting and leasing of cars and light motor vehicles | 130 | 48 | 0 | 0 | 130 | 48 | |||||||||||||||||||||||||||||||||||||||||||||||||
| 51 | N7712 - Renting and leasing of trucks | 60 | 5 | 0 | 0 | 60 | 5 | |||||||||||||||||||||||||||||||||||||||||||||||||
| 52 | N8299 - Other business support service activities n.e.c. | 159 | 0 | 0 | 0 | 159 | 0 | |||||||||||||||||||||||||||||||||||||||||||||||||
| 53 | Other N Administrative and support service activities | 126 | 23 | 0 | 0 | 126 | 23 | |||||||||||||||||||||||||||||||||||||||||||||||||
| 54 | O Public administration and defence, compulsory social security | 0 | 0 | 0 | 0 | 0 | 0 | |||||||||||||||||||||||||||||||||||||||||||||||||
| 55 | P Education | 14 | 0 | 0 | 0 | 14 | 0 | |||||||||||||||||||||||||||||||||||||||||||||||||
| 56 | Q Human health services and social work activities | 18 | 2 | 0 | 0 | 18 | 2 | |||||||||||||||||||||||||||||||||||||||||||||||||
| 57 | R Arts, entertainment and recreation | 2 | 0 | 0 | 0 | 2 | 0 | |||||||||||||||||||||||||||||||||||||||||||||||||
| 58 | S Other services | 519 | 63 | 7 | 0 | 525 | 63 | |||||||||||||||||||||||||||||||||||||||||||||||||
| 1. Exposures in the banking book towards those sectors covered by the Taxonomy (NACE sectors 4 levels of detail), using the relevant NACE Codes on the basis of the principal activity of the counterparty. A threshold above 0.5% of the eligible exposure has been set for reporting NACE at level 4. All other NACEs outside this threshold are reported at level 1. | ||
108
2. GAR sector information (Turnover)
| Breakdown by sector - NACE 4 digits level (code and label) | 2023 | |||||||||||||||||||||||||||||||||||||||||||||||||||||||
| Climate Change Mitigation (CCM) | Climate Change Adaptation (CCA) | TOTAL (CCM + CCA) | ||||||||||||||||||||||||||||||||||||||||||||||||||||||
| Non-Financial corporates (Subject to NFRD) | SMEs and other NFC not subject to NFRD | Non-Financial corporates (Subject to NFRD) | SMEs and other NFC not subject to NFRD | Non-Financial corporates (Subject to NFRD) | SMEs and other NFC not subject to NFRD | |||||||||||||||||||||||||||||||||||||||||||||||||||
| [Gross] carrying amount | [Gross] carrying amount | [Gross] carrying amount | [Gross] carrying amount | [Gross] carrying amount | [Gross] carrying amount | |||||||||||||||||||||||||||||||||||||||||||||||||||
| Mn EUR | Of which environmentally sustainable (CCM) | Mn EUR | Of which environmentally sustainable (CCM) | Mn EUR | Of which environmentally sustainable (CCA) | Mn EUR | Of which environmentally sustainable (CCA) | Mn EUR | Of which environmentally sustainable (CCM+CCA) | Mn EUR | Of which environmentally sustainable (CCM+CCA) | |||||||||||||||||||||||||||||||||||||||||||||
| 1 | A Agriculture, forestry and fishing | 5 | 4 | 0 | 0 | 5 | 4 | |||||||||||||||||||||||||||||||||||||||||||||||||
| 2 | B910 - Support activities for petroleum and natural gas extraction | 101 | 15 | 0 | 0 | 101 | 15 | |||||||||||||||||||||||||||||||||||||||||||||||||
| 3 | Other B Mining and quarrying | 20 | 9 | 0 | 0 | 20 | 9 | |||||||||||||||||||||||||||||||||||||||||||||||||
| 4 | C2410 - Manufacture of basic iron and steel and of ferro-alloys | 132 | 50 | 0 | 0 | 132 | 50 | |||||||||||||||||||||||||||||||||||||||||||||||||
| 5 | C2420 - Manufacture of tubes, pipes, hollow profiles and related fittings, of steel | 52 | 4 | 0 | 0 | 52 | 4 | |||||||||||||||||||||||||||||||||||||||||||||||||
| 6 | C2442 - Aluminium production | 84 | 45 | 0 | 0 | 84 | 45 | |||||||||||||||||||||||||||||||||||||||||||||||||
| 7 | C2732 - Manufacture of other electronic and electric wires and cables | 56 | 16 | 0 | 0 | 56 | 16 | |||||||||||||||||||||||||||||||||||||||||||||||||
| 8 | C2751 - Manufacture of electric domestic appliances | 48 | 0 | 0 | 0 | 48 | 0 | |||||||||||||||||||||||||||||||||||||||||||||||||
| 9 | C2910 - Manufacture of motor vehicles | 484 | 50 | 0 | 0 | 484 | 50 | |||||||||||||||||||||||||||||||||||||||||||||||||
| 10 | C3011 - Building of ships and floating structures | 81 | 10 | 0 | 0 | 81 | 10 | |||||||||||||||||||||||||||||||||||||||||||||||||
| 11 | C3020 - Manufacture of railway locomotives and rolling stock | 143 | 83 | 0 | 0 | 143 | 83 | |||||||||||||||||||||||||||||||||||||||||||||||||
| 12 | C3313 - Repair of electronic and optical equipment | 55 | 0 | 0 | 0 | 55 | 0 | |||||||||||||||||||||||||||||||||||||||||||||||||
| 13 | Other C Manufacturing | 243 | 40 | 0 | 0 | 243 | 40 | |||||||||||||||||||||||||||||||||||||||||||||||||
| 14 | D3511 - Production of electricity | 843 | 537 | 0 | 0 | 843 | 537 | |||||||||||||||||||||||||||||||||||||||||||||||||
| 15 | D3512 - Transmission of electricity | 100 | 75 | 0 | 0 | 100 | 75 | |||||||||||||||||||||||||||||||||||||||||||||||||
| 16 | D3513 - Distribution of electricity | 338 | 174 | 0 | 0 | 338 | 174 | |||||||||||||||||||||||||||||||||||||||||||||||||
| 17 | D3514 - Trade of electricity | 137 | 108 | 0 | 0 | 137 | 108 | |||||||||||||||||||||||||||||||||||||||||||||||||
| 18 | Other D Electricity, gas, steam and air conditioning supply | 30 | 8 | 0 | 0 | 30 | 8 | |||||||||||||||||||||||||||||||||||||||||||||||||
| 19 | E3600 - Water collection, treatment and supply | 53 | 1 | 0 | 0 | 53 | 1 | |||||||||||||||||||||||||||||||||||||||||||||||||
| 20 | Other E Water supply | 39 | 1 | 0 | 0 | 39 | 1 | |||||||||||||||||||||||||||||||||||||||||||||||||
109
| Breakdown by sector - NACE 4 digits level (code and label) | 2023 | |||||||||||||||||||||||||||||||||||||||||||||||||||||||
| Climate Change Mitigation (CCM) | Climate Change Adaptation (CCA) | TOTAL (CCM + CCA) | ||||||||||||||||||||||||||||||||||||||||||||||||||||||
| Non-Financial corporates (Subject to NFRD) | SMEs and other NFC not subject to NFRD | Non-Financial corporates (Subject to NFRD) | SMEs and other NFC not subject to NFRD | Non-Financial corporates (Subject to NFRD) | SMEs and other NFC not subject to NFRD | |||||||||||||||||||||||||||||||||||||||||||||||||||
| [Gross] carrying amount | [Gross] carrying amount | [Gross] carrying amount | [Gross] carrying amount | [Gross] carrying amount | [Gross] carrying amount | |||||||||||||||||||||||||||||||||||||||||||||||||||
| Mn EUR | Of which environmentally sustainable (CCM) | Mn EUR | Of which environmentally sustainable (CCM) | Mn EUR | Of which environmentally sustainable (CCA) | Mn EUR | Of which environmentally sustainable (CCA) | Mn EUR | Of which environmentally sustainable (CCM+CCA) | Mn EUR | Of which environmentally sustainable (CCM+CCA) | |||||||||||||||||||||||||||||||||||||||||||||
| 21 | F4110 - Development of building projects | 214 | 14 | 0 | 0 | 214 | 14 | |||||||||||||||||||||||||||||||||||||||||||||||||
| 22 | F4120 - Construction of residential and non-residential buildings | 81 | 12 | 0 | 0 | 81 | 12 | |||||||||||||||||||||||||||||||||||||||||||||||||
| 23 | F4211 - Construction of roads and motorways | 192 | 3 | 1 | 0 | 193 | 4 | |||||||||||||||||||||||||||||||||||||||||||||||||
| 24 | F4222 - Construction of utility projects for electricity and telecommunications | 314 | 1 | 0 | 0 | 315 | 1 | |||||||||||||||||||||||||||||||||||||||||||||||||
| 25 | F4299 - Construction of other civil engineering projects n.e.c. | 164 | 18 | 0 | 0 | 164 | 18 | |||||||||||||||||||||||||||||||||||||||||||||||||
| 26 | F4312 - Site preparation | 122 | 0 | 0 | 0 | 122 | 0 | |||||||||||||||||||||||||||||||||||||||||||||||||
| 27 | F4321 - Electrical installation | 109 | 8 | 0 | 0 | 109 | 8 | |||||||||||||||||||||||||||||||||||||||||||||||||
| 28 | Other F Construction | 105 | 15 | 0 | 0 | 105 | 15 | |||||||||||||||||||||||||||||||||||||||||||||||||
| 29 | G Wholesale and retail trade | 168 | 15 | 0 | 0 | 169 | 15 | |||||||||||||||||||||||||||||||||||||||||||||||||
| 30 | H5221 - Service activities incidental to land transportation | 421 | 1 | 0 | 0 | 421 | 1 | |||||||||||||||||||||||||||||||||||||||||||||||||
| 31 | Other H Transport and storage | 177 | 36 | 0 | 0 | 177 | 36 | |||||||||||||||||||||||||||||||||||||||||||||||||
| 32 | I5510 - Hotels and similar accommodation | 250 | 0 | 0 | 0 | 250 | 0 | |||||||||||||||||||||||||||||||||||||||||||||||||
| 33 | Other I Accommodation and food service activities | 26 | 0 | 0 | 0 | 26 | 0 | |||||||||||||||||||||||||||||||||||||||||||||||||
| 34 | J6110 - Wired telecommunications activities | 59 | 4 | 2 | 0 | 61 | 4 | |||||||||||||||||||||||||||||||||||||||||||||||||
| 35 | J6120 - Wireless telecommunications activities | 365 | 30 | 49 | 1 | 414 | 32 | |||||||||||||||||||||||||||||||||||||||||||||||||
| 36 | J6399 - Other information service activities n.e.c. | 504 | 0 | 0 | 0 | 504 | 0 | |||||||||||||||||||||||||||||||||||||||||||||||||
| 37 | Other J Information and communication | 97 | 1 | 15 | 5 | 112 | 7 | |||||||||||||||||||||||||||||||||||||||||||||||||
| 38 | L6810 - Buying and selling of own real estate | 74 | 9 | 0 | 0 | 74 | 9 | |||||||||||||||||||||||||||||||||||||||||||||||||
| 39 | L6820 - Renting and operating of own or leased real estate | 267 | 1 | 0 | 0 | 267 | 1 | |||||||||||||||||||||||||||||||||||||||||||||||||
| 40 | L6831 - Real estate agencies | 234 | 18 | 0 | 0 | 234 | 18 | |||||||||||||||||||||||||||||||||||||||||||||||||
| 41 | Other L Real estate activities | 26 | 2 | 0 | 0 | 26 | 2 | |||||||||||||||||||||||||||||||||||||||||||||||||
| 42 | M6920 - Accounting, bookkeeping and auditing activities; tax consultancy | 66 | 42 | 8 | 1 | 74 | 43 | |||||||||||||||||||||||||||||||||||||||||||||||||
| 43 | M7010 - Activities of head offices | 488 | 158 | 0 | 0 | 488 | 158 | |||||||||||||||||||||||||||||||||||||||||||||||||
110
| Breakdown by sector - NACE 4 digits level (code and label) | 2023 | |||||||||||||||||||||||||||||||||||||||||||||||||||||||
| Climate Change Mitigation (CCM) | Climate Change Adaptation (CCA) | TOTAL (CCM + CCA) | ||||||||||||||||||||||||||||||||||||||||||||||||||||||
| Non-Financial corporates (Subject to NFRD) | SMEs and other NFC not subject to NFRD | Non-Financial corporates (Subject to NFRD) | SMEs and other NFC not subject to NFRD | Non-Financial corporates (Subject to NFRD) | SMEs and other NFC not subject to NFRD | |||||||||||||||||||||||||||||||||||||||||||||||||||
| [Gross] carrying amount | [Gross] carrying amount | [Gross] carrying amount | [Gross] carrying amount | [Gross] carrying amount | [Gross] carrying amount | |||||||||||||||||||||||||||||||||||||||||||||||||||
| Mn EUR | Of which environmentally sustainable (CCM) | Mn EUR | Of which environmentally sustainable (CCM) | Mn EUR | Of which environmentally sustainable (CCA) | Mn EUR | Of which environmentally sustainable (CCA) | Mn EUR | Of which environmentally sustainable (CCM+CCA) | Mn EUR | Of which environmentally sustainable (CCM+CCA) | |||||||||||||||||||||||||||||||||||||||||||||
| 44 | M7022 - Business and other management consultancy activities | 95 | 8 | 1 | 0 | 96 | 8 | |||||||||||||||||||||||||||||||||||||||||||||||||
| 45 | M7112 - Engineering activities and related technical consultancy | 46 | 16 | 0 | 0 | 46 | 16 | |||||||||||||||||||||||||||||||||||||||||||||||||
| 46 | M7490 - Other professional, scientific and technical activities n.e.c. | 99 | 35 | 0 | 0 | 100 | 35 | |||||||||||||||||||||||||||||||||||||||||||||||||
| 47 | Other M Professional, scientific and technical activities | 3 | 0 | 0 | 0 | 3 | 0 | |||||||||||||||||||||||||||||||||||||||||||||||||
| 48 | N7711 - Renting and leasing of cars and light motor vehicles | 127 | 10 | 0 | 0 | 127 | 10 | |||||||||||||||||||||||||||||||||||||||||||||||||
| 49 | N7712 - Renting and leasing of trucks | 58 | 0 | 0 | 0 | 58 | 0 | |||||||||||||||||||||||||||||||||||||||||||||||||
| 50 | N8010 - Private security activities | 49 | 0 | 0 | 0 | 49 | 0 | |||||||||||||||||||||||||||||||||||||||||||||||||
| 51 | N8299 - Other business support service activities n.e.c. | 157 | 0 | 0 | 0 | 157 | 0 | |||||||||||||||||||||||||||||||||||||||||||||||||
| 52 | Other N Administrative and support service activities | 92 | 11 | 1 | 0 | 93 | 11 | |||||||||||||||||||||||||||||||||||||||||||||||||
| 53 | O Public administration and defence, compulsory social security | 0 | 0 | 0 | 0 | 0 | 0 | |||||||||||||||||||||||||||||||||||||||||||||||||
| 54 | P Education | 14 | 0 | 0 | 0 | 14 | 0 | |||||||||||||||||||||||||||||||||||||||||||||||||
| 55 | Q Human health services and social work activities | 17 | 1 | 0 | 0 | 17 | 1 | |||||||||||||||||||||||||||||||||||||||||||||||||
| 56 | R Arts, entertainment and recreation | 0 | 0 | 0 | 0 | 0 | 0 | |||||||||||||||||||||||||||||||||||||||||||||||||
| 57 | S Other services | 534 | 21 | 24 | 1 | 558 | 21 | |||||||||||||||||||||||||||||||||||||||||||||||||
| 1. Exposures in the banking book towards those sectors covered by the Taxonomy (NACE sectors 4 levels of detail), using the relevant NACE Codes on the basis of the principal activity of the counterparty. A threshold above 0.5% of the eligible exposure has been set for reporting NACE at level 4. All other NACEs outside this threshold are reported at level 1. | ||
111
3. GAR KPI stock (Capex)
| % (compared to total covered assets in the denominator) | 2023 | |||||||||||||||||||||||||||||||||||||||||||||||||||||||
| Climate Change Mitigation (CCM) | Climate Change Adaptation (CCA) | TOTAL (CCM + CCA) | ||||||||||||||||||||||||||||||||||||||||||||||||||||||
| Of which towards taxonomy relevant sectors (Taxonomy-eligible) | Of which towards taxonomy relevant sectors (Taxonomy-eligible) | Of which towards taxonomy relevant sectors (Taxonomy-eligible) | Proportion of total assets covered | |||||||||||||||||||||||||||||||||||||||||||||||||||||
| Of which environmentally sustainable (Taxonomy-aligned) | Of which environmentally sustainable (Taxonomy-aligned) | Of which environmentally sustainable (Taxonomy-aligned) | ||||||||||||||||||||||||||||||||||||||||||||||||||||||
| Of which Use of Proceeds | Of which transitional | Of which enabling | Of which Use of Proceeds | Of which enabling | Of which Use of Proceeds | Of which transitional | Of which enabling | |||||||||||||||||||||||||||||||||||||||||||||||||
| GAR - Covered assets in both numerator and denominator | ||||||||||||||||||||||||||||||||||||||||||||||||||||||||
| 1 | Loans and advances, debt securities and equity instruments not HfT eligible for GAR calculation | 70.4 | 5.1 | 4.4 | 1.1 | 0.2 | 0 | 0 | 0 | 0 | 70.4 | 5.1 | 4.4 | 1.1 | 0.2 | 36.1 | ||||||||||||||||||||||||||||||||||||||||
| 2 | Financial undertakings | 26.8 | 1.8 | 0 | 0 | 1.2 | 0 | 0 | 0 | 0 | 26.8 | 1.8 | 0 | 0 | 1.2 | 1.5 | ||||||||||||||||||||||||||||||||||||||||
| 3 | Credit institutions | 27.7 | 0 | 0 | 0 | 0 | 0 | 0 | 0 | 0 | 27.7 | 0 | 0 | 0 | 0 | 1.2 | ||||||||||||||||||||||||||||||||||||||||
| 4 | Loans and advances | 25.8 | 0 | 0 | 0 | 0 | 0 | 0 | 0 | 0 | 25.8 | 0 | 0 | 0 | 0 | 1.1 | ||||||||||||||||||||||||||||||||||||||||
| 5 | Debt securities, including UoP | 44.6 | 0 | 0 | 0 | 0 | 0 | 0 | 0 | 0 | 44.6 | 0 | 0 | 0 | 0 | 0.1 | ||||||||||||||||||||||||||||||||||||||||
| 6 | Equity instruments | 0 | 0 | 0 | 0 | 0 | 0 | 0 | 0 | 0 | 0 | 0 | 0 | |||||||||||||||||||||||||||||||||||||||||||
| 7 | Other financial corporations | 23.1 | 9 | 0 | 0.2 | 6.2 | 0 | 0 | 0 | 0 | 23.1 | 9 | 0 | 0.2 | 6.2 | 0.3 | ||||||||||||||||||||||||||||||||||||||||
| 8 | of which investment firms | 22 | 17.6 | 0 | 0 | 15.4 | 0 | 0 | 0 | 0 | 22 | 17.6 | 0 | 0 | 15.4 | 0.1 | ||||||||||||||||||||||||||||||||||||||||
| 9 | Loans and advances | 9.5 | 3.4 | 0 | 0 | 0.5 | 0 | 0 | 0 | 0 | 9.5 | 3.4 | 0 | 0 | 0.5 | 0.1 | ||||||||||||||||||||||||||||||||||||||||
| 10 | Debt securities, including UoP | 96 | 96 | 0 | 0 | 96 | 0 | 0 | 0 | 0 | 96 | 96 | 0 | 0 | 96 | 0 | ||||||||||||||||||||||||||||||||||||||||
| 11 | Equity instruments | 0 | 0 | 0 | 0 | 0 | 0 | 0 | 0 | 0 | 0 | 0 | 0 | |||||||||||||||||||||||||||||||||||||||||||
| 12 | of which management companies | 72 | 7.7 | 0 | 0.9 | 0.5 | 0 | 0 | 0 | 0 | 72 | 7.7 | 0 | 0.9 | 0.5 | 0 | ||||||||||||||||||||||||||||||||||||||||
| 13 | Loans and advances | 72 | 7.7 | 0 | 0.9 | 0.5 | 0 | 0 | 0 | 0 | 72 | 7.7 | 0 | 0.9 | 0.5 | 0 | ||||||||||||||||||||||||||||||||||||||||
| 14 | Debt securities, including UoP | 0 | 0 | 0 | 0 | 0 | 0 | 0 | 0 | 0 | 0 | 0 | 0 | 0 | 0 | 0 | ||||||||||||||||||||||||||||||||||||||||
| 15 | Equity instruments | 0 | 0 | 0 | 0 | 0 | 0 | 0 | 0 | 0 | 0 | 0 | 0 | |||||||||||||||||||||||||||||||||||||||||||
| 16 | of which insurance undertakings | 16.8 | 0 | 0 | 0 | 0 | 0 | 0 | 0 | 0 | 16.8 | 0 | 0 | 0 | 0 | 0.1 | ||||||||||||||||||||||||||||||||||||||||
| 17 | Loans and advances | 16.8 | 0 | 0 | 0 | 0 | 0 | 0 | 0 | 0 | 16.8 | 0 | 0 | 0 | 0 | 0.1 | ||||||||||||||||||||||||||||||||||||||||
| 18 | Debt securities, including UoP | 0 | 0 | 0 | 0 | 0 | 0 | 0 | 0 | 0 | 0 | 0 | 0 | 0 | 0 | 0 | ||||||||||||||||||||||||||||||||||||||||
| 19 | Equity instruments | 0 | 0 | 0 | 0 | 0 | 0 | 0 | 0 | 0 | 0 | 0 | 0 | |||||||||||||||||||||||||||||||||||||||||||
| 20 | Non-financial undertakings | 42.1 | 14.6 | 0 | 1.5 | 5 | 0.2 | 0 | 0 | 0 | 42.3 | 14.7 | 0 | 1.5 | 5 | 1.4 | ||||||||||||||||||||||||||||||||||||||||
| 21 | Loans and advances | 42.6 | 13.6 | 0 | 1.6 | 4.4 | 0.2 | 0 | 0 | 0 | 42.8 | 13.6 | 0 | 1.6 | 4.4 | 1.3 | ||||||||||||||||||||||||||||||||||||||||
| 22 | Debt securities, including UoP | 34.2 | 30.4 | 0 | 0 | 14.6 | 0.4 | 0 | 0 | 0 | 34.6 | 30.4 | 0 | 0 | 14.6 | 0.1 | ||||||||||||||||||||||||||||||||||||||||
| 23 | Equity instruments | 0 | 0 | 0 | 0 | 0 | 0 | 0 | 0 | 0 | 0 | 0 | 0 | |||||||||||||||||||||||||||||||||||||||||||
| 24 | Households | 73.7 | 4.8 | 4.8 | 1.1 | 0 | 0 | 0 | 0 | 0 | 73.7 | 4.8 | 4.8 | 1.1 | 0 | 33.1 | ||||||||||||||||||||||||||||||||||||||||
| 25 | of which loans collateralised by residential immovable property | 97.4 | 6.1 | 6.1 | 0 | 0 | 0 | 0 | 0 | 0 | 97.4 | 6.1 | 6.1 | 0 | 0 | 20 | ||||||||||||||||||||||||||||||||||||||||
| 26 | of which building renovation loans | 100 | 0 | 0 | 0 | 0 | 0 | 0 | 0 | 0 | 100 | 0 | 0 | 0 | 0 | 0 | ||||||||||||||||||||||||||||||||||||||||
| 27 | of which motor vehicle loans | 100 | 7.3 | 7.3 | 7.3 | 0 | 100 | 7.3 | 7.3 | 7.3 | 0 | 4.9 | ||||||||||||||||||||||||||||||||||||||||||||
112
| % (compared to total covered assets in the denominator) | 2023 | |||||||||||||||||||||||||||||||||||||||||||||||||||||||
| Climate Change Mitigation (CCM) | Climate Change Adaptation (CCA) | TOTAL (CCM + CCA) | ||||||||||||||||||||||||||||||||||||||||||||||||||||||
| Of which towards taxonomy relevant sectors (Taxonomy-eligible) | Of which towards taxonomy relevant sectors (Taxonomy-eligible) | Of which towards taxonomy relevant sectors (Taxonomy-eligible) | Proportion of total assets covered | |||||||||||||||||||||||||||||||||||||||||||||||||||||
| Of which environmentally sustainable (Taxonomy-aligned) | Of which environmentally sustainable (Taxonomy-aligned) | Of which environmentally sustainable (Taxonomy-aligned) | ||||||||||||||||||||||||||||||||||||||||||||||||||||||
| Of which Use of Proceeds | Of which transitional | Of which enabling | Of which Use of Proceeds | Of which enabling | Of which Use of Proceeds | Of which transitional | Of which enabling | |||||||||||||||||||||||||||||||||||||||||||||||||
| 28 | Local governments financing | 100 | 0 | 0 | 0 | 0 | 0 | 0 | 0 | 0 | 100 | 0 | 0 | 0 | 0 | 0 | ||||||||||||||||||||||||||||||||||||||||
| 29 | Housing financing | 100 | 0 | 0 | 0 | 0 | 0 | 0 | 0 | 0 | 100 | 0 | 0 | 0 | 0 | 0 | ||||||||||||||||||||||||||||||||||||||||
| 30 | Other local government financing | 100 | 0 | 0 | 0 | 0 | 0 | 0 | 0 | 0 | 100 | 0 | 0 | 0 | 0 | 0 | ||||||||||||||||||||||||||||||||||||||||
| 31 | Collateral obtained by taking possession: residential and commercial immovable properties | 0 | 0 | 0 | 0 | 0 | 0 | 0 | 0 | 0 | 0 | 0 | 0 | 0 | 0 | 0.3 | ||||||||||||||||||||||||||||||||||||||||
| 32 | Total GAR assets | 36.2 | 2.6 | 2.3 | 0.5 | 0.1 | 0 | 0 | 0 | 0 | 36.2 | 2.6 | 2.3 | 0.5 | 0.1 | 70.3 | ||||||||||||||||||||||||||||||||||||||||
113
3. GAR KPI stock (Turnover)
| % (compared to total covered assets in the denominator) | 2023 | |||||||||||||||||||||||||||||||||||||||||||||||||||||||
| Climate Change Mitigation (CCM) | Climate Change Adaptation (CCA) | TOTAL (CCM + CCA) | ||||||||||||||||||||||||||||||||||||||||||||||||||||||
| Of which towards taxonomy relevant sectors (Taxonomy-eligible) | Of which towards taxonomy relevant sectors (Taxonomy-eligible) | Of which towards taxonomy relevant sectors (Taxonomy-eligible) | Proportion of total assets covered | |||||||||||||||||||||||||||||||||||||||||||||||||||||
| Of which environmentally sustainable (Taxonomy-aligned) | Of which environmentally sustainable (Taxonomy-aligned) | Of which environmentally sustainable (Taxonomy-aligned) | ||||||||||||||||||||||||||||||||||||||||||||||||||||||
| Of which Use of Proceeds | Of which transitional | Of which enabling | Of which Use of Proceeds | Of which enabling | Of which Use of Proceeds | Of which transitional | Of which enabling | |||||||||||||||||||||||||||||||||||||||||||||||||
| GAR - Covered assets in both numerator and denominator | ||||||||||||||||||||||||||||||||||||||||||||||||||||||||
| 1 | Loans and advances, debt securities and equity instruments not HfT eligible for GAR calculation | 70.2 | 4.7 | 4.4 | 1 | 0.1 | 0.1 | 0 | 0 | 0 | 70.3 | 4.7 | 4.4 | 1 | 0.1 | 36.1 | ||||||||||||||||||||||||||||||||||||||||
| 2 | Financial undertakings | 28.1 | 1.1 | 0 | 0 | 0.7 | 1.3 | 0 | 0 | 0 | 29.4 | 1.1 | 0 | 0 | 0.7 | 1.5 | ||||||||||||||||||||||||||||||||||||||||
| 3 | Credit institutions | 30.6 | 0 | 0 | 0 | 0 | 0.1 | 0 | 0 | 0 | 30.7 | 0 | 0 | 0 | 0 | 1.2 | ||||||||||||||||||||||||||||||||||||||||
| 4 | Loans and advances | 29 | 0 | 0 | 0 | 0 | 0.1 | 0 | 0 | 0 | 29.1 | 0 | 0 | 0 | 0 | 1.1 | ||||||||||||||||||||||||||||||||||||||||
| 5 | Debt securities, including UoP | 44.6 | 0 | 0 | 0 | 0 | 0 | 0 | 0 | 0 | 44.6 | 0 | 0 | 0 | 0 | 0.1 | ||||||||||||||||||||||||||||||||||||||||
| 6 | Equity instruments | 0 | 0 | 0 | 0 | 0 | 0 | 0 | 0 | 0 | 0 | 0 | 0 | |||||||||||||||||||||||||||||||||||||||||||
| 7 | Other financial corporations | 17.8 | 5.5 | 0 | 0.1 | 3.7 | 6.4 | 0 | 0 | 0 | 24.2 | 5.5 | 0 | 0.1 | 3.7 | 0.3 | ||||||||||||||||||||||||||||||||||||||||
| 8 | of which investment firms | 14.1 | 8.7 | 0 | 0 | 7.8 | 2.1 | 0 | 0 | 0 | 16.1 | 8.7 | 0 | 0 | 7.8 | 0.1 | ||||||||||||||||||||||||||||||||||||||||
| 9 | Loans and advances | 8.7 | 1.3 | 0 | 0 | 0.1 | 2.8 | 0 | 0 | 0 | 11.5 | 1.3 | 0 | 0 | 0.1 | 0.1 | ||||||||||||||||||||||||||||||||||||||||
| 10 | Debt securities, including UoP | 49 | 49 | 0 | 0 | 49 | 0 | 0 | 0 | 0 | 49 | 49 | 0 | 0 | 49 | 0 | ||||||||||||||||||||||||||||||||||||||||
| 11 | Equity instruments | 0 | 0 | 0 | 0 | 0 | 0 | 0 | 0 | 0 | 0 | 0 | 0 | |||||||||||||||||||||||||||||||||||||||||||
| 12 | of which management companies | 70.2 | 12 | 0 | 0 | 0 | 0 | 0 | 0 | 0 | 70.2 | 12 | 0 | 0 | 0 | 0 | ||||||||||||||||||||||||||||||||||||||||
| 13 | Loans and advances | 70.2 | 12 | 0 | 0 | 0 | 0 | 0 | 0 | 0 | 70.2 | 12 | 0 | 0 | 0 | 0 | ||||||||||||||||||||||||||||||||||||||||
| 14 | Debt securities, including UoP | 0 | 0 | 0 | 0 | 0 | 0 | 0 | 0 | 0 | 0 | 0 | 0 | 0 | 0 | 0 | ||||||||||||||||||||||||||||||||||||||||
| 15 | Equity instruments | 0 | 0 | 0 | 0 | 0 | 0 | 0 | 0 | 0 | 0 | 0 | 0 | |||||||||||||||||||||||||||||||||||||||||||
| 16 | of which insurance undertakings | 16.7 | 0 | 0 | 0 | 0 | 16.8 | 0 | 0 | 0 | 33.5 | 0 | 0 | 0 | 0 | 0.1 | ||||||||||||||||||||||||||||||||||||||||
| 17 | Loans and advances | 16.7 | 0 | 0 | 0 | 0 | 16.8 | 0 | 0 | 0 | 33.5 | 0 | 0 | 0 | 0 | 0.1 | ||||||||||||||||||||||||||||||||||||||||
| 18 | Debt securities, including UoP | 0 | 0 | 0 | 0 | 0 | 0 | 0 | 0 | 0 | 0 | 0 | 0 | 0 | 0 | 0 | ||||||||||||||||||||||||||||||||||||||||
| 19 | Equity instruments | 0 | 0 | 0 | 0 | 0 | 0 | 0 | 0 | 0 | 0 | 0 | 0 | |||||||||||||||||||||||||||||||||||||||||||
| 20 | Non-financial undertakings | 34.2 | 6.6 | 0 | 1 | 2.3 | 0.4 | 0 | 0 | 0 | 34.6 | 6.7 | 0 | 1 | 2.3 | 1.4 | ||||||||||||||||||||||||||||||||||||||||
| 21 | Loans and advances | 35.4 | 6.2 | 0 | 1.1 | 2.3 | 0.3 | 0 | 0 | 0 | 35.7 | 6.2 | 0 | 1.1 | 2.3 | 1.3 | ||||||||||||||||||||||||||||||||||||||||
| 22 | Debt securities, including UoP | 15.2 | 13.3 | 0 | 0.2 | 2.5 | 1.2 | 0 | 0 | 0 | 16.3 | 13.3 | 0 | 0.2 | 2.5 | 0.1 | ||||||||||||||||||||||||||||||||||||||||
| 23 | Equity instruments | 0 | 0 | 0 | 0 | 0 | 0 | 0 | 0 | 0 | 0 | 0 | 0 | |||||||||||||||||||||||||||||||||||||||||||
| 24 | Households | 73.7 | 4.8 | 4.8 | 1.1 | 0 | 0 | 0 | 0 | 0 | 73.7 | 4.8 | 4.8 | 1.1 | 0 | 33.1 | ||||||||||||||||||||||||||||||||||||||||
| 25 | of which loans collateralised by residential immovable property | 97.4 | 6.1 | 6.1 | 0 | 0 | 0 | 0 | 0 | 0 | 97.4 | 6.1 | 6.1 | 0 | 0 | 20 | ||||||||||||||||||||||||||||||||||||||||
| 26 | of which building renovation loans | 100 | 0 | 0 | 0 | 0 | 0 | 0 | 0 | 0 | 100 | 0 | 0 | 0 | 0 | 0 | ||||||||||||||||||||||||||||||||||||||||
| 27 | of which motor vehicle loans | 100 | 7.3 | 7.3 | 7.3 | 0 | 100 | 7.3 | 7.3 | 7.3 | 0 | 4.9 | ||||||||||||||||||||||||||||||||||||||||||||
114
| % (compared to total covered assets in the denominator) | 2023 | |||||||||||||||||||||||||||||||||||||||||||||||||||||||
| Climate Change Mitigation (CCM) | Climate Change Adaptation (CCA) | TOTAL (CCM + CCA) | ||||||||||||||||||||||||||||||||||||||||||||||||||||||
| Of which towards taxonomy relevant sectors (Taxonomy-eligible) | Of which towards taxonomy relevant sectors (Taxonomy-eligible) | Of which towards taxonomy relevant sectors (Taxonomy-eligible) | Proportion of total assets covered | |||||||||||||||||||||||||||||||||||||||||||||||||||||
| Of which environmentally sustainable (Taxonomy-aligned) | Of which environmentally sustainable (Taxonomy-aligned) | Of which environmentally sustainable (Taxonomy-aligned) | ||||||||||||||||||||||||||||||||||||||||||||||||||||||
| Of which Use of Proceeds | Of which transitional | Of which enabling | Of which Use of Proceeds | Of which enabling | Of which Use of Proceeds | Of which transitional | Of which enabling | |||||||||||||||||||||||||||||||||||||||||||||||||
| 28 | Local governments financing | 100 | 0 | 0 | 0 | 0 | 0 | 0 | 0 | 0 | 100 | 0 | 0 | 0 | 0 | 0 | ||||||||||||||||||||||||||||||||||||||||
| 29 | Housing financing | 100 | 0 | 0 | 0 | 0 | 0 | 0 | 0 | 0 | 100 | 0 | 0 | 0 | 0 | 0 | ||||||||||||||||||||||||||||||||||||||||
| 30 | Other local government financing | 100 | 0 | 0 | 0 | 0 | 0 | 0 | 0 | 0 | 100 | 0 | 0 | 0 | 0 | 0 | ||||||||||||||||||||||||||||||||||||||||
| 31 | Collateral obtained by taking possession: residential and commercial immovable properties | 0 | 0 | 0 | 0 | 0 | 0 | 0 | 0 | 0 | 0 | 0 | 0 | 0 | 0 | 0.3 | ||||||||||||||||||||||||||||||||||||||||
| 32 | Total GAR assets | 36 | 2.4 | 2.3 | 0.5 | 0.1 | 0 | 0 | 0 | 0 | 36.1 | 2.4 | 2.3 | 0.5 | 0.1 | 70.3 | ||||||||||||||||||||||||||||||||||||||||
115
4. GAR KPI flow (Capex)
| % (compared to total covered assets in the denominator) | 2023 | |||||||||||||||||||||||||||||||||||||||||||||||||||||||
| Climate Change Mitigation (CCM) | Climate Change Adaptation (CCA) | TOTAL (CCM + CCA) | ||||||||||||||||||||||||||||||||||||||||||||||||||||||
| Of which towards taxonomy relevant sectors (Taxonomy-eligible) | Of which towards taxonomy relevant sectors (Taxonomy-eligible) | Of which towards taxonomy relevant sectors (Taxonomy-eligible) | Proportion of total new assets covered | |||||||||||||||||||||||||||||||||||||||||||||||||||||
| Of which environmentally sustainable (Taxonomy-aligned) | Of which environmentally sustainable (Taxonomy-aligned) | Of which environmentally sustainable (Taxonomy-aligned) | ||||||||||||||||||||||||||||||||||||||||||||||||||||||
| Of which Use of Proceeds | Of which transitional | Of which enabling | Of which Use of Proceeds | Of which enabling | Of which Use of Proceeds | Of which transitional | Of which enabling | |||||||||||||||||||||||||||||||||||||||||||||||||
| GAR - Covered assets in both numerator and denominator | ||||||||||||||||||||||||||||||||||||||||||||||||||||||||
| 1 | Loans and advances, debt securities and equity instruments not HfT eligible for GAR calculation | 59.5 | 6.8 | 4.7 | 3.2 | 1 | 0 | 0 | 0 | 0 | 59.5 | 6.8 | 4.7 | 3.2 | 1 | 14.5 | ||||||||||||||||||||||||||||||||||||||||
| 2 | Financial undertakings | 29.8 | 2.7 | 0 | 0 | 2.3 | 0 | 0 | 0 | 0 | 29.8 | 2.7 | 0 | 0 | 2.3 | 1.7 | ||||||||||||||||||||||||||||||||||||||||
| 3 | Credit institutions | 28.7 | 0 | 0 | 0 | 0 | 0 | 0 | 0 | 0 | 28.7 | 0 | 0 | 0 | 0 | 1.5 | ||||||||||||||||||||||||||||||||||||||||
| 4 | Loans and advances | 28.6 | 0 | 0 | 0 | 0 | 0 | 0 | 0 | 0 | 28.6 | 0 | 0 | 0 | 0 | 1.5 | ||||||||||||||||||||||||||||||||||||||||
| 5 | Debt securities, including UoP | 44 | 0 | 0 | 0 | 0 | 0 | 0 | 0 | 0 | 44 | 0 | 0 | 0 | 0 | 0 | ||||||||||||||||||||||||||||||||||||||||
| 6 | Equity instruments | 0 | 0 | 0 | 0 | 0 | 0 | 0 | 0 | 0 | 0 | 0 | 0 | |||||||||||||||||||||||||||||||||||||||||||
| 7 | Other financial corporations | 39.8 | 26.7 | 0 | 0.3 | 22.7 | 0 | 0 | 0 | 0 | 39.8 | 26.7 | 0 | 0.3 | 22.7 | 0.2 | ||||||||||||||||||||||||||||||||||||||||
| 8 | of which investment firms | 55.7 | 54.4 | 0 | 0 | 54.4 | 0 | 0 | 0 | 0 | 55.7 | 54.4 | 0 | 0 | 54.4 | 0.1 | ||||||||||||||||||||||||||||||||||||||||
| 9 | Loans and advances | 40.9 | 14 | 0 | 0 | 14 | 0 | 0 | 0 | 0 | 40.9 | 14 | 0 | 0 | 14 | 0 | ||||||||||||||||||||||||||||||||||||||||
| 10 | Debt securities, including UoP | 96 | 96 | 0 | 0 | 96 | 0 | 0 | 0 | 0 | 96 | 96 | 0 | 0 | 96 | 0 | ||||||||||||||||||||||||||||||||||||||||
| 11 | Equity instruments | 0 | 0 | 0 | 0 | 0 | 0 | 0 | 0 | 0 | 0 | 0 | 0 | |||||||||||||||||||||||||||||||||||||||||||
| 12 | of which management companies | 7.8 | 0 | 0 | 0 | 0 | 0 | 0 | 0 | 0 | 7.8 | 0 | 0 | 0 | 0 | 0 | ||||||||||||||||||||||||||||||||||||||||
| 13 | Loans and advances | 7.8 | 0 | 0 | 0 | 0 | 0 | 0 | 0 | 0 | 7.8 | 0 | 0 | 0 | 0 | 0 | ||||||||||||||||||||||||||||||||||||||||
| 14 | Debt securities, including UoP | 0 | 0 | 0 | 0 | 0 | 0 | 0 | 0 | 0 | 0 | 0 | 0 | 0 | 0 | 0 | ||||||||||||||||||||||||||||||||||||||||
| 15 | Equity instruments | 0 | 0 | 0 | 0 | 0 | 0 | 0 | 0 | 0 | 0 | 0 | 0 | |||||||||||||||||||||||||||||||||||||||||||
| 16 | of which insurance undertakings | 0.5 | 0 | 0 | 0 | 0 | 0 | 0 | 0 | 0 | 0.5 | 0 | 0 | 0 | 0 | 0 | ||||||||||||||||||||||||||||||||||||||||
| 17 | Loans and advances | 0.5 | 0 | 0 | 0 | 0 | 0 | 0 | 0 | 0 | 0.5 | 0 | 0 | 0 | 0 | 0 | ||||||||||||||||||||||||||||||||||||||||
| 18 | Debt securities, including UoP | 0 | 0 | 0 | 0 | 0 | 0 | 0 | 0 | 0 | 0 | 0 | 0 | 0 | 0 | 0 | ||||||||||||||||||||||||||||||||||||||||
| 19 | Equity instruments | 0 | 0 | 0 | 0 | 0 | 0 | 0 | 0 | 0 | 0 | 0 | 0 | |||||||||||||||||||||||||||||||||||||||||||
| 20 | Non-financial undertakings | 42.6 | 16.9 | 0 | 1.1 | 6.6 | 0.1 | 0 | 0 | 0 | 42.8 | 16.9 | 0 | 1.1 | 6.6 | 1.5 | ||||||||||||||||||||||||||||||||||||||||
| 21 | Loans and advances | 43.7 | 15 | 0 | 1.3 | 5.5 | 0.2 | 0 | 0 | 0 | 43.9 | 15.1 | 0 | 1.3 | 5.5 | 1.3 | ||||||||||||||||||||||||||||||||||||||||
| 22 | Debt securities, including UoP | 34.5 | 31.1 | 0 | 0 | 14.9 | 0 | 0 | 0 | 0 | 34.5 | 31.1 | 0 | 0 | 14.9 | 0.2 | ||||||||||||||||||||||||||||||||||||||||
| 23 | Equity instruments | 0 | 0 | 0 | 0 | 0 | 0 | 0 | 0 | 0 | 0 | 0 | 0 | |||||||||||||||||||||||||||||||||||||||||||
| 24 | Households | 66.1 | 6 | 6 | 3.9 | 0 | 0 | 0 | 0 | 0 | 66.1 | 6 | 6 | 3.9 | 0 | 11.4 | ||||||||||||||||||||||||||||||||||||||||
| 25 | of which loans collateralised by residential immovable property | 98.9 | 6.1 | 6.1 | 0 | 0 | 0 | 0 | 0 | 0 | 98.9 | 6.1 | 6.1 | 0 | 0 | 3.8 | ||||||||||||||||||||||||||||||||||||||||
| 26 | of which building renovation loans | 100 | 0 | 0 | 0 | 0 | 0 | 0 | 0 | 0 | 100 | 0 | 0 | 0 | 0 | 0 | ||||||||||||||||||||||||||||||||||||||||
| 27 | of which motor vehicle loans | 100 | 12 | 12 | 12 | 0 | 100 | 12 | 12 | 12 | 0 | 3.7 | ||||||||||||||||||||||||||||||||||||||||||||
116
| % (compared to total covered assets in the denominator) | 2023 | |||||||||||||||||||||||||||||||||||||||||||||||||||||||
| Climate Change Mitigation (CCM) | Climate Change Adaptation (CCA) | TOTAL (CCM + CCA) | ||||||||||||||||||||||||||||||||||||||||||||||||||||||
| Of which towards taxonomy relevant sectors (Taxonomy-eligible) | Of which towards taxonomy relevant sectors (Taxonomy-eligible) | Of which towards taxonomy relevant sectors (Taxonomy-eligible) | Proportion of total new assets covered | |||||||||||||||||||||||||||||||||||||||||||||||||||||
| Of which environmentally sustainable (Taxonomy-aligned) | Of which environmentally sustainable (Taxonomy-aligned) | Of which environmentally sustainable (Taxonomy-aligned) | ||||||||||||||||||||||||||||||||||||||||||||||||||||||
| Of which Use of Proceeds | Of which transitional | Of which enabling | Of which Use of Proceeds | Of which enabling | Of which Use of Proceeds | Of which transitional | Of which enabling | |||||||||||||||||||||||||||||||||||||||||||||||||
| 28 | Local governments financing | 100 | 0 | 0 | 0 | 0 | 0 | 0 | 0 | 0 | 100 | 0 | 0 | 0 | 0 | 0 | ||||||||||||||||||||||||||||||||||||||||
| 29 | Housing financing | 100 | 0 | 0 | 0 | 0 | 0 | 0 | 0 | 0 | 100 | 0 | 0 | 0 | 0 | 0 | ||||||||||||||||||||||||||||||||||||||||
| 30 | Other local government financing | 100 | 0 | 0 | 0 | 0 | 0 | 0 | 0 | 0 | 100 | 0 | 0 | 0 | 0 | 0 | ||||||||||||||||||||||||||||||||||||||||
| 31 | Collateral obtained by taking possession: residential and commercial immovable properties | 0 | 0 | 0 | 0 | 0 | 0 | 0 | 0 | 0 | 0 | 0 | 0 | 0 | 0 | 0 | ||||||||||||||||||||||||||||||||||||||||
| 32 | Total GAR assets | 17.1 | 1.9 | 1.3 | 0.9 | 0.3 | 0 | 0 | 0 | 0 | 17.1 | 1.9 | 1.3 | 0.9 | 0.3 | 50.6 | ||||||||||||||||||||||||||||||||||||||||
117
4. GAR KPI flow (Turnover)
| % (compared to total covered assets in the denominator) | 2023 | |||||||||||||||||||||||||||||||||||||||||||||||||||||||
| Climate Change Mitigation (CCM) | Climate Change Adaptation (CCA) | TOTAL (CCM + CCA) | ||||||||||||||||||||||||||||||||||||||||||||||||||||||
| Of which towards taxonomy relevant sectors (Taxonomy-eligible) | Of which towards taxonomy relevant sectors (Taxonomy-eligible) | Of which towards taxonomy relevant sectors (Taxonomy-eligible) | Proportion of total new assets covered | |||||||||||||||||||||||||||||||||||||||||||||||||||||
| Of which environmentally sustainable (Taxonomy-aligned) | Of which environmentally sustainable (Taxonomy-aligned) | Of which environmentally sustainable (Taxonomy-aligned) | ||||||||||||||||||||||||||||||||||||||||||||||||||||||
| Of which Use of Proceeds | Of which transitional | Of which enabling | Of which Use of Proceeds | Of which enabling | Of which Use of Proceeds | Of which transitional | Of which enabling | |||||||||||||||||||||||||||||||||||||||||||||||||
| GAR - Covered assets in both numerator and denominator | ||||||||||||||||||||||||||||||||||||||||||||||||||||||||
| 1 | Loans and advances, debt securities and equity instruments not HfT eligible for GAR calculation | 58.6 | 5.7 | 4.7 | 3.2 | 0.5 | 0.1 | 0 | 0 | 0 | 58.7 | 5.7 | 4.7 | 3.2 | 0.5 | 14.5 | ||||||||||||||||||||||||||||||||||||||||
| 2 | Financial undertakings | 30.1 | 1.7 | 0 | 0 | 1.4 | 0.1 | 0 | 0 | 0 | 30.2 | 1.7 | 0 | 0 | 1.4 | 1.7 | ||||||||||||||||||||||||||||||||||||||||
| 3 | Credit institutions | 30.3 | 0 | 0 | 0 | 0 | 0 | 0 | 0 | 0 | 30.3 | 0 | 0 | 0 | 0 | 1.5 | ||||||||||||||||||||||||||||||||||||||||
| 4 | Loans and advances | 30.3 | 0 | 0 | 0 | 0 | 0 | 0 | 0 | 0 | 30.3 | 0 | 0 | 0 | 0 | 1.5 | ||||||||||||||||||||||||||||||||||||||||
| 5 | Debt securities, including UoP | 44 | 0 | 0 | 0 | 0 | 0 | 0 | 0 | 0 | 44 | 0 | 0 | 0 | 0 | 0 | ||||||||||||||||||||||||||||||||||||||||
| 6 | Equity instruments | 0 | 0 | 0 | 0 | 0 | 0 | 0 | 0 | 0 | 0 | 0 | 0 | |||||||||||||||||||||||||||||||||||||||||||
| 7 | Other financial corporations | 27.8 | 16.7 | 0 | 0.1 | 13.6 | 1.3 | 0 | 0 | 0 | 29.1 | 16.7 | 0 | 0.1 | 13.6 | 0.2 | ||||||||||||||||||||||||||||||||||||||||
| 8 | of which investment firms | 29.2 | 27.6 | 0 | 0 | 27.6 | 0 | 0 | 0 | 0 | 29.2 | 27.6 | 0 | 0 | 27.6 | 0.1 | ||||||||||||||||||||||||||||||||||||||||
| 9 | Loans and advances | 37.8 | 3.8 | 0 | 0 | 3.8 | 0 | 0 | 0 | 0 | 37.8 | 3.8 | 0 | 0 | 3.8 | 0 | ||||||||||||||||||||||||||||||||||||||||
| 10 | Debt securities, including UoP | 49 | 49 | 0 | 0 | 49 | 0 | 0 | 0 | 0 | 49 | 49 | 0 | 0 | 49 | 0 | ||||||||||||||||||||||||||||||||||||||||
| 11 | Equity instruments | 0 | 0 | 0 | 0 | 0 | 0 | 0 | 0 | 0 | 0 | 0 | 0 | |||||||||||||||||||||||||||||||||||||||||||
| 12 | of which management companies | 0 | 0 | 0 | 0 | 0 | 0 | 0 | 0 | 0 | 0 | 0 | 0 | 0 | 0 | 0 | ||||||||||||||||||||||||||||||||||||||||
| 13 | Loans and advances | 0 | 0 | 0 | 0 | 0 | 0 | 0 | 0 | 0 | 0 | 0 | 0 | 0 | 0 | 0 | ||||||||||||||||||||||||||||||||||||||||
| 14 | Debt securities, including UoP | 0 | 0 | 0 | 0 | 0 | 0 | 0 | 0 | 0 | 0 | 0 | 0 | 0 | 0 | 0 | ||||||||||||||||||||||||||||||||||||||||
| 15 | Equity instruments | 0 | 0 | 0 | 0 | 0 | 0 | 0 | 0 | 0 | 0 | 0 | 0 | |||||||||||||||||||||||||||||||||||||||||||
| 16 | of which insurance undertakings | 0.5 | 0 | 0 | 0 | 0 | 43.8 | 0 | 0 | 0 | 44.3 | 0 | 0 | 0 | 0 | 0 | ||||||||||||||||||||||||||||||||||||||||
| 17 | Loans and advances | 0.5 | 0 | 0 | 0 | 0 | 43.8 | 0 | 0 | 0 | 44.3 | 0 | 0 | 0 | 0 | 0 | ||||||||||||||||||||||||||||||||||||||||
| 18 | Debt securities, including UoP | 0 | 0 | 0 | 0 | 0 | 0 | 0 | 0 | 0 | 0 | 0 | 0 | 0 | 0 | 0 | ||||||||||||||||||||||||||||||||||||||||
| 19 | Equity instruments | 0 | 0 | 0 | 0 | 0 | 0 | 0 | 0 | 0 | 0 | 0 | 0 | |||||||||||||||||||||||||||||||||||||||||||
| 20 | Non-financial undertakings | 33.8 | 7.6 | 0 | 0.8 | 2.9 | 0.4 | 0 | 0 | 0 | 34.2 | 7.6 | 0 | 0.8 | 2.9 | 1.5 | ||||||||||||||||||||||||||||||||||||||||
| 21 | Loans and advances | 36.3 | 6.8 | 0 | 0.9 | 2.9 | 0.4 | 0 | 0 | 0 | 36.7 | 6.8 | 0 | 0.9 | 3 | 1.3 | ||||||||||||||||||||||||||||||||||||||||
| 22 | Debt securities, including UoP | 15.4 | 13.6 | 0 | 0.2 | 2.5 | 0 | 0 | 0 | 0 | 15.4 | 13.6 | 0 | 0.2 | 2.5 | 0.2 | ||||||||||||||||||||||||||||||||||||||||
| 23 | Equity instruments | 0 | 0 | 0 | 0 | 0 | 0 | 0 | 0 | 0 | 0 | 0 | 0 | |||||||||||||||||||||||||||||||||||||||||||
| 24 | Households | 66.1 | 6 | 6 | 3.9 | 0 | 0 | 0 | 0 | 0 | 66.1 | 6 | 6 | 3.9 | 0 | 11.4 | ||||||||||||||||||||||||||||||||||||||||
| 25 | of which loans collateralised by residential immovable property | 98.9 | 6.1 | 6.1 | 0 | 0 | 0 | 0 | 0 | 0 | 98.9 | 6.1 | 6.1 | 0 | 0 | 3.8 | ||||||||||||||||||||||||||||||||||||||||
| 26 | of which building renovation loans | 100 | 0 | 0 | 0 | 0 | 0 | 0 | 0 | 0 | 100 | 0 | 0 | 0 | 0 | 0 | ||||||||||||||||||||||||||||||||||||||||
| 27 | of which motor vehicle loans | 100 | 12 | 12 | 12 | 0 | 100 | 12 | 12 | 12 | 0 | 3.7 | ||||||||||||||||||||||||||||||||||||||||||||
118
| % (compared to total covered assets in the denominator) | 2023 | |||||||||||||||||||||||||||||||||||||||||||||||||||||||
| Climate Change Mitigation (CCM) | Climate Change Adaptation (CCA) | TOTAL (CCM + CCA) | ||||||||||||||||||||||||||||||||||||||||||||||||||||||
| Of which towards taxonomy relevant sectors (Taxonomy-eligible) | Of which towards taxonomy relevant sectors (Taxonomy-eligible) | Of which towards taxonomy relevant sectors (Taxonomy-eligible) | Proportion of total new assets covered | |||||||||||||||||||||||||||||||||||||||||||||||||||||
| Of which environmentally sustainable (Taxonomy-aligned) | Of which environmentally sustainable (Taxonomy-aligned) | Of which environmentally sustainable (Taxonomy-aligned) | ||||||||||||||||||||||||||||||||||||||||||||||||||||||
| Of which Use of Proceeds | Of which transitional | Of which enabling | Of which Use of Proceeds | Of which enabling | Of which Use of Proceeds | Of which transitional | Of which enabling | |||||||||||||||||||||||||||||||||||||||||||||||||
| 28 | Local governments financing | 100 | 0 | 0 | 0 | 0 | 0 | 0 | 0 | 0 | 100 | 0 | 0 | 0 | 0 | 0 | ||||||||||||||||||||||||||||||||||||||||
| 29 | Housing financing | 100 | 0 | 0 | 0 | 0 | 0 | 0 | 0 | 0 | 100 | 0 | 0 | 0 | 0 | 0 | ||||||||||||||||||||||||||||||||||||||||
| 30 | Other local government financing | 100 | 0 | 0 | 0 | 0 | 0 | 0 | 0 | 0 | 100 | 0 | 0 | 0 | 0 | 0 | ||||||||||||||||||||||||||||||||||||||||
| 31 | Collateral obtained by taking possession: residential and commercial immovable properties | 0 | 0 | 0 | 0 | 0 | 0 | 0 | 0 | 0 | 0 | 0 | 0 | 0 | 0 | 0 | ||||||||||||||||||||||||||||||||||||||||
| 32 | Total GAR assets | 16.9 | 1.6 | 1.3 | 0.9 | 0.1 | 0 | 0 | 0 | 0 | 16.9 | 1.6 | 1.3 | 0.9 | 0.1 | 50.6 | ||||||||||||||||||||||||||||||||||||||||
119
5. KPI off-balance sheet exposures (Capex stock)
| % (compared to total eligible off-balance sheet assets) | 2023 | ||||||||||||||||||||||||||||||||||||||||||||||||||||
| Climate Change Mitigation (CCM) | Climate Change Adaptation (CCA) | TOTAL (CCM + CCA) | |||||||||||||||||||||||||||||||||||||||||||||||||||
| Proportion of total covered assets funding taxonomy relevant sectors (Taxonomy-eligible) | Proportion of total covered assets funding taxonomy relevant sectors (Taxonomy-eligible) | Proportion of total covered assets funding taxonomy relevant sectors (Taxonomy-eligible) | |||||||||||||||||||||||||||||||||||||||||||||||||||
| Proportion of total covered assets funding taxonomy relevant sectors (Taxonomy-aligned) | Proportion of total covered assets funding taxonomy relevant sectors (Taxonomy-aligned) | Proportion of total covered assets funding taxonomy relevant sectors (Taxonomy-aligned) | |||||||||||||||||||||||||||||||||||||||||||||||||||
| Of which Use of Proceeds | Of which transitional | Of which enabling | Of which Use of Proceeds | Of which enabling | Of which Use of Proceeds | Of which transitional | Of which enabling | ||||||||||||||||||||||||||||||||||||||||||||||
| 1 | Financial guarantees (FinGuar KPI) | 4.1 | 1.8 | 0 | 0 | 1 | 0.2 | 0 | 0 | 0 | 4.3 | 1.8 | 0 | 0 | 1 | ||||||||||||||||||||||||||||||||||||||
| 2 | Assets under management (AuM KPI) | 3.6 | 1.1 | 0 | 0.1 | 0.5 | 0 | 0 | 0 | 0 | 3.6 | 1.1 | 0 | 0.1 | 0.5 | ||||||||||||||||||||||||||||||||||||||
5. KPI off-balance sheet exposures (Turnover stock)
| % (compared to total eligible off-balance sheet assets) | 2023 | ||||||||||||||||||||||||||||||||||||||||||||||||||||
| Climate Change Mitigation (CCM) | Climate Change Adaptation (CCA) | TOTAL (CCM + CCA) | |||||||||||||||||||||||||||||||||||||||||||||||||||
| Proportion of total covered assets funding taxonomy relevant sectors (Taxonomy-eligible) | Proportion of total covered assets funding taxonomy relevant sectors (Taxonomy-eligible) | Proportion of total covered assets funding taxonomy relevant sectors (Taxonomy-eligible) | |||||||||||||||||||||||||||||||||||||||||||||||||||
| Proportion of total covered assets funding taxonomy relevant sectors (Taxonomy-aligned) | Proportion of total covered assets funding taxonomy relevant sectors (Taxonomy-aligned) | Proportion of total covered assets funding taxonomy relevant sectors (Taxonomy-aligned) | |||||||||||||||||||||||||||||||||||||||||||||||||||
| Of which Use of Proceeds | Of which transitional | Of which enabling | Of which Use of Proceeds | Of which enabling | Of which Use of Proceeds | Of which transitional | Of which enabling | ||||||||||||||||||||||||||||||||||||||||||||||
| 1 | Financial guarantees (FinGuar KPI) | 3.2 | 0.9 | 0 | 0 | 0.6 | 0 | 0 | 0 | 0 | 3.2 | 0.9 | 0 | 0 | 0.6 | ||||||||||||||||||||||||||||||||||||||
| 2 | Assets under management (AuM KPI) | 3.1 | 0.6 | 0 | 0 | 0.3 | 0.3 | 0 | 0 | 0 | 3.4 | 0.6 | 0 | 0 | 0.3 | ||||||||||||||||||||||||||||||||||||||
120
5. KPI off-balance sheet exposures (Capex flow)
| % (compared to total eligible off-balance sheet assets) | 2023 | ||||||||||||||||||||||||||||||||||||||||||||||||||||
| Climate Change Mitigation (CCM) | Climate Change Adaptation (CCA) | TOTAL (CCM + CCA) | |||||||||||||||||||||||||||||||||||||||||||||||||||
| Proportion of total covered assets funding taxonomy relevant sectors (Taxonomy-eligible) | Proportion of total covered assets funding taxonomy relevant sectors (Taxonomy-eligible) | Proportion of total covered assets funding taxonomy relevant sectors (Taxonomy-eligible) | |||||||||||||||||||||||||||||||||||||||||||||||||||
| Proportion of total covered assets funding taxonomy relevant sectors (Taxonomy-aligned) | Proportion of total covered assets funding taxonomy relevant sectors (Taxonomy-aligned) | Proportion of total covered assets funding taxonomy relevant sectors (Taxonomy-aligned) | |||||||||||||||||||||||||||||||||||||||||||||||||||
| Of which Use of Proceeds | Of which transitional | Of which enabling | Of which Use of Proceeds | Of which enabling | Of which Use of Proceeds | Of which transitional | Of which enabling | ||||||||||||||||||||||||||||||||||||||||||||||
| 1 | Financial guarantees (FinGuar KPI) | 5.9 | 2 | 0 | 0 | 1.2 | 0.4 | 0 | 0 | 0 | 6.3 | 2 | 0 | 0 | 1.2 | ||||||||||||||||||||||||||||||||||||||
| 2 | Assets under management (AuM KPI) | 7.6 | 2.2 | 0 | 0 | 1.1 | 0 | 0 | 0 | 0 | 7.6 | 2.2 | 0 | 0 | 1.1 | ||||||||||||||||||||||||||||||||||||||
5. KPI off-balance sheet exposures (Turnover flow)
| % (compared to total eligible off-balance sheet assets) | 2023 | ||||||||||||||||||||||||||||||||||||||||||||||||||||
| Climate Change Mitigation (CCM) | Climate Change Adaptation (CCA) | TOTAL (CCM + CCA) | |||||||||||||||||||||||||||||||||||||||||||||||||||
| Proportion of total covered assets funding taxonomy relevant sectors (Taxonomy-eligible) | Proportion of total covered assets funding taxonomy relevant sectors (Taxonomy-eligible) | Proportion of total covered assets funding taxonomy relevant sectors (Taxonomy-eligible) | |||||||||||||||||||||||||||||||||||||||||||||||||||
| Proportion of total covered assets funding taxonomy relevant sectors (Taxonomy-aligned) | Proportion of total covered assets funding taxonomy relevant sectors (Taxonomy-aligned) | Proportion of total covered assets funding taxonomy relevant sectors (Taxonomy-aligned) | |||||||||||||||||||||||||||||||||||||||||||||||||||
| Of which Use of Proceeds | Of which transitional | Of which enabling | Of which Use of Proceeds | Of which enabling | Of which Use of Proceeds | Of which transitional | Of which enabling | ||||||||||||||||||||||||||||||||||||||||||||||
| 1 | Financial guarantees (FinGuar KPI) | 4 | 0.5 | 0 | 0 | 0.4 | 0 | 0 | 0 | 0 | 4 | 0.5 | 0 | 0 | 0.4 | ||||||||||||||||||||||||||||||||||||||
| 2 | Assets under management (AuM KPI) | 6.5 | 2.3 | 0 | 0 | 1.7 | 0.2 | 0 | 0 | 0 | 6.7 | 2.3 | 0 | 0 | 1.7 | ||||||||||||||||||||||||||||||||||||||
121
6. Nuclear and fossil gas related activities
| Nuclear energy related activities | ||||||||
| 1 | The undertaking carries out, funds or has exposures to research, development, demonstration and deployment of innovative electricity generation facilities that produce energy from nuclear processes with minimal waste from the fuel cycle. | NO | ||||||
| 2 | The undertaking carries out, funds or has exposures to construction and safe operation of new nuclear installations to produce electricity or process heat, including for the purposes of district heating or industrial processes such as hydrogen production, as well as their safety upgrades, using best available technologies. | YES | ||||||
| 3 | The undertaking carries out, funds or has exposures to safe operation of existing nuclear installations that produce electricity or process heat, including for the purposes of district heating or industrial processes such as hydrogen production from nuclear energy, as well as their safety upgrades. | YES | ||||||
| Nuclear energy related activities | ||||||||
| 4 | The undertaking carries out, funds or has exposures to construction or operation of electricity generation facilities that produce electricity using fossil gaseous fuels. | YES | ||||||
| 5 | The undertaking carries out, funds or has exposures to construction, refurbishment, and operation of combined heat/cool and power generation facilities using fossil gaseous fuels. | YES | ||||||
| 6 | The undertaking carries out, funds or has exposures to construction, refurbishment and operation of heat generation facilities that produce heat/cool using fossil gaseous fuels. | NO | ||||||
6. Nuclear and fossil gas related activities:
Taxonomy-aligned economic activities (denominator) - Capex
Taxonomy-aligned economic activities (denominator) - Capex
| CCM+CCA | CCM | CCA | |||||||||||||||||||||
| Nuclear energy related activities | Amount | % | Amount | % | Amount | % | |||||||||||||||||
| 1 | Amount and proportion of taxonomy- aligned economic activity referred to in Section 4.26 of Annexes I and II to Delegated Regulation 2021/2139 in the denominator of the applicable KPI | 0 | 0 | 0 | 0 | 0 | 0 | ||||||||||||||||
| 2 | Amount and proportion of taxonomy- aligned economic activity referred to in Section 4.27 of Annexes I and II to Delegated Regulation 2021/2139 in the denominator of the applicable KPI | 16 | 0 | 16 | 0 | 0 | 0 | ||||||||||||||||
| 3 | Amount and proportion of taxonomy- aligned economic activity referred to in Section 4.28 of Annexes I and II to Delegated Regulation 2021/2139 in the denominator of the applicable KPI | 123 | 0 | 123 | 0 | 0 | 0 | ||||||||||||||||
| 4 | Amount and proportion of taxonomy- aligned economic activity referred to in Section 4.29 of Annexes I and II to Delegated Regulation 2021/2139 in the denominator of the applicable KPI | 0 | 0 | 0 | 0 | 0 | 0 | ||||||||||||||||
| 5 | Amount and proportion of taxonomy- aligned economic activity referred to in Section 4.30 of Annexes I and II to Delegated Regulation 2021/2139 in the denominator of the applicable KPI | 0 | 0 | 0 | 0 | 0 | 0 | ||||||||||||||||
| 6 | Amount and proportion of taxonomy- aligned economic activity referred to in Section 4.31 of Annexes I and II to Delegated Regulation 2021/2139 in the denominator of the applicable KPI | 0 | 0 | 0 | 0 | 0 | 0 | ||||||||||||||||
| 7 | Amount and proportion of other taxonomy-aligned economic activities not referred to in rows 1 to 6 above in the denominator of the applicable KPI | 33,284 | 2.6 | 33,277 | 2.6 | 7 | 0 | ||||||||||||||||
| 8 | Total applicable KPI | 33,422 | 2.6 | 33,416 | 2.6 | 7 | 0 | ||||||||||||||||
| Note 1: The denominator of the applicable KPI is 1,288,300 millions of euro | ||
6. Nuclear and fossil gas related activities:
Taxonomy-aligned economic activities (denominator) - Turnover
Taxonomy-aligned economic activities (denominator) - Turnover
| CCM+CCA | CCM | CCA | |||||||||||||||||||||
| Nuclear energy related activities | Amount | % | Amount | % | Amount | % | |||||||||||||||||
| 1 | Amount and proportion of taxonomy- aligned economic activity referred to in Section 4.26 of Annexes I and II to Delegated Regulation 2021/2139 in the denominator of the applicable KPI | 0 | 0 | 0 | 0 | 0 | 0 | ||||||||||||||||
| 2 | Amount and proportion of taxonomy- aligned economic activity referred to in Section 4.27 of Annexes I and II to Delegated Regulation 2021/2139 in the denominator of the applicable KPI | 0 | 0 | 0 | 0 | 0 | 0 | ||||||||||||||||
| 3 | Amount and proportion of taxonomy- aligned economic activity referred to in Section 4.28 of Annexes I and II to Delegated Regulation 2021/2139 in the denominator of the applicable KPI | 76 | 0 | 76 | 0 | 0 | 0 | ||||||||||||||||
| 4 | Amount and proportion of taxonomy- aligned economic activity referred to in Section 4.29 of Annexes I and II to Delegated Regulation 2021/2139 in the denominator of the applicable KPI | 0 | 0 | 0 | 0 | 0 | 0 | ||||||||||||||||
| 5 | Amount and proportion of taxonomy- aligned economic activity referred to in Section 4.30 of Annexes I and II to Delegated Regulation 2021/2139 in the denominator of the applicable KPI | 1 | 0 | 1 | 0 | 0 | 0 | ||||||||||||||||
| 6 | Amount and proportion of taxonomy- aligned economic activity referred to in Section 4.31 of Annexes I and II to Delegated Regulation 2021/2139 in the denominator of the applicable KPI | 0 | 0 | 0 | 0 | 0 | 0 | ||||||||||||||||
| 7 | Amount and proportion of other taxonomy-aligned economic activities not referred to in rows 1 to 6 above in the denominator of the applicable KPI | 31,074 | 2.4 | 31,065 | 2.4 | 9 | 0 | ||||||||||||||||
| 8 | Total applicable KPI | 31,151 | 2.4 | 31,142 | 2.4 | 9 | 0 | ||||||||||||||||
| Note 1: The denominator of the applicable KPI is 1,288,300 millions of euro | ||
122
6. Nuclear and fossil gas related activities:
Taxonomy-aligned economic activities (numerator) - Capex
Taxonomy-aligned economic activities (numerator) - Capex
| CCM+CCA | CCM | CCA | |||||||||||||||||||||
| Nuclear energy related activities | Amount | % | Amount | % | Amount | % | |||||||||||||||||
| 1 | Amount and proportion of taxonomy- aligned economic activity referred to in Section 4.26 of Annexes I and II to Delegated Regulation 2021/2139 in the numerator of the applicable KPI | 0 | 0 | 0 | 0 | 0 | 0 | ||||||||||||||||
| 2 | Amount and proportion of taxonomy- aligned economic activity referred to in Section 4.27 of Annexes I and II to Delegated Regulation 2021/2139 in the numerator of the applicable KPI | 16 | 0 | 16 | 0 | 0 | 0 | ||||||||||||||||
| 3 | Amount and proportion of taxonomy- aligned economic activity referred to in Section 4.28 of Annexes I and II to Delegated Regulation 2021/2139 in the numerator of the applicable KPI | 123 | 0.4 | 123 | 0.4 | 0 | 0 | ||||||||||||||||
| 4 | Amount and proportion of taxonomy- aligned economic activity referred to in Section 4.29 of Annexes I and II to Delegated Regulation 2021/2139 in the numerator of the applicable KPI | 0 | 0 | 0 | 0 | 0 | 0 | ||||||||||||||||
| 5 | Amount and proportion of taxonomy- aligned economic activity referred to in Section 4.30 of Annexes I and II to Delegated Regulation 2021/2139 in the numerator of the applicable KPI | 0 | 0 | 0 | 0 | 0 | 0 | ||||||||||||||||
| 6 | Amount and proportion of taxonomy- aligned economic activity referred to in Section 4.31 of Annexes I and II to Delegated Regulation 2021/2139 in the numerator of the applicable KPI | 0 | 0 | 0 | 0 | 0 | 0 | ||||||||||||||||
| 7 | Amount and proportion of other taxonomy-aligned economic activities not referred to in rows 1 to 6 above in the numerator of the applicable KPI | 33,284 | 99.6 | 33,277 | 99.6 | 7 | 0 | ||||||||||||||||
| 8 | Total amount and proportion of taxonomy-aligned economic activities in the numerator of the applicable KPI | 33,422 | 100 | 33,416 | 100 | 7 | 0 | ||||||||||||||||
6. Nuclear and fossil gas related activities:
Taxonomy-aligned economic activities (numerator) - Turnover
Taxonomy-aligned economic activities (numerator) - Turnover
| CCM+CCA | CCM | CCA | |||||||||||||||||||||
| Nuclear energy related activities | Amount | % | Amount | % | Amount | % | |||||||||||||||||
| 1 | Amount and proportion of taxonomy- aligned economic activity referred to in Section 4.26 of Annexes I and II to Delegated Regulation 2021/2139 in the numerator of the applicable KPI | 0 | 0 | 0 | 0 | 0 | 0 | ||||||||||||||||
| 2 | Amount and proportion of taxonomy- aligned economic activity referred to in Section 4.27 of Annexes I and II to Delegated Regulation 2021/2139 in the numerator of the applicable KPI | 0 | 0 | 0 | 0 | 0 | 0 | ||||||||||||||||
| 3 | Amount and proportion of taxonomy- aligned economic activity referred to in Section 4.28 of Annexes I and II to Delegated Regulation 2021/2139 in the numerator of the applicable KPI | 76 | 0.2 | 76 | 0.2 | 0 | 0 | ||||||||||||||||
| 4 | Amount and proportion of taxonomy- aligned economic activity referred to in Section 4.29 of Annexes I and II to Delegated Regulation 2021/2139 in the numerator of the applicable KPI | 0 | 0 | 0 | 0 | 0 | 0 | ||||||||||||||||
| 5 | Amount and proportion of taxonomy- aligned economic activity referred to in Section 4.30 of Annexes I and II to Delegated Regulation 2021/2139 in the numerator of the applicable KPI | 1 | 0 | 1 | 0 | 0 | 0 | ||||||||||||||||
| 6 | Amount and proportion of taxonomy- aligned economic activity referred to in Section 4.31 of Annexes I and II to Delegated Regulation 2021/2139 in the numerator of the applicable KPI | 0 | 0 | 0 | 0 | 0 | 0 | ||||||||||||||||
| 7 | Amount and proportion of other taxonomy-aligned economic activities not referred to in rows 1 to 6 above in the numerator of the applicable KPI | 31,074 | 99.8 | 31,065 | 99.7 | 9 | 0 | ||||||||||||||||
| 8 | Total amount and proportion of taxonomy-aligned economic activities in the numerator of the applicable KPI | 31,151 | 100 | 31,142 | 100 | 9 | 0 | ||||||||||||||||
123
6. Nuclear and fossil gas related activities:
Taxonomy-eligible but not taxonomy-aligned economic activities - Capex
Taxonomy-eligible but not taxonomy-aligned economic activities - Capex
| CCM+CCA | CCM | CCA | |||||||||||||||||||||
| Nuclear energy related activities | Amount | % | Amount | % | Amount | % | |||||||||||||||||
| 1 | Amount and proportion of taxonomy- eligible but not taxonomy-aligned economic activity referred to in Section 4.26 of Annexes I and II to Delegated Regulation 2021/2139 in the denominator of the applicable KPI | 0 | 0 | 0 | 0 | 0 | 0 | ||||||||||||||||
| 2 | Amount and proportion of taxonomy- eligible but not taxonomy-aligned economic activity referred to in Section 4.27 of Annexes I and II to Delegated Regulation 2021/2139 in the denominator of the applicable KPI | 0 | 0 | 0 | 0 | 0 | 0 | ||||||||||||||||
| 3 | Amount and proportion of taxonomy- eligible but not taxonomy-aligned economic activity referred to in Section 4.28 of Annexes I and II to Delegated Regulation 2021/2139 in the denominator of the applicable KPI | 0 | 0 | 0 | 0 | 0 | 0 | ||||||||||||||||
| 4 | Amount and proportion of taxonomy- eligible but not taxonomy-aligned economic activity referred to in Section 4.29 of Annexes I and II to Delegated Regulation 2021/2139 in the denominator of the applicable KPI | 84 | 0 | 84 | 0 | 0 | 0 | ||||||||||||||||
| 5 | Amount and proportion of taxonomy- eligible but not taxonomy-aligned economic activity referred to in Section 4.30 of Annexes I and II to Delegated Regulation 2021/2139 in the denominator of the applicable KPI | 13 | 0 | 13 | 0 | 0 | 0 | ||||||||||||||||
| 6 | Amount and proportion of taxonomy- eligible but not taxonomy-aligned economic activity referred to in Section 4.31 of Annexes I and II to Delegated Regulation 2021/2139 in the denominator of the applicable KPI | 0 | 0 | 0 | 0 | 0 | 0 | ||||||||||||||||
| 7 | Amount and proportion of other taxonomy-eligible but not taxonomy-aligned economic activities not referred to in rows 1 to 6 above in the denominator of the applicable KPI | 432,433 | 33.6 | 432380 | 33.6 | 54 | 0 | ||||||||||||||||
| 8 | Total amount and proportion of taxonomy eligible but not taxonomy- aligned economic activities in the denominator of the applicable KPI | 432,530 | 33.6 | 432477 | 33.6 | 54 | 0 | ||||||||||||||||
6. Nuclear and fossil gas related activities:
Taxonomy-eligible but not taxonomy-aligned economic activities - Turnover
Taxonomy-eligible but not taxonomy-aligned economic activities - Turnover
| CCM+CCA | CCM | CCA | |||||||||||||||||||||
| Nuclear energy related activities | Amount | % | Amount | % | Amount | % | |||||||||||||||||
| 1 | Amount and proportion of taxonomy- eligible but not taxonomy-aligned economic activity referred to in Section 4.26 of Annexes I and II to Delegated Regulation 2021/2139 in the denominator of the applicable KPI | 0 | 0 | 0 | 0 | 0 | 0 | ||||||||||||||||
| 2 | Amount and proportion of taxonomy- eligible but not taxonomy-aligned economic activity referred to in Section 4.27 of Annexes I and II to Delegated Regulation 2021/2139 in the denominator of the applicable KPI | 0 | 0 | 0 | 0 | 0 | 0 | ||||||||||||||||
| 3 | Amount and proportion of taxonomy- eligible but not taxonomy-aligned economic activity referred to in Section 4.28 of Annexes I and II to Delegated Regulation 2021/2139 in the denominator of the applicable KPI | 84 | 0 | 84 | 0 | 0 | 0 | ||||||||||||||||
| 4 | Amount and proportion of taxonomy- eligible but not taxonomy-aligned economic activity referred to in Section 4.29 of Annexes I and II to Delegated Regulation 2021/2139 in the denominator of the applicable KPI | 653 | 0.1 | 653 | 0.1 | 0 | 0 | ||||||||||||||||
| 5 | Amount and proportion of taxonomy- eligible but not taxonomy-aligned economic activity referred to in Section 4.30 of Annexes I and II to Delegated Regulation 2021/2139 in the denominator of the applicable KPI | 9 | 0 | 9 | 0 | 0 | 0 | ||||||||||||||||
| 6 | Amount and proportion of taxonomy- eligible but not taxonomy-aligned economic activity referred to in Section 4.31 of Annexes I and II to Delegated Regulation 2021/2139 in the denominator of the applicable KPI | 0 | 0 | 0 | 0 | 0 | 0 | ||||||||||||||||
| 7 | Amount and proportion of other taxonomy-eligible but not taxonomy-aligned economic activities not referred to in rows 1 to 6 above in the denominator of the applicable KPI | 432,780 | 33.6 | 432,313 | 33.6 | 468 | 0 | ||||||||||||||||
| 8 | Total amount and proportion of taxonomy eligible but not taxonomy- aligned economic activities in the denominator of the applicable KPI | 433,527 | 33.7 | 433,059 | 33.6 | 468 | 0 | ||||||||||||||||
124
6. Nuclear and fossil gas related activities:
Taxonomy non-eligible economic activities - Capex
Taxonomy non-eligible economic activities - Capex
| Nuclear energy related activities | Amount | % | |||||||||
| 1 | Amount and proportion of taxonomy- eligible but not taxonomy-aligned economic activity referred to in Section 4.26 of Annexes I and II to Delegated Regulation 2021/2139 in the denominator of the applicable KPI | 0 | 0 | ||||||||
| 2 | Amount and proportion of taxonomy- eligible but not taxonomy-aligned economic activity referred to in Section 4.27 of Annexes I and II to Delegated Regulation 2021/2139 in the denominator of the applicable KPI | 0 | 0 | ||||||||
| 3 | Amount and proportion of taxonomy- eligible but not taxonomy-aligned economic activity referred to in Section 4.28 of Annexes I and II to Delegated Regulation 2021/2139 in the denominator of the applicable KPI | 0 | 0 | ||||||||
| 4 | Amount and proportion of taxonomy- eligible but not taxonomy-aligned economic activity referred to in Section 4.29 of Annexes I and II to Delegated Regulation 2021/2139 in the denominator of the applicable KPI | 0 | 0 | ||||||||
| 5 | Amount and proportion of taxonomy- eligible but not taxonomy-aligned economic activity referred to in Section 4.30 of Annexes I and II to Delegated Regulation 2021/2139 in the denominator of the applicable KPI | 0 | 0 | ||||||||
| 6 | Amount and proportion of taxonomy- eligible but not taxonomy-aligned economic activity referred to in Section 4.31 of Annexes I and II to Delegated Regulation 2021/2139 in the denominator of the applicable KPI | 0 | 0 | ||||||||
| 7 | Amount and proportion of other taxonomy-eligible but not taxonomy-aligned economic activities not referred to in rows 1 to 6 above in the denominator of the applicable KPI | 822,367 | 63.8 | ||||||||
| 8 | Total amount and proportion of taxonomy eligible but not taxonomy- aligned economic activities in the denominator of the applicable KPI | 822,367 | 63.8 | ||||||||
6. Nuclear and fossil gas related activities:
Taxonomy non-eligible economic activities - Turnover
Taxonomy non-eligible economic activities - Turnover
| Nuclear energy related activities | Amount | % | |||||||||
| 1 | Amount and proportion of economic activity referred to in row 1 of Template 1 that is taxonomy-non-eligible in accordance with Section 4.26 of Annexes I and II to Delegated Regulation 2021/2139 in the denominator of the applicable KPI | 0 | 0 | ||||||||
| 2 | Amount and proportion of economic activity referred to in row 1 of Template 1 that is taxonomy-non-eligible in accordance with Section 4.26 of Annexes I and II to Delegated Regulation 2021/2139 in the denominator of the applicable KPI | 0 | 0 | ||||||||
| 3 | Amount and proportion of economic activity referred to in row 1 of Template 1 that is taxonomy-non-eligible in accordance with Section 4.26 of Annexes I and II to Delegated Regulation 2021/2139 in the denominator of the applicable KPI | 0 | 0 | ||||||||
| 4 | Amount and proportion of economic activity referred to in row 1 of Template 1 that is taxonomy-non-eligible in accordance with Section 4.26 of Annexes I and II to Delegated Regulation 2021/2139 in the denominator of the applicable KPI | 0 | 0 | ||||||||
| 5 | Amount and proportion of economic activity referred to in row 1 of Template 1 that is taxonomy-non-eligible in accordance with Section 4.26 of Annexes I and II to Delegated Regulation 2021/2139 in the denominator of the applicable KPI | 0 | 0 | ||||||||
| 6 | Amount and proportion of economic activity referred to in row 1 of Template 1 that is taxonomy-non-eligible in accordance with Section 4.26 of Annexes I and II to Delegated Regulation 2021/2139 in the denominator of the applicable KPI | 0 | 0 | ||||||||
| 7 | Amount and proportion of other taxonomy-non-eligible economic activities not referred to in rows 1 to 6 above in the denominator of the applicable KPI | 823,644 | 63.9 | ||||||||
| 8 | Total amount and proportion of taxonomy-non-eligible economic activities in the denominator of the applicable KPI | 823,644 | 63.9 | ||||||||
125
9.6 Sustainable finance and investment classification system (SFICS)
GRI FS8
Sustainable finance is key to meeting our ambition to be net zero carbon emissions by 2050. We continue to build on our sustainable finance guidelines, which we first published in February 2022. In 2023, we updated them based on developments in regulation and market practice. The latest version also includes socially responsible investment standards and is now called the Sustainable finance and investment classification system (SFICS).
The SFICS outlines common standards to consider an asset or activity as environmental, social or sustainable in all the Group’s units and businesses. It draws on such international market guidelines, standards and principles as the EU Taxonomy (including the four new environmental targets for 2023), ICMA Principles, LMA Principles, UNEP FI Framework and the Climate Bonds Standard.
The SFICS enables us to track our sustainable activity, support product development and mitigate greenwashing risk.
We updated the SFICS based on lessons learned and market trends. It now features:
 | A sustainability approach for customers that complements the activity-based approach. | ||||
 | Additional details on manufacturing, real estate, sustainable agriculture and other activities. | ||||
| New activities that come to light on the back of developments in the EU Taxonomy and to cover new environmental goals related to water, waste, the circular economy and biodiversity. | ||||
We will continue working to evolve the SFICS in line with market developments and business practice, to have a comprehensive set of criteria that enables us to classify green and transition activities to support our customers transition and contribute to our net zero ambition.
| Internationally recognized sector principles and guidelines that the SFICS draws on | ||||||||||||||||||||||||||||||||
| EU taxonomy | ICMA Green/Social Bond Principles | LMA Green Loan Principles | LMA Sustainability Linked Loan Principles | ICMA Sustainability Linked Bond Principles | Febraban taxonomy (Brazil) | UNEP FI framework | Climate Bond Standards | |||||||||||||||||||||||||
| Eligible products | ||||||||||||||||||||||||||||||||
Dedicated purpose | Sustainability-linked financing | |||||||||||||||||||||||||||||||
→Proceeds go towards eligible environmental and social activities and initiatives. →Eligibility criteria: Activities with a specific environmental and social purpose under accepted standards that follow internationally recognized sector guidelines and principles (ICMA, LMA, Climate Bonds Standard) and the EU Taxonomy. | →Sustainability-linked transactions designed to help our customers achieve their ESG objectives. →Transaction structured to achieve pre-determined sustainability performance targets (ESG ratings and metrics). →Alignment with sector standards (ICMA and LMA). | |||||||||||||||||||||||||||||||
Update in 2023 to the Green, social and sustainability funding global framework
Updated in 2023, this framework is the reference for all environmental, social and sustainability-labelled funding instruments traded in sustainable capital markets and enables all Grupo Santander entities to issue based on it. It replaces our previous Global sustainable bond and Green bond frameworks.
Consistent with best market practice and investor expectations, it covers use of proceeds, project assessment and selection, management of proceeds and reporting in line with the International Capital Market Association’s (ICMA) and Loan Market Association’s (LMA) guidelines. It is also consistent with the SFICS.
126
9.7 Scope of information
The following table outlines the scope of information in the different areas of information of this chapter.
Where specific limitations exist for one or more indicators, when these are significant, they are reflected in each corresponding section and in the GRI (Global Reporting Initiative) Content Index.
| Topics | Scope of information | |||||||
| Business conduct | ||||||||
| Ethical channel | Main Group companies in: Argentina, Brazil, Chile, Spain, Mexico, Poland, Portugal, United Kingdom, United States, Uruguay, Colombia, Peru, Switzerland, Bahamas, and Digital Consumer Bank subsidiaries and branches. | |||||||
| Socio-environmental risk (Equator Principles) | Full Group scope (Corporate & Investment Banking business). | |||||||
| Responsible procurement | Main companies of the Group in: Argentina, Brazil, Chile, Germany, Mexico, Portugal, Spain, United Kingdom, United States and United States. | |||||||
Acting responsibly towards customers | ||||||||
NPS and customer satisfaction | Main companies of the Group in: Argentina, Brazil, Chile, Spain, United States, Mexico, Poland, Portugal and United Kingdom, Uruguay. | |||||||
| Customer complaints | All Group entities (>1% of reported claims volume in 2023) | |||||||
| Financial health and inclusion | Main companies of the Group in: Argentina, Brazil, Colombia, Chile, Chile, Germany, Mexico, Peru, Poland, Portugal, Spain, United Kingdom, United States and Uruguay. | |||||||
Acting responsibly towards our employees | ||||||||
| Employees | Full Group scope | |||||||
Supporting communities | ||||||||
| Support for higher education, employability and entrepreneurship | Main companies of the Group in: Argentina, Brazil, Chile, Germany, Mexico, Poland, Portugal, Spain, United Kingdom, United States, United Kingdom and Uruguay, in addition to Fundación Universia. | |||||||
| Other community support programmes | Main Group companies in: Germany, Argentina, Brazil, Colombia, Chile, Spain, United States, Mexico, Poland, Portugal, United Kingdom, Uruguay, and the rest of the countries in which DCB operates, as well as Foundations associated to the Group (e.g. Fund. Banco Santander in Spain, Santander Foundation in the UK, etc). | |||||||
| Supporting the green transition | ||||||||
| Green finance | Corporate & Investment Banking. | |||||||
| Portfolio alignment | Corporate & Investment Banking for thermal coal, power generation, energy (oil & gas), aviation, steel and auto manufacturing portfolios. DCB for the auto loan portfolio. | |||||||
| Agreements with multilateral development banks | Full Group scope. Companies that have signed financing operations (loans, guarantees, risk, sharings or securitisations) with multilateral development banks (MDBs). | |||||||
| Environmental footprint | Wholly owned companies in: Argentina, Brazil, Chile, Germany, Mexico, Poland, Portugal, Spain, the United Kingdom and the United States. | |||||||
Responsible investment | ||||||||
| SRI AuMs | Wealth Management & Insurance: SAM and Private Banking | |||||||
| Other topics | ||||||||
| Corporate governance | Banco Santander, S.A. | |||||||
| Customers | Full Group scope | |||||||
| Tax contribution | Full Group scope | |||||||
| Litigation and penalties | Full Group scope | |||||||
| Communications with shareholders and investors | Banco Santander, S.A. | |||||||
127
9.8 Alternative performance measures (APMs)
The following are additional alternative performance measures (APMs) to those listed in section 8 of the chapter 'Economic and Financial Review'.
Data related to tax contribution
The profits obtained, and the taxes accrued and paid, correspond to the countries where we operate.
Taxes paid by the Group | The taxes Santander pays directly are included in the cash flow statement and mainly stem from the corporate income tax paid. They also include non-recoverable value added tax (VAT), employers' social security contributions, charges levied on banks and financial transactions in the geographies were we operate, and other taxes.. | It reflects how the Bank complies with its commitment to tax transparency in the jurisdictions where it operates. Additionally, the "Taxes paid by the Group" metric is a requirement of the GRI standard, GRI 201-1: Direct economic value generated and distributed. For more information see: https://www.globalreporting.org/ | ||||||||||||
Third-party taxes | These are those generated by the development of our economic activity. This is the sum of salary withholdings and employees' social security contributions, recoverable VAT, tax deduced at source on capital, non-resident taxes, property taxes, stamp taxes, taxes related to the financial activity, and others. | |||||||||||||
| Total tax contribution | The Group's total tax contribution includes the taxes paid by the Group as a direct cost and the taxes collected from third parties in the course of our economic activity. | |||||||||||||
Data related to the country by country report
Revenue from third-party sales | Revenue from intra-group transactions with other tax jurisdictions includes interest income; interest expenses; commission income and expenses for transactions between Santander companies whose residence is in different tax jurisdictions; and intra-group income, excluded from total income in the consolidated income statement because counterparty expense is recorded under another item of the consolidated income statement not included in total income. | Metrics required by GRI 207-4: Country-by-Country Report. This standard requires the presentation of a country-by-country report with financial, economic and tax information on each jurisdiction in which Grupo Santander operates. These indicators are complemented by the other indicators (not considered alternative performance measures) available in Appendix VI. Annual banking report of the Group's annual accounts (see page 824 of the annual accounts). For more information see: https://www.globalreporting.org/ | ||||||||||||
Revenue from intra-group transactions with other tax jurisdictions | ||||||||||||||
Tangible assets other than cash and cash equivalents | Composed of tangible assets, non-current assets held for sale and inventories. | |||||||||||||
Corporate income tax accrued on profit/loss | The accrued corporate income tax is a current-year expense and does not include deferred taxes. | |||||||||||||
128
Data related to sustainable finance
| Green finance raised and facilitated | Nominal amount of project finance, financial advisory, project bonds, green bonds (DCM), export finance (ECA), mergers and acquisitions (M&A), and equity capital markets (ECM) transactions ranked by the SCFS panel and reported in the League Tables of Dealogic, Inframation News, TXF and Mergermarket since the beginning of the year. See data in section 2.6 Supporting a green transition and 8.6 Green transition (table 36. Green finance) in this chapter. | It reflects Santander's commitment and contribution to helping our customers, and society as a whole, in the transition to a low-carbon economy. | ||||||||||||
| Financing volume of renewable energy projects | Nominal amount of renewable energy projects (greenfield and brownfield) financed since the beginning of the year and reported externally as reported in Infralogic's League Tables for project financing. | |||||||||||||
| Financing volume of renewable electric vehicles | Financing volume of vehicles powered exclusively by a rechargeable electric battery (no petrol engine). | |||||||||||||
Credit disbursed to microentrepreneurs (EUR) | Total amount of credit disbursed during the year to low-income entrepreneurs with low access to banking services, or with difficulties in accessing credit, with the objective of creating and/or growing their businesses. Data includes information on microfinance programmes in Brazil, Colombia, Mexico and Peru. See data in section IV. 2023 highlights and 8.3 Financial inclusion (table 9. Microfinance) of this chapter. | It reflects Santander's commitment and contribution to help address financial inclusion challenges in the markets where we operate. | ||||||||||||
Data related to responsible investment
Socially responsible investment assets under management (SRI AUM) | Value corresponding to total volume of assets under management registered as article 8 - promoting ESG characteristics - and 9 - with explicit sustainability objectives - of the SFDR regulation (EU Reg. 2019/2088) except for illiquid investments in Private Banking which are reported in terms of committed capital. Includes assets managed by Santander Asset Management (SAM) in the EU and with equivalent criteria in geographies where SFDR does not apply (mainly Latam) and Third Party Funds. | It reflects Santander's commitment and contribution to promote responsible investment. It also allows our managers to have a more complete vision of the assets in which to invest and identify competitive advantages and prevent potential risks. | ||||||||||||
Data related to employees training
Cost per hour | Sum of total training expenditure divided by total hours of training completed by active employees in the period. | It reflects the bank's commitment to training and lifelong learning for its employees. | ||||||||||||
Investment per employee | Total expenditure on training divided by the average number of employees per year. | |||||||||||||
Total investment in training | Sum of all expenditures accrued in Learning Activities, during the period, including: Direct costs from trainers who are employed as Employees (i.e. Total Compensation prorated for the dedication to training activities), but not including Salaries of Learning and Development Employees, External suppliers / vendors expenses paid and budgeted by the Learning department (for any type of service: training design, training sessions delivery, communications, consulting), logistic and facilities costs (training rooms, catering, accommodation and travel, materials), Labour cost of employees within the Learning Department (actual amounts accrued during the period, including gross compensation - all items-, plus company taxes - contributions, ), IT costs and licenses plus their applicable services; expenditures in Marketing and Communications paid and budgeted by the Learning Department.; Other expenses | |||||||||||||
129
Data related to community investment
At Banco Santander, we measure our investment in community outreach according to the Business for Societal Impact (B4SI)1 methodology, which is an international benchmark for the Global Reporting Initiative (GRI), S&P Dow Jones Sustainability Index and other standards and indices.
Support (investment) for education, employment and entrepreneurship | Total amount invested to support education, employment and entrepreneurship. See data in section 6. Supporting communities and 8.4 Community investment (table 10. Community investment)of this chapter. | It reflects Santander's commitment and contribution to promoting (beyond our business operations) the progress and inclusive and sustainable growth of the communities where we are present. | ||||||||||||
Support (investment) for other local initiatives | Total amount invested through local initiatives to promote childhood education, social welfare (especially among vulnerable groups), art and culture. See data in section 6. Supporting communities and 8.4 Community investment (table 10. Community investment)of this chapter. | |||||||||||||
Total community investment | Sum of investment in education, employability and entrepreneurship, plus investment in other community support programmes. See data in section 6. Supporting communities and 8.4 Community investment (table 10. Community investment)of this chapter. | |||||||||||||
Data related to suppliers
Payments to suppliers | Total amount of payments made to suppliers outside the Group (excludes payments made by the Group in Poland). | It reflects the Group's economic contribution through the purchase of products and services in its operations. It also reflects our commitment to the local economies of the geographies in which we operate. | ||||||||||||
% Turnover of locally contracted suppliers (M EUR) | % of the Group's total turnover made to suppliers based in the same geography where the services are purchased (excludes payments made by the Group in Poland). Turnover from locally contracted suppliers is divided by total turnover to suppliers. | |||||||||||||
Specific data requested by ESG standards
GRI 201 -1. Direct economic value generated and distributed | Direct economic value generated and distributed (EVG&D) on an accruals basis, including the basic components for the organization’s global operations as listed below. i.Direct economic value generated: revenues; ii.Economic value distributed: operating costs, employee wages and benefits, payments to providers of capital, payments to government by country, and community investments; iii.Economic value retained: ‘direct economic value generated’ less ‘economic value distributed’. | Economic performance indicator that reflects how an organisation has generated economic wealth for its stakeholders. It is a requirement of the GRI standard (201-1: Direct economic value generated and distributed). For more information see: https://www.globalreporting.org/ | ||||||||||||
130
10. Sustainability reporting standards
and references
and references
131
10.1 Non-financial information
Act 11/2018 content index
Act 11/2018 content index
Table of equivalences with reporting requirements under Spain's Act 11/2018
| Non-financial information to be disclosed | Chapter/section of the annual report | Correspondence with GRI indicators/Other regulations | |||||||||||||||
| 0. General Information | Brief description of the Group’s business model (including its business environment, organization and structure, markets, objectives and strategies, plus the main factors and trends that can affect its future performance). | GRI 2-1 GRI 2-2 GRI 2-3 GRI 2-4 GRI 2-5 GRI 2-6 GRI 2-7 GRI 2-22 | |||||||||||||||
A description of the Group's policies that includes due diligence procedures for identifying, assessing, preventing and mitigating risks and significant impacts, and for verifying and controlling, including the measures in which they have been adopted): | Main internal regulation and governance (p. 92); Business conduct (p. 64) (Environmental, social and climate change risk management section). | GRI 2-23 GRI 3-3 | |||||||||||||||
The results of these policies, including key indicators of relevant non-financial results that allow the monitoring and evaluation of progress and that favour the comparability between companies and sectors, in accordance with national, European or international frameworks of reference used for each matter. | GRI 2-24 GRI 3-3 | ||||||||||||||||
The main risks related to these matters associated with the Group's activities (business relationships, products or services) that may have a negative effect in these areas, and how the Group manages these risks, explaining the procedures used to detect and assess them in accordance with national, European or international frameworks of reference for each matter. It must include information about the impacts that have been detected, offering a breakdown, in particular of the main risks in the short, medium and long term. | GRI 2-12 | ||||||||||||||||
132
| Non-financial information to be disclosed | Chapter/section of the annual report | Correspondence with GRI indicators/Other regulations | |||||||||||||||
1. Environmental Information | Detailed information on the current and foreseeable effects of the activities of the company in the environment and, where appropriate, health and safety, environmental evaluation or certification procedures; the resources dedicated to the prevention of environmental risks; the application of the principle of caution, the amount of provisions and guarantees for environmental risks. | At the end of the 2023 financial year, no significant account is presented in the Consolidated Annual Accounts of the Group that should be included in this chapter regarding environmental provisions or guarantees. | GRI 2-12 GRI 2-23 GRI 3-3 | ||||||||||||||
| Contamination: | |||||||||||||||||
Measures to prevent, reduce or repair CO2 emissions that seriously affect the environment, taking into account any form of air pollution, including noise and light pollution. | GRI 3-3 GRI 305-5 | ||||||||||||||||
| Circular economy and waste prevention and management: | |||||||||||||||||
| Waste prevention measures, waste recycling measures, waste reuse measures; other forms of waste recovery and reuse; actions against food waste. | GRI 3-3 GRI 301-1 GRI 306-2 | ||||||||||||||||
| Sustainable use of resources: | |||||||||||||||||
| Use and supply of water according to local limitations | GRI 303-5 | ||||||||||||||||
| Consumption of raw materials and measures taken to improve the efficiency of its use. | GRI 301-1 | ||||||||||||||||
| Energy: direct and indirect consumption, measures taken to improve energy efficiency, use of renewable energies | GRI 3-3 GRI 302-1 GRI 302-3 GRI 302-4 | ||||||||||||||||
| Climate change: | |||||||||||||||||
| Important elements of greenhouse gas emissions generated as a business activity (including goods and services produced) | GRI 3-3 GRI 305-1 GRI 305-2 GRI 305-3 GRI 305-4 | ||||||||||||||||
| Measures taken to adapt to the consequences of climate change | GRI 3-3 GRI 201-2 | ||||||||||||||||
| Reduction targets voluntarily established in the medium and long term to reduce greenhouse gas emissions and means implemented for this purpose. | GRI 2-23 GRI 3-3 | ||||||||||||||||
| Protection of biodiversity: | |||||||||||||||||
| Measures taken to preserve or restore biodiversity | GRI 304-2 | ||||||||||||||||
| Impacts caused by the activities or operations of protected areas | |||||||||||||||||
133
| Non-financial information to be disclosed | Chapter/section of the annual report | Correspondence with GRI indicators/Other regulations | |||||||||||||||
| 2. Social | Employment: | ||||||||||||||||
| Total number and distribution of employees by gender, age, country and professional classification | GRI 2-7 GRI 3-3 GRI 405-1 | ||||||||||||||||
Total number and distribution of contracts modes and annual average of undefined contracts, temporary contracts, and part-time contracts by: sex, age and professional classification. | GRI 2-7 GRI 405-1 | ||||||||||||||||
Number of dismissals by: gender, age and professional classification. | GRI 401-1 | ||||||||||||||||
Average remuneration and its progression broken down by gender, age and professional classification | GRI 405-2 | ||||||||||||||||
Salary gap and remuneration of equal or average jobs in society | GRI 3-3 GRI 405-2 | ||||||||||||||||
Average remuneration of directors and executives (including variable remuneration, allowances, compensation, payment to long-term savings forecast systems and any other payment broken down by gender) | GRI 2-19 GRI 2-20 GRI 3-3 GRI 405-2 | ||||||||||||||||
Implementation of work disconnection policies | GRI 3-3 | ||||||||||||||||
Employees with disabilities | GRI 405-1 | ||||||||||||||||
| Organization of work: | |||||||||||||||||
Organization of work time | GRI 3-3 | ||||||||||||||||
Number of absent hours | GRI 403-9 GRI 403-10 | ||||||||||||||||
Measures designed to facilitate work-life balance and encourage a jointly responsible use of said measures by parents | GRI 3-3 | ||||||||||||||||
| Health and safety: | |||||||||||||||||
Conditions of health and safety in the workplace | GRI 3-3 | ||||||||||||||||
Occupational accidents, in particular their frequency and severity, as well as occupational illnesses. Broken down by gender. | GRI 403-9 GRI 403-10 | ||||||||||||||||
| Social relations: | |||||||||||||||||
Organization of social dialogue (including procedures to inform and consult staff and negotiate with them) | GRI 3-3 | ||||||||||||||||
Percentage of employees covered by collective bargaining agreements by country | GRI 2-30 | ||||||||||||||||
Balance of the collective bargaining agreements (particularly in the field of health and safety in the workplace) | GRI 403-1 GRI 403-4 | ||||||||||||||||
| Mechanisms and procedures that employers have for encouraging the involvement of workers in management of the company, in terms of information, consultation and participation | |||||||||||||||||
| Training: | |||||||||||||||||
The policies implemented in the field of training | GRI 3-3 GRI 404-2 | ||||||||||||||||
Total number of hours of training by professional categories. | GRI 404-1 | ||||||||||||||||
134
| Non-financial information to be disclosed | Chapter/section of the annual report | Correspondence with GRI indicators/Other regulations | |||||||||||||||
| 2. Social | Accessibility: | ||||||||||||||||
Universal accessibility of people | GRI 3-3 | ||||||||||||||||
| Equality: | |||||||||||||||||
Measures taken to promote equal treatment and opportunities between women and men, Equality plans (Chapter III of Organic Law 3/2007, of 22 March, for the effective equality of women and men), measures taken to promote employment, protocols against sexual and gender-based harassment, Policy against all types of discrimination and, where appropriate, integration of protocols against sexual and gender-based harassment and protocols against all types of discrimination and, where appropriate, management of diversity | GRI 3-3 | ||||||||||||||||
| 3. Human Rights | Application of due diligence procedures in the field of Human Rights | GRI 2-25 GRI 3-3 | |||||||||||||||
| Prevention of the risks of Human Rights violations and, where appropriate, measures to mitigate, manage and repair any possible abuses committed | GRI 2-23 GRI 2-24 GRI 2-25 GRI 2-26 | ||||||||||||||||
| Complaints about cases of human rights violations | GRI 406-1 | ||||||||||||||||
| Promotion and compliance with the provisions of the fundamental conventions of the International Labour Organization regarding respect for freedom of association and the right to collective bargaining. | GRI 3-3 | ||||||||||||||||
| Elimination of discrimination in respect of employment and occupation; elimination of forced or compulsory labour; and the effective abolition of child labour. | Business conduct (p. 64) (Environmental, social and climate change risk management and Human rights sections) | GRI 2-23 GRI 3-3 GRI 406-1 | |||||||||||||||
| 4. Fight against corruption | Measures taken to prevent corruption and bribery | Main internal regulations and governance (p. 92); Business conduct (p. 64) (Financial crime compliance section). Risk, compliance and conduct management chapter: 7.2 Compliance and conduct risk management section (p. 497). | GRI 2-23 GRI 2-26 GRI 3-3 GRI 205-1 GRI 205-2 | ||||||||||||||
| Measures to combat money laundering | Main internal regulations and governance (p. 92); Business conduct (p. 64) (Financial crime compliance section). Risk, compliance and conduct management chapter: 7.2 Compliance and conduct risk management section (p. 497). | GRI 2-23 GRI 2-26 GRI 3-3 GRI 205-1 GRI 205-2 | |||||||||||||||
| Contributions to non-profit foundations and entities | GRI 413-1 | ||||||||||||||||
135
| Non-financial information to be disclosed | Chapter/section of the annual report | Correspondence with GRI indicators/Other regulations | |||||||||||||||
| 5. Information on the company | Commitments of the company to sustainable development: | ||||||||||||||||
| The impact of the company’s activity on employment and local development | GRI 3-3 GRI 203-1 GRI 203-2 GRI 413-1 GRI 413-2 | ||||||||||||||||
| The impact of the company’s activity on local towns and villages and in the country. | GRI 203-1 GRI 203-2 GRI 411-1 GRI 413-1 GRI 413-2 | ||||||||||||||||
| Relations maintained with the representatives of local communities and the modalities of dialogue with them. | GRI 2-29 | ||||||||||||||||
| Association or sponsorship actions | Santander participates in the sectoral associations representing financial activity in the countries in which it operates, such as the AEB in the case of Spain. | GRI 2-28 | |||||||||||||||
| Outsourcing and suppliers: | |||||||||||||||||
| Inclusion of social, gender equality and environmental issues in the procurement policy | GRI 2-6 GRI 3-3 | ||||||||||||||||
| Consideration in relations with suppliers and subcontractors of their responsibility | GRI 204-1 GRI 308-1 GRI 414-1 | ||||||||||||||||
| Supervision and audit systems and resolution thereof | GRI 3-3 | ||||||||||||||||
| Consumers: | |||||||||||||||||
| Measures for the health and safety of consumers | GRI 3-3 GRI 416-1 GRI 417-1 | ||||||||||||||||
| Systems for complaints received and resolution thereof | Acting responsibly towards customers (p. 55). Risk, compliance and conduct management chapter: 7.2 Compliance and conduct risk management section (p. 497) | GRI 2-26 GRI 3-3 GRI 416-2 GRI 417-2 GRI 418-1 | |||||||||||||||
| Tax information: | |||||||||||||||||
| The profits obtained country by country | Auditor's report and 2023 annual consolidate accounts (p. 519) (Annex VI Annual banking report) and Auditor's Report and 2022 annual consolidate accounts (Annex VI Annual banking report). | GRI 3-3 GRI 207-1 | |||||||||||||||
| Taxes on benefits paid | |||||||||||||||||
| Public grants received | GRI 201-4 | ||||||||||||||||
| 6. Other relevant information | EU Taxonomy | Information related to article 8 of EU Taxonomy: | EU Regulation 2020/852 and Commission Delegated Regulations 2021/2139 and 2021/2178 as amended by Delegated Regulations (EU) 2022/1214, 2023/2485 and 2023/2486 | ||||||||||||||
In addition to the contents mentioned in the previous table, the consolidated non-financial information statement of Banco Santander includes the following contents: 1, 2-8, 2-9, 2-10, 2-11, 2-13, 2-14, 2-15, 2-16, 2-17, 2-18, 2-21, 2-27, 3-1, 3-2, 201-1, 201-3, 202-1, 202-2, 205-3, 206-1, 207-2, 207-3, 207-4, 302-2, 302-5, 304-1, 304-3, 304-4, 305-6, 305-7, 306-1, 306-3, 306-4, 306-5, 401-2, 401-3, 403-2, 403-3, 403-5, 403-6, 403-8, 404-3, 415-1, 417-3.
136
10.2 UN Global Compact
content index
content index
Banco Santander has been a member of the United Nations Global Compact since 2002. Through the Responsible Banking chapter of this 2022 Annual Report, the bank shows its support and progress in complying with the Ten Principles of the United Nations Global Compact in the areas of human rights, labour, environment and anti-corruption.
| Principles | Reference in the 2023 Annual report | Correspondence with GRI indicators | |||||||||
| Human rights | |||||||||||
| Principle 1: | Businesses should support and respect the protection of internationally proclaimed human rights. | Business conduct (p. 64) (sections: Conduct standards, Environmental, social and climate change risk management, Acting responsibly towards suppliers) | GRI 2-7, 2-22, 2-23, 2-30, 201-3, 205-2, 401-1, 401-2, 403-1, 403-6, 403-9, 406-1, 414-1 | ||||||||
| Principle 2: | Businesses should make sure they are not complicit in human rights abuses. | GRI 406-1, 414-1 | |||||||||
| Labour | |||||||||||
| Principle 3: | Businesses should uphold the freedom of association and the effective recognition of the right to collective bargaining. | GRI 2-30, 401-2 | |||||||||
| Principle 4: | Businesses should uphold the elimination of all forms of forced and compulsory labour. | ||||||||||
| Principle 5: | Businesses should uphold the effective abolition of child labour. | ||||||||||
| Principle 6: | Businesses should uphold the elimination of discrimination in respect to employment and occupation. | GRI 2-7, 401-1, 401-2, 403-9, 404-1, 404-2, 404-3, 405-1, 406-1 | |||||||||
| Environment | |||||||||||
| Principle 7: | Businesses should support a precautionary approach to environmental challenges. | GRI 308-1 | |||||||||
| Principle 8: | Businesses should undertake initiatives to promote greater environmental responsibility. | GRI 302-1, 302-4, 303-5, 305-1, 305-2, 305-3, 305-4, 305-5 | |||||||||
| Principle 9: | Businesses should encourage the development and diffusion of environmentally friendly technologies. | GRI 302-4, 305-5 | |||||||||
| Anti-Corruption | |||||||||||
| Principle 10: | Businesses should work against corruption in all its forms, including extortion and bribery. | GRI 2-23, 2-27, 205-1, 205-2 | |||||||||
137
10.3 UNEP FI Principles for Responsible Banking reporting index
| Principle 1: Alignment | ||||||||
 | We will align our business strategy to be consistent with and contribute to individuals’ needs and society’s goals, as expressed in the Sustainable Development Goals, the Paris Climate Agreement and relevant national and regional frameworks. | |||||||
Business model Describe (high-level) your bank’s business model, including the main customer segments served, types of products and services provided, the main sectors and types of activities across the main geographies in which your bank operates or provides products and services. Please also quantify the information by disclosing e.g. the distribution of your bank’s portfolio (%) in terms of geographies, segments (i.e. by balance sheet and/or off-balance sheet) or by disclosing the number of customers and clients served. | ||||||||
Santander is a retail bank that operates in three regions (Europe, North America and South America) and in 10 core markets. We structure our operations into five global businesses: Retail & Commercial Banking; Digital Consumer Bank; Corporate & Investment Banking; Wealth Management & Insurance; and Payments. We want to be the best digital and open financial services platform by acting responsibly and earning the lasting loyalty of employees, customers, shareholders and broader society. Our purpose is to help people and businesses prosper. We strive to make sure that everything we do is Simple, Personal and Fair. Our strategy is to create value for all our stakeholders. With a talented and motivated team, we earn our customers’ trust and achieve strong financial results for our shareholders, which in turn enables us to support the communities we serve. Our business model is based on three pillars: •Customer focus. Digital bank with branches. We are transforming our business and operating model through technology-based initiatives to build a digital bank with branches that enables our customers to access financial services through several channels. •Our scale: Our scale in each core market, coupled with our global reach, drives profitable growth and competitive advantage over local peers. •Diversification: Our diversification by geography (in emerging and mature markets) and business (with presence in every sector — retail customers, SMEs, corporates, etc.) enables us to keep net interest income stable. By numbers: •Total customers served: 165 million •Gross loans and advances to customers: EUR 1,015 billion •Distribution by region: Europe (55%); North America (16%); South America (16%); Digital Consumer Bank (13%). •Distribution by segment: retail customers (63%), SMEs and corporates (24%); CIB (13%). | Links and references Corporate website - santander.com • About us • Our approach 2023 Digital Annual Review 2023 Annual report | |||||||
138
Strategy alignment Does your corporate strategy identify and reflect sustainability as strategic priority/ies for your bank? ☒ Yes ☐ No Please describe how your bank has aligned and/or is planning to align its strategy to be consistent with the Sustainable Development Goals (SDGs), the Paris Climate Agreement, and relevant national and regional frameworks. Does your bank also reference any of the following frameworks or sustainability regulatory reporting requirements in its strategic priorities or policies to implement these? ☒ UN Guiding Principles on Business and Human Rights ☒ International Labour Organization fundamental convention ☒ UN Global Compact ☒ UN Declaration on the Rights of Indigenous Peoples ☒ Any applicable regulatory reporting requirements on environmental risk assessments, e.g. on climate risk - please specify which ones: NFRD (Spanish Act 11/2018), Pillar III ☒ Any applicable regulatory reporting requirements on social risk assessments, e.g. on modern slavery - please specify which ones: Modern Slavery Act 2015 UK ☐ None of the above | ||||||||
Banco Santander is firmly committed to driving inclusive and sustainable growth. Our purpose is to help people and businesses prosper. Our operations and investments contribute to several United Nations' Sustainable Development Goals (SDGs) and to the Paris Agreement. We pinpointed three SDGs on which the Group has the greatest impact (8, 13 and 16) and eight more to which we also make a significant contribution through our activity and our social programmes (1, 4, 5, 7, 10, 11, 12, 13 and 17). We support the Paris Agreement goals and in 2021 set our ambition to be net zero in CO2 emissions by 2050. We also drive our responsible banking agenda through local and international initiatives and working groups. We comply with all regulatory requirements regarding ESG disclosure. The Responsible Banking chapter of the 2023 Annual Report is the Group’s consolidated non-financial information statement. It provides detailed information in accordance with Spain’s Act 11/2018, which transposes Directive 2014/95/EU into Spanish law. Our Pillar 3 ESG risk disclosures also cover new market requirements. Our three priorities as a responsible bank are: •Support the transition to a low-carbon economy: •Support and engage with customers in accelerating their transition, and develop a best-in-class sustainable finance and investment proposition. •Progress with decarbonizing our portfolios to align to net zero by 2050, while considering other environmental goals. •Promote inclusive growth: •Promote employees' wellbeing and equal treatment and opportunity for all. •Support financial inclusion by promoting access to financial products and services and financial health, including financial literacy. •Foster customer information transparency and data privacy. •Support education, employability and entrepreneurship. •Strong governance and culture across the organization: •Drive culture, conduct and ethical behaviour, doing everything the Santander Way: Simple, Personal and Fair. •Continue integrating ESG in governance and our core activities, and enhancing capabilities across teams including business, risk management and data reporting. | Links and references 2023 Digital Annual Review •About us 2023 Annual report - Responsible banking chapter Other references •Santander UK Modern Slavery Statement - santander.co.uk/about-santander/investor-relations/modern-slavery-statement | |||||||
139
| Principle 2: Impact and Target Setting | ||||||||
 | We will continuously increase our positive impacts while reducing the negative impacts on, and managing the risks to, people and environment resulting from our activities, products and services. To this end, we will set and publish targets where we can have the most significant impacts. | |||||||
2.1 Impact Analysis (Key Step 1) Show that your bank has performed an impact analysis of its portfolio/s to identify its most significant impact areas and determine priority areas for target-setting. The impact analysis shall be updated regularly1 and fulfil the following requirements/elements (a-d)2: a) Scope: What is the scope of your bank’s impact analysis? Please describe which parts of the bank’s core business areas, products/services across the main geographies that the bank operates in (as described under 1.1) have been considered in the impact analysis. Please also describe which areas have not yet been included, and why | ||||||||
Grupo Santander performs an annual materiality assessment to identify the most pressing sustainability matters. In 2023, we took a double-materiality approach based on the Corporate Sustainability Reporting Directive (CSRD). Our assessment covered two dimensions: impact materiality and financial materiality. Impact materiality assesses the potential positive and negative impacts of sustainability matters on people and the environment. We used the UNEP FI impact tool to assess impact materiality. The assessment covered the entire group, including information on all our businesses (Retail & Commercial Banking; Digital Consumer Bank; Corporate & Investment Banking; Wealth Management & Insurance; and Payments) and our own operations. It did not consider our vendors’ value chain. | Links and references 2023 Annual report - Responsible banking chapter | |||||||
1. That means that where the initial impact analysis has been carried out in a previous period, the information should be updated accordingly, the scope expanded as well as the quality of the impact analysis improved over time. 2. Further guidance can be found in the Interactive Guidance on impact analysis and target setting (unepfi.org/wordpress/wp-content/uploads/2022/05/Impact-and-Target-Process-V-1.1-09.05.2022.pdf). | ||||||||
b) Portfolio composition: Has your bank considered the composition of its portfolio (in %) in the analysis? Please provide proportional composition of your portfolio globally and per geographical scope i) by sectors & industries3 for business, corporate and investment banking portfolios (i.e. sector exposure or industry breakdown in %), and/or ii) by products & services and by types of customers for consumer and retail banking portfolios. If your bank has taken another approach to determine the bank’s scale of exposure, please elaborate, to show how you have considered where the bank’s core business/major activities lie in terms of industries or sectors. | ||||||||
Santander used the Consumer Banking and Investment Banking modules. The Consumer Banking module (52% of total assets, not including cash and debt securities) included products and credit volumes in the retail segment (mainly mortgages and consumer loans). The Investment Banking module (48%) included credit volumes in business segments (from SMEs to corporates), split by NACE sector. | Links and references 2023 Annual report - Responsible banking chapter 2023 Annual report - Risk management and compliance chapter | |||||||
c) Context: What are the main challenges and priorities related to sustainable development in the main countries/regions in which your bank and/or your clients operate?4 Please describe how these have been considered, including what stakeholders you have engaged to help inform this element of the impact analysis. | ||||||||
We used the Context module as input to point out the key sustainability challenges in the markets where the Group operates. We conducted this assessment on the Group’s five biggest markets (Spain, the UK, Brazil, Mexico and the US) in the three regions where we are present (Europe, North America and South America). The key sustainability challenges across the Group's footprint according to the Context module of the UNEPFI tool are: •availability, accessibility, affordability, which for us relates significantly to financial inclusion; and •climate stability We also included feedback from other main stakeholders — customers, regulators and NGOs – to confirm our findings and prioritize areas of focus. | Links and references 2023 Annual report - Responsible banking chapter | |||||||
| 3. ‘Key sectors’ relative to different impact areas, i.e. those sectors whose positive and negative impacts are particularly strong, are particularly relevant here. 4. Global priorities might alternatively be considered for banks with highly diversified and international portfolios. | ||||||||
140
Based on these first 3 elements of an impact analysis, what positive and negative impact areas has your bank identified? Which (at least two) significant impact areas did you prioritize to pursue your target setting strategy (see 2.2)5? Please disclose. | ||||||||
The two main areas of impact, which we made pivotal components of our strategy, are: •availability, accessibility, affordability, which for us relates significantly to financial inclusion; and •climate stability The positive impacts outweigh the negative impacts in both areas. Based on banks’ business models, we consider these areas of impact to: •promote the financial health and inclusion of our customers; and •help our customers transition to a low-carbon economy. | Links and references 2023 Annual report - Responsible banking chapter | |||||||
| 5. To prioritize the areas of most significant impact, a qualitative overlay to the quantitative analysis as described in a), b) and c) will be important, e.g. through stakeholder engagement and further geographic contextualisation. | ||||||||
d) For these (min. two prioritized impact areas): Performance measurement: Has your bank identified which sectors & industries as well as types of customers financed or invested in are causing the strongest actual positive or negative impacts? Please describe how you assessed the performance of these, using appropriate indicators related to significant impact areas that apply to your bank’s context. In determining priority areas for target-setting among its areas of most significant impact, you should consider the bank’s current performance levels, i.e. qualitative and/or quantitative indicators and/or proxies of the social, economic and environmental impacts resulting from the bank’s activities and provision of products and services. If you have identified climate and/or financial health&inclusion as your most significant impact areas, please also refer to the applicable indicators in the Annex. If your bank has taken another approach to assess the intensity of impact resulting from the bank’s activities and provision of products and services, please describe this. | ||||||||
The main impacts within the two selected areas are: •availability, accessibility, affordability: Positive impact from retail exposure; and •climate stability: Impact from the most emissions-intensive sectors, such as mining, manufacturing, energy, transport, and storage. | Links and references 2023 Annual report - Responsible banking chapter | |||||||
Self-assessment summary: Which of the following components of impact analysis has your bank completed, in order to identify the areas in which your bank has its most significant (potential) positive and negative impacts?6 Scope: ☒ Yes ☐ In progress ☐ No Portfolio composition: ☒ Yes ☐ In progress ☐ Context: ☒ Yes ☐ In progress ☐ No Performance measurement: ☐ Yes ☒ In progress ☐ No Which most significant impact areas have you identified for your bank, as a result of the impact analysis? Climate change mitigation and financial health & inclusion How recent is the data used for and disclosed in the impact analysis? ☒ Up to 6 months prior to publication ☐ Up to 12 months prior to publication ☐ Up to 18 months prior to publication ☐ Longer than 18 months prior to publication Open text field to describe potential challenges, aspects not covered by the above etc.: (optional) | ||
6. You can respond “Yes” to a question if you have completed one of the described steps, e.g. the initial impact analysis has been carried out, a pilot has been conducted.
141
2.2 Target Setting (Key Step 2) Show that your bank has set and published a minimum of two targets which address at least two different areas of most significant impact that you identified in your impact analysis. The targets7 have to be Specific, Measurable (qualitative or quantitative), Achievable, Relevant and Time-bound (SMART). Please disclose the following elements of target setting (a-d), for each target separately: a) Alignment: which international, regional or national policy frameworks to align your bank’s portfolio with8 have you identified as relevant? Show that the selected indicators and targets are linked to and drive alignment with and greater contribution to appropriate Sustainable Development Goals, the goals of the Paris Agreement, and other relevant international, national or regional frameworks. | |||||||||||||||||
Regarding climate change, we set our ambition to be net zero in carbon emissions by 2050 in February 2021 (2020 Annual Report). We’re also a founding member of the UNEP FI Net Zero Banking Alliance (NZBA, a coalition of leading banks that represent 41% of global banking assets) as a key banking sector initiative to help us drive our net zero ambition. Since setting our ambition, we’ve announced seven decarbonization targets for the most emissions-intensive sectors. These sectors are power generation; thermal coal mining and power generation; oil and gas; aviation; steel; auto manufacturing; and auto lending. According to our last assessment, aluminium, cement and maritime transport are not material to Santander. Within the NZBA sectors, we are also making headway with analysing, measuring and acting to help decarbonize other climate-related sectors such as agriculture, mortgages and commercial real estate, which are key in the retail segments. The climate performance dynamics of these sectors are heavily dependent on their regulatory landscape. There is currently a lack of public policies, actions and specific plans and measures at the level the changes require for a net zero pathway. We continue to work with clients in these sectors on their decarbonization efforts and internal monitoring of their performance; but we understand we should refrain from setting public targets until their regulatory landscape is sufficiently supportive. We have been actively and constructively sharing our understanding and experience of these policy gaps with authorities, as well as other sectors, and plan to keep doing so. Regarding financial inclusion, having exceeded our target to financially empower 10 million people between 2019 and 2025 (reaching 11.8 million in 2022), in 2023 we set a new target to financially include 5 million more between 2023 and 2025 through access and financing initiatives. We came up with an internal methodology to calculate the number of people we financially include. It considers best international practice and received independent, third-party validation. Santander also has an active role in the UNEP FI Working Group on Financial Health and Inclusion, which underpins the methodology we use. | Links and references 2023 Annual report - Responsible banking chapter Climate finance report •5. Metrics and targets | ||||||||||||||||
| 7. Operational targets (relating to for example water consumption in office buildings, gender equality on the bank’s management board or business-trip related greenhouse gas emissions) are not in scope of the PRB. 8. Your bank should consider the main challenges and priorities in terms of sustainable development in your main country/ies of operation for the purpose of setting targets. These can be found in National Development Plans and strategies, international goals such as the SDGs or the Paris Climate Agreement, and regional frameworks. Aligning means there should be a clear link between the bank’s targets and these frameworks and priorities, therefore showing how the target supports and drives contributions to the national and global goals. | |||||||||||||||||
b) Baseline: Have you determined a baseline for selected indicators and assessed the current level of alignment? Please disclose the indicators used as well as the year of the baseline. | |||||||||||||||||
| In case you have identified other and/or additional indicators as relevant to determine the baseline and assess the level of alignment towards impact driven targets, please disclose these. | |||||||||||||||||
Regarding climate change, we set baselines for our decarbonization targets. Baseline: We use 2019 as the baseline for four of our targets. For auto manufacturing and auto lending, we use 2020 and 2022, respectively. In financial inclusion, we achieved our target to financially empower 10 million people between 2019 and 2025 through access, financing and education initiatives three years early in 2022. To revise this target, in 2023 we conducted a study using reliable public information (i.e. from the World Bank) to pinpoint the barriers to financial services in our core markets. Based on that study and the initiatives we’re running, we set a new target to financially empower 5 million people between 2023 and 2025. | Links and references Climate finance report •5. Metrics and targets | ||||||||||||||||
142
c) SMART targets (incl. key performance indicators (KPIs)9): Please disclose the targets for your first and your second area of most significant impact, if already in place (as well as further impact areas, if in place). Which KPIs are you using to monitor progress towards reaching the target? Please disclose. | |||||
Climate change: Our aim is to support the green transition and reach net zero carbon emissions by 2050 by aligning our portfolio with the Paris Agreement goals: •Target/KPI 1: Thermal coal mining and power generation phase-out. From 7 bn (2021) to 0 by 2030. •Target/KPI 2: Reduce the emissions intensity of the power generation portfolio from 0.21 tCO2e/MWh (2019) to 0.11 tCO2e/MWh by 2030. •Target/KPI 3: Reduce the absolute emissions of the energy portfolio (oil and gas) from 23.84 mtCO2e (2019) to 16.98 mtCO2e by 2030. •Target/KPI 4: Reduce the emissions intensity of the aviation portfolio from 92.47 grCO2e/RPK (2019) to 61.71 grCO2e/RPK by 2030. •Target/KPI 5: Reduce the emissions intensity of the steel portfolio from 1.58 tCO2e/tS (2019) to 1.07 tCO2e/tS by 2030. •New target for 2023/KPI 6: Reduce the emissions intensity of the auto manufacturing portfolio from 149 gCO2/vkm (2020) to 103 gCO2/vkm by 2030. •New target for 2023/KPI 7: Reduce the emissions intensity of the auto lending portfolio from 137 gCO2e/vkm (2022) to 75- 89 gCO2/vkm by 2030. Helping customers transition to a low-carbon economy •Target/KPI 8: Invest or mobilize EUR 120 billion in green finance between 2019 and 2025, and EUR 22 billion by 2023. Helping customers transition to a sustainable economy Target/KPI 9: EUR 100 billion in socially responsible investment by 2025. Financial health and inclusion. Our aim is to help people access and use basic financial services, and provide tailored finance to individuals and SMEs with difficulty accessing credit or that are in financial distress through financial education initiatives that help maximize our impact. •Target 1: Financially empower 5 million people between 2023 and 2025. •Target/KPI 1: # people benefited from access to, and use of, basic financial services through simple payment platforms and cash services in remote and small communities. •Target/KPI 2: # microentrepreneurs, customers in financial distress and low-income households with difficulty getting credit for housing or basic financial needs supported. | Links and references 2023 Annual report - Responsible banking chapter | ||||
d) Action plan: which actions including milestones have you defined to meet the set targets? Please describe. Please also show that your bank has analysed and acknowledged significant (potential) indirect impacts of the set targets within the impact area or on other impact areas and that it has set out relevant actions to avoid, mitigate, or compensate potential negative impacts. | |||||
Climate change We drew up a climate strategy and are working to (1) set and implement decarbonization targets in the highest-emitting sectors, reporting on progress and action plans every year; (2) support our customers’ transition (rolling out solutions and ramping up our green operations), which we pledge to do as part of our action plan; (3) embed climate in risk management and revise the risk appetite of our portfolios though decarbonization targets; and (4) manage the environmental footprint of our own operations, with multi-year plans agreed for all units. Financial health and inclusion We promote financial health and inclusion through these three initiatives: •Access. Helping people access and use basic financial services through simple payment platforms and cash services in remote and small communities. •Finance. We provide tailored finance to individuals and SMEs with difficulty accessing credit or that are in financial distress. •Financial health. We help people manage their finances better in the short, medium and long term by expanding their knowledge of finance and making concepts easy to understand, which enables them to make more informed decisions. Our access and finance initiatives contribute towards our public target to financially empower five million people. | Links and references 2023 Annual report - Responsible banking chapter | ||||
| 9. Key Performance Indicators are chosen indicators by the bank for the purpose of monitoring progress towards targets. | |||||
143
Self-assessment summary Which of the following components of target setting in line with the PRB requirements has your bank completed or is currently in a process of assessing for your… | |||||||||||
… first area of most significant impact: … Climate change | … second area of most significant impact: … Financial health and inclusion | (If you are setting targets in more impact areas) …your third (and subsequent) area(s) of impact: … N/A | |||||||||
| Alignment | ☒ Yes ☐ In progress ☐ No | ☒ Yes ☐ In progress ☐ No | ☐ Yes ☐ In progress ☐ No | ||||||||
| Baseline | ☒ Yes ☐ In progress ☐ No | ☒ Yes ☐ In progress ☐ No | ☐ Yes ☐ In progress ☐ No | ||||||||
| SMART targets | ☒ Yes ☐ In progress ☐ No | ☒ Yes ☐ In progress ☐ No | ☐ Yes ☐ In progress ☐ No | ||||||||
| Action plan | ☒ Yes ☐ In progress ☐ No | ☒ Yes ☐ In progress ☐ No | ☐ Yes ☐ In progress ☐ No | ||||||||
2.3 Target Implementation and Monitoring (Key Step 2) For each target separately: Show that your bank has implemented the actions it had previously defined to meet the set target. Report on your bank’s progress since the last report towards achieving each of the set targets and the impact your progress resulted in, using the indicators and KPIs to monitor progress you have defined under 2.2. | |||||
Climate change We set the wheels in motion to implement our financed emissions reduction targets. This includes engaging with customers on climate matters; gathering data as part of our analysis on the risk of exclusion; and linking targets to senior executives’ remuneration. In 2023, we took this approach with sectors other than power generation (oil and gas, steel, and aviation) and set targets that adapt to their particularities. Our approach seeks to facilitate the achievement of emissions targets and develop a solid understanding of our customers’ strategies to transition to low-carbon business models. We base our approach on governance procedures run by our customer relations and risk teams and overseen by senior managers to guide our portfolio management. Its four stages are gather, assess, engage and review. We used several internationally recognized references such as the Cambridge Institute for Sustainability Leadership's (CISL) 'Let's Discuss Climate' guide and adapted them to our needs and objectives. Financial health and inclusion After achieving our target (in 2022) to financially empower 10 million people, in 2023 we: •conducted a study using reliable public information (i.e. from the World Bank) to pinpoint the barriers to financial services in our core markets. Based on that study and the initiatives we’re running, we set a new target to financially empower 5 million people between 2023 and 2025; •updated our methodologies on measuring the number of people we financially empower and who benefit from our financial education programme; and •began reporting progress every quarter through automated control to ensure the quality and consistency of information. In 2023, we financially included further 1.8 million people through access and lending solutions. | Links and references 2023 Annual report - Responsible banking chapter | ||||
144
| Principle 3: Clients and Customers | ||||||||
 | We will work responsibly with our clients and our customers to encourage sustainable practices and enable economic activities that create shared prosperity for current and future generations. | |||||||
3.1 Client engagement Does your bank have a policy or engagement process with clients and customers10 in place to encourage sustainable practices? ☒ Yes ☐ In progress ☐ No Does your bank have a policy for sectors in which you have identified the highest (potential) negative impacts? ☒ Yes ☐ In progress ☐ No Describe how your bank has worked with and/or is planning to work with its clients and customers to encourage sustainable practices and enable sustainable economic activities11). It should include information on relevant policies, actions planned/implemented to support clients’ transition, selected indicators on client engagement and, where possible, the impacts achieved. | ||||||||
Our Responsible banking and sustainability policy sets out the general principles, commitments, objectives and strategy that guide the Group’s progress with responsible banking and sustainability matters. The aim is to promote long-term value creation for all our stakeholders by acting on opportunity and managing risk. By fulfilling our purpose to help people and businesses prosper, we grow as a business and support society’s efforts to face global challenges, which drives our ambition in environmental, social and governance. We also have other policies that support our responsible banking strategy in such areas as compliance and conduct, cybersecurity, customer conduct risk management, customer service, product and service approval, sensitive sectors, data protection, and treatment of vulnerable customers. We want to act responsibly to make sure that every customer has a Simple, Personal and Fair experience with us. These are our key initiatives in this area: •We are continuously enhancing procedures that impact on customers’ experience with products and services, based on our NPS scores. In 2023, we enhanced contact centre and innovation-related procedures. •To enhance our sales of products and services, 40% of our sales units' variable pay is based on customer satisfaction and quality metrics. We included the contact centre in this variable pay scheme for the first time in 2023. •We have several initiatives for vulnerable customers, including a customer service protocol for senior citizens and people with disabilities. As part of our customer engagement, our Environmental, social and climate change risk management policy sets out how we identify, assess, monitor and manage environmental and social risks and other climate change-related operations. Together with the Equator Principles, we analyse operations in relation to investment in entities, the provision of financial products or services in the oil and gas, power generation and mining and metallurgy sectors, as well as those derived from soft commodity businesses. | Links and references 2023 Annual report - Responsible banking chapter Corporate website - santander.com •Our approach/Policies - santander.com/en/our-approach/policies | |||||||
| 10. A client engagement process is a process of supporting clients towards transitioning their business models in line with sustainability goals by strategically accompanying them through a variety of customer relationship channels. 11. Sustainable economic activities promote the transition to a low-carbon, more resource-efficient and sustainable economy. | ||||||||
145
3.2 Business opportunities Describe what strategic business opportunities in relation to the increase of positive and the reduction of negative impacts your bank has identified and/or how you have worked on these in the reporting period. Provide information on existing products and services , information on sustainable products developed in terms of value (USD or local currency) and/or as a % of your portfolio, and which SDGs or impact areas you are striving to make a positive impact on (e.g. green mortgages – climate, social bonds – financial inclusion, etc.). | ||||||||
These are the main growth opportunities that Banco Santander has identified: •Green finance: All our initiatives are to help our customers transition to a low-carbon economy. For large corporates, we focus on renewable energy and sustainable technology solutions. In Retail & Commercial Banking, we identified five areas of priority: green buildings, clean mobility, renewables, sustainable agriculture, and the circular economy. •AUM in socially responsible investment: We run initiatives to reach our goal of EUR 100 billion of socially responsible investment (SRI) AUM by 2025 •Financial inclusion/Microfinance: Our microfinance operations in Brazil, Mexico, Uruguay, Colombia, Peru and other Latin American markets aim to help microentrepreneurs set up and grow their businesses. •Financial inclusion/Access: We have the opportunity to provide access through bank accounts and digital solutions and wallets to those at the base of the pyramid. | Links and references 2023 Annual report - Responsible banking chapter | |||||||
| Principle 4: Stakeholders | ||||||||
 | We will proactively and responsibly consult, engage and partner with relevant stakeholders to achieve society’s goals. | |||||||
4.1 Stakeholder identification and consultation Does your bank have a process to identify and regularly consult, engage, collaborate and partner with stakeholders (or stakeholder groups12) you have identified as relevant in relation to the impact analysis and target setting process? ☒ Yes ☐ In progress ☐ No Please describe which stakeholders (or groups/types of stakeholders) you have identified, consulted, engaged, collaborated or partnered with for the purpose of implementing the Principles and improving your bank’s impacts. This should include a high-level overview of how your bank has identified relevant stakeholders, what issues were addressed/results achieved and how they fed into the action planning process. | ||||||||
Our materiality assessment includes inputs from customers, employees, senior managers, investors, supervisors, regulators and NGOs. Their contributions were key to understand the importance of the impact, risk and opportunity of sustainability matters. This stakeholder feedback supplemented our double-materiality assessment. We engaged our stakeholders mainly through surveys, which are the most direct way of incorporating their feedback into the materiality assessment. We also conducted interviews with our teams to build on the information we received. Findings are somewhat consistent across the six stakeholder groups we surveyed. Their primary concerns include the fight against climate change, customer data protection, transparency, and inclusion. Beyond the annual materiality assessment, we run continuous active listening and engagement initiatives throughout the year. We conduct surveys and have speak-up channels for employees and customers. We assess external factors to identify risk and opportunity and to gauge our impact on the community. We respond to demands from analysts, investors and ratings agencies and NGOs; keep pace with new regulation and best practices worldwide; and take part in consultations with authorities, trade bodies and other organizations on sustainability. We’re also involved in major local and international initiatives to support inclusive and sustainable growth. | Links and references 2023 Annual report - Responsible banking chapter | |||||||
12. Such as regulators, investors, governments, suppliers, customers and clients, academia, civil society institutions, communities, representatives of indigenous population and non-profit organizations
146
| Principle 5: Governance & Culture | ||||||||
 | We will implement our commitment to these Principles through effective governance and a culture of responsible banking | |||||||
5.1 Governance Structure for Implementation of the Principles Does your bank have a governance system in place that incorporates the PRB? ☒ Yes ☐ In progress ☐ No Please describe the relevant governance structures, policies and procedures your bank has in place/is planning to put in place to manage significant positive and negative (potential) impacts and support the effective implementation of the Principles. This includes information about •which committee has responsibility over the sustainability strategy as well as targets approval and monitoring (including information about the highest level of governance the PRB is subjected to), •details about the chair of the committee and the process and frequency for the board having oversight of PRB implementation (including remedial action in the event of targets or milestones not being achieved or unexpected negative impacts being detected), as well as •remuneration practices linked to sustainability targets. | ||||||||
Santander’s ESG governance 1) The board of directors approves and oversees the implementation of policies and strategies related to our corporate culture and values, responsible practices and sustainability. It also ensures that all the Group's employees are aware of our codes of conduct and act ethically, and comply with the law, customs and good practices of the sectors and countries in which we operate. 2) The responsible banking, sustainability and culture committee (RBSCC) oversees the Group's responsible banking programme and strategy. This committee comprises between three and nine directors (all independent or non-executive), with a majority independent directors. 3) The Responsible Banking Forum promotes and implements the responsible banking strategy throughout the Group, drives decision-making and ensures the execution of any mandates from the CBRSC, other board committees and the board of directors. The Forum also ensures alignment on key issues, including the review and submission of reports to the RBSCC. 4) The management meeting, chaired by the CEO, is where we discuss our quarterly progress with the responsible banking agenda (including climate change), with a focus on the implementation of the TCFD recommendations and ESG business opportunity. Remuneration linked to sustainability targets Sustainability is part of our short-term (variable remuneration) and long-term reward schemes. In both cases, Santander has scorecards to assess progress with sustainability matters, which are largely based on public targets. The long-term incentive scorecard for 2022-2024 comprises the following metrics: the percentage of senior positions held by women; the number of financially empowered people; the amount of green finance invested and mobilized and SRI AUM; and the phase-out of exposure to thermal coal mining and power generation. | Links and references 2023 Annual report - Responsible banking chapter 2023 Annual report - Corporate governance chapter Corporate website - santander.com •Corporate governance - santander.com/en/shareholders-and-investors/corporate-governance ◦Rules and regulations of the Board of directors ◦Board of directors ◦Board committees | |||||||
147
5.2 Promoting a culture of responsible banking: Describe the initiatives and measures of your bank to foster a culture of responsible banking among its employees (e.g., capacity building, e-learning, sustainability trainings for client-facing roles, inclusion in remuneration structures and performance management and leadership communication, amongst others). | ||||||||
Our corporate culture, The Santander Way', is the bedrock of our success. Our values (Simple, Personal and Fair), our corporate behaviours (TEAMS), our leadership principles and our robust risk culture (Risk Pro) guide our day-to-day operations. Employee training on sustainability is key to Santander. We further developed our three-tier training strategy and created a global ESG content platform: •We have global mandatory ESG training for all employees, Sustainability for all. •We continued to run ESG Talks, a series of webinars with internal experts for the areas that work on our sustainability agenda. •We provided the content for employees to obtain Santander ESG Commitment Fundamentals, International Sustainable Finance Specialist-IASE level II and other sustainability certifications. In 2023, the board of directors completed training programmes on climate change, with modules on the Paris Agreement, net zero, portfolio alignment, climate risk management, transition plans, regulation, and information disclosure. We also trained our employees on the Code of conduct, diversity and inclusion, health and safety, customer and vendor relations, the environment, anti-corruption, cyber security, and other topics. We believe it is key to lead by example when promoting sustainability awareness and culture. Since 2021, our offices and buildings in our core markets have been free of single-use plastics in fulfilment of our public commitments on responsible banking.38% of our employees work in buildings certified to ISO 14001 or ISO 50001 management systems; this is above the 36% ambition considered in our 2022-2025 plan. Today, almost all of Santander’s headquarters in our core markets are LEED, BREEAM or ISO 14001-certified. Some buildings in Brazil, Germany, Poland and Spain are LEED Gold or Platinum-certified, while the Grupo Santander City and Santander España’s central services buildings have ‘Zero waste’ certification. Santander runs global and local employee awareness campaigns on the importance of reducing waste and consumption. Each subsidiary posts news and feature articles on the environment and the Group’s ESG initiatives on its internal portal. In 2023, we observed Earth Hour for the 14th year in a row by switching off the lights at the Group’s most emblematic buildings. | Links and references 2023 Annual report - Responsible banking chapter | |||||||
148
5.3 Policies and due diligence processes Does your bank have policies in place that address environmental and social risks within your portfolio?13 Please describe. Please describe what due diligence processes your bank has installed to identify and manage environmental and social risks associated with your portfolio. This can include aspects such as identification of significant/salient risks, environmental and social risks mitigation and definition of action plans, monitoring and reporting on risks and any existing grievance mechanism, as well as the governance structures you have in place to oversee these risks. | ||||||||
Our Environmental, social and climate change risk management policy sets out standards for investing in, and providing financial products and services to, companies and customers who engage in sensitive activities in the oil and gas, power generation and transmission, mining and metals, and soft commodities industries (especially retail customers involved in farming and ranching in the Amazon). We analyse customers who are subject to the policy through a detailed questionnaire that their assigned banker completes before a team of analysts conducts an overall assessment of their environmental, social and climate change risks (which we update every year). We also analyse one-off, project-related transactions in accordance with the Equator Principles and such international regulations as the International Finance Corporation Performance Standards. After conducting environmental and social due diligence on projects, we ask our customers for mitigation plans based on their risk rating. In 2023, we kicked off an initiative to identify and assess the actual and potential adverse impact on human rights that our operations may cause or contribute to, or that may be linked to our operations, products or services through business relationships, based on the recommendations of international frameworks such as the UNGPs and the OECD Guidelines for Multinational Enterprises on Responsible Business Conduct. In addition to this initiative (the findings of which we will publish in 2024), we assess the socio-environmental impact of our operations on customers and vendors. •Customers: Per the Environmental, social and climate change risk management policy, we analysed customers who are subject to the policy through a detailed questionnaire and one-off, project-related transactions in accordance with the Equator Principles and such international regulations as the International Finance Corporation Performance Standards. After conducting environmental and social due diligence on projects, we asked our customers for mitigation plans based on their risk rating. •Vendors: We assess vendors who provide risk services to the bank through special questionnaires on environmental, social, human rights and good governance matters. We use the assessment findings to work with vendors on remediation plans and specific ESG training. In 2023, we worked on drawing up and implementing a new ESG approval methodology to classify our vendors according to risk, including a criticality assessment and action plans for vendors with the highest ESG risk. | Links and references 2023 Annual report - Responsible banking chapter Corporate website - santander.com •Our approach - Policies santander.com/en/our-approach/policies | |||||||
13. Applicable examples of types of policies are: exclusion policies for certain sectors/activities; zero-deforestation policies; zero-tolerance policies; gender-related policies; social due diligence policies; stakeholder engagement policies; whistle-blower policies etc., or any applicable national guidelines related to social risks. | ||||||||
Self-assessment summary Does the CEO or other C-suite officers have regular oversight over the implementation of the Principles through the bank’s governance system? ☒ Yes ☐ No Does the governance system entail structures to oversee PRB implementation (e.g. incl. impact analysis and target setting, actions to achieve these targets and processes of remedial action in the event targets/milestones are not achieved or unexpected neg. impacts are detected)? ☒ Yes ☐ No Does your bank have measures in place to promote a culture of sustainability among employees (as described in 5.2)? ☒ Yes ☐ In progress ☐ No | ||
149
| Principle 6: Transparency & Accountability | ||||||||
 | We will periodically review our individual and collective implementation of these Principles and be transparent about and accountable for our positive and negative impacts and our contribution to society’s goals. | |||||||
6.1 Assurance Has this publicly disclosed information on your PRB commitments been assured by an independent assurer? ☒ Yes ☐ Partially ☐ If applicable, please include the link or description of the assurance statement. | ||||||||
This is our fifth report on the Principles for Responsible Banking. It has been verified with limited assurance by PricewaterhouseCoopers Auditores, S.L. for sections 2.1 (Impact Analysis), 2.2 (Target Setting), 2.3 (Target Implementation and Monitoring) and 5.1 (Governance Structure for Implementation of the Principles). PricewaterhouseCoopers Auditores, S.L. is an independent firm that also audited Banco Santander, S.A.’s consolidated non-financial and financial statements for 2023. | Links and references 2023 Annual report - Responsible banking chapter | |||||||
6.2 Reporting on other frameworks Does your bank disclose sustainability information in any of the listed below standards and frameworks? ☒ GRI ☒ SASB ☒ CDP ☐ IFRS Sustainability Disclosure Standards (to be published ☒ TCFD ☒ Other: WEF Stakeholder Capitalism Metrics | ||||||||
This chapter meets Spain’s Act 11/2018, EU Guidelines 2017/C215/01 on non-financial reporting, the European Taxonomy regulation (Regulation (EU) 2020/852 and Commission Delegated Regulations 2021/2139 and 2021/2178), the GRI Standards, and the GRI G4 guidelines on financial services disclosures. It also considers the Sustainability Accounting Standards Board’s (SASB) 2018-10 industry standards, and the World Economic Forum's Stakeholder Capitalism Metrics. It shows Santander's progress with the UN Principles for Responsible Banking, the TCFD recommendations, the 2030 Agenda, the UN Sustainable Development Goals and the GFANZ requirements on transition plans. | Links and references 2023 Annual report - Responsible banking chapter | |||||||
6.3 Outlook What are the next steps your bank will undertake in next 12 month-reporting period (particularly on impact analysis14, target setting15 and governance structure for implementing the PRB)? Please describe briefly. | ||||||||
We will continue to make headway with identifying material items, risk and opportunity. | Links and references | |||||||
6.4 Challenges Here is a short section to find out about challenges your bank is possibly facing regarding the implementation of the Principles for Responsible Banking. Your feedback will be helpful to contextualise the collective progress of PRB signatory banks. What challenges have you prioritized to address when implementing the Principles for Responsible Banking? Please choose what you consider the top three challenges your bank has prioritized to address in the last 12 months (optional question). If desired, you can elaborate on challenges and how you are tackling these: | |||||
☐ Embedding PRB oversight into governance ☐ Gaining or maintaining momentum in the bank ☐ Getting started: where to start and what to focus on in the beginning ☒ Conducting an impact analysis ☒ Assessing negative environmental and social impacts ☐ Choosing the right performance measurement methodology/ies ☒ Setting targets ☐ Other: … | ☒ Customer engagement ☐ Stakeholder engagement ☒ Data availability ☒ Data quality ☐ Access to resources ☐ Reporting ☐ Assurance ☐ Prioritizing actions internally | ||||
If desired, you can elaborate on challenges and how you are tackling these: | |||||
14. For example outlining plans for increasing the scope by including areas that have not yet been covered, or planned steps in terms of portfolio composition, context and performance measurement
15. For example outlining plans for baseline measurement, developing targets for (more) impact areas, setting interim targets, developing action plans etc.
150
10.4 Global Reporting Initiative
(GRI) content index
(GRI) content index
GRI 1
| Statement of use | Grupo Santander has reported in accordance with the GRI Standards for the period between 01 January 2023 and 31 December 2023 | ||||
| GRI 1 used | Foundation 2021 | ||||
| Sectoral standard of application | Financial Services (GRI G4) | ||||
GRI Standards - GENERAL DISCLOSURES
| GRI Standard | Disclosure | Page | Omission | Reason | Explanation | ||||||||||||
| GRI 2: GENERAL DISCLOSURES | 2-1 Organizational details | - | - | - | |||||||||||||
2-2 Entities included in the organization's sustainability reporting | - | - | - | ||||||||||||||
2-3 Reporting period, frequency and contact point | - | - | - | ||||||||||||||
2-4 Restatements of information | - | - | - | ||||||||||||||
2-5 External assurance | - | - | - | ||||||||||||||
2-6 Activities, value chain and other business relationships | - | - | - | ||||||||||||||
2-7 Employees | - | - | - | ||||||||||||||
2-8 Workers who are not employees | - | D | 1 | ||||||||||||||
2-9 Governance structure and composition | - | - | - | ||||||||||||||
2-10 Nomination and selection of the highest governance body | - | - | - | ||||||||||||||
2-11 Chair of the highest governance body | Corporate Governance chapter of the annual report (p. 177)(4.3 Board functioning and effectiveness). | - | - | - | |||||||||||||
2-12 Role of the highest governance body in overseeing the management of impacts | - | - | - | ||||||||||||||
2-13 Delegation of responsibility for managing impacts | - | - | - | ||||||||||||||
151
| GRI Standard | Disclosure | Page | Omission | Reason | Explanation | ||||||||||||
| GRI 2: GENERAL DISCLOSURES | 2-14 Role of the highest governance body in sustainability reporting | - | - | - | |||||||||||||
2-15 Conflicts of interest | - | - | - | ||||||||||||||
2-16 Communication of critical concerns | - | - | - | ||||||||||||||
2-17 Collective knowledge of the highest governance body | Acting responsibly towards employees (p. 46) (3.3.2 Ensuring we have the right talent and skills); Corporate Governance chapter of the annual report (p. 177) (4.3 Board functioning and effectiveness). | - | - | - | |||||||||||||
2-18 Evaluation of the performance of the highest governance body | Corporate Governance chapter of the annual report (p. 177) (4.3 Board functioning and effectiveness). | - | - | - | |||||||||||||
2-19 Remuneration policies | - | - | - | ||||||||||||||
2.20 Process to determine remuneration | Corporate Governance chapter of the Annual Report (p. 177)(4.7 Remuneration committee activities in 2023; 6. Remuneration). | - | - | - | |||||||||||||
2-21 Annual total compensation ratio | - | C | - | ||||||||||||||
2-22 Statement on sustainable development strategy | - | - | - | ||||||||||||||
2-23 Policy commitments | - | - | - | ||||||||||||||
2-24 Embedding policy commitments | Main internal regulation and governance (p. 92); Business conduct (p.64); Acting responsibly towards employees (p. 46); Acting responsibly towards customers (p. 55); Acting responsibly towards suppliers (p. 69); Supporting the green transition (p. 30); Responsible investment (p. 44). Corporate Governance chapter of the annual report (p. 177) (4. Board composition); Risk management and compliance chapter (p. 451)(7. Compliance and conduct risk). | - | - | - | |||||||||||||
2-25 Processes to remediate negative impacts | - | - | - | ||||||||||||||
2-26 Mechanisms for seeking advice and raising concerns | - | - | - | ||||||||||||||
152
| GRI Standard | Disclosure | Page | Omission | Reason | Explanation | ||||||||||||
| GRI 2: GENERAL DISCLOSURES | 2-27 Compliance with laws and regulations | On 18 March 2021, a putative Pennsylvania-only class action filed in state court against Santander Consumer USA, Inc. (SC) alleging SC violated the Uniform Commercial Code and related Pennsylvania state law, and that the repossessions were not commercially reasonable and done in good faith and that SC failed to inform the consumer of a redemption and/or personal property fee that would have been required to have been paid in order to retrieve their personal affects. The parties agreed to settle this putative class action for US 14 million dollars. The court granted final approval of the settlement on 17 October 2023 and entered a final approval order of the class action settlement on 15 December 2023. In September 2021, the Financial Supervisory Authority of Norway (NFSA) carried out an IT/AML inspection at Santander Consumer Bank, AS Norwegian operations. The purpose of the inspection was to assess the bank´s compliance with certain provisions in the Norwegian IT Regulation and AML legislation. In October 2022, NFSA issued its assessment establishing that SCB Nordics had deficiencies in complying with the Norwegian AML legislation and in November 2022 it imposed an administrative fine for an amount of EUR 15,000,000 which was paid in January 2023. | - | - | 2 | ||||||||||||
| 2-28 Membership associations | Santander participates in industry associations representing financial activity in the countries where it operates, as the AEB in the case of Spain | - | - | - | |||||||||||||
2-29 Approach to stakeholder engagement | - | - | - | ||||||||||||||
2-30 Collective bargaining agreements | - | - | - | ||||||||||||||
153
GRI Standards - Topic-specific disclosures
See material and non-material issues in sections 1.1 'Material sustainability matters' and 9.2 'Double Materiality Assessment methodology and sources'
GRI standard | Disclosure | Location | Scope | Omission | Reason | Explanation | |||||||||||||||||
MATERIAL TOPICS | |||||||||||||||||||||||
GRI 3: MATERIAL TOPICS | 3-1 Process to determine material topics | - | - | - | |||||||||||||||||||
| 3-2 List of material topics | - | - | - | ||||||||||||||||||||
CLIMATE CHANGE | |||||||||||||||||||||||
GRI 3 MATERIAL TOPICS | 3-3 Management of material topics | Group | - | - | - | ||||||||||||||||||
GRI 201: ECONOMIC PERFORMANCE | 201-2 Financial implications and other risks and opportunities due to climate change | Group | - | - | - | ||||||||||||||||||
GRI 302: ENERGY | 302-1 Energy consumption within the organization | Main countries of operation | - | - | 4 | ||||||||||||||||||
| 302-2 Energy consumption outside of the organization | Main countries of operation | - | - | 4 | |||||||||||||||||||
| 302-3 Energy intensity | Main countries of operation | - | - | 4 | |||||||||||||||||||
| 302-4 Reduction of energy consumption | Main countries of operation | - | - | 4 | |||||||||||||||||||
| 302-5 Reductions in energy requirements of products and services | - | - | A | 5 | |||||||||||||||||||
GRI 305: EMISSIONS | 305-1 Direct (Scope 1) GHG emissions | Main countries of operation | - | - | 4 | ||||||||||||||||||
| 305-2 Energy indirect (Scope 2) GHG emissions | Main countries of operation | - | - | 4 | |||||||||||||||||||
| 305-3 Other indirect (Scope 3) GHG emissions | Main countries of operation | - | - | 4 | |||||||||||||||||||
| 305-4 GHG emissions intensity | Main countries of operation | - | - | 4 | |||||||||||||||||||
| 305-5 Reduction of GHG emissions | Main countries of operation | - | - | 4 | |||||||||||||||||||
| 305-6 Emissions of ozone-depleting substances (ODS) | - | - | A | 5 | |||||||||||||||||||
305-7 Nitrogen oxides (NOX), sulphur oxides (SOX), and other significant air emissions | - | - | A | 5 | |||||||||||||||||||
154
GRI standard | Disclosure | Location | Scope | Omission | Reason | Explanation | |||||||||||||||||
| FS8 | Monetary value of products and services designed to deliver a specific environmental benefit for each business line broken down by purpose | Group | - | - | - | ||||||||||||||||||
| FS11 | Percentage of assets subject to positive and negative environmental or social screening | Group | - | D | 7 | ||||||||||||||||||
| BUSINESS CONDUCT | |||||||||||||||||||||||
GRI 3 MATERIAL TOPICS | 3-3 Management of material topics | Group | - | - | - | ||||||||||||||||||
| GRI 204: PROCUREMENT PRACTICES | 204-1 Proportion of spending on local suppliers | Group (excluded Poland) | - | - | - | ||||||||||||||||||
GRI 205: ANTI-CORRUPTION | 205-1 Operations assessed for risks related to corruption | Group | - | - | - | ||||||||||||||||||
| 205-2 Communication and training about anti-corruption policies and procedures | Group | - | - | - | |||||||||||||||||||
| 205-3 Confirmed incidents of corruption and actions taken | Group | - | - | 3 | |||||||||||||||||||
GRI 206: ANTI-COMPETITIVE BEHAVIOUR | 206-1 Legal actions for anti-competitive behaviour, anti-trust, and monopoly practices | The Bank has not received final sanctions for this concept. Additional information on litigation and other Group contingencies can be found in note 25 of Auditor’s report and annual consolidated accounts. | Group | - | - | 2 | |||||||||||||||||
GRI 207: TAX | 207-1 Approach to tax | Group | - | - | - | ||||||||||||||||||
| 207-2 Tax governance, control, and risk management | Group | - | - | - | |||||||||||||||||||
| 207-3 Stakeholder engagement and management of concerns related to tax | Group | - | - | - | |||||||||||||||||||
| 207-4 Country-by-country reporting | Group | - | - | - | |||||||||||||||||||
| GRI 308: SUPPLIER ENVIRONMENTAL ASSESSMENT | 308-1 New suppliers that were screened using environmental criteria | Group (excluded Poland) | - | - | - | ||||||||||||||||||
| 308-2 Negative environmental impacts in the supply chain and actions taken | - | - | D | 6 | |||||||||||||||||||
GRI 414: SUPPLIER SOCIAL ASSESSMENT | 414-1 New suppliers that were screened using social criteria | Group (excluded Poland) | - | - | - | ||||||||||||||||||
| 414-2 Negative social impacts in the supply chain and actions taken | - | - | D | 6 | |||||||||||||||||||
155
GRI standard | Disclosure | Location | Scope | Omission | Reason | Explanation | |||||||||||||||||
| GRI 415: PUBLIC POLICY | 415-1 Political contributions | The ties, membership or collaboration with political parties or with other kind of entities, institutions or associations with public purposes, as well as contributions or services to them, should be done in a way that can assure the personal character and that avoids any involvement of the Group, as indicated in Grupo Santander General Code of Conduct. In 2023 we made a contribution of $78,684 to the US Political Action Committee. | Group | - | - | - | |||||||||||||||||
| FS9 | Coverage and frequency of audits to assess implementation of environmental and social policies and risk assessment procedures | Every two years, the Group’s Internal audit function reviews the corporate Responsible banking function's governance, materiality analyses, control, procedures and risk culture. If it spots areas for improvement, it will give recommendations to mitigate any operational risks from the Responsible banking function's procedures. The last audit in 2023 ended with an overall rating of 'need improvement'. | Group | - | - | - | |||||||||||||||||
CONSUMERS AND END-USERS | |||||||||||||||||||||||
GRI 3 MATERIAL TOPICS | 3-3 Management of material topics | Group | - | - | - | ||||||||||||||||||
GRI 416: CUSTOMER HEALTH AND SAFETY | 416-1 Assessment of the health and safety impacts of product and service categories | Acting responsibly towards our customers (p.55). The Commercialization Committee evaluates potential impact of all products and services, previously they are launched onto the market. These impacts include, among others, clients security and compatibility with other products. | Group | - | - | - | |||||||||||||||||
| 416-2 Incidents of non-compliance concerning the health and safety impacts of products and services | The Bank has not received final sanctions for this concept. Additional information on litigation and other Group contingencies can be found in note 25 of Auditor’s report and annual consolidated accounts. | Group | - | - | 2 | ||||||||||||||||||
GRI 417: MARKETING AND LABELLING | 417-1 Requirements for product and service information and labelling | Responsible business practices. The Commercialization Committee evaluates potential impact of all products and services, previously they are launched onto the market. These impacts include, among others, clients security and compatibility with other products. In addition, the Bank is member of the Association for Commercial Self- Regulation (Autocontrol) assuming the ethical commitment to be responsible regarding the freedom of commercial communication. | Group | - | - | - | |||||||||||||||||
417-2 Incidents of non-compliance concerning product and service information and labelling | The Bank has not received final sanctions for this concept. Additional information on litigation and other Group contingencies can be found in note 25 of Auditor’s report and annual consolidated accounts. | Group | - | - | 2 | ||||||||||||||||||
| 417-3 Incidents of non-compliance concerning marketing communications | The Bank hasn't received any sanctions concerning this matter. Additional information on litigation and other Group contingencies can be found in note 25 of Auditor’s report and annual consolidated accounts.. | Group | - | - | 2 | ||||||||||||||||||
| GRI 418: CUSTOMER PRIVACY | 418-1 Substantiated complaints concerning breaches of customer privacy and losses of customer data | The Bank hasn't received any sanctions concerning this matter. Additional information on litigation and other Group contingencies can be found in note 25 of Auditor’s report and annual consolidated accounts. | Grupo | - | - | 2 | |||||||||||||||||
| FS6 | Percentage of the portfolio for business lines by specific region, size (e.g. micro/ SME/large) and by sector | Group | - | - | - | ||||||||||||||||||
156
GRI standard | Disclosure | Location | Scope | Omission | Reason | Explanation | |||||||||||||||||
| FS15 | Policies for the fair design and sale of financial products and services | Group | - | - | - | ||||||||||||||||||
OTHER NON-MATERIAL TOPICS ON WHICH INFORMATION IS REPORTED FOR GREATER TRANSPARENCY | |||||||||||||||||||||||
| OWN WORKFORCE | |||||||||||||||||||||||
| GRI 202: MARKET PRESENCE | 202-1 Ratios of standard entry level wage by gender compared to local minimum wage | Group | Req. b | D | 1 | ||||||||||||||||||
| 202-2 Proportion of senior management hired from the local community | Our progress in figures (p. 70). The Group Corporate Human Resources Model aims to attract and retain the best professionals in the countries in which it operates. | Group | - | - | - | ||||||||||||||||||
| GRI 401: EMPLOYMENT | 401-1 New employee hires and employee turnover | Group | - | - | - | ||||||||||||||||||
| 401-2 Benefits provided to full-time employees that are not provided to temporary or part-time employees | Group | - | - | - | |||||||||||||||||||
| 401-3 Parental leave | Information unavailable. | - | - | D | 8 | ||||||||||||||||||
GRI 403: OCCUPATIONAL HEALTH AND SAFETY | 403-1 Occupational health and safety management system | Banco Santander has occupational health and safety management systems in place in all the geographies in which it operates, complying with the legal requirements of each country regarding occupational risk prevention. | Group | - | - | - | |||||||||||||||||
| 403-2 Hazard identification, risk assessment, and incident investigation | Group | - | - | - | |||||||||||||||||||
| 403-3 Occupational health services | Group | - | - | - | |||||||||||||||||||
| 403-4 Worker participation, consultation, and communication on occupational health and safety | At Banco Santander SA, the percentage of Representation in the Security Committee is 100%. | Banco Santander S.A. and SCF | - | - | - | ||||||||||||||||||
| 403-5 Worker training on occupational health and safety | Group | - | - | - | |||||||||||||||||||
| 403-6 Promotion of worker health | Group | - | - | - | |||||||||||||||||||
| 403-8 Workers covered by an occupational health and safety management system | 100% of Banco Santander own employees are covered by health and safety management systems at work. | Group | - | - | - | ||||||||||||||||||
| 403-9 Work-related injuries | Group | Req. b | D | 1 | |||||||||||||||||||
| 403-10 Work-related ill health | Group | Req. b | D | 1 | |||||||||||||||||||
157
GRI standard | Disclosure | Location | Scope | Omission | Reason | Explanation | |||||||||||||||||
GRI 404: TRAINING AND EDUCATION | 404-1 Average hours of training per year per employee | Group | - | - | - | ||||||||||||||||||
| 404-2 Programs for upgrading employee skills and transition assistance programs | Banco Santander offers management programmes and continuous training skills that foster the employees´ employability and that, sometimes, help them manage the end of their professional careers. Acting responsibly towards employees (p. 46) (Talent. Developing talent). | Group | - | - | - | ||||||||||||||||||
| 404-3 Percentage of employees receiving regular performance and career development omissions. | Acting responsibly towards employees (p. 46) (Working conditions and social dialogue. Performance review and remuneration). Santander regularly appraises employee performance; at the end of 2023, 74.2% of our employees had a performance review in which their contribution to Santander's results, their alignment with risk management and our TEAMS corporate culture were evaluated. Additionally, 14,065 retail branch employees in Mexico will have their performance review during the first quarter of 2024. In total, 80.8% of the workforce receives a MyContribution. | Group | - | - | - | ||||||||||||||||||
GRI 405: DIVERSITY AND EQUAL OPPORTUNITIES | 405-1 Diversity of governance bodies and employees | Group | - | - | - | ||||||||||||||||||
| 405-2 Ratio of basic salary and remuneration of women to men | Group | - | - | - | |||||||||||||||||||
| GRI 406: NON-DISCRMINATION | 406-1 Incidents of discrimination and corrective actions taken | Group | - | - | - | ||||||||||||||||||
| AFFECTED COMMUNITIES | |||||||||||||||||||||||
| GRI 203: INDIRECT ECONOMIC IMPACT | 203-1 Infrastructure investments and services supported | Group | - | - | - | ||||||||||||||||||
| 203-2 Significant indirect economic impacts | Group | - | - | - | |||||||||||||||||||
| GRI 411: RIGHTS OF INIDGENOUS PEOPLE | 411-1 Incidents of violations involving rights of indigenous people | The Bank ensures, through social and environmental risk assessments in their financing operations under the Equator Principles, that no violations of the indigenous peoples’ rights occur in such operations. In 2023, a total of 41 operations were evaluated in this respect. | Group | - | D | 7 | |||||||||||||||||
| GRI 413: LOCAL COMMUNITIES | 413-1 Operations with local community engagement, impact assessments, and development programs | Grupo Santander has several programmes in its main countries aim to encourage development and participation of local communities, in which it is carried out an assessment on people helped, scholarships given through agreement with Universities, among others. Moreover, in the last years the Group has developed different products and services offering social and/or environmental added value adapted to each country where Santander develops its activities. | Group | - | - | - | |||||||||||||||||
| 413-2 Operations with significant actual and potential negative impacts on local communities | Group | - | D | 7 | |||||||||||||||||||
| FS7 | Monetary value of products and services designed to deliver a specific social benefit for each business line broken down by purpose | Group | - | - | - | ||||||||||||||||||
| FS13 | Access points in low-populated or economically disadvantaged areas by type | Group | - | - | - | ||||||||||||||||||
158
GRI standard | Disclosure | Location | Scope | Omission | Reason | Explanation | |||||||||||||||||
| FS14 | Initiatives to improve access to financial services for disadvantaged people | Group | - | - | - | ||||||||||||||||||
| FS16 | Initiatives to enhance financial literacy by type of beneficiary | Group | - | - | - | ||||||||||||||||||
| OTHER GRI (NON-MATERIAL) TOPICS ON WHICH THE BANK REPORTS ON A VOLUNTARY BASIS FOR GREATER TRANSPARENCY | |||||||||||||||||||||||
| GRI 201: ECONOMIC PERFORMANCE | 201-1 Direct economic value generated and distributed | € million | 2023 | Group | - | - | - | ||||||||||||||||
Economic value generated1 | 57,716 | ||||||||||||||||||||||
| Gross income | 57,423 | ||||||||||||||||||||||
| Net loss on discontinued operations | 0 | ||||||||||||||||||||||
| Gains/(losses) on disposal of assets not classified as non-current held for sale | 313 | ||||||||||||||||||||||
| Gains/(losses) on disposal of assets not classified as discontinued operations | -20 | ||||||||||||||||||||||
| Economic value distributed | 32,807 | ||||||||||||||||||||||
Payments to providers of capital (dividends) | 1,298 | ||||||||||||||||||||||
Operating costs (except taxes) | 7,945 | ||||||||||||||||||||||
Employee wages and benefits | 13,726 | ||||||||||||||||||||||
Payments to government2 | 9,664 | ||||||||||||||||||||||
| CSR investment | 174 | ||||||||||||||||||||||
| Economic value retained (economic value generated less economic value distributed) | 24,909 | ||||||||||||||||||||||
1. Gross income plus net gains on asset disposals. 2. Our progress in figures (p. 70) (8.1 Tax contribution) provides additional information on the taxes paid. 3. For comparative issues see Auditor's report and 2022 annual consolidate accounts. | |||||||||||||||||||||||
| 201-3 Defined benefit plan obligations and other retirement plans | The liability for provisions for pensions and similar obligations at 2023 year-end amounted to EUR 2,225 million (p. 531). Endowments and contributions to the pension funds in the 2023 financial year have amounted to EUR 352 million. The detail may be consulted in Auditor´s report and annual consolidated accounts (p. 547)(Note 47.a to annual consolidated accounts). For comparative purposes see Audit report and consolidated annual accounts 2022. | Group | - | - | - | ||||||||||||||||||
| 201-4 Financial assistance received from government | The Bank has not received significant subsidies or public aids during 2022 and 2023. The detail may be consulted in Annual banking report, section e) Public subsidies (p. 824). | Group | - | - | - | ||||||||||||||||||
GRI 301: MATERIALS | 301-1 Materials used by weight or volume | Main countries of operation | - | - | 4 | ||||||||||||||||||
GRI 303: WATER AND EFFLUENTS | 303-5 Water consumption | Banco Santander manages its water consumption and supply in accordance with local limitations. In addition, the Bank collects its water from the public water supply and discharges the used water to the public network. Our progress in figures (p. 70)(Environmental footprint). | Main countries of operation | - | - | 4 | |||||||||||||||||
159
GRI standard | Disclosure | Location | Scope | Omission | Reason | Explanation | |||||||||||||||||
GRI 304: BIODIVERSITY | 304-1 Operational sites owned, leased, managed in, or adjacent to, protected areas and areas of high biodiversity value outside protected areas | Group | - | A | 5 | ||||||||||||||||||
| 304-2 Significant impacts of activities, products, and services on biodiversity | Group | - | - | - | |||||||||||||||||||
| 304-3 Habitats protected or restored | Group | - | A | 5 | |||||||||||||||||||
| 304-4 IUCN Red List species and national conservation list species with habitats in areas affected by operations | Group | - | A | 5 | |||||||||||||||||||
GRI 306: WASTE | 306-1 Waste generation and significant waste-related impacts | Main countries of operation | - | - | 4 | ||||||||||||||||||
306-2 Management of significant waste-related impacts | Main countries of operation | - | - | 4 | |||||||||||||||||||
306-3 Waste generated | Main countries of operation | - | - | 4 | |||||||||||||||||||
306-4 Waste diverted from disposal | Main countries of operation | - | - | 4 | |||||||||||||||||||
306-5 Waste directed to disposal | Main countries of operation | - | - | 4 | |||||||||||||||||||
| FS1 | Policies with specific environmental and social components applied to business lines | Group | - | - | - | ||||||||||||||||||
| FS2 | Procedures for assessing and screening environmental and social risks in business lines | Group | - | - | - | ||||||||||||||||||
| FS3 | Processes for monitoring clients´ implementation of and compliance with environmental and social requirements included in agreements of transactions | Group | - | - | - | ||||||||||||||||||
| FS4 | Process(es) for improving staff competency to implement the environmental and social policies and procedures as applied to business lines | Group | - | - | - | ||||||||||||||||||
| FS5 | Interactions with clients/ investees/business partners regarding environmental and social risks and opportunities | Group | - | - | - | ||||||||||||||||||
160
GRI standard | Disclosure | Location | Scope | Omission | Reason | Explanation | |||||||||||||||||
| FS10 | Percentage and number of companies held in the institution´s portfolio with which the reporting organization has interacted on environmental or social issues | Group | - | D | 7 | ||||||||||||||||||
| FS12 | Voting policy(ies) applied to environmental or social issues for shares over which the reporting organization hold the right to vote shares or advises on voting | Grupo Santander has no voting policies relating to social and/or environmental matters for entities over which acts as an advisor. The Santander Employees Pension Fund does have a policy of formal vote in relation to social and environmental aspects, for shareholder meetings of the entities over which it has voting rights. | Group | 0 | 0 | 0 | |||||||||||||||||
1. Information unavailable. Given the size of the organisation and the rotation of outsourced services, Banco Santander does not currently have a register of non-employees. In the medium and long term the Group will evaluate the possibility of reporting this indicator. 2. According to a materiality criteria, information included refers to judicial, administrative or regulatory proceedings and other claims that are concluded with unfavorable judgments, fines or sanctions greater than Euro 1 million, as well as those judicial, administrative or regulatory proceedings and other claims that are concluded with unfavorable judgments, fines or sanctions between Euro 100.000 euros and Euro 1 million euros but which have a “high” reputational impact according to our risk assessment. Only those cases where sanctions or fines have been confirmed in administrative proceedings or judicial proceedings where an unfavorable judgment has been rendered in first instance are reported. Once a matter is reported following the explained criteria, no additional updates will be reported until the sanctions, fines or judgments are final. Class actions and/or mass proceedings are not reported. Judicial, administrative, or regulatory proceedings and other claims that have already been included in note 25 of the consolidated annual accounts are not reported. 3. Information is provided on the total number of reports received through Canal Abierto related to gifts and invitations/corruption and bribery. 4. The scope and limitations of this indicator are described on Our progress in figures. 5. Not applicable due to the nature of the Group's financial business, geographies and sectors of operation. It should be noted that all of the Bank's activities are carried out in urban areas. 6. A new ESG approval methodology has been implemented which will allow us to classify all our suppliers according to their risk level by 2024, evaluating them in each case according to their criticality. 7. Information is only provided on the number of project finance deals of Santander’s Bank, which have been analysed regarding social and environmental risks in Equator Principles’ frame. 8. Given the size of the organization and the turnover of outsourced services, Banco Santander does not currently have a record of employees who have requested and taken parental leave during 2023. In the medium and long term the Group will evaluate the possibility of reporting this indicator.
161
10.5 Sustainability Accounting Standards Board (SASB) content index
This is the second year in which Santander has decided to report in accordance with the Sustainability Accounting Standards Board (SASB), following its Industry Standards Version 2018-10 issue.
The relevant standards disclosed in this section have been selected according to a materiality-driven analysis, focusing on the industries that are most closely aligned with our businesses within the 'Financials sector': Asset Management & Custody Activities (FN-AC), Commercial Banks (FN-CB), Consumer Finance (FN-CF), Investment Banking & Brokerage (FN-IB).
Acknowledging that SASB has a US-based approach, we have done our best efforts for translating it to our European standards.
Currently, we do not disclose all metrics included in the aforementioned industry standards, but we will continue to evaluate additional metrics in the future, enhancing our reporting under SASB framework for meeting the needs of our growing base of stakeholders and investors.
Unless otherwise is noted, all data and descriptions are reported for Grupo Santander, if applicable, on a consolidated basis, and not just the segments relevant to the particular industry. The information will refer to the 2023 fiscal year, unless otherwise is specified.
Sustainability Accounting Metrics
| Topic | Industry | Accounting Metric | Code | Response | ||||||||||
| Data Security | Commercial Banks Consumer Finance | (1) Number of data breaches, (2) percentage involving personally identifiable information (PII), (3) number of account holders affected. | FN-CB-230a.1 FN-CF-230a.1 | |||||||||||
| Commercial Banks Consumer Finance | Description of approach to identifying and addressing data security risks. | FN-CB-230a.2 FN-CF-230a.3 | Refer to ‘Risk Pro’ in 'Our culture' section of this chapter (p. 24).; and to ‘Relevant mitigation actions’ in section 6.2 of 'Risk, compliance and conduct management chapter' (p. 451). | |||||||||||
| Financial Inclusion & Capacity Building | Commercial Banks | (1) Number and (2) amount of loans outstanding qualified to programs designed to promote small business and community development. | FN-CB-240a.1 | For more detail see note 10. ‘Loans and advances to customers´ in the Auditor's report and consolidated financial statements (p. 519). Additionally, all the information related to microfinance programmes are available on the 5.3 ‘Financial health and inclusion‘ section of this report (p. 57). | ||||||||||
| Commercial Banks | (1) Number and (2) amount of past due and nonaccrual loans qualified to programs designed to promote small business and community development. | FN-CB-240a.2 | Refer to ‘Amounts past due‘ and ‘Impairment of financial assets‘ in 3.3 'Key metrics' section of the Risk management and compliance chapter. (p. 451). Also refer to notes 2.g and 10.d of the consolidated accounts in the Auditor's report and consolidated financial statements (p. 519). | |||||||||||
| Commercial Banks | Number of no-cost retail checking accounts provided to previously unbanked or underbanked customers. | FN-CB-240a.3 | ||||||||||||
| Commercial Banks | Number of participants in financial literacy initiatives for unbanked, underbanked, or underserved customers. | FN-CB-240a.4 | In 2023, Grupo Santander has financially included 1.8 million people. For further information refer to ‘5.3 Financial health and inclusion‘ section of this chapter (p. 57). | |||||||||||
162
| Topic | Industry | Accounting Metric | Code | Response | ||||||||||
| Incorporation of Environmental, Social, and Governance Factors in Credit Analysis | Commercial Banks | Commercial and industrial credit exposure, by industry. | FN-CB-410a.1 | Refer to ‘Concentration risk‘ in section 3.5 'Other credit risk details' of the Risk Management and compliance chapter (p. 451). | ||||||||||
| Commercial Banks | Description of approach to incorporation of environmental, social,and governance (ESG) factors in credit analysis. | FN-CB-410a.2 | Refer to 7.3 ‘Environmental, social and climate change risk management’ on business conduct section (p. 64), and the 10. ‘ESG risk factors‘ (p. 507).section of the Risk management and compliance chapter For further information see our ‘General Sustainability Policy and our ‘Environmental, social & climate change risk management Policy’, both available on our corporate website. | |||||||||||
| Incorporation of Environmental, Social, and Governance Factors in investment Banking & Brokerage Activities | Investment Banking & Brokerage | (1) Number and (2) total value of investments and loans incorporating integration of environmental, social, and governance (ESG) factors, by industry. | FN-IB-410a.2 | |||||||||||
| Investment Banking & Brokerage | Description of approach to incorporation of environmental, social, and governance (ESG) factors in investment banking and brokerage activities. | FN-IB-410a.3 | For further information see our ‘General Sustainability Policy‘, and our ‘Environmental, social & climate change risk management policy‘, both available on our corporate website. | |||||||||||
| Business Ethics | Asset Management & Custody Activities Commercial Banks Investment Banking & Brokerage | Total amount of monetary losses as a result of legal proceedings associated with fraud, insider trading, anti-trust, anti-competitive behavior,market manipulation, malpractice, or other related financial industry laws or regulations. | FN-AC-510a.1 FN-CB-510a.1 FN-IB-510a.1 | Refer to GRI 206-1 discloses legal actions for anticompetitive behaviour, anti-trust, and monopoly practices. For further information, refer to ’Litigation and other matters’ section on the Auditor's report and consolidated financial statements (p. 519). | ||||||||||
Asset Management & Custody Activities Commercial Banks Investment Banking & Brokerage | Description of whistleblower policies and procedures. | FN-AC-510a.2 FN-CB-510a.2 FN-IB-510a.2 | Refer to 7.2 ‘Ethical Channels’ in the section 4. 'Acting responsibly towards employees' of this chapter (p. 46). For further information, see our ‘General Code of Conduct’, available on our website. | |||||||||||
| Systemic Risk Management | Commercial Banks Investment Banking & Brokerage | Global Systemically Important Bank (G-SIB) score, by category | FN-CB-550a.1. FN-IB-550a.1. | According to the ‘2023 list of global systemically important banks (G-SIBs)’ released by the Financial Stability Board, Santander´s G-SIB buffer is 1.0 %. (G-SIBs as of November 2023). According to the G-SIB Scores Dashboard from the Basel Committee on Banking Supervision (BCBS), Grupo Santander´s scores are (end-2022 data): •Score: 190 •Complexity: 102 •Cross-jurisdictional: 483 •Interconnectedness: 147 •Size: 174 •Substitutability: 42 | ||||||||||
| Commercial Banks Investment Banking & Brokerage | Description of approach to incorporation of results of mandatory and voluntary stress tests into capital adequacy planning, long-term corporate strategy, and other business activities | FN-CB-550a.2. FN-IB-550a.2. | Refer to ‘Capital planning and stress tests’ in the section 3.5 'Capital management and adequacy' (p. 362) of the Economic and Financial chapter. | |||||||||||
163
| Topic | Industry | Accounting Metric | Code | Response | ||||||||||
| Employee Diversity & Inclusion | Commercial Banks, Investment Banking & Brokerage | Percentage of gender and racial/ethnic group representation for (1) executive management, (2) non-executive management, (3) professionals, and (4) all other employees | FN-AC-330a.1 FN-IB-330a.1 | For further information, refer to ‘Diversity & Inclusion’ section of 4. ‘Acting responsibly towards employees’ this chapter (p. 46). For further information about our diversity and inclusion principles, see our ‘Corporate Culture Policy’, available on our corporate website. | ||||||||||
| Activity metrics | Commercial Banks | (1) Number and (2) value of checking and savings accounts by segment: (a) personal and (b) small business. | FN-CB-000.A | Refer to ‘Consolidated annual accounts‘ in Auditor's report and consolidated financial statements (p. 519). | ||||||||||
| Commercial Banks | (1) Number and (2) value of loans by segment: (a) personal, (b) small business, and (c) corporate. | FN-CB-000.B | Refer to ‘Consolidated annual accounts‘ in Auditor's report and consolidated financial statements (p. 519). | |||||||||||
164
10.6 Stakeholder Capitalism Metrics
content index
content index
Stakeholder Capitalism Metrics
| Theme | Metric | Response | ||||||||||||
| Principles of governance | ||||||||||||||
| Governing Purpose | Setting Purpose: The company’s stated purpose, as the expression of the means by which a business proposes solutions to economic, environmental, and social issues. Corporate purpose should create value for all stakeholders, including shareholders. | 'Business model and strategy' (p. 7) chapter reflects how we help people and businesses prosper whilst adopting ESG practices. Additionally, in 'Our sustainability strategy' (p. 25) section in 'Responsible banking' chapter, we detail in deep how we work to be a more sustainable bank. | ||||||||||||
Purpose-led management: How the company’s stated purpose is embedded in company strategies, policies, and goals. | ||||||||||||||
| Quality of Governing Body | Governing Body Composition: Composition of the highest governance body and its committees by: competencies relating to economic, environmental, and social topics; executive or non-executive; independence; tenure on the governance body; number of each individual’s other significant positions and commitments, and the nature of the commitments; gender; membership of under-represented social groups; stakeholder representation. | |||||||||||||
Progress against strategic milestones: Disclosure of the material strategic economic, environmental, and social milestones expected to be achieved in the following year, such milestones achieved from the previous year, and how those milestones are expected to or have contributed to long-term value. | Refer to 'Santander's support for society' (p. 20), '2023 Highlights' (p. 20) and 'Our sustainability strategy' (p. 25) sections in 'Responsible banking' chapter. | |||||||||||||
Remuneration: 1. How performance criteria in the remuneration policies relate to the highest governance body’s and senior executives’ objectives for economic, environmental and social topics, as connected to the company’s stated purpose, strategy, and long-term value. 2. Remuneration policies for the highest governance body and senior executives for the following types of remuneration: Fixed pay and variable pay, including performance-based pay, equity-based pay, bonuses, and deferred or vested shares, Sign-on bonuses or recruitment incentive payments, termination payments, clawback and retirement benefits. | 1. Refer to ´Performance review and remuneration´ in 'Acting responsibly towards employees' section (p. 46) in 'Responsible banking' chapter. | |||||||||||||
| Ethical Behavior | Anti-corruption: 1. Total percentage of governance body members, employees and business partners who have received training on the organization’s anti-corruption policies and procedures, broken down by region. 2. (a) Total number and nature of incidents of corruption confirmed during the current year but related to previous years and (b) Total number and nature of incidents of corruption confirmed during the current year, related to this year. 3. Discussion of initiatives and stakeholder engagement to improve the broader operating environment and culture, in order to combat corruption. | 1. Refer to Financial Crime Compliance on 7.2 'Compliance and conduct risk management' section (p. 497) in 'Risk, compliance and conduct management' chapter. Refer also to GCC in Conduct and 'Ethical behaviour' section in 'Responsible banking' chapter. All our employees receive mandatory training on the GCC on an annual basis. 3. Refer to Financial Crime Compliance on 7.2 'Compliance and conduct risk management' section (p. 497) in 'Risk, compliance and conduct management' chapter. | ||||||||||||
Protected ethics advice and reporting mechanisms: A description of internal and external mechanisms for: 1. Seeking advice about ethical and lawful behaviour and organizational integrity 2. Reporting concerns about unethical or unlawful behaviour and organizational integrity | Refer to pages 13-14 in our Code of Conduct (available in our corporate website). In addition see 7.2 'Compliance and conduct risk management´ (p. 497) in 'Risk and compliance management' section on 'Risk, compliance and conduct management' chapter. And ´Ethical channels´ on ´Business conduct´ section (p. 64) in 'Responsible banking' chapter. | |||||||||||||
165
| Theme | Metric | Response | ||||||||||||
Monetary losses from unethical behaviour: Total amount of monetary losses as a result of legal proceedings associated with: fraud, insider trading, anti-trust, anti-competitive behaviour, market manipulation, malpractice, or violations of other related industry laws or regulations. | ||||||||||||||
Alignment of strategy and policies to lobbying: The significant issues that are the focus of the company’s participation in public policy development and lobbying; the company’s strategy relevant to these areas of focus; and any differences between its lobbying positions, purpose, and any stated policies, goals, or other public positions. | Refer to ´Principles of action in our relationship with political parties´ in 'Business conduct' section in 'Responsible banking' chapter (p. 64) The Financing of political parties policy is available on our corporate website. | |||||||||||||
| Risk and Opportunity Oversight | Integrating risk and opportunity into business process: Company risk factor and opportunity disclosures that clearly identify the principal material risks and opportunities facing the company specifically (as opposed to generic sector risks), the company appetite in respect of these risks, how these risks and opportunities have moved over time and the response to those changes. These opportunities and risks should integrate material economic, environmental, and social issues, including climate change and data stewardship. | Refer to 'Risk and opportunities' section in 'Risk, compliance and conduct management' chapter (p. 451). In addition, we report our progress in implementing TCFD recommendations (including Risk management) in 'Responsible banking' chapter (p. 30). Our Environmental, social and climate change risk policy is available at our corporate website. | ||||||||||||
| Stakeholder Engagement | Material issues impacting stakeholders: A list of the topics that are material to key stakeholders and the company, how the topics were identified, and how the stakeholders were engaged. | Refer to 'Materiality assessment' (p. 28) and 'Double materiality assessment and sources' (p. 95) section in 'Responsible banking' chapter. Refer also to 'Our sustainability strategy' (p. 25). | ||||||||||||
| Planet | ||||||||||||||
| Climate Change | Greenhouse Gas (GHG) emissions: For all relevant greenhouse gases (e.g. carbon dioxide, methane, nitrous oxide, F-gases etc.), report in metric tonnes of carbon dioxide equivalent (tCO₂e) GHG Protocol Scope 1 and Scope 2 emissions. Estimate and report material upstream and downstream (GHG Protocol Scope 3) emissions where appropriate. | Refer to Environmental footprint 2022-2023 table in 'Our progress in figures' section in 'Responsible banking' chapter (p. 70). •Total emissions (market based): 172,711 T CO2e •Scope 1: 25,755 T CO2eT2e •Scope 2 – market based: 21,516 T CO2e •Scope 2 – location based: 205,292 T CO2e •Scope 3: 125,441 T CO2e | ||||||||||||
TCFD implementation: Fully implement the recommendations of the Task Force on Climate-related Financial Disclosures (TCFD). If necessary, disclose a timeline of at most three years for full implementation. Disclose whether you have set, or have committed to set GHG emissions targets that are in line with the goals of the Paris Agreement — to limit global warming to well-below 2°C above pre-industrial levels and pursue efforts to limit warming to 1.5°C — and to achieve net-zero emissions before 2050. | Refer to 'Supporting the green transition' (p. 30) and 'TCFD content index' (p. 170) sections in 'Responsible banking' chapter, were we report our progress in implementing TCFD recommendations. In 2020, we became carbon neutral in our own operations. In 2021, we set our commitment to be net-zero in carbon emissions by 2050, and we set our first decarbonization targets. In addition, refer to 'Climate and environmental risk' section (p. 507) in 'Risk management and compliance' chapter. | |||||||||||||
Paris-aligned GHG emissions targets: Define and report progress against time-bound science-based GHG emissions targets that are in line with the goals of the Paris Agreement — to limit global warming to well-below 2°C above pre-industrial levels and pursue efforts to limit warming to 1.5°C. This should include defining a date before 2050 by which you will achieve net-zero greenhouse gas emissions and interim reduction targets based on the methodologies provided by the Science Based Targets initiative if applicable. | We set our first decarbonization targets. We're committed to aligning our power generation portfolio with the Paris Agreement by 2030. We are also ending financial services to power generation clients by 2030 if over 10% of their revenue depends on thermal coal. | |||||||||||||
| Fresh water availability | Water consumption and withdrawal in water-stressed areas: Report for operations where material, mega litres of water withdrawn, mega litres of water consumed and the percentage of each in regions with high or extremely high baseline water stress according to WRI Aqueduct water risk atlas tool. Estimate and report the same information for the full value chain (upstream and downstream) where appropriate. | Refer to Environmental footprint 2022-2023 table in 'Our progress in figures' section (p. 70) in 'Responsible banking' chapter. In 2022, Santander consumed 1,858,645 m3 from the public network, equalling a consumption of 9.56 m3/employee. (Information is provided exclusively on water withdrawal from the public network). We do not disclose data on water stress, due to our financial activities generating negligible impacts. | ||||||||||||
| Nature Loss | Land use and ecological sensitivity: Report the number and area (in hectares) of sites owned, leased or managed in oradjacent to protected areas and/or key biodiversity areas (KBA). | Refer to Nature and biodiversity on 'Supporting the green transition' section (p. 70) of the 'Responsible banking' chapter. | ||||||||||||
166
| Theme | Metric | Response | ||||||||||||
| Single-use plastics | Report wherever material along the value chain: estimated metric tonnes of single-use plastic consumed. Disclose the most significant applications of single-use plastic identified, the quantification approach used and the definition of single-use plastic adopted. | Refer to Our environmental footprint on 'Supporting the green transition' section (p. 30) in 'Responsible banking' chapter. In 2021 we have met our goal of eliminating unnecessary single-use plastics from our buildings and branches. In 2022 we also continue not providing single-use plastics in our buildings and offices. | ||||||||||||
| Prosperity | ||||||||||||||
| Employment and wealth generation | Absolute number and rate of employment: 1. Total number and rate of new employee hires during the reporting period, by age group, gender, other indicators of diversity and region. 2. Total number and rate of employee turnover during the reporting period, by age group, gender, other indicators of diversity and region. | 1. See: •Table 22.1. Distribution of new hires by age bracket •Table 23. Distribution of new hires by gender 2. See: •Table 25. External turnover rate by gender •Table 26. External turnover rate by age bracket | ||||||||||||
Economic Contribution: 1. Direct economic value generated and distributed (EVG&D) — on an accrual basis, covering the basic components for the organization’s global operations, ideally split out by: a. Revenue b. Operating Costs c. Employee wages and benefits d. Payments to providers of capital e. Payments to government f. Community Investment. 2. Financial assistance received from the government. Total monetary value of financial assistance received by the organization from any government during the reporting period. | 1. Refer to Global Reporting Initiative (GRI) content index in 'Responsible banking' chapter, and more specifically to GRI 201.1 Direct economic value generated and distributed (p. 151). •Economic value generated in 2023: EUR 57,716 million •Economic value distributed: EUR 31,476 million •Economic value retained EUR 26,240 million 1.a Revenue: EUR 57,423 million 1.b Operating cost: EUR 25,425 million 1.c Employee wages and benefits: EUR 13,726 million 1.d Payments to providers of capital: N/A 1.e Payments to government: EUR 9,664 million (total taxes) 1.f Community investment: EUR 174 million Further detail for 1a-c refer to Group financial performance section on Economic and financial review chapter (p. 334). Further detail for 1d refer to 3.3 Dividends in Shareholders section on Corporate governance chapter (p. 195). Further detail for 1e refer to 'Total taxes paid' table on 8. 'Our progress in figures' in 'Responsible banking' chapter (p. 70). 2. Grupo Santander did not receive significant public subsidies in 2023. Refer to 'Annual banking report', e) (p. 824). | |||||||||||||
| Wealth creation and Employment | Financial investment contribution disclosure: 1. Total capital expenditures (CapEx) minus depreciation supported by narrative to describe the company’s investment strategy. 2. Share buybacks plus dividend payments supported by narrative to describe the company’s strategy for returns of capital to shareholders. | 1.Refer to note 16 Tangible assets (p. 613) – For own use section in 'Auditor's report' in the consolidated financial statements. Additionally, refer to 2. Refer to 3. 'Shareholders. Engagement and general meeting' section (p. 177) in 'Corporate governance' chapter. | ||||||||||||
| Community and social vitality | Total tax paid: The total global tax borne by the company, including corporate income taxes, property taxes, non- creditable VAT and other sales taxes, employer-paid payroll taxes and other taxes that constitute costs to the company, by category of taxes. | Refer to 'Total taxes paid' table on 'Our progress in figures' section in 'Responsible banking' chapter (p. 70). | ||||||||||||
| Additional tax remitted | The total additional global tax collected by the company on behalf of other taxpayers, including VAT and employee-related taxes that are remitted by the company on behalf of customers or employees, by category of taxes. | Refer to 'Total taxes paid' table on 'Our progress in figures' section in 'Responsible banking' chapter (p. 70). | ||||||||||||
| Total tax paid by country for significant locations | Total tax paid and, if reported, additional tax remitted, by country for significant locations. | Refer to 'Total taxes paid' table on 'Our progress in figures' section in 'Responsible banking' chapter (p. 70). | ||||||||||||
167
| Theme | Metric | Response | ||||||||||||
| Innovation in better products and services | Total R&D expenses ($): Total costs related to research and development. | Innovation and technological development are strategic pillars of Grupo Santander. As in previous years, the European Commission's 2023 EU Industrial R&D Investment Scoreboard (based on 2022 data) recognized our technological effort. We were the first Spanish bank and the second best bank globally in R&D investment. The equivalent investment in R&D&I to that considered in the ranking was EUR 2,197 million. Refer to 'Research, development and innovation (R&D&I)' section in 'Economic and financial review' (p. 427). | ||||||||||||
| People | ||||||||||||||
| Dignity and equality | Diversity and inclusion (%): Percentage of employees per employee category, per age group, gender and other indicators of diversity (e.g. ethnicity). | Additional information on how we promote DEI refer to ´Diversity, equity and inclusion´ in 'Acting responsibly towards employees' section (p. 46) in 'Responsible banking' chapter. | ||||||||||||
Pay equality: Ratio of the basic salary and remuneration for each employee category by significant locations of operation for priority areas of equality: women to men; minor to major ethnic groups; and other relevant equality areas. | Gender and equal pay gap figures match 2021 trends, on the back of a firm commitment and ambitious action plans assumed throughout the Group (0%). Refer to ´Equal pay´ in 'Acting responsibly towards employees' section (p. 46) on 'Responsible banking' chapter. | |||||||||||||
Wage level (%): 1. Ratios of standard entry-level wage by gender compared to local minimum wage 2. Ratio of CEO’s total annual compensation to median total annual compensation of all employees (excluding the CEO) | Table 29 ´Ratio between the Bank’s minimum annual salary and the legal minimum annual salary by country and gender 2023´. We take as a reference the Bank’s minimum annual salary in each country. | |||||||||||||
Risk for incidents of child, forced or compulsory labor: An explanation of the operations and suppliers considered to have significant risk for incidents of child labor, forced or compulsory labor. Such risks could emerge in relation to type of operation (such as manufacturing plant) and type of supplier; or countries or geographic areas with operations and suppliers considered at risk. | Refer to ´Protecting human rights´ in 'Environmental, social and climate change risk management' on 'Business conduct' section (p. 64) of the 'Responsible banking' chapter. We have zero tolerance towards employee, customer and supplier discrimination, forced labour and child exploitation. We respect the provisions of the ILO convention and the legal minimum working aged established in countries. Further detail on our Responsible banking and sustainability policy, available at our corporate website. | |||||||||||||
Discrimination and Harassment Incidents (#) and the Total Amount of Monetary Losses ($): Number of discrimination and harassment incidents, status of the incidents and actions taken and the total amount of monetary losses as a result of legal proceedings associated with (1) law violations and (2) employment discrimination. | ||||||||||||||
168
| Theme | Metric | Response | ||||||||||||
Freedom of Association and Collective Bargaining at Risk (%): 1. Percentage of active workforce covered under collective bargaining agreements 2. An explanation of the assessment performed on suppliers for which the right to freedom of association and collective bargaining is at risk including measures taken by the organization to address these risks. | - Table 21. Coverage of the workforce by collective agreement | |||||||||||||
| Health and well being | Health and Safety (%): 1. The number and rate of fatalities as a result of work-related injury; high-consequence work-related injuries (excluding fatalities); recordable work-related injuries, main types of work- related injury; and the number of hours worked. 2. An explanation of how the organization facilitates workers’ access to non-occupational medical and healthcare services and the scope of access provided for employees and workers. | •Table 34. Accident rate •Table 35. Occupational health and safety 2. Refer to 'Our wellbeing' in 'Acting responsibly towards employees' section on 'Responsible banking' chapter (p. 46). | ||||||||||||
| Skills for the future | Training provided (#, $): 1. Average hours of training per person that the organization’s employees have undertaken during the reporting period, by gender and employee category (total number of trainings provided to employees divided by the number of employees). 2. Average training and development expenditure per full time employee. | •Table 30. Training •Table 31. Hours of training by category •Table 32. Hours of training by gender •28.7 hours per employee •EUR 284.4 of investment per employee. | ||||||||||||
169
10.7 Task Force on Climate related Financial Disclosure (TCFD) content index
| TCFD Recommendations | Reference in this Annual Report | Reference in Climate Finance Report 2022 - June 2023 | ||||||||||||
| Governance | a | Describe the board’s oversight of climate-related risks and opportunities. | 3. Governance; 5. Metrics and targets - Action plan - Power generation sector alignment | |||||||||||
| b | Describe management’s role in assessing and managing climate-related risks and opportunities. | 3. Governance; 6. Financing the green transition - ESG governance in Santander Asset Management | ||||||||||||
| Strategy | a | Describe the climate-related risks and opportunities the organization has identified over the short, medium, and long term. | 2. Strategy - Climate risks and opportunities; Resilience of Santander’s strategy. Scenario analysis | |||||||||||
| b | Describe the impact of climate-related risks and opportunities on the organization’s businesses, strategy, and financial planning. | |||||||||||||
| c | Describe the resilience of the organization’s strategy, taking into consideration different climate-related scenarios, including a 2°C or lower scenario. | |||||||||||||
| Risk Management | a | Describe the organization’s processes for identifying and assessing climate-related risks. | 4. Risk management - I. Identification; II. Planning; III. Assessment; IV. Monitoring; V. Mitigation; VI. Reporting | |||||||||||
| b | Describe the organization’s processes for managing climate-related risks. | |||||||||||||
| c | Describe how processes for identifying, assessing, and managing climate-related risks are integrated into the organization’s overall risk management. | |||||||||||||
| Metrics and Targets | a | Disclose the metrics used by the organization to assess climate-related risks and opportunities in line with its strategy and risk management process. | 5. Metrics and targets - Aligning our portfolio to the Paris agreement | |||||||||||
| b | Disclose Scope 1, Scope 2, and, if appropriate, Scope 3 greenhouse gas (GHG) emissions, and the related risks. | 5. Metrics and targets - Decarbonization targets - Financed emissions; Our environmental footprint | ||||||||||||
| c | Describe the targets used by the organization to manage climate-related risks and opportunities and performance against targets. | 5. Metrics and targets - Decarbonization targets | ||||||||||||
References in this report are included in the Responsible banking chapter.
For more details TCFD recommendations, see our Climate Report 2021-June 2022 available on our corporate website. Progress has been made on some of these recommendations since the publication of the Climate Finance Report in July 2022
170
10.8 SDGs contribution
content index
content index
We have identified eleven SDGs and associated targets on which we have the greatest impact.
| Summary of SDG target | Reference in the 2023 Annual report | |||||||
| SDG 1 | ||||||||
| 1.2 Reduce at least by half the proportion of men, women and children of all ages living in poverty in all its dimensions | ||||||||
| 1.4 Ensure that all men and women, in particular the poor and the vulnerable, have equal rights to economic resources, as well as access to basic services | ||||||||
| 1.5 Build the resilience of the poor and those in vulnerable situations and reduce their exposure and vulnerability to climate-related extreme events and other economic, social and environmental shocks and disasters | ||||||||
| SDG 4 | ||||||||
| 4.3 Ensure equal access for all to affordable and quality technical, vocational and tertiary education, including university. | •Supporting communities (p. 61) (Support for higher education, employability and entrepreneurship section). | |||||||
| 4.4 Substantially increase the number of young people and adults with technical and vocational skills to access quality employment and entrepreneurial opportunities. | •Supporting communities (p. 61) (Support for higher education, employability and entrepreneurship section). | |||||||
| 4.5 Eliminate gender disparities in education and ensure equal access to all levels of education and vocational training for persons with disabilities, indigenous populations and vulnerable children, among others. | •Supporting communities (p. 61) (sections: Support for higher education, employability and entrepreneurship, Other community support programmes). | |||||||
| 4.6 Substantially increase the scholarships available to developing countries for enrolment in higher education, including vocational training and ICT, technical, engineering and scientific programmes | •Supporting communities (p. 61) (sections: Support for higher education, employability and entrepreneurship, Other community support programmes). | |||||||
| SDG 5 | ||||||||
| 5.1. End all forms of discrimination against all women and girls everywhere. | ||||||||
| 5.5 Ensure women’s full and effective participation in, and equal opportunities for, leadership at all levels of decision making | ||||||||
| SDG 7 | ||||||||
| 7.1 Ensure universal access to affordable, reliable and modern energy services | •Supporting the green transition (p. 30) (Supporting our customers in the green transition section). | |||||||
| 7.b Expand infrastructure and improve technology to provide modern and sustainable energy services | •Supporting the green transition (p. 30) (Supporting our customers in the green transition section). | |||||||
171
| Summary of SDG target | Reference in the 2023 Annual report | |||||||
| SDG 8 | ||||||||
| 8.3 Promote development-orientated policies that support production, job creation, entrepreneurship, creativity and innovation, and promote the start-up and growth of micro, small and medium-sized enterprises through access to financial services and other means. | •Supporting communities (p. 61) (Support for higher education, employability and entrepreneurship section). | |||||||
8.4 Improve progressively, through 2030, global resource efficiency in consumption and production and endeavour to decouple economic growth from environmental degradation [...] | ||||||||
| 8.5 Secure wholesome and productive employment and decent work for all - most notably young people and persons with disabilities - and equal pay for work of equal value. | •Supporting communities (p. 61) (Support for higher education, employability and entrepreneurship section). | |||||||
| 8.6 Substantially reduce the proportion of youth not in employment, education or training | •Supporting communities (p. 61) (Support for higher education, employability and entrepreneurship section). | |||||||
| 8.8 Protect labour rights and promote safe and secure working environments for all workers, including migrant workers, in particular women migrants, and those in precarious employment | ||||||||
| 8.10 Strengthen the capacity of domestic financial institutions to encourage and expand access to banking, insurance and financial services for all | ||||||||
| SDG 10 | ||||||||
| 10.2 Strengthen and promote social, economic and political inclusion for all | ||||||||
| SDG 11 | ||||||||
| 11.1 Ensure access for all to adequate, safe and affordable housing and basic services and upgrade slums | ||||||||
| 11.4 Strengthen efforts to protect and safeguard the world’s cultural and natural heritage | ||||||||
| 11.6 Reduce the adverse per capita environmental impact of cities, including by paying special attention to air quality and municipal and other waste management | ||||||||
| SDG 12 | ||||||||
| 12.2 Achieve the sustainable management and efficient use of natural resources | ||||||||
| 12.5 Substantially reduce waste generation through prevention, reduction, recycling and reuse | ||||||||
| 12.6 Achieve full and productive employment and decent work for all women and men, including for young people and persons with disabilities, and equal pay for work of equal value | ||||||||
| SDG 13 | ||||||||
| 13.1 Strengthen resilience and adaptive capacity to climate-related hazards and natural disasters in all countries | ||||||||
| SDG 16 | ||||||||
| 16.5 Considerably reduce corruption and bribery in all their forms. | ||||||||
| 16.6 Develop effective, accountable and transparent institutions at all levels | ||||||||
| 16.7 Ensure responsive, inclusive, participatory and representative decision-making at all levels | ||||||||
| SDG 17 | ||||||||
172
10.9 GFANZ transition planning
| GFANZ recommendations | Reference in this report | Reference in Climate Finance Report 2022 - June 2023 | |||||||||
| Foundations | Objectives and priorities | 2. Strategy: Our Ambition, Our strategy, Our objectives and priorities, Our approach | |||||||||
| Implementation strategy | Products and services | 6. Financing the green transition | |||||||||
| Activities and decision-making | 3. Governance: Climate change and green transition oversight, Main areas involved in the implementation of the climate change strategy | ||||||||||
| Policies and conditions | 3. Governance:Policies and guidance; 4. Risk management: Monitoring | ||||||||||
| Engagement strategy | Engagement with clients and portfolio companies | 4. Risk management: Santander and the Brazilian Amazon; 5. Metrics and targets: Action plan | |||||||||
| Engagement with industry | 7. Partnerships: Sector working groups | ||||||||||
| Engagement with government and public sector | 7. Partnerships: Engagement with regulators, industry bodies and other stakeholders | ||||||||||
| Metrics and Targets | Metrics and targets | 5. Metrics and targets | |||||||||
| Governance | Roles, responsibilities, and remuneration | 3. Governance: Climate change and green transition oversight; 6. Financing the green transition: ESG governance in Santander Asset Management | |||||||||
| Skills and culture | 3. Governance: ESG culture and skills development | ||||||||||
173
[Page intentionally left blank] 1 of 3
174
[Page intentionally left blank] 2 of 3
175
[Page intentionally left blank] 3 of 3
176
Corporate governance | |||||
 | |||||
177
Clear and robust corporate governance to ensure a long-term sustainable business model
Broad and balanced shareholder base | ||
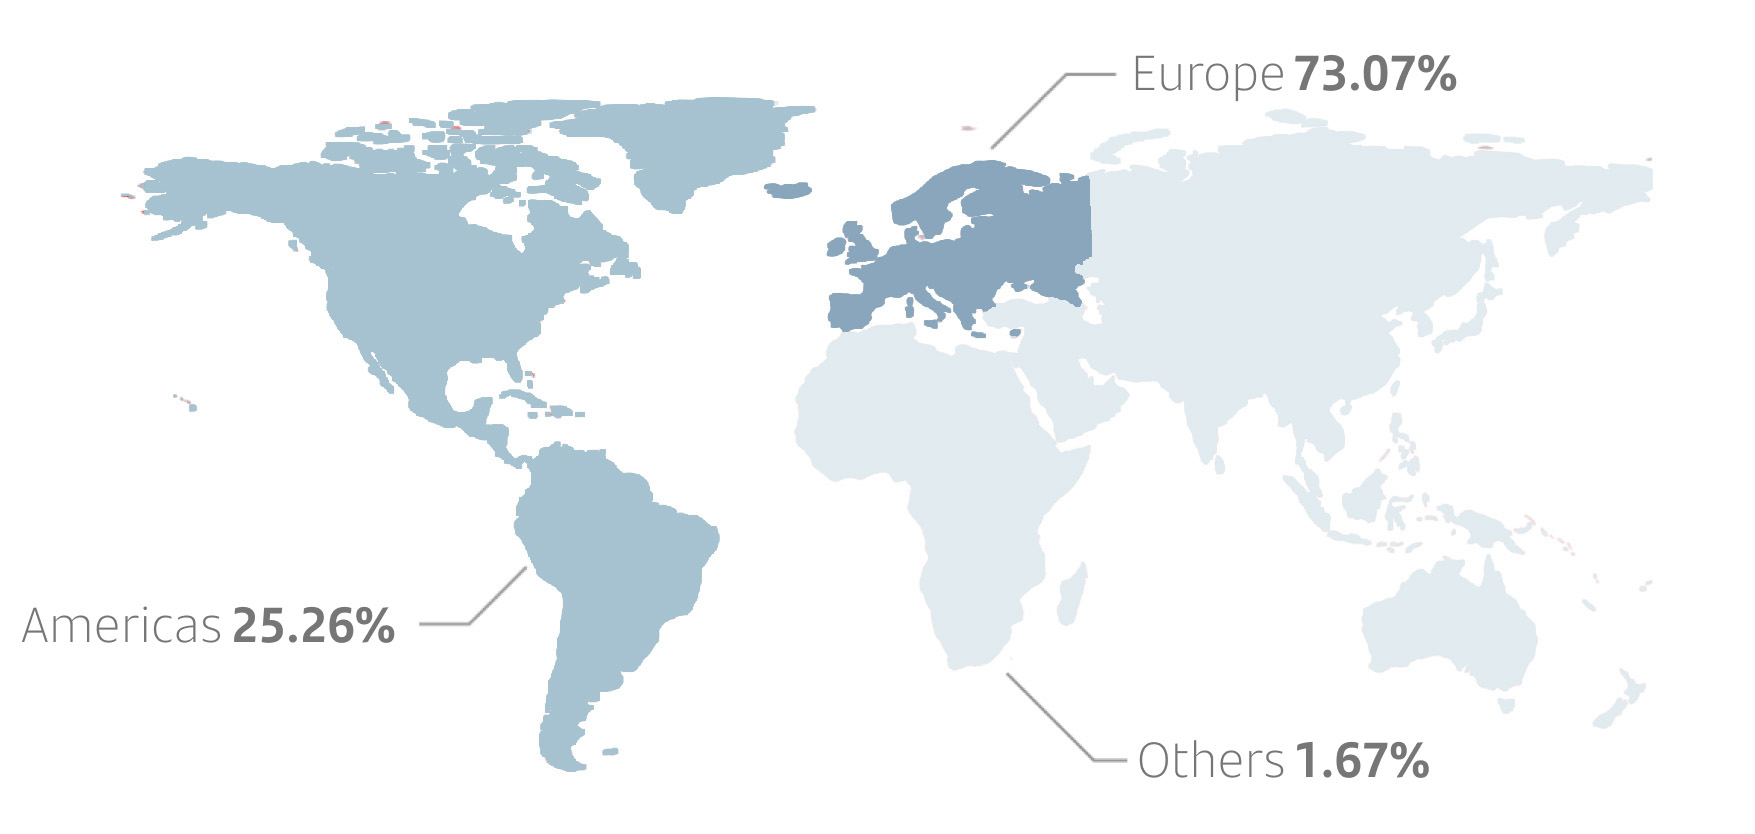 | ||
Aligned with high corporate governance standards | ||
 | ||
Banco Santander has the highest score in the Spanish Association for Standardisation and Certification's (AENOR) Good Corporate Governance Index (GCGI V2.0), which verifies aspects such as composition and functioning of the board and its committees, shareholders' general meeting, remuneration policy, compliance and transparency. | ||
Balanced and diverse board of directors

15 directors | ||
66.67% independent directors | ||
40% women | ||
5 geographies of origin | ||
178
179
1. 2023 Overview
 | "It is our goal as members of the board of directors of Banco Santander to increase shareholder value by delivering the sustainable results outlined at our Investor Day in February 2023. We believe that effective governance and rigorous oversight are key enablers to accomplishing these plans for success. As a result, the board paid close attention in 2023 to our operating model and succession planning process in addition to our other important governance tasks. One key strategic initiative in 2023 was to consolidate all activities across our footprint under five global businesses. In 2024 onwards, we will closely monitor the execution of this strategy to ensure that it accomplishes the intended customer benefits, operating efficiencies and clarity in external reporting. In 2023, we further supported the Group's strategic goals with a disciplined succession process, implementing key appointments to the board and senior management. First, the board oversaw the transition of the Chief Executive Officer, who reports directly to the board. In particular, we focused on monitoring the split of responsibilities between the Executive Chair and the Chief Executive Officer. Secondly, we managed the handover of the Lead Independent Director responsibilities from Bruce Carnegie-Brown to me as of October 2023. Bruce will stay on the board until the AGM and also continue to chair the nomination committee until then. All of us at Santander are deeply grateful to him for his many years of effective service. Further, under Bruce’s leadership during the year, we conducted a rigorous nomination process for new directors to replace him and Ramiro Mato, who will also be stepping down from the board. As a result, we nominated Carlos Barrabés and Antonio Weiss, who will both join the board shortly. I am delighted to welcome them and I am sure that we will greatly benefit from their broad experience and contributions. The board believes that effective governance is key to the successful development and execution of the Group’s strategy. To this end, we will continue to deepen diversity on our board, recognizing the benefits of a mix of gender, background, origin, skills, knowledge, experience and familiarity with our key markets to support our strategy. In particular, we commissioned an external evaluation of the board and its committees in order to continue to improve our overall effectiveness. We were pleased by the results which concluded that the board continues to operate effectively, while also identifying some areas for improvement. See more details in 'Board effectiveness review in 2023', in section 4.3. Importantly, the board also strongly believes in the value of engaging directly with our stakeholders. As part of that, Bruce Carnegie-Brown and I conducted an extensive engagement with shareholders in 2023/2024 ahead of the AGM (see more details in section 3.1 'Shareholder communication and engagement’). We deeply appreciate the time and effort expended by many of our shareholders to share their questions and recommendations with us. Looking back to 2023, I would like to thank Ramiro Mato, for his constructive challenges and contributions, and Bruce Carnegie-Brown for his exceptional professionalism and commitment to the Group. I also would like to compliment José Antonio Álvarez, now our non-executive board colleague and Vice Chair, for his many years of executive service to the Group. Their work will redound to the benefit of all of our stakeholders for years to come. Looking ahead, we are committed to increasing shareholder value in a manner consistent with the highest industry standards for serving our customers, employees and communities, while fulfilling our supervisory expectations and governance obligations. We are also mindful that the volatile geopolitical, economic and market conditions of 2023 could extend into the coming year. Working closely with our executive team, our board is confident that we will continue to create long-term, sustainable value for all stakeholders in 2024 and beyond." Glenn Hutchins, Vice Chair and Lead Independent Director | |||||||
180
1.1 Board skills and diversity
Appointments in 2023
Throughout 2023, we continued to renew and strengthen the board, reflecting our strong commitment to ensuring a balance of expertise and skills and diversity.
The changes have reinforced the board's banking, financial, technological and digital expertise, and to make it more diverse in terms of regional origin; and, overall, giving it the right composition to lead the Group in pursuit of its strategy now and in the future.
Two thirds of board members are independent directors and 40% are women, in line with our balanced representation target of 40-60% of both genders, and also with the diversity objectives set out in European and Spanish regulations (Directive (EU) 2022/2381, of 23 November 2022, on improving the gender balance among directors of listed companies and related measures, and Draft Organic Law on Equal Representation and Balanced Presence of Women and Men, which will implement the above mentioned directive).
The board changes in 2023 and the proposed changes to the annual general meeting called for 21 or 22 March 2024 at first or second call, respectively (2024 AGM), are as follows:
•Héctor Grisi is the Group CEO with effect from 1 January 2023. He succeeded José Antonio Álvarez, who remains on the board of directors as non-executive Vice Chair.
•Glenn Hutchins was appointed as Vice Chair and Lead Independent Director with effect from 1 October 2023, after a rigorous process lead by the nomination committee, replacing Bruce Carnegie-Brown in the role. Bruce Carnegie-Brown remains on the board of directors as non-executive director and has communicated to the board his intention to not stand for re-election at the 2024 AGM, stepping down with effect as from that same date.
•The board of directors agreed on 19 February 2024 to submit the nominations of both Carlos Barrabés and Antonio Weiss as new independent directors to the 2024 AGM (subject to regulatory approval), to fill the vacancies to be left by Bruce Carnegie-Brown and Ramiro Mato, who has also communicated his intention to not stand for re-election and step down as director on the later of the date on which the general meeting takes place and the date on which the regulatory approval for the appointment of Antonio Weiss is obtained. See section 3.5 'Our next AGM in 2024'. Carlos Barrabés is considered an influential e-commerce pioneer. He brings vast experience of the Spanish market, especially in digitalization and innovation, with a focus on using technology for socio-economic development, promoting talent, and helping people and institutions get the most out of the digital transformation. In turn, Antonio Weiss brings solid experience of the US market, which is one of the Group's strategic markets, and, in particular, in the financial sector, where he held different executive positions, and in the regulatory and public policy area.
Changes to the committees
The board made the following changes to the composition of its committees to ensure that they remained well equipped to discharge their responsibilities.
•Executive committee: Héctor Grisi joined the committee with effect from 1 January 2023 and Bruce Carnegie-Brown stepped down on 1 October 2023.
•Audit committee: its composition remained unchanged in 2023. In April 2024, after expiry of Pamela Walkden's four-year term of office, Germán de la Fuente will replace her as Chair of this committee. Pamela Walkden will remain as a member.
•Nomination committee: Belén Romana joined the committee on 1 January 2024.
•Remuneration committee: Glenn Hutchins was appointed Chair on 1 October 2023, replacing Bruce Carnegie-Brown.
•Risk supervision, regulation and compliance committee: Germán de la Fuente became a member on 1 January 2023.
•Responsible banking, sustainability and culture committee: Gina Díez Barroso was appointed to the committee on 31 January 2023.
•Innovation and technology committee: Héctor Grisi joined with effect from 1 January 2023 and Bruce Carnegie-Brown stepped down with effect from 1 October 2023.
1.2 Board effectiveness
Board effectiveness review and actions to continuously improve
Corporate governance is a priority for Santander. Our governance model has consistently received strong support from shareholders, as evidenced by their high participation in general meetings and strong approval rates for corporate management and the re-election of directors. Governance practices need to adapt to business and strategic needs, so we continuously monitor them and look for opportunities for improvement.
The annual board effectiveness review is key in our governance model and allows us to verify the quality and effectiveness of our governance bodies functioning. We periodically enlist the help of external independent advisors for the annual board effectiveness review, who enrich the outcomes with objective contributions. We also review individual and collective skills to ensure the board’s competence and diversity are sufficient for it to function effectively and hold management to account through constructive challenge.
In 2023, the nomination committee monitored execution of the action plan resulting from the 2022 internal board effectiveness review, which was successfully completed. In addition, the board conducted its annual effectiveness review in 2023 with the collaboration of an external independent firm (Spencer Stuart), covering its structure, organizational and functional model, dynamics and internal culture, depth of challenge, embeddedness of previous review outcomes, committee performance, as well as each director’s performance and contribution. Both the areas for improvement and the recommendations were reviewed by the nomination committee and the board of directors in January 2024 and the resulting
181
action plan was approved in February 2024. See 'Board effectiveness review in 2023' in section 4.3 for additional information.
Group and subsidiary board relations
The ongoing strength of the ties between the Group's and its subsidiaries' boards of directors is key to effective oversight of policies, controls and corporate culture. The volatile environment of the previous years reinforces the need for effective cross-border cooperation, which our proven Group Subsidiary Governance Model (GSGM) facilitates.
Our strength of governance is maintained by a number of coordination mechanisms that are in place between the Group and subsidiaries. In particular, the presence of a number of Group directors and top managers on our subsidiary boards, further reinforces the Group's oversight and control mechanisms and supplements the local boards with required skillsets. See section 7. 'Group structure and internal governance'.
In addition, we promote additional collaboration mechanisms to further strengthen the Group and subsidiary connectivity as follows:
Inaugural Subsidiary Chairs Meeting
In October 2023, the Executive Chair hosted for the first time a meeting with the Chairs of the board of directors of the main subsidiaries, accompanied by specific non-executive directors (mainly local Chairs of the nomination committees and Lead Independent Directors) in Boadilla del Monte, Madrid.
The arranged sessions were both informative and helpful in the context of their important role in driving our One Santander approach and associated strategy. They reflected on how their full support and alignment with Group expectations was key, helping to cement their sense of belonging to Santander and the importance of our global strategy and associated initiatives.
As part of that, the meeting covered strategic business considerations, ESG insights, cybersecurity, talent management and governance expectations, among others. The event was highly successful and promoted a sense of community among our subsidiaries. Further engagement opportunities will be explored in 2024.

Group and subsidiary committee relations
Banco Santander audit; responsible banking, sustainability and culture; and risk supervision, regulation and compliance
committee Chairs attended specific subsidiary committee meetings during 2023. In turn, they invited their local counterparts to join the respective Group meetings throughout the year. This helped to enhance communication and the sharing of topics of common interest and best practices.
In 2023, we also held a convention with the Chairs of the risk supervision, regulation and compliance committees at our headquarters in Boadilla del Monte. The aim was to foster further collaboration between subsidiaries, raise awareness about global initiatives and expectations, collectively discuss topical issues and encourage networking. The event was both successful and productive, with universal positive feedback received from participants.
In addition, the Chair of the audit committee hosted two virtual meetings with the subsidiary audit committee Chairs, which again provided a platform for sharing key messages across subsidiaries as well as facilitating ongoing connectivity. Further meetings of Chairs of these and other committees are planned in 2024 and beyond.
Induction & Training
We have continued to share our training, induction and development methodology and associated content with subsidiaries in order to promote best practices and drive consistency of approach on a group-wide basis. Specifically, in 2023 we scheduled training sessions with local directors covering cyber, ESG, financial crime, finance and targets disclosed at our Investor Day of 2023 in London, and talent management related matters, amongst others. See 'Director training and induction programmes' in section 4.3.
Group board visits
Every year at least one board session is held in one of the Group's key geographies. As part of these visits, directors meet top management in the unit in order to better understand the local financial sector. In 2023, the board of directors met in Lisbon, Portugal, with a specific focus on our business and strategy in this country.
Furthermore, subsidiary boards are encouraged to hold their board meetings at Santander's headquarters in Boadilla del Monte on occasion to foster further collaboration and engagement with the corporate teams. Throughout 2023, the boards of Santander Bank Polska, Santander UK and Santander Mexico held specific meetings in our headquarters. The above mentioned practices will continue in 2024 and beyond.
1.3 Remuneration policy
In 2023, we updated the remuneration policy for the Group’s executive directors and key executives to make it consistent with the new strategic plan disclosed at our Investor Day on 28 February 2023.
The 2023 compensation principles and composition will remain into 2024, 2025 and 2026, with just a few changes to simplify the bonus scheme:
•The number of steps for setting the yearly variable remuneration is reduced by converting the relative performance multiplier against the market into one of the elements of the qualitative assessment, instead of being an
182
intermediate step between the result of quantitative metrics and the qualitative assessment.
•However, to ensure that the multiplier is sufficiently relevant, its weight will be +/-10%, higher than the rest of the elements in the qualitative assessment, which will have a weight of +/-5%, after reducing the Network Collaboration item from +/-10% to +/-5% and merging Compliance and Risk into one.
As regards long-term remuneration, metrics related to return on tangible equity (RoTE) and total shareholder return (TSR) will be upheld. However, as for sustainability, updated targets are set in diversity (women in senior executive positions), financial inclusion and green finance. A new metric relating to the percentage of socially responsible investments over the total assets under management is included.
The maximum award ratio is upheld at 125%, so that executives are incentivized to outperform.
The variable remuneration of executive directors in 2024 shall be 50% in cash and 50% in Banco Santander shares. The variable remuneration of the rest of the Identified Staff in 2024 shall also be 50% in cash and 50% in Banco Santander shares.
1.4 Engagement with our shareholders
We are firmly committed to reporting information of the highest quality to align Santander’s interests with those of its shareholders, through sustainable growth and long-term value creation, and to retain shareholders’ confidence.
In 2023 we continued to combine traditional and virtual communication channels, which has allowed us to meet the needs of our approximately 3.7 million shareholders, encouraging their involvement in our corporate governance. See 'Engagement with shareholders in 2023' in section 3.1.
At the 2023 AGM, we once again gave our shareholders, spread around the world, the option to attend in person or remotely. This flexibility enables them to participate in the meeting without needing to travel.
A key shareholder engagement activity in 2023 was our Investor Day, held on 28 February, where the Group’s Executive Chair, the CEO and the Group Chief Financial Officer (CFO) presented our strategy and business and financial targets for the next three years to analysts and investors.
The new organizational structure that we presented to shareholders in September 2023 is a major step in our vision of becoming the best open financial services platform and will help us achieve the targets we announced at Investor Day. This structure brings together all our operations in these five global businesses: Retail & Commercial Banking; Digital Consumer Bank; Payments; Corporate & Investment Banking; and Wealth Management & Insurance.
1.5 Achievement of our 2023 goals
The 2022 annual report disclosed our corporate governance goals and priorities for 2023. The following chart describes how we delivered on each priority.
2023 goals | How we delivered | |||||||
Ensure a smooth transition of the new Chief Executive Officer and new Group Chief Risk Officer (CRO) | ||||||||
To oversee the orderly transition into the CEO and CRO roles, providing ongoing support and constructive challenge to both Héctor Grisi and Mahesh Aditya. | The board oversaw the smooth transition of the new CEO and CRO and ensured that their onboarding was robust, enabling them to be truly effective in their roles. Their transition was further facilitated by the fact that both were already familiar with the Group, in line with the board’s focus on continuing to develop the quality of our internal pipeline of talent. Specifically, the board supported Héctor Grisi during his transition as new CEO, and in particular, José Antonio Álvarez, who remains as a non-executive director, providing an ongoing transitional reference throughout 2023. In addition, the non-executive directors met with Héctor Grisi in a private session to retrieve his early views and comments after three months in the role. In turn, Mahesh Aditya transitioned into the CRO role assisted by a structured transition with the former CRO and, in addition to his direct and unfettered access to the board and its committees, has maintained regular informal meetings with the Chair of the risk supervision, regulation and compliance committee. Both executives have visited a significant number of units across our footprint to engage directly with the local management team to gain a deeper understanding and knowledge of the idiosyncrasies of our key businesses. They also successfully completed their induction programmes to the board’s satisfaction. | |||||||
183
2023 goals | How we delivered | |||||||
Progressing in our ESG commitments | ||||||||
To oversee the fulfilment of our ESG commitments to reach net zero emissions by 2050, accelerating green finance with new and wider value propositions for our customers, and at the same time taking care of the sustainability and responsible banking agenda. | We continued to progress on our ESG targets. In particular: •We expanded our capabilities to measure carbon emissions and approved new decarbonization targets for specific sectors. •We raised EUR 20.1 billion of green finance in 2023 (EUR 114.6 billion since 2019), towards our target of EUR 120 billion by 2025. •We increased our financial inclusion target, and the goal is now to financially include 5 million people by 2023-2025. In 2023, we have financially empowered 1.8 million people. •We invested EUR 105 million to support education, employability and entrepreneurship through Santander Universidades, helping 498 thousand people (2.7 million since 2019). •31.4% of our senior managers are women (35% target by 2025). We continued to prioritize diversity and inclusion awareness and equal opportunity regardless of gender, culture, sexual orientation or disability. | |||||||
Governance effectiveness | ||||||||
To continue enhancing the overall effectiveness of the board with an appropriate composition and ensuring that its role is discharged in the most tangible and effective manner. To consolidate the enhancements delivered as part of our action plan executed in 2022, following the review of our governance arrangements. | In 2023, we successfully managed succession planning throughout Santander, most notably conducting a rigorous and effective process that led to the appointment of Glenn Hutchins as new Lead Independent Director with effect from 1 October 2023. Glenn Hutchins replaced Bruce Carnegie-Brown, who had been in the role for almost nine years. We continued to work on an appropriately refreshed board of directors ensuring diversity in its broadest sense. As part of that, we will shortly welcome Carlos Barrabés and Antonio Weiss, whose appointments have been submitted to the 2024 AGM (subject to regulatory approval), further reinforcing the board's composition to ensure that we are well placed to address the challenges ahead in our business and taking into account feedback from previous board effectiveness reviews. In 2023, the nomination committee monitored execution of the action plan resulting from the 2022 internal board effectiveness review, which was successfully completed. In addition, the board conducted its annual effectiveness review in 2023 with the collaboration of Spencer Stuart as independent expert. The findings of the review concluded that the board and its committees operate effectively. See 'Board effectiveness review in 2023' in section 4.3. As part of that, the split of responsibilities between the Executive Chair and the CEO, together with the executive chair model, were positively rated by Spencer Stuart in 2023. The board verified that the arrangements to manage the Group with five global businesses were aligned with governance principles and management of the Group, whilst respecting the current governance structure of subsidiaries that are autonomous in capital and liquidity and aligned with accelerating transformation across the Group, with CEOs / Country Heads as ultimately responsible for the budget, execution of the customer and commercial strategy and financial delivery. | |||||||
184
2023 goals | How we delivered | |||||||
Balance sheet strength and long-term shareholder value | ||||||||
To maintain the solvency of the balance sheet and in particular, the quality of the credit risk portfolio as a key priority due to the current economic environment. To maintain our focus on capital management and capital allocation to businesses with high returns on risk-weighted assets (RoRWA). To promote the generation of long-term and sustainable shareholder value creation through consistent and reliable returns growth while continuing to build capital strength organically to ensure strong shareholder remuneration and the resources required to deliver our strategic transformation. | Even if the global economy in 2023 did better than expected, the board maintained a conservative risk appetite during the year given the increasing geopolitical risk and its potential macroeconomic implications, higher interest rates, and continued inflation, although the latter moderated its increase. During 2023, we continued maintaining a very active discipline of capital allocation and we have conducted a qualitative improvement in our asset mobilization capabilities. In 2023 we delivered a strong performance in the first year of our new phase of shareholder value creation that we outlined at the 2023 Investor Day. As part of that, the board continued to drive our potential through leveraging our unique business model based on the customer (building a digital bank with branches), scale (global and in-market scale) and diversification (business, geography and balance sheet). Specifically, we delivered on all our 2024 public targets disclosed to the market as follows: •Revenue and customer growth: revenue increased 13% in constant euros (11% in current euros) up to EUR 57,647 million and with customer numbers climbed five million to 165 million (vs.160 million customers in 2022). •Strength: CET1 above 12%, closing the year at 12.3% (vs. 12.0% in 2022), where we have maintained a disciplined capital allocation methodology and prudent risk management. •Profitability: RoTE above 15%, closing the year with a 15.1% RoTE (vs. 13.4% in 2022). •Cost discipline: the efficiency ratio improved in 2023 to 44.1% (vs. 45.8% in 2022), despite the impact of inflation on costs. •Conservative risk appetite: the Group cost of risk remained in line with the target below 1.2% at 1.18% at the end of 2023 (vs. 0.99% in 2022). •Shareholder remuneration: in 2023 the payout remained at 50% and TNAV raised up to EUR 4.76 per share (vs. EUR 4.26 per share in 2022). The paid cash dividend in 2023 amounted to 14.05 euro cents per share, which entailed a combined increase of TNAV and dividends of 15%. | |||||||
1.6 Priorities for 2024
The board set the following priorities for 2024:
•Transformation
We will oversee the execution of agreed plans to build a digital bank with branches with a single platform, optimizing the product portfolio and enhancing the customer experience, simplifying processes and implementing the new operating model.
•Five global businesses
We will oversee the consolidation of our activities across all markets under five global businesses and the change of reporting of financial results aligned to this model, with the support of the audit committee.
•People
We will continue to enhance our employee value proposition, ensuring that they are aligned with our corporate culture and that we are focused on attracting and retaining the best talent to fulfil our strategy. As part of that, succession planning will remain high on our agenda.
•Progressing in our ESG targets
We will oversee the fulfilment of our ESG targets to ensure that we remain on track to reach net zero emissions by 2050, accelerating finance to help our customers in their transition to a low carbon economy. In addition, we will continue taking care of the sustainability and responsible banking agenda, including our objectives on financial inclusion and customer welfare.
•Long-term shareholder value
The board will promote the generation of long-term and sustainable shareholder value creation through consistent returns growth while maintaining our capital management discipline. This will ensure strong shareholder remuneration and the resources required to deliver our strategic transformation.
•Governance effectiveness
We will remain focused on the overall effectiveness and composition of the board and its committees, ensuring that their role is discharged in the most tangible and effective manner.
185
2. Ownership structure
→Broad and balanced shareholder base
→A single class of shares
→Authorized capital consistent with best practice to provide the necessary flexibility
2.1 Share capital
Our share capital comprises ordinary shares, each with a par value of EUR 0.50. Every share belongs to the same class and carries the same voting, dividend and other rights.
We do not have any bonds or securities that can be converted into shares other than the contingent convertible preferred securities (CCPS) mentioned in section 2.2 'Authority to increase capital'.
As at 31 December 2023, Banco Santander's share capital amounted to EUR 8,092,073,09.50, divided into 16,184,146,059 shares.
In 2023, we amended our share capital twice, through the cancellation of the shares repurchased under the buyback programmes that formed part of the shareholder remuneration policy for 2022:
•by EUR 170,203,286 (c. 2.03% of share capital), under the authorization of the 2022 AGM. On 20 March 2023, the capital reduction was registered with the Commercial Registry; and
•by EUR 134,924,476.50 (c. 1.64% of share capital), in the terms agreed at the 2023 AGM. On 30 June 2023, the capital reduction was registered with the Commercial Registry.
On 30 January 2024, the board of directors agreed, under the authorization of the 2023 AGM, to reduce the share capital in the amount of EUR 179,283,743.50, by cancelling the 358.567.487 repurchased own shares (c. 2.22% of share capital), acquired through the first buyback programme carried out within the 2023 shareholder remuneration policy (First 2023 Buyback Programme). The share capital is currently EUR 7.912.789.286 represented by 15.825.578.572 shares.
Since November 2021, date on which the first buyback programme of those executed within the framework of the shareholder remuneration policy was completed, Banco Santander has reduced its share capital by c. 9%.
At the 2024 AGM, the board of directors has submitted to vote the cancellation of the shares that will be acquired through the second share buyback programme charged against 2023 results (Second 2023 Buyback Programme); as well as, if appropriate, within any new buyback programmes that the board may implement or by other legally permitted means.
We have a diversified and balanced shareholder structure, with 3,662,377 shareholders as at 31 December 2023, broken down
by type, geographical provenance and number of shares as follows:
Type of investor | |||||
% of share capital | |||||
BoardA | 1.20 | % | |||
Institutional | 58.75 | % | |||
Retail | 40.05 | % | |||
Total | 100 | % | |||
A. Shares owned or represented by directors. For more details, see 'Tenure and equity ownership' in section 4.2 and subsection A.3 in section 9.2 'Statistical information on corporate governance required by CNMV'.
| Geographic distribution | |||||
% of share capital | |||||
Europe | 73.07 | % | |||
The Americas | 25.26 | % | |||
Rest of the world | 1.67 | % | |||
| Total | 100 | % | |||
Number of shares | |||||
% of share capital | |||||
1-3,000 | 8.67 | % | |||
3,001-30,000 | 16.91 | % | |||
30,001-400,000 | 11.78 | % | |||
Over 400,000 | 62.64 | % | |||
Total | 100 | % | |||
2.2 Authority to increase capital
Under Spanish law, shareholders at the general meeting have the authority to increase the share capital and may delegate power to the board of directors to increase the share capital by no more than 50%. Our Bylaws are consistent with Spanish law and do not set out special conditions for share capital increases.
By 31 December 2023, our board of directors had received authorization from shareholders to approve or carry out the following capital increases:
•Authorized capital to 2025: Shareholders at the 2022 AGM granted authorization to the board to increase share capital on one or more occasions by up to EUR 4,335,160,325.50 (50% of the capital at the time of that AGM). The board was granted this authorization for a period of three years (until 1 April 2025).
The board can issue shares for cash consideration with or without pre-emptive rights for shareholders, and for capital
186
increases to back any convertible bonds or securities issued under its authority granted at the 2023 AGM.
Shares without pre-emptive rights under this authorization can be issued up to EUR 867,032,065 (10% of the capital at the time of the 2022 AGM). However, under the Spanish Companies Act, this limit does not apply to capital increases to convert CCPS (which shall be converted into newly-issued shares if the CET1 ratio falls below a predetermined threshold). This authorization was used for the two CCPS issues carried out in 2023.
The board of directors has proposed to have this authority renewed at our 2024 AGM. See section 3.5 'Our next AGM in 2024'.
•Capital increases approved for contingent conversion of CCPS: We issued contingent convertible preferred securities that qualify as regulatory Additional Tier 1 (AT1) instruments and would be converted into newly-issued shares if the CET1
ratio fell below a predetermined threshold. Each issue was backed by a capital increase approved under the authorization granted to the board by shareholders in force at the time of the CCPS issue.
The chart below shows the outstanding CCPS at the time of this report, with details about the capital increase resolutions that back them. Those capital increases are, therefore, contingent and have been delegated to the board of directors. The board is authorized to issue additional CCPS and other convertible securities and instruments in accordance with a resolution passed at the 2023 AGM that allows convertible instruments and securities to be issued for up to EUR 10 billion or an equivalent amount in another currency (two CCPS issues were executed in 2023 under this authorization). Any capital increase resulting from the conversion of shares and other convertible instruments will occur according to the capital increase authorization made at the time those instruments were issued.
| Issues of contingent convertible preferred securities | ||||||||||||||
| Date of issuance | Nominal amount | Discretionary remuneration per annum | Conversion predetermined threshold | Maximum number of shares in case of conversion A | ||||||||||
19/03/2018 | EUR 1,500 million | 4.75% for the first 7 years | If, at any time, the CET1 ratio of Banco Santander or the Group is lower than 5.125% | 416,666,666 | ||||||||||
14/01/2020 | EUR 1,500 million | 4.375% for the first 6 years | 604,594,921 | |||||||||||
| 06/05/2021 | USD 1,000 million | 4.75% for the first 6 years | 391,389,432 | |||||||||||
| 06/05/2021 | EUR 750 million | 4.125% for the first 7 years | 352,278,064 | |||||||||||
| 21/09/2021 | EUR 1,000 million | 3.625% for the first 8 years | 498,007,968 | |||||||||||
| 16/11/2023 | USD 1,150 million | 9.625% for the first 5 years and 6 months | 447,470,817 | |||||||||||
| 16/11/2023 | USD 1,350 million | 9.625% for the first 10 years | 525,291,828 | |||||||||||
A. The figure corresponds to the maximum number of shares that could be required to cover the conversion of these CCPS, calculated as the quotient (rounded off by default) of the nominal amount of the CCPS issue divided by the minimum conversion price determined for each CCPS (subject to any antidilution adjustments and the resulting conversion ratio).
2.3 Significant shareholders
As at 31 December 2023, there was no holder of a significant shareholding greater than 3% of the voting shares of Banco Santander registered with the CNMV (minimum threshold provided under Spanish law to disclose a significant holding in a listed company).
Though the following shareholdings held by asset managers were registered with the CNMV as at 31 December 2023, their related notifications state that the shares are being held on behalf of third parties (funds or other investment entities or the portfolios they manage) and that none of them exceeds 3% of the voting rights that Banco Santander shares afford.
| Significant shareholding | ||||||||
| Date of entry in CNMV register | Name | % holdingA | ||||||
| 24/10/2019 | BlackRock Inc | 5.426 | ||||||
| 16/06/2022 | Dodge & Cox | 3.038 | ||||||
| A. Percentage of capital as at the date of notification to the CNMV. | ||||||||
The changes in 2023 notified to the CNMV with regard to significant shareholdings are detailed below:
Significant shareholding | |||||||||||
| Date | Shareholder name | % previous share | % subsequent share | ||||||||
8/3/2023 | Norges Bank | 3.006 | 2.996A | ||||||||
| A. Shares and financial instruments. | |||||||||||
Likewise, though as at 31 December 2023 certain custodians appeared in our shareholder registry as holding more than 3% of our share capital, we understand that those shares were held on behalf of other investors, none of whom exceeded that threshold individually. These custodians were State Street Bank (14.97%), Chase Nominees Limited (6.89%), The Bank of New York Mellon Corporation (5.98%), Citibank (3.87%) and BNP Paribas (3.09%).
There may be some overlap in the holdings declared by the above mentioned custodians and asset managers.
Lastly, as at 31 December 2023, neither our shareholder registry nor the CNMV's registry showed any shareholder residing in a non-cooperative jurisdiction with a shareholding equal to, or greater than, 1% of our share capital (which is the mandatory disclose threshold applicable to such investors under Spanish law).
187
Our Bylaws and the Rules and regulations of the board of directors set out an appropriate regime for analysing and approving related-party transactions with significant shareholders. See section 4.12 'Related-party transactions and other conflicts of interest'.
2.4 Shareholders’ agreements
In February 2006, several persons linked to the Botín-Sanz de Sautuola y O’Shea family entered into a shareholders’ agreement to set up a syndicate for their shares in Banco Santander. The CNMV was informed of the execution of this agreement and the subsequent amendments the parties made. This information can be found on the CNMV website.
The main provisions of the agreement are:
•Transfer restrictions. Any transfer of Banco Santander shares expressly included in the agreement requires prior authorization from the syndicate meeting (which can freely authorise or reject it), except when the transferee is also a party to the agreement or Fundación Botín. These restrictions apply to the shares they expressly cover under the agreement and to shares subscribed for, or acquired by, syndicate members in exercising any subscription, bonus share, grouping or division, replacement, exchange or conversion rights that pertain or are attributed to, or derive from, those syndicated shares.
•Syndicated voting. Under the agreement, the parties will pool the voting rights attached to all their shares so that syndicate members may exercise them and engage Banco Santander in a concerted manner, in accordance with the instructions and the voting criteria and orientation the syndicate establishes. This covers the shares subject to the transfer restrictions mentioned above as well as any voting rights attached to any other Banco Santander shares held either directly or indirectly by the parties to the agreement, and any other voting rights assigned to them by virtue of usufruct, pledge or any other contractual title, for as long as they hold those shares or are assigned those rights. Representation of the syndicated shares is attributed to the syndicate chair, who will be the chair of Fundación Botín (currently Javier Botín, one of our directors and brother of our Group Executive Chair (Ana Botín)).
Though the agreement initially terminates on 1 January 2056, it will extend automatically for additional 10-year periods unless one of the parties notifies of its intention not to extend six months before the initial term or extension period ends. The agreement may only be terminated early if all the syndicated shareholders agree unanimously.
As at 31 December 2023, the parties to this agreement held 109,032,191 shares in Banco Santander (0.67% of its capital at such time), which were therefore subject to the voting syndicate. They include 80,355,819 shares (0.50% of its capital by close of 2023) that are also subject to the referred transfer restrictions.
Subsection A.7 of section 9.2 'Statistical information on corporate governance required by CNMV' contains a list of parties to the shareholders' agreement and the relevant information filed with CNMV.
2.5 Treasury shares
Shareholder approval
The acquisition of treasury shares was last authorized at our 2023 AGM, for five years and subject to these provisions:
•Treasury shares held cannot exceed 10% of Banco Santander's share capital at any time, which is the legal limit set under the Spanish Companies Act.
•The acquisition price may not be lower than the par value of the shares, nor exceed by more than 3% the highest of the following two: the price of the last independent transaction or the highest independent offer at that time at the trading venue where the purchase is made.
•The board may set the purposes and the procedures in which it may apply.
Treasury shares policy
On 27 June 2023, the board approved the current treasury shares policy, which dictates that treasury share transactions may be carried out for these purposes:
•Provide liquidity or supply of securities in the market for Banco Santander shares, which gives this market depth and minimizes any potential temporary imbalances in supply and demand.
•Take advantage, for the benefit of all shareholders, of weakness in the share price due to its medium-term outlook.
•Meet Grupo Santander's obligations to deliver shares to our employees and directors.
•Serve any other purpose authorized by the board within the legal limits and those set at the general meeting. In this regard, Banco Santander made during the year the donation to Fundación Banco Santander indicated below in the context of its Responsible Banking Policy.
Among other things, the policy also provides for:
•The principles to uphold in treasury share trades, which include protecting financial markets' integrity and prohibiting market manipulation and insider trading.
•The operational criteria for carrying out treasury share trades, unless in exceptional circumstances as per the policy or carried out through mechanisms, such as buyback programmes, with a regulation of their own. These criteria include rules on:
•Responsibility for execution of these trades, which falls on the Investments and Holdings department, which is kept separate from the rest of Banco Santander.
•Venues. Trades must generally be carried out in the orders market of the continuous market (mercado continuo) of Spanish stock exchanges.
•Volume limits. Trades must generally not exceed 15% of the average daily trading volume for Banco Santander shares in the previous 30 sessions on the relevant trading venue.
188
•Price limits. In general, (a) buy orders should not exceed by more than 3% the higher of (i) the price of the last independent transaction prior to the relevant acquisition or (ii) the highest independent bid at that time on the trading venue where the purchase is made; and (b) sell orders should not be lower than the lesser of the price of the last trade in the market by independent parties and the lowest sell order price in the order book.
•Time limits, including a black-out period that applies (a) during the 15 calendar days prior to the publication of each quarterly financial information and (b) if Banco Santander has decided to delay the disclosure of inside information according to market abuse regulations, until such information is disseminated. In the case of buyback programmes, the specific regulations establish a black-out period of 30 calendar days prior to the publication of annual and semi-annual results, which, however, will not apply when the buyback programme is managed by a third party or when the issuer has a temporary buyback programme in place.
•Disclosure to the markets of treasury shares trading.
The policy applies to the discretionary trading of treasury shares irrespective of whether they are carried out in regulated markets, in multilateral trading facilities, outside the orders market, either through blocks or through special transactions, or under buyback programmes. Furthermore, buyback programmes shall comply with all the applicable specific regulations, such as regulation on market abuse and their relevant implementing rules. The policy does not apply to transactions on Banco Santander's shares carried out to hedge market risks or provide brokerage or hedging for customers.
The full treasury shares policy is available on Banco Santander's corporate website.
Execution of the buyback programmes charged against 2022 results
According to the 2022 shareholder remuneration policy, two buyback programmes were executed:
•In the first buyback programme, executed from 22 November 2022 to 31 January 2023, we acquired 340,406,572 treasury shares (2.03% of share capital). Under the authorization of the 2022 AGM, on 1 February 2023 the board resolved to reduce Banco Santander’s share capital through the cancellation of the repurchased shares.
•In the second buyback programme, executed from 1 March to 21 April 2023, we acquired 269,848,953 treasury shares (1.64% of share capital). In the terms agreed by the 2023 AGM, on 24 April 2023 the board resolved to reduce Banco Santander’s share capital through the cancellation of the repurchased shares.
First 2023 Buyback Programme
Under the authorization of the 2023 AGM, and according to the 2023 shareholder remuneration policy, on 26 September 2023 the board resolved to execute a new share buyback programme for a maximum amount of EUR 1,310 million, equivalent to approximately 25% of the Group reported profit (excluding non-cash, non-capital ratios impact items) in first semester 2023.
In the First 2023 Buyback Programme (executed from 28 September 2023 to 25 January 2024, once the required regulatory authorization was obtained), we acquired 358,567,487 treasury shares (representing approximately 2.22% of Banco Santander’s share capital), at a weighted average price per share of EUR 3.65.
On 30 January 2024, the board resolved to reduce the share capital in the amount of EUR 179,283,743.50, by cancelling the 358,567,487 repurchased shares.
For more details on the share capital reductions, see section 2.1 'Share capital'
Second 2023 Buyback Programme
Under the same AGM approval and also according to the 2023 shareholder remuneration policy, on 19 February 2024 the board resolved to execute a new share buyback programme worth EUR 1,459 million. The appropriate regulatory authorization has already been obtained and the execution of which will begin from 20 February 2024.
The board had submitted the resolution to vote at the 2024 AGM for the share capital reduction by cancelling repurchased shares. See section 3.5 'Our next AGM in 2024'.
Activity in 2023
As at 31 December 2023, Banco Santander and its subsidiaries held 297,815,673 shares, which accounted for 1.84% of Banco Santander´s share capital (compared to 243,689,025, 1.45% of the share capital, at 31 December 2022).
The chart below summarizes the monthly average proportion of treasury shares to share capital throughout 2022 and 2023.
Monthly average of daily positions in treasury shares | ||||||||
| % of Banco Santander’s share capital at month end | ||||||||
| 2023 | 2022 | |||||||
January | 1.75 | % | 1.64 | % | ||||
February | 2.16 | % | 1.62 | % | ||||
March | 1.46 | % | 1.65 | % | ||||
April | 1.50 | % | 1.96 | % | ||||
May | 1.72 | % | 1.68 | % | ||||
June | 1.68 | % | 1.62 | % | ||||
July | 0.08 | % | 0.02 | % | ||||
August | 0.08 | % | 0.10 | % | ||||
September | 0.08 | % | 0.11 | % | ||||
October | 0.64 | % | 0.05 | % | ||||
November | 1.25 | % | 0.15 | % | ||||
December | 1.56% | 0.98 | % | |||||
189
In 2023, Banco Santander and its subsidiaries' treasury share trades amounted to the following values:
Acquisitions and transfers of treasury shares in 2023 | ||||||||||||||||||||||||||||||||
| Acquisitions | Transfers | |||||||||||||||||||||||||||||||
| EUR (except number of shares) | Number of shares | Total par value | Total cash amount | Average purchase price | Number of shares | Total par value | Total cash amount | Average purchase price | Profit (loss) net of taxes | |||||||||||||||||||||||
| Discretionary trading | 39,020,430 | 19,510,215 | 135,372,000 | 3.47 | 50,793,292A | 25,396,646A | 157,268,000A | 3.46B | 13,031,000B | |||||||||||||||||||||||
Client induced tradingC | 196,118,212 | 98,059,106 | 649,037,000 | 3.31 | 196,118,212 | 98,059,106.00 | 649,037,000 | 3.31 | ||||||||||||||||||||||||
| Buyback programmes | 676,155,035 | 338,077,518 | 2,324,924,000 | 3.44 | N/A | N/A | N/A | N/A | N/A | |||||||||||||||||||||||
| Total | 911,293,677 | 455,646,839 | 3,109,333,000 | 3.41 | 246,911,504A | 123,455,752A | 806,305,000A | 3.34B | 13,031,000B | |||||||||||||||||||||||
A. Including a donation that Banco Santander made to Fundación Banco Santander during the year totalling 6,617,008 treasury shares. For more details, see section 6.2 'Other community support programmes' of the ‘Responsible banking’ chapter.
B. Excluding the donation mentioned in footnote A above.
C. Transactions on Banco Santander's shares to hedge market risks or provide brokerage or hedging for customers.
The chart below shows significant changes in treasury shares that required disclosure to the CNMV in the year. Companies must report to the CNMV when purchases of treasury shares exceed 1% of the total voting rights (without discounting transfers) or there is a change in the number of total voting rights.
Significant changes in treasury shares in 2023A | |||||||||||
| % of voting rights represented by shares | |||||||||||
Reported on | acquired since last notice | transferred since last notice | held at reference date of notice | ||||||||
13/01/2023B | 1.06% | 0.22% | 1.40% | ||||||||
| 8/02/2023 | 1.01% | 0.23% | 2.18% | ||||||||
| 24/03/2023 | 1.02% | 2.54% | 0.70% | ||||||||
| 20/04/2023 | 1.03% | 0.18% | 1.55% | ||||||||
| 5/07/2023 | 0.54% | 2.03% | 0.09% | ||||||||
| 19/10/2023 | 1.06% | 0.46% | 0.68% | ||||||||
| 13/12/2023 | 1.00% | 0.19% | 1.50% | ||||||||
A. Percentages calculated with share capital at the date of disclosure.
B. Corrects notice dated 27 December 2022.
Transactions with financial instruments
The transactions with financial instruments with Banco Santander shares as the underlying asset carried out by Banco Santander of its own accord in 2023 for the purpose of discretionary treasury share management are as follows:
•In Q1'23, we reduced the investment position by a delta (i.e. net exposure to share price changes) equalling 6,000,000 shares.
•The final position at year end was a positive aggregated delta equalling 3,000,000 shares worth a total EUR 9,576,000.
•The instruments used were total return equity swaps, to be settled at maturity exclusively in cash.
190
2.6 Stock market information
Markets
Banco Santander shares are listed on Spanish stock exchanges (Madrid, Barcelona, Bilbao and Valencia), the New York Stock Exchange as American Depositary Shares (ADS), the London Stock Exchange as Crest Depositary Interests (CDI) and the Warsaw Stock Exchange. Likewise, until 28 December 2023, Banco Santander shares were listed on the traditional listing of the Mexican Stock Exchange (BMV) and from 29 December 2023 the shares are listed only in the International Quotation System (SIC) of said stock exchange.
Market capitalization and trading
As at 29 December 2023, Banco Santander occupies the second position in the eurozone and in the twenty-first world by market value among financial institutions, with a market capitalization of EUR 61,168 million.
11,132 million Banco Santander shares traded in the year for an effective value of EUR 38,144 million and a liquidity ratio of 68%.
| The Banco Santander share | ||||||||
| 2023 | 2022 | |||||||
| Shares (million) | 16,184.1 | 16,794.4 | ||||||
| Price (EUR) | ||||||||
| Closing price | 3.780 | 2.803 | ||||||
| Change in the price | 35 | % | (5%) | |||||
| Maximum for the period | 3.970 | 3.482 | ||||||
| Date of maximum for the period | 06/12/2023 | 10/02/2022 | ||||||
| Minimum for the period | 2.812 | 2.324 | ||||||
| Date of minimum for the period | 03/01/2023 | 15/07/2022 | ||||||
| Average for the period | 3.447 | 2.795 | ||||||
| End-of-period market capitalization (EUR million) | 61,168 | 47,066 | ||||||
| Trading | ||||||||
| Total volume of shares traded (million) | 11,132.3 | 14,217 | ||||||
| Average daily volume of shares traded (million) | 43.7 | 55.3 | ||||||
| Total cash traded (EUR million) | 38,143.5 | 40,262 | ||||||
| Average daily cash traded (EUR million) | 149.6 | 156.7 | ||||||
191
3. Shareholders and general meeting
→One share, one vote, one dividend
→No takeover defences in our Bylaws
→High shareholder participation and engagement at our general meetings
3.1 Shareholder communication and engagement
Policy on communication and engagement with shareholders and investors
Banco Santander aims to ensure its interests are in line with those of its shareholders, through sustainable growth and long-term value creation, retaining shareholders' and broader society's trust. For that, we:
•provide information to shareholders and investors that meets their expectations and upholds our culture and values; and
•communicate and engage with them regularly so that senior managers and governance bodies consider their views.
Our policy on communication and engagement with shareholders and investors, available on our corporate website, sets out the principles that govern the aforementioned activities:
•Protection of all shareholders' rights and lawful interests. We facilitate the exercise of rights for shareholders, provide them with information and give them opportunities to have a say in our corporate governance.
•Equal treatment and non-discrimination. We treat investors in the same situation equally.
•Fair disclosure. We make sure that the information we disclose is transparent, truthful and consistent according to applicable law.
•Appropriate disclosure of information. We report appropriate and relevant information to meet our shareholders’ and investors’ needs and expectations, and make sure it is clear, concise and accurate.
•Compliance with law and corporate governance rules. We adhere closely to the laws and regulations on inside and price-sensitive information in addition to following the principles of cooperation and transparency with supervisory and regulatory bodies.
The policy also sets out:
•the roles and responsibilities of the main governance bodies and internal functions involved in communication and engagement;
•the channels for information disclosure and communication; and
•the ways in which we engage with shareholders and investors.
The policy also applies to relations with agents that advise, recommend or guide our shareholders and investors, such as financial and ESG analysts, proxy advisers and ratings agencies.
Moreover, Banco Santander has board-approved frameworks on branding and communications, and on accounting and financial information and management. They set out the general principles, roles and key processes on the communication of financial, non-financial and corporate information, which help ensure that all our shareholders and other stakeholders are properly informed about our strategy, targets and results, as well as about our culture and values
Engagement with shareholders in 2023
As part of our policy on communication and engagement with shareholders and investors, we carried out the following activities during the year:
•The annual general meeting. The ordinary general meeting is the most important annual event for our shareholders. We strive to encourage them to attend and participate in the meeting, in an informed way. See 'Participation at general meetings' and 'Right to information' in section 3.2.
The annual general meeting is broadcast live on our corporate website, where its recordings are made available in full afterwards. This enables shareholders who cannot attend the meeting and other stakeholders to remain fully informed of deliberations and adopted resolutions.
The 2023 AGM was hybrid, allowing shareholders to attend in person or remotely. Our general meeting attendance app ensures shareholders can fully exercise their rights to attend and participate in real time and remotely. They can watch the entire meeting through a live feed, vote, make remarks, propose resolutions and contact the notary public. Our high shareholder participation rate at the most recent general meetings proves the effectiveness of our electronic means of attendance, delegation and remote voting prior to the meeting.
Also, the vast quorum and voting results at our 2023 AGM show just how important we consider shareholder engagement through general meetings. See section 3.4 '2023 AGM'.
Once again, Banco Santander's management system for the 2023 AGM received AENOR certification for sustainable events in compliance with the UNE-ISO 20121.
•Quarterly results presentations. We present our results at the end of each quarter on the same day we make them public. The presentation can be followed live, via conference call or streamed on our website. We release the related
192
quarterly financial report and presentation material on the same day before the markets open. During the presentation, questions can be asked or emailed to: investor@gruposantander.com.
In 2023, we gave our first, second and third quarter results presentations on 25 April, 26 July and 25 October, respectively. Our fourth quarter results presentation took place on 31 January 2024.
•Investor and strategy days. We organize investor and strategy days where we explain our strategy and targets for the next three years to investors and other stakeholders in a broader context than in results presentations. Investors can interact directly with senior managers and some directors. We
publish announcements about these meetings and provide related documents well in advance.
Our most recent investor day was held in London on 28 February 2023. For more details, see section 1.4 'Engagement with our shareholders'. The information we made available at those events is not included in this annual report nor considered part of it.
•Other activities. We know that a single format for communicating with shareholders and investors is not valid for everyone. For this reason, in 2023 and early 2024, we carried out the activities detailed in the table below to meet their diverse needs and expectations.
Other activities | ||||||||
→Regular meetings between the Lead Independent Director and key investors | Since October, our Lead Independent Director, Glenn Hutchins, accompanied by Bruce Carnegie-Brown, met with institutional investors, particularly in the months leading up to the AGM. In total, he met with 17 institutional investors, who represent approximately 24.6% of share capital. | |||||||
→Investor roadshows | Our Shareholder and Investor Relations team had 930 meetings (both in person and virtually) with 379 investors, including 47 meetings focused on ESG matters. We engaged with 36.18% of share capital. | |||||||
→Interaction with retail shareholders | Our Shareholder and Investor Relations team held 206 events (online, in person and hybrid). Attendees accounted for 8.4% of the capital held by retail shareholders in Spain. Shareholders engaged with the Group’s senior management at several of these events. | |||||||
→Studies and surveys | We received 239,238 shareholders and investors opinions through quality surveys and studies, of which 9,120 corresponded to opinions received in the SPF (Simple, Personal and Fair) survey of Banco Santander. | |||||||
Communication with proxy advisors and other analysts
We have always recognized the value our investors place on open and proactive dialogue with proxy advisers, ESG analysts and other influential entities. We make sure they understand our corporate governance, responsible banking and sustainability priorities and messages in order to convey them properly to investors.
In 2023, we continued to engage with the main proxy advisers (providing them with information and explanations, among others, about proposed resolutions submitted to vote at the 2023 AGM so they could make voting recommendations) and ESG ratings agencies.
Corporate website
Our corporate website includes all the information on corporate governance as required by law and, in particular, (i) Banco Santander’s key internal regulations (Bylaws, Rules and regulations of the board, Rules and regulations for the general shareholders meeting, etc.); (ii) information on the board of directors and its committees, as well as directors’ skills and professional biographies; and (iii) all the information related to general meetings.
Information on our corporate governance can be found at https://www.santander.com/en/shareholders-and- investors/corporate-governance (included for information purposes only). The contents of our corporate website are not incorporated by reference to this annual report nor should be considered part of it for any purpose.
In addition, our corporate website provides extensive institutional, financial and sustainability information about the Group as well as other information we consider to be of interest to our shareholders and, in general, to all our stakeholders worldwide. Its design enables us to be transparent and enhance user experience by providing quality information about Santander.
Other channels | |||||
In order to maximize the dissemination and quality of information, we offer shareholders and investors an app (Santander Shareholders and Investors) compatible for Android and Apple iOS that contains a broad range of information about the Group. |  | ||||
We also engage with shareholders through various channels, such as an email address, telephone lines, WhatsApp, postal service and virtual office. | |||||
In addition, we regularly post information about Banco Santander on our official Twitter and LinkedIn accounts. The contents included in these profiles are not incorporated by reference to this annual report nor should be considered part of it for any purpose. | |||||
193
3.2 Shareholder rights
One share, one vote, one dividend
Our Bylaws provide for one share class only (ordinary shares), which grant all shareholders the same rights. Each Banco Santander share entitles its holder to one vote and there is no preferential treatment in dividend payouts. The Bylaws fully adhere to the one share, one vote, one dividend principle.
Voting rights and unrestricted share transfers
There are no non-voting or multiple-voting shares, nor limitations to the number of votes a shareholder can cast, or any other restriction on exercising voting rights, except for those prescribed by law or set out in our Bylaws should the acquisition of the shares infringe regulations. There are no quorum requirements or qualified majorities other than those prescribed by law.
Neither Banco Santander's Bylaws nor any other means restrict the transferability of shares, which is subject only to restrictions prescribed by law.
Furthermore, our Bylaws do not include any neutralization provisions, as set out in the Spanish Securities Market Act, which would apply in takeover bids.
The shareholders’ agreement mentioned in section 2.4 'Shareholders' agreements' contains transfer and voting restrictions on the shares that are subject to it.
Acquisition of significant shareholdings
The acquisition of a significant shareholding or influence in Banco Santander is subject to regulatory approval or non-objection, as applicable, by the supervising authority, as banking is a regulated sector. Furthermore, as Banco Santander is a listed company, any parties wishing to acquire control over it and/or enter into any other lawful scenario must launch a tender offer for its shares.
Such acquisitions are largely regulated by:
•Regulation (EU) 1024/2013 of the Council of 15 October 2013, conferring specific tasks on the ECB relating to the prudential supervision of credit institutions.
•Act 10/2014, of 26 June, on the organization, supervision and solvency of credit Institutions and its implementing regulation, Spanish Royal Decree 84/2015, of 13 February.
•Act 6/2023, of 17 March, on the Securities Markets and on Investment Services.
The acquisition of a significant holding in Banco Santander may also require approval by other domestic and foreign regulators with supervisory powers over Banco Santander or its subsidiaries' operations and shares listings, or other actions concerning such regulators or subsidiaries; and other authorities pursuant to foreign investment regulations in Spain or other countries where we operate.
Participation at general meetings
All registered holders of shares found on record at least five days prior to the day of a general meeting are entitled to attend. Banco Santander facilitates shareholder participation by allowing them to exercise their rights to attend, delegate, vote and participate at general meetings using remote communications systems. Shareholders can attend general meetings virtually. They can watch it through a live feed, vote, make remarks, propose resolutions and contact the notary public.
The electronic shareholders’ forum, available on the corporate website at the time the meeting is held, allows shareholders to add to the agenda items included in the meeting notice, requests for support for their proposals, initiatives to reach the percentage required to exercise minority shareholder rights legally, and offers or requests to act as a voluntary proxy.
Supplement to the notice and proposal of resolutions
Shareholders representing at least 3% of the share capital are able to request the publication of a supplement to the annual general meeting notice, adding one or more items to the agenda, with an explanation or substantiated resolution proposal and any other relevant documents.
Shareholders representing at least 3% of the share capital may also propose reasoned resolutions on any matters that have been, or should be, added to the agenda of a called annual general meeting.
To exercise these rights, shareholders must send a certified notice to Banco Santander’s registered office within five days after the annual general meeting notice is posted.
Any shareholder, irrespective of their stake, can also request the removal of directors or the filing of corporate liability action against any director to be put to a vote at the general meeting, even when not on the agenda.
Right to information
From the time the general meeting notice is posted until the fifth day before the general meeting date on first call, shareholders can submit the written requests for information or clarification they may deem pertinent, or any written questions they deem relevant to the items on the meeting agenda.
Moreover, in the same manner and within the same period, shareholders can submit written requests for clarification about information Banco Santander has sent to the CNMV since the last general meeting or about auditor’s reports. Banco Santander posts all shareholder-requested information and the answers it provides on its corporate website.
Shareholders may also exercise their right to receive information at the meeting. Where information cannot be given during the course of the meeting, it will be provided in writing within seven days.
194
Quorum and majorities for passing resolutions at the general meeting
The quorum and majorities set out in our Bylaws and Rules and regulations for general meetings in order to hold a valid meeting and adopt corporate resolutions are those set out under Spanish law.
Except for certain matters mentioned below, on first call, shareholders accounting for at least 25% of the subscribed share capital with voting rights must be in attendance for the valid constitution of the general shareholders' meeting. If sufficient quorum is not reached, general meetings will be held on second call, which does not require a quorum.
In accordance with our Rules and regulations for the general meeting, shareholders voting by remote means, by post or direct delivery or by electronic means before the meeting are counted as present in order to determine the general meeting quorum.
With the exception of certain matters mentioned below, general meeting resolutions pass when shareholders attending in person or by proxy cast more votes in favour than against.
The quorum and majorities required to amend the Bylaws, issue shares and bonds, make structural changes and vote on other significant resolutions permitted by law are those set out below for amending the Bylaws. Furthermore, in accordance with laws applying to credit institutions, if over 50% of the share capital is present at a general meeting, a qualified two-thirds majority is required to raise the proportion of variable remuneration components to fixed components above 100% (up to 200%) for executive directors and other employees whose professional activities have a material impact on the Group's risk profile; otherwise, a three-quarters majority will be necessary.
Decisions about acquiring, selling or contributing core assets to another company or similar corporate transactions shall require shareholder approval at general meetings when the law so dictates. Our Bylaws have no further requirement in this regard.
Rules for amending our Bylaws
Shareholders at the general meeting have the authority to approve any amendment to the Bylaws. However, the board can also decide to change the registered office within Spain.
The directors or, as applicable, the shareholders who have drafted a proposed amendment to the Bylaws, must write it out in full and prepare a report justifying it, which shall be provided to shareholders at the time the general meeting to debate the proposed amendment is called.
The general meeting notice must clearly state the items to be amended as well as the rights of all shareholders to examine the full text of proposed amendments and the related report at Banco Santander’s registered office and to have them delivered free of charge.
If shareholders are convened to debate amendments to the Bylaws, the quorum on first call will be reached if 50% of the subscribed share capital with voting rights is in attendance. If a sufficient quorum cannot be reached, the general meeting will be held on second call, where 25% of the subscribed share capital with voting rights must be in attendance.
When less than 50% of the subscribed share capital with voting rights is in attendance, resolutions on amendments to the Bylaws can only be validly adopted if two-thirds of shareholders attending the meeting in person or by proxy vote for them. However, when 50% or more of the subscribed share capital with voting rights is present, resolutions may pass by way of absolute majority.
Resolutions to amend the Bylaws that involve new obligations for shareholders must be accepted by those affected.
Bylaws amendments are subject to ECB approval. However, amendments that are exempt from authorization but must still be reported to the ECB include the change of the registered office within Spain, share capital increases, adding mandatory or prohibitive laws or regulations to the Bylaws, changing the wording in order to comply with court or administrative rulings and any others the ECB has declared exempt due to a lack of materiality in response to prior consultations.
3.3 Dividends and shareholder remuneration
Remuneration against 2023 results
With regard to the 2023 results, the board followed a policy of allocating approximately 50% of the Group reported profit (excluding non-cash, non-capital ratios impact items) to shareholder remuneration, distributed as approximately 50% in cash dividends and 50% in share buybacks.
•Interim remuneration. On 26 September 2023, the board resolved to:
•Pay an interim cash dividend against the 2023 results of 8.10 euro cents per share entitled to the dividend (equivalent to approximately 25% of said Group reported profit in H1’23); it was paid from 2 November 2023.
•Execute the First 2023 Buyback Programme worth up to EUR 1,310 million (equivalent to approximately 25% of said Group reported profit in H1’23). See 'First 2023 Buyback Programme' in section 2.5.
•Final remuneration. Under the 2023 shareholder remuneration policy, on 19 February 2024 the board of directors resolved to:
•Submit a resolution at the 2024 AGM to approve a final cash dividend in the gross amount of 9.50 euro cents per share entitled to dividends. If approved at the AGM, the dividend would be payable from 2 May 2024.
•Implement the Second 2023 Buyback Programme worth 1,459 million euros, for which the appropriate regulatory authorization has been obtained and the execution of which will begin from 20 February 2024. For more details, see 'Second 2023 Buyback Programme' in section 2.5.
195
Once the above-mentioned actions are completed, total shareholder remuneration for 2023 will total 5,538 million euros (approximately 50% of the Group reported profit -excluding non-cash, non-capital ratios impact items- in 2023), distributed as approximately 50% in cash dividends (2,769 million euros) and 50% in share buybacks (2,769 million euros). These amounts have been estimated assuming that, as a consequence of the partial execution of the Second 2023 Buyback Programme, the number of outstanding shares entitled to a final cash dividend will be 15,483,617,874. Therefore, that amount may be higher if fewer shares than planned are acquired in the Second 2023 Buyback Programme; otherwise, it will be lower.
Remuneration against 2024 results
For the 2024 results, the board intends to continue applying the same policy, consisting in a total shareholder remuneration of approximately 50% of the Group reported profit (excluding non-cash, non-capital ratios impact items), distributed in approximately equal parts in cash dividend and share buybacks, thus continuing the one applied with respect to 2023.
The shareholder remuneration policy is subject to future corporate and regulatory approvals.
3.4 2023 AGM
We held our annual general meeting on 31 March 2023, on second call, both in person and by electronic means.

Quorum and attendance
The quorum (among shareholders present and represented) was 67.564%, broken down as follows:
Quorum breakdown | |||||
| Present | 3.358 | % | |||
| In person and virtual attendance | 0.717 | % | |||
| Remote voting | |||||
By post or direct delivery | 0.423 | % | |||
| By electronic means | 2.218 | % | |||
| Represented | 64.206 | % | |||
By post or direct delivery | 5.592 | % | |||
By electronic means | 58.614 | % | |||
Total | 67.564 | % | |||
Approved resolutions and voting results
All items on the agenda were approved. Votes in favour of the board’s proposals averaged 98.08%. 99.72% of votes approved the corporate management for 2023 and 90.78% of the votes approved the directors' remuneration policy for 2023, 2024 and 2025. None of the agenda items listed in the notice convening the meeting received less than 89.22% of votes in favour.
196
The following chart summarizes the resolutions approved and voting results:
VOTES A | QuorumD | ||||||||||||||||
ForB | AgainstB | BlankC | AbstentionC | ||||||||||||||
1. Annual accounts and corporate management | |||||||||||||||||
1A. Annual accounts and directors’ reports for 2022 | 99.68 | 0.32 | 0.06 | 0.27 | 67.56 | ||||||||||||
1B. Consolidated statement of non-financial statements for 2022 | 99.79 | 0.21 | 0.06 | 0.22 | 67.56 | ||||||||||||
1C. Corporate management for 2022 | 99.72 | 0.28 | 0.06 | 0.58 | 67.56 | ||||||||||||
2. Application of results for 2022 | 99.75 | 0.25 | 0.06 | 0.21 | 67.56 | ||||||||||||
3. Board of directors: appointment, re-election or ratification of directors | |||||||||||||||||
3A. Setting of the number of directors | 99.60 | 0.40 | 0.06 | 0.27 | 67.56 | ||||||||||||
3B. Ratification of the appointment and re-election of Mr Héctor Blas Grisi Checa | 99.54 | 0.46 | 0.07 | 0.31 | 67.56 | ||||||||||||
3C. Ratification of the appointment and re-election of Mr Glenn Hogan Hutchins | 98.87 | 1.13 | 0.06 | 0.31 | 67.56 | ||||||||||||
3D. Re-election of Mrs Pamela Ann Walkden | 99.49 | 0.51 | 0.07 | 0.30 | 67.56 | ||||||||||||
3E. Re-election of Ms Ana Patricia Botín-Sanz de Sautuola y O'Shea | 98.15 | 1.85 | 0.06 | 0.42 | 67.56 | ||||||||||||
3F. Re-election of Ms Sol Daurella Comadrán | 97.03 | 2.97 | 0.07 | 0.29 | 67.56 | ||||||||||||
3G. Re-election of Ms Gina Lorenza Díez Barroso Azcárraga | 98.58 | 1.42 | 0.07 | 0.30 | 67.56 | ||||||||||||
3H. Re-election of Ms Homaira Akbari | 99.50 | 0.50 | 0.07 | 0.31 | 67.56 | ||||||||||||
4. Re-election of the external auditor for financial year 2023 | 99.31 | 0.69 | 0.06 | 0.28 | 67.56 | ||||||||||||
5. Share capital and convertible securities | |||||||||||||||||
5A. Reduction in share capital in the maximum amount of EUR 757,225,978.50, through the cancellation of a maximum of 1,514,451,957 own shares | 99.32 | 0.68 | 0.05 | 0.21 | 67.56 | ||||||||||||
5B. Reduction in share capital in the maximum amount of EUR 822,699,750.50, through the cancellation of a maximum of 1,645,399,501 own shares | 99.28 | 0.72 | 0.05 | 0.19 | 67.56 | ||||||||||||
5C. Authorisation for the Bank and its subsidiaries to be able to acquire own shares | 98.72 | 1.28 | 0.05 | 0.19 | 67.56 | ||||||||||||
5D. Delegation to the board of the power to issue securities convertible into shares of the Bank within a 5-year period and subject to a maximum aggregate limit of EUR 10,000 million. Setting of standards to determine the bases for and terms and conditions applicable to the conversion and granting of powers to increase capital. Delegation to exclude pre-emptive rights | 96.65 | 3.35 | 0.05 | 0.22 | 67.56 | ||||||||||||
6. Remuneration | |||||||||||||||||
6A. Directors' remuneration policy | 90.78 | 9.22 | 0.06 | 0.27 | 67.56 | ||||||||||||
6B. Setting of the maximum total annual remuneration of directors in their capacity as directors | 97.66 | 2.34 | 0.06 | 0.26 | 67.56 | ||||||||||||
6C. Approval of the maximum ratio of fixed and variable components of total remuneration of executive directors and other employees belonging to categories with professional activities that have a material impact on the risk profile | 98.52 | 1.48 | 0.06 | 0.30 | 67.16 | ||||||||||||
6D. Deferred Multiyear Objectives Variable Remuneration Plan | 96.72 | 3.28 | 0.06 | 1.47 | 67.56 | ||||||||||||
6E. Application of the Group’s buy-out regulations | 98.38 | 1.62 | 0.07 | 0.33 | 67.56 | ||||||||||||
6F. Annual directors' remuneration report (consultative vote) | 89.22 | 10.78 | 0.06 | 0.26 | 67.56 | ||||||||||||
7. Authorization to the board and grant of powers for conversion into public instrument | 99.74 | 0.26 | 0.06 | 0.23 | 67.56 | ||||||||||||
8 to 23. Corporate action to demand director liability and dismissal and removal of directorsE | 0.00 | 100.00 | 0.00 | 0.03 | 64.92 | ||||||||||||
A. Each Banco Santander share grants one vote.
B. Percentage of votes for and against.
C. Percentage of share capital present and attending by proxy at the 2023 AGM.
D. Percentage of Banco Santander's share capital on the date of the 2023 AGM.
E. Items 8 to 23, not included on the agenda, were put to a separate vote. They refer to the proposal to bring corporate action to demand director liability (acción social de responsabilidad) against all directors in office (8) and to the proposal of dismissal and removal of the following directors: Ms Ana Botín-Sanz de Sautuola y O'Shea (9), Mr Héctor Blas Grisi Checa (10), Mr Bruce Carnegie-Brown (11), Mr José Antonio Álvarez Álvarez (12), Ms Homaira Akbari (13), Mr Javier Botín-Sanz de Sautuola y O'Shea (14), Mr Henrique de Castro (15), Ms Sol Daurella Comadrán (16), Ms Gina Lorenza Díez Barroso (17), Mr Germán de la Fuente Escamilla (18), Mr Glenn Hogan Hutchins (19), Mr Luis Isasi Fernández de Bobadilla (20), Mr Ramiro Mato García-Ansorena (21), Ms Belén Romana García (22) and Mrs Pamela Walkden (23).
The full texts of the resolutions passed can be found on our corporate website and on the CNMV’s website, as they were filed as other relevant information on 31 March 2023.
197
3.5 Our next AGM in 2024
The board of directors agreed to call the 2024 AGM on 21 March on first call or on 22 March on second call, proposing the following resolutions:
Annual accounts and corporate management. To approve: | ||||||||
→The annual accounts and the directors’ reports of Banco Santander and its consolidated Group for the financial year ended on 31 December 2023. For more details, see 'Consolidated financial statements'. →The consolidated non-financial statement for the financial year ended on 31 December 2023, which is part of the consolidated directors' report. See the 'Responsible banking' chapter. →The corporate management for financial year 2023. | ||||||||
Application of results of financial year 2023 | ||||||||
→To approve the application of results obtained by Banco Santander during financial year 2023. See note 4.a) to the consolidated financial statements. | ||||||||
Board of directors: appointment and re-election | ||||||||
→To set the number of directors at 15, within the maximum and minimum limits stated in the Bylaws. →To appoint Carlos Barrabés and Antonio Weiss as independent directors. See section 1.1 'Board skills and diversity'. →To re-elect Javier Botín, Germán de la Fuente, Henrique de Castro, José Antonio Álvarez and Belén Romana for a three-year period. See section 4.1 'Our directors'. | ||||||||
External auditor | ||||||||
→To re-elect the firm PricewaterhouseCoopers Auditores, S.L. (PwC) as external auditor of Banco Santander and its consolidated group for financial year 2024. | ||||||||
Share capital and convertible securities | ||||||||
→To authorize the increase of the share capital. Delegation for the exclusion of the preferential subscription right. →To reduce the share capital of Banco Santander with the following purposes: •Cancelling a maximum of 1,566,857,857 treasury shares purchased under the Second 2023 Buyback Programme. •Cancelling a maximum of 1,582,557,857 treasury shares acquired through one or more share buyback programmes or by other legally permitted means, authorizing the board of directors to cancel them on one or several occasions in a maximum timescale of one year or by the date of the next annual general meeting. | ||||||||
→To approve the director's remuneration policy for 2024, 2025 and 2026. →To set the maximum amount of annual remuneration to be paid to all the directors in their capacity as such. →To approve a maximum ratio of 200% of variable components to fixed components of total remuneration for executive directors and certain employees belonging to professional categories that have a material impact on the Group’s risk profile. →To approve the Deferred Multiyear Objectives Variable Remuneration Plan. →To approve the Group's buy-out regulations. →To hold a non-binding vote on the annual directors’ remuneration report. | ||||||||
The related documents and information are available for consultation on our corporate website from the date the meeting notice is published. We will also broadcast our 2024 AGM live, as it was done for the 2023 AGM.
Since attendance at general meetings is not paid, a general policy in this regard is not necessary. However, Banco Santander offers shareholders that participate in our general meeting a commemorative courtesy gift, as has been tradition for decades.
198
4. Board of directors
A balanced and diverse board
→15 directors: 13 non-executive and 2 executive
→Majority of independent directors (66.67%)
→Balanced presence of women and men (40%-60%)
Effective corporate governance
→Specialized committees advising the board
→The responsible banking, sustainability and culture committee shows the board's commitment to these areas
→Complementary functions and effective controls: Executive Chair, CEO and Lead Independent Director
1 Germán de la Fuente Member Non-executive director (independent) òp | 2 Pamela Walkden Member Non-executive director (independent) òCp | 3 Héctor Grisi CEO Executive director òp | 4 Ana Botín Executive Chair Executive director òCpC | 5 Glenn Hutchins Vice Chair and Lead Independent Director Non-executive director (independent) ¢¢Cp | 6 Ramiro Mato Member Non-executive director (independent) òòpŸC | 7 Belén Romana Member Non-executive director (independent) òò¢pCŸp | 8 Sol Daurella Member Non-executive director (independent) ¢¢Ÿ | ||||||||||||||||
9 Javier Botín Member Non-executive director | 10 Henrique de Castro Member Non-executive director (independent) ò¢p | 11 Gina Díez Barroso Member Non-executive director (independent) ¢Ÿ | 12 Bruce Carnegie-Brown Member Non-executive director (independent) ¢C¢ | 13 José Antonio Álvarez Vice Chair Non-executive director òp | 14 Luis Isasi Member Non-executive director ò¢p | 15 Homaira Akbari Member Non-executive director (independent) òŸp | 16 Jaime Pérez Renovales General Counsel and secretary of the board | ||||||||||||||||
ò Executive committee
ò Audit committee
¢ Nomination committee
¢ Remuneration committee
p Risk supervision, regulation and compliance committee
Ÿ Responsible banking, sustainability and culture committee
p Innovation and technology committee
C Chair of the committee

199
4.1 Our directors
 | |||||||||||
Ana Botín-Sanz de Sautuola y O’Shea EXECUTIVE CHAIR Executive director | |||||||||||
Board member since 1989.
Nationality: Spanish. Born in 1960 in Santander, Spain.
Education: Degree in Economics from Bryn Mawr College of Pennsylvania.
Experience: Ms Botín joined Banco Santander, S.A., after working at JP Morgan (New York, 1980-1988). In 1992, she was appointed Senior Executive Vice President. Between 1992 and 1998, she led Santander’s expansion into Latin America. In 2002, she was appointed Executive Chair of Banesto. Between 2010 and 2014, she was CEO of Santander UK PLC and was a non-executive director until April 2021. In 2014 she was
appointed Executive Chair of Santander. She was also a non-executive director of Santander UK Group Holdings PLC (2014-2021) and Chair of the European Banking Federation from 2021 to February 2023.
Other positions of note: Ms Botín is a member of the board of directors of The Coca-Cola Company and Chair of the Institute of International Finance (IIF). She is also founder and Chair of the CyD Foundation (which supports higher education) and the Empieza por Educar Foundation (the Spanish subsidiary of international NGO Teach for All), and sits on the advisory board of the Massachusetts Institute of Technology (MIT).
Positions in other Group companies: Ms Botín is non-executive Chair of Open Bank, S.A., Santander Consumer Finance, S.A., Open Digital Services, S.L., PagoNxt, S.L., Universia España Red de Universidades, S.A. and Universia Holding, S.L.; and is a non- executive director of Santander Holdings USA, Inc. and Santander Bank, N.A.
Membership of board committees: Executive committee (Chair) and innovation and technology committee (Chair).
Skills and competencies: Ms Botín has extensive international experience in top executive roles in banking. She has also led Grupo Santander’s strategic and cultural transformation, and her philanthropy underscores her ongoing commitment to sustainable and inclusive growth.
 | |||||||||||
Héctor Grisi Checa CHIEF EXECUTIVE OFFICER Executive director | |||||||||||
Board member since 2023.
Nationality: Mexican. Born in 1966 in Mexico City, Mexico.
Education: Degree in Finance from Universidad Iberoamericana (Mexico City).
Experience: Mr Grisi joined the Group in 2015 as Executive Chair and CEO of Santander México and Grupo Financiero Santander México. In 2019, he was named Regional Head for North America. Before joining Santander he worked in Mexico and the US. Mr Grisi spent 18 years in several leadership
roles at Crédit Suisse, including Head of investment banking for Mexico, Central America and the Caribbean, and Chair and CEO of Crédit Suisse México. He also held several roles in corporate and investment banking at Grupo Financiero Inverméxico and at Casa de Bolsa Inverlat. From 2011 to 2014, Mr Grisi was Vice Chair of Asociación de Bancos de México ("Bank Association of Mexico").
Other positions of note: Mr Grisi is non-executive Chair of Cogrimex, S.A. de C.V.
Positions in other Group companies: Mr Grisi is a non-executive director of Grupo Financiero Santander México, S.A. de C.V. and PagoNxt, S.L.
Membership of board committees: Executive committee and innovation and technology committee.
Skills and competencies: Mr Grisi has gained vast experience and a unique strategic vision from his many years of executive service at several banking and financial institutions. He is well-versed in Grupo Santander’s businesses and global strategy, especially in such key markets as Mexico and the US. He brings to the board diversity and a strong, international track record of management, leadership, business transformation and connectivity between the Group’s markets.
200
| |||||||||||
Glenn Hogan Hutchins VICE CHAIR AND LEAD INDEPENDENT DIRECTOR Non-executive director (independent) | |||||||||||
Board member since 2022.
Nationality: American. Born in 1955 in Virginia, US.
Education: Graduated with a AB, MBA and JD from Harvard University.
Experience: Mr Hutchins co-founded US technology and investment firm Silver Lake, where he was CEO until 2011. Prior, Mr Hutchins had been a senior managing director at The Blackstone Group (1994-1999) and Thomas H. Lee Co. (1985-1994), and a consultant at Boston Consulting Group. He has also served on the boards of SunGard Data Systems (Chair, 2005-2015), NASDAQ (2005-2017) and Virtu Financial (2017-2021). He served as a director and Chair of the audit and risk committees of the Federal Reserve Bank of New York from 2011 to 2021. Additionally, he served on the board of the
Harvard Management Company, which manages Harvard University’s endowment. Mr Hutchins worked with President Clinton in his transition to power and the White House as special advisor on economic and healthcare policy.
Other positions of note: Mr Hutchins is non-executive Chair of investment firm North Island Ventures and an independent director of AT&T. He is a member of the international advisory board and investment board of Singapore’s Government Investment Corporation (GIC), co-Chair of the Brookings Institution, director of not-for-profit organization CARE, and Vice Chair of the Obama Foundation. He also serves on the executive committee of the Boston Celtics basketball team.
Membership of board committees: Nomination committee, remuneration committee (Chair), and innovation and technology committee.
Skills and competencies: As a long-time investor in technology and fintech companies, Mr Hutchins has expertise in financial markets and is well-known among investors and stakeholders. He brings to the board his acumen in technology, telecommunications, innovation, finance and investment as well as extensive knowledge of financial regulation as a result of his leadership roles in government, especially with financial regulators and supervisors. He works closely with not-for-profit entities committed to fighting poverty, designing effective public policy and promoting social justice.
 | |||||||||||
José Antonio Álvarez Álvarez VICE CHAIR Non-executive director | |||||||||||
Board member since 2015.
Nationality: Spanish. Born in 1960 in León, Spain.
Education: Degree in Economics and Business Administration. MBA from the University of Chicago.
Experience: Mr Álvarez joined Santander in 2002. He was appointed Senior Executive Vice President of the Financial Management and Investor Relations division in 2004 (Group Chief Financial Officer) and was Group CEO from 2015 to 2022.
He served as director at SAM Investments Holdings Limited, Santander Consumer Finance, S.A. and Santander Holdings USA, Inc. He sat on the supervisory boards of Santander Consumer Bank AG, Santander Consumer Holding GmbH and Santander Bank Polska, S.A. He was also a board member of Bolsas y Mercados Españoles, S.A.
Other positions of note: Mr Álvarez is an independent director of Aon PLC and a member of the advisory committee of Grupo GED.
Positions in other Group companies: Mr Álvarez is non-executive Vice Chair of Banco Santander (Brasil) S.A. and a non-executive director of PagoNxt, S.L.
Membership of board committees: Executive committee and innovation and technology committee.
Skills and competencies: Mr Álvarez is a highly qualified and talented leader with a distinguished career in banking. He brings significant strategic and international management expertise, in particular financial planning, asset management and consumer finance, and has vast knowledge of the Group from his tenure as CEO. He has extensive experience and an established reputation with such key stakeholders as regulators and investors.
201
 | |||||||||||
Homaira Akbari Non-executive director (independent) | |||||||||||
Board member since 2016.
Nationality: American and French. Born in 1961 in Tehran, Iran.
Education: PhD in Experimental Particle Physics from Tufts University of Massachusetts and MBA from Carnegie Mellon University.
Experience: Ms Akbari was a non-executive director of Gemalto NV and Veolia Environment S.A. She was Chair and CEO of SkyBitz, Inc., managing director of TruePosition Inc., and a non-executive director of Covisint Corporation and US Pack Logistics, LLC. She also held various roles at Microsoft Corporation and Thales Group, was non-executive Chair of WorkFusion, Inc., and an independent director of Temenos, AG.
Other positions of note: Ms Akbari is CEO of AKnowledge Partners, LLC, a global consultancy firm on the Internet of Things, cyber security and artificial intelligence. She is an independent director of Landstar System, Inc. and a member of the security advisory board of Telefónica Soluciones de Criptografía, S.A.U. She is also a trustee of the French Institute Alliance Française.
Positions in other Group companies: Ms Akbari is a non-executive director of Santander Consumer USA Holdings Inc. and PagoNxt, S.L.
Membership of board committees: Audit committee, responsible banking, sustainability and culture committee, and innovation and technology committee.
Skills and competencies: Ms Akbari brings significant experience of technology companies. Her knowledge of digital transformation challenges and cyber security is an asset to the board. She also has extensive experience in diverse regions and knowledge of water, energy and waste management and treatment, which are of particular value to the Group's sustainability policy.
 | |||||||||||
Javier Botín-Sanz de Sautuola y O’Shea Non-executive director | |||||||||||
Board member since 2004.
Nationality: Spanish. Born in 1973 in Santander, Spain.
Education: Degree in Law from the Complutense University of Madrid.
Experience: Mr Botín founded JB Capital Markets, S.V., S.A.U. in 2008 and has been its Executive Chair ever since. He was co-founder and executive director of the equities division of M&B Capital Advisers, S.V., S.A. (2000-2008). Previously, he had been a legal adviser within the International Legal department of Banco Santander (1998-1999).
Other positions of note: In addition to the financial sector, Mr Botín works with several not-for-profit organizations. He has been Chair of the Botín Foundation since 2014 and is also a trustee of the Princess of Girona Foundation.
Skills and competencies: Mr Botín brings international and managerial expertise to the board, particularly in finance and banking. He also brings a deep understanding of Grupo Santander, its operations and its strategy from his tenure as a non-executive director.
202
 | |||||||||||
Bruce Carnegie-Brown Non-executive director (independent) | |||||||||||
Board member since 2015.
Nationality: British. Born in 1959 in Freetown, Sierra Leone.
Education: Master of Arts in English Language and Literature from the University of Oxford.
Experience: Mr Carnegie-Brown was non-executive Chair of Moneysupermarket.com Group PLC (2014-2019), a non-executive director of Jardine Lloyd Thompson Group PLC (2016-2017), Santander UK PLC and Santander UK Group Holdings PLC (2019-2021), and non-executive Chair of Aon UK Ltd (2012-2015). He was the founder and managing partner of the quoted private equity division of 3i Group PLC, and Chair and CEO of Marsh Europe, S.A. He was also Lead Independent
Director at Close Brothers Group PLC (2006-2014) and Catlin Group Ltd (2010-2014). He previously worked at JP Morgan Chase for 18 years and Bank of America for four years. He was Vice Chair and Lead Independent Director of Banco Santander from 2015 to 2023.
Other positions of note: Mr Carnegie-Brown is the non-executive Chair of Lloyd’s of London and of Cuvva Limited, a member of the investment committee of Gresham House PLC, Chair of Marylebone Cricket Club (MCC) and of TheCityUK leadership council, and member of the professional game committee of England and Wales Cricket Board.
Membership of board committees: Nomination committee (Chair) and remuneration committee.
Skills and competencies: Mr Carnegie-Brown has a lengthy background in banking, particularly investment banking, and considerable expertise in insurance. He also possesses significant international experience in top management positions in Europe (UK), the Middle East and Asia. His top-management insight provides the board with know-how in regard to remuneration, appointments and risk. As Lead Independent Director, he has also gained an excellent understanding of investors’ expectations, as well as managing relations with them and the financial community.
 | |||||||||||
Sol Daurella Comadrán Non-executive director (independent) | |||||||||||
Board member since 2015.
Nationality: Spanish. Born in 1966 in Barcelona, Spain.
Education: Degree in Business and MBA from ESADE.
Experience: Ms Daurella sat on the board of Círculo de Economía de Barcelona and was an independent director of Banco Sabadell, S.A., Ebro Foods, S.A. and Acciona, S.A. She was also honorary consul general of Iceland in Barcelona (1992-2021).
Other positions of note: Ms Daurella is Chair of Coca-Cola Europacific Partners PLC, Executive Chair of Olive Partners, S.A., and holds several roles in Grupo Cobega companies. She is also Vice Chair of the board of trustees of the FERO Oncology Research Foundation and of Instituto de la Empresa Familiar.
Membership of board committees: Nomination committee, remuneration committee, and responsible banking, sustainability and culture committee.
Skills and competencies: Ms Daurella brings to the board excellent strategy and high-level management skills from her international top-executive experience at listed and large privately-held entities, particularly distributors. She has vast experience of corporate governance as the former Chair of several boards and having served on several audit committees. As a trustee of various health, education and environmental foundations, she provides responsible business and sustainability insight to the board.
203
 | |||||||||||
Henrique de Castro Non-executive director (independent) | |||||||||||
Board member since 2019.
Nationality: Portuguese. Born in 1965 in Lisbon, Portugal.
Education: Degree in Business Administration from the Lisbon School of Economics & Management and MBA from the University of Lausanne.
Experience: Mr de Castro was Chief Operating Officer at Yahoo. Previously, he had been the manager of worldwide devices, media and platforms at Google, European sales and business development manager at Dell Inc., and a consultant at McKinsey & Company. He was also an independent director at First Data Corporation.
Other positions of note: Mr de Castro is an independent director of Fiserv Inc.
Positions in other Group companies: Mr de Castro is a non-executive director of PagoNxt, S.L.
Membership of board committees: Audit committee, remuneration committee, and innovation and technology committee.
Skills and competencies: Mr de Castro brings to the board valuable international experience in technological and digital strategy due to his executive roles in the world´s top technology companies.
 | |||||||||||
Germán de la Fuente Escamilla Non-executive director (independent) | |||||||||||
Board member since 2022.
Nationality: Spanish. Born in 1964 in Madrid, Spain.
Education: Degree in Economics and Business Administration with a diploma in auditing from the Complutense University of Madrid.
Experience: Mr de la Fuente has spent his professional career at Deloitte, where he has been Head of the audit business for the financial services industry (2002–2007), managing partner of Audit & Assurance (2007-2021) in Spain, and Chair and CEO of Deloitte, S.L. (2017-2022). He was also a member of the global board of directors of the firm from 2012 to 2016 and of the global audit and risk services committee until June 2021. He has been involved in auditing major Spanish financial groups and in multiple consulting and advisory projects.
Membership of board committees: Audit committee and risk supervision, regulation and compliance committee.
Skills and competencies: Mr de la Fuente brings extensive experience in the auditing industry and sound knowledge in auditing, accounting and internal and risk control, and the banking sector, all of which uphold his recognition as a financial expert.
204
 | |||||||||||
Gina Díez Barroso Azcárraga Non-executive director (independent) | |||||||||||
Board member since 2020.
Nationality: Mexican. Born in 1955 in Mexico City, Mexico.
Education: Degree in Design from Centro de Diseño of Mexico City.
Experience: Ms Díez Barroso was an independent director of Santander México and other Grupo Santander companies in Mexico until April 2020. She has been member of the board of directors of Americas Society and Council of the Americas, Laurel Strategies and Qualitas of Life Foundation. She was also a founder and a trustee of the Pro-Educación Centro and Diarq foundations.
Other positions of note: Ms Díez Barroso is the founder and non-executive Chair of Grupo Diarq, S.A. de C.V. and Centro de Diseño y Comunicación, S.C. (Universidad Centro). She is also a non-executive director of Bolsa Mexicana de Valores (BMV) and Dalia Women, S.A.P.I de C.V. (Dalia Empower), a member of Comité de 200 (C200) and represents Mexico at the W20, the G20 women's initiative to promote gender diversity.
Positions in other Group companies: Ms Díez Barroso is a non-executive director of Universia México, S.A. de C.V.
Membership of board committees: Nomination committee and responsible banking, sustainability and culture committee.
Skills and competencies: Ms Díez Barroso brings to the board vast experience in the real estate and education sectors, and has extensive knowledge of, and an ever-lasting commitment to, sustainability, inclusion and responsible business, having been a founder and trustee of foundations that focus on education, gender diversity and social support.
 | |||||||||||
Luis Isasi Fernández de Bobadilla Non-executive director (*) | |||||||||||
Board member since 2020.
Nationality: Spanish. Born in 1956 in Jerez de la Frontera, Spain.
Education: Degree in Economics and Business Administration and MBA from Columbia Business School.
Experience: Mr Isasi began his career at Abengoa, before holding various executive positions at JP Morgan in New York and First National Bank of Chicago in London.
In 1987, he joined Morgan Stanley where he was managing director of investment banking for Europe and Chair and Country Head for Spain (1997-2020) and senior advisor (2020-2023). He has also been director of Madrileña Red de Gas, S.A. and Sociedad Rectora de la Bolsa de Madrid, S.A., as well as an independent director of Grifols, S.A.
Other positions of note: Mr Isasi is non-executive Chair of Santander España and of Logista Integral, S.A. (LOGISTA).
Membership of board committees: Executive committee, remuneration committee, and risk supervision, regulation and compliance committee.
Skills and competencies: Mr Isasi has vast experience in a wide range of sectors and international markets (in particular, finance and investment banking) as well as a strong institutional network within Spain.
(*) In the opinion of the nomination committee and the board of directors, Mr Isasi meets the requirements to be considered independent, despite being categorized as other external based on a standard of prudence. For more details, see subsection 'Other external directors', in section 4.2.
205
 | |||||||||||
Ramiro Mato García-Ansorena Non-executive director (independent) | |||||||||||
Board member since 2017.
Nationality: Spanish. Born in 1952 in Madrid, Spain.
Education: Degree in Economics from the Complutense University of Madrid and graduate of Harvard University´s Management Development Programme.
Experience: Mr Mato held several roles in Banque BNP Paribas, including Chair of BNP Paribas Group in Spain. Previously, he had held several top roles in Argentaria. He sat on the board of
the Spanish Banking Association (AEB) as representative of Banque BNP Paribas, and of Bolsas y Mercados Españoles, S.A. He has also been a member of the board of trustees of the Fundación Española de Banca para Estudios Financieros (FEBEF).
Other positions of note: Mr Mato is Chair of Ansorena, S.A., senior advisor of ACON Southern Europe Advisory, S.L., and Vice Chair of the board of trustees of the Fundación Esperanza y Alegría.
Membership of board committees: Executive committee, audit committee, risk supervision, regulation and compliance committee, and responsible banking, sustainability and culture committee (Chair).
Skills and competencies: Mr Mato has had an extensive professional career in banking and capital market sectors. He has held senior executive and non-executive roles and brings considerable expertise in top management, audit, risk and strategy, mainly within the financial sector. He has also been active on the boards of trustees of several foundations to promote education.
 | |||||||||||
Belén Romana García Non-executive director (independent) | |||||||||||
Board member since 2015.
Nationality: Spanish. Born in 1965 in Madrid, Spain.
Education: Degree in Economics and Business Administration from Universidad Autónoma de Madrid. She is also State Economist for Spain.
Experience: Ms Romana was formerly director general of Economic Policy, director general of the Treasury of the Spanish Ministry of Economy, and director at Banco de España and the CNMV. She was also a director at the Instituto de Crédito Oficial and other entities on behalf of the Ministry of Economy. She served as a non-executive director at Banesto and as Executive Chair of Sociedad de Gestión de Activos Procedentes de la Reestructuración Bancaria, S.A. (SAREB). She has also been non-executive director of Aviva PLC and Aviva Italia Holding S.p.A.
She has also been co-Chair of the board of trustees of The Digital Future Society and advisory board member at Inetum and TribalData.
Other positions of note: Ms Romana is an independent director of SIX Group AG and its subsidiary Bolsas y Mercados Españoles, Sociedad Holding de Mercados y Sistemas Financieros, S.A.U. She is also the non-executive Chair of its other subsidiaries, SIX Digital Exchange AG and SDX Trading AG. Furthermore, she is an independent director of Werfen, S.A.; an advisory board member at Rafael del Pino Foundation; senior adviser to Artá Capital; and academic director of the IE Leadership & Foresight Hub Programme.
Membership of board committees: Executive committee, audit committee, nomination committee, risk supervision, regulation and compliance committee (Chair), responsible banking, sustainability and culture committee, and innovation and technology committee.
Skills and competencies: Given her background as a government economist and overall executive and non-executive experience in finance (particularly from serving on the audit committees of listed companies), Ms Romana is a recognized financial expert. Having held key positions in credit institutions and the regulatory and supervisory bodies of the financial industry and securities markets in Spain, she also provides strategic insights into banking, financial regulations and government relations in Spain and Europe.
206
 | |||||||||||
Pamela Walkden Non-executive director (independent) | |||||||||||
Board member since 2019.
Nationality: British. Born in 1960 in Worcester, England.
Education: Master's Degree in Economics from Cambridge University.
Experience: Mrs Walkden has served in a number of senior management positions at Standard Chartered Bank, including as Group Head of Human Resources, Chief Risk Officer, Group
Treasurer, Group Head of Asset and Liability Management and Regional Markets, Group Head of Internal Audit, Group Head of Corporate Affairs and Group Manager of Investor Relations. In addition, she served as an independent member of the UK Prudential Regulation Authority (PRA) Regulatory Reform Panel, as member of the European Banking Authority Stakeholder Group, and was a lay member of the Welfare and Ethics Committee of the Royal Veterinary College.
Other positions of note: Mrs Walkden is a member of the advisory board of JD Haspel Limited.
Positions in other Group companies: Mrs Walkden is a non-executive director of Santander UK PLC and Santander UK Group Holdings PLC.
Membership of board committees: Audit committee (Chair) and risk supervision, regulation and compliance committee.
Skills and competencies: Mrs Walkden qualifies as a financial expert in light of her broad, international experience in banking and auditing.
 | |||||||||||
Jaime Pérez Renovales General Counsel and secretary of the board | |||||||||||
Joined the Group in 2003.
Nationality: Spanish. Born in 1968 in Valladolid, Spain.
Education: Degree in Law and Business Administration from Universidad Pontificia Comillas (ICADE E-3) and State Attorney for Spain.
Experience: Jaime Pérez Renovales was director of the office of the second deputy Prime Minister for Economic Affairs and Minister of Economy, deputy secretary to the Spanish Prime Minister, Chair of the Spanish State Official Gazette and the
committee for Government Reform. Previously, he had been Vice General Counsel, vice secretary of the board and Head of Grupo Santander’s legal department, General Counsel and secretary of the board at Banesto, and deputy director of legal services at the CNMV. He is the Banco Santander representative on the board of trustees of the Princess of Asturias Foundation and is a member of the jury for its award for Social Sciences. He is Chair of the ICADE Business Club, member of the board of trustees of the Fundación Universitaria Comillas-I.C.A.I. and professor of Constitutional Law in the Faculty of Law at Universidad Pontificia Comillas (ICADE).
Jaime Pérez Renovales is the secretary of every board committee.
207
4.2 Board composition
Size
As at 31 December 2023, the board of directors comprised 15 members, whose profile and background are described in section 4.1 'Our directors'. The Bylaws dictate that the board must be composed of not less than 12 and no more than 17 members.
Composition by type of director
The board of directors has a balanced composition between executive and non-executive directors, most of whom are independent. Each director’s status has been verified by the nomination committee.
| Our board composition | ||
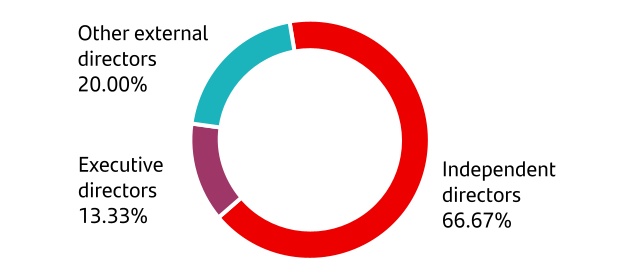
Executive directors
•Ana Botín, Group Executive Chair
•Héctor Grisi, Chief Executive Officer
Section 4.3 provides a detailed description of their respective roles and duties under 'Group Executive Chair and Chief Executive Officer'.
Independent directors
•Glenn Hutchins (Lead Independent Director)
•Homaira Akbari
•Bruce Carnegie-Brown
•Sol Daurella
•Henrique de Castro
•Germán de la Fuente
•Gina Díez Barroso
•Ramiro Mato
•Belén Romana
•Pamela Walkden
Every year, the nomination committee verifies the independence of the board members. It considers potentially significant business relations that could affect their
independence and other pertinent circumstances. This analysis is described further in section 4.6 'Nomination committee activities in 2023' and in subsection C.1.3 in section 9.2 'Statistical information on corporate governance required by the CNMV'.
Independent non-executive directors account for 66.7% of board members. This conforms to best corporate governance practices as well as to the Rules and regulations of the board, which require that the board be predominantly made up of non-executive directors with at least 50% independent directors.
Other external directors
•José Antonio Álvarez
•Javier Botín
•Luis Isasi
These directors cannot be classified as independent directors for the following reasons:
•Mr Álvarez, because he was the former CEO of Banco Santander until 31 December 2022.
•Mr Botín, because he has been a director for over 12 years.
•Mr Isasi, because it is considered preferable to classify him as an external director under prudent criteria, in view of his remuneration as non-executive chair of Santander España in addition to his remuneration as a director and the special nature of this body as supervisor of a business unit without its own corporate identity separate to Banco Santander, despite the nomination committee and the board believing that he meets the requirements to be classed as an independent director.
Board tenure | ||
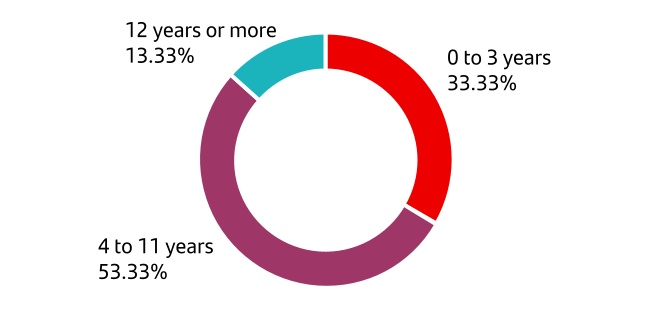
At the end of 2023, the average term of directors was 8.17 years and the average term of independent directors was 5.33 years. See 'Board skills and diversity matrix' and 'Tenure and equity ownership' in this section 4.2.
208
Tenure and equity ownershipA | |||||||||||||||||||||||||||||||||||
| Board of directors | Tenure | Banco Santander shareholdingD | |||||||||||||||||||||||||||||||||
Date of first appointmentB | Date of last appointment | End dateC | Direct | Indirect | Shares represented | Total | % of share capital | ||||||||||||||||||||||||||||
Executive Chair | Ana Botín | 04/02/1989 | 31/03/2023 | 31/03/2026 | 1,463,276 | 31,161,724 | 32,625,000 | 0.202% | |||||||||||||||||||||||||||
Chief Executive Officer | Héctor Grisi | 20/12/2022 | 31/03/2023 | 31/03/2026 | 1,693,710 | 1,693,710 | 0,010% | ||||||||||||||||||||||||||||
Vice Chair and Lead Independent Director | Glenn Hutchins | 20/12/2022 | 31/03/2023 | 31/03/2026 | 524,027 | 524,027 | 0.003% | ||||||||||||||||||||||||||||
Vice Chair | José Antonio Álvarez | 25/11/2014 | 01/04/2022 | 01/04/2025 | 2,497,881 | 2,497,881 | 0.015% | ||||||||||||||||||||||||||||
| Members | Homaira Akbari | 27/09/2016 | 31/03/2023 | 31/03/2026 | 67,826 | 100,913 | 168,739 | 0.001% | |||||||||||||||||||||||||||
Javier Botín | 25/07/2004 | 26/03/2021 | 26/03/2024 | 5,502,083 | 25,598,851 | 156.529.169 E | 187,630,103 | 1.159% | |||||||||||||||||||||||||||
Bruce Carnegie-Brown | 25/11/2014 | 26/03/2021 | 26/03/2024 | 59,940 | 59,940 | 0.000% | |||||||||||||||||||||||||||||
Sol Daurella | 25/11/2014 | 31/03/2023 | 31/03/2026 | 149,483 | 476,837 | 626,320 | 0.004% | ||||||||||||||||||||||||||||
Henrique de Castro | 12/04/2019 | 01/04/2022 | 01/04/2025 | 2,982 | 2,982 | 0.000% | |||||||||||||||||||||||||||||
| Germán de la Fuente | 01/04/2022 | 01/04/2022 | 01/04/2025 | 10,000 | 10,000 | 0.000% | |||||||||||||||||||||||||||||
Gina Díez | 22/12/2020 | 31/03/2023 | 31/03/2026 | 27,000 | 27,000 | 0.000% | |||||||||||||||||||||||||||||
| Luis Isasi | 03/04/2020 | 01/04/2022 | 01/04/2025 | 0.000% | |||||||||||||||||||||||||||||||
Ramiro Mato | 28/11/2017 | 26/03/2021 | 26/03/2024 | 506,860 | 506,860 | 0.003% | |||||||||||||||||||||||||||||
Belén Romana | 22/12/2015 | 01/04/2022 | 01/04/2025 | 208 | 4 | 212 | 0.000% | ||||||||||||||||||||||||||||
Pamela Walkden | 29/10/2019 | 31/03/2023 | 31/03/2026 | 82,608 | 82,608 | 0.001% | |||||||||||||||||||||||||||||
Total | 12,587,884 | 57,338,329 | 156,529,169 | 193,830,382 | 1.198% | ||||||||||||||||||||||||||||||
General secretary and secretary of the board | Jaime Pérez Renovales | ||||||||||||||||||||||||||||||||||
A. Figures as at 31 December 2023.
B. The date of first appointment referred herein may not match with the date of acceptance of the position.
C. The date provided does not take into account the additional period that may apply under article 222 of the Spanish Companies Act, nor the annual renewal of one-third of the board established in article 55.1 of the Bylaws. For more details, see 'Election, appointment, re-election and succession of directors' in section 4.2.
D. Banco Santander’s shareholding policy aims to align our executive directors and shareholders’ long-term interests. It includes the obligation for each executive director to maintain a significant investment in Banco Santander's shares, equivalent to twice their annual salary. Executive directors have five years from the time they were appointed to reach the required level of investment. Any shares they receive as remuneration are subject to a mandatory three-year holding period from their date of delivery, unless they already hold the mentioned investment equivalent, in addition to the regulatory obligation not to sell them for one year from delivery, which applies in all cases.
E. Includes shares owned by Fundación Botín, chaired by Javier Botín, and syndicated shares, including shares corresponding to Ana Botín that are also included within her direct or indirect shareholdings above, but excluding those corresponding to Javier Botín. See section 2.4 'Shareholders’ agreements'. In subsection A.3 of section 9.2 'Statistical information on corporate governance required by the CNMV', we adapted this information to the CNMV’s format.
For more details, see section 9.2 'Statistical information on corporate governance required by the CNMV'.
Diversity
A diverse board of directors is essential to its effectiveness. Mixed skills, experiences and points of view create an environment that promotes independent opinion and constructive debate, and ensures proper decision-making. Thus, we seek to achieve a sound balance of technical expertise, experience and broad diversity.
Our policy on the selection, suitability assessment and succession of directors helps make our board more diverse, not only in terms of gender, but also from an age, geographical provenance, experience and knowledge standpoint, without implicit bias that could lead to any form of discrimination, based for instance on disability, race or ethnic origin.
The policy follows the European Banking Authority (EBA) and the European Securities and Markets Authority's (ESMA) joint guidelines on the suitability assessment of board members and key functions holders, as well as the ECB´s Guide to fit and proper assessments.
Since 2019, when we added a gender equality target to our policy set by the nomination committee, our board of directors has had a balanced composition of women and men each accounting for between 40% and 60% of its members. In fact, since 2019, 40% of our board members are women. In 2020, the policy was amended to include age as additional diversity criteria to consider in the qualitative composition of the board
amid a review of the succession process for directors and other executive positions following the last amendment of the CNMV's Corporate Governance Code.
Our selection policy aims to diversify the board of directors based on different points of view, in particular:
•Country of origin/international education. Selection considers cultural diversity, geographical provenance, and international education and experience, especially in the Group's core markets.
•Gender. The nomination committee and the board of directors understand the importance of fostering equal opportunity between men and women as well as the need for women board members who possess the necessary skills, suitability and commitment to the role. Our policy promotes selection that maintains a balanced presence of women and men on the board, with a representation of both genders between 40% and 60%.
209
Women represent 40% of Banco Santander´s board members, which is above the average for large listed companies in Spain and Europe. According to figures published by the CNMV in September 2023, the boards of IBEX 35 companies in Spain in 2022 had an average of 37.6% women members. Moreover, according to the European Commission's report on gender equality in the EU dated March 2023, the boards of large listed companies across the European Union had an average of 32.2% women members.
•Age: Our policy also considers that selection must promote age diversity. There are no age limits for becoming a director nor for the roles of chair and chief executive officer.
•Education and career: Selection considers candidates´ academic training and career history to ensure they are qualified to understand our Group’s businesses, structure and markets, and that they fit within the Santander culture and other aspects deemed material to the Group.
Board skills and diversity matrix
The nomination committee updates a board skills and diversity matrix that reflects the balance of the knowledge, skills, qualifications, diversity and experience required to pursue our long-term strategy in an ever-changing market.
It considers EBA and ESMA guidelines on the suitability assessment of board members and key functions holders, as well as the ECB´s Guide to fit and proper assessments.
The matrix follows the structure below:
•We distinguish between thematic (technical) and horizontal skills.
•We include a separate diversity section that details gender, country of origin/ international education, and age.
•We show each member´s tenure.
The matrix discloses each board member's particular expertise and skills, some of which are further detailed in section 4.1 'Our directors'), and is a sign of our commitment to transparency.
We continuously review the suitability of skills and diversity to ensure a diverse board that can meet Banco Santander's strategy needs. The matrix enables us to pinpoint areas we need to strengthen in succession and election of new board members.
Last, the 'Committees skills and diversity matrix' shows the diverse composition of each committee and members´ knowledge and expertise relevant to their committee's remit.
210
| Board skills and diversity matrix | ||||||||||||||||||||||||||||||||||||||||||||||||||
| Ana Botín | Héctor Grisi | Glenn Hutchins | José Antonio Álvarez | Homaira Akbari | Javier Botín | Bruce Carnegie-Brown | Sol Daurella | Henrique de Castro | Germán de la Fuente | Gina Díez Barroso | Luis Isasi | Ramiro Mato | Belén Romana | Pamela Walkden | ||||||||||||||||||||||||||||||||||||
| Executive Chair | CEO | Vice Chair Lead Independent Director | Vice Chair Non-executive | Independent | Non-executive | Independent | Independent | Independent | Independent | Independent | Non-executive | Independent | Independent | Independent | ||||||||||||||||||||||||||||||||||||
| SKILLS AND EXPERIENCE | ||||||||||||||||||||||||||||||||||||||||||||||||||
| THEMATIC SKILLS | ||||||||||||||||||||||||||||||||||||||||||||||||||
Banking (93.3%) | • | • | • | • | • | • | • | • | • | • | • | • | • | • | ||||||||||||||||||||||||||||||||||||
Other financial services (86.7%) | • | • | • | • | • | • | • | • | • | • | • | • | • | |||||||||||||||||||||||||||||||||||||
Accounting, auditing and financial literacy (100%) | • | • | • | • | • | • | • | • | • | • | • | • | • | • | • | |||||||||||||||||||||||||||||||||||
Retail (80%) | • | • | • | • | • | • | • | • | • | • | • | • | ||||||||||||||||||||||||||||||||||||||
| Digital & information technology (60%) | • | • | • | • | • | • | • | • | • | |||||||||||||||||||||||||||||||||||||||||
Risk management (86.7%) | • | • | • | • | • | • | • | • | • | • | • | • | • | |||||||||||||||||||||||||||||||||||||
Business strategy (100%) | • | • | • | • | • | • | • | • | • | • | • | • | • | • | • | |||||||||||||||||||||||||||||||||||
Responsible business & sustainability (73.3%) | • | • | • | • | • | • | • | • | • | • | • | |||||||||||||||||||||||||||||||||||||||
Human resources, culture, talent & remuneration (93.3%) | • | • | • | • | • | • | • | • | • | • | • | • | • | • | ||||||||||||||||||||||||||||||||||||
Legal and regulatory (13.3%) | • | • | ||||||||||||||||||||||||||||||||||||||||||||||||
Governance and control (86.7%) | • | • | • | • | • | • | • | • | • | • | • | • | • | |||||||||||||||||||||||||||||||||||||
International experience | Continental Europe (73.3%) | • | • | • | • | • | • | • | • | • | • | • | ||||||||||||||||||||||||||||||||||||||
US/UK (93.3%) | • | • | • | • | • | • | • | • | • | • | • | • | • | • | ||||||||||||||||||||||||||||||||||||
Latam (66.7%) | • | • | • | • | • | • | • | • | • | • | ||||||||||||||||||||||||||||||||||||||||
| Others (40%) | • | • | • | • | • | • | ||||||||||||||||||||||||||||||||||||||||||||
| HORIZONTAL SKILLS | ||||||||||||||||||||||||||||||||||||||||||||||||||
Top management (100%) | • | • | • | • | • | • | • | • | • | • | • | • | • | • | • | |||||||||||||||||||||||||||||||||||
Government, regulatory and public policy (13.3%) | • | • | ||||||||||||||||||||||||||||||||||||||||||||||||
Academia and education (40%) | • | • | • | • | • | • | ||||||||||||||||||||||||||||||||||||||||||||
Significant directorship tenure (93.3%) | • | • | • | • | • | • | • | • | • | • | • | • | • | • | ||||||||||||||||||||||||||||||||||||
| DIVERSITY | ||||||||||||||||||||||||||||||||||||||||||||||||||
Gender | Female (40%) | • | • | • | • | • | • | |||||||||||||||||||||||||||||||||||||||||||
Male (60%) | • | • | • | • | • | • | • | • | • | |||||||||||||||||||||||||||||||||||||||||
Country of origin/international education | Continental Europe (60%) | • | • | • | • | • | • | • | • | • | ||||||||||||||||||||||||||||||||||||||||
US/UK (66.7%) | • | • | • | • | • | • | • | • | • | • | ||||||||||||||||||||||||||||||||||||||||
Latam (13.3%) | • | • | ||||||||||||||||||||||||||||||||||||||||||||||||
Others (6.7%) | • | |||||||||||||||||||||||||||||||||||||||||||||||||
| Age | Under 55 (6.7%) | • | ||||||||||||||||||||||||||||||||||||||||||||||||
55 to 65 (66.7%) | • | • | • | • | • | • | • | • | • | • | ||||||||||||||||||||||||||||||||||||||||
Over 65 (26.7%) | • | • | • | • | ||||||||||||||||||||||||||||||||||||||||||||||
| BOARD TENURE | ||||||||||||||||||||||||||||||||||||||||||||||||||
0 to 3 years (33.3%) | • | • | • | • | • | |||||||||||||||||||||||||||||||||||||||||||||
4 to 11 years (53.3%) | • | • | • | • | • | • | • | • | ||||||||||||||||||||||||||||||||||||||||||
12 years or more (13.3%) | • | • | ||||||||||||||||||||||||||||||||||||||||||||||||
211
| Committees skills and diversity matrix | ||||||||||||||||||||||||||
| Executive committee | Audit committee | Nomination committee | Remuneration committee | Risk supervision, regulation and compliance committee | Responsible banking, sustainability and culture committee | Innovation and technology committee | ||||||||||||||||||||
| SKILLS AND EXPERIENCE | ||||||||||||||||||||||||||
| THEMATIC SKILLS | ||||||||||||||||||||||||||
Banking | 100% | 83.3% | 100% | 80% | 100% | 100% | 85.7% | |||||||||||||||||||
Other financial services | 100% | 83.3% | 80% | 80% | 80% | 80% | 100% | |||||||||||||||||||
Accounting, auditing and financial literacy | 100% | 100% | 100% | 100% | 100% | 100% | 100% | |||||||||||||||||||
Retail | 100% | 83.3% | 60% | 80% | 80% | 80% | 85.7% | |||||||||||||||||||
Digital and information technology | 83.3% | 66.7% | 60% | 60% | 40% | 60% | 100% | |||||||||||||||||||
Risk management | 100% | 83.3% | 80% | 80% | 100% | 80% | 85.7% | |||||||||||||||||||
Business strategy | 100% | 100% | 100% | 100% | 100% | 100% | 100% | |||||||||||||||||||
Responsible business and sustainability | 83.3% | 50% | 100% | 60% | 40% | 100% | 85.7% | |||||||||||||||||||
Human resources, culture, talent and remuneration | 100% | 100% | 100% | 100% | 100% | 100% | 100% | |||||||||||||||||||
Legal and regulatory | 16.7% | 16.7% | 40% | 20% | 20% | 20% | 28.6% | |||||||||||||||||||
Governance and control | 100% | 83.3% | 80% | 80% | 100% | 80% | 85.7% | |||||||||||||||||||
International experience | Continental Europe | 83.3% | 83.3% | 60% | 80% | 80% | 80% | 71.4% | ||||||||||||||||||
US/UK | 100% | 100% | 80% | 100% | 100% | 80% | 100% | |||||||||||||||||||
Latam | 83.3% | 66.7% | 20% | 40% | 60% | 60% | 71.4% | |||||||||||||||||||
Others | 16.7% | 66.7% | 40% | 60% | 60% | 40% | 14.3% | |||||||||||||||||||
| HORIZONTAL SKILLS | ||||||||||||||||||||||||||
Top management | 100% | 100% | 100% | 100% | 100% | 100% | 100% | |||||||||||||||||||
Government, regulatory and public policy | 16.7% | 16.7% | 40% | 20% | 20% | 20% | 28.6% | |||||||||||||||||||
Academia and education | 33.3% | 33.3% | 60% | 40% | 20% | 80% | 28.6% | |||||||||||||||||||
Significant directorship tenure | 100% | 83.3% | 100% | 100% | 80% | 100% | 100% | |||||||||||||||||||
| DIVERSITY | ||||||||||||||||||||||||||
Gender | Female | 33.3% | 50% | 60% | 20% | 40% | 80% | 42.9% | ||||||||||||||||||
Male | 66.7% | 50% | 40% | 80% | 60% | 20% | 57.1% | |||||||||||||||||||
Country of origin/international education | Continental Europe | 83.3% | 66.7% | 40% | 60% | 80% | 60% | 57.1% | ||||||||||||||||||
US/UK | 83.3% | 66.7% | 80% | 60% | 80% | 80% | 71.4% | |||||||||||||||||||
Latam | 16.7% | – | 20% | – | – | 20% | 14.3% | |||||||||||||||||||
Others | – | 16.7% | – | – | – | 20% | 14.3% | |||||||||||||||||||
| Age | Under 55 | – | – | – | – | – | – | – | ||||||||||||||||||
55 to 65 | 66.7% | 83.3% | 60% | 60% | 60% | 60% | 85.7% | |||||||||||||||||||
Over 65 | 33.3% | 16.7% | 40% | 40% | 40% | 40% | 14.3% | |||||||||||||||||||
| BOARD TENURE | ||||||||||||||||||||||||||
0 to 3 years | 33.3% | 16.7% | 40% | 40% | 40% | 20% | 28.6% | |||||||||||||||||||
4 to 11 years | 50% | 83.3% | 60% | 60% | 60% | 80% | 57.1% | |||||||||||||||||||
12 years or more | 16.7% | – | – | – | – | – | 14.3% | |||||||||||||||||||
212
Election, appointment, re-election and succession of directors
Election
Our internal policy for the selection, suitability assessment and succession of directors dictates standards for the board’s composition, how it is revised and how new candidates are identified, selected and appointed.
Directors must meet specific requirements dictated by laws for credit institutions and our Bylaws. Upon taking office, they must formally undertake to fulfil the obligations and duties prescribed therein and in the Rules and regulations of the board.
Our directors must be of renowned business and professional integrity, and have the knowledge and experience needed to perform their role and exercise good governance. Director candidates will also be selected on the basis of their professional contribution to the entire board.
The board of directors will endeavour to have significantly more external or non-executive directors than executive directors, and for the number of independent directors to make up at least half of all members.
Appointment and re-election
Shareholders appoint and re-elect directors at the general meeting.
Furthermore, if directors step down during their term of office, the board of directors may provisionally designate another director by co-option until the shareholders at the general meeting confirm the appointment at the earliest subsequent meeting.
Each appointment, re-election and ratification of directors is submitted to a separate vote at the general meeting.
Proposals for appointment, re-election and ratification of directors (regardless of their category), which the board of directors submits to the shareholders, as well as appointments of the board in cases of co-option, should be preceded by the corresponding reasoned proposal of the nomination committee.
Proposals to be submitted to the general meeting must include a duly substantiated report by the board, containing an assessment of the qualifications, experience and merits of the proposed candidate. Re-election and ratification proposals will also provide an assessment of the work and dedication to the position during the last period in which the proposed director held office. If the board disregards the nomination committee's opinion, it must explain its decision and record its reasons in the minutes of the meeting.
Term and cessation
Our directors are appointed for three-year terms. However, one-third of board members are renewed each year in order of their tenure. Outgoing directors may be re-elected.
Our directors shall cease to hold office when the term for which they were appointed ends, unless they are re-elected, when the general meeting so resolves, or when they resign. When a director ceases to hold office prior to the end of their term (i.e. by general meeting resolution or by resignation), they shall explain the reasons for resignation or, in the event of non-executive directors, their opinion on the reasons for their
cessation in office by the general meeting in a letter to the other board members unless they report them at a meeting of the board and this is recorded in the minutes. When appropriate, the resignation shall be publicly disclosed, including sufficient information on the director's reasons or circumstances provided by the director.
Directors must tender their resignation to the board and formally step down from their position if the board, on the nomination committee's recommendation, deems it appropriate in cases that may adversely affect the board's functioning or Banco Santander’s credit or reputation. In particular, they must resign if they find themselves in a circumstance of ineligibility or prohibition provided by law, without prejudice to the honourability requirements for directors and the consequences deriving from subsequent failure to meet those requirements, set out in Royal Decree 84/2015, that implements Act 10/2014.
Directors must notify the board as soon as possible of any circumstances affecting them, whether related to their performance in Banco Santander or not, that might damage Banco Santander's credit or reputation, especially if under criminal investigation, and of the developments of any such criminal proceedings. When the board is informed or becomes otherwise aware of any such situations, it will examine them as soon as possible and decide, based on the particulars and on a report from the nomination committee, any measures to adopt, such as opening an internal investigation, calling on directors to resign or proposing their dismissal.
Proprietary directors must also tender their resignation when the shareholder they represent sells off or significantly reduces its equity holding.
Succession planning
Succession planning is a key element of our good governance as it ensures orderly role transitions as well as board continuity and stability and its adequate renewal and independence. It is a yearly cycle with a well-defined methodology and timelines, and a clear allocation of responsibilities. Our aim is to identify candidates with the necessary talent for each function and who contribute to the board's proper diversity and balance of skills.
Banco Santander director succession plan focuses on diversity standards and targets and the suitability assessment policy, as well as the regular review of the composition of the board and its committees, and the identification of potential board member candidates.
The policy has specific core performance indicators, reviewed each year, for such aspects as succession effectiveness (vacancies filled by identified candidates); the number of internal and external candidates immediately available to succeed executive directors; training and development plans for potential candidates to succeed executive directors in one to three years; gender diversity and country of origin or international education; updated board member tenure; the strength of the list of successors to executive directors, committee chairs and the Lead Independent Director; and the percentage of candidates to succeed directors who are immediately available (or candidates for a one-to-three year period).
213
The nomination committee and the board prioritize succession planning, with sound and appropriate plans in place that are regularly revisited to make sure they meet regulatory requirements and align with industry best practice.
4.3 Board functioning and effectiveness
Board functions
Banco Santander's board of directors is our highest decision-making body, except in matters reserved to shareholders at the general meeting. It performs its duties with unity of purpose and independent judgement.
The board’s policy is to designate executive bodies and managers to run day-to-day operations and implement the strategy. It focuses on general supervision and other functions it cannot delegate by law, the Bylaws or the Rules and regulations of the board, including:
•General policies and strategies (including capital and liquidity; tax; new products, operations and services; corporate culture and values, including policies on responsible business and sustainability and, in particular, on environmental and social matters; crisis management and resolution planning; risk (including tax risk) control and management; remuneration policy; and compliance).
•Financial and non-financial reporting, and - more generally - information reported to shareholders, investors and the general public, as well as the processes and controls that ensure full disclosure.
•Policies on reporting and communication with shareholders, markets and public opinion, and supervision of the disclosure of information.
•Internal audit plan.
•The selection, succession and remuneration of directors, senior management and other key positions.
•Effectiveness of Grupo Santander’s corporate and internal governance system, including the GSGM, corporate frameworks and internal regulations.
•Significant corporate transactions and investments.
•Calling the general shareholders’ meeting.
•Related-party transactions.
Board regulation
The board is governed by the rules set out in the Bylaws and the Rules and regulations of the board, both of which are available on our corporate website.
•Bylaws. Dictate the basic rules that apply to the composition and operation of the board and its members' duties, and are supplemented and implemented by the Rules and regulations of the board. They can only be amended by shareholders at
•Rules and regulations of the board. Set the rules for running and internally organizing the board of directors and its committees through the development of applicable laws and Bylaws provisions and good governance recommendations. They set out the principles governing its actions and the duties of its members.
On 25 July, the board of directors resolved to amend the Rules and regulations of the board of directors with the purpose of:
•adapting them to the new provisions of Act 2/2023 of 20 February on the protection of persons who report violations of the law and the fight against corruption, bringing the responsibility of the board for implementing an internal system (Canal Abierto) and of the audit and risk supervision, regulation and compliance committees for overseeing it;
•aligning them with the EBA guidelines on improving resolvability for institutions and resolution authorities, which apply from January 2024, to outline the board's oversight of crisis management planning, with support from the risk supervision, regulation and compliance committee; and
•introducing technical improvements to increase the board effectiveness in the performance of its duties.
The Rules and regulations of the board adhere to all legal provisions as well as the principles and recommendations set out in the Spanish Corporate Governance Code; Corporate Governance Principles for Banks of the Basel Committee on Banking Supervision; and the EBA's in Guidelines on internal governance.
Our rules on the audit committee also adhere to the good operating practices set out in CNMV's Technical Guide 3/2017 on Audit Committees of Public Interest Entities; as well as with the applicable regulations because our shares are listed as ADS on the NYSE and, in particular, with Rule 10A-3 under the Securities Exchange Act (SEA) on standards relating to audit committees.
Our rules on the nomination and the remuneration committees also adhere to the good operating practices set out in the CNMV’s Technical Guide 1/2019 on Nomination and Remuneration Committees.
Structure of the board
The board’s corporate governance structure ensures that it discharges its duties effectively.
Group Executive Chair and Chief Executive Officer
Our Executive Chair is Ana Botín and our Chief Executive Officer is Héctor Grisi. They are the most senior executives in the Group’s strategic and ordinary management, which the board is responsible for overseeing, ensuring that their roles are clearly separated and complementary. Both report exclusively to the board of directors.
214
The roles of our Executive Chair and Chief Executive Officer can be summarized as follows:
| Roles of the Executive Chair and the Chief Executive Officer | ||||||||
| Executive Chair | Chief Executive Officer | |||||||
•The Chair is the highest-ranking executive in Grupo Santander and its main representative with regulators, authorities and other major stakeholders. •The Chair is responsible for the long-term strategy of the Group, including new tech and digital growth engines, namely PagoNxt and the Digital Consumer Bank. •The Chair is also responsible for other corporate functions and units that help drive the Group's long-term strategy and transformation, comprising Technology and Data & Architecture, Human Resources, Talent, Financial Accounting & Control, Strategy and Corporate Development, General Secretariat and Communications & Corporate Marketing. This reflects the Chair's ultimate accountability for Transformation. •The Chair also leads the appointment and succession planning of Grupo Santander senior management, to be submitted to the nomination committee and board for approval. | •The Chief Executive Officer is entrusted with the day-to-day management of the business with the highest executive functions and reports exclusively to the board. •Accordingly, the Chief Executive Officer’s direct reports are the senior managers in charge of the business units: the regional heads (Europe, North America and South America) and those in charge of the global businesses (Wealth Management & Insurance, Corporate & Investment Banking, Payments and Retail & Commercial Banking (including TransformationA)), encompassing the relevant support and control functions. Whilst the Chair is accountable for Digital Consumer Bank, given that it is a global business, the Group CEO remains fully accountable for the Countries through which Digital Consumer Bank operates. •As responsible for day-to-day management, the CFO and head of Investment Platforms & Corporate Investments also report to the Chief Executive Officer. •Additionally, the Chief Executive Officer is responsible for Regulatory & Supervisory Relations and for embedding the Group's sustainability policy in the day-to-day management of Group businesses and the support and control functions. | |||||||
A.Whilst Retail & Commercial Banking reports directly to the Chief Executive Officer (with no functional line to the Executive Chair), ultimate accountability for Transformation remains with the Executive Chair.
The duties of the Executive Chair, the Chief Executive Officer, the board, and its committees are clearly separated. Various checks and balances give Grupo Santander’s corporate governance structure the appropriate equilibrium. In particular:
•The board and its committees supervise both the Executive Chair and the Chief Executive Officer. Both the Executive Chair and Chief Executive Officer report to the board of directors.
•The board has delegated all its powers to the Executive Chair and the Chief Executive Officer, except for those that cannot be delegated by law and under the Bylaws and the Rules and regulations of the board. The board directly exercises those powers to perform its general supervisory function.
•The Lead Independent Director leads the Group Executive Chair’s succession and appointment in coordination with the nomination committee.
•The audit committee is chaired by an independent director who is considered a ‘financial expert’ as defined in Regulation S-K of the Securities and Exchange Commission (SEC).
•The audit; nomination; responsible banking, sustainability and culture; remuneration; and risk supervision, regulation and compliance committees are chaired by, and have a majority of, independent directors. The first three committees are composed entirely of independent directors.
•The Executive Chair may not simultaneously act as Banco Santander’s Chief Executive Officer.
•The corporate Risk, Compliance and Conduct, and Internal Audit functions report as independent units to a committee or a member of the board of directors and have direct, unfettered access to the board.
215
Lead Independent Director
Our Lead Independent Director is Glenn Hutchins as of 1 October 2023. He replaced Bruce Carnegie-Brown, who had been in the role for almost nine years. The Lead Independent Director, who is key to our governance, coordinates the non-executive directors effectively and makes sure they serve as an appropriate counter-balance to the executive directors.
The following chart shows the Lead Independent Director's functions and activities in 2023. Before stepping down, Bruce Carnegie-Brown provided a detailed report to the nomination committee and board of directors on his activities and the discharge of his duties.
Duties of the Lead Independent Director and activities during 2023 | ||||||||
| Duties | Activities in 2023 | |||||||
Facilitate discussion and open dialogue among independent directors, coordinating private meetings of non-executive directors without the executive directors present and proactively engaging with them to consider their views and opinions. | Held five meetings with non-executive directors where they were able to voice their views and opinions. These meetings provided a valuable opportunity to reflect on the overall board and committee cycle throughout the year, to discuss board training topics, strategy execution, executive director and top management performance and objectives, succession planning and reflections on areas of continuous improvement. Given the appointment of a new Chief Executive Officer, the non-executive directors invited him to one session to gain his views after three months in office. In addition, the Lead Independent Director included in the agenda for these sessions the performance assessment of the CEO, in recognition of his reporting line to the board. | |||||||
Direct the periodic evaluation of the Chair of the board of directors and coordinate her succession plans. | Bruce Carnegie-Brown led the Executive Chair's annual performance review in order to determine her variable pay. Furthermore, he led her succession planning activity, as additionally facilitated through his chairmanship of the nomination committee. | |||||||
Engage with shareholders and other investors to learn of their concerns, especially with regard to Banco Santander's corporate governance. | See section 3.1 'Shareholder communication and engagement' for full details of the Lead Independent Director’s activities. | |||||||
| Replace the Chair in her absence, with such key rights as the ability to call board meetings under the terms of the Rules and regulations of the board. | Though the Lead Independent Director did not have to replace the Executive Chair at any board meeting, he remained committed to ensure the proper functioning of board meetings. | |||||||
Request a board meeting or that new items be added to the agenda. | While the Lead Independent Director did not need to request additional board meetings to be called, he remained fully engaged in, and informed of, board meeting agendas to make proposals of items. | |||||||
Structure of board committees
The board committee supports the board in:
•Managing the Group by exercising decision-making powers through the executive committee.
•Formulating strategy for core areas through the responsible banking, sustainability and culture committee, and the innovation and technology committee.
•Supervising and making important decisions through the audit committee, nomination committee, remuneration committee and risk supervision, regulation and compliance committee.
216
The board has seven committees with the following structure:
Mandatory committeesA | Executive committee | Audit committee | Nomination committee | Remuneration committee | Risk supervision, regulation and compliance committee | |||||||||||||||||||||||||||
Decision-making powers | Supervision, information, advice and recommendations regarding functions in risk, financial reporting and audit, nomination and remuneration matters | |||||||||||||||||||||||||||||||
Voluntary committees | Responsible banking, sustainability and culture committee | Innovation and technology committee | ||||||||||||
Support and proposal in strategic areas | ||||||||||||||
A. Required by law, the Bylaws or the Rules and regulations of the board.
Secretary of the board
Jaime Pérez Renovales is the secretary of the board. He assists the chair and ensures the formal and substantial legality of all the board’s actions. He also makes sure good governance recommendations and procedures are observed and regularly reviewed.
The secretary of the board is also the General Counsel of Banco Santander. He acts as the secretary of all board committees and facilitates a fluid and effective relationship between the committees and the Group's units that must collaborate with them.
The appointment of the secretary of the board is a matter for the board to approve, taking into account the prior opinion of the nomination committee. The secretary does not need to be a director.
The board has three vice secretaries, F. Javier Illescas Fernández-Bermejo (Head of Group Corporate Legal), Julia Bayón Pedraza (Head of Group Business Legal) and Adolfo Díaz-Ambrona Moreno (General Counsel of Santander España). They assist the secretary with his duties on the board and its committees, and replace him in the event of absence, inability to act or illness.
Board operation
The board of directors held 15 meetings (12 ordinary and three extraordinary) in 2023. The Rules and regulations of the board dictate that it must hold at least nine annual ordinary meetings and one quarterly meeting.
Although board meetings follow a calendar approved annually and a provisional agenda of items to discuss among the matters that fall under its remit, new items can be added and additional meetings can be called. Directors may also propose items to be added to the agenda and are duly informed of changes to the calendar and meeting agendas.
To help directors prepare effectively for each meeting, they are given relevant documents sufficiently in advance and in a secure electronic format. In the board’s opinion, these documents are appropriately detailed and received in good time.
The Rules and regulations of the board of directors also expressly acknowledge directors’ rights to request and obtain information on anything related to Banco Santander and its domestic and foreign subsidiaries. They also acknowledge their right to inspect the books, files, documents and any other records of corporate transactions, in addition to premises and facilities. Furthermore, directors can request and obtain any information and advice they deem necessary from the secretary in order to perform their duties.
Additionally, the board meets at the Chair’s discretion or at the request of at least three directors. The Lead Independent Director is also authorized to request a board meeting or that new items be added to the agenda for a meeting that has already been called.
Directors must attend meetings in person, either physically or virtually, and endeavour to limit their absence to situations of absolute necessity. The nomination committee checks that directors attend at least 75% of board and committee meetings and that any absence has a valid excuse without raising doubt about the director´s commitment to good governance. For more details, see 'Board and committee preparation and attendance' in this section 4.3.
If directors are unable to attend a meeting, they can designate (in writing and on a special basis for each session) another director to act on their behalf. Proxies are granted with instructions. Non-executive directors may only be represented by other non-executive directors. A director can hold more than one proxy.
217
The board may meet in various rooms at the same time, provided that members can interact in real time ensuring interactivity and intercommunication via audio-visual means or telephone.
Board meetings are validly quorate when more than half of its members attend in person or by proxy.
Resolutions are adopted by absolute majority of directors in attendance. The chair has the casting vote in the event of a tie. The Bylaws and the Rules and regulations of the board only require the qualified majorities according to law.
The secretary of the board keeps the board’s documents on file and records the content of meetings in meeting minutes. Meeting minutes of the board and committees include statements members expressly request to be put on record.
The board may hire legal, accounting or financial advisers and other experts at Banco Santander’s expense for assistance with their duties.
The board should encourage communication between its committees, especially the risk supervision, regulation and compliance committee and the audit committee. It should also promote dialogue between the risk supervision, regulation and compliance committee and the remuneration committee and the responsible banking, sustainability and culture committee, given the relevance of their respective work with each other.
Some committees hold joint meetings throughout the year. Though they cannot vote, any director can attend and participate in meetings of committees on which they do not serve if invited by the chair of the board and the chair of the respective committee, after having asked the chair of the board. Furthermore, all board members who are not executive committee members may attend executive committee meetings at least twice a year, for which they are to be called by the chair.
Comparison of number of meetings heldA | ||||||||||||||
Banco Santander | Spain average | US average | UK average | |||||||||||
| Board | 15 | 11.3 | 7.6 | 8.9 | ||||||||||
| Executive committee | 23 | 8.6 | — | — | ||||||||||
| Audit committee | 15 | 8.5 | 8.2 | 5.4 | ||||||||||
| Nomination committee | 13 | 6.8 | 4.6 | 4.2 | ||||||||||
| Remuneration committee | 12 | 6.8 | 5.8 | 5.4 | ||||||||||
| Risk supervision, regulation and compliance committee | 17 | NA | NA | NA | ||||||||||
A. Source: Spencer Stuart Board Index 2023 (Spain, United States and United Kingdom).
NA: Not available.
The following chart shows the board’s approximate time allocation to each function in 2023.
Approximate allocation of the board’s time in 2023 | ||
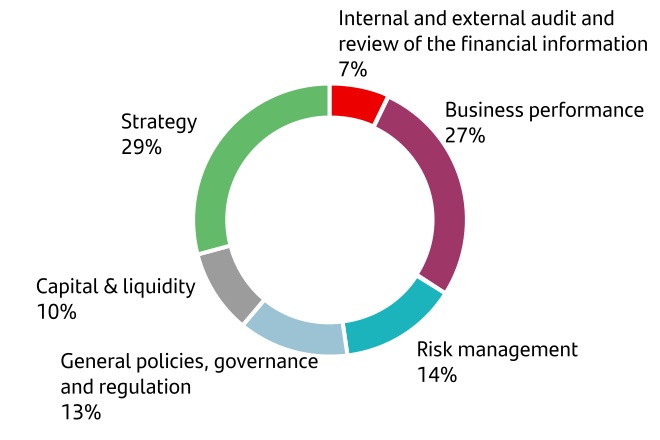
Committee operation
Board committees follow a calendar that includes at least four meetings (except for the innovation and technology committee, which holds at least three meetings) and an annual work plan established every year. Each committee meets as often as is required to fulfil its duties.
A committee meeting is quorate if it is attended by more than half the committee's members in person or through an appointed proxy. A committee resolution passes with a simple majority of votes. In the event of a tie, the committee chair has the casting vote. Committee members may appoint a proxy to vote for them and, as in board meetings, non-executive directors can only appoint a non-executive director proxy.
Committee members are given relevant meeting materials sufficiently in advance of each meeting to facilitate adequate meeting preparation and therefore promote overall committee effectiveness.
Committees have the authority to summon executives, who will appear at meetings at the invitation of, and under the terms dictated by, the respective chair. Furthermore, committees may also submit a request to the General Counsel to hire legal, accounting or financial advisers or other experts to assist with their duties at Banco Santander’s expense.
The role of committee secretary is non-voting and falls on the General Counsel and secretary of the board. This fosters a fluid and efficient relationship with the units that must work with, and report to, committees.
Committee chairs report on committees’ meetings and activities at all board meetings. Furthermore, all board members are given a copy of committee meeting minutes and all documents provided for meetings.
218
Board and committee preparation and attendance
The following table shows the attendance rate of board and committee meetings in 2023.
Committees | ||||||||||||||||||||||||||
| Directors | Board | Executive | Audit | Nomination | Remuneration | Risk supervision, regulation and compliance | Responsible banking, sustainability and culture | Innovation and technology | ||||||||||||||||||
| Average attendance | 100% | 95% | 99% | 94% | 95% | 98% | 93% | 98% | ||||||||||||||||||
| Individual attendance | ||||||||||||||||||||||||||
Ana Botín | 15/15 | 23/23 | _ | _ | _ | _ | _ | 4/4 | ||||||||||||||||||
Héctor Grisi | 15/15 | 22/23 | _ | _ | _ | _ | _ | 3/4 | ||||||||||||||||||
Glenn Hutchins | 15/15 | _ | _ | 13/13 | 12/12 | _ | _ | 4/4 | ||||||||||||||||||
| José Antonio Álvarez | 15/15 | 23/23 | _ | _ | _ | _ | _ | 4/4 | ||||||||||||||||||
| Homaira Akbari | 15/15 | _ | 15/15 | _ | _ | _ | 5/6 | 4/4 | ||||||||||||||||||
| Javier Botín | 15/15 | _ | _ | _ | _ | _ | _ | _ | ||||||||||||||||||
Bruce Carnegie-BrownA | 15/15 | 12/16 | _ | 13/13 | 12/12 | _ | _ | 3/3 | ||||||||||||||||||
| Sol Daurella | 15/15 | _ | _ | 10/13 | 10/12 | _ | 5/6 | _ | ||||||||||||||||||
| Henrique de Castro | 15/15 | _ | 14/15 | _ | 12/12 | _ | _ | 4/4 | ||||||||||||||||||
Germán de la Fuente | 15/15 | _ | 15/15 | _ | _ | 17/17 | _ | _ | ||||||||||||||||||
| Gina Díez Barroso | 15/15 | _ | _ | 13/13 | _ | _ | 6/6 | _ | ||||||||||||||||||
| Luis Isasi | 15/15 | 22/23 | _ | _ | 11/12 | 14/17 | _ | _ | ||||||||||||||||||
| Ramiro Mato | 15/15 | 22/23 | 15/15 | _ | _ | 17/17 | 6/6 | _ | ||||||||||||||||||
Belén Romana | 15/15 | 22/23 | 15/15 | _ | _ | 17/17 | 6/6 | 4/4 | ||||||||||||||||||
Pamela Walkden | 15/15 | _ | 15/15 | _ | _ | 17/17 | _ | _ | ||||||||||||||||||
Note: This table shows each director's in-person attendance at ordinary and extraordinary board or committee meetings except when they attended by proxy. The nomination committee was informed of directors’ excused absences and verified that they raised no doubt about their capability of good governance. Some directors did not attend extraordinary meetings that were not scheduled in the annual meeting calendar.
A. Stepped down as member of the executive committee and innovation and technology committee on 1 October 2023.
The following table shows the average preparation of directors in the exercise of their functions on the board and committees in 2023:
| Meetings | Average of hours per memberA | Average of hours per chairA | |||||||||
| Board | 15 | 169B | 338B | ||||||||
| Executive committee | 23 | 138 | 276 | ||||||||
| Audit committee | 15 | 150 | 300 | ||||||||
| Nomination committee | 13 | 52 | 104 | ||||||||
| Remuneration committee | 12 | 48 | 96 | ||||||||
| Risk supervision, regulation and compliance committee | 17 | 170 | 340 | ||||||||
Responsible banking, sustainability and culture committee | 6 | 30 | 60 | ||||||||
Innovation and technology committee | 4 | 16 | 32 | ||||||||
A. Includes hours of meeting preparation and attendance.
B. Not including two extraordinary sessions held in 2023 due to their short duration and low impact on the directors’ required commitment.
Directors’ average time commitment is calculated by taking the number of members on the board and on each committee, the number of times each body meets during the year, average meeting length, and an estimate of the time each director needs to prepare for every meeting. We estimate that the board chair and the committee chairs have a greater time commitment than the other directors because of the added functions their roles require. We also consider the commitment to attend sessions that form part of directors’ training and development programme. We consider the average time that directors not living in Spain must take to travel to board and committee meetings, but it is not factored into their average time commitment.
Considering the above mentioned criteria, on average, directors dedicate approximately 57 eight-hour days a year to preparing and attending board and committee meetings.
Directors must report to the nomination committee any professional activity or role that they are going to perform outside the Group so that the committee can check that they can dedicate enough time to the Group and the professional activity or role does not pose conflicts of interest.
The annual suitability reassessment our nomination committee conducts (see section 4.6 'Nomination committee activities in 2023') enables us to update information on the estimated time directors dedicate to roles or professional activities outside the Group and demonstrates their ability to exercise good governance.
219
This makes sure the number of board roles that our directors have at once is within the legal limit (i.e. no more than one executive and two non-executive roles, or four non-executive roles; roles in the same group are considered a single role and roles in not-for-profit or non-commercial organizations are not included).
Director training and induction programmes
The board has an annual training and development programme to help directors continue to develop skills and increase their understanding of the Group and industry, taking into account their experience and expertise. The board chooses contents based on feedback from its members and supervisory and regulatory requirements, among others.
In 2023, programme workshops were delivered collectively to all board members and covered the following topics:
•Behavioural economics, with the spotlight on impactful decision-making.
•Regulatory compliance and compliance risk review.
•Cloud, including an overview of the market and its implications for the financial industry.
•ESG, with a focus on regulatory and supervision requirements and greenwashing risk.
•Financial crime compliance, bribery and corruption risks, sanctions and anti-money laundering regulation.
•Risk appetite statement and associated methodology review.
•Decentralised Finance (DeFi), blockchain and smart contracts.
•Capital and Provisions Models.
Moreover, the audit committee requested training on the Sarbanes-Oxley Act (SOx) to stay abreast of its core principles; the differences between accounting rules and standards in Europe and the US; and forthcoming SEC regulations and their implications. Though this session was initially designed for the audit committee, board members were also able to attend.
Directors can also request one to one and ad-hoc training on specific topics tailored to their own needs, if deemed helpful. The objective of such sessions would be to enable directors to deep dive into specific areas in order to ensure that their knowledge is optimal.
Banco Santander shares its training, induction and development methodology with subsidiaries to promote best practices and drive consistency of approach across our footprint. Some executives facilitated special sessions for subsidiary directors throughout the year to keep them up to speed with relevant Group matters such as cybersecurity, ESG, financial crime, governance, talent management, culture and others.
Every board member receives the directors' manual. It is a support guide that provides both new and existing directors with a complete reference of information relevant to their role. In addition, the board has robust induction programmes so new directors can deeply understand the industry and Grupo Santander’s business model and structure, risk profile and governance arrangements, taking into account their existing skills, competencies and knowledge. They are completed within
six months after taking up their position as new directors. Induction and development needs are facilitated through different methods, including document reviews, tailored meetings, site visits and training sessions with senior managers of the Group.
In June 2023, Glenn Hutchins completed his induction programme, which was tailored to his experience and particular needs.
Board effectiveness review in 2023
The board undergoes a yearly assessment of its performance and effectiveness, composition, quality of its work and individual performance of its members. The review includes its committees. Every three years, it is conducted by an external consultant, whose independence is verified by the nomination committee. In 2023, the review was conducted by an external independent expert.
External consultant independence
A robust selection process was undertaken to identify an external independent consultant with an in-depth understanding of Spanish and banking markets, and of truly effective boards. As a result, Spencer Stuart was appointed.
Spencer Stuart, a leader in its field, advised the Group in 2023 -occasionally and never exclusively - on identifying, selecting and reviewing managers' skills and potential. The amounts paid to Spencer Stuart in 2023 for these services were:
| Entity | Amount (EUR) | ||||
Santander Asset Management | 360,995 | ||||
Banco Santander | 349,272 | ||||
TOTAL | 710,267 | ||||
The nomination committee did not consider the referred amounts material in the context of the overall budget for such services, nor that they represented a significant proportion of Spencer Stuart’s total fees.
Methodology and scope of the assessment
The Executive Chair and the Chair of the nomination committee led the assessment, which aimed to identify areas of continuous improvement and maximise the board's effectiveness going forward. The review methodology agreed with Spencer Stuart and endorsed by the nomination committee comprised:
•an anonymous questionnaire completed by all board members;
•structured, detailed and confidential interviews with individual board members and select members of the executive team, covering their qualitative and quantitative assessment of key areas; and
•attendance to board and committee meetings as an observer to assess the quality of debate and challenge, dynamics and internal culture.
The review focused on board and committee structure, composition, diversity of board membership and competences, and behaviours, including:
•the quality of their functioning;
220
•their size, composition and diversity;
•the effectiveness of the executive chair model;
•the performance of the Executive Chair, the CEO, the Lead Independent Director and the secretary of the board, together with the contribution of the remaining individual directors, with particular attention to the Chairs of each committee;
•the frequency and duration of meetings; content of the agenda and time dedicated to each item; quality of the information received; and decision-making processes including appropriate level of challenge; and
•the overall effectiveness of measures introduced in 2022 on the back of a comprehensive review of our governance model.
Findings and action plan
In January 2024, the nomination committee and the board of directors discussed the findings and specific actions to address those findings resulting from the 2023 review, with a consensus view that the results were positive and that the board and its committees operate effectively. Specifically, the review concluded that our governance model is both robust and comprehensive and is continuously monitored and adjusted to meet the highest standards. The review also acknowledged the strong commitment to, and delivery of, continuous improvement, as evidenced by the review findings, which highlighted the following:
•The board remains appropriately composed, with a depth and variety of board skills and expertise, high degree of independence, diversity and appropriate directors’ tenure average.
•The board culture is strong, with a collaborative and respectful collective mindset, which facilitates healthy debate and challenge, and rigorous decision-making processes, leveraging the skills and diversity of the board.
•The executive chair model is working effectively and there is a universal understanding of the division of responsibilities between the Executive Chair and the CEO, which is clearly documented. As part of that, the role of the Lead Independent Director is considered critical in providing additional checks and balances.
•The Executive Chair, Chief Executive Officer, Lead Independent Director and General Secretary performed positively, effectively and with the competence expected. The remaining directors performed positively with an overall effective contribution.
•The committee structure, composition and overall functioning is considered to be both effective and efficient and in particular, the support provided to the board is highly appreciated and rated positively.
As a result of the review, the board of directors discussed potential areas for improvement and approved an associated action plan in February 2024. Each committee will be engaged on specific actions applicable to their remit to ensure their ongoing effectiveness and efficient functioning.
The key aspects of the action plan can be summarized as follows:
•Structure of the board: as part of any future board refreshment, a continued focus will be placed on maintaining an appropriate international diversity, in recognition of our geographical footprint; and on technology and innovation skills, in accordance with our strategic direction.
•Effectiveness of the executive chair model: keep the split of the roles and responsibilities between the Executive Chair and the Group CEO under continuous review and refinement, as appropriate, to ensure its ongoing effectiveness and robustness.
•Lead Independent Director: consolidate the orderly transition of the Lead Independent Director’s responsibilities in favour of Glenn Hutchins, enabling him to be truly effective in role.
•Organization and internal culture: continue to ensure that paper volume and content is sufficient and concise in order to facilitate its understanding and corresponding debate. Furthermore, continue to leverage informal time between board members, acknowledging the value that this brings to board culture.
•Committees: keep committee composition under review, ensuring optimal performance and effectiveness. In addition, further develop the role and functioning of the responsible banking, sustainability and culture committee given its important ESG agenda, whilst leveraging on the work of other committees, to ensure that it remains effective.
The review findings and resulting actions are a sign of our ongoing commitment to effective governance. See 'Board effectiveness review and actions to continuously improve' in section 1.2 for further detail.
4.4 Executive committee activities in 2023
COMPOSITION | ||
| Position | Category | Appointed on | |||||||||
Chair | Ana Botín | Executive | 11/12/1989A | ||||||||
Members | Héctor Grisi | Executive | 01/01/2023 | ||||||||
José Antonio Álvarez | Other external | 13/01/2015 | |||||||||
Luis Isasi | Other external | 20/05/2020 | |||||||||
Ramiro Mato | Independent | 28/11/2017 | |||||||||
Belén Romana | Independent | 01/07/2018 | |||||||||
Secretary | Jaime Pérez Renovales | ||||||||||
A. Committee Chair since 10 September 2014.
Functions
The executive committee is a key governance body in Banco Santander and the Group. The board delegated to it all its powers except those that cannot be delegated by law or under the Bylaws and Rules and regulations of the board. Its meeting frequency and the nature of its decisions allows the board to focus on general oversight. It also reports regularly to the board on its core matters and provides all directors with the minutes and documents from its meetings.
221
Committee performance
The board, supported by its nomination committee, determines the committee's size and composition, to ensure its effectiveness based on board composition guidelines. As well as the board, the committee has an external director majority, including two independent directors, ensuring a balance of opinions and compliance with Recommendation 37 of the Spanish Corporate Governance Code. Its secretary is the secretary of the board.
The committee frequency ensures the discharge of its duties and it is generally convened every two weeks, although it can meet as many times as required by the Chair.
Main activities in 2023
In 2023, the executive committee addressed a breadth of matters relating to the business of the Group and its main subsidiaries, risk management, corporate transactions and main proposals that were subsequently submitted to the board of directors. It covered the following matters:
•Results: Regularly reviewed the Group's results and stakeholder reaction to them.
•Business performance: Regularly received management reports on the performance of the Group’s business areas and other related matters.
•Information reported by the Executive Chair: The Executive Chair regularly reported on the Group´s management, strategy and institutional issues.
•Information reported by the CEO: The CEO reported on the Group´s performance and on the budget and execution of plans for all the units and the global businesses reporting to him.
•Corporate transactions: Analysed and approved, where appropriate, corporate transactions on investments and divestments, joint ventures and capital transactions.
•Risks: Received regular holistic risk and compliance reports. Within the framework of the risk governance model, the committee authorized or declined transactions that it had to review due to their materiality. It paid specific attention to monitor the credit risk impact relating to the war in Ukraine and the conflict in the Middle East, as well as to the global macroeconomic situation.
•Global businesses and subsidiaries: Received updates on global businesses, subsidiaries and other business lines' performance against agreed plans. This helped the committee support the board with the oversight and control of its global business and subsidiary operations, and with the fulfillment of the targets announced at the 2023 Investor Day.
•Capital and liquidity: Received regular reports on capital ratio and the optimization measures, pricing (originations) and portfolio profitability. By virtue of the board's delegation and within capital and funding plans, the committee agreed non-convertible debt issuances and securitizations.
•Supervisors and regulatory matters: Reviewed regulatory developments, the yearly supervisory agenda and projects to ensure compliance with supervisory recommendations and regulatory reforms.
•Governance matters: Approved specific internal regulation under its remit. In particular, the committee reviewed and approved the key governance changes associated with the new organizational model based on five global businesses, respecting the split of responsibilities established between the Chair and the CEO.
In 2023, the executive committee held 23 meetings. See 'Board and committee preparation and attendance' in section 4.3 for members’ meeting attendance and the estimated average time each one spent on meeting preparation and attendance.
2024 priorities
The committee set the following priorities for 2024:
•Monitor the performance of the Group's global businesses and subsidiaries, including progress in the execution of their strategic plans.
•Oversee the deployment and embeddedness of the new organizational model based on five global businesses within the Group as primary reporting segments, with a specific focus on Retail & Commercial Banking and Digital Consumer Bank.
•Continue to assess proposed corporate transactions relating to investments and divestments, joint ventures and capital transactions.
•Continue to oversee the execution and achievement of specific public targets, including those disclosed at the 2023 Investor Day.
•Continue to facilitate timely and efficient decision making, supporting the board and enabling it to focus on general oversight and strategy matters.
•Continue to ensure the committee’s effectiveness and efficient coordination with the board, its committees and the executive first level committees.
222
4.5 Audit committee activities in 2023
| We have maintained a close communication with our subsidiary audit committee chairs throughout the year, as it allowed us to share our priorities, concerns and thoughts with them. In addition, the committee continued to benefit from our members’ mix of experience and skills, leveraging their collective insights to ensure best possible outcomes. In the coming year, we will continue to supervise the Group’s units and global businesses and especially those more relevant to One Transformation, to ensure that appropriate controls remain in place. In addition, we will review the new primary reporting segments as part of our fundamental responsibility to provide oversight of the integrity of the financial statements. As part of that, we will progress how all the Group’s activities across all markets are consolidated under the five global businesses, in which we will continue to strike the right balance of supporting management and ensuring an appropriate level of control for a Group of our size. The committee, in coordination with the responsible banking, sustainability and culture committee, will monitor compliance with new ESG regulatory initiatives and non-financial reporting standards across the world and particularly, in the European Union. I have been delighted to chair this committee over the last four years and will ensure a smooth transition with my successor so that the committee continues to be effective in the exercise of its duties."  | |||||||||||||
Pamela Walkden Chair of the audit committee | ||||||||||||||
"In 2023, we have remained focused on the effective oversight of the financial information process and internal controls, the effectiveness of our Internal Audit function, while maintaining a professional and open relationship with the external auditors. The enhancements of our ESG reporting were high on our agenda last year. In particular, significant time was devoted to ensuring its consistency and our preparedness for the greater independent assurance required, closely monitoring the progress in all the units. In addition, we continued to focus on the oversight of the internal audit plan execution, ensuring appropriate amendments to facilitate an ongoing focus on fundamental risks, such as credit risk, and new risks and, in particular, a key focus was given to cyber risk and Internal Audit’s approach to it. | ||||||||||||||
| COMPOSITION | ||
| Position | Category | Appointed on | |||||||||
Chair | Pamela Walkden | Independent | 29/10/2019A | ||||||||
Members | Homaira Akbari | Independent | 26/06/2017 | ||||||||
Henrique de Castro | Independent | 21/10/2019 | |||||||||
| Germán de la Fuente | Independent | 21/04/2022 | |||||||||
| Ramiro Mato | Independent | 28/11/2017 | |||||||||
Belén Romana | Independent | 22/12/2015 | |||||||||
Secretary | Jaime Pérez Renovales | ||||||||||
A. Committee Chair since 26 April 2020.
The board of directors appointed the committee’s members based on their expertise, skills and experience in the matters the committee handles. For more details, see section 4.1 'Our directors' and 'Board skills and diversity matrix' in section 4.2.
According to SEC Regulation S-K, committee Chair Pamela Walkden is considered a financial expert based on her training and experience in accounting, auditing and risk management, past leadership positions at entities where accounting expertise and risk management were essential, and international experience (primarily in the UK and Asia).
| TIME ALLOCATION | ||
In 2023, the committee held 15 meetings, including four joint sessions with the risk supervision, regulation and compliance committee. See 'Board and committee preparation and attendance' in section 4.3 for members' attendance and the estimated average time each one spent on meeting preparation and attendance.
The chart below shows the committee's approximate time allocation in 2023:
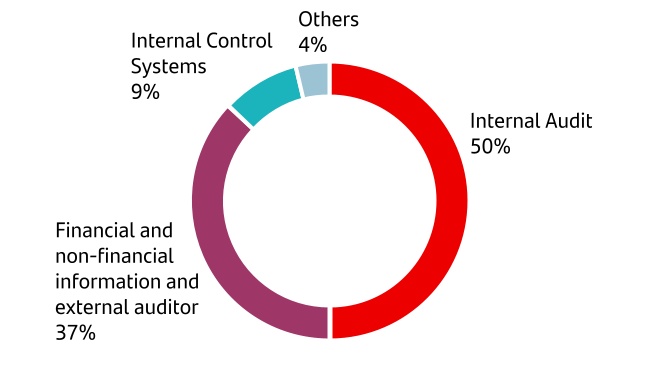
223
Duties and activities in 2023
This section summarizes the audit committee's activities in 2023.
| Duties | Actions taken | ||||||||||||||||
Financial and non-financial information | |||||||||||||||||
Review the financial statements and other financial information | •Reviewed the individual and consolidated financial statements and directors' report for 2023 and submitted them to the board of directors for approval. Monitored compliance with legal requirements and accounting principles, and ensured that the external auditor issued a report on the effectiveness of the Group’s system of internal control over financial reporting (ICFR). •Reviewed quarterly financial information (dated 31 December 2022, 31 March, 30 June and 30 September 2023, respectively), before being approved by the board and subsequently released to the market and supervisory bodies. •Reviewed such other financial information included in the annual report; Universal Registration Document filed with the CNMV; Form 20-F filed with the SEC; and the half-yearly financial information filed with the CNMV and with the SEC as Form 6-K. •Reviewed, prior to their submission to the board for approval, the adaptation of the 2022 and 2023 financial information by segments, in line with the agreed change of reporting to the five global businesses as primary segments. | ||||||||||||||||
Review the non-financial information | •Oversaw and assessed the preparation and reporting processes of non-financial reporting, in coordination with the responsible banking, sustainability and culture committee, and informed the board accordingly. •Received regular updates on ESG reporting evolution and progress within the Group, including the associated scope of metrics and action plans. •Reviewed the Climate Finance Report and the Green Bond Report in coordination with the responsible banking, sustainability and culture committee, prior to its submission to the board for approval, assessing the integrity of such disclosures and the review conducted by the external auditor. | ||||||||||||||||
Information on applied tax policies | •Was informed by the Head of Tax on applied tax policies based on the Code of Good Tax Practices, as well as the annual review of the tax strategy and policy on control and management of risk, including tax risk, prior to their submission to the board for approval. •Was informed on the filing of the 2022 Tax transparency report with the Spanish tax agency (Agencia Estatal de Administración Tributaria). | ||||||||||||||||
| Relations with the external auditor | |||||||||||||||||
Information on the external audit plan | •Received updates on the planning, progress and execution of the audit plan. •Was informed on the impact of new legal and regulatory requirements in connection with financial information. •Obtained the external auditor's confirmation of its full access to all information to conduct the audit. •Analysed the audits for the annual financial statements before the external auditor submitted them to the board of directors. •Received reports on ESG information reporting process, evolution of reporting requirements, their impact on timelines and assurance scope of the independent external verification of such information. | ||||||||||||||||
Interaction with the external auditor | •Met twice with the lead audit partner without executives present to ensure fluent communication and the independent performance of its function. •The lead audit partner, who met periodically with the committee Chair, attended all committee meetings, which facilitated effective communication between the external auditor and the board. | ||||||||||||||||
Assessment of the external auditor’s performance | •Conducted the final evaluation of the external auditor's performance and how it has contributed to the integrity of the financial information based on its knowledge of the business, the frequency and quality of its communications; its independence; and opinions of the main local audit committee Chairs and controllers of the main local units or relevant subgroups on it, among others. •Received PwC's 2023 Transparency report from the lead audit partner, who also informed about the public outcomes of quality controls conducted by the ICAC or other supervisors and any other relevant investigations. | ||||||||||||||||
224
| Duties | Actions taken | ||||||||||||||||
External auditor independence | |||||||||||||||||
PwC’s remuneration for audit and non-audit services | •Monitored PwC’s remuneration, including the following fees for audit and non-audit services provided to the Group: | ||||||||||||||||
| EUR million | |||||||||||||||||
2023 | 2022 | 2021 | |||||||||||||||
Audit | 116.8 | 115.4 | 106.0 | ||||||||||||||
Audit-related services | 8.6 | 6.4 | 6.0 | ||||||||||||||
Tax advisory services | 1.6 | 0.5 | 0.7 | ||||||||||||||
Other services | 5.9 | 4.8 | 2.4 | ||||||||||||||
Total | 132.9 | 127.1 | 115.1 | ||||||||||||||
The audit services and main non-audit services included for each item in the above breakdown are detailed as follows: •Audit services: audit of the individual and consolidated financial statements of Banco Santander and its subsidiaries (of which PwC or another firm in its network is the statutory auditor); audit of the interim consolidated financial statements of Banco Santander; audit of the integrated audits prepared in order to file Form 20-F for the annual report with the SEC in the US and the internal control audit (SOx) for required Grupo Santander's entities; the limited review of the financial statements; and the regulatory auditor’s reports on Grupo Santander’s entities. •Audit-related services: comfort letters; verification of the financial and non-financial information (as required by regulators); and other reviews of documents that, due to their nature, the external auditor provides for submission to domestic or foreign authorities. •Tax services: tax compliance and advisory services provided to Group companies outside Spain, which have no direct effect on the audited financial statements and are permitted in accordance with independence regulations. •Other services: agreed-upon procedure reports, assurance reports and special reports performed under the accepted profession's standards; as well as other reports required by the regulator. The 'Audit' heading includes the fees for the year's audit, regardless of the date the audit was completed. Any subsequent adjustments, which are not significant, and for purposes of comparison, are shown in note 47.b) in the 'Notes to the consolidated financial statements' for each year. The fees corresponding to the rest of the services are shown by reference to when the audit committee approved them. •Verified that the ratio of PwC's total fees paid for all services for Banco Santander and the Group to its annual revenue in Spain and worldwide did not exceed 15% for three consecutive years. In 2023 the ratio stood at 0.27% of PwC's worldwide total revenues. •Verified every quarter, according to Regulation (EU) No 537/2014 of the European Parliament and of the Council, that the fees approved in 2023 for non-audit services provided by PricewaterhouseCoopers Auditores, S.L. (PwC), (including for ‘Other services’ and ‘Audit-related services’, and not including services that the external auditor is required to perform under domestic or EU laws) were significantly less than 70% of the average fees paid specifically to PwC in the past three consecutive years for the ‘Audit’ of Banco Santander and its subsidiaries in Spain (not including fees for reviews with more limited assurance than required for accounts auditing, which are included as non-audit services). In 2023, the ratio stood at 31.12%; and it would be 21.05% if services approved for PwC and other firms in its network and provided to Grupo Santander in and outside Spain were included. See subsection C.1.32 of section 9.1 'Reconciliation with the CNMV’s corporate governance report model' for the reconciled amounts of the above mentioned fees listed, with the numerator and denominator values of each ratio found in section C.1.32 of section 9.2 'Statistical information on corporate governance required by the CNMV'. •In 2023, Grupo Santander contracted for services by audit firms other than PwC in the amount of EUR 174.1 million (EUR 185.5 and 263.8 million in 2022 and 2021, respectively). | |||||||||||||||||
Non-audit services | •Approved, on a monthly basis, all non-audit services rendered by the Group's external auditor verifying that all of them met the independence requirements in line with applicable Spanish and European regulation, SEC and Public Company Accounting Oversight Board (PCAOB) rules. | ||||||||||||||||
225
| Duties | Actions taken | ||||||||||||||||
| Personal and financial relations | •Received confirmation from PwC that the designated audit team, PwC as the auditor firm, everyone else that forms part of PwC or of other firms in its network, including all applicable extended relations to them complied with requirements on external auditor independence, analysing possible threats and taking appropriate safeguarding measures in line with their internal policies and procedures. •Received information about the results of the internal review carried out every six months of possible financial ties between the Group and PwC and its related parties, which concluded that no existing ties compromised the independence of PwC as external auditor. | ||||||||||||||||
External auditor independence report | •Verified the external auditor's independence prior to the issuance of the 2023 auditor’s report on the financial statements, considering: •the remuneration it has received for audit and non-audit services; •all non-audit services rendered by the external auditor; and •the personal circumstances and financial dealings, that the external auditor or persons performing the audit may have with the Group. •Received written confirmation from PwC of its independence from Grupo Santander in accordance with applicable European and Spanish law, the SEC and the PCAOB rules. •Concluded that, by its judgement, it had no objective reason to question the external auditor's independence. | ||||||||||||||||
| Re-election of the external auditor | |||||||||||||||||
Re-election of the external auditor | •Recommended to the board, for subsequent submission to the 2024 AGM, the re-election of PwC as the external auditor of Banco Santander and its consolidated Group for 2024. As from 2021, the lead audit partner is Julián González, PwC's banking sector audit leader who has experience as a global group audit partner (mainly in Spain and the UK) and a strong background in the Spanish financial sector. He also participates in various international banking supervisory and regulatory forums. •Was informed on the changes introduced by the Law on Auditing in connection with the external auditor's mandate, as well as the associated calendar and selection process milestones for a nomination in 2026. | ||||||||||||||||
| Internal audit | |||||||||||||||||
Oversight of the Internal Audit function | •Supervised the Internal Audit function and ensured its independence and effectiveness in 2023. •Reviewed the external quality assessment performed by the Institute of Internal Auditors in Spain to further ensure the effectiveness of the function and its alignment with best practice. •Held meetings with the Group Chief Audit Executive (CAE) and internal audit officers, and one private meeting with the CAE without other executives or the external auditor present. •Proposed a 2023 Internal Audit function budget, ensuring that the function had the resources needed to discharge its duties effectively. •Was kept apprised of the hubs created to improve the efficiency of the internal audit works and the internal audit digital initiatives, including artificial intelligence capabilities. •Assessed the preparedness and effectiveness of the Internal Audit function to fulfil its duties. •Reviewed and reported to the board on the CAE's 2023 objectives and performance in 2023 and reported to the remuneration committee and board of directors to set his variable remuneration. •Verified the suitability of the subsidiary CAEs, in coordination with the nomination committee. | ||||||||||||||||
| Monitoring of internal audit activities | •Reported on the internal audit plan, internal audit recommendations and ratings of units and corporate functions. Each unit CAE reported to the committee at least once in 2023. •Reviewed the strategic audit plan for 2023-2026 and recommended it to the board for approval, ensuring that it covered the Group's relevant risks. •Received regular information on the internal audit activities carried out in 2023, monitoring the progress in audit ratings, and further promoting a continued focus on a stronger control environment; and conducted an additional review of issued audit reports, requiring that relevant areas to present action plans. •Continued promoting the first-line’s further involvement in internal audit recommendations and ensured that senior management and the board understood the conclusions of internal audit reports. •Received holistic reviews of internal audit coverage of cybersecurity, IT risks, financial crime, ESG, model risk, capital and solvency, operational risk, access control and vendor management, amongst other topics, to ensure proper oversight, with first and second line of defence representatives invited to provide additional feedback, as appropriate. | ||||||||||||||||
226
| Duties | Actions taken | ||||||||||||||||
| Internal control systems | |||||||||||||||||
Monitoring the assessment of internal control systems | •Received information on the Group's internal control system and monitored related action plans, together with the internal control strategic plan. •Received reports and certification on the Group’s 2022 internal control system (ICS) and assessed its effectiveness in compliance with CNMV (SCIIF) and the SEC (SOx). •Received specific training on SOx to further enhance committee members' knowledge on this matter. See 'Director training and induction programmes' in section 4.3. | ||||||||||||||||
Coordination with Risk and with Compliance and Conduct | •Held four joint meetings with the risk supervision, regulation and compliance committee to review risk, compliance and internal audit aspects of the different regions and global businesses, with first line of defence representatives present. •Received information in a joint meeting with the risk supervision, regulation and compliance committee on Canal Abierto, the Group's whistleblowing channel with a special focus on matters within the committee's area of authority to ensure the Group's culture empowers employees and other persons related to Banco Santander can talk straight, be heard and report irregular practices without fear of reprisal. •Collectively discussed with the risk supervision, regulation and compliance committee additional topics of mutual interest, such as risk culture, third-party supplier risk management, SEC cybersecurity rules and received an update on internal audit matters of the Risk and Compliance and Conduct functions. •Received biannual reports on the main legal contingencies, associated provisions and applicable public information, in coordination with the risk supervision, regulation and compliance committee. •Invited the CRO to all 2023 committee meetings. •The Chairs of the audit committee and of the risk supervision, regulation and compliance committee met regularly, ensuring ongoing coordination and collaboration. | ||||||||||||||||
Other activities | •Endorsed the Pillar III disclosures report, which was submitted to the board for approval. •Received reports from Santander España audit committee on the main items covered at its meetings throughout the year. •Invited subsidiary audit committee chairs to specific committee meetings throughout the year and, in turn, the committee Chair attended specific subsidiary audit committee meetings to further enhance communication between them. | ||||||||||||||||
| Related-party and corporate transactions | |||||||||||||||||
Creation or acquisition of special-purpose vehicles and entities based in countries considered non-cooperative jurisdictions | •Was informed of the activities of the Group’s offshore entities by the Head of Tax. See note 3.c) in the 'Notes to the consolidated financial statements'. •Reported favourably to the board, for its approval, on proposals to create or acquire interests in special purpose entities and also received the Special Purpose Entities Annual Update. | ||||||||||||||||
Authorization and oversight of related-party transactions | •Reviewed the details and balances of the related-party transactions that appear in the annual and half-yearly financial statements. Checked that those transactions were carried out under market conditions. •Conducted bi-annual reviews to check that related-party transactions complied with the law, the Rules and regulations of the board and the conditions set by board resolution, and met the requirements to be considered fair, reasonable and transparent. Reported its findings to the board. •Issued the Related-party transactions report. See section 4.12 'Related-party transactions and other conflicts of interest'. | ||||||||||||||||
| Information for general meetings and corporate documents | |||||||||||||||||
Shareholder information | •Was represented by Pamela Walkden, in her capacity as committee Chair, to report at the 2023 AGM on the committee's activities in 2022. | ||||||||||||||||
Corporate documents for 2023 | •Prepared this activities report on 13 February 2024, which includes a performance review of the committee's functions and key priorities identified for 2024. The board of directors approved it on 19 February 2024. | ||||||||||||||||
227
Achievement of 2023 objectives
The committee took these actions planned for 2023:
•Continued to monitor the impact of the volatile environment on key aspects within the committee's remit. These included the macroeconomic scenarios which flow through to the key management judgements and estimates, such as provisioning, that were made in preparing the Group's financial statements, as well as the heightened risks around, for example, supply chain and cyber.
•Continued to supervise, in coordination with the risk supervision, regulation and compliance committee, the Group's units and global businesses, with a special focus on those more relevant to digital transformation, to ensure that appropriate controls were in place. In particular, updates on units and global businesses were provided in joint sessions with the risk supervision, regulation and compliance committee by the relevant CRO, CCO and CAE, with the respective country CEO and/or global business head present, in readiness for their presentation to the board of directors. This facilitated a holistic view of each unit and global business' risks by the committee before a more strategic and business driven discussion was held at the board meeting.
•Continued to focus on the oversight of the internal audit plan execution, ensuring appropriate amendments to address new risks and appropriateness of the internal controls to manage such risks. In particular, a key focus was given to cyber risk, the Internal Audit approach to it and the Group’s preparedness to address the challenges associated with it.
•Reviewed our enhanced ESG disclosures to ensure consistency and coherence in a complex legislative framework and monitor the increased independent assurance required in the coming years, by the Corporate Sustainability Reporting Directive. As a result, the committee further reinforced its strong working relationship with the responsible banking, sustainability and culture committee. Specific updates were provided by the Chief Accounting Officer in this respect, with a special focus on the enhancements and progress made by the different units. As part of that, the subsidiary audit committee chairs were also duly apprised on these developments at specific sessions led by the committee Chair throughout the year.
•Remained focused on the independence, quality and effectiveness of both the Internal Audit team and the committee itself, ensuring that their roles were discharged effectively. Specifically, the committee considered the findings and suggested areas for improvement resulting from the 2022 internal board effectiveness review concerning its remit.
2024 priorities
The committee set the following priorities for 2024:
•Continue to supervise the Group's units from a control perspective and specifically, the five global businesses, with a special focus on those more relevant to One Transformation, to ensure that appropriate controls are in place.
•Oversee the change of reporting of financial results to global businesses as primary segments, to better align the way we report with the manner we manage the Group.
•Continue to focus on the oversight of the internal audit plan execution, allowing for the appropriate level of flexibility to face challenges and new risks ahead, including cyber and risk derived from emerging technologies such as artificial intelligence. Remain focused on the independence and effectiveness of the Internal Audit function, ensuring its preparedness to fulfil its duties, including the need for new skillsets and expertise of its workforce.
•Remain focused on analysis and reporting processes for non-financial information and, in particular, to further embed climate related disclosures to meet increasing stakeholders expectations, with a key focus on the implementation of robust processes and controls in the current complex legislative framework, and monitor the greater independent assurance required going forward.
•Oversee and lead proactively an external auditor selection process according to applicable regulation, which will be coordinated by the CAO, with a view to appointing Banco Santander and its consolidated group's external auditor at the 2026 AGM, after expiration of the 10-year term of office of PwC as our external auditor.
•Remain focused on the overall effectiveness of the committee, ensuring that its role is discharged in the most tangible and effective manner and oversee a smooth transition of committee Chair, given that Pamela Walkden's four-year term of office expires in April 2024.
228
4.6 Nomination committee activities in 2023
| and structured handover process which enabled Glenn seamlessly to assume Lead Director responsibilities. We also remained focused on board composition, ensuring that its depth of skills, experience and overall make-up remained appropriate and relevant to the needs of the Group. As a result, we strengthened the board with the addition of both Carlos Barrabés and Antonio Weiss, who both bring highly relevant skills and experience. With respect to senior executive appointments, the committee has supported Héctor Grisi in his first year as the Group’s CEO and overseen the recommendations of new senior appointments for the Regional Heads of Europe and North America and for the Global Head of Retail & Commercial Banking, amongst others. The effectiveness of the board, its committees and our overall governance remained a key priority in the year. We tested our progress on our overall effectiveness through commissioning an external evaluation of the board and its committees. The review, conducted by Spencer Stuart, considered our board to be highly effective. Recommendations resulting from this review have been incorporated into each committee’s priorities for 2024. The committee continued to benefit from a great mix of experience and skills, and we have complemented this with the appointment of Belén Romana as a member with effect from 1 January 2024. It has been a privilege for me to chair this committee over the last nine years and I am confident that my committee Chair successor and colleagues will play their part in supporting the further development of the Group in the years to come."  | |||||||||||||
Bruce Carnegie-Brown Chair of the nomination committee | ||||||||||||||
"Board composition, succession planning, senior appointments, effective governance, career development and talent strategy remained top priorities in our agenda throughout 2023. The committee holds the belief that effective group-wide governance is an essential element of business success, and supported initiatives such as the subsidiary Chairs in-person convention hosted by the Group Executive Chair in Madrid, with a clear focus on the importance of effective governance across the Group, ongoing connectivity and sharing knowledge and associated best practices. We remained focused on robust governance standards aligned to our strategic goals. In this regard, a diverse workforce and an ambitious and compelling employee value proposition are key to both developing the quality of our internal pipeline and attracting the external talent required to deliver our strategic targets. In particular, significant time was devoted to the robust succession process followed for the Lead Independent Director role, which I passed to Glenn Hutchins on 1 October 2023. This work included the importance of an appropriate | ||||||||||||||
| COMPOSITION | ||
Position | Category | Appointed on | |||||||||
Chair | Bruce Carnegie-Brown | Independent | 12/02/2015A | ||||||||
Members | Sol Daurella | Independent | 23/02/2015 | ||||||||
| Gina Díez Barroso | Independent | 22/12/2021 | |||||||||
| Glenn Hutchins | Independent | 20/12/2022 | |||||||||
Belén Romana | Independent | 01/01/2024 | |||||||||
Secretary | Jaime Pérez Renovales | ||||||||||
A. Committee Chair since 12 February 2015.
The board of directors appointed the committee’s members based on their expertise, skills and experience in the matters the committee handles. For more details, see section 4.1 'Our directors' and 'Board and committees skills and diversity matrix' in section 4.2.
| TIME ALLOCATION | ||
In 2023, the committee held 13 meetings. See 'Board and committee preparation and attendance' in section 4.3 for members' attendance and the estimated average time each one spent on meeting preparation and attendance.
The chart below shows the committee’s approximate time allocation in 2023:
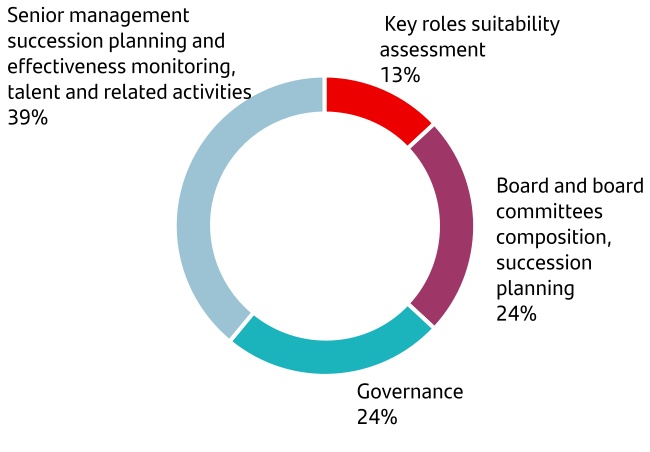
229
Duties and activities in 2023
This section summarizes the nomination committee's activities in 2023.
| Duties | Actions taken | |||||||
| Board and committees composition and succession planning | ||||||||
Selection and succession of the board and its committees | •Ensured board member selection procedures guaranteed directors’ individual and collective suitability; fostered diversity in its broadest sense; and analysed the required expertise, skills and time commitment for effective board membership. •Continued to be involved, together with the Group Executive Chair, in succession planning activities for the board. •Assessed the composition of the board committees and the international advisory board in order to ensure they had the right skills and experience to perform their duties successfully. •Continued monitoring the board of directors’ overall skills and competencies, ensuring that the collective board and its committees composition remains appropriate to oversee and lead the strategic direction of the Group. •Ensured that any proposed appointment had been drawn from a depth of candidate pool which recognised diversity in its broadest sense. | |||||||
Appointment, re-election and ratification of directors and committee members | •Considered areas of expertise and experience required to complement the board of directors by reference to the board skills and diversity matrix as well as the annual board effectiveness review in order to target the relevant recruitment. •Recommended the appointments of Carlos Barrabés and Antonio Weiss, as independent directors, effective from the 2024 AGM, subject to regulatory approval. •Oversaw a rigorous and comprehensive process to facilitate the orderly succession of the Lead Independent Director position, taking into account and constructively challenging all relevant factors. As a result, confirmed the suitability of Glenn Hutchins for the position and proposed his nomination to the board. •Proposed composition changes for certain committees to further enhance their performance and support to the board in their areas of authority. See section 1.1 'Board skills and diversity'. •Recommended the nominations of Carolyn Everson and Juan Ignacio Gallardo Thurlow as members of the international advisory board. | |||||||
| Annual verification of the status of directors | •Verified each director category (i.e. executive, independent and other external) and submitted a proposal to the board of directors for it to be confirmed in the annual corporate governance report and at the 2024 AGM. See section 4.2 'Board composition'. •Assessed directors’ independence, verifying there were no significant business ties between the Group and companies in which they are or have been significant shareholders, directors or senior managers, in particular regarding financing extended by the Group to such companies. In all cases, the committee concluded that existing ties were not significant because (i) financing (a) did not constitute economic dependency for such companies because other sources of funding were available, and (b) was consistent with the Group’s share of the relevant market; and because (ii) business ties did not reach comparable materiality thresholds used in other jurisdictions as benchmarks (e.g. New York Stock Exchange (NYSE), Nasdaq and Canada’s Bank Act), among other reasons. | |||||||
| Directors' potential conflicts of interest and other professional activities | •Examined the information provided by directors about their intention to carry out other professional activities or positions outside the Group and the related time commitment. Concluded that those commitments were compliant with applicable legislation regarding the maximum number of boards to which they may belong, and did not interfere with their obligations as Banco Santander directors nor entail any conflict of interest. | |||||||
| Director induction, training and development programmes | •Assessed the effectiveness of the director induction, training and development programmes, guaranteeing that such programmes are designed according to each director’s circumstances and needs. •Identified areas for improvement and additional training topics for the 2024 training programme. | |||||||
Senior management succession planning and effectiveness monitoring, talent and related activities | ||||||||
Succession planning for executive directors and senior management | •Oversaw the discipline applied to senior executive succession planning, which included key positions in subsidiaries, and made sure plans were being implemented for the orderly succession of senior managers through a rigorous, transparent, merit-based and objective process that promotes diversity in its broadest sense. •Oversaw appointments of key positions and monitored the effectiveness of the top management succession plans. | |||||||
| Appointment of key officers | •Recommended the following nominees, later agreed by the board: •Pedro Castro e Almeida, as Regional Head for Europe. •Christiana Riley, as Regional Head for North America. •Daniel Barriuso, as Global Head of Retail & Commercial Banking and Group Chief Transformation Officer. •José Luis de Mora, as Global Head of Digital Consumer Bank. | |||||||
230
| Duties | Actions taken | |||||||
Talent and culture | •Discussed Human Resources' activities and progress and proposals regarding diversity, equity and inclusion; and reviewed the Group’s STEM (science, technology, engineering and mathematics) talent strategy. •Assessed and challenged proposals on top-leadership goals, career development plans and mobility. | |||||||
| Governance | ||||||||
| Board effectiveness review | •Reviewed the execution of the action plan to address the areas for improvement revealed in the 2022 board effectiveness annual review. •Oversaw the 2023 board effectiveness review, which was conducted with the collaboration of an independent external consultant (Spencer Stuart), whose independence was verified by the committee upon analysing its business relations with the Group and, in particular, the services rendered and the amounts received. See 'Board effectiveness review in 2023' in section 4.3. | |||||||
Internal governance | •Assessed the suitability of certain proposed key position appointments for the subsidiaries, subject to the Group’s appointments and suitability procedure. •Oversaw subsidiary board composition to ensure consistent suitability in line with expectations across the Group. •Endorsed Group director nominations for subsidiary boards to ensure they were suitable and correctly perform their duties. •Verified the suitability of the subsidiary CAEs, CROs and CCOs with the Group audit and risk supervision, regulation and compliance committees. •Remained apprised on new governance regulation, trends, best practices and implications for the Group. •Verified that subsidiaries followed the provisions of the GSGM relating to board and committee structure and their functions pursuant to best practices. In addition, the committee tracked subsidiary actions and progress in implementing internal regulation required by the Group. See section 7. 'Group structure and internal governance'. •Reviewed the subsidiary board and board Chairs annual effectiveness reviews. | |||||||
| Corporate governance | •Reviewed the key highlights of the 2023 AGM. •Reviewed the activities conducted by the Lead Independent Director, ensuring the discharge of his duties, as evidenced through a summary of his activities in the year, which was also submitted to the board. •Reviewed the activities conducted by the Shareholder and Investor Relations team, as well as the Lead Independent Director's engagement with investors, shareholders and proxy advisors, and their feedback on the Group's corporate governance arrangements. •Reviewed the independence of the external advisers hired by the nomination committee and the remuneration committee in 2023, analysing their services, the amounts they received and other items. •Reviewed the annual corporate governance report to verify that information contained therein conforms to the applicable law and that the corporate governance system promotes corporate interests and considers all stakeholders' expectations. •Endorsed the proposed amendments to the Rules and regulations of the board which were submitted to the board for approval. | |||||||
Suitability assessment | ||||||||
Annual suitability assessment of directors and key function holders | •Assessed the suitability of directors, senior management, heads of internal control functions and the Group's key position holders, confirming their continued business and professional good reputes and appropriate knowledge and experience to perform their duties. •Concluded that board members are capable of good governance. To this effect, it supervised, amongst others, the attendance of the directors at the meetings of the board and the committees, ensuring that it was not less than 75% and, in the specific cases of lower attendance, that the absences were duly justified and do not undermine their capacity to devote sufficient time to discharge their functions. Furthermore, average board attendance was verified as 100%. See 'Board and committee preparation and attendance' in section 4.3. •Confirmed the absence of circumstances that could harm the Group's credit and reputation, based on the information received from directors. | |||||||
| Information for general meetings and corporate documents | ||||||||
Shareholder information | •Was represented by Bruce Carnegie-Brown, in his capacity as committee Chair, to report at the 2023 AGM on the committee's activities in 2022. | |||||||
Corporate documents for 2023 | •Prepared this activities report on 12 February 2024, which includes a performance review of the committee's functions and key priorities identified for 2024. The board of directors approved it on 19 February 2024. | |||||||
231
Achievement of 2023 objectives
The committee took these actions planned for 2023:
•Continued to review the board member and senior executive succession plans based on the strategic direction of the Group and ensuring that the collective board composition remained commensurate with the required skills, experience and diversity required to oversee and drive such strategy, including understanding of the operating context of the Group. The committee approach to succession planning also ensured the continued development of a robust internal succession pipeline.
•Continued to promote internal mobility within the Group and diversity in its broadest sense in our succession policy and talent strategy, acknowledging that building a more diverse and inclusive workforce is critical to business sustainability and success.
•Continued to monitor board members’ expertise and training needs, as well as the board’s development, to continuously improve the knowledge of the most important topics of the organisation and industry.
•Led the process for the appointment of a successor to the Lead Independent Director, which resulted in the appointment of Glenn Hutchins. He was also appointed as Vice Chair of the board with effect from 1 October 2023. As part of that, the committee received updated information throughout the year to ensure the robustness of the process followed, which included, amongst others, the suitability of the candidates considered, the associated timeline, the transition process and the associated impact to committee composition.
•Kept corporate governance arrangements under constant review, ensuring that the expectations of all stakeholders with strategic relevance for the Group were considered. In particular, the committee closely monitored shareholder engagement and considered their feedback and insights together with the Lead Independent Director.
•Continued to ensure the ongoing application of the GSGM and related internal regulation across the Group, and as a consequence, robust oversight and control of the Group´s subsidiaries, with a key focus on the effectiveness of local boards and their annual board effectiveness assessment disciplines and associated action plans.
•Remained focused on the overall effectiveness of the committee, ensuring that its role was discharged with appropriate rigour. As part of that, the committee considered the findings and suggested areas for improvement resulting from the 2022 internal board effectiveness review. In addition, the committee oversaw the selection process of the external review firm and coordinated the 2023 board effectiveness review. See 'Board effectiveness review in 2023' in section 4.3.
2024 priorities
The committee set the following priorities for 2024:
•Continue to apply and supervise succession arrangements for the board as a whole, playing an important role in ensuring that succession planning more generally is discharged in an effective manner. Continue to take its proactive approach to board refreshment and associated succession planning.
•Keep a proactive focus on senior executive succession planning based on the Group’s strategic needs and the potential challenges the business may face, maintaining our key focus on the continued development of our internal succession pipeline.
•Continue to place a great focus on diversity in its broadest sense as part of our talent strategy and, in particular, in gender diversity, to ensure a balanced representation of both genders. Further promote international mobility to ensure we leverage on the possibilities that being a group of our size represents for talent development purposes.
•Monitor the effective implementation of the action plan derived from the 2023 board effectiveness review, in line with our commitment to continuous governance improvements.
•Remain focused on the overall effectiveness of the board and its committees, ensuring that their role is discharged in the most tangible and effective manner. This will be particularly important to ensure our continued positive business performance and success. In addition, oversee a smooth transition of committee Chair, given that Bruce Carnegie-Brown has expressed his intention not to stand for re-election at the 2024 AGM, stepping down with effect from that same date.
232
4.7 Remuneration committee activities in 2023
| balance key objectives such as fair pay, effective risk management, sustainability, meritocracy, and cross-collaboration - all the while taking stakeholder feedback into account. The committee continued to benefit from a good mix of experience and skills of our members, each providing valuable advice and challenge to management. As in previous years, we received the confirmation from an external provider that the Group's policies, procedures and practices fully comply with applicable legislation. I would like especially to thank Bruce Carnegie-Brown for his service over the last years as Chair of the committee until I took over in October 2023, and his continued membership until the 2024 AGM. He has been an effective steward of the interest of our stakeholder community."  | |||||||||||||
Glenn Hutchins Chair of the remuneration committee | ||||||||||||||
"Our role, in coordination with the nomination committee, is to attract and retain key talent to support the Group’s transformation agenda and strategic ambitions in order to increase shareholder value. Our remuneration philosophy involves enhancing our employee value proposition while simultaneously meeting supervisory expectations and serving all of our stakeholders' best interests. This requires us to | ||||||||||||||
| COMPOSITION | ||
| Position | Category | Appointed on | |||||||||
| Chair | Glenn Hutchins | Independent | 20/12/2022 | ||||||||
| Members | Bruce Carnegie-Brown | Independent | 12/02/2015 | ||||||||
| Sol Daurella | Independent | 23/02/2015 | |||||||||
| Henrique de Castro | Independent | 29/10/2019 | |||||||||
Luis Isasi | Other external | 19/05/2020 | |||||||||
| Secretary | Jaime Pérez Renovales | ||||||||||
A. Committee Chair since 1 October 2023.
The board of directors appointed the committee’s members based on their expertise, skills and experience in the matters the committee handles. For more details, see section 4.1 'Our directors' and 'Board and committees skills and diversity matrix' in section 4.2.
| TIME ALLOCATION | ||
In 2023, the committee held 12 meetings, including one joint session with the risk supervision, regulation and compliance committee. See 'Board and committee preparation and attendance' in section 4.3 for members’ attendance and the estimated average time each one spent on meeting preparation and attendance.
The chart below shows the committee's approximate time allocation in 2023:
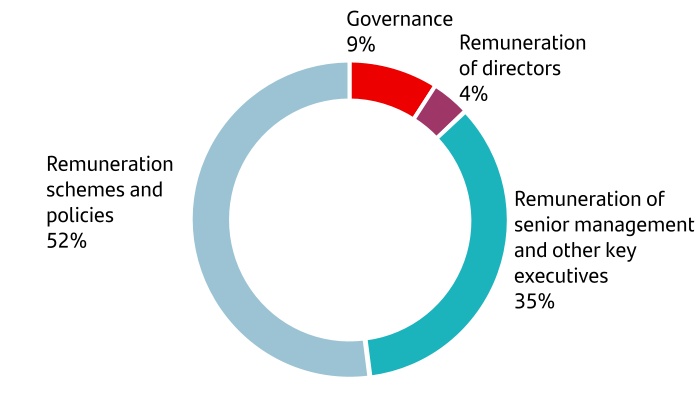
233
Duties and activities in 2023
This section summarizes the remuneration committee's activities in 2023.
| Duties | Actions taken | |||||||
| Remuneration schemes and policies | ||||||||
| Remuneration policy for executive directors, senior management and other key executives | •Remained focused on simplifying executive directors and senior management remuneration, shaping remuneration schemes consistent with Banco Santander's Simple, Personal and Fair values, and updated the long-term ESG-related metrics in coordination with the responsible banking, sustainability and culture committee. •Recommended the 2022 individual variable remuneration of members of senior management, based on annual performance targets and their weightings as set by the board. •Proposed to the board the global annual variable remuneration for 2023 (payable immediately and deferred executive remuneration), based on achievement of previously set quantitative and qualitative targets. •Recommended to the board the annual performance indicators to calculate variable remuneration for 2024 with limited variations versus previous years in order to maintain focus on customer centricity, risk, capital, profitable sustainable growth and cost discipline. •Set the achievement scales for the annual and multi-year performance targets and weightings for submission to the board. •Endorsed specific enhancements in the performance management process for senior management to further promote the latter as corporate culture representatives and supporters of the effective transformation of the business. | |||||||
| Assist the board of directors in supervising compliance with remuneration policies | •Checked that remuneration schemes were appropriate to the Group’s results, corporate culture and risk appetite and created no incentive to breach risk appetite. •Reported to the board on Group remuneration practices and assessed their effectiveness, receiving confirmation on their alignment with the Group remuneration policy. •Reported to the board that an external advisor assessment on the remuneration policy found that the Group's policies, procedures and practices comply with the regulatory requirements for credit institutions. •Endorsed proposed changes to the remuneration policy to adapt it to the SEC Remuneration Recoupment ('clawback') rules, amongst others. •Reviewed the adoption of ex-post risk adjustments, including the application of malus and clawback arrangements within the Group. | |||||||
| Diversity, equity and inclusion | •Reviewed gender pay gap reduction and equal pay with a view to promoting greater diversity in its broadest sense, acknowledging progress made in the number of women in senior positions. •Reviewed internal 'equal pay for equal work' data against the previous year and targets and focused on measures to enhance them in each unit. •Received information on inclusion indicators and initiatives launched to continue promoting a culture of inclusion in the Group and ensured the avoidance of pay gaps in this regard. | |||||||
| Remuneration of senior management and other key executives | ||||||||
Performance assessments | •Reviewed the calibration of executives’ performance reviews for the senior management and, in particular, for the Executive Chair, the CEO and the main executives in coordination with non-executive directors; for the CRO and CCO with the risk supervision, regulation and compliance committee; and for the CAE with the audit committee. | |||||||
Fixed remuneration for executive directors and senior management | •Checked that executive directors' fixed remuneration remained appropriate to their duties based on market rates. •Made sure remuneration for senior management remained fair and competitive, recommending adjustments where appropriate to the board, based on a benchmark analysis and specific pay principles. | |||||||
| Variable remuneration for executive directors and senior management | •Proposed to the board variable remuneration for the preceding year payable either immediately or in deferred amounts. | |||||||
Share plans | •Submitted a proposal to the board for approval and subsequently for vote at the 2023 AGM on remuneration plans that involve the delivery to executive directors of shares or share options (deferred multiyear target variable remuneration plan; deferred and conditional variable remuneration plan; application of the Group buy-out policy). •Analysed and submitted to the board tailored incentive schemes for different units to drive talent retention and alignment with the Group’s strategic priorities. | |||||||
234
| Duties | Actions taken | |||||||
| Remuneration of directors | ||||||||
| Individual remuneration of directors in their capacity as such | •Analysed and proposed adjustments to the directors’ remuneration in their capacity as such, based on the positions they held on the collective decision-making body, their membership and attendance at committee meetings, benchmark information and other objective circumstances. | |||||||
| Remuneration of Identified Staff | ||||||||
Remuneration of other executives who are Identified Staff | •Reviewed the volume of the Identified Staff (Material Risk Takers) in 2023, trends versus previous years and checked that fixed and variable remuneration ratios for control functions remained consistent with regulation and targets. •Set key remuneration components for Identified Staff in coordination with the risk supervision, regulation and compliance committee. •Submitted a proposal to the board, for subsequent submission to the 2023 AGM, regarding the approval of maximum variable remuneration of up to 200% of the fixed component for certain e Identified Staff, including executive directors and senior management. •Checked that remuneration schemes supported attraction and retention of key talent to help drive the Group's strategy, the application of the incentives implemented in the Group, and the level of achievement of long-term deferred remuneration metrics. | |||||||
| Governance | ||||||||
Coordination with subsidiaries | •Received information on practices, remuneration trends and challenges in different local markets. •Held a joint session with the risk supervision, regulation and compliance committee to review the subsidiary action plans on internal sales force pay and conduct risk for the external sales force. •Verified that remuneration schemes factor in capital and liquidity, and do not offer incentives to assume risks that exceed Banco Santander's tolerance, thus promoting and being compatible with adequate and effective risk management. | |||||||
Director remuneration policy report | •Reviewed the Lead Independent Director’s report on engagement with key shareholders and proxy advisors regarding executive director remuneration. •Reviewed and proposed to the board the annual directors' remuneration report for an advisory vote at the 2023 AGM. •Assisted the board in overseeing compliance with the director remuneration policy. •Positively recommended the proposal for the directors' remuneration policy for 2024, 2025 and 2026 that will be submitted by the board of directors at the 2024 AGM as a separate item on the agenda pursuant to Article 529 novodecies of the Spanish Companies Act and is an integral part of this report. See sections 6.4 Directors' remuneration policy for 2024, 2025 and 2026' and 6.5 'Preparatory work and decision-making for the remuneration policy; remuneration committee involvement'. As part of that, the committee considered the inputs from shareholder and stakeholder engagement during the year. It also considered any recommendations from regulators, legal requirements or applicable regulation concerning remuneration matters and verified that the policy is consistent with the Group's culture and Simple, Personal and Fair values. •Confirmed that the directors' remuneration policy for 2024, 2025 and 2026 is consistent with the Group's remuneration policy and with the remuneration scheme outlined in the Bylaws. The main changes included are as follows: the simplification of the short-term bonus pool scorecard, moving the multiplier approved in 2023 to the qualitative adjustment going forward, with an associated weight of +/-10%. In addition, we reinforced the focus on our solid cost discipline as a measure to succeed in transformation. We also eliminated the stock options for the executive directors. | |||||||
| Information for general meetings and corporate documents | ||||||||
Shareholders information | •Was represented by Bruce Carnegie-Brown, in his capacity as committee Chair, to report at the 2023 AGM on the committee's activities in 2022. | |||||||
Corporate documents for 2023 | •Prepared this report on 12 February 2024, which includes a performance review of the committee's functions and key priorities identified for 2024. The board of directors approved it on 19 February 2024. | |||||||
235
Achievement of 2023 objectives
The committee took these actions planned for 2023:
•Kept incentive measures under continuous review to ensure that they continue to align with our strategic aims. In particular, this included a continued focus on customers and sustainable profitability, carefully considering our corporate culture and behaviours, balancing the needs of our different stakeholders. As part of that, the committee established the annual performance indicators to calculate variable remuneration for 2024 with limited variations versus the previous year in order to maintain focus on customer centricity, risk, capital, profitable sustainable growth and cost discipline. In addition, it recommended to the board for approval specific changes in the performance management process for our top management to ensure they lead by example.
•Continued to monitor external developments in executive remuneration best practices in the financial industry and broader market within regulation to enhance our employee value proposition. The committee continued to focus on ensuring that our remuneration schemes remain effective for attracting and retaining key talent for the Group’s strategic ambitions, and that they promote meritocracy and effective risk management. In particular, it received specific deep-dives on remuneration matters for key segments, such as STEM talent, or certain countries.
•Continued to focus on accelerating pay equality in the Group to support our commitment to diversity, equity and inclusion. Checked that the methodology to calculate diversity metrics was accurate and action plans effectively promote a more diverse composition of our employee population.
•Remained focused on the overall effectiveness of the committee, ensuring that its role is discharged with appropriate rigour. Specifically, the committee considered the findings and suggested areas for improvement resulting from the internal board effectiveness review conducted in 2022 concerning its remit.
2024 priorities
The committee set the following priorities for 2024:
•Keep incentive measures under continuous review to ensure that they continue to align with our organization based on segments and global businesses, and shareholder value creation ambition. This will include a continued focus on customers and sustainable profitability and an assessment on how they drive our corporate culture and behaviours, balancing the needs of our different stakeholders.
•Continue to monitor trends and best practices in executive remuneration to further enhance our employee value proposition, promoting effective attraction and retention of key talent to deliver the Group's strategy while maintaining the strong shareholder support received and appreciation from investors and proxy advisors.
•Ensure that remuneration schemes support attraction and retention of key talent to help us deliver against our agreed strategy and associated targets, including our transformation agenda.
•Continue focusing on diversity, equity and inclusion across the Group, ensuring the avoidance of pay gaps in this regard. As part of that, review the implementation of new regulation regarding remuneration and salary equity information to be included in our non-financial disclosures.
•Remain focused on the overall effectiveness of the committee, ensuring that its role is discharged in the most tangible and effective manner.
236
4.8 Risk supervision, regulation and compliance committee activities in 2023
| strong commitment to compliance and conduct risk to safeguard our reputation and integrity, with an ongoing focus on financial crime compliance. We have also reflected and acknowledged how critical it is, in the current environment, to enhance cross-country collaboration. As a result, we have shared our concerns, best practices and views by organising a convention with the Chairs of the subsidiary risk supervision, regulation and compliance committees. In addition, the committee has maintained a key focus on identifying emerging and non-traditional risks in order to anticipate potential impacts on our business model; as in previous years, this featured the committee’s strategy meeting agenda. The committee continues to benefit from a good mix of experience and skills, and I am confident that this would help us to successfully navigate the challenges ahead. In the coming year, the committee will remain vigilant on the main risks of the Group, including credit, operational, financial crime compliance and model risks and also the risks related to the transformation of the Group, amongst others."  | |||||||||||||
Belén Romana Chair of the risk supervision, regulation and compliance committee | ||||||||||||||
"In 2023, we navigated a complex and dynamic risk landscape, characterised by macroeconomic and industry-specific challenges, primarily driven by rising inflation and interest rates, as well as a volatile geopolitical landscape. As part of this, the committee has closely monitored the actions taken by management to address these circumstances. During the year, the committee has ensured that we maintained prudent lending practices to achieve adequate credit quality of our loan portfolio and that the exposure remained within acceptable limits. The committee has kept its | ||||||||||||||
| COMPOSITION | ||
| Position | Category | Appointed on | |||||||||
Chair | Belén Romana | Independent | 28/10/2016A | ||||||||
Members | Germán de la Fuente | Independent | 01/01/2023 | ||||||||
| Luis Isasi | Other external | 19/05/2020 | |||||||||
| Ramiro Mato | Independent | 28/11/2017 | |||||||||
| Pamela Walkden | Independent | 01/05/2021 | |||||||||
Secretary | Jaime Pérez Renovales | ||||||||||
A. Committee Chair since 1 April 2021.
The board of directors appointed the committee's members based on their expertise, skills and experience in the matters the committee handles. For more details, see section 4.1 'Our directors' and 'Board and committees skills and diversity matrix' in section 4.2.
| TIME ALLOCATION | ||
In 2023, the committee held 17 meetings, including one strategy session, four joint sessions with the audit committee and one joint session with the remuneration committee. See 'Board and committee preparation and attendance' in section 4.3 for members’ attendance and the estimated average time each one spent on meeting preparation and attendance.
The chart below shows the committee’s approximate time allocation in 2023:
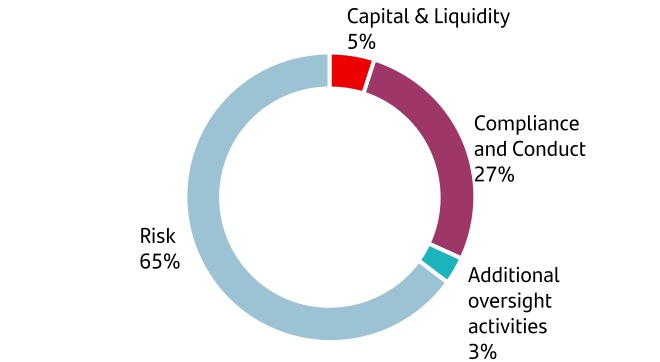
237
Duties and activities in 2023
This section summarizes the risk supervision, regulation and compliance committee's activities in 2023.
| Duties | Actions taken | |||||||
| Risk | ||||||||
Assist the board in (i) defining the Group's risks policies, (ii) determining the risk appetite strategy and culture, and (iii) supervising their alignment with the Group’s corporate values | •Reviewed and proposed to the board for approval the annual risk appetite statement proposal, and the analysis of proposed new metrics and limits. •Reviewed risk appetite metrics, compliance with the limits and any breaches in the year on a quarterly basis. •Reviewed the internal capital adequacy assessment process (ICAAP) and internal liquidity adequacy assessment process (ILAAP), the Strategic Plan, the three-year strategic financial plan, the annual budget and the recovery and resolution plans before the board of directors approved them. Reviewed and challenged the identified risks and mitigating factors associated with those key processes, their consistency, and their alignment to the Group' risk appetite. | |||||||
Risk management and control | •Reviewed the Group's main risks by unit and risk type, with a special focus on credit risk, operational risk and financial crime. •Analysed the subsidiaries and businesses risk management and control periodically, in coordination with the audit committee. •Reviewed the risks of strategic projects before their submission to the board of directors, and their mitigation measures, with a special focus on the new global businesses and strategic initiatives. •Checked that the Group's risk control management, most notably the risk profile assessment (RPA) and the risk control self-assessment (RCSA), remained robust. •Analysed the potential impact and opportunities associated with emerging risks and how they would affect different geographies, our subsidiaries and businesses. •Supported the board in conducting stress tests of Banco Santander through the assessment of scenarios and assumptions, analysing the results and the measures proposed by the Risk function. •Ensured that the stress test programme was aligned with the EBA Guidelines 2018/04 on institutions' stress testing. •Received and analysed specific information on credit risk, with a special focus on non-performing assets; market risk, structural and counterparty risk; operational risk, specially the risks derived from the cybersecurity and technological obsolescence, with a key focus on legal, reputational, social and environmental risks. The analysis on each matter was conducted in coordination with the audit and innovation and technology committees. The committee reviewed the business continuity and contingency plans with the latter. •Supervised, together with the responsible banking, sustainability and culture committee, (i) the alignment of risk appetite and limits with corporate culture and values; (ii) non-financial risks; and (iii) new metrics related to climate that were proposed under the Risk Appetite Statement annual proposal. •Supported the board in the supervision of crisis management and resolution planning. | |||||||
Supervise the Risk function | •Reviewed the Risk function’s activities, strategy, strengths and potential areas for improvement. •Ensured the ongoing independence and effectiveness of the Risk function, including the assessment of the sufficiency and appropriateness of its resourcing. •Reported to the board on the CRO's 2023 objectives and reviewed his performance against those, and reported to the remuneration committee and board of directors to set his variable remuneration. •Verified the suitability of the subsidiary CROs, in coordination with the nomination committee of the Group. | |||||||
Collaboration to establish rational remuneration policies and practices | •Held a joint session with the remuneration committee to review the subsidiary action plans on internal sales force pay and conduct risk for the external sales force. •Verified that remuneration schemes factor in capital and liquidity, and do not offer incentives to assume risks that exceed Banco Santander's tolerance, thus promoting and being compatible with adequate and effective risk management. •Reviewed the ex-ante risk adjustment of total variable remuneration assigned to the units, based on actual risk outcomes and their management, in conjunction with the remuneration committee. •Reviewed the 2023 bonus pool and results of the exercise carried out annually to identify employees whose professional activities had a material impact on the Group´s risk profile (Identified Staff). | |||||||
| Regulatory and supervisory relations | •Reviewed relevant developments regarding regulatory and supervisory relations and maintained focus on the most relevant developments related to the Single Supervisory Mechanism (SSM), the Single Resolution Board (SRB), the supervisors of all the Group’s subsidiaries and the Supervisory Review and Evaluation Process (SREP) and specific on-site inspections related to risk and compliance matters, as appropriate. | |||||||
238
| Duties | Actions taken | |||||||
| Compliance and conduct | ||||||||
Supervise the Compliance and Conduct function | •Supervised the Compliance and Conduct function's activities, strategy, strength and potential areas of improvement, as well as the development of the 2023 compliance programme. •Ensured the ongoing independence and effectiveness of the Compliance and Conduct function, including the assessment of its staffing levels and overall appropriateness of its resourcing. •Reviewed monthly reports on regulatory issues, product governance and consumer protection, reputational risk, internal and external events, notifications and inspections by supervisors, updates on the One Financial Crime Compliance (One FCC) programme, amongst others. •Received updates on compliance and conduct risks from the Group's main subsidiaries and global businesses, with a special focus on the status of the implementation of the One FCC programme. •Met with the CCO (twice in private session, in addition to other informal meetings) to discuss strategic compliance topics as well as to discuss independently and directly any potential material issue relating to the Compliance and Conduct function. •Reported to the board on the CCO's 2023 objectives and reviewed her performance against those, and reported to the remuneration committee and board to set her variable remuneration. •Verified the suitability of the subsidiary CCOs, in coordination with the nomination committee of the Group. | |||||||
Regulatory compliance including Canal Abierto | •Reviewed the situation of compliance with data protection regulation across Grupo Santander and received the data protection officer's annual report. •Endorsed, prior to presentation to the board, the changes to the general code of conduct. •Received information, in a joint meeting with the audit committee, on Canal Abierto, the Group's whistleblowing channel with a special focus on matters within the committee's area of authority to ensure the Group's culture empowers employees and other persons related to Banco Santander can talk straight, be heard and report irregular practices without fear of reprisal. | |||||||
Financial crime compliance (FCC) | •Oversaw the Group's observance of FCC regulations as well as the activities carried out by the function: •Was provided with quarterly updates on progress on the One FCC implementation and reviewed the sanctions screening activity. •Received recommendations and observations stemming from the annual independent expert report on Banco Santander in accordance with Act 10/2010 and Royal Decree 304/2014 (on anti-money laundering and terrorism financing). | |||||||
Product governance and consumer protection | •Reviewed reports on customer complaints, their causes and action plans launched to reduce and mitigate the identified deficiencies, in coordination with the responsible banking, sustainability and culture committee. •Reviewed risk management and the main risks identified, as well as the concerns, priorities and actions taken by the Product Governance and Consumer Protection area regarding conduct risk with retail and vulnerable customers. | |||||||
| Capital and liquidity | ||||||||
| Assist the board in reviewing and approving capital and liquidity strategies and supervising their implementation | •Reviewed and reported to the board on the annual ICAAP run by the Finance division and challenged by the Risk function in accordance with industry best practices and supervisory guidelines. •Reviewed a capital plan according to the scenarios envisaged over a three-year period. •Reviewed and reported to the board on the ILAAP, which was challenged by the Risk function and developed in line with the Group´s business model and its liquidity needs. •Reviewed liquidity risk and liquidity levels of the Group and its subsidiaries. •Continuously monitored capital levels, capital management and associated tools, the 2023 securitizations plan and the analysis of the portfolio profitability versus the risk undertaken. | |||||||
| Additional oversight activities | ||||||||
Additional oversight activities | •Held four joint meetings with the audit committee to review risk, compliance and internal audit aspects of the different regions and global businesses, with first line of defence representatives present. •Collectively discussed with the audit committee additional topics of mutual interest, such as risk culture, third-party supplier risk management and SEC cybersecurity rules, and received an update on internal audit matters of the Risk and Compliance and Conduct functions. •Received reports from the Santander España risk committee on the main items covered at its meetings throughout the year. •The committee Chair attended specific subsidiary risk supervision, regulation and compliance committee to further enhance communication between them. •Received updates on the matters discussed at the responsible banking, sustainability and culture committee by the Chair of that committee. •Received monthly updates from the CRO and CCO on the work conducted by both the risk control and the compliance and conduct committees in their capacity as Chairs, respectively. •The Chairs of the audit committee and of the risk supervision, regulation and compliance committee met regularly, ensuring ongoing coordination and collaboration. | |||||||
239
| Duties | Actions taken | |||||||
| Information for general meetings and corporate documents | ||||||||
Shareholder information | •Was represented by Belén Romana, in her capacity as committee Chair, to report at the 2023 AGM committee's activities in 2022. | |||||||
| Corporate documents for 2023 | •Prepared this activities report on 14 February 2024, which includes a performance review of the committee's functions and key priorities identified for 2024. The board of directors approved it on 19 February 2024. | |||||||
Achievement of 2023 objectives
The committee took these actions planned for 2023:
•Monitored the macroeconomic conditions, especially the energy crisis, inflation, interest rates hikes and potential recession in certain countries, and the potential impact on the Group. In particular, the committee continued to supervise, in coordination with the audit committee, the Group's units and global businesses to ensure that there was an appropriate focus on local nuances and risks. In particular, updates on global businesses and units were provided in joint sessions with the audit committee by the relevant CRO, CCO and CAE, with the respective global business head and/or country CEO present, in readiness for their presentation to the board of directors. This facilitated a holistic view on each unit and global business' risks by the committee before a more strategic and business driven discussion was held at the board meeting.
•Oversaw the risks associated with PagoNxt and Digital Consumer Bank, and reviewed specific deep dives on financial crime and money laundering prevention, IT obsolescence, climate change and model risk. As part of that, specific deep-dives were scheduled throughout the year to facilitate discussion and oversight of these risks.
•Monitored the Group’s top risks, early warning indicators and mitigation actions to manage risks and the Group's risk profile effectively and within risk appetite.
•Identified emerging and non-traditional risks to anticipate potential impacts on our business model. In particular, the committee held a strategy session where those items were covered, with a key focus on the geopolitical risks and regulatory and supervisory developments.
•Enhanced coordination and information exchange with core units and divisions, with Group and subsidiary-level committee Chairs taking part in each other’s risk supervision, regulation and compliance committee meetings. As part of that, a convention of the Chairs of the risk supervision, regulation and compliance committees of the Group was held at our headquarters to discuss global initiatives, expectations and common relevant issues for them.
•Monitored and oversaw the smooth transition of the new CRO and ensured that his onboarding was robust and effective, enabling him to be truly effective in his role. He attended all the 2023 committee meetings and frequently met with the committee Chair.
•Remained focused on the overall effectiveness of the committee, ensuring that its role is discharged in the most tangible and effective manner. Specifically, the committee considered the findings and suggested areas for improvement resulting from the 2022 internal board effectiveness review concerning its remit.
2024 Priorities
The committee set the following priorities for 2024:
•Continue to supervise and monitor the macroeconomic conditions, especially interest rates, the consequences of the energy crisis, inflation and the geopolitical landscape, including armed conflicts.
•Continue to monitor all risks of the Group, with specific focus on credit, operational, market, model, IT, cyber and risk derived from emerging technologies such as artificial intelligence and financial crime compliance, to ensure that those risks remain within our approved risk appetite. In addition, continue to identify the emerging and non-traditional risks in order to anticipate potential impacts on our business model.
•Supervise the main risks associated with the transformation and the five global businesses, ensuring that we maintain and even strengthen risk management under the new organization, at any time.
•Promote ongoing communication mechanisms between the Chair of the risk supervision, regulation and compliance committees of the Group and her counterparts in the subsidiaries to discuss areas of mutual interest, including risks that may have a greater impact at a Group level, exchange concerns and best practices.
•Remain focused on the overall effectiveness of the committee, ensuring that its role is discharged in the most tangible and effective manner.
240
4.9 Responsible banking, sustainability and culture committee activities in 2023
| initiatives to effectively integrate green finance within risk management. Furthermore, the inevitable range of challenges faced in the countries where Santander is present (geopolitical environment, regulatory fragmentation, different governmental support, etc) were considered by the committee to ensure the right approach to achieve the best possible outcomes, including achieving our established targets. In addition, education and our communities also remained high on our agenda. We further reinforced our working relationship with the audit committee by reviewing the preparation and presentation of non-financial information according to the applicable regulations and international standards. Members’ skills and experience helped the committee to operate effectively and to provide appropriate constructive challenge to management, and to assist the board with the significant ESG challenges ahead. In addition, we shared concerns and views with our subsidiary responsible banking, sustainability and culture committees throughout the year, which enabled us to harness their vast collective expertise. Going forward, we will remain focused on progressing our climate change strategy and monitoring the development of our green and sustainable finance proposition."  | |||||||||||||
Ramiro Mato Chair of the responsible banking, sustainability and culture committee | ||||||||||||||
"As in previous years, the committee´s main focus was to assist the board in driving ESG to build a more responsible bank. As part of this, in 2023 we have remained focused on delivering our Net Zero ambition by 2050, while we continue helping customers transition to a low carbon economy, developing best-in-class sustainable propositions, and doing things in a Simple, Personal and Fair way. Specifically, the committee oversaw actions, recommendations and targets to help Santander to become a global leader in green finance and an engine of profitable growth for the Group, helping our clients in their green transition. The committee monitored progress and key | ||||||||||||||
| COMPOSITION | ||
| Position | Category | Appointed on | |||||||||
Chair | Ramiro Mato | Independent | 01/07/2018A | ||||||||
| Members | Homaira Akbari | Independent | 01/07/2018 | ||||||||
| Sol Daurella | Independent | 01/07/2018 | |||||||||
| Gina Díez Barroso | Independent | 31/01/2023 | |||||||||
Belén Romana | Independent | 01/07/2018 | |||||||||
| Secretary | Jaime Pérez Renovales | ||||||||||
A. Committee Chair since 1 July 2018.
The board of directors appointed the committee's members based on their expertise, skills and experience in the matters the committee handles. For more details, see section 4.1 'Our directors' and 'Board and committees skills and diversity matrix' in section 4.2.
| TIME ALLOCATION | ||
In 2023, the committee held six meetings. See 'Board and committee preparation and attendance' in section 4.3 for members’ attendance and the estimated average time each one spent on meeting preparation and attendance.
The chart below shows the committee’s approximate time allocation in 2023:
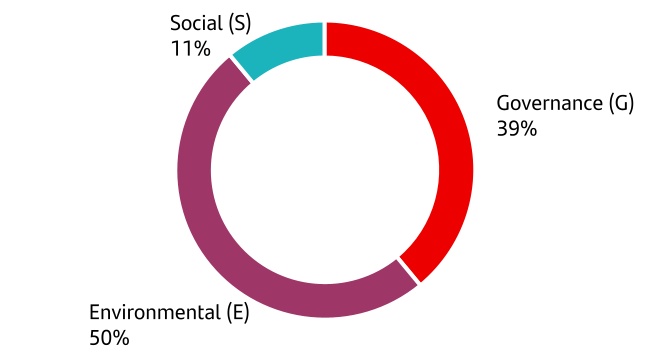
241
Duties and activities in 2023
This section summarizes the responsible banking, sustainability and culture committee’s activities in 2023.
| Duties | Actions taken | |||||||
| Environmental (E) | ||||||||
| Portfolio alignment with Net Zero by 2050 | •Reviewed the Group's climate change strategy, providing challenge to it to ensure that it remained a key enabler to achieve our ambition of net zero emissions by 2050. •Reviewed decarbonization targets in the thermal coal, power generation, energy (oil and gas), aviation and steel sectors and discussed and recommended to the board for approval new decarbonization targets for auto manufacturers (SCIB) and auto lending portfolio in Europe (SCF). •Reviewed the decarbonization plans of the subsidiaries, covering activity regarding mortgages, commercial real estate and agriculture to further develop our roadmap towards net zero while we address supervisory expectations. •Endorsed the Group priorities for 2023 in relation to responsible banking, including supporting our customers in their green transition and promoting a sustainable culture. •Reviewed actions proposed to align with the Task Force on Climate-Related Financial Disclosures (TCFD) recommendations and the transition plans and its communication needed in relation to the Glasgow Financial Alliance for Net Zero (GFANZ). | |||||||
| ESG in risk management | •Reviewed ESG factors introduced in the credit approval process, associated action plans and related achievements. •Reviewed the proposed risk appetite statement to support the reduction of carbon emissions relative to thermal coal, power generation, energy (oil and gas), aviation and steel sectors. | |||||||
| Green Finance | •Review the green finance strategy and its execution, including the Group´s exposure in green finance more generally. | |||||||
| Biodiversity | •Reviewed a disclosure proposal concerning Banco Santander's position on nature and biodiversity and submitted it to the board of directors for approval. •Reviewed Santander's participation with respect to the Febraban Protocol, which includes standards for managing the risk of illegal deforestation in Brazil and defines guidelines to be adopted by its signatories. | |||||||
| Environmental Footprint | •Reviewed our 2022-2025 Environmental Footprint Plan and carbon emissions offset criteria. •Monitored carbon footprint offsetting projects across the Group to fulfil public targets. | |||||||
| Regulatory landscape | •Reviewed the main European and international financial regulatory and supervisory initiatives and priorities related to ESG under discussion for 2023 and 2024, to maximize investment in the transition to a low carbon economy by 2050 and increase transparency on business models and operations. | |||||||
| Social (S) | ||||||||
Social agenda | •Reviewed our social agenda, which includes financial inclusion; financial health; business with social output; and corporate social responsibility or philanthropic activities. | |||||||
| Education and other support to communities | •Reviewed the strategy, objectives, and performance indicators in relation to Universia's activity in the communities, in the context of the Group's social agenda, which includes our support to universities in education, employability and entrepreneurship. •Reviewed and challenged communication strategy in relation to universities. | |||||||
242
| Duties | Actions taken | |||||||
| Governance (G) | ||||||||
| Corporate governance | •Assisted the board in ensuring that responsible banking targets and metrics were embedded in the Group's remuneration schemes. As part of that, reviewed, in coordination with the remuneration committee, a proposal to further increase the alignment of the long-term incentive for 2023-2025 with our ESG agenda. •Monitored and assessed the Group's progress on its public targets to ensure that its KPIs remained relevant and aligned with committee expectations. •Worked with the risk supervision, regulation and compliance committee to review the progress made in embedding climate-related and environmental risks, as well as to monitor the implementation of controls and processes to mitigate ESG risks, including greenwashing. •Reviewed responsible banking progress in the regions, units, global businesses and corporate areas on a regular basis to ensure best practices globally. •Identified priority ESG areas for action based on the outcomes of a materiality assessment exercise, which the Responsible Banking team conducts every year. •Verified that the proposed responsible banking agenda and targets remain aligned with Santander´s strategy. •Reviewed ESG global ratings' assessments of Banco Santander, identifying strengths, areas for improvement and areas of focus. Reviewed any resultant action plans after engaging with investors and NGOs on ESG matters. •Reviewed reports on customer complaints, their causes and associated action plans launched to reduce and mitigate the identified deficiencies, in coordination with the risk supervision, regulation and compliance committee. •Revised the environmental, social and climate change risk management policy and the responsible banking and sustainability policy. | |||||||
| ESG reporting | •Supported the audit committee on the supervision and assessment of the process of preparation and presentation of non-financial information according to the applicable regulations and international standards. •Reviewed the 2023 Group statement on non-financial information and the independent expert's report. See the 'Responsible banking' chapter. •Reviewed the Climate Finance Report in coordination with the audit committee, prior to its submission to the board for approval, including new targets for the energy, metal and aviation sectors, the action plan for the power generation sector and the disclosures for nature and biodiversity. •Reviewed the Green Bond Report in coordination with the audit committee, prior to its submission to the board for approval. •Analysed industry practices in ESG reporting under the Pilar III framework. | |||||||
Others | •The Chair of the committee periodically reported on its activities to the risk supervision, regulation and compliance committee. •Invited subsidiary responsible banking, sustainability and culture Chairs to specific committee meetings throughout the year and, in turn, the committee Chair attended specific subsidiary responsible banking, sustainability and culture committee meetings to further enhance communication between them. | |||||||
| Information for general meetings and corporate documents | ||||||||
| Shareholder information | •Was represented by Ramiro Mato, in his capacity as committee Chair, to report at the 2023 AGM committee's activities in 2022. | |||||||
Corporate documents for 2023 | •Prepared this activities report on 13 February 2024, which includes a performance review of the committee's functions and key priorities identified for 2024. The board of directors approved it on 19 February 2024. | |||||||
243
Achievement of 2023 objectives
The committee took these actions planned for 2023:
•Continued to advise the board on the climate change strategy and our ambition to be net zero by 2050, monitoring the development of our green and sustainable finance proposition and customers’ transition to a low-carbon economy. As part of that, the committee oversaw progress in relation to the implementation of the TCFD recommendations, including the introduction of targets to reduce emissions in certain climate-intensive sectors and the decarbonization plans. As part of that, the committee considered the challenges that the overall economic and geopolitical context entail in this respect.
•Continued to monitor financial health and financial inclusion by reviewing the progress made on specific social metrics and KPIs, such as people financially included in the year and microcredits provided to microentrepreneurs.
•Reviewed the Group's performance assessed by ESG analysts, and supervised the actions for improvement in this respect.
•Monitored the implementation of enablers to further embed ESG in the business and business-as-usual, including Banco Santander's performance of our responsible banking targets and KPIs.
•Provided support to the board in analysing and providing feedback on ESG information for reporting, disclosure, and management purposes, in coordination with the audit committee. Specific updates were provided by the Group's CAO in this respect, with a special focus on the enhancements and progress made by the different units.
•Remained focused on the overall effectiveness of the committee, ensuring that its role is discharged in the most tangible and effective manner. Specifically, it considered the findings and suggested areas for improvement resulting from the 2022 internal board effectiveness review concerning its remit.
2024 Priorities
The committee set the following priorities for 2024:
•Continue to advise the board on the climate change strategy and our ambition to be net zero by 2050, monitoring the development of our green finance proposition and how the global businesses support our customers’ transition to a low-carbon economy.
•Oversee that actions and targets for climate material exposure and decarbonization strategy are consistent with the TCFD recommendations and support the delivery of our public targets.
•Continue to focus on our sustainable finance proposition to continue promoting customer welfare.
•Analyse the heterogeneity in public policies and actions of authorities and institutions in the countries across our footprint, as well as their associated risks, and the potential impact on our ESG strategy.
•Continue to enhance data quality and monitor ESG disclosures and associated strategy in coordination with the audit committee, in order to meet increasing expectations from stakeholders in the current complex legislative framework.
•Remain focused on the overall effectiveness of the committee, ensuring that its role is discharged in the most tangible and effective manner.
244
4.10 Innovation and technology committee activities in 2023
| Cybersecurity and data strategy remained a top priority of our agenda during the year, recognising the importance of having adequate defences and security controls in place against increasing threats; and how data contributes to improve business growth and customer experience. In addition, we addressed the challenges and opportunities that artificial intelligence poses to the Group, ensuring that its use promotes effective risk management. In the coming year, we will continue to focus on how innovation and technology can help us deliver on our strategic ambitions, particularly linked to our newly created Retail & Commercial Banking and Digital Consumer Bank global businesses. An appropriate mix of members’ skills ensured that the committee remained well positioned to fulfil its responsibilities and operate effectively. I would like to thank Bruce Carnegie-Brown, who left the committee in October 2023, for his hard work, contribution, and commitment."  | |||||||||||||
Ana Botín Chair of the innovation and technology committee | ||||||||||||||
"We aim to be the best open financial services platform by acting responsibly. We continued our work on enhancing our technology capabilities to drive the improvement of our customer’s experience when banking with us, while delivering significant efficiencies through cutting-edge technologies and end-to-end automation. In this regard, we remained focused on overseeing the execution and progress of One Transformation and its overall alignment with the 2023 Investor Day targets and the Group’s strategy. | ||||||||||||||
| COMPOSITION | ||
Position | Category | Appointed on | |||||||||
Chair | Ana Botín | Executive | 23/04/2007A | ||||||||
Members | Homaira Akbari | Independent | 27/09/2016 | ||||||||
José Antonio Álvarez | Other external | 23/02/2015 | |||||||||
Henrique de Castro | Independent | 23/07/2019 | |||||||||
| Héctor Grisi | Executive | 01/01/2023 | |||||||||
| Glenn Hutchins | Independent | 20/12/2022 | |||||||||
Belén Romana | Independent | 19/12/2017 | |||||||||
Secretary | Jaime Pérez Renovales | ||||||||||
A. Committee Chair since 19 April 2022.
The board of directors appointed the committee’s members based on their expertise, skills and experience in the matters the committee handles. For more details, see section 4.1 'Our directors' and 'Board and committees skills and diversity matrix' in section 4.2.
| TIME ALLOCATION | ||
In 2023, the committee held four meetings. See 'Board and committee preparation and attendance' in section 4.3 for members’ attendance and the estimated average time each one spent on meeting preparation and attendance.
The chart below shows the committee’s approximate time allocation in 2023:
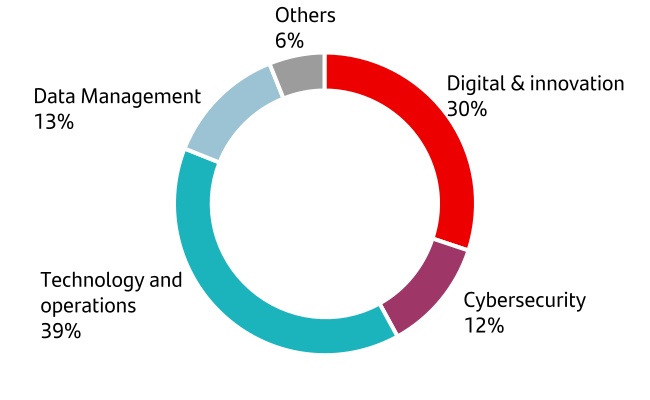
245
Duties and activities in 2023
This section summarizes the innovation and technology committee’s activities in 2023.
| Duties | Actions taken | |||||||
| Digital & innovation | ||||||||
| Digital | •Monitored metrics in connection with the digital evolution and associated transformation, with a special focus on customer experience, simplification and efficiency. •Reviewed core digital strategies to transform the business and accelerate new businesses growth. •Reviewed strategic technological tools developed internally to further increase value creation across the Group, improving efficiency and driving appropriate synergies. •Reviewed the execution and progress of One Transformation and its overall alignment with our strategy and targets disclosed at the 2023 Investor Day. | |||||||
| Cloud | •Reviewed the cloud strategy focused on improving innovation, time–to-market and efficiency with a business-based approach. | |||||||
| Innovation framework | •Reviewed the implementation of the technological and strategic plan and Group's innovation agenda, leveraging on our digital and data management capabilities. •Identified the challenges and capabilities in terms of innovation in order to increase end-to-end business agile transformation. •Identified new opportunities for accelerated innovation across the Group and increased the likelihood of success in new business models, technologies, systems and platforms. | |||||||
| Technology and operations | ||||||||
| Technology and operations (T&O) | •Assisted the board in supervising technological risks in coordination with the risk supervision, regulation and compliance and audit committees. •Reviewed the global technology strategy plan, reported to the board on T&O planning and activities, and ensured that T&O strategy was properly focused on the Group's relevant priorities, supervising its execution progress through defined top-level strategic KPIs, including those specific to the execution of One Transformation. •Endorsed the Group's core strategic technology priorities to integrate key digital capabilities, leveraging five pillars: agile, cloud, core systems evolution, artificial intelligence and deep technology related skills and data. •Continued to oversee the implementation of a new operating model and a common architecture. •Analysed the priorities of the T&O function and specifically, their alignment with the Group’s ambition to become a 'digital bank with branches', with a special focus on the contact centres’ contribution for such purposes and alternatives for further optimization, simplification and improvement of processes. | |||||||
| Cybersecurity | ||||||||
| Strategy | •Reviewed the cybersecurity strategy and the progress made on its main action lines: protecting the Group, bolstering its defences, and generating trust among stakeholders, customers, and society in general. •Monitored the status and progress made on the fraud prevention plan, including its associated impacts and the actions underway to further harmonize fraud prevention capabilities across the Group. | |||||||
| Risk management oversight | •Assisted the board in the supervision of cybersecurity risks in coordination with the risk supervision, regulation and compliance and audit committees. •Supervised defences against increasing threats and reviewed security controls and automated security processes. •Analysed cyber incidents and specific incidents outside the Group according to their relevance and impact, as appropriate. •Monitored closely the global cybersecurity threat landscape and continued to monitor the associated impacts of the Ukraine war and the conflict in the Middle East. •Received quarterly updates on cybersecurity risks, with a special focus on crisis simulation exercises and internal data leakage protection. •Reviewed external threats such as ransomware and analysed the strategy designed to shorten data recovery time and reduce its potential impact. | |||||||
| Data management | ||||||||
Data management | •Reviewed data management strategy and the Models & Data unit's priorities for the year, focusing on the business model and how data contributes to improve the business growth and customer experience. •Reviewed the Group approach to artificial intelligence usage based on a specific governance and risk management framework. | |||||||
246
| Duties | Actions taken | |||||||
| Information for general meetings and corporate documents | ||||||||
Corporate documents for 2023 | •Prepared this activities report on 25 January 2024, which includes a performance review of the committee's functions and key priorities identified for 2024. The board of directors approved it on 19 February 2024. | |||||||
Achievement of 2023 objectives
The committee took these actions planned for 2023:
•Reviewed the Group innovation strategy, driving support and coordination to the global businesses and to the development of a global technologic platform.
•Continued to review the effectiveness of data management and analytics as enablers for the Group to fulfil strategic priorities, focusing on the main business use cases and the use of the artificial intelligence considering the international advisory board´s feedback, amongst others, to ensure appropriate support to the Group´s strategy.
•Continued to strengthen the Group’s cybersecurity and fraud ecosystems, proposing strategies to respond to a constantly changing threat environment, while creating additional commercial value and a safe environment for clients.
•Continued to assess and provide suggestions on initiatives, targets, commitments, KPIs and proposed metrics on cross-cutting projects that conformed with the Group's digital strategy, reviewing them to ensure full alignment with the operating model of the Group.
•Remained focused on the overall effectiveness of the committee, ensuring that its role is discharged in the most tangible and effective manner. Specifically, the committee considered the findings and suggested areas for improvement resulting from the 2022 internal board effectiveness review concerning its remit.
2024 Priorities
The committee set the following priorities for 2024:
•Continue to support the Group’s innovation strategy, aligned with our global businesses, to develop our five technological pillars, supported by our operating model, common architecture and global platforms.
•Continue to drive a culture of innovation that positions data and analytics at the core of our business strategy while meeting regulatory expectations on data management and taking advantage of the benefits of using artificial intelligence.
•Continue to evolve our cyber security defences, with a special focus on emerging threats, as well as to continue to monitor the implementation of the technology and operations transformation model.
•Remain focused on the overall effectiveness of the committee, ensuring that its role is discharged in the most tangible and effective manner.
4.11 International advisory board
Composition
| Position | Background | |||||||
Chair | Larry Summers | Former Secretary of the US Treasury and President Emeritus and Charles W. Eliot University Professor of Harvard University | ||||||
| Members | Sheila C. Bair | Former Chair of the Federal Deposit Insurance Corporation and former President of Washington College | ||||||
Mike Rhodin | Supervisory board member of TomTom and director of HzO. Former IBM Watson Senior Vice President | |||||||
Francisco D’Souza | Managing Partner and co-founder at Recognize | |||||||
James Whitehurst | Senior Advisor at IBM and former CEO of Red Hat | |||||||
George Kurtz | CEO and co-founder of CrowdStrike. Former Chief Technology Officer of McAfee | |||||||
Nadia Schadlow | Former Deputy National Security Advisor for Strategy and former Assistant to the President of the United States | |||||||
| Andreas Dombret | Former board member of Deutsche Bundesbank, of Supervisory Board of the ECB and of Bank International Settlements and former Vice Chair of Bank of America in Europe | |||||||
Carolyn Everson | Director at The Coca-Cola Company and The Walt Disney Company. Former chair of Instacart and former vice-president of Global Business Group at Facebook (Meta) | |||||||
Juan Ignacio Gallardo Thurlow | Chair of Organización Cultiba, Grupo Azucarero México and Grupo GEPP (PepsiCo bottling company in Mexico) | |||||||
Secretary | Jaime Pérez Renovales | |||||||
Functions
Since 2016, Banco Santander’s international advisory board has provided the Group with expert insight into innovation, digital transformation, cybersecurity, new technologies, capital markets, corporate governance, branding, reputation, regulation and compliance.
Its members are external and not members of the board. They are prominent and respected leaders who have extensive experience in the most relevant areas for the strategy of the Group, particularly in terms of innovation, digital transformation and the US and European markets.
Meetings
The international advisory board meets at least twice a year. In 2023, it met in May and October. It addressed key strategic trending topics for the near future within the overall context of our transformation agenda and our global-local organization with five global businesses. In particular, it covered specific topics such as the advantages and repercussion of the use of
247
artificial intelligence in the financial sector; our brand and its strategic implications; digital assets, crypto trends and business opportunities; the overall global business structure and the cyber threat landscape, amongst others.
4.12 Related-party transactions and other conflicts of interest
Related-party transactions
This section contains the related-party transactions report referred to in recommendation six of the CNMV´s Corporate Governance Code, the audit committee prepared on 13 February 2024.
Directors, senior managers and shareholders
Pursuant to the Rules and regulations of the board, a transaction that Banco Santander or its subsidiaries make with directors, shareholders who hold at least 10% of voting rights or sit on the board, and parties considered "related parties" under the International Financial Reporting Standards must be authorized:
•In the general meeting if it is worth 10% or more of assets on the last consolidated balance sheet; or
•By the board of directors in all other cases. Nonetheless, according to relevant rules and on the audit committee’s recommendation, our board delegated authority to executive bodies, committees and competent proxies to approve related-party transactions if they:
•are carried out under agreements with standard terms that would generally apply to customers who contract for the same product or service;
•are made at prices or rates set by the supplier of such products or service or, where such products or service have no existing prices or rates, under regular market conditions as in business relations with similar customers; and
•do not exceed 0.5% of the net annual income as stated in the last consolidated financial statements approved at the general meeting.
The board approved an internal reporting and monitoring procedure in which the audit committee confirms twice a year that such transactions authorized with delegated board powers are fair and transparent and meet the above-mentioned requirements.
The board also has an internal approval mechanism for non-banking and other transactions that do not meet the delegation requirements. It sets out minimum transaction terms and conditions in order to protect corporate and shareholder interests.
The board and audit committee check that transactions with related parties are fair and reasonable to Banco Santander and to the other shareholders.
If a related-party transaction must be approved at the general meeting or by the board, the law says that audit committee must issue a preliminary report about it. However, the law does not require the report for related-party transactions if they are
approved under the board's delegated authority and meet the audit committee’s requirements.
Board members must recuse themselves from all deliberations and votes on resolutions about a related-party transaction if they have a conflict of interest with it.
In 2023, the audit committee found that no director or related party, in the terms of International Financial Reporting Standards, carried out transactions deemed 'significant' or material to Santander and the related party, or under non-market conditions.
The audit committee confirmed that all related-party transactions in 2023 had been performed correctly after conducting a bi-annual review on their conformity to the law, the Rules and regulations of the board and the conditions set by board resolution, and met the requirements to be considered fair, reasonable and under market conditions (see the audit committee activities report under section 4.5 'Audit committee activities in 2023').
Banco Santander has a policy for the admission, authorisation and monitoring of financing transactions to directors and senior managers as well as to their spouse (or similar partner), a child who is a minor or legal adult and their financial dependent, or a company controlled by a director or a senior manager whose business is to hold assets for the sole purpose of managing their personal or family wealth. The policy applies to financing transactions carried out by Banco Santander, or any of its subsidiaries, and sets out general maximum borrowing rules, interest rates and other conditions that apply to related-party transactions, which are the same for all other employees. It dictates that the board must authorize loans, credit facilities and guarantees extended to Banco Santander's directors and senior managers, and, except the cases listed below, subsequently by the ECB:
•Transactions guaranteed in a collective agreement signed by Banco Santander, with similar terms and conditions to transactions with any employee.
•Transactions made under agreements with standard conditions that generally apply to a large number of customers, if the amount granted to the beneficiary or their related parties does not exceed EUR 200,000.
Note 5.f) 'Loans' to the consolidated financial statements describes the direct risk Grupo Santander maintained with board members as at 31 December 2023. Those transactions are consistent with market conditions, have the same terms and conditions as transactions with employees, and allocate payments in kind where appropriate.
No Banco Santander shareholder holds 10% or more of voting rights or has a seat on the board.
Intra-group transactions
The law does not consider direct or indirect transactions with a wholly-owned subsidiary or investee to be "related-party" if no party related to Banco Santander holds an interest in it. To this end, Santander monitors subsidiaries or investees’ observance of these rules if they can be affected by related-party transactions. The rules and approval bodies and procedures that apply to intragroup transactions are the same as for
248
transactions with customers to make sure they are conducted at market prices and conditions.
Note 53 'Related parties' to the consolidated financial statements and note 47 'Related parties' to the individual financial statements state the balance of transactions with subsidiaries, affiliates, jointly-owned entities, directors, senior managers and related parties.
Other conflicts of interest
Banco Santander has rules and procedures for preventing and managing conflicts of interest that can arise from operations or with directors and senior managers. We also have an internal policy for Group employees, directors and entities on preventing and managing conflicts of interest.
Directors and senior managers
Our directors must adopt necessary measures to avoid situations in which their direct or indirect interests may enter into conflict with corporate interests or their duty towards Banco Santander.
Directors must refrain from using Santander’s name or their position to exert undue influence on private transactions; using corporate assets for private purposes; using business opportunities for personal gain; obtaining favours or remuneration from others for being directors; and engaging in activities for themselves or others that will put them and Banco Santander in competition or permanent conflict.
Directors must report to the board conflicts of interest that they or their related parties may have with Banco Santander, which are to be disclosed in the financial statements. The nomination committee verifies compliance with the rules set from time to time to avoid potential conflicts of interest in other roles held by directors.
In 2023, no director reported a conflict of interest with Santander. Nonetheless, there were 52 abstentions in votes on matters deliberated at board and committee meetings, including 28 instances where directors did not vote on resolutions on nominations, re-elections or board committee assignments; 10 instances concerning remuneration; four instances relating to a transaction between Banco Santander and a director or a close relative of a director; and 10 instances where directors removed themselves during the review of their status and suitability.
The Code of conduct in security markets (CCSM), which directors and senior managers follow, provides mechanisms to recognize and resolve conflicts of interest. It also dictates that directors and senior managers must provide the Compliance & Conduct area with a statement on their relations, and they must keep it up to date.
They must also disclose any matter that could put them in a conflict of interest because of their ties or otherwise, and the chief officer of their area will resolve it. Conflicts that involve several areas must be resolved by their common senior officer. In other cases, the Compliance & Conduct area should be consulted.
The CCSM also dictates that directors, senior managers and related parties should not trade Grupo Santander’s securities within 30 days either from the time they are bought or sold or
before the quarterly, half-year or annual results are announced and published.
The CCSM can be found on our corporate website.
Group companies
Banco Santander is the Group’s only company listed in Spain, where it’s not required to have mechanisms in place to resolve conflicts of interest with a listed subsidiary.
In a conflict of interest with a listed subsidiary, Banco Santander, as the parent company, must consider the interests of all its subsidiaries and how the conflict may affect the long-term interests of the Group. Subsidiaries should also consider the interests of Grupo Santander when making decisions within their competence.
The Group structures governance on a system of rules that guarantees regulation on governance as well as proper oversight over subsidiaries (see section 7. 'Group structure and internal governance').
249
5. Senior management team
The table below shows the profiles of Banco Santander’s Senior Executive Vice Presidents. It does not include executive directors, whose profiles are described in section 4.1 'Our directors').
Name | Position | Profile | |||||||||
Mahesh Aditya | GROUP CHIEF RISK OFFICER | Born in 1962, Mahesh Aditya joined Grupo Santander in 2017 as Chief Operating Officer of Santander Holdings USA. He became Chief Risk Officer in 2018 and Chief Executive Officer of Santander Consumer USA in 2019. Previously, he had been Chief Risk Officer at Visa (2017-2019) and Chief Risk Officer of Retail & Mortgage Banking at JP Morgan, Capital One and Citibank. He was appointed Group Chief Risk Officer in 2023. | |||||||||
Daniel Barriuso | GLOBAL HEAD OF RETAIL & COMMERCIAL BANKING AND GROUP CHIEF TRANSFORMATION OFFICER | Born in 1973, Daniel Barriuso joined Grupo Santander in 2017 as Global Head of Cyber Security (CISO) and Fraud Prevention. In 2023, he was named Senior Executive Vice President, Chief Transformation Officer, and Global Head of Retail and Commercial Banking. Previously, he had held several executive roles at BP, Credit Suisse and ABN AMRO. | |||||||||
Alexandra Brandão | GROUP HEAD OF HUMAN RESOURCES | Born in 1978, Alexandra Brandão joined Grupo Santander in 2003 as Head of Products and Services for Individuals at Santander Totta. She was Global Head of Knowledge and Development at the Grupo Santander Corporate Centre (2012-2016); Head of Human Resources (2016-2018); and Head of Commercial Management and Segments at Santander Portugal (2019-2020). She was appointed Group Head of Human Resources in 2021. | |||||||||
| Juan Manuel Cendoya | GROUP HEAD OF COMMUNICATIONS, CORPORATE MARKETING AND RESEARCH | Born in 1967, Juan Manuel Cendoya joined Grupo Santander in 2001 as Senior Executive Vice President and Group Head of the Communications, Corporate Marketing and Research division. In 2016, he was appointed Vice Chair of the board of directors and Head of Institutional and Media Relations of Santander España. Previously, he had been Head of the Legal and Tax department of Bankinter, S.A. He is also a State Attorney for Spain. | |||||||||
| José Doncel | GROUP CHIEF ACCOUNTING OFFICER | Born in 1961, José Doncel joined Grupo Santander in 1989 as Head of Accounting. He had also served as Head of Accounting and Financial Management at Banesto (1994-2013). He was appointed Senior Executive Vice President and Head of the Internal Audit division in 2013 and Group Chief Accounting Officer in 2014. | |||||||||
| José Antonio García Cantera | GROUP CHIEF FINANCIAL OFFICER | Born in 1966, José Antonio García joined Grupo Santander in 2003 as Senior Executive Vice President of Global Wholesale Banking of Banesto and was appointed CEO in 2006. Previously, he had served on the executive committee of Citigroup EMEA, as well as on the board of directors of Citigroup Capital Markets, Ltd and Citigroup Capital Markets UK. He was appointed Senior Executive Vice President of Global Corporate Banking in 2012 and Group Chief Financial Officer in 2015. | |||||||||
| Juan Guitard | GROUP CHIEF AUDIT EXECUTIVE | Born in 1960, Juan Guitard joined Grupo Santander in 1997 as Head of Human Resources at Santander Investment, S.A. and was also General Counsel and secretary of the board of Santander Investment, S.A. and Banco Santander de Negocios, S.A. In 2002, he was appointed Vice General Counsel of Banco Santander. In 2013, he was Head of Banco Santander’s Risk division. In 2014, he was appointed Group Chief Audit Executive. He is also a State Attorney for Spain. | |||||||||
250
| José María Linares | GLOBAL HEAD OF CORPORATE & INVESTMENT BANKING | Born in 1971, José María Linares joined Grupo Santander in 2017 as Senior Executive Vice President and Global Head of Corporate and Investment Banking. Previously, he served as an equity analyst at Morgan Stanley & Co. (1993-1994). He worked as Senior Vice President and senior equity analyst at Oppenheimer & Co. (1994-1997), as well as director and senior equity analyst at Société Générale (1997-1999). He joined J.P. Morgan in 1999 and was subsequently appointed managing director and Head of Global Corporate Banking at J.P. Morgan Chase & Co. (2011-2017). | |||||||||
| Mónica López-Monís | GROUP HEAD OF SUPERVISORY AND REGULATORY RELATIONS | Born in 1969, Mónica López-Monís joined Grupo Santander in 2009 as General Counsel and secretary of the board of Banesto. Previously, she had been General Counsel at Aldeasa, S.A. She also was General Counsel at Bankinter, S.A., as well as independent director at Abertis Infraestructuras, S.A. In 2015, she was appointed Senior Executive Vice President of Banco Santander and Group Chief Compliance Officer until her appointment in 2019 as Group Head of Supervisory and Regulatory Relations. She is also a State Attorney for Spain. | |||||||||
| Dirk Marzluf | GROUP CHIEF OPERATING & TECHNOLOGY OFFICER | Born in 1970, Dirk Marzluf joined Grupo Santander in 2018 as Senior Executive Vice President and Head of IT and Operations. Previously, he had held several roles at AXA Group, where he became CIO, leading the insurance group’s technology and information security transformation and co-sponsoring its digital strategy. He also held global senior management roles at Accenture, Daimler Chrysler and Winterthur Group. | |||||||||
| Víctor Matarranz | GLOBAL HEAD OF WEALTH MANAGEMENT & INSURANCE | Born in 1976, Víctor Matarranz joined Grupo Santander in 2012 as Head of Strategy and Innovation at Santander UK. In 2014, he was appointed Senior Executive Vice President and Head of the Executive Chairman’s Office and Strategy until his appointment in 2017 as global Head of Wealth Management & Insurance. Previously, he held several management roles at McKinsey & Company, where he had become partner. | |||||||||
| José Luis de Mora | GLOBAL HEAD OF DIGITAL CONSUMER BANK AND GROUP HEAD OF CORPORATE DEVELOPMENT AND FINANCIAL PLANNING | Born in 1966, José Luis de Mora joined Grupo Santander in 2003 to Head the Group’s Strategic Plan Development and Acquisitions. In 2015, he was appointed Senior Executive Vice President and Group Head of Financial Planning and Corporate Development. In 2020, he was named Head of Consumer Finance (now Digital Consumer Bank). He was also Head of Strategy (2019-2023). | |||||||||
| Jaime Pérez Renovales | GROUP GENERAL COUNSEL | ||||||||||
| Marjolein van Hellemondt-Gerdingh | GROUP CHIEF COMPLIANCE OFFICER | Born in 1964, Marjolein van Hellemondt-Gerdingh joined Grupo Santander in 2019 as Senior Executive Vice President and Group Chief Compliance Officer. Previously, she had been Chief Compliance Officer of several banking and financial entities such as NN Group, Zurich Insurance Company and De Lage Landen International B.V. | |||||||||
251
6. Remuneration
Sections 6.1, 6.2, 6.3, 6.5, 6.6, 6.7, 9.4 and 9.5 comprise the annual report on directors’ remuneration that must be prepared and submitted to the consultative vote of the general shareholders' meeting.
In addition, sections 6.4 and 6.5 sets out the directors' remuneration policy for 2024, 2025 and 2026, which is to be put to a vote at the general shareholders' meeting, which is binding.
The annual report on directors' remuneration and the directors' remuneration policy for 2024, 2025 and 2026 were approved by our board of directors on 19 February 2024. All directors were present at the time of vote casting and voted in favour.
The remuneration policy for directors in force as of the date of this report is available on our corporate website.
6.1 Principles of the remuneration policy
Directors' remuneration in their capacity as such
The board of directors sets the individual remuneration of directors (including executive directors) for the performance of supervisory and collective decision-making duties within the amount fixed by shareholders and commensurately with the roles they perform on the collective decision-making body, their committee membership and attendance, and other objective circumstances the board might consider.
Remuneration of directors for executive duties
Banco Santander’s remuneration policy for executive duties (which also generally applies to Banco Santander employees) dictates that:
| 1 | Remuneration must be in line with shareholders and customers' interests, conducive to creating long-term value and compatible with our rigorous risk management, long-term strategy and values, as well as with maintaining a sound capital base. | |||||||
| 2 | Fixed remuneration must make up a significant proportion of total compensation. | |||||||
| 3 | Variable remuneration must reward performance for achieving individual, local company and, as the case may be, Group targets. | |||||||
| 4 | The global remuneration package and its structure must be competitive in order to attract and retain talent. | |||||||
| 5 | Remuneration decisions must be free of conflicts of interest and discrimination of any kind different from that based on the performance assessment of objectives and corporate behaviours. Remuneration must be free of gender-based bias and help eliminate inequalities that could result from it. | |||||||
The remuneration elements the policy lays down include necessary mechanisms to ensure remuneration will be conducive to achieving strategic and long-term sustainability objectives of the Bank.
Accordingly, it bases executive directors and senior managers’ variable pay on pre-determined, specific and quantifiable financial, sustainability-based and value-creation targets that are consistent with Banco Santander’s interests, including in regard to environmental, social and governance matters.
For more details, see section 6.3 about the policy's application in 2023 and section 6.4 about the remuneration policy for 2024 and subsequent years.
Lastly, the remuneration committee and the board enlisted the assistance of Willis Towers Watson to:
•Compare markets and entities similar to the Group in size, characteristics and operations using relevant data for setting remuneration.
•Analyse and confirm compliance with certain quantitative metrics required to evaluate accomplishment of objectives.
•Estimate the fair value of variable remuneration linked to long-term objectives.
6.2 Remuneration of directors for supervisory and collective decision-making duties: policy applied in 2023
A. Composition and limits
According to our Bylaws, the remuneration of directors in their roles consists of a fixed annual amount set at the general shareholders' meeting. This amount remains in effect until shareholders vote to amend it, even though the board may reduce it in the years it deems appropriate. At the annual general shareholders' meeting, remuneration for 2023 was set at EUR 6 million, which included (a) annual allotment and (b) attendance fees.
Santander has taken out a civil liability insurance policy for directors and other executives of the Group, subject to usual terms proportionate to its circumstances.
252
Directors can receive shares, share options or other forms of share-based compensation, subject to prior approval at the general meeting. Directors can also receive other compensation following a proposal made by the remuneration committee and upon resolution by the board of directors, as may be deemed appropriate, in consideration for the performance of other duties in Banco Santander, whether they are executives duties or not, in addition to their oversight and collective decision-making as board members.
Non-executive directors do not have the right to receive any benefit on the occasion of their removal from office.
In 2023, we worked alongside an independent expert to conduct a comparative market analysis on the remuneration of non-executive board members at 20 banks across the world, including Santander’s nine official peers. This analysis concludes that the high dedication of Santander’s board members significantly exceeds the average time commitment of directors at the peer banks analysed, with the hourly rate thus standing between the 25th and the 50th percentile of the sample.
B. Annual allotment
Each director received the amounts for serving on the board and its committees and positions held in them included in the chart below for 2022 and 2023.
In accordance with the remuneration policy approved at the general shareholders' meeting on 31 March 2023, the annual allotment for board and committee membership (except for the executive committee) increased EUR 3,000 compared to the amounts for 2022. Applicable amounts were:
| Amount per director in euros | 2023 | 2022 | ||||||
| Members of the board of directors | 98,000 | 95,000 | ||||||
| Members of the executive committee | 170,000 | 170,000 | ||||||
| Members of the audit committee | 43,000 | 40,000 | ||||||
| Members of the nomination committee | 28,000 | 25,000 | ||||||
| Members of the remuneration committee | 28,000 | 25,000 | ||||||
| Members of the risk supervision, regulation and compliance committee | 43,000 | 40,000 | ||||||
| Members of the responsible banking, sustainability and culture committee | 18,000 | 15,000 | ||||||
| Members of the innovation and technology committee | 28,000 | 25,000 | ||||||
| Chair of the audit committee | 70,000 | 70,000 | ||||||
| Chair of the nomination committee | 50,000 | 50,000 | ||||||
| Chair of the remuneration committee | 50,000 | 50,000 | ||||||
| Chair of the risk supervision, regulation and compliance committee | 70,000 | 70,000 | ||||||
| Chair of the responsible banking, sustainability and culture committee | 50,000 | 50,000 | ||||||
| Chair of the innovation and technology committee | 70,000 | 70,000 | ||||||
Lead independent directorA | 110,000 | 110,000 | ||||||
| Non-executive Vice Chair | 30,000 | 30,000 | ||||||
A. Since 2015, Bruce Carnegie-Brown has been allocated EUR 700,000 (including annual allowances and attendance fees) in minimum total annual pay set for the lead independent director, for his services to the board and its committees, particularly as Chair of the nomination and remuneration committees and also as lead independent director; and for the required time and dedication to perform these roles. Bruce Carnegie-Brown has stepped down from his role of Lead Independent Director on 1 October 2023, when he has been succeeded in this position by Glenn Hutchins.
C. Attendance fees
Pursuant to resolutions approved by the board on the remuneration committee’s recommendations, attendance fees for board and committees meetings (with the exception of the executive committee, for which no fees are set) totalled the amounts included in the chart below for the last two years.
The fees have not been modified since 2016. And for 2023, the board voted to keep the same amounts set out in the 2022 policy.
| Attendance fees per director per meeting in euros | 2023 | 2022 | ||||||
| Board of directors | 2,600 | 2,600 | ||||||
| Audit committee and risk supervision, regulation and compliance committee | 1,700 | 1,700 | ||||||
| Other committees (excluding executive committee) | 1,500 | 1,500 | ||||||
253
D. Breakdown of Bylaw-stipulated emoluments
Total director Bylaw-stipulated emoluments and attendance fees received in 2023 amounted to EUR 5.3 million (EUR 4.7 million in 2022). This is 11% less than the amount approved at the general meeting. The increase compared to the previous year is mainly due to the fact that the executive committee has incorporated Hector Grisi as CEO of the Bank, and the higher number of board meetings and commissions held in 2023 (15 board meetings in 2023 versus 14 in 2022 and 67 board committee meetings in 2023 versus 62 in 2022, excluding executive committee meetings). Each director earned the following amounts for these items:
| Amount in euros | |||||||||||||||||||||||||||||||||||||||||||||||
| Directors | 2023 | 2022 | |||||||||||||||||||||||||||||||||||||||||||||
| Annual allotment | Board and committee attendance fees | Total By-law stipulated emoluments and attendance fees | |||||||||||||||||||||||||||||||||||||||||||||
Category | BoardG | EC | AC | NC | RC | RSRCC | RBSCC | ITC | Total | ||||||||||||||||||||||||||||||||||||||
| Ana Botín | Executive | 98,000 | 170,000 | — | — | — | — | — | 98,000 | 366,000 | 45,000 | 411,000 | 379,900 | ||||||||||||||||||||||||||||||||||
Héctor GrisiA | Executive | 98,000 | 170,000 | — | — | — | — | — | 28,000 | 296,000 | 43,500 | 339,500 | — | ||||||||||||||||||||||||||||||||||
| José Antonio Álvarez | Other external | 128,000 | 170,000 | — | — | — | — | — | 28,000 | 326,000 | 45,000 | 371,000 | 329,400 | ||||||||||||||||||||||||||||||||||
| Bruce Carnegie-Brown | Independent | 203,000 | 127,500 | — | 78,000 | 65,500 | — | — | 21,000 | 495,000 | 81,000 | 576,000 | 700,000 | ||||||||||||||||||||||||||||||||||
| Homaira Akbari | Independent | 98,000 | — | 43,000 | — | — | — | 18,000 | 28,000 | 187,000 | 78,000 | 265,000 | 243,800 | ||||||||||||||||||||||||||||||||||
Javier BotínB | Other external | 98,000 | — | — | — | — | — | — | — | 98,000 | 39,000 | 137,000 | 128,800 | ||||||||||||||||||||||||||||||||||
| Sol Daurella | Independent | 98,000 | — | — | 28,000 | 28,000 | — | 18,000 | — | 172,000 | 76,500 | 248,500 | 229,800 | ||||||||||||||||||||||||||||||||||
| Henrique de Castro | Independent | 98,000 | — | 43,000 | — | 28,000 | — | — | 28,000 | 197,000 | 86,800 | 283,800 | 261,100 | ||||||||||||||||||||||||||||||||||
| Gina Díez | Independent | 98,000 | — | — | 28,000 | — | — | 16,550 | — | 142,550 | 67,500 | 210,050 | 171,800 | ||||||||||||||||||||||||||||||||||
| Luis Isasi | Other external | 98,000 | 170,000 | — | — | 28,000 | 43,000 | — | — | 339,000 | 77,800 | 416,800 | 411,600 | ||||||||||||||||||||||||||||||||||
| Ramiro Mato | Independent | 98,000 | 170,000 | 43,000 | — | — | 43,000 | 68,000 | — | 422,000 | 95,600 | 517,600 | 499,800 | ||||||||||||||||||||||||||||||||||
| Belén Romana | Independent | 98,000 | 170,000 | 43,000 | — | — | 113,000 | 18,000 | 28,000 | 470,000 | 101,600 | 571,600 | 549,300 | ||||||||||||||||||||||||||||||||||
| Pamela Walkden | Independent | 98,000 | — | 113,000 | — | — | 43,000 | — | — | 254,000 | 86,600 | 340,600 | 323,000 | ||||||||||||||||||||||||||||||||||
Germán de la Fuente | Independent | 98,000 | — | 43,000 | — | — | 43,000 | — | — | 184,000 | 86,600 | 270,600 | 136,683 | ||||||||||||||||||||||||||||||||||
Glenn HutchinsC | Independent | 192,600 | — | — | 28,000 | 40,500 | — | — | 28,000 | 289,100 | 82,500 | 371,600 | 9,689 | ||||||||||||||||||||||||||||||||||
Álvaro CardosoD | Independent | — | — | — | — | — | — | — | — | — | — | — | 38,601 | ||||||||||||||||||||||||||||||||||
R. Martín ChavezE | Independent | — | — | — | — | — | — | — | — | — | — | — | 146,447 | ||||||||||||||||||||||||||||||||||
Sergio RialF | Other external | — | — | — | — | — | — | — | — | — | — | — | 131,400 | ||||||||||||||||||||||||||||||||||
| 1,699,600 | 1,147,500 | 328,000 | 162,000 | 190,000 | 285,000 | 138,550 | 287,000 | 4,237,650 | 1,093,000 | 5,330,650 | 4,691,121 | ||||||||||||||||||||||||||||||||||||
A. Member of board of directors since 1 January 2023.
B. All amounts received were reimbursed to Fundación Botín.
C.From 1 October 2023 the Lead Independent Director, non-executive Vice Chair and Chair of remuneration committee is Mr. Glenn Hutchins, succeeding Mr. Carnegie-Brown.
D. Stepped down as director on 1 April 2022.
E. Stepped down as director on 1 July 2022.
F. Stepped down as director on 1 January 2023.
G. Also includes emoluments for other roles in the board.
I: Independent. N: Non-external (neither proprietary nor independent).
EC: executive committee AC: audit committee NC: nomination committee RC: remuneration committee
RSRCC: risk supervision, regulation and compliance committee. RBSCC: responsible Banking, sustainability and culture committee. ITC: innovation and technology committee.
254
6.3 Remuneration of directors for executive duties
The policy on directors’ remuneration for executive duties in 2023 was approved by the board of directors and put to a binding vote at the 2023 general shareholders' meeting, with 90.78% votes in favour. The table below summarizes the remuneration policy of Ana Botín and Héctor Grisi.
Component | Type | Policy | Effective in 2023 | ||||||||||||||||||||
Gross annual salary | Fixed | →Paid in cash on a monthly basis. | Ana Botin: EUR 3,271 thousand. Héctor Grisi: EUR 3,000 thousand. | ||||||||||||||||||||
Variable remuneration | Variable | →Individual benchmark reference →Calculated against annual quantitative metrics, a multiplier and a qualitative assessment, and taking into account individual performance. →50% of each payment is instruments, consisting of Banco Santander, S.A instruments, and restricted stock units (RSUs) of PagoNxt, S.A., split as: ◦the amount of PagoNxt RSUs set for each executive director; and. ◦the rest, all in shares of Banco Santander, S.A. →The number of instruments is set at the time of the award. →40% paid in 2024. →60% deferred in five years. ◦24% paid in equal parts in 2025 and 2026. ◦36% paid in equal parts in 2027, 2028 and 2029, provided certain long-term objectives are met (2023-2025). | •See section 6.3 B ii for details on annual metrics and assessment. •See section 6.3 B iv for details on long-term metrics. •See section 6.3 B iii for details on individual variable pay. | ||||||||||||||||||||
Pension scheme | Fixed | →Annual contribution of 22% of base salary. | •No changes. | ||||||||||||||||||||
Variable | →Annual contribution of 22% of 30% of the average of variable remuneration in the last three years. | •See section 6.3 C for details on annual contributions and pension balance. | |||||||||||||||||||||
Other remuneration | Fixed | →Includes life, accident and medical insurance, and other in-kind compensation. →Includes for the Executive Chair a fixed remuneration supplement in cash (not considered salary or pensionable) since supplementary death and disability benefits were eliminated. | •Regarding fixed remuneration supplement, no change for Ana Botín since 2018. •Héctor Grisi will not receive supplement in his fixed remuneration. | ||||||||||||||||||||
→Payment for non-compete commitment | No changes. | ||||||||||||||||||||||
Shareholding policy | N/A | →Executive directors also have the obligation to hold them for three years from their award date, unless the director already holds shares for an amount equivalent to 200% of their net annual salary (calculated on the basis of their gross annual salary). In such case, the regulatory obligation to hold shares is for one year from their grant date. | •Policy updated during 2020 to assure compliance with recommendation 62 to the Good Governance Code for Listed Companies of the CNMV. •Both Ana Botín and Héctor Grisi maintain an amount in shares higher than 200% of their fixed pay. | ||||||||||||||||||||
255
A. Gross annual salary
After five years with no review of gross annual salary, the board resolved that Ana Botín’s gross annual salary would increase a 3% in respect of 2022. In turn, the board approved for Héctor Grisi (new CEO with effect from 1 January 2023), a gross annual salary of EUR 3 million, which means he will maintain a similar total fixed remuneration amount as his predecessor.
It also maintained the fixed pension contribution of 22% of gross annual salary it had agreed in 2022 for 2023.
Executive directors’ gross annual salary and fixed annual contribution to pensions for 2023 and 2022 were as follows:
| EUR thousand | 2023 | 2022 | |||||||||||||||||||||
| Gross annual salary | Fixed annual pension contribution | TotalA | Gross annual salary | Fixed annual pension contribution | TotalA | ||||||||||||||||||
| Ana Botín | 3,271 | 720 | 3,991 | 3,176 | 699 | 3,875 | |||||||||||||||||
| Héctor Grisi | 3,000 | 660 | 3,660 | — | — | — | |||||||||||||||||
| José Antonio Álvarez | — | — | — | 2,541 | 559 | 3,100 | |||||||||||||||||
| Total | 6,271 | 1,380 | 7,651 | 5,717 | 1,258 | 6,975 | |||||||||||||||||
A. Additionally, Ana Botín received in 2023 and 2022 EUR 525 thousand as a fixed remuneration supplement, as disclosed in section B) i) b) of 6.4, Director's remuneration for 2024. José Antonio Alvarez received in 2022 EUR 710 thousand for this concept. Héctor Grisi did not receive fixed remuneration supplement.
B. Variable remuneration
i) General policy for 2023
The board approved the executive directors’ variable remuneration on the remuneration committee’s recommendation, according to the policy approved at the general shareholders' meeting:
•Variable components1 (including the variable part of the contributions to the benefit systems) of executive directors’ total remuneration in 2023 should amount to less than 200% of fixed components, as established by resolution of the general shareholders' meeting on 31 March 2023.
•At the beginning of 2024, on the remuneration committee’s recommendation, the board approved the final amount of the 2023 incentive, based on the set bonus pool in accordance with the directors' remuneration policy approved at the general shareholders' meeting on 31 March 2023, in consideration of:
•Short-term quantitative metrics measured against annual objectives.
•A relative performance multiplier versus market which would multiply by 0.7 to 1.3 the result of the quantitative metrics above.
•A qualitative assessment that cannot adjust the result above by more than 25 percentage points upwards or downwards.
•Any exceptional adjustment that must be supported by evidence.
•The final figure is adjusted to executive directors’ individual target variable remuneration according to the current model and (i) their individual objectives (which generally match the Group’s and cover financial, risk management and solvency position, as well as fostering the global initiatives PagoNxt and Digital Consumer Bank (and the CIB, Wealth and Commercial businesses); and accelerating the transformation of the Bank into One Santander, with a special focus on IT, people and the responsible banking agenda); and (ii) how they achieve them in consideration of how they manage employees and follow the corporate values.
| Individual benchmark variable remuneration | | Quantitative metrics, a multiplier and qualitative assessmentA | | Individual performance | | Final individual variable remuneration | ||||||||||||||
A.Any exceptional adjustment supported by evidence
Quantitative metrics and qualitative assessment aspects are described below.
•Payment of the approved incentive is split equally into cash and instruments, the latter as follows:
•EUR 500,000 and EUR 420,000 in PagoNxt, S.L. RSUs for Ana Botín and Héctor Grisi, respectively.
•The rest, all in instruments of Banco Santander. The executive director must decide between receiving such amount all in shares, or receiving in equal parts shares and share options of Banco Santander. In 2023, both executive directors chose to receive them all in shares.
• 40% is paid in 2024, once the final amount has been set. The remaining 60% will be deferred in equal parts over five years (subject to long-term metrics) as follows:
1 As indicated in the first chart in section 6.3 pension contributions include both fix and variable components, the latter of which also form part of total variable remuneration.
256
•The deferred amount payable in 2025 and 2026 (24% of the total), will be paid if none of the malus clauses described below are triggered.
•The deferred amount payable in 2027, 2028 and 2029 (36% of the total), will be paid if the malus clauses are not triggered and the multi-year targets described below are reached. These targets can reduce these amounts and the number of deferred instruments, or increase them up to a maximum achievement ratio of 125%, so executives have the incentive to exceed their targets.
•When the deferred amount is paid in cash, the beneficiary may be paid the amount adjusted for inflation up to the date of payment.
•All payments in shares are subject to a three year retention period, unless the director already holds shares for an amount equivalent to twice his/her annual fix remuneration, in which case the shares would be subject only to the regulatory one year retention period obligation.
•The hedging of the instruments received during the retention and deferral periods is expressly prohibited.
The payment schedule of the incentive is illustrated below.
| Cash | |||||||||||||||||||||||||||||
| Instruments | |||||||||||||||||||||||||||||
| Immediately following performance year | Deferred not subject to long-term metrics | Long-term performance deferral | Total | ||||||||||||||||||||||||||
 | 40% | ||||||||||||||||||||||||||||
 | | 24% | |||||||||||||||||||||||||||
| | | 36% | ||||||||||||||||||||||||||
| 2024 | 2025 | 2026 | 2027 | 2028 | 2029 | 100% | |||||||||||||||||||||||
All deferred payments can be subject to malus, even if they are not subject to long-term objectives. Similarly, Santander can claw back paid incentives in the scenarios and for the period dictated in the Group’s malus and clawback policy.
ii) Quantitative metrics and qualitative assessment for 2023
Executive directors’ variable remuneration for 2023 has been based on the corporate centre executives' common bonus pool, which calculation comes from the quantitative metrics, a relative performance multiplier versus market and qualitative assessment approved by the board at the beginning of 2023 on
the remuneration committee’s recommendation. This also takes into account the input from the human resources committee, which for this purpose counts on the participation of the senior management in charge of the group's Risk, Compliance, Audit, Human Resources and Legal and Financial accounting and control functions, who among others provided input on risk, solvency, liquidity, results' quality and recurrence, and compliance and control. The results for the bonus pool (shown in the chart below) resulting from the process above and reviewed and approved by the board, upon recommendation from the remuneration committee, are shown in the chart below.
257
Category and (weight) | A.Quantitative metricsA | ||||||||||
Targets | Achievement over target | Assessment | |||||||||
Transformation: (45%) | Total customers (growth) (10%) | Target: 8.83 million. Achievement: 11.05 million. | 125.17 | % | |||||||
Active customers (growth) (10%) | Target: 5.43 million. Achievement: 5.43 million. | 100.03 | % | ||||||||
Revenue per active customer (10%) | Target: EUR 572. Achievement: EUR 597. | 104.46 | % | ||||||||
Operative cost per active customer (15%) | Target: EUR 251.10. Achievement: EUR 264. | 94.82 | % | ||||||||
Capital (30%) | CET1 ratio | Target: 12.45%. Achievement: 12.54% | 125.19 | % | |||||||
Profitability (25%) | RoTE (Return on tangible equity) | Target: 15.72%. Achievement: 15.39%. | 97.92 | % | |||||||
TOTAL metrics | 109.22% | ||||||||||
A. For this purpose, these metrics may be adjusted upwards or downwards by the board, following a proposal from the remuneration committee, when inorganic transactions, material changes to the Group’s composition or size or other extraordinary circumstances (such as extraordinary impacts of macroeconomic environment, impairments, restructuring procedures or regulatory changes) have occurred which affect the suitability of the metric and achievement scale established in each case and resulting in an impact not related to the performance of the executive directors and executives being evaluated.
B. MULTIPLIER (relative performance vs. market) | Net interest margin (NIM), cost to income, CoR, NPLs, net promoter score (NPS) and Net Margin after provisions as references. | Santander registered record results in 2023, which enabled us to climb to second in the ranking for net margin after provisions. Moreover, the Group outperformed its peers in terms of capitalization, with an increase of 45% in the measuring period, which is well above our major competitors’ 21% average. Regarding subsidiaries, Spain (NIM and NPS) and Portugal (practically all metrics) were among the top performers, as well as Digital Consumer Bank (NIM and cost to income). | 1.02 | ||||||||
C. Qualitative assessment | ||||||||
Indicators | Level of achievement | Assessment | ||||||
Risk (+/- 5%) | Strengthened the control environment and escalation, especially for non-financial risks (fraud, budgeting), market risk and structural risk (management of the US banking crisis). Significant progress with strategic and transformation initiatives, and further integration of advanced risk management techniques (automated decision-making, machine learning, and artificial intelligence). | +3.20% | ||||||
Compliance (+/- 5%) | General enhancement of the control environment, most notably in relation to regulatory compliance. Progress with the implementation of strategic and transformation initiatives (vulnerable customer strategy and branch conduct rating, among others). | +2.60% | ||||||
Network Collaboration (+/- 10%) | In 2023, our strategic focus involved the commitment by the global businesses, regions and subsidiaries and cross-cutting functions to work together. Thanks to our unique combination of a global scale with local leadership and a network that creates value for the Group, we nurtured relationships between subsidiaries and regions by sharing expertise and ways of working. In 2023 we monitored performance indicators that showed an increase in cooperation between the global businesses, subsidiaries and support functions, who worked together to create synergy and share best practice in pursuit of our goal to become ONE Santander. | +2.73% | ||||||
ESG targets (+/- 5%) | (i) We made headway with our target on the percentage of women in senior executive positions — up from 29.3% in 2022 to 31.4% in 2023; (ii) we financially included 1.8 million people through our access and finance programmes; (iii) we raised or facilitated over EUR 22,000 million in green finance and reached EUR 67,700 million in socially-responsible assets under management; (iv) we set new targets for our auto manufacturing and auto lending portfolios, as well as decarbonization plans for key retail portfolios; and (v) we continued to enhance the quality control of our sustainability disclosures. | +3.40% | ||||||
TOTAL qualitative assessment | +11.93% | |||||||
D. Exceptional adjustment approved by board of directors upon recommendation of remuneration committee | Following the same rationale applied to the discretionary decreases of 14.5% of the bonus pools of 2019 and 2021 due to worse total shareholder returns, and taking into account the record attributable profit obtained (11,076 million euros, +15% compared to 2022) and the very high shareholders return (+40.5%, beating the average of our peer group by 5%), the board of directors, upon the recommendation of the remuneration committee, agreed to set the same bonus pool (138.91%) as in 2022, thus making an exceptional upward adjustment of +15.57% | +15.57% | ||||||
Final bonus pool 2023 | 138.91% | |||||||
To the total result obtained in the year by the quantitative metrics (109.22%), the result of the multiplier is applied (1.02) and the ones relative to the qualitative evaluation (+11.93%) and the adjustment (+15.57%) are added:
(A X B) + C +D = Final bonus pool result in 2023
The following section details the individual variable remuneration approved by the board.
iii) Determination of the individual variable remuneration for executive directors set in 2023
The board approved executive directors’ variable remuneration on the remuneration committee’s recommendation based on the policy mentioned in the paragraphs above and the result of the quantitative metrics and qualitative assessment described above.
The board also verified that none of the following circumstances have occurred:
•The Group’s ONP2 for 2023 was not more than 50% less than for 2022. Otherwise, variable remuneration would not have been greater than 50% of the benchmark incentive.
2 For this purpose, ONP is attributed ordinary net profit, adjusted upwards or downwards for transactions the board believes have an impact not connected to the performance of evaluated directors, for which extraordinary profit, corporate transactions, impairments, or accounting or legal adjustments that may occur during the year are evaluated. The exclusion in the calculation for these purposes of goodwill impairments is aligned with the supervisors' criteria on their recommendations on dividend distributions.
258
•The Group’s ONP was not negative. Otherwise, the incentive would have been zero.
The board voted to maintain the same benchmark incentive for Ana Botín in 2023 as in 2022 and established a variable remuneration target for Hector Grisi of EUR 4,200 thousand (aligned with that of his predecessor José Antonio Álvarez).
Variable contributions to pensions were not modified in 2023, so the amounts are the 22% of the 30% of the last three assigned bonus' average. This means complying with Circular 2/2016 of the Bank of Spain, standard 41, on pension benefits, by which a part of not less than 15% must be based on variable components.
Breakdown of immediately payable and deferred remuneration
In 2023, Santander’s strong performance and excellent execution of our strategy enabled us to deliver record attributable profit of EUR 11,076 million (+15,3% compared to 2022 results) and a capital ratio of 12.3% (achieving our public target). We also achieved a very high total shareholder return of +40.5% (5% above the average of our official group of nine peers3 in relative terms). Because of the double digit growth in net profit coupled with the highest TSR in the last 14 years, the board approved to maintain the same bonus pool as in 2022, at 138.91%,
for which an extraordinary adjustment of +15.57% was made, in the same manner as the 2021 and 2019 pools were both reduced by extraordinary adjustments (due to worse shareholders return), with a combined impact of -30%.
As a result, and considering the exceptional contribution made by the Chairman and the CEO to the achievement of these exceptional results, on the basis of the pool detailed above, and taking into consideration the fulfillment of their individual objectives, the board of directors, upon recommendation of the remuneration committee, approved the variable remuneration disclosed below, which means an increase of 5% of the Executive Chair's total compensation vs 2022, and a reduction of 9% in the case of Héctor Grisi (compared to his predecessor).
Furthermore, the ratio of executive directors’ total remuneration to underlying attributable profit fell from 0.23% in 2022 to 0.19% in 2023, as shown in section 6.3.I.
The immediately payable variable remuneration in deferred amounts not contingent on long-term metrics and variable remuneration deferred and contingent on long-term objectives approved by the board of directors, following a proposal by the remuneration committee resulting from the aforementioned process are:
| Immediately payable and deferred (not linked to long-term objectives) variable remuneration | ||||||||||||||||||||||||||||||||
| EUR thousand | 2023 | 2022 | ||||||||||||||||||||||||||||||
| In cash | In sharesA | In RSUsA | Total | In cash | In sharesB | In share optionsB | In RSUsB | Total | ||||||||||||||||||||||||
| Ana Botín | 2,848 | 2,648 | 200 | 5,696 | 2,702 | 1,229 | 1,229 | 243 | 5,403 | |||||||||||||||||||||||
| Héctor Grisi | 1,952 | 1,784 | 168 | 3,904 | — | — | — | — | — | |||||||||||||||||||||||
| José Antonio Álvarez | — | — | — | — | 1,823 | 830 | 830 | 164 | 3,647 | |||||||||||||||||||||||
| Total | 4,800 | 4,432 | 368 | 9,600 | 4,525 | 2,059 | 2,059 | 407 | 9,050 | |||||||||||||||||||||||
A. The amounts in the foregoing table correspond to a total of 1,168 thousand shares of Banco Santander and 6 thousand RSUs of PagoNxt, S.L.
B. The amounts in the foregoing table correspond to a total of 667 thousand shares in Banco Santander, 1,795 thousand share options and 8 thousand RSUs in 2022 for Ana Botín and José Antonio Álvarez .
The following chart states deferred variable remuneration at fair value, which will only be received in 2027, 2028 and 2029 if the long-term multi-year targets are met (see section 6.3 B iv)) and beneficiaries continue to be employed at Grupo Santander, in accordance with the terms approved in the general shareholders' meeting, and no circumstances triggering malus clauses occur4:
| Deferred variable remuneration linked to long-term objectives (fair value) | ||||||||||||||||||||||||||||||||
| EUR thousand | 2023 | 2022 | ||||||||||||||||||||||||||||||
| In cash | In sharesA | In RSUsA | Total | In cash | In sharesB | In share optionsB | In RSUsB | Total | ||||||||||||||||||||||||
| Ana Botín | 1,121 | 911 | 210 | 2,243 | 1,064 | 404 | 404 | 255 | 2,128 | |||||||||||||||||||||||
| Héctor Grisi | 769 | 592 | 176 | 1,537 | — | — | — | — | — | |||||||||||||||||||||||
| José Antonio Álvarez | — | — | — | — | 718 | 273 | 273 | 172 | 1,436 | |||||||||||||||||||||||
| Total | 1,890 | 1,504 | 386 | 3,780 | 1,782 | 677 | 677 | 428 | 3,564 | |||||||||||||||||||||||
A. The number of shares in the table total 396 thousand shares of Banco Santander and 6 thousand RSUs of PagoNxt S.L.
B.219 thousand shares, 590 thousand share options and 9 thousand RSUs of PagoNxt S.L in 2022.
3 Peer group: BBVA, BNP Paribas, Citi, Crédit Agricole, HSBC, ING, Itaú, Scotia Bank and Unicredit.
4 Corresponds to the fair value of the maximum amount to be received over a total of 3 years, subject to continued service -with certain exceptions-, non- applicability of malus clauses and compliance with set goals. Fair value was estimated at the plan award date on account of several scenarios for the variables in the plan during the measurement periods.
259
Fair value has been determined on the grant date based on the valuation of an independent expert, Willis Towers Watson. Based on the design of the plan for 2023 and success levels of similar plans at peer entities, the fair value was considered to be 70% of total value linked to long-term objectives assigned.
The maximum amount of shares to be delivered under the plan is within the maximum amount of the award to be delivered in shares (EUR 11.5 million) approved by 2023 general shareholders’ meeting for executive directors. This number of shares has been calculated with the weighted average daily volume of weighted average listing prices of Banco Santander shares in the 50 trading sessions prior to the Friday (not inclusive) before 30 January 2024 (the date on which the board approved the 2023 bonus for executive directors), which was EUR 3.793 per share. According to an independent experts' valuation, the price per PagoNxt, S.L. RSU equals EUR 60.34.
260
iv) Multi-year targets linked to the payment of deferred amounts in 2027, 2028 and 2029
The multi-year targets linked to the payment of the deferred amounts payable in 2027, 2028 and 2029 are:
| Metrics | Weight | Target and compliance scales (metrics ratios) | ||||||||||||
A | Banco Santander’s consolidated Return on tangible equity (RoTE) target in 2025 | 40% | If RoTE in 2025 is ≥ 17%, then metric ratio is 1.5 If RoTE in 2025 is ≥ 14% but <17%, then metric ratio is 0 – 1.5B If RoTe in 2025 is < 14%, then metric is 0 | |||||||||||
B | Relative Total Shareholder Return (TSR)A in 2023-2025 within a peer group | 40% | If ranking Santander above or equal percentile 100, then metric ratio is 1.5 If ranking Santander between percentiles 75 and 100 (not inclusive), then metric ratio is 1 – 1.5C If ranking Santander between percentiles 40 and 75 (not inclusive), then metric ratio is 0.5 – 1C If ranking Santander below percentile 40, then metric ratio is 0 | |||||||||||
| C | Four ESG (environmental, social and governance) metrics with same weighting (1/4 x Coefficient 1 + 1/4 x Coefficient 2 + 1/4 x Coefficient 3 +1/4 x Coefficient 4) On which: Coefficient 3: (0.7 x Subcoefficient 3.a) + (0.3 x Subcoefficient 3.b) | 20% | 1) | If % women in senior executive positions in 2025 is ≥ 36%, then metric ratio is 1.25 If % women in senior executive positions in 2025 is ≥ 35% but <36%, then metric ratio is 1 – 1.25D If % women in senior executive positions in 2025 is ≥ 29.3% but <35%, then metric ratio is 0 – 1D If % women in senior executive positions in 2025 is < 29.3%, then metric ratio is 0 | ||||||||||
2) | If number of banking proposals or tailored financeE between 2023 and 2025 (in million) is ≥ 6, then metric ratio is 1.25 If number of banking proposals or tailored financeE between 2023 and 2025 (in million) is ≥ 5 but <6, then metric ratio is 1 – 1.25D If number of banking proposals or tailored financeE between 2023 and 2025 (in million) is ≥ 3 but <5, then metric ratio is 0 – 1D If number of banking proposals or tailored financeE between 2023 and 2025 (in million) is < 3, then metric ratio is 0 | |||||||||||||
3) a. | If green finance raised and facilitatedF target between 2019 and 2025 (in euro billions) is ≥ 240, then metric ratio is 1.25 If green finance raised and facilitatedF target between 2019 and 2025 (in euro billions) is ≥ 220 but < 240, then metric ratio is 1 –1.25D If green finance raised and facilitatedF target between 2019 and 2025 (in euro billions) is ≥ 160 but < 220, then metric ratio is 0 –1D If green finance raised and facilitatedF target between 2019 and 2025 (in euro billions) is < 160, then metric ratio is 0 | |||||||||||||
3) b. | If socially responsible investmentsG (in euro billions) in 2025 is ≥ 102, then metric ratio is 1.25 If socially responsible investmentsG (in euro billions) in 2025 is ≥ 100 but < 102, then metric ratio is 1 –1.25D If socially responsible investmentsG (in euro billions) in 2025 is ≥ 53 but < 100, then metric ratio is 0 – 1D If socially responsible investmentsG (in euro billions) in 2025 is < 53, then metric ratio is 0 | |||||||||||||
4) | If credit risk exposure with customers affected by the thermal coalH (in euro billions) in 2025 is ≤ 3.8, then metric ratio is 1.25 If credit risk exposure with customers affected by the thermal coalH (in euro billions) in 2025 is < 5.8 but > 3.8, then metric ratio is 1 –1.25D If credit risk exposure with customers affected by the thermal coalH (in euro billions) in 2025 is = 5.8, then metric ratio is 1 If credit risk exposure with customers affected by the thermal coalH (in euro billions) in 2025 is > 5.8, then metric ratio is 0 | |||||||||||||
A. TSR refers to the difference (%) between the final and initial values of capital invested in ordinary shares of Banco Santander. The final value is calculated based on the dividends or other similar concepts (such as the Santander Scrip Dividend programme) shareholders receive for this investment during the corresponding period -as if they had invested in more shares of the same type at the first date on which the dividend or similar concept was payable to shareholders- and the weighted average share price at that date. To calculate TSR, the weighted average daily volumes of the weighted average listing prices for the fifteen trading sessions prior to 1 January 2023 (exclusive) is considered (to calculate the initial value) and the fifteen trading sessions prior to 1 January 2026 (exclusive) (to calculate the final value). The peer group consists of BBVA, BNP Paribas, Citi, Crédit Agricole, HSBC, ING, Itaú, Scotia Bank and Unicredit.
B. Straight-line increase in the RoTE ratio based on the percentage of specific RoTE in 2025 within this bracket of the scale.
C. Proportional increase in the TSR ratio based on the number of positions moved up in the ranking.
D. Increase of the coefficient is proportional to its position on this line of the scale.
E. Banking proposals for unbanked and underbanked regarding access to basic financial services (i.e.: cash-in/cash-out services in remote locations) or tailored finance (i.e.: for micro-entrepreneurs to set up or grow a business or customers in financial distress).
F. Grupo Santander's contribution to green business: SCIB, Retail & Commercial banking and Digital Consumer Bank. It is measured with cumulative data since 2019.
G.Funds registered under article 8 and 9 (SFDR) in the EU, including third-party funds and SAM´s Latin American funds that meet equivalent criteria.
H. Credit risk exposure with customers affected by the thermal coal 2030 phase-out target: power generation customers with more than 10% of revenues coming from thermal coal and thermal coal-mining customers.
261
To determine the annual amount of the deferred portion linked to objectives corresponding to each board member in 2027, 2028 and 2029, the following formula shall be applied to each of these payments ('final annuity') without prejudice to any adjustment deriving from the malus clauses:
Final annuity = Amt. x (2/5 x A + 2/5 x B + 1/5 x C)
where:
•'Amt.' is one third of the variable remuneration amount deferred conditional on performance (i.e. Amt. will be 12% of the total variable pay set in early 2024).
•'A' is the RoTE coefficient according to the scale in the table above, based on RoTE at year-end 2025.
•'B' is the TSR ratio calculated as the scale in the table above, according to the relative performance of Banco Santander’s TSR within its peer group in 2023- 2025.
•'C' is the coefficient resulting from the sum of weighted coefficients for each of the four Responsible Banking targets for 2025 described above.
•In any event, if the result of (2/5 x A + 2/5 x B +1/5 x C) is greater than 1.25, the multiplier will be 1.25.
v) Malus and clawback
Deferred amounts (whether or not contingent on multi-year targets) will be earned if the beneficiary continues to work with the Group5, and none of the circumstances triggering malus clauses arise before each payment, according to the section on malus and clawback clauses in the remuneration policy.
Similarly, Banco Santander can clawback any paid variable amounts in the scenarios and for the period dictated by the terms and conditions in the said policy.
Variable remuneration for 2023 can be clawed back until the beginning of 2030.
Malus and clawback clauses are triggered by poor financial performance of Banco Santander, a division or area, or exposures from staff as a result of an executive(s)’s management of, at least, one of these factors:
Category | Factors | ||||
| Risk | Significant failures in risk management by Banco Santander, or by a business or risk control unit. | ||||
| Capital | An increase in capital requirements at the Banco Santander or one of its business units not planned at the time that exposure was generated. | ||||
| Regulation and internal codes | Regulatory penalties or legal convictions for events that might be attributable to the unit or staff responsible for them. In addition, failure to comply with Banco Santander’s internal codes of conduct. | ||||
| Conduct | Improper conduct, whether individual or collective. Negative effects deriving from the marketing of unsuitable products and the liability of persons or bodies making such decisions will be considered especially significant. | ||||
In addition to the existing policy on malus and clawback clauses of our remuneration policy, the board of directors of Banco Santander at its meeting held on 28 November 2023, following the proposal from the remuneration committee on 27 November 2023, approved an addendum to our remuneration policy to comply with the new SEC (US Securities and Exchange Commission) regulations relating to the recoupment of compensation erroneously received by the executive directors of Banco Santander, S.A., and senior management, in the event of a financial restatement (according to the regulation) resulting from material noncompliance with financial reporting requirements under federal securities laws. The new addendum to our remuneration policy, entitled "Financial Statement Restatement Compensation", is included as an exhibit to our Annual Report on Form 20-F report filed with the SEC.
The application of malus or clawback clauses for executive directors shall be determined by the board of directors, at the proposal of the remuneration committee, and cannot be proposed once the retention period for the final payment in shares under the plan has elapsed in early 2030. Therefore, the board determines the specific deferred incentive amount to be paid as well as any amount that could be subject to clawback, upon on the remuneration committee’s recommendation and depending on the level of compliance with the conditions for applying malus clauses.
5 When the beneficiary’s relationship with Banco Santander or another Group entity terminates because of retirement, early retirement or pre-retirement; a dismissal ruled by the courts to be wrongful; unilateral withdrawal for good cause by an employee (which includes the situations set forth in article 10.3 of Royal Decree 1382/1985, of 1 August, governing the special relationship of senior management, for the persons subject to these rules); permanent disability or death; mandatory redundancy; or because an employer other than Banco Santander ceases to belong to Grupo Santander, the right to receive shares and deferred amounts in cash and any amounts of the deferred amounts in cash adjusted for inflation will remain under the same conditions in force as if none of such circumstances had occurred. In the case of death, the right will pass to the beneficiary’s heirs.
In cases of justified temporary leave due to temporary disability, suspension of contract due to maternity or paternity leave, or leave to care for children or a relative, there will be no change in the beneficiary’s rights. If the beneficiary goes to another Group company (even through international assignment and/or expatriation), these rights will likewise not change. If the relationship terminates by mutual agreement or because the beneficiary obtains a leave not mentioned above, the terms of the termination or temporary leave agreement will apply.
None of those circumstances attach the right to receive the deferred amount in advance. If beneficiaries or their heirs maintain the right to receive deferred pay in shares and cash and any deferred amounts in cash adjusted for inflation, it will be delivered within the periods and under the terms dictated by the rules for the plans.
None of the above circumstances shall give the right to receive the deferred amount in advance. If the beneficiary or the successors thereof maintain the right to receive the deferred remuneration in shares and cash and, where applicable, the amounts arising from the adjustment for inflation of the deferred amounts in cash, it shall be delivered within the periods and under the terms provided in the rules for the plans.
262
C. Main features of the benefit plans
Executive directors participate in the defined contribution pension scheme created in 2012, which covers contingencies due to retirement, disability and death.
According to the 2012 system, contracts for Ana Botín and other senior managers with defined benefit pension obligations were transformed into a defined contribution system. The new system gives executive directors the right to receive benefits upon retirement, even if they are not active at Banco Santander at the time, based on contributions to the system. It also replaced their previous right to receive a pension supplement in the event of retirement.
The initial amount Ana Botín in the new defined contribution pension scheme corresponded to the market value of the assets for which the provisions for due obligations were recognized when the previous pension commitments had been transferred to the new pension scheme.
Every year since 2013, Banco Santander has been contributing to the pension scheme for executive directors and other members of the executive team in proportion to their pensionable bases until their departure from the Group, retirement, death or disability. In general terms, the pensionable base for executive directors is the sum of fixed remuneration plus 30% of the average of their last three variable remuneration amounts. Contributions will be 22% of pensionable bases in all cases. For Héctor Grisi, CEO from 1 January 2023, since he has not been in the position for three years, the calculation of the variable portion was done using his gross variable remuneration in that financial year.
Pursuant to remuneration regulations, contributions calculated on the basis of variable remuneration are subject to the discretionary pension benefits scheme. Therefore, under the policy, malus and clawback clauses can be enforced on them in place at any given time and during the same period in which variable remuneration is deferred. Furthermore, these contributions must be invested in shares in Banco Santander for five years from the date of the executive director's retirement, or from the date on which executive directors leave the group. Once that period has elapsed, the amount invested in shares will be paid to them or their beneficiaries if some contingency covered by the pension scheme was happened or will be added to the remainder of their cumulative balance until their retirement age when the total amount will be paid.
The benefit plan is outsourced to Santander Seguros y Reaseguros, Compañía Aseguradora, S.A. The economic rights of the directors previously mentioned belong to them even if they are not active at Banco Santander at the time of their retirement, death or disability. Their contracts do not stipulate any severance payment outside the extent of the law for termination of contract.
The provisions recognised in 2023 for retirement pensions amounted to EUR 2,110 thousand (EUR 1,892 thousand in 2022), as broken down below.
| EUR thousand | 2023 | 2022 | ||||||
| Ana Botín | 1,144 | 1,081 | ||||||
| Héctor Grisi | 966 | — | ||||||
| José Antonio Álvarez | — | 811 | ||||||
| Total | 2,110 | 1,892 | ||||||
The amounts corresponding to each director as of 31 December 2023 and 2022 in the pension scheme are:
| EUR thousand | 2023 | 2022 | ||||||
| Ana Botín | 49,257 | 46,725 | ||||||
| Héctor Grisi | 585 | — | ||||||
| José Antonio Álvarez | 19,495 | 18,958 | ||||||
| Total | 69,338 | 65,683 | ||||||
D. Other remuneration
Grupo Santander also takes out insurance policies for life, health and other contingencies for its executive directors. This other remuneration component includes the fixed supplement approved for Ana Botín to replace the supplementary benefits from the pension scheme eliminated in 2018, in addition to the cost for insuring death or disability until they retire. Executive directors are also covered under the Group’s civil liability insurance policy.
Note 5 to the Group’s consolidated financial statements describes other benefits received by executive directors in detail.
E. Shareholdings
In 2016, on the remuneration committee’s recommendation, the board of directors approved a shareholding policy to better align executive directors with shareholders’ long-term interests.
According to this policy, in addition to the executive directors’ commitment to maintaining a significant holding of shares in the Group for as long as they have their role, executive directors have five years to demonstrate that their personal assets include shares in Banco Santander that amount (net of taxes) to twice their gross annual salary on that date. The following table show the ratio, with a share price of EUR 3.793:
| 2023 | |||||||||||
| Gross annual salary (thousand) | Number of shares (thousand) | X | |||||||||
| Ana Botín | 3,271 | 32,625 | 37.8 | ||||||||
Héctor Grisi | 3,000 | 1,694 | 2.1 | ||||||||
Likewise, in addition to the regulatory obligation for executive directors not to sell the shares they receive as remuneration for a year from their award, which is included in the shareholding policy, and will apply to all cases, this policy has also been updated in 2020 to include the obligation for executive directors not to sell the shares they receive as remuneration for a period of three years from their award date, unless the executive director already holds Banco Santander shares for an amount equivalent to twice his/her fix annual remuneration.
263
F. Remuneration of board members as representatives of Banco Santander
The executive committee has resolved that the remuneration received by executive directors who represent Banco Santander on boards of companies where it owns equity and were appointed after 18 March 2002 will accrue to the Group. No executive director received remuneration for this type of representation in 2023.
The following table includes the remuneration received by non-executive directors on a personal basis in other Group entities:
Director | Position | Remuneration | ||||||
| Homaira Akbari | Member of the board of Santander Consumer USA Holdings, Inc. | USD 120 thousand (EUR 111 thousand) | ||||||
Member of the Board of PagoNxt, S.L. | EUR 200 thousand | |||||||
Henrique de Castro | Member of the Board of PagoNxt, S.L. | EUR 200 thousand | ||||||
José Antonio Álvarez | Member of the Board of PagoNxt, S.L. | EUR 200 thousand | ||||||
Member of the Board of Banco Santander (Brasil) S.A. | BRL 755 thousand (EUR 141 thousand) | |||||||
| Pamela Walkden | Member of the Santander UK, plc and Santander UK Group Holdings Limited | GBP 132 thousand (EUR 152 thousand) | ||||||
Likewise, Luis Isasi was paid EUR 1,000 thousand for his role as non-Executive Chair of Santander España and for Santander España board and committees meetings (amount included in the chart below as "other remuneration" as it is paid by Banco Santander).
And finally, José Antonio Álvarez received a fixed remuneration of EUR 1,750 thousand as strategic adviser of Grupo Santander, as well as the life and health insurance contributions and the supplement for having waived the death and disability policy disclosed in the table in section G below.
G. Individual remuneration of directors for all items in 2023
Below is a breakdown of each director’s short-term salary (payable immediately) and deferred remuneration not based on long-term performance for 2023 and 2022. Statistical information on remuneration required by the CNMV (9.5) and Note 5 to the Group’s consolidated financial statements contains disclosures on shares delivered in 2023 under the deferred remuneration schemes of previous years where conditions for their delivery were met in the related years.
| EUR thousand | ||||||||||||||||||||||||||||||||||||||
| Directors | 2023 | 2022 | ||||||||||||||||||||||||||||||||||||
| Bylaw-stipulated emoluments | Salary and bonus of executive directors | Total | Total | |||||||||||||||||||||||||||||||||||
| Board and board committees annual allotment | Board and committee attendance fees | Fixed Salary | Immediate payment bonus (50% in instruments) | Deferred payment bonus (50% in instruments) | Total | Pension Contribution | Other remunerationF | |||||||||||||||||||||||||||||||
| Ana Botín | 366 | 45 | 3,271 | 3,560 | 2,136 | 8,967 | 1,144 | 1,022 | 11,544 | 11,001 | ||||||||||||||||||||||||||||
Héctor GrisiA | 296 | 44 | 3,000 | 2,440 | 1,464 | 6,904 | 966 | 47 | 8,257 | — | ||||||||||||||||||||||||||||
| José Antonio Álvarez | 326 | 45 | — | — | — | — | — | 3,182 | 3,553 | 9,086 | ||||||||||||||||||||||||||||
| Bruce Carnegie-Brown | 495 | 81 | — | — | — | — | — | — | 576 | 700 | ||||||||||||||||||||||||||||
| Homaira Akbari | 187 | 78 | — | — | — | — | — | — | 265 | 244 | ||||||||||||||||||||||||||||
Javier BotínB | 98 | 39 | — | — | — | — | — | — | 137 | 129 | ||||||||||||||||||||||||||||
| Sol Daurella | 172 | 77 | — | — | — | — | — | — | 249 | 230 | ||||||||||||||||||||||||||||
| Henrique de Castro | 197 | 87 | — | — | — | — | — | — | 284 | 261 | ||||||||||||||||||||||||||||
| Gina Díez | 143 | 68 | — | — | — | — | — | — | 211 | 172 | ||||||||||||||||||||||||||||
| Luis Isasi | 339 | 78 | — | — | — | — | — | 1,000 | 1,417 | 1,412 | ||||||||||||||||||||||||||||
| Ramiro Mato | 422 | 96 | — | — | — | — | — | — | 518 | 500 | ||||||||||||||||||||||||||||
| Belén Romana | 470 | 102 | — | — | — | — | — | — | 572 | 549 | ||||||||||||||||||||||||||||
| Pamela Walkden | 254 | 87 | — | — | — | — | — | — | 341 | 323 | ||||||||||||||||||||||||||||
| Germán de la Fuente | 184 | 87 | — | — | — | — | — | — | 271 | 137 | ||||||||||||||||||||||||||||
| Glenn Hutchins | 289 | 83 | — | — | — | — | — | — | 372 | 10 | ||||||||||||||||||||||||||||
Álvaro CardosoC | — | — | — | — | — | — | — | — | — | 39 | ||||||||||||||||||||||||||||
R. Martín ChavezD | — | — | — | — | — | — | — | — | — | 147 | ||||||||||||||||||||||||||||
Sergio RialE | — | — | — | — | — | — | — | — | — | 131 | ||||||||||||||||||||||||||||
| Total 2023 | 4,238 | 1,097 | 6,271 | 6,000 | 3,600 | 15,871 | 2,110 | 5,251 | 28,567 | — | ||||||||||||||||||||||||||||
| Total 2022 | 3,762 | 931 | 5,717 | 5,656 | 3,394 | 14,767 | 1,892 | 3,719 | — | 25,071 | ||||||||||||||||||||||||||||
A.Member of board of directors since 1 January 2023.
B. All amounts received were reimbursed to Fundación Botín.
C. Stepped down as director on 1 April 2022.
D. Stepped down as director on 1 July 2022.
E. Stepped down as director on 1 January 2023.
F. Other remuneration includes for Luis Isasi EUR 1,000 thousand for his role as non-executive Chair of Santander España and for Santander España board and committees meetings. For José Antonio Álvarez, this amount includes remuneration as strategic advisor of Grupo Santander, life and health insurance contributions (EUR 722 thousand) and the supplement for having waived the death and disability policy (EUR 710 thousand).
264
The following table provides each executive director’s salary contingent on multi-year targets. It is only paid if they remain active in the group, malus clauses do not apply and set multi-year targets are achieved (as depending on their achievement, the amounts will be increased (limited to 125%), reduced, or even be zero, if the related minimum thresholds are not achieved):
EUR thousandA | ||||||||
| 2023 | 2022 | |||||||
| Ana Botín | 2,243 | 2,128 | ||||||
| Héctor Grisi | 1,537 | — | ||||||
| José Antonio Álvarez | — | 1,436 | ||||||
| Total | 3,780 | 3,564 | ||||||
A. Fair value of the maximum amount receivable over a total of 3 years (2027, 2028 and 2029), which was estimated when the plan was granted, based on several scenarios relating to variables in the plan during the measurement periods.
H. Ratio of variable to fixed pay components in 2023
At the 2023 AGM, shareholders approved a maximum ratio of 200% of variable to fixed components in executive directors’ pay.
The table below shows the ratio of variable components to fixed components for each executive director’s total pay in 2023. This ratio increased slightly from 2022 by 3 pp for Ana Botín.
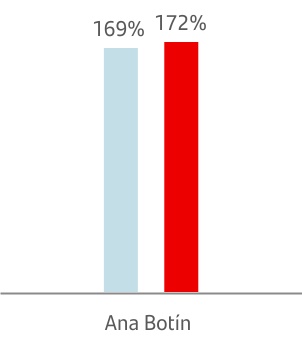
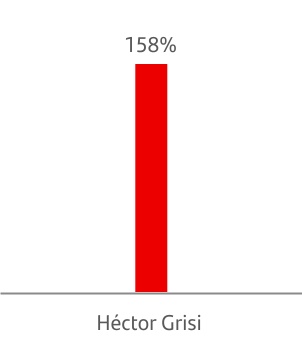
For these purposes:
•Variable components include all items of this nature, such as any contributions to the pension scheme calculated on directors’ variable pay.
•Fixed components consist of the other items each director receives for executive duties, including contributions to pension schemes calculated on the basis of fixed remuneration and other benefits, as well as all Bylaw-stipulated emoluments that the director is entitled to receive in his or her capacity as such.
I. Comparative analysis of directors' remuneration, company performance and average remuneration of employees
This chart summarizes directors’ compensation (short-term remuneration, deferred variable remuneration and/or deferred variable remuneration linked to multi-year targets included, excluding pension contributions) for executive duties in relation to underlying attributable profit. The weight of executive directors’ remuneration relative to underlying attributable profit continues to decline since 2013.
Ratio of executive directors’ total remuneration to underlying attributable profit | ||
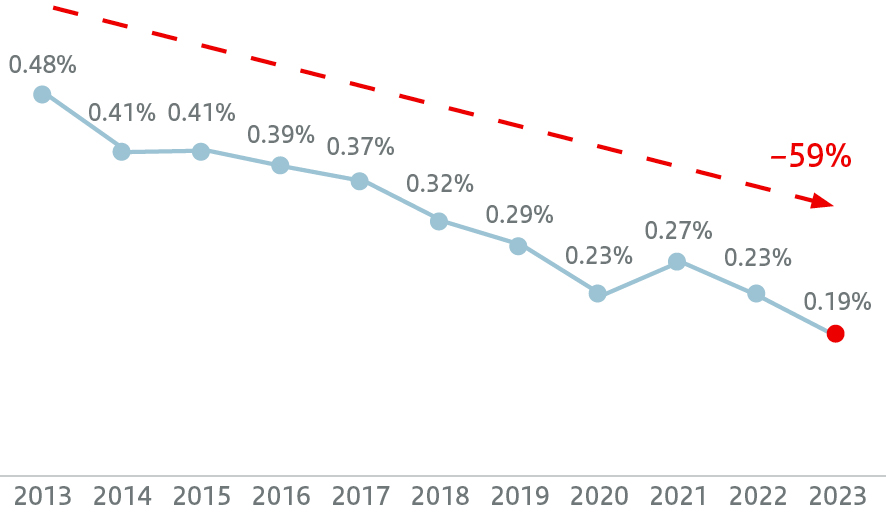
265
The following chart shows the comparative analysis between the directors' remuneration, the company performance (underlying profit attributable to the Group, audited profit before taxes and ordinary ROTE) and the average remuneration of Santander employees (other than directors and in a full time equivalent basis) in the last 5 years:
Directors' remuneration1 (EUR thousand) | 2023 | % var. 23/22 | 2022 | % var. 22/21 | 2021 | % var. 21/20 | 2020 | % var. 20/19 | 2019 | ||||||||||||||||||||
| • Executive Directors | |||||||||||||||||||||||||||||
| Ana Botín | 11,544 | 5% | 11,001 | (4)% | 11,435 | 68% | 6,818 | (32)% | 9,954 | ||||||||||||||||||||
Héctor GrisiA | 8,257 | — | |||||||||||||||||||||||||||
• Non-Executive Directors2 | |||||||||||||||||||||||||||||
| José Antonio Álvarez | 3,553 | (61%) | 9,086 | (1%) | 9,160 | 52% | 6,018 | (27%) | 8,270 | ||||||||||||||||||||
| Bruce Carnegie-Brown | 576 | (18%) | 700 | — | 700 | 18% | 595 | (15%) | 700 | ||||||||||||||||||||
Javier BotínB | 137 | 6% | 129 | — | 129 | 6% | 122 | (11%) | 137 | ||||||||||||||||||||
| Sol Daurella | 249 | 8% | 230 | (4%) | 239 | 12% | 214 | (11%) | 240 | ||||||||||||||||||||
| Belén Romana | 572 | 4% | 549 | 3% | 533 | 28% | 417 | (21%) | 525 | ||||||||||||||||||||
| Homaira Akbari | 265 | 9% | 244 | (2%) | 248 | 23% | 202 | (11%) | 226 | ||||||||||||||||||||
| Ramiro Mato | 518 | 4% | 500 | — | 499 | 16% | 430 | (14%) | 500 | ||||||||||||||||||||
| Henrique de Castro | 284 | 9% | 261 | (2%) | 267 | 23% | 217 | 152% | 86 | ||||||||||||||||||||
| Pamela Walkden | 341 | 6% | 323 | 7% | 303 | 42% | 214 | 529% | 34 | ||||||||||||||||||||
| Luis Isasi | 1,417E | — | 1,412E | — | 1,406E | 49% | 943 | — | — | ||||||||||||||||||||
| Gina Díez Barroso | 211 | 23% | 172 | 32% | 130 | — | 4 | — | — | ||||||||||||||||||||
Germán de la FuenteC | 271 | — | 137 | — | — | — | — | — | — | ||||||||||||||||||||
Glenn HutchinsD | 372 | — | 10 | — | — | — | — | — | — | ||||||||||||||||||||
| Company’s performance | |||||||||||||||||||||||||||||
| Underlying profit attributable to the Group (EUR mn) | 11,076 | 15% | 9,605 | 11% | 8,654 | 70% | 5,081 | (38%) | 8,252 | ||||||||||||||||||||
Consolidated results of the Group3 (EUR mn) | 16,459 | 8% | 15,250 | 5% | 14,547 | — | (2,076) | — | 12,543 | ||||||||||||||||||||
| Ordinary RoTE | 15.06% | 13% | 13.37% | 5% | 12.73% | 71% | 7.44% | (37%) | 11.79% | ||||||||||||||||||||
Employees' average remuneration4 (EUR thousand) | 58 | 3% | 56 | 1% | 56 | 18% | 47 | (12%) | 54 | ||||||||||||||||||||
Employees' average remuneration in Spain5 (EUR thousand) | 73 | 6% | 68 | 10% | 62 | (2%) | 63 | — | n.a. | ||||||||||||||||||||
1. Deferred variable remuneration linked to long-term objectives not included.
2. Non-executive directors' remuneration fluctuations are caused by joining or leaving the board of directors and the difference in the amount of meetings they assist during the year. Hence there is no correlation between their remuneration and the company performance.
3.Group operating profit/(loss) before tax.
4. Employee average remuneration includes all concepts, including other remuneration. Full-time equivalent data. Normally the increases or decreases in remuneration are greater for the executive directors, depending on the results of the entity, because the percentage of variable remuneration over fixed remuneration in an average employee is lower than that of the executive directors. Variable remuneration data accrued in the current year, both for employees and executive directors. Evolutive data also impacted by exchange rate performance in the group's geographies. Full time equivalent data considered.
5.Total employees in Spain geography. Fixed remuneration + effective bonus received in the year. Not included all concepts. Not impacted by exchange rates.
A. Member of board of directors since 1 January 2023.
B. All amounts received were reimbursed to Fundación Botín.
C. Director since 1 April 2022.
D. Director since 20 December 2022.
E. Includes EUR 1,000 thousand for his role as non-executive Chair of Santander España and for Santander España board and committees meetings.
266
J. Summary of link between risk, performance and remuneration
Banco Santander's remuneration policy and its application in 2023 have promoted sound and effective risk management, at the same time as supported the fulfilment of long-term business objectives.
The key elements of the remuneration policy for executive directors making alignment between risk, performance and reward in 2023 were as follows:
Key words | Aspect aligning risk, performance and remuneration | ||||
| Metrics balance | The balance of quantitative metrics and qualitative assessments, including customer, risk, capital and profitability in relation to risk, used to determine the executive directors’ variable remuneration. | ||||
| Financial thresholds | The adjustment to variable remuneration if certain financial thresholds are not reached, which may limit the variable remuneration to 50% of the previous year's amount or lead to it not being awarded at all. | ||||
| Long-term objectives | The long-term objectives linked to the last three portions of the deferred variable remuneration. These objectives are directly associated with return to shareholders relative to a peer group, return on tangible equity (RoTE) and the five public targets linked to our Responsible banking agenda. | ||||
| Individual performance | The discretion of the board to consider the performance of each executive director in the award of their individual variable remuneration. | ||||
| Variable remuneration cap | 200% of fixed remuneration. | ||||
| Control functions involvement | The work undertaken by the human resources committee aided by senior managers leading Control functions in relation to the analysis of quantitative metrics information and undertaking qualitative analysis. | ||||
| Malus and clawback | Malus can be applied to unvested deferred pay and clawback can be applied to vested or paid compensation under the conditions dictated by the Group’s remuneration policy. | ||||
| Payment in shares | At least 50% of variable pay is in instruments and subject to retention or prohibition from exercise of at least one year from their delivery. | ||||
6.4 Directors' remuneration policy for 2024, 2025 and 2026
Remuneration policy principles and remuneration system
A. Directors’ remuneration in their capacity as such
Director’s remuneration is regulated by article 58 of Banco Santander’s Bylaws and article 33 of the Rules and regulations of the board of directors. For 2024, 2025 and 2026, no changes to the principles and composition of directors’ remuneration for supervisory and collective decision-making duties are planned with respect of those in 2023. They are described in sections 6.1 and 6.2.
B. Executive directors' remuneration
Executive directors are entitled to be paid the remuneration (e.g., salaries, incentives, bonuses, severance payments for early termination from such duties, and amounts to be paid by Banco Santander for insurance premiums or contributions to savings schemes) deemed appropriate for performing executive functions following a proposal from the remunerations committee and by resolution of the board of directors, subject to the limits set by law.
With the aim of simplifying the system, the number of steps for setting the yearly variable remuneration is reduced by converting the relative performance multiplier against the market into one of the elements of the qualitative assessment, instead of being an intermediate step between the result of quantitative metrics and the qualitative assessment.
However, to ensure that the multiplier is sufficiently relevant, its weight will be +/-10%, higher than the rest of the elements in the qualitative assessment (which will have a weight of +/-5%), after reducing the Network Collaboration item from +/-10% to +/-5% and merging compliance and risk into one.
Second, variable remuneration in 2024 for executive directors will be paid 50% in cash and 50% in instruments. The part to be received in instruments split as follows:
◦EUR 500,000 and EUR 420,000 in PagoNxt, S.L. RSUs for Ana Botín and Héctor Grisi, respectively.
◦The rest, all in shares of Banco Santander.
For the rest of the identified staff, variable remuneration will be paid 50% in cash and 50% in shares of Banco Santander.
Third, it is proposed to maintain the long-term performance metrics, prioritising in this way shareholder returns and the Group's profitability in the long-term, as well as sustainability of the balance sheet and its activities and how they are carried out. Therefore these metrics will be:
267
•Relative performance of Banco Santander's total shareholder return (TSR) compared to our peer group. Its weight will be 40% of the total.
•Return on tangible equity (RoTE), as an indication of long-term value creation. Its weight will be 40% of the total.
•Four ESG (environmental, social and governance) metrics linked to the progress we make on our targets to implement the Group's Responsible banking agenda. Their weight will be 20% of the total.
The maximum achievement ratio will remain at 125% so executives have the incentive to exceed their targets; however, the maximum achievement ratio for effectively paid remuneration will not exceed the thresholds approved at the AGM.
Additionally, with the aim of providing a strong alignment with PagoNxt's success, the Executive Chair and the Chief Executive Officer will continue to receive restricted stock units (RSUs) of PagoNxt, S.L.
The RSUs substitute part of their Santander variable pay instruments without increasing their total pay and will not represent more than 10% of their variable pay.
Specifically, as regards 2024, Ana Botín would receive the equivalent of EUR 500 thousand in RSUs, and Héctor Grisi would receive the equivalent of EUR 420 thousand in RSUs, in accordance with PagoNxt, S.L.'s long term incentive plan. Each RSU would grant the right to a share in PagoNxt, S.L. or the holding entity of its group (or its equivalent in cash) at the moment when, according to such plan, a liquidity event, a repurchase or a liquidation of such instruments takes place.
This plan is subject to the same principles of risk alignment, variable remuneration caps, deferrals and malus and clawback as the incentive which applies to executive directors described herein, but with payment being done in PagoNxt instruments.
Also, Banco Santander conducts an annual comparative review of executive directors’ and top management remuneration. In 2024, the peers that comprise the review are BBVA, BNP Paribas, Citi, Crédit Agricole, HSBC, ING, Itaú, Scotiabank and Unicredit, based on their market capitalization, global scale, brand recognition, geographical diversification, business model and regulatory framework. The incorporation of US and Brazilian banks is justified by the strong presence of Banco Santander in those countries, where Santander is listed (in the New York Stock Exchange and Brazilian Stock Exchange of São Paulo).
Our findings show that Banco Santander does not award its executive directors any remunerative components outside of common market practice.
Principle of equal pay for equal work and equal employment conditions for Santander executives and employees
Santander applies the equal pay principle included in the Corporate remuneration policy of Grupo Santander for executive directors and employees alike, which forbids any type of differential treatment that is not exclusively based on an assessment of performance results and corporate behaviours, and promotes equal pay for men and women.
Furthermore, our remuneration framework rewards Santander employees for their contribution based on such common principles as:
•Meritocracy: Non-discrimination based on sex, age, culture, religion or ethnicity.
•Consistency: Remuneration consistent with the level of responsibility, leadership and performance within the Group, to promote retention of key professionals and attract the best talent.
•Sustainability: A remuneration framework that is sustainable in terms of associated costs, cost control, and related objectives (as described in the policy) that ensure variable remuneration is commensurate with the Group's performance, disincentivize short termism and promote long-term sustainability. The remuneration scheme for the 1,152 identified staff also includes deferrals of up to 60% of variable remuneration, payment 50% in Santander instruments (subject to one-year retention) and malus and clawback clauses.
Also, performance objectives for annual variable remuneration have included since 2020 ESG components aligned with our Responsible banking goals. From 2022, with the purpose of increasing focus on the Group's responsible banking agenda and highlight sustainability as a core long-term strategy, ESG metrics are included (described in the next section) for the last deferred variable remuneration payments.
•Social responsibility: Employees’ pay cannot be lower than the legal minimum wage or the living wage in the country where they work. Additionally, in order to give our social responsibility prominence in remuneration, the Group’s responsible banking objectives for employee remuneration include the people financially included metric.
•Performance-based pay: Variable remuneration is subject to the achievement of (i) annual objectives (set out in section 6.4.B.ii.B), which reflect customer and profitability strategy, promote proper risk management and cost-effective capital allocation, and discourage short-term management focus; and (ii) long-term objectives (see section 6.4.B.ii.B), which support a sustainable balance sheet, shareholder return, the Group’s profitability and sustainability of the Group's activities and the way they are carried out.
Directors’ remuneration for 2024
A. Directors' remuneration in their capacity as such
In 2024, directors, in their capacity as such, will receive remuneration for supervisory and collective decision-making duties for a total of up to EUR 6 million as authorised by the shareholders at the April 2023 AGM (which will again be put to a vote at the 2024 AGM). It consists of:
•annual allocation, and
•attendance fees.
The board of directors, upon recommendation of the remuneration committee, approved to maintain the same amounts for annual allotments as those initially established for 2023 disclosed in section 6.2.B and C above, except for the responsible banking, sustainability and culture committee
268
(RBSCC), which will be updated to EUR 28 thousand, thus equalizing its remuneration to other committees of mandatory existence, considering the importance and complexity of the matters addressed in it, such as the supervision of non-financial information, which the RBSCC carries out in coordination with the audit committee.
Also, since the attendance fees have not been reviewed since 2016, the board of directors, upon recommendation of the remuneration committee, approved an increase of 4% in respect of 2023. This increase is applied to compensate for the higher time commitment (as indicated at the beginning of section 6.2 above) of board members, compared to those of other comparable banking groups.
Both updates would mean an effective total rise in total director Bylaw-stipulated emoluments and attendance fees received of less than 2%.
The specific amounts and the form of payment are determined by the board of directors in the manner described in section 6.2 above, based on the objective circumstances of each director.
Additionally, as indicated in the description of the director remuneration system, Banco Santander will pay its directors’ the corresponding civil liability insurance premium in 2024. The related policy is common to all executives and was taken out under usual market condition, proportionate to Banco Santander's situation.
B. Executive directors' remuneration for the performance of executive duties
i) Fixed remuneration components
A) Gross annual salary
On the remuneration committee’s recommendation, and due to the excellent business results and total shareholder return in 2023, in order to ensure a competitive remuneration compared to other peer groups, the board resolved to increase 5% the annual salary for Ana Botín and Héctor Grisi in 2024. The average remuneration of the Group’s staff in Spain has increased by 6% from 2022 to 2023 (+5% on a like for like basis).
Likewise, their gross annual salary amounts may increase owing to adjustments made to the fixed remuneration mix based on the criteria approved by the remuneration committee, provided this does not entail any cost increase for Banco Santander.
B) Other fixed remuneration components
•Benefit systems: defined contribution schemes as set out in section 'Benefit schemes'6.
•Supplement to fixed salary: Ana Botín will receive EUR 525,000 as a supplement to her fixed pay in 2023. This was approved in 2018 when the supplementary death and disability pension schemes were eliminated. Héctor Grisi will not receive any supplement of this kind.
•Social welfare benefits: executive directors will also receive social welfare benefits such as life insurance premiums, travel grants, medical insurance and the allocation of remuneration to employee loans, in accordance with Banco Santander’s
general policy for senior management, and in the same terms as the rest of employees.
•Likewise, the Bank makes available to directors the human and material means required or considered appropriate for carrying out their duties (including any travel required for the exercise of their role). Any eventual private use of these means by the executive directors is duly paid by them under the similar terms and conditions that would be applied to third independent party under the supervision of the audit committee. This information can also be found under the 'Benefit plans' section.
ii) Variable remuneration components
The board approved the policy on executive directors’ variable remuneration for 2024 on the remuneration committee's recommendation, based on the remuneration policy principles described under section 6.3.
Executive directors’ variable remuneration consists of a single incentive scheme, linked to the achievement of short-and long-term objectives. It is structured as follows:
•The final amount of variable remuneration will be set at the start of the following year (2025) based on the benchmark amount and subject to compliance with the annual objectives described under section B) below.
•40% of the incentive will be paid immediately once the final amount has been set, and 60% will be deferred in equal parts paid out over five years and subject to long-term metrics:
•The amount deferred over the first two years (24% of the total) will be paid in 2026 and 2027 on the condition that no malus clauses described under section 6.3 B v) are triggered.
•The amount deferred over the next three years (36% of the total) will be paid in 2028, 2029 and 2030, on the condition that no malus clauses are triggered and long-term targets –described in section D) Deferred incentive subject to long-term performance objectives– are met.
The Group can clawback incentives already paid in the cases and during the term set out in its malus and clawback policy, described under section 6.3 B v).
Exceptionally, when a new executive director joins Banco Santander, his/her variable pay may include a sign-on bonus and/or buyouts.
Variable components in executive directors’ total remuneration for 2024 cannot exceed the limit of 200% of fixed components submitted for approval to the 2024 AGM. However, under EU regulations on remuneration, certain variable components can be excluded.
The proportion of fixed and variable remuneration elements of Banco Santander executive directors is due to the European regulation set out in the CRD V directive. In this sense, the setting of higher fixed amounts than other executive directors of non-EU banks within our peer group is due precisely to the non-requirement of this limit 2:1 of variable/fixed components for non-EU banks.
6 As indicated in the next section, executive directors contribution to the benefit systems includes both fixed and variable components
269
A. Variable remuneration benchmark
Variable remuneration for executive directors in 2024 will be set based on a standard benchmark contingent upon the full achievement of their set individual targets, which for 2024 among others include, both for the Executive Chair and the CEO, pushing capital contribution and sustainability targets.
The board of directors may revise the variable pay benchmark on the remuneration committee’s recommendation and following market and internal contribution criteria. Specifically for 2024, the board of directors, upon recommendation of the remuneration committee, has resolved to increase in 5% their target bonuses. The average remuneration of the Group’s staff in Spain has increased by 6% from 2022 to 2023 (+5% on a like for like basis).
B. Setting of final variable remuneration based on yearly results
Based on that standard benchmark, 2024 variable remuneration for executive directors will be based on this updated corporate bonus scheme proposal:
•Three categories of quantitative metrics (business transformation, profitability and capital) to increase alignment with shareholder value creation and capital generation.
•A qualitative assessment with four components, which includes the regulatory requirements and the needs and concerns of our stakeholders: risk, compliance, network collaboration and ESG matters and, as a new feature this year, a relative performance assessment against the market in the main financial metrics, which comes from the multiplier applied in 2023 as an intermediate step between the quantitative metrics and the qualitative assessment but which is now integrated into the qualitative assessment to simplify the process. This relative performance assessment will have a greater weight than the other elements of the qualitative assessment, to highlight the importance of beating the market. The assessment cannot raise or lower the above result by more than 25%.
•An exceptional adjustment that must be duly supported and may involve changes owing to control and/or risk deficiencies, negative assessments from supervisors or unexpected material events.
Capital generation will continue to be an important part of key employees’ remuneration (including executive directors) in order to ensure an efficient use of capital, alongside RoTE, which we are keeping in the scorecard to incentivize sustainable, long-term growth. Customers continue to be part of the quantitative metrics, with special focus on active customers. A specific metric on costs (instead of operative cost per active customer) is also included to highlight the relevance of appropriate management of costs to succeed in transformation.
Accordingly, the proposed quantitative metrics and weightings are:
| Category | Quantitative metricsA | ||||
Transformation: Weight: 45% | Total and active customers (growth) (Weight: 20%) | ||||
Costs (Weight: 15%) | |||||
Revenue per active customer (Weight: 10%) | |||||
Capital Weight: 30% | CET1 ratio | ||||
Profitability Weight: 25% | RoTE (Return on tangible equity) | ||||
A. For this purpose, these metrics may be adjusted upwards or downwards by the board, following a proposal from the remuneration committee, when inorganic transactions, material changes to the Group’s composition or size or other extraordinary circumstances (such as impairments, extraordinary impacts of macroeconomic environment, regulatory changes or restructuring procedures) have occurred which affect the suitability of the metric and achievement scale established in each case and resulting in an impact not related to the performance of the executive directors and executives being evaluated.
And finally, to the result obtained above, we add or subtract the qualitative assessment according to this table:
| Qualitative assessment | Weight | ||||
Performance vs. Market | '+/-10% | ||||
Compliance and Risk | +/-5% | ||||
| Network collaboration | '+/-5% | ||||
| ESG targets | +/-5% | ||||
Lastly, as additional conditions for determining the incentive, the following circumstances must be confirmed to set variable pay:
•If the Group’s ONP for 2024 were 50% less than in 2023, variable pay would in no case exceed 50% of the benchmark incentive for 2024.
•If the Group’s ONP were negative, the incentive would be zero.
When setting individual bonuses, the board will also consider restrictions to the dividend policy imposed by supervisors.
C) Forms of payment of the incentive
Variable remuneration of executive directors will be paid 50% in instruments, split as:
•the amount of PagoNxt RSUs set for each year (which cannot exceed 10% of their variable pay); and
•the rest, all in shares of Banco Santander.
One portion will be paid in 2025 and the other will be deferred for five years and contingent on long-term metrics:
a)40% of variable remuneration is paid in 2025 net of tax, with 50% in cash and 50% in instruments.
b)60% paid, if applicable, in five equal parts in 2026, 2027, 2028, 2029 and 2030 (net of tax), with 50% in cash, 50% in instruments, under the conditions stipulated in section E).
270
The final three payments will also be subject to long-term objectives described in section D) below.
Shares shall be subject to a three-years retention period, unless the executive directors already hold shares for an amount equivalent to 200% of their fix annual remuneration -in which case the regulatory one year retention period will apply.
Additionally, 2023 AGM approved to increase the number of trading sessions used to determine the share price used for executive directors and identified staff bonus from 15 to 50, to soften the impact on the share price of events (positive or negative) that may occur within a short period. Under the Remuneration policy for 2023 and beyond, the maximum number of shares will be calculated based on the daily volume-weighted average of the weighted average Santander share price in the 50 trading sessions before the last Friday (not included) before the board meeting at which executive directors’ bonus is agreed.
D) Deferred variable pay subject to long-term objectives
As indicated above, the amounts deferred in 2028, 2029 and 2030 will be paid on the condition that the group achieves its long-term targets for 2024-2026, in addition to the terms described in section E).
As advanced in section B) on the principles of the remuneration policy, the long-term targets are:
a.Banco Santander’s consolidated Return on tangible equity (RoTE) target in 2026. The RoTE ratio for this target is obtained as follows:
RoTE in 2026 (%) | ‘RoTE Ratio' | ||||
≥ 18% | 1.5 | ||||
≥ 15% but <18% | 0 – 1.5A | ||||
< 15% | 0 | ||||
A. Straight-line increase in the RoTE ratio based on the percentage of specific RoTE in 2026 within this bracket of the scale.
To verify compliance with this objective, the board, following a proposal from the remuneration committee, may adjust it to remove the effects of any regulatory change to its calculation rules or any extraordinary circumstances (such as impairments, corporate transactions, share buybacks or restructuring procedures) that have occurred which affect the suitability of the metric and achievement scale established in each case and resulting in an impact not related to the performance of the executive directors and executives being evaluated.
b. Relative performance of Banco Santander's total shareholder return (TSR) in 2024-2026 in respect of the weighted TSR of a peer group comprising 9 credit institutions, with the appropriate TSR ratio based on the group’s TSR among its peers.
Ranking of Santander TSR | 'TSR Ratio' | ||||
The100th percentile | 1.5 | ||||
Between the 75th and 100th percentiles (not inclusive) | 1 – 1.5A | ||||
Between the 40th and 75th percentiles (not inclusive) | 0.5 - 1A | ||||
| Less than the 40th percentile | 0 | ||||
A. Increase in the TSR ratio proportional to the number of positions moved up in the ranking.
TSR7 measures the return on shareholders’ investment. It is the sum of the change in share price plus dividends and other similar items shareholders can receive during the period.
The peer group comprises BBVA, BNP Paribas, Citi, Credit Agricole, HSBC, ING, Itaú, Scotiabank and Unicredit.
c. ESG (environmental, social and governance) metrics.
Achievement will depend on the progress made on the Group's Responsible Banking actions lines and associated targets (described below)8:
1.Women in senior executive positions by 2026:
Women in senior executive positionsB (%) | Coefficient | ||||
≥ 37% | 1.25 | ||||
≥ 36% but < 37% | 1 – 1.25A | ||||
≥ 34% but < 36% | 0 – 1A | ||||
< 34% | 0 | ||||
A. Increase of the coefficient is proportional to its position on this line of the scale.
B. Senior leadership positions make up 1% of the total workforce.
2.Financial inclusion between 2024 and 2026:
Financial inclusionB (millions of people) | Coefficient | ||||
≥ 6.3 | 1.25 | ||||
≥ 5.3 but < 6.3 | 1 – 1.25A | ||||
≥ 3.5 but < 5.3 | 0 – 1A | ||||
< 3.5 | 0 | ||||
A. Increase of the coefficient is proportional to its position on this line of the scale.
B. Number of people unbanked, underbanked, in financial distress or with difficulty to access credit to whom we provide tailored access and finance solutions, aiming to meet local financial inclusion needs in a recurrent, comprehensive, affordable and effective way.
7TSR refers to the difference (%) between the final and initial values of capital invested in ordinary shares of Banco Santander. The final value is calculated based on the dividends or other similar concepts (such as the Santander Scrip Dividend programme) shareholders receive for this investment during the corresponding period -as if they had invested in more shares of the same type at the first date on which the dividend or similar concept was payable to shareholders- and the weighted average share price at that date. To calculate TSR, the weighted average daily volumes of the weighted average listing prices for the fifteen trading sessions prior to 1 January 2024 (exclusive) is considered (to calculate the initial value) and the fifteen trading sessions prior to 1 January 2027 (exclusive) (to calculate the final value).
8 There are thresholds that go beyond current public targets, which should not be considered a revision of them, but a way to further motivate our management team, in order to progress beyond targets on ESG main strategic lines.
271
3.Socially responsible investment in 2026 as a percentage of total assets under management.
Socially responsible investmentB (%) | Coefficient | ||||
≥ 21% | 1.25 | ||||
≥ 18% but < 21% | 1 – 1.25A | ||||
≥ 15% but < 18% | 0 – 1A | ||||
< 15% | 0 | ||||
A. Increase of the coefficient is proportional to its position on this line of the scale.
B. Assets under management that meet the criteria of Santander’s Sustainable Finance and Investment Classification System (SFICS).
4.Supporting transition. This goal includes how we support our customers' transition, and the fulfilment of a transition plan:
Business raised and facilitatedB between 2024 and 2026 (EUR bn) | Coefficient | ||||
≥ 180 | 1.25 | ||||
≥ 150 but < 180 | 1 – 1,25A | ||||
≥ 110 but < 150 | 1 | ||||
< 110 | 0 | ||||
A. Increase of the coefficient is proportional to its position on this line of the scale.
B. Grupo Santander's contribution to our customers’ transition (2024-2026): CIB green finance raised and facilitated (public target), Retail & Commercial banking green finance and sustainable linked-loans, and Digital Consumer Bank green finance..
To achieve beyond 100% of this goal, it is necessary to deliver on a comprehensive and credible transition plan (it will work as an underpin). This plan will include improving climate data, progressing on actions to decarbonize portfolios, enhancing sustainable product offering to address market needs, further embedding climate and environmental risk, and active engaging to support policy action and market developments.
Each ESG goal has a different weighting:
1.Women in senior executive positions: 20%
2. Financial inclusion: 20%
3. Socially responsible Investment: 10%
4. Supporting transition: 50%
C = (20% Goal 1 +20% Goal 2 +10% Goal 3 +50% Goal 4)
Finally, the following formula will be used to set the annual amount of performance-based deferred variable remuneration in 2028, 2029 and 2030 ('final annuity'), without prejudice to any adjustment deriving from the application of the malus policy (see section 6.3 B v):
Final annuity = Amt. x (2/5 x A + 2/5 x B + 1/5 x C)
where:
•'Amt.' is one third of variable remuneration deferred conditional on performance (i.e. Amt. will be 12% of the total incentive set in early 2025).
•‘A' is the RoTE coefficient according to the scale in the table above, based on RoTE at year-end 2026.
•'B' is the TSR ratio calculated as the scale in the table above, according to the relative performance of Banco Santander’s TSR within its peer group in 2024-2026.
•‘C’ is the coefficient resulting from the sum of weighted coefficients for each of the four Responsible banking targets for 2026 (see section (c) above).
•In any event, if the result of (2/5 x A + 2/5 x B +1/5 x C) is greater than 1.25, the multiplier will be 1.25.
The estimated maximum amount to be delivered in instruments to executive directors is EUR 11.5 million.
E) Other terms of the incentive
Payment of the deferred amounts (including those linked to long-term targets) will occur only if they remain in the Group and none of the circumstances triggering malus clauses arise (as per the malus and clawback section in the Group’s remuneration policy) under terms similar to those indicated for 2023 (detailed in section 6.3 B v)), policy expanded in 2023 to adapt it to the new regulation of US Securities Exchange Commission. Furthermore, the group can claw back paid incentives under the scenarios, period and terms and conditions set out in the remuneration policy.
Hedging the value of Santander shares received during the retention and deferral periods is expressly prohibited.
The effect of inflation on the deferred amounts in cash may be offset.
Selling shares is also prohibited for at least one year since the delivery.
The remuneration committee may propose to the board adjustments in variable remuneration under exceptional circumstances owing to internal or external factors, such as requirements, orders or recommendations issued by regulatory or supervisory bodies. Such adjustments will be described in detail in the report on the remuneration committee and the annual report on directors’ remuneration put to a non-binding vote at the annual general meeting.
iii. Shareholdings
As described in section 6.3.E, in addition to the regulatory obligation not to sell shares they receive as remuneration for a year since from their award date, in order to comply with recommendation 62 of the Spanish Corporate Governance Code, the policy on shareholdings includes the obligation for executive directors not to sell the shares they receive as variable remuneration for a period of three years from their award date, unless the executive director already holds Banco Santander shares for an amount equivalent to twice his/her annual salary.
Directors’ remuneration for 2025 and 2026
A. Directors’ remuneration in their capacity as such
For 2025 and 2026, no changes to directors’ remuneration are planned in respect of what is foreseen herein for 2024. However, shareholders at the 2025 or 2026 annual general meeting may approve an amount higher than the six million euros currently in force, or the board may approve an alternative allocation of that amount to directors in accordance with the criteria in article 58.2 of Banco Santander’s Bylaws (i.e. duties and responsibilities; positions held on the board; membership and attendance at committee meetings; and other objective circumstances).
272
B. Directors' remuneration for the performance of executive duties
Executive directors’ remuneration will conform to principles similar to those applied in 2024, with the following changes.
i) Fixed components of remuneration
A) Gross annual salary
Executive directors’ annual gross fixed pay may be adjusted each year based on the criteria approved by the remuneration committee at any given time. For 2025 and 2026, the maximum increase of gross annual salary will be 5% in respect of the previous year for each executive director. Likewise, the gross annual salary may be increased above that threshold as a result of adjustments to the mix of fixed components, provided that such modification does not entail an increase in costs for the Group.
The 5% increase mentioned above may also be higher for one or several directors provided that, when applying the rules or requirements or supervisory recommendations, and if so proposed by the remuneration committee, it is appropriate to adjust their remuneration mix and, in particular, their variable remuneration, in view of the functions they perform. This should not increase executive directors’ total remuneration.
Otherwise, it must be disclosed in the report on the remuneration committee and the annual report on director's remuneration put to a non-binding vote at annual general meeting.
B) Other fixed remuneration components
No changes planned in respect of the terms for 2024.
ii) Variable remuneration components
The policy on executive directors’ variable remuneration for 2025 and 2026 will be based on the same principles as in 2024, following the same single-incentive scheme described above, and subject to the same rules of operation and limitations.
A) Setting variable remuneration
Executive directors’ variable remuneration for 2025 and 2026 will be set based on the corporate bonus pool and a benchmark approved for each year which takes into account:
•a set of short-term quantitative metrics measured against annual objectives and aligned with the Group’s strategic plan. These metrics will also cover, at least, shareholder return targets, capital and customers. They can be measured at Group level and, where applicable, at division level, for a specific business division headed by an executive director. The results of each metric can be contrasted with the budget for the financial year, as well as with growth from the previous year.
•a qualitative assessment that cannot raise or lower the result of the quantitative metrics by more than 25%. It will be conducted for the same categories as the quantitative metrics, including relative performance against market, risk management, compliance, network collaboration and ESG targets.
•an exceptional adjustment that must be duly substantiated and may involve changes owing to control and/or risk shortfalls, negative assessments from supervisors or unexpected material events.
The quantitative metrics, the qualitative assessment and potential extraordinary adjustments will ensure main objectives are considered from the perspective of the various stakeholders and that the importance of risk and capital management is factored in.
Once the corporate bonus pool is fixed according to the criteria above, the board of directors, further to a proposal from the remunerations committee, decides on the individual bonus, taking into consideration the level of achievement of their individual objectives, which in general terms coincide with the bonus pool metrics, their compliance with corporate values and risk culture.
Lastly, the following circumstances must be confirmed to set variable remuneration:
•If ONP does not reach a certain compliance threshold, the incentive cannot exceed 50% of the year’s incentive benchmark.
•If the group’s ONP were negative, the incentive would be zero.
•When setting individual variable pay, the board will also consider restrictions to the dividend policy imposed by supervisors.
B) Forms of payment of the incentive
The variable remuneration of executive directors for 2025 and 2026, will be paid as follows:
•50% in cash;
•and 50% in instruments, split as follows:
•the amount of PagoNxt, S.L. RSUs set for each year (as described below); and
•the rest, all shares of Banco Santander, S.A.
It is also envisaged that for 2025 and 2026 Ana Botín would receive the equivalent of EUR 500 thousand in RSUs, and Héctor Grisi would receive the equivalent of EUR 420 thousand in RSUs, in accordance with PagoNxt, S.L.'s long term incentive plan. Each RSU would grant the right to a share in PagoNxt, S.L. or the holding entity of its group (or its equivalent in cash) at the moment when, according to such plan, a liquidity event, a repurchase or a liquidation of such instruments takes place.
The RSUs will substitute part of their Santander variable pay instruments without increasing their total pay and will not represent more than 10% of their variable pay in any event.
C) Deferred variable remuneration subject to long-term objectives
The last three annual payments of each deferred variable remuneration amount will be made in accordance with the terms described under section E) above and if the Group fulfils long-term objectives for at least three years. This may confirm, reduce or increase payment amounts and the number of deferred instruments.
Long-term metrics will, at least, cover value creation and shareholder returns as well as capital and sustainability over a minimum period of three years. They will be aligned with the Group’s strategic plan and main priorities towards its stakeholders. They can be measured for the entire Group or by
273
country or business, when appropriate, and subsequently compared to a group of peers.
The portion paid in shares cannot be sold until one year has elapsed since delivery.
D) Other terms of the incentive
No changes to the continuity, malus and clawback clauses of the remuneration policy for 2024 described in section 6.4.B.E are expected. Furthermore, no changes are planned in respect of the clauses on hedging instruments or the deferred amounts in cash adjusted for inflation.
iii) Shareholdings
The policy on shareholdings approved in 2016, with the amendment introduced in 2020 relating to not selling the shares they receive as variable remuneration for a period of three years detailed in section 6.3.E above will apply in 2025 and 2026, unless the remuneration committee proposes it be amended to the board in light of exceptional circumstances (regulations, orders or recommendations from regulators or supervisors). Such amendments would be described in detail in the report on the remuneration committee and the annual report on director’s remuneration put to a non-binding vote at the annual general meeting.
iv) Principle of equal pay
The same principle of equal pay that applies for executive directors and any other Santander employee described in respect of 2024 apply for 2025 and 2026.
Terms and conditions of executive directors’ contracts
Executive directors’ terms of service are governed by board-approved contracts they sign with Banco Santander. The basic terms and conditions, besides those relating to the remuneration mentioned above, are the ones described herebelow.
A. Exclusivity and non-competition
Executive directors may not contract with other companies or entities to perform services, unless expressly authorised by the board of directors. In all cases, they are bound by a duty of non-competition in relation to companies and activities similar in nature to Banco Santander and its consolidated group.
In addition, executive director contracts impose prohibitions on competing and attracting customers, employees and suppliers, which can be enforced for two years after their termination in their executive duties for reasons other than a breach by Banco Santander. In regard to Ana Botín and Héctor Grisi, the compensation to be paid by Banco Santander for this duty of non-competition is twice the amount of the fixed remuneration.
B. Code of Conduct
Executive directors are obliged to adhere strictly to the group’s General Code and the Code of Conduct in Securities Markets, especially in terms of confidentiality, professional ethics and conflicts of interest.
C. Termination
The length of executive directors' contract is indefinite. Contracts do not provide for any severance payment upon termination apart from what the law provides.
If Ana Botín’s contract is terminated by Banco Santander, she must remain available to the group for four months in order to ensure proper transition. During this period, she would continue to receive her gross annual salary.
D. Benefit plans
Executive directors participate in the defined contribution pension scheme created in 2012. It covers retirement, disability and death. Banco Santander makes annual contributions to executive directors’ benefit plans schemes. Annual contributions are calculated in proportion to executive directors’ pensionable bases, and the Group will continue to make them until the executive directors’ leave the Group or until their retirement within the Group, their death or disability. The pensionable base of executive directors’ annual contributions is their fixed remuneration plus 30% of the average of their last three variable remuneration amounts. For Héctor Grisi, the average for the first three years will be calculated according to these criteria:
•For 2023, his gross variable remuneration agreed in that exercise.
•For 2024, the average of his gross variable remuneration agreed for 2023 and 2024 exercises.
•For 2025, the average of his gross variable remuneration agreed for 2023, 2024 and 2025 exercises.
Contributions will be 22% of pensionable bases.
The pension amount that corresponds to contributions linked to variable remuneration will be invested in Santander shares for five years from the earlier of the date of retirement or cessation. It will be paid in cash after the five years have elapsed or on the retirement date (if later). Moreover, the malus and clawback clauses for variable remuneration contributions will apply for the same period as the related bonus or incentive.
This benefit plan is outsourced to Santander Seguros y Reaseguros, Compañía Aseguradora, S.A. Executive directors’ economic rights under the scheme belong to them even if they are not active in the group at the time of their retirement, death or disability. Their contracts do not provide for any severance pay upon termination apart from what the law provides and in the case of pre-retirement, the aforementioned annual allotment.
E. Insurance and other remuneration and benefits in kind
Ana Botín will receive the supplement to their fixed remuneration approved when the supplementary life and health benefits were eliminated in 2018. It will be paid in 2024, 2025 and 2026 in the same amount and continue to be paid until they reach retirement age (even if they are still active).
The Group has life and health insurance policies taken out for directors. Insurance premiums for 2024 include standard life insurance and the life insurance cover with the supplement to their fixed remuneration mentioned above. In 2025 and 2026, premiums could vary if directors’ fixed pay or actuarial circumstances change.
Furthermore, executive directors are covered by Banco Santander’s civil liability insurance policy and may receive other benefits in kind (such as employee loans) pursuant to the
274
group’s general policy and subject to the corresponding tax treatment.
Likewise, the Bank makes available to directors the human and material means required or considered appropriate for carrying out their duties (including any travel required for the exercise of their role). Any eventual private use of these means by the executive directors is duly paid by them under the similar terms and conditions that would be applied to third independent party under the supervision of the audit committee
F. Confidentiality and return of documents
Directors are bound to a strict duty of confidentiality during their relationship and subsequent to termination. Executive directors are required to return any documents and items relating to their activities and in their possession to Banco Santander.
Agreements with non-executive members of the board
José Antonio Álvarez has a contract (effective from 1 January 2023) to assist in the handover to the new CEO and to attend executive risk committee meetings and engaging supervisors, international bodies, sector organizations and others in institutional matters as necessary, for which he receives a fixed remuneration of EUR 1,750 thousand. This is an annual contract which has been renewed for the year 2024.
Luis Isasi has a contract since 4 April 2020 to act as non-Executive Chair of the board of Santander España (for which he receives EUR 925 thousand a year) and to serve as a member of the board of Santander España (for which he receives EUR 75 thousand a year). His contract is permanent and does not entitle him to any compensation if terminated.
Appointment of new executive directors
The components of remuneration and basic structure of the agreements described in this remunerations policy will apply to any new director that is given executive functions at Banco Santander, notwithstanding the possibility of amending specific terms of agreements so that, overall, they contain conditions similar to those previously described.
Directors’ total remuneration for executive duties cannot exceed the highest remuneration received by the group’s current executive directors under the remuneration policy approved by shareholders. The same rules apply if a director assumes new duties or becomes an executive director.
If a director takes up executive functions in a specific division or local unit, the board of directors, on the remuneration committee's recommendation, can adapt the metrics for setting and paying incentives to take that division or local unit into account in addition to the Group.
Remuneration paid to directors in that capacity will be included within the maximum amount set by shareholders to be distributed by the board of directors in the terms described above.
A new director coming from an entity outside Grupo Santander could be paid a buyout to offset any variable remuneration foregone for having accepted a contract with the group; and/or a sign-on bonus for leaving to join Banco Santander.
This compensation could be paid fully or partly in shares, depending on the delivery limits approved at the annual general shareholders' meeting. Authorization is expected to be sought at the next general shareholders’ meeting in order to deliver a maximum number of shares to any new executive directors or employees to whom buyout regulations apply.
Furthermore, sign-on bonuses can only be paid once to new executive directors, in cash or in shares, and in each case they will not exceed the sum of the maximum variable remuneration awarded for all executive directors.
Mr Grisi’s appointment as CEO (with effect from 1 January 2023) did not entail a buyout or sign-on bonus since he was already part of Grupo Santander.
Temporary exceptions to the remuneration policy
According to section 6 of Article 529 novedecies of the Spanish Companies Act, specific exceptions may apply to components in the remuneration policy, based on particular business needs or macroeconomic context in the Group's geographies, provided that they are required to serve the long-term interests and sustainability of the entity; ensure its viability; and require to be adopted urgently.
Such exceptions include:
•Complex macroeconomic scenarios where the ordinary course of the business is severely impacted.
•The appointment of a new Executive Chair or chief executive officer, or the need to retain an executive director to avoid a vacancy at the head of the Group (vacatio regis) during especially complex times for the business.
•The need to adapt to regulatory change.
To apply, exceptions must be supported by:
•a reasoned remuneration committee proposal; and
•board of directors analysis and approval.
Any applied exception will be explained in the Annual report on directors' remuneration.
6.5 Preparatory work and decision-making for the remuneration policy; remuneration committee involvement
Section 4.7 'Remuneration committee activities for 2023', (the report on the remuneration committee) states:
•Pursuant to Banco Santander’s Bylaws and the Rules and regulations of the board of directors, the duties relating to the remuneration of directors performed by the remuneration committee.
•How the remuneration committee is composed on the date the report is approved.
•The number of meetings it had in 2023, including joint sessions with the risk, compliance and regulation supervision committee.
275
•The date of the meeting in which the report was approved.
The 2022 annual report on directors’ remuneration was approved by the board of directors and put to a binding vote at the 2023 AGM, with 89.22% of the votes in favour. The tally of the votes was:
Number | % of totalA | |||||||
| Votes | 11,087,900,806 | 99.74 | % | |||||
Number | % | |||||||
Votes forB | 9,886,665,679 | 89.22 | % | |||||
Votes againstB | 1,194,192,063 | 10.78 | % | |||||
BlankC | 7,043,064 | 0.06 | % | |||||
AbstentionsC | 29,058,164 | 0.26 | % | |||||
A. Percentage on total valid votes and abstentions.
B. Percentage of votes for and against.
C. Percentage of share capital present and attending by proxy at the ordinary shareholders’ meeting.
Decision process for the development, review and application of the policy
Pursuant to Article 529 novodecies of the Spanish Companies Act, the remuneration committee issues the report on the proposed remuneration policy for 2024, 2025 and 2026 herein. The board of directors then submits it to the 2024 AGM as a separate item on the agenda and an integral part of this text. See section 6.4 'Directors' remuneration policy for 2024, 2025 and 2026'.
Banco Santander’s Compensation function prepares the remuneration policy with the suggestions, requests and comments received during the year from the human resources committee, remuneration committee and the board of directors. A first draft of the policy is submitted to the remuneration committee for review every January. The review considers the suggestions, requests and comments the Chair and lead independent director receive through shareholder and stakeholder engagement during the year on our corporate governance and our remuneration structures. Regulators’ recommendations and legal requirements that may have come to light since the last time the director remuneration policy was submitted for approval by the annual general meeting are also considered.
The committee also makes sure the policy is consistent with the Group's culture and our Simple, Personal and Fair values. The Compensation function then prepares the final draft for the remuneration committee to submit to the board of directors for approval in February.
Based on the analysis carried out in the context of the 2023 annual remuneration report elaboration and its continued
supervision of the remuneration policy, the remuneration committee believes the director remuneration policy for 2024, 2025 and 2026 which is included in section 6.4 above is consistent with the principles of Banco Santander’s remuneration policy and its remuneration scheme set out in the Bylaws.
The policy aims, among other aspects, (i) to maintain a simple executive remuneration scheme, with three categories of quantitative metrics (business transformation, profitability and capital) to further align with value creation and capital generation; (ii) outperform peers in value creation aspects; and, (iii) regarding metrics linked to multiyear objectives, to prioritize long-term profitability for shareholders and Santander and a sustainable balance sheet (total shareholder return, RoTE and ESG-related metrics related to our responsible banking targets) in order to follow best market practice and meet our stakeholders’ needs.
In 2023, no deviations from, or temporary exceptions to, the application of the remuneration policy occurred.
6.6 Remuneration of non-director members of senior management
2023 variable remuneration was approved by the board of directors on 30 January 2024 in view of the recommendation from the 29 January 2024 remuneration committee. It was set according to Banco Santander’s general remuneration policy as well as specific details pertaining to senior management.
In general, senior management variable remuneration packages were calculated with the quantitative metrics and qualitative assessment used for executive directors (see section 6.3 B ii).
Some contracts of members of senior management were amended in 2018 in the same manner described under 6.3.D in respect of Ana Botín, with a pension scheme of 22% of their pensionable bases, the elimination of supplementary benefits, an increase of the insured sum of life insurance and a supplement to fixed remuneration in cash which is included under "Other remuneration".
The following table shows the amounts of short term remuneration (immediately payable) and deferred remuneration (not linked to multi year targets) for senior management as of 31 December 2023 and 2022, excluding those of executive directors. This amount has been reduced by 38% compared to that reported in 2014 (EUR 80,792 thousand):
EUR thousand | |||||||||||||||||||||||
Short-term and deferred salary remuneration | |||||||||||||||||||||||
Year | Number of people | Fixed | Immediately receivable variable remuneration (50% in instruments)A | Deferred variable remuneration (50% in instruments)B | Pension contributions | Other remunerationC | Total | ||||||||||||||||
| 2023 | 14 | 17,109 | 14,711 | 6,439 | 4,775 | 7,135 | 50,169 | ||||||||||||||||
| 2022 | 14 | 18,178 | 15,466 | 6,797 | 5,339 | 6,956 | 52,736 | ||||||||||||||||
A. The amount immediately payable in 2023 was 1,568 thousand Santander shares and 1,386 thousand Santander share options (2,504 thousand Santander shares in 2022).
B. The deferred amount for 2023 will be 700 thousand Santander shares and 555 thousand Santander share options (1,010 thousand Santander shares in 2022).
C. Includes life insurance premiums, health insurance and relocation packages, other remuneration items and RSUs of PagoNxt S.L., as members of board of directors of this entity .
276
The share price for 2023 variable remuneration is EUR 3.793. With this price set, the share options are worth EUR 1.016.
This table breaks down remuneration linked to multi-year targets for senior management (excluding executive directors) at 31 December 2023 and 2022, which they will only receive if they meet the terms of continued service; non-applicability of malus clauses; and long-term goals are met during deferral periods.
Thousands of euros | ||||||||
Year | Number of people | Deferred variable remuneration subject to long-term metricsA (50% in instruments)B | ||||||
| 2023 | 14 | 6,761 | ||||||
| 2022 | 14 | 7,137 | ||||||
A. In 2023, this corresponds to the fair value of maximum annual payments for 2027, 2028 and 2029 in the eighth cycle of the plan for deferred variable remuneration linked to multi-year targets. In 2022, this corresponds to the estimated fair value of maximum annual payments for 2026, 2027 and 2028 in the seventh cycle of the plan for deferred variable pay linked to multi-year targets. Fair value in the plan was determined on the authorization date based on the valuation report of independent expert Willis Towers Watson. Based on the plan for 2023 and success levels of similar plans at peer entities, the fair value was considered to be 70% of the value linked to long-term metrics.
B. The number of shares in Santander as deferred variable pay subject to long-term metrics shown in the table above was 735 thousand shares in 2023 and 582 Santander share options (1,156 thousand shares in Santander in 2022).
The long-term goals are the same as those for executive directors. They are described in section 6.3 B iv).
Additionally, members of senior management who stepped down from their roles in 2023 consolidated salary remuneration and other remuneration for a total amount of EUR 3,560 thousand (EUR 3,691 thousand in 2022). In 2023 they did not generate any right regarding variable pay subject to long-term objectives (this right has been generated in 2022 for a total amount of EUR 447 thousand).
The board of directors approved the 2023 Digital Transformation Incentive which is a variable remuneration scheme split in two different blocks which delivers PagoNxt, S.L. RSUs and premium priced options (PPOs), and is aimed at up to 50 employees whose roles are considered key to PagoNxt’s success, including 1 senior executive who will receive EUR 200 thousand under it.
See note 46 to the 2023 Group's consolidated financial statements for further information on the Digital Transformation Incentive.
In 2023, the ratio of variable to fixed pay components was 120% of the total for senior managers, well within the maximum limit of 200% set by shareholders.
6.7 Prudentially significant disclosures document
On the remuneration committee’s recommendation, the board approves the key remuneration elements of managers or employees who, while not belonging to senior management, take on risks, carry out control functions (i.e. internal audit, risk management and compliance) or who receive global remuneration that places them in the same remuneration bracket as senior management and employees who take on risk. These are typically those whose professional activities may have an important impact on the Group's risk profile (all of these, together with the senior management and Banco Santander's board of directors form the so called 'Identified Staff' or 'Material Risk Takers')
Every year, the remuneration committee reviews and, where applicable, updates identified staff in order to include individuals within the organization who qualify as such. The Remuneration Policies chapter in the 2023 Pillar III disclosures report9 of Banco Santander, S.A. explains the criteria and regulations followed to identify such staff.
At the end of 2023, 1,152 Group executives (including executive directors and non-director senior managers) were considered identified staff (1,029 in 2022), which accounts for 0.54% of the total final workforce (0.50% in 2022).
Identified staff have the same remuneration standards as executive directors (see sections 6.1 and 6.3), except for:
•Category-based deferral percentages and terms.
•The possibility in 2023 of certain less senior manager categories of only having deferred variable pay subject to malus and clawback clauses (and not to long-term targets).
•The portion of variable remuneration paid or deferred as shares for Group executives in Brazil, Chile and Poland that can be delivered in shares or similar instruments of their own listed entities (as in previous years).
In 2024, the board will maintain its flexibility to determine full or partial payment in shares or similar instruments of Banco Santander and its subsidiaries in the proportion it deems appropriate (according to the maximum number of Santander shares allocated at the general meeting and to any regulatory restrictions in each jurisdiction).
The aggregate amount of variable remuneration for identified staff in 2023, the amounts deferred in cash and instruments, and the ratio of the variable to fixed remuneration components are explained in the remuneration policies chapter of Banco Santander’s Pillar III disclosures report for 2023.
9 The 2023 Pillar III disclosures report can be found on our corporate website.
277
7. Group structure
and internal governance
and internal governance
Grupo Santander is structured into legally independent subsidiaries whose parent company is Banco Santander, S.A. Its registered office is in Santander (Cantabria, Spain), while its corporate centre is located in Boadilla del Monte (Madrid, Spain). It has a Group-Subsidiary Governance Model (GSGM) and good governance practices in place for its core subsidiaries. Any references to subsidiaries in this section are to the Group’s most prominent entities.
The key features of the GSGM are:
•The subsidiaries’ governing bodies must ensure their rigorous and prudent management and economic solvency while pursuing the interests of their shareholders and other stakeholders.
•The subsidiaries are managed locally by teams that possess extensive knowledge on, and experience with, their customers and markets, while benefiting from the synergies and advantages of belonging to the Group.
•The subsidiaries are subject to local authority regulation and supervision, although the ECB supervises the Group overall.
•Customer funds are secured by the deposit guarantee schemes in the subsidiaries’ countries and are subject to local laws.
The subsidiaries finance their own capital and liquidity. The Group’s capital and liquidity are coordinated by corporate committees. Intra-group risk transactions are limited, transparent and carried out under market conditions. Grupo Santander retains a controlling interest in subsidiaries listed in certain countries.
Each subsidiary runs independently and has its own recovery plan, limiting the contagion of risk between them and reducing systemic risk.
The GSGM also applies to the Group´s global businesses, namely: Corporate & Investment Banking (CIB), Retail & Commercial Banking (Retail), Wealth Management & Insurance (Wealth), Digital Consumer Bank (Consumer) and Payments (Payments). CEOs/Country Heads remain ultimately responsible for the budget, execution of the customer and commercial strategy, and financial delivery.
7.1 Corporate Centre
The GSGM is supported by a corporate centre, which brings control and support units together with such functions as strategy, risk, compliance, audit, finance, accounting, technology and operations, human resources, legal services, internal governance, communications and marketing. It adds value to the Group by:
•enhancing governance under robust corporate frameworks, models, policies and procedures to implement strategies and ensure effective Group oversight;
•making the Group’s units more efficient through cost management synergies, economies of scale and a common brand;
•sharing best practices in global connectivity, commercial initiatives and digitalization; and
•ensuring the 'know your structure' governance principle is effectively applied with a procedure for appointing key positions and assessing suitability that applies to the entire Group.
7.2 Internal governance
The GSGM outlines a set of principles that regulate three types of relationships between the Group and its subsidiaries:
•The subsidiaries’ governing bodies are subject to the Group’s rules and procedures for structuring, forming and running boards of directors and audit, nomination, remuneration and risk committees, according to international standards. The guidelines regarding subsidiary board composition are aligned with best international practices and ensure appropriate Group presence on the subsidiary boards with at least two Group nominated directors on each board. The subsidiaries are also subject to local regulations and supervisory standards.
•The relationship between regional and country heads and the Group CEO.
•The relationship between local and global heads of key positions, following a three lines of defence model: chief officers for risk (CRO), compliance (CCO), audit (CAE), finance (CFO) and accounting (CAO), as well as other key support and business functions (Technology and Operations, HR, General Counsel and Legal Services, Marketing, Communications, Strategy, as well as the five global businesses: CIB, Retail, Wealth, Consumer and Payments).
The Group has three regional heads who report to the Group CEO and are responsible for consolidating and streamlining the management and coordination of its core subsidiaries in the three geographic areas where it operates: Europe, South America and North America. They must undertake their key responsibilities in compliance with European Union and country-specific laws and regulations, and ensure that the country heads' role and accountability (including regulatory responsibilities) are not undermined.
Grupo Santander has corporate frameworks for matters considered to have a material impact on its risk profile, such as risk, capital, liquidity, compliance, financial crime, technology, auditing, accounting, finance, strategy, human resources, outsourcing, cybersecurity, special situations management communications and brand and responsible banking. These frameworks, which are mandatory, also specify:
•how the Group should supervise and exert control over subsidiaries; and
278
•the Group’s involvement in subsidiaries’ decision-making (and vice versa).
The Banco Santander board approves the GSGM and corporate frameworks for the subsidiary governing bodies to formally adhere to them. They consider subsidiaries' local requirements and are revised every year as required by the Group board to adapt to new legislation and international best practices.
The functions draw on corporate frameworks to prepare internal regulatory documents that are given to subsidiaries as a reference for implementing those frameworks effectively, cohesively and in compliance with applicable local laws and supervisory requirements. This approach ensures consistency throughout the Group. Every year, the functions conduct an assessment to ensure that the Group's internal regulations are embedded locally and carry out an annual certification process to ensure the internal regulation under their scope is fit for
purpose. The internal governance office presents the findings to the board of directors.
The Group’s internal governance office and subsidiary general counsels are responsible for embedding the GSGM and corporate frameworks. Every year, the Group assesses their performance in reports sent to governing bodies.
Since 2019, a policy on the governance of non-GSGM subsidiaries has enhanced the governance and control system that has been applied to those companies.
Global businesses each have specific governance arrangements which ensures a robust Group-wide oversight of such businesses as set out in the GSGM. Each global business is responsible for defining the common business and operating model, setting the global ambition and identifying and managing the global tech platforms and product factories.
The following charts show the three levels of the GSGM, as well as the main actions to ensure an effective relationship and solid internal governance system for the Group.
Group | Subsidiaries | ||||
| Board of directors | ||||||||||||||||||||
| Board of directors | ||||||||||||||||||||
 | ||||||||||||||||||||
Group Executive ChairA | ||||||||||||||||||||
The GSGM enhances control and oversight through: Presence of Group Santander on the subsidiaries' boards of directors, establishing guidelines for board structure, dynamics and effectiveness. | ||
Group CEOB  Regional headsC | CEO/Country head |  | |||||||||||||||
Reporting of the CEO/country heads to the Group CEO/regional heads and Group executive committee. | ||
Control management and business functions, as well as Group global businessesD | Control management and business functions, as well as local global businesses | | ||||||||||||
Interaction between the Group's and subsidiaries' control, management and business functions. | ||
A. First executive.
B. Second executive, who reports directly to the board of directors.
C. Europe, North America and South America, reporting to the Group CEO.
D. Audit, Risk, Compliance, Finance, Financial Accounting & Control, IT & Operations, Human Resources, General Secretariat, Marketing, Communications, Strategy as well as the five global businesses (CIB, Retail, Wealth, Consumer and Payments).
Best practices and talent sharing across the whole Group and between subsidiaries is key to our success. | Multiple point of entry structure that has proved to be a key resilience instrument and is a result of our diversification strategy. | Continuous collaboration and daily interaction between local and corporate teams. | ||||||||||||||||||||||||||||||
A common set of corporate frameworks and policies across the Group adapted to local market conditions. | Synergies and economies of scale across the Group. | Planning and implementation of new Group-wide and local initiatives to keep developing our management and control model. | ||||||||||||||||||||||||||||||
279
8. Internal control over financial reporting (ICFR)
This section describes the key features of Grupo Santander's ICFR.
8.1 Control environment
Governance and control bodies
These bodies are responsible for implementing and overseeing our ICFR:
•Board of directors. It approves the financial reports Banco Santander must disclose as a listed company. The board also oversees and guarantees the integrity of the Group’s internal information, control, accounting and reporting systems.
•Audit committee. It assists the board in overseeing the Internal Control System (ICS) and in preparing and presenting financial information.
The audit committee also works with the external auditor to address matters that have been considered in audits to have a significant impact on our ICFR. It also makes sure the external auditor issues a report on the Group’s ICFR.
•Risk control committee. It assists the audit committee in reviewing and overseeing the annual ICS assessment.
•Corporate accounting and financial management information committee. It is responsible for governing and supervising accounting, financial management and control matters.
•Internal control steering meeting. It is chaired by the CRO and CAO and its role is to continuously monitors the Group’s control environment, as well as the ICS strategy and performance.
Lead functions
The structure of the Group enables us to manage risk effectively and ensure that internal control functions (risk, compliance and internal audit) are independent of business functions and can perform their duties efficiently. The key functions that prepare financial information are:
•Costs. It draws up and documents the corporate model for managing structures and templates, which is used as a reference across the Group.
•Business and support functions. They are the first line of defence and responsible for identifying and documenting the risks, tasks and controls that make up our ICFR, based on their operations.
•Risk and Compliance & Conduct. They are the second line of defence. They make sure that we implement ICFR in accordance with the SOx Act.
In particular, the corporate Non-financial risk control area is responsible for:
•setting and circulating the methodology for documenting, assessing and certifying the ICS, which covers ICFR and other legal and regulatory requirements;
•keeping documents up to date to adapt them to organizational and regulatory changes and, along with the Financial Accounting and Control division and representatives of the divisions and Group companies involved, to present the ICS assessment findings to the audit committee; and
•similar functions in each country unit and global business also report to the corporate Non-financial risk control area.
•Internal Audit. It is the third line of defence in overseeing and reporting on our ICFR. It recommends corrective action and areas of improvement for the first and second lines to consider and implement.
Internal Audit is an independent function that guarantees the quality and effectiveness of internal control, risk management (current or emerging) and governance processes and systems, thus contributing to the protection of the organization's value, solvency and reputation as well as the board of directors and senior managers.
•Financial Accounting and Control: Regarding the production of financial information, the local controllers are responsible for:
•embedding the Group's corporate accounting policies into its management and adapting them to local needs;
•ensuring that appropriate organizational structures are in place to carry out assigned tasks, as well as a suitable hierarchical-functional structure;
•using Group tools and methodologies to oversee the set up and monitoring of the internal control systems that ensure that the financial information we report remains reliable; and
•implementing the corporate accounting and management information systems and adapting them to the specific needs of each unit.
In order to preserve their independence, each local controller reports hierarchically to the head of the entity or country in which they exercise their responsibilities (CEO) and functionally to the head of the Group's Financial Accounting and Control division.
280
Moreover, the CAO presents the financial information to the audit committee at least quarterly, giving explanations of the main criteria used to make estimates, assessments and significant judgements.
General Code of Conduct, Canal Abierto and training
General Code of Conduct (GCC)
The Group’s GCC sets out board approved guidelines on employees’ conduct. Moreover, it dictates guidelines in relation to accounting standards and financial reporting.
All of the Group’s employees, including directors, sign up to the GCC when they join Santander, though some are also bound to the Code of Conduct in Securities Markets and other codes of conduct specific to their area or business.
All Santander employees have access to e-learning courses on the GCC. The Compliance and Conduct function also answers employees’ queries on ethics and rules in the GCC.
If anyone violates the code, the Human Resources function adopts disciplinary measures and recommends corrective action (including work sanctions), irrespective of any related civil or criminal sanctions.
Canal Abierto
Banco Santander’s ethical channel is called Canal Abierto, where anyone linked to Grupo Santander can confidentially and, if desired, anonymously, report crimes, internal rule violations, financial and accounting misdemeanours (according to the SOx Act), and regulatory infringements. It can also be used to report breaches of our GCC and corporate behaviours.
The board of directors is responsible for implementing Canal Abierto, while the audit committee and the risk supervision, regulation and compliance committee jointly supervise the channel depending on the subject of the complaint. The SOx act gives authority to the audit committee to supervise whistleblowing channels in matters that fall under its remit (financial and accounting, including those related to auditing), while the supervision of reports of breaches of regulatory requirements, corporate behaviours and the internal governance system falls on the risk, regulation and compliance committee.
For more details on the number and type of complaints filed on Canal Abierto, see section 7.2 'Ethical channels' in the 'Responsible Banking' chapter.
Training
Group employees who help prepare or analyse financial information take part in training programmes and regular refresher courses specifically designed to teach them the concepts and skills they require to discharge their duties properly.
The functions that prepare our ICFR promote, design and oversee these programmes and courses, with support from the Human Resources function.
Training takes the form of both e-learning and on-site sessions that the Human Resources function monitors and oversees to
guarantee that employees duly complete them and understand their contents.
Training programmes and refresher courses on financial reporting in 2023 focused on: (i) risk analysis and management; (ii) accounting and financial statement analysis; (iii) the business, banking and the financial environment; (iv) financial management, costs and budgeting; (v) mathematical skills; and (vi) calculations and statistics.
31,900 employees from several units and markets where Grupo Santander operates undertook the mentioned training programmes. Over 434,000 training hours were spent at the corporate centre in Spain and remotely via e-learning. Moreover, each subsidiary has its own training plan, based on Banco Santander’s.
8.2 Risk assessment in financial reporting
Grupo Santander has a specific process to identify the companies that must be included in its scope of consolidation, which the Financial Accounting and Control division and the General Secretariat division oversee.
This process enables us to identify the entities that Grupo Santander controls through voting rights that grant direct or indirect ownership of their capital and through mutual funds, securitization funds, structured entities and other means. We analyse whether the Group has control over an entity, whether it has rights to the variable returns of the entity or is exposed to them, and whether it can influence the amount of such variable returns. If the Group is considered to have control, the entity is included in the scope of consolidation under the global integration method.
Otherwise, we analyse whether there is significant influence or joint control. If so, the entity is also included in the scope of consolidation and is measured using the equity method.
Entities with the greatest impact on the preparation of the Group's financial information, must use a common ICS methodology to make sure that relevant controls are included and all significant risks to financial reporting are covered.
The Group's ICS complies with the strictest international standards, particularly the guidelines of the Committee of Sponsoring Organizations of the Treadway Commission (COSO) under its last published framework in 2013, which covers control targets for effective and efficient operations, reliable financial reporting and regulatory compliance.
Risk identification considers all the Group's activities, not just the risks directly related to the preparation of the Group's financial information.
Identifying potential risks that must be covered by the ICS is based on top management's knowledge and understanding of the business and its operations in relative to the importance and qualitative criteria associated with the type, complexity or structure of the business.
Banco Santander ensures that controls are in place to cover risks of errors and fraud in financial reporting, such as (i) the existence of assets, liabilities and transactions at the relevant date; (ii) timely and correct recording and proper valuation of
281
assets, liabilities and transactions; and (iii) the correct application of accounting principles and rules, as well as appropriate breakdowns.
The main features of the Group's ICS are:
•It is a corporate model that involves the entire organizational structure under a direct set of individual responsibilities.
•Management of the documents is decentralized to the various units, while coordination and monitoring falls to the Non-financial risk control area, which sets general criteria and guidelines to standardize procedure documents, control assessments, criteria for classifying potential deficiencies and regulatory adaptations.
•It is a global model primarily aimed at documenting activities to produce consolidated financial information and other procedures carried out by each Group entity's support areas that, without having a direct impact on the accounts, could lead to possible losses or contingencies in the event of incidents, errors, breaches of regulations or fraud.
•It is a dynamic model that is under constant development in order to reflect the reality of the Group's business, risks and controls to mitigate them.
•It produces comprehensive documents on the processes within its scope and includes detailed descriptions of operations, assessment criteria and reviews.
All ICS documents for the Group’s companies can be found on a corporate app that enables us to check risk assessment procedures and the effectiveness of controls.
8.3 Control activities
Revision and approval of financial information
The audit committee and the board of directors oversee the preparation, submission and integrity of the financial information required of Banco Santander and the Group. They also review compliance with regulatory requirements, the scope of consolidation and the correct application of accounting standards, ensuring that financial information remains permanently updated on our corporate website.
The audit committee is responsible for reporting to the board on the financial information that the Group must publish, ensuring that it is prepared in accordance with the same principles and practices as the financial statements and is as equally reliable so the board can adopt the corresponding resolutions.
The most significant aspects we consider when closing accounts and reviewing relevant judgements, estimates, measurements and projections are:
•Impairment losses on certain assets.
•The assumptions used in the actuarial calculation of post-employment benefit liabilities and other obligations.
•The useful life of tangible and intangible fixed assets.
•The valuation of consolidation goodwill.
•The calculation of provisions and contingent liabilities.
•The fair value of certain unquoted assets and liabilities.
•The recoverability of tax assets.
•The fair value of acquired identifiable assets and the liabilities assumed in business combinations.
Moreover, the Non-financial risk control area put in place continuous monitoring mechanisms to verify that the ICS is functioning correctly and to pinpoint and manage potential changes in the Group's control environment. In particular, the Non-financial risk control area prepares detailed information on the Group's control environment and the progress of the main mitigation plans in place every quarter, which it makes available to the internal control forums.
The Non-financial risk control area presents the conclusions annually of its assessments to the audit committee alongside the Financial Accounting and Control division and, where applicable, the representatives of the divisions and companies in question, prior to submission to the risk supervision, regulation and compliance committee. Moreover, once it completes its assessment, the Non-financial risk control area provides the audit committee with at least one update on the ICS’s status.
As additional information, the audit committee receives a report that includes the main conclusions from the units' ICS assessments and the main deficiencies identified, indicating whether they have been appropriately resolved or what plans are in place for their satisfactory resolution, as well as supporting evidence for the CEO, CFO and CAO to verify the ICS’s effectiveness.
Internal control policies and procedures for financial IT systems
The Technology and Operations division draws up the Group’s corporate policies on IT systems that are used directly or indirectly to prepare financial statements. These systems follow special internal controls to prepare and publish financial information correctly.
The internal control policies on the following aspects are of particular importance:
•Updated and divulged internal policies and procedures for system security and access to applications and computer systems according to the duties assigned to a role, to make sure access to information is appropriate and to protect the confidentiality, availability and integrity of financial information from cyber attacks.
•The methodology we use when creating, modifying and maintaining apps follows a cycle of definition, development and testing that ensures we process financial information correctly. We have special development and security controls that include coding, data access, testing, vulnerability management, and other mechanisms. For more details on cybersecurity, see section 5 ‘Research, development and innovation (R+D+I)’ in the Economic and Financial Review chapter.
•Once applications are developed according to regularly defined requirements (detailed documentation of processes to be implemented), they are run through comprehensive tests by a specialist development laboratory.
282
•Before they are rolled out, a complete software testing cycle is run in a pre-production computerized environment that simulates real situations. Testing includes technical and functional tests, performance tests, user-acceptance tests and pilot and prototype tests, which are defined by the entities before the apps become available to end users.
•The Group’s business continuity plans for key functions in disasters or other events that could suspend or disrupt operations, as well as highly automated back-up systems that support critical systems and require little manual intervention owing to redundant systems, high availability systems and redundant communication lines.
Internal control policies and procedures for outsourced activities and valuation services from independent experts
The Group has an action framework and specific policies and procedures to cover outsourcing risks properly.
The Group must adhere to this framework, which meets the EBA's requirements for outsourcing and risk management with third parties.
It consists of:
•tasks to initiate, record, process, settle, report and account for transactions and asset valuations;
•IT support in terms of software development, infrastructure maintenance, incident management, security and processing; and
•other material support services that are not directly related to financial reporting, such as vendor management, property management, HR management and others.
Key control procedures include:
•documenting relations between Group companies with comprehensive service agreements.
•documenting and validating by the Group’s service providers of processes and controls for the services that the Group´s vendors perform; and
•external suppliers undergoing an approval process to ensure that the relevant risks associated with the services they provide remain within acceptable levels, in accordance with the Group's risk appetite.
Grupo Santander reviews estimates internally according to its control model guidelines. It will hire the services of a third party to help with specific matters upon confirming their expertise and independence and approving their methods and rationale of assumptions though relevant procedures.
Moreover, specific controls make sure information for external suppliers of services that could affect the financial statements is accurately and comprehensively detailed in service level agreements.
8.4 Information and communication
Group accounting policies
Accounting policies should be understood as a complement to local financial and accounting rules. Their overarching aims are (i) for statements and financial information to be made available to management bodies, supervisors and the market provide accurate and reliable information for decision-making in relation to the Group; and (ii) for all Group entities (due to their accounting ties to Banco Santander) to meet their legal requirements in a timely manner.
The Accounting regulation area of the Financial Accounting and Control division is responsible for:
•setting the general framework for the treatment of the transactions that constitute Banco Santander's activity, in accordance with their economic nature and the regulations governing the financial system.
•drawing up and keeping up to date the Group’s accounting policies and resolving any queries or conflicts arising from their interpretation; and
•enhancing and standardizing the Group’s accounting practices.
The corporate accounting and financial reporting and management framework sets out the principles and guidelines to prepare accounting, financial and management information that must apply to all Grupo Santander entities as a key element of their good governance.
The Group's structure makes it necessary for these principles and standard guidelines to be common for their application across our footprint, and for each of the Group entities to have effective consolidation methods and employ homogeneous accounting policies. The framework's principles are adequately reflected in the Group’s accounting policies.
Accounting policies are revised at least once a year and on the back of key regulatory amendments. Moreover, every month, the Accounting Policies area publishes an internal bulletin on new accounting regulation and their most significant interpretations.
The Group entities, through their operations or accounting heads, maintain open communication with the Accounting regulation area and the rest of the Financial Accounting and Control division, as well as other divisions when appropriate.
Mechanisms for the preparation of financial information
The production, revision and approval of financial information and a description of our ICFR are documented in a corporate tool that integrates the control model into risk management, including a description of activities, risks, tasks and controls associated with all operations that may have a significant effect on the financial statements. These documents cover recurrent banking operations and one-off transactions and aspects related to judgements and estimates to correctly record, analyse, present and breakdown financial information.
283
Regarding financial statement consolidation, to minimize operational risk and maximize the quality of information, the Group developed IT tools to channel the flow of information between the units and the Financial Accounting and Control division and carries out consolidation based on the information provided.
This process is automated end to end, with controls that enable us to detect incidents during consolidation. Moreover, the Financial Accounting and Control division exercises further supervisory and analytical control, which is set out in formal documents and carried out and reviewed under set time frames.
8.5 Monitoring of system functioning
2023 ICFR monitoring activities and results
The board of directors approved an internal audit framework that details the function and how it should conduct its work.
The Internal Audit function reports to the audit committee and periodically, at least twice a year, to the board of directors. As an independent unit, it also has direct access to the board when required.
Internal Audit assesses:
•the efficiency and effectiveness of the ICFR;
•compliance with applicable regulations and supervisory requirements;
•the reliability and integrity of financial and operational information; and
•asset integrity.
Its scope of action includes:
•all entities over which the Group exercises effective control;
•separated assets (for example, mutual funds) managed by the entities mentioned in the previous section; and
•any entity (or separated assets) not included in the above points with which the Group has entered into an agreement to provide internal audit functions.
This subjective scope includes, our activities, businesses and processes (performed internally or through outsourcing), the organization and, where applicable, branch networks. Internal Audit may also conduct audits for other investees that are not included in the preceding points when the Group has reserved this right as a shareholder, as well as on outsourced activities in accordance with the established agreements.
The audit committee supervises the Group's Internal Audit function. See section 4.5 'Audit committee activities in 2023'.
As at 2023 year-end, Internal Audit had 1,227 employees, all exclusively dedicated to this service. Of these, 274 were based at the Corporate Centre and 953 in the local units located in the Group´s core markets, all with exclusive dedication.
Every year, Internal Audit prepares an audit plan based on a risk self-assessment and is solely responsible for executing the plan. Reviews may lead to recommendations, which are
prioritized in accordance with their relative importance and are continuously monitored until full implementation.
At its meeting on 17 February 2023, the audit committee reviewed the 2023 audit plan, which was reported to, and approved by, the board at its meeting on 23 February 2023.
The internal audit report on the ICFR review aimed to:
•verify compliance with the provisions contained in sections 302, 404, 406, 407 and 806 of the SOx Act;
•check corporate governance with regard to information relating to the internal control system for financial reporting, including risk culture;
•review the functions performed by the internal control departments and by other departments, areas and divisions that work to ensure compliance with the SOx Act;
•make sure the supporting documentation relating to the SOx Act is up to date;
•confirm the effectiveness of a sample of controls based on an internal audit risk assessment methodology;
•assess the accuracy of the unit's certifications, especially their consistency with respect to the observations and recommendations made by Internal Audit, the external auditors of the annual accounts and supervisors; and
•ratify the implementation of recommendations made in the audit plan.
In 2023, the audit committee and the board of directors were informed of the Internal Audit function's work in accordance with its annual plan, as well as and of other related matters. See section 4.5 'Audit committee activities in 2023'.
Detection and management of deficiencies
The audit committee oversees to supervise the financial reporting process and the internal control systems. It is responsible for discussing any significant weaknesses detected in the audit with the external auditor.
The audit committee also assesses the results of the work of the Internal audit unit and may take the necessary measures to correct any deficiencies identified in the financial information, that may impact on the reliability and accuracy of the financial statements. It may ask other areas of the Group involved in the process for vital information and clarification. The committee also assesses the potential impact of any errors detected in the financial information.
In 2023, the audit committee was informed of the ICS assessment and certification for the 2022 financial year. See section 4.5 'Audit committee activities in 2023'.
284
[Page intentionally left blank] 1 of 2
285
[Page intentionally left blank] 2 of 2
286
9. Other corporate
governance information
governance information
Since 12 June 2018, CNMV allows the annual corporate governance and directors’ remuneration reports Spanish listed companies must submit to be drafted in a free format, which is what we selected for our corporate governance and directors’ remuneration reports since 2018.
The CNMV requires any issuer opting for a free format to provide certain information in a format it dictates so that it can be aggregated for statistical purposes. This information is included (i) for corporate governance matters, under section 9.2 'Statistical information on corporate governance required by the CNMV', which also covers the section 'Degree of compliance with corporate governance recommendations', and (ii) for remuneration matters, under section 9.5 'Statistical information on remuneration required by the CNMV'.
Some shareholders or other stakeholders may be used to the formats of the corporate governance and directors'
remuneration reports set the by the CNMV. Therefore, each section under this format in sections 9.1 'Reconciliation with the CNMV’s corporate governance report model' and 9.4 'Reconciliation to the CNMV’s remuneration report model' include a cross reference indicating where this information may be found in the 2022 annual corporate governance report (drafted in a free format) and elsewhere in this annual report.
We have normally completed the 'comply or explain' section for all recommendations in the Spanish Corporate Governance Code to clearly show the ones we complied with, and explain the ones we partially complied or failed to comply with. In section 9.3 'References on compliance with recommendations of Spanish Corporate Governance Code', we have included a chart with cross-references showing where information supporting each response can be found in this corporate governance chapter and elsewhere in this annual report.
9.1 Reconciliation with the CNMV’s corporate governance report model
Section in the CNMV model | Included in statistical report | Comments | ||||||
| A. OWNERSHIP STRUCTURE | ||||||||
| A.1 | Yes | |||||||
| A.2 | Yes | |||||||
| A.3 | Yes | See 'Tenure and equity ownership' in section 4.2 and section 9.2 'Statistical information on corporate governance required by the CNMV'. | ||||||
| A.4 | No | See section 2.3 'Significant shareholders' where we explain there are no significant shareholders on their own account so this section does not apply. | ||||||
| A.5 | No | See section 2.3 'Significant shareholders' where we explain there are no significant shareholders on their own account so this section does not apply. | ||||||
| A.6 | No | See section 2.3 'Significant shareholders' where we explain there are no significant shareholders on their own account so this section does not apply. | ||||||
| A.7 | Yes | |||||||
| A.8 | Yes | Not applicable. See section 9.2 'Statistical information on corporate governance required by the CNMV'. | ||||||
| A.9 | Yes | |||||||
| A.10 | No | |||||||
| A.11 | Yes | |||||||
| A.12 | No | |||||||
| A.13 | No | |||||||
| A.14 | Yes | |||||||
287
288
Section in the CNMV model | Included in statistical report | Comments | ||||||
| C.1.29 | Yes | See section 4.1 'Our directors', 'Secretary of the board' in section 4.3 and section 9.2 'Statistical information on corporate governance as required by the CNMV'. | ||||||
| C.1.30 | No | See section 3.1 'Shareholder communication and engagement'and 'External auditor independence' in section 4.5. | ||||||
| C.1.31 | Yes | |||||||
| C.1.32 | Yes | In accordance with the CNMV’s instructions, see 'External auditor independence' in section 4.5 and sub-section C.1.32 of section 9.2 'Statistical information on corporate governance required by the CNMV'. Per the CNMV’s instructions on preparing annual reports on corporate governance, sub-section C.1.32 provides the fee ratios of non-audit services to total audit services, with these differences in the ratio set out in Regulation (EU) No 537/2014 that is included in section 4.5 'Audit committee activities in 2023': (a) the ratios in sub-section C.1.32 have two perimeters to the one established by Regulation (EU) No 537/2014: fees for the approved services to be performed by PricewaterhouseCoopers Auditores, S.L. (PwC) for Banco Santander and fees for the approved services to be performed by PwC and other firms in its network for all other Grupo Santander entities, in and outside Spain; and (b) the ratios' denominator is the fees amount for audit services in 2022 and not the average fee value from the past three consecutive years that Regulation (EU) No 537/2014 dictates. | ||||||
| C.1.33 | Yes | |||||||
| C.1.34 | Yes | |||||||
| C.1.35 | Yes | |||||||
| C.1.36 | No | |||||||
| C.1.37 | No | |||||||
| C.1.38 | No | Not applicable. | ||||||
| C.1.39 | Yes | |||||||
| C.2 Board committees | ||||||||
| C.2.1 | Yes | See 'Structure of board committees' and 'Committee operation' in section 4.3, sections 4.4, 4.5, 4.6, 4.7, 4.8, 4.9, 4.10 and 9.2 'Statistical information on corporate governance required by the CNMV'. | ||||||
| C.2.2 | Yes | |||||||
| C.2.3 | No | See 'Board regulation' and 'Structure of board committees', 'Committee operation' in section 4.3 and 'Duties and activities in 2023' in sections 4.4, 4.5, 4.6, 4.7, 4.8, 4.9 and 4.10. | ||||||
| D. RELATED PARTY AND INTRAGROUP TRANSACTIONS | ||||||||
| D.1 | No | |||||||
| D.2 | Yes | |||||||
| D.3 | Yes | |||||||
| D.4 | Yes | |||||||
| D.5 | Yes | |||||||
| D.6 | No | |||||||
| D.7 | Yes | Not applicable. See section 2.3 'Significant shareholders' and 'Other conflicts of interest' in section 4.12. | ||||||
| E. CONTROL AND RISK MANAGEMENT SYSTEMS | ||||||||
| E.1 | No | See chapter 'Risk, compliance & conduct management', in particular section 2.'Risk management and control model' and sections 1.2 'Impacts, risks and opportunities', 2.3 'Risk management' and 7.1.4 'Principles of action in tax matters' in the 'Responsible banking' chapter. | ||||||
| E.2 | No | See note 54 to the consolidated financial statements, section 2.3 'Risk and compliance governance' in the 'Risk, compliance & conduct management' chapter. See also sections 1.2 'Impacts, risks and opportunities', 2.2 'Governance' and 7.1.4 'Principles of action in tax matters' in the 'Responsible banking' chapter. | ||||||
| E.3 | No | See sections 2.2 'Key risk types', 3. 'Credit risk', 4. 'Market, structural and liquidity risk', 5. 'Capital risk', 6. 'Operational risk', 7. 'Compliance and conduct risk', 8. 'Model risk', 9. 'Strategic risk' and 10. 'ESG risk factors' in the 'Risk, compliance & conduct management' chapter. See also the 'Responsible banking' chapter and, for our capital needs, see section 3.5 'Capital management and adequacy. Solvency ratios' of the 'Economic and financial review' chapter. | ||||||
| E.4 | No | See section 2.4. 'Management processes and tools' in the 'Risk, compliance & compliance management' chapter and sections 1.2 'Impacts, risks and opportunities', 2.3 'Risk management' and 7.1.4 'Principles of action in tax matters' in the 'Responsible banking' chapter. | ||||||
| E.5 | No | See 3. 'Credit risk', 4. 'Market, structural and liquidity risk', 5. 'Capital risk', 6. 'Operational risk', 7 'Compliance and conduct risk', 8 .'Model risk', 9. 'Strategic risk' and in 10.'ESG risk factors' the 'Risk, compliance & conduct management' chapter. Additionally, see note 25e) in the 'Notes to the consolidated financial statements'. | ||||||
| E.6 | No | See sections 2.'Risk management and control model', 3. 'Credit risk', 4. 'Market, structural and liquidity risk', 5. 'Capital risk', 6. 'Operational risk', 7. 'Compliance and conduct risk', 8. 'Model risk', 9. 'Strategic risk' and 10.'ESG risk factors' in the 'Risk, compliance & conduct management' chapter. See also sections 2.2 'Governance' and 2.3 'Risk management' in the in the 'Responsible banking' chapter. | ||||||
289
Section in the CNMV model | Included in statistical report | Comments | ||||||
| F. ICFRS | ||||||||
| F.1 | No | |||||||
| F.2 | No | |||||||
| F.3 | No | |||||||
| F.4 | No | |||||||
| F.5 | No | |||||||
| F.6 | No | Not applicable. | ||||||
| F7 | No | |||||||
| G. DEGREE OF COMPLIANCE WITH CORPORATE GOVERNANCE RECOMMENDATIONS | ||||||||
| G | Yes | |||||||
| H. OTHER INFORMATION OF INTEREST | ||||||||
| H | No | See 'Board regulation' in section 4.3. Banco Santander also complies with the Polish Code of Best Practices, except in areas where regulation is different in Spain and Poland. In addition, see sections 7. 'Business conduct' and 9.2 'Main internal regulations and governance', in particular, 9.1 'Stakeholder engagement', in the Responsible banking chapter. | ||||||
9.2 Statistical information on corporate governance required by the CNMV
Unless otherwise indicated all data as of 31 December 2023.
A. OWNERSHIP STRUCTURE
A.1 Complete the following table on share capital and the attributed voting rights, including those corresponding to shares with a loyalty vote as of the closing date of the year, where appropriate:
Indicate whether company Bylaws contain the provision of double loyalty voting:
Yes o No þ
| Date of last modification | Share capital (euros) | Number of shares | Number of voting rights | ||||||||
| 30/06/2023 | 8,092,073,029.50 | 16,184,146,059 | 16,184,146,059 | ||||||||
Indicate whether different types of shares exist with different associated rights:
Yes o No þ
A.2 List the direct and indirect holders of significant ownership interests at year-end, including directors with a significant shareholding:
| % of voting rights attributed to shares | % of voting rights through financial instruments | Total % of voting rights | ||||||||||||||||||
| Name or corporate name of shareholder | Direct | Indirect | Direct | Indirect | ||||||||||||||||
| BlackRock Inc. | 0 | 5.08 | 0 | 0.346 | 5.43 | |||||||||||||||
| Dodge & Cox | 0 | 3.04 | 0 | 0 | 3.04 | |||||||||||||||
Details of the indirect shares:
| Name or corporate name of the indirect shareholder | Name or corporate name of the direct shareholder | % of voting rights attributed to shares | % of voting rights through financial instruments | Total % of voting rights | ||||||||||
| BlackRock Inc. | Subsidiaries of BlackRock Inc. | 5.08 | 0.346 | 5.43 | ||||||||||
| Dodge & Cox | Funds and portfolios managed by Dodge & Cox | 3.04 | 0 | 3.04 | ||||||||||
290
A.3 Give details of the participation at the close of the fiscal year of the members of the board of directors who are holders of voting rights attributed to shares of the company or through financial instruments, whatever the percentage, excluding the directors who have been identified in Section A.2 above:
Name or corporate name of director | % of voting rights attributed to shares (including loyalty votes) | % of voting rights through financial instruments | Total % of voting rights | From the total % of voting rights attributed to the shares, indicate, where appropriate, the % of the additional votes attributed corresponding to the shares with a loyalty vote | ||||||||||||||||||||||
Direct | Indirect | Direct | Indirect | Direct | Indirect | |||||||||||||||||||||
| Ana Botín-Sanz de Sautuola y O’Shea | 0.01 | 0.19 | 0.00 | 0.00 | 0.20 | 0.00 | 0.00 | |||||||||||||||||||
Héctor Grisi Checa | 0.01 | 0.00 | 0.00 | 0.00 | 0.01 | 0.00 | 0.00 | |||||||||||||||||||
Glenn Hutchins | 0.00 | 0.00 | 0.00 | 0.00 | 0.00 | 0.00 | 0.00 | |||||||||||||||||||
| José Antonio Álvarez Álvarez | 0.02 | 0.00 | 0.00 | 0.00 | 0.02 | 0.00 | 0.00 | |||||||||||||||||||
| Homaira Akbari | 0.00 | 0.00 | 0.00 | 0.00 | 0.00 | 0.00 | 0.00 | |||||||||||||||||||
| Javier Botín-Sanz de Sautuola y O’Shea | 0.03 | 0.16 | 0.00 | 0.00 | 0.19 | 0.00 | 0.00 | |||||||||||||||||||
| Bruce Carnegie-Brown | 0.00 | 0.00 | 0.00 | 0.00 | 0.00 | 0.00 | 0.00 | |||||||||||||||||||
| Sol Daurella Comadrán | 0.00 | 0.00 | 0.00 | 0.00 | 0.00 | 0.00 | 0.00 | |||||||||||||||||||
| Germán de la Fuente | 0.00 | 0.00 | 0.00 | 0.00 | 0.00 | 0.00 | 0.00 | |||||||||||||||||||
| Henrique de Castro | 0.00 | 0.00 | 0.00 | 0.00 | 0.00 | 0.00 | 0.00 | |||||||||||||||||||
| Gina Díez Barroso | 0.00 | 0.00 | 0.00 | 0.00 | 0.00 | 0.00 | 0.00 | |||||||||||||||||||
| Luis Isasi Fernández de Bobadilla | 0.00 | 0.00 | 0.00 | 0.00 | 0.00 | 0.00 | 0.00 | |||||||||||||||||||
| Ramiro Mato García Ansorena | 0.00 | 0.00 | 0.00 | 0.00 | 0.00 | 0.00 | 0.00 | |||||||||||||||||||
| Sergio Rial | 0.00 | 0.00 | 0.00 | 0.00 | 0.00 | 0.00 | 0.00 | |||||||||||||||||||
| Belén Romana García | 0.00 | 0.00 | 0.00 | 0.00 | 0.00 | 0.00 | 0.00 | |||||||||||||||||||
| Pamela Walkden | 0.00 | 0.00 | 0.00 | 0.00 | 0.00 | 0.00 | 0.00 | |||||||||||||||||||
| % total voting rights held by the board of directors | 0.43 | |||||||||||||||||||||||||
% total voting rights represented on the board of directors | 0.77 | |||||||||||||||||||||||||
Details of the indirect holding:
| Name or corporate name of director | Name or corporate name of direct owner | % of voting rights attributed to shares | % of voting rights through financial instruments | Total % of voting rights | From the total % of voting rights attributed to the shares, indicate, where appropriate, the % of the additional votes attributed corresponding to the shares with a loyalty vote | ||||||||||||
| _ | _ | _ | _ | _ | _ | ||||||||||||
A.7 Indicate whether the company has been notified of any shareholders’ agreements that may affect it, in accordance with the provisions of Articles 530 and 531 of the Spanish Companies Act (LSC). If so, provide a brief description and list the shareholders bound by the agreement, as applicable:
Yes þ No o
| Parties to the shareholders’ agreement | % of share capital affected | Brief description of agreement | Expiry date, if applicable | |||||||||||
| Javier Botín-Sanz de Sautuola y O’Shea (directly and indirectly through Agropecuaria El Castaño, S.L.U.) Emilio Botín-Sanz de Sautuola y O’Shea, Puente San Miguel, S.L.U. Ana Botín-Sanz de Sautuola y O’Shea, CRONJE, S.L.U. Nueva Azil, S.L. Carmen Botín-Sanz de Sautuola y O’Shea Paloma Botín-Sanz de Sautuola y O’Shea Bright Sky 2012, S.L. | 0.67 | Transfer restrictions and syndication of voting rights as described under section 2.4 'Shareholders’ agreements' of the 'Corporate governance' chapter in the annual report. The communications to CNMV relating to this shareholders' agreement can be found in material facts with entry numbers 64179, 171949, 177432, 194069, 211556, 218392, 223703, 226968 and 285567 filed in CNMV on 17 February 2006, 3 August 2012, 19 November 2012, 17 October, 2013, 3 October 2014, 6 February 2015, 29 May 2015, 29 July 2015 and 31 December 2019, respectively. | 01/01/2056 | |||||||||||
291
Indicate whether the company is aware of the existence of any concerted actions among its shareholders. If so, give a brief description as applicable:
Yes þ No o
| Participants in the concerted action | % of share capital affected | Brief description of concerted action | Expiry date, if applicable | |||||||||||
| Javier Botín-Sanz de Sautuola y O’Shea (directly and indirectly through Agropecuaria El Castaño, S.L.U.) Emilio Botín-Sanz de Sautuola y O’Shea, Puente San Miguel, S.L.U. Ana Botín-Sanz de Sautuola y O’Shea, CRONJE, S.L.U. Nueva Azil, S.L. Carmen Botín-Sanz de Sautuola y O’Shea Paloma Botín-Sanz de Sautuola y O’Shea Bright Sky 2012, S.L. | 0.67 | Transfer restrictions and syndication of voting rights as described under section 2.4 'Shareholders’ agreements' of the 'Corporate governance' chapter in the annual report. The communications to CNMV relating to this shareholders' agreement can be found in material facts with entry numbers 64179, 171949, 177432, 194069, 211556, 218392, 223703, 226968 and 285567 filed in CNMV on 17 February 2006, 3 August 2012, 19 November 2012, 17 October, 2013, 3 October 2014, 6 February 2015, 29 May 2015, 29 July 2015 and 31 December 2019, respectively. | 01/01/2056 | |||||||||||
A.8 Indicate whether any individual or entity currently exercises control or could exercise control over the company in accordance with article 5 of the Spanish Securities Market Act. If so, identify them:
Yes o No þ
A.9 Complete the following tables on the company’s treasury shares:
At year end:
Number of shares held directly | Number of shares held indirectly (*) | % of total share capital | ||||||
| 286,842,316 | 10,973,357 | 1.84% | ||||||
(*) Through:
Name or corporate name of the direct shareholder | Number of shares held directly | ||||
| Pereda Gestión, S.A. | 9,000,000 | ||||
| Banco Santander Río, S.A. | 629,222 | ||||
| Banco Santander México, S.A. | 1,344,135 | ||||
| Total: | 10,973,357 | ||||
A.11 Estimated free float:
| % | |||||
| Estimated free float | 88.49 | ||||
A.14 Indicate whether the company has issued securities not traded in a regulated market of the European Union.
Yes þ No o
292
B. GENERAL SHAREHOLDERS’ MEETING
B.4 Indicate the attendance figures for the general shareholders’ meetings held during the financial year to which this report relates and in the two preceding financial years:
Attendance data | |||||||||||||||||
% remote voting | |||||||||||||||||
Date of General Meeting | % attending in person | % by proxy | Electronic means | Other | Total | ||||||||||||
| 26/03/2021 | 0.06 | 65.02 | 2.04 | 0.55 | 67.67 | ||||||||||||
| Of which free float: | 0.01 | 64.03 | 2.04 | 0.55 | 66.63 | ||||||||||||
Attendance data | |||||||||||||||||
% remote voting | |||||||||||||||||
Date of General Meeting | % attending in person | % by proxy | Electronic means | Other | Total | ||||||||||||
| 01/04/2022 | 0.71 | 65.41 | 2.08 | 0.57 | 68.77 | ||||||||||||
| Of which free float: | 0.09 | 64.98 | 2.08 | 0.57 | 67.72 | ||||||||||||
Attendance data | |||||||||||||||||
% remote voting | |||||||||||||||||
Date of General Meeting | % attending in person | % by proxy | Electronic means | Other | Total | ||||||||||||
| 31/03/2023 | 0.72 | 64.20 | 2.22 | 0.42 | 67.56 | ||||||||||||
| Of which free float: | 0.06 | 63.73 | 2.22 | 0.42 | 66.43 | ||||||||||||
B.5 Indicate whether in the general shareholders’ meetings held during the financial year to which this report relates there has been any matter submitted to them which has not been approved by the shareholders:
Yes o No þ
B.6 Indicate whether the Bylaws require a minimum holding of shares to attend to or to vote remotely in the general shareholders’ meeting:
Yes o No þ
293
C. MANAGEMENT STRUCTURE
C.1 Board of directors
C.1.1 Maximum and minimum number of directors provided for in the Bylaws:
| Maximum number of directors | 17 | ||||
| Minimum number of directors | 12 | ||||
| Number of directors set by the General Meeting | 15 | ||||
C.1.2 Complete the following table with the directors’ details:
Name or corporate name of director | Representative | Category of director | Position in the board | Date of first appointment | Date of last appointment | Election procedure | ||||||||||||||
| Ana Botín-Sanz de Sautuola y O’Shea | N/A | Executive | Chair | 04/02/1989 | 31/03/2023 | Vote in general shareholders’ meeting | ||||||||||||||
Héctor Grisi Checa | N/A | Executive | Chief Executive Officer | 20/12/2022 | 31/03/2023 | Vote in general shareholders’ meeting | ||||||||||||||
| Glenn Hutchins | N/A | Independent | Lead Independent Director | 20/12/2022 | 31/03/2023 | Vote in general shareholders’ meeting | ||||||||||||||
| José Antonio Álvarez Álvarez | N/A | Other external | Director | 25/11/2014 | 01/04/2022 | Vote in general shareholders’ meeting | ||||||||||||||
| Homaira Akbari | N/A | Independent | Director | 27/09/2016 | 31/03/2023 | Vote in general shareholders’ meeting | ||||||||||||||
| Javier Botín-Sanz de Sautuola y O’Shea | N/A | Other external | Director | 25/07/2004 | 26/03/2021 | Vote in general shareholders’ meeting | ||||||||||||||
| Bruce Carnegie-Brown | N/A | Independent | Director | 25/11/2014 | 26/03/2021 | Vote in general shareholders’ meeting | ||||||||||||||
| Sol Daurella Comadrán | N/A | Independent | Director | 25/11/2014 | 31/03/2023 | Vote in general shareholders’ meeting | ||||||||||||||
| Henrique de Castro | N/A | Independent | Director | 12/04/2019 | 01/04/2022 | Vote in general shareholders’ meeting | ||||||||||||||
| Germán de la Fuente | N/A | Independent | Director | 01/04/2022 | 01/04/2022 | Vote in general shareholders’ meeting | ||||||||||||||
| Gina Díez Barroso | N/A | Independent | Director | 22/12/2020 | 31/03/2023 | Vote in general shareholders’ meeting | ||||||||||||||
| Luis Isasi Fernández de Bobadilla | N/A | Other external | Director | 03/04/2020 | 01/04/2022 | Vote in general shareholders' meeting | ||||||||||||||
| Ramiro Mato García-Ansorena | N/A | Independent | Director | 28/11/2017 | 26/03/2021 | Vote in general shareholders´ meeting | ||||||||||||||
| Belén Romana García | N/A | Independent | Director | 22/12/2015 | 01/04/2022 | Vote in general shareholders’ meeting | ||||||||||||||
| Pamela Walkden | N/A | Independent | Director | 29/10/2019 | 31/03/2023 | Vote in general shareholders’ meeting | ||||||||||||||
| Total number of directors | 15 | |||||||||||||||||||
Indicate any directors who have left during the financial year to which this report relates, regardless of the reason (whether for resignation or by agreement of the general meeting or any other):
Name or corporate name of director | Category of director at the time he/her left | Date of last appointment | Date of leave | Board committees he or she was a member of | Indicate whether he or she has left before the expiry of his or her term | ||||||||||||
Sergio Rial | Other external | 03/04/2020 | 01/01/2023 | – | YES | ||||||||||||
294
C.1.3 Complete the following tables for the directors in each relevant category:
| Executive directors | ||||||||
| Name or corporate name of director | Position held in the company | Profile | ||||||
| Ana Botín-Sanz de Sautuola y O’Shea | Executive Chair | |||||||
Héctor Grisi Checa | CEO | |||||||
| Total number of executive directors | 2 | |||||||
| % of the Board | 13.33 | |||||||
Proprietary non-executive directors | ||||||||
Name or corporate name of director | Name or corporate name of significant shareholder represented or having proposed his or her appointment | Profile | ||||||
| N/A | N/A | N/A | ||||||
| Total number of proprietary non-executive directors | 0 | |||||||
| % of the Board | 0 | |||||||
Independent directors | |||||
Name or corporate name of director | Profile | ||||
Glenn Hutchins | |||||
| Homaira Akbari | |||||
Bruce Carnegie-Brown | |||||
| Sol Daurella Comadrán | |||||
| Henrique de Castro | |||||
Germán de la Fuente | |||||
| Gina Díez Barroso | |||||
| Ramiro Mato García-Ansorena | |||||
| Belén Romana Garcia | |||||
| Pamela Walkden | |||||
| Total number of independent directors | 10 | ||||
| % of the Board | 66.67 | ||||
295
Identify any independent director who receives from the company or its group any amount or perk other than his or her director remuneration, as a director, or who maintain or have maintained during the financial year covered in this report a business relationship with the company or any group company, whether in his or her own name or as a principal shareholder, director or senior manager of an entity which maintains or has maintained such a relationship.
In such a case, a reasoned statement from the Board on why the relevant director(s) is able to carry on their duties as independent director(s) will be included.
| Name or corporate name of director | Description of the relationship | Reasoned statement | ||||||
| Sol Daurella | Business/Financing | When conducting the annual verification of the independence of directors classified as independent, the nomination committee analysed the business relationships between Grupo Santander and the companies in which they are or have previously been principal shareholders, directors or senior managers. The committee concluded that the business relationships maintained and the funding Grupo Santander granted to companies in which Sol Daurella was a principal shareholder or director in 2023 were not significant because, among other reasons: (i) did not generate economic dependence on the companies involved in view of the substitutability of this funding by other sources, whether banks or others, (ii) were aligned with Grupo Santander's share in the corresponding market, and (iii) did not reach certain comparable materiality thresholds used in other jurisdictions, e.g. NYSE, Nasdaq and the Canadian Bank Act. | ||||||
| Henrique de Castro | Business | When conducting the annual verification of the independence of directors classified as independent, the nomination committee analysed the business relationships between Grupo Santander and the companies in which they are or have previously been principal shareholders, directors or senior managers. The committee concluded that the business relationships maintained between Grupo Santander and the company in which Henrique de Castro was a director in 2023 were not significant because, among other reasons they did not reach certain comparable materiality thresholds used in other jurisdictions, e.g. NYSE and Nasdaq. | ||||||
| Gina Díez Barroso | Business/Financing | When conducting the annual verification of the independence of directors classified as independent, the nomination committee analysed the business relationships between Grupo Santander and the companies in which they are or have previously been principal shareholders, directors or senior managers. The committee concluded that the business relationships maintained and the funding granted by Grupo Santander to the companies in which Gina Díez Barroso was a principal shareholder and director in 2023 were not significant because, among other reasons: (i) did not generate a situation of economic dependence on the company involved in view of the substitutability of this funding by other sources, whether banks or others, (ii) were aligned with Grupo Santander's share in the corresponding market, and (iii) did not reach certain comparable materiality thresholds used in other jurisdictions, e.g. NYSE, Nasdaq and the Canadian Bank Act. | ||||||
| Glenn Hutchins | Financing | When conducting the annual verification of the independence of directors classified as independent, the nomination committee analysed the business relationships between Grupo Santander and the companies in which they are or have previously been principal shareholders, directors or senior managers. The committee concluded that the funding Grupo Santander granted to the company in which Glenn Hutchins was a director in 2023 was not significant because, among other reasons: (i) did not generate economic dependence on the companies involved in view of the substitutability of this funding by other sources, whether banks or others, (ii) was aligned with Grupo Santander's share in the corresponding market, and (iii) did not reach certain comparable materiality thresholds used in other jurisdictions, e.g. NYSE, Nasdaq and the Canadian Bank Act. | ||||||
| Belén Romana | Business/Financing | When conducting the annual verification of the independence of directors classified as independent, the nomination committee analysed the business relationships between Grupo Santander and the companies in which they are or have previously been principal shareholders, directors or senior managers. The committee concluded that the business relationships maintained and the funding Grupo Santander granted to the companies in which Belén Romana was a director in 2023 were not significant because, among other reasons: (i) did not generate economic dependence on the companies involved in view of the substitutability of this funding by other sources, whether banks or others, (ii) were aligned with Grupo Santander's share in the corresponding market, and (iii) did not reach certain comparable materiality thresholds used in other jurisdictions, e.g. NYSE, Nasdaq and the Canadian Bank Act. | ||||||
296
Other external directors | |||||
Identify all other external directors and explain why these cannot be considered proprietary or independent directors and detail their relationships with the company, its executives or shareholders:
| Name or corporate name of director | Reasons | Company, manager or shareholder to which or to whom the director is related | Profile | ||||||||
José Antonio Álvarez Álvarez | Given that Mr Álvarez was the former CEO of Banco Santander until 31 December 2022, pursuant to sub-section 4.a) of article 529 duodecies of the Spanish Companies Act. | Banco Santander, S.A. | |||||||||
| Javier Botín-Sanz de Sautuola y O’Shea | Given that Mr Botín has been director for over 12 years, pursuant to sub-section 4. i) of article 529 duodecies of the Spanish Companies Act. | Banco Santander, S.A. | |||||||||
| Luis Isasi Fernández de Bobadilla | Under prudent criteria given his remuneration as non-executive Chair of Santander España’s body as supervisor, unit without its own corporate identity separate to Banco Santander, pursuant to sub-sections 2 to 4 of article 529 duodecies of the Spanish Companies Act. | Banco Santander, S.A. | |||||||||
| Total number of other external directors | 3 | ||||||||||
| % of the Board | 20.00 | ||||||||||
List any changes in the category of a director which have occurred during the period covered in this report.
Name or corporate name of director | Date of change | Previous category | Current category | ||||||||
José Antonio Álvarez Álvarez | 01/01/2023 | Executive | Other external | ||||||||
C.1.4 Complete the following table on the number of female directors at the end of each the past four years and their category:
Number of female directors | % of total directors of each category | |||||||||||||||||||||||||
FY 2023 | FY 2022 | FY 2021 | FY 2020 | FY 2023 | FY 2022 | FY 2021 | FY 2020 | |||||||||||||||||||
| Executive | 1 | 1 | 1 | 1 | 50.00 | 50.00 | 50.00 | 33.33 | ||||||||||||||||||
| Proprietary | — | — | — | — | 0.00 | 0.00 | 0.00 | 0.00 | ||||||||||||||||||
| Independent | 5 | 5 | 5 | 5 | 50.00 | 50.00 | 50.00 | 50.00 | ||||||||||||||||||
| Other external | — | — | — | — | 0.00 | 0.00 | 0.00 | 0.00 | ||||||||||||||||||
| Total: | 6 | 6 | 6 | 6 | 40.00 | 40.00 | 40.00 | 40.00 | ||||||||||||||||||
297
C.1.11 List the positions of director, administrator or representative thereof, held by directors or representatives of directors who are members of the company's board of directors in other entities, whether or not they are listed companies:
| Identity of the director or representative | Company name of the listed or non-listed entity | Position | Remunerated YES/NO | ||||||||
| Ana Botín-Sanz de Sautuola y O’Shea | The Coca-Cola Company | Director | YES | ||||||||
Héctor Grisi Checa | Cogrimex, S.A. de C.V. | Chair | NO | ||||||||
| Bruce Carnegie-Brown | Lloyd's of London | Chair | YES | ||||||||
| Cuvva Limited | Chair | YES | |||||||||
| Javier Botín-Sanz de Sautuola y O’Shea | JB Capital Markets, S. V., S.A.U. | Chair | YES | ||||||||
| Inversiones Zulú, S.L. | Chair-chief executive officer | NO | |||||||||
Agropecuaria El Castaño, S.L.E | Joint administrator | NO | |||||||||
| Inversiones Peña Cabarga, S.L. | Joint and several administrator | NO | |||||||||
| Homaira Akbari | Landstar System, Inc. | Director | YES | ||||||||
| AKnowledge Partners, LLC | Chief executive officer | YES | |||||||||
| Sol Daurella Comadrán | Coca-Cola Europacific Partners PLC | Chair | YES | ||||||||
| Cobega, S.A. | Representative of director | NO | |||||||||
| Equatorial Coca Cola Bottling Company, S.L. | Director | YES | |||||||||
| Cobega Invest S.L. | Joint administrator | NO | |||||||||
| Olive Partners, S.A. | Representative of director | NO | |||||||||
| Indau, S.A.R.L. | Joint and several administrator | YES | |||||||||
| Henrique de Castro | Fiserv Inc. | Director | YES | ||||||||
| Stakecorp Capital, s.a.r.l. | Director | NO | |||||||||
| Gina Díez Barroso Azcárraga | Grupo Diarq, S.A. de C.V. | Chair | NO | ||||||||
| Dalia Women, S.A.P.I. de C.V. | Director | NO | |||||||||
| Centro de Diseño y Comunicación, S.C. | Chair | NO | |||||||||
| Bolsa Mexicana de Valores, S.A.B. de C.V. | Director | YES | |||||||||
| Glenn Hogan Hutchins | AT&T Inc. | Director | YES | ||||||||
| North Island, LL | Chair | NO | |||||||||
| North Island Ventures, LLC | Chair | NO | |||||||||
| Luis Isasi Fernández de Bobadilla | Compañía de Distribución Integral Logista Holdings, S.A. | Vice Chair | YES | ||||||||
| Balcón del Parque, S.L. | Sole administrator | NO | |||||||||
Santa Clara de C. Activos, S.L. | Director | NO | |||||||||
| Ramiro Mato García-Ansorena | Ansorena, S.A. | Chair | NO | ||||||||
| Belén Romana García | Werfen, S.A. | Director | YES | ||||||||
| Six Group AG | Director | YES | |||||||||
SIX Digital Exchange AG | Chair | YES | |||||||||
SDX Trading AG | Chair | YES | |||||||||
| Bolsas y Mercados Españoles, Sociedad Holding de Mercados y Sistemas Financieros, S.A. | Director | YES | |||||||||
Indicate, where appropriate, the other remunerated activities of the directors or directors' representatives, whatever their nature, other than those indicated in the previous table.
| Identity of the director or representative | Other paid activities | ||||
| Bruce Carnegie-Brown | Member of investment committee of Gresham House PLC | ||||
| Glenn Hogan Hutchins | Member of the international advisory board Government of Singapore Investment Corporation | ||||
| Member of the executive committee of Boston Celtics | |||||
| Luis Isasi Fernández de Bobadilla | Senior Advisor of Morgan Stanley | ||||
| Ramiro Mato García-Ansorena | External advisor of ACON Southern Europe Advisory, S.L. | ||||
| Belén Romana García | Senior advisor of Artá Capital, S.G.E.I.C., S.A | ||||
Academic director of the IE Leadership & Foresight Hub Programme | |||||
| Pamela Walkden | Member of the advisory board of JD Haspel Limited | ||||
298
C.1.12 Indicate and, if applicable explain, if the company has established rules on the maximum number of directorships its directors may hold and, if so, where they are regulated:
Yes þ No o
The maximum number of directorships is established, as provided for in article 30 of the Rules and regulations of the board, in article 26 of Spanish Law 10/2014 on the ordering, supervision and solvency of credit institutions. This rule is further developed by articles 29 and subsequent of Royal Decree 84/2015 and by Rules 30 and subsequent of Bank of Spain Circular 2/2016.
C.1.13 Identify the following items of the total remuneration of the board of directors:
| Board remuneration accrued in the fiscal year (EUR thousand) | 28,567 | ||||
| Funds accumulated by current directors for long-term savings systems with consolidated economic rights (EUR thousand) | 69,338 | ||||
Funds accumulated by current directors for long-term savings systems with unconsolidated economic rights (EUR thousand) | 0 | ||||
| Pension rights accumulated by former directors (EUR thousand) | 46,200 | ||||
C.1.14 Identify the members of the company’s senior management who are non executive directors and indicate total remuneration they have accrued during the financial year:
Name or corporate name | Position (s) | ||||
Mahesh Aditya | Group Chief Risk Officer | ||||
Daniel Barriuso | Global Head of Retail & Commercial Banking and Group Chief Transformation Officer | ||||
| Alexandra Brandão | Group Head of Human Resources | ||||
| Juan Manuel Cendoya Méndez de Vigo | Group Head of Communications, Corporate Marketing and Research | ||||
| José Francisco Doncel Razola | Group Chief Accounting Officer | ||||
| José Antonio García Cantera | Group Chief Financial Officer | ||||
| Juan Guitard Marín | Group Chief Audit Executive | ||||
| José Maria Linares Perou | Global Head of Corporate & Investment Banking | ||||
| Mónica Lopez-Monís Gallego | Group Head of Supervisory and Regulatory Relations | ||||
| Dirk Marzluf | Group Chief Operating & Technology Officer | ||||
| Víctor Matarranz Sanz de Madrid | Global Head of Wealth Management & Insurance | ||||
| José Luis de Mora Gil-Gallardo | Group Head of Digital Consumer Bank and Group Head of Corporate Development and Financial Planning | ||||
| Jaime Pérez Renovales | Group General Counsel | ||||
| Marjolein van Hellemondt-Gerdingh | Group Chief Compliance Officer | ||||
| Number of women in senior management | 3 | ||||
| Percentage of total senior management | 21.43 | ||||
| Total remuneration accrued by the senior management (EUR thousand) | 50,369 | ||||
C.1.15 Indicate whether any changes have been made to the board's regulations during the financial year:
Yes þ No o
C.1.21 Indicate whether there are any specific requirements, other than those applying to directors generally, to be appointed Chair:
Yes o No þ
C.1.23 Indicate whether the Bylaws or the board's regulations set a limited term of office (or other requirements which are stricter than those provided for in the law) for independent directors different than the one provided for in the law.
Yes o No þ
C.1.25 Indicate the number of board meetings held during the financial year and how many times the board has met without the Chair’s attendance. Attendance also includes proxies appointed with specific instructions:
| Number of board meetings | 15 | ||||
| Number of board meetings held without the Chair’s attendance | 0 | ||||
Indicate the number of meetings held by the Lead Independent Director with the rest of directors without the attendance or representation of any executive director.
| Number of meetings | 5 | ||||
299
Indicate the number of meetings of the various board committees held during the financial year.
| Number of meetings of the audit committee | 15 | ||||
| Number of meetings of the responsible banking, sustainability and culture committee | 6 | ||||
| Number of meetings of the innovation and technology committee | 4 | ||||
| Number of meetings of the nomination committee | 13 | ||||
| Number of meetings of the remuneration committee | 12 | ||||
| Number of meetings of the risk supervision, regulation and compliance committee | 17 | ||||
| Number of meetings of the executive committee | 23 | ||||
C.1.26 Indicate the number of board meetings held during the financial year and data about the attendance of the directors:
| Number of meetings with at least 80% of directors being present | 15 | ||||
| % of votes cast by members present over total votes in the financial year | 100 | ||||
| Number of board meetings with all directors being present (or represented having given specific instructions) | 15 | ||||
| % of votes cast by members present at the meeting or represented with specific instructions over total votes in the financial year | 100 | ||||
C.1.27 Indicate whether the company´s consolidated and individual financial statements are certified before they are submitted to the board for their formulation.
Yes þ No o
Identify, where applicable, the person(s) who certified the company’s individual and consolidated financial statements prior to their formulation by the board:
Name | Position | ||||
| José Francisco Doncel Razola | Group Chief Accounting Officer | ||||
C.1.29 Is the secretary of the board also a director?
Yes o No þ
If the secretary of the board is not a director fill in the following table:
Name or corporate name of the secretary | Representative | ||||
| Jaime Pérez Renovales | N/A | ||||
C.1.31 Indicate whether the company has changed its external audit firm during the financial year. If so, identify the incoming audit firm and the outgoing audit firm:
Yes o No þ
C.1.32 Indicate whether the audit firm performs non-audit work for the company and/or its group. If so, state the amount of fees paid for such work and express this amount as a percentage they represent of all fees invoiced to the company and/or its group.
Yes þ No o
| Company | Group companies | Total | |||||||||
| Amount of non-audit work (EUR thousand) | 9,372 | 10,192 | 19,564 | ||||||||
| Amount of non-audit work as a % of amount of audit work | 35.08 | 13.12 | 18.74 | ||||||||
C.1.33 Indicate whether the audit report on the previous year’s financial statements contains a qualified opinion or reservations. Indicate the reasons given by the Chair of the audit committee to the shareholders in the general shareholders meeting to explain the content and scope of those qualified opinion or reservations.
Yes o No þ
300
C.1.34 Indicate the number of consecutive years during which the current audit firm has been auditing the financial statements of the company and/or its group. Likewise, indicate for how many years the current firm has been auditing the financial statements as a percentage of the total number of years over which the financial statements have been audited:
Individual financial statements | Consolidated financial statements | |||||||
| Number of consecutive years | 8 | 8 | ||||||
Company | Group | |||||||
| Number of years audited by current audit firm/Number of years the company’s or its Group financial statements have been audited (%) | 19.05 | 19.51 | ||||||
C.1.35 Indicate and if applicable explain whether there are procedures for directors to receive the information they need in sufficient time to prepare for meetings of the governing bodies:
Yes þ No o
| Procedures | ||
| Our Rules and regulations of the board foresees that members of the board and committees are provided with the relevant documentation for each meeting sufficiently in advance of the meeting date. | ||
C.1.39 Identify, individually in the case of directors, and in the aggregate in all other cases, and provide detailed information on, agreements between the company and its directors, executives and employees that provide indemnification, guarantee or golden parachute clause in the event of resignation, unfair dismissal or termination as a result of a takeover bid or other type of transaction.
| Number of beneficiaries | 22 | ||||
| Type of beneficiary | Description of the agreement: | ||||
| Employees | The Bank has no commitments to provide severance pay to directors. A number of employees have a right to compensation equivalent to one to two years of their basic salary in the event of their contracts being terminated by the Bank in the first two years of their contract in the event of dismissal on grounds other than their own will, retirement, disability or serious dereliction of duties. In addition, for the purposes of legal compensation, in the event of redundancy a number of employees are entitled to recognition of length of service including services provided prior to being contracted by the Bank; this would entitle them to higher compensation than they would be due based on their actual length of service with the Bank itself. | ||||
Indicate whether these agreements must be reported to and/or authorised by the governing bodies of the company or its group beyond the procedures provided for in applicable law. If applicable, specify the process applied, the situations in which they apply, and the bodies responsible for approving or communicating those agreements:
| Board of directors | General Shareholders’ Meeting | |||||||
| Body authorising clauses | √ | |||||||
YES | NO | |||||||
| Is the general shareholders’ meeting informed of such clauses? | √ | |||||||
301
C.2 Board committees
C.2.1 Give details of all the board committees, their members and the proportion of executive, independent and other external directors.
Executive committee | ||||||||
Name | Position | Type | ||||||
| Ana Botín-Sanz de Sautuola y O’Shea | Chair | Executive director | ||||||
Héctor Grisi Checa | Member | Executive director | ||||||
| José Antonio Álvarez Álvarez | Member | Other external director | ||||||
| Luis Isasi Fernández de Bobadilla | Member | Other external director | ||||||
| Ramiro Mato García-Ansorena | Member | Independent director | ||||||
| Belén Romana García | Member | Independent director | ||||||
| % of executive directors | 33.33 | |||||||
| % of proprietary directors | 0.00 | |||||||
| % of independent directors | 33.33 | |||||||
| % of other external directors | 33.33 | |||||||
| Audit committee | ||||||||
Name | Position | Type | ||||||
| Pamela Walkden | Chair | Independent director | ||||||
| Homaira Akbari | Member | Independent director | ||||||
| Henrique de Castro | Member | Independent director | ||||||
| Germán de la Fuente | Member | Independent director | ||||||
| Ramiro Mato García-Ansorena | Member | Independent director | ||||||
| Belén Romana García | Member | Independent director | ||||||
| % of executive directors | 0 | |||||||
| % of proprietary directors | 0 | |||||||
| % of independent directors | 100 | |||||||
| % of other external directors | 0 | |||||||
Identify those directors in the audit committee who have been appointed on the basis of their knowledge and experience in accounting, audit or both and indicate the date of appointment of the committee chair.
Name of directors with accounting or audit experience | Pamela Walkden Belén Romana García Homaira Akbari Germán de la Fuente Henrique de Castro Ramiro Mato García-Ansorena | ||||
Date of appointment of the committee chair for that position | 26 April 2020 | ||||
| Nomination committee | ||||||||
Name | Position | Type | ||||||
Bruce Carnegie-Brown | Chair | Independent director | ||||||
Sol Daurella Comadrán | Member | Independent director | ||||||
| Gina Díez Barroso | Member | Independent director | ||||||
| Glenn Hutchins | Member | Independent director | ||||||
% of executive directors | 0 | |||||||
% of proprietary directors | 0 | |||||||
% of independent directors | 100 | |||||||
| % of other external directors | 0 | |||||||
302
| Remuneration committee | ||||||||
Name | Position | Type | ||||||
Glenn Hogan Hutchins | Chair | Independent director | ||||||
Bruce Carnegie-Brown | Member | Independent director | ||||||
Sol Daurella Comadrán | Member | Independent director | ||||||
Henrique de Castro | Member | Independent director | ||||||
| Luis Isasi Fernández de Bobadilla | Member | Other external director | ||||||
% of executive directors | 0 | |||||||
% of proprietary directors | 0 | |||||||
% of independent directors | 80.00 | |||||||
% of other external directors | 20.00 | |||||||
| Risk supervision, regulation and compliance committee | ||||||||
Name | Position | Type | ||||||
| Belén Romana García | Chair | Independent director | ||||||
Germán de la Fuente | Member | Independent director | ||||||
Luis Isasi Fernández de Bobadilla | Member | Other external director | ||||||
Ramiro Mato García-Ansorena | Member | Independent director | ||||||
Pamela Walkden | Member | Independent director | ||||||
% of executive directors | 0 | |||||||
% of proprietary directors | 0 | |||||||
% of independent directors | 80.00 | |||||||
% of other external directors | 20.00 | |||||||
| Responsible banking, sustainability and culture committee | ||||||||
Name | Position | Type | ||||||
Ramiro Mato García-Ansorena | Chair | Independent director | ||||||
Homaira Akbari | Member | Independent director | ||||||
Sol Daurella Comadrán | Member | Independent director | ||||||
Gina Díez Barroso | Member | Independent director | ||||||
Belén Romana García | Member | Independent director | ||||||
% of executive directors | 0 | |||||||
% of proprietary directors | 0 | |||||||
% of independent directors | 100 | |||||||
% of other external directors | 0 | |||||||
| Innovation and technology committee | ||||||||
Name | Position | Type | ||||||
| Ana Botín-Sanz de Sautuola y O'Shea | Chair | Executive director | ||||||
Homaira Akbari | Member | Independent director | ||||||
José Antonio Álvarez Álvarez | Member | Other external director | ||||||
Henrique de Castro | Member | Independent director | ||||||
Héctor Grisi Checa | Member | Executive director | ||||||
Glenn Hogan Hutchins | Member | Independent director | ||||||
Belén Romana García | Member | Independent director | ||||||
% of executive directors | 28.57 | |||||||
% of proprietary directors | 0.00 | |||||||
% of independent directors | 57.14 | |||||||
| % of other external directors | 14.29 | |||||||
303
C.2.2 Complete the following table on the number of female directors on the various board committees over the past four years.
Number of female directors | |||||||||||||||||||||||||||||||||||
| FY 2023 | FY 2022 | FY 2021 | FY 2020 | ||||||||||||||||||||||||||||||||
| Number | % | Number | % | Number | % | Number | % | ||||||||||||||||||||||||||||
Audit committee | 3 | 50.00 | 3 | 50.00 | 3 | 60.00 | 3 | 60.00 | |||||||||||||||||||||||||||
Responsible banking, sustainability and culture committee | 4 | 80.00 | 3 | 75.00 | 3 | 60.00 | 3 | 60.00 | |||||||||||||||||||||||||||
Innovation and technology committee | 3 | 42.86 | 3 | 42.86 | 3 | 42.86 | 3 | 42.85 | |||||||||||||||||||||||||||
Nomination committee | 2 | 50.00 | 2 | 50.00 | 2 | 50.00 | 1 | 33.33 | |||||||||||||||||||||||||||
Remuneration committee | 1 | 20.00 | 1 | 20.00 | 1 | 20.00 | 1 | 20.00 | |||||||||||||||||||||||||||
Risk supervision, regulation and compliance committee | 2 | 40.00 | 2 | 50.00 | 2 | 40.00 | 1 | 20.00 | |||||||||||||||||||||||||||
Executive committee | 2 | 33.33 | 2 | 33.33 | 2 | 33.33 | 2 | 33.33 | |||||||||||||||||||||||||||
D. RELATED-PARTY AND INTRAGROUP TRANSACTIONS
D.2 Give individual details of operations that are significant due to their amount or of importance due to their subject matter carried out between the company or its subsidiaries and shareholders holding 10% or more of the voting rights or who are represented on the board of directors of the company, indicating which has been the competent body for its approval and if any affected shareholder or director has abstained. In the event that the board of directors has responsibility, indicate if the proposed resolution has been approved by the board without a vote against the majority of the independents:
Not applicable.
D.3 Give individual details of the operations that are significant due to their amount or relevant due to their subject matter carried out by the company or its subsidiaries with the administrators or managers of the company, including those operations carried out with entities that the administrator or manager controls or controls jointly, indicating the competent body for its approval and if any affected shareholder or director has abstained. In the event that the board of directors has responsibility, indicate if the proposed resolution has been approved by the board without a vote against the majority of the independents:
Not applicable.
D.4 Report individually on intra-group transactions that are significant due to their amount or relevant due to their subject matter that have been undertaken by the company with its parent company or with other entities belonging to the parent's group, including subsidiaries of the listed company, except where no other related party of the listed company has interests in these subsidiaries or that they are fully owned, directly or indirectly, by the listed company.
In any case, report any intragroup transactions carried out with entities in countries or territories considered to be tax havens.
| Corporate name of the group company | Brief description of the transaction and any other information necessary for its evaluation | Amount (EUR thousand) | ||||||
The information included in this chart shows the transactions and the results obtained by the Bank in Spain and its foreign branches as of 31 December 2023 with Group entities resident in countries or territories that were considered non-cooperative jurisdictions pursuant to Spanish legislation, at such date (Law 11/2021 on measures to prevent and fight against tax fraud). These results, and the balances indicated below, were eliminated in the consolidation process. See note 3 to the 2023 consolidated financial statements for more information on offshore entities. | ||||||||
| Banco Santander (Brasil) S.A. (Cayman Islands Branch) | The amount shown on the right corresponds to negative results (including results due to exchange differences) relating to contracting of derivatives. The referred derivatives had a net negative market value of EUR 697 million and covered the following transactions: - 142 Non Delivery Forwards. - 175 Swaps. - 55 Cross Currency Swaps. - 24 Options. - 26 Forex. | 416,850 | ||||||
The amount shown on the right corresponds to negative results relating to demand deposits (liability). These deposits had a nominal value of EUR 2,311 million as of 31 December 2023. | 61,906 | |||||||
The amount shown on the right corresponds to positive results relating to demand deposits (asset). These deposits had a nominal value of EUR 19 million as of 31 December 2023. | 22 | |||||||
The amount shown on the right corresponds to positive results relating to fixed income securities-subordinated instruments (asset). This relates to the investment in November 2018 in two subordinated instruments (Tier I Subordinated Perpetual Notes and Tier II Subordinated Notes with maturity 2028, but with a full and early redemption option exercised in November 2023). Tier I Notes had an amortised cost of EUR 1,146 million as of 31 December 2023. | 148,680 | |||||||
The amount shown on the right corresponds to negative results relating to interests and commissions concerning correspondent accounts (liability). This relates to correspondent accounts with a credit balance of EUR 22 million as of 31 December 2023. | 412 | |||||||
The amount shown on the right corresponds to positive results relating to commissions received. | 139 | |||||||
304
D.5 Give individual details of the operations that are significant due to their amount or relevant due to their subject matter carried out by the company or its subsidiaries with other related parties pursuant to the international accounting standards adopted by the EU, which have not been reported in previous sections.
Not applicable.
G. DEGREE OF COMPLIANCE WITH THE CORPORATE GOVERNANCE RECOMMENDATIONS
Indicate the degree of the company’s compliance with the recommendations of the good governance code for listed companies.
Should the company not comply with any of the recommendations or comply only in part, include a detailed explanation of the reasons so that shareholders, investors and the market in general have enough information to assess the company’s behaviour. General explanations are not acceptable.
1. The bylaws of listed companies should not place an upper limit on the votes that can be cast by a single shareholder, or impose other obstacles to the takeover of the company by means of share purchases on the market.
Complies þ Explain o
2. When the listed company is controlled, pursuant to the meaning established in Article 42 of the Commercial Code, by another listed or non-listed entity, and has, directly or through its subsidiaries, business relationships with that entity or any of its subsidiaries (other than those of the listed company) or carries out activities related to the activities of any of them, this is reported publicly, with specific information about:
a) The respective areas of activity and possible business relationships between, on the one hand, the listed company or its subsidiaries and, on the other, the parent company or its subsidiaries.
b) The mechanisms established to resolve any conflicts of interest that may arise.
Complies o Partially complies o Explain o Not applicable þ
3. During the AGM the chair of the board should verbally inform shareholders in sufficient detail of the most relevant aspects of the company’s corporate governance, supplementing the written information circulated in the annual corporate governance report. In particular:
a) Changes taking place since the previous annual general meeting.
b) The specific reasons for the company not following a given Good Governance Code recommendation, and any alternative procedures followed in its stead.
Complies þ Partially complies o Explain o
4. The company should define and promote a policy for communication and contact with shareholders and institutional investors within the framework of their involvement in the company, as well as with proxy advisors, that complies in full with the rules on market abuse and gives equal treatment to shareholders who are in the same position. The company should make said policy public through its website, including information regarding the way in which it has been implemented and the parties involved or those responsible its implementation.
Further, without prejudice to the legal obligations of disclosure of inside information and other regulated information, the company should also have a general policy for the communication of economic-financial, non-financial and corporate information through the channels it considers appropriate (media, social media or other channels) that helps maximise the dissemination and quality of the information available to the market, investors and other stakeholders.
Complies þ Partially complies o Explain o
5. The board of directors should not make a proposal to the general meeting for the delegation of powers to issue shares or convertible securities without pre-emptive subscription rights for an amount exceeding 20% of capital at the time of such delegation.
And that whenever the board of directors approves an issuance of shares or convertible securities without pre-emptive rights the company immediately publishes reports on its web page regarding said exclusions as referenced in applicable mercantile law.
Complies þ Partially complies o Explain o
6. Listed companies drawing up the following reports on a voluntary or compulsory basis should publish them on their website well in advance of the AGM, even if their distribution is not obligatory:
a) Report on auditor independence.
b) Reviews of the operation of the audit committee and the nomination and remuneration committees.
c) Audit committee report on third-party transactions.
Complies þ Partially complies o Explain o
7. The company should broadcast its general meetings live on the corporate website.
The company should have mechanisms that allow the delegation and exercise of votes by electronic means and even, in the case of large-cap companies and, to the extent that it is proportionate, attendance and active participation in the general shareholders’ meeting.
Complies þ Explain o
8. The audit committee should strive to ensure that the financial statements that the board of directors presents to the general shareholders’ meeting are drawn up in accordance to accounting legislation. And in those cases where the auditors includes any qualification in its report, the chair of the audit committee should give a clear explanation at the general meeting of their opinion regarding the scope and content, making a summary of that opinion available to the shareholders at the time of the publication of the notice of the meeting, along with the rest of proposals and reports of the board.
Complies þ Partially complies o Explain o
305
9. The company should disclose its conditions and procedures for admitting share ownership, the right to attend general meetings and the exercise or delegation of voting rights, and display them permanently on its website.
Such conditions and procedures should encourage shareholders to attend and exercise their rights and be applied in a non-discriminatory manner.
Complies þ Partially complies o Explain o
10. When a shareholder so entitled exercises the right to supplement the agenda or submit new proposals prior to the general meeting, the company should:
a) Immediately circulate the supplementary items and new proposals.
b) Disclose the standard attendance card or proxy appointment or remote voting form, duly modified so that new agenda items and alternative proposals can be voted on in the same terms as those submitted by the board of directors.
c) Put all these items or alternative proposals to the vote applying the same voting rules as for those submitted by the board of directors, with particular regard to presumptions or deductions about the direction of votes.
d) After the general meeting, disclose the breakdown of votes on such supplementary items or alternative proposals.
Complies þ Partially complies o Explain o Not applicable o
11. In the event that a company plans to pay for attendance at the general meeting, it should first establish a general, long-term policy in this respect.
Complies o Partially complies o Explain o Not applicable þ
12. The board of directors should perform its duties with unity of purpose and independent judgement, according the same treatment to all shareholders in the same position. It should be guided at all times by the company’s best interest, understood as the creation of a profitable business that promotes its sustainable success over time, while maximising its economic value.
In pursuing the corporate interest, it should not only abide by laws and regulations and conduct itself according to principles of good faith, ethics and respect for commonly accepted customs and good practices, but also strive to reconcile its own interests with the legitimate interests of its employees, suppliers, clients and other stakeholders, as well as with the impact of its activities on the broader community and the natural environment.
Complies þ Partially complies o Explain o
13. The board of directors should have an optimal size to promote its efficient functioning and maximise participation. The recommended range is accordingly between five and fifteen members.
Complies þ Explain o
14. The board of directors should approve a policy aimed at promoting an appropriate composition of the board that:
a) is concrete and verifiable;
b) ensures that appointment or re-election proposals are based on a prior analysis of the competences required by the board; and
c) favours diversity of knowledge, experience, age and gender. Therefore, measures that encourage the company to have a significant number of female senior managers are considered to favour gender diversity.
The results of the prior analysis of competences required by the board should be written up in the nomination committee’s explanatory report, to be published when the general shareholders’ meeting is convened that will ratify the appointment and re-election of each director.
The nomination committee should run an annual check on compliance with this policy and set out its findings in the annual corporate governance report.
Complies þ Partially complies o Explain o
15. Proprietary and independent directors should constitute an ample majority on the board of directors, while the number of executive directors should be the minimum practical bearing in mind the complexity of the corporate group and the ownership interests they control.
Further, the number of female directors should account for at least 40% of the members of the board of directors before the end of 2022 and thereafter, and not less than 30% previous to that.
Complies þ Partially complies o Explain o
16. The percentage of proprietary directors out of all non-executive directors should be no greater than the proportion between the ownership stake of the shareholders they represent and the remainder of the company’s capital.
This criterion can be relaxed:
a) In large cap companies where few or no equity stakes attain the legal threshold for significant shareholdings.
b) In companies with a plurality of shareholders represented on the board but not otherwise related.
Complies þ Explain o
17. Independent directors should be at least half of all board members.
However, when the company does not have a large market capitalisation, or when a large cap company has shareholders individually or concertedly controlling over 30 percent of capital, independent directors should occupy, at least, a third of board places.
Complies þ Explain o
18. Companies should disclose the following director particulars on their websites and keep them regularly updated:
a) Background and professional experience.
b) Directorships held in other companies, listed or otherwise, and other paid activities they engage in, of whatever nature.
c) Statement of the director class to which they belong, in the case of proprietary directors indicating the shareholder they represent or have links with.
d) Dates of their first appointment as a board member and subsequent re-elections.
e) Shares held in the company, and any options on the same.
Complies þ Partially complies o Explain o
19. Following verification by the nomination committee, the annual corporate governance report should disclose the reasons for the appointment of proprietary directors at the urging of shareholders controlling less than 3 percent of capital; and explain any rejection of a formal request for a board place from shareholders whose equity stake is equal to or greater than that of others applying successfully for a proprietary directorship.
Complies o Partially complies o Explain o Not applicable þ
306
20. Proprietary directors should resign when the shareholders they represent dispose of their ownership interest in its entirety. If such shareholders reduce their stakes, thereby losing some of their entitlement to proprietary directors, the number of the latter should be reduced accordingly.
Complies þ Partially complies o Explain o Not applicable o
21. The board of directors should not propose the removal of independent directors before the expiry of their tenure as mandated by the bylaws, except where they find just cause, based on a proposal from the nomination committee. In particular, just cause will be presumed when directors take up new posts or responsibilities that prevent them allocating sufficient time to the work of a board member, or are in breach of their fiduciary duties or come under one of the disqualifying grounds for classification as independent enumerated in the applicable legislation.
The removal of independent directors may also be proposed when a takeover bid, merger or similar corporate transaction alters the company’s capital structure, provided the changes in board membership ensue from the proportionality criterion set out in recommendation 16.
Complies þ Explain o
22. Companies should establish rules obliging directors to disclose any circumstance that might harm the organisation’s name or reputation, related or not to their actions within the company, and tendering their resignation as the case may be, and, in particular, to inform the board of any criminal charges brought against them and the progress of any subsequent trial.
When the board is informed or becomes aware of any of the situations mentioned in the previous paragraph, the board of directors should examine the case as soon as possible and, attending to the particular circumstances, decide, based on a report from the nomination and remuneration committee, whether or not to adopt any measures such as opening of an internal investigation, calling on the director to resign or proposing his or her dismissal. The board should give a reasoned account of all such determinations in the annual corporate governance report, unless there are special circumstances that justify otherwise, which must be recorded in the minutes. This is without prejudice to the information that the company must disclose, if appropriate, at the time it adopts the corresponding measures.
Complies þ Partially complies o Explain o
23. Directors should express their clear opposition when they feel a proposal submitted for the board’s approval might damage the corporate interest. In particular, independents and other directors not subject to potential conflicts of interest should strenuously challenge any decision that could harm the interests of shareholders lacking board representation.
When the board makes material or reiterated decisions about which a director has expressed serious reservations, then he or she must draw the pertinent conclusions. Directors resigning for such causes should set out their reasons in the letter referred to in the next recommendation.
The terms of this recommendation also apply to the secretary of the board, even if he or she is not a director.
Complies þ Partially complies o Explain o Not applicable o
24. Directors who give up their position before their tenure expires, through resignation or resolution of the general meeting, should state the reasons for this decision, or in the case of non-executive directors, their opinion of the reasons for the general meeting resolution, in a letter to be sent to all members of the board.
This should all be reported in the annual corporate governance report, and if it is relevant for investors, the company should publish an announcement of the departure as rapidly as possible, with sufficient reference to the reasons or circumstances provided by the director.
Complies þ Partially complies o Explain o Not applicable o
25. The nomination committee should ensure that non-executive directors have sufficient time available to discharge their responsibilities effectively.
The board rules and regulations should lay down the maximum number of company boards on which directors can serve.
Complies þ Partially complies o Explain o
26. The board should meet with the necessary frequency to properly perform its functions, eight times a year at least, in accordance with a calendar and agendas set at the start of the year, to which each director may propose the addition of initially unscheduled items.
Complies þ Partially complies o Explain o
27. Director absences should be kept to a strict minimum and quantified in the annual corporate governance report. In the event of absence, directors should delegate their powers of representation with the appropriate instructions.
Complies þ Partially complies o Explain o
28. When directors or the secretary express concerns about some proposal or, in the case of directors, about the company’s performance, and such concerns are not resolved at the meeting, they should be recorded in the minutes book if the person expressing them so requests.
Complies þ Partially complies o Explain o Not applicable o
29. The company should provide suitable channels for directors to obtain the advice they need to carry out their duties, extending if necessary to external assistance at the company’s expense.
Complies þ Partially complies o Explain o
30. Regardless of the knowledge directors must possess to carry out their duties, they should also be offered refresher programmes when circumstances so advise.
Complies þ Explain o Not applicable o
31. The agendas of board meetings should clearly indicate on which points directors must arrive at a decision, so they can study the matter beforehand or obtain the information they consider appropriate.
For reasons of urgency, the chair may wish to present decisions or resolutions for board approval that were not on the meeting agenda. In such exceptional circumstances, their inclusion will require the express prior consent, duly minuted, of the majority of directors present.
Complies þ Partially complies o Explain o
32. Directors should be regularly informed of movements in share ownership and of the views of major shareholders, investors and rating agencies on the company and its group.
Complies þ Partially complies o Explain o
33. The chair, as the person responsible for the efficient functioning of the board of directors, in addition to the functions assigned by law and the company’s bylaws, should prepare and submit to the board a schedule of meeting dates and agendas; organise and coordinate regular evaluations of the board and, where appropriate, of the company’s chief executive officer;
307
exercise leadership of the board and be accountable for its proper functioning; ensure that sufficient time is given to the discussion of strategic issues, and approve and review refresher courses for each director, when circumstances so advise.
Complies þ Partially complies o Explain o
34. When a lead independent director has been appointed, the bylaws or the Rules and regulations of the board of directors should grant him or her the following powers over and above those conferred by law: to chair the board of directors in the absence of the chair or vice chair; to give voice to the concerns of non-executive directors; to maintain contact with investors and shareholders to hear their views and develop a balanced understanding of their concerns, especially those to do with the company’s corporate governance; and to coordinate the chair’s succession plan.
Complies þ Partially complies o Explain o Not applicable o
35. The board secretary should strive to ensure that the board’s actions and decisions are informed by the governance recommendations of the Good Governance Code of relevance to the company.
Complies þ Explain o
36. The board in full should conduct an annual evaluation, adopting, where necessary, an action plan to correct weakness detected in:
a) The quality and efficiency of the board’s operation.
b) The performance and membership of its committees.
c) The diversity of board membership and competencies.
d) The performance of the chair of the board of directors and the company’s chief executive.
e) The performance and contribution of individual directors, with particular attention to the chair of board committees.
The evaluation of board committees should start from the reports they send to the board of directors, while that of the board itself should start from the report of the nomination committee.
Every three years, the board of directors should engage an external facilitator to aid in the evaluation process. This facilitator’s independence should be verified by the nomination committee.
Any business dealings that the facilitator or members of its corporate group maintain with the company or members of its corporate group should be detailed in the annual corporate governance report.
The process followed and areas evaluated should be detailed in the annual corporate governance report.
Complies þ Partially complies o Explain o
37. When there is an executive committee, there should be at least two non-executive members, at least one of whom should be independent; and its secretary should be the secretary of the board of directors.
Complies þ Partially complies o Explain o Not applicable o
38. The board should be kept fully informed of the matters discussed and decisions made by the executive committee. To this end, all board members should receive a copy of the committee’s minutes.
Complies þ Partially complies o Explain o Not applicable o
39. All members of the audit committee, particularly its chair, should be appointed with regard to their knowledge and experience in accounting, auditing and risk management matters, both financial and non-financial.
Complies þ Partially complies o Explain o
40. Listed companies should have a unit in charge of the internal audit function, under the supervision of the audit committee, to monitor the effectiveness of reporting and control systems. This unit should report functionally to the board’s non-executive chair or the chair of the audit committee.
Complies þ Partially complies o Explain o
41. The head of the unit handling the internal audit function should present an annual work programme to the audit committee, for approval by this committee or the board, inform it directly of any incidents or scope limitations arising during its implementation, the results and monitoring of its recommendations, and submit an activities report at the end of each year.
Complies þ Partially complies o Explain o Not applicable o
42. The audit committee should have the following functions over and above those legally assigned:
1. With respect to internal control and reporting systems:
a) Monitor and evaluate the preparation process and the integrity of the financial and non-financial information, as well as the control and management systems for financial and non-financial risks related to the company and, where appropriate, to the group – including operating, technological, legal, social, environmental, political and reputational risks or those related to corruption – reviewing compliance with regulatory requirements, the accurate demarcation of the consolidation perimeter, and the correct application of accounting principles.
b) Monitor the independence of the unit handling the internal audit function; propose the selection, appointment and removal of the head of the internal audit service; propose the service’s budget; approve or make a proposal for approval to the board of the priorities and annual work programme of the internal audit unit, ensuring that it focuses primarily on the main risks the company is exposed to (including reputational risk); receive regular report-backs on its activities; and verify that senior management are acting on the findings and recommendations of its reports.
c) Establish and supervise a mechanism that allows employees and other persons related to the company, such as directors, shareholders, suppliers, contractors or subcontractors, to report irregularities of potential significance, including financial and accounting irregularities, or those of any other nature, related to the company, that they notice within the company or its group. This mechanism must guarantee confidentiality and enable communications to be made anonymously, respecting the rights of both the complainant and the accused party.
d) In general, ensure that the internal control policies and systems established are applied effectively in practice.
2. With regard to the external auditor:
a) Investigate the issues giving rise to the resignation of the external auditor, should this come about.
b) Ensure that the remuneration of the external auditor, does not compromise its quality or independence.
c) Ensure that the company notifies any change of external auditor through the CNMV, accompanied by a statement of any disagreements arising with the outgoing auditor and the reasons for the same.
308
d) Ensure that the external auditor has a yearly meeting with the board in full to inform it of the work undertaken and developments in the company’s risk and accounting positions.
e) Ensure that the company and the external auditor adhere to current regulations on the provisions of non-audit services, limits on the concentration of the auditor’s business and other requirements concerning auditor independence.
Complies þ Partially complies o Explain o
43. The audit committee should be empowered to meet with any company employee or manager, even ordering their appearance without the presence of another manager.
Complies þ Partially complies o Explain o
44. The audit committee should be informed of any structural changes or corporate transactions the company is planning, so the committee can analyse the operation and report to the board beforehand on its economic conditions and accounting impact and, when applicable, the exchange ratio proposed.
Complies þ Partially complies o Explain o Not applicable o
45. Risk control and management policy should identify or establish at least:
a) The different types of financial and non-financial risk the company is exposed to (including operational, technological, financial, legal, social, environmental, political and reputational risks, and risks relating to corruption), with the inclusion under financial or economic risks of contingent liabilities and other off-balance-sheet risks.
b) A risk control and management model based on different levels, of which a specialised risk committee will form part when sector regulations provide or the company deems it appropriate.
c) The level of risk that the company considers acceptable.
d) The measures in place to mitigate the impact of identified risk events should they occur.
e) The internal control and reporting systems to be used to control and manage the above risks, including contingent liabilities and off-balance-sheet risks.
Complies þ Partially complies o Explain o
46. Companies should establish a risk control and management function in the charge of one of the company’s internal department or units and under the direct supervision of the audit committee or some other specialised board committee. This internal department or unit should be expressly charged with the following responsibilities:
a) Ensure that risk control and management systems are functioning correctly and, specifically, that major risks the company is exposed to are correctly identified, managed and quantified.
b) Participate actively in the preparation of risk strategies and in key decisions about their management.
c) Ensure that risk control and management systems are mitigating risks effectively in the frame of the policy drawn up by the board of directors.
Complies þ Partially complies o Explain o
47. Members of the nomination and remuneration committee-or of the nomination committee and remuneration committee, if separately constituted - should be chosen procuring they have the right balance of knowledge, skills and experience for the functions they are called on to discharge. The majority of their members should be independent directors.
Complies þ Partially complies o Explain o
48. Large cap companies should have formed separate nomination and remuneration committees.
Complies þ Explain o Not applicable o
49. The nomination committee should consult with the company’s chair and chief executive, especially on matters relating to executive directors.
When there are vacancies on the board, any director may approach the nomination committee to propose candidates that it might consider suitable.
Complies þ Partially complies o Explain o
50. The remuneration committee should operate independently and have the following functions in addition to those assigned by law:
a) Propose to the board the standard conditions for senior officer contracts.
b) Monitor compliance with the remuneration policy set by the company.
c) Periodically review the remuneration policy for directors and senior officers, including share-based remuneration systems and their application, and ensure that their individual compensation is proportionate to the amounts paid to other directors and senior officers in the company.
d) Ensure that conflicts of interest do not undermine the independence of any external advice the committee engages.
e) Verify the information on director and senior officers’ pay contained in corporate documents, including the annual directors’ remuneration statement.
Complies þ Partially complies o Explain o
51. The remuneration committee should consult with the company’s chair and chief executive, especially on matters relating to executive directors and senior officers.
Complies þ Partially complies o Explain o
52. The rules regarding composition and functioning of supervision and control committees should be set out in the regulations of the board of directors and aligned with those governing legally mandatory board committees as specified in the preceding sets of recommendations. They should include at least the following terms:
a) Committees should be formed exclusively by non-executive directors, with a majority of independents.
b) They should be chaired by independent directors.
c) The board should appoint the members of such committees with regard to the knowledge, skills and experience of its directors and each committee’s terms of reference; discuss their proposals and reports; and provide report-backs on their activities and work at the first board plenary following each committee meeting.
d) They may engage external advice, when they feel it necessary for the discharge of their functions.
309
e) Meeting proceedings should be minuted and a copy made available to all board members.
Complies þ Partially complies o Explain o Not applicable o
53. The task of supervising compliance with the policies and rules of the company in the environmental, social and corporate governance areas, and internal rules of conduct, should be assigned to one board committee or split between several, which could be the audit committee, the nomination committee, a committee specialised in sustainability or corporate social responsibility, or a dedicated committee established by the board under its powers of self-organisation. Such a committee should be made up solely of non-executive directors, the majority being independent and specifically assigned the following minimum functions.
Complies þ Partially complies o Explain o
54. The minimum functions referred to in the previous recommendation are as follows:
a) Monitor compliance with the company’s internal codes of conduct and corporate governance rules, and ensure that the corporate culture is aligned with its purpose and values.
b) Monitor the implementation of the general policy regarding the disclosure of economic-financial, non-financial and corporate information, as well as communication with shareholders and investors, proxy advisors and other stakeholders. Similarly, the way in which the entity communicates and relates with small and medium-sized shareholders should be monitored.
c) Periodically evaluate the effectiveness of the company’s corporate governance system and environmental and social policy, to confirm that it is fulfilling its mission to promote the corporate interest and catering, as appropriate, to the legitimate interests of remaining stakeholders.
d) Ensure the company’s environmental and social practices are in accordance with the established strategy and policy.
e) Monitor and evaluate the company’s interaction with its stakeholder groups.
Complies þ Partially complies o Explain o
55. Environmental and social sustainability policies should identify and include at least:
a) The principles, commitments, objectives and strategy regarding shareholders, employees, clients, suppliers, social welfare issues, the environment, diversity, fiscal responsibility, respect for human rights and the prevention of corruption and other illegal conducts.
b) The methods or systems for monitoring compliance with policies, associated risks and their management.
c) The mechanisms for supervising non-financial risk, including that related to ethical aspects and business conduct.
d) Channels for stakeholder communication, participation and dialogue.
e) Responsible communication practices that prevent the manipulation of information and protect the company’s honour and integrity.
Complies þ Partially complies o Explain o
56. Director remuneration should be sufficient to attract and retain directors with the desired profile and compensate the commitment, abilities and responsibility that the post demands, but not so high as to compromise the independent judgement of non-executive directors.
Complies þ Explain o
57. Variable remuneration linked to the company and the director’s performance, the award of shares, options or any other right to acquire shares or to be remunerated on the basis of share price movements, and membership of long-term savings schemes such as pension plans, retirement accounts or any other retirement plan should be confined to executive directors.
The company may consider the share-based remuneration of non-executive directors provided they retain such shares until the end of their mandate. The above condition will not apply to any shares that the director must dispose of to defray costs related to their acquisition.
Complies þ Partially complies o Explain o
58. In the case of variable awards, remuneration policies should include limits and technical safeguards to ensure they reflect the professional performance of the beneficiaries and not simply the general progress of the markets or the company’s sector, or circumstances of that kind.
In particular, variable remuneration items should meet the following conditions:
a) Be subject to predetermined and measurable performance criteria that factor the risk assumed to obtain a given outcome.
b) Promote the long-term sustainability of the company and include non-financial criteria that are relevant for the company’s long-term value, such as compliance with its internal rules and procedures and its risk control and management policies.
c) Be focused on achieving a balance between the achievement of short, medium and long-term targets, such that performance-related pay rewards ongoing achievement, maintained over sufficient time to appreciate its contribution to long-term value creation. This will ensure that performance measurement is not based solely on one off, occasional or extraordinary events.
Complies þ Partially complies o Explain o Not applicable o
59. The payment of the variable components of remuneration is subject to sufficient verification that previously established performance, or other, conditions have been effectively met. Entities should include in their annual directors’ remuneration report the criteria relating to the time required and methods for such verification, depending on the nature and characteristics of each variable component.
Additionally, entities should consider establishing a reduction clause (‘malus’) based on deferral for a sufficient period of the payment of part of the variable components that implies total or partial loss of this remuneration in the event that prior to the time of payment an event occurs that makes this advisable.
Complies þ Partially complies o Explain o Not applicable o
60. Remuneration linked to company earnings should bear in mind any qualifications stated in the external auditor’s report that reduce their amount.
Complies þ Partially complies o Explain o Not applicable o
61. A major part of executive directors’ variable remuneration should be linked to the award of shares or financial instruments whose value is linked to the share price.
Complies þ Partially complies o Explain o Not applicable o
310
62. Following the award of shares, options or financial instruments corresponding to the remuneration schemes, executive directors should not be able to transfer their ownership or exercise them until a period of at least three years has elapsed.
Except for the case in which the director maintains, at the time of the transfer or exercise, a net economic exposure to the variation in the price of the shares for a market value equivalent to an amount of at least twice his or her fixed annual remuneration through the ownership of shares, options or other financial instruments.
The foregoing shall not apply to the shares that the director needs to dispose of to meet the costs related to their acquisition or, upon favourable assessment of the nomination and remuneration committee to address an extraordinary situation.
Complies þ Partially complies o Explain o Not applicable o
63. Contractual arrangements should include provisions that permit the company to reclaim variable components of remuneration when payment was out of step with the director’s actual performance or based on data subsequently found to be misstated.
Complies þ Partially complies o Explain o Not applicable o
64. Termination payments should not exceed a fixed amount equivalent to two years of the director’s total annual remuneration and should not be paid until the company confirms that he or she has met the predetermined performance criteria.
For the purposes of this recommendation, payments for contractual termination include any payments whose accrual or payment obligation arises as a consequence of or on the occasion of the termination of the contractual relationship that linked the director with the company, including previously unconsolidated amounts for long-term savings schemes and the amounts paid under post-contractual non-compete agreements.
Complies þ Partially complies o Explain o Not applicable o
List whether any directors voted against or abstained from voting on the approval of this Report.
Yes o No þ
I declare that the information included in this statistical annex are the same and are consistent with the descriptions and information included in the annual corporate governance report published by the company.
311
9.3 References on compliance with recommendations of Spanish Corporate Governance Code
312
Recommendation | Comply / Explain | Information | ||||||
| 43 | Comply | |||||||
| 44 | Comply | |||||||
| 45 | Comply | See 'Board regulation' in section 4.3, 'Duties and activities in 2023' in section 4.5, 'Duties and activities in 2023' in section 4.8 and the 'Risk management and compliance' chapter. | ||||||
| 46 | Comply | See 'Duties and activities in 2023' in section 4.5,'Duties and activities in 2023' in section 4.8 and the 'Risk, compliance & conduct management'' chapter. | ||||||
| 47 | Comply | |||||||
| 48 | Comply | |||||||
| 49 | Comply | |||||||
| 50 | Comply | |||||||
| 51 | Comply | |||||||
| 52 | Comply | |||||||
| 53 | Comply | See 'Board regulation' in section 4.3, 'Duties and activities in 2023' in section 4.6, 'Duties and activities in 2023' in section 4.8 and 'Duties and activities in 2023' in section 4.9. | ||||||
| 54 | Comply | See 'Board's regulation' in section 4.3, 'Duties and activities in 2023' in section 4.6, 'Duties and activities in 2023' in section 4.8 and 'Duties and activities in 2023' in section 4.9. | ||||||
| 55 | Comply | |||||||
| 56 | Comply | |||||||
| 57 | Comply | |||||||
| 58 | Comply | |||||||
| 59 | Comply | |||||||
| 60 | Comply | |||||||
| 61 | Comply | |||||||
| 62 | Comply | |||||||
| 63 | Comply | |||||||
| 64 | Comply | |||||||
313
9.4 Reconciliation to the CNMV’s remuneration report model
Section in the CNMV model | Included in statistical report | Further information elsewhere and comments | ||||||
| A. Remuneration policy for the present fiscal year | ||||||||
| A.1 | No | |||||||
| A.2 | No | |||||||
| A.3 | No | |||||||
| A.4 | No | |||||||
| B. Overall summary of application of the remuneration policy over the last fiscal year | ||||||||
| B.1 | No | |||||||
| B.2 | No | |||||||
| B.3 | No | |||||||
| B.4 | No | |||||||
| B.5 | No | |||||||
| B.6 | No | |||||||
| B.7 | No | |||||||
| B.8 | No | Not applicable. | ||||||
| B.9 | No | |||||||
| B.10 | No | |||||||
| B.11 | No | |||||||
| B.12 | No | |||||||
| B.13 | No | |||||||
| B.14 | No | |||||||
| B.15 | No | |||||||
| B.16 | No | No remuneration for this component. | ||||||
| C. Breakdown of the individual remuneration of directors | ||||||||
| C | Yes | |||||||
| C.1 a) i) | Yes | |||||||
C.1 a) ii) | Yes | |||||||
C.1 a) iii) | Yes | |||||||
C.1 a) iii) | Yes | |||||||
C.1 b) i) | Yes | |||||||
C.1 b) ii) | No | No remuneration for this component. | ||||||
C.1 b) iii) | No | No remuneration for this component. | ||||||
C.1 b) iv) | No | No remuneration for this component. | ||||||
C.1 c) | Yes | |||||||
| C.2 | Yes | |||||||
| D. Other information of interest | ||||||||
D | No | |||||||
314
9.5 Statistical information on remuneration required by the CNMV
B. OVERALL SUMMARY OF HOW REMUNERATION POLICY WAS APPLIED DURING THE YEAR ENDED
B.4 Report on the result of the consultative vote at the general shareholders’ meeting on remuneration in the previous year, indicating the number of votes in favour, votes against, abstentions and blank ballots:
| Number | % of total | |||||||
| Votes cast | 11,116,958,970 | 100.00 | % | |||||
| Number | % of votes cast | |||||||
| Votes in favour | 9,886,665,679 | 88.93 | % | |||||
| Votes against | 1,194,192,063 | 10.74 | % | |||||
| Blank | 7,043,064 | 0.06 | % | |||||
| Abstentions | 29,058,164 | 0.26 | % | |||||
C. ITEMISED INDIVIDUAL REMUNERATION ACCRUED BY EACH DIRECTOR
| Directors | Type | Period of accrual in year 2023 | ||||||
| Ana Botín-Sanz de Sautuola y O’Shea | Executive Chair | From 01/01/2023 to 31/12/2023 | ||||||
| Héctor Grisi Checa | CEO | From 01/01/2023 to 31/12/2023 | ||||||
| José Antonio Álvarez Álvarez | Vice-Chair | From 01/01/2023 to 31/12/2023 | ||||||
| Bruce Carnegie-Brown | Independent | From 01/01/2023 to 31/12/2023 | ||||||
| Homaira Akbari | Independent | From 01/01/2023 to 31/12/2023 | ||||||
| Javier Botín-Sanz de Sautuola y O’Shea | Other external | From 01/01/2023 to 31/12/2023 | ||||||
| Sol Daurella Comadrán | Independent | From 01/01/2023 to 31/12/2023 | ||||||
| Henrique de Castro | Independent | From 01/01/2023 to 31/12/2023 | ||||||
| Gina Díez Barroso | Independent | From 01/01/2023 to 31/12/2023 | ||||||
| Luis Isasi Fernández de Bobadilla | Other External | From 01/01/2023 to 31/12/2023 | ||||||
| Ramiro Mato García-Ansorena | Independent | From 01/01/2023 to 31/12/2023 | ||||||
| Belén Romana García | Independent | From 01/01/2023 to 31/12/2023 | ||||||
| Pamela Walkden | Independent | From 01/01/2023 to 31/12/2023 | ||||||
| Germán de la Fuente | Independent | From 01/01/2023 to 31/12/2023 | ||||||
| Glenn Hutchins | Lead independent director | From 01/01/2023 to 31/12/2023 | ||||||
Comments (Not included in the electronic submission to the CNMV) | ||
Glenn Hutchins was appointed as Vice Chair and Lead Independent Director with effect from 1 October 2023 replacing Bruce Carnegie-Brown in the role. | ||
315
C.1 Complete the following tables on individual remuneration of each director (including the remuneration for exercising executive functions) accrued during the year.
a) Remuneration from the reporting company:
i) Remuneration in cash (thousand euros)
| Name | Fixed remuneration | Per diem allowances | Remuneration for membership of Board's committees | Salary | Short-term variable remuneration | Long-term variable remuneration1 | Severance pay | Other grounds | Total year 2023 | Total year 2022 | ||||||||||||||||||||||
| Ana Botín-Sanz de Sautuola y O’Shea | 98 | 45 | 268 | 3,271 | 2,838 | 361 | — | 525 | 7,406 | 7,227 | ||||||||||||||||||||||
| Héctor Grisi Checa | 98 | 44 | 198 | 3,000 | 1,220 | — | — | — | 4,560 | — | ||||||||||||||||||||||
| José Antonio Álvarez Álvarez | 128 | 45 | 198 | — | 714 | 231 | — | 2,460 | 3,776 | 5,700 | ||||||||||||||||||||||
| Bruce Carnegie-Brown | 203 | 81 | 292 | — | — | — | — | — | 576 | 700 | ||||||||||||||||||||||
| Homaira Akbari | 98 | 78 | 89 | — | — | — | — | — | 265 | 244 | ||||||||||||||||||||||
| Javier Botín-Sanz de Sautuola y O’Shea | 98 | 39 | — | — | — | — | — | — | 137 | 129 | ||||||||||||||||||||||
| Sol Daurella Comadrán | 98 | 77 | 74 | — | — | — | — | — | 249 | 230 | ||||||||||||||||||||||
| Henrique de Castro | 98 | 87 | 99 | — | — | — | — | — | 284 | 261 | ||||||||||||||||||||||
| Gina Díez Barroso | 98 | 68 | 45 | — | — | — | — | — | 211 | 172 | ||||||||||||||||||||||
| Luis Isasi Fernández de Bobadilla | 98 | 78 | 241 | — | — | — | — | 1,000 | 1,417 | 1,412 | ||||||||||||||||||||||
| Ramiro Mato García-Ansorena | 98 | 96 | 324 | — | — | — | — | — | 518 | 500 | ||||||||||||||||||||||
| Belén Romana García | 98 | 102 | 372 | — | — | — | — | — | 572 | 549 | ||||||||||||||||||||||
| Pamela Walkden | 98 | 87 | 156 | — | — | — | — | — | 341 | 323 | ||||||||||||||||||||||
| Germán de la Fuente | 98 | 87 | 86 | — | — | — | — | — | 271 | 137 | ||||||||||||||||||||||
| Glenn Hutchins | 193 | 83 | 96 | — | — | — | — | — | 372 | 10 | ||||||||||||||||||||||
Comments (Not included in the electronic submission to the CNMV) | ||
The remuneration of Luis Isasi includes EUR 1,000 thousand for his role as non-executive Chair of Santander España and for Santander España board and committees meetings. The variable remuneration only includes amounts related to the position of executive director of Banco Santander S.A. | ||
316
ii) Table of changes in share-based remuneration schemes and gross profit from consolidated shares or financial instruments
| Financial instruments at start of year 2023 | Financial instruments granted during 2023 year | Financial instruments consolidated during 2023 | Instruments matured but not exercised | Financial instruments at end of year 2023 | ||||||||||||||||||||||||||||||||||||||||||||||
| Name | Name of Plan | No. of instruments | No. of equivalent shares | No. of instruments | No. of equivalent shares | No. of instruments | No. of equivalent shares / handed over | Price of the consolidated shares | Gross profit from shares handed over or consolidated financial instruments (EUR thousand) | No. of instruments | No. of instruments | No. of equivalent shares | ||||||||||||||||||||||||||||||||||||||
| Ana Botín Sanz de Sautuola y O'Shea | 3rd cycle of deferred variable remuneration plan linked to multi-year targets (2018) | 103,303 | 103,303 | — | — | 34,400 | 34,400 | 3.793 | 130 | 68,903 | — | — | ||||||||||||||||||||||||||||||||||||||
| 4th cycle of deferred variable remuneration plan linked to multi-year targets (2019) | 212,927 | 212,927 | — | — | 35,452 | 35,452 | 3.793 | 134 | 71,011 | 106,464 | 106,464 | |||||||||||||||||||||||||||||||||||||||
| 5th cycle of deferred variable remuneration plan linked to multi-year targets (2020) | 111,821 | 111,821 | — | — | 31,049 | 31,049 | 3.793 | 118 | 6,225 | 74,547 | 74,547 | |||||||||||||||||||||||||||||||||||||||
| 6th cycle of deferred variable remuneration plan linked to multi-year targets (2021) | 710,698 | 710,698 | — | — | 177,675 | 177,675 | 3.793 | 674 | — | 533,023 | 533,023 | |||||||||||||||||||||||||||||||||||||||
| 7th cycle of deferred variable remuneration plan linked to multi-year targets (2022) in shares | 311,669 | 311,669 | — | — | 62,334 | 62,334 | 3.793 | 236 | — | 249,335 | 249,335 | |||||||||||||||||||||||||||||||||||||||
| 7th cycle (Bis) of deferred variable remuneration plan linked to multi-year targets (2022) in shares options. | 839,174 | 311,669 | — | — | 167,835 | 62,334 | 3.793 | 118 | — | 671,339 | 249,335 | |||||||||||||||||||||||||||||||||||||||
| 8th cycle of deferred variable remuneration plan linked to multi-year targets (2023) in shares | — | — | 1,041,392 | 1,041,392 | 469,286 | 469,286 | 3.793 | 1,780 | — | 572,107 | 572,107 | |||||||||||||||||||||||||||||||||||||||
| Financial instruments at start of year 2023 | Financial instruments granted during 2023 year | Financial instruments consolidated during 2023 | Instruments matured but not exercised | Financial instruments at end of year 2023 | ||||||||||||||||||||||||||||||||||||||||||||||
| Name | Name of Plan | No. of instruments | No. of equivalent shares | No. of instruments | No. of equivalent shares | No. of instruments | No. of equivalent shares / handed over | Price of the consolidated shares | Gross profit from shares handed over or consolidated financial instruments (EUR thousand) | No. of instruments | No. of instruments | No. of equivalent shares | ||||||||||||||||||||||||||||||||||||||
| Héctor Grisi Checa | 8th cycle of deferred variable remuneration plan linked to multi-year targets (2023) in shares | — | — | 693,383 | 693,383 | 321,645 | 321,645 | 3.793 | 1,220 | — | 371,737 | 371,737 | ||||||||||||||||||||||||||||||||||||||
317
| Financial instruments at start of year 2023 | Financial instruments granted during 2023 year | Financial instruments consolidated during 2023 | Instruments matured but not exercised | Financial instruments at end of year 2023 | ||||||||||||||||||||||||||||||||||||||||||||||
| Name | Name of Plan | No. of instruments | No. of equivalent shares | No. of instruments | No. of equivalent shares | No. of instruments | No. of equivalent shares / handed over | Price of the consolidated shares | Gross profit from shares handed over or consolidated financial instruments (EUR thousand) | No. of instruments | No. of instruments | No. of equivalent shares | ||||||||||||||||||||||||||||||||||||||
| José Antonio Álvarez Álvarez | 3rd cycle of deferred variable remuneration plan linked to multi-year targets (2018) | 69,033 | 69,033 | — | — | 22,988 | 22,988 | 3.793 | 87 | 46,045 | — | — | ||||||||||||||||||||||||||||||||||||||
| 4th cycle of deferred variable remuneration plan linked to multi-year targets (2019) | 142,299 | 142,299 | — | — | 23,693 | 23,693 | 3.793 | 90 | 47,457 | 71,149 | 71,149 | |||||||||||||||||||||||||||||||||||||||
| 5th cycle of deferred variable remuneration plan linked to multi-year targets (2020) | 60,737 | 60,737 | — | — | 16,865 | 16,865 | 3.793 | 64 | 3,381 | 40,491 | 40,491 | |||||||||||||||||||||||||||||||||||||||
| 6th cycle of deferred variable remuneration plan linked to multi-year targets (2021) | 479,644 | 479,644 | — | — | 119,911 | 119,911 | 3.793 | 455 | — | 359,733 | 359,733 | |||||||||||||||||||||||||||||||||||||||
| 7th cycle of deferred variable remuneration plan linked to multi-year targets (2022) in shares | 210,395 | 210,395 | — | — | 42,079 | 42,079 | 3.793 | 160 | — | 168,316 | 168,316 | |||||||||||||||||||||||||||||||||||||||
| 7th cycle (Bis) of deferred variable remuneration plan linked to multi-year targets (2022) in shares options. | 566,492 | 210,395 | — | — | 113,298 | 42,079 | 3.793 | 80 | — | 453,194 | 168,316 | |||||||||||||||||||||||||||||||||||||||
318
Comments (Not included in the electronic submission to the CNMV) | ||
nThe variable remuneration only includes the amounts related to the position of executive director of Banco Santander S.A. The figures are impacted by the adaptation for 2023 and successive financial years of the information on "short-term variable remuneration" and "long-term variable remuneration" to the consolidation criteria of CNMV, the latter understood as the fulfillment at the end of the accrual period of the different objectives or conditions to which the variable remuneration was linked, including the verification of whether or not the application of malus clauses is appropriate (instead of including amounts accrued to the executive director under short- and long-term results that are put to the vote of the annual general meeting each year). In 2023 there was no application of malus clauses. nThe variable remuneration consolidated as of the date of this report corresponds to the following plans: 1) Short-term variable remuneration: a.40% immediate payment of variable remuneration of the eight cycle of the deferred multi-year objectives variable remuneration plan (2023). b.First fifth deferred (12%) of variable remuneration of the seventh cycle of the deferred multi-year objectives variable remuneration plan (2022). c.Second fifth deferred (12%) of variable remuneration of the sixth cycle of the deferred multi-year objectives variable remuneration plan (2021). 2) Long-term variable remuneration: a.Third deferred (first fifth subject to multi-year metrics) of variable remuneration of the fifth cycle of the deferred multi-year objectives variable remuneration plan (2020). b.Fourth deferred (second fifth subject to multiyear metrics) of variable remuneration of the fourth cycle of the deferred multi-year objectives variable remuneration plan (2019). c.Fifth deferred (third fifth subject to multiyear metrics) of variable remuneration of the third cycle of the deferred multi-year objectives variable remuneration plan (2018). For the purpose of calculating the hypothetical current cash value of Gross profit from shares handed over or consolidated financial instruments, the same share price used for VR 2023 has been taken, calculated with the weighted average daily volume of weighted average listing prices of Santander shares in the 50 trading sessions prior to the Friday (not inclusive) before 30 January 2024 (the date on which the board approved the 2023 bonus for executive directors), which was EUR 3.793 per share. In the case of the 2022 VR share options, the gross profit of the consolidated instruments has been calculated as the difference between the EUR 3.793 and the exercise price of the option in that remuneration plan (EUR 3.088). nAnd below are the levels of achievement of the multi-year metrics of the long-term variable remuneration plans: 1) Fifth cycle of the deferred multi-year objectives variable remuneration plan (2020): 83.3% of achievement for the period 2020-2022. a.CET1 metric at 100% of achievement for 2022 year-end period (target 12.00%). Weight of 33.3%. b.Underlying BPA growth at 150% of achievement (target growth of 10%). Weight of 33.3%. c.TSR metric at 0% of achievement (minimum target of 33% not reached). Weight of 33.3%. 2) Fourth cycle of the deferred multi-year objectives variable remuneration plan (2019): 33.3% of achievement for the period 2019-2021. a.CET1 metric at 100% of achievement for 2021 year-end period (target 12.00%). Weight of 33.3%. b.Underlying BPA growth at 0% of achievement (target growth of 15%). Weight of 33.3%. c.TSR metric at 0% of achievement (minimum target of 33% not reached). Weight of 33.3%. 3) Third cycle of the deferred multi-year objectives variable remuneration plan (2018): 33.3% of achievement for the period 2018-2020. a.CET1 metric at 100% of achievement for 2020 year-end period (target 11.30%). Weight of 33.3%. b.Underlying BPA growth at 0% of achievement (target growth of 25%). Weight of 33.3%. c.TSR metric at 0% of achievement (minimum target of 33% not reached). Weight of 33.3%. | ||
319
iii) Long-term saving systems (thousand EUR)
| Name | Remuneration from consolidation of rights to savings system | ||||
| Ana Botín-Sanz de Sautuola y O’Shea | 1,144 | ||||
Héctor Grisi Checa | 966 | ||||
| Contribution over the year from the company (EUR thousand) | |||||||||||||||||||||||||||||||||||
| Savings systems with consolidated economic rights | Savings systems with unconsolidated economic rights | Amount of accumulated funds (EUR thousand) | |||||||||||||||||||||||||||||||||
| 2023 | 2022 | ||||||||||||||||||||||||||||||||||
| Name | 2023 | 2022 | 2023 | 2022 | Systems with consolidated economic rights | Systems with unconsolidated economic rights | Systems with consolidated economic rights | Systems with unconsolidated economic rights | |||||||||||||||||||||||||||
| Ana Botín-Sanz de Sautuola y O’Shea | 1,144 | 1,081 | — | — | 49,257 | — | 46,725 | — | |||||||||||||||||||||||||||
| Héctor Grisi Checa | 966 | — | 585 | — | — | — | |||||||||||||||||||||||||||||
José Antonio Álvarez | — | 811 | — | — | — | — | 19,495 | — | — | 18,958 | — | ||||||||||||||||||||||||
iv) Details of other items (thousands of EUR)
| Name | Item | Amount remunerated | ||||||
| Ana Botín-Sanz de Sautuola y O’Shea | Life insurance and complement | 470 | ||||||
| Other remuneration | 28 | |||||||
| Name | Item | Amount remunerated | ||||||
Héctor Grisi Checa | Life insurance and complement | 1 | ||||||
| Other remuneration | 46 | |||||||
| Name | Item | Amount remunerated | ||||||
José Antonio Álvarez Álvarez | Life insurance and complement | 716 | ||||||
| Other remuneration | 6 | |||||||
320
b) Remuneration of the company directors for seats on the boards of other group companies:
i) Remuneration in cash (thousands of EUR)
| Name | Fixed remuneration | Per diem allowances | Remuneration for membership of Board's committees | Salary | Short-term variable remuneration | Long-term variable remuneration | Severance pay | Other grounds | Total year 2023 | Total year 2022 | ||||||||||||||||||||||
| Homaira Akbari | 311 | — | — | — | — | — | — | — | 311 | 361 | ||||||||||||||||||||||
| Henrique de Castro | 200 | — | — | — | — | — | — | — | 200 | 200 | ||||||||||||||||||||||
| Pamela Walkden | 152 | — | — | — | — | — | — | — | 152 | 147 | ||||||||||||||||||||||
| José Antonio Álvarez Álvarez | 200 | — | 141 | — | — | — | — | — | 341 | — | ||||||||||||||||||||||
Comments (Not included in the electronic submission to the CNMV) | ||
The variable remuneration only includes the amounts accrued since the appointment of executive director of Banco Santander S.A. | ||
ii) Table of changes in share/based remunerations schemes and gross profit from consolidated shares of financial instruments
Not applicable
iii) Long term saving systems (thousand EUR)
Not applicable
iv) Detail of other items (thousands of EUR)
Not applicable
321
c) Summary of remuneration (thousands of EUR)
The summary should include the amounts corresponding to all the items of remuneration included in this report that have been accrued by the director, in thousand euros.
Remuneration accrued in the company | Remuneration accrued in group companies | Total 2023 Company + group companies | |||||||||||||||||||||||||||||||||
| Name | Total cash remuneration | Gross profit on consolidated shares or financial instruments | Contributions to the long-term savings plan | Remuneration for other items | Total 2023 | Total cash remuneration | Gross profit on consolidated shares or financial instruments | Contributions to the long-term savings plan | Remuneration for other items | Total 2023 | |||||||||||||||||||||||||
| Ana Botín-Sanz de Sautuola y O’Shea | 7,406 | 3,190 | 1,144 | 498 | 12,239 | — | — | — | — | — | 12,239 | ||||||||||||||||||||||||
| Héctor Grisi Checa | 4,560 | 1,220 | 966 | 47 | 6,793 | — | — | — | — | — | 6,793 | ||||||||||||||||||||||||
| José Antonio Álvarez Álvarez | 3,776 | 936 | — | 722 | 5,434 | 341 | — | — | — | 341 | 5,775 | ||||||||||||||||||||||||
| Bruce Carnegie-Brown | 576 | — | — | — | 576 | — | — | — | — | — | 576 | ||||||||||||||||||||||||
| Homaira Akbari | 265 | — | — | — | 265 | 311 | — | — | — | 311 | 576 | ||||||||||||||||||||||||
| Javier Botín-Sanz de Sautuola y O’Shea | 137 | — | — | — | 137 | — | — | — | — | — | 137 | ||||||||||||||||||||||||
| Sol Daurella Comadrán | 249 | — | — | — | 249 | — | — | — | — | — | 249 | ||||||||||||||||||||||||
| Henrique de Castro | 284 | — | — | — | 284 | 200 | — | — | — | 200 | 484 | ||||||||||||||||||||||||
| Gina Díez Barroso | 211 | — | — | — | 211 | — | — | — | — | — | 211 | ||||||||||||||||||||||||
| Luis Isasi Fernández de Bobadilla | 1,417 | — | — | — | 1,417 | — | — | — | — | — | 1,417 | ||||||||||||||||||||||||
| Ramiro Mato García-Ansorena | 518 | — | — | — | 518 | — | — | — | — | — | 518 | ||||||||||||||||||||||||
| Belén Romana García | 572 | — | — | — | 572 | — | — | — | — | — | 572 | ||||||||||||||||||||||||
| Pamela Walkden | 341 | — | — | — | 341 | 152 | — | — | — | 152 | 493 | ||||||||||||||||||||||||
| Germán de la Fuente | 271 | — | — | — | 271 | — | — | — | — | — | 271 | ||||||||||||||||||||||||
| Glenn Hutchins | 372 | — | — | — | 372 | — | — | — | — | — | 372 | ||||||||||||||||||||||||
Total | 20,955 | 5,346 | 2,110 | 1,267 | 29,679 | 1,004 | — | — | — | 1,004 | 30,683 | ||||||||||||||||||||||||
Comments (Not included in the electronic submission to the CNMV) | ||
The remuneration of Luis Isasi includes EUR 1,000 thousand for his role as non-executive Chair of Santander España and for Santander España board and committees meetings. | ||
322
C.2 Indicate the evolution in the last five years of the amount and percentage variation of the remuneration accrued by each of the directors of the listed company who have held this position during the year, the consolidated results the company and the average remuneration on an equivalent basis with regard to full-time employees of the company and its subsidiaries that are not directors of the listed company.
| Directors' remuneration (EUR thousand) | 2023 | % var. 23/22 | 2022 | % var. 22/21 | 2021 | % var. 21/20 | 2020 | % var. 20/19 | 2019 | ||||||||||||||||||||
| • Executive Directors | |||||||||||||||||||||||||||||
| Ana Botín-Sanz de Sautuola y O’Shea | 12,239 | 4% | 11,735 | (5)% | 12,288 | 52% | 8,090 | (19)% | 9,954 | ||||||||||||||||||||
Héctor Grisi Checa | 6,793 | — | — | — | — | — | — | — | — | ||||||||||||||||||||
• External Directors1 | |||||||||||||||||||||||||||||
| José Antonio Álvarez Álvarez | 5,775 | (40)% | 9,575 | (2)% | 9,728 | 41% | 6,877 | (17)% | 8,270 | ||||||||||||||||||||
| Bruce Carnegie-Brown | 576 | (18)% | 700 | — | 700 | 18% | 595 | (15)% | 700 | ||||||||||||||||||||
| Javier Botín-Sanz de Sautuola y O’Shea | 137 | 6% | 129 | —% | 129 | 6% | 122 | (11)% | 137 | ||||||||||||||||||||
| Sol Daurella Comadrán | 249 | 8% | 230 | (4)% | 239 | 12% | 214 | (11)% | 240 | ||||||||||||||||||||
| Belén Romana García | 572 | 4% | 549 | 3% | 533 | 28% | 417 | (21)% | 525 | ||||||||||||||||||||
| Homaira Akbari | 576 | (5)% | 605 | 31% | 461 | 19% | 386 | 71% | 226 | ||||||||||||||||||||
| Ramiro Mato García Ansorena | 518 | 4% | 500 | — | 499 | 16% | 430 | (14)% | 500 | ||||||||||||||||||||
| Henrique de Castro | 484 | 5% | 461 | 45% | 319 | 36% | 234 | 172% | 86 | ||||||||||||||||||||
| Pamela Walkden | 493 | 5% | 470 | 38% | 339 | 59% | 214 | 529% | 34 | ||||||||||||||||||||
Luis Isasi Fernández de Bobadilla2 | 1,417 | — | 1,412 | — | 1,406 | 49% | 943 | — | — | ||||||||||||||||||||
| Gina Díez Barroso | 211 | 23% | 172 | 32% | 130 | 622% | 18 | — | — | ||||||||||||||||||||
| Germán de la Fuente | 271 | — | 137 | — | — | — | — | — | — | ||||||||||||||||||||
| Glenn Hutchins | 372 | — | 10 | — | — | — | — | — | — | ||||||||||||||||||||
| Company’s performance | |||||||||||||||||||||||||||||
| Underlying profit attributable to the Group (EUR mn) | 11,076 | 15% | 9,605 | 11% | 8,654 | 70% | 5,081 | (38)% | 8,252 | ||||||||||||||||||||
| Consolidated results of the Group3 (EUR mn) | 16,459 | 8% | 15,250 | 5% | 14,547 | — | (2,076) | — | 12,543 | ||||||||||||||||||||
| Ordinary RoTE | 15.06% | 13% | 13.37% | 5% | 12.73% | 71% | 7.44% | (37)% | 11.79% | ||||||||||||||||||||
Employees' average remuneration4 (EUR thousand) | 58 | 3% | 56 | 1% | 56 | 18% | 47 | (12%) | 54 | ||||||||||||||||||||
Employees' average remuneration in Spain5 (EUR thousand) | 73 | 6% | 68 | 10% | 62 | (2%) | 63 | — | n.a. | ||||||||||||||||||||
1.Non-executive directors' remuneration fluctuations are caused by joining or leaving the Board of Directors and the difference in the amount of meetings they assist during the year. Hence there is no correlation between their remuneration and the company performance.
2.The remuneration of Luis Isasi includes EUR 1,000 thousand for his role as non-executive Chair of Santander España and for Santander España board and committees meetings.
3. Group operating profit/(loss) before tax.
4. Employee average remuneration includes all concepts. Full-time equivalent data. Variable remuneration data accrued in the current year.
5. Total employees in Spain geography. Fixed remuneration + effective bonus received in the year. Not included rest of concepts. Not impacted by exchange rates.
| Comments (Not included in the electronic submission to the CNMV) | ||
nThe variable remuneration only includes the amounts related to the position of executive director of Banco Santander S.A. The figures are impacted by the adaptation for 2023 and successive financial years of the information on "short-term variable remuneration" and "long-term variable remuneration" to the consolidation criteria of CNMV, the latter understood as the fulfillment at the end of the accrual period of the different objectives or conditions to which the variable remuneration was linked, including the verification of whether or not the application of malus clauses is appropriate (instead of including amounts accrued to the executive director under short- and long-term results that are put to the vote of the annual general meeting each year). In 2023 there was no application of malus clauses. nTotal remuneration of executive directors is impacted by the excellent evolution of Santander share price. In 2023, the revaluation of the share price used to set the 2023 variable remuneration (EUR 3.793) was +23%, so the Gross profit from shares handed over or consolidated financial instruments (Price x Volume) increased due to such revaluation. If it had remained stable in EUR 3.088 (share price of VR 2022), the increase in the total remuneration of the Executive Chair would have been only +1% compared to the figure released in 2022 report (EUR 11,735 thousand). nAnd regarding the average remuneration of employees (EUR 58 thousand), to highlight the following ideas: a.Normally the increases or decreases in remuneration are greater for the executive directors, depending on the results of the entity, because the percentage of variable remuneration over fixed remuneration is lower in the average employee than in the executive directors. b.Our local presence and global scale, based on three regions and ten core markets, and our vast branch network (c.8,500), have a direct impact on this figure: more than a half of our employees are based in Mexico and South America (mainly in Brazil). The salaries of these employees are adapted to the local cost of living. Therefore, the comparison with the remuneration of executive directors (which remuneration was set for living in a mature country) is also distorted by the difference between both costs of living. Developing countries have a lower cost of living than the country where both directors carried out their functions (Spain). c.The different annual exchange rates have also an impact on this calculation where all local wages and salaries are translated into euros at the average year-end exchange rate. d.Finally, the average remuneration figure of Banco Santander is impacted by the different departures (retirements and early retirements) and annual new hires, with the average cost of the former (a more senior profile) being higher than the latter (a more junior profile). | ||
This annual report on remuneration has been approved by the board of directors of the company, at its meeting on 19 February 2024.
State if any directors have voted against or abstained from approving this report.
Yes o No þ
323
[THIS PAGE HAS BEEN LEFT BLANK INTENTIONALLY]
324
Economic and financial review | |||||
 | |||||
325
2023 Highlights
We delivered record profit...
→Record results with 5mn new customers YoY contributing to double-digit revenue growth →First year of ONE Transformation driving profitable growth and structural efficiency improvement →Strong balance sheet, with solid credit quality metrics and a higher capital ratio →Delivering double-digit value creation and higher shareholder remuneration | ||
| FY’23 Attributable Profit | FY’23 Revenue | |||||||
€11.1bn +15% | €58bn +11% | |||||||
| Cost-to-income | RoTE | |||||||
44.1% –173bps | 15.1% +169bps | |||||||
| CoR | FL CET1 | |||||||
1.18% +0.19pp | 12.3% +0.2pp | |||||||
| TNAVps + DPS | EPS | |||||||
+15% Cash DPS +c.50% | +21.5% | |||||||
Note: based on underlying P&L. YoY changes in euros. In constant euros: attributable profit +18% and revenue +13%.
TNAVps + dividend per share (DPS) includes the €5.95 cent cash dividend paid in May 2023 and the €8.10 cent cash dividend paid in November 2023. Implementation of 2023 shareholder remuneration policy is subject to future corporate and regulatory decisions and approvals.
For more details, see section 3.3 ‘Dividends and shareholder remuneration’ in the ‘Corporate Governance’ chapter.
… and achieved all our 2023 financial targets
| 2023 targets | 2023 achievement | |||||||||||||
RevenueA |  | Double-digit growth | +13% | ü | ||||||||||
| Efficiency ratio | | 44-45% | 44.1% | ü | ||||||||||
| CoR | | <1.2% | 1.18% | ü | ||||||||||
| FL CET1 | | >12% | 12.3% | ü | ||||||||||
| RoTE | | >15% | 15.1% | ü | ||||||||||
A. YoY change in constant euros.
326
327
1. Economy, regulation
and competition
and competition
Economy
In 2023, Santander operated in an environment dominated by geopolitical tensions and higher interest rates as central banks looked to contain inflation, which gradually eased during the year. The world's major economies withstood monetary policy tightening well, although there was a gradual slowdown in activity. Labour markets were also resilient, with unemployment rates at or close to full employment in two thirds of Santander's footprint.
Our core regions' economies performed as follows:
•Eurozone (GDP: +0.5% estimated in 2023). The positive start to the year, supported by the normalization of global supply chains and reduced uncertainty around energy supply, lost momentum in the second half of the year as interest rates rose, industry struggled to adjust to higher energy costs and households remained cautious about consumption. Inflation eased (2.9% in December) after the ECB raised its interest rates by 450 basis points in this monetary cycle (the deposit facility rate rose from -0.5% to 4%).
•Spain (GDP: +2.5% estimated in 2023). GDP growth was driven by private consumption (fall in inflation improved households' purchasing power) and external sector, with tourism at record levels. Investment was lower than expected, especially in investment in equipment. The labour market remained solid, with a record number of people in employment. Inflation closed the year at 3.1% (3.6% on average) with a decline in all components and a greater-than-expected moderation in core inflation (3.8% in December vs 7.6% in February).
•United Kingdom (GDP: +0.5% estimated in 2023). Economic growth remained practically flat. The labour market remained tight, putting pressure on inflation. However, inflation eased during the year and stood at 4% in December, far from the 11.1% peak in October 2022. The Bank of England paused rate increases at 5.25%, unchanged since August.
•Portugal (GDP: +2.3% in 2023). Growth decelerated throughout the year as demand in the rest of the European Union continued to cool. Despite this, the labour market remained at full employment (6.1% in Q3'23) and inflation moderated rapidly (1.4% in December). Moody's upgraded the sovereign's rating to A3, supported by economic and fiscal reforms, private sector deleveraging and the continued strengthening of the banking sector.
•Poland (GDP: +0.2% in 2023). The economy barely grew in 2023 (+5.3% in 2022) due to weak private consumption. However, investment increased strongly and external sector contributed positively to the economy. The strong labour market was reflected in full employment and a marked increase in real household income. In addition, inflation fell significantly to 6.2% in December (18.4% in February). In
response, the central bank paused its monetary easing, leaving the official interest rate at 5.75%.
•United States (GDP: +2.5% estimated in 2023). The economy grew more than expected, particularly in private consumption. Labour market tensions eased slightly but the market remains very solid. Inflation fell significantly (3.4% in December down from 6.5% in December 2022) and the Fed suggested there would be no more rate rises (the federal funds target range was 5.25%-5.50% at year end).
•Mexico (GDP: +3.5% estimated in 2023). Economic growth was surprisingly robust, driven by construction, linked to both nearshoring and infrastructure projects and the resilience of services. Inflation fell significantly to 4.7% (7.8% in the previous year). The central bank has left official interest rates unchanged at 11.25% since the first quarter of the year and suggested a possible first cut in early 2024.
•Brazil (GDP: +2.8% estimated in 2023). The economy grew well, driven by agricultural, mining and services, but showed signs of a slowdown in the second half of the year. Inflation continued to fall (4.6% in December, 5.8% average in the year), allowing the central bank to begin to cut official interest rates in August, from 13.75% in December 2022 to 11.75% at year end.
•Chile (GDP: -0.2% estimated in 2023). In the first half of the year, the economy completed the adjustment process initiated at the end of 2022. The second half of the year showed signs of recovery, supported by household consumption and exports. Inflation fell back sharply (3.9% vs. 12.8% in 2022), which enabled the central bank to begin to reduce interest rates in July, with a total reduction of 200 bps, ending the year at 8.25%.
•Argentina (GDP: -1.5% estimated in 2023). The economy contracted due to the severe droughts, which reduced agricultural production and soybean exports (which have a large weight in GDP). Inflation accelerated, fuelled by the depreciation of the Argentine peso. On 10 December, a new government took office and presented an International Monetary Fund (IMF) backed stabilization plan focused on correcting macro imbalances.
328
The exchange rates of our main currencies against the euro in 2023 and 2022 were:
| Exchange rates: 1 euro/currency parity | |||||||||||||||||
Average | Period-end | ||||||||||||||||
| 2023 | 2022 | 2023 | 2022 | ||||||||||||||
| US dollar | 1.081 | 1.051 | 1.105 | 1.068 | |||||||||||||
| Pound sterling | 0.870 | 0.853 | 0.868 | 0.887 | |||||||||||||
| Brazilian real | 5.397 | 5.421 | 5.365 | 5.650 | |||||||||||||
| Mexican peso | 19.158 | 21.131 | 18.691 | 20.805 | |||||||||||||
| Chilean peso | 906.417 | 916.688 | 965.192 | 909.200 | |||||||||||||
| Argentine peso | 282.765 | 134.786 | 893.635 | 189.116 | |||||||||||||
| Polish zloty | 4.538 | 4.683 | 4.343 | 4.684 | |||||||||||||
Inflation performance, the extent of the economic slowdown and the central banks' reaction were the main issues for financial markets in 2023.
In mature markets, stickier inflation and expectations of a higher-for-longer interest rate environment impacted sovereign bond markets. In the US, this was reinforced by activity data showing that the economy remained resilient, and put significant upward pressure on long-term bond yields. The 10-year treasury reached 5% for the first time in several years. In the euro area, where moderation of the cycle became evident earlier, government bond yields rebounded, but to a lesser extent.
Towards the end of the year, disinflation gained momentum, which, together with the US economy starting to lose traction, fuelled expectations of interest rate cuts by the Fed and ECB beginning in the first half of 2024. Consequently, long-term sovereign bond yields declined.
In the foreign exchange market, the Fed's stronger tone and weaker economic data in the euro area weighed on the euro during most of the year.
2023 was a good year in equities, although with some ups and downs, first with volatility in the banking sector in the US and later with the tightening of long-term yields. The view that monetary tightening has peaked increased appetite towards the end of the year.
Latin American markets performed well as a result of early action by their central banks. They were the first countries to initiate interest rate hikes and consequently were the first to either start the cycle of interest rate cuts (as was the case in Chile and Brazil during the second half of the 2023) or suggest they would start cutting interest rates (e.g. Mexico) as inflation falls back. This benefited fixed income. In general, Latin American currencies remained strong, supported by healthier external positions (low current account deficits and solid international reserve buffers), and were able to quickly overcome the occasional waves of volatility that arose during the year.
Since the covid-19 pandemic and the war in Ukraine, the banking sector has had to cope with the collapse of three American regional banks and one Swiss bank in the first quarter of the year. Although caused by management failures in all four cases, the market's perception of the stability of bank deposits
and the convertible debt market was affected. Monitoring of banks' unrealized losses increased due to the sudden rise in interest rates and potential liquidity problems in the non-bank sector, especially associated with the commercial real estate market.
Even so, the banking system once again proved resilient to financial turmoil and ended the year with generalized improvements in valuations, especially in Europe. Global banks benefited from monetary policy tightening, although the impact differed depending on institutions' business models. Moreover, the strength of labour markets and savings accumulated during the covid-19 pandemic helped the private sector cope with the higher cost of debt while maintaining portfolio quality.
As a result, the banking sector continued to strengthen its balance sheets, improving its solvency in an environment of slower growth in business volumes due to lower credit demand. As shown through the different stress tests published by supervisors, banks are generally prepared to face a much more severe economic scenario than the one expected in 2024.
2024 is expected to be marked by a lower contribution from interest rates to net interest income, the potential deterioration of the credit portfolio due to the economic slowdown and the gradual withdrawal of excess liquidity. However, we do not expect abrupt changes in any of these three variables.
The medium-term challenges that banks face remain unchanged. Digital transformation accelerated during the covid-19 pandemic, forcing entities to offer customers a better digital experience in the wake of a surge of new competitors. Climate transition also requires a significant effort as institutions must develop new portfolio classification models and risk scenarios to assess the potential balance sheet impacts and understand exposure to transitional and physical risks to companies and households relating to climate change in the coming years.
Regulatory and competitive environment
In 2023, regulatory discussions were focused on four main areas: capital requirements and resolution framework, sustainability, digitalization (with a special focus on payments) and retail.
Main regulatory actions in these four areas were:
1.Prudential and resolution: Most of the discussions continued to focus on the legislative proposal to implement the Basel III prudential framework in Europe (CRR3-CRD6). This reform aims to reduce the variability of risk-weighted assets and enhance comparability across institutions. It introduces other issues such as the prudential treatment of exposures to crypto-assets and provisions relating to environmental, social and governance (ESG) risks. Regarding the latter, the European Banking Authority (EBA) is carrying out an analysis of potential prudential treatment of ESG risks. The Basel Committee published a first report on lessons learned from the Silicon Valley Bank and Credit Suisse crisis, highlighting the need to strengthen the supervisory framework, and announced that it will continue to analyse the need to reform the current framework on liquidity, interest rate risk and AT1 instruments. The European Commission published its proposal for the revision of the crisis management framework (resolution and recovery directive - BRRD, and
329
deposit guarantee scheme directive - DGSD), while other countries, such as Chile and Brazil, continue to develop proposals.
2.Sustainability: The European Commission made progress on the green taxonomy, particularly in defining the four pending environmental objectives: i) protection of water and marine resources, ii) transition to a circular economy, iii) pollution control and protection of ecosystems, and iv) biodiversity. It presented new proposals, such as the proposal on regulations for ESG ratings activity and the directive on the energy efficiency of buildings, and progressed on other initiatives. For example, the corporate sustainability due diligence and the development of requirements for the transparency of sustainability information, such as those entrusted to the European Financial Reporting Advisory Group (EFRAG). Internationally, the work of the International Sustainability Standards Board (ISSB) was endorsed by the Financial Stability Board (FSB) and the International Organisation of Securities Commissions (IOSCO) as international standards. The Basel Committee published its proposal to complement the Pillar 3 requirements with environmental risk management information.
3.Digitalization: There were important proposals relating to payments in 2023. The proposal for instant payments was approved and a proposal to revise the payments directive (PSD3) was also presented. A new proposal for regulation of the various players in the payments world (Payment Services Regulation: PSR) was presented. Europe made progress on the Digital Euro as the ECB announced the end of the research phase in October and the start of the preparation phase. Moreover, in June, the European Commission published a proposal to regulate the essential elements of the Digital Euro and to give legitimacy to the ECB's design. The ECB is responsible for determining whether the Digital Euro should be issued but we do not expect a decision before 2026. Discussions continue in several other jurisdictions on the possible issuance of Central Bank Digital Currencies (CBCDs).
In the data world, the Open Finance proposal, known as Financial Information Data Access (FiDA), was published in Europe. The proposal increases the level of data disaggregation which banks are subject to, extending requirements to other financial institutions (e.g. payment institutions, scoring agencies, etc.), which will have to share information relating to loans, deposits, investment funds, pensions, among others. This proposal backs the general trend of building a data economy, putting customers at the centre, as we have seen in proposals in other jurisdictions (US, Chile, UK).
4. Retail banking: In 2023, the directive revising the rules for granting consumer credit was approved in Europe. The directive introduces concepts such as buy now, pay later and
requires authorization and registration for all lenders. It also allows countries the possibility to set limits on interest rates. As expected, the European Commission presented its Retail Investment Strategy (RIS), which stands out for the changes relating to incentives paid to sell products and the introduction of the concept of value for money. The latter is similar to what exists in other countries such as the UK with the aim of demonstrating that the investment provides value to the investor over time.
Finally, the impact of the war in Ukraine continues in the background, justifying measures in some countries regarding mortgage payments for vulnerable groups and for the population with financial difficulties in meeting their obligations in general. Additionally, measures such as the definition of specific taxes on banks continue to be adopted in some countries.
Santander and public policy
Santander has always defended the need for robust, high-quality regulation that supports bank strength and solvency, establishes strong consumer protection and market stability standards, and favours transparency regarding risk and resilience for investors and supervisors. A framework that supports the much needed economic growth, while protecting financial stability. A framework that also allows for innovation, making use of the opportunities offered by new technology and the use of data to better serve our customers while being more efficient.
We are committed to constructive and transparent engagement with regulators on the objectives, design and implementation of banking sector rules and frameworks that affect our business and therefore the interests of our customers. Our participation in the regulatory policy debate is geared towards transparently and honestly providing regulators and legislators our banking sector knowledge and data, mainly through official consultations, supporting the competitiveness of the financial sector and of the economies in which we operate to help our customers prosper.
330
| Santander and public policy | |||||||||||||||||
| 1 | Capital and bank resilience | ||||||||||||||||
| Although we believe that reforms in the last decade have made financial institutions more robust in terms of capital, helping banks grow in stress situations such as the covid-19 pandemic or the war in Ukraine, we continue to advocate for: | |||||||||||||||||
•The correction of the current regulatory bias that favours risk aversion over growth and competitiveness. •The need for a stable and predictable framework to facilitate institutions' management and investors' understanding of this agenda. •The building of a genuine single financial services market in Europe, which we believe is key to competitiveness. •Banking regulation that takes into account the realities of banks with a global footprint, does not penalize expansion to other countries and includes the recognition of the Multiple Point of Entry (MPE) resolution framework. •A common deposit insurance scheme for EU banks that breaks the bank/sovereign loop. Furthermore, the alignment of the different rules and the revitalization of the securitization market are essential for the construction of a Capital Markets Union. | |||||||||||||||||
| 2 | Sustainability and sustainable finance | ||||||||||||||||
| We believe that decarbonization is a top social and environmental challenge in which banks have an important role to play and we are fully committed to the objectives. We continue to advocate for: | |||||||||||||||||
•In this new political cycle in Europe, a carefully carried out impact assessment of related legislation adopted to date to assess whether it is contributing to the ultimate goal of a stable and fair transition. •Avoiding regulation and supervision that restrict banks from supporting their customers' transition. It is not only important to finance companies that are already green, but it is also important to help those in carbon-intensive sectors to transition. •International coordination as sustainability knows no borders. •Regulation that supports governments with their responsibility to define transition paths for different economic sectors, along with implementation tools and policies, with banks as a major player in supporting individuals and companies in their transitions. | |||||||||||||||||
| 3 | The digital landscape | ||||||||||||||||
| The banking sector is undergoing significant changes during its digital transformation with the aim of leveraging technology and innovation opportunities and improving customer choice and experience. We continue to advocate for: | |||||||||||||||||
•Simple, future-proof regulation and supervision that allows the banking sector to innovate and take advantage of the potential benefits of technology and digitalization on an equal basis with other companies. •A true data economy that puts the consumer at the centre of decision making, with an appropriate framework of incentives and accountability in the use of data. In addition, data sharing across sectors (financial and non-financial) that would make a real difference in providing better services and products for consumers and customers. •A framework that allows banks to continue to offer the solutions that customers demand, including innovative and novel capabilities. The debate around the issuance of digital currencies by central banks should consider the role that the financial system plays in financing the economy. •Customer protection rules that facilitate access to different products with conditions that favour a smooth and user-friendly experience, without being detrimental to customer protection. | |||||||||||||||||
331
2. Group selected data
| BALANCE SHEET (EUR million) | 2023 | 2022 | % 2023 vs. 2022 | 2021 | ||||||||||
| Total assets | 1,797,062 | 1,734,659 | 3.6 | 1,595,835 | ||||||||||
| Loans and advances to customers | 1,036,349 | 1,036,004 | 0.0 | 972,682 | ||||||||||
| Customer deposits | 1,047,169 | 1,009,722 | 3.7 | 900,554 | ||||||||||
Total funds A | 1,306,942 | 1,239,981 | 5.4 | 1,135,866 | ||||||||||
| Total equity | 104,241 | 97,585 | 6.8 | 97,053 | ||||||||||
| INCOME STATEMENT (EUR million) | 2023 | 2022 | % 2023 vs. 2022B | 2021 | ||||||||||
| Net interest income | 43,261 | 38,619 | 12.0 | 33,370 | ||||||||||
| Total income | 57,423 | 52,117 | 10.2 | 46,404 | ||||||||||
| Net operating income | 31,998 | 28,214 | 13.4 | 24,989 | ||||||||||
| Profit before tax | 16,459 | 15,250 | 7.9 | 14,547 | ||||||||||
| Profit attributable to the parent | 11,076 | 9,605 | 15.3 | 8,124 | ||||||||||
EPS, PROFITABILITY AND EFFICIENCY (%)C | 2023 | 2022 | % 2023 vs. 2022 | 2021 | ||||||||||
| EPS (euro) | 0.654 | 0.539 | 21.5 | 0.438 | ||||||||||
| RoE | 11.91 | 10.67 | 9.66 | |||||||||||
| RoTE | 15.06 | 13.37 | 11.96 | |||||||||||
| RoA | 0.69 | 0.63 | 0.62 | |||||||||||
| RoRWA | 1.96 | 1.77 | 1.69 | |||||||||||
Efficiency ratio D | 44.1 | 45.8 | 46.2 | |||||||||||
UNDERLYING INCOME STATEMENT D (EUR million) | 2023 | 2022 | % 2023 vs. 2022E | 2021 | ||||||||||
| Net interest income | 43,261 | 38,619 | 12.0 | 33,370 | ||||||||||
| Total income | 57,647 | 52,154 | 10.5 | 46,404 | ||||||||||
| Net operating income | 32,222 | 28,251 | 14.1 | 24,989 | ||||||||||
| Profit before tax | 16,698 | 15,250 | 9.5 | 15,260 | ||||||||||
| Attributable profit to the parent | 11,076 | 9,605 | 15.3 | 8,654 | ||||||||||
UNDERLYING EPS AND PROFITABILITY D (%) | 2023 | 2022 | % 2023 vs. 2022 | 2021 | ||||||||||
| Underlying EPS (euro) | 0.654 | 0.539 | 21.5 | 0.468 | ||||||||||
| Underlying RoE | 11.91 | 10.67 | 10.29 | |||||||||||
| Underlying RoTE | 15.06 | 13.37 | 12.73 | |||||||||||
| Underlying RoA | 0.69 | 0.63 | 0.65 | |||||||||||
| Underlying RoRWA | 1.96 | 1.77 | 1.78 | |||||||||||
332
SOLVENCY (%) | 2023 | 2022 | 2021 | |||||||||||
| Fully-loaded CET1 capital ratio | 12.3 | 12.0 | 12.1 | |||||||||||
| Fully-loaded total capital ratio | 16.3 | 15.8 | 16.4 | |||||||||||
CREDIT QUALITY (%)C | 2023 | 2022 | 2021 | |||||||||||
| Cost of risk | 1.18 | 0.99 | 0.77 | |||||||||||
| NPL ratio | 3.14 | 3.08 | 3.16 | |||||||||||
| Total coverage ratio | 66 | 68 | 71 | |||||||||||
THE SHARE AND MARKET CAPITALIZATION | 2023 | 2022 | % 2023 vs. 2022 | 2021 | ||||||||||
| Number of shareholders | 3,662,377 | 3,915,388 | (6.5) | 3,936,922 | ||||||||||
| Shares (millions) | 16,184 | 16,794 | (3.6) | 17,341 | ||||||||||
| Share price (euro) | 3.780 | 2.803 | 34.9 | 2.941 | ||||||||||
| Market capitalization (EUR million) | 61,168 | 47,066 | 30.0 | 50,990 | ||||||||||
| Tangible book value per share (euro) | 4.76 | 4.26 | 4.12 | |||||||||||
| Price / Tangible book value per share (X) | 0.79 | 0.66 | 0.71 | |||||||||||
| CUSTOMERS (thousands) | 2023 | 2022 | % 2023 vs. 2022 | 2021 | ||||||||||
| Total customers | 164,542 | 159,844 | 2.9 | 152,943 | ||||||||||
Active customers F | 99,503 | 99,190 | 0.3 | 96,887 | ||||||||||
Loyal customers G | 29,286 | 27,456 | 6.7 | 25,548 | ||||||||||
Digital customers H | 54,161 | 51,471 | 5.2 | 47,489 | ||||||||||
| Digital sales / Total sales (%) | 56.3 | 55.1 | 54.4 | |||||||||||
| OPERATING DATA | 2023 | 2022 | % 2023 vs. 2022 | 2021 | ||||||||||
| Number of employees | 212,764 | 206,462 | 3.1 | 199,177 | ||||||||||
| Number of branches | 8,518 | 9,019 | (5.6) | 9,229 | ||||||||||
| A. Includes customer deposits, mutual funds, pension funds and managed portfolios. | ||
| B. In constant euros: Net interest income: +15.8%; Total income: +12.8%; Net operating income: +15.4%; Profit before tax: +9.7%; Attributable profit: +17.7%. | ||
D. In addition to IFRS measures, we present non-IFRS measures including some which we refer to as underlying measures. These non-IFRS measures exclude items outside the ordinary course of business and reclassify certain items under some headings of the underlying income statement as described at the end of section 3.2 'Results' and in section 8. 'Alternative Performance Measures' of this chapter. In our view, this provides a better year-on-year comparison. | ||
| E. In constant euros: Net interest income: +15.8%; Total income: +13.1%; Net operating income: +16.1%; Profit before tax: +11.3%; Attributable profit: +17.7%. | ||
| F. Those customers who comply with the minimum balance, income and/or transactionality requirements as defined according to the business area. | ||
| G. Active customers who receive most of their financial services from the Group according to the commercial segment to which they belong. Various engaged customer levels have been defined taking profitability into account. | ||
| H. Every physical or legal person, that, being part of a commercial bank, has logged in its personal area of internet banking or mobile phone or both in the last 30 days. | ||
333
3. Group financial
performance
performance
Santander follows IFRS to report its results (see note 1.b to the consolidated financial statements), which generally inform reporting of our financial situation in this consolidated directors’ report. However, we also use non-IFRS measures and Alternative Performance Measures (APMs) to assess our performance (see section 8. 'Alternative Performance Measures' of this chapter). Thus, the main adjustments to our IFRS results consist of:
•underlying results measures: we present what we call underlying results measures which exclude items outside the ordinary course of business and reclassify certain items under some headings of the underlying income statement as described at the end of section 3.2 ‘Results’ in this chapter and in note 52.c of the consolidated financial statements. In our view, this provides a better year-on-year comparison.
In section 4 'Financial information by segment', we present results by business area only in underlying terms in accordance with IFRS 8. We reconcile them in aggregate terms with our IFRS consolidated results in note 52.c to the consolidated financial statements; and
•local currency measures: we use certain non-IFRS financial indicators in local currency to assess our ongoing operating performance. They include the results from our subsidiary banks outside the eurozone excluding the exchange rate impact (i.e. in constant euros). Because changes in exchange rates have a non-operating impact on results, we believe assessing performance in local currency provides management and investors an additional and meaningful assessment of performance. Section 8. 'Alternative Performance Measures' of this chapter explains how we exclude the exchange rate impact from financial measures in local currency.
We have rounded certain figures in this consolidated directors' report to present them more clearly. Thus, the amounts given in the totals columns and rows of tables in certain instances may not match the sum of that column or row.
3.1 Overview of Santander
Santander is one of the largest banks in the eurozone. At 2023 year-end, we had EUR 1,797,062 million in assets and EUR 1,306,942 million in total customer funds. Santander was the second largest bank by market capitalization in the eurozone (EUR 61,168 million as of 29 December 2023).
The Santander Way
Our Purpose is to help people and businesses prosper. Our Aim is to be the best open financial services platform, by acting responsibly and earning the lasting loyalty of our stakeholders by being Simple, Personal and Fair in all we do.
Over the years, we have demonstrated the strength and resilience of our unique strategy and business model, despite the challenges that have arisen.
We engage in all types of typical banking activities, operations and services. We do not merely meet our legal and regulatory obligations but we also aim to exceed the expectations of our stakeholders: employees, customers, communities and shareholders. In detail:
•We had 212,764 employees at 2023 year end. We continue to work towards being an employer of choice in all of our markets. Our strategic priorities centre around ensuring our employees are the heart of all we do through our Santander Way culture and by fostering diversity, equity & inclusion (DE&I) as well as wellbeing. We are attracting the best talent and promoting learning to ensure we have the right people in place.
In 2023, we continued to listen to employees through our “Your Voice” listening tool and our employee Net Promoter Scores (eNPS) increased to 62, in the top 10% of the Finance Sector and top 5% of all sectors (+22 and +26 above respective benchmarks) backed by several improvements in employee experience. We also implemented a potential assessment model that has helped us learn more about the skills, capabilities and career aspirations of our employees.
We took great strides in our DE&I efforts as we continued to address the importance of gender equality and pay gaps. Our DE&I strategy includes addressing the pay gap, with the aim of reducing it to near 0% (already close to 0%). The number of women in senior executive positions has increased, progressing towards our 2025 target, which we increased at the beginning of 2023 up to 35% (from 30%), reaching 31.4% at the end of the year. This represents a 7.7pp increase over last three years.
334
•Customer focus is an essential part our strategy. Through our multichannel offering, we provide our 165 million customers the best products and services to meet their financial needs and make us their global, trusted and responsive partner. Our investments in customer growth are centred around three fundamentals that customers look for: competitive prices, a frictionless digital experience, so we can be our customers’ trusted financial partner.
We continued to improve our distribution model through constant innovation. We are building a digital bank with branches to make our customers' lives easier, giving them the power to decide how they want to interact with us.
Each year, we have further enhanced our customer experience and satisfaction, reflected in our customer growth rates and Net Promoter Score (NPS) improvement where we are one of the top three banks in seven markets (including topping the ranking in Chile and Argentina).
At year end, we had 8,518 branches across a wide footprint, including WorkCafés, Smart Red branches and other specialized centres for businesses, private banking, universities and other customer segments. These physical spaces also incorporate new digital facilities and some have collaborative spaces.
Customer interactions continued to shift to digital and remote services. The number of digital customers and digital activity continued to increase. We now have more than 54 million digital customers (+5% year-on-year) and digital sales accounted for 56% of total sales (55% in 2022).
At Santander, we appreciate the value of the human connection our branch network provides and are mindful of our most vulnerable customers' needs, responding with offers to deliver growth through customer loyalty and customer experience.
We are committed to creating products and services catered to our customers' needs. Some examples of our commitment to financial inclusion are our initiatives in rural Spain: through our branches, ATMs and network of financial agents in communities with under 10,000 inhabitants and Correos Cash, we provide access to basic financial services to customers in these rural areas that might otherwise have been left unattended.
Santander is joining efforts with the Asociación Española de Banca (AEB) members to ensure and promote financial inclusion in remote areas and vulnerable population. In 2023, we helped customers in financial difficulties in Spain through different initiatives such as waiving fees to vulnerable customers or specific programmes to refinance debt to customers affected by the higher cost of living.
As another example, we have a cross-functional team that has been working on enhancing services for our elderly customers including measures such as extending the hours of counter/teller services and creating senior ambassadors to make sure senior citizens receive the best possible service. Additionally, we promote financial education with specific content for seniors through Finanzas para Mortales (our financial education programme). Our commitment in Spain to financial education through this programme directly impacted to senior
citizens, people with disabilities, people in vulnerable situations and school children, among others.
•We support our communities by embedding ESG factors in all our businesses, ensuring we do things the right way.
We have a competitive advantage to help our customers on their green transitions. In 2023:
•In Corporate & Investment Banking, we raised and facilitated EUR 20.2 billion in green finance, reaching EUR 114.6 billion since 2019. Santander remains among the top banks in number of deals and deal value globally in renewable energy financing, with over 85 deals and EUR 6.7 billion globally.
•To help fulfil our ambition of being net zero by 2050, we set two new decarbonization targets for 2030 for corporate auto manufacturing and auto lending portfolio in Europe. We now have seven targets in five of our high-emitting sectors.
•In Retail and Commercial Banking, we strengthened our green proposition with new solutions for all customers, such as financing of solar panel installations and green mortgages.
•In Digital Consumer Bank, we financed more than 200,000 new electric vehicles (EVs), with volumes over EUR 6.5 billion, representing a >10% market share in Europe EV sales.
•In Wealth Management & Insurance, we held EUR 67.7 billion of the EUR 100 billion we have pledged to hold in Socially Responsible Investment (SRI) assets under management by 2025.
In terms of financial inclusion, we revised our target of financial inclusion to reach 5 million people by 2025. In addition, we committed to invest EUR 400 million between 2023-2026 to foster education, employability and entrepreneurship.
As a result of all these initiatives, we were:
•named the World’s Best Bank for Financial Inclusion (for the third year in a row), the World’s Best Bank for SMEs and World’s Best Bank for Emerging Markets by Euromoney (in the Euromoney Awards for Excellence); and
•the highest ranking bank on Fortune's list of 50 companies that are changing the world, owing to Santander Universities support for education, entrepreneurship and employability over the past 27 years.
•For our shareholders, we delivered solid financial results in 2023. We achieved an all-time high attributable profit of EUR 11,076 million boosted by revenue and efficiency improvement, with profitability growing strongly.
These results allowed us to build up capital with double-digit value creation, while increasing our payout ratio to 50%. As a result, the total shareholder remuneration paid against 2023 results is estimated to be 44% higher than that paid against of the 2022 results. The cash dividend per share is estimated to increase by approximately 50%.
335
Once again, we delivered on the targets we set at the beginning of 2023: double-digit revenue growth in constant euros (+13% achieved), efficiency ratio of 44-45% (44.1% full-year 2023), cost of risk below 1.2% (1.18%), fully-loaded CET1 ratio over 12% (12.3%) and RoTE over 15% (15.1%).
Looking ahead
In 2023, we entered into a new phase of profitability and sustainable and higher shareholder value creation. This new phase is underpinned by three tenets:
•Think Value: delivering double-digit value creation, on average through-the- cycle.
•Think Customer: building a digital bank with branches with well targeted products and services to grow our customer base.
•Think Global: best customer experience leveraging global and in-market scale, network and technological capabilities to accelerate profitable growth.
Over the last 9 years, we have made structural changes in the business and operating model, building global businesses and global platforms.
We launched ONE Transformation, which involves implementing a common operating model and technology for our retail and commercial business across all our footprint. This will support improved customer service, efficiency and profitability.
We recently completed our last step towards ONE Santander through the creation of five global businesses with the following strategic priorities for 2024:
•Retail & Commercial Banking: a new global business integrating our retail and commercial banking activity. Our priorities for 2024 are to: implement a common operating model; spread transformation efforts across Retail & Commercial Banking's footprint; and further strengthen profitability.
•Digital Consumer Bank: a single model across our markets for our consumer and auto finance business and for Openbank. Our priorities for 2024 are to: expand our leadership in consumer lending across our footprint; converge towards a global operating model, a more digital one; and continue to build flex-term solutions (leasing, subscription) off common platforms.
•Corporate & Investment Banking: our global platform to support corporates and institutions. Our priorities for 2024 are to deliver profitable growth by: deepening client relationships, with a particular focus on the US; sophisticate our centres of expertise and further digitalize our business; and actively managing capital.
•Wealth Management & Insurance: common service models for our private banking, asset management and insurance businesses. Our priorities for 2024 are to: improve our customer experience and expand our presence into new countries and businesses; create operational leverage through our global operations and factories and continue to build our global platforms.
•Payments: single infrastructures for our payment solutions: PagoNxt and Cards. PagoNxt continues to scale up our global platform of innovative payments and integrated value-added solutions. Also, we aim to expand our global payment platform to all our regions and the open market, and our Cards business while improving customer experience.
Our regions' strategic priorities are:
•Europe: remain focused on customer experience and service quality, and on making the structural changes needed to develop a common operating model for Europe.
•North America: leverage the strength of our global businesses to accelerate the transformation of our businesses in the US and Mexico.
•South America: increase the value we bring to the Group and on working to become the most profitable bank in each of the countries where we operate in the region.
•DCB Europe: continue to reinforce our auto leadership through strategic alliances, leasing and subscription. In non-auto, keep upscaling our buy now, pay later business. Transformation for future growth deploying a simpler organizational structure to deliver through best-in-class digital platforms, launching new channels and products.
To conclude, we believe Grupo Santander is well positioned to continue driving additional profitable growth in 2024, supported by our consistent track record and the implementation of ONE Santander.
Note: the implementation of the shareholder remuneration policy is subject to future corporate and regulatory decisions and approvals.
336
3.2 Results
| Executive summary | |||||||||||||||||||||||||||||||||||||||||||||||||||||||||||||||||||||||||||||||||||||||||
| Attributable profit | Performance (2023 vs. 2022) | ||||||||||||||||||||||||||||||||||||||||||||||||||||||||||||||||||||||||||||||||||||||||
| Record profit, reaching all targets for the year | Double-digit revenue growth, increasing more than operating expenses, and controlled cost of risk | ||||||||||||||||||||||||||||||||||||||||||||||||||||||||||||||||||||||||||||||||||||||||
| +15% in euros | Total income | Costs | Provisions | ||||||||||||||||||||||||||||||||||||||||||||||||||||||||||||||||||||||||||||||||||||||
| EUR 11,076 mn | +11% | +6% | +19% | in euros | |||||||||||||||||||||||||||||||||||||||||||||||||||||||||||||||||||||||||||||||||||||
| +18% in constant euros | +13% | +10% | +19% | in constant euros | |||||||||||||||||||||||||||||||||||||||||||||||||||||||||||||||||||||||||||||||||||||
| Efficiency | Profitability | ||||||||||||||||||||||||||||||||||||||||||||||||||||||||||||||||||||||||||||||||||||||||
| The Group's efficiency ratio improved driven by Europe | Profitability continued to improve | ||||||||||||||||||||||||||||||||||||||||||||||||||||||||||||||||||||||||||||||||||||||||
| Group | Europe | RoTE | RoRWA | ||||||||||||||||||||||||||||||||||||||||||||||||||||||||||||||||||||||||||||||||||||||
| 44.1% | 42.1% | 15.1% | 1.96% | ||||||||||||||||||||||||||||||||||||||||||||||||||||||||||||||||||||||||||||||||||||||
| -1.7 pp | -5.2 pp | +1.7 pp | +0.19 pp | ||||||||||||||||||||||||||||||||||||||||||||||||||||||||||||||||||||||||||||||||||||||
| Changes 2023 vs. 2022 | |||||||||||||||||||||||||||||||||||||||||||||||||||||||||||||||||||||||||||||||||||||||||
| Condensed income statement | ||||||||||||||||||||
| EUR million | ||||||||||||||||||||
| Change | ||||||||||||||||||||
| 2023 | 2022 | Absolute | % | % excl. FX | 2021 | |||||||||||||||
| Net interest income | 43,261 | 38,619 | 4,642 | 12.0 | 15.8 | 33,370 | ||||||||||||||
| Net fee income (commission income minus commission expense) | 12,057 | 11,790 | 267 | 2.3 | 5.0 | 10,502 | ||||||||||||||
| Gains or losses on financial assets and liabilities and exchange differences (net) | 2,633 | 1,653 | 980 | 59.3 | 77.1 | 1,563 | ||||||||||||||
| Dividend income | 571 | 488 | 83 | 17.0 | 17.4 | 513 | ||||||||||||||
| Income from companies accounted for using the equity method | 613 | 702 | (89) | (12.7) | (13.3) | 432 | ||||||||||||||
| Other operating income/expenses | (1,712) | (1,135) | (577) | 50.8 | 177.9 | 24 | ||||||||||||||
| Total income | 57,423 | 52,117 | 5,306 | 10.2 | 12.8 | 46,404 | ||||||||||||||
| Operating expenses | (25,425) | (23,903) | (1,522) | 6.4 | 9.6 | (21,415) | ||||||||||||||
| Administrative expenses | (22,241) | (20,918) | (1,323) | 6.3 | 9.4 | (18,659) | ||||||||||||||
| Staff costs | (13,726) | (12,547) | (1,179) | 9.4 | 12.2 | (11,216) | ||||||||||||||
| Other general administrative expenses | (8,515) | (8,371) | (144) | 1.7 | 5.2 | (7,443) | ||||||||||||||
| Depreciation and amortization | (3,184) | (2,985) | (199) | 6.7 | 11.2 | (2,756) | ||||||||||||||
| Provisions or reversal of provisions | (2,678) | (1,881) | (797) | 42.4 | 55.2 | (2,814) | ||||||||||||||
| Impairment or reversal of impairment of financial assets not measured at fair value through profit or loss (net) | (12,956) | (10,863) | (2,093) | 19.3 | 19.6 | (7,407) | ||||||||||||||
| Impairment of other assets (net) | (237) | (239) | 2 | (0.8) | 33.1 | (231) | ||||||||||||||
| Gains or losses on non-financial assets and investments (net) | 313 | 12 | 301 | — | — | 53 | ||||||||||||||
| Negative goodwill recognized in results | 39 | — | 39 | — | — | — | ||||||||||||||
| Gains or losses on non-current assets held for sale not classified as discontinued operations | (20) | 7 | (27) | — | — | (43) | ||||||||||||||
| Profit or loss before tax from continuing operations | 16,459 | 15,250 | 1,209 | 7.9 | 9.7 | 14,547 | ||||||||||||||
| Tax expense or income from continuing operations | (4,276) | (4,486) | 210 | (4.7) | (3.3) | (4,894) | ||||||||||||||
| Profit from the period from continuing operations | 12,183 | 10,764 | 1,419 | 13.2 | 15.1 | 9,653 | ||||||||||||||
| Profit or loss after tax from discontinued operations | — | — | — | — | — | — | ||||||||||||||
| Profit for the period | 12,183 | 10,764 | 1,419 | 13.2 | 15.1 | 9,653 | ||||||||||||||
| Profit attributable to non-controlling interests | (1,107) | (1,159) | 52 | (4.5) | (5.5) | (1,529) | ||||||||||||||
| Profit attributable to the parent | 11,076 | 9,605 | 1,471 | 15.3 | 17.7 | 8,124 | ||||||||||||||
337
Main income statement items
Total income
Total income amounted to EUR 57,423 million, a double-digit increase year-on-year. In constant euros, total income increased 13% year-on-year. Net interest income and net fee income accounted for 96% of total income. By line:
Net interest income
Net interest income amounted to EUR 43,261 million, 12% higher than 2022.
The tables below show the average balances of each year
–calculated as the monthly average over the period, which we believe should not differ materially from using daily balances–, and the generated interest.
–calculated as the monthly average over the period, which we believe should not differ materially from using daily balances–, and the generated interest.
The tables also include average balances and interest rates in 2023 and 2022, based on the domicile of the entities at which the relevant assets or liabilities are recorded. Domestic balances relate to our entities domiciled in Spain. International balances relate to entities domiciled outside of Spain (reflecting our foreign activity), and are divided into mature markets (the US and Europe, except Spain and Poland) and developing markets (South America, Mexico and Poland).
| Average balance sheet - assets and interest income | |||||||||||||||||||||||
| EUR million | |||||||||||||||||||||||
| 2023 | 2022 | ||||||||||||||||||||||
| Assets | Average balance | Interest | Average rate | Average balance | Interest | Average rate | |||||||||||||||||
Cash balances at central banks and other deposits on demand and loans and advances to central banks and credit institutions A | 310,887 | 16,467 | 5.30 | % | 304,935 | 7,139 | 2.34 | % | |||||||||||||||
| Domestic | 117,332 | 4,694 | 4.00 | % | 111,697 | 1,166 | 1.04 | % | |||||||||||||||
| International - Mature markets | 124,570 | 5,611 | 4.50 | % | 139,105 | 1,971 | 1.42 | % | |||||||||||||||
| International - Developing markets | 68,985 | 6,162 | 8.93 | % | 54,133 | 4,002 | 7.39 | % | |||||||||||||||
| of which: | |||||||||||||||||||||||
| Reverse repurchase agreements | 55,570 | 4,745 | 8.54 | % | 39,572 | 1,862 | 4.71 | % | |||||||||||||||
| Domestic | 24,292 | 1,336 | 5.50 | % | 19,072 | 146 | 0.77 | % | |||||||||||||||
| International - Mature markets | 4,845 | 278 | 5.74 | % | 4,713 | 55 | 1.17 | % | |||||||||||||||
| International - Developing markets | 26,433 | 3,131 | 11.85 | % | 15,787 | 1,661 | 10.52 | % | |||||||||||||||
| Loans and advances to customers | 1,036,547 | 70,619 | 6.81 | % | 1,031,226 | 54,110 | 5.25 | % | |||||||||||||||
| Domestic | 265,322 | 10,581 | 3.99 | % | 272,826 | 5,929 | 2.17 | % | |||||||||||||||
| International - Mature markets | 546,641 | 28,771 | 5.26 | % | 552,674 | 19,821 | 3.59 | % | |||||||||||||||
| International - Developing markets | 224,584 | 31,267 | 13.92 | % | 205,726 | 28,360 | 13.79 | % | |||||||||||||||
| of which: | |||||||||||||||||||||||
| Reverse repurchase agreements | 46,382 | 3,603 | 7.77 | % | 43,505 | 1,026 | 2.36 | % | |||||||||||||||
| Domestic | 8,725 | 261 | 2.99 | % | 9,509 | 42 | 0.44 | % | |||||||||||||||
| International - Mature markets | 36,546 | 3,210 | 8.78 | % | 33,068 | 919 | 2.78 | % | |||||||||||||||
| International - Developing markets | 1,111 | 132 | 11.88 | % | 928 | 65 | 7.00 | % | |||||||||||||||
| Debt securities | 224,304 | 14,501 | 6.46 | % | 183,013 | 10,416 | 5.69 | % | |||||||||||||||
| Domestic | 71,507 | 2,503 | 3.50 | % | 45,932 | 809 | 1.76 | % | |||||||||||||||
| International - Mature markets | 51,327 | 1,444 | 2.81 | % | 43,877 | 803 | 1.83 | % | |||||||||||||||
| International - Developing markets | 101,470 | 10,554 | 10.40 | % | 93,204 | 8,804 | 9.45 | % | |||||||||||||||
| Hedging income | 3,561 | (236) | |||||||||||||||||||||
| Domestic | (45) | 16 | |||||||||||||||||||||
| International - Mature markets | 2,955 | 480 | |||||||||||||||||||||
| International - Developing markets | 651 | (732) | |||||||||||||||||||||
| Other interest | 104 | 1 | |||||||||||||||||||||
| Domestic | (47) | (121) | |||||||||||||||||||||
| International - Mature markets | 63 | 40 | |||||||||||||||||||||
| International - Developing markets | 88 | 82 | |||||||||||||||||||||
| Total interest-earning assets | 1,571,738 | 105,252 | 6.70 | % | 1,519,174 | 71,430 | 4.70 | % | |||||||||||||||
| Domestic | 454,161 | 17,686 | 3.89 | % | 430,455 | 7,799 | 1.81 | % | |||||||||||||||
| International - Mature markets | 722,538 | 38,844 | 5.38 | % | 735,656 | 23,115 | 3.14 | % | |||||||||||||||
| International - Developing markets | 395,039 | 48,722 | 12.33 | % | 353,063 | 40,516 | 11.48 | % | |||||||||||||||
| Other assets | 201,365 | 201,099 | |||||||||||||||||||||
| Assets from discontinued operations | — | — | |||||||||||||||||||||
| Average total assets | 1,773,103 | 105,252 | 1,720,273 | 71,430 | |||||||||||||||||||
A.In 2022, interest includes income from liabilities reported in 'Deposits from central banks and credit institutions' related to funding from the European Central Bank.
338
The average balance of interest-earning assets in 2023 was 3% higher than in 2022. The activity of our entities in the domestic market grew by 6%, in the international mature markets it decreased 2% and international developing markets were up 12%.
The average balance of interest-bearing liabilities in 2023 was 3% higher year-on-year, with growth in domestic (+2%) and international developing (+13%) markets, and a reduction in international mature markets (-1%).
Higher interest rates in our markets led to a general increase in asset yields and liability costs.
The average return on interest-earning assets increased 200 bps from 4.70% in 2022 to 6.70% in 2023, with general rises across our markets (domestic +208 bps, international developing +224 bps, international mature +85 bps). Moreover, returns across all balance sheet items increased.
The average cost of interest-bearing liabilities rose 189 bps to 4.14%, with increases in all markets. Domestic liabilities increased 154 bps while international mature markets and international developing markets increased 229 bps and 110 bps, respectively. All balance sheet lines increased.
We calculated the change in interest income/(expense) shown in the tables below by:
•Applying the interest rate of the previous period to the difference between the average balances from the current and previous periods to obtain the change in volumes.
•Applying the difference between the rates from the current and previous periods to the average balance from the previous year to obtain the change in interest rate.
Both interest income and expense increased in 2023, mainly due to higher interest rates and, to a lesser extent, greater volumes.
Net interest income increased 12%, as shown in the graph shown below. In constant euros, growth was 16%, mainly due to greater volumes in some countries, higher interest rates and margin management. By region and in constant euros:
•Net interest income in Europe grew 27%, due to the strong positive sensitivity to interest rate rises in our balance sheet in euros. By country: +46% in Spain, +5% in the UK, +96% in Portugal and +25% in Poland.
•In North America it increased 3%, driven mainly by Mexico (+12%) while it decreased 4% in the US.
•Net interest income in South America rose 12%, despite the impact from negative sensitivity to interest rate rises during most of the year in Chile (-23%) and Brazil (+2%).
•In Digital Consumer Bank (DCB), net interest income increased 6%, supported by actively repricing loans and customer deposit growth.
•Corporate Centre recorded lower losses due to higher liquidity buffer remuneration as a result of higher interest rates.
339
| Average balance sheet - liabilities and interest expense | |||||||||||||||||||||||
| EUR million | |||||||||||||||||||||||
| 2023 | 2022 | ||||||||||||||||||||||
| Liabilities and stockholders’ equity | Average balance | Interest | Average rate | Average balance | Interest | Average rate | |||||||||||||||||
Deposits from central banks and credit institutions A | 175,164 | 9,350 | 5.34 | % | 214,879 | 3,636 | 1.69 | % | |||||||||||||||
| Domestic | 62,366 | 2,723 | 4.37 | % | 92,373 | 560 | 0.61 | % | |||||||||||||||
| International - Mature markets | 63,456 | 2,989 | 4.71 | % | 78,230 | 972 | 1.24 | % | |||||||||||||||
| International - Developing markets | 49,342 | 3,638 | 7.37 | % | 44,276 | 2,104 | 4.75 | % | |||||||||||||||
| of which: | |||||||||||||||||||||||
| Repurchase agreements | 55,619 | 3,737 | 6.72 | % | 34,298 | 1,349 | 3.93 | % | |||||||||||||||
| Domestic | 34,123 | 1,686 | 4.94 | % | 17,321 | 186 | 1.07 | % | |||||||||||||||
| International - Mature markets | 6,542 | 388 | 5.93 | % | 2,743 | 50 | 1.82 | % | |||||||||||||||
| International - Developing markets | 14,954 | 1,663 | 11.12 | % | 14,234 | 1,113 | 7.82 | % | |||||||||||||||
| Customer deposits | 1,011,471 | 33,238 | 3.29 | % | 963,359 | 16,994 | 1.76 | % | |||||||||||||||
| Domestic | 302,379 | 3,269 | 1.08 | % | 286,233 | 698 | 0.24 | % | |||||||||||||||
| International - Mature markets | 468,602 | 12,386 | 2.64 | % | 460,386 | 3,279 | 0.71 | % | |||||||||||||||
| International - Developing markets | 240,490 | 17,583 | 7.31 | % | 216,740 | 13,017 | 6.01 | % | |||||||||||||||
| of which: | |||||||||||||||||||||||
| Repurchase agreements | 73,193 | 7,084 | 9.68 | % | 57,646 | 3,199 | 5.55 | % | |||||||||||||||
| Domestic | 4,602 | 263 | 5.71 | % | 2,327 | 24 | 1.03 | % | |||||||||||||||
| International - Mature markets | 46,992 | 4,125 | 8.78 | % | 37,380 | 1,099 | 2.94 | % | |||||||||||||||
| International - Developing markets | 21,599 | 2,696 | 12.48 | % | 17,939 | 2,076 | 11.57 | % | |||||||||||||||
Marketable debt securities B | 288,345 | 12,751 | 4.42 | % | 255,721 | 8,464 | 3.31 | % | |||||||||||||||
| Domestic | 134,045 | 4,184 | 3.12 | % | 111,682 | 2,262 | 2.03 | % | |||||||||||||||
| International - Mature markets | 108,912 | 4,219 | 3.87 | % | 107,374 | 2,262 | 2.11 | % | |||||||||||||||
| International - Developing markets | 45,388 | 4,348 | 9.58 | % | 36,665 | 3,940 | 10.75 | % | |||||||||||||||
| of which: | |||||||||||||||||||||||
| Commercial paper | 29,195 | 1,329 | 4.55 | % | 17,907 | 375 | 2.09 | % | |||||||||||||||
| Domestic | 21,509 | 888 | 4.13 | % | 12,377 | 222 | 1.79 | % | |||||||||||||||
| International - Mature markets | 5,641 | 243 | 4.31 | % | 4,280 | 60 | 1.40 | % | |||||||||||||||
| International - Developing markets | 2,045 | 198 | 9.68 | % | 1,250 | 93 | 7.44 | % | |||||||||||||||
Other interest-bearing liabilities C | 23,139 | 638 | 2.76 | % | 23,861 | 216 | 0.91 | % | |||||||||||||||
| Domestic | 16,109 | 469 | 2.91 | % | 16,616 | 93 | 0.56 | % | |||||||||||||||
| International - Mature markets | 4,830 | 1 | 0.02 | % | 5,416 | 1 | 0.02 | % | |||||||||||||||
| International - Developing markets | 2,200 | 168 | 7.64 | % | 1,829 | 122 | 6.67 | % | |||||||||||||||
| Hedging expenses | 4,436 | 2,055 | |||||||||||||||||||||
| Domestic | 1,045 | 218 | |||||||||||||||||||||
| International - Mature markets | 1,756 | 207 | |||||||||||||||||||||
| International - Developing markets | 1,635 | 1,630 | |||||||||||||||||||||
| Other interest | 1,578 | 1,446 | |||||||||||||||||||||
| Domestic | 567 | 435 | |||||||||||||||||||||
| International - Mature markets | 304 | 186 | |||||||||||||||||||||
| International - Developing markets | 707 | 825 | |||||||||||||||||||||
| Total interest-bearing liabilities | 1,498,119 | 61,991 | 4.14 | % | 1,457,820 | 32,811 | 2.25 | % | |||||||||||||||
| Domestic | 514,899 | 12,257 | 2.38 | % | 506,904 | 4,266 | 0.84 | % | |||||||||||||||
| International - Mature markets | 645,800 | 21,655 | 3.35 | % | 651,406 | 6,907 | 1.06 | % | |||||||||||||||
| International - Developing markets | 337,420 | 28,079 | 8.32 | % | 299,510 | 21,638 | 7.22 | % | |||||||||||||||
| Other liabilities | 173,299 | 163,832 | |||||||||||||||||||||
| Non-controlling interests | 8,650 | 8,635 | |||||||||||||||||||||
| Shareholders´ equity | 93,035 | 89,986 | |||||||||||||||||||||
| Liabilities from discontinued operations | — | — | |||||||||||||||||||||
| Average total liabilities and equity | 1,773,103 | 61,991 | 1,720,273 | 32,811 | |||||||||||||||||||
A.In 2022, Interest includes expenses from assets reported in "Cash and deposits on demand and loans and advances to central banks and credit institutions" related to liquidity placed at the European Central Bank.
B.Does not include contingently convertible preference shares and perpetual subordinated notes because they do not accrue interest. We include them under 'Other liabilities'.
C. Includes 'Liabilities under insurance or reinsurance contracts', reflecting the retrospective application of the new accounting standard IFRS 17 from 1 January 2023 which meant the reclassification of a portfolio of products for approximately EUR 16 billion registered as of 31 December 2022 in 'Customer deposits' to 'Liabilities under insurance or reinsurance contracts' (see note 1.b to our consolidated financial statements). The 2022 average balance information has been updated for comparative purposes but not the Interest information, following the approach adopted by the Group in the financial statements.
340
| Volume and profitability analysis | |||||||||||
| EUR million | |||||||||||
| 2023 vs. 2022 | |||||||||||
| Increase (decrease) due to changes in | |||||||||||
| Interest income | Volume | Rate | Net change | ||||||||
| Cash and deposits on demand and loans and advances to central banks and credit institutions | 1,064 | 8,264 | 9,328 | ||||||||
| Domestic | 62 | 3,466 | 3,528 | ||||||||
| International - Mature markets | (226) | 3,866 | 3,640 | ||||||||
| International - Developing markets | 1,228 | 932 | 2,160 | ||||||||
| of which: | |||||||||||
| Reverse repurchase agreements | 1,291 | 1,592 | 2,883 | ||||||||
| Domestic | 50 | 1,140 | 1,190 | ||||||||
| International - Mature markets | 2 | 221 | 223 | ||||||||
| International - Developing markets | 1,239 | 231 | 1,470 | ||||||||
| Loans and advances to customers | 2,237 | 14,272 | 16,509 | ||||||||
| Domestic | (167) | 4,819 | 4,652 | ||||||||
| International - Mature markets | (219) | 9,169 | 8,950 | ||||||||
| International - Developing markets | 2,623 | 284 | 2,907 | ||||||||
| of which: | |||||||||||
| Reverse repurchase agreements | 117 | 2,460 | 2,577 | ||||||||
| Domestic | (4) | 223 | 219 | ||||||||
| International - Mature markets | 106 | 2,185 | 2,291 | ||||||||
| International - Developing markets | 15 | 52 | 67 | ||||||||
| Debt securities | 1,583 | 2,502 | 4,085 | ||||||||
| Domestic | 611 | 1,083 | 1,694 | ||||||||
| International - Mature markets | 154 | 487 | 641 | ||||||||
| International - Developing markets | 818 | 932 | 1,750 | ||||||||
| Hedging income | 3,797 | — | 3,797 | ||||||||
| Domestic | (61) | — | (61) | ||||||||
| International - Mature markets | 2,475 | — | 2,475 | ||||||||
| International - Developing markets | 1,383 | — | 1,383 | ||||||||
| Other interest | 103 | — | 103 | ||||||||
| Domestic | 74 | — | 74 | ||||||||
| International - Mature markets | 23 | — | 23 | ||||||||
| International - Developing markets | 6 | — | 6 | ||||||||
| Total interest-earning assets | 8,784 | 25,038 | 33,822 | ||||||||
| Domestic | 519 | 9,368 | 9,887 | ||||||||
| International - Mature markets | 2,207 | 13,522 | 15,729 | ||||||||
| International - Developing markets | 6,058 | 2,148 | 8,206 | ||||||||
341
Volume and cost analysis | |||||||||||
| EUR million | |||||||||||
| 2023 vs. 2022 | |||||||||||
| Increase (decrease) due to changes in | |||||||||||
| Interest expense | Volume | Rate | Net change | ||||||||
| Deposits from central banks and credit institutions | (190) | 5,904 | 5,714 | ||||||||
| Domestic | (238) | 2,401 | 2,163 | ||||||||
| International - Mature markets | (216) | 2,233 | 2,017 | ||||||||
| International - Developing markets | 264 | 1,270 | 1,534 | ||||||||
| of which: | |||||||||||
| Repurchase agreements | 506 | 1,882 | 2,388 | ||||||||
| Domestic | 318 | 1,182 | 1,500 | ||||||||
| International - Mature markets | 129 | 209 | 338 | ||||||||
| International - Developing markets | 59 | 491 | 550 | ||||||||
| Customer deposits | 1,632 | 14,612 | 16,244 | ||||||||
| Domestic | 42 | 2,529 | 2,571 | ||||||||
| International - Mature markets | 60 | 9,047 | 9,107 | ||||||||
| International - Developing markets | 1,530 | 3,036 | 4,566 | ||||||||
| of which: | |||||||||||
| Repurchase agreements | 837 | 3,048 | 3,885 | ||||||||
| Domestic | 42 | 197 | 239 | ||||||||
| International - Mature markets | 347 | 2,679 | 3,026 | ||||||||
| International - Developing markets | 448 | 172 | 620 | ||||||||
| Marketable debt securities | 1,420 | 2,867 | 4,287 | ||||||||
| Domestic | 519 | 1,403 | 1,922 | ||||||||
| International - Mature markets | 33 | 1,924 | 1,957 | ||||||||
| International - Developing markets | 868 | (460) | 408 | ||||||||
| of which: | |||||||||||
| Commercial paper | 336 | 618 | 954 | ||||||||
| Domestic | 241 | 425 | 666 | ||||||||
| International - Mature markets | 24 | 159 | 183 | ||||||||
| International - Developing markets | 71 | 34 | 105 | ||||||||
| Other interest-bearing liabilities | 24 | 398 | 422 | ||||||||
| Domestic | (3) | 379 | 376 | ||||||||
| International - Mature markets | 0 | 0 | 0 | ||||||||
| International - Developing markets | 27 | 19 | 46 | ||||||||
| Hedging expenses | 2,381 | — | 2,381 | ||||||||
| Domestic | 827 | — | 827 | ||||||||
| International - Mature markets | 1,549 | — | 1,549 | ||||||||
| International - Developing markets | 5 | — | 5 | ||||||||
| Other interest | 132 | — | 132 | ||||||||
| Domestic | 132 | — | 132 | ||||||||
| International - Mature markets | 118 | — | 118 | ||||||||
| International - Developing markets | (118) | — | (118) | ||||||||
| Total interest-bearing liabilities | 5,399 | 23,781 | 29,180 | ||||||||
| Domestic | 1,279 | 6,712 | 7,991 | ||||||||
| International - Mature markets | 1,544 | 13,204 | 14,748 | ||||||||
| International - Developing markets | 2,576 | 3,865 | 6,441 | ||||||||
342
| Net interest income. Volume, profitability and cost analysis summary | |||||||||||
| EUR million | |||||||||||
| 2023 vs. 2022 | |||||||||||
| Increase (decrease) due to changes in | |||||||||||
| Volume | Rate | Net change | |||||||||
| Interest income | 8,784 | 25,038 | 33,822 | ||||||||
| Domestic | 519 | 9,368 | 9,887 | ||||||||
| International - Mature markets | 2,207 | 13,522 | 15,729 | ||||||||
| International - Developing markets | 6,058 | 2,148 | 8,206 | ||||||||
| Interest expense | 5,399 | 23,781 | 29,180 | ||||||||
| Domestic | 1,279 | 6,712 | 7,991 | ||||||||
| International - Mature markets | 1,544 | 13,204 | 14,748 | ||||||||
| International - Developing markets | 2,576 | 3,865 | 6,441 | ||||||||
| Net interest income | 3,385 | 1,257 | 4,642 | ||||||||
| Domestic | (760) | 2,656 | 1,896 | ||||||||
| International - Mature markets | 663 | 318 | 981 | ||||||||
| International - Developing markets | 3,482 | (1,717) | 1,765 | ||||||||
Net interest income | ||
| EUR million | ||
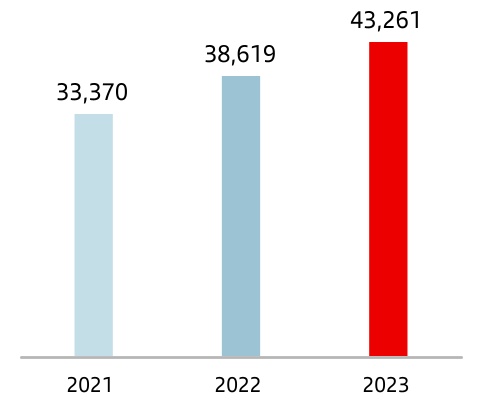
| +12% | A | ||||
| 2023 vs. 2022 | |||||
A. In constant euros: +16%.
Net fee income | ||
| EUR million | ||
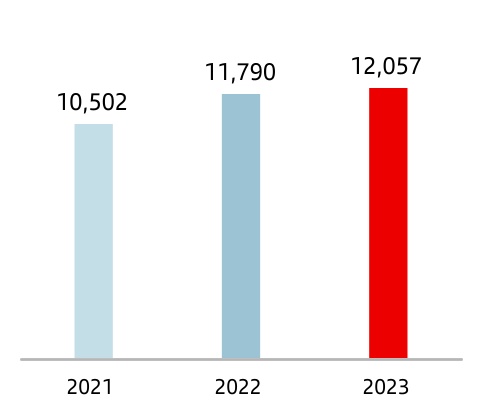
| +2% | A | ||||
| 2023 vs. 2022 | |||||
A. In constant euros: +5%.
| Net fee income | ||||||||||||||||||||
| EUR million | ||||||||||||||||||||
| Change | ||||||||||||||||||||
| 2023 | 2022 | Absolute | % | % excl. FX | 2021 | |||||||||||||||
| Asset management business, funds and insurance | 3,967 | 4,032 | (65) | (1.6) | 6.4 | 3,649 | ||||||||||||||
| Credit and debit cards | 2,386 | 2,139 | 247 | 11.6 | 19.2 | 1,782 | ||||||||||||||
| Securities and custody services | 1,086 | 986 | 100 | 10.1 | 17.4 | 1,035 | ||||||||||||||
| Account management and availability fees | 2,005 | 2,032 | (27) | (1.3) | 22.3 | 1,850 | ||||||||||||||
| Cheques and payment orders | 826 | 797 | 29 | 3.6 | 45.6 | 642 | ||||||||||||||
| Foreign exchange | 797 | 788 | 9 | 1.1 | 2.9 | 522 | ||||||||||||||
| Charges for past-due/unpaid balances and guarantees | 297 | 277 | 20 | 7.3 | 12.8 | 266 | ||||||||||||||
| Bill discounting | 208 | 227 | (19) | (8.3) | 1.7 | 199 | ||||||||||||||
| Other | 484 | 512 | (28) | (5.4) | (26.6) | 557 | ||||||||||||||
| Net fee income | 12,057 | 11,790 | 267 | 2.3 | 5.0 | 10,502 | ||||||||||||||
343
Net fee income
Net fee income increased 2% compared to 2022, reaching EUR 12,057 million. In constant euros, it was 5% higher.
By region, net fee income rose 7% in North America and 14% in South America. It decreased 2% in Europe due to lower credit volumes and customer attraction campaigns.
Our scale and global businesses generated greater activity for our country units and the Group, which was reflected in net fee income growth, particularly in Santander Corporate & Investment Banking (SCIB) and PagoNxt.
In SCIB, net fee income increased double digits, with widespread growth across its core businesses.
Net fee income growth was also strong in PagoNxt with double-digit growth year-on-year in total payments volumes.
Gains or losses on financial assets and liabilities and exchange differences (net)
Gains on financial transactions and liabilities and exchange differences (net) stood at EUR 2,633 million (EUR 1,653 million in 2022), driven mainly by customer activity in SCIB and lower losses in the Corporate Centre (driven by higher negative results from the foreign exchange (FX) hedge in 2022).
Gains and losses on financial assets and liabilities stem from mark-to-market valuations of the trading portfolio and derivative instruments , which include spot market foreign exchange transactions, sales of investment securities and liquidation of our hedging and other derivative positions.
Exchange rate differences primarily show gains and losses from foreign exchange and the differences that arise from converting
monetary items in foreign currencies to the functional currency, and from selling non-monetary assets denominated in foreign currency at the time of their disposal. Given Santander manages currency exposures with derivative instruments, the changes in this line should be analysed together with Gains/(losses) on financial assets and liabilities.
Dividend income
Dividend income was EUR 571 million (EUR 488 million in 2022).
Income from companies accounted for by the equity method
The income from companies accounted for by the equity method reached EUR 613 million compared to EUR 702 million in 2022.
Other operating income/expenses
Other operating income recorded a loss of EUR 1,712 million (compared to a EUR 1,135 million loss in 2022), owing to the hyperinflation adjustment in Argentina and lower leasing income in the US. This line was also affected by the EUR 224 million charge related to the temporary levy on revenue in Spain and DCB recorded in the first quarter of 2023.
In summary, total income increased in all regions, DCB and global businesses. The Corporate Centre also increased, due to the higher liquidity buffer remuneration and the lower negative impact from the FX hedge.
344
| Operating expenses | ||||||||||||||||||||
| EUR million | ||||||||||||||||||||
Change | ||||||||||||||||||||
| 2023 | 2022 | Absolute | % | % excl. FX | 2021 | |||||||||||||||
| Staff costs | 13,726 | 12,547 | 1,179 | 9.4 | 12.2 | 11,216 | ||||||||||||||
| Other administrative expenses | 8,515 | 8,371 | 144 | 1.7 | 5.2 | 7,443 | ||||||||||||||
| Information technology | 2,471 | 2,473 | (2) | (0.1) | 7.3 | 2,182 | ||||||||||||||
| Communications | 414 | 410 | 4 | 1.0 | 17.5 | 401 | ||||||||||||||
| Advertising | 603 | 559 | 44 | 7.9 | 16.9 | 510 | ||||||||||||||
| Buildings and premises | 721 | 708 | 13 | 1.8 | 7.8 | 699 | ||||||||||||||
| Printed and office material | 97 | 96 | 1 | 1.0 | 9.9 | 90 | ||||||||||||||
| Taxes (other than tax on profits) | 570 | 559 | 11 | 2.0 | 35.4 | 558 | ||||||||||||||
| Other expenses | 3,639 | 3,566 | 73 | 2.0 | 11.6 | 3,003 | ||||||||||||||
| Administrative expenses | 22,241 | 20,918 | 1,323 | 6.3 | 9.4 | 18,659 | ||||||||||||||
| Depreciation and amortization | 3,184 | 2,985 | 199 | 6.7 | 11.2 | 2,756 | ||||||||||||||
| Operating expenses | 25,425 | 23,903 | 1,522 | 6.4 | 9.6 | 21,415 | ||||||||||||||
Operating expenses
Operating expenses amounted to EUR 25,425 million, 6% higher than 2022 (+10% in constant euros), due to higher inflation. In real terms (excluding the impact of average inflation), operating expenses increased 0.4%.
Our cost management continued to focus on improving our efficiency and, as a result, we remained among the most efficient global banks in the world. The efficiency ratio stood at 44.1% in 2023, 1.7 pp better than 2022.
Our business transformation plan, ONE Transformation, continued to progress across our footprint, reflected in greater operating productivity and better business dynamics.
Efficiency ratio (cost to income) | ||
| % | ||
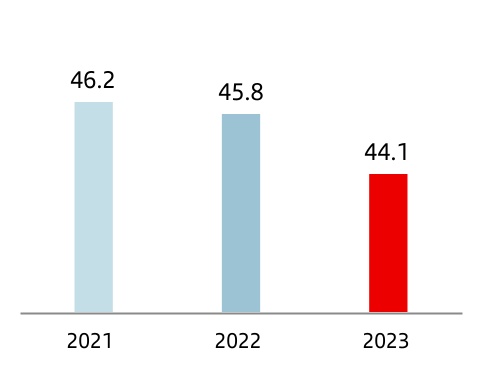
| -1.7 | pp | ||||
| 2023 vs. 2022 | |||||
In constant euros, operating expenses by region and market performed as follows:
•In Europe, operating expenses were up 6%. In real terms, they rose 1%, due to increases in Spain, Poland and Portugal, which were partially offset by the decrease in the UK (-3%). The region's efficiency ratio stood at 42.1%, improving 5.2 pp year-on-year.
•In North America, operating expenses increased 8%. In real terms, they were up 3%, due to investments in digitalization, technology and other transformation initiatives underway. The efficiency ratio stood at 49.1%.
•In South America, operating expenses rose 17%. In real terms, they were down 3%, despite the salary increases directly linked to inflation. The efficiency ratio stood at 38.5%.
•DCB's operating expenses increased 8%, +3% in real terms, due to strategic and transformation investments in leasing and BNPL platforms and business growth. The efficiency ratio stood at 47.6%.
Provisions or reversal of provisions
Provisions (net of provisions reversals) amounted to EUR 2,678 million (EUR 1,881 million in 2022) mainly driven by Spain and Brazil.
Impairment or reversal of impairment of financial assets not measured at fair value through profit or loss (net)
Impairment or reversal of impairment on financial assets not measured at fair value through profit or loss (net) was EUR 12,956 million (EUR 10,863 million in 2022).
This comparison was mainly affected by the provisions resulting from the charges in Poland for Swiss franc mortgages, the increase in the US and Mexico (due to normalization) and higher provisions recorded in Brazil, in line with credit portfolio growth.
345
Impairment of other assets (net)
The impairment on other assets (net) was EUR 237 million, compared to an impairment of EUR 239 million in 2022.
Gains or losses on non-financial assets and investments (net)
Net gains on non-financial assets and investments were EUR 313 million in 2023 (gain of EUR 12 million in 2022).
Impairment or reversal of impairment of financial assets not measured at fair value through profit or loss (net) | |||||||||||
| EUR million | |||||||||||
| 2023 | 2022 | 2021 | |||||||||
| Financial assets at fair value through other comprehensive income | 44 | 7 | 19 | ||||||||
| Financial assets at amortized cost | 12,912 | 10,856 | 7,388 | ||||||||
| Impairment or reversal of impairment of financial assets not measured at fair value through profit or loss and net gains and losses from changes | 12,956 | 10,863 | 7,407 | ||||||||
Impairment on other assets (net) | |||||||||||
| EUR million | |||||||||||
| 2023 | 2022 | 2021 | |||||||||
| Impairment of investments in subsidiaries, joint ventures and associates, net | — | — | — | ||||||||
| Impairment on non-financial assets, net | 237 | 239 | 231 | ||||||||
| Tangible assets | 136 | 140 | 150 | ||||||||
| Intangible assets | 73 | 75 | 71 | ||||||||
| Others | 28 | 24 | 10 | ||||||||
| Impairment on other assets (net) | 237 | 239 | 231 | ||||||||
Negative goodwill recognized in results
Negative goodwill of EUR 39 million was recorded in 2023. No negative goodwill was recorded in 2022.
Gains or losses on non-current assets held for sale not classified as discontinued operations
This item, which mainly includes impairment of foreclosed assets recorded and the sale of properties acquired upon foreclosure, recorded a EUR 20 million loss in 2023 (EUR 7 million gain in 2022).
Profit or loss before tax from continuing operations
Profit before tax was EUR 16,459 million in 2023, +8% year-on-year and +10% in constant euros. Good top line performance (double-digit growth in total income minus costs) was partially offset by higher loan-loss provisions and impairments and the temporary levy on revenue earned in Spain.
Tax expense or income from continuing operations
Total income tax was EUR 4,276 million (EUR 4,486 million in 2022).
| Profit attributable to the parent | ||
| EUR million | ||
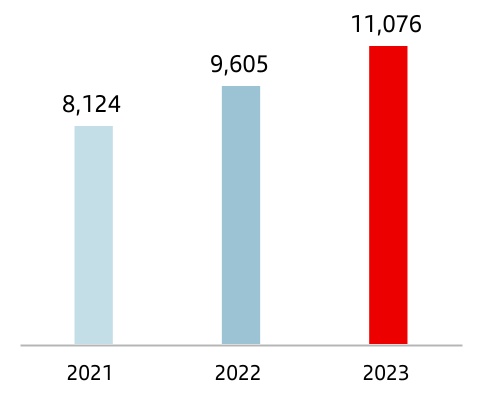
| +15% | A | ||||
| 2023 vs. 2022 | |||||
A. In constant euros: +18%.
346
Profit attributable to non-controlling interests
Profit attributable to non-controlling interests amounted to EUR 1,107 million, down 4% year-on-year (-6% in constant euros), due to lower profit in Brazil and DCB as well as the Group's increased shareholding in Banco Santander México in 2023.
Profit attributable to the parent
Profit attributable to the parent amounted to EUR 11,076 million in 2023, compared to EUR 9,605 million in 2022. These results do not fully reflect profit performance due to the temporary levy on revenue earned in Spain in 2023.
RoTE stood at 15.1% (13.4% in 2022), RoRWA at 1.96% (1.77% in 2022) and earnings per share stood at EUR 0.65 (EUR 0.54 in 2022).
Earnings per share | ||
| EUR | ||
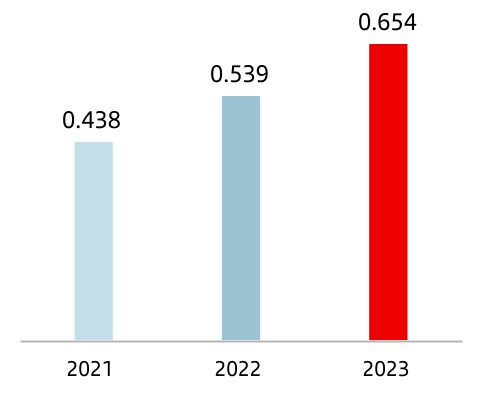
| +21% | |||||
| 2023 vs. 2022 | |||||
RoTE | ||
| % | ||
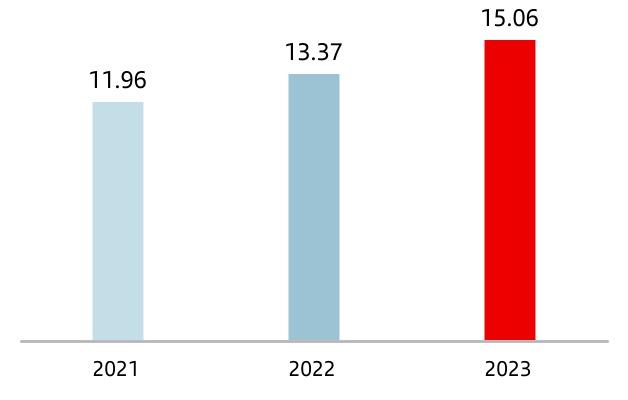
RoRWA | ||
% | ||
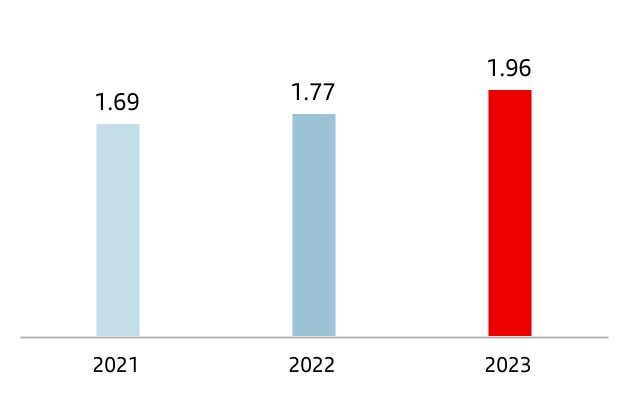
347
Below is the condensed income statement adjusted for items beyond the ordinary course of business and reclassification of certain items under some headings of the underlying income statement, as described in note 52.c of the consolidated financial statements, where our segments' aggregate underlying consolidated results are reconciled to the statutory consolidated results.
Condensed underlying income statement | ||||||||||||||||||||
| EUR million | ||||||||||||||||||||
Change | ||||||||||||||||||||
| 2023 | 2022 | Absolute | % | % excl. FX | 2021 | |||||||||||||||
| Net interest income | 43,261 | 38,619 | 4,642 | 12.0 | 15.8 | 33,370 | ||||||||||||||
| Net fee income | 12,057 | 11,790 | 267 | 2.3 | 5.0 | 10,501 | ||||||||||||||
| Gains (losses) on financial transactions and exchange differences | 2,633 | 1,653 | 980 | 59.3 | 77.1 | 1,564 | ||||||||||||||
| Other operating income | (304) | 92 | (396) | — | — | 968 | ||||||||||||||
| Total income | 57,647 | 52,154 | 5,493 | 10.5 | 13.1 | 46,404 | ||||||||||||||
| Administrative expenses and amortizations | (25,425) | (23,903) | (1,522) | 6.4 | 9.6 | (21,415) | ||||||||||||||
| Net operating income | 32,222 | 28,251 | 3,971 | 14.1 | 16.1 | 24,988 | ||||||||||||||
| Net loan-loss provisions | (12,458) | (10,509) | (1,949) | 18.5 | 19.1 | (7,436) | ||||||||||||||
| Other gains (losses) and provisions | (3,066) | (2,492) | (574) | 23.0 | 33.5 | (2,292) | ||||||||||||||
| Profit before tax | 16,698 | 15,250 | 1,448 | 9.5 | 11.3 | 15,260 | ||||||||||||||
| Tax on profit | (4,489) | (4,486) | (3) | 0.1 | 1.5 | (5,076) | ||||||||||||||
| Profit from continuing operations | 12,209 | 10,764 | 1,445 | 13.4 | 15.4 | 10,184 | ||||||||||||||
| Net profit from discontinued operations | — | — | — | — | — | — | ||||||||||||||
| Consolidated profit | 12,209 | 10,764 | 1,445 | 13.4 | 15.4 | 10,184 | ||||||||||||||
| Non-controlling interests | (1,133) | (1,159) | 26 | (2.2) | (3.4) | (1,530) | ||||||||||||||
| Net capital gains and provisions | — | — | — | — | — | (530) | ||||||||||||||
| Profit attributable to the parent | 11,076 | 9,605 | 1,471 | 15.3 | 17.7 | 8,124 | ||||||||||||||
Underlying profit attributable to the parent A | 11,076 | 9,605 | 1,471 | 15.3 | 17.7 | 8,654 | ||||||||||||||
A.Excluding net capital gains and provisions.
Underlying profit attributable to the parent
Profit attributable to the parent and underlying profit were the same in 2023 (EUR 11,076 million), as profit was not affected by results that fell outside the ordinary course of our business, but there was a reclassification of certain items under some headings of the underlying income statement to better understand the business trends. These items are:
•The temporary levy on revenue in Spain in the first quarter of 2023, totalling EUR 224 million, which was moved from total income to other gains (losses) and provisions.
•Provisions to strengthen the balance sheet in Brazil in the first quarter of 2023, totalling EUR 235 million, net of tax and minority interests.
In 2022, profit attributable to the parent and underlying profit were also the same (EUR 9,605 million), as profit was not affected by results that fell outside the ordinary course of our business, but there was also a reclassification of certain items under some headings of the underlying income statement.
As a result, both attributable profit and underlying profit increased 15% in euros and 18% in constant euros compared to 2022.
This growth was mainly boosted by solid revenue performance, which increased 11% in euros and 13% in constant euros compared to 2022, and the better efficiency improvement, which improved to 44.1%.
Santander's net operating income1 was EUR 32,222 million, 14% higher year-on-year. In constant euros, it rose 16% as follows:
1.As described in note 52.c of the consolidated financial statements, net operating income is used for the Group’s internal operating and management reporting purposes but is not a line item in the statutory consolidated income statement.
348
Net loan-loss provisions | ||
| EUR million | ||
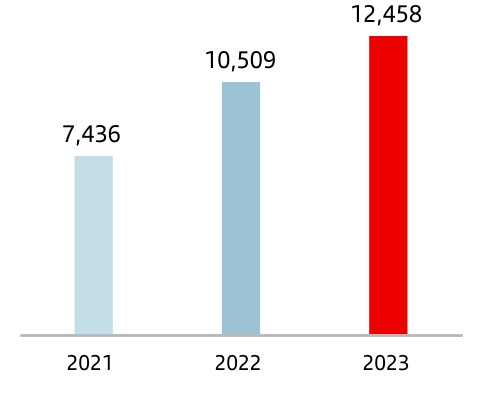
| +19 | % | A | |||
| 2023 vs. 2022 | |||||
Underlying profit attributable to the parentA | ||
| EUR million | ||
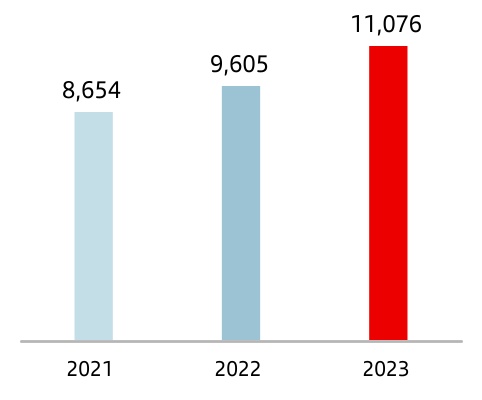
| +15 | % | B | |||
| 2023 vs. 2022 | |||||
A. Excluding net capital gains and provisions.
B. In constant euros: +18%.
•In Europe, net operating income increased 31% with strong improvements in all markets, boosted by 19% growth in total income (mainly net interest income in a context of higher interest rates) and administrative expenses and amortizations increasing in line with inflation, resulting in efficiency gains.
•In North America, net operating income rose 2%. In Mexico, it was up 18%, supported by strong total income growth, which more than offset higher transformation costs. In the US, it decreased 10%, affected by higher funding costs and investments in building up our CIB and Wealth Management businesses.
•In South America, net operating income increased 3%, driven by total income.
Cost of risk | ||
| % | ||
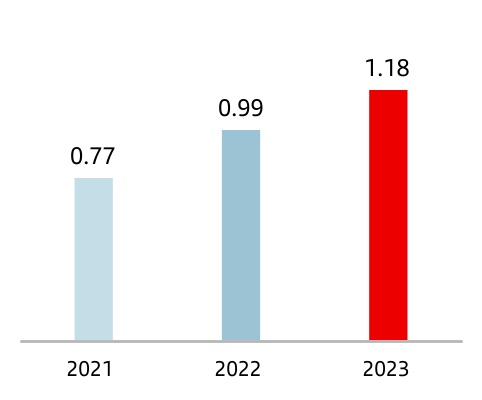
| +0.19 | pp | ||||
| 2023 vs. 2022 | |||||
Underlying earnings per shareA | ||
| EUR | ||
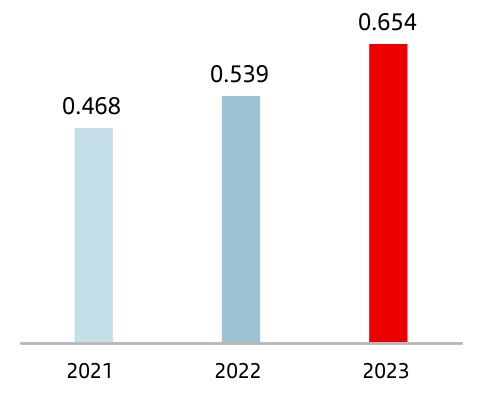
| +21% | |||||
| 2023 vs. 2022 | |||||
A. Excluding net capital gains and provisions.
•In DCB, net operating income increased 4%, driven by higher net interest income, leasing income and gains on financial transactions. Administrative expenses and amortizations rose due to strategic transformation investments and business growth, as already mentioned.
•In the Corporate Centre, net operating income improved EUR 1,029 million, driven by the improvement of net interest income (higher liquidity buffer remuneration) and gains on financial transactions higher (FX hedge costs in 2022).
Net loan-loss provisions rose 19% (+19% also in constant euros) mainly due to normalization in the US and Mexico, Swiss franc mortgage provisions in Poland and portfolio growth in Brazil. This growth was reflected in an increase in the cost of risk to 1.18%, delivering on Group's target for the year.
349
3.3 Balance sheet
| Balance sheet | |||||||||||||||||
| EUR million | |||||||||||||||||
Change | |||||||||||||||||
Assets | 2023 | 2022 | Absolute | % | 2021 | ||||||||||||
| Cash, cash balances at central banks and other deposits on demand | 220,342 | 223,073 | (2,731) | (1.2) | 210,689 | ||||||||||||
| Financial assets held for trading | 176,921 | 156,118 | 20,803 | 13.3 | 116,953 | ||||||||||||
| Non-trading financial assets mandatorily at fair value through profit or loss | 5,910 | 5,713 | 197 | 3.4 | 5,536 | ||||||||||||
| Financial assets designated at fair value through profit or loss | 9,773 | 8,989 | 784 | 8.7 | 15,957 | ||||||||||||
| Financial assets at fair value through other comprehensive income | 83,308 | 85,239 | (1,931) | (2.3) | 108,038 | ||||||||||||
| Financial assets at amortized cost | 1,191,403 | 1,147,044 | 44,359 | 3.9 | 1,037,898 | ||||||||||||
| Hedging derivatives | 5,297 | 8,069 | (2,772) | (34.4) | 4,761 | ||||||||||||
| Changes in the fair value of hedged items in portfolio hedges of interest risk | (788) | (3,749) | 2,961 | (79.0) | 410 | ||||||||||||
| Investments | 7,646 | 7,615 | 31 | 0.4 | 7,525 | ||||||||||||
| Assets under insurance or reinsurance contracts | 237 | 308 | (71) | (23.1) | 283 | ||||||||||||
| Tangible assets | 33,882 | 34,073 | (191) | (0.6) | 33,321 | ||||||||||||
| Intangible assets | 19,871 | 18,645 | 1,226 | 6.6 | 16,584 | ||||||||||||
| Tax assets | 31,390 | 29,987 | 1,403 | 4.7 | 25,196 | ||||||||||||
| Other assets | 8,856 | 10,082 | (1,226) | (12.2) | 8,595 | ||||||||||||
| Non-current assets held for sale | 3,014 | 3,453 | (439) | (12.7) | 4,089 | ||||||||||||
| Total assets | 1,797,062 | 1,734,659 | 62,403 | 3.6 | 1,595,835 | ||||||||||||
| Liabilities and equity | |||||||||||||||||
| Financial liabilities held for trading | 122,270 | 115,185 | 7,085 | 6.2 | 79,469 | ||||||||||||
| Financial liabilities designated at fair value through profit or loss | 40,367 | 40,268 | 99 | 0.2 | 14,943 | ||||||||||||
| Financial liabilities at amortized cost | 1,468,703 | 1,423,858 | 44,845 | 3.1 | 1,349,169 | ||||||||||||
| Hedging derivatives | 7,656 | 9,228 | (1,572) | (17.0) | 5,463 | ||||||||||||
| Changes in the fair value of hedged items in portfolio hedges of interest rate risk | 55 | (117) | 172 | — | 248 | ||||||||||||
| Liabilities under insurance or reinsurance contracts | 17,799 | 16,426 | 1,373 | 8.4 | 18,560 | ||||||||||||
| Provisions | 8,441 | 8,149 | 292 | 3.6 | 9,583 | ||||||||||||
| Tax liabilities | 9,932 | 9,468 | 464 | 4.9 | 8,649 | ||||||||||||
| Other liabilities | 17,598 | 14,609 | 2,989 | 20.5 | 12,698 | ||||||||||||
| Liabilities associated with non-current assets held for sale | — | — | — | — | — | ||||||||||||
| Total liabilities | 1,692,821 | 1,637,074 | 55,747 | 3.4 | 1,498,782 | ||||||||||||
| Shareholders' equity | 130,443 | 124,732 | 5,711 | 4.6 | 119,649 | ||||||||||||
| Other comprehensive income | (35,020) | (35,628) | 608 | (1.7) | (32,719) | ||||||||||||
| Non-controlling interest | 8,818 | 8,481 | 337 | 4.0 | 10,123 | ||||||||||||
| Total equity | 104,241 | 97,585 | 6,656 | 6.8 | 97,053 | ||||||||||||
| Total liabilities and equity | 1,797,062 | 1,734,659 | 62,403 | 3.6 | 1,595,835 | ||||||||||||
350
Executive summary A | ||||||||||||||||||||||||||||||||||||||||||||||||||||||||||||||||||||||||||
| Loans and advances to customers (minus reverse repos) | Customer funds (deposits minus repos + mutual funds) | |||||||||||||||||||||||||||||||||||||||||||||||||||||||||||||||||||||||||
Credit performance reflects the impact of macroeconomic environment and rising interest rates on customer behaviour | Customer funds continued to grow year-on-year | |||||||||||||||||||||||||||||||||||||||||||||||||||||||||||||||||||||||||
| EUR 1,015 billion | -1% | EUR 1,177 billion | +4% | |||||||||||||||||||||||||||||||||||||||||||||||||||||||||||||||||||||||
è By segment: | è By product: | |||||||||||||||||||||||||||||||||||||||||||||||||||||||||||||||||||||||||
| Year-on-year decline in corporates, while loans to individuals remained stable | Increase in time deposits and mutual funds on the back of demand deposits | |||||||||||||||||||||||||||||||||||||||||||||||||||||||||||||||||||||||||
| Individuals | SMEs and corporates | CIB | Demand | Time | Mutual funds | |||||||||||||||||||||||||||||||||||||||||||||||||||||||||||||||||||||
| 0% | -1% | -6% | -7% | +30% | +13% | |||||||||||||||||||||||||||||||||||||||||||||||||||||||||||||||||||||
| A. 2023 vs. 2022 changes in constant euros. | ||||||||||||||||||||||||||||||||||||||||||||||||||||||||||||||||||||||||||
Loans and advances to customers
Loans and advances to customers totalled EUR 1,036,349 million in December 2023, remaining stable year-on-year.
For the purpose of analysing traditional commercial banking loans, the Group uses gross loans and advances to customers minus reverse repurchase agreements which amounted to EUR 1,014,953 million, which also remained stable year-on-year. To facilitate the analysis of Santander's management, as usual the comments below do not consider the exchange rate impact.
Gross loans and advances to customers, excluding reverse repurchase agreements and in constant euros, declined 1%, as follows:
•In Europe, volumes decreased 6%, with falls in almost all markets impacted by higher interest rates. Volumes fell 8% in Spain, 6% in Portugal and 6% in UK. On the other hand, volumes in Poland increased 5%, mainly due to double-digit growth in CIB.
•In North America, growth was 3%. In the US, lending grew 1% propelled by CIB and Multifamily, while lending in Mexico was up 6% with widespread rises across segments (except CIB).
•Growth in South America was 7%. In Argentina, lending increased 217% driven by SMEs, corporates and individuals. In Brazil, it climbed 6% owing to positive performance in SMEs and individuals. In Chile, loans increased 4% backed by individuals, CIB and consumer finance. In Uruguay, they rose 12% mainly driven by consumer and corporates.
•At DCB, volumes increased 8%, with generalized growth across countries (except the UK). Openbank's loans grew 16%.
| Loans and advances to customers | |||||||||||||||||
| EUR million | |||||||||||||||||
| Change | |||||||||||||||||
| 2023 | 2022 | Absolute | % | 2021 | |||||||||||||
| Commercial bills | 55,628 | 56,688 | (1,060) | (1.9) | 49,603 | ||||||||||||
| Secured loans | 554,375 | 565,609 | (11,234) | (2.0) | 542,404 | ||||||||||||
| Other term loans | 295,485 | 290,031 | 5,454 | 1.9 | 269,526 | ||||||||||||
| Finance leases | 38,723 | 39,833 | (1,110) | (2.8) | 38,503 | ||||||||||||
| Receivable on demand | 12,277 | 11,435 | 842 | 7.4 | 10,304 | ||||||||||||
| Credit cards receivable | 24,371 | 22,704 | 1,667 | 7.3 | 20,397 | ||||||||||||
| Impaired assets | 34,094 | 32,888 | 1,206 | 3.7 | 31,645 | ||||||||||||
| Gross loans and advances to customers (minus repurchase agreements) | 1,014,953 | 1,019,188 | (4,235) | (0.4) | 962,382 | ||||||||||||
| Repurchase agreements | 44,184 | 39,500 | 4,684 | 11.9 | 33,264 | ||||||||||||
| Gross loans and advances to customers | 1,059,137 | 1,058,688 | 449 | 0.0 | 995,646 | ||||||||||||
| Loan-loss allowances | 22,788 | 22,684 | 104 | 0.5 | 22,964 | ||||||||||||
| Net loans and advances to customers | 1,036,349 | 1,036,004 | 345 | 0.0 | 972,682 | ||||||||||||
351
| Gross loans and advances to customers (minus reverse repos) | ||
| EUR billion | ||
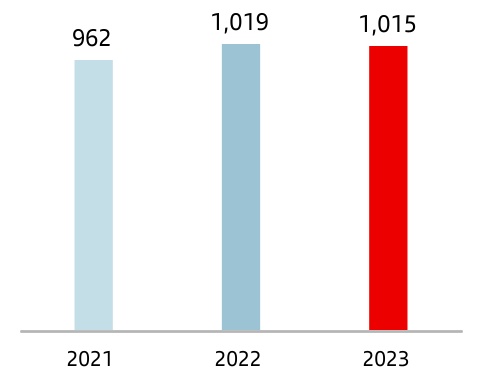
| 0 | % | A | |||
| 2023 vs. 2022 | |||||
A. In constant euros: -1%.
As of December 2023, gross loans and advances to customers minus reverse repurchase agreements maintained a balanced structure: individuals (63%), SMEs and corporates (24%) and CIB (13%).
At the end of 2023, 62% of loans and advances to customers maturing in more than a year had a fixed interest rate, while the other 38% had a floating interest rate:
•In Spain, 50% of loans and advances to customers were fixed rate and 50% were floating rate.
•Outside Spain, 66% of loans and advances to customers were fixed rate and 34% were floating rate.
| Gross loans and advances to customers (minus reverse repos) | ||
| % of operating areas. December 2023 | ||
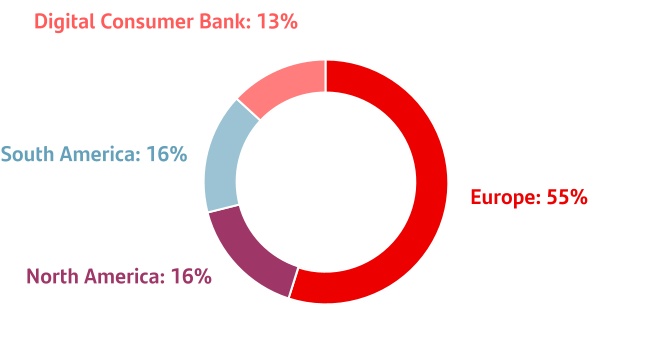
For more details on the distribution of loans and advances to customers by business line, see note 10.b to the consolidated financial statements.
Tangible assets amounted to EUR 33,882 million in December 2023, down EUR 191 million compared to December 2022.
Intangible assets stood at EUR 19,871 million, of which EUR 14,017 million corresponds to goodwill (which increased EUR 276 million) and EUR 5,854 million to other intangible assets, mostly IT developments (up EUR 950 million).
| Loans and advances to customers with maturities exceeding one year at 2023 year end | ||||||||||||||||||||||||||
| EUR million | ||||||||||||||||||||||||||
| Domestic | International | TOTAL | ||||||||||||||||||||||||
| Amount | Weight as % of the total | Amount | Weight as % of the total | Amount | Weight as % of the total | |||||||||||||||||||||
| Fixed | 78,163 | 50 | % | 376,339 | 66 | % | 454,502 | 62 | % | |||||||||||||||||
| Floating | 77,650 | 50 | % | 197,240 | 34 | % | 274,890 | 38 | % | |||||||||||||||||
| TOTAL | 155,813 | 100 | % | 573,579 | 100 | % | 729,392 | 100 | % | |||||||||||||||||
352
| Total customer funds | |||||||||||||||||
| EUR million | |||||||||||||||||
| Change | |||||||||||||||||
| 2023 | 2022 | Absolute | % | 2021 | |||||||||||||
| Demand deposits | 661,262 | 710,232 | (48,970) | (6.9) | 717,728 | ||||||||||||
| Time deposits | 307,085 | 236,099 | 70,986 | 30.1 | 146,469 | ||||||||||||
Mutual funds A | 208,528 | 184,054 | 24,474 | 13.3 | 188,096 | ||||||||||||
| Customer funds | 1,176,875 | 1,130,385 | 46,490 | 4.1 | 1,052,293 | ||||||||||||
Pension funds A | 14,831 | 14,021 | 810 | 5.8 | 16,078 | ||||||||||||
Managed portfolios A | 36,414 | 32,184 | 4,230 | 13.1 | 31,138 | ||||||||||||
| Repurchase agreements | 78,822 | 63,391 | 15,431 | 24.3 | 36,357 | ||||||||||||
| Total funds | 1,306,942 | 1,239,981 | 66,961 | 5.4 | 1,135,866 | ||||||||||||
A. Including managed and marketed funds.
Customer deposits grew 4% year-on-year to EUR 1,047,169 million at 31 of December 2023.
Santander uses customer funds (customer deposits, minus repurchase agreements, plus mutual funds) to analyse traditional retail banking funds, which stood at EUR 1,176,875 million and grew 4% year-on-year. To facilitate the analysis of Santander's management, as usual the comments below do not consider the exchange rate impact. Compared to December 2022, customer funds in constant euros rose 4%, as follows:
•By product, customer deposits minus repurchase agreements rose 2%, as higher interest rates resulted in a notable increase in time deposits (+30%), which grew significantly in all markets, to the detriment of demand deposits, which fell 7%. Mutual funds increased (+13%) in all markets (except the US).
| Customer funds (minus repos) | ||
| EUR billion | ||
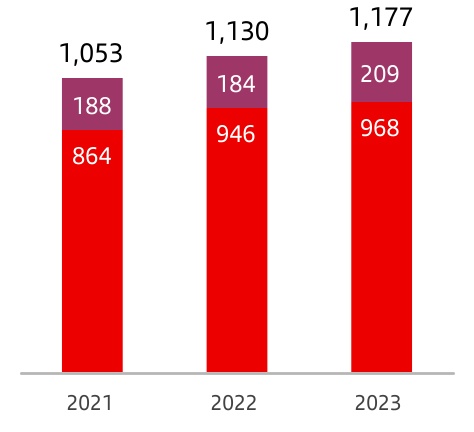
| +4 | % | A | |||
| +13 | % | ||||
| +2 | % | ||||
•Total | |||||
•Mutual fundsB | |||||
•Deposits minus repos | |||||
| 2023 vs. 2022 | |||||
A. In constant euros: +4%.
B. Including managed and marketed funds.
•Customer funds increased 17% in South America with growth in all markets (Argentina: +235%; Brazil: +14%; and Chile: +12%), increased 3% in North America (the US: -1% and Mexico: +10%), and fell 1% in Europe due to the decreases in Portugal (-4%), Spain (-2%), and the UK (-1%), offset by the increase in Poland (+8%).
•Positive performance in DCB, as customer funds increased 19%.
•By secondary segment, there was a solid performance across businesses, particularly Retail Banking and Wealth Management and Insurance.
The weight of demand deposits was 56% of total customer funds, while time deposits accounted for 26% and mutual funds 18%.
In addition to capturing customer deposits, the Group, for strategic reasons, has a selective policy on issuing securities in international fixed income markets and strives to adapt the frequency and volume of its market operations to the structural liquidity needs of each unit, as well as to the receptiveness of each market.
For more details on debt issuances and maturities, see section 3.4 'Liquidity and funding management' in this chapter.
| Customer funds (minus repos) | ||
| % of operating areas. December 2023 | ||
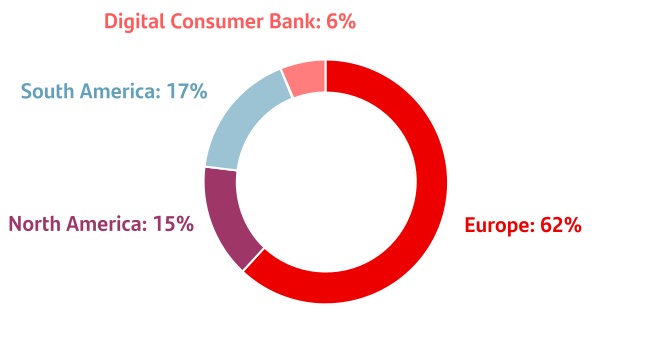
353
3.4 Liquidity and funding management
| Executive Summary | ||||||||||||||||||||||||||||||||||||||||||||||||||||||||||||||||||||
| Regulatory ratios | Debt issuances in 2023 | |||||||||||||||||||||||||||||||||||||||||||||||||||||||||||||||||||
| The LCR and NSFR ratios amply exceed regulatory requirements (both 100%) | We issued more than EUR 62 bn in debt in 2023, diversified by product, currency, country and maturity | |||||||||||||||||||||||||||||||||||||||||||||||||||||||||||||||||||
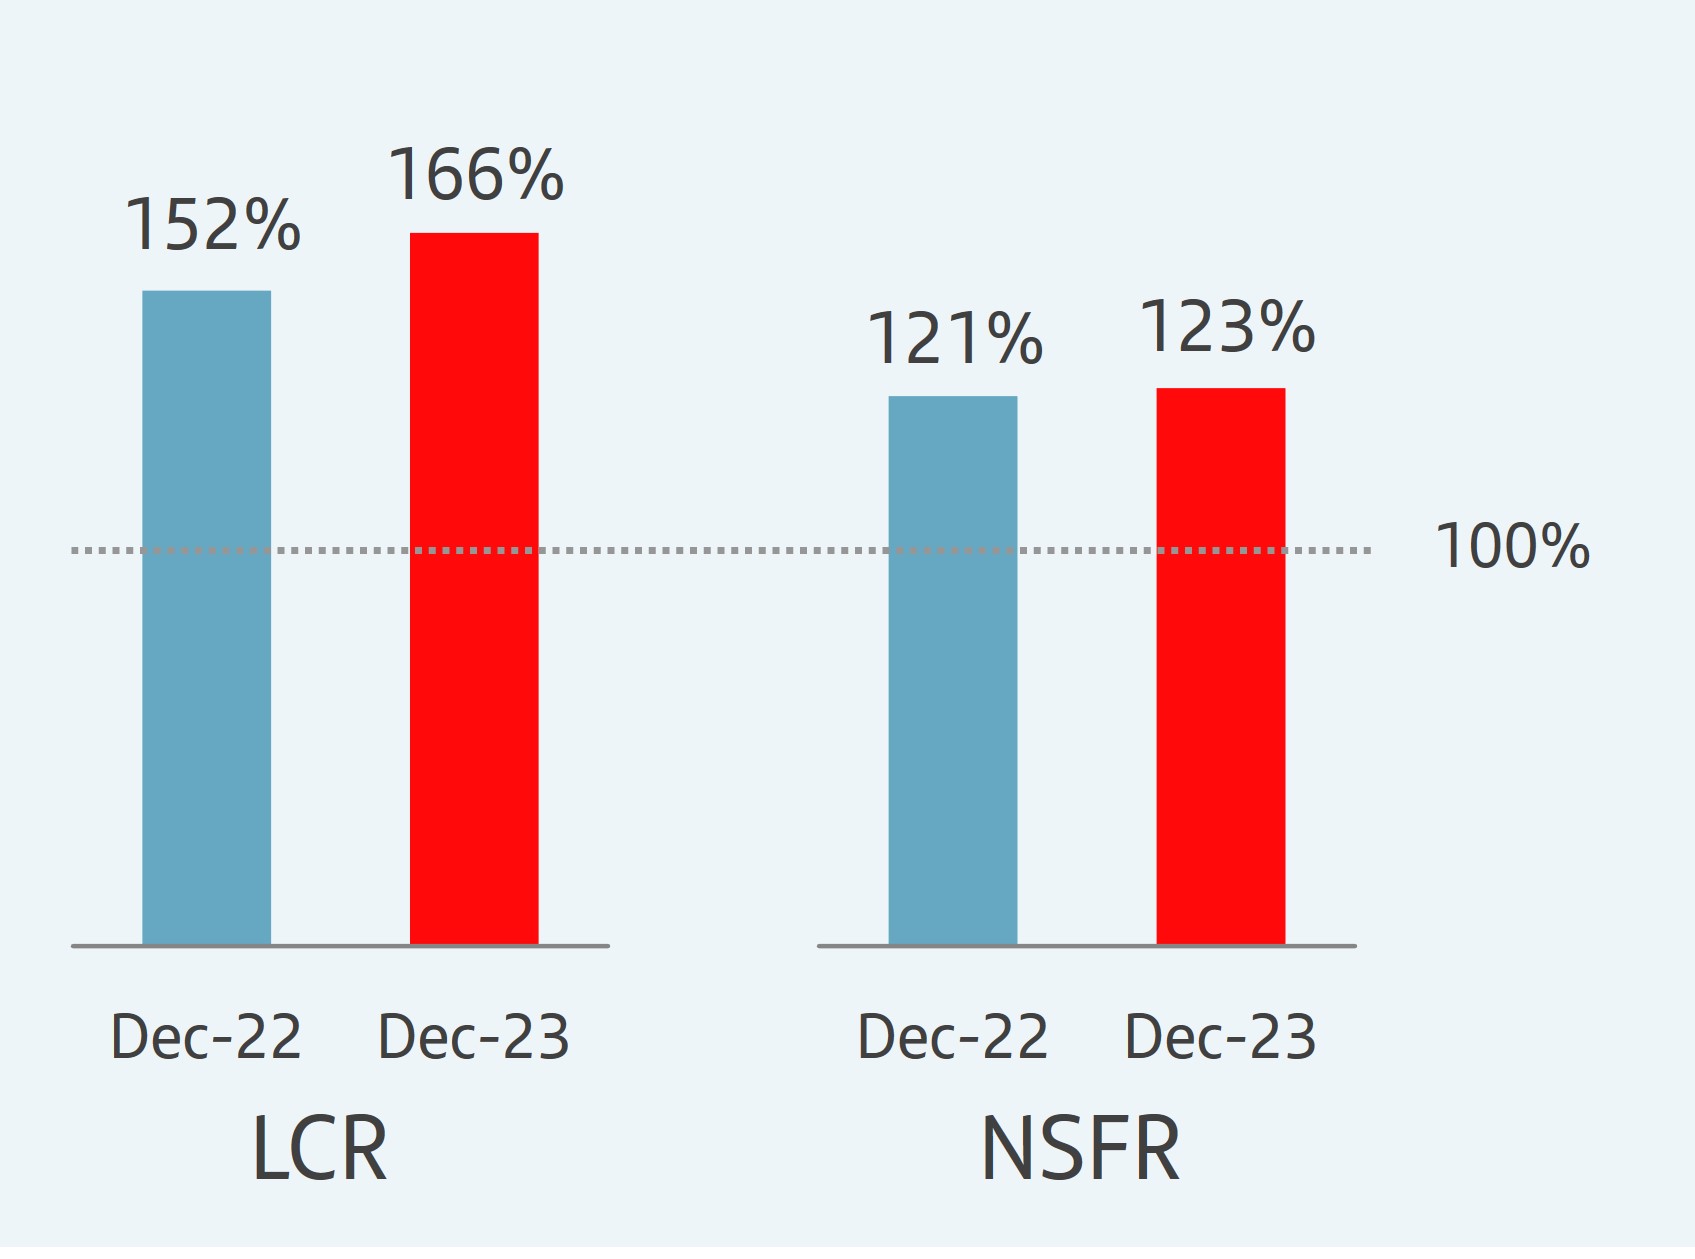 | EUR 44.5 bn | Medium- and long-term debt | ||||||||||||||||||||||||||||||||||||||||||||||||||||||||||||||||||
| EUR 19.9 bn | Securitizations | |||||||||||||||||||||||||||||||||||||||||||||||||||||||||||||||||||
| Comfortable and stable funding structure | ||||||||||||||||||||||||||||||||||||||||||||||||||||||||||||||||||||
| High contribution from customer deposits | ||||||||||||||||||||||||||||||||||||||||||||||||||||||||||||||||||||
| 99% | LTD ratio | |||||||||||||||||||||||||||||||||||||||||||||||||||||||||||||||||||
Liquidity management
Our structural liquidity management aims to optimize maturities and costs, and to avoid undesired liquidity risks in funding Santander’s operations.
It follows these principles:
•Decentralized liquidity model.
•Medium-and long-term (M/LT) funding needs must be covered by medium- and long-term instruments.
•High contribution from customer deposits due to the retail nature of the balance sheet.
•Wholesale funding sources diversified by instrument, investor, market, currency and maturity.
•Limited use of short-term funding.
•Sufficient liquidity reserves (including standing facilities/discount windows at central banks) to be used in adverse situations.
•Group and subsidiary-level compliance with regulatory liquidity requirements.
To apply these principles effectively across the Group, we developed a unique, three-pronged management framework:
•Organization and governance. Strict organization and governance that involve subsidiaries’ senior managers in decision-making and our global strategy. Decisions about structural risks, including liquidity and funding risk, falls on the local asset and liability committees (ALCOs), which coordinate with the global ALCO. The global ALCO is empowered by Banco Santander, S.A.'s board of directors under the corporate Asset and Liability Management (ALM) framework.
This enhanced governance model is part of our risk appetite framework, which meets regulatory and market standards for strong risk management and control systems.
•Balance sheet and liquidity risk. In-depth balance sheet analysis and liquidity risk measurement that support decisions
and controls to ensure liquidity levels cover short- and long-term needs with stable funding sources, and optimize funding costs.
Each subsidiary has a conservative risk appetite framework (based on their commercial strategy) which sets out the liquidity risk management framework. Subsidiaries must work within the framework limits to achieve their strategic objectives.
•Liquidity management adapted to the needs of each business. We prepare a liquidity plan every year to achieve:
•a solid balance sheet structure, with a diversified footprint in wholesale markets;
•stable liquidity buffers and limited asset encumbrance; and
•compliance with regulatory and other metrics included in each entity’s risk appetite statement.
We monitor all the plan's components throughout the year.
Santander continues to carry out the Internal Liquidity Adequacy Assessment Process (ILAAP) as part of its other risk management and strategic processes to measure liquidity in ordinary and stressed scenarios. The quantitative and qualitative items we consider are also inputs for the Supervisory Review and Evaluation Process (SREP).
Once a year, we must submit a board-approved ILAAP assessment to supervisors that demonstrates our funding and liquidity structures will remain solid in all scenarios and our internal processes will ensure sufficient liquidity (based on analyses that each subsidiary conducts according to local liquidity management models).
Our governance structure is robust and suited to identify, manage, monitor and control liquidity risks. It rests on common frameworks, conservative principles, clearly defined roles and responsibilities, a consistent committee structure, effective local lines of defence and well-coordinated corporate supervision.
354
We produce frequent, detailed liquidity monitoring reports for management, control and reporting purposes. We also regularly send the most relevant information to senior managers, the pertinent ALCOs the executive committee and the board of directors.
Over the last few years, Santander and each subsidiary have developed a comprehensive special situations management framework that centralizes our governance for such scenarios. It contains contingency funding plans that form part of our governance model, including feasible, pre-assessed actions that follow a defined timeline, are categorized and prioritized, and provide for sufficient liquidity and execution time to mitigate stress scenarios. For more details, see the '3.6 Special situations and resolution' section
Funding strategy and liquidity in 2023
Funding strategy and structure
Our funding strategy is focused on extending our management model to all subsidiaries.
It is based on a model of autonomous subsidiaries that are responsible for covering their own liquidity needs. This enables our solid retail banking model to maintain sound liquidity positions in the Group and our core country units, even amid market stress.
We have had to adapt funding strategies to business trends, market conditions and new regulations. In 2023, we improved specific aspects, without significant changes in liquidity management or funding policies and practices. We believe this will enable us to start 2024 from a strong position and with no growth restrictions.
Our subsidiaries continue to apply the same funding and liquidity management strategies to:
•maintain sufficient and stable medium- and long-term wholesale funding levels;
•ensure the right volume of assets that can be discounted in central banks as part of the liquidity buffer; and
•generate liquidity from the retail business.
We believe these developments provide Santander with a very strong funding structure with the following characteristics:
•Customer deposits are our main funding source. They are highly stable because they mainly arise from retail customer activity. At the end of December 2023, they represented just over two thirds of net liabilities (i.e. of the liquidity balance sheet) and more than 100% of loans and advances to customers. Their weight (as a percentage of loans and advances to customers) increased year-on-year. For more details, see the section Liquidity in 2023.
| Group's liquidity balance sheet | ||
| %. December 2023 | ||
Financial assets | |||||
Fixed assets & other | |||||
Loans and advances to customers | |||||
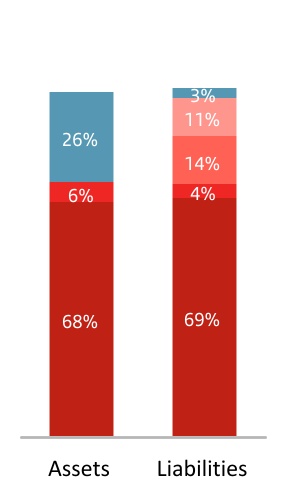
| n | ST funding | ||||
| n | Equity and other | ||||
| n | M/LT debt issuance | ||||
| n | Securitizations and others | ||||
| n | Customer deposits | ||||
Note: Liquidity balance sheet for management purposes is the consolidated balance sheet, net of trading derivatives and interbank balances. For more information on the consolidated balance sheet, see the 'Consolidated financial statements' chapter.
•M/LT funding (including M/LT issuances and securitizations) accounted for nearly 18% of net liabilities at the end of 2023 (similar to 2022).
The outstanding balance of M/LT debt issued (to third parties) at the end of 2023 was EUR 206,190 million. Our maturity profile is comfortable and well balanced by instruments and markets with a weighted average maturity of 4.1 years (slightly below average maturity of 4.3 years at the end of 2022).
These tables show our funding by instrument over the past three years and by maturity profile:
355
Group. Stock of medium- and long-term debt issuances A | |||||||||||
| EUR million | |||||||||||
| 2023 | 2022 | 2021 | |||||||||
| Preferred | 9,892 | 8,693 | 10,238 | ||||||||
| Subordinated | 20,708 | 17,573 | 16,953 | ||||||||
| Senior debt | 125,951 | 116,350 | 104,553 | ||||||||
| Covered bonds | 49,639 | 44,073 | 41,908 | ||||||||
| Total | 206,190 | 186,689 | 173,652 | ||||||||
A. Placed in markets. Does not include securitizations, agribusiness notes and real estate credit notes.
| Group. Distribution by contractual maturity. December 2023 | |||||||||||||||||||||||||||||
| EUR million | |||||||||||||||||||||||||||||
0-1 month | 1-3 months | 3-6 months | 6-9 months | 9-12 months | 12-24 months | 2-5 years | more than 5 years | Total | |||||||||||||||||||||
| Preferred | — | — | — | — | — | — | — | 9,892 | 9,892 | ||||||||||||||||||||
| Subordinated | — | — | — | — | — | 3,370 | 5,678 | 11,660 | 20,708 | ||||||||||||||||||||
| Senior debt | 524 | 2,193 | 12,327 | 2,529 | 2,842 | 25,471 | 53,375 | 26,691 | 125,951 | ||||||||||||||||||||
| Covered bonds | 100 | 1,105 | 2,310 | 540 | 3,654 | 4,613 | 24,810 | 12,506 | 49,639 | ||||||||||||||||||||
| Total | 624 | 3,298 | 14,637 | 3,068 | 6,496 | 33,454 | 83,863 | 60,750 | 206,190 | ||||||||||||||||||||
Note: There are no additional guarantees for any of the debt issued by the Group’s subsidiaries.
In addition to M/LT wholesale debt issuances, we have securitizations placed in the market as well as collateralized and other specialist funding totalling EUR 59,450 million (including EUR 14,400 million in debt instruments placed with private banking clients in Brazil). The average maturity was around 1.7 years.
This chart shows the similarity of the geographic breakdown of our loans and advances to customers and M/LT wholesale funding across our footprint. This distribution is very similar to 2022.
| Loans and advances to customers and M/LT wholesale funding | ||
| %. December 2023 | ||
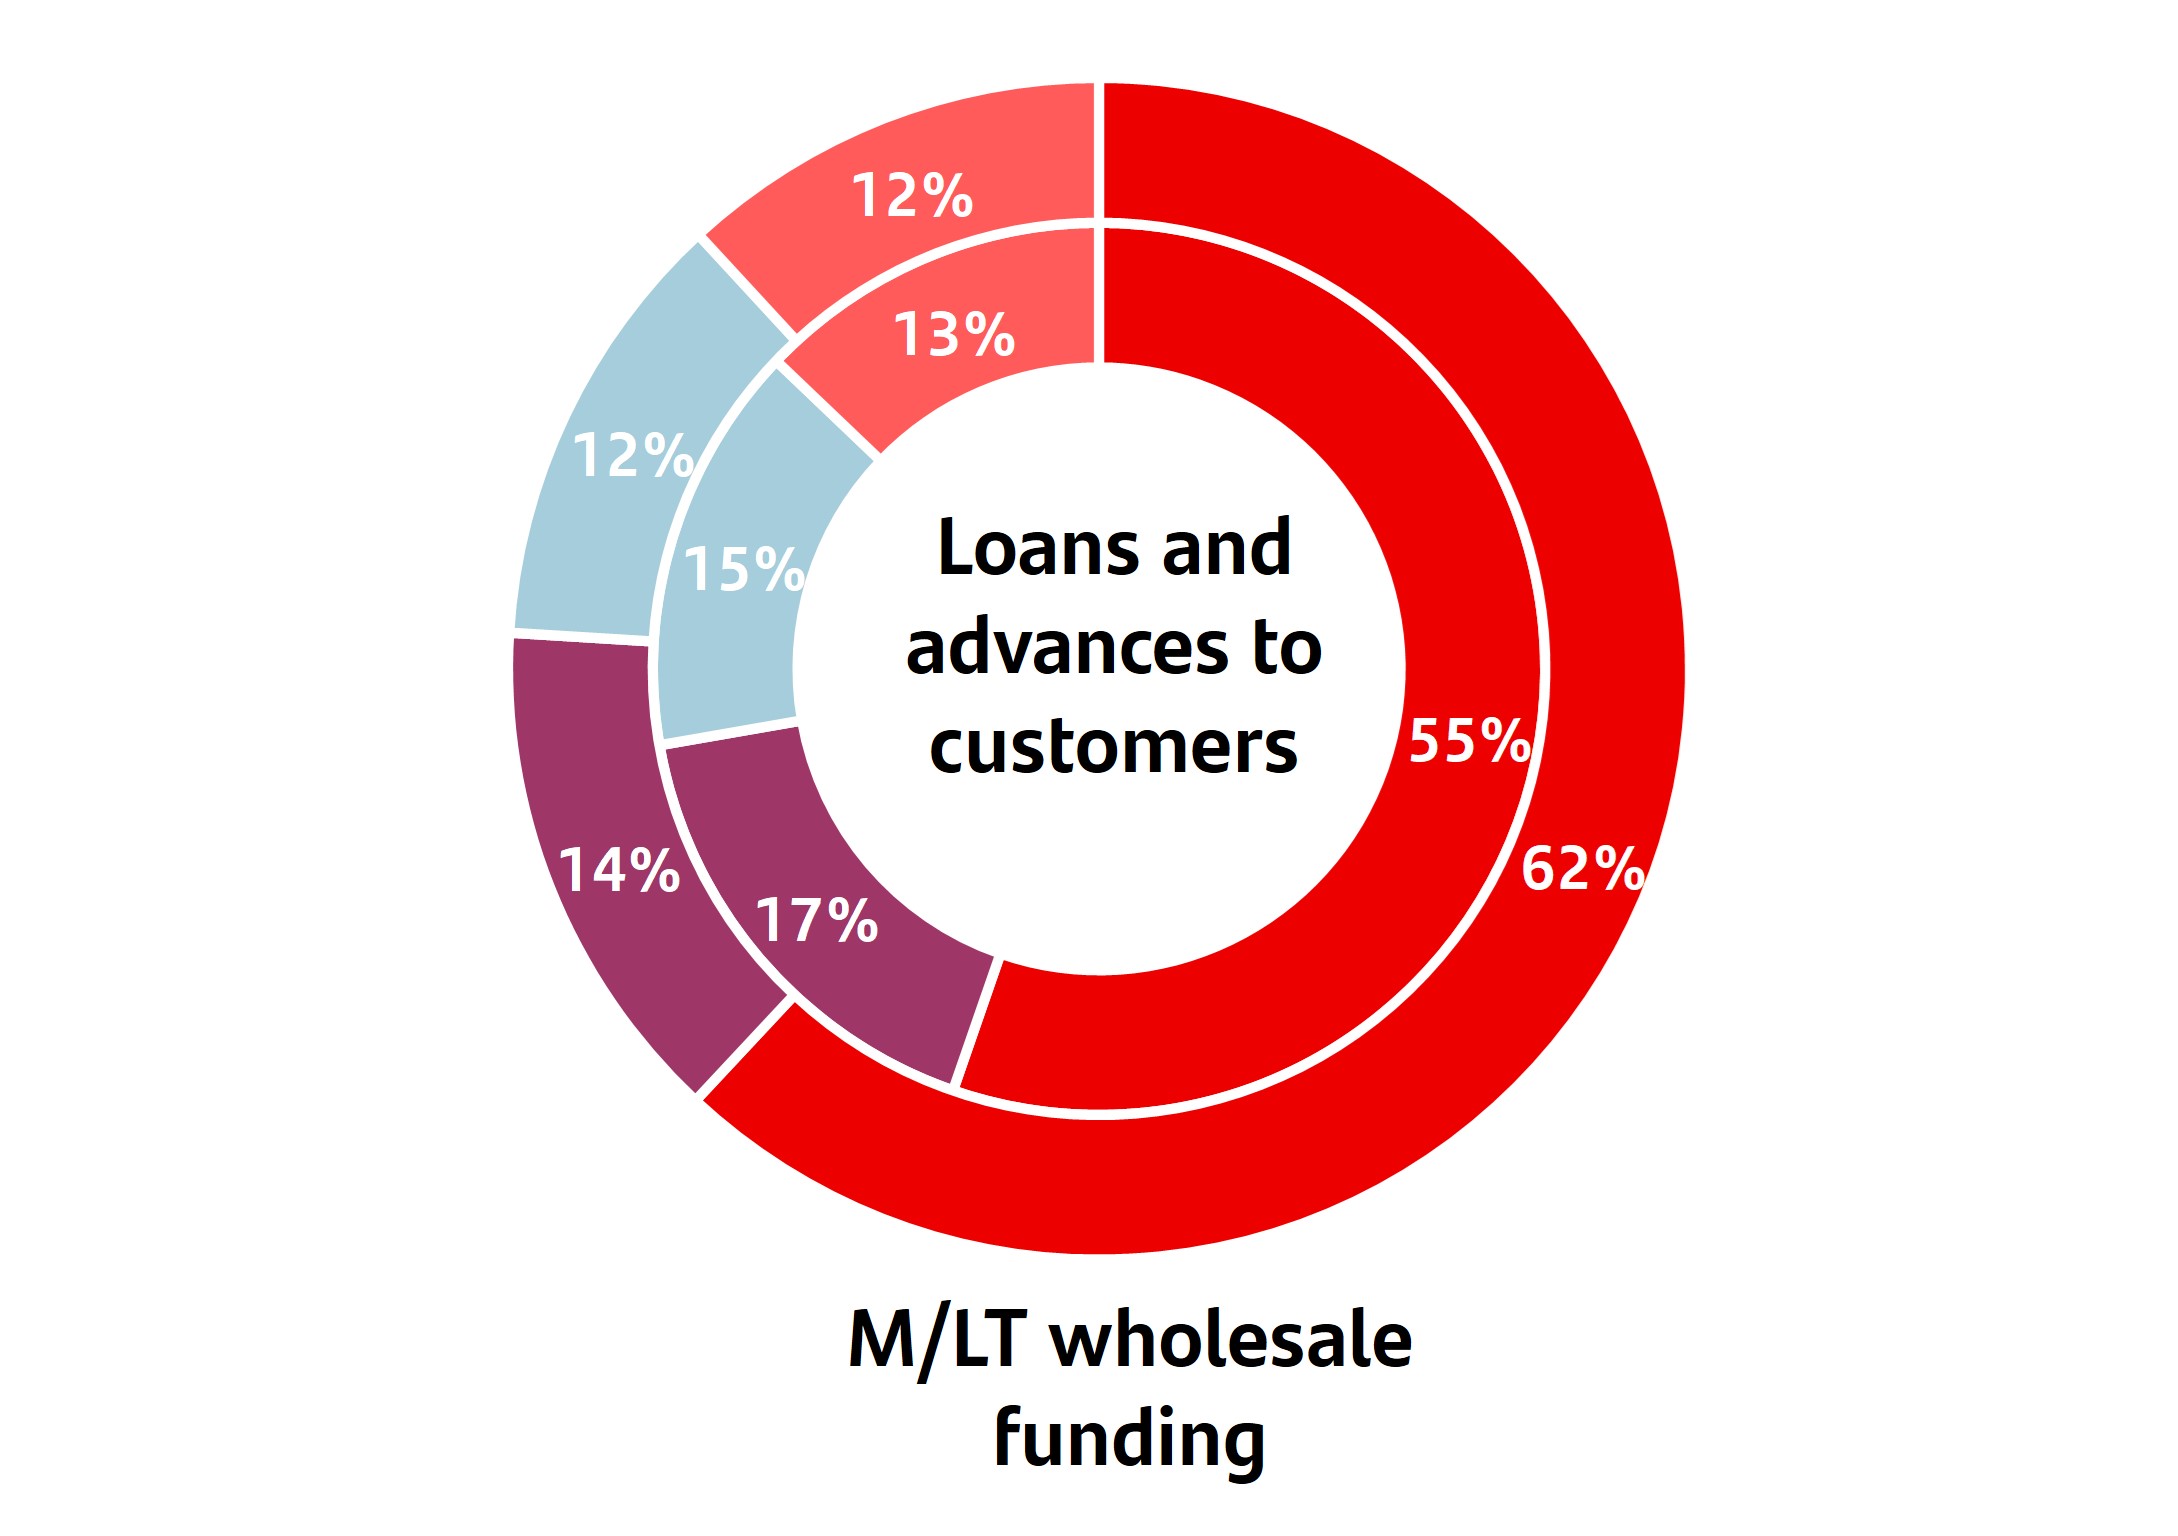 | |||||||||||
| Europe | |||||||||||
| North America | |||||||||||
| South America | |||||||||||
| DCB | |||||||||||
Wholesale funding from short-term issuance programmes is a residual part of Santander’s funding structure, which is related to treasury activities and is comfortably covered by liquid assets.
The outstanding short-term wholesale funding balance at the end of 2023 was EUR 47,281 million, of which 52% was in European Commercial Paper, US Commercial Paper and domestic programmes issued by Banco Santander, S.A.; 10% in certificates of deposit and commercial paper programmes in the UK; 28% in Santander Consumer Finance (SCF) commercial paper programmes; and 10% in issuance programmes in other subsidiaries.
Liquidity in 2023
The key liquidity takeaways from 2023 were:
•basic liquidity ratios remained at comfortable levels;
•regulatory liquidity ratios were well above minimum requirements; and
•our asset encumbrance from funding operations was moderate.
In order to tackle high inflation and return it to more normalized levels, central banks continued to withdraw stimulus measures and raise rate in 2023. However, at the end of 2023, the central banks in Poland, Brazil and Chile began to cut official interest rates.
Santander continued to repay ECB TLTRO-III funding while strengthening balance sheets through a combination of customer deposit growth, an increase in short-term instruments and greater activity in medium- and long-term issuances, with the objective of maintaining regulatory liquidity ratios and internal metrics at prudent levels after repayment.
In the weeks following the regional banks crisis in the US and the Credit Suisse intervention, the Group strengthened its
356
supervision and coordination and monitored the liquidity situation and presented it to senior executives daily, under the special situations framework. During this time, liquidity remained solid in all the Group's units, including the UK and the US (followed more closely), and there were no significant impacts from the crisis.
During 2023, our liquidity position remained solid and commercial activity was not a significant drain on liquidity.
i. Basic liquidity ratios at comfortable levels
At the end of 2023, Santander recorded:
•A credit to net assets ratio (i.e. total assets minus trading derivatives and inter-bank balances) of 68%, slightly lower than previous years. Such a high level compared to our competitors in Europe speaks to the retail nature of our balance sheet.
•A net loan-to-deposit ratio (LTD) of 99%, a very comfortable level (well below 120%) and lower than 2022 year-end. As a result of the tightening of financial conditions due to inflation-fighting monetary policies, credit fell in constant euros across most of our European footprint (except in Poland and DCB) as households and companies repaid debt early. Credit in the US remained relatively stable while there was growth in Mexico and South America. Deposits showed similar trends.
•A customer deposit plus M/LT funding to net loans and advances ratio of 127%, slightly above the 121% in 2022.
•Limited recourse to short-term wholesale funding (around 3% of total funding), in line with previous years.
•An average structural surplus balance, defined as the excess of structural funding sources (deposits, M/LT funding and capital) against structural liquidity needs from fixed assets and loans, of EUR 308,315 million in the year.
The consolidated structural surplus stood at EUR 346,174 million at year-end. Fixed-income assets (EUR 217,334 million), equities (EUR 17,076 million) and net interbank and central bank deposits (EUR 159,045 million) were partly offset by short-term wholesale funding (-EUR 47,281 million). This totalled around 23% of our net liabilities (slightly up from the end of 2022).
This table shows Santander’s basic liquidity monitoring metrics in recent years:
| Group’s liquidity monitoring metrics | |||||||||||
| % | |||||||||||
| 2023 | 2022 | 2021 | |||||||||
Loans A / Net assets | 68 | % | 72 | % | 75 | % | |||||
Loan A -to-deposit ratio (LTD) | 99 | % | 103 | % | 108 | % | |||||
Customer deposits and medium-and long-term funding / Loans A | 127 | % | 121 | % | 115 | % | |||||
| Short-term wholesale funding / Net liabilities | 3 | % | 3 | % | 2 | % | |||||
| Structural liquidity surplus (% of net liabilities) | 23 | % | 19 | % | 16 | % | |||||
A. Net loans and advances to customers.
The table below shows the principal liquidity ratios of our main subsidiaries at the end of 2023:
| Main subsidiaries' liquidity metrics | ||||||||
| %. December 2023 | ||||||||
LTD ratio (loans A / deposits) | Deposits + M/LT funding / Loans A | |||||||
| Spain | 74 | % | 147 | % | ||||
| United Kingdom | 105 | % | 110 | % | ||||
| Portugal | 101 | % | 112 | % | ||||
| Poland | 76 | % | 137 | % | ||||
| United States | 104 | % | 122 | % | ||||
| Mexico | 89 | % | 121 | % | ||||
| Brazil | 88 | % | 138 | % | ||||
| Chile | 144 | % | 92 | % | ||||
| Argentina | 58 | % | 172 | % | ||||
| Digital Consumer Bank | 191 | % | 76 | % | ||||
| Group | 99 | % | 127 | % | ||||
A. Net loans and advances to customers.
In 2023, the key drivers of Santander's and its subsidiaries' liquidity (in constant euros, i.e. excluding exchange rate impact) were:
•Minimal impact from the retail funding gap on liquidity.
•Issuance activity remained high and, overall, was in line with our funding plan for the year. We issued less in South America than originally planned as deposits grew more than credit while we were more active in capital markets in Europe and DCB.
In 2023, Santander issued EUR 64,419 million in M/LT funding (at year-average exchange rates).
By instrument, issuances of M/LT fixed income debt (i.e. covered bonds, senior debt, subordinated debt and capital hybrid instruments) increased by around 12% to EUR 44,478 million in the year. Greater activity in hybrid instruments somewhat offset lower senior debt issuances (mainly TLAC eligible) compared to 2022. The volume of covered bond issuances in 2023 was similar to the previous year. Securitizations and structured finance totalled EUR 19,942 million in 2023, a 13% increase year-on-year.
Spain issued by far the most M/LT fixed income debt (excluding securitizations), followed by DCB and the UK. Spain and DCB Bank registered the highest absolute increases in the year. The main year-on-year decrease occurred in the UK.
SC USA and SCF were the main issuers of securitizations.
357
The charts below show issuances in the year by instrument and region:
| Distribution by instrument and region | ||
| %. December 2023 | ||
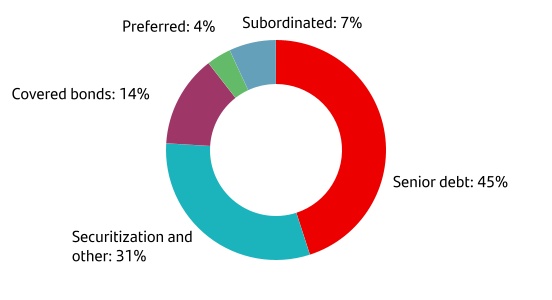
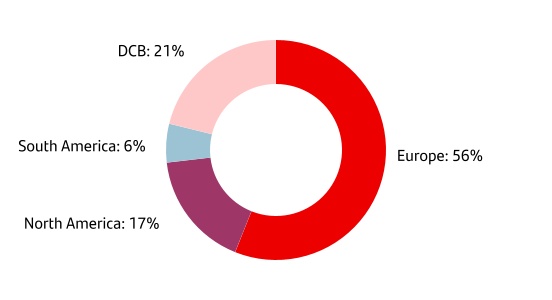
The issuance of eligible hybrid instruments, such as AT1 or subordinated debt, depends on risk-weighted asset growth. We had to issue these instruments in 2023, contributing to a lower overall weight of senior debt in the year. In 2023, senior debt accounted for 45% of total issuances compared to 53% in 2022. The weight of bonds and securitizations remained similar to 2022.
In 2023, at average exchange rates, the Group issued EUR 13,987 million in TLAC eligible instruments, including EUR 7,217 million in senior non-preferred debt from Banco Santander, S.A. and Poland and senior preferred from the holdings in the UK and the US; EUR 4,458 million in subordinated debt issued from Banco Santander, S.A. and Brazil; and EUR 2,313 million of AT1 eligible hybrid instruments were issued from Banco Santander, S.A.
We retained comfortable access to all our markets having issued and securitized debt in 15 currencies, involving 25 major issuers from 14 countries and an average maturity of 4.8 years (slightly above the 4.1 years in 2022).
ii. Compliance with regulatory liquidity ratios
Within the liquidity management model, Santander manages implementation, monitoring and compliance with the liquidity requirements established under international financial regulations.
Liquidity Coverage Ratio (LCR)
As the regulatory LCR requirement has been at the maximum level of 100% since 2018, we set a risk appetite of 110% at the consolidated and subsidiary level.
Our strong short-term liquidity base and our core subsidiaries’ autonomous management helped us maintain compliance levels well above 100% (both at the Group and subsidiary level) throughout the year. Our LCR in December 2023 was 166%, well above the regulatory requirement.
This table shows that all our subsidiaries substantially exceeded the required minimum in 2023 and the comparison versus 2022. Santander UK’s figures only include activities that the Financial Services and Markets Act 2000 leaves within the Ring-Fenced Bank.
| Liquidity Coverage Ratio (LCR) | ||||||||
| % | ||||||||
| December 2023 | December 2022 | |||||||
| Parent bank | 159 | % | 147 | % | ||||
| United Kingdom | 159 | % | 157 | % | ||||
| Portugal | 150 | % | 132 | % | ||||
| Poland | 221 | % | 178 | % | ||||
| United States | 138 | % | 125 | % | ||||
| Mexico | 171 | % | 197 | % | ||||
| Brazil | 154 | % | 127 | % | ||||
| Chile | 207 | % | 189 | % | ||||
| Argentina | 226 | % | 235 | % | ||||
| Santander Consumer Finance | 357 | % | 241 | % | ||||
| Group | 166 | % | 152 | % | ||||
358
NSFR (Net Stable Funding Ratio)
Regulation (EU) 2019/876 of the European Parliament dictated that entities must have a net stable funding ratio greater than 100% from June 2021.
The NSFR is a structural measure that gives banks an incentive to ensure long-term stability and proper management of maturity mismatches by funding long-term assets with long-term liabilities. It is the quotient of available stable funding (ASF) and required stable funding (RSF).
ASF comprises sources of funding (i.e. capital and other liabilities) considered stable over one year. As RSF primarily refers to any asset deemed illiquid over one year, it needs to be matched with stable sources of funding.
The risk appetite limit for the NSFR is set at 103% at the consolidated and subsidiary level.
The high weight of customer deposits (which are more stable); permanent liquidity needs deriving from commercial activity funded by medium- and long-term instruments; and limited recourse to short-term funding help maintain our balanced liquidity structure as reflected in our consolidated and subsidiary NSFRs which all exceeded 100% in December 2023.
The following table provides details by entity as well as a comparison with 2022. Santander UK’s figures only include activities that the Financial Services and Markets Act 2000 leaves within the Ring-Fenced Bank. All figures were calculated using European regulations.
| Net Stable Funding Ratio | ||||||||
| % | ||||||||
| December 2023 | December 2022 | |||||||
| Parent bank | 117 | % | 116 | % | ||||
| United Kingdom | 138 | % | 137 | % | ||||
| Portugal | 117 | % | 116 | % | ||||
| Poland | 157 | % | 146 | % | ||||
| United States | 117 | % | 109 | % | ||||
| Mexico | 129 | % | 120 | % | ||||
| Brazil | 113 | % | 112 | % | ||||
| Chile | 115 | % | 117 | % | ||||
| Argentina | 202 | % | 195 | % | ||||
| Santander Consumer Finance | 111 | % | 109 | % | ||||
| Group | 123 | % | 121 | % | ||||
iii. Asset Encumbrance
Santander’s use of assets as collateral in structural balance sheet funding sources is moderate.
Per the 2014 European Banking Authority (EBA) guidelines on disclosure of encumbered and unencumbered assets, the concept of asset encumbrance includes on-balance-sheet assets pledged as collateral in operations to obtain liquidity, off-balance-sheet assets received and reused for a similar purpose, and other assets with liabilities for reasons other than funding.
The tables below show the asset encumbrance data we must submit to the EBA as of December 2023.
On-balance-sheet encumbered assets amounted to EUR 306.3 billion, of which 61% were loans and advances (e.g. mortgages and corporate loans). Off-balance-sheet encumbrance stood at EUR 138.8 billion and mainly related to debt securities received as collateral in reverse repurchase agreements and reused ('rehypothecated').
In total, encumbered assets amounted to EUR 445.2 billion, giving rise to associated liabilities of EUR 330.6 billion.
At the end of 2023, total asset encumbrance in funding operations was 22.4% of the Group's extended balance sheet under EBA criteria (total assets plus guarantees received: EUR 1,987.1 billion), similar to 2022.
359
| Group. Disclosure on asset encumbrance as at December 2023 | ||||||||||||||
| EUR billion | ||||||||||||||
| Carrying amount of encumbered assets | Fair value of encumbered assets | Carrying amount of unencumbered assets | Fair value of unencumbered assets | |||||||||||
| Assets | 306.3 | — | 1,490.7 | — | ||||||||||
| Loans and advances | 186.4 | — | 1,172.2 | — | ||||||||||
| Equity instruments | 9.4 | 9.4 | 11.5 | 11.5 | ||||||||||
| Debt instruments | 86.8 | 87.6 | 156.4 | 156.1 | ||||||||||
| Other assets | 23.7 | — | 150.6 | — | ||||||||||
| Group. Collateral received as at December 2023 | ||||||||
| EUR billion | ||||||||
| Fair value of encumbered collateral received or own debt securities issued | Fair value of collateral received or own debt securities issued available for encumbrance | |||||||
| Collateral received | 138.8 | 51.3 | ||||||
| Loans and advances | 1.1 | — | ||||||
| Equity instruments | 5.5 | 8.7 | ||||||
| Debt instruments | 132.2 | 42.5 | ||||||
| Other collateral received | — | 0.1 | ||||||
| Own debt securities issued other than own covered bonds or ABSs | — | 1.9 | ||||||
| Group. Encumbered assets/collateral received and associated liabilities as at December 2023 | ||||||||
| EUR billion | ||||||||
Matching liabilities, contingent liabilities or securities lent | Assets, collateral received and own debt securities issued other than covered bonds and ABSs encumbered | |||||||
| Total sources of encumbrance (carrying amount) | 330.6 | 445.2 | ||||||
Rating agencies
Rating agencies influence Santander’s access to wholesale funding markets and the cost of its issuances.
The agencies listed below regularly review our ratings. Debt ratings depend on several internal factors (business model, strategy, capital, income generation capacity, liquidity, ESG related factors, etc.) but also on external factors related to economic conditions, the industry and sovereign risk across our footprint.
The agencies' methodologies limit ratings in some cases to the sovereign's rating of the country where the bank is headquartered. However, as a testament of our financial strength and diversification, Moody’s, DBRS and Standard & Poor’s (S&P) still rate Banco Santander, S.A. above the Kingdom of Spain's (where it is headquartered) sovereign rating while Fitch rates them equally.
At the end of 2023, the ratings from the main agencies were:
| Rating agencies | |||||||||||
| Long term | Short term | Outlook | |||||||||
| DBRS | A (High) | R-1 (Middle) | Stable | ||||||||
| Fitch Ratings | A-(SeniorA) | F2 (Senior F1) | Stable | ||||||||
| Moody's | A2 | P-1 | Stable | ||||||||
| Standard & Poor's | A+ | A-1 | Stable | ||||||||
| Scope | AA- | S-1+ | Stable | ||||||||
| JCR Japan | A+ | — | Stable | ||||||||
In March 2022, S&P Global ratings confirmed the Kingdom of Spain's A rating and upgraded its outlook to stable. At the same time, it confirmed Banco Santander S.A.'s rating and upgraded its outlook to stable.
In 2023, all the rating agencies left their ratings and outlooks for Santander unchanged.
Going forward, improvements to Santander's ratings from S&P and Moody's will heavily depend on the Kingdom of Spain's rating.
360
Funding outlook for 2024
Santander has begun 2024 with a strong liquidity position, having already repaid more than 85% of ECB funding. The funding outlook for the year is positive, despite lingering uncertainties due to the macroeconomic and geopolitical landscape.
We expect lending to rise moderately in all our core markets, coupled with a solid performance in deposits leading to limited demand for liquidity from our retail business.
Maturities in the coming quarters are manageable, aided by limited recourse to short-term funding and an active medium- and long-term issuance dynamic. We will manage each country and optimize liquidity to maintain a solid balance sheet structure across our footprint.
Our funding plans consider costs and diversification by instrument, country and market as well as the construction of liability buffers with loss-absorbing capacity in resolution (whether capital eligible or not). We design them to ensure Santander and its subsidiaries satisfy regulatory requirements and those stemming from our risk appetite framework.
Santander has been very active at the beginning of 2024. Banco Santander, S.A. pre-funded EUR 9.2 billion in 2023. In January 2024, the main issuers in the Group (Banco Santander, S.A., Santander UK, Santander Consumer Finance and Santander Holdings USA) had already issued EUR 10.6 billion, which, together with the pre-funding amounts to EUR 19.8 billion, over half of their total funding plan for the year.
361
3.5 Capital management and adequacy. Solvency ratios
| Executive summary | ||||||||||||||||||||||||||||||||||||||||||||||||||||||||||||||||||||||||||||||||||||||||||||||||||
| Fully-loaded capital ratio | Fully-loaded CET1 | |||||||||||||||||||||||||||||||||||||||||||||||||||||||||||||||||||||||||||||||||||||||||||||||||
| The fully-loaded CET1 ratio remained above 12% in every quarter in 2023 | Strong organic generation driven by higher profit | |||||||||||||||||||||||||||||||||||||||||||||||||||||||||||||||||||||||||||||||||||||||||||||||||
| % | 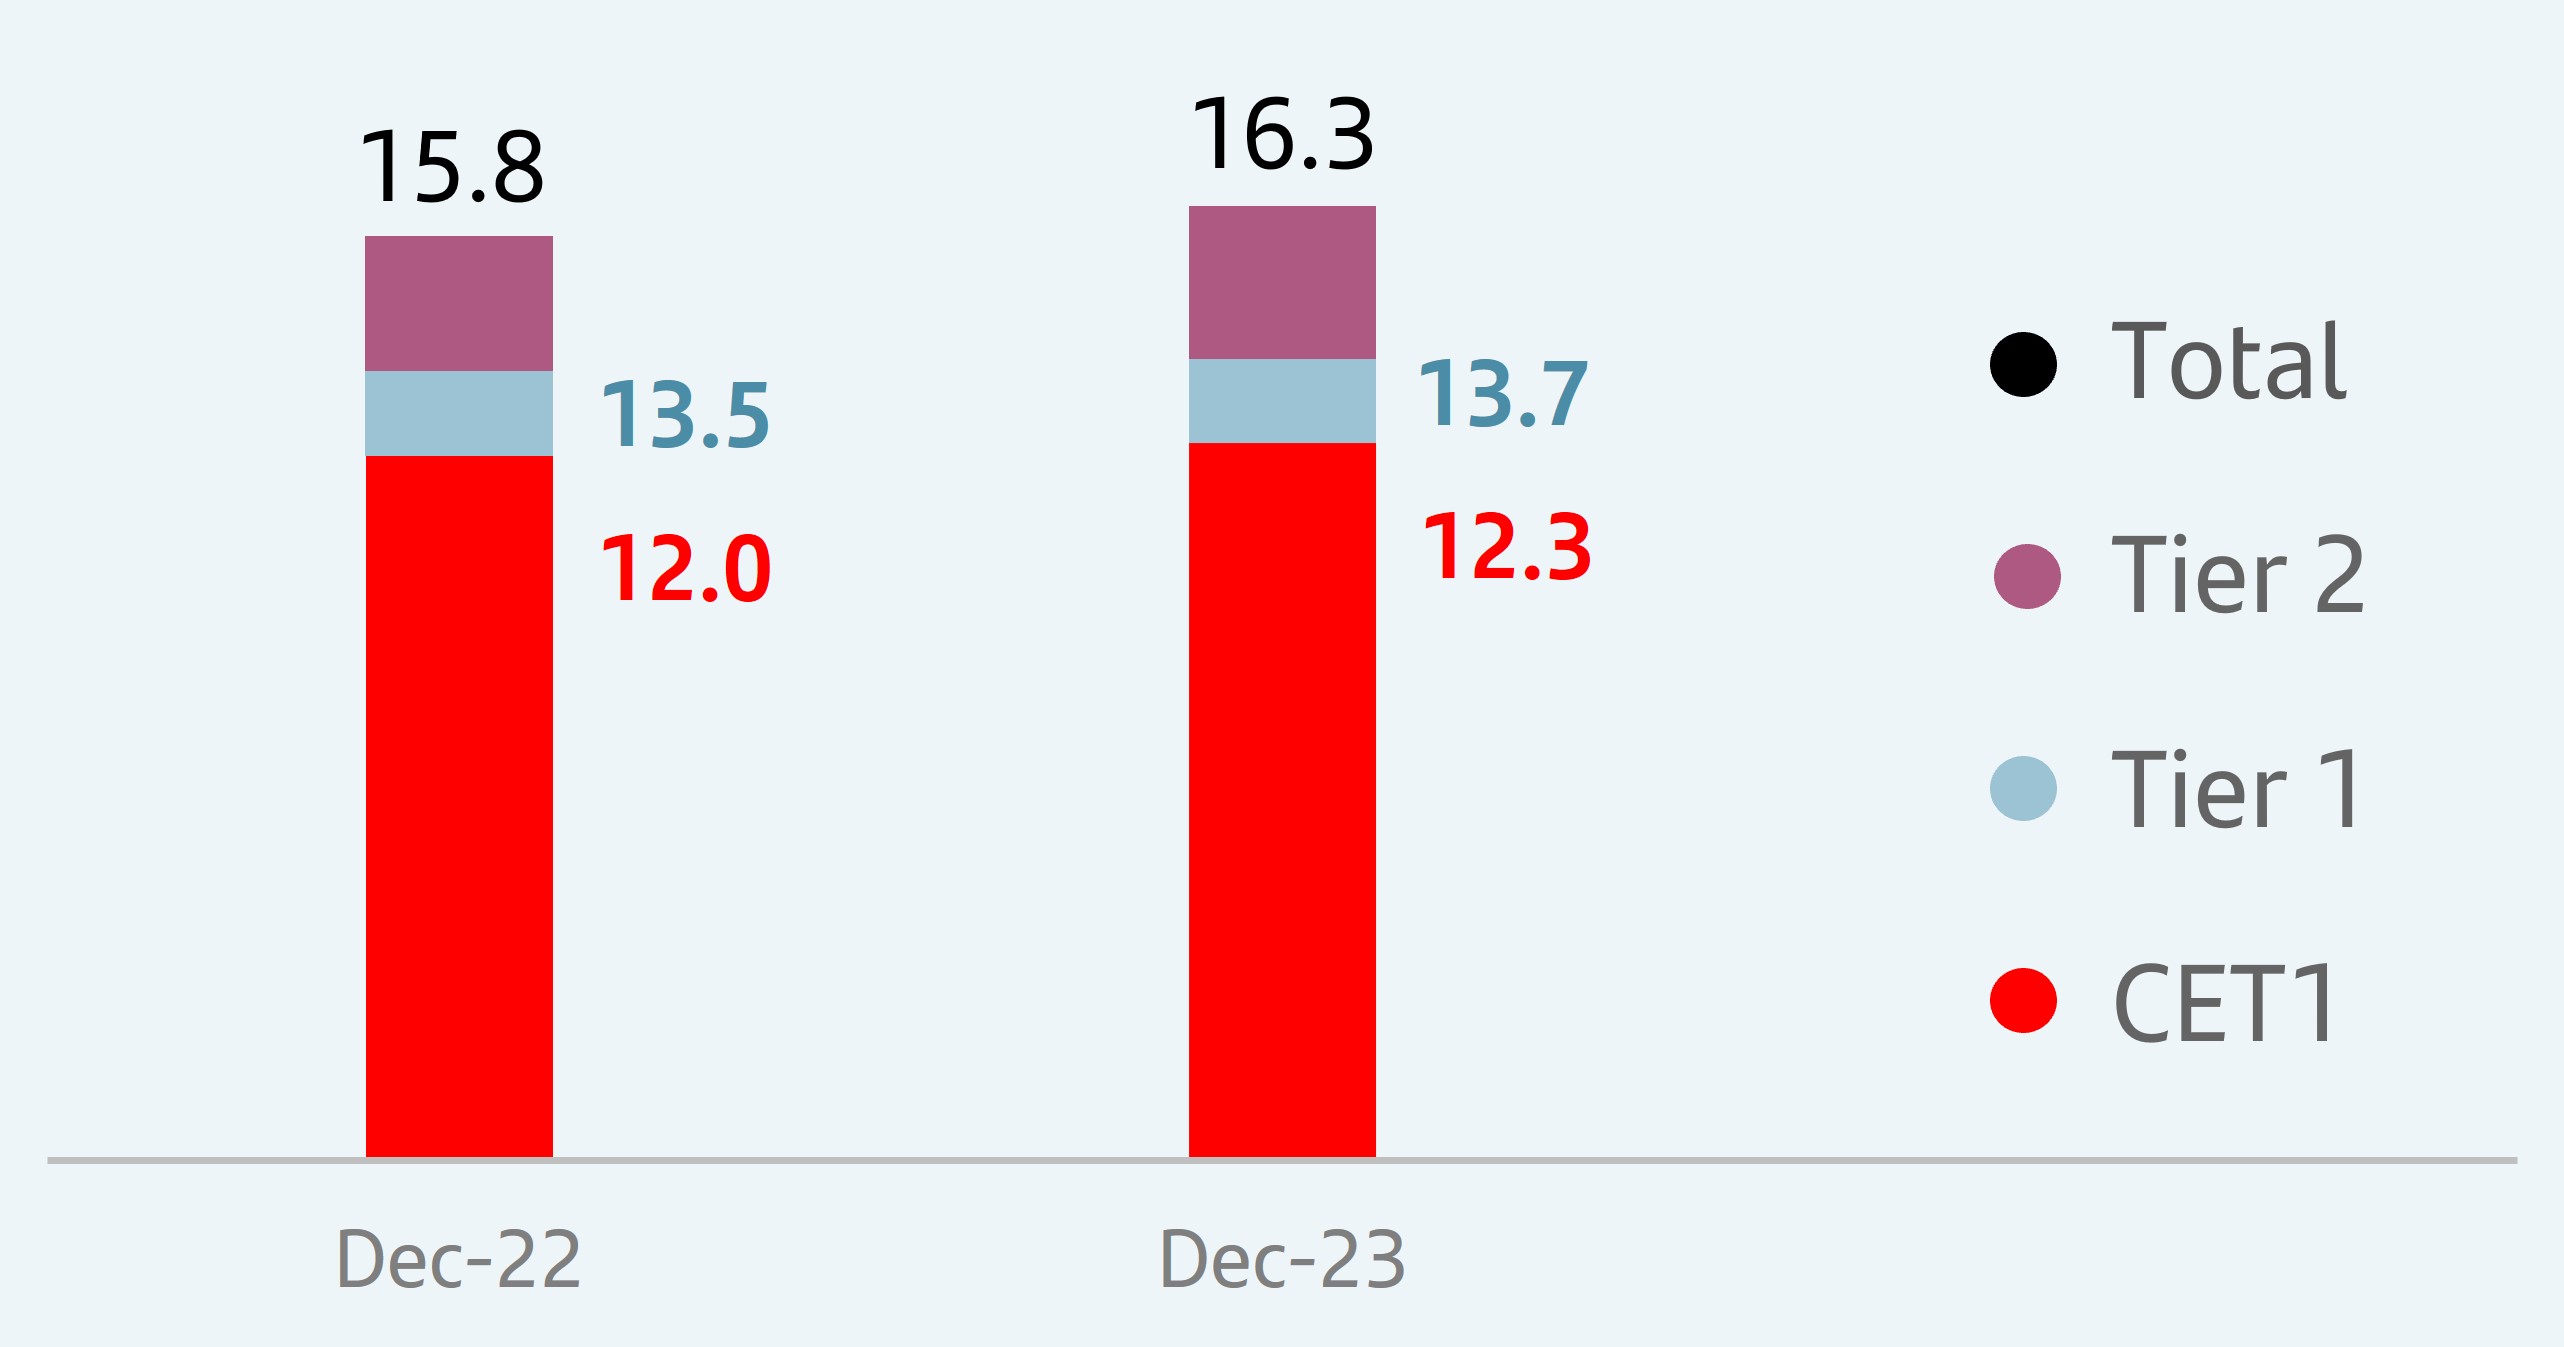 | Organic generation | +119 bps | |||||||||||||||||||||||||||||||||||||||||||||||||||||||||||||||||||||||||||||||||||||||||||||||
| TNAV per share | ||||||||||||||||||||||||||||||||||||||||||||||||||||||||||||||||||||||||||||||||||||||||||||||||||
The TNAV per share was EUR 4.76, +15% year-on-year including cash dividends paid in 2023 | ||||||||||||||||||||||||||||||||||||||||||||||||||||||||||||||||||||||||||||||||||||||||||||||||||
Capital management and adequacy at Santander aims to guarantee solvency and maximize profitability, while complying with regulatory requirements and internal capital targets.
Capital management is a key strategic tool for decision-making at both the subsidiary and corporate levels.
We have a common framework that covers capital management actions, criteria, policies, functions, metrics and processes. We have a team in charge of our capital analysis, adequacy and management that coordinates with subsidiaries on all matters related to capital and monitors and measures shareholder returns.
Our most notable capital management activities are:
•establishing capital adequacy and capital contribution targets that align with minimum regulatory requirements, internal policies and the budget, to guarantee robust capital levels consistent with our risk profile and efficient use of capital;
•drawing up a capital plan to meet our strategic plan objectives;
•monitoring the capital ratio in both regulatory and economic terms and the efficient capital allocation to units. Assessing capital adequacy to ensure the capital plan is consistent with our risk profile and risk appetite framework in baseline and stress scenarios;
•integrating capital metrics into businesses' management ensuring alignment with the Group’s objectives. Continuously monitoring stock and new business profitability as well as new business pricing at the unit, segment and customer levels. Tracking portfolios and customers with profitability below the minimum target. Coordinating and promoting the bank’s asset mobilization plan (e.g. securitizations, guarantees, sales);
•preparing internal capital reports, and reports for the supervisory authorities and the market (ICAAP, Pillar 3 reports and stress tests); and
•planning and managing other loss-absorbing instruments (MREL and TLAC).
Santander's capital function comprises three levels:
 | Regulatory capital | ||||||||||||||||
| The first step in managing regulatory capital is to analyse the capital base, the capital adequacy ratios under the current regulatory criteria and the scenarios used in capital planning to make the capital structure as efficient as possible, both in terms of costs and compliance with regulatory requirements and out internal capital targets. Active capital management includes strategies for allocation and efficient use of capital, securitizations, asset sales and issuances of equity instruments (hybrid equity instruments and subordinated debt). | |||||||||||||||||
 | Economic capital | ||||||||||||||||
| The economic capital model aims to ensure we adequately allocate our capital to cover every risk we are exposed to a result of our activity and risk appetite. It also aims to optimize economic value added at Group and business unit level. | |||||||||||||||||
 | Profitability and pricing | ||||||||||||||||
| Creating value and maximizing profitability is one of Santander's main objectives. We carefully select the most appropriate markets and portfolios based on profitability while considering risk. Thus, profitability and pricing are integral to our key capital model processes. | |||||||||||||||||
362
The main measures we took in 2023 were:
Issuances of capital hybrid and other loss-absorbing instruments
In 2023, Banco Santander, S.A. issued EUR 5.7 billion in hybrid instruments including EUR 3.4 billion in Tier 2 subordinated debt and EUR 2.3 billion in contingently convertible preferred shares (CoCos). The CoCo issuances aim to replace a EUR 1.0 billion AT1 issuance that was amortized early in December 2023 and a EUR 1.1 billion AT1 issuance amortized early in February 2024.
Additionally, Banco Santander, S.A. issued EUR 3.2 billion in senior non-preferred debt.
Dividends and shareholder remuneration
With regard to the 2023 results, the board followed a policy of allocating 50% of the Group reported profit (excluding non-cash, non-capital ratios impact items) to shareholder remuneration, distributed as approximately 50% in cash dividends and 50% in share buybacks.
•Interim remuneration. On 26 September 2023, the board resolved to:
•Pay an interim cash dividend against the 2023 results of EUR 8.10 cents per share entitled to the dividend (equivalent to approximately 25% of said Group's reported profit in H1’23); it was paid from 2 November 2023.
•Execute the First 2023 Buyback Programme worth up to EUR 1,310 million (equivalent to approximately 25% of said Group reported profit in H1’23). See 'First 2023 Buyback Programme' in the 'Corporate Governance' chapter.
•Final remuneration. Under the 2023 shareholder remuneration policy, on 19 February 2024 the board of directors resolved to:
•Submit a resolution at the 2024 AGM to approve a final cash dividend in the gross amount of EUR 9.50 cents per share entitled to dividends. If approved at the AGM, the dividend would be payable from 2 May 2024.
•Implement the Second 2023 Buyback Programme worth EUR 1,459 million, for which the appropriate regulatory authorization has been obtained, the execution of which will begin from 20 February 2024. For more details, see 'Second 2023 Buyback Programme' in the 'Corporate Governance' chapter.
Once the above-mentioned actions are completed, total shareholder remuneration for 2023 will total EUR 5,538 million (approximately 50% of the Group reported profit -excluding non-cash, non-capital ratios impact items- in 2023), distributed as approximately 50% in cash dividends (EUR 2,769 million) and 50% in share buybacks (EUR 2,769 million). For more details, see section 3.3 'Dividends and shareholder remuneration' in the 'Corporate Governance' chapter.
Strengthening our active capital management culture
We continue to focus on disciplined capital allocation and shareholder remuneration and on achieving our 2024 fully-loaded CET1 target of remaining above 12%.
Continuous improvement of our capital ratios reflects our profitable growth strategy and a culture of active capital management at all levels.
The Capital and Profitability Management team is in charge of our capital analysis, adequacy and management, coordination with subsidiaries on all matters related to capital and monitoring and measuring returns.
Every country and business unit has drawn up individual capital plans that focus on maximizing the return on equity.
Santander places high value on its long-term sustainability and the efficient use of capital in the incentives of the Group's main executives. We considered certain aspects relating to capital management and returns when setting senior managers' 2023 variable remuneration:
•Metrics include return on tangible equity (RoTE) and other relevant capital metrics (capital generation or CET1).
•Qualitative adjustments considered included efficient management of solvency metrics, operational risk management, risk appetite, sustainability and strength of results and effective cost management.
363
Fully-loaded CET1 ratioA | ||
| % | ||
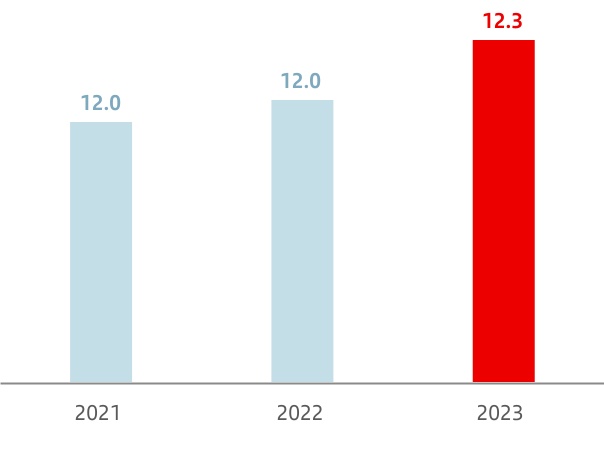
Regulatory phased-in CET1 ratioB | ||||||||||||||
| % | ||||||||||||||
| 12.5 | 12.2 | 12.3 | ||||||||||||
| Main capital data and solvency ratios | |||||||||||||||||
| EUR million | |||||||||||||||||
| Fully loaded | Phased-in B | ||||||||||||||||
| 2023 | 2022 | 2023 | 2022 | ||||||||||||||
| Common equity (CET1) | 76,448 | 73,390 | 76,741 | 74,202 | |||||||||||||
| Tier1 (T1) | 85,450 | 82,221 | 85,742 | 83,033 | |||||||||||||
| Eligible capital | 101,747 | 96,373 | 102,240 | 97,392 | |||||||||||||
| Risk-weighted assets | 623,652 | 609,702 | 623,731 | 609,266 | |||||||||||||
| CET1 capital ratio | 12.3 | % | 12.0 | % | 12.3 | % | 12.2 | % | |||||||||
| T1 capital ratio | 13.7 | % | 13.5 | % | 13.7 | % | 13.6 | % | |||||||||
| Total capital ratio | 16.3 | % | 15.8 | % | 16.4 | % | 16.0 | % | |||||||||
| Leverage ratio | 4.68 | % | 4.70 | % | 4.69 | % | 4.74 | % | |||||||||
A. The 2021 fully-loaded CET1 ratio includes a charge related to corporate transactions that were pending approval at year end (-0.16 pp).
B. The phased-in ratios include the transitory treatment of IFRS 9, calculated in accordance with article 473 bis of the Regulation on Capital Requirements (CRR) and subsequent amendments introduced by Regulation 2020/873 of the European Union. Additionally, the Tier 1 and total phased-in capital ratios include the transitory treatment according to chapter 2, title 1, part 10 of the aforementioned CRR.
Fully-loaded capital ratios in 2023
The fully-loaded CET1 ratio was 12.3% if we do not apply the transitory IFRS 9 provisions or the subsequent amendments introduced by Regulation 2020/873 of the European Union.
In the year, we organically generated 119 bps of capital, supported by profit growth. We recorded an impact of 44 bps related to cash dividend accrual and another 36 bps for the First 2023 Share Buyback Programme, representing a net generation of 39 bps in 2023.
Additionally, there was a 9 bp positive impact, mainly relating to regulatory and FX movements.
However, this was partially offset by a -26 bp charge relating to the second 2023 share buyback programme in accordance with the EBA's Q&A 2023_6887 on the deduction of share buybacks included in distribution policies.
The fully-loaded leverage ratio stood at 4.68%.
| Fully-loaded CET1 ratio in 2023 | ||
| % | ||
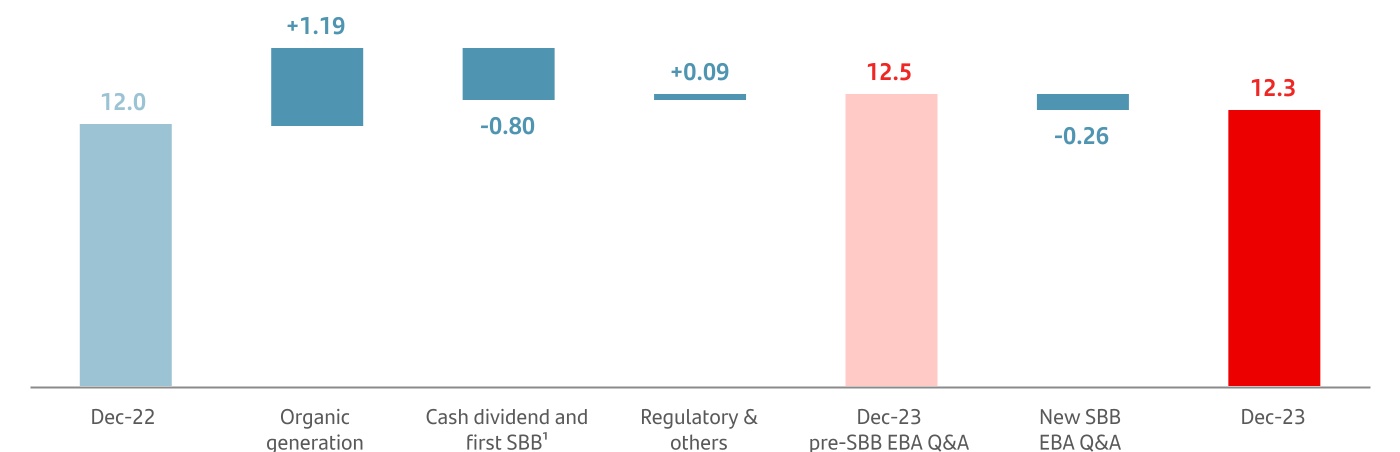
1.The implementation of the shareholder remuneration policy is subject to future corporate and regulatory decisions and approvals.
364
Regulatory capital ratios (phased-in)
The phased-in ratios are calculated by applying the CRR transitory schedules.
On a consolidated basis, the minimum levels required by the European Central Bank in 2023 were 9.26% for the CET1 ratio and 13.45% for the total capital ratio.
Our capital requirements increased in 2023, mainly due to the continued increase of countercyclical buffer requirements by the competent authorities in the countries in which we operate (+0.19 pp).
At year-end, the phased-in CET1 ratio was 12.30%, resulting in a CET1 management buffer of 305 bps. This shows our ability to generate capital organically, our solid position to be able to pay dividends and our strong capital management.
The total phased-in capital ratio was 16.39%. Taking into account the shortfall in AT1, Santander exceeded the 2023 minimum regulatory requirements (i.e. distance to the maximum distributable amount - MDA) by 269 bps.
The phased-in leverage ratio stood at 4.69%.
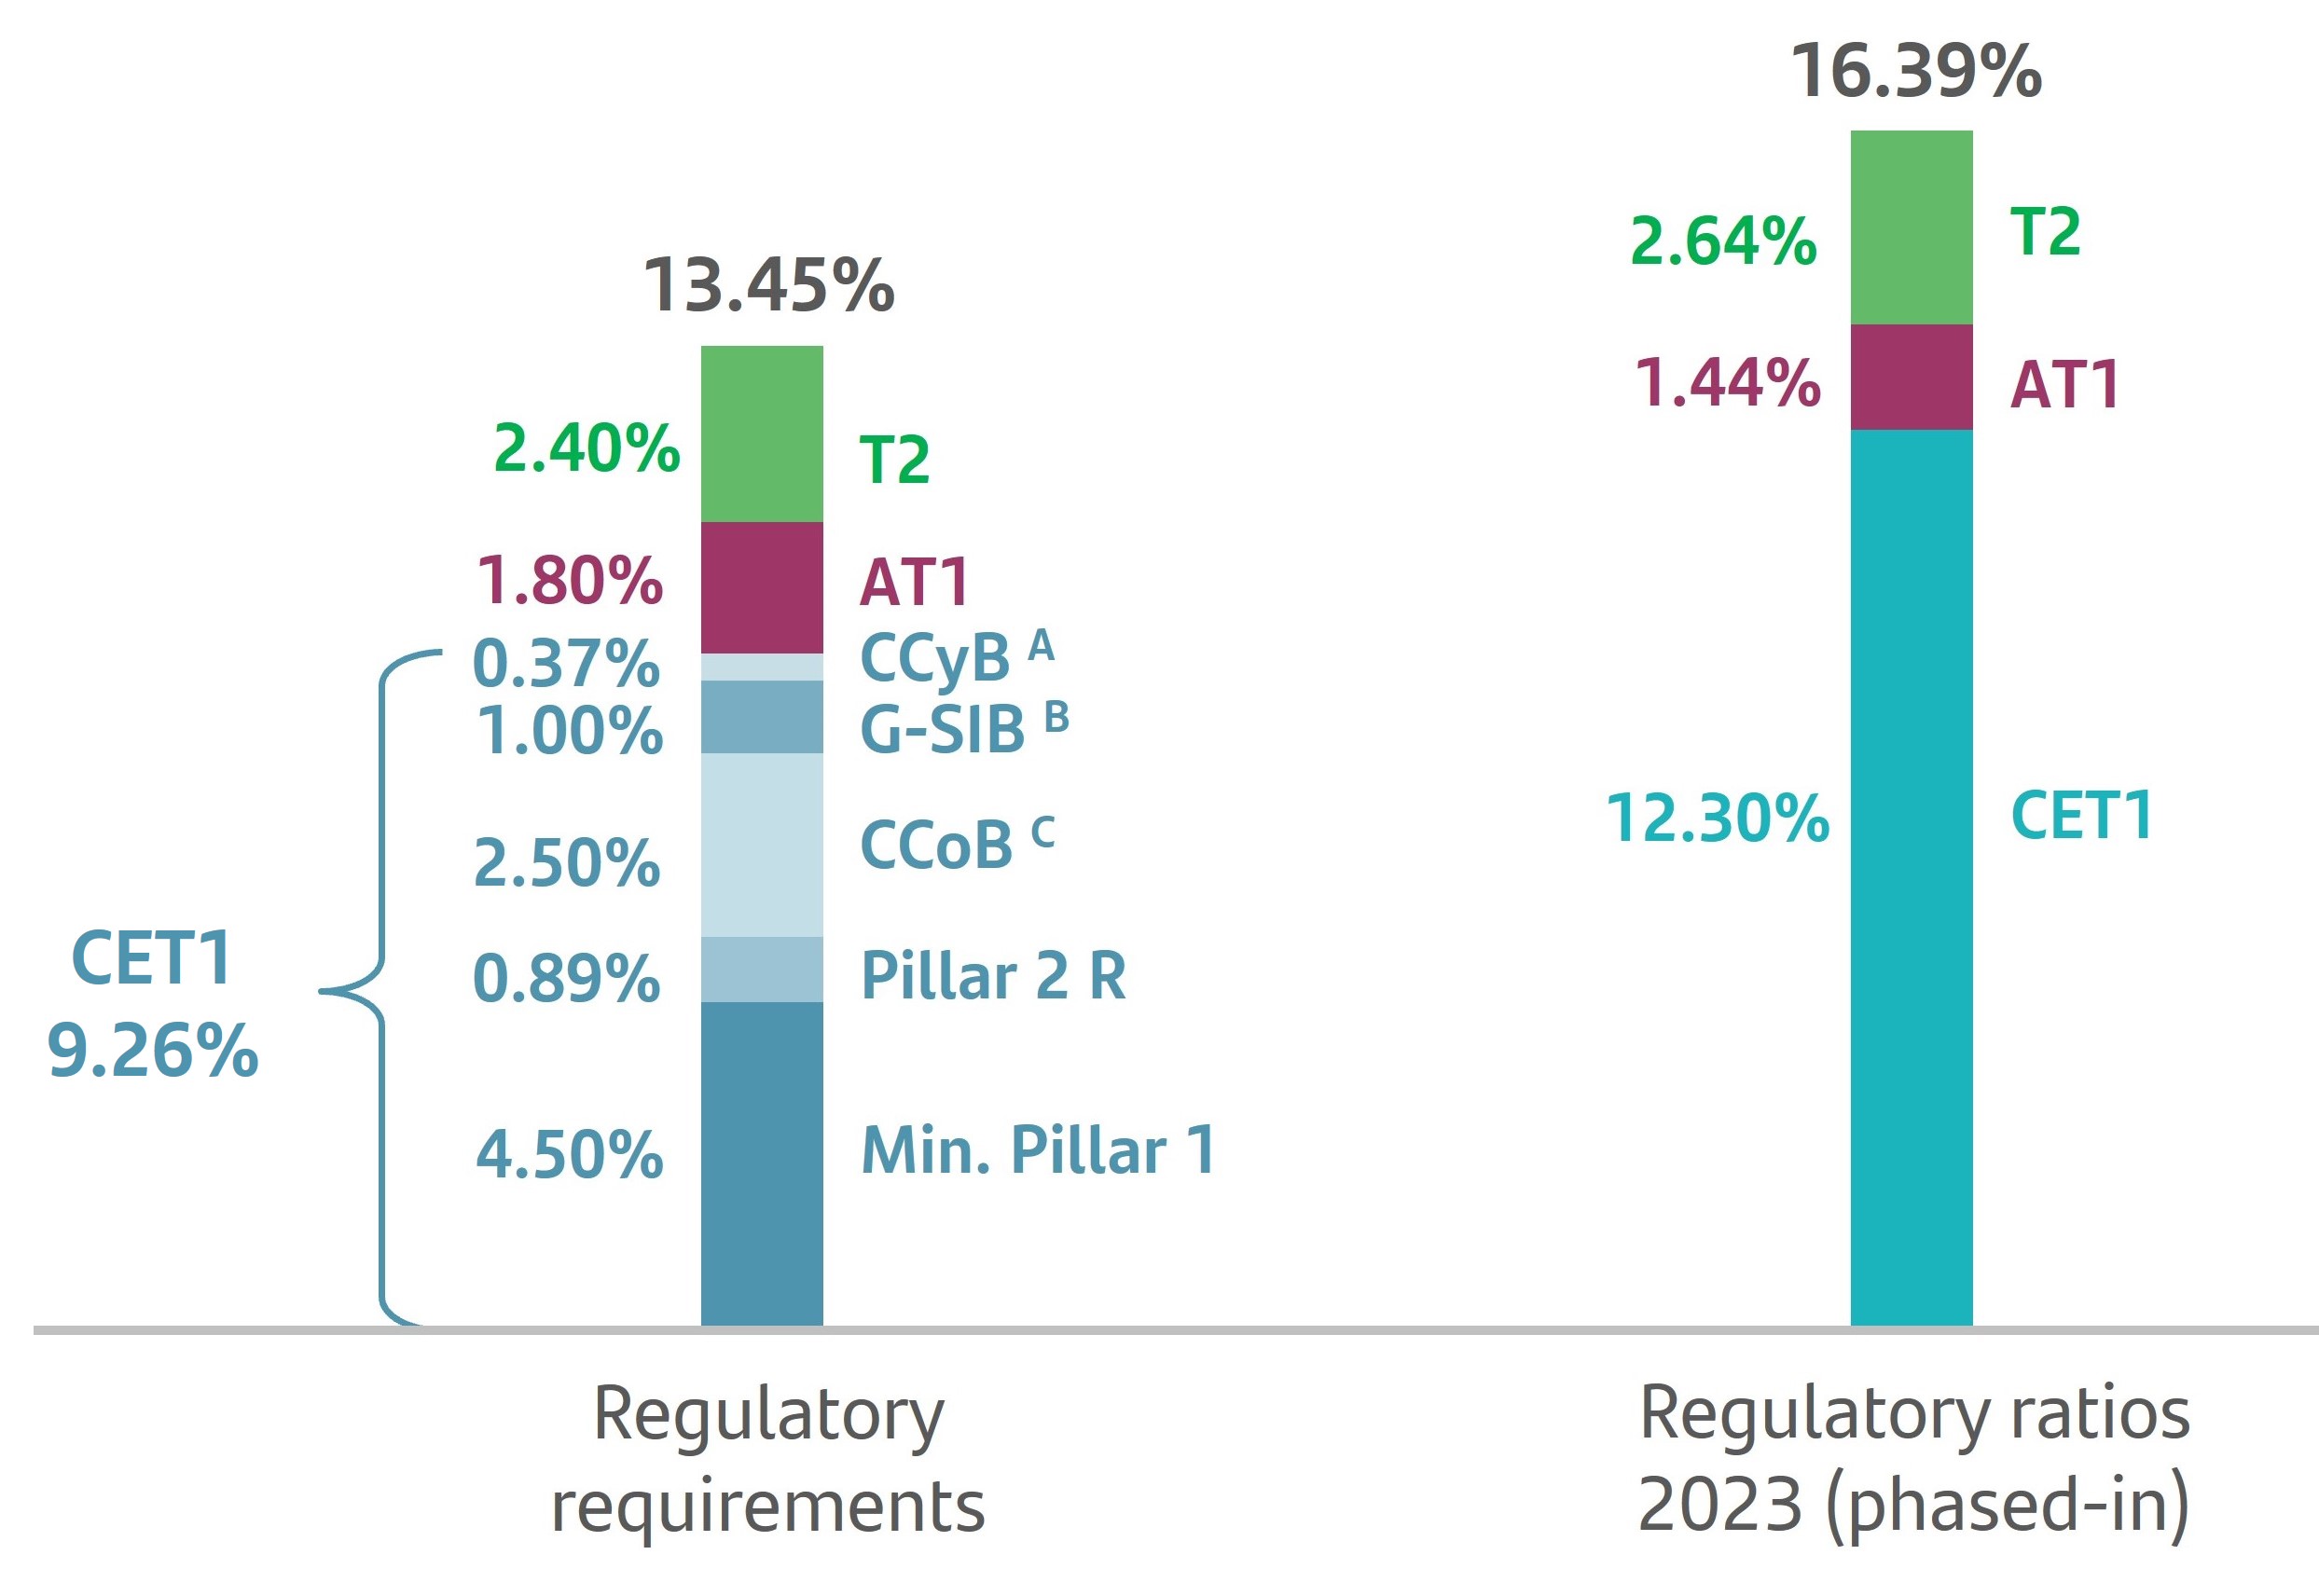
A. Countercyclical buffer.
B. Global systemically important banks (G-SIB) buffer.
C. Capital conservation buffer.
With effect from 1 January 2024, the ECB revised Banco Santander, S.A.'s P2R requirement, establishing a minimum of 1.74% on a consolidated basis. This is a 0.16 pp increase compared to the 2023 requirements (of which, 0.15 pp are due to a methodological change). 0.98 percentage points of the P2R requirement must be covered with CET1 and the rest between AT1 and tier 2.
Institutions must hold capital at the consolidated level for the higher of the G-SIB and D-SIB requirements. In 2023, they were both set at 1%, however Banco de España informed the Group that its D-SIB buffer would increase from 1.00% to 1.25% from 1 January 2024.
| Regulatory capital (phased-in). Flow statement | |||||
| EUR million | |||||
| 2023 | |||||
| Capital Core Tier 1 (CET 1) | |||||
| Starting amount (31/12/2022) | 74,202 | ||||
| Shares issued in the year and share premium | (2,205) | ||||
| Treasury shares and own shares financed | (2,787) | ||||
| Reserves | (1,209) | ||||
| Attributable profit net of dividends | 8,307 | ||||
| Other retained earnings | 2,400 | ||||
| Minority interests | (518) | ||||
| Decrease/(increase) in goodwill and other intangible assets | (38) | ||||
| Other | (1,412) | ||||
| Ending amount (31/12/2023) | 76,741 | ||||
| Additional Capital Tier 1 (AT1) | |||||
| Starting amount (31/12/2022) | 8,831 | ||||
| AT1 eligible instruments | 117 | ||||
| AT1 excesses - subsidiaries | 54 | ||||
| Residual value of intangible assets | — | ||||
| Deductions | — | ||||
| Ending amount (31/12/2023) | 9,002 | ||||
| Capital Tier 2 (T2) | |||||
| Starting amount (31/12/2022) | 14,359 | ||||
| T2 eligible instruments | 2,331 | ||||
| Generic funds and surplus loan-loss provisions-IRB | 76 | ||||
| T2 excesses - subsidiaries | (269) | ||||
| Deductions | — | ||||
| Ending amount (31/12/2023) | 16,497 | ||||
| Deductions from total capital | — | ||||
| Total capital ending amount (31/12/2023) | 102,240 | ||||
365
These tables show the total risk-weighted assets (comprising the denominator of capital requirements based on risk) as well as their distribution by geographic segment.
| Risk-weighted assets (phased-in CRR, phased-in IFRS 9) | ||||||||||||||
| EUR million | ||||||||||||||
| RWAs | Minimum capital requirements | |||||||||||||
| 2023 | 2022 | 2023 | ||||||||||||
Credit risk (excluding CCR) A | 515,238 | 507,775 | 41,219 | |||||||||||
| Of which: standardized approach (SA) | 285,728 | 274,922 | 22,858 | |||||||||||
| Of which: the foundation IRB (FIRB) approach | 56,913 | 11,759 | 4,553 | |||||||||||
Of which: slotting approach B | 14,123 | 14,509 | 1,130 | |||||||||||
| Of which: equities under the simple risk-weighted approach | 3,603 | 2,828 | 288 | |||||||||||
| Of which: the advanced IRB (AIRB) approach | 138,204 | 188,442 | 11,056 | |||||||||||
| Counterparty credit risk (CCR) | 13,593 | 13,096 | 1,087 | |||||||||||
Of which: standardized approach | 10,150 | 9,493 | 812 | |||||||||||
| Of which: internal model method (IMM) | — | — | — | |||||||||||
| Of which: exposures to a CCP | 324 | 278 | 26 | |||||||||||
| Of which: credit valuation adjustment (CVA) | 680 | 1,097 | 54 | |||||||||||
| Of which: other CCR | 2,439 | 2,229 | 195 | |||||||||||
| Settlement risk | 4 | 4 | 0 | |||||||||||
| Securitization exposure in the banking book (after the cap) | 11,419 | 9,898 | 914 | |||||||||||
| Of which: SEC-IRBA approach | 4,275 | 4,471 | 342 | |||||||||||
| Of which: SEC-ERBA approach | 2,257 | 2,156 | 181 | |||||||||||
Of which: SEC-SA approach B | 4,887 | 3,270 | 391 | |||||||||||
Of which: 1250% deduction C | — | — | — | |||||||||||
| Position, foreign exchange and commodities risks (Market risk) | 16,454 | 15,791 | 1,316 | |||||||||||
| Of which: standardized approach | 9,166 | 7,521 | 733 | |||||||||||
| Of which: internal model approach (IMA) | 7,288 | 8,270 | 583 | |||||||||||
| Large exposures | — | — | — | |||||||||||
| Operational risk | 67,022 | 62,702 | 5,362 | |||||||||||
| Of which: basic indicator approach | — | — | — | |||||||||||
| Of which: standardized approach | 67,022 | 62,702 | 5,362 | |||||||||||
| Of which: advanced measurement approach | — | — | — | |||||||||||
| Amounts below the thresholds for deduction | 28,732 | 25,868 | 2,299 | |||||||||||
Total B | 623,731 | 609,266 | 49,898 | |||||||||||
A.Includes equities under the PD/LGD approach.
B.For more detail see Pillar 3 report.
C.Information prepared following the recent update of the EBA (24.05.22,"ITS on institutions’ Pillar 3 public disclosures"). Banco Santander S.A. deducts from capital those securitisations that meet the deduction requirements, and therefore does not apply a 1,250% weighting to these exposures. This row does not include the EUR 5,475 million that would result from applying this weighting to these exposures.
366
| RWAs by geographical distribution (phased-in CRR, phased-in IFRS 9) | ||||||||||||||||||||||||||
EUR billion | ||||||||||||||||||||||||||
| TOTAL | EUROPE | o/w: Spain | o/w: United Kingdom | NORTH AMERICA | o/w: US | SOUTH AMERICA | o/w: Brazil | |||||||||||||||||||
| Credit risk (excluding CRR) | 540 | 323 | 132 | 69 | 94 | 67 | 123 | 89 | ||||||||||||||||||
| of which, standardised approach (SA) | 290 | 122 | 36 | 19 | 74 | 56 | 94 | 65 | ||||||||||||||||||
of which, internal rating-based (IRB) approach | 218 | 172 | 74 | 46 | 18 | 9 | 28 | 23 | ||||||||||||||||||
| of which, equity and DTAs | 19 | 19 | 19 | — | — | — | — | — | ||||||||||||||||||
of which, securitizations A | 11 | 9 | 2 | 3 | 2 | 2 | 0 | 0 | ||||||||||||||||||
| of which, rest | 1 | 1 | 0 | — | 0 | — | — | — | ||||||||||||||||||
| Market risk | 16 | 12 | 11 | 0 | 2 | 1 | 3 | 1 | ||||||||||||||||||
| Operational risk | 67 | 35 | 14 | 7 | 16 | 11 | 16 | 10 | ||||||||||||||||||
Total | 624 | 369 | 157 | 77 | 112 | 80 | 142 | 100 | ||||||||||||||||||
Note: Breakdown according to debtor’s residency, except operational risk (management criteria). Counterparty RWAs are included in the IRB/STD approaches.
A. It does not include 1250% deductions.
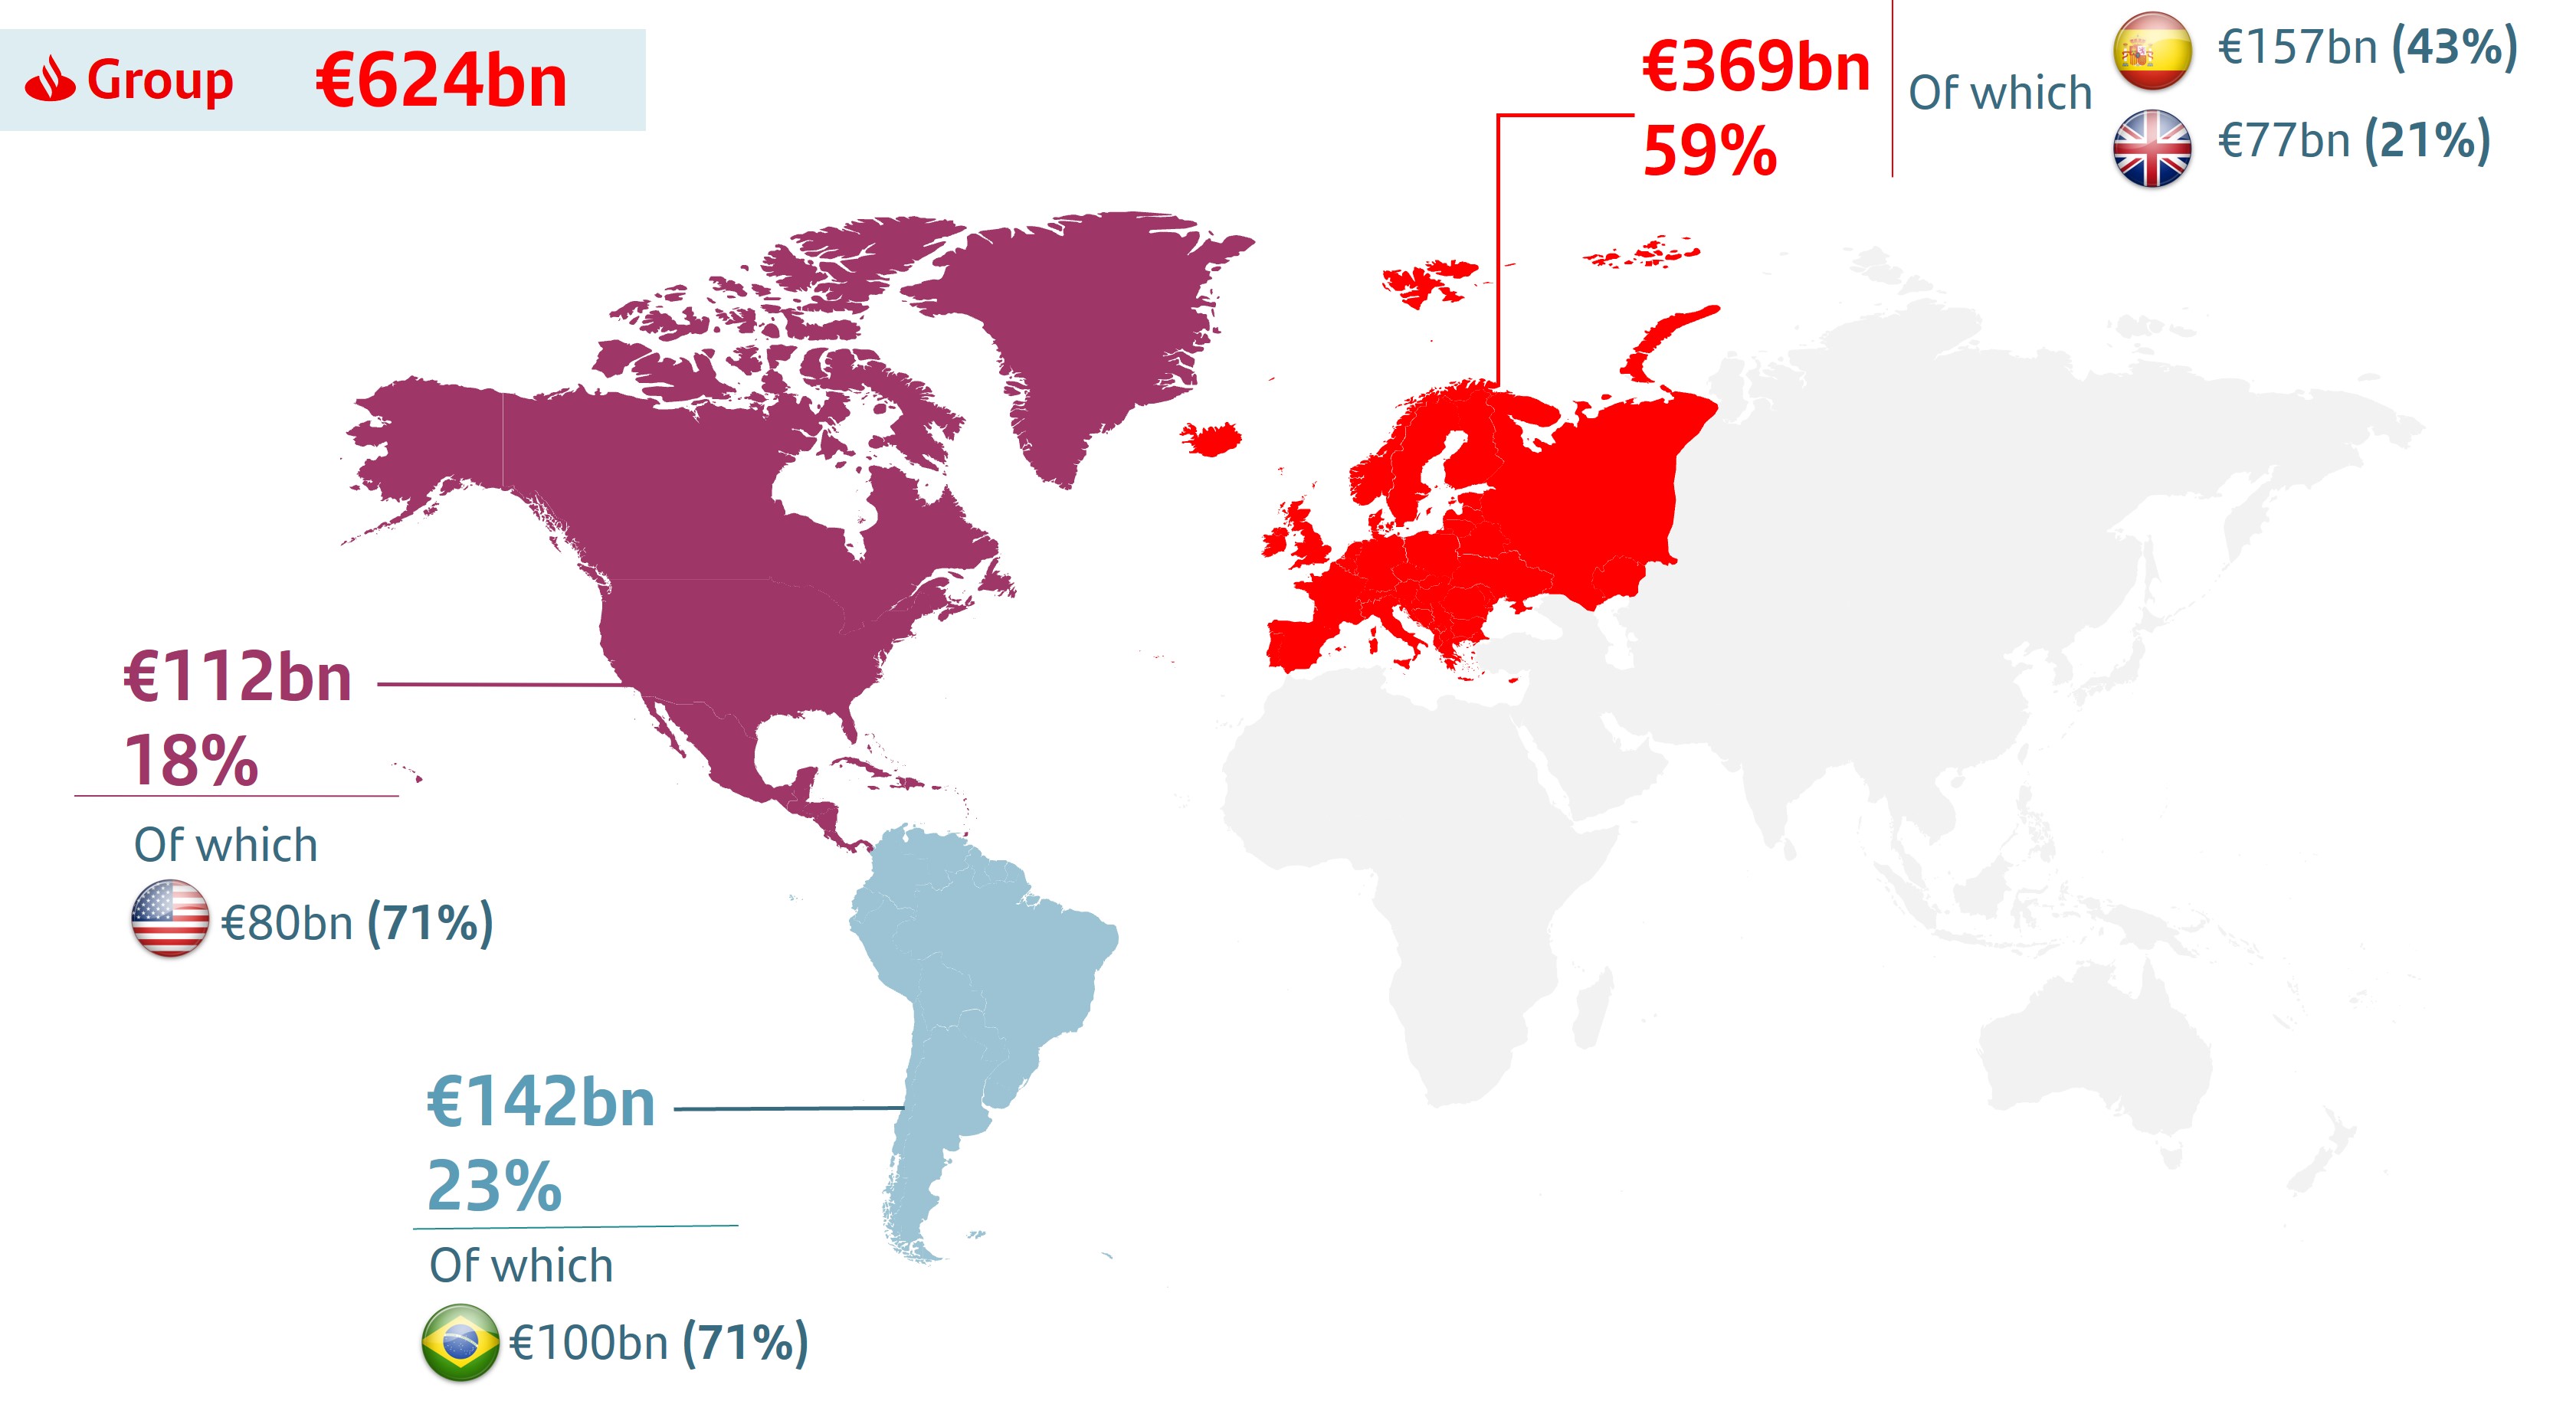
367
This table presents the main changes to capital requirements by credit risk:
Credit risk capital movements A | ||||||||
| EUR million | ||||||||
| RWAs | Capital requirements | |||||||
| Starting amount (31/12/2022) | 529,401 | 42,352 | ||||||
| Asset size | 14,247 | 1,140 | ||||||
| Asset quality | (2,091) | (167) | ||||||
| Model updates | (13) | (1) | ||||||
| Regulatory | — | — | ||||||
| Acquisitions and disposals | — | — | ||||||
| Foreign exchange movements | (2,297) | (184) | ||||||
| Other | — | — | ||||||
| Ending amount (31/12/2023) | 539,247 | 43,140 | ||||||
A. Includes capital requirements from equity, securitizations and counterparty risk (excluding CVA and CCP).
Credit risk RWAs increased EUR 9,846 million in 2023. If we isolate the exchange rate effect (due to the depreciation of the Argentine peso, the US dollar and the Chilean peso partially offset by the appreciation of the Brazilian real and the Mexican peso), RWAs increased EUR 12,143 million. This is mainly due to asset size (EUR 14,247 million), driven by greater business volumes particularly in DCB and South America which were partially offset by securitizations during the year (EUR 15,371 million). Additionally, there was a decrease in RWAs related to credit quality performance (-EUR 2,091 million).
In short, from a qualitative point of view, Santander's solid capital ratios are consistent with its business model, balance sheet structure and risk profile.
Economic capital
Economic capital is the capital required to cover risks from our activity with a certain level of solvency. We measure it using an internal model. To calculate the required capital, we determine our solvency level based on our long-term rating target of 'A' (in line with the Kingdom of Spain); this represents a confidence level of 99.95% (above the regulatory level of 99.90%).
Our economic capital model measurements cover all significant risks incurred in our activity (concentration risk, structural interest rate risk (ALM), business risk, pensions risk, deferred tax assets (DTAs), goodwill and others that are beyond the scope of regulatory Pillar 1). It also considers diversification, which is key to determining and understanding our risk profile and solvency in view of our multinational operations and businesses.
Our total risk and related economic capital are less than the sum of the risk and capital of all individual units combined. Because our business spans several countries in a structure of separate legal entities with different customer and product segments and risk types, our earnings are less vulnerable to adverse situations for any given market, portfolio, customer type or risk. Despite increasing economic globalization, economic cycles and their impact differ by country. Groups with a global presence tend to have more stable results and are more resistant to market or portfolio crises, which translates into lower risk.
In contrast to regulatory criteria, we consider such intangible assets as DTAs and goodwill to retain value (even in a hypothetical resolution), owing to the geographic structure of our subsidiaries. Thus, we can value assets and estimate their unexpected loss and capital impact.
Economic capital is an essential internal management tool that helps us develop our strategy, assess solvency and manage portfolio and business risk. As such, it is a key part of the Supervisory Review and Evaluation Process (SREP).
Regarding Basel Pillar 2, we use our economic model for the internal capital adequacy assessment process (ICAAP). We plan business progression and capital needs under a baseline scenario and alternative stress scenarios to make sure we meet our solvency objectives, even in adverse scenarios.
Economic capital-derived metrics help us assess risk-return objectives, price operations based on risk, determine how economically viable projects are, and value country units and business lines to fulfil our overriding objective of maximizing shareholder value.
As a homogeneous risk measure, we can use economic capital to explain how we distribute risk throughout Santander, bringing together several activities and risk types under a single metric.
Given its relevance to internal management, Santander includes several economic capital-derived metrics from both a capital needs and a risk-return point of view, within a conservative risk appetite framework established at both Group and subsidiary level.
Required economic capital in December 2023 amounted to EUR 74,721 million. Compared to the available economic capital base of EUR 94,228 million, this implies a capital surplus of EUR 19,507 million.
368
| Reconciliation of economic and regulatory capital | ||||||||
| EUR million | ||||||||
| 2023 | 2022 | |||||||
| Net capital and issuance premiums | 49,618 | 54,610 | ||||||
| Reserves and retained profits | 76,841 | 67,978 | ||||||
| Valuation adjustments | (34,484) | (35,068) | ||||||
| Minority interests | 6,908 | 7,426 | ||||||
| Prudential filters | (669) | (708) | ||||||
Other A | (3,986) | (2,522) | ||||||
| Base economic capital available | 94,228 | 91,716 | ||||||
| Deductions | (18,867) | (18,603) | ||||||
| Goodwill | (14,161) | (14,484) | ||||||
| Other intangible assets | (3,059) | (2,698) | ||||||
| DTAs | (1,648) | (1,421) | ||||||
| Other | 1,088 | 237 | ||||||
| Base regulatory (FL CET1) capital available | 76,448 | 73,350 | ||||||
| Base economic capital available | 94,228 | 91,716 | ||||||
Economic capital required B | 74,721 | 70,900 | ||||||
| Capital surplus | 19,507 | 20,816 | ||||||
| A. Includes: deficit of provisions over economic expected loss, pension assets and other adjustments. | ||
| B. For a better comparison with regulatory capital, the differences in goodwill due to FX changes are included in the required economic capital. All figures according to EC 2022 methodology. | ||
The main difference compared to regulatory CET1 is the treatment of goodwill, other intangible assets and DTAs; we consider them additional capital requirements rather than a deduction from available capital.
RoRAC and Economic Value Added
One of the Group's primary priorities is to manage capital by ensuring that we make a cost-effective allocation of capital in all our activities.
Our strategy includes investing capital in markets and portfolios with the highest returns on capital, ensuring strong and sustainable shareholder value creation. Metrics such as RoTE, RoRWA and RoRAC are part of approvals and monitoring policies. These metrics help us compare the return on operations, customers, portfolios and businesses on a like-for-like basis. We can identify what is obtaining a risk-adjusted return higher than its cost of capital and thus align risk and business management to maximize economic value added (EVA).
We regularly assess the level and progression of EVA across the Group, both from a regulatory and economic capital point of view. EVA is the profit generated above the cost of capital employed.
The minimum return on capital a transaction must obtain is determined by the cost of capital (i.e. the minimum compensation required by shareholders). We calculate it by adding the premium shareholders demand to invest in Santander to the risk-free return. The premium depends essentially on the degree of volatility in our share price with respect to market performance. Santander's cost of capital in 2023 was 11.2% (in line with 2022).
On top of reviewing the cost of capital every year, we also estimate a cost of capital for each business unit based on its features (under the philosophy that subsidiaries manage capital and liquidity autonomously) to determine whether each business is capable of creating value on a standalone basis.
This table shows economic value added and RoRAC of the Group’s main geographical segments at the end of December 2023.
Economic Value AddedA and RoRAC | |||||||||||||||||
| EUR million | |||||||||||||||||
| 2023 | 2022 | ||||||||||||||||
| Main segments | RoRAC | EVA | RoRAC | EVA | |||||||||||||
| Europe | 24.1 | % | 3,169 | 15.5 | % | 1,082 | |||||||||||
| North America | 18.8 | % | 886 | 23.4 | % | 1,418 | |||||||||||
| South America | 19.0 | % | (45) | 23.4 | % | 966 | |||||||||||
| Digital Consumer Bank | 23.2 | % | 788 | 26.5 | % | 974 | |||||||||||
| Total Group | 15.3 | % | 3,285 | 14.0 | % | 2,146 | |||||||||||
A. The economic value added is calculated with the cost of capital of each unit. The Group’s total RoRAC includes the operating units and the Corporate Centre, reflecting the Group's economic capital and its return.
Additionally, we also internally use a Shareholder Value Added (SVA) view which adjusts components that affect shareholder value creation but are not reflected in results.
Identifying and managing businesses with low profitability is part of the Group's capital optimization process. We dynamically target and actively monitor customers, portfolios and markets with attractive returns on capital.
To ensure improved profitability and maximize capital productivity, we must focus on capital efficiency from origination. Pricing is an objective process based on the characteristics of the transaction, product, borrower, segment and market. Furthermore, it should ensure that the price exceeds a minimum threshold covering at least funding, operating, credit and capital costs, as well as an additional spread that takes into account demand sensitivity to prices and value generation. Therefore, pricing should aim to maximize profitability, with positive EVA for every transaction, customer and/or portfolio, and ensure compliance with minimum return on capital targets.
369
Santander has granular approvals tools for the CIB and corporate segments which it uses to calculate the return on both regulatory and economic capital (RoRWA and RoRAC) and determine appropriate pricing. For retail segments, tools are locally developed by the units, tailoring them to the individual characteristics of each market. We also employ a granular tool to track returns on capital on a like-for-like basis between units.
Our approvals tools enable us to identify and justify any new loans with a pricing below the minimum threshold and our monitoring tools enable us to identify operations with profitability below the cost of capital, thereby recurrently destroying value. To try to ensure that all customer relationships add value, we regularly monitor and actively manage low performing customers through specific action plans.
Both approvals and profitability monitoring have a robust approval and review governance which i) ensures the consideration of minimum pricing thresholds are properly integrated into capital processes, ii) establishes a timely scaling/authorizing process and iii) that detailed follow-ups are carried out for operations approved below the minimum threshold.
Capital planning and stress tests
Capital stress test exercises are a key tool in banks' dynamic assessments of their risks and solvency. These forward-looking reviews are based on unlikely-but-plausible macroeconomic and idiosyncratic scenarios. They require robust planning models that can translate the effects defined in the projected scenarios to elements that affect solvency.
The ultimate aim of these exercises is to assess risks and solvency thoroughly to determine capital requirements if a bank fails to meet its regulatory and internal capital objectives.
Santander has an internal capital stress and planning process to respond to various regulatory exercises and is a key tool integrated within management and strategy. They aim to ensure sufficient current and future capital, even in unlikely-but-plausible economic scenarios. We estimate results in various business environments (including severe recessions as well as expected macroeconomic environments), based on our initial situation (financial statements, capital base, risk parameters and regulatory and economic ratios) to determine our solvency ratios, usually for a three-year period.
Planning offers a comprehensive view of our capital for the analysed period and in each of the defined scenarios based on regulatory capital and economic capital metrics.
This chart describes the structure in place:
| 1 | Macroeconomic scenario | •Central and recession •Idiosyncratic: based on specific risks the entity faces •Multi-year horizon •Reverse stress tests | ||||||||||||
| 2 | Balance sheet and income statement forecasts | •Projection of volumes. Business strategy •Margins and funding costs •Fees and operating expenses •Market shocks and operational losses •Credit losses and provisions. PIT LGD and PD models •IFRS 9 models and migration among stages | ||||||||||||
| 3 | Capital requirements forecasts | •Consistent with projected balance sheet •Regulatory and economic risk parameters (PD, LGD and EAD) | ||||||||||||
| 4 | Solvency analysis | •Available capital base. Profits and dividends •Regulatory and legislative impacts •Capital and solvency ratios •Compliance with capital objectives •Regulatory and economic view | ||||||||||||
| 5 | Action plan | •In the event of failure to comply with internal objectives or regulatory requirements | ||||||||||||
370
This structure supports the ultimate objective of capital planning, by making it an important strategic component that:
•ensures current and future solvency, even in adverse economic scenarios;
•facilitates communication with the market and supervisors;
•ensures comprehensive capital management, analyses specific effects and integrates them into strategic planning;
•enables a more efficient use of capital; and
•helps formulate our capital management strategy.
Senior managers are fully involved in and closely oversee capital planning under a framework that ensures proper governance and is subject to the robust challenge, review and analysis.
In capital planning and stress analysis exercises, calculating the required provisions under stress scenarios is key, especially to cover losses on credit portfolios. It is particularly important for income statement forecasts under adverse scenarios.
To calculate loan-loss provisions of the credit portfolio, we use a methodology that ensures provisions cover loan losses projected by internal expected loss models, based on exposure at default (EAD), probability of default (PD) and loss given default (LGD parameters), at all times.
In 2018, we adapted this methodology to incorporate changes brought in by the new IFRS 9 regulations, with models to calculate balances by stages (S1, S2, S3) as well as the movements between them and the loan-loss provisions in accordance with the new standards.
Our capital planning and stress analysis culminate in an analysis of solvency under various scenarios over a set period to measure capital adequacy and ensure we meet all internal capital and regulatory requirements.
Should we fail to meet our capital objectives, we would draw up an action plan with the measures needed to attain the minimum capital desired. We analyse and quantify those measures as part of internal exercises even if we don't need to use them as we exceed the minimum capital thresholds.
Santander carries out its internal stress and capital planning transversally throughout the Group, at the consolidated and local level. Our subsidiaries use it as an internal management tool, particularly to respond to local regulatory requirements.
We have undergone nine external stress tests since the beginning of the economic crisis in 2008. Every test proved our strength and solvency in the most extreme and severe macroeconomic scenarios showing that, owing to our business model and geographic diversification, we would still be capable of generating a profit for shareholders while satisfying the most demanding regulatory requirements.
The ECB determines and sets Pillar 2 Guidance (P2G) according to the results of the adverse scenario in these supervisory stress tests, including the EU-level stress tests carried out by the EBA. When determining the P2G, the ECB considers the maximum impact expected on the CET1 ratio, which, for this purpose, is the difference between the lowest CET1 ratio in the adverse scenario over the projection horizon and the real CET1 ratio at the starting point.
We have also conducted internal stress tests every year since 2008 as part of our ICAAP (Basel Pillar 2). Every test has proven our capacity to confront the most difficult exercises globally and locally. We carry out these capital planning processes using tools shared throughout the Group.
Due to the special situation resulting from the covid-19 pandemic, capital planning capacities and stress tests enabled us to analyse various pandemic scenarios and ensure capital adequacy in each of them.
We incorporate an analysis of the potential impact of climate risks (transition risk and physical risk) into internal stress exercises in addition to expressly considering them in the macroeconomic scenarios definitions, in line with industry best practices and supervisory expectations.
In 2022, Santander participated in the ECB's first climate risk stress test comprising three parts: first, the supervisor assessed entities’ internal capacities; second, the entities provided information on their main customers' emissions and revenue shares by activity sector to the supervisor; and third, the ECB made projections under various transition risk, heat wave risk and flood risk scenarios. The ECB published aggregate results for the industry as a whole.
371
2023 EBA stress test
In late July, the European Banking Authority (EBA) published the results of its 2023 EU-wide stress test, which involved the main banks from the EU.
This exercise assesses the resilience of these banks' main balance sheet and income statement items under two different macroeconomic scenarios (baseline and adverse).
Balance sheets at the end of 2022 were used as a starting point and the expected behaviour of business models was compared in order to gauge the expected losses and the ability of the balance sheet to withstand such losses without requiring external support.
As with previous exercises, there was no minimum capital threshold to meet. However, the results were taken into account when determining the SREP requirements.
The baseline scenario assumes the most likely economic performance according to the models used by the supervisor. On the other hand, the very unlikely adverse scenario assumes a severe deterioration in both macroeconomic and global financial market conditions.
This year, the scenarios used to project the evolution of the Group's main businesses were as follows:
| Gross Domestic Product (GDP) | |||||||||||||||||||||||||||||||||||||||||||||||||||||
| Change (%) | |||||||||||||||||||||||||||||||||||||||||||||||||||||
| Spain | UK | US | Mexico | Brazil | Chile | ||||||||||||||||||||||||||||||||||||||||||||||||
| 2023 | 2023-25 | 2023 | 2023-25 | 2023 | 2023-25 | 2023 | 2023-25 | 2023 | 2023-25 | 2023 | 2023-25 | ||||||||||||||||||||||||||||||||||||||||||
| Baseline scenario | 1.3 | 6.1 | 0.3 | 3.2 | 1.0 | 4.0 | 1.2 | 5.1 | 1.0 | 4.9 | -1.0 | 3.3 | |||||||||||||||||||||||||||||||||||||||||
| Adverse scenario | -2.6 | -5.4 | -4.8 | -8.5 | -5.7 | -4.5 | -4.6 | -6.8 | -4.0 | -5.5 | -7.0 | -7.9 | |||||||||||||||||||||||||||||||||||||||||
According to the results obtained in this stress test, under the adverse scenario Santander would destroy 170 bps of fully-loaded CET1 capital, the best result among peers who destroyed on average 418 bps. The average of European banking system was 459 bps.
This implies that, in absolute terms, the Group at the end of the stressed horizon, would have a fully-loaded CET1 ratio 30 bps better than the average of its European peers.
Even in the adverse scenario, the cumulative projections of the Group's income statement show a profit of EUR 6,582 million, well above our peers and the system, which, on average, resulted in losses of EUR 3,129 million and EUR 1,404 million, respectively.
| Fully-loaded CET1 ratio 2025 vs 2022 | Profit after tax (accumulated 3 years) | |||||||
| Adverse scenario. Basis points | Adverse scenario. EUR million | |||||||
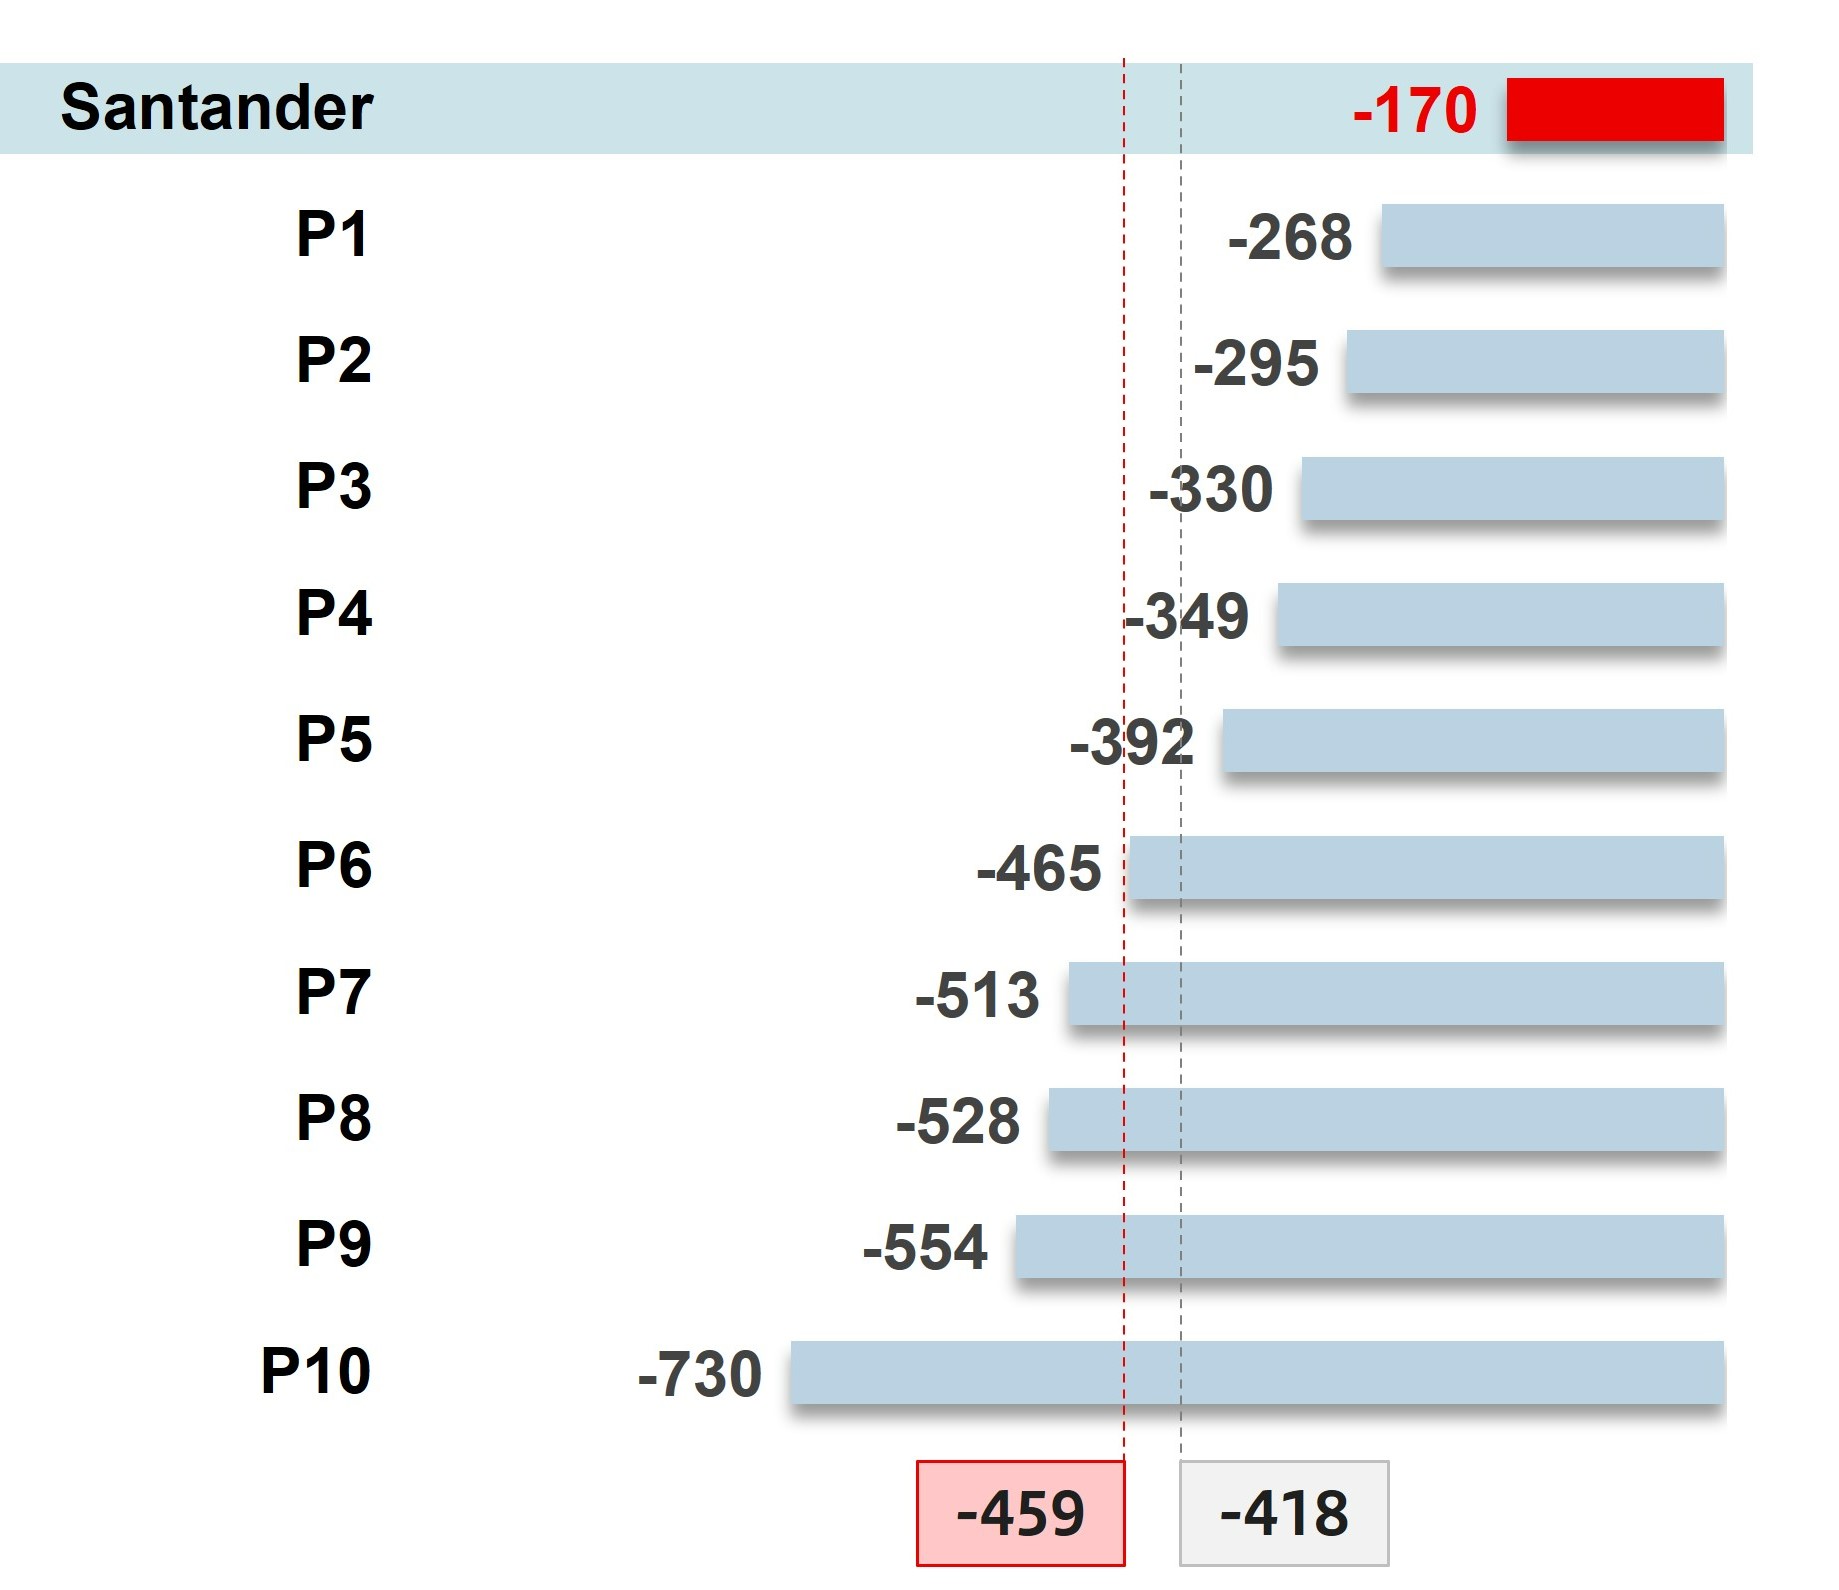 | 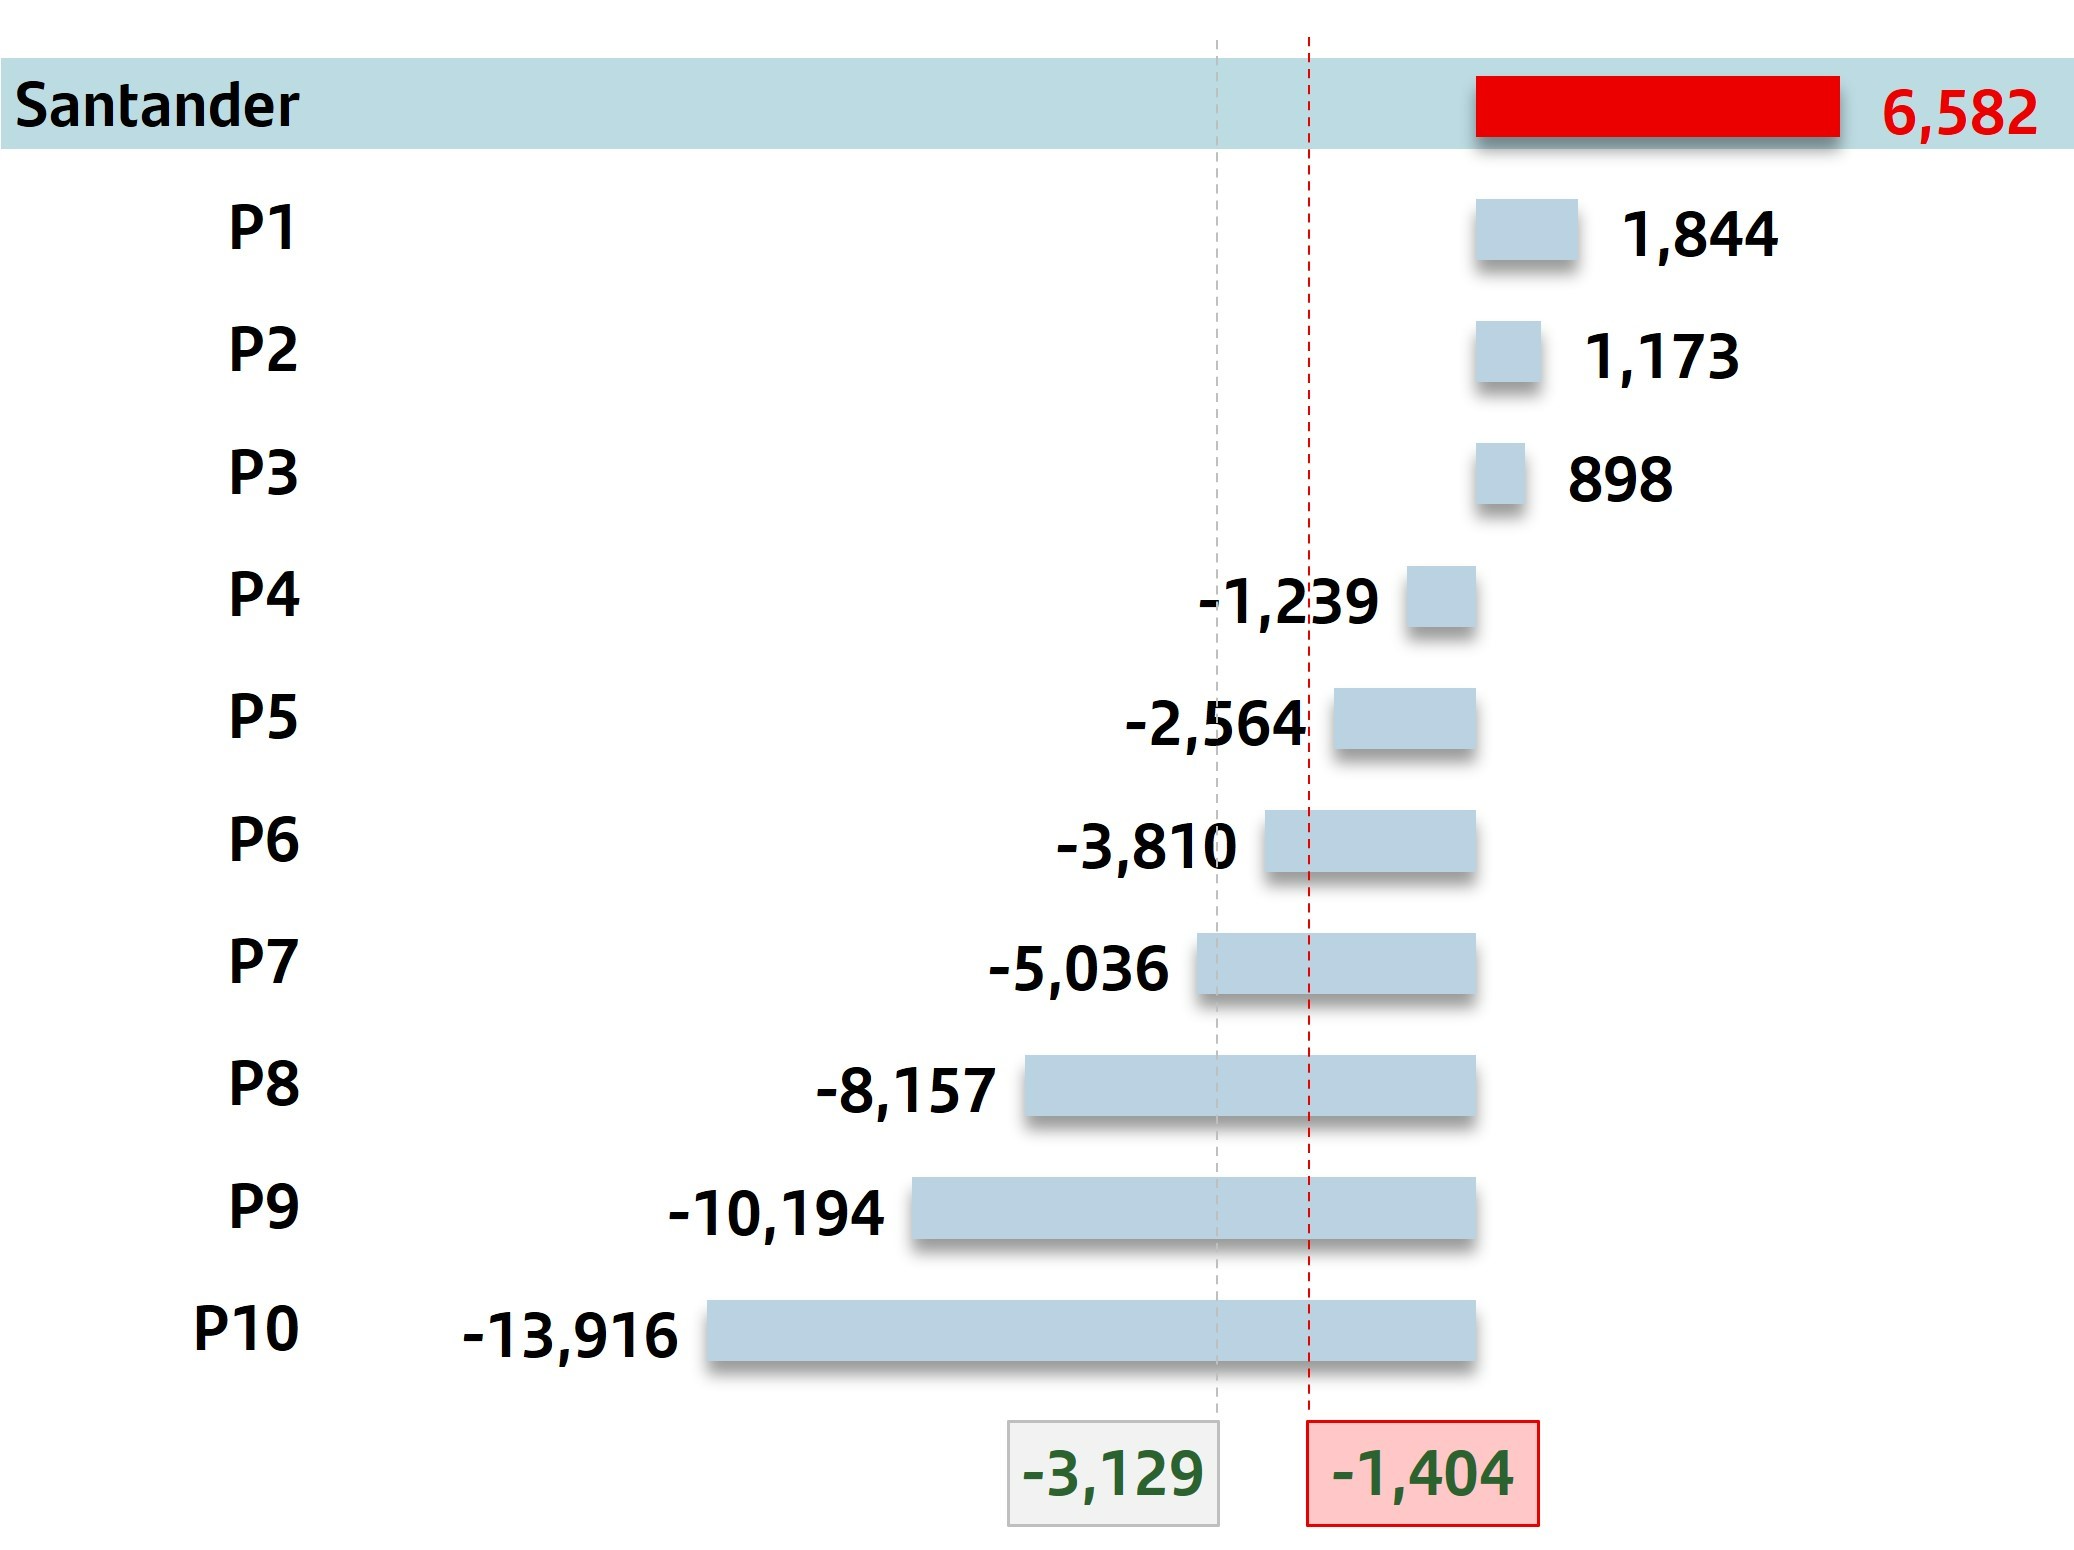 | |||||||
| Peer average | System | ||||||||||||||||||||||
372
Total Loss-Absorbing Capacity (TLAC) and Minimum Requirement for own funds and Eligible Liabilities (MREL)
In November 2015, the FSB published the TLAC term sheet based on the previously published principles for crisis management frameworks. It aims to ensure global systemically important banks (G-SIBs) will have the capacity to absorb losses and recapitalize as required to maintain critical functions during and immediately after resolution proceedings without compromising public funds or financial stability.
From 1 January 2022, the TLAC term sheet requires each G-SIB to have an individually set minimum TLAC level that is the greater of 18% of risk-weighted assets and 6.75% of the Basel III Tier 1 leverage ratio exposure.
Some jurisdictions have already transposed the TLAC term sheet into law (as is the case in Europe, in the US and in Mexico as of 1 January 2023); however, other jurisdictions where we operate (e.g. Brazil) have yet to do so.
In Europe, the final texts of CRR 2 and BRRD 2, which amend the resolution framework, were published in June 2019. One of the main objectives of this revision was to implement the TLAC requirement in Europe.
The CRR 2, which came into force in June 2019, dictates the 18% minimum requirement for G-SIBs as set in the TLAC term sheet. It must be made up of subordinated liabilities (with the exception of a percentage of senior debt of maximum of 3.5%, with the resolution authority's authorization).
As of 31 December 2023, the TLAC of the resolution group headed by Banco Santander, S.A. stood at 26.7% of risk-weighted assets and 9.2% of the leverage ratio exposure.
The BRRD 2 was transposed into law in Spain in 2021.
G-SIBs also have a Pillar 2 requirement in addition to the minimum CRR requirement, owing to the MREL methodology in the BRRD 2.
In May 2023, Banco de España formally communicated the (binding) MREL requirement for the Banco Santander, S.A. Resolution Group (sub-consolidated), which needed be met from 1 January 2024. It was set at the highest of 29.81% of the Resolution Group’s RWAs1 and 11.51% of the Resolution Group’s leverage ratio exposure, based on 31 December 2021 data.
As of 31 December 2023, Banco Santander, S.A. met its MREL requirements, having issued eligible instruments during the year, specifically 38.0% of RWAs and 16.3% of the leverage ratio exposure.
Of the total MREL requirement, a minimum subordination level was fixed as the highest of 10.27% of RWAs and 6.13% of the leverage ratio exposure. However, the Resolution Group headed by Banco Santander, S.A.'s minimum subordination is determined by TLAC, not by MREL, as the TLAC subordination requirement is greater. In December 2023, the MREL subordinated figures of the Resolution Group headed by Banco Santander, S.A. were 32.2% and 13.8%, respectively.
| TLAC 2023 | MREL 2023 | |||||||
| % | % | |||||||
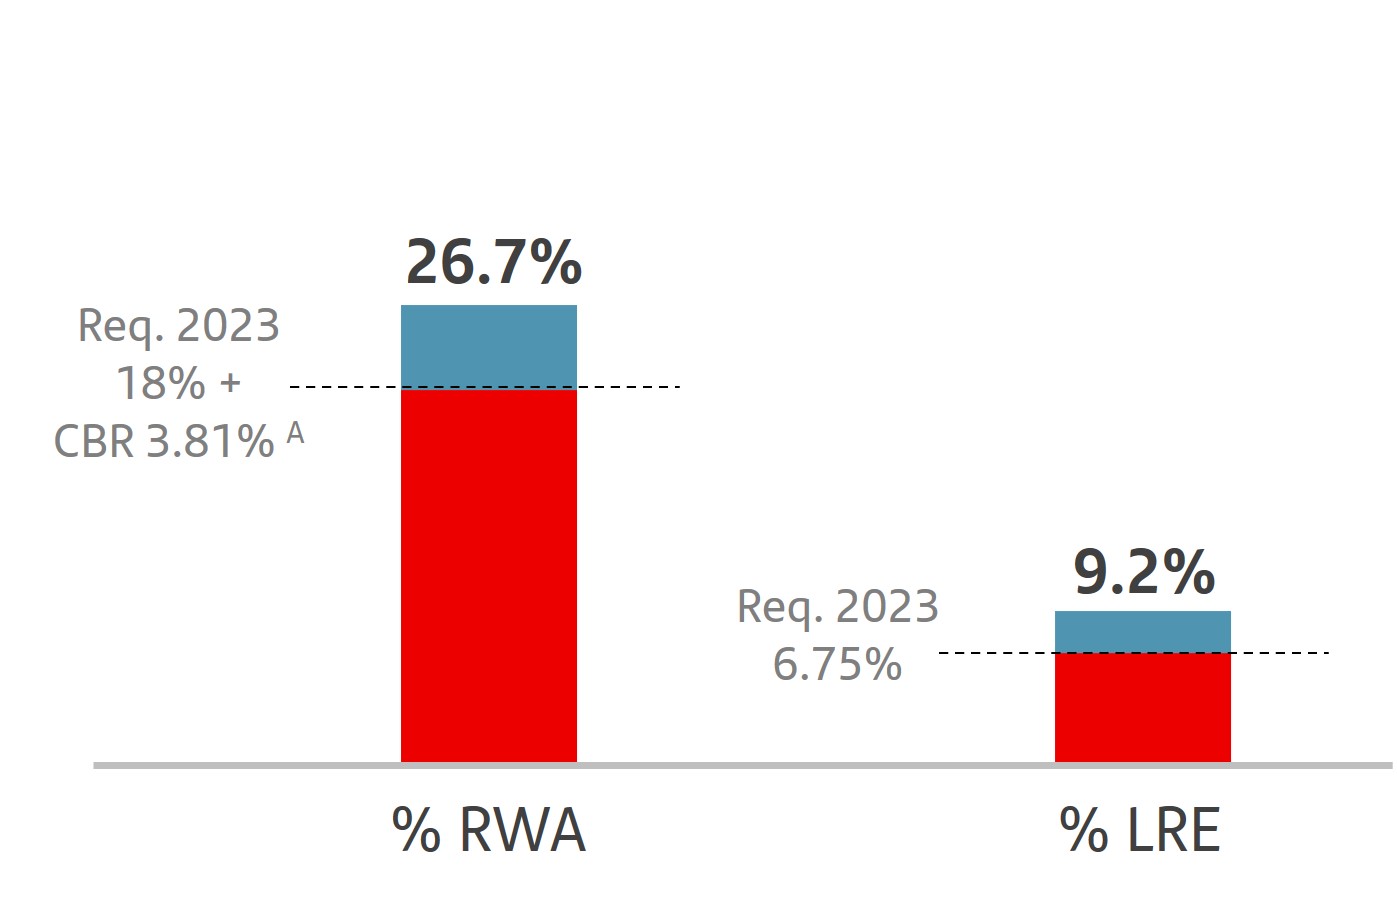 | 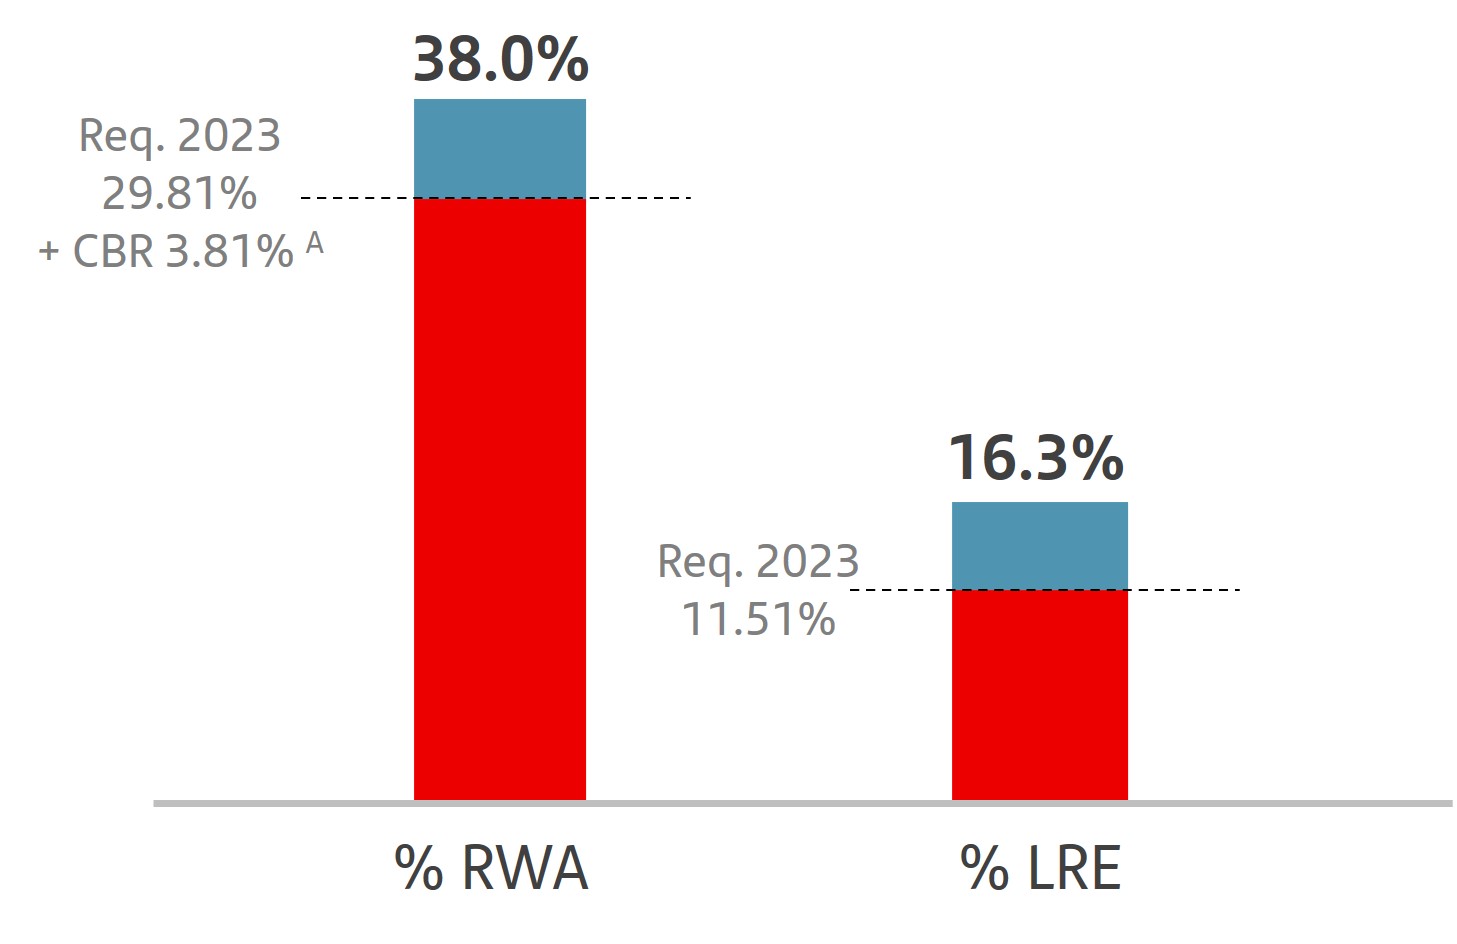 | |||||||
A.CBR: Combined Buffer Requirement, comprising a capital conservation buffer (2.5%), a G-SII buffer (1%) and a countercyclical capital buffer (0.31%). | ||||||||
1. When the requirement is set in terms of RWAs, the CET1 used to cover the combined capital buffers cannot be used to comply with the MREL requirement at the same time.
373
3.6 Special situations and resolution
Corporate special situations and resolution framework, crisis management, recovery and resolution planning
This section summarizes the main developments in the year relating to preparing and strengthening mechanisms for a potential crisis, recovery plans and preparing and executing initiatives to improve resolvability plans.
Corporate framework for special situations and resolution
The framework enables our units to aggregate and clearly interpret the various mechanisms for monitoring, escalating and managing both financial and non-financial events as well as governance. It helps link the action plans (e.g. contingency plans, business continuity plans, recovery plan) to be executed in each phase.
We base crisis governance on a collective decision-making model that is organized into and operated under severity levels to facilitate flexibility and sequential decision-making. For instance, in the most severe stages of a hypothetical crisis, the 'Gold committee', composed of the Group’s top executives supported by the 'Silver forum' and other specialist 'Bronze teams', would be the leading decision-making body.
The framework aims to encourage the sharing of best practices across the Group and continuous collaboration between subsidiaries and corporate teams (including coordination in the recovery and resolution planning phases) to continue to develop our management and control model in the most effective way.
Two of Santander's key processes are the recovery plan and the bail-in playbook, which describes the resolution tool's execution.
Crisis management
Apart from the management of more local incidents, several events were closely monitored in 2023: the regional banking crisis in the US, the Credit Suisse intervention, several geopolitical and macroeconomic episodes (such as the war in Ukraine, elections in Argentina, armed conflict in the Middle East, monetary policy in Poland, etc.), natural disasters (e.g. Hurricane Otis in Mexico, earthquakes in Morocco and Turkey, etc.) and various cyber-security related incidents (e.g. ICBC cyber-attack).
We believe these events are idiosyncratic, particularly in the case of the regional banking crisis in the US or the Credit Suisse intervention, and conclusions should not be extrapolated to the rest of the financial system. However, the banking industry and the competent authorities highlighted certain general lessons. These include: (i) the comprehensive, forward-looking and early warning view of possible threats, (ii) the importance of crisis communication, (iii) the need for implementing crisis management governance while ensuring proper supervision/coordination mechanisms in international groups, and (iv) the need for maintaining proper crisis recovery strategies and measures, particularly with regards to liquidity.
Despite these conditions, Grupo Santander's crisis management model once again proved its robustness, highlighting two fundamental aspects for a group such as ours:
•Coordination with subsidiaries, as cooperation between the Group's different units proved to be a strength in times of crisis, through crisis governance bodies (e.g. global Silver Forum), the regular issuance of corporate guidelines and the Group's participation in the preparation and execution of simulation exercises.
•Early incident management, given the Bronze teams were able to provide a rapid and proactive response to very different critical events.
To further strengthen our crisis management model, we implemented several initiatives. In particular, we:
•introduced greater flexibility into the decision-making process (e.g. quorums of crisis management bodies);
•simplified escalation processes for both financial and non-financial events; and
•strengthened response operationalization to crisis events (e.g. development of playbooks); particularly in communication with customers and regulators.
Despite the challenges faced in 2023, we have shown that we have the right tools to appropriately respond to a wide range of potential crises. However, given the complexity of the current environment and the potential threats facing the banking industry, we remain committed to further strengthening our crisis management mechanisms and instruments.
Recovery plans
Context. Santander drew up its fourteenth corporate recovery plan in 2023. It sets out measures we have at our disposal to survive a very severe crisis without extraordinary public aid, in accordance with article 5.3 of the BRRD.
Its primary aim is to test the feasibility, effectiveness and credibility of the recovery measures as well as the suitability of the recovery indicators and their respective thresholds, above which decision-making will be escalated to cope with stress situations.
It sets out macroeconomic and financial crisis scenarios that could materialize in idiosyncratic, systemic and combined events that could lead the Group to trigger the plan.
The recovery plan should not be considered an instrument separate from our structural mechanisms to measure, manage and supervise risk. It includes the risk appetite framework (RAF), the risk appetite statement (RAS), the risk profile assessment (RPA), the business continuity management system (BCMS), the internal assessments of capital and liquidity (ICAAP and ILAAP) and other tools. It is also integrated into the Group's strategic plans.
374
Progress in 2023. In December 2022, the EBA published a consultation on its new "Guidelines on total resilience in recovery plans" draft. The most important changes include incorporating more severe scenarios that reach the near-default point and dynamically calculating resilience starting from the moment an indicator breach activates the plan. In May 2023, the ECB requested we apply these guidelines in the annual plan, even though the final version was not published until July and, therefore, not yet in force at the end of 2023 (as three months had not passed since its publication in all official EU languages). Volatility in the markets in the first quarter of 2023 (banking crisis in the US and the collapse of Credit Suisse) required special attention to liquidity resilience and the need for institutions to ensure that they have sufficient measures in place that can be implemented in a short period of time. The ECB also requested simulations to ensure the operational feasibility of various recovery options.
Like every year, the document fully covered all of the ECB’s recommendations, including:
•new forward-looking indicators to meet the EBA's Guidelines on recovery plan indicators under Article 9 of Directive 2014/59/EU, published in November 2021;
•more extreme scenarios so that all scenarios reach a near-default point according to new guidelines;
•greater detail regarding execution of all measures;
•calculations of total recovery capabilities for LCR and NSFR indicators in liquidity scenarios and for capital indicators (CET1, Total Capital Ratio and Leverage Ratio); and
•new recovery measures.
The key takeaways from our review of the 2023 corporate plan were:
•no material interdependencies between main subsidiaries;
•ample recovery capacity in all scenarios through available measures. Our geographically diversified model is a great asset from a recovery standpoint;
•sufficient capacity in each subsidiary to emerge from a recovery situation on its own, which strengthens capital and liquidity within our autonomous subsidiaries model;
•sufficiently robust governance to manage financial and non-financial stresses that vary in nature and intensity; and
•amid a serious financial or solvency crisis, no subsidiary is important enough to trigger the corporate plan by causing the severest recovery indicator levels to be breached.
These factors prove our business model and geographic diversification strategy would remain firm in a recovery situation.
Regulation and governance. Santander’s recovery plan complies with EU regulations and follows the non-binding recommendations of the Financial Stability Board (FSB) and other international bodies.
We submitted our latest plan to the Single Supervisory Mechanism in October 2023; the EBA has six months to make formal considerations.
Santander's recovery plan comprises the corporate plan (Banco Santander, S.A.) and local plans for the UK, Brazil, Mexico, the US, Germany, Argentina, Chile, Portugal, Norway and a recovery plan summary for Santander Bank Polska S.A. and Santander Consumer Bank S.A. -Poland- (as required). All subsidiaries (except Santander Chile) must draw up a local plan in compliance with local regulations and corporate requirements.
Though the board of Banco Santander, S.A. approves the corporate plan, relevant content and figures are submitted to and discussed by the Silver forum, Gold committee, risk control committee and the risk supervision, regulation and compliance committee beforehand. Local plans are approved by local bodies in coordination with the Group (as they are included in the corporate plan).
Resolution plans
The relevant authorities prepare the resolution plans and Santander cooperates with them, providing all information they request1. The members of the Crisis Management Group (CMG) upheld their decision on our Multiple Point of Entry (MPE) strategy to be used in a hypothetical resolution.
This strategy is consistent with our legal and business structure, which is organized into 11 resolution2 groups that can be resolved independently without involving other parts of the organization, given the low level of interconnection.
Meetings with the Single Resolution Board (SRB) and its working priorities letters confirmed that there are no substantial impediments to Banco Santander, S.A.’s resolvability, achieving the target set for December 2023 by the SRB. This was communicated through a high-level meeting with the CEO in October, where a heat map was presented showing that we meet all resolvability dimensions. Despite this, the SRB highlighted the need to continue to work on resolvability and meet the targets set for the new resolution planning cycle starting in 2024, which focus on the operationalization of the resolution tool.
The resolution group headed by Banco Santander, S.A. underwent a deep-dive on the potential separability of one of its subsidiaries. The preliminary conclusion of this analysis was positive.
In 2023, we prepared the multi-annual work plan to continue to meet the resolution planning requirements. Banco Santander, S.A.’s board of directors approved it in January 2024, prior to its definitive submission to the SRB and in which the following actions, among others, were defined:
1.With the exception of the US, where individual entities draw up their own resolution plans.
2.In 2023, the SRB approved the integration of the Santander Totta (Portugal) resolution group into the resolution group headed by Banco Santander, S.A. creating a new resolution group called Banking Union, hence going from 12 resolution groups to 11.
375
1) Conduct initial tests to measure capability to provide high quality data for resolution valuations
In previous years, Banco Santander, S.A. conducted a self-assessment of the capabilities of its information systems to provide valuation data to the SRB. The SRB asked us to carry out a real-time test in 2024 and share with them the resulting data for each of the relevant subsidiaries of Banco Santander, S.A. within the resolution group known as Banking Union.
2) Conduct a liquidity exercise based on the joint SRB-ECB liquidity report developed in October 2023
In October 2023, we presented a new liquidity report jointly required by the SRB and the ECB. In 2024, we will conduct a liquidity exercise aiming to strengthen our liquidity reporting capabilities during and after resolution. We will also need to take into account the SRB's comments on the 2023 liquidity exercise.
3) Demonstrate the separability of relevant subsidiaries in the resolution group headed by Banco Santander, S.A.
We will continue the work on separability, an area that was established as a priority for Santander in the last resolution planning cycle, and improve Santander's ability to implement transfer tools in the event of resolution by developing an advanced separability analysis report.
This analysis will identify potential obstacles and mitigating factors to ensure the subsidiaries' operational and business continuity if separated from the Group.
4) Test the internal recapitalization resolution tool and the internal loss transfer and recapitalization mechanism, together with information system capabilities
Given the results of the internal recapitalization testing exercises in previous years, Banco Santander is expected to continue to test its internal recapitalization preparation through a test focused on its information systems' capabilities, internal and external execution and communication, as described in the Bail-in Playbook. Testing should also include the internal loss transfer and recapitalization mechanism (ILTRM) in place.
We expect the next version of the recapitalization manual, to be completed in 2024, will meet all the requirements specified by the SRB based on the lessons learned from the tests. The subsidiaries required by the SRB are also expected to continue to develop and complete the ILTRM manuals.
5) Continue the work on Management Information Systems
We expect to complete all reporting manuals by 2024, including those required for the timely provision of accurate information for internal recapitalization and valuation datasets. In the update, we will incorporate lessons learned from the tests and comments from the SRB.
6) Guarantee operational continuity in resolution situations.
As in 2022, in 2023 we identified the essential services that support core business lines, as well as their operational assets and critical personnel. We also redrafted any service contracts that did not contain the operational continuity clause. We will continue this work stream in 2024.
We continued to work on making contingency plans for market infrastructure services more operational and executive.
We addressed the development of retention and succession plans.
376
4. Financial information
by segment
by segment
4.1 Description of segments during 2023
We base segment reporting on financial information presented to the chief operating decision maker, which excludes certain statutory results items that distort year-on-year comparisons and are not considered for management reporting. This financial information (underlying basis) is computed by adjusting reported results for the effects of certain gains and losses (capital gains, write-downs, impairment of goodwill, etc.). These gains and losses are items that management and investors ordinarily identify and consider separately to better understand the underlying trends in the business (see also note 52.c to the Santander financial statements).
Santander has aligned the information in this chapter with the underlying information used internally for management reporting and with that presented in the Group's other public documents.
Santander's executive committee has been selected to be its chief operating decision maker. The Group's operating segments reflect its organizational and managerial structures. The executive committee reviews internal reporting based on these segments to assess performance and allocate resources.
During 2023, the segments were split by geographic area in which profits were earned or by type of business. We prepared the information by aggregating the figures for Santander’s various geographic areas and business units, relating it to both the accounting data of the business units integrated in each segment and that provided by management information systems. The same general principles as those used in the Group were applied.
In 2023, Santander maintained the criteria applied in 2022, with two exceptions:
•In the secondary segments: usual annual customer perimeter adjustment between Retail Banking and Santander Corporate & Investment Banking and between Retail Banking and Wealth Management & Insurance.
•In the Group's financial statements: as a result of the implementation from 1 January 2023 of the amendments to IFRS 17 (new general accounting standard for insurance contracts), the Group retrospectively performed a reclassification in the balance sheet to 'Liabilities under insurance or reinsurance contracts', related to the different treatment established by this new standard for the components of an insurance contract. This reclassification was made in the corresponding segments.
For comparison purposes, the 2022 data have been restated to include these changes.
In terms of the operating segment structure, the Group maintained the two levels of segmentation applied in 2022.
Primary segments
This primary level of segmentation, which was based on the Group’s management structure in 2023, comprised five reportable segments: four operating areas plus the Corporate Centre. The operating areas in 2023 were:
Europe: comprised all business activity carried out in the region, except that included in Digital Consumer Bank. Detailed financial information is provided on Spain, the UK, Portugal and Poland.
North America: comprised all the business activities carried out in Mexico and the US, which includes the holding company (SHUSA) and the businesses of Santander Bank, Santander Consumer USA (SC USA), the specialized business unit Banco Santander International, the New York branch and Santander US Capital Markets (SanCap).
South America: included all the financial activities carried out by Grupo Santander through its banks and subsidiary banks in the region. Detailed information is provided on Brazil, Chile, Argentina, Uruguay, Peru and Colombia.
Digital Consumer Bank: included Santander Consumer Finance, which incorporates the entire consumer finance business in Europe, Openbank and Open Digital Services (ODS).
377
Secondary segments
At this secondary level in 2023, Grupo Santander was structured into Retail Banking, Santander Corporate & Investment Banking (SCIB), Wealth Management & Insurance (WM&I) and PagoNxt.
Retail Banking: this segment covered all customer banking businesses, including consumer finance, except those of corporate banking which were managed through Santander Corporate & Investment Banking and asset management, private banking and insurance, which are managed by Wealth Management & Insurance. The results of the hedging positions in each country were also included, conducted within the sphere of their respective assets and liabilities committees.
Santander Corporate & Investment Banking: this segment included global corporate banking, investment banking and markets worldwide including treasuries managed globally, as well as equity business.
Wealth Management & Insurance: included the asset management business (Santander Asset Management), the corporate unit of Private Banking and International Private Banking in Miami and Switzerland (Santander Private Banking) and the insurance business (Santander Insurance).
PagoNxt: this included digital payment solutions, providing global technology solutions for our banks and new customers in the open market. It was structured into four businesses: Merchant, International Trade, Payments and Consumer.
In addition to these operating units, both primary and secondary segments, the Group maintained the Corporate Centre, which included the centralized activities relating to equity stakes in financial companies, financial management of the structural exchange rate position, assumed within the sphere of the Group’s assets and liabilities committee, as well as management of liquidity and shareholders’ equity via issuances.
As the Group’s holding entity, this area managed all capital and reserves and allocations of capital and liquidity with the other businesses. It did not incorporate the costs related to the Group’s central services (charged to the areas), except for corporate and institutional expenses related to the Group’s functioning.
The businesses included in each of the primary segments in this report and the accounting principles under which their results are presented here may differ from the businesses included and accounting principles applied in the financial information separately prepared and disclosed by our subsidiaries (some of which are publicly listed) which in name or geographical description may seem to correspond to the business areas covered in this report. Accordingly, the results of operations and trends shown for our business areas in this document may differ materially from those of such subsidiaries. As described in section 3 'Group financial performance' above, the results of our business areas presented below are provided on the basis of underlying results only and generally including the impact of foreign exchange rate fluctuations. However, for a better understanding of the changes in the performance of our business segments, we also provide and discuss the year-on-year changes to our results excluding such exchange rate impacts. The statements included in this section regarding Santander's competitiveness and that of its subsidiaries have been produced by the Group based on public information (corporate websites of competing entities and information published by national banking institutions). | ||||||||
378
4.2 Summary of the Group's main business areas' income statements
| 2023 | ||||||||||||||||||||
| Main items of the underlying income statement | ||||||||||||||||||||
| EUR million | ||||||||||||||||||||
| Primary segments | Net interest income | Net fee income | Total income | Net operating income | Profit before tax | Profit attributable to the parent | ||||||||||||||
| Europe | 15,910 | 4,399 | 21,439 | 12,409 | 8,195 | 5,482 | ||||||||||||||
| Spain | 6,641 | 2,699 | 10,132 | 5,905 | 3,399 | 2,371 | ||||||||||||||
| United Kingdom | 5,152 | 338 | 5,525 | 2,779 | 2,107 | 1,545 | ||||||||||||||
| Portugal | 1,465 | 464 | 1,982 | 1,440 | 1,314 | 896 | ||||||||||||||
| Poland | 2,543 | 589 | 3,182 | 2,320 | 1,392 | 674 | ||||||||||||||
| Other | 109 | 309 | 618 | (35) | (17) | (3) | ||||||||||||||
| North America | 10,159 | 2,192 | 13,174 | 6,708 | 2,837 | 2,354 | ||||||||||||||
| US | 5,742 | 766 | 7,209 | 3,531 | 863 | 932 | ||||||||||||||
| Mexico | 4,408 | 1,374 | 5,899 | 3,311 | 2,119 | 1,560 | ||||||||||||||
| Other | 8 | 52 | 66 | (133) | (145) | (138) | ||||||||||||||
| South America | 13,040 | 4,684 | 17,971 | 11,050 | 4,608 | 3,038 | ||||||||||||||
| Brazil | 9,116 | 3,462 | 13,104 | 8,574 | 2,911 | 1,921 | ||||||||||||||
| Chile | 1,383 | 572 | 2,285 | 1,265 | 951 | 582 | ||||||||||||||
| Argentina | 1,879 | 396 | 1,544 | 769 | 505 | 386 | ||||||||||||||
| Other | 662 | 254 | 1,038 | 441 | 241 | 150 | ||||||||||||||
| Digital Consumer Bank | 4,193 | 796 | 5,502 | 2,884 | 2,019 | 1,199 | ||||||||||||||
| Corporate Centre | (41) | (13) | (439) | (829) | (961) | (998) | ||||||||||||||
| TOTAL GROUP | 43,261 | 12,057 | 57,647 | 32,222 | 16,698 | 11,076 | ||||||||||||||
| Secondary segments | ||||||||||||||||||||
| Retail Banking | 37,985 | 7,661 | 45,254 | 25,858 | 10,872 | 7,436 | ||||||||||||||
| Corporate & Investment Banking | 3,485 | 2,190 | 8,296 | 4,905 | 4,570 | 3,078 | ||||||||||||||
| Wealth Management & Insurance | 1,739 | 1,265 | 3,396 | 2,240 | 2,235 | 1,637 | ||||||||||||||
| PagoNxt | 93 | 954 | 1,140 | 49 | (17) | (77) | ||||||||||||||
| Corporate Centre | (41) | (13) | (439) | (829) | (961) | (998) | ||||||||||||||
| TOTAL GROUP | 43,261 | 12,057 | 57,647 | 32,222 | 16,698 | 11,076 | ||||||||||||||
| Profit attributable to the parent distribution | ||
Distribution A by primary segment. 2023 | ||
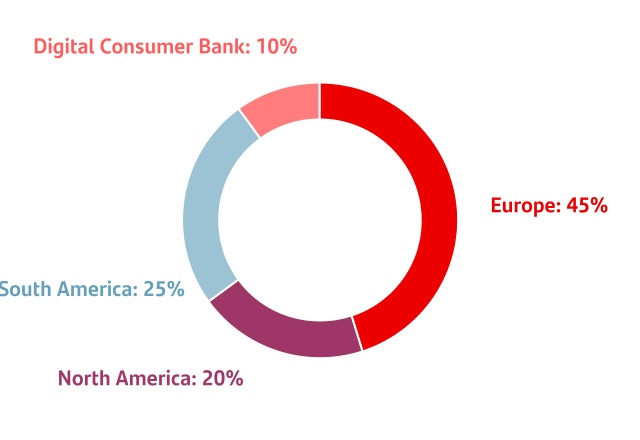
A. As a % of operating areas. Excluding the Corporate Centre.
| Profit attributable to the parent. 2023 | ||
| EUR million. % change YoY | ||
| Europe | | |||||||
| ||||||||
| ||||||||
| ||||||||
| North America | | |||||||
| ||||||||
| South America | | |||||||
| ||||||||
| ||||||||
| Digital Consumer Bank | DCB | |||||||
| Global businesses |  | |||||||
 | ||||||||
 | ||||||||
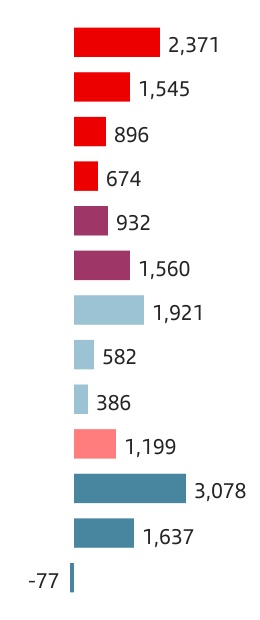
| Var. | Var. B | ||||
| +52 | % | +52 | % | ||
| +11 | % | +13 | % | ||
| +68 | % | +68 | % | ||
| +85 | % | +80 | % | ||
| -48 | % | -46 | % | ||
| +29 | % | +17 | % | ||
| -25 | % | -25 | % | ||
| -14 | % | -15 | % | ||
| +19 | % | +462 | % | ||
| -8 | % | -7 | % | ||
| +9 | % | +20 | % | ||
| +46 | % | +48 | % | ||
| -64 | % | -63 | % | ||
B. Changes in constant euros.
379
| 2022 | ||||||||||||||||||||
| Main items of the underlying income statement | ||||||||||||||||||||
| EUR million | ||||||||||||||||||||
| Primary segments | Net interest income | Net fee income | Total income | Net operating income | Profit before tax | Profit attributable to the parent | ||||||||||||||
| Europe | 12,565 | 4,493 | 18,030 | 9,507 | 5,482 | 3,810 | ||||||||||||||
| Spain | 4,539 | 2,818 | 8,233 | 4,236 | 2,079 | 1,560 | ||||||||||||||
| United Kingdom | 4,992 | 390 | 5,418 | 2,733 | 1,900 | 1,395 | ||||||||||||||
| Portugal | 747 | 484 | 1,295 | 793 | 775 | 534 | ||||||||||||||
| Poland | 1,976 | 528 | 2,474 | 1,782 | 789 | 364 | ||||||||||||||
| Other | 312 | 273 | 609 | (38) | (61) | (42) | ||||||||||||||
| North America | 9,705 | 1,958 | 12,316 | 6,445 | 3,790 | 2,878 | ||||||||||||||
| US | 6,140 | 771 | 7,623 | 4,025 | 2,261 | 1,784 | ||||||||||||||
| Mexico | 3,565 | 1,140 | 4,623 | 2,547 | 1,665 | 1,213 | ||||||||||||||
| Other | — | 47 | 70 | (126) | (137) | (119) | ||||||||||||||
| South America | 12,979 | 4,515 | 18,025 | 11,350 | 5,764 | 3,658 | ||||||||||||||
| Brazil | 8,901 | 3,296 | 12,910 | 8,730 | 4,055 | 2,544 | ||||||||||||||
| Chile | 1,772 | 468 | 2,449 | 1,468 | 1,062 | 677 | ||||||||||||||
| Argentina | 1,778 | 542 | 1,833 | 846 | 443 | 324 | ||||||||||||||
| Other | 527 | 210 | 832 | 306 | 205 | 112 | ||||||||||||||
| Digital Consumer Bank | 4,022 | 843 | 5,269 | 2,807 | 2,237 | 1,308 | ||||||||||||||
| Corporate Centre | (652) | (19) | (1,487) | (1,858) | (2,022) | (2,049) | ||||||||||||||
| TOTAL GROUP | 38,619 | 11,790 | 52,154 | 28,251 | 15,250 | 9,605 | ||||||||||||||
| Secondary segments | ||||||||||||||||||||
| Retail Banking | 34,855 | 7,654 | 42,674 | 24,123 | 11,785 | 7,933 | ||||||||||||||
| Corporate & Investment Banking | 3,548 | 1,981 | 7,378 | 4,476 | 4,097 | 2,817 | ||||||||||||||
| Wealth Management & Insurance | 847 | 1,293 | 2,635 | 1,581 | 1,531 | 1,119 | ||||||||||||||
| PagoNxt | 22 | 881 | 953 | (71) | (141) | (215) | ||||||||||||||
| Corporate Centre | (652) | (19) | (1,487) | (1,858) | (2,022) | (2,049) | ||||||||||||||
| TOTAL GROUP | 38,619 | 11,790 | 52,154 | 28,251 | 15,250 | 9,605 | ||||||||||||||
380
4.3 Primary segments
 | EUROPE | Underlying attributable profit | |||||||||||||||
| EUR 5,482 mn | |||||||||||||||||
| EXECUTIVE SUMMARY | |||||||||||||||||
| Strategy | Business performance1 | Results1 | ||||||||||||
We remain focused on customer experience and service quality, and on making the structural changes needed to develop a common operating model for Europe | Our customer base grew 2% year-on-year. Loans decreased 6%, affected by higher interest rates. In customer funds, change of mix from demand to time deposits with double-digit growth in mutual funds | Underlying attributable profit rose 45% year-on-year underpinned by NII growth, significant efficiency gains (despite inflation) and controlled cost of risk | ||||||||||||
Strategy
Our aim is to create a better bank in Europe, that our customers and employees will feel a close connection with and to deliver sustainable value to shareholders and society. We aim to:
•Improve our customer experience by making headway with our omnichannel strategy and adding value to our customer interactions, towards our vision of becoming a digital bank with branches.
•Grow our business, supported by the best Group assets and leveraging our unique position, as a result of our scale and geographical diversification.
•Increase efficiency by implementing a common operating model based on simplification, exploiting the Group's global scale through common platforms and services and becoming a more agile organization.
•Maximize business value and sustainable growth focused on capital-efficient opportunities and risk management.
We expect to improve performance, profitability and efficiency, while strengthening customer experience.
In 2023, we consolidated our transformation by providing more than 16 million customers with access to our common app (full migration in Poland and available in the UK), by making the shared services operating model more robust and, by increasing our ambition to work together with the launch of a new digital value proposition for sole traders. As a result of these actions, we achieved:
•sustainable business growth, increasing customer loyalty;
•efficient price and balance sheet management in a higher interest rate environment;
•strong cost discipline, which led to a better efficiency ratio, despite the inflationary environment;
•solid risk management which enabled us to keep the cost of risk under control; and
•greater shareholder value, with an RoTE of 14.5% (up from 9.3% in 2022).
| Europe. Customers | ||||||||||||||||||||||||||||||||||||||||||||
 |  | | | | ||||||||||||||||||||||||||||||||||||||||
 | Total customers | Thousands | 46,293 | 15,023 | 22,481 | 2,908 | 5,877 | |||||||||||||||||||||||||||||||||||||
| YoY | +2 | % | +5 | % | 0 | % | -1 | % | +3 | % | ||||||||||||||||||||||||||||||||||
 | Active customers | Thousands | 28,538 | 8,367 | 13,864 | 1,838 | 4,465 | |||||||||||||||||||||||||||||||||||||
| YoY | +1 | % | +7 | % | -1 | % | +3 | % | +3 | % | ||||||||||||||||||||||||||||||||||
381
Strategy by country in 2023:
| Spain | ||||
In 2023, we maintained our customer-centric strategy: attracting more customers, increasing their loyalty and creating more profitable relationships that enable us to generate sustainable value for shareholders and society. In this regard:
•We increased our customer base (+700 thousand), both in individuals and businesses. We doubled the growth rate in loyal customers compared to 2022, leading the market in capturing transactionality with relevant market share gains in both payroll and PoS.
•We continued to improve our customer experience, shifting towards simple, end-to-end digital and omni-channel processes, with a data-driven commercial strategy, increasing hyper-personalization, so that we can improve services efficiently.
•We maintained our active and forward-looking risk management by reducing provisions in a complex macroeconomic environment, keeping the cost of risk stable.
As a result of our work during the year, we achieved record results with 64% growth year-on-year in profit before tax, driven by the growth in the customer base and good price and balance sheet management, making the most of higher interest rates. We were named Bank of the Year 2023 in Spain by The Banker, an award that recognizes our #ObsesionXElCliente strategy and the transformation process underway.
| United Kingdom | ||||
We continued to help and support our customers face the pressures of the current economic environment, offering the right products and services as well as supporting them with their finances when they need it. Our strategy delivers strong liquidity, funding and capital with a prudent approach to risk. In 2023:
•we provided competitive products for savers, including an easy access savings account, and helped home owners struggling with higher interest rates;
•customer loans and deposits decreased in line with the market and we maintained pricing discipline; and
•our clear strategy and prudent approach to risk enabled us to continue to support our customers through current and future economic challenges.
| Portugal | ||||
During 2023, we continued to execute our commercial and digital transformation strategy, focused on selective growth, service quality and profitability, which enabled us to grow in loyal and digital customers.
•Activity reflected a higher interest rate environment, with household and corporate deleveraging and lower loan demand.
•We continued to deliver great customer experience, both for individuals and businesses, remaining in the top 3 for NPS in both segments.
•Santander was named Best Bank in Portugal 2023 by Euromoney and Global Finance, and Best Retail Bank by World Finance, in recognition of our top customer service, innovation and dynamism in the market.
| Poland | ||||
In 2023, we continued to work primarily on improving employee and customer experience. We also worked to increase the digital accessibility of our products and services, and improve our sales and aftersales processes:
•We met our NPS target by achieving a significantly higher score.
•We were the first bank in Poland to receive the prestigious Great Place to Work certification.
•We were among the top 3 banks in the Polish market in terms of NPS.
•We won the Golden Bank award and were third in the best multichannel service quality category. We were also awarded for our personal account, cash loans and payment card. Additionally, Santander was named Best Bank in Poland in the Awards for Excellence category, and Best Bank for SMEs in Poland by Euromoney.
382
Business performance
In 2023, we focused on continuing to grow our customer base, both total and active, as well as improving revenue per customer. We also continued to develop our digitalization and customer loyalty programmes to ensure sustainable future growth.
As a result of our active credit risk management and capital allocation, loans and advances to customers declined 4% year-on-year. Minus reverse repurchase agreements and in constant euros, they decreased 6% year-on-year, across all segments, particularly in mortgages due to prepayments as customers increasingly look to reduce indebtedness given the interest rate environment.
Customer deposits remained flat compared to 2022. Minus repurchase agreements and in constant euros, they fell 2%, with a notable change in product mix towards time deposits. Also, mutual funds increased 12%, driven by the improvement in business dynamics and market recovery.
| Europe. 2023 business performance | ||||||||||||||||||||||||||||||||
| EUR billion and YoY % change in constant euros | ||||||||||||||||||||||||||||||||
 | 552 | -6% | | 725 | -1% | |||||||||||||||||||||||||||
| ||
| ||
| ||
| ||
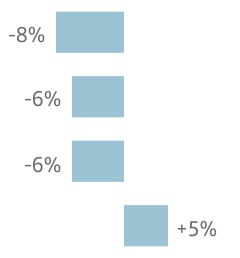
| ||
| ||
| ||
| ||
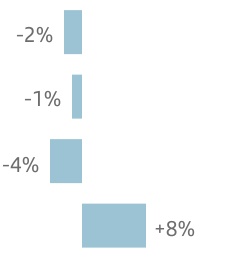
| Gross loans and advances to customers minus reverse repos | Customer deposits minus repos + mutual funds | |||||||||||||||||||||||||||||||||||||
Results
Attributable profit was EUR 5,482 million (45% of the Group's total operating areas), up 44% year-on-year. In constant euros, profit rose 45%, as follows:
•Total income increased 19% mainly driven by net interest income, which increased 27% due to the good price and balance sheet management in a context of higher interest rates. Gains on financial transactions increased 26% driven by greater activity and growth in CIB.
•Net operating income rose 31%, driven by strict control in administrative expenses and amortizations, keeping growth below inflation even as we continued to invest in transformation to improve efficiency in the future,
•Net loan-loss provisions increased 5% mainly driven by Swiss franc mortgage charges in Poland, but were partially offset by the positive performance in Spain and the UK.
•Other gains (losses) and provisions remained flat, despite the temporary levy on revenue earned in Spain and other charges related to operational risk and portfolio sales.
| Europe. Underlying income statement | ||||||||||||||
| EUR million and % change | ||||||||||||||
| / | 2022 | |||||||||||||
| 2023 | 2022 | % | % excl. FX | |||||||||||
| Revenue | 21,439 | 18,030 | +19 | +19 | ||||||||||
| Expenses | (9,030) | (8,523) | +6 | +6 | ||||||||||
| Net operating income | 12,409 | 9,507 | +31 | +31 | ||||||||||
| LLPs | (2,533) | (2,396) | +6 | +5 | ||||||||||
| PBT | 8,195 | 5,482 | +50 | +50 | ||||||||||
| Attributable profit | 5,482 | 3,810 | +44 | +45 | ||||||||||
383
| Spain | Underlying attributable profit | ||||||
| EUR 2,371 | mn | |||||||
Business performance
2023 was marked by a complex and highly uncertain environment that accelerated the deleveraging of the economy. In this context, our priority was to remain close to our customers, reflected in 28 consecutive months of net growth in active customers.
In Retail Banking, we continued to grow in short-term funding, while demand for long-term funding decreased in the year, impacted by the environment of rising interest rates and inflation. However, in the fourth quarter, new business rebounded, mainly in corporates and mortgages. We continued to gain market share in payrolls and PoS and in CIB, we consolidated our leadership in the main league tables.
Loans and advances to customers fell 7% year-on-year. In gross terms and excluding reverse repurchase agreements, they decreased 8%.
Customer deposits fell 2% year-on-year. Minus repurchase agreements, they decreased 4%, with a change of mix towards time deposits. In addition, we led the market in mutual funds, with 8% growth year-on-year.
Results
Attributable profit for the year totalled EUR 2,371 million (20% of the Group's total operating areas), 52% higher than in 2022. By line:
•Total income was up 23% propelled by net interest income, as a result of higher interest rates and customer base growth. Net fee income decreased in asset management due to a change of mix towards fixed income products and lower average volumes.
•Administrative expenses and amortizations increased 6%, affected by inflation. However, our efficiency ratio improved 7 pp to 41.7%.
•Net loan-loss provisions decreased 6% and the NPL ratio improved 21 bps to 3.06%.
•The other gains (losses) and provisions line recorded a loss of EUR 984 million, impacted by the temporary levy on revenue (EUR 202 million) and other losses associated with portfolio sales and operational risk.
| Spain. Underlying income statement | |||||||||||
| EUR million and % change | |||||||||||
| / 2022 | |||||||||||
| 2023 | 2022 | % | |||||||||
| Revenue | 10,132 | 8,233 | +23 | ||||||||
| Expenses | (4,227) | (3,998) | +6 | ||||||||
| Net operating income | 5,905 | 4,236 | +39 | ||||||||
| LLPs | (1,522) | (1,618) | (6) | ||||||||
| PBT | 3,399 | 2,079 | +64 | ||||||||
| Attributable profit | 2,371 | 1,560 | +52 | ||||||||
| United Kingdom | Underlying attributable profit | ||||||
| EUR 1,545 | mn | |||||||
Business performance
Our transformation programme continues to deliver efficiency improvements through the simplification and digitalization of key processes. We are promoting the use of digital channels with 77% of refinanced mortgage loans processed online and 92% of new current accounts opened through digital channels. The launch of our competitive Edge Up current account and broadening of our savings proposition demonstrated our continued commitment to providing value for individuals.
Loans and advances to customers were 2% lower year-on-year. In gross terms, minus reverse repurchase agreements and in constant euros, they decreased 6% impacted by cost-of-living pressures and higher customer rates, which resulted in lower new business volumes as we carefully manage our net interest margin.
Customer deposits grew 1% year-on-year. Minus repurchase agreements and in constant euros, both customer deposits and total customer funds decreased 1%. We saw lower balances in current accounts offset by higher in savings accounts. Mutual funds remained flat.
Results
Attributable profit was EUR 1,545 million (13% of the Group’s total operating areas), 11% up on 2022. In constant euros, profit grew 13%. By line:
•Total income was up 4%, driven by strong net interest income, in an environment of higher interest rates and despite greater funding costs.
•Administrative expenses and amortizations rose 4% impacted by inflation, though costs decreased in real terms. The efficiency ratio remained stable.
•Net loan-loss provisions decreased 20%. Cost of risk was 10 basis points, slightly better than in 2022.
•The negative impact from other gains (losses) and provisions decreased 16% year-on-year, as in 2022 we recorded the settlement agreed with the FCA regarding AML controls prior to 2017.
| United Kingdom. Underlying income statement | ||||||||||||||
| EUR million and % change | ||||||||||||||
| / | 2022 | |||||||||||||
| 2023 | 2022 | % | % excl. FX | |||||||||||
| Revenue | 5,525 | 5,418 | +2 | +4 | ||||||||||
| Expenses | (2,745) | (2,685) | +2 | +4 | ||||||||||
| Net operating income | 2,779 | 2,733 | +2 | +4 | ||||||||||
| LLPs | (247) | (316) | (22) | (20) | ||||||||||
| PBT | 2,107 | 1,900 | +11 | +13 | ||||||||||
| Attributable profit | 1,545 | 1,395 | +11 | +13 | ||||||||||
384
| Portugal | Underlying attributable profit | ||||||
| EUR 896 | mn | |||||||
Business performance
We executed our growth strategy supported by commercial and digital transformation processes, focused on improving service quality and profitability based on selective growth and greater customer loyalty.
Higher interest rates caused households and corporates to deleverage, which influenced both new business and the stock of mortgages, as a large number of prepayments were made at the beginning of the year. As a result, loans and advances to customers fell 6% year-on-year, both in net terms and in gross terms minus reverse repurchase agreements.
Customer deposits (with and without repurchase agreements) fell 6%, as customers took advantage of their liquidity to prepay their loans. Mutual funds continued to perform positively, up 17% year-on-year, supported by our growth strategy in higher value-added segments.
Results
Attributable profit reached EUR 896 million (7% of the Group's total operating areas), 68% higher than in 2022:
•Total income increased 53%, reflecting recovery in net interest income (+96%) supported by higher interest rates and good liability cost management. Net fee income fell slightly, impacted by lower volumes and regulatory changes affecting certain mortgage-related transactions.
•Administrative expenses and amortizations rose 8%, affected by inflation. However, the efficiency ratio improved 11 pp to 27.3%.
•Net loan-loss provisions rose from the low levels registered in 2022, bringing cost of risk to 20 bps. Credit quality remained solid as the NPL ratio fell 39 bps to 2.59%.
•The other gains (losses) and provisions line recorded losses of EUR 49 million associated with the tax contribution of the banking sector.
| Portugal. Underlying income statement | |||||||||||
| EUR million and % change | |||||||||||
| / 2022 | |||||||||||
| 2023 | 2022 | % | |||||||||
| Revenue | 1,982 | 1,295 | +53 | ||||||||
| Expenses | (542) | (502) | +8 | ||||||||
| Net operating income | 1,440 | 793 | +82 | ||||||||
| LLPs | (77) | (17) | +354 | ||||||||
| PBT | 1,314 | 775 | +69 | ||||||||
| Attributable profit | 896 | 534 | +68 | ||||||||
| Poland | Underlying attributable profit | ||||||
| EUR 674 | mn | |||||||
Business performance
In 2023, we advanced significantly with our strategy. We improved service quality and regained our top 3 NPS position. We accelerated our digitalization programme, implementing our new mobile app, as we successfully migrated our customers to OneApp and simplified several processes and products.
Loans and advances to customers were 14% up in the year. In gross terms, minus reverse repurchase agreements and in constant euros they rose 5%. We saw growth in all our products, but mainly in the corporate segment, with double-digit growth in CIB. Lending to individuals increased in both mortgages and consumer.
Customer deposits increased 13%, +5% minus repurchase agreements and in constant euros, with strong growth in time deposits. Mutual funds increased by 48%, gaining market share, based on improved customer satisfaction.
Results
Attributable profit was EUR 674 million (6% of the Group’s total operating areas). Year-on-year, profit rose 85%. In constant euros, it increased 80% as follows:
•Total revenue was 25% higher driven by net interest income on the back of higher average interest rates and strict control of the cost of funding. Net fee income also performed well.
•Administrative expenses and amortizations increased 21%, mainly driven by a tight labour market as well as some lagged effects from high inflation in 2022. The efficiency ratio improved to 27.1%.
•Net loan-loss provisions grew 48%, reflecting the increased coverage of the Swiss franc mortgage portfolio.
•Other gains (losses) and provisions were less negative, mainly due to the losses related to the mortgage payment holiday recorded in 2022.
| Poland. Underlying income statement | ||||||||||||||
| EUR million and % change | ||||||||||||||
| / | 2022 | |||||||||||||
| 2023 | 2022 | % | % excl. FX | |||||||||||
| Revenue | 3,182 | 2,474 | +29 | +25 | ||||||||||
| Expenses | (862) | (692) | +25 | +21 | ||||||||||
| Net operating income | 2,320 | 1,782 | +30 | +26 | ||||||||||
| LLPs | (674) | (440) | +53 | +48 | ||||||||||
| PBT | 1,392 | 789 | +76 | +71 | ||||||||||
| Attributable profit | 674 | 364 | +85 | +80 | ||||||||||
385
 | NORTH AMERICA | Underlying attributable profit | |||||||||||||||
| EUR 2,354 mn | |||||||||||||||||
| EXECUTIVE SUMMARY | |||||||||||||||||
| Strategy | Business performance1 | Results | ||||||||||||
We are leveraging the strength of our global businesses to accelerate the transformation of our businesses in the US and Mexico | Loans and advances to customers increased 3% year-on-year driven by business growth in both Mexico and the US. Customer funds also rose 3%, boosted by time deposits | Attributable profit amounted to EUR 2,354 million, down 18% year-on-year (-20% in constant euros) | ||||||||||||
1. In constant euros.
Strategy
We continued to pursue business transformation across the US and Mexico leveraging our global and regional scale. We:
•Accelerated the transformation of our Retail Banking and Consumer businesses in both countries by simplifying our product portfolio, streamlining our operations to increase efficiency and adopting global technology platforms to deliver an excellent digital experience.
•Continued to develop our profitable CIB and Wealth Management businesses, with targeted investments to further complete our global businesses' capabilities and strengthen growth levers.
•Strengthened our regional operating model in Technology & Operations to consolidate know-how, digitalization, digital hubs, front-office and back-office automation to drive more effective and efficient operations.
In line with our strategy to allocate capital to the most profitable businesses, in 2023:
•The Group increased its shareholding in Banco Santander México to 99.9% and subsequently delisted it from the Mexican and New York Stock Exchanges.
•The Federal Deposit Insurance Corporation (FDIC) selected Santander US to partner it in a joint venture that will manage USD 9 billion of Signature Bank’s Multifamily portfolio. We acquired a 20% equity stake and will service 100% of the assets.
•Santander US distributed dividends totalling USD 3 billion.
In line with our global responsible banking agenda and public commitments, we focused on expanding and implementing sustainable finance opportunities within our businesses in 2023.
In the US, we:
•Launched our Community Plan, a USD 13.6 billion, three-year commitment to invest in communities. This plan builds upon SBNA's successful Inclusive Communities Plan and includes commitments for community development lending and investments, small businesses, sustainable finance, philanthropy and supplier diversity.
•Executed a USD 250 million asset-based revolving credit facility on behalf of Wind Turbine & Energy Cables Corp.
In Mexico:
•We announced our initiative with Mastercard to replace all our debit cards and LikeU credit cards with sustainable models (made from recycled PVC and the first to be made accessible for the visually impaired).
•Tuiio, Santander México’s financial inclusion initiative, signed several important agreements, including with the Secretary of Security from the State of Mexico, to provide basic financial education for inmates, and with the Ministry of Economy and Labour of Chiapas to provide access to financial services and education to women, native groups and artisans that generate social impact and wellbeing.
•We partnered with the International Finance Corporation (IFC) to promote sustainable construction practices. This enables us to offer customers free advice from the IFC’s experts to obtain sustainable construction certifications for which we offer our Green Mortgage, the first-of-its-kind in Mexico providing financing at attractive pricing levels.
386
Strategy by country in 2023:
| United States | ||||
Santander operates in the competitive US market focusing on our four core segments (Consumer, Commercial, CIB and Wealth Management). This reflects the prioritization of businesses that benefit from the Group’s connectivity or competitive advantages that allow us to achieve the scale necessary to ensure attractive returns.
In 2023, the transformation of our business in the US was anchored on three key principles:
•Simplification: Rationalize businesses and products with limited scale and profitability and exit non-core portfolios. In 2023, we further streamlined processes and enhanced efficiency by combining the Commercial Real Estate and Corporate & Institutions businesses under one umbrella within Commercial banking. We reduced retail products on offer by 52% and our branch network by 14% vs 2022.
•Transformation and Network contributions: Leverage Group digital and data capabilities to advance our journey towards becoming a digital bank with branches in the US. A fully-digital consumer banking solution will modernize our business, drive scalability and lower the cost to serve of our stable retail US dollar funding base. We set in motion the necessary steps to launch our new digital nation-wide deposit platform in the third quarter of 2024.
•Profitable growth: Drive growth across target businesses while maintaining disciplined capital management. We progressed with our initiative to increase the percentage of our auto portfolio funded with retail deposits. We also expanded our partnership with Mitsubishi and signed new preferred auto lending relationships with INEOS and Lotus, among others, which support our strategy to forge deep, multi-geographic relationships with OEMs while catering to customers across the credit spectrum.
Key accomplishments in 2023 include:
•Consumer: Supported by SBNA's high percentage of FDIC insured deposits (c.66%), our retail deposit base remained stable through 2023 bank volatility.
•Commercial: SBNA remains a top 10 multifamily real estate bank lender in the US market and acquired a 20% stake in the aforementioned joint venture that will manage multifamily real estate assets retained by the FDIC following the failure of Signature Bank.
•Corporate & Investment Banking: We continued to build up our CIB business with the development of additional product and segment capabilities anchored around the creation of Santander Capital Markets (SanCap), through the merger of Amherst Pierpont Securities (APS) and Santander Investment Securities. The combined broker-dealer now offers our corporate and institutional clients significantly enhanced infrastructure, capabilities, products and services.
•Wealth Management: Assets under management and revenue continue to rise, supported by strong commercial activity and the higher rate environment.
| Mexico | ||||
Santander México is a leading universal bank in the Mexican market with scaled operations across all of Santander’s global businesses.
In 2023, we launched a transformation plan with the aim to become the best bank in terms of customer experience, double our revenue and triple profit in the coming years focused on:
•Customer acquisition: During the year we significantly improved our app to offer the best customer experience (active customers grew 6% year-on-year), by incorporating several new functionalities, including: sending and receiving money with a mobile number, blocking and requesting replacement cards and transferring funds to new bank accounts with no wait time.
•Simplification and automation: We began to implement our new branch model, opening the first multi-segment branch that enhances synergies among the different businesses and offers a comprehensive service to our customers. We also opened our fourth Work Café.
•Continuous innovation: Our culture of innovation can be seen across the business. For example, in cards, we created our 100% digital offerings (LikeU and Samsung cards), our differentiated value proposition continued to take shape
| North America. Customers | ||||||||||||||||||||||||||||||||
 | | | ||||||||||||||||||||||||||||||
| Total customers | Thousands | 25,027 | 4,510 | 20,517 | |||||||||||||||||||||||||||
| YoY | 0 | % | 0 | % | +1 | % | ||||||||||||||||||||||||||
| Active customers | Thousands | 14,486 | 4,223 | 10,263 | |||||||||||||||||||||||||||
| YoY | +3 | % | +2 | % | +6 | % | ||||||||||||||||||||||||||
387
through innovations in Cashback, exclusive pre-sales with high profile artists and our Unique Rewards loyalty programme for the high-income segment.
In auto, we reached new alliances with BYD, a leading global new energy vehicle company, to provide accessible financing for sustainable vehicles and GAC Motor. We increased our financing participation with our main partners (Mazda, Suzuki and Honda). We also increased personalized attention, sped up formalization times through digital specialists and launched plans with preferred conditions for groups such as universities, payroll or high income.
•Enhanced digital offerings: In consumer, we continued to increase customer loyalty, as well as promote early customer engagement through digital payroll loans and faster customer processes with pre-approved loan campaigns.
In mortgages, all products, launches and offers are now digitally processed. We were the first bank to cut mortgage rates for certain segments. Also, we launched the first green mortgage in the country.
In deposits, we launched Cuenta Digital Lite, a digital checking account that can be opened in five minutes.
Business performance
Loans and advances to customers rose 2% year-on-year. In gross terms, minus reverse repurchase agreements and in constant euros, they were 3% higher driven by mortgages, credit cards, auto and payroll loans in Mexico and by Corporate & Investment Banking and Multifamily in the US.
Customer deposits grew 4% compared to 2022. Minus repurchase agreements and in constant euros, they also rose 4% driven by flows into time deposits that were incentivized by competitive interest rates to attract new customers and volumes and foster customer loyalty.
Mutual funds were flat in constant euros, as growth in Mexico was offset by a decline in the US.
| North America. 2023 Business performance | ||||||||||||||||||||||||||||||||
| EUR billion and YoY % change in constant euros | ||||||||||||||||||||||||||||||||
 | 161 | +3% | | 171 | +3% | |||||||||||||||||||||||||||
| ||
| ||
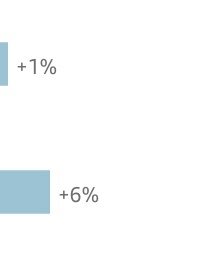
| ||
| ||
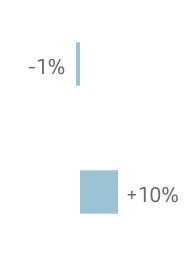
| Gross loans and advances to customers minus reverse repos | Customer deposits minus repos + mutual funds | |||||||||||||||||||||||||||||||||||||
Results
Attributable profit in 2023 was EUR 2,354 million (20% of the Group's total operating areas). Year-on-year, attributable profit decreased 18%. In constant euros, profit fell 20%, by line:
•Total income increased 5% year-on-year. Net interest income growth (+3%) was mainly driven by Mexico, supported by the higher interest rate environment and greater loan volumes. Net fee income rose 7% driven mainly by credit cards and insurance in Mexico and CIB in the US. Gains on financial transactions more than doubled, driven by excellent results in CIB in both countries.
•Other operating income declined due to leasing in the US where there was an increased proportion of repurchases at dealerships and growth in electric vehicle leases which obtain a fiscal benefit (recorded upfront in the tax line) that was partially passed through to customer rates.
•Administrative expenses and amortizations were 8% higher impacted by inflation and investments in technology, digitalization and transformation initiatives.
•Net loan-loss provisions rose 45% reflecting the normalization in retail portfolios in both countries, performing in line with expectations at the beginning of the year.
•We recorded a EUR 138 million loss in the other gains (losses) and provisions line, more negative than a year ago due to strategic restructuring costs in the US.
| North America. Underlying income statement | ||||||||||||||
| EUR million and % change | ||||||||||||||
| / | 2022 | |||||||||||||
| 2023 | 2022 | % | % excl. FX | |||||||||||
| Revenue | 13,174 | 12,316 | +7 | +5 | ||||||||||
| Expenses | (6,465) | (5,871) | +10 | +8 | ||||||||||
| Net operating income | 6,708 | 6,445 | +4 | +2 | ||||||||||
| LLPs | (3,733) | (2,538) | +47 | +45 | ||||||||||
| PBT | 2,837 | 3,790 | (25) | (27) | ||||||||||
| Attributable profit | 2,354 | 2,878 | (18) | (20) | ||||||||||
388
| United States | Underlying attributable profit | ||||||
| EUR 932 | mn | |||||||
Business performance
Loans and advances to customers were 3% lower than in December 2022. In gross terms, minus reverse repurchase agreements and in constant euros, they were 1% up year-on-year driven by CIB and Multifamily.
Customer deposits fell 2% year-on-year. Minus repurchase agreements and in constant euros, they grew 1%. Our retail deposit base at SBNA remained stable year-on-year and we saw inflows into corporate deposits. Mutual funds declined 12% as Wealth Management customers moved funds into higher yielding investment portfolios.
Results
Attributable profit in the year was EUR 932 million (8% of the Group's total operating areas), a 48% decline year-on-year. In constant euros, profit fell 46%:
•Total income decreased 3%. Higher funding costs drove down net interest income (partially mitigated by loan growth and disciplined pricing actions) and leasing income declined due to higher dealer repurchases and increased electric vehicle mix. Also, there was a one-time special assessment impacting all FDIC insured banks.
On the other hand, both net fee income and gains on financial transactions performed well, supported by higher activity in CIB and the APS acquisition.
•Administrative expenses and amortizations were 5% higher as investments to build-up our CIB franchise and Wealth Management were partially offset by savings from transformation initiatives.
•Net loan-loss provisions continued to normalize in line with expectations. However, late-stage delinquency payments remain favourable and the cost of risk remained below 2%.
•Other gains (losses) and provisions recorded a EUR 74 million loss compared to a EUR 20 million loss in 2022.
•Tax on profit was positive in the year due to tax incentives relating to electric vehicle leasing.
| United States. Underlying income statement | ||||||||||||||
| EUR million and % change | ||||||||||||||
| / | 2022 | |||||||||||||
| 2023 | 2022 | % | % excl. FX | |||||||||||
| Revenue | 7,209 | 7,623 | (5) | (3) | ||||||||||
| Expenses | (3,679) | (3,599) | +2 | +5 | ||||||||||
| Net operating income | 3,531 | 4,025 | (12) | (10) | ||||||||||
| LLPs | (2,593) | (1,744) | +49 | +53 | ||||||||||
| PBT | 863 | 2,261 | (62) | (61) | ||||||||||
| Attributable profit | 932 | 1,784 | (48) | (46) | ||||||||||
| Mexico | Underlying attributable profit | ||||||
| EUR 1,560 | mn | |||||||
Business performance
In individuals, we maintained a solid performance with double-digit growth year-on-year. We increased our market share in payroll loans (+61 bps) while we consolidated our third position in credit cards and auto (14% and 17% market shares, respectively).
Loans and advances to customers increased 17% year-on-year. In gross terms, minus reverse repurchase agreements and in constant euros, loans rose 6% driven by loans to individuals (mortgages +7%, credit cards +18% and consumer +14%). In corporates, loans increased 7% along with a 2% increase in SMEs. CIB loans fell 18%, in line with our profitability focus and risk appetite.
Customer deposits grew 21% year-on-year. Minus repurchase agreements and in constant euros, they rose 10% driven by time deposit growth (+24%) on the back of successful customer acquisition campaigns. Mutual funds increased 10% following a decline in the fourth quarter of 2022 as funds were channelled into time deposits.
Results
Attributable profit in 2023 was EUR 1,560 million (13% of the Group’s total operating areas), 29% higher year-on-year. In constant euros, it increased 17%. By line:
•Total income rose 16%, boosted by net interest income (+12%), supported by the expansion of the retail business and interest rates, net fee income (+9%) and higher gains on financial transactions.
•Administrative expenses and amortizations increased 13%, reflecting investments in technology and digitalization related to our transformation plan and talent attraction and retention. However, the efficiency ratio improved by 104 bps to 43.9%.
•Net loan-loss provisions were up 31%, due to the normalization of provisions and solid growth in loans to individuals. Asset quality remains healthy and with manageable credit risk.
•Other gains (losses) and provisions recorded a EUR 57 million loss compared to a EUR 94 million loss in 2022.
| Mexico. Underlying income statement | ||||||||||||||
| EUR million and % change | ||||||||||||||
| / | 2022 | |||||||||||||
| 2023 | 2022 | % | % excl. FX | |||||||||||
| Revenue | 5,899 | 4,623 | +28 | +16 | ||||||||||
| Expenses | (2,588) | (2,076) | +25 | +13 | ||||||||||
| Net operating income | 3,311 | 2,547 | +30 | +18 | ||||||||||
| LLPs | (1,135) | (788) | +44 | +31 | ||||||||||
| PBT | 2,119 | 1,665 | +27 | +15 | ||||||||||
| Attributable profit | 1,560 | 1,213 | +29 | +17 | ||||||||||
389
 | SOUTH AMERICA | Underlying attributable profit | |||||||||||||||
| EUR 3,038 mn | |||||||||||||||||
| EXECUTIVE SUMMARY | |||||||||||||||||
| Strategy | Business performance1 | Results1 | ||||||||||||
We are focused on increasing the value we bring to the Group and on working to become the most profitable bank in each of the countries where we operate in the region | Year-on-year growth in both loans and deposits, as we aim to become the leading bank in inclusive and sustainable businesses through differential value propositions | Attributable profit reached EUR 3,038 million, 11% lower year-on-year as the strong revenue performance failed to offset higher costs and provisions | ||||||||||||
1. In constant euros.
Strategy
South America offers great growth potential, with opportunities to increase banking penetration and financial inclusion. To consolidate our leadership position in the region, we continue to focus on increasing the value we bring to the Group and on working to become the most profitable bank in each of the countries where we operate.
We continue to transform our business model, by building a digital bank with branches focused on improving customer experience, while also driving synergies across our global and regional businesses. Initiatives during the year include:
•In consumer finance, we strengthened our leadership position, reinforcing partnerships with OEMs and developing new agreements by leveraging existing ones globally. In Peru, for example, we signed nine agreements with manufacturers. In Uruguay, we launched the Mi Auto offer, which enabled us to nearly triple the number of vehicles financed. We continued to develop models in the region that speed up the approval of transactions, in addition to improving user experience. In Colombia, we adopted the Fast Track tool, which boosted originations and consolidated our position in new and used car loans, increasing our portfolio by 45% year-on-year.
•In payments, we aim to increase our market share through One Trade and Getnet, which continued to grow. In Argentina, we expanded our offering, focusing on e-commerce and host-to-host solutions for large merchants. We also increased our trade finance activity through new international solutions, such as the expansion of Ebury's services in Brazil. In addition, we are building a unique global platform which has been launched in Brazil.
•In CIB and corporates, we continued to work on the development and implementation of joint initiatives to deepen relationships with multinational clients. Our goal is to become the leading wholesale banking operator in most countries and products. To consolidate the offering in all regions, we are launching a regional Markets hub. For corporates, we are reinforcing the differential value offering through Multi-Latins and working with other countries in the Group to increase synergies in multinational companies.
•In ESG, our aim is to become the leading bank in South America in inclusive and sustainable businesses. In 2023, we developed business plans in relevant sectors such as Agro, Green Energy and Electromobility. We continued to support our microcredit business, through our Prospera and Surgir programmes, with 50% portfolio growth year-on-year. This business already provides service to more than 1.2 million customers throughout the region. In addition, to support the Group's goal of zero net emissions by 2050, we focused on supporting our customers in the transition to a low-carbon economy, providing them the advice and solutions needed, through initiatives such as WayCarbon.
Our efforts to improve customer service and satisfaction have resulted in a top 3 NPS position in three markets and substantial customer base growth in the region.
390
Main initiatives by country in 2023:
| Brazil | ||||
During the year, we focused on:
•Growing our strategic businesses to broaden business diversification, improve our service quality and increase profitability. In WM&I, we continued our retail investment plan and we completed the full acquisition of Toro. In CIB, we remained leaders in trade finance. In SMEs, we are redesigning our service model. We also had a great performance in other products such as Cards, Auto, Agro and Payrolls.
•Continuing to foster a technological culture to drive growth and generate operational efficiencies. Our technology teams are integrated with the business and we have a digital system that allows data flows and processing to improve customer experience.
•Increasing customer focus to become our customers' main bank, which enabled us to improve customer satisfaction in our channels and increase loyalty. In Select, we surpassed our 1 million customer goal at the end of 2023, reaching 1.2 million (+51% year-on-year).
| Chile | ||||
We remained focused on digitalization and improving customer satisfaction, which enabled us to maintain our top NPS position. During the year, we:
•Launched several innovative initiatives, such as: i) Más Lucas, a no-cost, interest-bearing demand account for the mass segment; ii) Work Café Expresso, a new branch format; and iii) a new service model for specialized businesses, with a particular focus on the agricultural, automotive and Multi-Latins.
•Continued to develop e-commerce and the domestic and international transfers business in payments and continued to offer integrated financing, cash management and treasury solutions to our corporate customers.
| Argentina | ||||
In Argentina, we are the leading privately-owned bank in banking business, payments, transactional services and foreign trade. During the year, these initiatives stood out:
•Santander Asset Management acquired BNP Paribas's Asset Management business in Argentina, consolidating our leadership position in the market.
•We launched our acquiring business, with Getnet third in terms of market share in this segment.
•We acquired an unregulated consumer finance company with more than 30 points of sale in the Buenos Aires metropolitan area.
All this enabled us to maintain and widen our leadership in NPS for individuals and to obtain 9% year-on-year growth in total customers.
| Uruguay | ||||
We consolidated our position as the country's leading privately-owned bank, with a business model that allows us to continue growing our customer base and expanding our loan portfolio.
•During the year, we carried out several initiatives, such as launching Getnet and creating Mi Auto, an innovative solution to finance vehicle purchases, which, in just one year, has become a leader in auto consumer financing.
•We continued to improve digitalization, offering more products online, reinforcing the SOY Santander offer for individuals and Getnet for corporates, to achieve greater customer loyalty.
•Additionally, we launched F1RST, a solution focused on innovation, security and the development of new digital assets.
| South America. Customers | ||||||||||||||||||||||||||||||||||||||||||||
 | | | | Other South America | ||||||||||||||||||||||||||||||||||||||||
| Total customers | Thousands | 73,028 | 62,804 | 4,052 | 4,771 | 1,400 | |||||||||||||||||||||||||||||||||||||
| YoY | +5 | % | +4 | % | +13 | % | +9 | % | -5 | % | ||||||||||||||||||||||||||||||||||
| Active customers | Thousands | 37,517 | 30,460 | 2,399 | 3,562 | 1,096 | |||||||||||||||||||||||||||||||||||||
| YoY | -2 | % | -4 | % | +9 | % | +11 | % | -5 | % | ||||||||||||||||||||||||||||||||||
391
| Peru | ||||
Our strategy is focused on leadership in specialized services and supporting global companies and corporates. Our model for corporate clients is highly specialized in sectors such as mining, agriculture, fishing, institutions and Multi-Latins. Our global and regional experience has enabled us to develop new businesses such as joint initiatives between CIB and corporates, as well as launch new products.
•In Wholesale Banking, we have ranked among the top three investment banks for the last three years, specifically in mergers and acquisitions, Debt Capital Markets, syndicated loans and leveraged buyouts. We are also pioneers in Global Transaction Banking solutions.
•We remain leaders in vehicle financing through our digital NeoAuto platform and our large sales force, with a market share above 30%.
•We stand out as one of the main financial inclusion entities, through our microfinance business Surgir, supporting more than 100,000 entrepreneurs since 2021.
| Colombia | ||||
We continue to offer sustainable and inclusive financial solutions and participate in the most important transactions for the country's development, with joint initiatives between CIB and Corporates, where we also continue to strengthen the Multi-Latins business.
•In consumer finance, we further strengthened our position in new and used vehicle loans, with a 47% year-on-year increase in our portfolio and an offer focused on Simple Finance for our customers. In addition, we continued to grow through our global alliances throughout the country.
•In our microcredit business, we increased our presence to 644 municipalities though Prospera, a fully-digital programme that processes payments in up to 24 hours. We also continue to promote the granting of loans to entrepreneurs, with a significant percentage granted to women, agricultural activities and charities.
| South America. 2023 business performance | ||||||||||||||||||||||||||||||||
| EUR billion and YoY % change in constant euros. | ||||||||||||||||||||||||||||||||
 | 161 | +7% | | 206 | +17% | |||||||||||||||||||||||||||
| ||
| ||
| ||
 | ||
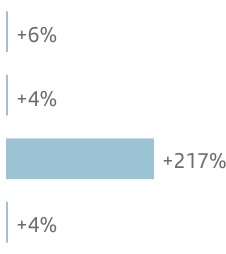
| ||
| ||
| ||
| ||
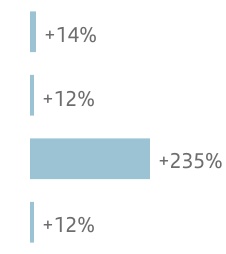
| Gross loans and advances to customers minus reverse repos | Customer deposits minus repos + mutual funds | |||||||||||||||||||||||||||||||||||||
Business performance
Loans and advances to customers climbed 6% year-on-year. Minus reverse repurchase agreements and in constant euros, gross loans were 7% higher, with increases in all countries, except Colombia.
Customer deposits rose 13% year-on-year. Minus repurchase agreements and in constant euros, they rose 15%, backed by time deposits (+18% year-on-year). Mutual funds were up 21% in constant euros.
Results
Attributable profit was EUR 3,038 million (25% of the Group’s total operating areas), 17% less than in 2022. In constant euros, profit declined 11% as follows:
•Total income rose 8% with double-digit growth in net interest income (+12%), net fee income (+14%) and gains on financial transactions (+14%). Other operating income was affected by the hyperinflation adjustment in Argentina.
•Administrative expenses and amortizations increased 17%, heavily impacted by inflation. In real terms, costs decreased 3% due to management efforts and cost discipline.
•Net loan-loss provisions rose by 9%, partially explained by lending growth. The cost of risk was practically unchanged at 3.36% (3.32% in December 2022).
•Greater loss in other gains (losses) and provisions, mainly due to Brazil.
| South America. Underlying income statement | ||||||||||||||
| EUR million and % change | ||||||||||||||
| / | 2022 | |||||||||||||
| 2023 | 2022 | % | % excl. FX | |||||||||||
| Revenue | 17,971 | 18,025 | 0 | +8 | ||||||||||
| Expenses | (6,920) | (6,675) | +4 | +17 | ||||||||||
| Net operating income | 11,050 | 11,350 | (3) | +3 | ||||||||||
| LLPs | (5,401) | (5,041) | +7 | +9 | ||||||||||
| PBT | 4,608 | 5,764 | (20) | (15) | ||||||||||
| Attributable profit | 3,038 | 3,658 | (17) | (11) | ||||||||||
392
| Brazil | Underlying attributable profit | ||||||
| EUR 1,921 | mn | |||||||
Business performance
We are expanding our strategic businesses: in WM&I, we continued our retail investment plan and completed the full acquisition of Toro in 2023. In wholesale banking, we are leaders in trade finance, FX and commodities. We remained market leaders in auto lending to individuals and continued to strengthen our strategic alliances. We saw strong growth in our agro portfolio and growth picked back up in cards in the second half of the year.
Loans and advances to customers increased 12% year-on-year. In gross terms, minus reverse repurchase agreements and in constant euros, they rose 6%, underscored by SMEs, corporates and individuals.
Customer deposits increased 22% year-on-year. Minus repurchase agreements and in constant euros, they grew 13% driven by time deposits (+16%). As mutual funds increased 15%, customer funds rose 14% in constant euros.
Results
Attributable profit in 2023 was EUR 1,921 million (16% of the Group's total operating areas), 25% lower year-on-year. In constant euros, it also decreased 25%, as follows:
•Total income rose 1%, as the good performance in fee income (+5%) and the recovery of net interest income (+2%), which was affected by the negative sensitivity to higher interest rates in the first half of the year, offset lower gains on financial transactions.
•Administrative expenses and amortizations increased 8% (+3% in real terms), impacted by salary agreements, expenses related to higher business growth and technology investments. The efficiency ratio was 34.6%.
•Net loan-loss provisions rose 6%, in line with loan growth. Both 2022 and 2023 provisions were impacted by single names in CIB. The cost of risk stood at 4.77% (4.79% in 2022).
•The negative impact of other gains (losses) and provisions increased due to higher labour provisions in 2023.
| Brazil. Underlying income statement | ||||||||||||||
| EUR million and % change | ||||||||||||||
| / | 2022 | |||||||||||||
| 2023 | 2022 | % | % excl. FX | |||||||||||
| Revenue | 13,104 | 12,910 | +1 | +1 | ||||||||||
| Expenses | (4,529) | (4,180) | +8 | +8 | ||||||||||
| Net operating income | 8,574 | 8,730 | (2) | (2) | ||||||||||
| LLPs | (4,701) | (4,417) | +6 | +6 | ||||||||||
| PBT | 2,911 | 4,055 | (28) | (29) | ||||||||||
| Attributable profit | 1,921 | 2,544 | (25) | (25) | ||||||||||
| Chile | Underlying attributable profit | ||||||
| EUR 582 | mn | |||||||
Business performance
We remained focused on digitalization, improving customer service and developing Santander Life and Más Lucas. In payments, we continued to expand Getnet and launched a new way to make international transfers, including nine more European countries. In corporates, we launched a new commercial service model, focused especially on agricultural, auto and Multi-Latin businesses.
Loans and advances to customers decreased 2% year-on-year. Minus reverse repurchase agreements and in constant euros, gross loans and advances to customers rose 4% driven by individuals (+7%), consumer (+6%) and CIB (+6%), which more than offset the fall in corporates.
Customer deposits increased 2% year-on-year. Minus repurchase agreements and in constant euros they rose 8%, underpinned by time deposits (+23%). Demand deposits fell 5%, while mutual funds grew 25% in constant euros. Total customer funds increased 12% in constant euros.
Results
Attributable profit in 2023 was EUR 582 million (5% of the Group’s total operating areas), down 14% year-on-year. In constant euros it fell 15%. By line:
•Total income decreased 8% driven by the drop in net interest income (-23%) linked to the negative sensitivity to higher interest rates. This decline was partially offset by the excellent performance of net fee income, which rose 21% mainly driven by transactional and insurance fees, and gains on financial transactions (+31%).
•Administrative expenses and amortizations rose 3% (well below inflation) and the efficiency ratio was 44.6%.
•Net loan-loss provisions decreased 9% and the cost of risk improved to 0.80% (-13 bps year-on-year). The NPL ratio stood at 5.01%.
•Other gains (losses) and provisions totalled EUR 51 million
(loss of EUR 8 million in 2022).
(loss of EUR 8 million in 2022).
| Chile. Underlying income statement | ||||||||||||||
| EUR million and % change | ||||||||||||||
| / | 2022 | |||||||||||||
| 2023 | 2022 | % | % excl. FX | |||||||||||
| Revenue | 2,285 | 2,449 | (7) | (8) | ||||||||||
| Expenses | (1,020) | (981) | +4 | +3 | ||||||||||
| Net operating income | 1,265 | 1,468 | (14) | (15) | ||||||||||
| LLPs | (365) | (399) | (8) | (9) | ||||||||||
| PBT | 951 | 1,062 | (10) | (11) | ||||||||||
| Attributable profit | 582 | 677 | (14) | (15) | ||||||||||
393
| Argentina | Underlying attributable profit | ||||||
| EUR 386 | mn | |||||||
Business performance
We continued to focus on improving customer experience, with a growth strategy to consolidate our leadership position in the transactional business and increase our customer base and our loan portfolio.
Loans and advances to customers decreased 33% year-on-year. Minus reverse repurchase agreements and in constant euros, gross loans and advances to customers were 217% higher driven by SMEs, corporates and individuals.
Customer deposits decreased 39% year-on-year. Minus repurchase agreements and in constant euros, deposits grew 190%, mainly driven by demand deposits, and mutual funds rose 355%. Customer funds rose 235% in constant euros.
Growth rates (of both volumes and results) in euros were heavily impacted by the devaluation of the Argentine peso. Additionally, growth in constant euros was strongly affected by the high inflation in the country.
Results
Attributable profit in 2023 was EUR 386 million (3% of the Group’s total operating areas), 19% higher year-on-year. In constant euros, it rose 462%:
•Total income grew 298%, well above inflation, underpinned by the good performance in net interest income, net fee income and gains on financial transactions. All of these more than offset the greater negative effect from the hyperinflation adjustment in other operating income.
•Administrative expenses and amortizations increased below total income growth. The efficiency ratio stood at 50.2%, improving 3.7 pp year-on-year and net operating income rose 330%.
•Net loan-loss provisions rose from low levels in 2022 and cost of risk stood at 6.64%, 3.7 pp higher than in December 2022.
•Other gains (losses) and provisions increased their loss due to charges relating to downsizing.
| Argentina. Underlying income statement | ||||||||||||||
| EUR million and % change | ||||||||||||||
| / | 2022 | |||||||||||||
| 2023 | 2022 | % | % excl. FX | |||||||||||
| Revenue | 1,544 | 1,833 | (16) | +298 | ||||||||||
| Expenses | (775) | (987) | (21) | +271 | ||||||||||
| Net operating income | 769 | 846 | (9) | +330 | ||||||||||
| LLPs | (150) | (132) | +14 | +437 | ||||||||||
| PBT | 505 | 443 | +14 | +438 | ||||||||||
| Attributable profit | 386 | 324 | +19 | +462 | ||||||||||
| Uruguay | Underlying attributable profit | ||||||
| EUR 187 | mn | |||||||
Business performance
During the year, we consolidated our position as the country's leading privately-owned bank. We are top 2 in NPS and continued to expand our presence in the market. Additionally, we integrated our consumer finance companies into our bank to strength our position in the country.
As a result, we were recognized as the Best Bank in the Country by Euromoney and achieved the best position among banks in the Great Place to Work (GPTW) ranking.
Loans and advances to customers increased 10% year-on-year. In gross terms, minus reverse repurchase agreements and in constant euros, they rose 12%, with growth in all segments.
Customer deposits remained flat year-on-year. In constant euros and minus repurchase agreements, they rose 2% driven by time deposits (+85%). Growth in mutual funds (+2%) led to a 2% increase in customer funds in constant euros.
Results
Attributable profit in 2023 was EUR 187 million (2% of the Group's total operating areas), up 36% year-on-year. In constant euros, it increased 32% as follows:
•Total income increased 27% boosted by net interest income, net fee income and gains on financial transactions.
•Administrative expenses and amortizations rose 14% (impacted by inflation), but grew less than total income. The efficiency ratio stood at 38.5% (-4.4 pp year-on-year) and net operating income rose 37%.
•Net loan-loss provisions increased, following the low levels recorded in 2022. Cost of risk stood at 2.70% and the NPL ratio at 2.50%.
| Uruguay. Underlying income statement | ||||||||||||||
| EUR million and % change | ||||||||||||||
| / | 2022 | |||||||||||||
| 2023 | 2022 | % | % excl. FX | |||||||||||
| Revenue | 593 | 453 | +31 | +27 | ||||||||||
| Expenses | (228) | (194) | +17 | +14 | ||||||||||
| Net operating income | 365 | 259 | +41 | +37 | ||||||||||
| LLPs | (114) | (56) | +104 | +99 | ||||||||||
| PBT | 242 | 201 | +20 | +17 | ||||||||||
| Attributable profit | 187 | 138 | +36 | +32 | ||||||||||
394
| Peru | Underlying attributable profit | ||||||
| EUR 84 | mn | |||||||
Business performance
Loans and advances to customers rose 2% year-on-year (+3% in gross terms, minus reverse repurchase agreements and in constant euros).
Customer deposits increased 35% (+36% minus repurchase agreements and in constant euros), mainly driven by demand deposits.
Results
Attributable profit of EUR 84 million in 2023 was 14% higher year-on-year. In constant euros, it also rose 14%. By line:
•Total income was up 20%, boosted by net interest income, net fee income and gains on financial transactions.
•Administrative expenses and amortizations were 23% higher, mainly driven by inflation and the launch of new businesses. The efficiency ratio stood at 36.6% and net operating income increased 19%.
•Net loan-loss provisions increased but cost of risk remained low, at 1.15%.
| Colombia | Underlying attributable profit | ||||||
| EUR 28 | mn | |||||||
Business performance
Loans and advances to customers rose 13% year-on-year. In gross terms, minus reverse repurchase agreements and in constant euros they fell 5%.
Customer deposits were up 41%, +18% minus repurchase agreements and in constant euros, driven by the good performance in both demand and time deposits (+21% and +13%, respectively).
Results
Attributable profit of EUR 28 million in 2023 was 5% higher year-on-year. In constant euros, it increased 10% as follows:
•Total income grew 32% driven by the good performance in net fee income and gains on financial transactions.
•Administrative expenses and amortizations were 23% higher. The efficiency ratio stood at 52.5%, improving 3.8 pp, and net operating income was 43% higher.
•Net loan-loss provisions rose but cost of risk remained low at 1.07%.
| Other South America. Underlying income statement | |||||||||||||||||||||||||||||
| EUR million and % change | |||||||||||||||||||||||||||||
| Net operating income | Attributable profit | ||||||||||||||||||||||||||||
| / | 2022 | / | 2022 | ||||||||||||||||||||||||||
| 2023 | 2022 | % | % excl. FX | 2023 | 2022 | % | % excl. FX | ||||||||||||||||||||||
| Peru | 155 | 131 | +18 | +19 | 84 | 73 | +14 | +14 | |||||||||||||||||||||
| Colombia | 67 | 49 | +37 | +43 | 28 | 27 | +5 | +10 | |||||||||||||||||||||
395
 | DIGITAL CONSUMER BANK | Underlying attributable profit | |||||||||||||||
| EUR 1,199 mn | |||||||||||||||||
| EXECUTIVE SUMMARY | |||||||||||||||||
| Strategy | Business performance1 | Results1 | ||||||||||||
Continue to reinforce our auto leadership through strategic alliances, leasing and subscription. In non-auto, keep upscaling our buy now, pay later business. Transformation for future growth deploying a simpler organizational structure to deliver through best-in-class digital platforms, launching new channels and products | Although the operating environment remains complex as inflation and high rates are denting consumer appetite, new lending rose 3% year-on-year, +6% in auto, and deposits grew 19%. In this environment we were focused on profitability, asset quality and providing the best customer service | Underlying attributable profit stood at EUR 1,199 million (-7% year-on-year), despite total income growth (+6% year-on-year), affected by net loan-loss provisions | ||||||||||||
1. In constant euros.
Strategy
Digital Consumer Bank (DCB) is the leading consumer finance bank in Europe in scale and profitability as it leverages Santander Consumer Finance's (SCF) auto and non-auto consumer finance footprint in Europe and Openbank’s technology stack.
SCF is Europe's consumer finance leader, present in 18 countries (16 in Europe plus China and Canada) and works through more than 130,000 associated points of sale. It provides its customers and partners with a value proposition to enhance their sales capabilities by financing products and developing advanced technologies to grant them a competitive edge. SCF aims to become the best-in-class auto financing and digital mobility service provider in Europe.
Openbank is Europe's largest 100% digital bank. It offers current accounts, cards, loans, mortgages, a state-of-the-art roboadvisor service and open platform brokerage. It is currently active in Spain, the Netherlands, Germany and Portugal, and we are working on expanding it across Europe and the Americas.
DCB’s vision is to offer competitive financing solutions to expand our European leadership in profitability and scale in auto and consumer lending by leveraging the advantages of our proprietary platforms in mobility, consumer and checkout loans and buy now, pay later (BNPL).
In 2023, DCB focused on accelerating transformation to drive future growth. Management's main priorities were to:
•secure leadership positions in global digital consumer lending, both auto and non-auto (consumer);
•continue with the transformation of our operating model in Europe, to defend our best-in-class efficiency through: i) single IT platforms, ii) a simpler operational structure, and iii) automation and processes redesign;
•grow by progressing in transformational projects in Europe, with new OEM partnerships and leasing platform in auto and through the full transition to Zinia's tech stack in consumer; and
•reduce sensitivity to interest rate rises by increasing deposit acquisition (deposits are already our primary funding source) with focus on profitability. Also, promote an originate-to-distribute model to increase balance sheet mobilization and build a more capital-light business.
| Loans and advances to customers by geographic area | ||
| December 2023 | ||
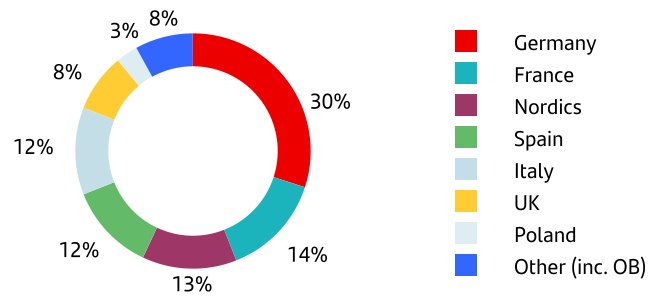
396
In 2023, we continued to expand our business reach in Europe, with new products, services and platforms and by signing new agreements with retail distributors and manufacturers. In the year, we strengthened our leadership in global digital consumer lending, focusing on growth and transformation in these areas:
1.Auto: progress with strategic initiatives to build a world-class digital offering in mobility. Aid OEMs' transformation journeys with online lending, leasing (both financial and operational), subscription offerings, and providing our partners with innovative finance and sale solutions on dealer websites and auto marketplaces. Our transformational initiatives are:
a.In leasing, we continued developing our proprietary digital leasing platform for Europe with the ambition of disrupting the market. We see it as an entire “new” business to be run, building customer loyalty by our direct relationships, providing innovative features across the value chain (key control of the asset and user from first proposal to hand back), enabling us to create a consolidated mobility-related customer view and cross-border proposition.
b.In subscription, where we are already a European leader, we continued to expand Wabi, our consumer subscription platform and Ulity, our new platform for vehicle subscription-based solutions for companies. Our auto subscription service offers flexible subscriptions across two models: i) Wabi, our direct-to-consumer own brand, is already live in Spain, Norway and Germany and will expand to other countries in the coming years, and ii) Ulity, a white label solution for OEMs and Service Car companies launched in June 2022. Through Ulity we have already entered into important agreements with pan-European ride-hailing services and OEMs.
c.In mobility, we created one digital front that connects all of our partners to enhance their experience: OEMs, digital dealers and third party marketplaces. Moreover, we further expanded transformational OEM relationships with strong electric vehicle (EV) propositions and other sizeable ongoing negotiations.
d.We are also developing our own digital channel with leading proprietary marketplaces and car advising value-added services.
e.We continued our pursuit of future market share gains while also addressing new segments and accelerating growth in high potential markets.
In 2023, we renewed our partnership with Stellantis in Europe, which will enable us to consolidate our position as their main financing partner while continue to work with the strongest OEMs in the world.
We had an auto loan book of EUR 103.5 billion in December 2023.
2.Consumer (Non-Auto): gain market share through specialization and the development of tech platforms that build our leadership in Europe, leveraging Zinia (BNPL), checkout lending, credit cards and direct loans. In BNPL, Zinia continues to achieve outstanding results serving our medium/large partners. By year end, the new stack had reached 1.15 million total requests while developing functionalities to serve our tech partners.
The joint venture with TIMFin, the leading Italian telecommunications company, had more than 2.2 million contracts since launch as well as 5,884 active points of sale and more than 2,600 connected merchants as of end 2023.
Our loan book was EUR 21.7 billion at the end of 2023.
3.Digital Bank:
•Expand loyalty among our 3.9 million Digital Bank customers within Openbank and SC Germany Retail while boosting digitalization and promoting digital banking activity.
•Increase profit by leveraging strategic operations (e.g. Stellantis), leasing and subscription launch (in auto) and BNPL development (non-auto);
•Drive tech transformation projects to seize on the fast-growing transition to online, support digital customer base expansion and provide our partners with digital tools to achieve a single digital connection in Europe while maintaining high profitability and one of the best efficiency ratios in the sector.
Moreover, we continue supporting the European mobility green transformation, financing more than 200,000 new electric vehicles in 2023 with a market share in the region's EV sales of more than 10%, and developing new initiatives in other fields such as electric chargers, solar panels, green heating systems and e-bikes.
We were also recognized as a Top Employer or Great Place to Work (GPTW) in four countries.
397
Business performance
After a difficult environment in 2022, 2023 was also a complex year due to rising interest rates that affected new business profitability, cost of risk and customers' credit appetite. Some of the headwinds were: i) the change of TLTRO contractual conditions, ii) rising interest rates that put pressure on consumer finance monoliners' margins, compressing them while loan books reprice, added to a time when the Auto and Consumer industries are transforming towards more sustainable businesses (from a mobility and consumption perspective), iii) provisioning for the Swiss franc mortgage portfolio in Poland, and iv) normalization from a very low cost of risk towards the average across the cycle.
In this context, we managed to increase our new lending 3% year-on-year in constant euros. After a 2022 where new market registrations in Europe fell 4% vs. 2021 and -29% vs. 2019, in 2023 grew 14% vs. 2022. Our new business volumes were up 16% in new cars but fell 5% in used cars year-on-year in constant euros, slightly below market transactions in our footprint as we prioritized profitability over volume. We are also actively repricing our new business to offset higher funding costs from higher interest rates in the year.
The stock of loans and advances to customers increased 8% year-on-year. In gross terms, minus reverse repurchase agreements and in constant euros they also rose 8% year-on-year to EUR 135 billion. We continue to proactively monitor our portfolios to prevent the impact of any deterioration in our activity.
Customer deposits increased 18%, +19% minus repurchase agreements and in constant euros to EUR 69 billion. Mutual funds increased 18% in constant euros. Our recourse to wholesale funding markets remained strong and diversified. We are actively repricing our new business to offset higher funding costs.
| Digital Consumer Bank. 2023 activity | ||||||||||||||||||||||||||||||||
| EUR billion and % change in constant euros | ||||||||||||||||||||||||||||||||
| +8% | ||||||||||||||||||||||||||||||||
| 135 | YoY | |||||||||||||||||||||||||||||||
| 73 | +19% | |||||||||||||||||||||||||||||||
| YoY | ||||||||||||||||||||||||||||||||
Gross loans and advances to customers minus reverse repos | Customer deposits minus repos + mutual funds | |||||||||||||||||||||||||||||||
Results
Attributable profit in 2023 was EUR 1,199 million (10% of the Group’s total operating areas), 8% down. In constant euros, profit fell 7% (-5% excluding the impact of the temporary levy in Spain):
•Total income was up 6%. To neutralize the negative sensitivity to interest rate rises, we are actively repricing loans, focusing on the most profitable segments and increasing customer deposits which are structurally our primary funding source. As a result, net interest income rose 6%.
•Net fee income declined 5%, impacted by the insurance regulation in Germany capping achievable fees. Gains on financial transactions considerably increased along with other operating income, supported by leasing income.
•Administrative expenses and amortizations increased 8%, mainly affected by strategic transformation investments, business growth and inflation. In real terms, costs grew 3%. Net operating income increased 4% and the efficiency ratio stood at 47.6%.
•Net loan-loss provisions increased 48% due to the normalization of provisions, but remained at comfortable levels coming from a low base in 2022. Cost of risk remains low, at 0.62% but is also normalizing, and the NPL ratio stood at 2.12%.
•Negative contribution in other gains (losses) and provisions due to the temporary levy on revenue in Spain and regulatory charges in Poland, among others.
•By country, the largest contribution to attributable profit came from the Nordic countries (EUR 241 million), Germany (EUR 235 million), the UK (EUR 177 million), France (EUR 145 million) and Spain (EUR 119 million).
| Digital Consumer Bank. Underlying income statement | ||||||||||||||
| EUR million and % change | ||||||||||||||
| / | 2022 | |||||||||||||
| 2023 | 2022 | % | % excl. FX | |||||||||||
| Revenue | 5,502 | 5,269 | +4 | +6 | ||||||||||
| Expenses | (2,618) | (2,462) | +6 | +8 | ||||||||||
| Net operating income | 2,884 | 2,807 | +3 | +4 | ||||||||||
| LLPs | (792) | (544) | +46 | +48 | ||||||||||
| PBT | 2,019 | 2,237 | (10) | (9) | ||||||||||
| Attributable profit | 1,199 | 1,308 | (8) | (7) | ||||||||||
398
4.4 CORPORATE CENTRE
 | CORPORATE CENTRE | Underlying attributable profit | |||||||||||||||
| -EUR 998 mn | |||||||||||||||||
| EXECUTIVE SUMMARY | |||||||||||||||||
2023 HIGHLIGHTS: The Corporate Centre continued to support the Group. The Corporate Centre’s objective is to define, develop and coordinate the Group's strategy and aid the operating units by contributing value and carrying out the corporate oversight and control function. It also carries out functions related to financial and capital management. Lower underlying attributable loss compared to 2022 due to higher liquidity buffer remuneration and lower negative impact from foreign currency (FX) hedging. | |||||||||||||||||
Strategy and functions
The Corporate Centre contributes value to the Group, through the following functions, among others:
•Implementing global control frameworks and supervision.
•Fostering the exchange of best practices in cost management, which enables us to be one of the most efficient banks.
•Collaborating in the definition and execution of the global strategy, competitive development operations and projects that ensure we meet the business plan.
•Contributing to the launch of projects that will be developed by our global businesses aimed at leveraging our worldwide presence to generate economies of scale.
•Ensuring open and constructive communication with shareholders, analysts, investors, bondholders, rating agencies and other market players.
•Adding value to countries and divisions by encouraging the exchange of best practices, driving and managing innovative global initiatives and defining corporate policies, all in the communication, marketing and sustainability fields.
It also coordinates the relationship with European regulators and supervisors and develops functions related to financial and capital management, as follows:
•Financial Management functions:
•Structural management of liquidity risk associated with funding the Group’s recurring activity and stakes of a financial nature. At the end of 2023, the liquidity buffer exceeded EUR 348 billion.
This activity is carried out by the diversification of funding sources (issuances and other), maintaining an adequate profile in volumes, maturities and costs.
The price of these transactions with other Group units is the market rate that includes all liquidity concepts (which the Group supports by immobilizing funds during the term of the transaction) and regulatory requirements (TLAC/MREL).
•Interest rate risk is also actively managed in order to dampen the impact of interest rate changes on net interest income, conducted via high credit quality, very liquid and low capital consumption derivatives.
•Strategic management of exposure to exchange rates in equity and dynamic management of the FX hedge countervalue related to the units’ next twelve months results in euros. The net investments in equity currently hedged totalled EUR 12,396 million (mainly in the UK and Mexico) with different FX instruments (spot or forwards).
•Management of capital and reserves: team responsible for the Group's capital analysis, adequacy and management. Its functions include: coordination with subsidiaries, monitoring profitability to maximize shareholder returns, setting solvency targets and capital contributions, and monitoring the capital ratio (in both regulatory and economic terms), and efficient capital allocation to the units.
399
Results
The attributable loss of EUR 998 million was 51% lower than in 2022 (loss of EUR 2,049 million):
•Net interest income improved by EUR 612 million, due to higher liquidity buffer remuneration as a result of higher interest rates.
•Higher gains on financial transactions (EUR 422 million better), due to lower negative FX hedging impacts.
•Administrative expenses and amortizations increased 5% year-on-year, due to the general upturn in inflation in 2023. Excluding this impact, they increased 2%.
•Net loan-loss provisions recorded releases in both 2022 and 2023 (EUR 9 million and EUR 2 million, respectively).
•The net negative impact of other gains (losses) and provisions (which include provisions, intangible asset impairments, cost of the state guarantee on deferred tax assets, pensions, litigation, one-off provisions, etc.) decreased from a loss of EUR 173 million in 2022 to a EUR 134 million loss in 2023.
 Global Headquarters in Boadilla del Monte.
| Corporate Centre | ||||||||||||||
| EUR million | ||||||||||||||
| Underlying income statement | 2023 | 2022 | % | |||||||||||
| Net interest income | (41) | (652) | (93.8) | |||||||||||
| Net fee income | (13) | (19) | (30.8) | |||||||||||
Gains (losses) on financial transactions A | (302) | (724) | (58.3) | |||||||||||
| Other operating income | (83) | (92) | (9.0) | |||||||||||
| Total income | (439) | (1,487) | (70.5) | |||||||||||
| Administrative expenses and amortizations | (391) | (372) | 5.2 | |||||||||||
| Net operating income | (829) | (1,858) | (55.4) | |||||||||||
| Net loan-loss provisions | 2 | 9 | (77.3) | |||||||||||
| Other gains (losses) and provisions | (134) | (173) | (22.7) | |||||||||||
| Profit before tax | (961) | (2,022) | (52.5) | |||||||||||
| Tax on profit | (36) | (27) | 36.9 | |||||||||||
| Profit from continuing operations | (998) | (2,049) | (51.3) | |||||||||||
| Net profit from discontinued operations | — | — | — | |||||||||||
| Consolidated profit | (998) | (2,049) | (51.3) | |||||||||||
| Non-controlling interests | — | — | — | |||||||||||
| Profit attributable to the parent | (998) | (2,049) | (51.3) | |||||||||||
| Balance sheet | ||||||||||||||
| Loans and advances to customers | 5,565 | 5,785 | (3.8) | |||||||||||
| Cash, central banks and credit institutions | 119,279 | 123,230 | (3.2) | |||||||||||
| Debt instruments | 7,726 | 8,588 | (10.0) | |||||||||||
| Other financial assets | 808 | 273 | 196.6 | |||||||||||
| Other asset accounts | 121,327 | 124,343 | (2.4) | |||||||||||
| Total assets | 254,705 | 262,217 | (2.9) | |||||||||||
| Customer deposits | 1,508 | 895 | 68.5 | |||||||||||
| Central banks and credit institutions | 47,747 | 71,226 | (33.0) | |||||||||||
| Marketable debt securities | 110,144 | 98,733 | 11.6 | |||||||||||
| Other financial liabilities | 326 | 308 | 6.1 | |||||||||||
| Other liabilities accounts | 7,084 | 7,489 | (5.4) | |||||||||||
| Total liabilities | 166,809 | 178,650 | (6.6) | |||||||||||
| Total equity | 87,896 | 83,567 | 5.2 | |||||||||||
| Memorandum items: | ||||||||||||||
Gross loans and advances to customers B | 5,640 | 5,779 | (2.4) | |||||||||||
| Customer funds | 1,508 | 895 | 68.5 | |||||||||||
Customer deposits C | 1,508 | 895 | 68.5 | |||||||||||
| Mutual funds | — | — | — | |||||||||||
| Operating means | ||||||||||||||
| Number of employees | 1,922 | 1,899 | 1.2 | |||||||||||
| A. Includes exchange differences. | ||||||||||||||
| B. Minus reverse repurchase agreements. | ||||||||||||||
| C. Minus repurchase agreements. | ||||||||||||||
400
4.5 Secondary segments
| RETAIL BANKING | Underlying attributable profit | ||||||||||||||||
| EUR 7,436 mn | |||||||||||||||||
| EXECUTIVE SUMMARY | |||||||||||||||||
| Strategy | Business performance1 | Results | ||||||||||||
We continued improving digitization and simplification of our products and services through our ONE Transformation programme | Lending remained stable during the year, with growth in South America and North America offsetting the decline in Europe. Deposits grew driven by term deposits | Underlying attributable profit of EUR 7,436 million, down 6% in euros (-7% in constant euros) due to higher provisions, partly offset by the good revenue performance | ||||||||||||
1. In constant euros.
Strategy
In recent years, one of the Group's main priorities has been to intensify our transformation strategy, focusing on the simplification and the digitalization of products, services and processes.
As part of this strategy, in 2022 we launched ONE Transformation, the programme that aims to accelerate structural changes in our model, in three countries (Spain, Mexico and the US) to simplify, automate and improve our retail service. During 2023, we made great progress:
•In terms of simplification, we reduced the number of products by 16% year-on-year.
•We increased the digitalization and automation of processes, which enabled us to reduce the transactions carried out in branches, focusing more on value-added tasks that require advice and personalized attention.
•We made progress in our digital self-service model, which enabled us, for example, to reduce the use of our contact centres by 16%. In Mexico, we digitalized the entire onboarding process.
•We continued to roll out a common operating model and technology for the segment in all countries.
Additionally, and as a final step in our ONE Santander strategy, in September, we announced the consolidation of commercial banking activities into a new global area, Retail & Commercial Banking, which, as of January 2024, will be reported as a primary segment together with four other global businesses.
We will focus on expanding ONE Transformation to the rest of our banks, which will allow us to continue improving efficiency and quality of our service, as well as increasing our customer base and profitability.
| Total customers | Active customers | Digital customers | ||||||||||||||||||||||||||||||
| Millions | Millions | Millions | ||||||||||||||||||||||||||||||
| +3% | 0% | +5% | ||||||||||||||||||||||||||||||
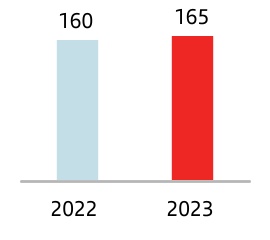
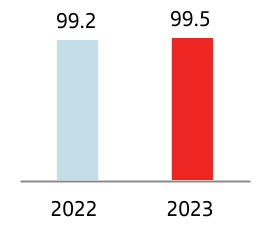
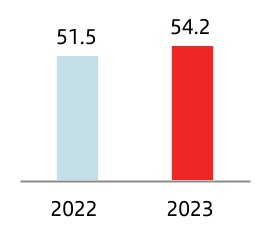
401
In addition to the efforts made in terms of transformation, digitalization and process automation, during the year we carried out numerous commercial actions and initiatives such as:
•In the retail segment: in an environment of higher interest rates, we offered savers competitive prices in the UK through an easy-access savings account. In Spain, we increased our market share in payrolls. In Mexico, we increased our market share in credit cards and payroll loans, while consolidating our third position in terms of market share in the auto market. In Argentina, we acquired an unregulated consumer finance company, with more than 30 points of sale in the Buenos Aires metropolitan area. In Uruguay, we strengthened the SOY Santander offer.
•In the SME and Corporate segment: in the US, we remain one of the top 10 Multifamily Real Estate lenders and acquired a 20% stake in a joint venture that will manage the multifamily real estate assets retained by the FDIC following Signature Bank's bankruptcy. In Brazil, we are redesigning our service model for SMEs. In Chile, we expanded our offering of integrated financing, cash management and treasury solutions for companies. In Poland, we were recognized as the Best Bank for SMEs by Euromoney.
All this has enabled us to grow the Group's total customer base by 3% to 165 million and digital customers by 5%. We also achieved a top 3 NPS ranking in seven of our countries, a clear recognition of our efforts to improve customer service and attention.
Business performance
Loans and advances to customers increased by 1% compared with 2022. In gross terms, minus reverse repurchase agreements and in constant euros, they remained stable, as growth in North and South America offset lower demand in Europe, affected by the prepayments of mortgages.
Customer deposits rose 4% year-on-year. Minus repurchase agreements and in constant euros, they were up 3%, driven by time deposits (+38%), as demand deposits declined 5% year-on-year.
Results
Attributable profit in 2023 was EUR 7,436 million (62% of the Group's total operating areas), down 6% compared to 2022. In constant euros, it decreased 7%, with the following detail:
•Total income grew 8% driven by higher net interest income (+12%), mainly in Europe and Mexico.
•Administrative expenses and amortizations increased 8%, affected by inflation. Net operating income also grew 8% and efficiency improved to 42.9%.
•Net loan-loss provisions rose 21%, mainly driven by the increase in North America, in line with expectations, and higher provisions in South America.
•The other gains (losses) and provisions line was slightly more negative than in 2022, mainly due to South America and the temporary levy on revenue earned in Spain.
| Retail Banking. Underlying income statement | ||||||||||||||
| EUR million and % change | ||||||||||||||
| / | 2022 | |||||||||||||
| 2023 | 2022 | % | % excl. FX | |||||||||||
| Revenue | 45,254 | 42,674 | +6 | +8 | ||||||||||
| Expenses | (19,396) | (18,552) | +5 | +8 | ||||||||||
| Net operating income | 25,858 | 24,123 | +7 | +8 | ||||||||||
| LLPs | (12,295) | (10,212) | +20 | +21 | ||||||||||
| PBT | 10,872 | 11,785 | (8) | (8) | ||||||||||
| Attributable profit | 7,436 | 7,933 | (6) | (7) | ||||||||||
402
| Santander Corporate & Investment Banking | Underlying attributable profit | ||||||||||||||||
| EUR 3,078 mn | |||||||||||||||||
| EXECUTIVE SUMMARY | |||||||||||||||||
| Strategy | Business performance | Results | ||||||||||||
Become a world-class CIB business leveraging our strengths, positioning ourselves as a strategic advisor to our clients and delivering profitable growth | Activity in 2023 delivered growth and profitability in a challenging macroeconomic environment that affected the entire industry. We maintained business levels similar to 2022 | Underlying attributable profit reached EUR 3,078 million due to an increase in total income. Efficiency remains among the best in the sector | ||||||||||||
Strategy
At SCIB, we continue advancing in the execution of our strategy to transform the business and position ourselves as our clients' strategic advisor, by offering specialized products and services, focusing on the energy and digital transition.
The goal of this transformation is to continue to grow sustainably and profitably, with the aim of becoming one of the leading investment banks in our areas of expertise.
In the year, we:
•Took the SCIB US franchise to the next level, focusing on accelerating advisory capabilities, maximizing the value of synergies with Santander Capital Markets and selectively expanding our client base and product capabilities, primarily in sectors with the highest growth potential.
•Continued the globalization of the Markets business to increase activity focusing on corporate clients and institutional investors, enhancing our global FX and Over-the-Counter (OTC) derivatives platform in the main commodity markets.
•Accelerated asset rotation to optimize profitability and increase new assets origination capacity.
•Increased collaboration with the Group's other global businesses to capture more business opportunities, leveraging our extensive commercial network.
Some of the key highlights in 2023 include:
•The merger of Amherst Pierpont Securities (APS) and Santander Investment Securities (SIS) to create Santander US Capital Markets (SanCap), a key element in the reorganization and globalization of the Markets business and the growth of the US franchise.
•Continued investment in talent, highlighting the acceleration in building our US advisory capabilities, complementing existing capabilities to carry out new business opportunities.
•Focusing on digital transformation, SCIB formed a partnership with the insurance firm Allianz Trade and the fintech Two (B2B e-commerce payments platform) to offer a new receivables solution that replicates the buy now, pay later (BNPL) model available in the retail segment.
•In ESG, Santander acquired a stake in InnoEnergy's capital acting as a joint advisor in the capital increase, which confirms our commitment to sustainable development objectives and our leadership position in climate tech.
In terms of positioning, we maintained our leadership position in the rankings of different products:
•In Export & Agency Finance, we maintained our global and European leadership, whilst in Structured Finance we reached second position, standing out as leaders in Renewables globally as well as in Europe and Latin America.
•In Debt Capital Markets (DCM), we remained among the top 3 in the bond issuance market in Latin America and continued to be leaders in Spain. In Equity Capital Markets (ECM), we are leaders in Spain and Poland, and in the top 5 in Latin America.
•In M&A, we are leaders in Spain and top 3 in Latin America and Poland.
During 2023, SCIB won several awards in different categories:
403
2023 Ranking | ||||||||
| Award/ranking | Source | Area | ||||||
| Europe Bank of the Year | Proximo | Global | ||||||
| Corporate Bond House of the Year / Best Investment Bank in Brazil | Bonds, Loans LatAm Awards | Global | ||||||
| Eurobond of the Year | IFR | GDF | ||||||
| North America Financial Bond of the Year | IFR | GDF | ||||||
| Infrastructure Bank of the Year | LatinFinance | GDF | ||||||
| Deal of the Year - Infrastructure and Project Finance for DigitalBridge and Brookfield's majority stake in GD Towers | The Banker | GDF | ||||||
| Most Impressive Bank for ESG Capital Markets in Latin America | Global Capital | Markets | ||||||
| LatAm's Best Foreign Exchange Bank | Euromoney | Markets | ||||||
Deal of the Year - Equities for Porsche's €9.4bn IPO | The Banker | CF | ||||||
| Best Iberian Broker | Institutional Investor | CF | ||||||
| Best Bank for Export Finance | Global Finance | GTB | ||||||
| Best Bank for Cash Management in Latin America | Global Finance | GTB | ||||||
| Best Trade Finance Bank / Best Receivables Finance Provider | TFG | GTB | ||||||
| Best Supply Chain Finance Bank | GTR | GTB | ||||||
Business performance
In a challenging macroeconomic and geopolitical environment, our priority has been to support our clients with our advisory and high value-added solutions. In this context, total income reached EUR 8,296 million, growing 12% year-on-year. In constant euros, total income rose 18%, backed by relevant growth across core businesses:
•Markets showed solid growth of 22% year-on-year, as a result of managing market volatility well.
In Europe, sales revenue continued to increase, both from corporate and institutional clients, achieving another year of strong growth, especially in the UK. By product, there were good results in Securities Financing, Equity Derivatives and Credit.
In Latin America, we saw good year-on-year growth, particularly in Mexico, Chile, Colombia and Uruguay, and especially Commodities, Cash Equity, FI Rates and FX products. In Brazil, the Electricity and Commodities desks stood out.
In the US, activity increased 30% year-on-year. Despite the macroeconomic challenges faced by some businesses, we continued to capture the synergies and efficiencies related to the creation of SanCap. Securities Financing, Exchange Traded Derivatives and Rates products stood out. There was good activity with corporate clients, including closing several important transactions in FX and Rates whilst flows with institutional clients remained stable compared to 2022.
•Global Transaction Banking (GTB) increased total income by 20% year-on-year.
Cash Management experienced another year of significant growth, both in terms of activity, with a greater number of clients and operations, and in terms of liability income, due to higher volumes and the benefits from high interest rates in the markets where we operate. The team continued to support our clients by creating solutions to optimize their treasury and commercial processes. A clear example was the
development of our Nexus Global Collections platform for collection tools, helping to simplify and automate the reconciliation process.
Trade & Working Capital Solutions continued to strengthen its global and distribution capabilities, consolidating its leadership in the market. Santander was chosen as agent bank for major international transactions, such as a EUR 5 billion confirming programme covering Europe, Asia and the Americas. We acquired a stake in Komgo's capital, and the recent partnership with SAP enabled us to integrate our solutions into our clients' own ERP, already providing good results in confirming and invoice discounting.
Export Finance maintained its leadership in the ECA financing market, participating in important transactions globally. Highlights include the mandate for the largest transaction in the history of Export Finance, the renewable energy development programme in Mexico, in which Santander acted as global coordinator and ECA Agent, as well as participating in the first offshore wind farm in Poland.
•Global Debt Financing (GDF) closed the year with significant growth in total income (+11%). The growth in non-financial fees was particularly strong (+23% year-on-year), as was the efficient use of capital.
For Debt Capital Markets (DCM), 2023 was a year of recovery in the global debt and loan markets as inflation fell back and interest rate rises slowed. Santander remained top 3 in bond issuances in Latin America and achieved a significant increase in market share globally, with total income growing 27% year-on-year. Good examples were the debt issuances in dollars for the Brazilian Treasury, for AstraZeneca in euros and dollars, and an issuance for the European Union in euros.
In Structured Finance, Santander ended the year in second place worldwide and as a leader in Renewables, contributing to total income exceeding the EUR 900 million mark for the first time, growing at 16% year-on-year. Our high value-added services, such as debt advisory or underwritings,
404
contributed to the improvement in profitability. The area is making good progress in positioning towards new energy transition assets (electric vehicle charging, gigafactories, green hydrogen, etc.) with several mandates executed or underway.
We continued developing our investment funds financing activity (Fund Finance).
In the Securitizations business, we continued to rapidly expand our capabilities. Total income grew by 31% year-on-year, allowing us to lead the European ranking.
| Total income breakdown | ||
Constant EUR million | ||
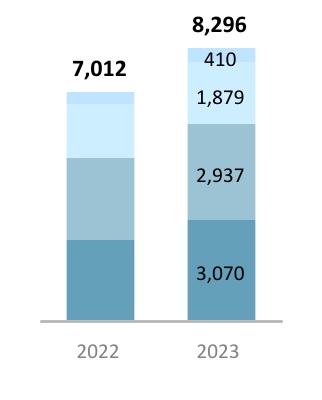
| TOTAL | +18 | % | |||
| Other | +11 | % | |||
| Global Debt Financing | +11 | % | |||
| Global Transactional Banking | +20 | % | |||
| Markets | +22 | % | |||
•In Corporate Finance (CF), despite the general stagnation of the market, there were some signs of recovery in the last quarter 2023. There were major Mergers and Acquisitions (M&A) transactions in Energy, advising on the divestment of wind farms.
In addition, Santander demonstrated its global leadership in environmental transactions related to waste treatment, through the advisory to the Canadian pension fund CPPIB on the acquisition of a stake in FCC Medioambiente and the sale of Sacyr's environmental division.
In the Telecommunications, Media, Technology (TMT) industry, there was significant activity in telecommunications towers and fibre, highlighting the advisory to GIP on the purchase of Vantage Towers and Telefónica on the sale of a majority stake in its fibre network in Latin America to KKR. In the technology area, Santander acted as joint bookrunner in Arm's IPO, one of the year's most important transactions.
In Consumer Retail & Healthcare (CRH), we advised on the spin-off of Grupo Éxito, which was followed by others in Brazil (Viveo, Via Varejo), where capital markets have reopened.
Interest rate hikes during the year had a negative impact on IPOs. However, takeover bids increased significantly in the Spanish market, where Santander maintained a leading position. Santander also participated in large international transactions such as the aforementioned Arm transaction, secondary placements by London Stock Exchange Group and Coty's listing on Euronext Paris.
Collaboration revenue and income from multinational clients outside their local market increased by 9% year-on-year to around EUR 2.5 billion.
Results
Attributable profit increased 9% year-on-year to EUR 3,078 million (25% of the Group's total operating areas). In constant euros, profit increased by 20%. By line:
•Total income rose 18% to EUR 8,296 million, with strong increases in all regions, especially North America which rose 27%.
•Administrative expenses and amortizations increased 20% year-on-year as a result of the investment in products and development of new capabilities in the US. Despite this, the efficiency ratio stood at 40.9% and remained at lower levels than the rest of the sector.
•Lower net loan-loss provisions, which decreased by 34% compared to the previous year, together with adequate capital management, contributed to an RoTE of 25%.
| SCIB. Underlying income statement | ||||||||||||||
| EUR million and % change | ||||||||||||||
| / | 2022 | |||||||||||||
| 2023 | 2022 | % | % excl. FX | |||||||||||
| Revenue | 8,296 | 7,378 | +12 | +18 | ||||||||||
| Expenses | (3,391) | (2,902) | +17 | +20 | ||||||||||
| Net operating income | 4,905 | 4,476 | +10 | +17 | ||||||||||
| LLPs | (162) | (249) | (35) | (34) | ||||||||||
| PBT | 4,570 | 4,097 | +12 | +20 | ||||||||||
| Attributable profit | 3,078 | 2,817 | +9 | +20 | ||||||||||
405
| Wealth Management & Insurance | Underlying attributable profit | ||||||||||||||||
| EUR 1,637 mn | |||||||||||||||||
| EXECUTIVE SUMMARY | |||||||||||||||||
| Strategy | Business performance1 | Results1 | ||||||||||||
We aim to become the best Wealth and Insurance Manager in Europe and the Americas by leveraging Group's scale and capabilities | Total assets under management grew by 14% year-on-year to EUR 460 billion, as a result of strong commercial dynamics | Total contribution to profit in 2023 grew 21% year-on-year to EUR 3,296 million, driven by higher net interest income and commercial activity | ||||||||||||
1. In constant euros. | ||||||||||||||
Strategy
In 2023, we continued to work to become the best Wealth and Insurance Manager in Europe and the Americas. WM&I was one of the Group's growth drivers with a record year of 21% growth in contribution to Group profit. During the year, Euromoney named us Latin America's Best Bank for Wealth Management.
•In Private Banking, we continued to leverage our global platform so our clients can benefit from our scale and international presence, making it easy for them to move from one region of the Group to another. In terms of collaboration, we remained leaders in investment flows between Latin America, Europe and the US, managing network business volumes (cross-border business between markets) of EUR 53.9 billion (+15% year-on-year).
Our collaboration business with SCIB continued to increase, especially in Brazil, Chile and BPI. In 2023, total income reached EUR 189 million, 8% higher year-on-year.
During 2023, we continued to widen our value proposition and to innovate across our product range, seeking the best opportunities for our clients. We had a particular focus on alternatives, structured products, secured lending and socially responsible products (ESG).
In alternatives, we had almost EUR 3 billion in total capital commitments at the end of the year. In collaboration with Santander Alternative Investments, we launched Santander Innoenergy, a venture capital fund that invests in innovative startups in the field of energy transition. Aiming to select the best managers and the most appropriate strategies, we launched a new fund of funds in our Irish ICAV, Laurion Secondaries, offering a diversified Private Equity portfolio with secondary transactions.
Our offering in discretionary portfolio management and advisory mandates exceeded EUR 48 billion of total assets in 2023. Consistent performance and customized service has resulted in steady growth in this service in recent years.
Our real estate investment service, which is capturing a large part of investment flows between Latin America, Europe and the US, reached a total volume of EUR 240 million in transactions in 2023.
During 2023, Euromoney named us the Best Private Bank in Latin America, as well as the Best International Private Bank in Mexico, Argentina, Brazil, Peru, Uruguay, Poland and Portugal. Additionally, we received the prize for the Best Global Private Bank in Cybersecurity and Digital Portfolio Management in Europe by the Professional Wealth Management magazine, a Financial Times publication.

•In Santander Asset Management (SAM), we had a record year in net sales (EUR 9.0 billion) driven by the adaptation of our value proposition to current market conditions. We are gaining market share in almost all our markets, and we continued to be the global product platform of choice for our retail banks, with EUR 1,128 million in total fees generated, in line with those of the previous year.
In Spain, we are developing the discretionary portfolio management model and launched two new funds whose advisory services are delegated to top managers such as BlackRock (US equities) and Fidelity (Asia). We continue to complement with our GO range in Luxembourg with two new strategies launched (Global Equity ESG and Asian Equity). Santander Pensiones was also one of the five entities awarded the contract to participate in the Publicly Promoted Employment Pension Fund in Spain (FPEPP), created to promote collective savings.
406
We also adapted our value proposition for institutional clients and implemented a new coverage model expanding our business beyond our existing footprint. Total net inflows for institutional clients in 2023 surpassed EUR 3 billion.
The range of alternative products is becoming increasingly robust, with 22 vehicles globally and EUR 2.5 billion in total commitments. Our main strategies include Private Debt, Infrastructure, Trade Finance and Real Estate, with the notable launch of Santander Global Real Assets Fund of Funds, for Private Banking clients.
We made further headway in terms of our ESG strategy, with assets under management of around EUR 48 billion. Together with RED, we launched the Santander Prosperity fund in seven countries and won the Best Product Innovation in The Global Private Banker Innovation Awards 2023.
Our efforts to continue offering the best investment solutions were recognized through several awards in the year, both globally (Most Innovative Investment Manager in Europe by Pan Finance magazine) and at a local level (Best Fixed Income Manager in Spain, Best Multi-Asset Manager in the UK, Best Money Market Manager in Brazil and Most Awarded Asset Manager in Chile, just to name a few).
•In Insurance, we continued delivering growth in gross premiums (+12% year-on-year), mainly driven by non-related and savings businesses. The credit-related business was slightly affected by the lower demand for credit in general.
In Europe, non-credit related insurance sales were particularly strong, as a result of new products and the transformation plans deployed across countries to improve customer experience and loyalty. During 2023, we reinforced our value proposition for SMEs and Health, launching a leasing insurance product in Portugal and a new partnership with BUPA in the UK. More recently in the fourth quarter, we reinforced our Savings value offer in Portugal with a new five-year product, offering yields until maturity. In Spain, we also started the commercialization of reverse mortgages with Mapfre.
In the Americas, new sales in non-credit related insurance business continued with strong growth, especially in savings. In 2023, we completed our Savings offer in Mexico by launching a USD unit linked for Private Banking and Plan Futuro funds for the Select segment. In Chile, we launched a new Health product in alliance with UC Christus, one of the best hospitals in the country. We also reinforced our value offer for SMEs with new products (e.g., Cyber in Mexico, a cyber threat insurance for SMEs). Smart use of data was implemented in all countries to reduce claim processing times by 90% compared to traditional processes.
The motor vehicle insurance business grew 10% year-on-year. Our Autocompara platform, with presence in Argentina, Brazil, Chile, Mexico and Uruguay, reached 1.4 million active policies and we added new companies in Brazil such as Porto Seguro (market leader in Auto segment) and Azul to further strengthen our competitive position.
Our digital strategy continued to drive growth in new sales through digital channels, now representing 20% of total sales.
Business performance
Total assets under management amounted to EUR 460.3 billion, 14% higher year-on-year, driven by intense commercial activity.
| Business performance: SAM and Private Banking | |||||
| EUR billion and % change in constant euros. December 2023 | |||||
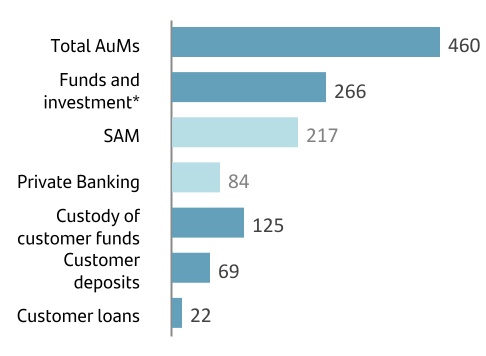
| / 2022 | ||
| +14 | % | |
| +10 | % | |
| +15 | % | |
| +10 | % | |
| +31 | % | |
| +4 | % | |
| +2 | % | |
Note: Total assets marketed and/or managed in 2023 and 2022.
(*) Total adjusted private banking customer funds managed by SAM.
•In Private Banking, the volume of customer assets and liabilities (CAL) reached EUR 300.4 billion, 15% higher than in 2022. Net new money amounted to EUR 13.7 billion (4.6% of total volume). Profit after tax reached EUR 1,191 million, 75% higher than the contribution in 2022 in constant euros, primarily backed by net interest income and improved commercial activity. Clients increased 9% to 260,000.
•In SAM, total assets under management increased 15% year-on-year to EUR 217.1 billion. We had a record year in net sales of more than EUR 9 billion (4.2% of total AuMs) with almost all countries gaining market share. SAM’s total contribution to the Group's profit (including fees ceded to the commercial network) was EUR 609 million, +5% year-on-year.
•In Insurance, gross written premiums amounted to EUR 13.1 billion (up 12% year-on-year) and fee income rose 2%. Total contribution to profit reached EUR 1,496 million, +2% year-on-year.
407
Results
Attributable profit was EUR 1,637 million in 2023, up 46% year-on-year. In constant euros, it was 48% higher:
•Total income increased 31% mainly driven by higher net interest income supported by strong trading activity and rising interest rates.
•Total fee income generated, including those ceded to the commercial network, amounted to EUR 3,725 million, +1% year-on-year, representing 31% of the Group's total fee income.
•Administrative expenses and amortizations were 12% higher year-on-year, due to investments and higher costs related to increased commercial activity.
•As a result, net operating income increased 44% year-on-year and the efficiency ratio improved 5.9 pp in the year to 34.0%.
| Total contribution to profit | ||||||||||||||||||||
| EUR million and % change in constant euros | ||||||||||||||||||||
| 3,296 | ||||||||||||||||||||
| 〉 | +21% | |||||||||||||||||||
| / 2022 | ||||||||||||||||||||
The total contribution to the Group's profit (profit after tax plus and total fees generated net of tax) was EUR 3,296 million, 20% higher than in 2022 (+21% in constant euros).
| WM&I. Underlying income statement | ||||||||||||||
| EUR million and % change | ||||||||||||||
| / | 2022 | |||||||||||||
| 2023 | 2022 | % | % excl. FX | |||||||||||
| Revenue | 3,396 | 2,635 | +29 | +31 | ||||||||||
| Expenses | (1,156) | (1,054) | +10 | +12 | ||||||||||
| Net operating income | 2,240 | 1,581 | +42 | +44 | ||||||||||
| LLPs | 21 | (14) | — | — | ||||||||||
| PBT | 2,235 | 1,531 | +46 | +48 | ||||||||||
| Attributable profit | 1,637 | 1,119 | +46 | +48 | ||||||||||
408
| PagoNxt | Underlying attributable profit | ||||||||||||||||
| -EUR 77 mn | |||||||||||||||||
| EXECUTIVE SUMMARY | |||||||||||||||||
| Strategy | Business performance1 | Results | ||||||||||||
Scale up our global platform of innovative payments and integrated value-added solutions serving the payment needs for Grupo Santander and for open market customers worldwide | PagoNxt continued to expand in 2023. Getnet's Total Payments Volume reached EUR 206 billion globally, a 22% increase versus 2022 | Continued momentum in total income in 2023, reaching EUR 1,140 million, up 20% year-on-year (+17% in constant euros) | ||||||||||||
1. In constant euros.
Strategy
PagoNxt aims to be a global leadership in payments through a distinct, holistic and customer-centric value proposition. We are a one-of-a-kind paytech business that provides customers with a wide range of innovative payments and integrated value-added solutions.
Since 2020, PagoNxt has been built through the combination of several strategic and high-growth business segments (e.g. Merchant Acquiring, International Trade and Payments Hub).
Already existing businesses, like Merchant Acquiring in core Santander countries like Brazil, Mexico and Spain, have been combined with newly internally developed global technology platforms (i.e. Merchant Solutions, OneTrade and Account-To-Account Payments) and a limited number of inorganic acquisitions (e.g. Ebury).
PagoNxt's technology platforms and specialist teams serve the payments needs of Grupo Santander's customers and cater to open market opportunities beyond Santander's footprint with in-depth solutions for millions of businesses and people.
PagoNxt runs an efficient global operating model that covers three core regions (Europe, South America and North America) with bank-grade security and compliance embedded in our customer products.
PagoNxt's strategy for the next few years is anchored on 3 key pillars:
•Scaling up our global, cloud-native, secure and efficient platform, which is interconnected and API-based to ensure customer access through a single integration. We process and generate insights to help our customers and their businesses harness the full power of data to make decisions.
•accelerating commercial growth by further strengthening our commerce and trade ecosystem and our distribution through Santander commercial platforms with a focus on SMEs.
•maximizing the open market opportunity through direct commercialization and distribution partnerships (with integrated software vendors (ISVs), financial institutions (FI), non-banking financial institutions (NBFI)), increasing our market penetration in Europe, South America and North
America and extending our footprint to additional strategic countries.
This strategy is fully aligned with PagoNxt's short- and medium-term targets, namely, delivering sustained and diversified revenue growth, growing the open market business and ensuring operational leverage for improved scale-driven margins and bottom-line profitability.
Business performance
Getnet, our end-to-end Merchant Acquiring business with presence in Latin America (Brazil, Mexico, Argentina, Chile and Uruguay) and Europe (pan-European activity with active merchants in 15 countries), continued consolidating its franchise and market position and growing above market in most regions. Getnet improved its position in Merchant acquiring to second in Latin America and 17th globally, according to the Nilson reports based on number of transactions.
In 2023, Getnet's Total Payments Volume (TPV) reached EUR 206 billion, +25% year-on-year (+22% in constant euros). This growth was accompanied by margin expansion due to increasing scale and the roll out of innovative value-added services, global e-commerce capabilities and further developed specialized vertical solutions which it shares across countries. Highlights by market were:
•Getnet Brazil's TPV increased 14%. Brazil's focus has been on profitable growth through higher penetration in SMEs, our pre-payments products, and value-added services. We are pursuing opportunities across all sales channels and enhancing open market sales through partnerships with banks and ISVs, direct sales and digital channels.
•Getnet Europe, our pan-European acquirer, grew significantly in the year. TPV increased 31% year-on-year, mainly driven by the Spanish and Portuguese markets. In the UK, we are currently operating with a reduced number of customers under our UK FCA licence. We continue enhancing our platform capabilities, with new payment methods, a vertical solution for airlines and a stronger value-added proposition for SMEs, which enable us to progress on our open market strategy with merchants operating in 15 countries.
409
•Getnet Mexico's activity remained strong, with TPV increasing 23% year-on-year, driven by higher SME penetration and the strong performance of our open market distribution channels, which include several partnerships with payment’s facilitators, ISVs and payment ecosystems. We launched several innovative value-added services like tap-on-phone, DCC and dynamic working capital.
•We are ramping up Getnet's commercial activity in other Latin American countries. Our acquiring businesses in Argentina and Uruguay launched in 2022 are showing strong growth as they start penetrating Santander's merchant base. Chile, with 80% year-on-year TPV growth, is accelerating its penetration in the Chilean market through Santander and open market, which already represents around 50% of new onboardings.
PagoNxt OneTrade platform comprises two different activities: one which offers a range of international business services delivered to our banks and their customers as a Banking-as-a-Service proposition, and another service delivered to open market customers through an Electronic Money Institution.
The Banking-as-a-Service proposition enabled Santander to replace multiple investments in local institutions with a single global one, accelerating implementation while reducing operational and maintenance costs.
In 2023, we achieved significant progress and all core interconnected services are fully operational. Some of the services which have already been rolled out across core markets such as Spain, Mexico and Chile are: OneTrade FX, a digital FX service facilitating currency trading; International Payments, aimed at fostering Corporate and SMEs business; and TradeNxt, a trade finance platform supporting import/export activities.
We expect to ramp up OneTrade open market activities in the first half of 2024 by scaling up its correspondent banking offering (cross-border payments and FX services) targeted at financial institutions, non-banking financial institutions and other entities in need of cross-border payments optimization.
PagoNxt continued to accelerate its roadmap to be Santander's wholesale payments processing provider, centralizing all types of payments (except cards). In 2023, we continued the development of our product capability around five core areas (Instant Payments, Credit Transfers, Bulk Credit Transfers, Direct Debits and International Payments) and implemented functionality across multiple countries and businesses (SCIB, Openbank, Spain, Portugal, Germany, the UK and Mexico). Significant volumes of payments have already been migrated into the new payments platform reaching an annualized volume of 700 million transactions.
Ebury continued to deliver organic top-line growth, with double-digit growth in total income. The business continued to enhance its B2B offerings and recently completed the acquisition of Bexs, the Brazilian cross-border payments and FX transactions specialist.
Results
Attributable loss of EUR 77 million in 2023, a marked improvement versus a loss of EUR 215 million in 2022.
Total income continued its upward momentum in 2023 and reached EUR 1,140 million, a 17% increase year-on-year in constant euros, backed by increased activity and volumes, especially in our Merchant and Trade businesses (Getnet and Ebury).
PagoNxt. Total income performance | ||||||||||||||||||||
| Constant EUR million | ||||||||||||||||||||
| +17% | ||||||||||||||
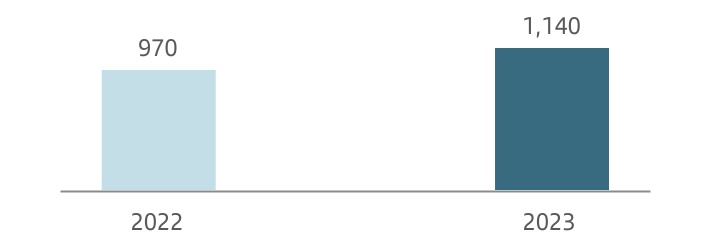
In 2023, administrative expenses and amortizations grew by 6% year-on-year and reflected inflation pressures and the ongoing investment plans to develop and implement global technology.
| PagoNxt. Underlying income statement | ||||||||||||||
| EUR million and % change | ||||||||||||||
| / | 2022 | |||||||||||||
| 2023 | 2022 | % | % excl. FX | |||||||||||
| Revenue | 1,140 | 953 | +20 | +17 | ||||||||||
| Expenses | (1,091) | (1,024) | +7 | +6 | ||||||||||
| Net operating income | 49 | (71) | — | — | ||||||||||
| LLPs | (24) | (44) | (46) | (46) | ||||||||||
| PBT | (17) | (141) | (88) | (87) | ||||||||||
| Attributable profit | (77) | (215) | (64) | (63) | ||||||||||
410
4.6 Appendix
| Primary segments | ||||||||||||||||||||||||||||||||
| EUR million | ||||||||||||||||||||||||||||||||
| Europe | Spain | |||||||||||||||||||||||||||||||
| Underlying income statement | 2023 | 2022 | % | % excl. FX | 2023 | 2022 | % | |||||||||||||||||||||||||
| Net interest income | 15,910 | 12,565 | 26.6 | 27.0 | 6,641 | 4,539 | 46.3 | |||||||||||||||||||||||||
| Net fee income | 4,399 | 4,493 | (2.1) | (2.2) | 2,699 | 2,818 | (4.2) | |||||||||||||||||||||||||
Gains (losses) on financial transactions A | 1,033 | 821 | 25.9 | 25.8 | 688 | 612 | 12.3 | |||||||||||||||||||||||||
| Other operating income | 97 | 151 | (35.8) | (34.2) | 105 | 265 | (60.4) | |||||||||||||||||||||||||
| Total income | 21,439 | 18,030 | 18.9 | 19.2 | 10,132 | 8,233 | 23.1 | |||||||||||||||||||||||||
| Administrative expenses and amortizations | (9,030) | (8,523) | 5.9 | 6.4 | (4,227) | (3,998) | 5.7 | |||||||||||||||||||||||||
| Net operating income | 12,409 | 9,507 | 30.5 | 30.5 | 5,905 | 4,236 | 39.4 | |||||||||||||||||||||||||
| Net loan-loss provisions | (2,533) | (2,396) | 5.7 | 5.4 | (1,522) | (1,618) | (5.9) | |||||||||||||||||||||||||
| Other gains (losses) and provisions | (1,681) | (1,629) | 3.2 | 2.8 | (984) | (539) | 82.4 | |||||||||||||||||||||||||
| Profit before tax | 8,195 | 5,482 | 49.5 | 49.9 | 3,399 | 2,079 | 63.5 | |||||||||||||||||||||||||
| Tax on profit | (2,371) | (1,492) | 58.9 | 59.2 | (1,029) | (518) | 98.5 | |||||||||||||||||||||||||
| Profit from continuing operations | 5,824 | 3,989 | 46.0 | 46.4 | 2,371 | 1,560 | 51.9 | |||||||||||||||||||||||||
| Net profit from discontinued operations | — | — | — | — | — | — | — | |||||||||||||||||||||||||
| Consolidated profit | 5,824 | 3,989 | 46.0 | 46.4 | 2,371 | 1,560 | 51.9 | |||||||||||||||||||||||||
| Non-controlling interests | (342) | (179) | 90.6 | 84.7 | — | — | (26.2) | |||||||||||||||||||||||||
| Profit attributable to the parent | 5,482 | 3,810 | 43.9 | 44.6 | 2,371 | 1,560 | 51.9 | |||||||||||||||||||||||||
| Balance sheet | ||||||||||||||||||||||||||||||||
| Loans and advances to customers | 570,067 | 591,280 | (3.6) | (4.8) | 239,214 | 256,397 | (6.7) | |||||||||||||||||||||||||
| Cash, central banks and credit institutions | 198,451 | 216,310 | (8.3) | (9.1) | 116,317 | 129,113 | (9.9) | |||||||||||||||||||||||||
| Debt instruments | 115,428 | 76,319 | 51.2 | 49.1 | 70,072 | 42,008 | 66.8 | |||||||||||||||||||||||||
| Other financial assets | 44,538 | 47,737 | (6.7) | (6.7) | 40,926 | 43,555 | (6.0) | |||||||||||||||||||||||||
| Other asset accounts | 26,860 | 26,564 | 1.1 | 0.5 | 17,075 | 17,995 | (5.1) | |||||||||||||||||||||||||
| Total assets | 955,344 | 958,209 | (0.3) | (1.4) | 483,603 | 489,067 | (1.1) | |||||||||||||||||||||||||
| Customer deposits | 644,921 | 643,875 | 0.2 | (1.1) | 324,099 | 329,414 | (1.6) | |||||||||||||||||||||||||
| Central banks and credit institutions | 104,164 | 112,254 | (7.2) | (7.9) | 44,802 | 43,110 | 3.9 | |||||||||||||||||||||||||
| Marketable debt securities | 79,095 | 71,731 | 10.3 | 8.7 | 28,486 | 23,674 | 20.3 | |||||||||||||||||||||||||
| Other financial liabilities | 53,361 | 60,010 | (11.1) | (11.2) | 46,532 | 52,876 | (12.0) | |||||||||||||||||||||||||
| Other liabilities accounts | 29,633 | 27,300 | 8.5 | 8.0 | 22,264 | 19,600 | 13.6 | |||||||||||||||||||||||||
| Total liabilities | 911,173 | 915,169 | (0.4) | (1.5) | 466,184 | 468,674 | (0.5) | |||||||||||||||||||||||||
| Total equity | 44,171 | 43,040 | 2.6 | 1.2 | 17,419 | 20,394 | (14.6) | |||||||||||||||||||||||||
| Memorandum items: | ||||||||||||||||||||||||||||||||
Gross loans and advances to customers B | 551,722 | 579,476 | (4.8) | (6.0) | 229,803 | 249,821 | (8.0) | |||||||||||||||||||||||||
| Customer funds | 725,417 | 720,910 | 0.6 | (0.5) | 386,810 | 394,679 | (2.0) | |||||||||||||||||||||||||
Customer deposits C | 620,299 | 627,630 | (1.2) | (2.4) | 308,745 | 322,284 | (4.2) | |||||||||||||||||||||||||
| Mutual funds | 105,118 | 93,280 | 12.7 | 12.2 | 78,065 | 72,395 | 7.8 | |||||||||||||||||||||||||
| Ratios (%), operating means and customers | ||||||||||||||||||||||||||||||||
| RoTE | 14.47 | 9.28 | 5.19 | 14.16 | 7.89 | 6.27 | ||||||||||||||||||||||||||
| Efficiency ratio | 42.1 | 47.3 | (5.2) | 41.7 | 48.6 | (6.8) | ||||||||||||||||||||||||||
| NPL ratio | 2.32 | 2.37 | (0.05) | 3.06 | 3.27 | (0.21) | ||||||||||||||||||||||||||
| Total coverage ratio | 49.3 | 51.8 | (2.5) | 49.1 | 51.0 | (1.9) | ||||||||||||||||||||||||||
| Number of employees | 67,457 | 65,581 | 2.9 | 26,834 | 26,839 | (0.0) | ||||||||||||||||||||||||||
| Number of branches | 3,083 | 3,148 | (2.1) | 1,874 | 1,913 | (2.0) | ||||||||||||||||||||||||||
| Number of total customers (thousands) | 46,293 | 45,564 | 1.6 | 15,023 | 14,320 | 4.9 | ||||||||||||||||||||||||||
| Number of active customers (thousands) | 28,538 | 28,124 | 1.5 | 8,367 | 7,852 | 6.6 | ||||||||||||||||||||||||||
| A. Includes exchange differences. | ||||||||||||||||||||||||||||||||
| B. Minus reverse repurchase agreements. | ||||||||||||||||||||||||||||||||
| C. Minus repurchase agreements. | ||||||||||||||||||||||||||||||||
411
| Primary segments | ||||||||||||||||||||||||||||||||
| EUR million | ||||||||||||||||||||||||||||||||
| United Kingdom | Portugal | |||||||||||||||||||||||||||||||
| Underlying income statement | 2023 | 2022 | % | % excl. FX | 2023 | 2022 | % | |||||||||||||||||||||||||
| Net interest income | 5,152 | 4,992 | 3.2 | 5.3 | 1,465 | 747 | 96.2 | |||||||||||||||||||||||||
| Net fee income | 338 | 390 | (13.3) | (11.5) | 464 | 484 | (4.2) | |||||||||||||||||||||||||
Gains (losses) on financial transactions A | 29 | 31 | (4.6) | (2.7) | 33 | 56 | (41.0) | |||||||||||||||||||||||||
| Other operating income | 5 | 6 | (7.2) | (5.3) | 21 | 8 | 152.5 | |||||||||||||||||||||||||
| Total income | 5,525 | 5,418 | 2.0 | 4.0 | 1,982 | 1,295 | 53.1 | |||||||||||||||||||||||||
| Administrative expenses and amortizations | (2,745) | (2,685) | 2.2 | 4.3 | (542) | (502) | 8.1 | |||||||||||||||||||||||||
| Net operating income | 2,779 | 2,733 | 1.7 | 3.7 | 1,440 | 793 | 81.6 | |||||||||||||||||||||||||
| Net loan-loss provisions | (247) | (316) | (21.7) | (20.1) | (77) | (17) | 353.6 | |||||||||||||||||||||||||
| Other gains (losses) and provisions | (425) | (517) | (17.9) | (16.3) | (49) | (1) | — | |||||||||||||||||||||||||
| Profit before tax | 2,107 | 1,900 | 10.9 | 13.1 | 1,314 | 775 | 69.4 | |||||||||||||||||||||||||
| Tax on profit | (563) | (505) | 11.4 | 13.6 | (416) | (240) | 73.2 | |||||||||||||||||||||||||
| Profit from continuing operations | 1,545 | 1,395 | 10.8 | 13.0 | 898 | 536 | 67.8 | |||||||||||||||||||||||||
| Net profit from discontinued operations | — | — | — | — | — | — | — | |||||||||||||||||||||||||
| Consolidated profit | 1,545 | 1,395 | 10.8 | 13.0 | 898 | 536 | 67.8 | |||||||||||||||||||||||||
| Non-controlling interests | — | — | — | — | (2) | (2) | 38.9 | |||||||||||||||||||||||||
| Profit attributable to the parent | 1,545 | 1,395 | 10.8 | 13.0 | 896 | 534 | 67.9 | |||||||||||||||||||||||||
| Balance sheet | ||||||||||||||||||||||||||||||||
| Loans and advances to customers | 245,743 | 251,892 | (2.4) | (4.5) | 36,864 | 39,126 | (5.8) | |||||||||||||||||||||||||
| Cash, central banks and credit institutions | 62,387 | 65,962 | (5.4) | (7.5) | 8,084 | 9,634 | (16.1) | |||||||||||||||||||||||||
| Debt instruments | 10,234 | 7,294 | 40.3 | 37.3 | 10,991 | 7,887 | 39.4 | |||||||||||||||||||||||||
| Other financial assets | 289 | 601 | (52.0) | (53.0) | 1,078 | 1,095 | (1.6) | |||||||||||||||||||||||||
| Other asset accounts | 4,363 | 3,292 | 32.5 | 29.7 | 1,279 | 1,481 | (13.7) | |||||||||||||||||||||||||
| Total assets | 323,016 | 329,042 | (1.8) | (3.9) | 58,297 | 59,223 | (1.6) | |||||||||||||||||||||||||
| Customer deposits | 233,453 | 230,829 | 1.1 | (1.0) | 36,366 | 38,506 | (5.6) | |||||||||||||||||||||||||
| Central banks and credit institutions | 28,202 | 37,022 | (23.8) | (25.5) | 9,237 | 9,182 | 0.6 | |||||||||||||||||||||||||
| Marketable debt securities | 43,850 | 44,088 | (0.5) | (2.7) | 4,813 | 3,288 | 46.4 | |||||||||||||||||||||||||
| Other financial liabilities | 3,434 | 3,549 | (3.2) | (5.3) | 319 | 448 | (28.8) | |||||||||||||||||||||||||
| Other liabilities accounts | 1,704 | 1,553 | 9.7 | 7.4 | 3,725 | 4,467 | (16.6) | |||||||||||||||||||||||||
| Total liabilities | 310,642 | 317,041 | (2.0) | (4.1) | 54,460 | 55,890 | (2.6) | |||||||||||||||||||||||||
| Total equity | 12,373 | 12,001 | 3.1 | 0.9 | 3,837 | 3,333 | 15.1 | |||||||||||||||||||||||||
| Memorandum items: | ||||||||||||||||||||||||||||||||
Gross loans and advances to customers B | 235,111 | 244,840 | (4.0) | (6.0) | 37,658 | 40,066 | (6.0) | |||||||||||||||||||||||||
| Customer funds | 231,667 | 228,993 | 1.2 | (1.0) | 40,618 | 42,129 | (3.6) | |||||||||||||||||||||||||
Customer deposits C | 224,396 | 221,884 | 1.1 | (1.0) | 36,366 | 38,506 | (5.6) | |||||||||||||||||||||||||
| Mutual funds | 7,272 | 7,109 | 2.3 | 0.1 | 4,252 | 3,623 | 17.4 | |||||||||||||||||||||||||
| Ratios (%), operating means and customers | ||||||||||||||||||||||||||||||||
| RoTE | 13.01 | 10.70 | 2.31 | 25.92 | 15.03 | 10.89 | ||||||||||||||||||||||||||
| Efficiency ratio | 49.7 | 49.6 | 0.1 | 27.3 | 38.7 | (11.4) | ||||||||||||||||||||||||||
| NPL ratio | 1.42 | 1.21 | 0.22 | 2.59 | 2.99 | (0.39) | ||||||||||||||||||||||||||
| Total coverage ratio | 30.3 | 33.8 | (3.4) | 82.7 | 79.3 | 3.4 | ||||||||||||||||||||||||||
| Number of employees | 22,280 | 21,185 | 5.2 | 4,945 | 4,952 | (0.1) | ||||||||||||||||||||||||||
| Number of branches | 444 | 449 | (1.1) | 376 | 383 | (1.8) | ||||||||||||||||||||||||||
| Number of total customers (thousands) | 22,481 | 22,402 | 0.4 | 2,908 | 2,923 | (0.5) | ||||||||||||||||||||||||||
| Number of active customers (thousands) | 13,864 | 13,995 | (0.9) | 1,838 | 1,784 | 3.0 | ||||||||||||||||||||||||||
| A. Includes exchange differences. | ||||||||||||||||||||||||||||||||
| B. Minus reverse repurchase agreements. | ||||||||||||||||||||||||||||||||
| C. Minus repurchase agreements. | ||||||||||||||||||||||||||||||||
412
| Primary segments | |||||||||||||||||||||||||||||||||||
| EUR million | |||||||||||||||||||||||||||||||||||
| Poland | Other Europe | ||||||||||||||||||||||||||||||||||
| Underlying income statement | 2023 | 2022 | % | % excl. FX | 2023 | 2022 | % | % excl. FX | |||||||||||||||||||||||||||
| Net interest income | 2,543 | 1,976 | 28.7 | 24.7 | 109 | 312 | (65.0) | (64.4) | |||||||||||||||||||||||||||
| Net fee income | 589 | 528 | 11.6 | 8.1 | 309 | 273 | 13.2 | 14.7 | |||||||||||||||||||||||||||
Gains (losses) on financial transactions A | 67 | 93 | (28.2) | (30.4) | 217 | 29 | 641.1 | 685.2 | |||||||||||||||||||||||||||
| Other operating income | (17) | (123) | (85.8) | (86.3) | (16) | (5) | 249.6 | 266.1 | |||||||||||||||||||||||||||
| Total income | 3,182 | 2,474 | 28.6 | 24.6 | 618 | 609 | 1.6 | 3.2 | |||||||||||||||||||||||||||
| Administrative expenses and amortizations | (862) | (692) | 24.6 | 20.7 | (653) | (646) | 1.1 | 2.1 | |||||||||||||||||||||||||||
| Net operating income | 2,320 | 1,782 | 30.1 | 26.1 | (35) | (38) | (6.5) | (14.4) | |||||||||||||||||||||||||||
| Net loan-loss provisions | (674) | (440) | 53.2 | 48.5 | (12) | (6) | 112.3 | 112.2 | |||||||||||||||||||||||||||
| Other gains (losses) and provisions | (253) | (553) | (54.2) | (55.6) | 30 | (18) | — | — | |||||||||||||||||||||||||||
| Profit before tax | 1,392 | 789 | 76.4 | 71.0 | (17) | (61) | (71.5) | (72.8) | |||||||||||||||||||||||||||
| Tax on profit | (377) | (247) | 52.7 | 47.9 | 13 | 18 | (28.5) | (31.7) | |||||||||||||||||||||||||||
| Profit from continuing operations | 1,015 | 542 | 87.3 | 81.5 | (5) | (43) | (89.1) | (89.6) | |||||||||||||||||||||||||||
| Net profit from discontinued operations | — | — | — | — | — | — | — | — | |||||||||||||||||||||||||||
| Consolidated profit | 1,015 | 542 | 87.3 | 81.5 | (5) | (43) | (89.1) | (89.6) | |||||||||||||||||||||||||||
| Non-controlling interests | (342) | (179) | 91.2 | 85.3 | 2 | 1 | 103.7 | 103.7 | |||||||||||||||||||||||||||
| Profit attributable to the parent | 674 | 364 | 85.3 | 79.6 | (3) | (42) | (93.7) | (94.0) | |||||||||||||||||||||||||||
| Balance sheet | |||||||||||||||||||||||||||||||||||
| Loans and advances to customers | 33,850 | 29,659 | 14.1 | 5.8 | 14,397 | 14,206 | 1.3 | 4.7 | |||||||||||||||||||||||||||
| Cash, central banks and credit institutions | 9,289 | 8,898 | 4.4 | (3.2) | 2,374 | 2,703 | (12.2) | (10.3) | |||||||||||||||||||||||||||
| Debt instruments | 15,070 | 11,865 | 27.0 | 17.8 | 9,060 | 7,265 | 24.7 | 24.9 | |||||||||||||||||||||||||||
| Other financial assets | 733 | 628 | 16.8 | 8.3 | 1,512 | 1,857 | (18.6) | (16.1) | |||||||||||||||||||||||||||
| Other asset accounts | 1,974 | 1,616 | 22.2 | 13.3 | 2,170 | 2,180 | (0.5) | 1.1 | |||||||||||||||||||||||||||
| Total assets | 60,916 | 52,665 | 15.7 | 7.2 | 29,512 | 28,211 | 4.6 | 6.9 | |||||||||||||||||||||||||||
| Customer deposits | 44,500 | 39,299 | 13.2 | 5.0 | 6,503 | 5,827 | 11.6 | 15.4 | |||||||||||||||||||||||||||
| Central banks and credit institutions | 4,623 | 4,969 | (7.0) | (13.7) | 17,300 | 17,971 | (3.7) | (2.1) | |||||||||||||||||||||||||||
| Marketable debt securities | 1,945 | 681 | 185.6 | 164.8 | — | — | — | — | |||||||||||||||||||||||||||
| Other financial liabilities | 1,706 | 1,179 | 44.7 | 34.2 | 1,369 | 1,958 | (30.1) | (28.0) | |||||||||||||||||||||||||||
| Other liabilities accounts | 1,687 | 1,378 | 22.4 | 13.5 | 253 | 302 | (16.3) | (15.9) | |||||||||||||||||||||||||||
| Total liabilities | 54,462 | 47,506 | 14.6 | 6.3 | 25,425 | 26,058 | (2.4) | (0.3) | |||||||||||||||||||||||||||
| Total equity | 6,454 | 5,159 | 25.1 | 16.0 | 4,087 | 2,153 | 89.9 | 95.2 | |||||||||||||||||||||||||||
| Memorandum items: | |||||||||||||||||||||||||||||||||||
Gross loans and advances to customers B | 34,729 | 30,524 | 13.8 | 5.5 | 14,420 | 14,226 | 1.4 | 4.7 | |||||||||||||||||||||||||||
| Customer funds | 49,371 | 42,370 | 16.5 | 8.0 | 16,951 | 12,740 | 33.1 | 35.1 | |||||||||||||||||||||||||||
Customer deposits C | 44,462 | 39,299 | 13.1 | 4.9 | 6,330 | 5,658 | 11.9 | 15.8 | |||||||||||||||||||||||||||
| Mutual funds | 4,909 | 3,071 | 59.9 | 48.2 | 10,621 | 7,082 | 50.0 | 50.0 | |||||||||||||||||||||||||||
| Ratios (%), operating means and customers | |||||||||||||||||||||||||||||||||||
| RoTE | 17.68 | 11.93 | 5.75 | ||||||||||||||||||||||||||||||||
| Efficiency ratio | 27.1 | 28.0 | (0.9) | ||||||||||||||||||||||||||||||||
| NPL ratio | 3.55 | 3.80 | (0.25) | ||||||||||||||||||||||||||||||||
| Total coverage ratio | 73.3 | 74.0 | (0.6) | ||||||||||||||||||||||||||||||||
| Number of employees | 10,822 | 10,532 | 2.8 | ||||||||||||||||||||||||||||||||
| Number of branches | 381 | 395 | (3.5) | ||||||||||||||||||||||||||||||||
| Number of total customers (thousands) | 5,877 | 5,697 | 3.2 | ||||||||||||||||||||||||||||||||
| Number of active customers (thousands) | 4,465 | 4,316 | 3.4 | ||||||||||||||||||||||||||||||||
| A. Includes exchange differences. | |||||||||||||||||||||||||||||||||||
| B. Minus reverse repurchase agreements. | |||||||||||||||||||||||||||||||||||
| C. Minus repurchase agreements. | |||||||||||||||||||||||||||||||||||
413
| Primary segments | |||||||||||||||||||||||||||||||||||
| EUR million | |||||||||||||||||||||||||||||||||||
| North America | United States | ||||||||||||||||||||||||||||||||||
| Underlying income statement | 2023 | 2022 | % | % excl. FX | 2023 | 2022 | % | % excl. FX | |||||||||||||||||||||||||||
| Net interest income | 10,159 | 9,705 | 4.7 | 2.6 | 5,742 | 6,140 | (6.5) | (3.8) | |||||||||||||||||||||||||||
| Net fee income | 2,192 | 1,958 | 11.9 | 6.7 | 766 | 771 | (0.6) | 2.2 | |||||||||||||||||||||||||||
Gains (losses) on financial transactions A | 505 | 204 | 147.3 | 147.9 | 294 | 164 | 79.2 | 84.3 | |||||||||||||||||||||||||||
| Other operating income | 318 | 449 | (29.1) | (24.4) | 406 | 548 | (25.9) | (23.8) | |||||||||||||||||||||||||||
| Total income | 13,174 | 12,316 | 7.0 | 4.7 | 7,209 | 7,623 | (5.4) | (2.7) | |||||||||||||||||||||||||||
| Administrative expenses and amortizations | (6,465) | (5,871) | 10.1 | 8.0 | (3,679) | (3,599) | 2.2 | 5.1 | |||||||||||||||||||||||||||
| Net operating income | 6,708 | 6,445 | 4.1 | 1.7 | 3,531 | 4,025 | (12.3) | (9.8) | |||||||||||||||||||||||||||
| Net loan-loss provisions | (3,733) | (2,538) | 47.1 | 45.2 | (2,593) | (1,744) | 48.7 | 52.9 | |||||||||||||||||||||||||||
| Other gains (losses) and provisions | (138) | (118) | 17.4 | 9.0 | (74) | (20) | 278.1 | 288.9 | |||||||||||||||||||||||||||
| Profit before tax | 2,837 | 3,790 | (25.1) | (27.2) | 863 | 2,261 | (61.8) | (60.7) | |||||||||||||||||||||||||||
| Tax on profit | (468) | (869) | (46.1) | (47.9) | 69 | (478) | — | — | |||||||||||||||||||||||||||
| Profit from continuing operations | 2,369 | 2,921 | (18.9) | (21.1) | 932 | 1,784 | (47.7) | (46.3) | |||||||||||||||||||||||||||
| Net profit from discontinued operations | — | — | — | — | — | — | — | — | |||||||||||||||||||||||||||
| Consolidated profit | 2,369 | 2,921 | (18.9) | (21.1) | 932 | 1,784 | (47.7) | (46.3) | |||||||||||||||||||||||||||
| Non-controlling interests | (15) | (43) | (64.9) | (68.3) | — | — | — | — | |||||||||||||||||||||||||||
| Profit attributable to the parent | 2,354 | 2,878 | (18.2) | (20.3) | 932 | 1,784 | (47.7) | (46.3) | |||||||||||||||||||||||||||
| Balance sheet | |||||||||||||||||||||||||||||||||||
| Loans and advances to customers | 174,780 | 171,519 | 1.9 | 1.8 | 126,843 | 130,390 | (2.7) | 0.7 | |||||||||||||||||||||||||||
| Cash, central banks and credit institutions | 35,969 | 35,607 | 1.0 | (1.9) | 21,215 | 20,000 | 6.1 | 9.8 | |||||||||||||||||||||||||||
| Debt instruments | 50,311 | 44,060 | 14.2 | 9.7 | 22,686 | 21,637 | 4.8 | 8.5 | |||||||||||||||||||||||||||
| Other financial assets | 10,937 | 14,668 | (25.4) | (29.6) | 4,075 | 5,241 | (22.3) | (19.5) | |||||||||||||||||||||||||||
| Other asset accounts | 22,829 | 22,741 | 0.4 | 0.8 | 16,307 | 17,837 | (8.6) | (5.4) | |||||||||||||||||||||||||||
| Total assets | 294,827 | 288,595 | 2.2 | 0.8 | 191,126 | 195,106 | (2.0) | 1.4 | |||||||||||||||||||||||||||
| Customer deposits | 175,958 | 168,748 | 4.3 | 3.8 | 121,782 | 124,209 | (2.0) | 1.5 | |||||||||||||||||||||||||||
| Central banks and credit institutions | 34,723 | 25,294 | 37.3 | 29.2 | 17,411 | 8,572 | 103.1 | 110.3 | |||||||||||||||||||||||||||
| Marketable debt securities | 35,133 | 41,063 | (14.4) | (14.1) | 27,059 | 32,685 | (17.2) | (14.3) | |||||||||||||||||||||||||||
| Other financial liabilities | 18,606 | 20,883 | (10.9) | (15.4) | 7,276 | 8,346 | (12.8) | (9.7) | |||||||||||||||||||||||||||
| Other liabilities accounts | 6,764 | 6,943 | (2.6) | (5.0) | 3,119 | 4,116 | (24.2) | (21.6) | |||||||||||||||||||||||||||
| Total liabilities | 271,183 | 262,931 | 3.1 | 1.8 | 176,646 | 177,929 | (0.7) | 2.8 | |||||||||||||||||||||||||||
| Total equity | 23,644 | 25,664 | (7.9) | (9.1) | 14,480 | 17,177 | (15.7) | (12.7) | |||||||||||||||||||||||||||
| Memorandum items: | |||||||||||||||||||||||||||||||||||
Gross loans and advances to customers B | 161,401 | 156,521 | 3.1 | 2.6 | 112,671 | 115,248 | (2.2) | 1.2 | |||||||||||||||||||||||||||
| Customer funds | 171,310 | 164,414 | 4.2 | 3.0 | 108,062 | 112,856 | (4.2) | (0.9) | |||||||||||||||||||||||||||
Customer deposits C | 141,863 | 135,955 | 4.3 | 3.7 | 95,697 | 98,346 | (2.7) | 0.7 | |||||||||||||||||||||||||||
| Mutual funds | 29,447 | 28,459 | 3.5 | (0.3) | 12,364 | 14,510 | (14.8) | (11.8) | |||||||||||||||||||||||||||
| Ratios (%), operating means and customers | |||||||||||||||||||||||||||||||||||
| RoTE | 9.76 | 11.06 | (1.30) | 6.07 | 9.40 | (3.33) | |||||||||||||||||||||||||||||
| Efficiency ratio | 49.1 | 47.7 | 1.4 | 51.0 | 47.2 | 3.8 | |||||||||||||||||||||||||||||
| NPL ratio | 4.09 | 3.03 | 1.06 | 4.57 | 3.25 | 1.32 | |||||||||||||||||||||||||||||
| Total coverage ratio | 73.8 | 93.3 | (19.4) | 67.7 | 90.3 | (22.6) | |||||||||||||||||||||||||||||
| Number of employees | 45,593 | 44,518 | 2.4 | 13,489 | 14,610 | (7.7) | |||||||||||||||||||||||||||||
| Number of branches | 1,784 | 1,854 | (3.8) | 415 | 485 | (14.4) | |||||||||||||||||||||||||||||
| Number of total customers (thousands) | 25,027 | 24,980 | 0.2 | 4,510 | 4,523 | (0.3) | |||||||||||||||||||||||||||||
| Number of active customers (thousands) | 14,486 | 14,020 | 3.3 | 4,223 | 4,137 | 2.1 | |||||||||||||||||||||||||||||
| A. Includes exchange differences. | |||||||||||||||||||||||||||||||||||
| B. Minus reverse repurchase agreements. | |||||||||||||||||||||||||||||||||||
| C. Minus repurchase agreements. | |||||||||||||||||||||||||||||||||||
414
| Primary segments | |||||||||||||||||||||||||||||||||||
| EUR million | |||||||||||||||||||||||||||||||||||
| Mexico | Other North America | ||||||||||||||||||||||||||||||||||
| Underlying income statement | 2023 | 2022 | % | % excl. FX | 2023 | 2022 | % | % excl. FX | |||||||||||||||||||||||||||
| Net interest income | 4,408 | 3,565 | 23.7 | 12.1 | 8 | — | — | — | |||||||||||||||||||||||||||
| Net fee income | 1,374 | 1,140 | 20.5 | 9.3 | 52 | 47 | 10.0 | 10.0 | |||||||||||||||||||||||||||
Gains (losses) on financial transactions A | 211 | 39 | 435.2 | 385.2 | (1) | — | — | — | |||||||||||||||||||||||||||
| Other operating income | (94) | (122) | (22.6) | (29.8) | 6 | 22 | (71.7) | (71.7) | |||||||||||||||||||||||||||
| Total income | 5,899 | 4,623 | 27.6 | 15.7 | 66 | 70 | (6.1) | (6.1) | |||||||||||||||||||||||||||
| Administrative expenses and amortizations | (2,588) | (2,076) | 24.7 | 13.0 | (199) | (196) | 1.3 | 1.4 | |||||||||||||||||||||||||||
| Net operating income | 3,311 | 2,547 | 30.0 | 17.9 | (133) | (126) | 5.4 | 5.5 | |||||||||||||||||||||||||||
| Net loan-loss provisions | (1,135) | (788) | 44.1 | 30.6 | (5) | (6) | (15.2) | (15.2) | |||||||||||||||||||||||||||
| Other gains (losses) and provisions | (57) | (94) | (39.1) | (44.7) | (7) | (5) | 52.0 | 52.5 | |||||||||||||||||||||||||||
| Profit before tax | 2,119 | 1,665 | 27.2 | 15.4 | (145) | (137) | 6.1 | 6.1 | |||||||||||||||||||||||||||
| Tax on profit | (541) | (407) | 32.9 | 20.5 | 5 | 17 | (70.6) | (70.6) | |||||||||||||||||||||||||||
| Profit from continuing operations | 1,577 | 1,257 | 25.4 | 13.7 | (140) | (120) | 16.8 | 16.8 | |||||||||||||||||||||||||||
| Net profit from discontinued operations | — | — | — | — | — | — | — | — | |||||||||||||||||||||||||||
| Consolidated profit | 1,577 | 1,257 | 25.4 | 13.7 | (140) | (120) | 16.8 | 16.8 | |||||||||||||||||||||||||||
| Non-controlling interests | (17) | (44) | (61.0) | (64.7) | 2 | 1 | 103.7 | 103.7 | |||||||||||||||||||||||||||
| Profit attributable to the parent | 1,560 | 1,213 | 28.6 | 16.6 | (138) | (119) | 16.0 | 16.1 | |||||||||||||||||||||||||||
| Balance sheet | |||||||||||||||||||||||||||||||||||
| Loans and advances to customers | 47,905 | 41,080 | 16.6 | 4.8 | 32 | 48 | (33.3) | (33.3) | |||||||||||||||||||||||||||
| Cash, central banks and credit institutions | 14,088 | 15,254 | (7.6) | (17.0) | 666 | 354 | 88.5 | 88.5 | |||||||||||||||||||||||||||
| Debt instruments | 27,624 | 22,423 | 23.2 | 10.7 | 2 | — | — | — | |||||||||||||||||||||||||||
| Other financial assets | 6,723 | 9,257 | (27.4) | (34.8) | 139 | 170 | (18.0) | (18.0) | |||||||||||||||||||||||||||
| Other asset accounts | 6,156 | 4,622 | 33.2 | 19.6 | 366 | 282 | 29.8 | 29.8 | |||||||||||||||||||||||||||
| Total assets | 102,496 | 92,636 | 10.6 | (0.6) | 1,205 | 853 | 41.2 | 41.2 | |||||||||||||||||||||||||||
| Customer deposits | 53,703 | 44,309 | 21.2 | 8.9 | 473 | 230 | 105.9 | 105.9 | |||||||||||||||||||||||||||
| Central banks and credit institutions | 17,047 | 16,592 | 2.7 | (7.7) | 265 | 130 | 103.1 | 103.1 | |||||||||||||||||||||||||||
| Marketable debt securities | 8,074 | 8,378 | (3.6) | (13.4) | — | — | — | — | |||||||||||||||||||||||||||
| Other financial liabilities | 11,189 | 12,374 | (9.6) | (18.8) | 141 | 163 | (13.2) | (13.2) | |||||||||||||||||||||||||||
| Other liabilities accounts | 3,579 | 2,764 | 29.5 | 16.4 | 66 | 64 | 2.9 | 2.9 | |||||||||||||||||||||||||||
| Total liabilities | 93,592 | 84,416 | 10.9 | (0.4) | 945 | 587 | 61.1 | 61.1 | |||||||||||||||||||||||||||
| Total equity | 8,904 | 8,220 | 8.3 | (2.7) | 259 | 266 | (2.6) | (2.6) | |||||||||||||||||||||||||||
| Memorandum items: | |||||||||||||||||||||||||||||||||||
Gross loans and advances to customers B | 48,688 | 41,218 | 18.1 | 6.1 | 41 | 55 | (24.8) | (24.8) | |||||||||||||||||||||||||||
| Customer funds | 62,775 | 51,328 | 22.3 | 9.9 | 473 | 230 | 105.9 | 105.9 | |||||||||||||||||||||||||||
Customer deposits C | 45,693 | 37,379 | 22.2 | 9.8 | 473 | 230 | 105.9 | 105.9 | |||||||||||||||||||||||||||
| Mutual funds | 17,082 | 13,949 | 22.5 | 10.0 | — | — | — | — | |||||||||||||||||||||||||||
| Ratios (%), operating means and customers | |||||||||||||||||||||||||||||||||||
| RoTE | 17.70 | 16.92 | 0.77 | ||||||||||||||||||||||||||||||||
| Efficiency ratio | 43.9 | 44.9 | (1.0) | ||||||||||||||||||||||||||||||||
| NPL ratio | 2.82 | 2.32 | 0.50 | ||||||||||||||||||||||||||||||||
| Total coverage ratio | 100.0 | 106.6 | (6.6) | ||||||||||||||||||||||||||||||||
| Number of employees | 30,876 | 28,834 | 7.1 | ||||||||||||||||||||||||||||||||
| Number of branches | 1,369 | 1,369 | 0.0 | ||||||||||||||||||||||||||||||||
| Number of total customers (thousands) | 20,517 | 20,239 | 1.4 | ||||||||||||||||||||||||||||||||
| Number of active customers (thousands) | 10,263 | 9,711 | 5.7 | ||||||||||||||||||||||||||||||||
| A. Includes exchange differences. | |||||||||||||||||||||||||||||||||||
| B. Minus reverse repurchase agreements. | |||||||||||||||||||||||||||||||||||
| C. Minus repurchase agreements. | |||||||||||||||||||||||||||||||||||
415
| Primary segments | |||||||||||||||||||||||||||||||||||
| EUR million | |||||||||||||||||||||||||||||||||||
| South America | Brazil | ||||||||||||||||||||||||||||||||||
| Underlying income statement | 2023 | 2022 | % | % excl. FX | 2023 | 2022 | % | % excl. FX | |||||||||||||||||||||||||||
| Net interest income | 13,040 | 12,979 | 0.5 | 12.0 | 9,116 | 8,901 | 2.4 | 2.0 | |||||||||||||||||||||||||||
| Net fee income | 4,684 | 4,515 | 3.7 | 14.0 | 3,462 | 3,296 | 5.0 | 4.6 | |||||||||||||||||||||||||||
Gains (losses) on financial transactions A | 1,280 | 1,291 | (0.9) | 13.8 | 483 | 736 | (34.5) | (34.7) | |||||||||||||||||||||||||||
| Other operating income | (1,033) | (761) | 35.8 | 403.0 | 43 | (23) | — | — | |||||||||||||||||||||||||||
| Total income | 17,971 | 18,025 | (0.3) | 7.8 | 13,104 | 12,910 | 1.5 | 1.1 | |||||||||||||||||||||||||||
| Administrative expenses and amortizations | (6,920) | (6,675) | 3.7 | 16.7 | (4,529) | (4,180) | 8.3 | 7.9 | |||||||||||||||||||||||||||
| Net operating income | 11,050 | 11,350 | (2.6) | 2.9 | 8,574 | 8,730 | (1.8) | (2.2) | |||||||||||||||||||||||||||
| Net loan-loss provisions | (5,401) | (5,041) | 7.1 | 8.9 | (4,701) | (4,417) | 6.4 | 6.0 | |||||||||||||||||||||||||||
| Other gains (losses) and provisions | (1,041) | (544) | 91.1 | 212.9 | (963) | (259) | 272.0 | 270.4 | |||||||||||||||||||||||||||
| Profit before tax | 4,608 | 5,764 | (20.1) | (15.4) | 2,911 | 4,055 | (28.2) | (28.5) | |||||||||||||||||||||||||||
| Tax on profit | (1,121) | (1,549) | (27.7) | (23.4) | (776) | (1,232) | (37.0) | (37.3) | |||||||||||||||||||||||||||
| Profit from continuing operations | 3,487 | 4,215 | (17.3) | (12.5) | 2,135 | 2,822 | (24.3) | (24.7) | |||||||||||||||||||||||||||
| Net profit from discontinued operations | — | — | — | — | — | — | — | — | |||||||||||||||||||||||||||
| Consolidated profit | 3,487 | 4,215 | (17.3) | (12.5) | 2,135 | 2,822 | (24.3) | (24.7) | |||||||||||||||||||||||||||
| Non-controlling interests | (449) | (557) | (19.4) | (19.9) | (215) | (278) | (22.9) | (23.2) | |||||||||||||||||||||||||||
| Profit attributable to the parent | 3,038 | 3,658 | (16.9) | (11.2) | 1,921 | 2,544 | (24.5) | (24.8) | |||||||||||||||||||||||||||
| Balance sheet | |||||||||||||||||||||||||||||||||||
| Loans and advances to customers | 153,244 | 144,812 | 5.8 | 7.2 | 96,399 | 86,202 | 11.8 | 6.2 | |||||||||||||||||||||||||||
| Cash, central banks and credit institutions | 67,410 | 52,358 | 28.7 | 30.1 | 53,618 | 40,858 | 31.2 | 24.6 | |||||||||||||||||||||||||||
| Debt instruments | 64,352 | 57,106 | 12.7 | 18.7 | 47,325 | 37,387 | 26.6 | 20.2 | |||||||||||||||||||||||||||
| Other financial assets | 20,796 | 19,854 | 4.7 | 7.8 | 8,161 | 5,682 | 43.6 | 36.4 | |||||||||||||||||||||||||||
| Other asset accounts | 19,247 | 18,795 | 2.4 | 3.6 | 14,590 | 14,037 | 3.9 | (1.3) | |||||||||||||||||||||||||||
| Total assets | 325,049 | 292,925 | 11.0 | 13.3 | 220,093 | 184,165 | 19.5 | 13.5 | |||||||||||||||||||||||||||
| Customer deposits | 155,448 | 137,661 | 12.9 | 17.3 | 110,162 | 89,957 | 22.5 | 16.3 | |||||||||||||||||||||||||||
| Central banks and credit institutions | 48,898 | 42,921 | 13.9 | 14.1 | 28,333 | 23,477 | 20.7 | 14.6 | |||||||||||||||||||||||||||
| Marketable debt securities | 39,603 | 35,063 | 12.9 | 11.2 | 27,976 | 23,997 | 16.6 | 10.7 | |||||||||||||||||||||||||||
| Other financial liabilities | 42,438 | 41,445 | 2.4 | 2.7 | 28,625 | 25,719 | 11.3 | 5.7 | |||||||||||||||||||||||||||
| Other liabilities accounts | 12,768 | 11,327 | 12.7 | 16.8 | 7,938 | 5,477 | 44.9 | 37.6 | |||||||||||||||||||||||||||
| Total liabilities | 299,155 | 268,417 | 11.5 | 13.6 | 203,035 | 168,627 | 20.4 | 14.3 | |||||||||||||||||||||||||||
| Total equity | 25,894 | 24,508 | 5.7 | 10.1 | 17,058 | 15,539 | 9.8 | 4.2 | |||||||||||||||||||||||||||
| Memorandum items: | |||||||||||||||||||||||||||||||||||
Gross loans and advances to customers B | 160,987 | 152,435 | 5.6 | 6.9 | 102,583 | 92,194 | 11.3 | 5.7 | |||||||||||||||||||||||||||
| Customer funds | 205,675 | 182,541 | 12.7 | 17.3 | 145,044 | 120,911 | 20.0 | 13.9 | |||||||||||||||||||||||||||
Customer deposits C | 135,342 | 123,307 | 9.8 | 15.3 | 90,297 | 75,767 | 19.2 | 13.2 | |||||||||||||||||||||||||||
| Mutual funds | 70,333 | 59,234 | 18.7 | 21.3 | 54,747 | 45,144 | 21.3 | 15.2 | |||||||||||||||||||||||||||
| Ratios (%), operating means and customers | |||||||||||||||||||||||||||||||||||
| RoTE | 14.43 | 18.77 | (4.33) | 13.73 | 19.23 | (5.50) | |||||||||||||||||||||||||||||
| Efficiency ratio | 38.5 | 37.0 | 1.5 | 34.6 | 32.4 | 2.2 | |||||||||||||||||||||||||||||
| NPL ratio | 5.72 | 6.20 | (0.49) | 6.56 | 7.57 | (1.00) | |||||||||||||||||||||||||||||
| Total coverage ratio | 78.4 | 76.0 | 2.4 | 84.7 | 79.5 | 5.2 | |||||||||||||||||||||||||||||
| Number of employees | 80,997 | 78,271 | 3.5 | 57,775 | 55,993 | 3.2 | |||||||||||||||||||||||||||||
| Number of branches | 3,309 | 3,653 | (9.4) | 2,580 | 2,847 | (9.4) | |||||||||||||||||||||||||||||
| Number of total customers (thousands) | 73,028 | 69,553 | 5.0 | 62,804 | 60,117 | 4.5 | |||||||||||||||||||||||||||||
| Number of active customers (thousands) | 37,517 | 38,368 | (2.2) | 30,460 | 31,813 | (4.3) | |||||||||||||||||||||||||||||
| A. Includes exchange differences. | |||||||||||||||||||||||||||||||||||
| B. Minus reverse repurchase agreements. | |||||||||||||||||||||||||||||||||||
| C. Minus repurchase agreements. | |||||||||||||||||||||||||||||||||||
416
| Primary segments | |||||||||||||||||||||||||||||||||||
| EUR million | |||||||||||||||||||||||||||||||||||
| Chile | Argentina | ||||||||||||||||||||||||||||||||||
| Underlying income statement | 2023 | 2022 | % | % excl. FX | 2023 | 2022 | % | % excl. FX | |||||||||||||||||||||||||||
| Net interest income | 1,383 | 1,772 | (22.0) | (22.9) | 1,879 | 1,778 | 5.7 | 399.4 | |||||||||||||||||||||||||||
| Net fee income | 572 | 468 | 22.2 | 20.8 | 396 | 542 | (26.9) | 245.2 | |||||||||||||||||||||||||||
Gains (losses) on financial transactions A | 320 | 242 | 32.2 | 30.7 | 341 | 218 | 56.0 | 637.0 | |||||||||||||||||||||||||||
| Other operating income | 11 | (33) | — | — | (1,071) | (705) | 51.9 | 617.8 | |||||||||||||||||||||||||||
| Total income | 2,285 | 2,449 | (6.7) | (7.7) | 1,544 | 1,833 | (15.8) | 298.1 | |||||||||||||||||||||||||||
| Administrative expenses and amortizations | (1,020) | (981) | 4.0 | 2.8 | (775) | (987) | (21.5) | 271.0 | |||||||||||||||||||||||||||
| Net operating income | 1,265 | 1,468 | (13.8) | (14.8) | 769 | 846 | (9.1) | 329.7 | |||||||||||||||||||||||||||
| Net loan-loss provisions | (365) | (399) | (8.5) | (9.5) | (150) | (132) | 13.6 | 436.9 | |||||||||||||||||||||||||||
| Other gains (losses) and provisions | 51 | (8) | — | — | (114) | (270) | (57.7) | 99.8 | |||||||||||||||||||||||||||
| Profit before tax | 951 | 1,062 | (10.4) | (11.4) | 505 | 443 | 13.8 | 437.9 | |||||||||||||||||||||||||||
| Tax on profit | (135) | (105) | 28.5 | 27.0 | (117) | (118) | (1.4) | 366.1 | |||||||||||||||||||||||||||
| Profit from continuing operations | 816 | 956 | (14.7) | (15.6) | 388 | 325 | 19.4 | 464.1 | |||||||||||||||||||||||||||
| Net profit from discontinued operations | — | — | — | — | — | — | — | — | |||||||||||||||||||||||||||
| Consolidated profit | 816 | 956 | (14.7) | (15.6) | 388 | 325 | 19.4 | 464.1 | |||||||||||||||||||||||||||
| Non-controlling interests | (234) | (279) | (16.0) | (16.9) | (2) | (1) | 154.0 | — | |||||||||||||||||||||||||||
| Profit attributable to the parent | 582 | 677 | (14.1) | (15.1) | 386 | 324 | 19.0 | 462.3 | |||||||||||||||||||||||||||
| Balance sheet | |||||||||||||||||||||||||||||||||||
| Loans and advances to customers | 42,616 | 43,336 | (1.7) | 4.4 | 3,767 | 5,586 | (32.6) | 218.7 | |||||||||||||||||||||||||||
| Cash, central banks and credit institutions | 6,373 | 6,344 | 0.5 | 6.6 | 4,548 | 3,021 | 50.6 | 611.4 | |||||||||||||||||||||||||||
| Debt instruments | 13,273 | 11,977 | 10.8 | 17.6 | 1,368 | 5,317 | (74.3) | 21.6 | |||||||||||||||||||||||||||
| Other financial assets | 12,159 | 13,898 | (12.5) | (7.1) | 11 | 74 | (85.8) | (32.7) | |||||||||||||||||||||||||||
| Other asset accounts | 2,746 | 2,869 | (4.3) | 1.6 | 776 | 1,017 | (23.7) | 260.6 | |||||||||||||||||||||||||||
| Total assets | 77,167 | 78,425 | (1.6) | 4.5 | 10,470 | 15,015 | (30.3) | 229.5 | |||||||||||||||||||||||||||
| Customer deposits | 29,578 | 29,042 | 1.8 | 8.1 | 6,478 | 10,547 | (38.6) | 190.2 | |||||||||||||||||||||||||||
| Central banks and credit institutions | 14,808 | 13,906 | 6.5 | 13.0 | 1,271 | 1,080 | 17.6 | 455.9 | |||||||||||||||||||||||||||
| Marketable debt securities | 10,775 | 10,415 | 3.5 | 9.8 | 148 | 153 | (3.4) | 356.6 | |||||||||||||||||||||||||||
| Other financial liabilities | 12,624 | 14,650 | (13.8) | (8.5) | 638 | 811 | (21.3) | 272.0 | |||||||||||||||||||||||||||
| Other liabilities accounts | 3,733 | 4,832 | (22.7) | (18.0) | 455 | 514 | (11.5) | 318.4 | |||||||||||||||||||||||||||
| Total liabilities | 71,518 | 72,845 | (1.8) | 4.2 | 8,990 | 13,105 | (31.4) | 224.2 | |||||||||||||||||||||||||||
| Total equity | 5,648 | 5,580 | 1.2 | 7.5 | 1,479 | 1,910 | (22.6) | 266.0 | |||||||||||||||||||||||||||
| Memorandum items: | |||||||||||||||||||||||||||||||||||
Gross loans and advances to customers B | 43,823 | 44,588 | (1.7) | 4.3 | 3,878 | 5,781 | (32.9) | 217.0 | |||||||||||||||||||||||||||
| Customer funds | 40,098 | 38,014 | 5.5 | 12.0 | 10,288 | 14,499 | (29.0) | 235.3 | |||||||||||||||||||||||||||
Customer deposits C | 29,337 | 28,889 | 1.6 | 7.8 | 6,478 | 10,547 | (38.6) | 190.2 | |||||||||||||||||||||||||||
| Mutual funds | 10,761 | 9,126 | 17.9 | 25.2 | 3,810 | 3,952 | (3.6) | 355.5 | |||||||||||||||||||||||||||
| Ratios (%), operating means and customers | |||||||||||||||||||||||||||||||||||
| RoTE | 14.82 | 19.47 | (4.65) | 55.60 | 26.23 | 29.36 | |||||||||||||||||||||||||||||
| Efficiency ratio | 44.6 | 40.1 | 4.6 | 50.2 | 53.9 | (3.7) | |||||||||||||||||||||||||||||
| NPL ratio | 5.01 | 4.99 | 0.02 | 1.99 | 2.08 | (0.10) | |||||||||||||||||||||||||||||
| Total coverage ratio | 52.7 | 56.3 | (3.6) | 165.7 | 180.4 | (14.7) | |||||||||||||||||||||||||||||
| Number of employees | 9,948 | 9,773 | 1.8 | 8,455 | 8,251 | 2.5 | |||||||||||||||||||||||||||||
| Number of branches | 248 | 283 | (12.4) | 322 | 375 | (14.1) | |||||||||||||||||||||||||||||
| Number of total customers (thousands) | 4,052 | 3,577 | 13.3 | 4,771 | 4,385 | 8.8 | |||||||||||||||||||||||||||||
| Number of active customers (thousands) | 2,399 | 2,196 | 9.2 | 3,562 | 3,203 | 11.2 | |||||||||||||||||||||||||||||
| A. Includes exchange differences. | |||||||||||||||||||||||||||||||||||
| B. Minus reverse repurchase agreements. | |||||||||||||||||||||||||||||||||||
| C. Minus repurchase agreements. | |||||||||||||||||||||||||||||||||||
417
| Primary segments | |||||||||||||||||||||||||||||||||||
| EUR million | |||||||||||||||||||||||||||||||||||
| Other South America | Digital Consumer Bank | ||||||||||||||||||||||||||||||||||
| Underlying income statement | 2023 | 2022 | % | % excl. FX | 2023 | 2022 | % | % excl. FX | |||||||||||||||||||||||||||
| Net interest income | 662 | 527 | 25.6 | 24.1 | 4,193 | 4,022 | 4.3 | 6.1 | |||||||||||||||||||||||||||
| Net fee income | 254 | 210 | 21.2 | 20.2 | 796 | 843 | (5.6) | (5.3) | |||||||||||||||||||||||||||
Gains (losses) on financial transactions A | 137 | 95 | 44.5 | 45.1 | 117 | 60 | 95.5 | 94.8 | |||||||||||||||||||||||||||
| Other operating income | (16) | 1 | — | — | 396 | 344 | 15.1 | 15.3 | |||||||||||||||||||||||||||
| Total income | 1,038 | 832 | 24.6 | 23.5 | 5,502 | 5,269 | 4.4 | 5.9 | |||||||||||||||||||||||||||
| Administrative expenses and amortizations | (596) | (527) | 13.2 | 12.7 | (2,618) | (2,462) | 6.4 | 8.1 | |||||||||||||||||||||||||||
| Net operating income | 441 | 306 | 44.3 | 42.1 | 2,884 | 2,807 | 2.7 | 3.9 | |||||||||||||||||||||||||||
| Net loan-loss provisions | (186) | (94) | 98.4 | 96.1 | (792) | (544) | 45.7 | 47.8 | |||||||||||||||||||||||||||
| Other gains (losses) and provisions | (15) | (7) | 95.0 | 92.8 | (72) | (27) | 169.9 | 167.0 | |||||||||||||||||||||||||||
| Profit before tax | 241 | 205 | 17.7 | 15.7 | 2,019 | 2,237 | (9.7) | (8.7) | |||||||||||||||||||||||||||
| Tax on profit | (93) | (94) | (0.8) | (1.9) | (493) | (549) | (10.3) | (9.5) | |||||||||||||||||||||||||||
| Profit from continuing operations | 148 | 111 | 33.3 | 30.4 | 1,526 | 1,687 | (9.5) | (8.4) | |||||||||||||||||||||||||||
| Net profit from discontinued operations | — | — | — | — | — | — | — | — | |||||||||||||||||||||||||||
| Consolidated profit | 148 | 111 | 33.3 | 30.4 | 1,526 | 1,687 | (9.5) | (8.4) | |||||||||||||||||||||||||||
| Non-controlling interests | 2 | 1 | 96.8 | 96.8 | (327) | (379) | (13.7) | (13.7) | |||||||||||||||||||||||||||
| Profit attributable to the parent | 150 | 112 | 33.9 | 31.0 | 1,199 | 1,308 | (8.4) | (6.9) | |||||||||||||||||||||||||||
| Balance sheet | |||||||||||||||||||||||||||||||||||
| Loans and advances to customers | 10,463 | 9,689 | 8.0 | 3.6 | 132,692 | 122,608 | 8.2 | 8.5 | |||||||||||||||||||||||||||
| Cash, central banks and credit institutions | 2,870 | 2,135 | 34.4 | 31.9 | 18,636 | 12,311 | 51.4 | 52.7 | |||||||||||||||||||||||||||
| Debt instruments | 2,386 | 2,425 | (1.6) | (1.2) | 5,387 | 7,644 | (29.5) | (29.8) | |||||||||||||||||||||||||||
| Other financial assets | 466 | 200 | 133.3 | 133.1 | 135 | 190 | (28.8) | (29.0) | |||||||||||||||||||||||||||
| Other asset accounts | 1,135 | 872 | 30.2 | 28.9 | 9,945 | 8,262 | 20.4 | 20.3 | |||||||||||||||||||||||||||
| Total assets | 17,320 | 15,320 | 13.1 | 9.8 | 166,796 | 151,016 | 10.4 | 10.7 | |||||||||||||||||||||||||||
| Customer deposits | 9,230 | 8,116 | 13.7 | 12.5 | 69,334 | 58,544 | 18.4 | 19.0 | |||||||||||||||||||||||||||
| Central banks and credit institutions | 4,486 | 4,457 | 0.6 | (6.6) | 31,965 | 39,169 | (18.4) | (18.5) | |||||||||||||||||||||||||||
| Marketable debt securities | 703 | 498 | 41.3 | 43.8 | 44,605 | 33,749 | 32.2 | 32.7 | |||||||||||||||||||||||||||
| Other financial liabilities | 550 | 265 | 107.8 | 105.7 | 2,218 | 1,820 | 21.9 | 21.4 | |||||||||||||||||||||||||||
| Other liabilities accounts | 641 | 504 | 27.4 | 27.1 | 5,233 | 4,704 | 11.2 | 11.6 | |||||||||||||||||||||||||||
| Total liabilities | 15,611 | 13,840 | 12.8 | 9.4 | 153,355 | 137,986 | 11.1 | 11.4 | |||||||||||||||||||||||||||
| Total equity | 1,709 | 1,480 | 15.5 | 14.1 | 13,441 | 13,029 | 3.2 | 3.6 | |||||||||||||||||||||||||||
| Memorandum items: | |||||||||||||||||||||||||||||||||||
Gross loans and advances to customers B | 10,703 | 9,872 | 8.4 | 4.1 | 135,202 | 124,976 | 8.2 | 8.4 | |||||||||||||||||||||||||||
| Customer funds | 10,246 | 9,117 | 12.4 | 11.5 | 72,963 | 61,625 | 18.4 | 18.9 | |||||||||||||||||||||||||||
Customer deposits C | 9,230 | 8,105 | 13.9 | 12.6 | 69,334 | 58,544 | 18.4 | 19.0 | |||||||||||||||||||||||||||
| Mutual funds | 1,016 | 1,011 | 0.5 | 2.5 | 3,629 | 3,081 | 17.8 | 17.8 | |||||||||||||||||||||||||||
| Ratios (%), operating means and customers | |||||||||||||||||||||||||||||||||||
| RoTE | 12.33 | 13.65 | (1.32) | ||||||||||||||||||||||||||||||||
| Efficiency ratio | 47.6 | 46.7 | 0.9 | ||||||||||||||||||||||||||||||||
| NPL ratio | 2.12 | 2.06 | 0.06 | ||||||||||||||||||||||||||||||||
| Total coverage ratio | 88.0 | 92.8 | (4.8) | ||||||||||||||||||||||||||||||||
| Number of employees | 16,795 | 16,193 | 3.7 | ||||||||||||||||||||||||||||||||
| Number of branches | 342 | 364 | (6.0) | ||||||||||||||||||||||||||||||||
| Number of total customers (thousands) | 20,193 | 19,746 | 2.3 | ||||||||||||||||||||||||||||||||
| A. Includes exchange differences. | |||||||||||||||||||||||||||||||||||
| B. Minus reverse repurchase agreements. | |||||||||||||||||||||||||||||||||||
| C. Minus repurchase agreements. | |||||||||||||||||||||||||||||||||||
418
| Secondary segments | |||||||||||||||||||||||||||||||||||
| EUR million | |||||||||||||||||||||||||||||||||||
| Retail Banking | Corporate & Investment Banking | ||||||||||||||||||||||||||||||||||
| Underlying income statement | 2023 | 2022 | % | % excl. FX | 2023 | 2022 | % | % excl. FX | |||||||||||||||||||||||||||
| Net interest income | 37,985 | 34,855 | 9.0 | 11.9 | 3,485 | 3,548 | (1.8) | 7.5 | |||||||||||||||||||||||||||
| Net fee income | 7,661 | 7,654 | 0.1 | 3.3 | 2,190 | 1,981 | 10.5 | 13.6 | |||||||||||||||||||||||||||
Gains (losses) on financial transactions A | 214 | 449 | (52.3) | (54.0) | 2,581 | 1,818 | 42.0 | 57.0 | |||||||||||||||||||||||||||
| Other operating income | (606) | (283) | 114.2 | — | 41 | 31 | 30.8 | (79.5) | |||||||||||||||||||||||||||
| Total income | 45,254 | 42,674 | 6.0 | 8.1 | 8,296 | 7,378 | 12.5 | 18.3 | |||||||||||||||||||||||||||
| Administrative expenses and amortizations | (19,396) | (18,552) | 4.6 | 8.1 | (3,391) | (2,902) | 16.8 | 20.4 | |||||||||||||||||||||||||||
| Net operating income | 25,858 | 24,123 | 7.2 | 8.1 | 4,905 | 4,476 | 9.6 | 17.0 | |||||||||||||||||||||||||||
| Net loan-loss provisions | (12,295) | (10,212) | 20.4 | 20.9 | (162) | (249) | (35.0) | (33.7) | |||||||||||||||||||||||||||
| Other gains (losses) and provisions | (2,691) | (2,126) | 26.6 | 39.3 | (174) | (130) | 34.0 | 33.9 | |||||||||||||||||||||||||||
| Profit before tax | 10,872 | 11,785 | (7.8) | (8.1) | 4,570 | 4,097 | 11.5 | 19.6 | |||||||||||||||||||||||||||
| Tax on profit | (2,586) | (2,950) | (12.3) | (11.5) | (1,280) | (1,098) | 16.6 | 19.7 | |||||||||||||||||||||||||||
| Profit from continuing operations | 8,286 | 8,835 | (6.2) | (7.0) | 3,290 | 2,999 | 9.7 | 19.6 | |||||||||||||||||||||||||||
| Net profit from discontinued operations | — | — | — | — | — | — | — | — | |||||||||||||||||||||||||||
| Consolidated profit | 8,286 | 8,835 | (6.2) | (7.0) | 3,290 | 2,999 | 9.7 | 19.6 | |||||||||||||||||||||||||||
| Non-controlling interests | (849) | (902) | (5.8) | (6.9) | (212) | (182) | 16.3 | 15.1 | |||||||||||||||||||||||||||
| Profit attributable to the parent | 7,436 | 7,933 | (6.3) | (7.0) | 3,078 | 2,817 | 9.3 | 19.9 | |||||||||||||||||||||||||||
| A. Includes exchange differences. | |||||||||||||||||||||||||||||||||||
| Secondary segments | |||||||||||||||||||||||||||||||||||
| EUR million | |||||||||||||||||||||||||||||||||||
| Wealth Management & Insurance | PagoNxt | ||||||||||||||||||||||||||||||||||
| Underlying income statement | 2023 | 2022 | % | % excl. FX | 2023 | 2022 | % | % excl. FX | |||||||||||||||||||||||||||
| Net interest income | 1,739 | 847 | 105.4 | 112.1 | 93 | 22 | 325.2 | 320.8 | |||||||||||||||||||||||||||
| Net fee income | 1,265 | 1,293 | (2.1) | 0.5 | 954 | 881 | 8.3 | 6.3 | |||||||||||||||||||||||||||
Gains (losses) on financial transactions A | 149 | 123 | 20.8 | 29.5 | (10) | (14) | (29.4) | (32.0) | |||||||||||||||||||||||||||
| Other operating income | 242 | 371 | (34.8) | (39.3) | 102 | 64 | 59.9 | 58.7 | |||||||||||||||||||||||||||
| Total income | 3,396 | 2,635 | 28.9 | 31.0 | 1,140 | 953 | 19.6 | 17.5 | |||||||||||||||||||||||||||
| Administrative expenses and amortizations | (1,156) | (1,054) | 9.7 | 11.6 | (1,091) | (1,024) | 6.6 | 6.0 | |||||||||||||||||||||||||||
| Net operating income | 2,240 | 1,581 | 41.6 | 43.9 | 49 | (71) | — | — | |||||||||||||||||||||||||||
| Net loan-loss provisions | 21 | (14) | — | — | (24) | (44) | (45.6) | (45.8) | |||||||||||||||||||||||||||
| Other gains (losses) and provisions | (26) | (36) | (28.6) | (28.0) | (42) | (26) | 62.3 | 66.1 | |||||||||||||||||||||||||||
| Profit before tax | 2,235 | 1,531 | 46.0 | 48.3 | (17) | (141) | (88.1) | (87.0) | |||||||||||||||||||||||||||
| Tax on profit | (528) | (349) | 51.2 | 55.5 | (59) | (63) | (5.6) | (9.8) | |||||||||||||||||||||||||||
| Profit from continuing operations | 1,707 | 1,182 | 44.4 | 46.2 | (76) | (203) | (62.7) | (60.9) | |||||||||||||||||||||||||||
| Net profit from discontinued operations | — | — | — | — | — | — | — | — | |||||||||||||||||||||||||||
| Consolidated profit | 1,707 | 1,182 | 44.4 | 46.2 | (76) | (203) | (62.7) | (60.9) | |||||||||||||||||||||||||||
| Non-controlling interests | (71) | (63) | 11.8 | 9.9 | (1) | (12) | (87.8) | (88.2) | |||||||||||||||||||||||||||
| Profit attributable to the parent | 1,637 | 1,119 | 46.3 | 48.4 | (77) | (215) | (64.0) | (62.5) | |||||||||||||||||||||||||||
| A. Includes exchange differences. | |||||||||||||||||||||||||||||||||||
419
4.7 New reporting structure from 1 January 2024
Description of segments
In addition to what has already been explained in the previous sections of this chapter of the Annual report, and in order to align the operating and management model of the retail and commercial and consumer banking areas with Grupo Santander's strategy, on 18 September 2023 we announced that we would adapt our reporting segments, as a result of these changes in the management, starting with the financial information for the first quarter of 2024.
a.Main changes to the composition of Santander's segments
The main changes, which apply from 1 January 2024 to the management information for all periods included in the consolidated financial statements, are as follows:
1.All of the bank's businesses across all markets have been consolidated into five global areas: Retail & Commercial Banking, Digital Consumer Bank, Corporate & Investment Banking, Wealth Management & Insurance and Payments. These become the new primary segments.
2.The changes in financial information are:
a.The former Retail Banking has been split into two new segments: Retail & Commercial Banking and Digital Consumer Bank. Our cards business now forms part of the new Payments segment.
b.The results of activities mainly related to financial management located in the countries are fully allocated to their global businesses based on the segment that generates the financial position.
c.The local corporate centres are fully allocated to each global business.
d.The revenue sharing criteria between global businesses have been revised to better reflect the contribution of each business to the Group.
3.The former primary segments (Europe, North America, South America and Digital Consumer Bank - which is renamed DCB Europe) are now our secondary segments. All 2023 and 2022 published figures for the countries, regions and the Corporate Centre remain unchanged.
All the changes described above have no impact on the reported Group consolidated financial statements.
b. New composition of Santander's segments
Primary segments
This primary level of segmentation, which is based on the Group's management structure from 1 January 2024, comprises six reportable segments: five operating areas plus the Corporate Centre. The operating areas are:
Retail & Commercial Banking: new area that integrates the retail banking business (individuals) and commercial banking (SMEs and corporates), except for the consumer finance and the cards businesses.
Digital Consumer Bank: comprises all business originated in the consumer finance companies, plus Openbank, Open Digital Services (ODS) and SBNA Consumer.
Corporate & Investment Banking (CIB): this business, which includes Markets, Investment Banking (Global Debt Finance and Corporate Finance) and Global Transactional Banking, offers products and services on a global scale to corporate and institutional customers, and collaborates with other global businesses to better serve our broad customer base.
Wealth Management & Insurance: includes the asset management business (Santander Asset Management), the corporate unit of Private Banking and International Private Banking in Miami and Switzerland and the insurance business (Santander Insurance).
Payments: digital payments solutions, providing global technology solutions for our banks and new customers in the open market. It is structured in two businesses: PagoNxt (merchant, International Trade, A2A Payments and Consumer) and Cards (cards platform and business in the countries).
Secondary (or geographic) segments
At this secondary level, Santander is structured into the segments that made up the primary segments in 2022 and 2023, which are Europe, North America, South America and DCB Europe:
Europe: comprises all business activity carried out in the region, except that included in DCB Europe. Detailed financial information is provided on Spain, the UK, Portugal and Poland.
North America: comprises all the business activities carried out in Mexico and the US, which includes the holding company (SHUSA) and the businesses of Santander Bank, Santander Consumer USA (SC USA), the specialized business unit Banco Santander International, the New York branch and Santander US Capital Markets (SanCap).
South America: includes all the financial activities carried out by Santander through its banks and subsidiary banks in the region. Detailed information is provided on Brazil, Chile, Argentina, Uruguay, Peru and Colombia.
DCB Europe: includes Santander Consumer Finance, which incorporates the entire consumer finance business in Europe, Openbank in Spain and ODS.
In addition to these operating units, both at the primary and secondary segment level, the Group continues to maintain the area of Corporate Centre, which includes the centralized activities relating to equity stakes in financial companies, financial management of the structural exchange rate position, assumed within the sphere of the Group’s assets and liabilities committee, as well as management of liquidity and of shareholders’ equity via issuances.
As the Group’s holding entity, this area manages all capital and reserves and allocations of capital and liquidity with the other businesses. It also incorporates goodwill impairment but not the costs related to the Group’s central services (charged to the areas), except for corporate and institutional expenses related to the Group’s functioning.
420
To facilitate like-for-like comparisons, in this section we provide 2022 and 2023 data adjusted to reflect the aforementioned changes.
Underlying results and business volumes for 2023 and 2022 are included below, together with comments on 2023 performance, all in line with the new primary and secondary segmentation.
Summary of the Group's income statements by new primary segment
2023. Main items of the underlying income statement of the new primary segments | ||||||||||||||||||||
| EUR million | ||||||||||||||||||||
| Primary segments | Net interest income | Net fee income | Total income | Net operating income | Profit before tax | Profit attributable to the parent | ||||||||||||||
| Retail & Commercial Banking | 25,550 | 4,497 | 29,754 | 16,930 | 7,989 | 5,659 | ||||||||||||||
| Digital Consumer Bank | 10,221 | 1,229 | 12,296 | 7,033 | 2,677 | 1,901 | ||||||||||||||
| Corporate & Investment Banking | 3,594 | 2,131 | 7,527 | 4,140 | 3,795 | 2,440 | ||||||||||||||
| Wealth Management & Insurance | 1,513 | 1,262 | 3,210 | 1,994 | 1,994 | 1,467 | ||||||||||||||
| Payments | 2,424 | 2,952 | 5,298 | 2,954 | 1,205 | 607 | ||||||||||||||
| Corporate Centre | (41) | (13) | (439) | (829) | (961) | (998) | ||||||||||||||
| TOTAL GROUP | 43,261 | 12,057 | 57,647 | 32,222 | 16,698 | 11,076 | ||||||||||||||
2022. Main items of the underlying income statement of the new primary segments | ||||||||||||||||||||
| EUR million | ||||||||||||||||||||
| Primary segments | Net interest income | Net fee income | Total income | Net operating income | Profit before tax | Profit attributable to the parent | ||||||||||||||
| Retail & Commercial Banking | 22,093 | 4,672 | 26,994 | 14,935 | 7,099 | 5,017 | ||||||||||||||
| Digital Consumer Bank | 10,121 | 1,269 | 12,391 | 7,194 | 3,880 | 2,610 | ||||||||||||||
| Corporate & Investment Banking | 3,816 | 1,922 | 6,703 | 3,802 | 3,379 | 2,233 | ||||||||||||||
| Wealth Management & Insurance | 883 | 1,293 | 2,678 | 1,574 | 1,516 | 1,101 | ||||||||||||||
| Payments | 2,359 | 2,653 | 4,874 | 2,604 | 1,398 | 693 | ||||||||||||||
| Corporate Centre | (652) | (19) | (1,487) | (1,858) | (2,022) | (2,049) | ||||||||||||||
| TOTAL GROUP | 38,619 | 11,790 | 52,154 | 28,251 | 15,250 | 9,605 | ||||||||||||||
421
 | RETAIL & COMMERCIAL BANKING | Underlying attributable profit | |||||||||||||||
| EUR 5,659 mn | |||||||||||||||||
Business performance
Gross loans and advances to customers, minus reverse repurchase agreements and in constant euros declined 3% year-on-year.
Customer deposits (minus repurchase agreements and in constant euros) grew 3%. Mutual funds decreased 1%. As a result, total customer funds increased 2% in constant euros.
Results
Attributable profit in the year was EUR 5,659 million, 13% higher year-on-year. In constant euros, profit rose 12%. By line:
•Total income increased 12% due to higher net interest income (+19%). On the other hand, net fee income remained stable, gains on financial transactions decreased 27%, while other operating income was 61% more negative.
•Administrative expenses and amortizations were 10% higher but below total income growth. The efficiency ratio improved to 43.1%.
•Net loan-loss provisions rose 11%.
•Other gains (losses) and provisions recorded a EUR 2,401 million loss compared to a EUR 1,950 million loss in 2022.
| Retail & Commercial Banking | |||||||||||||||||
| EUR million | |||||||||||||||||
| Underlying income statement | 2023 | 2022 | % | % excl. FX | |||||||||||||
| Net interest income | 25,550 | 22,093 | 15.6 | 18.9 | |||||||||||||
| Net fee income | 4,497 | 4,672 | (3.8) | (0.1) | |||||||||||||
Gains (losses) on financial transactions A | 854 | 1,141 | (25.2) | (27.0) | |||||||||||||
| Other operating income | (1,146) | (913) | 25.6 | 61.2 | |||||||||||||
| Total income | 29,754 | 26,994 | 10.2 | 12.5 | |||||||||||||
| Administrative expenses and amortizations | (12,825) | (12,059) | 6.3 | 10.3 | |||||||||||||
| Net operating income | 16,930 | 14,935 | 13.4 | 14.2 | |||||||||||||
| Net loan-loss provisions | (6,540) | (5,887) | 11.1 | 11.1 | |||||||||||||
| Other gains (losses) and provisions | (2,401) | (1,950) | 23.1 | 33.6 | |||||||||||||
| Profit before tax | 7,989 | 7,099 | 12.5 | 11.8 | |||||||||||||
| Tax on profit | (1,927) | (1,676) | 15.0 | 15.6 | |||||||||||||
| Profit from continuing operations | 6,062 | 5,423 | 11.8 | 10.6 | |||||||||||||
| Net profit from discontinued operations | — | — | — | — | |||||||||||||
| Consolidated profit | 6,062 | 5,423 | 11.8 | 10.6 | |||||||||||||
| Non-controlling interests | (403) | (406) | (0.9) | (2.9) | |||||||||||||
| Profit attributable to the parent | 5,659 | 5,017 | 12.8 | 11.7 | |||||||||||||
| Business volumes | |||||||||||||||||
Gross loans and advances to customers B | 618,773 | 629,478 | (1.7) | (3.0) | |||||||||||||
| Customer funds | 712,433 | 689,330 | 3.4 | 2.3 | |||||||||||||
Customer deposits C | 621,598 | 598,110 | 3.9 | 2.8 | |||||||||||||
| Mutual funds | 90,835 | 91,220 | (0.4) | (1.0) | |||||||||||||
| A. Includes exchange differences. | |||||||||||||||||
| B. Excluding reverse repos. | |||||||||||||||||
| C. Excluding repos. | |||||||||||||||||
422
 | DIGITAL CONSUMER BANK | Underlying attributable profit | |||||||||||||||
| EUR 1,901 mn | |||||||||||||||||
Business performance
Gross loans and advances to customers, minus reverse repurchase agreements and in constant euros rose 6% year-on-year.
Customer deposits minus repurchase agreements and in constant euros increased 13%. Mutual funds rose 18% in constant euros and, consequently, total customer funds increased 13%.
Results
Attributable profit in 2023 was EUR 1,901 million, 27% less than in 2022. In constant euros, profit declined 26% as follows:
•Total income grew 1% supported by net interest income (+3%). On the other hand, net fee income and gains on financial transactions decreased 2% and 20%, respectively, and other operating income fell 17%.
•Administrative expenses and amortizations increased 3%, which together with total income growth, resulted in a 0.9pp increase in the efficiency ratio to 42.8%.
•Net loan-loss provisions increased 30%.
•Other gains (losses) and provisions recorded a EUR 250 million loss compared to a EUR 91 million loss in 2022.
| Digital Consumer Bank | |||||||||||||||||
| EUR million | |||||||||||||||||
| Underlying income statement | 2023 | 2022 | % | % excl. FX | |||||||||||||
| Net interest income | 10,221 | 10,121 | 1.0 | 3.5 | |||||||||||||
| Net fee income | 1,229 | 1,269 | (3.1) | (2.5) | |||||||||||||
Gains (losses) on financial transactions A | 116 | 144 | (19.9) | (20.0) | |||||||||||||
| Other operating income | 730 | 856 | (14.7) | (17.0) | |||||||||||||
| Total income | 12,296 | 12,391 | (0.8) | 1.1 | |||||||||||||
| Administrative expenses and amortizations | (5,263) | (5,197) | 1.3 | 3.5 | |||||||||||||
| Net operating income | 7,033 | 7,194 | (2.2) | (0.6) | |||||||||||||
| Net loan-loss provisions | (4,106) | (3,222) | 27.4 | 29.8 | |||||||||||||
| Other gains (losses) and provisions | (250) | (91) | 173.0 | 187.0 | |||||||||||||
| Profit before tax | 2,677 | 3,880 | (31.0) | (30.0) | |||||||||||||
| Tax on profit | (426) | (881) | (51.6) | (50.5) | |||||||||||||
| Profit from continuing operations | 2,251 | 3,000 | (25.0) | (24.0) | |||||||||||||
| Net profit from discontinued operations | — | — | — | — | |||||||||||||
| Consolidated profit | 2,251 | 3,000 | (25.0) | (24.0) | |||||||||||||
| Non-controlling interests | (350) | (389) | (10.2) | (10.2) | |||||||||||||
| Profit attributable to the parent | 1,901 | 2,610 | (27.2) | (26.1) | |||||||||||||
| Business volumes | |||||||||||||||||
Gross loans and advances to customers B | 206,649 | 196,878 | 5.0 | 5.8 | |||||||||||||
| Customer funds | 117,963 | 106,027 | 11.3 | 13.1 | |||||||||||||
Customer deposits C | 114,334 | 102,946 | 11.1 | 13.0 | |||||||||||||
| Mutual funds | 3,629 | 3,081 | 17.8 | 17.8 | |||||||||||||
| A. Includes exchange differences. | |||||||||||||||||
| B. Excluding reverse repos. | |||||||||||||||||
| C. Excluding repos. | |||||||||||||||||
423
 | CORPORATE & INVESTMENT BANKING | Underlying attributable profit | |||||||||||||||
| EUR 2,440 mn | |||||||||||||||||
Business performance
Gross loans and advances to customers, minus reverse repurchase agreements and in constant euros decreased 3% year-on-year.
Customer deposits minus repurchase agreements and in constant euros decreased 7% while mutual funds rose 72% in constant euros. As a result, total customer funds declined 3%.
Results
Attributable profit in 2023 was EUR 2,440 million, 9% more than in 2022. In constant euros profit was 16% higher as follows:
•Total income grew 17% supported by net fee income (+14%). Gains on financial transactions increased 126% while net interest income remained stable.
•Administrative expenses and amortizations increased 20% and the efficiency ratio rose 1.7 pp to 45.0%.
•Net loan-loss provisions decreased 35%.
•Other gains (losses) and provisions recorded a EUR 181 million loss compared to a EUR 166 million loss in 2022.
| Corporate & Investment Banking | |||||||||||||||||
| EUR million | |||||||||||||||||
| Underlying income statement | 2023 | 2022 | % | % excl. FX | |||||||||||||
| Net interest income | 3,594 | 3,816 | (5.8) | (0.3) | |||||||||||||
| Net fee income | 2,131 | 1,922 | 10.8 | 14.1 | |||||||||||||
Gains (losses) on financial transactions A | 1,795 | 962 | 86.6 | 125.6 | |||||||||||||
| Other operating income | 7 | 3 | 122.7 | (95.9) | |||||||||||||
| Total income | 7,527 | 6,703 | 12.3 | 16.9 | |||||||||||||
| Administrative expenses and amortizations | (3,387) | (2,901) | 16.7 | 20.3 | |||||||||||||
| Net operating income | 4,140 | 3,802 | 8.9 | 14.3 | |||||||||||||
| Net loan-loss provisions | (165) | (257) | (35.8) | (34.5) | |||||||||||||
| Other gains (losses) and provisions | (181) | (166) | 8.9 | 25.8 | |||||||||||||
| Profit before tax | 3,795 | 3,379 | 12.3 | 17.6 | |||||||||||||
| Tax on profit | (1,137) | (955) | 19.0 | 21.4 | |||||||||||||
| Profit from continuing operations | 2,658 | 2,424 | 9.6 | 16.0 | |||||||||||||
| Net profit from discontinued operations | — | — | — | — | |||||||||||||
| Consolidated profit | 2,658 | 2,424 | 9.6 | 16.0 | |||||||||||||
| Non-controlling interests | (219) | (191) | 14.3 | 13.0 | |||||||||||||
| Profit attributable to the parent | 2,440 | 2,233 | 9.2 | 16.2 | |||||||||||||
| Business volumes | |||||||||||||||||
Gross loans and advances to customers B | 137,578 | 142,646 | (3.6) | (3.2) | |||||||||||||
| Customer funds | 186,410 | 196,021 | (4.9) | (3.3) | |||||||||||||
Customer deposits C | 171,845 | 186,678 | (7.9) | (6.8) | |||||||||||||
| Mutual funds | 14,565 | 9,343 | 55.9 | 72.0 | |||||||||||||
| A. Includes exchange differences. | |||||||||||||||||
| B. Excluding reverse repos. | |||||||||||||||||
| C. Excluding repos. | |||||||||||||||||
424
 | WEALTH MANAGEMENT & INSURANCE | Underlying attributable profit | |||||||||||||||
| EUR 1,467 mn | |||||||||||||||||
Business performance
Gross loans and advances to customers, minus reverse repurchase agreements and in constant euros increased 2% year-on-year.
Customer deposits minus repurchase agreements and in constant euros rose 1%. Mutual funds were up 23%, resulting in a 14% increase in total customer funds.
Results
Attributable profit in the year was EUR 1,467 million, 33% increase year-on-year. In constant euros, it rose 35%. By line:
•Total income increased 22%, due to net interest income growth (+76%). Net fee income remained stable and gains on financial transactions increased (+69%), while other operating income decreased 37%.
•Administrative expenses and amortizations rose 12%, which, together with total income growth, resulted in a 3.3 pp improvement in the efficiency ratio to 37.9%.
•Net loan-loss provisions were positive in the year with net releases of EUR 17 million (EUR 21 million net provisions in 2022).
•Other gains (losses) and provisions recorded an EUR 18 million loss compared to a EUR 37 million loss in 2022.
| Wealth Management & Insurance | |||||||||||||||||
| EUR million | |||||||||||||||||
| Underlying income statement | 2023 | 2022 | % | % excl. FX | |||||||||||||
| Net interest income | 1,513 | 883 | 71.4 | 76.0 | |||||||||||||
| Net fee income | 1,262 | 1,293 | (2.4) | 0.2 | |||||||||||||
Gains (losses) on financial transactions A | 170 | 108 | 56.7 | 69.4 | |||||||||||||
| Other operating income | 266 | 394 | (32.4) | (36.9) | |||||||||||||
| Total income | 3,210 | 2,678 | 19.9 | 21.6 | |||||||||||||
| Administrative expenses and amortizations | (1,216) | (1,104) | 10.2 | 11.8 | |||||||||||||
| Net operating income | 1,994 | 1,574 | 26.7 | 28.4 | |||||||||||||
| Net loan-loss provisions | 17 | (21) | — | — | |||||||||||||
| Other gains (losses) and provisions | (18) | (37) | (52.5) | (51.0) | |||||||||||||
| Profit before tax | 1,994 | 1,516 | 31.5 | 33.2 | |||||||||||||
| Tax on profit | (454) | (346) | 31.2 | 34.5 | |||||||||||||
| Profit from continuing operations | 1,540 | 1,170 | 31.6 | 32.8 | |||||||||||||
| Net profit from discontinued operations | — | — | — | — | |||||||||||||
| Consolidated profit | 1,540 | 1,170 | 31.6 | 32.8 | |||||||||||||
| Non-controlling interests | (73) | (69) | 5.1 | 3.1 | |||||||||||||
| Profit attributable to the parent | 1,467 | 1,101 | 33.3 | 34.8 | |||||||||||||
| Business volumes | |||||||||||||||||
Gross loans and advances to customers B | 22,603 | 22,247 | 1.6 | 2.2 | |||||||||||||
| Customer funds | 157,142 | 137,423 | 14.3 | 14.0 | |||||||||||||
Customer deposits C | 57,643 | 57,014 | 1.1 | 1.4 | |||||||||||||
| Mutual funds | 99,499 | 80,409 | 23.7 | 22.9 | |||||||||||||
| A. Includes exchange differences. | |||||||||||||||||
| B. Excluding reverse repos. | |||||||||||||||||
| C. Excluding repos. | |||||||||||||||||
425
 | PAYMENTS | Underlying attributable profit | |||||||||||||||
| EUR 607 mn | |||||||||||||||||
Business performance
Gross loans and advances to customers, minus reverse repurchase agreements and in constant euros rose 9%.
Results
Attributable profit in the year was EUR 607 million, a 12% decrease year-on-year. In constant euros, profit declined 4% year-on-year, by line:
•Total income increased 12%, driven by growth in net fee income (+13%) and net interest income (+11%) .
•Administrative expenses and amortizations rose 6%, below revenue growth, resulting in a 2.3 pp improvement in the efficiency ratio to 44.2%.
•Net loan-loss provisions increased 45%.
•Other gains (losses) and provisions recorded an EUR 84 million loss compared to a EUR 74 million loss in 2022.
| Payments | |||||||||||||||||
| EUR million | |||||||||||||||||
| Underlying income statement | 2023 | 2022 | % | % excl. FX | |||||||||||||
| Net interest income | 2,424 | 2,359 | 2.8 | 10.8 | |||||||||||||
| Net fee income | 2,952 | 2,653 | 11.3 | 13.0 | |||||||||||||
Gains (losses) on financial transactions A | 1 | 20 | (97.1) | — | |||||||||||||
| Other operating income | (79) | (158) | (50.1) | 45.5 | |||||||||||||
| Total income | 5,298 | 4,874 | 8.7 | 11.6 | |||||||||||||
| Administrative expenses and amortizations | (2,344) | (2,271) | 3.2 | 6.1 | |||||||||||||
| Net operating income | 2,954 | 2,604 | 13.5 | 16.5 | |||||||||||||
| Net loan-loss provisions | (1,666) | (1,132) | 47.2 | 44.8 | |||||||||||||
| Other gains (losses) and provisions | (84) | (74) | 13.5 | 41.3 | |||||||||||||
| Profit before tax | 1,205 | 1,398 | (13.8) | (9.2) | |||||||||||||
| Tax on profit | (509) | (603) | (15.6) | (14.2) | |||||||||||||
| Profit from continuing operations | 696 | 795 | (12.5) | (5.2) | |||||||||||||
| Net profit from discontinued operations | — | — | — | — | |||||||||||||
| Consolidated profit | 696 | 795 | (12.5) | (5.2) | |||||||||||||
| Non-controlling interests | (89) | (103) | (12.9) | (14.4) | |||||||||||||
| Profit attributable to the parent | 607 | 693 | (12.4) | (3.6) | |||||||||||||
| Business volumes | |||||||||||||||||
Gross loans and advances to customers B | 23,709 | 22,161 | 7.0 | 9.1 | |||||||||||||
| Customer funds | 1,418 | 688 | 105.9 | 105.9 | |||||||||||||
Customer deposits C | 1,418 | 688 | 105.9 | 105.9 | |||||||||||||
| Mutual funds | — | — | — | — | |||||||||||||
| A. Includes exchange differences. | |||||||||||||||||
| B. Excluding reverse repos. | |||||||||||||||||
| C. Excluding repos. | |||||||||||||||||
426
5. Research, development
and innovation (R&D&I)
and innovation (R&D&I)
Research, development and innovation activity
Innovation and technological development are crucial to Santander's strategy. We focus on operational excellence and customer experience to meet the challenges that stem from digital transformation.
The information we gather through new technology platforms helps us to better understand the customer journey and design a more accurate digital profile which boosts confidence and increases customer loyalty.
In addition to competition from other banks, we must be mindful of new entrants to the financial system that use new technology to stand out from the crowd and gain a competitive advantage.
Developing a sound strategic technology plan must provide:
•greater capacity to adapt to customers’ needs (customized products and services, full availability and excellent, secure service on all channels);
•enhanced processes for Santander’s professionals to ensure greater reliability and productivity; and
•proper risk management that provides teams with the means to spot and assess all business, operational, reputational, regulatory and compliance risks.
As a global systemically important bank, Santander and its subsidiaries face increasing regulatory demands that impact system models and underlying technology, which require considerable investments to guarantee compliance and legal certainty.
As in previous years, the European Commission's 2023 EU Industrial R&D Investment Scoreboard (based on 2022 data) recognized our technological effort. We were the top Spanish bank and the second bank globally in R&D investment, with EUR 1,748 million. The equivalent investment in R&D&I to that considered in the ranking was EUR 2,197 million. See note 18 to the consolidated financial statements.
Technology strategy
To aid the Group's strategy to become the best open digital platform for financial services, our technology must boost efficiency and minimize risk through optimization, growth and value creation.
Our IT strategy ensures that our technology supports future business growth and is based on simplification, reusable components and platform model. It is consistent with the Group's strategic initiatives and global business and operating models.
As a result, and mainly because of the successful implementation of Gravity in September 2023, Santander was named the World's Most Innovative Bank by The Banker magazine. Implementing Gravity laid the foundations for digitalization with its own core banking software.
To ensure the commitment of all Group units to the IT strategy, the active players in the key decisions of the platform model meet monthly in the Global Platform Governance (GPG) formed by the global, regional and global business technology heads.
These principles, combined with the global businesses, guide technological development and integration with such new digital capabilities as agile methodologies, the public and private Cloud, core systems development, and advanced technological skills (API - application programming interface-, artificial intelligence, robotics, blockchain, etc.) and data.
To implement our technology strategy, we use internal regulation, the Group's commitment and experience in working with our entities and a governance model that defines projects and initiatives to shape the strategy across our footprint.
We constantly develop our Technology and Operations (T&O) model as we adapt to business demands. We created Santander Digital Services (SDS) in January 2023, bringing together Santander Global Technology & Operations and Santander Technology and Operations Spain. The company, with 9,000 employees in Spain, Poland, Portugal, the UK, Mexico, the US, Brazil and Chile, is a key element in Santander's technology and operations strategy, offering its services and know-how to the different Group entities and banks.
Innovation is at the core of Santander's activity, with a commitment to the latest technologies that enable more robust, efficient and secure systems and processes, in which SDS teams play a key role.
427
Finally, like the rest of the Group, SDS is committed to improving its positive impact on society with plans to attract diverse tech talent (BeTech) to help us gain the internal knowledge necessary for our transformation, enhancing internal volunteering initiatives, and implementing specific plans to offset our carbon footprint.
Technological infrastructure
Santander has a network of high-quality data processing centres (CPDs) interconnected by a redundant communications system. They are spread across strategic markets to support and develop our operations. They combine traditional IT systems with the capabilities of a private, on-premise cloud, which, thanks to its swift adoption, enables us to integrate management of the business areas’ technology, accelerate digitalization and achieve significant cost savings.
Santander has migrated more than 95% of its technology infrastructure to the cloud and has already started to deploy next generation infrastructure in the on-premise private cloud with a technology architecture that provides greater resilience and efficiency while reducing energy consumption. Our local Cloud Centres of Excellence (CCoEs), coordinated by Global CCoE, guarantee consistent and rigorous cloud adoption across our entities. This minimizes risk in accordance with our public cloud policy. Migration will also contribute towards Santander's responsible banking goals as we expect it to reduce the energy our technology infrastructure consumes by 70%.
Cybersecurity
Cybersecurity is crucial to support our purpose of helping people and businesses prosper and to offer customers excellent digital services. The growing cyber threat combined with the increasing reliance on digital systems make cybersecurity one of Santander’s main priorities.
In 2023, Santander continued evolving our cyber defences in line with the Cybersecurity Vision and key strategic initiatives. New controls were implemented following a cyber threat-led approach, covering current areas of risk and new attack methods. In addition to the evolution of our Ransomware readiness and Data Leakage Prevention frameworks developed in 2022, we designed a new Distributed Denial of Service framework, responding to the increased threat derived from the geopolitical backdrop. New controls have been developed, notably around supply chain, backup and recovery and fraud prevention measures reinforced by leveraging behavioural biometric solutions and machine learning technology.
To strengthen our response, streamline operations and maximize resources, we inaugurated the Santander Fusion Centre in 2023, enabling closer collaboration between Cyber and IT Monitoring teams. The Fusion Centre operates 24 hours a day, 7 days per week, providing services to all Group entities, detecting, monitoring and responding to operational failures and cybersecurity events.
In parallel, Santander is preparing for the new requirements of upcoming regulations on cybersecurity matters, whilst decoding the pros and cons derived from emerging technologies, such as Quantum and Generative AI. For example, the collaboration with the World Economic Forum to publish "Quantum Readiness Toolkit: Building a Quantum-Secure Economy“, and the implementation of new use cases leveraging AI to improve
detection capabilities and automation in cybersecurity operations.
Santander continues boosting public-private collaboration, going beyond information sharing. In 2023, Santander was formally associated with the Cybercrime Atlas initiative of the World Economic Forum as a member of the Steering Co. and co-led the first cyber meeting of the European Financial Services Roundtable and Chairs the European FS-ISAC Board. Santander also hosted the 11th Institute of International Finance (IIF) Cyber Roundtable.
Santander proactively identifies IT assets, systems and information and assesses their risk and protection levels to detect and remediate any potential weaknesses by using vulnerability scanning, penetration testing and red team simulations of real cyberattacks. Internal and external auditors periodically review our information systems.
In addition to regular testing and reviews, independent third-party certification authorities review and certify our critical cybersecurity processes. Certifications, including the International Organization for Standardization (ISO) 27001:2022 and 27017, and the Statement on Standards for Attestation Engagements (SSAE) 18, are periodically reviewed and updated, certifying new processes and controls annually.
For more details on the cybersecurity initiatives we ran in 2023, see the 'Acting responsibly towards customers' section in 'Responsible banking' chapter. For details on the measurement, monitoring and control of cybersecurity-related risks, and their respective mitigation plans, see section 6.2 'Operational risk management' in 'Risk management and compliance' chapter.
Fintech ecosystem
Santander is an active participant in the fintech ecosystem in all the regions where we operate. As part of our efforts to foster and channel innovation into Santander while providing better customer experience and improving our efficiency, we work with fintech companies as partners. Through our Fintech Station programme, we work with startups and scaleups on pilot programmes and either implement or co-create new products and services with them. In 2023, Santander Fintech Station worked on 15 proof of concepts (POCs) and put six initiatives into production. Santander also provides banking services to these fintech companies, including growth financing, transactional banking, FX and advisory services among others. As an example of collaboration with a fintech, in 2023 SCIB partnered with Komgo to digitalize trade finance and made an equity investment in the company.
Santander is an active investor in the fintech sector, sometimes directly (like with Komgo) and through funds sponsored by the Group, such as Mouro Capital (global fintech venture capital fund). To date, Mouro has invested in 47 companies throughout Europe, North America and South America, and continues to be a key tool to spark innovation within the Group. Santander partners with many companies in Mouro's portfolio, for example with ThetaRay for AML/Sanctions screening globally and Autofi for PoS auto financing in the US. Atempo Growth, a pan-European venture debt fund also sponsored by Santander, solidified its market position in 2023, having funded 26 companies, many of them in the fintech space (e.g. Form3, Acin, Clarity.ai). Finally, in 2023, Santander launched a venture debt fund alongside Inveready to provide financing to high growth startups in Spain.
428
For more details on our digital and innovative products and services for individuals and corporates, as well as references to cybersecurity policies, see section 3.4 ‘Acting responsibly towards customers’ in 'Responsible banking' chapter.
429
6. Significant events
since year end
since year end
In accordance with the agreement reached by the March 2023 general shareholders’ meeting, on 30 January 2024 the board of directors approved a capital reduction of EUR 179,283,743.50 through the redemption of 358,567,487 shares (representing approximately 2.22% of the share capital), acquired in the First 2023 Share Buyback Programme, with which the share capital has been set at EUR 7,912,789,286, represented by 15,825,578,572 shares.
430
7. Trend information 2024
This directors' report contains prospective information on the directors’ plans, forecasts and estimates, based on what they consider to be reasonable assumptions. Readers of this report should take into account that such prospective information must not be considered a guarantee of our future performance. As the plans, forecasts and estimates are subject to numerous risks and uncertainties, our future performance may not match initial expectations. These risks and uncertainties are described in the 'Risk management and compliance' chapter of this report and in note 54 of the consolidated financial statements.
à Macroeconomic environment
Our macroeconomic forecasts for 2024 by country/region are as follows:
Eurozone
Following the economic stagnation in 2023, we expect the weaker tone to continue in 2024 (forecast GDP growth of 0.6%). However, the eurozone may avoid a recession as we expect private consumption and foreign demand to pick up. We believe inflation will continue to fall, though not linearly, as the withdrawal of fiscal measures causes temporary upturns. We expect a slight rise in the unemployment rate while remaining close to historic lows. Fiscal policy is expected to adopt a restrictive tone as the Stability Pact is reactivated. The reduction in inflation could pave the way for interest rate cuts in the second half of 2024.
Spain
We expect GDP growth to slow down in 2024 to 1.6%. Private consumption will likely be the main driver of growth as household disposable income remains high (lower inflation, expected rate cuts in 2024 and a stable labour market). Tourism is expected to grow above GDP, but decelerating. We expect inflation (headline and core) will end the year around 3%. Energy should no longer detract from inflation and the withdrawal of the measures introduced to combat the energy crisis may drive a step up in inflation. Despite this, underlying pressures should moderate and we do not expect second round effects.
UK
Economic growth is forecasted to be practically flat, with 0.4% GDP growth, with weak consumption due to real income restraints (due to higher interest rates, no price subsidies and unchanged tax thresholds, among other reasons). We expect a soft landing in the labour market from full employment to an unemployment rate below 5%. Inflation should be close to 3% by the end of 2024, paving the way for possible Bank of England base rate cuts in the second quarter. We expect rates to end the year at 4.5%.
Portugal
Economic growth is expected to moderate in 2024 (forecast GDP growth of 0.6%), driven by subdued domestic demand, as households and businesses face higher interest rates and weaker purchasing power. In the first half of 2024, external demand will likely be affected by the weak recovery in the eurozone but is expected to reverse in the second half of the year, benefiting Portuguese exports. We project the unemployment rate will rise to 8% (near its natural rate) in 2024, due to the lagged effects from lower economic activity. We believe inflation will remain around 2% throughout the year.
Poland
The economy started to recover in the third quarter of 2023 and we expect higher GDP growth around 3% in 2024, driven by private consumption. The strong labour market and rising real incomes are expected to support domestic demand while the external sector is expected to contribute less to this economic recovery. Our projections show a further decline in inflation to 3% year-on-year in the first quarter and then a pick up to around 7%, dependent on the new government's measures. We assume that the central bank's benchmark interest rate will remain unchanged at 5.75% until the fourth quarter of 2024.
US
After a more dynamic 2023 than expected, in 2024, we believe economic growth will moderate, affected by cumulative interest rate hikes, post-pandemic savings running out and a less expansionary fiscal policy. We are forecasting a soft landing accompanied by a further rebalancing of the labour market contributing to a gradual decline in inflation. The Fed is waiting to make sure that inflation is converging towards the target before lowering rates and will slow down its balance sheet reduction.
Mexico
We expect economic growth to remain robust, driven by investments linked to nearshoring and related infrastructure investment projects. We believe the central bank will begin to cut the official rate, albeit gradually, depending on inflation and whether expectations are anchored at its 3% target.
431
Brazil
We expect a deceleration due to lower global economic growth partially explained by the strong agricultural growth in 2023, which will be difficult to repeat. Additionally, there will be uncertainty about commodity prices in an environment of lower demand growth in major developed and developing economies. On the other hand, further rate cuts as monetary policy continues to normalize (assuming inflation nears target) will support GDP growth.
Chile
After completing its adjustment process in 2023 and correcting the macro imbalances that were generated in the previous expansionary phase, the economy is well positioned to return to growth rates of around 2.5%. We expect inflation will be very close to the 3% target, allowing the monetary policy to get closer to the neutral rate, accelerating rate cuts.
Argentina
The economy could experience its second year of negative growth, but this time with an intense adjustment programme that aims to balance fiscal accounts and moderate inflation. The extension of the financial agreement with the IMF and an exchange rate more in line with fundamentals, following the devaluation at the end of 2023, should ease external pressures and enable the country to rebuild international reserves.
à Financial markets
Financial markets ended 2023 pricing in optimism regarding upcoming monetary policy changes in advanced countries.
Historically, as monetary policy eases (especially at the beginning of the cycle) there have been downward corrections in long-term bond yields. We expect this to occur again in 2024, with a greater impact on US debt than German. We also expect a gradual normalization of yield curve slopes in the sovereign bond market once official rates start to decline.
Narrower interest rate differentials and the cyclical gap between the US and eurozone economies closing suggest the US dollar will depreciate gradually.
We believe a soft landing will support equity markets. The global environment suggests positive but low absolute returns for equities in 2024. Lower activity, higher interest burdens and less ability to pass through costs to prices imply more pressure on profit margins.
In emerging markets, the Chinese economy and the measures it will take to solve its real estate problems remain a major source of uncertainty. In Latin America, we believe markets will benefit from the progressive containment of inflation, the rate cuts by Latin American central banks and a more benign global monetary environment in which central banks in advanced countries may also start cutting rates.
The risk in this central scenario is that central banks in advanced economies delay the start of their cuts, or that the Chinese economy slows further, negatively affecting investor appetite.
The banking environment will be shaped by monetary policy, the gradual withdrawal of excess liquidity and a lower economic growth, which are expected to slightly impact net interest income and credit quality.
Risks are slightly skewed to the downside. They may come from non-bank financial players and include potentially disorderly asset price adjustments and liquidity market disruptions. However, most entities should have enough capital to cope.
Aside from the economic environment, banks must digitalize faster while identifying and managing climate change risks.
à Financial regulation
In 2024, we expect greater emphasis on sustainability, digital and retail banking agendas. European Parliament elections in June 2024 (every five years) could slow down the adoption and presentation of new proposals.
Prudential and resolution
Following the 2023 agreement in Europe on Basel III reform, we expect the final framework to be published in early 2024 and to be implemented from 1 January 2025. The US and the UK will continue to discuss their respective proposals to implement Basel III. The Basel Committee will continue to work on the lessons learned from the collapse of Silicon Valley Bank and Credit Suisse, and on further developments of the prudential framework for cryptoasset exposures. In addition, we expect discussion on specific issues such as the capital buffer framework in Europe as well as on the securitization framework at international level. We do not expect much progress on the crisis management framework review in Europe, given the lack of agreement on highly political and sensitive issues.
Sustainability
We expect agreements on the corporate sustainability due diligence directive, energy efficiency directive and the proposal on regulations for ESG ratings activity in Europe. During 2024, the Commission will work on its commitment to reduce the reporting burden by 20%. The EBA, EIOPA and ESMA are expected to publish their definition of greenwashing in the European financial sector. The EBA plans to analyse the need to review the Pillar 1 framework to ensure that climate and environmental risks are adequately integrated. We also expect it to start work on guidelines on transition plan content for banks. We expect the Basel Committee will reach an agreement to complement the Pillar 3 transparency requirements with environmental risk management information.
432
Digital
We believe discussions around artificial intelligence (AI) will intensify, given the opportunities and risks of using generative AI. These ongoing discussions prevented adoption of AI regulation in Europe in 2023, and it is now expected in 2024. G7 principles were recently approved and we expect development of more international principles from different platforms. Discussions in the world of data, payments and CBDCs will continue to be very intense. The Financial Stability Board (FSB) approved several framework recommendations for the regulation of cryptoassets and stablecoins during 2023 that are expected to be implemented by some jurisdictions in 2024.
Retail banking
The debate will be very much focused on the European Commission's Retail Investment Strategy and on specific issues in certain jurisdictions linked to the consumer protection debate and the rising cost of living.
433
These are the main management priorities for 2024 in our Global Business segments and regions:
 | Retail & Commercial Banking's priorities for 2024 are to: →Implement a common operating model, leveraging the scale of Group and our local presence. →Spread transformation efforts across our footprint to foster simplification, process automation and deployment of our best-in-class tech platform. →Further increase profitability supported by customer base growth and cost-to-serve efficiencies. | |||||||||||||
| Retail & Commercial Banking | ||||||||||||||
| A new global business integrating our retail and commercial banking activities | ||||||||||||||
•With the aim of better serving our customers, improving efficiency and driving value creation, our focus in 2024 will be on converging our retail and commercial customers to a common operating model.
This business and operating model has been designed to deliver our vision of becoming a digital bank with branches, powered by the Santander network, making all our products and services available to our customers through our websites and applications, with the branch network serving as a powerful sales and advisory channel.
The global model will be implemented across our footprint and will leverage the Group's scale and local presence.
•In 2024, we will extend our One Transformation efforts to all our countries, having concentrated on Spain, Mexico and the US in 2023 (where we achieved 112 bps in efficiency improvements).
Our transformation will continue to rest on three strategic transformation pillars: i) customer experience; ii) operational leverage; and iii) global technology platform.
•We will further simplify our product offering and make it digitally available to enhance customer experience. By offering a minimum set of products that are highly standardized across markets, we will be able to simplify our operations and improve quality and user experience.
•We will streamline additional processes by promoting the reduction of operational activities, use of automation tools
and lean organizational structures. This should enable us to improve our efficiency, accuracy and speed, as well as reduce risks.
•Our global technological platform, based on our award-winning back-end technology (Gravity( and our cloud based front-end technology (ODS), will be a key element in our transformation.
The first technical integration of Gravity and ODS has already been completed in the US, where a new fully-digital offering will be launched nationwide in 2024. All other local units will adopt and/or converge towards the global technological platform in 2024.
Executing these three pillars across all our RCB footprint will help the Group progress towards achieving on the targets set out at the 2023 Investor Day.
•Customer growth, cost-to-serve efficiencies and a disciplined approach to capital, will contribute to increased profitability in 2024.
Customer satisfaction across all segments will remain at the core of our agenda in 2024 as a driver for growth. Execution towards our common operating model will contribute to delivering an exceptional user experience which, with advanced data analytics and in-market presence (digital bank with branches), will promote customer growth.
The streamlining of processes and the deployment of a global tech platform will pave the way towards a lower cost to serve.
 |  |  | ||||||||||||||||||||||||
| Customer experience | Operational leverage | Global platform | ||||||||||||||||||||||||
Product simplification and digital first | Common operating model, globally leveraging process automation | Proprietary back-end (Gravity) and our cloud based front-end (ODS) technologies | ||||||||||||||||||||||||
434
 | Our priorities for 2024 are to: →Expand our leadership in consumer lending across our footprint (e.g. #1 finance company in Europe and LatAm, top 5 in the US and top 10 in China in auto finance) by providing the best customer experience and enhancing our global relationships. →Converge towards a more digital global operating model, building a world-class digital offering in mobility, supporting our partners' transformation journeys. →Continue to build flex-term solutions (leasing, subscription) based on common platforms. | |||||||||||||
| Digital Consumer Bank | ||||||||||||||
| A single model across our markets for our consumer and auto finance business and for Openbank | ||||||||||||||
Our focus is to address our customers' needs, as they evolve both in mobility and consumer financing, by providing them with best-in-class point of sale solutions, available through their channel of choice.
We are a growth arm of Santander, by bringing mobility, consumer financing and digital banking capabilities at the same time to any market:
•Mobility: we are the largest global franchise in a growing market. DCB's competitive advantages include our global reach, our strong relationships with all players in the value chain and our service quality. We focus on improving digital solutions for our end customers and partners and investing in our leasing and subscription global digital platforms.
•Consumer financing (non-auto): we are a strong player in Europe and Latin America for checkout lending, buy now, pay later, credit cards and direct loans. We have specialized know-how and tech platforms, with the aim of capturing multi-product customers.
•Digital Banking: through Openbank and its advanced data, tech and product capabilities, we can quickly expand into other markets with excellent and enhanced deposit gathering possibilities.
In 2024, our strategic projects include:
•Mobility: deploy our common leasing platform in a few European markets, continue to develop digital capabilities for OEMs, dealers and new digital players. Expand existing partner relationships across the US and Latin America.
•Consumer financing: execute signed flagship deals with major global tech companies and continue to develop solutions in Zinia's new tech stack.
•Openbank: further grow customers in Spain and recently entered European markets by continuing to provide a great, fully-digital customer experience.
Moreover, we will continue increasing our deposit based funding and the originate to distribute model by expanding our securitization programme.
| | | ||||||||||||||||||||||||
| Customer experience | Operational leverage | Global platform | ||||||||||||||||||||||||
Global relationship management (OEMs, importers and retailers) | Operational & commercial benchmark to maximize profitability and growth | From multiple country-specific platforms to global platforms (e.g. leasing, BNPL) | ||||||||||||||||||||||||
435
 | Our aim is to become a focused, world-class Corporate & Investment Banking business, positioning ourselves as a trusted advisor to our clients whilst delivering profitable growth. Our priorities for 2024 are to: →Deepen our client relationships with a particular focus on the US. →Make our centres of expertise more sophisticated and further digitalize our business. →Manage capital actively. | |||||||||||||
| Corporate & Investment Banking | ||||||||||||||
| Our global platform to support corporates and institutions | ||||||||||||||
In order to deliver on our 2024 priorities, we will focus on the following levers:
•Deepen client relationships:
•Boost strategic dialogue, accelerating advisory/value-added products and services to continue growing our fee business.
•Focus on executing the plan to take our US CIB franchise to the next level, selectively expanding our client base and product capabilities in areas adjacent to our strengths.
•Deliver CIB products and services to the Group's customer base, fostering collaboration with other Santander businesses.
•Global platforms:
•Active capital management to optimize returns, deepening the Originate-to-Share model to accelerate asset rotation and increase global origination.
•Operational leverage:
•Reinforce our global centres of expertise.
•Continue building Global Markets business to increase activity with our corporate and institutional clients.
•Further leverage technology and invest in AI to digitalize the business and automate end-to-end processes.
•Attract, develop and retain top talent.
| | | ||||||||||||||||||||||||
| Customer experience | Operational leverage | Global platform | ||||||||||||||||||||||||
Trusted advisor for our customers, leveraging our global and local products | Continue growing fee and transactional business through our global centres of expertise and tech | Optimize capital returns on the back of global origination and distribution capabilities | ||||||||||||||||||||||||
436
 | Our ambition in 2024 is continue building the best Wealth and Insurance Manager in Europe and the Americas through 3 strategic pillars: →Improve our customer experience and expand our presence to new countries and businesses. →Boost operational leverage through our global operations and factories. →Continue to build our global platforms. | |||||||||||||
| Wealth Management & Insurance | ||||||||||||||
| Common service models for private banking, asset management and insurance businesses | ||||||||||||||
With the aim of maintaining double-digit growth, better serving our customers and remaining one of the most important growth engines of the Group, we will continue to work to become the best Wealth and Insurance Manager in Europe and the Americas.
To deliver on this ambition, our priorities for 2024 are organized around three pillars:
•Customer experience and growth through the development of new businesses and expanding our presence to new countries. We are entering new markets that are key for our business such as the domestic side of the US or the Middle East. On the Asset Management side, we plan to significantly grow our Alternatives and Institutional businesses. In Insurance, we are focusing on businesses with greater growth potential such as Health, Savings or SMEs, while streamlining our processes to deliver a better customer experience.
•Boost operational leverage through our global operations and factories. We are reinforcing the collaboration among our businesses and also with Retail & Commercial Banking and Corporate & Investment Banking to offer the best of our factories and footprint to our customers. We are using our global factories to implement our complete Private Banking model across our footprint and to create a systematic approach to investment advice across countries and simplify and streamline our insurance products and services.
•Continue building our global platform across the three businesses. Through a new global investments platform, we are digitalizing the way we distribute investments and provide advice in our markets. We are also completing our Private Banking platform with a focus on digital and we are building new global business platforms in Insurance.
| | | ||||||||||||||||||||||||
| Customer experience | Operational leverage | Global platform | ||||||||||||||||||||||||
Providing our customers with a specialized product & service proposition in all countries | Leverage our global operations and factories to connect countries and increase collaboration with CIB and Retail | Global platforms and infrastructure to improve efficiency and time-to-market | ||||||||||||||||||||||||
437
 | Our priorities for 2024 are to: →Scale up our global platform of innovative payments and integrated value-added solutions →Roll out our global payment platform to all our regions and the open market →Expand our cards business while improving customer experience | |||||||||||||
| Payments | ||||||||||||||
| Single infrastructures for payments solutions: PagoNxt and Cards | ||||||||||||||
PagoNxt
•Merchant
•Strategic management of market share and profitable growth, investing in commercial capabilities to further expand business across Santander's banks and capture opportunities in the open market.
•Focus on product globalization and delivery of strategic value-added services.
•Investment in globalizing technology to improve efficiency and lower cost per transaction, and scale up our platform.
•OneTrade
•Complete the deployment of PagoNxt solutions for international business across Santander markets. Scale up open market activities.
•Leverage our scale to deliver a market leading proposition.
•Consolidate the OneTrade platform to sustain business growth and capture synergies with the Group.
•Payments Hub
•Continue expansion of the global payments platform reaching seven different markets.
•Migrate a significant volume of transactions so more than 2 billion are processed through the payments platform in the year.
•Continue driving a lower cost per transaction through an overall efficiency plan.
•Ebury
•Consolidate customer franchise through product development, enhanced commercial capabilities and geographical expansion.
•Drive operational leverage and significantly improve profitability.
Cards
We aim to provide exceptional payments experience, fostering customer loyalty and leveraging transactional data to enhance profitability.
To implement this vision we are focusing on three pillars:
•Expand our business to increase our revenue.
•Drive profitable growth in lending through debit and credit cards through the use of data, improving admission process and limits approval.
•Exploit the commercial cards business by leveraging Santander's presence in the Corporate and SME segments.
•Connect card issuing and Merchant acquiring platforms, developing new business opportunities between Cards and Getnet.
•Improve customer experience:
•Expand, develop and adopt common digital services that improve customer experience.
•Invisible payments to offer our customers the most seamless and convenient card payment experience.
•Become a best-in-class global card issuing tech platform:
•In 2024, we aim to roll out our global Cards platform, Plard, in six countries.
| | | ||||||||||||||||||||||||
| Customer experience | Operational leverage | Global platform | ||||||||||||||||||||||||
Deliver best-in-class payment solutions leveraging our global and local scale | Reduce cost per transaction through capex optimization and operational efficiency | Migrate volumes to common global platforms to gain scale and offer competitive pricing in the open market | ||||||||||||||||||||||||
438
Secondary segments
| Europe | ||||||||||
Our strategy in Europe is to remain focused on customer experience, service quality and delivering a common operating model. Our top priorities for 2024 are to: →Improve our customer experience as we progress in our omni-channel strategy, simplifying and adding value to our interactions, moving towards our shared vision of being a digital bank with branches. →Expand our franchise, leveraging our unique position of geographic diversification and scale. →Increase efficiency, maintaining strong cost discipline and increasing productivity by implementing a common operating model based on simplification, scale and agility. →Maximize our business value through agile pricing and active capital management focused on sustainable asset rotation and greater emphasis on high-value origination. | |||||||||||
| Spain | ||||
•Accelerate business transformation, in particular organizational, process and product simplification, leveraging global platforms and new technologies such as generative AI, which allow us to structurally reduce our cost to serve.
•Grow in all business segments focused on further increasing the customer base and loyalty, leveraging our global and regional scale.
| United Kingdom | ||||
•Grow based on customer loyalty and exceptional customer experience.
•Simplify and digitalize the business to improve efficiency and performance.
| Portugal | ||||
•Continue our commercial and digital transformation, with the aim of providing the best customer experience.
•Remain best-in-class in terms of efficiency and profitability, providing an adequate return on capital.
| Poland | ||||
•Improve our customers' and employees' experience.
•Focus on business digitalization increasing services and products offered in all channels.
| North America | ||||||||||
In 2024, we expect to begin to see the impact of our platform development programme as we build on our local strengths and increasingly take advantage of our global businesses capabilities to: →Launch new capabilities in each of our North American markets, particularly in digital consumer banking. →Develop our Corporate & Investment Banking platforms in both countries and Wealth Management offshore and in Mexico, to accelerate revenue growth in capital-light businesses. →Continue to simplify our regional operating model to reduce overlaps and increase efficiency. →Increase cross-border coordination to leverage our differentiated footprint across Europe and the Americas. | |||||||||||
| United States | ||||
•Digital Consumer Bank: support profitable growth and our digital bank with branches vision by bringing together our consumer finance capabilities with stable sources of USD funding, including the launch our national digital deposit gathering platform.
•Corporate & Investment Banking: continue growing focusing on client relationships, leveraging the enhanced advisory and investment banking capabilities both locally and globally.
•Wealth Management: accelerate growth through initiatives to expand the offshore customer segments that bank with us.
| Mexico | ||||
•Advance our technological transformation to improve digital channels, drive digital adoption and further improve customer experience by building on technology and data.
•Grow our customer base and increase loyalty, supported by digital products and offerings, new service models and continued product simplification.
•Increase synergies with global businesses to drive new and innovative solutions.
•Support our customers' green transitions while fostering inclusive and sustainable growth.
439
| South America | ||||||||||
The Group's priorities in the region are to: →Strengthen connectivity between our countries and with the Group, through the development of our global and regional businesses, fostering inclusive and sustainable businesses. →Accelerate revenue growth by focusing on more transactional businesses that generate higher fees. →Increase liabilities business, improve specialized value propositions for corporate customers and strengthen our payment services business through our global platforms. | |||||||||||
| Brazil | ||||
•Consolidate our strategy by focusing on value creation and profitability improvement, while keeping credit quality under control.
•Continue making progress in business diversification and customer loyalty.
•Simplify products and processes, improving operational efficiency and customer experience.
| Chile | ||||
•Transform our bank digitally to capture new customers, maintain our NPS leadership and consolidate our position in the mass segment with new product offerings such as Getnet.
•Strengthen our corporate and private banking franchise, with specialized value propositions and leadership in FX and Wealth Management transactional products.
| Argentina | ||||
•Continue to develop our financial platform, strengthening connectivity between businesses and consolidating recent inorganic acquisitions.
•Generate productivity gains and synergies between businesses, focusing on cost management and simplification.
| Uruguay | ||||
•Increase business volumes, maintaining good levels of efficiency and high profitability.
•Simplify our retail product offering and accelerate digital transformation.
| Peru | ||||
•Become our customers' main bank in the Corporate and CIB segments, continue leading the auto finance market, expand the microfinance business and take advantage of global platforms and digitalization.
| Colombia | ||||
•Continue to focus on profitable products for Corporates and CIB, and promote our auto and microcredit businesses (Prospera), with a differentiated value proposition, leveraging regional offerings. We will also analyse additional funding sources to reduce funding costs.
| DCB Europe | ||||||||||
Our priorities for 2024 are to: →Expand our European leadership in profitability and scale in auto and consumer lending with competitive, innovative financing solutions. →Accelerate transformation of our operating model towards single platforms, building off Group solutions to improve both end customers' and partners' customer experience, providing the best service while maintaining best-in-class efficiency. →Reduce sensitivity to interest rates by increasing deposit acquisition. →Continue supporting the green transformation of mobility in Europe. | |||||||||||
440
8. Alternative performance
measures (APMs)
measures (APMs)
In addition to the financial information prepared under IFRS, this consolidated directors’ report contains financial measures that constitute alternative performance measures (APMs) to comply with the guidelines on alternative performance measures issued by the European Securities and Markets Authority on 5 October 2015 and non-IFRS measures.
The financial measures contained in this consolidated directors’ report that qualify as APMs and non-IFRS measures have been calculated using our financial information but are not defined or detailed in the applicable financial information framework or under IFRS and therefore have neither been audited nor are susceptible to being fully audited.
We use these APMs and non-IFRS measures when planning, monitoring and evaluating our performance. We consider these APMs and non-IFRS financial measures to be useful metrics for management and investors to facilitate operating performance comparisons from period to period. While we believe that these APMs and non-IFRS financial measures are useful in evaluating our business, this information should be considered as supplemental in nature and is not meant as a substitute of IFRS measures. In addition, the way in which Santander defines and calculates these APMs and non-IFRS measures may differ from the calculations used by other companies with similar measures and, therefore, may not be comparable.
Additional APMs to those included in this section are presented in section 9.8 of the chapter 'Responsible banking'.
The APMs and non-IFRS measures we use in this document can be categorized as follows:
Underlying results
In addition to IFRS results measures, we present some results measures which are non-IFRS and which we refer to as underlying measures. These measures allow in our view a better year-on-year comparability given that they exclude items outside the ordinary performance of our business (e.g. capital gains, write-downs, impairment of goodwill) or certain line items have been reclassified in the underlying ("adjusted") income statement, as their impact on profit is zero, to better understand the trends in the business. Further information is included at the end of section 3.2 'Results'.
In addition, the results by business areas in section 4 'Financial information by segment' are presented only on an underlying basis in accordance with IFRS 8. The use of this information by the Group’s governance bodies and reconciled on an aggregate basis to our IFRS consolidated results can be found in note 52.c to our consolidated financial statements.
441
Profitability and efficiency ratios
The purpose of the profitability and efficiency ratios is to measure the ratio of profit to equity, to tangible equity, to assets and to risk-weighted assets, while the efficiency ratio measures how much general administrative expenses (personnel and other) and amortization costs are needed to generate revenue.
Goodwill adjustments have been removed from the RoTE numerator as, since they are not considered in the denominator, we believe this calculation is more correct.
| Ratio | Formula | Relevance of the metric | ||||||||||||
| RoE | Profit attributable to the parent | This ratio measures the return that shareholders obtain on the funds invested in the bank and as such measures the bank’s ability to pay shareholders. | ||||||||||||
| (Return on Equity) | Average stockholders’ equity A (excl. minority interests) | |||||||||||||
| Underlying RoE | Underlying profit attributable to the parent | This ratio measures the return that shareholders obtain on the funds invested in the bank excluding results from operations outside the ordinary course of business. | ||||||||||||
Average stockholders’ equity A (excl. minority interests) | ||||||||||||||
| RoTE | Profit attributable to the parent B | This is used to evaluate the profitability of the company as a percentage of its tangible equity. It is measured as the return that shareholders receive as a percentage of the funds invested in the bank less intangible assets. | ||||||||||||
| (Return on Tangible Equity) | Average stockholders’ equity A (excl. minority interests) - intangible assets | |||||||||||||
| Underlying RoTE | Underlying profit attributable to the parent B | This very common indicator measures the profitability of the tangible equity of a company arising from underlying activities, i.e. excluding results from operations outside the ordinary course of business. | ||||||||||||
Average stockholders’ equity A (excl. minority interests) - intangible assets | ||||||||||||||
| RoA | Consolidated profit | This metric measures the profitability of a company as a percentage of its total assets. It is an indicator that reflects the efficiency of the bank’s total assets in generating profit over a given period. | ||||||||||||
| (Return on Assets) | Average total assets | |||||||||||||
| Underlying RoA | Underlying consolidated profit | This metric measures the profitability of a company as a percentage of its total assets excluding results from operations outside the ordinary course of business. It is an indicator that reflects the efficiency of the bank’s total assets in generating underlying profit over a given period. | ||||||||||||
| Average total assets | ||||||||||||||
| RoRWA | Consolidated profit | The return adjusted for risk is a derivative of the RoA metric. The difference is that RoRWA measures profit in relation to the Group’s risk-weighted assets. | ||||||||||||
| (Return on Risk-Weighted Assets) | Average risk-weighted assets | |||||||||||||
| Underlying RoRWA | Underlying consolidated profit | This relates the underlying consolidated profit (excluding results from operations outside the ordinary course of business) to the Group’s risk-weighted assets. | ||||||||||||
| Average risk-weighted assets | ||||||||||||||
| RoRAC | Underlying consolidated profit | This is the return on economic capital required internally (necessary to support all risks inherent in our activity). | ||||||||||||
| (Return on Risk-Adjusted Capital) | Average economic capital | |||||||||||||
| Economic Value Added | Underlying consolidated profit – (average economic capital x cost of capital) | Economic value added is the profit generated in excess of the cost of economic capital employed. This measures risk-adjusted returns in absolute terms, complementing the RoRAC approach. | ||||||||||||
| Efficiency | Operating expenses C | One of the most commonly used indicators when comparing productivity of different financial entities. It measures the amount of resources used to generate the bank’s operating income. | ||||||||||||
| (Cost-to-income) | Total income | |||||||||||||
A.Stockholders’ equity = Capital and Reserves + Accumulated other comprehensive income + Profit attributable to the parent + Dividends.
B.Excluding the adjustment to the valuation of goodwill.
C.Operating expenses = Administrative expenses + amortizations.
442
Profitability and efficiency A B (EUR million and %) | 2023 | 2022 | 2021 | ||||||||
| RoE | 11.91 | % | 10.67 | % | 9.66 | % | |||||
| Profit attributable to the parent | 11,076 | 9,605 | 8,124 | ||||||||
| Average stockholders' equity (excluding minority interests) | 93,035 | 89,986 | 84,133 | ||||||||
| Underlying RoE | 11.91 | % | 10.67 | % | 10.29 | % | |||||
| Profit attributable to the parent | 11,076 | 9,605 | 8,124 | ||||||||
| (-) Net capital gains and provisions | — | — | -530 | ||||||||
| Underlying profit attributable to the parent | 11,076 | 9,605 | 8,654 | ||||||||
| Average stockholders' equity (excluding minority interests) | 93,035 | 89,986 | 84,133 | ||||||||
| RoTE | 15.06 | % | 13.37 | % | 11.96 | % | |||||
| Profit attributable to the parent | 11,076 | 9,605 | 8,124 | ||||||||
| (-) Goodwill impairment | -20 | — | -6 | ||||||||
| Profit attributable to the parent (excluding goodwill impairment) | 11,096 | 9,605 | 8,130 | ||||||||
| Average stockholders' equity (excluding minority interests) | 93,035 | 89,986 | 84,133 | ||||||||
| (-) Average intangible assets | 19,361 | 18,164 | 16,169 | ||||||||
| Average stockholders' equity (excl. minority interests) - intangible assets | 73,675 | 71,822 | 67,964 | ||||||||
| Underlying RoTE | 15.06 | % | 13.37 | % | 12.73 | % | |||||
| Profit attributable to the parent | 11,076 | 9,605 | 8,124 | ||||||||
| (-) Goodwill impairment | -20 | — | — | ||||||||
| Profit attributable to the parent (excluding goodwill impairment) | 11,096 | 9,605 | 8,124 | ||||||||
| (-) Net capital gains and provisions | — | — | -530 | ||||||||
| Underlying profit attributable to the parent (excluding goodwill impairment) | 11,096 | 9,605 | 8,654 | ||||||||
| Average stockholders' equity (excl. minority interests) - intangible assets | 73,675 | 71,822 | 67,964 | ||||||||
| RoA | 0.69 | % | 0.63 | % | 0.62 | % | |||||
| Consolidated profit | 12,209 | 10,764 | 9,653 | ||||||||
| Average total assets | 1,773,103 | 1,720,273 | 1,563,899 | ||||||||
| Underlying RoA | 0.69 | % | 0.63 | % | 0.65 | % | |||||
| Consolidated profit | 12,209 | 10,764 | 9,653 | ||||||||
| (-) Net capital gains and provisions | — | — | -530 | ||||||||
| Underlying consolidated profit | 12,209 | 10,764 | 10,183 | ||||||||
| Average total assets | 1,773,103 | 1,720,273 | 1,563,899 | ||||||||
| RoRWA | 1.96 | % | 1.77 | % | 1.69 | % | |||||
| Consolidated profit | 12,209 | 10,764 | 9,653 | ||||||||
| Average risk-weighted assets | 624,031 | 606,952 | 572,136 | ||||||||
| Underlying RoRWA | 1.96 | % | 1.77 | % | 1.78 | % | |||||
| Consolidated profit | 12,209 | 10,764 | 9,653 | ||||||||
| (-) Net capital gains and provisions | — | — | -530 | ||||||||
| Underlying consolidated profit | 12,209 | 10,764 | 10,183 | ||||||||
| Average risk-weighted assets | 624,031 | 606,952 | 572,136 | ||||||||
RoRAC C | 15.34 | % | 14.00 | % | 13.73 | % | |||||
| Consolidated profit | 12,209 | 10,764 | 9,653 | ||||||||
| (-) Net capital gains and provisions | — | — | -530 | ||||||||
| Underlying consolidated profit | 12,209 | 10,764 | 10,183 | ||||||||
| Average economic capital | 79,605 | 76,872 | 74,166 | ||||||||
Economic value added C | 3,285 | 2,146 | 2,707 | ||||||||
| Underlying consolidated profit | 12,209 | 10,764 | 10,183 | ||||||||
| (-) Average economic capital x cost of capital | -8,924 | -8,617 | -7,476 | ||||||||
| Average economic capital | 79,605 | 76,872 | 74,166 | ||||||||
| Cost of capital | 11.21 | % | 11.21 | % | 10.08 | % | |||||
| Efficiency ratio | 44.1 | % | 45.8 | % | 46.1 | % | |||||
| Underlying operating expenses | 25,425 | 23,903 | 21,415 | ||||||||
| Operating expenses | 25,425 | 23,903 | 21,415 | ||||||||
Net capital gains and provisions impact in operating expenses D | — | — | — | ||||||||
| Underlying total income | 57,647 | 52,154 | 46,404 | ||||||||
| Total income | 57,423 | 52,117 | 46,404 | ||||||||
Net capital gains and provisions impact in total income D | 224 | 37 | — | ||||||||
A.Averages included in the RoE, RoTE, RoA and RoRWA denominators are calculated using the monthly average over the period, which we believe should not differ materially from using daily balances.
B.The risk-weighted assets included in the denominator of the RoRWA metric are calculated in line with the criteria laid out in the CRR (Capital Requirements Regulation).
C.The 2022 and 2021 economic capital requirements have been recalculated based on the 2023 methodology to facilitate their comparison.
443
Efficiency ratio by business area (EUR million and %) | ||||||||||||||||||||
| 2023 | 2022 | |||||||||||||||||||
| % | Operating expenses | Total income | % | Operating expenses | Total income | |||||||||||||||
| Europe | 42.1 | 9,030 | 21,439 | 47.3 | 8,523 | 18,030 | ||||||||||||||
| Spain | 41.7 | 4,227 | 10,132 | 48.6 | 3,998 | 8,233 | ||||||||||||||
| United Kingdom | 49.7 | 2,745 | 5,525 | 49.6 | 2,685 | 5,418 | ||||||||||||||
| Portugal | 27.3 | 542 | 1,982 | 38.7 | 502 | 1,295 | ||||||||||||||
| Poland | 27.1 | 862 | 3,182 | 28.0 | 692 | 2,474 | ||||||||||||||
| North America | 49.1 | 6,465 | 13,174 | 47.7 | 5,871 | 12,316 | ||||||||||||||
| US | 51.0 | 3,679 | 7,209 | 47.2 | 3,599 | 7,623 | ||||||||||||||
| Mexico | 43.9 | 2,588 | 5,899 | 44.9 | 2,076 | 4,623 | ||||||||||||||
| South America | 38.5 | 6,920 | 17,971 | 37.0 | 6,675 | 18,025 | ||||||||||||||
| Brazil | 34.6 | 4,529 | 13,104 | 32.4 | 4,180 | 12,910 | ||||||||||||||
| Chile | 44.6 | 1,020 | 2,285 | 40.1 | 981 | 2,449 | ||||||||||||||
| Argentina | 50.2 | 775 | 1,544 | 53.9 | 987 | 1,833 | ||||||||||||||
| Digital Consumer Bank | 47.6 | 2,618 | 5,502 | 46.7 | 2,462 | 5,269 | ||||||||||||||
RoTE by business area (EUR million and %) | ||||||||||||||||||||
| 2023 | 2022 | |||||||||||||||||||
| % | Profit attributable to the parent (excluding goodwill impairment) | Average stockholders' equity (excl. minority interests) - intangible assets | % | Profit attributable to the parent (excluding goodwill impairment) | Average stockholders' equity (excl. minority interests) - intangible assets | |||||||||||||||
| Europe | 14.47 | 5,489 | 37,931 | 9.28 | 3,810 | 41,054 | ||||||||||||||
| Spain | 14.16 | 2,371 | 16,742 | 7.89 | 1,560 | 19,786 | ||||||||||||||
| United Kingdom | 13.01 | 1,545 | 11,874 | 10.70 | 1,395 | 13,038 | ||||||||||||||
| Portugal | 25.92 | 896 | 3,458 | 15.03 | 534 | 3,553 | ||||||||||||||
| Poland | 17.68 | 674 | 3,810 | 11.93 | 364 | 3,047 | ||||||||||||||
| North America | 9.76 | 2,360 | 24,183 | 11.06 | 2,878 | 26,025 | ||||||||||||||
| US | 6.07 | 932 | 15,355 | 9.40 | 1,784 | 18,968 | ||||||||||||||
| Mexico | 17.70 | 1,560 | 8,814 | 16.92 | 1,213 | 7,168 | ||||||||||||||
| South America | 14.43 | 3,045 | 21,097 | 18.77 | 3,658 | 19,491 | ||||||||||||||
| Brazil | 13.73 | 1,921 | 13,987 | 19.23 | 2,544 | 13,232 | ||||||||||||||
| Chile | 14.82 | 582 | 3,925 | 19.47 | 677 | 3,479 | ||||||||||||||
| Argentina | 55.60 | 386 | 694 | 26.23 | 324 | 1,237 | ||||||||||||||
| Digital Consumer Bank | 12.33 | 1,199 | 9,721 | 13.65 | 1,308 | 9,583 | ||||||||||||||
444
Credit risk indicators
The credit risk indicators measure the quality of the credit portfolio and the percentage of non-performing loans covered by provisions.
Ratio | Formula | Relevance of the metric | ||||||||||||
NPL ratio (Non-performing loans ratio) | Credit impaired loans and advances to customers, customer guarantees and customer commitments granted | The NPL ratio is an important variable regarding financial institutions' activity since it gives an indication of the level of risk the entities are exposed to. It calculates risks that are, in accounting terms, declared to be credit impaired as a percentage of the total outstanding amount of customer credit and contingent liabilities. | ||||||||||||
Total Risk A | ||||||||||||||
| Total coverage ratio | Total allowances to cover impairment losses on loans and advances to customers, customer guarantees and customer commitments granted | The total coverage ratio is a fundamental metric in the financial sector. It reflects the level of provisions as a percentage of the credit impaired assets. Therefore it is a good indicator of the entity's solvency against customer defaults both present and future. | ||||||||||||
| Credit impaired loans and advances to customers, customer guarantees and customer commitments granted | ||||||||||||||
| Cost of risk | Allowances for loan-loss provisions over the last 12 months | This ratio quantifies loan-loss provisions arising from credit risk over a defined period of time for a given loan portfolio. As such, it acts as an indicator of credit quality. | ||||||||||||
| Average loans and advances to customers over the last 12 months | ||||||||||||||
A.Total risk = Total loans and advances and guarantees to customers (including credit impaired assets) + contingent liabilities that are credit impaired.
Credit risk (I) (EUR million and %) | 2023 | 2022 | 2021 | ||||||||
| NPL ratio | 3.14 | % | 3.08 | % | 3.16 | % | |||||
| Credit impaired loans and advances to customers, customer guarantees and customer commitments granted | 35,620 | 34,673 | 33,234 | ||||||||
| Gross loans and advances to customers registered under the headings 'financial assets measured at amortized cost' and 'financial assets designated at fair value through profit or loss' classified in stage 3 (OCI), excluding POCI (Purchased or Originated Credit Impaired) that is currently impaired | 33,821 | 32,617 | 31,288 | ||||||||
| POCI exposure (Purchased or Originated Credit Impaired) that is currently impaired | 273 | 271 | 358 | ||||||||
| Customer guarantees and customer commitments granted classified in stage 3 | 1,517 | 1,776 | 1,578 | ||||||||
| Doubtful exposure of loans and advances to customers at fair value through profit or loss | 9 | 9 | 10 | ||||||||
| Total risk | 1,133,898 | 1,124,121 | 1,051,115 | ||||||||
| Impaired and non-impaired gross loans and advances to customers | 1,059,135 | 1,058,688 | 995,646 | ||||||||
| Impaired and non-impaired customer guarantees and customer commitments granted | 74,763 | 65,433 | 55,469 | ||||||||
445
Credit risk (II) (EUR million and %) | 2023 | 2022 | 2021 | ||||||||
| Total coverage ratio | 66 | % | 68 | % | 71 | % | |||||
| Total allowances to cover impairment losses on loans and advances to customers, customer guarantees and customer commitments granted | 23,490 | 23,418 | 23,698 | ||||||||
| Total allowances to cover impairment losses on loans and advances to customers measured at amortised cost and designated at fair value through OCI | 22,788 | 22,684 | 22,964 | ||||||||
| Total allowances to cover impairment losses on customer guarantees and customer commitments granted | 702 | 734 | 734 | ||||||||
| Credit impaired loans and advances to customers, customer guarantees and customer commitments granted | 35,620 | 34,673 | 33,234 | ||||||||
| Gross loans and advances to customers registered under the headings 'financial assets measured at amortized cost' and 'financial assets designated at fair value through profit or loss' classified in stage 3 (OCI), excluding POCI (Purchased or Originated Credit Impaired) that is currently impaired | 33,821 | 32,617 | 31,288 | ||||||||
| POCI exposure (Purchased or Originated Credit Impaired) that is currently impaired | 273 | 271 | 358 | ||||||||
| Customer guarantees and customer commitments granted classified in stage 3 | 1,517 | 1,776 | 1,578 | ||||||||
| Doubtful exposure of loans and advances to customers at fair value through profit or loss | 9 | 9 | 10 | ||||||||
| Cost of risk | 1.18 | % | 0.99 | % | 0.77 | % | |||||
| Underlying allowances for loan-loss provisions over the last 12 months | 12,458 | 10,509 | 7,436 | ||||||||
| Allowances for loan-loss provisions over the last 12 months | 12,932 | 10,836 | 7,436 | ||||||||
| Net capital gains and provisions impact in allowances for loan-loss provisions | -474 | -327 | — | ||||||||
| Average loans and advances to customers over the last 12 months | 1,059,566 | 1,059,972 | 968,931 | ||||||||
NPL ratio by business area (EUR million and %) | ||||||||||||||||||||
| 2023 | 2022 | |||||||||||||||||||
| % | Credit impaired loans and advances to customers, customer guarantees and customer commitments granted | Total risk | % | Credit impaired loans and advances to customers, customer guarantees and customer commitments granted | Total risk | |||||||||||||||
| Europe | 2.32 | 14,495 | 624,696 | 2.37 | 15,186 | 639,996 | ||||||||||||||
| Spain | 3.06 | 8,529 | 278,569 | 3.27 | 9,598 | 293,197 | ||||||||||||||
| United Kingdom | 1.42 | 3,518 | 247,360 | 1.21 | 3,059 | 253,455 | ||||||||||||||
| Portugal | 2.59 | 1,024 | 39,503 | 2.99 | 1,247 | 41,755 | ||||||||||||||
| Poland | 3.55 | 1,397 | 39,329 | 3.80 | 1,268 | 33,350 | ||||||||||||||
| North America | 4.09 | 7,805 | 190,720 | 3.03 | 5,629 | 185,614 | ||||||||||||||
| US | 4.57 | 6,303 | 137,893 | 3.25 | 4,571 | 140,452 | ||||||||||||||
| Mexico | 2.82 | 1,489 | 52,785 | 2.32 | 1,047 | 45,107 | ||||||||||||||
| South America | 5.72 | 10,142 | 177,380 | 6.20 | 10,381 | 167,348 | ||||||||||||||
| Brazil | 6.56 | 7,479 | 113,937 | 7.57 | 7,705 | 101,801 | ||||||||||||||
| Chile | 5.01 | 2,332 | 46,565 | 4.99 | 2,384 | 47,811 | ||||||||||||||
| Argentina | 1.99 | 78 | 3,903 | 2.08 | 122 | 5,844 | ||||||||||||||
| Digital Consumer Bank | 2.12 | 2,877 | 135,608 | 2.06 | 2,583 | 125,339 | ||||||||||||||
446
Total coverage ratio by business area (EUR million and %) | ||||||||||||||||||||
| 2023 | 2022 | |||||||||||||||||||
| % | Total allowances to cover impairment losses on loans and advances to customers, customer guarantees and customer commitments granted | Credit impaired loans and advances to customers, customer guarantees and customer commitments granted | % | Total allowances to cover impairment losses on loans and advances to customers, customer guarantees and customer commitments granted | Credit impaired loans and advances to customers, customer guarantees and customer commitments granted | |||||||||||||||
| Europe | 49.3 | 7,147 | 14,495 | 51.8 | 7,871 | 15,186 | ||||||||||||||
| Spain | 49.1 | 4,185 | 8,529 | 51.0 | 4,890 | 9,598 | ||||||||||||||
| United Kingdom | 30.3 | 1,066 | 3,518 | 33.8 | 1,033 | 3,059 | ||||||||||||||
| Portugal | 82.7 | 847 | 1,024 | 79.3 | 990 | 1,247 | ||||||||||||||
| Poland | 73.3 | 1,024 | 1,397 | 74.0 | 938 | 1,268 | ||||||||||||||
| North America | 73.8 | 5,763 | 7,805 | 93.3 | 5,250 | 5,629 | ||||||||||||||
| US | 67.7 | 4,265 | 6,303 | 90.3 | 4,127 | 4,571 | ||||||||||||||
| Mexico | 100.0 | 1,489 | 1,489 | 106.6 | 1,116 | 1,047 | ||||||||||||||
| South America | 78.4 | 7,948 | 10,142 | 76.0 | 7,886 | 10,381 | ||||||||||||||
| Brazil | 84.7 | 6,338 | 7,479 | 79.5 | 6,128 | 7,705 | ||||||||||||||
| Chile | 52.7 | 1,230 | 2,332 | 56.3 | 1,343 | 2,384 | ||||||||||||||
| Argentina | 165.7 | 128 | 78 | 180.4 | 220 | 122 | ||||||||||||||
| Digital Consumer Bank | 88.0 | 2,532 | 2,877 | 92.8 | 2,397 | 2,583 | ||||||||||||||
Cost of risk by business area (EUR million and %) | ||||||||||||||||||||
| 2023 | 2022 | |||||||||||||||||||
| % | Underlying allowances for loan-loss provisions over the last 12 months | Average loans and advances to customers over the last 12 months | % | Underlying allowances for loan-loss provisions over the last 12 months | Average loans and advances to customers over the last 12 months | |||||||||||||||
| Europe | 0.44 | 2,533 | 582,256 | 0.39 | 2,396 | 612,142 | ||||||||||||||
| Spain | 0.62 | 1,522 | 246,660 | 0.61 | 1,618 | 265,051 | ||||||||||||||
| United Kingdom | 0.10 | 247 | 251,362 | 0.12 | 316 | 262,973 | ||||||||||||||
| Portugal | 0.20 | 77 | 38,546 | 0.04 | 17 | 40,286 | ||||||||||||||
| Poland | 2.08 | 674 | 32,385 | 1.43 | 440 | 30,721 | ||||||||||||||
| North America | 2.05 | 3,733 | 182,037 | 1.49 | 2,538 | 169,980 | ||||||||||||||
| US | 1.92 | 2,593 | 135,190 | 1.35 | 1,744 | 128,834 | ||||||||||||||
| Mexico | 2.43 | 1,135 | 46,729 | 1.95 | 788 | 40,348 | ||||||||||||||
| South America | 3.36 | 5,401 | 160,644 | 3.32 | 5,041 | 151,705 | ||||||||||||||
| Brazil | 4.77 | 4,701 | 98,555 | 4.79 | 4,417 | 92,188 | ||||||||||||||
| Chile | 0.80 | 365 | 45,637 | 0.93 | 399 | 42,953 | ||||||||||||||
| Argentina | 6.64 | 150 | 2,262 | 2.91 | 132 | 4,541 | ||||||||||||||
| Digital Consumer Bank | 0.62 | 792 | 128,583 | 0.45 | 544 | 119,524 | ||||||||||||||
447
Other indicators
The market capitalization indicator provides information on the volume of tangible equity per share. The loan-to-deposit ratio (LTD) identifies the relationship between net customer loans and advances and customer deposits, assessing the proportion of loans and advances granted by the Group that are funded by customer deposits.
The Group also uses gross customer loan magnitudes excluding reverse repurchase agreements (repos) and customer deposits excluding repos. In order to analyse the evolution of the traditional commercial banking business of granting loans and capturing deposits, repos and reverse repos are excluded, as they are mainly treasury business products and highly volatile.
Ratio | Formula | Relevance of the metric | ||||||||||||
TNAV per share (Tangible net asset value per share) | Tangible book value A | This is a very commonly used ratio used to measure the company’s accounting value per share having deducted the intangible assets. It is useful in evaluating the amount each shareholder would receive if the company were to enter into liquidation and had to sell all the company’s tangible assets. | ||||||||||||
| Number of shares excluding treasury stock | ||||||||||||||
| Price to tangible book value per share (X) | Share price | This is one of the most commonly used ratios by market participants for the valuation of listed companies both in absolute terms and relative to other entities. This ratio measures the relationship between the price paid for a company and its accounting equity value. | ||||||||||||
| TNAV per share | ||||||||||||||
| LTD (Loan-to-deposit) | Net loans and advances to customers | This is an indicator of the bank's liquidity. It measures the total loans and advances to customers net of loan-loss provisions as a percentage of customer deposits. | ||||||||||||
| Customer deposits | ||||||||||||||
| Loans and advances (minus reverse repos) | Gross loans and advances to customers minus reverse repos | In order to aid analysis of the commercial banking activity, reverse repos are excluded as they are highly volatile treasury products. | ||||||||||||
| Deposits (minus repos) | Customer deposits minus repos | In order to aid analysis of the commercial banking activity, repos are excluded as they are highly volatile treasury products. | ||||||||||||
| PAT + After tax fees paid to SAN (in Wealth Management & Insurance) | Net profit + fees paid from Santander Asset Management and Santander Insurance to Santander, net of taxes, excluding Private Banking customers | Metric to assess Wealth Management & Insurance’s total contribution to Group’s profit. | ||||||||||||
A. Tangible book value = Stockholders’ equity (excl. minority interests) - intangible assets.
Others (EUR million and %) | 2023 | 2022 | 2021 | ||||||||
| TNAV (tangible book value) per share | 4.76 | 4.26 | 4.12 | ||||||||
| Tangible book value | 75,552 | 70,459 | 70,346 | ||||||||
| Number of shares excl. treasury stock (million) | 15,886 | 16,551 | 17,063 | ||||||||
| Price to tangible book value per share (X) | 0.79 | 0.66 | 0.71 | ||||||||
| Share price (euros) | 3.780 | 2.803 | 2.941 | ||||||||
| TNAV (tangible book value) per share | 4.76 | 4.26 | 4.12 | ||||||||
| Loan-to-deposit ratio | 99 | % | 103 | % | 108 | % | |||||
| Net loans and advances to customers | 1,036,349 | 1,036,004 | 972,682 | ||||||||
| Customer deposits | 1,047,169 | 1,009,722 | 900,554 | ||||||||
| PAT + After tax fees paid to SAN (in WM&I) (Constant EUR million) | 3,296 | 2,730 | |||||||||
| Profit after tax | 1,707 | 1,167 | |||||||||
| Net fee income net of tax | 1,589 | 1,563 | |||||||||
448
Impact of exchange rate movements on profit and loss accounts
The Group presents, at both the Group level as well as the business unit level, the real changes in euros in the income statement as well as the changes excluding the exchange rate effect (i.e. in constant euros), as it considers the latter facilitates analysis, since it enables business movements to be identified without taking into account the impact of converting each local currency into euros.
Said variations, excluding the impact of exchange rate movements, are calculated by converting P&L lines for the different business units comprising the Group into our presentation currency, the euro, applying the average exchange rate for 2023 to all periods contemplated in the analysis. The table below shows the average exchange rates of the main currencies in which the Group operates.
Impact of exchange rate movements on the balance sheet
The Group presents, at both the Group level as well as the business unit level, the real changes in euros in the balance sheet as well as the changes excluding the exchange rate effect for loans and advances to customers minus reverse repurchase agreements and customer funds (which comprise deposits and mutual funds) minus repurchase agreements. As with the income statement, the reason is to facilitate analysis by isolating the changes in the balance sheet that are not caused by converting each local currency into euros.
These changes excluding the impact of exchange rate movements are calculated by converting loans and advances to customers minus reverse repurchase agreements and customer funds minus repurchase agreements, into our presentation currency, the euro, applying the closing exchange rate on the last working day of 2023 to all periods contemplated in the analysis. The table below shows the period-end exchange rates of the main currencies in which the Group operates.
| Exchange rates: 1 euro/currency parity | |||||||||||||||||
| Average | Period-end | ||||||||||||||||
| 2023 | 2022 | 2023 | 2022 | ||||||||||||||
| US dollar | 1.081 | 1.051 | 1.105 | 1.068 | |||||||||||||
| Pound sterling | 0.870 | 0.853 | 0.868 | 0.887 | |||||||||||||
| Brazilian real | 5.397 | 5.421 | 5.365 | 5.650 | |||||||||||||
| Mexican peso | 19.158 | 21.131 | 18.691 | 20.805 | |||||||||||||
| Chilean peso | 906.417 | 916.688 | 965.192 | 909.200 | |||||||||||||
| Argentine peso | 282.765 | 134.786 | 893.635 | 189.116 | |||||||||||||
| Polish zloty | 4.538 | 4.683 | 4.343 | 4.684 | |||||||||||||
Impact of inflation on operating expenses
Santander presents, for both the Group and the business units included in the primary segments, the changes in operating expenses, as well as the changes excluding the exchange rate effect, and the changes of the latter excluding the effect of average inflation in 2023. The reason is that the two latter facilitate analysis for management purposes.
Inflation is calculated as the arithmetic average of the last twelve months for each country and, for the regions, as the weighted average of each country comprising the region's inflation rate, weighted by each country's operating expenses in the region. The table below shows the average inflation rates calculated as indicated for each of the regions and countries.
| Average inflation 2023 | |||||
| % | |||||
| Europe | 5.7 | ||||
| Spain | 3.6 | ||||
| United Kingdom | 7.4 | ||||
| Portugal | 4.4 | ||||
| Poland | 11.6 | ||||
| North America | 4.7 | ||||
| US | 4.2 | ||||
| Mexico | 5.6 | ||||
| South America | 19.5 | ||||
| Brazil | 4.6 | ||||
| Chile | 7.7 | ||||
| Argentina | 127.9 | ||||
| Digital Consumer Bank | 5.5 | ||||
| Total Group | 9.3 | ||||
449
Profitability and efficiency ratios of new primary segments from 1 January 2024
| Ratio | Formula | Relevance of the metric | ||||||||||||
Global Business RoTE | Profit attributable to the parent (excluding goodwill impairment) | This is used to evaluate the profitability of the company as a percentage of its tangible equity. It is measured as the return that shareholders receive as a percentage of the funds invested in the bank less intangible assets. | ||||||||||||
Average stockholders’ equity (excl. minority interests) - intangible assetsA | ||||||||||||||
A. Allocated according to RWA consumption.
Efficiency ratio by new primary segment (EUR million and %) | ||||||||||||||||||||
| 2023 | 2022 | |||||||||||||||||||
| % | Operating expenses | Total income | % | Operating expenses | Total income | |||||||||||||||
| Retail & Commercial Banking | 43.1 | 12,825 | 29,754 | 44.7 | 12,059 | 26,994 | ||||||||||||||
| Digital Consumer Bank | 42.8 | 5,263 | 12,296 | 41.9 | 5,197 | 12,391 | ||||||||||||||
| Corporate & Investment Banking | 45.0 | 3,387 | 7,527 | 43.3 | 2,901 | 6,703 | ||||||||||||||
| Wealth Management & Insurance | 37.9 | 1,216 | 3,210 | 41.2 | 1,104 | 2,678 | ||||||||||||||
| Payments | 44.2 | 2,344 | 5,298 | 46.6 | 2,271 | 4,874 | ||||||||||||||
RoTE by new primary segment (EUR million and %) | ||||||||||||||||||||
| 2023 | 2022 | |||||||||||||||||||
| % | Profit attributable to the parent (excluding goodwill impairment) | Average stockholders' equity (excl. minority interests) - intangible assets | % | Profit attributable to the parent (excluding goodwill impairment) | Average stockholders' equity (excl. minority interests) - intangible assets | |||||||||||||||
| Retail & Commercial Banking | 15.15 | 5,659 | 37,362 | 14.15 | 5,017 | 35,462 | ||||||||||||||
| Digital Consumer Bank | 11.52 | 1,901 | 16,502 | 15.47 | 2,610 | 16,869 | ||||||||||||||
| Corporate & Investment Banking | 17.52 | 2,440 | 13,922 | 15.85 | 2,233 | 14,085 | ||||||||||||||
| Wealth Management & Insurance | 72.16 | 1,467 | 2,033 | 52.42 | 1,101 | 2,100 | ||||||||||||||
| Payments | 24.94 | 627 | 2,512 | 30.01 | 693 | 2,309 | ||||||||||||||
450
Risk, compliance & conduct management | |||||
 | |||||
451
Our risk, compliance & conduct management is an essential lever to help people and businesses prosper.
→ Our risk management and control model together with our risk culture and robust governance contribute to maintaining a medium-low risk profile. | → Risk, compliance & conduct continue to support our customers and all our stakeholders to face a challenging environment. | → We keep embedding ESG factors across the different risks, both from a regulatory and management perspective. | ||||||||||||
| Santander’s risk culture is part of the Santander Way. It represents how we manage risks on a day-to-day basis. | ||
| ||
9.0 (over 10) Average rating by employees agreeing to the statement: "Group leaders frequently highlight the importance of managing risks on our day-to-day" | ||||||||
8.3 (over 10) Employees rating of Santander’s performance. Development and reward frameworks motivate people to effectively manage risks | ||||||||
452
453
1. Risk, compliance &
conduct management
conduct management
1.1 Executive summary and 2023 highlights
This section outlines Santander’s risk management and risk profile in 2023 based on key risk indicators and their performance. Additional information on each risk type can be accessed using the links provided for each section.
| Credit risk | |||||
Credit quality indicators remain in line with expected levels, given the current challenging macroeconomic and geopolitical environment.
NPL ratio | Cost of risk | |||||||
3.14% ▲ 6bp s/2022 | 1.18% ▲ 19bp s/2022 | |||||||
This year's NPL rate performance is explained by the lower increase in impaired loans, thanks to proactive management and NPL portfolio sales, and the lower relative growth of the credit risk with customers.
The cost of risk has remained slightly below 120 bp, mainly due to the good performance in the year of loan-loss provisions in Spain, the UK and Chile.
The 2023 credit risk strategy focused on:
→A customers-related proposal that improves time to market and simplifies the product offer.
→Managing the effects of increased cost of living (monitoring most affected sectors/customers, playbooks, local customer support measures, among others).
→Strengthening the balance sheet by divesting less profitable assets (portfolio sales).
→Driving digital transformation to improve profitability and support subsidiaries in the transition to global business management.
| Market, structural and liquidity risk | |||||
Our risk profile remained stable, despite some Value at Risk (VaR) spikes due to high market volatility in some periods.
Average VaR | LCRA | |||||||
€ 11.7 Mn ▼ 2.4 Mn s/2022 | 166% ▲ 14 pp s/2022 | |||||||
A.LCR: Liquidity coverage ratio
VaR remained generally stable throughout the year averaging EUR 11.7 million, rebounding at times of high volatility in the markets (max. EUR 19.3 million) due to events related to the regional banks and the negotiation of the debt ceiling in the United States or the increase in tension in the Middle East.
Robust and diversified liquidity buffer by customers, business and geographies, with ratios well above regulatory requirements.
A summary of our 2023 highlights is described below:
→Highly liquid balance sheet & well-diversified deposit base, composed mainly by retail deposits with stable structure (approximately 75% are transactional).
→Reduced exposure to Interest Rate Risk in the Banking Book (IRRBB) with conservative risk appetite limits.
→Our exposure to unrealized losses on the held-to-collect bond portfolio (HtC) compared to CET1 is among the lowest in the banking system.
→Trading business focused on customer service.
454
Capital risk | |||||
The latest EBA stress test has once again demonstrated the strength of our business model and, consequently, that our solvency levels would be sufficient to cope with the most severe macroeconomic scenarios.
Credit risk stands out in the distribution of risk-weighted assets (RWA) as it is our core business.
CET 1 Fully Loaded | RWA | |||||||
12.3% ▲ 22 bp s/2022 | ||
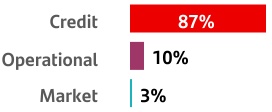
624 bn ▲ 15Mn s/2022 | ||
Capital optimization with enhanced models and several initiatives. In addition, our new global business model will allow us to improve capital allocation.
| Operational risk | |||||
→Stable risk profile despite the challenging environment.
→Adaptation to regulatory changes focused on operational resilience and Basel principles related to operational risk, environmental, social and governance (ESG) requirements and capital calculation models.
→Widening of the European cyber risk hub, to other geographies outside Europe.
| Compliance and conduct risk | |||||
→Reinforcement of the Group's General Code of Conduct and Canal Abierto.
→Development of compliance and conduct frameworks and regulations for CIB.
→Progress in the development of a global control room to prevent illicit conduct and identify potential conflictive transactions.
→One FCC: improved accountability of the first line of defence, strengthened supervision methodology and support for international anti-money laundering initiatives.
→Continuous progress in conduct risk management, especially those derived from sustainability factors in new products, digital channels, financial inclusion and customer vulnerability.
→Progress in reputational risk management derived from climate risk factors (materiality assessment and greenwashing).
| Model risk | |||||
→Reinforcement of the binding role of internal validation to comply with growing regulatory requirements.
→Definition of the IV Next project to evolve the internal validation function, prioritizing key actions through global management.
→Optimizing model risk management data exploitation.
→Continuous improvement of regulatory models (Internal Rating Based Approach —IRB— e Internal Model Approach —IMA—) to meet supervisory expectations.
| Strategic risk | |||||
→Focus on monitoring the consequences of inflationary pressure, monetary and fiscal policy.
→We continue to focus on our transformation initiatives.
→Improved challenge of strategic plans, identification and monitoring of emerging risks and analysis of the business model evolution.
ESG risk factors | |||||
→Advances in risk appetite with new metrics and limits to support our decarbonization strategy.
→Progress in our materiality assessment methodology, including a more holistic view and advances in biodiversity.
→Progress in the implementation of the climate risk management model through 'The Climate Race' initiative to integrate ESCC factors into the credit granting process.
→Participation in the EBA regulatory exercise 'One-off Fit-for-55 Climate Risk Scenario Analysis', which will be extended to 2024.
455
Proactive and efficient risk management in a challenging macroeconomic and geopolitical environment by strengthening how we monitor all risks, key indicators and the most affected customers and sectors. | Our business model and solvency levels have demonstrated, once again, their resilience to the most severe macroeconomic scenarios, according to the latest EBA stress exercise. | The transition to a low-carbon economy represents a great business opportunity for financial entities that are committed to sustainability, which is why we embed ESG factors in our risk management model. | ||||||||||||||||||||||||||||||
We base segment reporting on financial information presented to the chief operating decision maker, which exclude certain statutory results items that distort year-on-year comparisons and are not considered for management reporting. Grupo Santander has aligned the information in this chapter consistently with the information used internally for management reports and with the information presented in other public documents of the Group.
During 2023, the segments were split by geographic area in which profits were earned or by type of business. We prepared the information by aggregating the figures for Santander’s various geographic areas and business units, relating it to both the accounting data of the business units integrated in each segment and that provided by management information systems. The same general principles as those used in the Group were applied.
| For more details on segments, see section '4.1 Description of segments' of the 'Economic and financial review' chapter. | ||||
456
1.2 Emerging risks
Through our emerging risks exercise, we try to identify key threats to our strategic plan under theoretical stress scenarios with low likelihood of occurrence. We aim to detect, assess and monitor risks that may have a significant impact on our business model, profitability and solvency. Proactive risk management is essential to avoid potentially negative impacts on, and deviations from, targets which could be mitigated through action plans drawn up in advance.
Emerging risk identification involves both the first and second line of defence in our subsidiaries and at the corporate centre. We also embed identified risks in the idiosyncratic scenarios of the Group's Internal Capital Adequacy Assessment Process (ICAAP), the Internal Liquidity Adequacy Assessment Process (ILAAP), and recovery and resolution plans.
In 2023, potential threats stemmed from, among others, tighter financial conditions, high inflation, tension in the Middle East, and the continuing war in Ukraine. Some core emerging risks and their associated action plans are:
Macroeconomic and geopolitical environment
Some of the many macroeconomic and geopolitical factors posing risk to our strategy include persistent restrictive monetary policy, intensification of armed conflicts in the Middle East and Ukraine, and rising energy and commodity prices. We analyse situations that we do not include in our base scenario because of their low likelihood (per our emerging risk methodology); however, they can become global risk scenarios that may affect the markets where we operate. For example:
•Higher interest rates for longer. Future rises in inflation or delays in the disinflation roadmap could mean restrictive monetary policy remains in place for longer, which would mainly impact on our subsidiaries in Europe and the US — economies in Latin America are at a different stage of monetary policy. This could trigger a worse than expected economic slowdown, with higher unemployment and a drop in house prices that could jeopardize credit quality and liquidity conditions.
•Escalation of the conflicts in Ukraine and the Middle East, leading to tighter monetary policy as energy prices and inflation soar.
•High increase in public debt levels, triggering a rise in risk premiums, mainly in the eurozone, financial fragmentation, and possible spillover to financial institutions.
Macroeconomic and geopolitical uncertainty can potentially hinder our growth and profitability and diminish asset quality due to a slowdown in one or many of our markets. In addition, our clients' income or the value of their financial assets could also be affected, which would likely impact the recoverability of loans and increase our losses or additional provisioning needs.
Economic volatility might make our estimates seem inaccurate, our processes seem unreliable and our loan-loss provisions seem insufficient.
Grupo Santander has robust risk policies and procedures and manages risk proactively to keep our risk profile within the limits set in our risk appetite statement. This, coupled with our
geographical and business diversification, makes us more resilient to macroeconomic and geopolitical risk.
In addition, the constant reinforcement of mitigating measures helped reduce the potential severity of these risks. Throughout 2023, we have developed the following actions:
•frequent monitoring meetings, including special situation forums (where necessary) to review risk profile and business, market and macroeconomic trends, with the spotlight on key indicators related to the potential escalation of the armed conflicts mentioned above;
•playbooks designed and implemented to pursue a quick, forward-looking and proactive response to challenging circumstances;
•a large and diverse base of customer deposits that enables us to address challenges from a strong liquidity position;
•the means to proactively detect credit impairment (especially in the most affected sectors) and get customers the help they need through specific solutions;
•support for our customers in developing sustainable, energy-efficient alternatives to offset the impact of economic cycles and potential energy shocks and adopt the measures implemented by governments to protect the most vulnerable customers; and
•asset-liability committee (ALCO) and market committee meetings to monitor structural, interest rate and FX risk, including the coverage of our capital ratios in all major currencies and, where necessary, adjusting our limits and exposure so that we remain within our risk appetite.
Growing legislative and regulatory pressure
With a business model based on a broad international presence through subsidiaries that maintain relevant market shares in our core geographies in which we operate, Grupo Santander is subject to different regulations. Our status as a global systemically important bank (G-SIB), implies higher capital requirements that could intensify due to new regulations or if supervisors revise current requirements (e.g. on the back of the recent crisis of some regional banks in the US).
New laws or extension of existing legislative measures, an increase in minimum capital requirements following supervisor review and assessment, or levies on credit institutions that impact on our business and relations with customer, could stymie profitability and return on equity, increase funding costs and undermine our resilience to economic disruption and ability to extend credit.
Any law or regulation could lead to new or stricter prudential requirements, especially in terms of capital and liquidity. This could have a direct impact on the Group's or our subsidiaries’ solvency and/or liquidity levels.
The key mitigation measures for this risk are:
•monitoring of initiatives included in the capital plan, in line with the continuous improvement of our regulatory models, as well as the mitigation of the possible impacts of Basel standards; and
457
•creation of multidisciplinary working groups in cooperation with banking associations, regulators and other stakeholders to anticipate possible outcomes of these measures.
Risk of suffering a severe cyber attack
International conflicts such as the Ukraine and Israel crises produced a worsening threat landscape. The growing cyber threat combined with the increasing reliance on digital systems, make cybersecurity one of Santander’s main priorities.
Therefore, we aim to become a cyber resilient organization that can resist, detect and rapidly respond to cyberattacks, while constantly enhancing our defences. To achieve this, we have a cyber risk oversight and control framework to measure the control environment and our risk profile.
For more details on the main cybersecurity risks, see 'Cyber risk' in section 6.2 ‘Operational risk management’.
To counter these threats, Santander counts with different initiatives described in section '5. Research, development and innovation (R&D&I)' on the 'Economic and financial review' chapter.
Risks related to Artificial Intelligence (AI)
Artificial Intelligence (AI) is the creation of intelligent systems through machines. These machines are able to operate with a certain degree of autonomy to generate predictions, recommendations, decisions and other outcomes that can impact on physical and virtual environments. Machine learning, deep learning and other AI analytical techniques have different levels of autonomy and complexity.
Banks have been using AI for several years to boost operational efficiency and strengthen risk management. In fact, they have been relying on AI to identify early warnings against money laundering, enhance customer experience, provide new insights for more rounded analysis, automate processes to reduce operational risk, and for other means.
The use of AI will become more widespread in the coming years, especially as new components like generative AI come to light. We must weigh up the benefits of AI and the oversight and control of using it, which also entails potential risks (complexity and explainability of results, biases, identification of accountability, data privacy, among others) that financial institutions will need to manage and mitigate to remain financially stable.
We are firmly committed to promoting the transformation of the financial sector through the responsible use of AI that prioritizes transparency and customer protection.
Central bank digital currencies (CBDC) and disintermediation risk
The possible launch of digital versions of fiduciary currencies issued by central banks (central bank digital currency — CBDC) could impact on financial stability if they replace traditional accounts, which in turn could affect commercial banks’ volume, structure and cost of lending.
An increasing number of central banks are exploring the possibility of issuing CBDC. Some are already running pilot projects to be prepared in case they consider at some point that its issuance is necessary. The focus of the political debate is above all on the versions aimed at the retail market that offer citizens a digital, central bank liability for payments. In the Eurozone, the ECB is making significant headway with the digital euro, which is in what is called the 'preparatory phase' since October 2023.
Depending on their design, CBDC could become the new standard of payments and bank deposits, which could lead to a disintermediation of the financial system. This could exacerbate financial instability in time of economic stress, if customers decide to convert euros in their bank deposits into digital euros, which may be perceived as more secure. A massive and disorderly adoption could also impact the financing of financial entities, which could have an impact on the financing of the economy. In addition, CBDC could replace other payment methods, which could have an impact on other business lines.
It is not clear what services and what business model banks and other payment providers will be able to provide based on these instruments. The final impact of CBDC will depend on their final design, in terms of the introduction of restrictions on remuneration and maximum holding amounts for citizens, as well as the use cases, infrastructure used and compensation model for intermediaries that they envisage. services. The benefits of CBDC, which are also unclear, will depend on each country or region’s particularities.
To mitigate CBDC risk, the Group:
•actively participates in the debate on CBDC with national and international authorities in order to explain the risks to financial stability and banks, and propose solutions to mitigate them;
•monitors central banks’ CBDC projects to analyse their impact on the business or the possibility of developing new services for our clients.
458
2. Risk management
and control model
and control model
Our risk management and control model is underpinned by common principles, a solid risk culture, a clear governance structure and advanced management processes on risk types
2.1 Risk principles and culture
Grupo Santander's risk management and control are based on these mandatory principles, which consider regulatory requirements and best market practices:
1.All employees are risk managers who must understand the risks associated with their functions and not assume risks that will exceed the Group’s risk appetite or have an unknown impact.
2.Senior managers must be involved to make sure we keep our risk profile within risk appetite, with consistent risk conduct, action, communications, and oversight of our risk culture.
3.Independence of risk management and control functions, according to our three lines of defence model (described in detail under section 2.3 'Risk and compliance governance').
4.We take a forward-looking, comprehensive approach for all businesses and risk types.
5.Effective information management to identify, assess, manage and disclose risks at appropriate levels.
Risk culture - Risk Pro
The Group's risk culture, which is called Risk Pro (or 'I AM RISK' in the UK and the US), is a core element of both our corporate culture, The Santander Way, and our purpose of helping people and businesses prosper.
Risk Pro is each employee’s accountability for the risks taken in their day to day and their individual contribution to identifying, assessing and managing risks properly and responsibly.
Risk Pro is part of all stages of the employee life cycle, so we ran training in the behaviors of our risk culture. Our performance review system, MyContribution, assigns all Santander employees a common risk objective.
In 2023, we continued rolling out our risk culture target operating model, which is based on the best practices identified in the different subsidiaries where we operate. Its main target is to consolidate the risk culture across the Group. We measure how risk cultures is embedded within the organization through YourVoice and other KPIs.
Throughout the year, with the aim of promoting our risk culture, we’ve celebrated our global Risk Pro Week to raise employees’ awareness of why they must manage risk in their day-to-day.
| For more details about Group's risk culture, see the section '1. Our culture' of the 'Responsible Banking' chapter. | ||||
2.2 Key risk types
Grupo Santander's risk classification is based on our corporate risk framework. It includes the following, which you can find out more about by clicking on the links provided:
 | | |||||||||||||||||||||||||||||||
| | |||||||||||||||||||||||||||||||
| | |||||||||||||||||||||||||||||||
| ||||||||||||||||||||||||||||||||

At Grupo Santander we consider that ESG (environmental, social and governance) risk factors can impact the types of risks that exist in different time horizons. Consequently, they must be identified, evaluated, managed and mitigated in accordance with regulatory requirements and market best practices.
459
2.3 Risk, compliance & conduct governance
Our risk, compliance & conduct governance structure pursues an effective oversight of every risk according to our risk appetite. It stands on three lines of defence, a clear committee structure and strong group-subsidiary relations guided by our risk culture, Risk Pro.
Lines of defence
Our model of three lines of defence effectively manages and controls risks:
1st | The business and support areas that take or originate risks are primarily responsible for managing them. The first line detects, measures, controls, monitors and reports on the risks it originates according to internal risk management policies, models and procedures. Risk management must be consistent with the approved risk appetite and related limits. | |||||||
2nd | The second line of defence, comprising the risk, compliance & conduct areas, independently oversees and challenges risk management at the first line of defence. Its duties include promoting that risks will be managed according to the risk appetite approved by senior management and strengthening our risk culture across the Group. | |||||||
3rd | The third line of defence, which is the Internal Audit area, is fully independent to give the board and senior management assurance of high-quality and efficient internal control, governance and risk management to preserve our value, solvency and reputation. | |||||||
Risk, compliance & conduct, and internal audit functions are sufficiently separate and independent from each other. Each function has direct access to the board and its committees. The risk, compliance and conduct functions report to the risk supervision, regulation and compliance committee and the internal audit function reports to the audit committee.
Risk, compliance & conduct committees' structure
Our risk and compliance & conduct governance aims to:
•facilitate effective and efficient decision-making on risks;
•oversee risk control; and
•check that we manage risks according to the risk appetite set by the Group and subsidiary boards of directors.
To achieve these aims, our risk, compliance & conduct governance keeps risk control and risk-taking separate.
Board level: |  Board of directors | |||||||||||||||||||||||||||||||||||||
Risk management | Risk control | |||||||||||||||||||||||||||||||||||||
 | Executive committee |  | Risk supervision, regulation and compliance committee | |||||||||||||||||||||||||||||||||||
Executive level: |  | Executive risk committee (ERC) |  | Risk control committee (RCC) | | Compliance and conduct committee | |||||||||||||||||||||||
Chair: | CEO | Group CRO | Group CCO | ||||||||||||||||||||||||||
Frequency: | Weekly | Monthly | Monthly | ||||||||||||||||||||||||||
Fora: | •Model approval forum •Risk proposal forum | •Market, structural, liquidity and capital risk control forum •Credit risk control forum •Provisions forum | •Corporate product governance forum •Financial crime compliance forum •Reputational risk forum | ||||||||||||||||||||||||||
460
The board of directors has final oversight of risk, compliance & conduct management and control to promote a sound risk culture and to review and approve risk appetite and policy, with support from its risk, regulation and compliance committee and its executive committee.
| For more details, see section 4.8 ‘Risk supervision, regulation and compliance committee activities in 2023’ on 'Corporate governance' chapter. | ||||
The Group chief risk officer (Group CRO), who leads the application and execution of our risk strategy and promotes proper risk culture, is in charge of overseeing all risks, as well as challenging and advising business lines on risk management.
The Group chief compliance officer (Group CCO) leads the application and execution of the compliance & conduct risk strategy and is in charge of overseeing the risks within their purview and reporting on them to the Group CRO.
The Group CRO and the Group CCO report directly to both the risk supervision, regulation and compliance committee and the board of directors.
The executive risk committee, the risk control committee and the compliance & conduct committee are executive committees with powers delegated from the board of directors.
Executive risk committee (ERC)
The ERC manages risk with board-given authority to accept, modify or escalate important models as well as actions and transactions that may pose significant risk to the Group. It makes the highest-level risk decisions, mindful of risk appetite. It is formed by the CEO and other senior managers from the Risk, Finance and Compliance & Conduct areas. The Group CRO can veto the committee’s resolutions.
Risk control committee (RCC)
The RCC controls and provides a holistic overview of risks. It makes sure business lines are managed according to the board-approved risk appetite. It also determines and checks the impact of existing and emerging risks on Grupo Santander's risk profile. It is formed of senior officers from the Risk, Compliance & Conduct, Finance and Management control, and other areas. From time to time, subsidiary-level CROs to report to the committee on risk profile.
Compliance & conduct committee
The committee monitors and reviews compliance & conduct risk management. It also oversees corrective measures for new risks and risks detected among management-related deficiencies. It is formed of senior officers from the compliance & conduct, risk, accounting and management control, and other areas. The chair holds the casting vote over the committee’s resolutions.
Executive-level committees delegate some duties to management and control fora and meetings (see chart above) that:
•inform the Group CRO, the Group CCO, the risk control committee, and the compliance and control committee if risks are being managed within risk appetite;
•regularly monitor each key risk type; and
•oversee measures to meet supervisors and auditors’ expectations.
The risk and compliance & conduct functions' internal regulation effectively creates the right environment to manage and control all risk types.
Grupo Santander can establish additional governance measures for special situations, as it has done with the covid crisis, the war in Ukraine, the uncertainty caused by the collapse of several regional banks in the US and Credit Suisse, and the current geopolitical situation. We have upgraded the monitoring of all risks, with special attention to the main macroeconomic indicators, liquidity, vulnerable sectors and clients, cybersecurity reinforcement, among other areas. The special situations forums we have activated are enabling us to cope with the geopolitical and macroeconomic environment in a resilient manner.
The Group’s relationship with its subsidiaries
Grupo Santander subsidiaries’ risk, compliance & conduct management and control model is consistent with the frameworks approved by the Group board of directors. Subsidiaries adhere to the frameworks through their own boards and can only adapt to higher standards according to local law and regulation. As part of our aggregate risk oversight, we challenge and ratify subsidiaries’ internal regulation and transactions to create a common risk management and control model across the Group.
The risk, compliance & conduct functions will continue to support the businesses and oversee risk control both globally and locally. We continued to build on our group-subsidiary relations model by leveraging our global scale to uncover synergy under a common operating model and platform. The model promotes process simplification and more enhanced control to help grow the business.
The Group CRO, the Group CCO and regional heads of risk are involved in appointing, setting objectives for, reviewing and compensating their country-unit counterparts to evaluating that risks are adequately controlled.
Each subsidiary's CRO/CCO interacts regularly with the regional head of risk, the Group CRO and the Group CCO in country control meetings. Local and global risk, compliance & conduct functions also hold meetings to address specific matters.
Our subsidiaries cooperate to effectively strengthen group-subsidiary relations through these common initiatives:
•evolution of organizational structures based on subsidiary benchmarks and strategic vision to promote more advanced risk management infrastructures and practices;
•exchange of best practices that will strengthen processes, drive innovation and result in a quantitative impact;
•search for talent in risk and compliance teams with internal mobility through the global risk talent programme and strong succession plans.
| For more details on our relationship with our subsidiaries, see section 7. ‘Group structure and internal governance’ of the 'Corporate Governance' chapter. | ||||
461
2.4 Risk management processes and tools
In the following section, we describe Grupo Santander's processes and tools to carry out effective risk management.
Risk appetite and structure of limits
Risk appetite is the aggregate level and types of risk we deem prudent for our business strategy, even in unforeseen circumstances.
The risk appetite is expressed through qualitative statements and quantitative limits and metrics representative of the bank’s risk profile. Those metrics cover all key risk types according to our corporate risk framework. We articulate them in five axes that provide us with a holistic view of all risks we incur in the development of our business model:
| Key risks | ||||||||||||||||||||||||||||||||||||||||||||||||||||||||
| Risk Appetite axes | Credit risk | Market risk | Liquidity risk | Structural risk | Operat. risk | Financial Crime Risk | Model risk | Reputat. risk | Strategic risk | |||||||||||||||||||||||||||||||||||||||||||||||
| P&L volatility | Control of P&L volatility associated with business plan under baseline and stressed conditions | |||||||||||||||||||||||||||||||||||||||||||||||||||||||
| Solvency | Control of capital ratios under baseline and stressed scenarios (aligned with ICAAP) | |||||||||||||||||||||||||||||||||||||||||||||||||||||||
| Liquidity | Control of liquidity ratios under base and stress scenarios (aligned with ILAAP) | |||||||||||||||||||||||||||||||||||||||||||||||||||||||
| Concentration | Control of concentration levels in customers, sectors and portfolios | |||||||||||||||||||||||||||||||||||||||||||||||||||||||
| Non financial risks | Solid controls on non financial risks aimed to minimize financial, operative, technological losses, as well as legal and regulatory breaches, and conduct events or reputational damage | |||||||||||||||||||||||||||||||||||||||||||||||||||||||
Our risk appetite and business model rests on:
•a medium-low, predictable target risk profile, centred on retail & commercial banking, internationally diversified operations and a significant market share;
•stable, recurrent earnings and shareholder remuneration, sustained by a sound base of capital, liquidity and sources of funding;
•autonomous subsidiaries that are self-sufficient in terms of capital and liquidity to safeguard their risk profiles against compromising the Group’s solvency;
•an independent risk function and a senior management actively engaged in supporting a robust control environment and risk culture; and
•a conduct model that protects our customers and our Simple, Personal and Fair culture.
Risk appetite is governed throughout the Group by the following principles:
•Risk appetite is part of the board's duties. It prepares the risk appetite statement (RAS) for the whole Group every year. In a cascading down process, each subsidiary's board also sets its own risk appetite.
•Comprehensiveness and forward-looking approach. Our appetite includes of all material risks that we are exposed to and defines our target risk profile for the current and medium term with a forward-looking view considering stress scenarios.
To promote that all material risks are adequately represented, we use corporate methodologies to identify and assess the risk to which we are exposed to, in the different counties, and are inherent to our activities (emerging risks and risk control self-assessment — RCSA— among others).
| For more details on these exercises see sections ‘Management and control model’ 6.2 Operational risk management' and '1.2 Emerging risks'. | ||||
•Common standards embedded in the day-to-day risk management. The Group shares the same risk appetite model, which sets common requirements for processes, metrics, governance bodies, controls and standards. It also facilitates an effective and traceable embedding of our appetite into more granular management policies and limits across our subsidiaries.
•Continuous adaptation to market best practices, regulatory requirements and supervisors’ expectations.
462
•Aligning with business plans and strategy. The risk appetite is a key point of reference for strategic and business planning. We verify that the three-year strategic plans, the annual budget, and capital and liquidity planning are within the limits set in the RAS before we approve them.
| RAS (Risk appetite statement and limits) | ||||||||||||||||||||||||||||||||||||||
| Group's RAS | ||||||||||||||||||||||||||||||||||||||
| RAS Unit 1 | RAS Unit 2 | RAS Unit n | ||||||||||||||||||||||||||||||||||||
| RAS embedding (Management limits) | ||||||||||||||||||||||||||||||||||||||
| Global limits & policies | Risk limits & policies Unit 1 | Risk limits & policies Unit 2 | Risk limits & policies Unit n | |||||||||||||||||||||||||||||||||||
We promote that strategic and business plans are aligned with our risk appetite by:
•considering the risk appetite, long-term strategic view and the risk culture when drafting strategic and business plans.
•challenging business and strategic plans against the risk appetite. Misalignments trigger a review of either the three-year strategic plan (to make sure we stay within RAS limits) or risk appetite limits, with independent governance.
•control through the three lines of defence model that the risk appetite limits are subject to periodic oversight and that the specialized control functions report on risk profile and compliance with limits to the board and its committees every month.
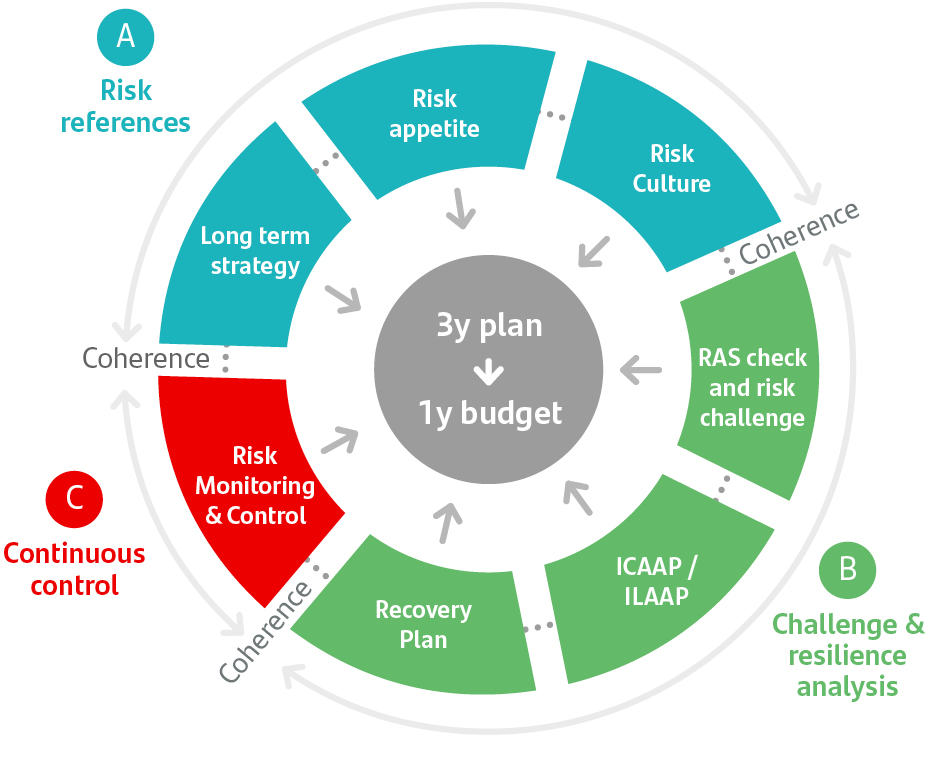
Risk profile assessment (RPA)
Identification and assessment are crucial to managing, controlling and reporting on risks properly. Our risk profile assessment (RPA) covers the Group’s internal and external risks and vulnerabilities and measures their quantitative and qualitative materiality. Our risk framework outlines all material risk types that stem from the Group’s core risk assessments.
We systematically evaluate the risk profile of the Group and its subsidiaries using a single RPA methodology based on the core principles of our risk identification and assessment model: area-level accountability, efficiency, common methodology, comprehensive risk coverage, materiality, and guidance on corrective action and mitigation.
Under the RPA methodology, we calculate risk profiles based on a points system of 'low', 'medium-low', 'medium-high' and 'high' to make sure the board-approved risk appetite remains within a medium-low, predictable risk profile. In addition, it allows a holistic view of all risks at a given moment in time, pinpointing weaknesses in our risk management and deviations from our business plan to take corrective action. It showcases our prudent risk management that translates to solid solvency ratios and comfortable levels of liquidity.
Our risk profile considers these factors:
•Risk type, where we measure exposure under base and stressed scenarios through risk appetite and 'top of the house' metrics and internationally recognized, internal and best practice indicators.
•Group/Subsidiaries, which gives an aggregated view of risks to the Group and its subsidiaries, as well as threats that may impact on business planning and strategic objectives.
The Group's target is to maintain a medium-low risk profile, despite market volatility, a gradual drop in inflation (which remains high) and ongoing geopolitical tension. Our cautious and proactive management led to strong profitability and credit quality indicators, and a robust liquidity risk profile.
Scenario analysis
Scenario analyses enable us to measure the resilience of our balance sheet and our capital adequacy under stressful conditions. The findings of these analyses are used to review our risk appetite and draw up actions to mitigate expected losses or, if needed, to reduce capital and liquidity.
Scenario analyses also enable senior management to comprehend the nature and scope of the vulnerabilities to which the Group is exposed to in the development of its business plan.
Our Research department plays a key role in determining scenarios, macroeconomic variables and other factors that can affect our risk profile in our markets.
463
We conduct a systematic review of our risk exposure under base, adverse and favourable scenarios that predict an impact on solvency and liquidity. These exercises are fundamental to our processes:
•Regulatory exercises based on instructions from EU and domestic supervisors.
•Business planning to help set the Group’s risk strategy and profile, with:
•internal capital and liquidity adequacy assessment processes (ICAAP and ILAAP) that measure capital and liquidity in various scenarios;
•budget and strategic planning when implementing a new risk approval policy, in evaluating the risk profile or when monitoring specific portfolios and business lines;
•our annual recovery plan, which specifies which tools Grupo Santander could use to survive a severe financial crisis. The plan’s financial and macroeconomic stress scenarios have various levels of severity, plus idiosyncratic and/or systemic events; and
•risk appetite, with stressed metrics to determine how much risk we want to expose ourselves to.
•Recurrent risk management also uses scenario analyses for:
•provisions estimates: involve a value correction of credit operations for those existing or prospective risk factors that have not been considered in the initial approval and rating process, both for individual customers and for total portfolio;
•regular credit and market risk stress tests that simulate changes in expected losses to estimate required capital and absorb unexpected losses; and
| For more details on scenario analysis, see sections 3.2 ‘Credit risk management', 4.2 ‘Market risk management’ and 4.6 'Liquidity risk management' and section 'Expected loss estimation' in Note 54 to the consolidated financial statement. | ||||
•climate change scenario analysis, with the Network for Greening the Financial System (NGFS) & Representative Concentration Pathways (RCP) scenarios and others that we’ve created to calculate the impact of climate change.
To make stress testing more consistent and robust:
•Our three lines of defence and senior management are involved in scenario analysis governance and oversight.
•The models we develop estimate future metric values (e.g. credit losses).
•Our backtesting and reverse stress exercises challenge model outcomes regularly.
•Our teams contribute expert opinions and a vast understanding of portfolios.
•And we thoroughly monitor models, scenarios, assumptions, results and mitigating management measures.
Against a backdrop of high inflation, record interest rate hikes by central banks, banking sector volatility, armed conflict in Ukraine and the Middle East, initial signs of weak demand for credit, and uncertainty and mistrust in the financial system due to several events in early 2023, scenario analyses were key to pinpointing and managing potential impacts of those events on our portfolios.
We boosted our foresight by drawing up action points, adapting our strategy to maintain solvency levels and considering our more vulnerable customers due to the macroeconomic landscape.
We continued to build up our analysis of potential losses to the highest level of granularity by enhancing our sector-level methodology and projection tool based on the resilience of each company’s financial statements to different macroeconomic scenarios. We considered their pledge to meet energy commitments through possible transition plans by quantifying impacts under the assumptions of an orderly, disorderly or non-existent transition to be able to keep our management of the portfolio one step ahead.
Moreover, we conducted sensitivity analysis on retail customers’ creditworthiness, with special focus on our mortgage portfolio. The analysis considered several interest rate hike scenarios to propose relief and mitigation measures for the most vulnerable customers.
Risk reporting structure
Senior management gets regular reporting from the Enterprise-wide risk management team on current and future risks so it can remain abreast of our risk profile and exercise sound decision-making. Reporting is dynamic, such that all significant risks are prioritized in a timely and appropriate manner.
Our reports cover every risk included in our corporate risk framework, with all necessary considerations for their proper risk assessment. They also provide a consolidated view of all risks, maintaining the information quality and consistency according to our corporate data framework.
Our risk reporting structure continues to strike a balance between data, analysis and qualitative commentary, incorporating forward-looking measures, risk appetite information and limits, and emerging risks.
We continue to enhance our reporting with simpler, automated processes and tighter controls that adapt to new needs. In 2023, we reported and monitored all the impacts of ongoing armed conflicts; escalated cases of risk from macroeconomic and geopolitical volatility; and paid close attention to every emerging risk that could have a direct or indirect impact on the Group.
464
3. Credit risk
3.1 Introduction
Credit risk is the risk of financial loss when a customer or counterparty whom Santander has financed or has a contractual obligation with defaults or loses creditworthiness. It includes counterparty risk, country risk and sovereign risk and generates the most exposure and capital consumption.
3.2 Credit risk management
We take a holistic view of the credit risk cycle, including the transaction, the customer and the portfolio to identify, analyse and make decisions about credit risk.
Credit risk identification facilitates active and effective portfolio management. We classify external and internal risk in each business to adopt any corrective or mitigating measures through:
Planning Our planning helps us set business targets and draw up action plans within our risk appetite statement. Strategic commercial plans (SCPs) are a risk management and control tool the business and risk areas prepare for our credit portfolios. They determine commercial strategies, risk policies, resources and infrastructure, to have a holistic view of portfolios. | Risk assessment and credit rating Risk approval generally depends on the applicant’s ability to repay the debt, regardless of any collateral or personal guarantees we require. We review their regular sources of income, including funds and net cash flows from any businesses. Our credit quality assessment models are based on the credit rating engines for each of our segments, which we monitor to calibrate and adjust the decisions and ratings they assign. | |||||||||||||||||||||||||
 | ||||||||||||||||||||||||||
Collections and recoveries The Collections & Recoveries area draws up a strategy based on local economic conditions, business models and other recovery-related particulars. For effective and efficient recoveries management, the area segments customers based on certain aspects, using new digital channels that help create sustainable value. | Scenario analysis Scenario analyses determine potential risks in credit portfolios; give us a better understanding of their performance under various macroeconomic conditions; and enable us to employ management strategies that will avoid future deviations from set plans and targets. | |||||||||||||||||||||||||
Mitigation techniques We generally approve risk according to a borrower’s ability to make due payment, regardless of any additional collateral or personal guarantees we may require. We always consider guarantees or collateral as a reinforcement measure in a credit transaction to mitigate a loss if the borrower defaults on their payment obligation. | Monitoring Our holistic, regular monitoring allows us to track credit quality, spot risk trends early and check credit performance against original targets based on a system that helps us determine monitoring levels, policies and special measures for each customer. | |||||||||||||||||||||||||
| For more details see section 'Credit risk management', in Note 54 to the consolidated financial statement | ||||
465
ATOMiC: Advanced Target Operating Model in Collaboration
Since its launch, the ATOMiC has transformed credit risk management as we continue to work on daily business operations as part of our credit risk strategy.
It enables us to continue strengthening our control environment and our ability to anticipate and handle uncertainty caused by complex, unforeseen events like geopolitical conflict and social and economic instability, and adapt to new regulation from recent years.
In 2023, we bolstered our credit risk strategy to help us achieve sustainable and profitable growth. We continued to make headway in digitalization and innovation with the goal of achieving prudent growth. We focused on monitoring portfolio profitability and capital targets with a forward-looking approach in view of the macroeconomic landscape. We also supported the development of the Group’s new global businesses, and embedded environmental, social and climate change (ESCC) risk in credit risk management.
Everything we do is consistent with the Group’s strategic principles:
•Think Value: Adding value by simplifying credit risk procedures through enhanced automation and digitalization, which enables us to continue refining our customer response times, Net Promoter Score (NPS) and other KPIs.
•Think Customer: Keeping the customer at the core of our credit risk strategy by promoting flexible limits and quick response, improving decision-making, maintaining focus on the quality of collections and recoveries, and supporting business areas’ growth.
•Think Global: Working as a global team to adapt better and faster to change, as well as sharing knowledge and best practice among internal talent and networks of Group experts and harnessing the benefits of being a multinational organization.
As a 'living' strategy, it is reviewed and updated annually. In 2023, the Group drew up initiatives in subsidiaries that helped (and will continue to help) drive faster transformation and innovation and tackle new challenges with ATOMiC Pro.
We based these initiatives on four levers we consider vital to their success:
i.advanced target operating models (updated TOMs);
ii.business success case studies (SCS) that help us understand best practices implemented in the Group;
iii.KPIs: metrics that help measure the contribution and impacts of ATOMiC on credit portfolios (including the percentage of automated decisions, time-to-yes, percentage of customers with pre-approved limits); and
iv.local transformational initiatives that promote faster implementation of the strategic lines of credit risk in the Group and are subject to specific KPIs.
Local credit risk strategies are defined based on the starting situation of each country, its budgetary needs and readjusting global objectives to their own reality and particularities. These local strategies therefore jointly build the Group's ambition and credit strategy. ATOMIC enables us to be better prepared for unexpected events, as we constantly strengthen our control framework in terms of:
•risk appetite limits and risk profile;
•credit risk management based on analytical models and automation;
•forward-looking metrics and concentration limits per customer and sector;
•measures that help determine in advance the risk policies and actions to be implemented with clusters of customers in view of the environment (playbooks);
•specific measures for each segment, from individuals to large corporates, such as sectoral exercises with new macroeconomic scenarios, and review of admission cut-off scores; and
•enhanced forecasting, proactive monitoring and recovery management by the Collections and Recoveries area.
3.3 Key metrics
2023 overview
In 2023, the global macroeconomic landscape continued to be affected by inflation — which did, however, begin to gradually decline due to monetary policy. Grupo Santander’s performance was largely affected by official interest rate hikes in our markets. We had to make credit risk control processes more forward-looking to be ready for future shifts.
Though lending margins benefited from interest rate hikes, the financial industry is facing increasing headwinds related to lower loan demand, which is cooling rapidly; lower credit quality with higher credit risk in portfolios; and a potential increase in credit losses due to customers having less disposable income.
Our geographical diversification also enables us to tackle the challenging landscape as our markets are at different stages of the economic cycle. Our credit risk maintained a strong, diversified balance of mature and emerging markets: Europe1 (55%), North America (17%), South America (16%) and DCB (12%).
As at December 2023, credit risk with customers climbed 1% from 2022 (0.8% in constant euros). Increases in Brazil and Mexico (backed by appreciating currency) and in DCB drove the Group’s credit risk upwards; however, this was partially offset by a drop in the credit portfolio in our core units in Europe due to early repayment of mortgages.
Lower credit portfolio growth, coupled with an increase in impaired credit assets to 35,620 million euros (up 2.7% on 2022), caused the NPL ratio to rise to 3.14% (+6 bps from 2022). The main increases in impaired credit assets were in
1 'Others' not included make up the remaining 0.4% (Corporate Centre).
466
North America, the United Kingdom, Poland and DCB, offset by decreases in the rest of Europe and South America.
The Group recognized loan-loss provisions of EUR 12,458 million (up 19% compared to 2022) in compliance with IFRS 9, driven by the provisions made in the US (normalization of the Auto portfolio), DCB (due to portfolio growth), Mexico (driven by loan loss provision normalization and growth in loans to individuals) and Poland (related to Swiss Franc mortgages). Our credit profile in the different markets remained good.
Loan-loss reserves totalled EUR 23,490 million. Our NPL coverage ratio decrease to 65.9% (down 1.6 pp on 2022). To understand this coverage ratio, we must consider that mortgages to individuals made up approximately 30% of net customer loans as at December 2023. By and large, these mortgages are found in Spain and the UK and consist of low-risk home mortgages, with low NPL ratios and fewer losses.
Grupo Santander has adopted the measures proposed by the governments of Spain, the UK, Portugal and Poland to ease the burden that interest rate hikes place on vulnerable customers with mortgages. Such measures include extending mortgage terms to bring down payments to levels that customers can afford, in addition to the measures we had in place already.
The Group continuously monitors the government liquidity programs that were launched during the pandemic, where Spain constitutes the majority. 99% of the grace periods have expired, showing positive behaviour with no signs of deterioration.
467
The tables below show key customer credit risk metrics:
Main credit risk metricsA | |||||||||||||||||||||||||||||||||||
| Data as of 31 December | |||||||||||||||||||||||||||||||||||
Credit risk with customersB (EUR million) | Impaired loans (EUR million) | NPL ratio (%) | |||||||||||||||||||||||||||||||||
| 2023 | 2022 | 2021 | 2023 | 2022 | 2021 | 2023 | 2022 | 2021 | |||||||||||||||||||||||||||
| Europe | 624,696 | 639,996 | 636,123 | 14,495 | 15,186 | 19,822 | 2.32 | 2.37 | 3.12 | ||||||||||||||||||||||||||
| Spain | 278,569 | 293,197 | 283,953 | 8,529 | 9,598 | 13,403 | 3.06 | 3.27 | 4.72 | ||||||||||||||||||||||||||
| UK | 247,360 | 253,455 | 262,869 | 3,518 | 3,059 | 3,766 | 1.42 | 1.21 | 1.43 | ||||||||||||||||||||||||||
| Portugal | 39,503 | 41,755 | 41,941 | 1,024 | 1,247 | 1,442 | 2.59 | 2.99 | 3.44 | ||||||||||||||||||||||||||
| Poland | 39,329 | 33,350 | 33,497 | 1,397 | 1,268 | 1,210 | 3.55 | 3.80 | 3.61 | ||||||||||||||||||||||||||
| North America | 190,720 | 185,614 | 149,792 | 7,805 | 5,629 | 3,632 | 4.09 | 3.03 | 2.42 | ||||||||||||||||||||||||||
| US | 137,893 | 140,452 | 112,808 | 6,303 | 4,571 | 2,624 | 4.57 | 3.25 | 2.33 | ||||||||||||||||||||||||||
| Mexico | 52,785 | 45,107 | 36,984 | 1,489 | 1,047 | 1,009 | 2.82 | 2.32 | 2.73 | ||||||||||||||||||||||||||
| South America | 177,380 | 167,348 | 141,874 | 10,142 | 10,381 | 6,387 | 5.72 | 6.20 | 4.50 | ||||||||||||||||||||||||||
| Brazil | 113,937 | 101,801 | 85,702 | 7,479 | 7,705 | 4,182 | 6.56 | 7.57 | 4.88 | ||||||||||||||||||||||||||
| Chile | 46,565 | 47,811 | 41,479 | 2,332 | 2,384 | 1,838 | 5.01 | 4.99 | 4.43 | ||||||||||||||||||||||||||
| Argentina | 3,903 | 5,844 | 5,481 | 78 | 122 | 198 | 1.99 | 2.08 | 3.61 | ||||||||||||||||||||||||||
| Digital Consumer Bank | 135,608 | 125,339 | 116,989 | 2,877 | 2,583 | 2,490 | 2.12 | 2.06 | 2.13 | ||||||||||||||||||||||||||
| Corporate Centre | 5,494 | 5,824 | 6,337 | 301 | 894 | 903 | 5.48 | 15.35 | 14.38 | ||||||||||||||||||||||||||
| Total Group | 1,133,898 | 1,124,121 | 1,051,114 | 35,620 | 34,673 | 33,234 | 3.14 | 3.08 | 3.16 | ||||||||||||||||||||||||||
| NPL coverage ratio (%) | Loan-loss provisions C (EUR million) | Cost of risk (%/risk)D | |||||||||||||||||||||||||||||||||
| 2023 | 2022 | 2021 | 2023 | 2022 | 2021 | 2023 | 2022 | 2021 | |||||||||||||||||||||||||||
| Europe | 49.3 | 51.8 | 49.4 | 2,533 | 2,396 | 2,293 | 0.44 | 0.39 | 0.39 | ||||||||||||||||||||||||||
| Spain | 49.1 | 51.0 | 51.4 | 1,522 | 1,618 | 2,320 | 0.62 | 0.61 | 0.92 | ||||||||||||||||||||||||||
| UK | 30.3 | 33.8 | 25.8 | 247 | 316 | -245 | 0.10 | 0.12 | (0.09) | ||||||||||||||||||||||||||
| Portugal | 82.7 | 79.3 | 71.7 | 77 | 17 | 38 | 0.20 | 0.04 | 0.09 | ||||||||||||||||||||||||||
| Poland | 73.3 | 74.0 | 73.9 | 674 | 440 | 200 | 2.08 | 1.43 | 0.67 | ||||||||||||||||||||||||||
| North America | 73.8 | 93.3 | 134.9 | 3,733 | 2,538 | 1,210 | 2.05 | 1.49 | 0.93 | ||||||||||||||||||||||||||
| US | 67.7 | 90.3 | 150.3 | 2,593 | 1,744 | 419 | 1.92 | 1.35 | 0.43 | ||||||||||||||||||||||||||
| Mexico | 100.0 | 106.6 | 95.0 | 1,135 | 788 | 791 | 2.43 | 1.95 | 2.44 | ||||||||||||||||||||||||||
| South America | 78.4 | 76.0 | 98.3 | 5,401 | 5,041 | 3,251 | 3.36 | 3.32 | 2.60 | ||||||||||||||||||||||||||
| Brazil | 84.7 | 79.5 | 111.2 | 4,701 | 4,417 | 2,715 | 4.77 | 4.79 | 3.73 | ||||||||||||||||||||||||||
| Chile | 52.7 | 56.3 | 63.3 | 365 | 399 | 341 | 0.80 | 0.93 | 0.85 | ||||||||||||||||||||||||||
| Argentina | 165.7 | 180.4 | 153.8 | 150 | 132 | 140 | 6.64 | 2.91 | 3.01 | ||||||||||||||||||||||||||
| Digital Consumer Bank | 88.0 | 92.8 | 107.8 | 792 | 544 | 527 | 0.62 | 0.45 | 0.46 | ||||||||||||||||||||||||||
| Corporate Centre | 32.8 | 1.5 | 3.6 | (2) | -10 | 155 | (0.04) | (0.14) | 2.45 | ||||||||||||||||||||||||||
| Total Group | 65.9 | 67.5 | 71.3 | 12,458 | 10,509 | 7,436 | 1.18 | 0.99 | 0.77 | ||||||||||||||||||||||||||
A. Management perimeter according to the reported segments.
B. Includes gross loans and advances to customers, guarantees and documentary credits.
C. Post write-off recoveries (EUR 1,592 million).
D. Provisions to cover losses due to impairment of loans in the last 12 months / average customer loans and advances of the last 12 months.
| For more details on the main subsidiaries see section 'Detail of the main geographical areas' in Note 54 of the consolidated accounts. | ||||
From 1Q'24 (inclusive), Grupo Santander's financial information will reflect changes in the segments we report on, as a result of its new structure/business model. Risk disclosures will also follow these new criteria.
468
Reconciliation of key figures
Santander’s 2023 consolidated financial statements disclose loans and advances to customers before and after loan-loss reserves. Credit risk with customers also includes off-balance sheet risk or contingent liabilities. This table shows the relationship between those concepts:
Gross credit risk with customersA | ||||||||||||||||||||||||||
| 1,133,898 | ||||||||||||||||||||||||||
Gross credit risk with customers | = | Gross loans and advances to customers & others 1,059,137 | + | Contingent liabilities | ||||||||||||||||||||||
| 1,133,898 | 74,761 | |||||||||||||||||||||||||
Loans and advances to customers(Gross) | = | Financial assets measured at amortised cost (Gross)B | + | Financial assets held for tradingB | + | Financial assets at fair value (Gross)B | ||||||||||||||||||||
| 1,059,137 | 1,032,511 | 11,634 | 14,992 | |||||||||||||||||||||||
Loan-loss reserves | = | Loan-loss reserves | + | Loan-loss reserves | ||||||||||||||||||||||
| -22,788 | -22,666 | -122 | ||||||||||||||||||||||||
Net loans and advances to customers | = | Net financial assets measured at amortised cost | + | Financial assets held for trading | + | Net financial assets at fair value | ||||||||||||||||||||
| 1,036,349 | 1,009,845 | 11,634 | 14,870 | |||||||||||||||||||||||
Net loans and advances to customers | ||||||||||||||||||||||||||
| 1,036,349 | ||||||||||||||||||||||||||
A. Includes gross loans and advances to customers, guarantees and documentary credits.
B. Before loan-loss allowances.
Distribution by market and segment
Santander organizes its credit risk function around three customer groups:
•Individuals: All natural persons that are not self-employed individuals, subdivided by income level to manage risk properly by customer type.
•SMEs, corporates and institutions: Companies and self-employed individuals, state-owned entities and private not-for-profit organizations.
•Large corporates: Corporate customers, financial institutions and sovereigns, which make up a closed list that is revised annually. This list is determined through a complete analysis of the customer (business type, geographic diversification, product types used, volume of income it represents for Santander, among others).
The graph below breaks down credit risk (including gross loans and advances to customers, guarantees and letters of credit):
| Credit risk distribution | ||
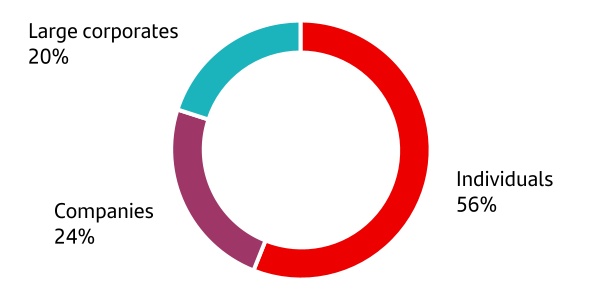
469
Below is a breakdown of performing loans and credit impaired by region and segment:
| Total | ||
| Total | ||
| Eur Mn | ||
| 1,133,898 | ||
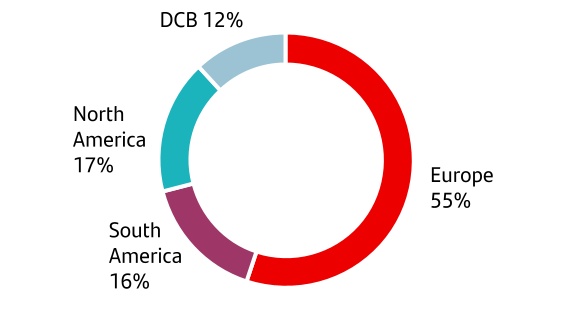
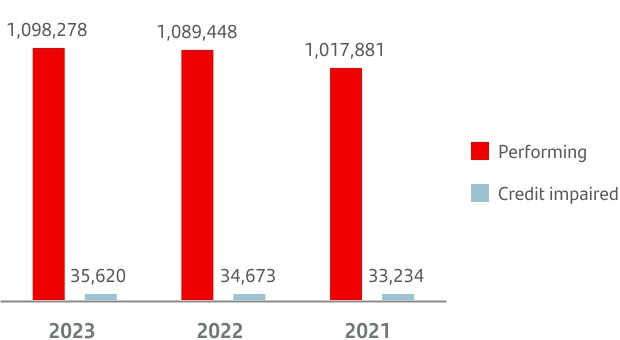
| Segments | ||
 | Individuals | ||||||||||
| Eur Mn | 634,455 | ||||||||||
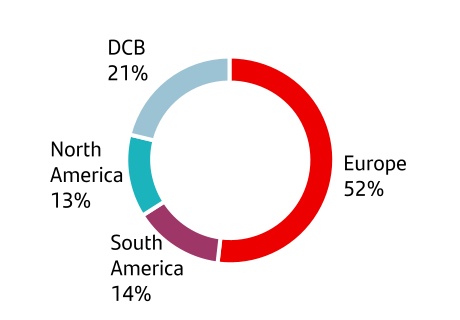
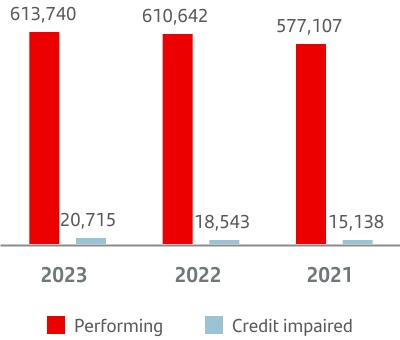
 | SME, Commercial Banking and Institutions | ||||||||||
| Eur Mn | 277,234 | ||||||||||
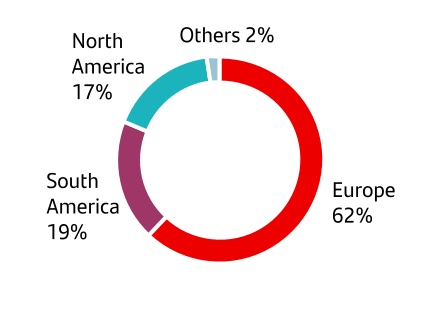
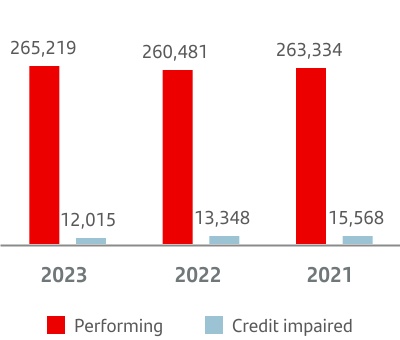
| Large Corporates | ||||||||||
| Eur Mn | 222,209 | ||||||||||
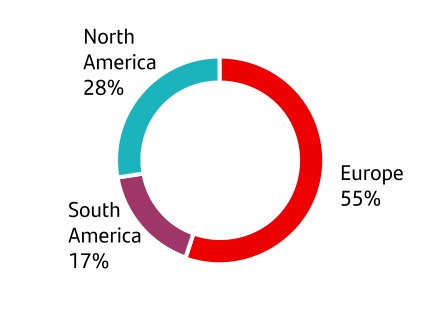
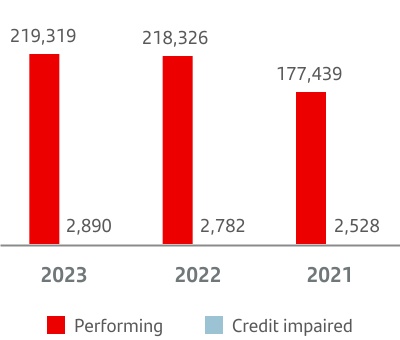
'Others' include Corporate Centre.
•Europe: The NPL ratio fell 5 bps to 2.32% from 2022, due to a significant reduction in impaired loans in Spain and Portugal on the back of portfolio sales.
•North America: The NPL ratio climbed 106 bps to 4.09% from 2022, mainly because the increase in SC USA (normalisation of the portfolio) and in Mexico (portfolio growth in higher return-risk segment).
•South America: The NPL ratio fell 48 bps to 5.72% from 2022, due to the portfolio growth in Brazil and the performance of the Chilean portfolio.
•Digital Consumer Bank: The NPL ratio climbed 6 bps to 2.12% due to a slight increase in impaired loans, not offset by portfolio growth.
470
Financial asset impairment
The IFRS 9 impairment model applies to financial assets valued at amortized cost; debt instruments valued at fair value with changes in other comprehensive income; leasing receivables; and commitments and guarantees not measured at fair value.
The portfolio of IFRS 9 financial instruments is split according to three credit risk stages:
Observed credit risk impairment since the initial recognition of the financial instrument | |||||
 | ||
| Risk category | Stage 1 | Stage 2 | Stage 3 | ||||||||
| Classification criteria | Financial instruments with no significant increase in risk since initial recognition. | Financial instruments with a significant credit risk increase since initial recognition but with no materialized impairment event. | Financial instruments with true signs of impairment as a result of one or more events resulting in a loss. | ||||||||
| Provisions recognised | The impairment provision reflects expected credit losses from defaults over 12 months from the reporting date. | The impairment provision reflects expected losses from defaults over the financial instrument’s residual life. | The impairment provision reflects expected losses from defaults over the financial instrument’s residual life. In this stage, the calculation considers that loss events have already occurred and, therefore, the only possible scenario is that they will materialize in losses. | ||||||||
Impairment provisions include expected credit risk losses over the expected residual life of purchased or originated credit impaired (POCI) financial instruments.
The following table shows credit risk exposure by stage and geography:
Exposure by stage and geographyA | ||||||||||||||
EUR million. Dec.23 | ||||||||||||||
| Stage 1 | Stage 2 | Stage 3 | Total | |||||||||||
| Europe | 531,686 | 48,215 | 14,495 | 594,396 | ||||||||||
| Spain | 235,757 | 16,141 | 8,529 | 260,426 | ||||||||||
| UK | 205,707 | 26,118 | 3,518 | 235,344 | ||||||||||
| Portugal | 34,489 | 3,990 | 1,024 | 39,503 | ||||||||||
| Poland | 35,906 | 1,907 | 1,397 | 39,209 | ||||||||||
| North America | 152,026 | 11,861 | 7,805 | 171,692 | ||||||||||
| US | 103,811 | 9,377 | 6,303 | 119,490 | ||||||||||
| Mexico | 48,191 | 2,484 | 1,489 | 52,164 | ||||||||||
| South America | 152,964 | 13,726 | 10,142 | 176,832 | ||||||||||
| Brazil | 96,799 | 9,130 | 7,479 | 113,408 | ||||||||||
| Chile | 40,198 | 4,033 | 2,332 | 46,562 | ||||||||||
| Argentina | 3,469 | 357 | 78 | 3,903 | ||||||||||
| Digital Consumer Bank | 128,145 | 4,569 | 2,877 | 135,591 | ||||||||||
| Corporate Centre | 3,930 | 934 | 301 | 5,165 | ||||||||||
| Total Group | 968,751 | 79,305 | 35,620 | 1,083,676 | ||||||||||
A. Does not include EUR 31,396 million in temporary purchases of stage 1 assets, nor EUR 18.826 million in unimpaired risk.
Stage 3 financial instruments (showing impairment) performed as follows:
2021 - 2023 Impaired credit assets | |||||||||||
| EUR million | |||||||||||
| 2023 | 2022 | 2021 | |||||||||
| Start of period | 34,673 | 33,234 | 31,767 | ||||||||
| Net entries | 14,658 | 13,257 | 10,027 | ||||||||
| Perimeter | (59) | — | — | ||||||||
| FX and others | 195 | 417 | 529 | ||||||||
| Write-off | (13,847) | (12,235) | (9,089) | ||||||||
| End of period | 35,620 | 34,673 | 33,234 | ||||||||
2021 - 2023 loan loss reserves | |||||||||||
| EUR million | |||||||||||
| 2023 | 2022 | 2021 | |||||||||
Start of period | 23,418 | 23,698 | 24,271 | ||||||||
| Stage 1 and 2 | 9,272 | 9,983 | 10,491 | ||||||||
| Stage 3 | 14,146 | 13,714 | 13,780 | ||||||||
| Gross provision for impaired assets and write-downs | 13,524 | 11,665 | 8,824 | ||||||||
| Provision for other assets | 526 | 305 | (6) | ||||||||
| FX and other | (132) | (14) | (303) | ||||||||
| Write-off | (13,847) | (12,235) | (9,089) | ||||||||
End of period | 23,490 | 23,418 | 23,698 | ||||||||
| Stage 1 and 2 | 9,026 | 9,272 | 9,983 | ||||||||
| Stage 3 | 14,464 | 14,146 | 13,714 | ||||||||
471
We quantify expected losses from credit events using an unbiased, weighted consideration of up to five future scenarios that could affect our ability to collect contractual cash flows. They consider the time-value of money, information from past events, and current conditions and projections of GDP, house pricing, unemployment and other important macroeconomic factors.
We calculated impairment losses using parameters (mainly EAD2, PD3, LGD4 and discount rate) based on internal models and regulatory and management expertise. As they are far from a simple adaptation, we define and validate them according to IFRS 9 guidelines.
| For more information regarding Financial asset impairment, see 'Credit risk management' in section '2. Main aggregates and variations' on Note 54 to the consolidated financial statement. | ||||
Forbearance
Grupo Santander's internal forbearance policy is a standard for our subsidiaries and follows regulations and supervisory expectations such as the EBA Guidelines on the management of credit impaired and forborne exposures.
Its rigorous criteria for assessing and monitoring forbearances allows for the strictest possible care and diligence in recoveries. Forbearance must aim to recover outstanding debt, with payment obligations adapted to customers' circumstances.
Forborne debt should remain classified as 'doubtful' or put on a watch-list for sufficient time in order to determine both associated risk and reasonable certainty about recovery of ability to pay. Forbearance may never be used to delay the immediate recognition of losses or hinder the appropriate recognition of risk of default.
In 2023, forbearance stock fell again (6% in the year), and stood at EUR 31,963 million, due to the good payment behaviour in the main geographies. In terms of credit quality, 47% are classified as credit impaired with average coverage of 44%.
| Key forbearance figures | |||||||||||
| EUR million | |||||||||||
| 2023 | 2022 | 2021 | |||||||||
| Performing | 16,919 | 18,988 | 20,504 | ||||||||
Credit impaired | 15,044 | 15,185 | 15,539 | ||||||||
| Total forborne | 31,963 | 34,173 | 36,042 | ||||||||
% Total coverageA | 25 | % | 24 | % | 23 | % | |||||
A. Total forbearance portfolio loan-loss allowances/total forborne portfolio.
3.4 Other credit risk details
Credit risk from financial markets activities
This section covers the credit risk generated from treasury activity with customers (especially credit institutions) through money market financing and counterparty risk products to meet the needs of customers and the Group's own needs in their management.
Counterparty credit risk is the risk that a customer will default before the final settlement of a transaction’s cash flows. It creates a bilateral credit risk because it can affect both parties to a transaction. It is also uncertain because it depends on market factors, which can be volatile.
We manage counterparties with several credit risk models based on their characteristics and needs. Model segmentation is organized by business and risk treatment and based on counterparty disclosures as well as the credit risk cycle. The exposure that the counterparty credit risk model cover includes derivatives contracts, repurchase agreements, securities and commodities lending, long settlements and margin lending.
An infrastructure that can measure current and potential exposure quickly and dynamically with various degrees of aggregation and granularity to generate detailed reports is key to decision-making.
We measure exposure using two methods: 'Mark-to-market' (MtM - replacement cost of derivatives), plus potential future exposure ('add-on'); and the Monte Carlo simulation for certain countries and products. We also calculate capital at risk and unexpected loss (e.g. economic capital net of collateral and recoveries, after deducting expected loss).
At market close, we recalculate exposure by adjusting transactions to a new time horizon, adapting potential future exposure, and applying netting, collateral and other mitigants. That way, we can check exposure daily against the limits approved by senior management within risk appetite. We control risk by using a real-time, integrated system that shows the exposure limit with a counterparty for any product and term, and for all subsidiaries.
Counterparty credit risk can also give rise to 'wrong-way' risk if exposure to a portfolio or a counterparty increases but credit quality declines. It can happen when rising default risk increases exposure to a counterparty. Santander has specific models to measure this risk.
Settlement risk occurs when a transaction is settled through an exchange of flows or assets between two counterparties. For instance, when a counterparty exchanges dollars for euros, settlement implies that one party gives euros and receives an equivalent amount of dollars from the other. Settlement risk is the possibility that one of the parties will default on their settlement commitments. We use a global infrastructure and specific models to measure this risk.
2 Exposure at Default
3 Probability of Default
4 Loss Given Default
472
Counterparty risk exposures: over-the-counter (OTC) transactions and organized markets (OM)
As at December 2023, the positive market value of total exposure (under management criteria) with netting and collateral agreements for counterparty risk was 13,428 million euros (net credit risk equivalent of 48,372 million euros). In 2023, despite the geopolitical and macroeconomic uncertainty, there was no significant increase in market value or exposure.
Counterparty risk: exposure in terms of market value and credit risk equivalent, including the mitigation effectA | |||||||||||
| EUR million | |||||||||||
| 2023 | 2022 | 2021 | |||||||||
Market value with netting effect and collateralB | 13,428 | 13,249 | 5,491 | ||||||||
Net CREC | 48,372 | 45,157 | 31,444 | ||||||||
A. Figures under internal risk management criteria. Listed derivatives have a market value of zero. No collateral is received for these types of transactions.
B. Includes the mitigation of netting agreements and deducting the collateral received.
C. CRE (credit risk equivalent): net value of replacement plus the maximum potential value, less collateral received.
The chart below shows counterparty risk products (especially interest rate and FX hedging instruments) by nominal risk:
Counterparty risk by nominalA | |||||||||||||||||
| EUR million | |||||||||||||||||
| 2023 | 2022 | 2021 | |||||||||||||||
Nominal | Nominal | Nominal | |||||||||||||||
Credit derivativesB | 24,528 | 14,765 | 17,164 | ||||||||||||||
| Equity derivatives | 20,326 | 26,177 | 79,062 | ||||||||||||||
| Fixed income derivatives | 4,793 | 13,320 | 4,409 | ||||||||||||||
| Exchange rate derivatives | 1,256,997 | 1,069,870 | 947,061 | ||||||||||||||
| Interest rate derivatives | 6,775,004 | 5,538,173 | 4,915,150 | ||||||||||||||
| Commodity derivatives | 20,061 | 13,496 | 12,022 | ||||||||||||||
| Total OTC derivatives | 7,909,027 | 6,479,325 | 5,786,114 | ||||||||||||||
Derivatives organised marketsC | 192,682 | 196,476 | 188,755 | ||||||||||||||
| Repos | 421,937 | 259,946 | 129,085 | ||||||||||||||
| Securities lending | 61,374 | 52,269 | 48,346 | ||||||||||||||
Total counterparty riskD | 8,585,020 | 6,988,017 | 6,152,300 | ||||||||||||||
A. Figures under internal risk management criteria.
B. Credit derivatives acquired including hedging of loans.
C. Refers to transactions involving listed derivatives (proprietary portfolio). Listed derivatives have a market value of zero. No collateral is received for these types of transactions.
D. Spot transaction not included.
As the following table shows, most of Santander’s derivatives reach maturity in up to five years, and repurchase agreements and securities lending in up to one year.
Counterparty risk: Distribution of nominal risk by maturityA | ||||||||||||||
EUR million. Dec.23 data | ||||||||||||||
| Up to 1 year | Up to 5 years | Up to 10 years | More than 10 years | |||||||||||
Credit derivativesB | 14 | % | 58 | % | 25 | % | 3 | % | ||||||
| Equity derivatives | 63 | % | 35 | % | 2 | % | — | % | ||||||
| Fixed income derivatives | 97 | % | 3 | % | — | % | — | % | ||||||
| Exchange rate derivatives | 56 | % | 27 | % | 11 | % | 6 | % | ||||||
| Interest rate derivatives | 40 | % | 38 | % | 14 | % | 8 | % | ||||||
| Commodity derivatives | 71 | % | 27 | % | 2 | % | — | % | ||||||
| Total OTC derivatives | 42 | % | 36 | % | 14 | % | 8 | % | ||||||
Derivatives organised marketsC | 65 | % | 23 | % | 10 | % | 2 | % | ||||||
| Repos | 94 | % | 6 | % | — | % | — | % | ||||||
| Securities lending | 98 | % | 2 | % | — | % | — | % | ||||||
| Total counterparty risk | 46 | % | 34 | % | 13 | % | 7 | % | ||||||
A. Figures under internal risk management criteria.
B. Credit derivatives acquired, including coverage of loans.
C. Refers to transactions involving listed derivatives (proprietary portfolio). Listed derivatives have a market value of zero. No collateral is received for these types of transactions.
Even if the credit quality of some counterparties declines, most counterparty credit risk is with customers with high credit quality (88% rated A or higher), especially financial institutions (23%) and clearing houses (71%).
Counterparty risk: Notional values by customer ratingA | |||||
Dec.23 data | |||||
Rating | % | ||||
| AAA | 0.81 | % | |||
| AA | 2.38 | % | |||
| A | 84.36 | % | |||
| BBB | 11.32 | % | |||
| BB | 1.03 | % | |||
| B | 0.08 | % | |||
| Other | 0.02 | % | |||
A. Ratings based on internally defined equivalences between internal ratings and credit agency ratings.
Transactions with clearing houses and financial institutions are subject to netting and collateral agreements, which we also seek to use to cover all other transactions. In general, the collateral agreements Santander signs are bilateral; still, we do sign some unilateral agreements in the customer’s favour, mainly with multilateral organizations and securitization funds.
473
| Counterparty risk: Notional values by customer segment | ||
Dec. 23 data | ||
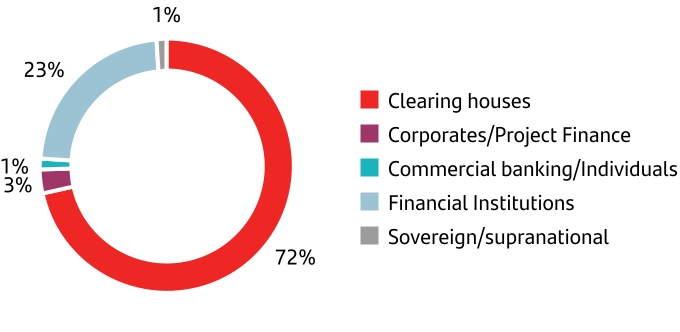
We use collateral to reduce counterparty risk. It consists of highly liquid instruments with economic value. They are deposited or transferred from one counterparty to another to guarantee or reduce counterparty credit risk from portfolios of cross-risk derivatives.
We measure trades subject to collateral agreements daily, with parameters to determine the amount of collateral to be paid or received from the counterparty (in cash or securities).
Our processes to manage collateral properly and more often have proved effective amid high volatility.
Most of the collateral received under Credit Support Annex (CSA), Overseas Securities Lending Agreement (OSLA), International Securities Market Association (ISMA), Global Master Repurchase Agreement (GMRA) and other agreements signed by the Group has been effective (41%); the rest is subject to strict quality policies in regard to the issuer and their rating, debt seniority and haircuts.
Because of the credit risk we assume with each counterparty, we apply credit valuation adjustments (CVA) to over-the-counter (OTC) derivatives when calculating the results of trading portfolios.
A CVA is a change to the market value of OTC derivatives that accounts for counterparty credit risk throughout the contract
life. A counterparty’s CVA adds up to the CVA on all maturity dates. It discounts the value of a derivative offered by a buyer based on the chance that the counterparty will default. We calculate it with exposure at default, probability of default, loss given default, the discount curve and other inputs.
We also apply debt valuation adjustments (DVA), which are similar to CVA but result from credit risk assumed by OTC counterparties trading with Grupo Santander. Both CVA and DVA are done within the potential period of exposure.
At the end of December 2023, CVA adjustments of EUR 293 million and DVA adjustments of EUR 330 million were recorded, down 16.5% and 9.3% respectively, compared to 2022. These declines are mainly due to movements in the credit markets whose spread levels have been moderately reduced compared to December 2022, partly offset by the upward movement in interest rates.
Counterparty risk, organized markets and clearing houses
Santander’s policies promote early action according to regulation on OTC derivatives, repurchase agreements and securities lending (whether settled through clearing houses or bilaterally). In recent years, we have been standardizing OTC transactions to settle and clear new contracts through clearing houses according to current regulation, in addition to promoting internal use of electronic execution systems.
We actively manage contracts not settled by clearing houses to optimize volume, in accordance with regulation on margins and capital.
While our counterparty risk management does not contemplate credit risk in such transactions, we have been calculating regulatory credit exposure for organized market exchanges since the Capital Requirements Directive (CRD) and the Capital Requirements Regulation (CRR), transposing the Basel principles on capital calculation.
The table below shows the weight of contracts settled by CCP versus total counterparty risk as of December 2023:
Counterparty risk: Notional values by settlement channel and productA | ||||||||||||||||||||||||||||||||
| Nominal in EUR million | ||||||||||||||||||||||||||||||||
Bilateral | CCPB | Organised marketsC | Total | |||||||||||||||||||||||||||||
Nominal | % | Nominal | % | Nominal | % | |||||||||||||||||||||||||||
| Credit derivatives | 14,388 | 58.7 | % | 10,140 | 41.3 | % | — | — | % | 24,528 | ||||||||||||||||||||||
| Equity derivatives | 14,980 | 73.7 | % | 559 | 2.8 | % | 4,786 | 23.5 | % | 20,326 | ||||||||||||||||||||||
| Fixed income derivatives | 4,793 | 100.0 | % | — | — | % | — | — | % | 4,793 | ||||||||||||||||||||||
| Exchange rate derivatives | 1,186,033 | 94.4 | % | 44,152 | 3.5 | % | 26,812 | 2.1 | % | 1,256,997 | ||||||||||||||||||||||
| Interest rate derivatives | 786,925 | 11.6 | % | 5,844,580 | 86.3 | % | 143,500 | 2.1 | % | 6,775,004 | ||||||||||||||||||||||
| Commodity derivatives | 2,477 | 12.3 | % | — | — | % | 17,584 | 87.7 | % | 20,061 | ||||||||||||||||||||||
| Repos | 228,551 | 54.2 | % | 193,386 | 45.8 | % | — | — | % | 421,937 | ||||||||||||||||||||||
| Securities lending | 61,374 | 100.0 | % | — | — | % | — | — | % | 61,374 | ||||||||||||||||||||||
| Total | 2,299,521 | 6,092,817 | 192,682 | 8,585,020 | ||||||||||||||||||||||||||||
A. Figures under internal risk management criteria.
B. Central counterparties (CCP).
C. Refers to transactions involving listed derivatives (proprietary portfolio). Listed derivatives have a market value of zero. No collateral is received for these types of transactions.
474
Risk settled by CCP and productA | |||||||||||
| Nominal in EUR million | |||||||||||
2023 | 2022 | 2021 | |||||||||
| Credit derivatives | 10,140 | 4,848 | 6,714 | ||||||||
| Equity derivatives | 559 | 758 | — | ||||||||
| Fixed income derivatives | — | 15 | — | ||||||||
| Exchange rate derivatives | 44,152 | 24,349 | 38,755 | ||||||||
| Interest rate derivatives | 5,844,580 | 4,555,519 | 4,054,711 | ||||||||
| Commodity derivatives | — | — | — | ||||||||
| Repos | 193,386 | 109,248 | 35,284 | ||||||||
| Securities lending | — | — | — | ||||||||
| Total | 6,092,817 | 4,694,737 | 4,135,464 | ||||||||
A. Figures under internal risk management criteria.
Credit derivatives
We use credit derivatives to hedge transactions, customer business in financial markets and trading. The credit derivatives Santander has negotiated have a low notional value: 0.4% of the notional value of counterparty risk. Furthermore, we subject credit derivatives to internal robust controls and procedures to minimize operational risk.
Concentration risk
Concentration risk control is key to our management. We continuously monitor credit risk concentration by region and country, economic sector, customer type and other criteria.
The board sets concentration limits according to risk appetite. Accordingly, the executive risk committee develops risk policies and reviews the appropriate exposure levels so we can effectively manage credit risk concentration.
Because Santander is subject to the CRR stipulations on large risks, exposure with a customer or group of associated customers will be considered 'large exposure' if its value is equal to, or greater than, 10% of eligible capital.
No large exposure should exceed 25% of the entity’s eligible capital, including the credit risk reduction effect set out in the regulation.
The use of risk mitigation techniques resulted in no groups triggering those thresholds as at the end of December. 5.6% of total credit risk (including loans to customers and off-balance-sheet risk) is with the 20 'large exposure' groups, according to regulation on credit exposure. While 8.5% of total credit risk is with the 40 'large exposure' groups.
Our Risk division works closely with the Finance division on actively managing credit portfolios with credit derivatives, securitizations and other techniques to reduce exposure concentration and optimize risk-reward.
As indicated in the key metrics section of this chapter, our credit risk is diversified among our core markets (Spain 25%, the UK 22%, the US 12%, Brazil 10%, etc.). Grupo Santander is enhancing these markets with global businesses that will help boost local performance to add value.
In terms of sector diversification, 56% of our credit risk is with individuals, who are inherently highly diverse. It is also well distributed, with no significant concentration in a particular
industry. The chart below shows credit risk by industry as at December 2023:
Diversification by economic sectorA | ||
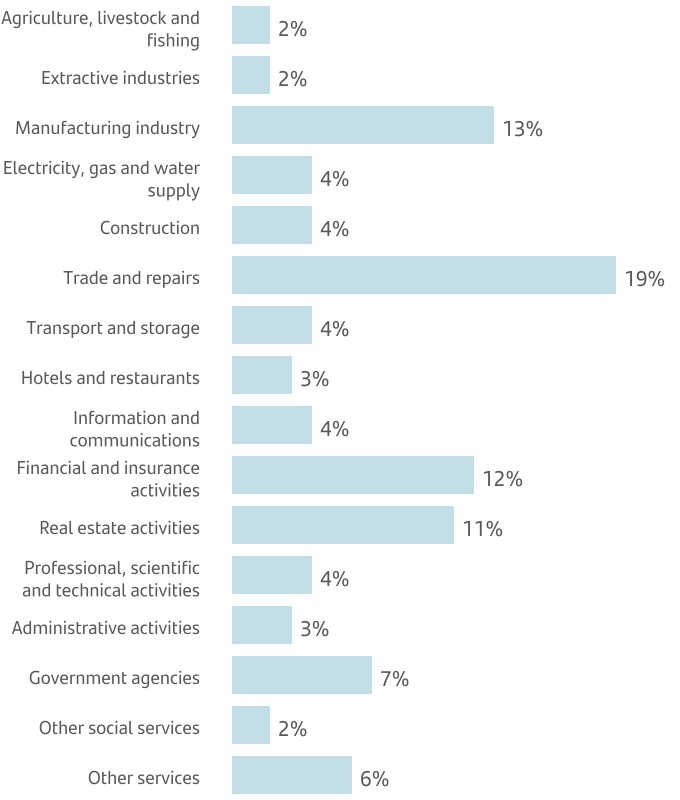
A. Excluding individuals and reverse repos.
Sectors identification and management
Grupo Santander conducts a quarterly review of exposure to customers operating in sectors that could be more affected by macroeconomic conditions (energy consumption, commodity prices, and key macroeconomic variables).
It considers:
•Market information: Industries’ stock market performance.
•Analysts’ EBITDA forecasts for the coming years.
•Internal information: Changes in credit exposure, defaults (in different timelines) and stagings.
•Our industry experts’ opinion, based on specific details about our exposures and our relationships with customers.
Country risk
In credit risk, country risk involves transactions with customers residing in a particular country with unusual business risk. It includes sovereign risk and transfer risk, as well as war, natural disaster, balance of payments crisis and other things that can disrupt international finance. In accordance with regulation, our models and provisioning processes contemplate country risk.
We assume country risk very selectively in transactions that enhance our global relations with customers. And we follow highly cautious standards to manage it.
475
Sovereign risk and risk with government agencies
Sovereign risk arises from central bank transactions (including regulatory cash reserves), government bonds (public debt) and transactions with non-commercial government institutions funded exclusively by a state’s budget revenue.
Our standard for sovereign risk differs somewhat from the EBA's standard for regular stress testing. In particular, the EBA does not consider deposits with central banks, exposures with insurance companies or indirect exposures from guarantees and other financial instruments. However, its standard does generally include entities run by regional, local and central governments.
We continue to track and manage transactions with sovereign risk based on available information, such as reports by rating agencies and international organizations. We monitor each country where we have cross-border5 and sovereign risk. We analyse events that could affect the country’s political or institutional stability and assign its government or central bank a credit rating. This helps us set limits for transactions with sovereign risk.
Our exposure to local sovereign risk not in the issuer country’s currency at the end of December was minor (EUR 4,404 million or 1.1% of total sovereign risk), based on our management criteria. Exposure to non-local sovereign issuers with cross-
border risk was also minor6 (EUR 11,085 million or 2.7% of total sovereign risk). The sovereign debt we hold in Latin America, which is recorded in local ledgers, is predominantly in local currency and short-term.
In recent years, total sovereign risk exposure has remained within regulatory requirements and strategy defined for its management. Because exposure spans several countries, each with its distinct macroeconomic outlook and growth scenario, it varies due to our liquidity management strategy and our interest and FX rate coverage, which apply limits based on each country’s credit rating. The table below shows exposure ratios by rating7:
| 2023 | 2022 | 2021 | |||||||||
| AAA | 18 | % | 27 | % | 15 | % | |||||
| AA | 19 | % | 19 | % | 32 | % | |||||
| A | 41 | % | 34 | % | 26 | % | |||||
| BBB | 12 | % | 11 | % | 11 | % | |||||
| Lower than BBB | 10 | % | 9 | % | 16 | % | |||||
Sovereign exposure at the end of December 2023 is shown in the table below (data in million euros):
2023 | 2022 | ||||||||||||||||||||||
Portfolio | |||||||||||||||||||||||
| Financial assets held for trading and Financial assets designated as FV with changes in results | Financial assets at fair value through other comprehensive income | Financial assets at amortised cost | Non-trading financial assets mandatory at fair value through profit or loss | Total net direct exposure | Total net direct exposure | ||||||||||||||||||
| Spain | 4,996 | 97 | 34,534 | — | 39,627 | 29,095 | |||||||||||||||||
| Portugal | 462 | 1,247 | 5,150 | — | 6,859 | 5,456 | |||||||||||||||||
| Italy | (2,187) | 415 | 7,366 | — | 5,594 | 7,415 | |||||||||||||||||
| Greece | — | — | — | — | — | — | |||||||||||||||||
| Ireland | — | — | — | — | — | — | |||||||||||||||||
| Rest Eurozone | 2,899 | 604 | 4,621 | — | 8,124 | 5,651 | |||||||||||||||||
| UK | 1,261 | 607 | 1,919 | — | 3,787 | 2,106 | |||||||||||||||||
| Poland | 194 | 6,340 | 4,733 | — | 11,267 | 8,715 | |||||||||||||||||
| Rest of Europe | 16 | 2,467 | 310 | — | 2,793 | 132 | |||||||||||||||||
| US | 2,049 | 5,253 | 14,002 | — | 21,304 | 23,298 | |||||||||||||||||
| Brazil | 11,715 | 10,273 | 5,745 | — | 27,733 | 23,728 | |||||||||||||||||
| Mexico | 3,311 | 12,075 | 5,439 | — | 20,825 | 17,306 | |||||||||||||||||
| Chile | 97 | 1,040 | 5,148 | — | 6,285 | 6,485 | |||||||||||||||||
| Rest of America | 277 | 543 | 1,430 | — | 2,250 | 1,964 | |||||||||||||||||
| Rest of the World | 229 | 2,843 | 1,455 | — | 4,527 | 3,542 | |||||||||||||||||
| Total | 25,319 | 43,804 | 91,852 | — | 160,975 | 134,893 | |||||||||||||||||
5 Risks with domestic public or private borrowers in foreign currency and originated outside the country.
6 Countries that are not considered low risk by Banco de España.
7 Internal ratings are applied.
476
4. Market, structural
and liquidity risk
and liquidity risk
4.1 Introduction
This section is about Grupo Santander’s management and control of market risk in 2023, including trading risk, liquidity risk and structural risk. It provides a brief description of our methodologies and metrics.
Market risk comes from movements in interest rates, inflation, foreign exchange, equity prices, credit spread, commodity prices, volatility, liquidity risk from products and the balance sheet, and other market variables that can affect transaction performance. It also includes trading and structural risk.
Options, futures, forwards, swaps and other derivatives can mitigate some or all of these risks.
Market risk factors that require more complex hedging are correlation, market liquidity, pre-payment and underwriting risk.
On-balance sheet liquidity risk, where the bank is unable to meet payment obligations promptly or would do so at a high price, is also key. Losses may result from a forced asset disposal and a cash flow imbalance.
Pension and actuarial risk also depend on market variables (for more details, see the end of this section).
| For further detail on market factors see section 'Activities subject to market risk and types of market risk', in Note 54 to the consolidated financial statement. | ||||
In 2023, we heightened our focus on climate and environmental factors, which arises from the possibility that climate change could adversely affect the value of a financial instrument or a portfolio, or the bank's liquidity; we use market and liquidity risk stress scenarios to measure their potential exposure.
We check our compliance with the Basel Committee’s Fundamental Review of the Trading Book (FRTB) and its implementation according to the EU’s Capital Requirements Regulation (CRR II) and the EBA’s guidelines on market risks.
In 2023, we ran several projects to give control teams the best tools to manage market risk and capital consumption. They included:
•We ran numerous initiatives to enhance the calculation of market risk-related capital requirements under the Fundamental Review of the Trading Book - Standard Approach (FRTB- SA) methodology. In particular:
◦rounded off the scope of calculation for entities and risk factors subject to market risk-related capital;
◦made necessary amendments to adapt the calculation to the most recent regulation;
◦strengthened the control environment over metrics, static risks and technical procedures through an overhaul of data architecture to reduce calculation times and enable us to run simulations; and
◦built up the exploitation layer of capital data under FRTB SA.
•We enhanced the procedures related to positions measured at fair value to meet regulatory requirements.
•We developed and implemented new valuation adjustment methodologies using corporate tools and common standards.
•We broadened the content and analysis of market risk reporting to top management.
•We enhanced the governance framework for the approval and use of market risk models.
4.2 Market risk management
Because factors inside and outside a unit can give rise to market risk, management and control must cover all potential risk sources with coordinated, uniform treatment by all subsidiaries.
The Group's senior management receives thorough, accurate reporting on a regular basis to measure subsidiaries’ risk profiles and gain a holistic view of risk for global analysis and control.
Limits management and control system
The market risk area runs a daily checks so that market risk positions remain within approved limits and assesses the performance of, and significant changes in, related metrics.
We set market risk limits in a dynamic process according to risk appetite levels in the annual limits plan prepared by senior management and extended to all subsidiaries.
To establish that these limits cover all market risk factors based on risk appetite, we take a prudent approach that includes:
•value at risk (VaR) and stressed VaR (sVaR) limits;
•equivalent and/or nominal position limits;
•interest rate sensitivity limits;
•Vega limits;
•limits for risk of delivery of short sales (bonds and equities);
•limits to reduce effective losses or protect profits during the year ('Loss trigger' and 'Stop loss');
477
•credit limits (limits for total exposure and jump-to-default by issuer); and
•origination limits.
Those general limits have sub-limits that make the structure granular enough to control market risks from trading. We monitor subsidiaries’ positions every day.
We set global approval and control limits, global approval limits with subsidiary-run control and subsidiary-level approval and control limits. Each subsidiary’s business unit manager requests limits based on business particulars and budgetary targets so that they will match the risk-reward ratio. Risk bodies approve limits according to established governance.
Subsidiaries must adhere to approved limits. The day a limit breach occurs, subsidiary business managers must provide a written explanation with an action plan to correct it.
Market risk-related capital requirements
We use internal and standard models to determine market risk-related capital requirements.
We also use internal models to calculate regulatory capital for the trading books of our subsidiaries in Chile, Mexico and Spain (Santander España’s trading book includes Santander London Branch, which helps diversify its positions).
We launched the Market risk advanced platform (MRAP), a global initiative to strengthen market risk infrastructure according to the new Fundamental Review of the Trading Book (FRTB); and to adapt internal market risk models to the latest Targeted Review of Internal Models (TRIM) and to supervisory demands.
This initiative includes all subsidiaries that generate market risk; the market risk, T&O, front office, finance and regulatory affairs areas.
In 2023, the MRAP programme continued to work on enhancing our processes to measure ‘fair value’. We developed new valuation adjustment methodologies; set corporate standards for valuation adjustment procedures to use them consistently in all the Group’s units; built on control and reporting of positions measured at fair value; and drew up new standards and methodologies to classify financial instruments into levels of fair value. We rolled out all these enhancements in our core markets through corporate tools, enabling us to automate processes and reduce the use of expert judgement significantly.
Our internal market risk model calculates the Group's consolidated regulatory capital as subsidiaries’ total regulatory capital that the ECB has approved. Because it does not consider capital savings owing to geographical diversification, our model is conservative.
It uses advanced methods with VaR, sVaR, Incremental Risk Charge (IRC) and Risk Not in Model (RNIM) as fundamental metrics to calculate ECB-approved regulatory capital in trading consistently with the Basel requirements set out in the CRR.
Methodologies and key aspects
a) Value at Risk (VaR)
Value at risk (VaR), our standard methodology for managing and controlling market risk, measures maximum expected loss with a certain confidence level over a given time. For standard historical simulation, the confidence level is 99% and the time window is one day. We also apply a two-year horizon or VaR over 520 days and other statistical adjustments in order to quickly and efficiently account for recent events that influence risk levels.
We report the highest of two VaR figures, which we calculate every day. One figure includes an exponential decay factor with a low weighting on the oldest observations; the other weights all observations the same. We also use the same methodology to calculate value at earnings (VaE), which gives maximum potential earnings within a certain confidence level and time horizon.
As a risk metric, historical VaR simulation has many advantages. It states a portfolio’s market risk in a single figure according to market movements. Still, it does have its limitations:
•VaR is calibrated to a certain confidence level, above which it does not reveal potential losses.
•The liquidity horizon of products in a portfolio is longer than the VaR model’s.
•VaR is not a dynamic measure of risk even if it is subject every day to significant, albeit unlikely, changes.
•High sensitivity to time windows.
•Inability to show plausible high-impact events outside the time window.
•No market inputs (e.g. correlations, dividends or recovery rates) for measurement parameters.
•Slow adaptation to new volatility and correlations, as the weighting of the newest and the oldest data is the same.
To circumvent some limitations, we use stressed VaR (sVaR) and expected shortfall (ES); calculate VaR with exponential decay; make conservative measurement adjustments; and run analyses and backtesting to assess the accuracy of the VaR calculation model.
b) Stressed VaR (sVaR) and Expected Shortfall (ES)
Every day, we calculate sVaR for our main portfolios using the same VaR calculation method but with these exceptions:
•A window of 260 observations (as opposed to 520 for VaR) over a continuous stress period. For each portfolio, we review the history of a subset of market risk factors (selected with expert criteria) and the most significant positions per books.
•Unlike VaR, the percentile we take to get sVaR has uniform weighting and is not the highest one based on exponential and uniform weightings.
We calculate ES as expected loss above VaR at a 99% confidence level. We also weight all observations the same. Unlike VaR, ES has the advantage of showing tail risk (i.e. the risk of loss due to a rare event) while being a subadditive metric.
478
According to the Basel Committee, 97.5% ES is a risk level similar to 99% VaR.
c) Scenario analysis
Santander’s risk measures are based on normal market conditions, price stability, sufficient liquidity and other assumptions used in daily risk management and decision-making. However, it is possible that extreme movements and strong unforeseen changes will not be properly anticipated.
Scenario analysis enables us to recognize unexpected outcomes and estimate how much capital could be needed to absorb losses stemming from those outcomes.
We regularly calculate and review stress test scenarios for all the trading books of the Group and our subsidiaries, such as:
Historical scenarios
Historical scenarios consider trading portfolio performance during a crisis or significant past market events to estimate maximum losses if such events reoccur (e.g. the subprime crisis of 2007-2008 and the Covid-19 pandemic).
Hypothetical scenarios
We use extreme scenarios based on market risk shocks that do not relate to past events (e.g. abrupt crisis with strong movements in all risk factors, worst-case scenarios, scenarios based on regulatory stress exercises, and forward-looking scenarios). Unlike generally ex post historical scenarios, hypothetical scenarios are ex ante.
Reverse stress test scenarios
Reverse stress test scenarios indicate loss-causing market variables that may compromise the bank’s survival. They supplement traditional stress test scenarios and point out potentially vulnerable business areas, hidden risks and correlations between risk factors.
Other stress test scenarios
In addition to the above scenarios, other stress tests are calculated on a quarterly basis to identify potential losses or significant impacts on capital arising from extreme market movements (e.g. IRC scenarios, proxy stress scenarios in the VaR calculation, liquidity and concentration scenarios).
d) Calibration and backtesting
According to regulation, the VaR model must accurately show material risks. Because VaR uses statistical techniques under normal conditions for a certain confidence level over a set time horizon, the estimate of maximum potential loss may differ from actual losses. We review and contrast the VaR calculation model on a regular basis to verify its accuracy.
We run internal backtesting, contrast VaR and review assumptions about portfolios for subsidiaries that follow the internal market risk model. For subsidiaries with an approved internal model, we run regulatory backtesting to find exceptions (where daily profit or loss is higher than VaR or VaE) that will influence the calculation of regulatory capital requirements for market risk.
Through backtesting, we assess the quality and general effectiveness of our risk measurement model. Our backtesting compares daily VaR/VaE observed on D-1 to profit and loss
(P&L) observed on D: Economic P&L, actual P&L, hypothetical P&L, and theoretical P&L.
We run daily backtesting for our subsidiaries, as well as daily, weekly and monthly internal (non-regulatory) backtesting depending on portfolio granularity.
The number (or proportion) of exceptions we record is one of the most intuitive indicators of a model’s soundness. As our regulatory backtesting covers a historical period of one year (250 days) and a 99% VaR, we expect two to three exceptions per year. To calculate regulatory capital for market risk, we take the regulatory K8 from the number of exceptions we find in actual and hypothetical backtesting.
e) Analysis of positions, sensitivities and results
Santander uses positions to quantify the market value of derivative transactions by main risk factor and with the Delta value of futures and options. We can express risk positions in subsidiaries’ base currency and in the currency used to standardize information. We monitor positions every day to correct any incidents we find immediately.
Sensitivity to market risk is the estimated impact of change in a risk factor on the market value of an instrument or portfolio. We measure it with partial derivatives or a full portfolio revaluation to get an analytical approximation.
The Market risk area’s daily P&L statement is an excellent indicator of the impact of changes of financial variables on portfolios.
f) Derivatives activities and credit management
Because of their atypical characteristics, we have special measures to monitor derivatives and credit management daily. On the one hand, we monitor the sensitivity of underlying assets to price movements (Delta and Gamma) to volatility (Vega9) and over time (Theta). On the other hand, we systematically check measurements of their sensitivity to spread risk, jump-to-default risk and position concentrations by rating.
Based on regulation and the Basel Committee’s recommendations, we also calculate the IRC, an additional metric for credit risk in the trading book.
The IRC covers default risk and rating migration risk (which VaR does not show adequately) by taking credit spread changes into account. In general, we apply it to government and corporate bonds; to forwards, options and other bond derivatives; and to credit default swaps, asset-backed securities and other credit derivatives. To calculate it, we take direct measurements of loss distribution tails at the right percentile (99.9%) over a one-year horizon and follow the Monte Carlo method with one million simulations.
g) Credit valuation adjustment (CVA) and debit valuation adjustment (DVA)
The Group calculates trading book results through CVA and DVA.
| For further detail on CVA and DVA see 'Credit risk from financial markets activities' in section 3.4 'Other credit risk aspect' | ||||
8 K: Parameter to calculate regulatory capital consumption for market risk.
9 Vega represents the sensitivity of the value of a portfolio to changes in the price of market volatility.
479
4.3 Market risk key metrics
In 2023, trading risk levels stayed low amid the high volatility caused by consistently high inflation and pressures on central banks' monetary policies. Additionally, political issues such as debt ceiling talks in the US, elections in certain countries, continuing war in Ukraine or the Middle East conflict, along with the collapse of some regional banks in the US and Credit Suisse case, compounded market volatility.
Risks continued to originate from trading non-complex instruments with customers. Most were hedges for interest rate and FX risk.
2023 saw generally low consumption of trading limits, which are based on the Group's market risk appetite.
VaR analysis
As the VaR of CIB’s trading book shows, market risk strategy focuses on trading with customers to minimize net directional exposure and keep risk diversified by geography and risk factor.
Market volatility throughout the year (especially in terms of interest rates) caused VaR to stay mostly above its three-year average — it ended 2023 at EUR 13.5 million.
In 2023, VaR fluctuated between EUR 19.3 and EUR 7.5 million. Average VaR in 2023 was EUR 11.7 million, lower than 2022 which was marked by high volatility driven by the impact of the Ukraine conflict on energy prices and its effect on inflation, and slightly higher than 2021 (EUR 14.1 million and EUR 10.5 million, respectively).
VaR 2021-2023 | ||
| EUR million. VaR at 99% over a one day horizon | ||
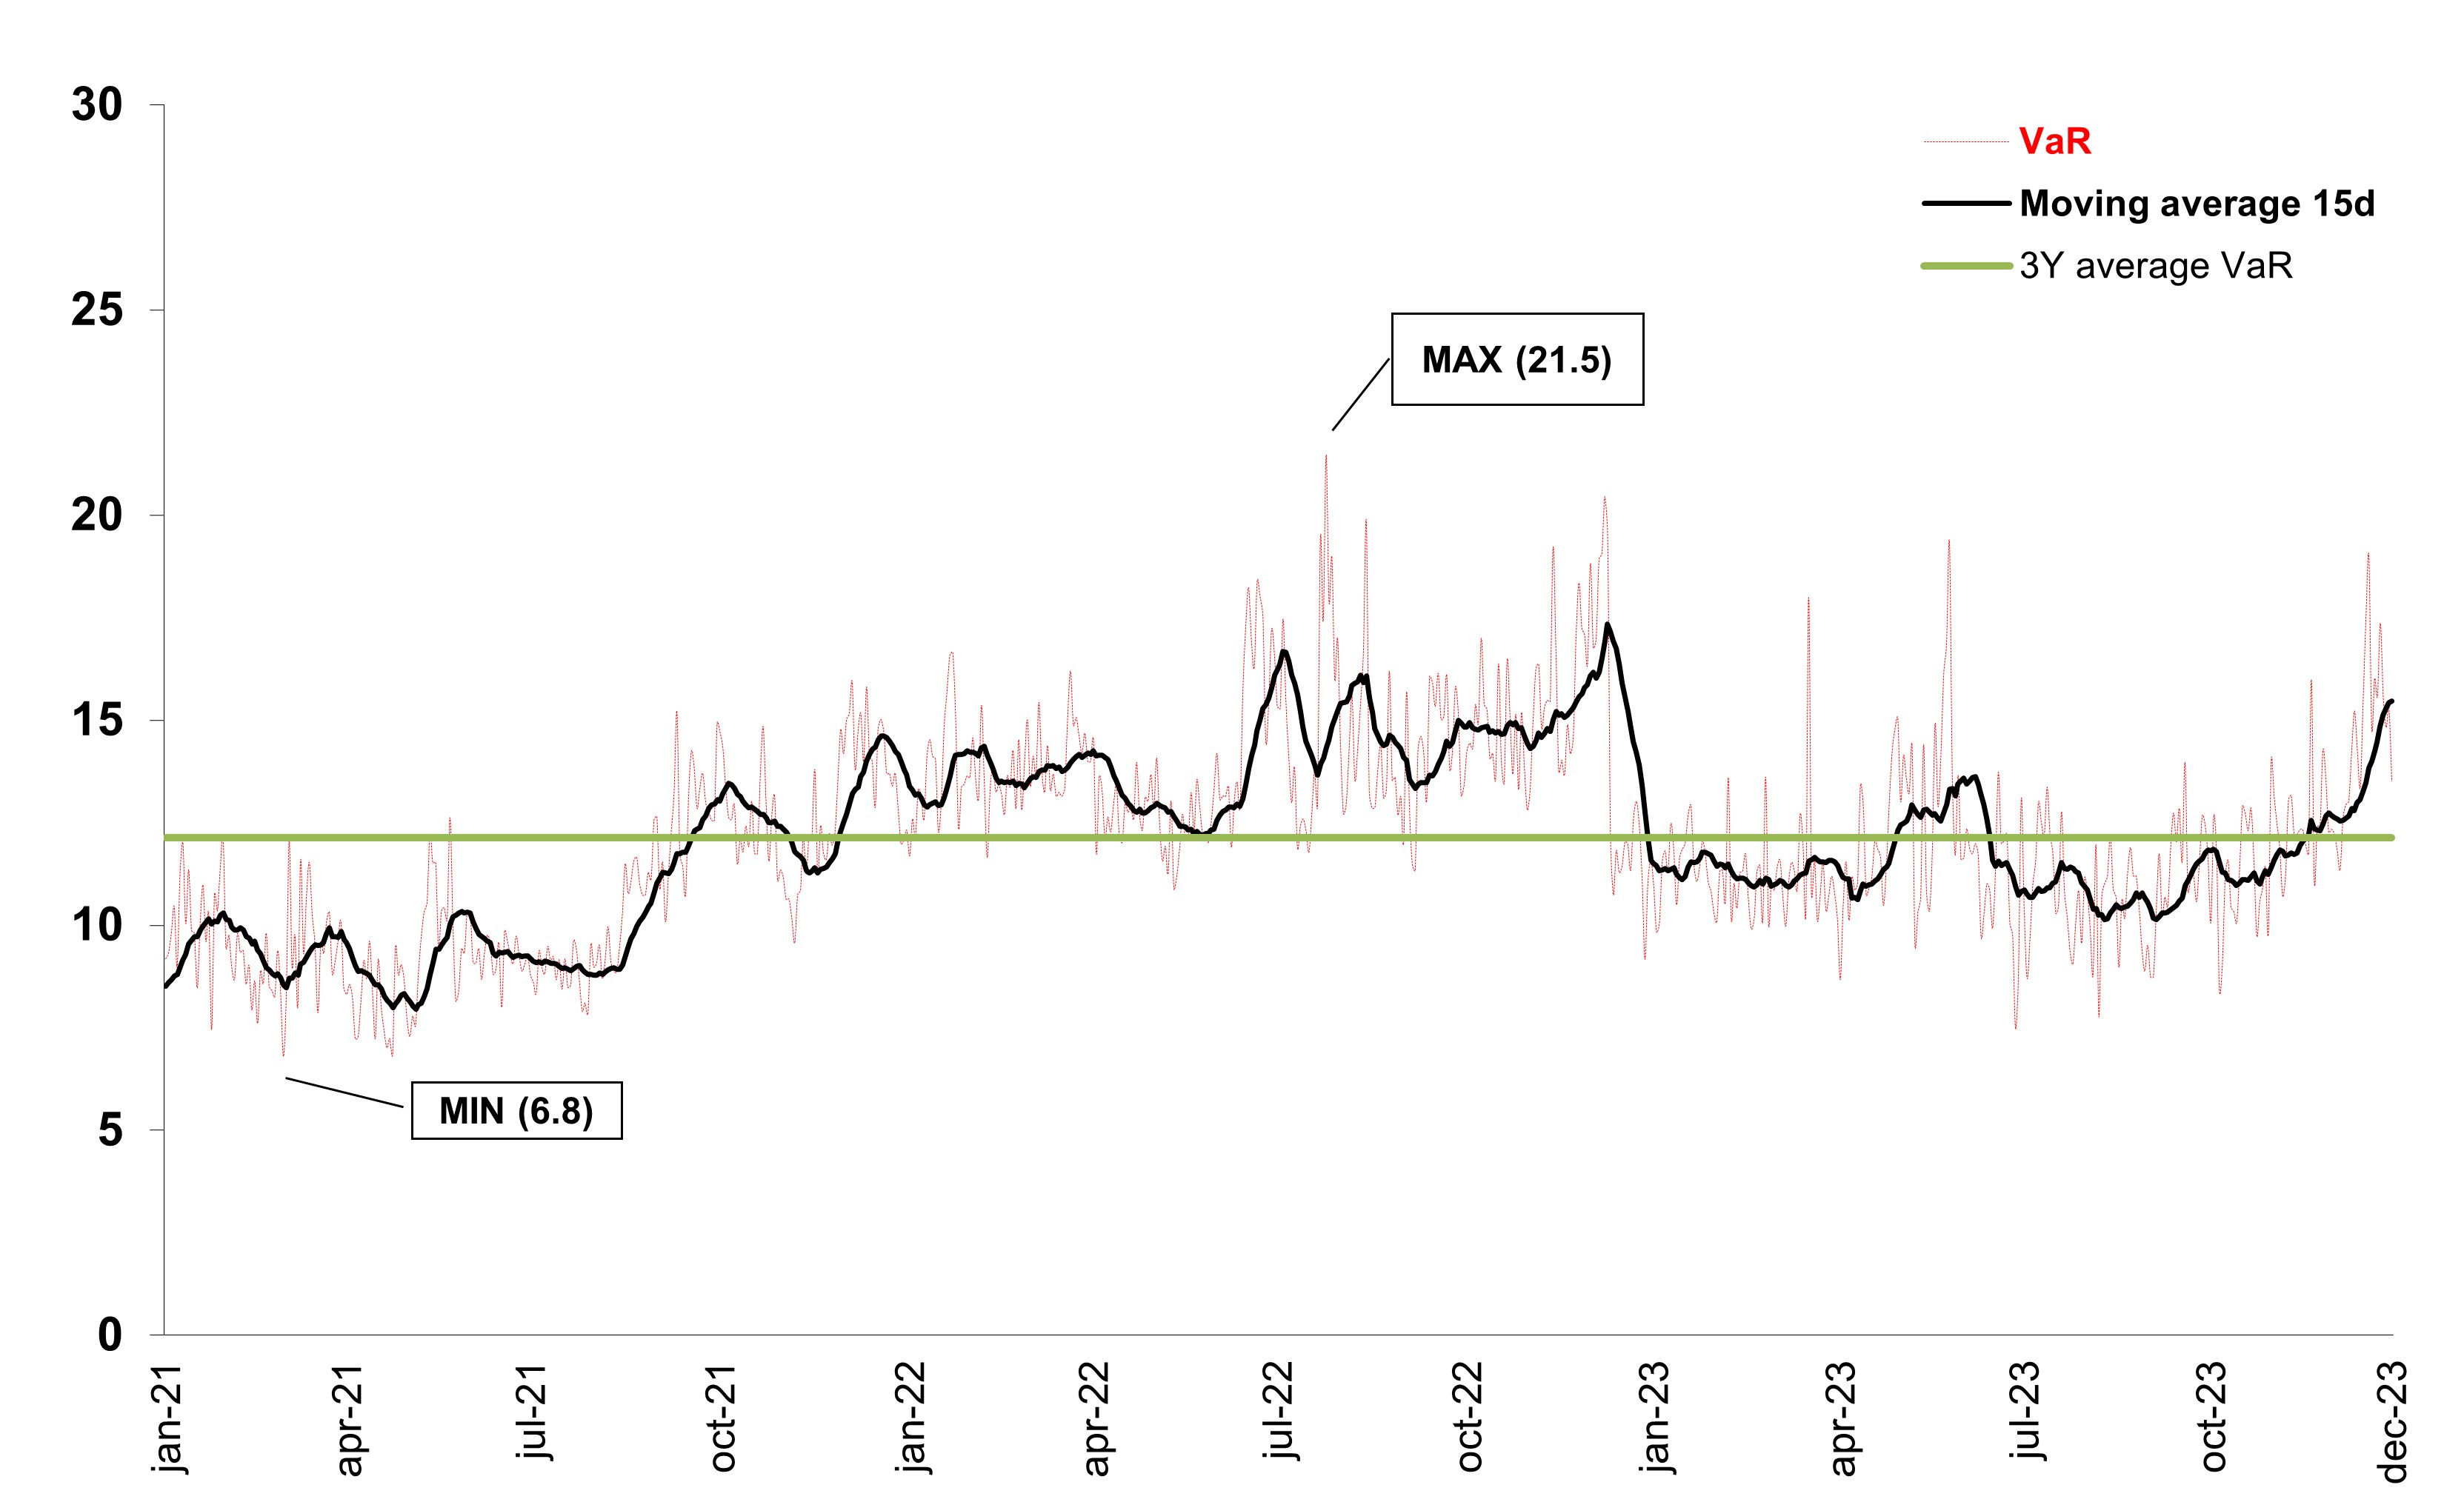
480
Risk by factor
This table shows the latest and average VaR at a 99% confidence level by risk factor in the last three years. It also shows the high and low VaR values in 2023 and 97.5% expected shortfall (ES) at the end of December 2023:
VaR statistics and Expected Shortfall by risk factorA | ||||||||||||||||||||||||||||||||||||||
| EUR million. VaR at 99% and ES at 97.5% with a one-day time horizon | ||||||||||||||||||||||||||||||||||||||
| 2023 | 2022 | 2021 | ||||||||||||||||||||||||||||||||||||
VaR (99%) | ES (97.5%) | VaR | VaR | |||||||||||||||||||||||||||||||||||
Min | Average | Max | Latest | Latest | Average | Latest | Average | Latest | ||||||||||||||||||||||||||||||
| Total Trading | 7.5 | 11.7 | 19.3 | 13.5 | 12.5 | 14.1 | 11.6 | 10.5 | 12.3 | |||||||||||||||||||||||||||||
| Diversification effect | (8.5) | (14.9) | (27.3) | (17.1) | (18.9) | (14.6) | (15.5) | (12.9) | (13.4) | |||||||||||||||||||||||||||||
| Interest rate | 8.9 | 12.2 | 20.3 | 11.1 | 11.5 | 12.6 | 9.9 | 9.6 | 9.1 | |||||||||||||||||||||||||||||
| Equities | 1.4 | 3.2 | 7.3 | 6.0 | 6.1 | 4.2 | 5.5 | 3.5 | 5.1 | |||||||||||||||||||||||||||||
| Exchange rate | 2.3 | 5.3 | 9.4 | 4.8 | 4.9 | 4.8 | 3.6 | 4.2 | 5.7 | |||||||||||||||||||||||||||||
| Credit spread | 2.7 | 4.3 | 6.4 | 6.1 | 5.9 | 5.4 | 5.8 | 4.8 | 5.1 | |||||||||||||||||||||||||||||
| Commodities | 0.7 | 1.6 | 3.2 | 2.6 | 3.0 | 1.7 | 2.3 | 1.3 | 0.7 | |||||||||||||||||||||||||||||
| Total Europe | 6.6 | 9.4 | 14.7 | 11.8 | 11.1 | 12.2 | 10.5 | 9.3 | 9.9 | |||||||||||||||||||||||||||||
| Diversification effect | (5.3) | (10.5) | (21.6) | (13.8) | (14.9) | (10.4) | (14.2) | (9.3) | (12.6) | |||||||||||||||||||||||||||||
| Interest rate | 5.6 | 9.1 | 16.5 | 8.2 | 9.3 | 10.2 | 10.1 | 7.7 | 7.1 | |||||||||||||||||||||||||||||
| Equities | 1.5 | 2.8 | 7.1 | 5.8 | 5.3 | 3.6 | 5.5 | 3.3 | 5.8 | |||||||||||||||||||||||||||||
| Exchange rate | 2.1 | 3.5 | 5.7 | 5.2 | 5.2 | 3.4 | 3.3 | 2.8 | 4.5 | |||||||||||||||||||||||||||||
| Credit spread | 2.7 | 4.3 | 6.4 | 6.1 | 5.9 | 5.4 | 5.8 | 4.8 | 5.1 | |||||||||||||||||||||||||||||
| Commodities | — | 0.2 | 0.6 | 0.3 | 0.3 | — | — | — | — | |||||||||||||||||||||||||||||
| Total North America | 1.8 | 4.0 | 6.4 | 5.0 | 5.0 | 2.3 | 2.7 | 2.5 | 2.7 | |||||||||||||||||||||||||||||
| Diversification effect | (0.3) | (0.7) | (2.6) | (0.5) | (0.5) | (0.8) | (1.1) | (0.7) | (0.6) | |||||||||||||||||||||||||||||
| Interest rate | 1.8 | 3.7 | 6.3 | 5.0 | 5.0 | 2.2 | 2.7 | 2.5 | 2.7 | |||||||||||||||||||||||||||||
| Equities | — | 0.2 | 0.5 | — | — | 0.1 | 0.1 | 0.1 | — | |||||||||||||||||||||||||||||
| Exchange rate | 0.3 | 0.8 | 2.2 | 0.5 | 0.5 | 0.8 | 1.0 | 0.6 | 0.6 | |||||||||||||||||||||||||||||
| Total South America | 4.2 | 7.3 | 13.3 | 7.0 | 6.2 | 8.0 | 6.2 | 5.9 | 6.3 | |||||||||||||||||||||||||||||
| Diversification effect | (1.3) | (6.2) | (14.2) | (6.6) | (7.6) | (5.0) | (4.2) | (4.9) | (5.1) | |||||||||||||||||||||||||||||
| Interest rate | 4.3 | 7.3 | 12.6 | 5.6 | 5.4 | 7.0 | 5.5 | 5.5 | 5.8 | |||||||||||||||||||||||||||||
| Equities | — | 1.4 | 3.7 | 2.4 | 2.5 | 1.6 | 1.7 | 1.2 | 1.1 | |||||||||||||||||||||||||||||
| Exchange rate | 0.5 | 3.2 | 8.0 | 3.0 | 2.9 | 2.7 | 0.9 | 2.8 | 3.8 | |||||||||||||||||||||||||||||
| Commodities | 0.7 | 1.6 | 3.2 | 2.6 | 3.0 | 1.7 | 2.3 | 1.3 | 0.7 | |||||||||||||||||||||||||||||
A.In the Americas, credit spread VaR and North Americas' commodity VaR are negligible and, thus, not shown.
VaR at the end of December was slightly higher (EUR 1.9 million difference) compared to the end of 2022, reflecting the spike in market volatility after the latest meetings of the main Central Banks, albeit generally less volatile this year than previous one.
Average VaR was lower for all risk factors except exchange rate, which was slightly higher. Temporary VaR increases owe more to short-term price volatility than to significant changes in positions.
By region, average VaR fell mainly in Europe (in almost every risk factor), while the slight increase in North America was due to interest rates.
481
Backtesting
Actual losses can differ from predicted losses because of VaR’s limitations. Santander measures the accuracy of our VaR calculation model to make sure it is reliable (see ‘Methodologies’ in section 4.2 ‘Market risk management’). The most important tests we run involve backtesting:
•Backtesting of hypothetical P&L and of the entire trading book showed an exception on 13 March (higher daily loss than VaR)
on the back of market volatility triggered by the collapse of some regional banks in the US. Regarding VaE at 99%, an exception (daily profit higher than VaE) was observed on 13 December as a result of the devaluation of the Argentine peso.
•These results are consistent with assumptions in the VaR calculation model.
| Backtesting of trading portfolios: daily results vs. VaR for previous day | ||
| EUR million | ||
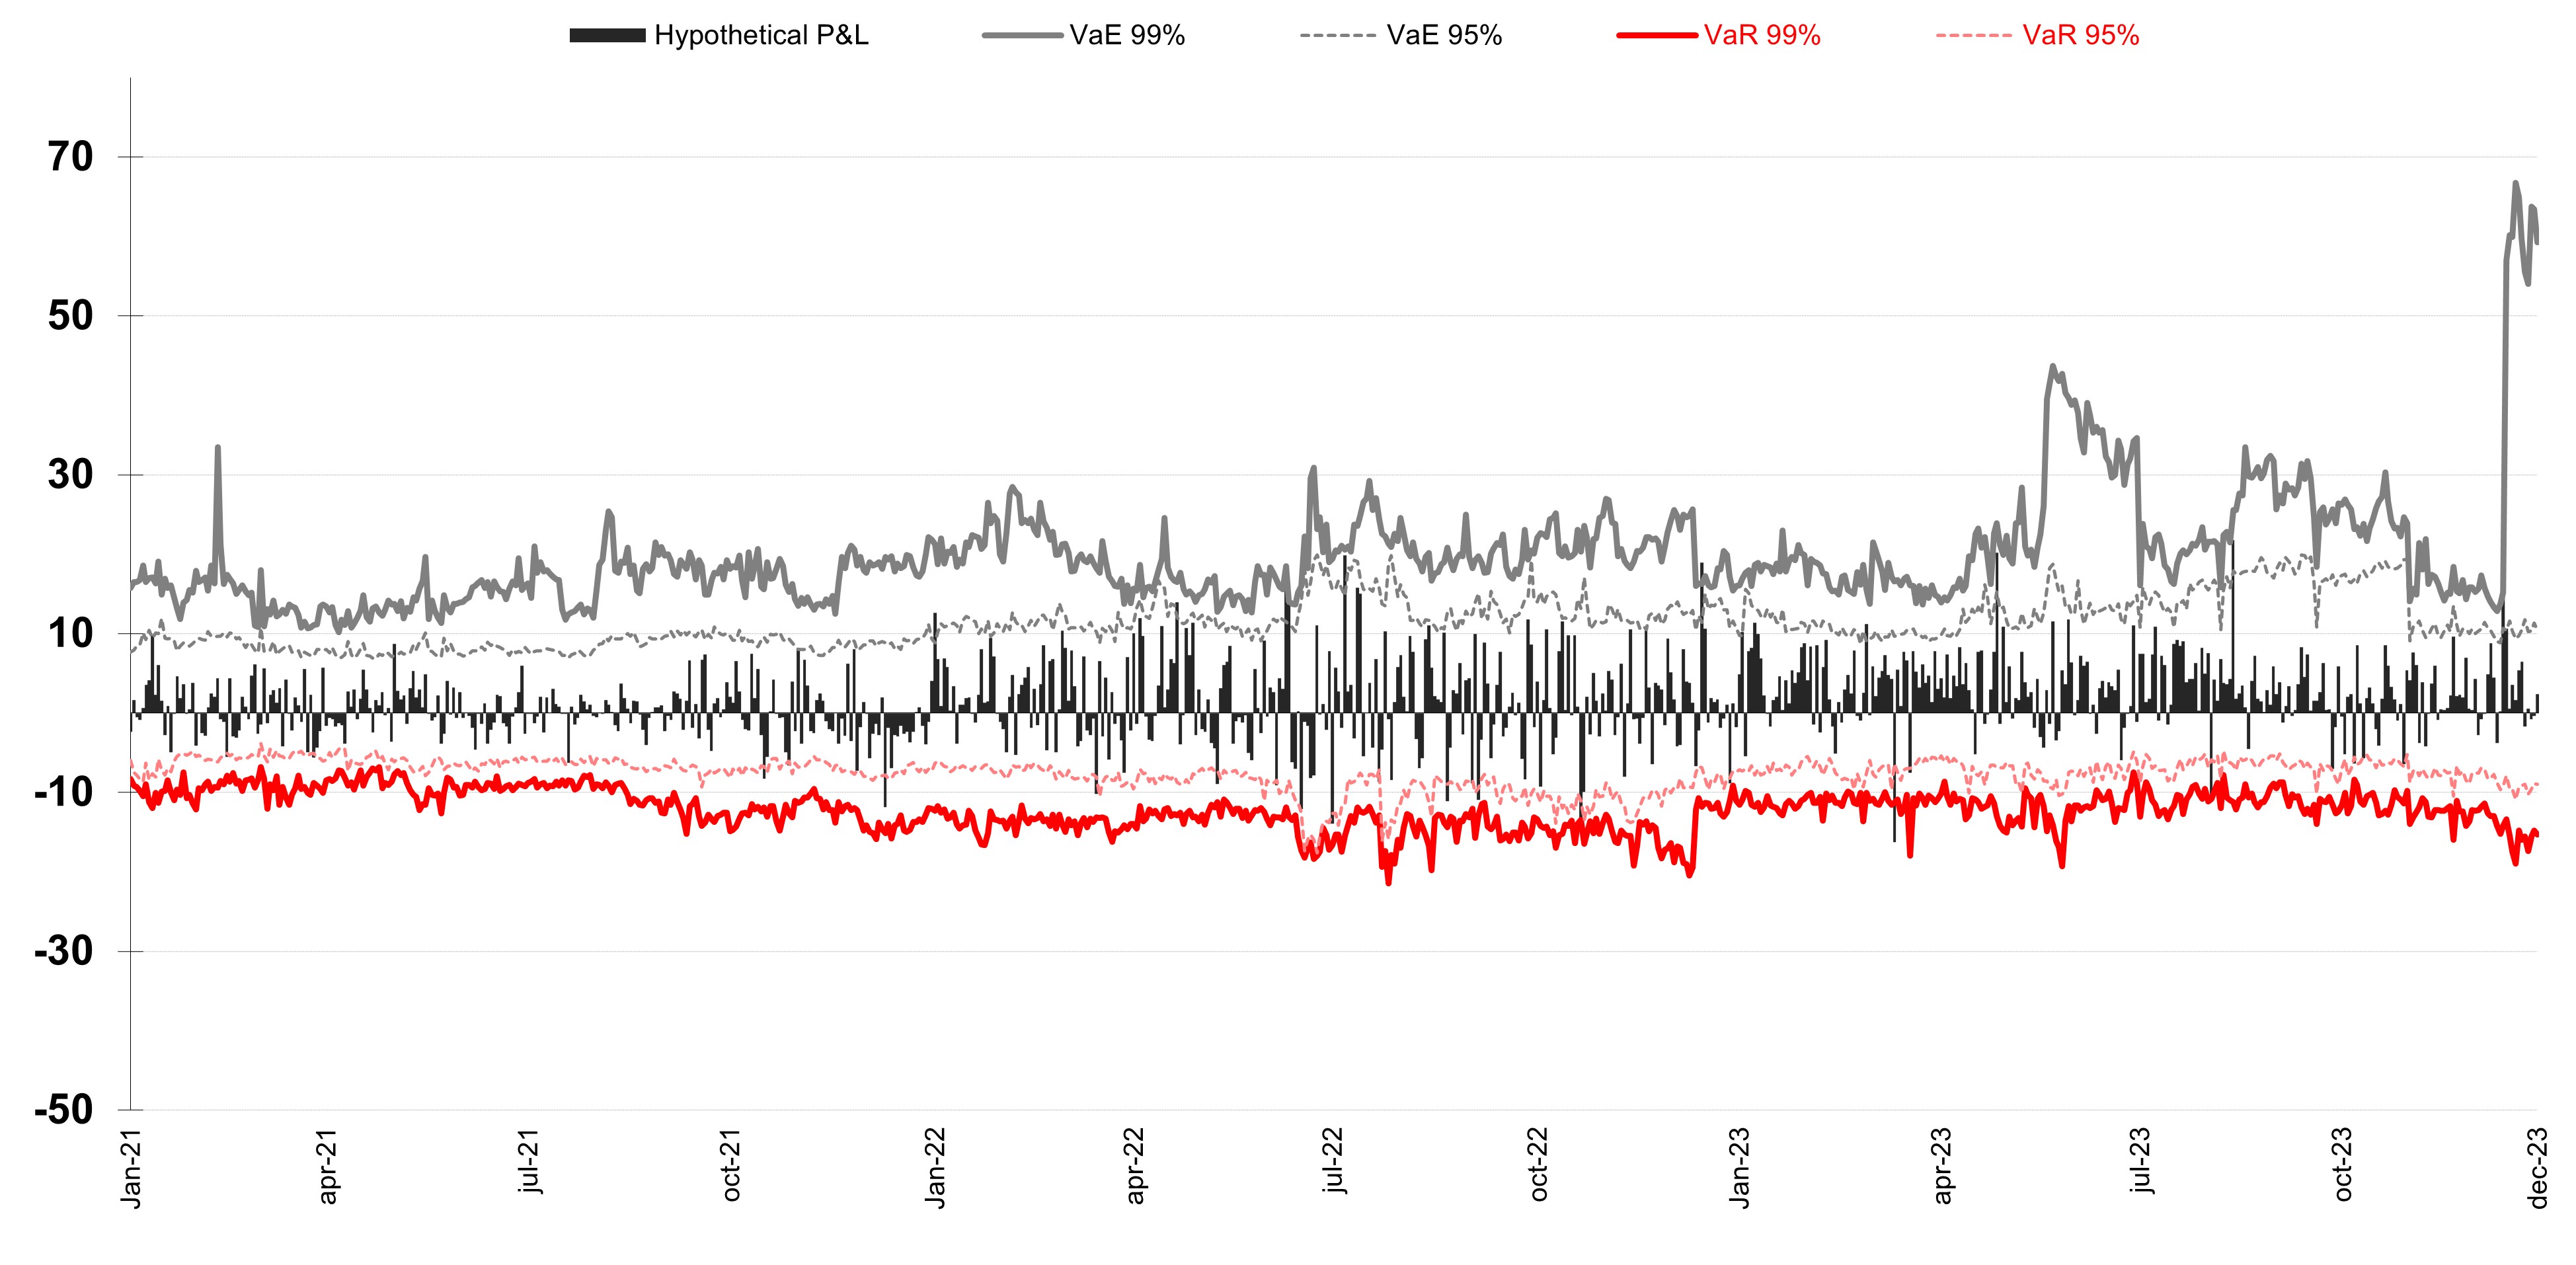
Derivatives risk management
Our operations with derivatives consist mainly in selling investment products and hedging risks for customers. We aim to keep open net risk as low as possible. Trading includes equity, fixed-income and FX options, chiefly in Spain, Brazil, the UK and Mexico.
The graph shows the VaR vega of structural derivatives over the last three years. On average, it has increased some EUR 2.8 million. In general, high VaR values stem from sudden spikes in market volatility, such as at the start of the health crisis, amid changes to monetary policy, or at times of political uncertainty in our geographies.
Average VaR was based mainly on interest rates, followed by equities and FX rates. In 2023, average risk (EUR 2.4 million) was slightly lower than in 2021 and 2022, considering the high volatility in interest rates throughout the year (see table below):
| Change in risk over time (VaR) of structure derivatives | ||
| EUR million. VaR Vega at a 99% over a one day horizon | ||
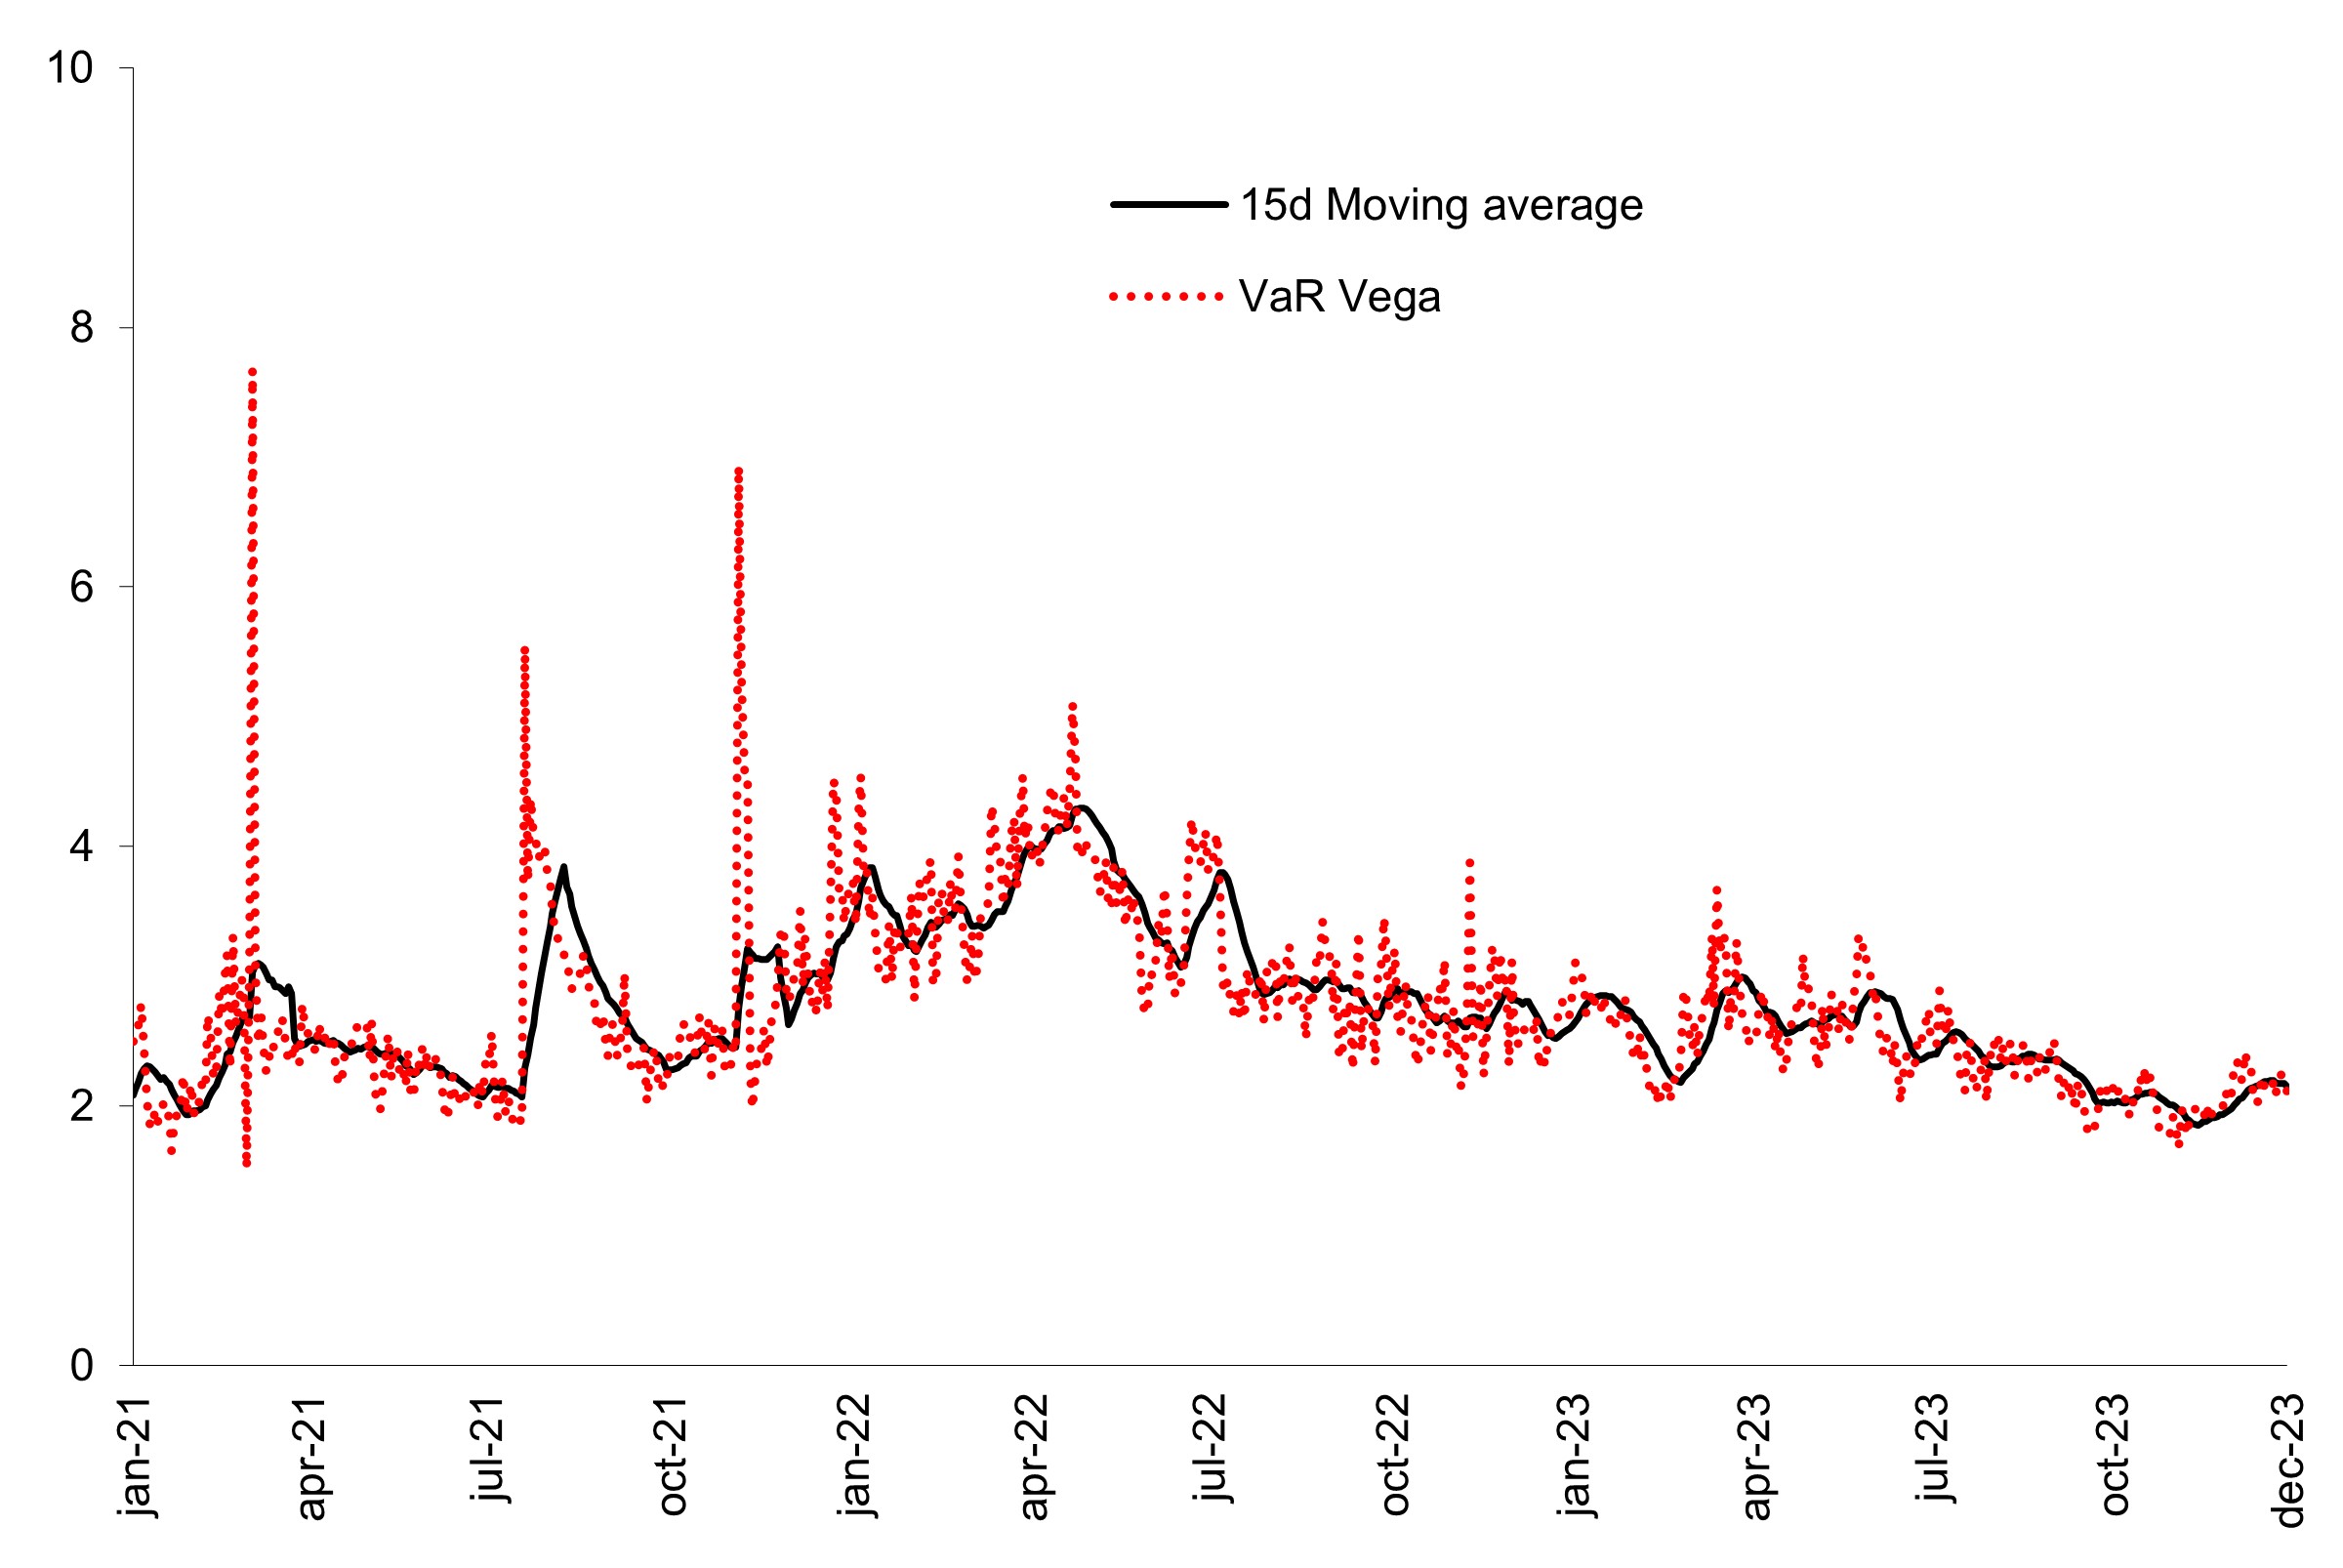
482
| Financial derivatives. Risk (VaR) by risk factor | ||||||||||||||||||||||||||||||||
| EUR million. VaR at a 99% over a one day horizon | ||||||||||||||||||||||||||||||||
| c | ||||||||||||||||||||||||||||||||
| 2023 | 2022 | 2021 | ||||||||||||||||||||||||||||||
| Minimum | Average | Maximum | Latest | Average | Latest | Average | Latest | |||||||||||||||||||||||||
| Total VaR Vega | 1.7 | 2.4 | 3.7 | 2.1 | 3.2 | 2.7 | 2.6 | 3.7 | ||||||||||||||||||||||||
| Diversification effect | (0.8) | (1.9) | (8.6) | (1.2) | (1.1) | (1.0) | (0.9) | (0.1) | ||||||||||||||||||||||||
Interest rate VaR | 1.0 | 2.0 | 8.6 | 1.5 | 2.0 | 1.4 | 1.4 | 1.2 | ||||||||||||||||||||||||
| Equity VaR | 1.0 | 1.4 | 2.0 | 1.2 | 1.4 | 0.9 | 1.2 | 1.6 | ||||||||||||||||||||||||
| FX VaR | 0.5 | 0.9 | 1.7 | 0.6 | 0.9 | 1.4 | 0.9 | 1.0 | ||||||||||||||||||||||||
| Commodity VaR | — | — | — | — | — | — | — | — | — | |||||||||||||||||||||||
Thanks to our risk culture and prudent risk management, exposure to complex structured instruments and vehicles is minor. At the end of December 2023, we had exposure to:
•hedge funds (as the counterparty in derivative contracts): EUR 57 million (indirect). We review this type of counterparty risk on a case-by-case basis, setting collateralization ratios based on each fund's characteristics and assets; and
•monolines: no exposure at 2023 year end.
Our policy on approving new derivatives transactions has always been extremely prudent and conservative. It is reviewed by senior management.
Scenario analysis
The table below shows worst case (i.e. maximum volatility) scenario results from late December 2023:
| Stress scenario: maximum volatility (worst case) | ||||||||||||||||||||
EUR million. Dec. 2023 | ||||||||||||||||||||
Interest rate | Equities | Exchange rate | Credit spread | Commodities | Total | |||||||||||||||
| Total trading | (37.5) | (10.4) | (32.3) | (0.5) | — | (80.7) | ||||||||||||||
| Europe | (10.1) | (4.9) | (21.4) | (0.5) | — | (36.9) | ||||||||||||||
| North America | (0.6) | (0.1) | (1.0) | — | — | (1.7) | ||||||||||||||
| South America | (26.8) | (5.4) | (9.9) | — | — | (42.1) | ||||||||||||||
Our analysis found that Santander's trading books would lose EUR 81 million in market value in the worst-case scenario of market stress. Losses would mainly affect South America (especially if interest rates fall) and Europe (if the euro were to appreciate).
483
Connection with balance sheet items
Below are items on Santander’s consolidated balance sheet that generate market risk. The table distinguishes positions whose main risk metric is VaR from other positions that are monitored with other risk metrics.
| Risk metric values on the consolidated balance sheet | ||||||||||||||
EUR million. Dec. 2023 | ||||||||||||||
Main market risk metrics | ||||||||||||||
| Assets subject to market risk | Balance sheet amount | VaR | Other | Main risk factors for 'Other' balance | ||||||||||
| Cash, cash balances at central banks and other deposits on demand | 220,342 | 220,342 | Interest rate | |||||||||||
| Financial assets held for trading | 176,921 | 176,921 | ||||||||||||
| Non-trading financial assets mandatorily at fair value through profit or loss | 5,910 | 4,068 | 1,842 | Interest rate, spread | ||||||||||
| Financial assets designated at fair value through profit or loss | 9,773 | 1,360 | 8,413 | Interest rate, spread | ||||||||||
| Financial assets at fair value through other comprehensive income | 83,308 | 1,761 | 81,547 | Interest rate, spread | ||||||||||
| Financial assets measured at amortised cost | 1,191,403 | 1,191,403 | Interest rate, spread | |||||||||||
| Hedging derivatives | 5,297 | 5,297 | Interest rate, exchange rate | |||||||||||
| Changes in the fair value of hedged items in portfolio hedges of interest risk | (788) | (788) | Interest rate | |||||||||||
| Other assets | 104,896 | |||||||||||||
| Total assets | 1,797,062 | |||||||||||||
| Liabilities subject to market risk | ||||||||||||||
| Financial liabilities held for trading | 122,270 | 122,270 | ||||||||||||
| Financial liabilities designated at fair value through profit or loss | 40,367 | 450 | 39,917 | Interest rate, spread | ||||||||||
| Financial liabilities at amortised cost | 1,468,703 | 1,468,703 | Interest rate, spread | |||||||||||
| Hedging derivatives | 7,656 | 7,656 | Interest rate, exchange rate | |||||||||||
| Changes in the fair value hedged items in portfolio hedges of interest rate risk | 55 | 55 | Interest rate | |||||||||||
| Other liabilities | 53,770 | |||||||||||||
| Total liabilities | 1,692,821 | |||||||||||||
| Total equity | 104,241 | |||||||||||||
4.4 Structural balance sheet risk management
Structural risk is the risk that market or balance sheet movements will change the value or profit generation of assets or liabilities in the banking book.
It covers insurance and pension risks, as well as the risk that Santander will not have sufficient capital (in terms of quantity or quality) to meet internal business targets, regulatory requirements or market expectations.
Limits management and control systems
The policies of senior management dictate mechanisms to monitor and control structural risk according to regulatory requirements and our risk appetite. The mechanisms consider sub-types of structural risk and their implications, contingencies and interrelations.
The Structural risk area’s role in the second line of defence is to oversee that structural risks are understood, controlled and reported to senior management according to established governance:
•It sets interest rate risk metrics and reviews and challenges the structural risk appetite and limits proposed by the first line of defence.
•It oversees the first line of defence’s structural risk management and checks compliance with set limits.
•It regularly reports on risk profile to senior management and issues guidelines to business lines about measures it deems necessary.
•It reviews and challenges business proposals and helps senior management and business units understand the interest rate risk of the Group’s businesses and operations.
•It develops and revises models and policy. And it checks that structural risk procedures are fit and proper.
484
Like market risk, structural risk also has an annual plan framework to set structural balance sheet risk limits according to risk appetite.
These are the main limits we use:
•Structural interest risk in the banking book:
•Net interest income (NII) sensitivity limit over a one-year horizon.
•Economic value of equity (EVE) sensitivity limit.
•Market value limit on ALCO portfolios under stress scenarios and with a potential influence on shareholder equity based on their accounting entry (fair value through shareholder equity).
•Structural FX risk:
•Limit on the net permanent position of the core capital ratio.
•Limit on the individual hedge required for each currency.
Business lines’ risk managers must provide explanations for potential limit and sub-limit breaches as well as an action plan to correct them.
Methodologies and other key details
a) Structural interest rate risk
As part of structural risk, interest rate risk in the banking book (IRRBB) is a key balance sheet risk.
Santander measures the potential impact of interest rate movements on EVE and NII. Because of the effect of changing rates, we must manage and control many subtypes of interest rate risk, such as repricing risk, yield curve risk, basis risk and option risk (e.g. behavioural or automatic).
Interest rate positions on the balance sheet and market conditions and outlooks could necessitate certain financial measures to achieve the Group’s risk profile target.
Metrics for checking IRRBB include NII and EVE sensitivity to interest rate movements.
•Net interest income (NII) and sensitivity: NII is the difference between interest income from assets and the interest cost of liabilities in the banking book over a typical one- to three-year horizon (one year being standard in Santander). It enables us to see short-term risks and supplement economic value of equity (EVE) sensitivity.
•Economic value of equity (EVE) and sensitivity: EVE is the difference between the present value of all assets minus the present value of all liabilities in the banking book. It does not include shareholder equity and non-interest-bearing instruments. It enables us to see long-term risks and supplement NII sensitivity.
b) Credit spread risk
The metrics we use to monitor credit spread risk in the banking book (CSRBB) includes NII and EVE sensitivity to changes in spread curves as well as the impact of stress scenarios on positions that have been identified as affecting CSRBB.
c) Interest rate models
Interest rate risk metrics consider the behaviour of financial products under stress scenarios in which uncertainty is common and the failure to meet contractual obligations is possible. We have methodologies that help explain how such products will behave. These are our key interest rate risk models:
•Treatment of liabilities without stated maturity. The Group’s model shows balances of all accounts without maturity using stable and unstable volumes, settlement speed over time, customer and market types, and other variables.
•Prepayment treatment for certain assets. Prepayment risk mainly affects fixed-rate mortgages in subsidiaries where contractual rates are below market rates and customers have the incentive to pay off all or part of their mortgage early.
d) Structural exchange rate risk/hedging of results
We measure FX positions, VaR and P&L every day.
e) Structural equity risk
We measure equity positions, VaR and P&L.
4.5 Structural balance sheet risk key metrics
In line with previous years, the market risk profile of the Group’s balance sheet remained moderate in 2023.
Each subsidiary’s finance division manages interest rate risk from retail banking and is responsible for handling structural risk from interest rate fluctuations.
To measure interest rate risk, we use statistical models based on strategies to mitigate structural risk with interest-rate instruments (such as bonds and derivatives) and keep risk profile within risk appetite.
Exposure across all our footprint was moderate in relation to annual budget and capital levels in 2023.
The NII and EVE sensitivities below are based on scenarios of parallel interest rate movements between -100 and 100 bps.
Structural interest rate risk
Europe
At the end of December, sensitivity of NII on our core balance sheets to interest rate hikes was positive, while EVE sensitivity was negative in the case of UK and positive sensitivity in Spain considering the same scenario.
Under the scenarios described above, at the end of December, the most significant risk of NII sensitivity to the euro amounted to EUR 886 million; to the pound sterling, EUR 246 million; to the US dollar, EUR 99 million; and to the Polish zloty, EUR 24 million, all with the risk of rate cuts.
485
| Net interest income (NII) sensitivity | ||
| % of total | ||
| 68.1% | 19.7% | 3.9% | 8.3 | % | |||||||

* Other: Portugal and SCF.
Significant risk of EVE sensitivity to yield curves of the euro was EUR 391.9 million; of the pound sterling, EUR 392.1 million; of the US dollar, EUR 364 million; and of the Polish zloty, EUR 176 million, mostly with the risk of rate rises.
| Economic value of equity (EVE) sensitivity | ||
| % of total | ||
| 55.2% | 28.8% | 16.0% | ||||||

* Other: Poland, Portugal and SCF.
North America
At the end of December, sensitivity of NII on our North America balance sheet to interest rate hikes was positive, while EVE sensitivity was negative.
At the end of December, the most significant risk to NII was mainly in the US and amounted to EUR 117 million.
| Net interest income (NII) sensitivity | ||
| % of total | ||
| 87.8% | 12.2% | ||||

The most significant risk to EVE was in the US and amounted to EUR 786 million.
| Economic value of equity (EVE) sensitivity | ||
| % of total | ||
| 92.6% | 7.4% | ||||

South America
The EVE and NII of our main South American balance sheets are positioned for interest rate cuts.
At the end of December, the most significant risks to NII were mainly in Chile (EUR 36 million) and Brazil (EUR 141 million).
| Net interest income (NII) sensitivity | ||
| % of total | ||
| 75.0% | 19.1% | 5.9% | ||||||

* Other: Argentina, Peru and Uruguay.
The most significant risks to EVE were recorded in Chile (EUR 255 million) and Brazil (EUR 360 million).
Economic value of equity (EVE) | ||
| % of total | ||
| 53.1% | 37.6% | 9.3% | ||||||

* Other: Argentina, Peru and Uruguay.
Structural foreign exchange rate risk/results hedging
Our structural FX risk exposure mainly stems from the performance of, and hedges for, permanent financial investments. In our dynamic management of this risk, we aim to limit the impact of FX rate movements on the core capital ratio. In 2023, we hedged nearly all currencies that have an impact on our core capital ratio.
In December 2023, our permanent exposures (with potential impact on shareholder equity) were, from largest to smallest, in US dollars, British pounds sterling, Brazilian reais, Mexican pesos, Chilean pesos and Polish złoty.
We use FX derivatives to hedge part of those permanent positions. The Finance division manages FX risk and hedging for the expected profits and dividends of subsidiaries whose base currency is not the euro.
Structural equity risk
Santander holds equity positions in its banking and trading books. They are either equity instruments or stock, depending on the share of ownership or control.
Equities in the banking book at the end of December 2023 were diversified, with securities from Spain, China, Morocco, Poland and other countries. Most of them invest in the financial and insurance sectors. We have minor equity exposure to property and other sectors.
Structural equity positions are exposed to market risk. We calculate their VaR with a set of market prices and proxies. At the end of December 2023, VaR at a 99% confidence level over a one-day horizon was EUR 171 million (EUR 195 million in 2022 and EUR 309 million in 2021).
486
Structural VaR
Homogenous metrics like VaR make it possible to monitor all market risk in the banking book (minus CIB trading; see section 4.3 ‘Market risk key metrics’). We differentiate fixed income based on interest rates and credit spreads in ALCO portfolios, FX rates and shares.
In general, the structural VaR of our total assets and equity is minor.
| Structural VaR | ||||||||||||||||||||||||||||||||
| EUR million. VaR at a 99% over a one day horizon | ||||||||||||||||||||||||||||||||
| 2023 | 2022 | 2021 | ||||||||||||||||||||||||||||||
| Minimum | Average | Maximum | Latest | Average | Latest | Average | Latest | |||||||||||||||||||||||||
| Structural VaR | 552.7 | 705.0 | 914.5 | 749.5 | 664.0 | 538.5 | 993.7 | 1,011.9 | ||||||||||||||||||||||||
| Diversification effect | (368.7) | (416.6) | (422.2) | (444.1) | (417.1) | (422.4) | (327.3) | (240.2) | ||||||||||||||||||||||||
VaR Interest RateA | 273.3 | 348.4 | 478.0 | 380.2 | 350.8 | 304.5 | 400.7 | 287.8 | ||||||||||||||||||||||||
| VaR Exchange Rate | 477.0 | 580.4 | 661.1 | 642.9 | 493.4 | 461.0 | 600.6 | 655.2 | ||||||||||||||||||||||||
| VaR Equities | 171.1 | 192.8 | 197.6 | 171.1 | 236.9 | 195.4 | 319.7 | 309.1 | ||||||||||||||||||||||||
A. Includes credit spread VaR on ALCO portfolios.
4.6 Liquidity risk management
The second line of defence oversees that liquidity risk is understood, controlled and reported to senior management and across the Group according to established governance. For this purpose:
•It defines liquidity risk and provides detailed measurements of current and emerging liquidity risks.
•It sets liquidity risk metrics, and reviews and challenges risk appetite and limits proposed by the first line of defence.
•It assesses and challenges commercial and business proposals, and gives senior management and business units the information they need to understand Santander’s liquidity risk.
•It oversees the first line of defence’s liquidity risk management and measures how long business will remain within risk appetite limits.
•It reports to governing bodies on compliance with risk appetite limits and any exceptions.
•It provides a comprehensive overview of our liquidity risk exposure and profile.
•It makes sure that liquidity risk procedures are appropriate to manage the business within risk appetite limits.
In 2023, high inflation and the collapse of several regional banks in the US and Credit Suisse in Europe caused considerable uncertainty in the markets. Nonetheless, these events had no impact on Grupo Santander due to our highly diversified sources of financing and assets across markets and businesses.
Additionally, our subsidiaries have a sound balance sheet and stable funding structure, supported by a large base of customer deposits, low dependence on short-term funding and liquidity metrics well above local and corporate regulatory requirements and within risk appetite limits.
4.7 Main liquidity risk metrics
Our solid liquidity position stands on a decentralized model under which each subsidiary manages its own liquidity autonomously. To measure liquidity risk, we use tools and metrics for the right risk factors. We follow the guidelines set out in the Capital Requirements Regulation (CRR II) and the Capital Requirements Directive (CRD IV) to draw up liquidity risk metrics. We determine liquidity scenarios for internal metrics based on the behaviour of other banks in liquidity crises, regulatory assumptions, and expert opinion.
These are our core monitoring metrics in the Group:
A) Regulatory metrics:
a. Liquidity coverage ratio (LCR) assesses the short-term resilience of our liquidity profile by making sure we have enough high-quality liquid assets to withstand a considerable market stress scenario for 30 calendar days. In 2023, the LCR remained stable and well above the regulatory threshold.
b. Net stable funding ratio (NSFR) measures long-term liquidity risk. It is the ratio of available stable funding to required stable funding. In 2023, the NSFR of our core subsidiaries and the Group remained above the regulatory requirement of 100% and the internal risk appetite of 101.5%.
B) Internal metrics:
a. Liquidity buffer assesses whether liquid assets are enough for the bank to survive for set time horizons under several liquidity stress scenarios.
b. Wholesale liquidity metric measures the number of days the Group would survive if it used liquid assets to cover lost liquidity from a wholesale deposit run-off (without possible renewal) over a set time horizon. We also use it as an internal short-term liquidity metric to reduce risk from dependence on wholesale funding.
487
c. Structural asset encumbrance metrics. We calculate two metrics to measure asset encumbrance risk. One the one hand, the asset encumbrance ratio is encumbered assets to total assets; on the other hand, the structural asset encumbrance ratio gives the proportion of encumbered assets by structural funding transaction (namely long-term collateralized issues and credit transactions with central banks).
d. Other liquidity metrics. Grupo Santander has a set of additional liquidity indicators to complement those listed above and to measure other non-covered liquidity risk factors. These include concentration metrics, such as the main and the five largest funding counterparties, and the distribution of funding by maturity.
e. Liquidity risk scenario analysis. Grupo Santander has five standard scenarios:
i.An idiosyncratic scenario of events that are detrimental only to Santander.
ii.A local market scenario of events that are highly detrimental to Grupo Santander’s base country’s financial system or real economy.
iii.A global market scenario of events that are highly detrimental to the global financial system.
iv.A combined scenario of more severe idiosyncratic and local and global market events, occurring simultaneously in an interconnected manner.
v.Climate scenarios, with various stress situations based on the potential economic effects of climate change.
We use these stress test outcomes as tools to determine risk appetite and support business decision-making.
f. Early-warning liquidity indicators. The system of early warning indicators consists of quantitative and qualitative liquidity indicators that help predict stress situations and weaknesses in the funding and liquidity structure of Grupo Santander entities. External indicators relate to market-based financial variables; internal indicators relate to our own performance.
g. Intraday liquidity metrics. Santander follows Basel regulation and calculates several metrics and stress scenarios for intraday liquidity risk to maintain a high level of control.
| For more details on liquidity metrics, see section 3.4 ‘Liquidity and funding management’ of 'Economic and financial review' chapter. | ||||
4.8 Pension and actuarial risk management
Pension risk
Grupo Santander runs several defined benefit pension schemes that generate financial, market, credit and liquidity risks from assets and investments, as well as market and actuarial risks from pension obligations.
Our pension risk management and control involves identifying, measuring, mitigating and reporting on sources of pension risk to reduce long-term exposure.
Grupo Santander uses a VaR methodology to measure pension risk, set pension risk appetite limits and calculate economic capital. Moreover, we estimate combined losses each year on assets and liabilities under a stress scenario that includes shifts in interest rates, exchange rates, inflation, stock markets, property values and credit spreads.
The majority of our defined benefit pension schemes are in Brazil, Germany, Portugal, Spain and the UK.
In 2023, the markets’ effect on pension risk was negative, mainly due to the decrease in discount rates in our main subsidiaries during the last quarter, after increasing expectation in the markets about the possibility that the main Central Banks ended their cycles of interest rates increases. Throughout the year, we took measures to reduce our exposure to pension and actuarial risk by taking advantage of current interest rate levels.
Actuarial risk
Actuarial risk stems from biometric changes in defined benefit recipients’ and life insurance policyholders’ life expectancy; and from suddenly higher non-life insurance payments.
These are the actuarial risks we distinguish:
•Life liability risk: Risk of loss on liabilities due to changing risk factors that affect pension obligations, split into mortality/longevity risk, morbidity risk, withdrawal/surrender risk, expense risk, and catastrophe risk.
•Non-life liability risk: Risk of loss on liabilities due to changing risk factors that increase Santander's non-life payment obligations towards employees, split into premium risk, reserve risk, and catastrophe risk.
488
5. Capital risk
5.1 Introduction
Our structural risk includes the risk of insufficient quality or quantity of capital to meet internal business objectives, regulatory requirements and market expectations.
We oversee first-line capital management and check that our capital adequacy and coverage match our risk profile through our Capital Risk area, which is part of our second line of defence. We also oversee transactions that could be considered significant risk transfers (SRT).
Capital management falls under the Group’s capital framework and model. It brings together capital planning and adequacy, budget execution and tracking, and the ongoing measurement, reporting and disclosure of capital data.
5.2 Capital risk management
The Capital Risk function independently oversees the capital activities carried out by the first line of defence. These activities are split into four workflows to promote an appropriate level and efficient use of capital, meet internal solvency targets and regulatory requirements, and match our risk profile:
1.Capital planning
We draw up a capital plan (consistent with the strategic plan) that sets out our solvency targets and the actions required to execute it. The control area reviews the plan to assess the risks that may impact on fulfilling it.
2.Capital adequacy
We measure capital levels against the risk assumed, based on a risk profile assessment and our risk appetite framework, and under stress scenarios. Oversight of this process aims to:
•cover all significant risks in the course of our operations;
•confirm that results are reasonable and consistent with business strategy, the macroeconomic environment and system variables; and
•check that planning methodologies and assumptions are appropriate.
3.Capital risk assessment
The required actions to measure capital metrics, based on a set methodology to obtain final figures. It also supports the stages of capital management, monitoring, oversight and control
Continuous monitoring of our regulatory capital measurement is an additional control function to count with the right capital risk profile. It involves a review of capital metrics and set thresholds, as well as oversight of compliance with capital risk appetite to keep capital levels above regulatory requirements and market expectations.
4.Origination
Assessment of our portfolios' capital efficiency for securitization, risk mitigation, asset sales and other capital optimization initiatives.
We oversee securitizations that might be significant risk transfers originated by Santander, in accordance with articles 243 and 245 of Regulations (EU) 2017/2401 and 2017/2402.
Oversight is an essential prerequisite for synthetic and traditional securitizations, especially if they can reduce risk-weighted assets (RWA) under regulatory standards.
The aim is to make sure that oversight includes analysis of the conditions that could alter the securitization’s SRT classification, namely:
•if it meets the requirements of an effective risk transfer;
•if it complies with all prudential regulation requirements;
•if its risk parameters follow our methodology; and
•if its economic rationale meets Group-wide standards.
In today’s macroeconomic landscape of high inflation, geopolitical tension, market volatility and other events, we focused on protecting the Group’s solvency and meet the internal objectives. We pinpointed and assessed the risks that could affect solvency and continuously monitored key metrics.
The Capital Risk function regularly assesses potential deviations in capital forecasts to set budget uncertainty levels. We oversee progress with the organic capital plan, securitization plan and other initiatives that impact on capital, as well as IRB model reviews.
In 2023, we continued to enhance monitoring of the achievement of subsidiaries’ capital contribution targets to spot risk and opportunity relating to our capital targets for the year. We also checked the impact of market variables on capital levels. Moreover, we continued to implement hedging policies to mitigate exchange rate volatility on our CET1 ratio.
According to the results obtained in the EBA's stress test, published in July 2023, under the adverse scenario Santander would destroy 170 bps of fully loaded CET1 capital compared to the peer average of 418 bps and to the average of European banking system of nearly 500 bps. This implies that, in absolute terms, the Group at the end of the stressed horizon, would have a fully-loaded CET 1 ratio 30 bps better than the average of its European peers.
The Capital Risk function and first line of defence set the solvency appetite limits, which were consistent with the Group’s medium-low risk profile and resilient to stress conditions.
489
We updated this exercise and added a new distance to maximum distributable amount (MDA) metric for the Group to make our risk appetite framework more robust.
Regarding planning, in 2023 we performed a more detailed review of our Group and subsidiary recovery plans to enhance measures and hypotheses.
We introduced stricter standards to enhance reporting and governance of SRT securitization oversight during origination. To make monitoring more robust, subsidiaries became more involved in exercises and we drove further automation through use of the corporate tool.
5.3 Key metrics
Banco Santander’s strong capital position is consistent with our business model, balance sheet structure, risk profile and regulatory requirements. Our robust balance sheet and profitability enable us to finance growth and accumulate capital.
Our model of subsidiaries with autonomy over liquidity and capital enables us to mitigate risk. Our capital metrics are stable, with ratios that remain comfortably above regulatory requirements.
The distribution of risk-weighted assets (RWA) by risk factor and by region at year end reflects the Group's core business in credit risk and geographic diversification:
RWA by risk typeA | |||||
Dec. 23 data | |||||
RWA by regionB | ||
Dec. 23 data | ||
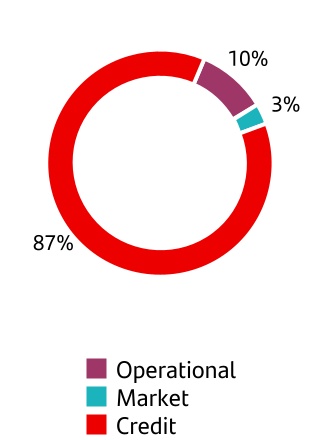
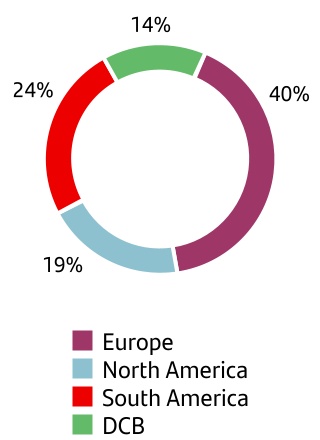
A. Credit risk included counterparty credit risk, securitizations and amounts below the thresholds for deduction.
B. Others, not included, represent 3% (Corporate centre)
At the end of December, our fully-loaded CET1 was 12.3%, above our 11-12% target.
The fully-loaded CET1 ratio rose 22 bp. We achieved a gross organic generation of 119 bp and recognized a 106 bp charge for shareholder remuneration, of which 44 bp owed to the shareholder remuneration against the results of 2023 (consistent with the target payout of 50%) and 62 bp to the share buyback programme.
Under IFRS 9 transitional arrangements, the CET1 phased-in ratio at the end of December was 12.3% and the total phased-in capital ratio was 16.4%, comfortably meeting the Basel Committee's 9.3% and 13.5% minimum levels, respectively.
The fully-loaded leverage ratio was 4.69% and the phased-in ratio was 4.71%, which also met the Basel Committee’s 3.5% minimum comfortably.
We kept all the Group’s risk appetite metrics above the set solvency limits throughout the whole year.
| For more details, see section 3.5 ‘Capital management and adequacy. Solvency ratios' in the 'Economic and financial review' chapter. | ||||
490
6. Operational risk
6.1 Introduction
In accordance with the Basel framework, Santander defines operational risk as the risk of loss due to inadequate or failed internal processes, people, and systems or to external events. It covers risk types such as fraud, third party supplier risk, technology risk, cyber risk, legal risk10 and conduct risk.
Operational risk is inherent in all products, activities, processes, and systems, and is generated in all business and support areas. All employees are responsible for managing and controlling the operational risks generated by their activities.
Our operational risk management and control model is based on a continuous process of identifying, evaluating and mitigating sources of risk, regardless of whether they have materialized or not. Throughout the application of this process, risk management priorities are established appropriately, and internal controls are defined and executed to manage and mitigate the risk across the organization.
6.2 Operational risk management
Management and control model
Our operational risk model establishes the core components needed to manage and control operational risk properly according to advanced regulatory standards and best practices. Its phases are:
•strategic planning: covers the activities necessary to define the Group's objective operational risk profile, including setting the risk appetite, estimating annual losses and reviewing the management perimeter.
•identification and assessment of risks and internal controls: this process aims to identify the risks and factors that may cause operational risk in the organization and assess their potential impact quantitatively or qualitatively.
•ongoing monitoring of the operational risk profile, to regularly analyse available information on the nature and extent of the risks incurred in the development of the Group's activities through an adequate alerts system, based on tools, such as indicators and escalation procedures.
•risk response decisions including risk mitigation and risk transfer measures: once the operational risk assessment has been carried out, it is important to identify risk mitigation measures to prevent risks from occurring and, if necessary, to minimize the impact of the risks that have occurred.
•disclosure and reporting, including obtaining, disseminating and making available the information necessary for decision-making to the relevant persons.
The main operational risk tools used by the Group throughout the management cycle are the following:
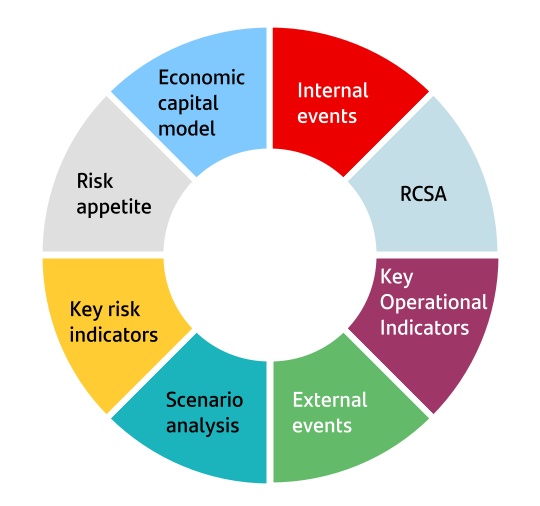
•Internal event database: registry of operational risk events, whose impact could be financial (e.g., losses, irrespective of their amount) or non-financial (i.e., relating to regulation, customers, or services). This information:
◦enables the analysis of root causes;
◦increases the awareness of risks for better operational risk management;
◦enables the escalation of relevant operational risk events to senior risk executives in the shortest time possible;
◦facilitates regulatory reporting; and
◦facilitates the development of the economic capital model within the internal capital adequacy assessment process (ICAAP).
•Our Operational risk control self-assessment (RCSA) integrates specific reviews that allow for the identification of cyber, technology, fraud, third party supplier risk as well as others risk drivers that could lead to operational risk, as well as the failure to meet regulatory expectations. In addition, the RCSA incorporates reviews related to regulatory compliance, conduct and financial crime risk (for more details, see section 7.2 'Compliance and conduct risk management').
10 Legal proceedings stemming from operational risk.
491
•Key Operational Risks (KORs): top – down operational risk assessment, that promotes an open communication from Senior Management about their operational risk concerns so that they are properly evaluated by the rest of the organization and included in the RCSA.
•External events data: quantitative and qualitative information about external operational risk events. This information facilitates detailed and structured analysis of relevant events in the industry; the comparison to Group and subsidiaries’ loss profiles; as well as the preparation for RCSA exercises, insurance and scenario analysis.
•Operational risk scenario analysis identifies highly unlikely events that could result in significant losses and establishes appropriate mitigating measures based on the assessment and opinion of experts from business lines and risk managers. Scenario analysis results are also used as an input to the economic capital models.
•Key risk indicators that provide quantitative information about our risk exposure and control environment. The most relevant indicators are those related to the bank´s main risk exposures, and are part of the operational risk appetite.
•Risk appetite, which has the following structure:
◦a global non-financial risk appetite statement, which asserts our commitment to controlling and limiting non-financial risk events that can result in financial losses; fraud events; operational and technological incidents; legal and regulatory infractions; issues associated with conduct; or reputational damage. This statement has associated loss and control environment metrics.
◦statements regarding technology risk, cyber risk, cloud, fraud, financial crime compliance, product sales, regulatory compliance, model risk, data management, and supplier risk management, and their own forward-looking monitoring metrics.
•Economic capital model: a loss distribution approach (LDA) model that captures our operational risk profile, with information collected from the internal loss database, external data, and scenarios. Its purpose is to determine operational risk economic capital and estimate expected and stressed losses for operational risk appetite.
•Other instruments are used to analyse and manage operational risk, such as the assessment of new products and services, and transformation initiatives; business continuity plans (BCP); review of corporate insurance; review of the management perimeter; recommendations from internal and external auditors, and supervisors; and the quality assurance process.
Heracles, which is our management and reporting system for operational risk, supports the operational risk programme and tools with a Governance, Risk and Compliance (GRC) approach. It provides information for management and reporting at subsidiaries and throughout the Group. Heracles also facilitates better operational risk management decisions by using a common set of taxonomies and methodological standards to allow information consolidation, duplication prevention, and reporting simplification. Through Heracles, we aim that
employees can have a timely, complete, and precise view of their risks.
The main objective of the second line of defence is to challenge and oversee the operational risk profile through the ongoing monitoring of the previously described toolset.
Operational resilience and the business continuity plan
Digital transformation is revolutionizing how banks operate, presenting new business opportunities. At the same time this structural change is also giving rise to new emerging risks such as technology risk, cyber risk, and an increased dependency on third party suppliers, which increase the potential exposure to events that could affect the provision of services to our clients.
We are also witnessing changes in regulations that are increasingly focused on the importance of Operational Resilience, such as:
•the published Basel Principles for Operational Resilience guidelines;
•the policy statement and final rules, Building the UK Financial Sector’s Operational Resilience, by the Bank of England (BoE), the Financial Conduct Authority (FCA) and the Prudential Regulation Authority (PRA);
•the EU's Digital Operational Resilience Act (DORA).
These regulations require banks to strengthen their ability to recover from disruptive events that could have an impact on their core business services and operations.
We are firmly committed to maintaining a robust control environment according to the best standards in the banking industry. This allows us to reinforce our operational resilience against potential disruptive events, thus promoting the provision of services to our customers as well as systemic stability.
A major pillar of our operational resilience is our business continuity management system (BCMS), which promotes the continuity of our business processes in all our subsidiaries in the event of a severe incident or disaster. It is a holistic management process that identifies potential threats and their impact to our operations and resources. It also defines the proper protocols and governance to provide an effective response.
In 2023, we continued to enhance and revise our BCMS to adapt it to the new Operational Resilience regulatory requirements, with particular emphasis on the following aspects:
•critical services identification, establishing the impact tolerance for disruption for each of them, according to the bank’s risk appetite, risk capacity and risk profile;
•the bank’s operational resilience approach approved by the board of directors, considering the bank’s risk appetite and the tolerance for disruption to its critical services;
•internal continuity strategies to minimize the impact on business activities derived from the potential disruptions in the services provided by critical suppliers;
492
•mandatory risk assessments and cost-benefit analyses in order to select the necessary continuity strategies for each contingency scenario identified;
•strengthening the HQ contingency sites with the goal of having proper risk coverage and a quick recovery of critical business activities in the case of contingency scenarios impacting main offices, or other situations such as ransomware attacks, power shortages affecting the homes of staff; and
•enhancing the methodology to manage and monitor the maturity level of subsidiary business continuity programmes.
Important mitigating measures
We continuously implement and monitor mitigation actions for major sources of risk identified by internal operational risk management tools and other external sources of information.
The main sources of operational risk and their respective mitigation measures are described below:
Fraud
The transformation and digitalization of the business has given rise to new risks and threats, such as more payment scams and identity fraud. To mitigate these risks, we enhanced control mechanisms and implemented new solutions. Strong customer authentication processes, in line with the EU’s Payment Service Directive (PSD2), such as biometric validation (e.g., facial recognition) in customer onboarding and enhancing anti-fraud alerts in origination are becoming increasingly widespread to mitigate fraud risk.
Examples of the controls that we are implementing to mitigate the risk of fraud in Cards include:
→transaction monitoring using advanced fraud prevention models;
→e-Commerce fraud mitigation with 3D Secure and;
→use of biometric authentication in ATMs and branches.
Additional examples of controls that we are implementing for online banking fraud include:
→Strong customer authentication and signature to approve transactions;
→behavioural biometrics and anti-malware protection and;
→identification and secure registration of customer devices.
Cyber risk
International conflicts in Ukraine and Middle East and the professionalization of cybercriminals produced a worsening threat landscape increasing the frequency and severity of cyberattacks that are impacting businesses, third parties, critical infrastructure and even governments. This situation has made cybersecurity a top risk concern for financial institutions; thus, we heightened our activity in terms of cybersecurity initiatives to mitigate emerging threats.
Our greater reliance on digital systems also makes cybersecurity one of the main non-financial risks of the business. Our goal is to make Grupo Santander a cyber-resilient organization that can quickly prevent, detect, and respond to cyberattacks, with constantly improving our defences.
In the reporting period, an increase in cybersecurity events has been observed, primarily related to Distributed Denial of Service (DDoS) attacks derived from the geopolitical situation, and isolated events involving third-party service providers, which were promptly addressed and resolved. None of these events materially affected our operations. Our team remains vigilant and committed to enhancing our cybersecurity measures to protect against evolving digital threats.
In that sense, we continue to improve our risk management and develop controls in line with the Group's global cybersecurity framework and international best practices.
From a second line of defence perspective, there is a framework to measure and monitor the cyber risk profile and its control environment.
The main areas of focus for this year have been:
•Consolidation of a Global second line of defence Center of Excellence for cyber risk providing an opportunity to strengthen control risk activities while achieving efficiencies, simplification, and harmonization.
•Establishing homogeneous criteria for regulatory requirements (mostly in SOx and new SEC cyber security requirements).
•Deep dive reviews of BAU processes; and metric assurance processes.
•Automation and comprehensive, predictive dashboards for enabling detailed cyber risk information.
| For more details on cyber security, see section 5 'Research, development and innovation (R&D&I)' on 'Economic and financial review' chapter. | ||||
IT risk
The process of digital transformation as well as Santander’s mission to become the best open financial services platform requires that we constantly review, assess and improve our controls to mitigate and manage IT risk.
Despite a demanding environment that is constantly changing, we are quickly adapting our business model and our technology to meet the new needs of our customers as well as new regulatory requirements. In this regard, we are transforming our business and operating model through our global technology initiatives to build a digital bank with branches that provides access to financial services for our customers through several channels.
For 2023, the key aspects of our IT Risk Management programme are summarized below:
•The adoption of a risk-based approach to prioritize the necessary resources and corrective actions taking into consideration the criticality of our IT assets.
493
•The thresholds of our risk appetite metrics that are used to monitor the different channels availability have been stressed. We made significant progress on reducing the level of obsolescence in key IT assets that is also measured as part of our risk appetite.
•We continued the enhancement of an automated tool that enables IT risk data correlation, analysis, and reporting. This tool facilitates information gathering and consolidation to enable the prioritization of risk management activities, allowing for more efficient independent oversight of IT risk.
•A specific tool has been developed to help risk practitioners in the analysis and forecasting of potential obsolescence problems in IT assets and thus helping with the strategic budget planning.
•Monitoring and reporting of IT relevant incidents. It is important to note that, even with the current digital transformation, relevant IT incidents at Group level have continued their downward trend in comparison with recent years.
•Detailed deep dive analyses of relevant IT risks as identified in our RCSA to gain an in-depth understanding of these risks, controls and appropriate mitigation plans.
•Oversight and challenge of the main IT transformation initiatives.
•Regular review of KRI’s and related thresholds to reinforce a consistent oversight of our most relevant IT Risks.
Supplier risk management
Our digitalization strategy sets out to offer our customers the best solutions and products in the market. This can entail an increase in third-party services and the use of new technologies such as cloud.
In 2023, in light of an increase in cyber and environmental related risks, as well as regulatory requirements (in particular DORA), the Group has strengthened the supplier risk management model and the internal control framework. A new IT platform is being developed to properly assess and manage the risks in outsourcing and third-party agreements.
We revised our methodologies and tools to enhance the monitoring of third-party risk in our subsidiaries. In addition, we adopted a risk-based approach that focuses on those suppliers, in the different entities of the Group, that could increase the potential risk level in our operations and client services. We have implemented enhanced monitoring of those suppliers with the goal that:
•they present an appropriate control environment in accordance with established Group policies and that mitigate the risk level of the service provided;
•business continuity plans are in place to allow the delivery of the service even in the event of a disruption;
•the proper controls are in place to protect the information processed during the provision of services;
•contracts and third-party agreements include the required clauses to protect the interests of the Group and our
customers, while providing coverage of the legal obligations in force;
•regular monitoring of these providers is carried out, with particular attention to the monitoring of service level agreements and to the regular testing of the supplier´s business continuity plans; and
•exit strategies are defined, including reversion or migration plans, particularly for those services with a high impact on business continuity and complex substitution.
In addition, a deep dive analysis and reinforced monitoring has been performed in order to assess the situation of our suppliers potentially impacted by the Middle East conflict. The main risks and the required controls have been identified, as well as the potential alternatives for the service provided.
We are embedding our environmental, social and governance approach in our strategy and culture to build a more responsible bank. In this regard, as our suppliers can affect the environment and broader society, we hold them to strict ethical, social and environmental standards. A new certification process is being implemented to revise that our suppliers follow the ESG sustainability standards and criteria required by the Group.
Other key mitigating actions
We are constantly improving our risk mitigation measures related to customer, products, and business practices. Santander has specific frameworks and policies on the marketing and selling of products and services; customer complaint handling and analysis; financial crime prevention; and compliance with new regulations.
| For more details on compliance risk mitigation, see section 7.2 'Compliance and conduct risk management'. | ||||
Insurance in operational risk management
Santander considers insurance to be an important component in the management of operational risk. The Corporate Insurance function is responsible for the use of risk transfer formulas to optimize and safeguard the bank´s financial results. The Corporate Insurance function, in collaboration with Non- Financial Risk (NFR), performs the continuous oversight and supervision of entities across the Group to promote the proper application of policies and procedures to manage risk that is insurable. This collaboration is governed by:
•NFR participation as a permanent member in the quarterly Corporate Insurance forum.
•NFR attendance of the quarterly Claims forum, which monitors and enhances processes for loss recovery via insurance.
•Procedures outlining the interaction model between NFR and Corporate Insurance, as well as other functions that correspond to the various insurance typologies (e.g., facilities, cybersecurity, legal, among others). These procedures pursue the proper management of insurance throughout the entire process of identification, assessment, transfer, and retention of risk.
494
•The coordination on an annual basis of the mapping of risks to insurance across the Group, with the objective of monitoring the effectiveness of insurance coverage, and identifying and correcting any potential gaps in coverage.
We continue to adapt the use of insurance to align our management with changes in the risk environment. As a result, we have expanded our analysis and implemented coverage related to climate change, ESG, cyber risk, the digital environment, and other elements. To respond to these and other transversal risks, we have global insurance programmes for property damage, general liability, fraud, expenses arising from cybersecurity breaches, and third-party claims against directors and officers of the Group (D&O insurance). These global policies are complemented by local insurance policies that adapt to the characteristics of each subsidiary and are purchased according to the Corporate Insurance risk management model implemented in each geography.
Analysis and oversight of controls in Corporate & Investment Banking (CIB)
Given the nature, specificity, and complexity of financial markets, CIB improves operational risk management and control on a continuous basis. The following enhancements were implemented in 2023:
•Continuous review of processes to improve and drive automation and operational excellence in the services provided to our clients, reinforcing a culture of quality and promoting the best CIB standards in all geographies.
•The control framework has undergone continuous improvement through regular review of controls and reporting tools that facilitate holistic supervision and monitoring of market activity. The risk of unauthorized trading continues to be monitored on a priority basis, using a specific risk appetite metric that measures the evolution of key risk mitigation controls.
•Constant monitoring of incidents and risks is maintained to resolve them promptly for more effective operational risk mitigation measures.
•Continuous improvement of the control model related to regulatory requirements such as MiFID11 II, the Dodd-Frank Act, EMIR12, Margin and other regulations.
•The vendor risk management function continues to be strengthened through tasks such as watch lists and targeted reviews of critical third-party process, improving the risk profile and promoting the compliance with internal and regulatory requirements.
•With respect to cyber controls, we have continued to enhance the controls related to data leakage, vulnerability management (focus on vulnerabilities identified in the global platform applications) and control over user access to systems (Zero trust). In addition, monitoring and challenge exercises have been maintained to correct the execution of controls.
| For more details on regulatory compliance in markets, see section 'CIB Compliance' in 7.2 'Compliance and conduct risk management' | ||||
11 Markets in Financial Instruments Directive.
12 European Market Infrastructure Regulation.
495
6.3 Key metrics
Net losses (including incurred losses and net provisions) as per Basel13 risk categories in the last three years were:
Net losses by operational risk categoryA | ||
| (% o/total) | ||
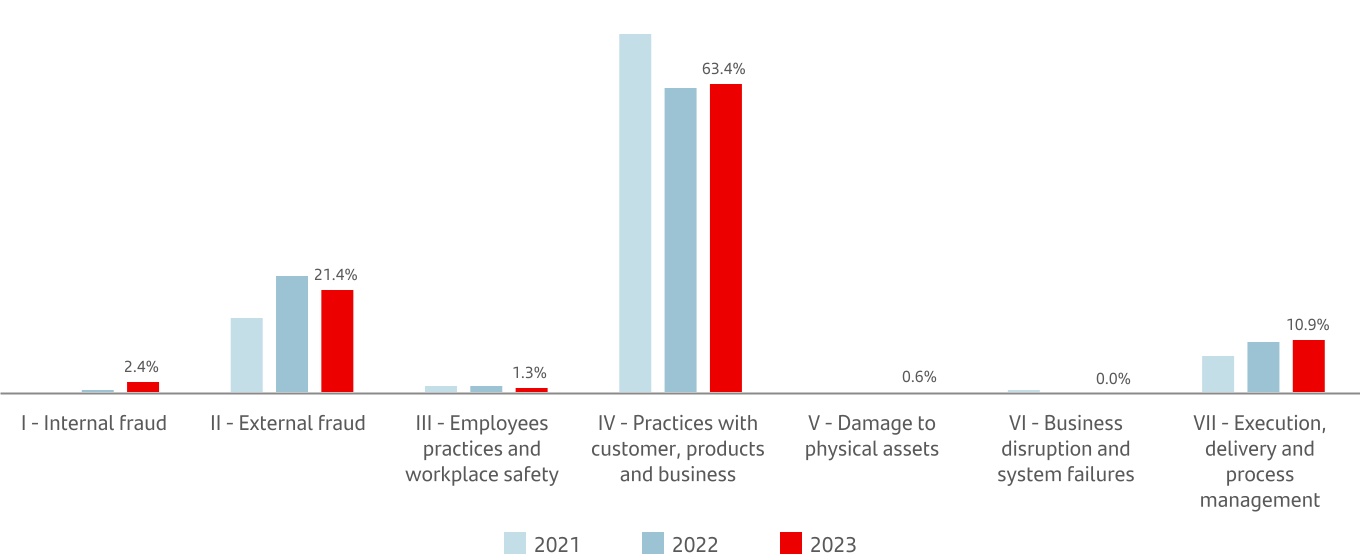
A. Does not include employees litigations in Brazil.
Losses due to practices with customers, products and business are stable, compared to the previous year. However, those due to execution, delivery and process management as well as external fraud losses have decreased.
The net losses by country were:
Net losses by countryA | ||
| (% o/total) | ||
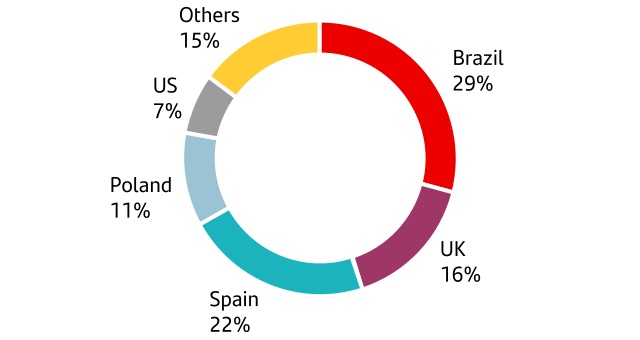
A. Does not include employees litigations in Brazil.
Santander considers employee litigation in Santander Brazil to be a staff expense. Our governing bodies continuously monitor expense levels with specific risk appetite metrics and take special actions to reduce them. These expenses are reported under the categories defined by the Basel Operational Risk framework.
In 2023, the most significant losses by category and geography are related to litigation in Santander Brazil (with ongoing root cause analyses of the main products), Spain (due to legacy cases) and the UK (due to fraud and legacy cases).
13 The Basel categories incorporate risks which are detailed in section 7 'Compliance and conduct risk'.
496
7. Compliance &
conduct risk
conduct risk
7.1 Introduction
The compliance and conduct activity takes into consideration supervisory requirements, ethical principles and good conduct, for the benefit of employees, customers, shareholders and the community in general, and also covers the risks described below:
•Regulatory compliance risk: Risk of non-compliance with legal and regulatory requirements, as well as supervisors’ expectations, which may result in legal or regulatory sanctions, including fines or other economic consequences.
•Conduct risk with customers (product governance and customer protection): Risk arising by inadequate practices in the Group's relationship with customers, including the way they are treated, as well as the products and services offered and their suitability for each customer.
•Financial crime risk: Risk arising from actions or the use of the Group's means, products and services in criminal or illegal activities. These activities include, among others, money laundering, terrorist financing, violation of international sanctions programs, corruption, bribery and tax evasion.
•Reputational risk: the risk of current or potential negative economic impact to the bank due to damage to the perception of the bank on the part of employees, customers, shareholders/investors and the wider community.
7.2 Compliance and conduct risk management
The compliance and conduct risk function is an independent control function within the second line of defence. It reports directly and regularly to the board of directors and its committees through the Group Chief Compliance Officer (Group CCO). It facilitates critical, independent debate, overseeing and control in terms of regulatory compliance, product governance, consumer protection, financial crime and reputation risk. It also measures the impact of compliance and conduct risk on risk appetite and risk profile.
The compliance and conduct function reports to governance bodies on risk when necessary and, especially, breaches of risk appetite. It also promotes a common risk culture and gives expert judgement and guidance on important compliance and conduct risk matters.
Banco Santander and each subsidiary run compliance programmes that suit their size and complexity. Programmes
are structured according to the four management risks mentioned earlier, and set out the core initiatives to be undertaken throughout the year. They are essential for oversight of subsidiaries’ Compliance and conduct risk control environment.
Regulatory compliance
The Regulatory Compliance function oversees and controls regulatory risk from employees, those related to the securities markets (market abuse), regulatory disclosures to the CNMV and other regulatory bodies where Santander is a publicly traded company, and personal data processing.
In 2023, we strengthened the two compliance risk oversight functions we created last year through pinpointing, monitoring and reporting on the major risks on investment platforms14, and in restructuring area; and through the monitoring of the use and contribution of benchmarks.
The main parts of regulatory compliance are:
A. Employees
We promote a culture of ethics and compliance among our employees, with standards for preventing crime risk, conflicts of interest and anti-competitive practices according to the General Code of Conduct (GCC). On the other hand, we manage the Canal Abierto, Grupo Santander whistleblowing channel, through which employees and other stakeholders can communicate anonymously and confidentially report financial and accounting irregularities of potential significance, as well as violations of internal and external regulation and our corporate behaviours.
In 2023, we reviewed the internal regulation that governs Canal Abierto in Spain to make it consistent with Ley 2/2023, de 20 de febrero, de Protección al Informante (Spain’s whistleblower protection law). We updated the Grupo Santander Canal Abierto policy and the related Usage and Operation procedure, which the board of directors had approved in June. Both documents are available on our corporate website and the Canal Abierto platform. In addition, the Group Chief Compliance Officer has been appointed as the person responsible for this channel for Banco Santander S.A.15
We enhanced communications with core vendors to share Santander’s conduct guidelines and standards regarding ethics behaviour according to our culture and the GCC. For the third year running, we ran initiatives in the compliance and conduct area to promote diversity, equity and inclusion and to spread awareness with Fundación Universia about including professionals from different backgrounds.
14 Investments in debt and or equity through a specialized fund manager. Characteristics of the businesses IPU participates are that Banco Santander invests in both the fund and the asset manager.
15 Includes Corporate Centre and Santander España.
497
| Employees’ compliance functions | ||||||||||||||
| Canal Abierto | Training and awareness | |||||||||||||
 | →Provides a channel for employees to report unethical conduct and breaches of internal regulation. →Manages and investigate reported cases. →Promotes a culture of speaking up and truly listening. |  | →Develop employee training programmes and awareness campaigns on corporate defense and employee' compliance. →Issue messages about ethics to the entire Group to build relationships based on trust. → Train the Group’s board members. | |||||||||||
| Disciplinary proceedings | Policies and procedures | |||||||||||||
 | →Investigate conduct that is misaligned with our ethics and compliance principles. → Assess disciplinary measures. |  | →Promote compliance with the GCC and enact special policies and procedures to enforce it. → Report to governing bodies regularly. | |||||||||||
Appointments | Queries about ethics | |||||||||||||
 | →Assess the suitability of the Group’s board and senior management nominations.* |  | →Manage queries from employees and members of governing bodies about ethics and internal regulation. →Provide advice on ethics amid controversies. | |||||||||||
| Anti-trust | ||||||||||||||
 | →Manage the anti-trust compliance programme. | |||||||||||||
(*) Run by the Corporate Centre Regulatory Compliance, Legal and Internal Governance areas. | ||||||||||||||
| |||||
B. Market abuse
Control room team is responsible for applying the Code of conduct in securities markets (CCSM) to prevent unlawful conduct and uncover transactions that could lead to a conflict of interest. In 2023, we continued to build on the initiative to create a Global Control Room to review current policies and procedures and enhance reporting systems. Also regulatory compliance function reviews treasury shares and Group buyback programmes.
C. Regulatory communications
The Regulatory communications team’s core functions are:
•disclosing relevant information as well as key inside information on the Group to the markets, which can be found on both our website and the Comisión Nacional del Mercado Valores (Spain’s securities market commission or 'CNMV').
•reporting on transactions with treasury shares or significant holdings of Banco Santander, and on transactions and remuneration schemes of executive directors and senior managers to CNMV and other regulatory bodies where Santander is a publicly traded company.
D. Personal data processing
The regulatory compliance function also oversees Grupo Santander’s personal data management risks through:
Personal data protection
At Santander, we have a specialist area that enforces our corporate policy on personal data protection, which sets out guidelines for all subsidiaries. We strengthened our governance model overseen by each subsidiary’s data protection officer to check compliance with corporate policy.
We continued to roll out a comprehensive compliance programme to over 90 Group subsidiaries to manage personal data protection risks effectively. It is supported by a robust control framework based on regular KPIs and each subsidiary’s annual self-assessment. We have adapted this programme to the diverse regulation — in nature and maturity — that applies to our subsidiaries and businesses.
Automatic exchange of tax information between countries
The data management function oversees automatic tax disclosure between subsidiaries (pursuant to FATCA16 and CRS17) by checking regular reporting obligations and execution of local action plans.
16 Foreign Account Tax Compliance Act
17 Common Reporting Standards
498
E. Market regulation
The SCIB compliance function also oversees the risks from core international market regulations applicable to Banco Santander, such as:
•EU Regulation: It has continued to monitor compliance with EU Regulations (mainly MiFID II and EMIR), paying close attention to Reporting, Inducements and requirements related with Algorithmic Trading. The bank has been working also to implement the modifications arising from EMIR Refit.
•US Regulation: From a Dodd-Frank perspective, Swap Dealer and Security Based Swap Dealer’s compliance frameworks monitoring has been focused on the swap/security-based swap data reporting. Ongoing work streams are constantly analysing potential enhancements to ensure trade reporting accuracy and completeness. From a Volcker Rule perspective every new activity is monitored and assessed to identify any proprietary trading activities and investment in Covered Funds, under the implemented Moderate Compliance Program across the Group.
In addition, there is a specialist team in place focused on the prevention, control and mitigation of risks related to market abuse and different conduct regulatory requirements through a robust Surveillance program on the transactions and communications mainly of markets activity, ALCO and other investment banking business areas. This team works to have global visibility of the group's businesses, carrying out an oversight function over the group’s core subsidiaries and standardizing the controls of Banco Santander S.A. and its international branches.
Conduct risk with customers: product governance and customer protection
Our product governance and customer protection area promotes that we base our actions on our customers’ interests, regulation, our values and our principles. That means promoting a customer-centric culture with a Simple, Personal and Fair approach, through the following pillars:
1.Action and governance principles:
→Establish the internal guidelines on customer service in the conduct risk management model, which is developed in a robust regulatory framework. These guidelines promote a robust, customer-centric culture throughout the commercialization process and retail customer relations.
→Run corporate product governance forum to approve new products and services, and escalate customer conduct risk issues. We carry this out through the conduct and customer voice follow-up meetings, and especially to the compliance, risk, responsible banking and board committees.
2. Oversight of key procedures to check that:
→our products and services are designed to meet customer's needs with the right balance of risk, cost and profitability;
→sales are carried out to the right target markets and provide transparent information, with proper sales force training and customer-centric remuneration schemes; and
→our customer and post-sale services strive to be Simple, Personal and Fair, and we carry out a follow-up and root-
cause analysis of our customers' voice and product evolution to check for product deterioration and process shortcomings.
3. Risk management by:
→reporting to senior managers to enable correct decisions on customer strategy, and drawing up and tracking action plans;
→oversight of the design and use of controls for marketing and customer relations, and reviews of the management and control model in the second line of defence;
→risk detection and measurement with methodologies that involve customer survey analysis, management indicators follow-up, thematic assessments, first-line self-assessments, regulatory trends, industry practices, supervisor and auditor opinions, learning from internal and external events and other sources.
Product and service governance
We have a two-pronged governance approach to product approval. Each subsidiary has its own approval body that manages conduct risk from marketing new products and services to meet the needs of the target market and check that they are sold through appropriate channels and processes, and have clear and fair terms and conditions. New products and services are first escalated to the corporate product governance forum (CFGP, which all the Group’s support and control areas attend) to be approved.
In addition, the meetings of the fiduciary risk function control that the investment products have an adequate definition of their investment policies and their management is carried out in a robust risk control environment, according to that defined in the Group's fiduciary risk admission, monitoring and control policy.
In 2023, products and services design included the following new features:
1.Making products, services and business models sustainable:
→Investment services: (i) products and services transformation towards ESG classification; and (ii) modification of the convenience and suitability tests to comply with the European Securities and Markets Authority (ESMA) guidelines, through the incorporation of aspects related to the customers’ sustainability preferences.
→Sustainable development: Running innovation and sustainable development initiatives to promote user awareness and responsible consumption (e.g. carbon footprint service).
→Financial inclusion: Undertaking initiatives to enable access to financial products and services (e.g. salary advances through SuperMóvil).
499

2. Digital strategy:
→Digital channels: Enhancing coverage, quality and user experience of online products and services (e.g. launch in Mexico of DiMo, a service for intermediary payments between accounts via mobile phone number).
→Transformation project: Customer impact assessment, offer simplification and special attention to process automation.
→Digital assets and Blockchain: (i) development of internal regulations; (ii) review of proposals in the subsidiaries' pipeline; and (iii) participation of Banco Santander, S.A. in the Fnality pilot, which is under the supervision of the Bank of England and is aimed at making payments between financial institutions via a platform based on blockchain technology.
Key conduct risk lines of action in 2023 | ||||||||||||||
| Objectives | Lines of action | |||||||||||||
 | Continue to enhance conduct risk management with customers | Adapting internal rules and management models to the shifting landscape and customers’ needs. | →Keeping retail customer conduct guidelines consistent with regulation and industry best practice. → Embedding lessons learned from customer conduct risks detected, measured and mitigated by our risk management, especially through first-line self-assessments that boost awareness and accountability. → Exploring advanced analysis and machine learning techniques through the development of algorithms that correlate customer voice data with business indicators to monitor customer’s conduct, embracing innovation and technology for an effective process of corrective measures. | |||||||||||
 | Awareness and accountability of the first line of defence | Raising awareness of conduct risk management and prevention in business and support areas. | →Regularly training our local first- and second-line defence teams on conduct risk. In 2023, we updated mandatory conduct training for all Group employees. → Linking first-line teams’ remuneration to conduct and quality, with a holistic view of branches, online channels, remote customer assistance, and services. | |||||||||||
| Sustainable products and services | Supporting projects relating to the Group’s transition towards a more sustainable economy. | →Transparent reporting on investment products and services for retail customers. → Embedding ESG risks in our management through measurement tools and methodologies that enable us to categorize products appropriately, measure ESG risk and meet customers’ sustainability needs. | |||||||||||
 | Vulnerable customers and special cases | Treating vulnerable customers fairly and appropriately, and making sure we consider their circumstances as part of our services. | →Developing our global vulnerable customer strategy and helping units implement it. → Monitoring collection and recovery indicators every month. → Performing special monitoring of practices for customers who are affected by the rising cost of living, have disabilities, and are senior citizens. | |||||||||||
500
Financial Crime Compliance (FCC)
Financial crime risk is the risk arising from actions or the use of the Group's means, products and services in criminal or illegal activities. Such activity includes money laundering, terrorist financing, violation of international sanctions, corruption, bribery and tax evasion.
Financial crimes are universal, globalised phenomena that take advantage of cross-border economic activity, and thus their detection, deterrence and disruption call for a coordinated global response by the international community and the financial sector.
Our commitment to partnering with law enforcement and competent authorities to disrupt threat finance networks is key to supporting the societies in which the Group operates, including implementing international sanctions programmes aimed at defending human rights and civil liberties, and deterring corruption and armed conflict. We are fully committed to the fight against financial crime and seek continuous improvement in our control framework. Our FCC function continues to identify and develop new approaches, both internally and via public-private partnership, on responding to existing and emerging threats.
Our business functions maintain the primary responsibility for identifying, managing and reporting financial crime risk. We monitor and oversee financial crime risks and promote adequate policies and procedures have been implemented to manage effectively the business within the Group's established risk appetite and supporting the organisation’s risk culture.
The FCC Strategic Transformation Programme has been underway to strengthen the Group’s control framework and operating model, embed a sustainable and dynamic approach to customer due diligence, and implement next generation technological platforms on transaction monitoring and sanctions screening.
Our board of directors and senior management continue to see and reinforce the importance of the FCC Strategic Transformation Programme in order to build the Group’s functional and technical control framework for the future.
Key achievements over 2023 include:
•The publication and transposition of a revised AML/CFT policy, which crystalizes the accountability of the business in managing financial crime risk;
•An enhanced methodology for compliance monitoring to check that all subsidiaries subject to FCC policies and procedures follow a consistent approach to supervising and assessing financial crime risk;
•Restructuring reporting lines and job profiles across the FCC function, under the Group’s target operating model;
•Supporting the Group-wide Anti-Bribery and Corruption Policy (ABC), which aligns to international and supranational guidance such as the Organization for Economic Cooperation and Development Anti-Bribery Convention, with extensive training sessions to target stakeholders across the bank in areas exposed to greater ABC risk;
•Continuing to hub FCC-related activities in newly established operational centres of excellence; and
•Moving into production in various jurisdictions with the Group’s strategic platform for sanctions screening and transaction monitoring, with results indicating strong advancement on screening effectiveness.
In 2023, we continued to focus heavily on the intersection of financial crime compliance and financial inclusion to ensure both objectives can mutually reinforce one another. We provided subject matter expert support to a UN initiative aimed at building a self-assessment diagnostic tool to evaluate a financial institution's 'awareness of modern slavery and human trafficking risks'. And we continue to pursue public-private partnerships focused on disrupting human trafficking and modern-day slavery, for instance in Europol’s Financial Intelligence Public Private Partnership. These initiatives are all part of the Group’s larger commitment to Sustainable Development Goal 8 (SDG 8), Decent Work and Economic Growth, which includes ending modern slavery, trafficking and child labour.
Our capacity building initiatives continue, leveraging in our face-to-face training sessions external guests from law enforcement, regional and international governmental organizations, and key stakeholders from civil society, covering topics like correspondent banking risk, advanced transaction monitoring using artificial intelligence, virtual currencies, data analytics, and human trafficking. Specialist training sessions were also held for stakeholders in the bank with elevated exposure to key risks, such as sanctions and bribery and corruption (for more information see section '2.4 Financial crime compliance and relations with political parties' in Responsible banking chapter), and in-person training to the board of directors focused on emphasizing the interconnectedness between the Group’s focus on an effective FCC framework and advancing on the UN SDG through real examples across our subsidiaries.
We also implemented a FCC MLRO (Money Laundering Reporting Officer) Training Academy in 2023, where the inaugural academy focused on promoting collaboration with other functions within the Group on anti-bribery and corruption compliance, environmental and social risk management, and cyber-security.
The financial sector’s role in supporting national and supra-national diplomacy continued to be a priority for Santander in 2023. Sanctions programmes such as the Global Magnitsky Sanctions, aimed at fighting human rights abuses and corruption, are applied Group wide, and with the on-going war in Ukraine, we continue to enforce sanctions compliance across the Group’s international operations.
Santander FCC function also continues to serve as chair of the United Nations Office on Drugs and Crime’s Private Sector Dialogue on the Financial Disruption of Forestry Crime, now expanded to cover all types of environmental crime. It brings together actors from the public and private sector, as well as civil society, to coordinate on disrupting the financial networks behind environmental crimes. Highlights over 2023 included case studies from the NGO TMT18 on unregulated and illegal fishing, a presentation from the Ukrainian Financial Intelligence Unit on illegal logging and corruption networks supplying Europe, a
18 Non-governmental organization Trygg Mat Tracking
501
nd a demonstration by Santander Brazil on the use of satellite imagery in the due diligence process for assessing illegal deforestation risk in the Amazon.
The FCC function also played a key role in opening the Latin America Chapter of United for Wildlife in July 2023, and collaborates regularly with other initiatives focused on environmental crime, like the recently launched Nature Crime Alliance. Advances on disrupting environmental crime are part of the Group’s larger commitment to SDG19 13, Climate Action.
Highlights over 2023 in our key activities include:
•240,542 disclosures to authorities
•396,482 investigations conducted
•177,298 employees trained
•34 specialised training sessions for experienced FCC staff
Reputational risk
Reputational risk can arise from multiple sources: from business or business support activities, as a consequence of other risks, from the economic, social and political environment or from events related to our competitors. Our reputation could also suffer if we are the subject of negative coverage in the media, whether it has merit or not.
Our reputational risk model takes a preventive management and control approach, with effective handling of early warnings as well as procedures to identify, manage and monitor risk events. It also includes elements for identification, analysis and monitoring of key stakeholders’ perception of Grupo Santander and the financial sector, and how that perception may change. Our model is also aligned with the risk management and control processes (risk profile, risk appetite, ICAAP, emerging risks, among others).
2023 highlights:
We continued to enhance management and control, updating guidelines for certain areas. In particular, we:
•reviewed policies and criteria for action in the financing of sensitive sectors and donations, as well as procedures that develop them;
•collaboration with other areas to prepare greenwashing management and control guidelines in order to determine key processes, duties and governance to identify, assess and manage greenwashing risk and meet regulatory requirements;
•worked with other areas to prepare humanitarian crisis management guidelines in order to set crisis assessment criteria and the Group’s actions;
•analysed the impact and defined preventative and mitigation actions of reputational risks related to climate (e.g. deforestation, fossil fuels, nuclear energy), the cost of living, humanitarian crises, and others;
•enhanced our risk materiality assessment methodology, with the spotlight on climate risk and a more detailed description of the reputational impact assessment for internal capital procedures;
•enhanced event database and reputational risk standardization procedures according to a new identification, assessment, reporting and escalation methodology;
•ran initiatives to share best practices with subsidiaries, including enhancements of collaborative tools and 'Best Practice' workshops;
•updated the corporation’s and subsidiaries’ global reputational risk assessment procedure, including new risks and further developing ESG aspects;
•built on the reputational risk tool that measures stakeholders’ perception of the Group and the financial sector;
•enhanced management consolidation and reporting based on a forward-looking risk approach in the corporation and in subsidiaries; and
•strengthened subsidiary oversight in terms of governance and challenge, and updated subsidiaries' oversight guidelines.
19 Sustainable Development Goals
502
8. Model risk
8.1 Introduction
A model is a system, approach or a quantitative method that applies statistical, economic, financial or mathematical theories, techniques and assumptions to transform data into quantitative estimates.
We use models mainly for credit scoring/rating, performance, capital and provisioning, market and structural risk, operational, compliance and liquidity risk, and financial accounting and control, among others.
The use of models entails certain risks, such as the potential negative consequences of decisions based on poorly developed, poorly implemented or incorrectly used models. Model risk can lead to financial losses, inappropriate business or strategic decisions or damage to the Group's operations.
8.2 Model risk management
The model risk function in Grupo Santander has evolved and matured in recent years, enabling robust management both in the corporation and in the main subsidiaries.
For the proper management of model risk, we have clear internal regulations that establish the principles, responsibilities and processes of the model´s life cycle, and describe their inventory, governance, management and validation.
The intensity of model risk management is relative to the importance of each model. The concept of tiering is the main attribute used to summarise the level of importance of non-regulatory models. The regulatory models, given their particular relevance for the Group, follow the most intense control and management standards.
At Grupo Santander we define the following phases of the model's life cycle:
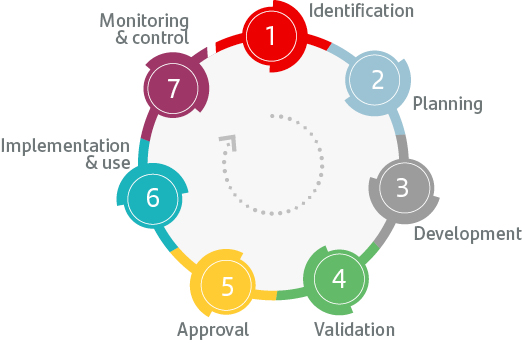
1. Identification
The identified models must be included in the scope of model risk control. For sound management, a complete inventory of all models in use is key. There is a Group centralized inventory, a single platform based on an uniform taxonomy for all models used in the business units. The inventory contains all relevant information of each model, enabling to closely monitor them according to their relevance and the tiering criteria.
2. Planning
An internal annual exercise approved by our subsidiaries’ governance bodies and ratified by the global team, which formulates strategic measures for models managed by the Model Risk area and pinpoints needs for any models to be developed, reviewed or implemented during the year.
3. Development
In this phase, the Model unit contributes to strengthening risk management by developing models and using data in accordance with existing regulatory requirements.
This unit leads the development of models for all types of risks with the spotlight on complying with regulatory expectations (Internal Rating Based Approach -IRB-, IFRS9 and Internal Model Approach -IMA models, among others). To develop models, we have specialized local and global teams. The experts in each geography are responsible for the development of local models, since they know the particularities and needs of each unit, while the global experts define the modelling standards, develop global models and support the geographies in the application of these standards and/or in the development of their own modes if required.
Moreover, we use a boxification methodology that enables us to automate, standardize and maintain the quality of model development.
Throughout the year, the development function has focused mainly on the completion of the IRB repair program, the delivery of stress test models and the development of models for climate change risk management, among others.
At Santander, we believe in the innovation by using machine learning/generative artificial intelligence in a responsible way to develop models. We cooperate with Banco de España on issues related to explainability and control of bias in machine learning models, promoting the use of these new techniques for risks management.
503
4. Internal validation
Independent model validation is a regulatory requirement and key feature of our model risk management and control.
A specialist unit that is totally independent from developers and users issues technical assessments of internal model suitability. These assessments are expressed through a rating that summarizes the model risk associated to it. Validation intensity and frequency are well-defined and risk-driven.
We have an unique validation approach led by the Single Validation Office, which strengthen the second line of defence promoting a consistent and standardized model risk management across the Group. It has allowed a greater decentralised organizational structure.
5. Approval
Before the model´s implementation and use, internal governing bodies must approve it through a governance circuit in place for our model inventory, based on its level of importance.
6. Implementation and use
In this phase, we add new models to our IT systems. Because this is another source of model risk, technical teams and model owners test proper model integration based on methodology and expectations.
7. Monitoring and control
We regularly review models to check they are working correctly and that they are suitable for their purpose. Otherwise, the must be adapted and redesigned. Control teams must pursue that models are managed according to the general model risk framework and other related internal rules.
Main activities in 2023
The MRM Next strategic plan (2022-2025) was launched in 2022 with the aim of strengthening the Group's model risk culture and positioning Santander as a benchmark in this area in the industry. During 2023, the strategy focused on:
•strengthening the binding role of internal validation to meet increasing regulatory requirements;
•definition of the IV Next project to evolve the validation function, prioritising key actions through a global management of validation recommendations and including mitigation elements to focus on the most material risks;
•optimising the exploitation of model risk management data;
•and continuous improvement of regulatory models (IRB and IMA) to ensure that they are fully aligned with supervisory expectations.
504
9. Strategic risk
9.1 Introduction
Strategic risk is the risk of loss or damage arising from strategic decisions or their poor implementation, or from an inability to adapt to external developments, that may impact the long-term interests of our key stakeholders.
Grupo Santander’s business model is a key element of strategic risk, it must be viable, sustainable and capable of generating results in line with the annual objectives and for at least the following three years, in a manner consistent with the Group's long-term vision.
Strategic risk has three components:
| 1 | Business model risk, which includes the risk of the model being out of date, becoming irrelevant and/or losing its capacity to continue generating the desired results. | ||||
| 2 | Strategy design risk, which relates to the strategy and assumptions set out in Grupo’s long-term plan, considering that this plan may be unsuitable in its nature or because of its assumptions, which could result in the Group not achieving the expected results. | ||||
| 3 | Strategy execution risk, which involves the three-year strategic plan and potential deviations from it due to internal and external factors, the lack of capacity to respond to changes in the business environment and the risks associated with corporate development transactions. | ||||
9.2 Strategic risk management
Our strategy and business model pillars are customer focus, our global scale with local presence, and geographical, business and product diversification. Our global businesses are key to driving more value creation, profitability and shareholder remuneration.
Santander views strategic risk as a transversal risk. Subsidiaries refer to our operating model that covers the governance, procedures and necessary tools for robust monitoring and control within board-approved risk appetite.
We constantly monitor changes in competition, regulation, market conditions and our organization to determine if we need to revise strategy and verify mitigating factors and resolution plans. The Strategic Risk team engages with key areas of the first- and second-line of defence to pursue that measures are defined and implemented when necessary.
In 2023, strategic risk centred around macroeconomic uncertainty, with inflation remaining high and a possible overreaction regarding monetary policy; geopolitical risk related to the potential escalation of military conflicts and deterioration
of ties between the US and China; cyber attacks; and execution risk stemming from our transformation initiatives.
Our strategic risk model is based on:
•Challenging strategic plans: With the support of other specialized areas within the Risk division, the Strategic Risk team challenges the three-year financial plan and long-term strategic plan, including a specific chapter in both that identifies potential threats and changes in the environment that could undermine strategic objectives. In 2023, we focused on analysing the plans of our new five global businesses as a driver of value creation in our local markets and globally.
•Emerging risks: Santander proactively identifies, measures, monitors and manages risks that, under stressed scenarios, could have a significant impact on profitability, liquidity and solvency. In 2023, we worked with our local units to enhance our emerging risks identification and assessment.
| |||||
•Analysis of the business model performance: To identify and assess the main threats to the bank’s business plan and strategic objectives in four areas:
•Strategy execution: Assessing the risk of deviation from plans, targets, and strategic and transformation initiatives.
•Viability and sustainability: Assessing our position against competitors and the risk of failing to create shareholder value.
•Business plan volatility: Assessing the risk that our planning will be unstable and profits will not be recurrent in the long term.
•Likelihood of meeting strategic objectives: Risk of failing to achieve our three-year financial plan goals.
•In 2023, we continued developing our business model assessment methodology to consider the peculiarities of our local markets more profoundly.
•New products commercialization: Assessing new product and service proposals before Santander launches them, to check that they are consistent with the Group’s strategy.
•Corporate development transactions: Contributing that transactions of this nature are subject to an assessment of their impact on the risk profile and risk appetite of the Group.
505
•Monitoring strategic projects: The Strategic Risk team works with other areas on drawing up and monitoring strategic projects. Progress with these projects is reviewed twice a year, including an independent challenge from the second line of defence, which is key to assessing strategic risk. In 2023, we delved deeper into the execution risk of our transformation initiatives, including the Retail & Commercial Transformation initiative that brings together our consumer and commercial customers under a common operating model to deliver profitable and sustainable growth.
As the second line of defence, our Corporate Centre and subsidiaries' Strategic Risk teams provide a consolidated view of our exposure to this risk as well as an independent opinion and challenge of first-line of defence activities. The Strategic Risk Report is regularly submitted to senior management, which includes an update on strategy execution, threats and emerging risks, business model performance, corporate development transactions, products commercialization, and strategic projects.
506
10. ESG risk factors
10.1 Introduction
Environmental Managing climate and environmental risk factors is crucial to implementing our strategy, aiding the transition to a low-carbon economy, and fulfilling our ambition to be net zero by 2050. | Social Our social risk management is supported by the definition of several policies and internal frameworks that are leveraged on best practices, conventions, international protocols and codes of conduct in each matter. | Governance The management of risks derived from governance is a relevant aspect in two facets: on the one hand, in the internal governance of the Grupo Santander, and on the other, in the evaluation we make of the governance of our customers. | ||||||||||||||||||||||||||||||
Due to the climate emergency, the data availability and methodology, the environmental aspects within ESG are a focus of attention in the banking industry, among others. For this reason, the following section is more targeted on climate and environmental risks factors, which are considered transversal and likely to have an impact on existing risk typologies such as credit, market, liquidity, operational, reputational and strategic, mainly. These risk factors include the physical effects of climate change and the transition to a low-carbon economy.
Physical risk (PR): effects of climate change on economic activity, labour supply, communities, markets, assets and investors. It comprises:
Acute  | | More intense extreme weather events, such as droughts, hurricanes or floods. | ||||||
Chronic  | | Changes in rainfall patterns, extreme weather variability, average temperature rises, severe heatwaves and rising sea levels. | ||||||
Transition risk (TR): effects of the transition to a low-carbon economy, including changes in regulation, technology and market trends:
Market sentiment  | | Changes in the supply and demand of certain commodities, products and services as they consider climate risk and opportunity, which could lead to reputational and other issues. | ||||||
Policy action  | | Implementing carbon pricing mechanisms to reduce greenhouse gas emissions; using energy sources with lower emissions; adopting energy efficient solutions; and promoting water efficiency measures and more sustainable land use practices. | ||||||
Technology  | | The need to build and innovate to support the transition to an energy efficient financial system with lower CO2 emissions. This can have a significant impact on companies as new technology displaces obsolete systems and disrupts some components of the financial system as we know it. | ||||||
In addition, these factors pose a risk and an opportunity for Grupo Santander and our customers. On the one hand, they can impact on customers’ financial solvency across different time horizons and on banks’ reputations. On the other hand, the urgent transition to a low-carbon economy presents a considerable business opportunity for banks like Santander that are committed to offering increasingly sustainable products and services, supporting our customers in their transition.
507
We measure the impact of the climate and environmental factors of each risk type across several time horizons. This table shows pre-mitigation impact, our progress with climate matters in 2023, and next steps:
| Risk type | Key climate drivers1 | Main time horizon2 | Potential impact on climate risk factors | What we’re doing to manage climate risk | Next steps | ||||||||||||||||||
| Credit | | Medium-long term | →Extreme weather can lead to higher retail and corporate loan default and lower collateral value. It can also cause income to fall, harm agriculture, and increase insurance coverage and premiums. Moreover, changes in wind patterns that reduce energy production can lead to higher operating costs and hamper productivity. This may increase asset depreciation and early disposal due to property damage in 'high risk' locations. →A failure by borrowers to adapt their business models to a low-carbon economy could heighten credit risk and, therefore, the risk of a reduction in income or activity that may increase default or cause the business to lose value. →Adverse weather conditions can cause significant financial loss, endanger communities, harm the environment and affect the value of guarantees. →Market sentiment that influences demand; obsolete technology; customer preferences. →Higher operating costs for carbon-intensive customers; information requirements (data gathering), especially on emissions (e.g. Scope 3) and green taxonomy disclosures; and new EU financial information directives stemming from government measures. | →Conducting materiality assessments to spot physical and transition risk in our portfolios. →Analysing short-, medium- and long-term risk concentration by sector and region. →Creating heatmaps that follow orderly, disorderly and Hot House World scenarios up to 2050. →Implementing mitigation measures such as policies, thresholds and insurance to combat risks and their impact. →Conducting scenario analyses and measuring sensitivities to forecast changes in ratings, PD and LGD in view of physical and transition risk. →Drawing up credit risk metrics to monitor and control E&CC3 risk factors in BAU processes. →Measuring E&CC factors in customer and transaction analysis and ratings. →Setting risk appetite limits and alerts to manage climate-related sectors. | →Run the second phase of 'Climate Race', our credit risk target operating model for climate and environmental factors and embedding of E&CC factors in the entire credit cycle to pinpoint and mitigate physical and transition risk. →Include climate factors in internal physical and transition risk models and embed scenario analysis techniques in risk management through a forward-looking approach by sector and geography. →Develop tools to monitor E&CC factors that consider physical and transition risk in the property sector. | ||||||||||||||||||
| Market | | Short-Medium term | →Higher volatility in market factors under stress scenarios. →Changes in market perception leading to wider credit spreads for business in impacted sectors. | →Regular reviews of climate stress scenarios and subsidiaries that apply them. →Stress testing using physical and transition risk scenarios. →Portfolio analysis of current exposure to climate-sensitive business activities. | →Enhancing analysis of material climate impact on trading portfolios to help with future sector-based stress testing. →Enriching stress testing and reviewing new scenarios to be included. →Adapting stress testing to best market practices. | ||||||||||||||||||
| Liquidity | | Short-Medium term | →Market impacts on the value of high quality liquid assets in Santander's liquidity buffer. →More frequent extreme weather stifling economic growth in countries susceptible to climate change, causing sovereign debt to rise and limiting access to capital markets. →Cash outflows from companies trying to boost their reputation in the market or solve problems with climate scenarios. | →Qualitative and quantitative climate scenario analyses of impacts on highly liquid assets (HQLAs) and financing of exposed companies. →Analysis of higher outflows due to changes in market perception of corporations in climate-sensitive business activities. | →Enhancing stress testing and reviewing new scenarios to be included. →Adapting stress testing to best market practices, including new liquidity scenarios to measure their impact. | ||||||||||||||||||
508
| Risk type | Key climate drivers1 | Main time horizon2 | Potential impact on climate risk factors | What we’re doing to manage climate risk | Next steps | ||||||||||||||||||
| Operational | | Medium-long term | →Severe climate events can cause damage to our assets, including branches, offices and data centres. They can also affect business continuity, processes and staff. →Climate-related factors can also lead to operational risk losses from litigation (e.g., if a bank is perceived to misrepresent sustainability-related practices). | →Conducting operational risk and control self-assessments that include ESG-related risks to evaluate our exposure. →Conducting mandatory operational risk scenario analysis that covers physical and transition risk. →Adding ESG flag to the operational risk events database to classify incidents and environmental- and climate-related losses. →Including an assessment of climate threats in business continuity scenarios. | →Enhance operational risk reporting on climate-related factors. →Update documentation and provide training on the embedding of ESG factors in operational risk management. | ||||||||||||||||||
| Reputational | | Short-medium-long term | →Customers, investors and other stakeholders who believe banks aren't doing enough to meet low-carbon targets, act against their policies or that their public commitments can pose reputational risk. →Misleading customers, investors and stakeholders with statements, actions, announcements, policies and the sustainability features of products or 'greenwashing' practices. | →Updating climate and environmental risk policies and procedures. →Addressing reputational risk through corporate credit committees that assess sensitive transactions that involve climate and environmental risk. →Holding formal meetings to review reputational issues (including climate matters), involving the legal, responsible banking, investor relations, risk and other teams. →Implementing proactive measures to support companies’ green transition and decarbonization. | →Continue driving cooperation between the reputational risk area and other teams to address reputational impact. →Conduct a materiality assessment to measure climate-related and environmental reputational risk. →Implement a methodology to quantify the reputational impact of climate and environmental risk. | ||||||||||||||||||
| Strategic | | Short-medium-long term | →A failure to achieve our climate and environmental targets, including those relating to our own and our customers’ operations, could affect our strategy. | →Checking that ESG targets are embedded in the Group’s strategic planning. →Monitoring the Group’s strategic 'Climate change' project, including net zero KPIs. →Identifying emerging risks, which includes an ESG risk event and analysis of how low-probability stress scenarios might impact on the Group’s strategic targets to draw up suitable action plans. →Monitoring ESG initiatives presented at the corporate product governance forum (CGPF) and investors’ forum. →Reviewing ESG factors and KPIs in the business model. | →Continue monitoring climate and environmental threats as part of emerging risk identification. →Revise ESG KPIs regularly so that they remain consistent with the Group’s strategy. →Continue reviewing ESG factors in relation to business model performance. | ||||||||||||||||||
1. Though all climate drivers impact on risk factors, we have only included the key ones in this table.
2. Short term: up to one year. Medium term: up to three years. Long term: five years and beyond.
3. E&CC: environmental and climate change.
Acute Chronic Market sentiment Policy action Technology509
10.2 ESG factors risk management
As part of our climate and environmental risk factors management, we are gradually introducing decarbonization targets in sectors that are considered 'highly polluting', as well as embedding climate and environmental factors in our risk management and cross-cutting enterprise risk management processes, such as our risk appetite and in the emerging risks identification exercise. One of the elements that has contributed to integrating these factors into our strategy is their inclusion in the credit granting and monitoring process.
| For more information regarding climate and environmental risks factors, see our 'Climate Finance Report' on our corporate website. | ||||
We identify and assess the factors that are most material to each risk type.
The following chart describes how we are integrating climate and environmental factors into the risk management cycle.
Identification
Through the exercise of emerging risks related to climate change (which have a climate subcategory and a biodiversity subcategory), we evaluate internal and external threats that could affect our profitability, solvency or strategy.
Our emerging risks exercise focuses on ESG risks, such as greenwashing, the environment and biodiversity.
Planning
As part of our public sustainability commitments, we included decarbonization targets in strategic planning, with separate time horizons: short-term budget (one year); medium-term financial plan (three years); long-term strategic plan (five years); and ad hoc analysis.
Assessment
We use materiality assessments, quantitative and qualitative heatmaps, scenario analyses and other tools and techniques to analyse the potential impact of climate and environmental factors on our portfolios. For instance, we run a quarterly materiality assessment to pinpoint the loan portfolios with the highest physical and transition risk.
Our automated corporate tool 'Klima' enables us to monitor the Group’s loan portfolios. This tool includes forward-looking analysis of companies’ performance by sector and geography, using orderly, disorderly and hot house world scenario analyses to calculate physical and transition risk impact across several time horizons. In 2023, we added a physical risk assessment module for collateral and customer portfolios, which we break down by economic activity. Our physical and transition risk assessments rate each sector on a 5-point scale from 'Low' to 'Very high'.
The following table shows the latest materiality analysis prepared by the Group with data at the end of Q3 2023.
Materiality assessment - Climate risk analysis and portfolio heatmap | |||||||||||||||||
| September 2023 (pre-mitigation) - EUR billion | |||||||||||||||||
| TR | PR | CIB | Other segments | ||||||||||||||
| Power (conventional) | 28 | 2 | |||||||||||||||
Power (renewables) | 12 | 0 | |||||||||||||||
| Oil & Gas | 23 | 1 | |||||||||||||||
| Mining y metals | 14 | 8 | |||||||||||||||
| Transport | 28 | 12 | |||||||||||||||
Auto Consumer | 0 | 159 | |||||||||||||||
| Real Estate | 8 | 388 | |||||||||||||||
Other climate-related sectors | Agriculture | 2 | 9 | ||||||||||||||
| Construction | 17 | 14 | |||||||||||||||
| Manufacturing | 49 | 26 | |||||||||||||||
| Water & Waste | 3 | 1 | |||||||||||||||
| Climate sectors | 184 | 620 | |||||||||||||||
| Other sectors | 58 | 230 | |||||||||||||||
| Total portfolio | 242 | 850 | |||||||||||||||
¢ Low ¢ Moderately Low ¢ Medium ¢ High ¢ Very High | |||||||||||||||||
TR: transition risk. PR: physical risk. CIB: REC (on and off-balance sheet lending + guarantees + derivatives PFE: Potential Future Exposure). Other segments: Drawn amount; includes individuals, SCF, Auto US, Corporates and Institutions, and SMEs. Other sectors: considered as low risk; include: CIB, Corporate and SMEs outside the risk taxonomy perimeter // Individuals and SCF: cards and other consumer credit // Private Banking (excl. mortgages). Exposure 0 represents exposure below EUR 500 million. | |||||||||||||||||
Finally, we highlight the methodological progress made in our materiality assessment, with improvements to the scope of the existing methodology, including a more holistic view of how climate and environmental factors can impact the main types of risks set out in our framework.t
| For more information regarding our materiality assessment, see our 'Climate Finance Report' on our corporate website. | ||||
510
Monitoring
At Grupo Santander, we constantly monitor the risk profile and our compliance with risk appetite limits through control functions that report to the board. From 2021, we have been enhancing our risk appetite statement with a quantitative metric for thermal coal counterparties, energy and mining related customers. Moreover, we have a decarbonization roadmap to set risk appetite limits that are consistent with our commitments for 2030. In 2023, we approved new quantitative metrics — adding to the ones we set for thermal coal and power — for oil and gas, steel, and aviation, which we will implement and monitor in 2024. For the automotive sector, we are making progress in designing a metric for approval in 2024.
We are in permanent contact with our customers to monitor and support their transition planning. Specifically, we continue to embed environmental, social and climate change (ESCC) risk factors into the credit risk granting and monitoring process, through our operating model, 'The Climate Race'. This model is underpinned by the following pillars: strategic planning, risk management, loan approval and tracking, models and systems, and culture and governance. The timeline to implement it ends in late 2024, when we expect to have met supervisory expectations and to have rolled out a common strategy for the whole Group.
Mitigation
Policies are key to mitigating climate and environmental risk factors. Our ESCC policy sets out our public commitments and aims to support our strategy for sensitive and prohibited activities in the oil and gas, power generation and transmission, mining and metals sectors, and those derived from businesses dedicated to soft commodities.
We also have internal policies and frameworks that include climate and environmental factors in risk management. Our credit granting policies consider climate and environmental factors through our internal taxonomy (SFICS), credit committees, CIB rating and Corporate clients, collateral management, and other means. Moreover, we continue to use insurance and compensation funds to mitigate climate risks.
Throughout 2023, Grupo Santander has promoted a wide range of specific training on ESG matters, with the aim of raising employee awareness, both through internal continuous training and through international certifications for those professionals directly involved in this subject. In addition, we have best case studies, to establish the best practices regarding the integration of climate and environmental factors in the credit cycle.
Finally, another mitigation element is the multidisciplinary working group on ESG controversies, coordinated by the reputational risk function and where any matter that may have a reputational impact derived from said controversies is escalated.
Reporting
Transparent and regular reports to senior managers and stakeholders help us manage climate and environmental factors and comply with the law and supervisors’ expectations.
Our reporting on climate and environmental risk management includes our Annual Report, the Climate Finance Report, the ICAAP exercise, and our Pillar III disclosures report.
Our approach to nature and biodiversity
At Grupo Santander we know some of our customers’ endeavours may have bad consequences for the environment. That’s why it’s crucial we assess and mitigate whatever negative role our lending may play in harming nature.
We run two simultaneous exercises under an internal risk assessment methodology to assess environmental impact and dependency. We take a qualitative score to measure each sector's sensitivity to ecosystem services.
Our findings enable us to decide on the key parameters of risk assessments for customers whose activity may be affected by the degradation of ecosystem services and the destruction of the environmental and biodiversity-related assets in the coming years.
In 2023, we followed the TNFD (Taskforce on Nature-related Financial Disclosures) recommendations on environmental risk assessments to analyse our corporate portfolio. We focused on a heatmap to determine and compare the portfolio’s physical and transition risks and the level of threat of potential environmental and biodiversity events that may have a negative impact on Santander’s customers. These events can come from physical risks such as the organization’s dependency on the environment; or from transition risks related to government measures, advances in technology, market shifts, litigation, and changes in customer preferences.
511
Main activities in 2023
→In 2023 we began our participation in the Fit-for-55 Climate Risk Scenario Analysis regulatory exercise, established by the EBA to verify the resilience of Financial Institutions to meet the climate objectives of the European Green Deal defined by the Commission. The exercise will also be extended to 2024.
→Advances in risk appetite, establishing new metrics and limits to support the bank's decarbonization strategy.
→Progress in our materiality assessment' methodology, with improvements in the scope of the existent methodology, including a more holistic view of how climate and environmental factors can impact the main risk types established in our corporate framework.
→Advances in the analysis of materiality in terms of biodiversity, through an internal assessment methodology of both impacts related to nature and its dependencies.
→Improvements in the identification, prevention and control of potential sources of greenwashing allegations.
→Progress in the implementation of the climate risk management model through the 'Climate Race' initiative to integrate ESCC factors into the credit risk granting process.
→Advances in the identification and management of physical risks, including improvements in data sources and their granularity, as well as their implementation in our monitoring tool (Klima).
512
Glossary of terms, acronyms and abbreviations
| 2023 AGM | Annual general shareholders’ meeting of Banco Santander held on 31 March 2023 at second call | ||||
| 2024 AGM | Annual general shareholders’ meeting of Banco Santander called for 21 or 22 March 2024 at first or second call, respectively | ||||
| ABC | Anti-bribery and corruption | ||||
| Act 10/2014 | Act 10/2014, of 26 June, on the organization, supervision and solvency of credit institutions | ||||
| Active customer | Those customers who comply with the minimum balance, income and/or transactionality requirements as defined according to the business area | ||||
| ADR | American depositary receipts | ||||
| ADS | American depositary shares | ||||
| AEOI | Automatic Exchange of Information standard | ||||
| AI | Artificial intelligence | ||||
| ALCO | Assets and liabilities committee | ||||
| ALM | Asset and liability management | ||||
| AML | Anti-money laundering | ||||
| API | Application programming interface | ||||
| APM | Alternative performance measure | ||||
| APS | Amherst Pierpont Securities | ||||
| AuM | Assets under management | ||||
| Banesto | Banco Español de Crédito, S.A. | ||||
| BCMS | Business continuity management system | ||||
| BCP | Business continuity plan | ||||
| bn | Billion | ||||
| BNPL | Buy-now-pay-later. Short-term financing that allows consumers to make purchases and pay for them at a future date | ||||
| BoE | Bank of England | ||||
| bps | Basis points | ||||
| BRRD | Directive 2014/59/EU establishing a framework for the recovery and resolution of credit institutions and investment firms, as amended from time to time | ||||
| Bylaws | Bylaws of Banco Santander, S.A. | ||||
| CAE | Chief Audit Executive | ||||
| CAGR | Compounded annual growth rate | ||||
| CAO | Chief Accounting Officer | ||||
| CARF | Conselho Administrativo de Recursos Fiscais (Administrative Council for Tax Appeals) | ||||
| CBDC | Central bank digital currency | ||||
| CCCA | Collective Commitment to Climate Action | ||||
| CCO | Chief Compliance Officer | ||||
| CCPS | Contingent convertible preferred stock | ||||
| CCR | Counterparty credit risk | ||||
| CCSM | Code of Conduct in Securities Markets | ||||
| CDI | CREST Depositary Interests | ||||
| CEO | Chief Executive Officer | ||||
| CFO | Chief Financial Officer | ||||
| CFT | Combating the financing of terrorism | ||||
513
| CHF | Swiss franc | ||||
| CIB | Corporate & Investment Banking | ||||
| CIO | Chief Information Officer | ||||
| CNBV | Comisión Nacional Bancaria y de Valores (Mexican stock market authority) | ||||
| CNMV | Comisión Nacional del Mercado de Valores (Spanish stock market authority) | ||||
| CoE | Cost of equity | ||||
| COFINS | Contribuiçao para Financiamiento da Seguridade Social (Contribution for Social Security Financing) | ||||
| Constant euros | Excluding exchange rates impact | ||||
| COSO | Committee of Sponsoring Organizations of the Treadway Commission | ||||
| Costs in real terms | Costs excluding the effect of average inflation over the last twelve months | ||||
| CPGF | Corporate product governance forum | ||||
| CRD | Capital Requirements Directive | ||||
| CRE | Credit risk equivalent | ||||
| CRO | Chief Risk Officer | ||||
| CRR | Regulation (EU) 575/2013 on prudential requirements for credit institutions and investment firms, as amended from time to time | ||||
| CRS | Common reporting standards | ||||
| CSA | Credit Support Annex | ||||
| CSLL | Contribuçao Social sobre o Lucro Liquido (Social Contribution on Net Profit) | ||||
| CSRBB | Credit spread risk in the banking book | ||||
| CSRD | Corporate Sustainability Reporting Directive | ||||
| CVA | Credit valuation adjustment | ||||
| DCB | Digital Consumer Bank | ||||
| Digital customer | Every consumer of commercial banking services who has logged on to their personal online banking and/or mobile banking in the last 30 days | ||||
| DNSH | Do not significant harm | ||||
| DORA | Digital Operational Resilience Act | ||||
| DPO | Data protection officer | ||||
| DTA | Deferred tax asset | ||||
| DVA | Debt valuation adjustment | ||||
| E&CC | Environmental and climate change related | ||||
| EAD | Exposure at default | ||||
| EBA | European Banking Authority | ||||
| EBITDA | Earnings before interest, taxes, depreciation and amortization | ||||
| ECB | European Central Bank | ||||
| EIB | European Investment Bank | ||||
| EIOPA | European Insurance and Occupational Pensions Authority | ||||
| EMIR | European Market Infrastructure Regulation | ||||
| eNPS | Employee Net Promoter Score is a method of measuring employee satisfaction | ||||
| EOIR | Exchange Of Information on Request standard | ||||
| EPC | Energy performance certificate | ||||
| EPS | Earnings per share | ||||
| Equal pay gap | The equal pay gap measures differences in remuneration between women and men in the same job at the same level | ||||
| ESCC | Environmental, social and climate change related | ||||
| ESG | Environmental, social and governance | ||||
| ESMA | European Securities and Markets Authority | ||||
| ESRS | European Sustainability Reporting Standards | ||||
| EU | European Union | ||||
| EV | Electric vehicle | ||||
514
| EVA | Economic value added | ||||
| EVP | Employee value proposition | ||||
| FATCA | Foreign Account Tax Compliance Act | ||||
| FCA | Financial Conduct Authority | ||||
| FCC | Financial crime compliance | ||||
| Fed | Federal Reserve | ||||
| Financial inclusion | Number of people who are unbanked, underbanked, in financial difficulty, with difficulties in accessing credit who, through the Group's products and services, are able to access the financial system or receive tailored finance. Financially underserved groups are defined as people who do not have a current account, or who have an account but obtained alternative (non-bank) financial services in the last 12 months. Beneficiaries of various programmes are included in the quantification process only once in the entire period. Only new empowered people are counted, taking as a base year those existing since 2019 | ||||
| First 2023 Buyback Programme | First buyback programme carried out within the 2023 shareholder remuneration policy | ||||
| FL CET1 | Fully-Loaded Common Equity Tier 1 | ||||
| FRTB | Fundamental review of the trading book | ||||
| FSB | Financial Stability Board | ||||
| FX | Foreign exchange | ||||
| G-SIB | Global systemically important bank | ||||
| GAR | Green asset ratio | ||||
| GBP | Sterling pound | ||||
| GCC | General Code of Conduct | ||||
| GDP | Gross Domestic Product | ||||
| GDPR | General Data Protection Regulation | ||||
| Gender pay gap | The gender pay gap measures differences in remuneration between women and men in an organization, business, industry or the broader economy, irrespective of the type of work | ||||
| GFANZ | Glasgow Financial Alliance for Net Zero | ||||
| GHG | Greenhouse gases | ||||
| GMRA | Global master repurchase agreement | ||||
| GRC | Governance, risk and compliance | ||||
| GRI | Global Reporting Initiative | ||||
| GSGM | Group-Subsidiary governance model | ||||
| GTB | Global transactional banking | ||||
| HQLA | High-quality liquid assets | ||||
| HtC | Held to collect | ||||
| ICAAP | Internal capital adequacy assessment process | ||||
| ICAC | Instituto de Contabilidad y Auditoría de Cuentas (Institute of accounting and auditing) | ||||
ICE | Internal combustion engines | ||||
| ICFR | Internal control over financial reporting | ||||
| ICO | Instituto Oficial de Crédito (Spanish public credit institution) | ||||
| ICS | Internal control system | ||||
| Identified staff | Other executives whose activities may have a significant impact on the Group's risk profile | ||||
| IEA | International Energy Agency | ||||
| IFRS | International Financial Reporting Standards | ||||
| ILAAP | Internal liquidity adequacy assessment process | ||||
| IMA | International model approach | ||||
| IMF | International Monetary Fund | ||||
| IOSCO | International Organization of Securities Commissions | ||||
| IPO | Initial Public Offering | ||||
| IRB | Internal ratings-based | ||||
515
| IRC | Incremental risk charge | ||||
| IROs | Impacts, risks and opportunities | ||||
| IRPJ | Imposto sobre a Renda das Pessoas Jurídicas (Corporate Income Tax) | ||||
| IRRBB | Interest rate risk in the banking book | ||||
| ISMA | International Securities Market Association | ||||
| JPY | Japanese yen | ||||
| KOR | Key operational risks | ||||
| KPI | Key performance indicators | ||||
| KRI | Key risk indicators | ||||
| LCR | Liquidity coverage ratio | ||||
| LDA | Loss distribution approach | ||||
| LGD | Loss given default | ||||
| LLP | Loan-loss provisions | ||||
| Loyal customer | Active customers who receive most of their financial services from the Group according to the commercial segment to which they belong. Various loyalty customer levels have been defined taking profitability into account | ||||
| LTD | Loan to deposit ratio. Ratio of loans and advances to customers over customer deposits | ||||
| LTV | Loan to value ratio. Ratio of loans and advances to customers to the value of the asset used as collateral | ||||
LUC | Land use change (cambio en el uso del terreno) | ||||
| M/LT | Medium-and long-term | ||||
| Material Risk Taker | Other executives whose activities could have a significant impact on the Group's risk profile | ||||
| MDA | Maximum distributable amount | ||||
| MiFID | Markets in Financial Instruments Directive | ||||
| MILRO | Money Laundering Reporting Officer | ||||
| mn | Million | ||||
| MRAP | Market risk advanced platform | ||||
| MREL | Minimum requirements for own funds and eligible liabilities which are required under the BRRD | ||||
| MSS | Minimum social safeguards | ||||
| NACE | Nomenclature of Economic Activities of the European Union | ||||
| NFR | Non-financial risk | ||||
| NGFS | Network for greening the financial system | ||||
| NGO | Non-governmental organization | ||||
| NGO TMT | Non-governmental organization Trygg Mat Tracking | ||||
| NII | Net interest income | ||||
| NPL | Non-performing loans | ||||
| NPS | Net Promoter Score | ||||
| NSFR | Net stable funding ratio | ||||
| NYSE | New York Stock Exchange | ||||
| NZAMi | Net Zero Asset Managers initiative | ||||
| NZBA | Net Zero Banking Alliance | ||||
| NZE | Net zero emissions | ||||
| OECD | Organization for Economic Cooperation and Development | ||||
| OEM | Original equipment manufacturer | ||||
| OTC | Over-the-counter | ||||
| P&L | Profit and loss statement | ||||
| PBT | Profit before taxes | ||||
| PCAF | Partnership for Carbon Accounting Financials | ||||
| PCAOB | Public Company Accounting Oversight Board | ||||
| PD | Probability of default | ||||
516
| PHEV | plug-in hybrid electric vehicle | ||||
| PIS | Programa de Integraçao Social (Social Integration Programme) | ||||
| POCI | Purchased or originated credit impaired | ||||
| PoS | Point of sale | ||||
| pp | Percentage point | ||||
| PRA | Prudential Regulation Authority | ||||
PRB | Principles for responsible banking | ||||
| PSD2 | Payment Services Directive Two | ||||
| RAS | Risk appetite statement | ||||
RBF | Responsible banking forum | ||||
| RBSCC | Responsible banking, sustainability and culture committee | ||||
| RCP | Representative concentration pathway | ||||
| RCSA | Risk control self-assessment | ||||
| Repos | Repurchase agreements | ||||
| RoA | Return on assets | ||||
| RoE | Return on equity | ||||
| RoRWA | Return (net of tax) on risk weighted assets for a particular business | ||||
| RoTE | Return on tangible equity | ||||
| RPA | Risk profile assessment | ||||
RPK | Revenue passenger kilometers | ||||
| RWA | Risk-weighted assets | ||||
| S&P 500 | Index maintained by S&P Dow Jones Indices LLC | ||||
| SAM | Santander Asset Management | ||||
| SBNA | Santander Bank N.A. | ||||
| SBTi | Science Based Targets initiative | ||||
| SBTN | Science Based Targets Network | ||||
| SC USA | Santander Consumer US | ||||
| SCF | Santander Consumer Finance | ||||
| SCIB | Santander Corporate & Investment Banking | ||||
| SDG | Sustainable development goals | ||||
| SEC | Securities and Exchange Commission | ||||
| Second 2023 Buyback Programme | Second share buyback programme charged against 2023 results | ||||
| SFDR | Sustainable Finance Disclosure Regulation | ||||
| SFICS | Sustainable finance and investment classification system | ||||
| SHUSA | Santander Holding USA, Inc | ||||
| SME | Small and medium enterprises | ||||
| SOx | Sarbanes-Oxley Act of 2002 | ||||
| Spanish Corporate Governance Code | CNMV's Good Governance Code for Listed Companies | ||||
| Spanish Securities Markets Act | Act 6/2023, of 17 March, on the Securities Markets and on Investment Services | ||||
| SPC | Strategic commercial plans | ||||
| SPF | Simple, Personal and Fair | ||||
| SRB | European Single Resolution Board | ||||
| SREP | Supervisory review and evaluation process | ||||
| SRI | Socially responsible investment | ||||
| SRT | Significant risk transfer | ||||
| SSM | Single Supervisory Mechanism. The system of banking supervision in Europe. It is composed of the ECB and the competent supervisory authorities of the participating EU countries | ||||
517
| STEM | Science, Technology, Engineering, Mathematics | ||||
| STR | Suspicious transaction reporting | ||||
| T&O | Technology & operations | ||||
| TCFD | Task Force on Climate-related Financial Disclosures | ||||
| TLAC | Total loss-absorbing capacity requirement which is required to be met under the CRD V package | ||||
| TLTRO | Targeted longer-term refinancing operations | ||||
| TNAV | Tangible net asset value | ||||
| TNFD | Taskforce on Nature-related Financial Disclosure | ||||
| TOM | Target operating model | ||||
| TPV | Total payments volume | ||||
| TRIM | Targeted review of internal models | ||||
| TSR | Total shareholder return | ||||
| UK | United Kingdom | ||||
| UNEP FI | United Nations Environmental Programme Finance Initiative | ||||
| US | United States of America | ||||
| USD | United States dollar | ||||
| VaR | Value at risk | ||||
| VAT | Value added tax | ||||
vkm | Vehicle-kilometer | ||||
| WBCSD | World Business Council for Sustainable Development | ||||
| YoY | Year-on-Year | ||||
518
Auditor's report and consolidated financial statements | |||||
 | |||||
519
Consolidated statements of recognised income
and expense for the years ended 31 December
2023, 2022 and 2021 538
and expense for the years ended 31 December
2023, 2022 and 2021 538
Consolidated statements of changes in total equity for
the years ended 31 December 2023, 2022 and 2021 539
the years ended 31 December 2023, 2022 and 2021 539
1. Introduction, basis of presentation of the
consolidated financial statements (consolidated
annual accounts) and other information 548
consolidated financial statements (consolidated
annual accounts) and other information 548
4. Distribution of Banco Santander’s profit, shareholder
remuneration scheme and earnings per share 583
remuneration scheme and earnings per share 583
520
Auditor's report | |||||
 | |||||
521
[Page intentionally left blank] 1 of 6
522
[Page intentionally left blank] 2 of 6
523
[Page intentionally left blank] 3 of 6
524
[Page intentionally left blank] 4 of 6
525
[Page intentionally left blank] 5 of 6
526
[Page intentionally left blank] 6 of 6
527
REPORT OF INDEPENDENT REGISTERED PUBLIC ACCOUNTING FIRM
To the Board of Directors and Shareholders of Banco Santander, S.A.:
Opinions on the Financial Statements and Internal Control over Financial Reporting
We have audited the accompanying consolidated balance sheets of Banco Santander, S.A. and its subsidiaries (the “Company”) as of December 31, 2023, 2022 and 2021, and the related consolidated income statements, statements of recognised income and expense, statements of changes in total equity and statements of cash flows for each of the three years in the period ended December 31, 2023, including the related notes (collectively referred to as the “consolidated financial statements”). We also have audited the Company’s internal control over financial reporting as of December 31, 2023, based on criteria established in Internal Control - Integrated Framework (2013) issued by the Committee of Sponsoring Organizations of the Treadway Commission (COSO).
In our opinion, the consolidated financial statements referred to above present fairly, in all material respects, the financial position of the Company as of December 31, 2023, 2022 and 2021, and the results of its operations and its cash flows for each of the three years in the period ended December 31, 2023 in conformity with International Financial Reporting Standards as issued by the International Accounting Standards Board. Also in our opinion, the Company maintained, in all material respects, effective internal control over financial reporting as of December 31, 2023, based on criteria established in Internal Control - Integrated Framework (2013) issued by the COSO.
Basis for Opinions
The Company’s management is responsible for these consolidated financial statements, for maintaining effective internal control over financial reporting, and for its assessment of the effectiveness of internal control over financial reporting, included in Management’s Report on Internal Control over Financial Reporting appearing under Item 15. Our responsibility is to express opinions on the Company’s consolidated financial statements and on the Company’s internal control over financial reporting based on our audits. We are a public accounting firm registered with the Public Company Accounting Oversight Board (United States) (PCAOB) and are required to be independent with respect to the Company in accordance with the U.S. federal securities laws and the applicable rules and regulations of the Securities and Exchange Commission and the PCAOB.
We conducted our audits in accordance with the standards of the PCAOB. Those standards require that we plan and perform the audits to obtain reasonable assurance about whether the consolidated financial statements are free of material misstatement, whether due to error or fraud, and whether effective internal control over financial reporting was maintained in all material respects.
Our audits of the consolidated financial statements included performing procedures to assess the risks of material misstatement of the consolidated financial statements, whether due to error or fraud, and performing procedures that respond to those risks. Such procedures included examining, on a test basis, evidence regarding the amounts and disclosures in the consolidated financial statements. Our audits also included evaluating the accounting principles used and significant estimates made by management, as well as evaluating the overall presentation of the consolidated financial statements.
Our audit of internal control over financial reporting included obtaining an understanding of internal control over financial reporting, assessing the risk that a material weakness exists, and testing and evaluating the design and operating effectiveness of internal control based on the assessed risk. Our audits also included performing such other procedures as we considered necessary in the circumstances. We believe that our audits provide a reasonable basis for our opinions.
Definition and Limitations of Internal Control over Financial Reporting
A company’s internal control over financial reporting is a process designed to provide reasonable assurance regarding the reliability of financial reporting and the preparation of financial statements for external purposes in accordance with generally accepted accounting principles. A company’s internal control over financial reporting includes those policies and procedures that (i) pertain to the maintenance of records that, in reasonable detail, accurately and fairly reflect the transactions and dispositions of the assets of the company; (ii) provide reasonable assurance that transactions are recorded as necessary to permit preparation of financial statements in accordance with generally accepted accounting principles, and that receipts and expenditures of the company are being made only in accordance with authorizations of management and directors of the company; and (iii) provide reasonable assurance regarding prevention or timely detection of unauthorized acquisition, use, or disposition of the company’s assets that could have a material effect on the financial statements.
Because of its inherent limitations, internal control over financial reporting may not prevent or detect misstatements. Also, projections of any evaluation of effectiveness to future periods are subject to the risk that controls may become inadequate because of changes in conditions, or that the degree of compliance with the policies or procedures may deteriorate.
Critical Audit Matters
The critical audit matters communicated below are matters arising from the current period audit of the consolidated financial statements that were communicated or required to be communicated to the audit committee and that (i) relate to accounts or disclosures that are material to the consolidated financial statements and (ii) involved our especially challenging, subjective, or complex judgments. The communication of critical audit matters does not alter in any way our opinion on the consolidated financial statements, taken as a whole, and we are not, by communicating the critical audit matters below, providing separate opinions on the critical audit matters or on the accounts or disclosures to which they relate.
Estimation of impairment of financial assets at amortised cost– loans and advances to customers
As described in Notes 2,10 and 54 to the consolidated financial statements, the Company’s financial assets at amortised cost – loans and advances to customers - were EUR 1,009,845 million as of December 31, 2023, and its estimation of impairment of financial assets at amortised cost – loans and advances to customers – was EUR 12,912 million for the year ended December 31, 2023. The Company assesses impairment by estimating the expected credit losses based on the stage in which each financial asset is classified. Management’s collective assessment of expected credit losses consider instruments with
528
similar credit risk characteristics that are indicative of debtors’ capacity to pay. The methodology required to estimate the expected credit losses due to credit events is based on an unbiased and weighted consideration by the probability of occurrence of a series of scenarios. The estimation of expected credit losses requires expert judgment and the support of historical, current and future information, including considering management overlays. The probability of loss is measured considering past events, the present situation and future trends of macroeconomic scenarios.
The principal considerations for our determination that performing procedures relating to the estimation of the impairment of financial assets at amortised cost – loans and advances to customers is a critical audit matter are (i) the significant judgment by management in determining the collective assessment of the expected credit losses; (ii) a high degree of auditor judgment, subjectivity and effort in performing procedures relating to the models and assumptions used to determine the expected credit losses; and (iii) the audit effort involved the use of professionals with specialized skill and knowledge.
Addressing the matter involved performing procedures and evaluating audit evidence in connection with forming our overall opinion on the consolidated financial statements. These procedures included testing the effectiveness of controls relating to management’s expected credit loss estimation process, which included controls over the data, models and assumptions used in the estimation process, including management overlays to the models. These procedures also included, among others, (i) evaluating, on a test basis, models with respect to the estimation criteria and calculation, the models utilized for the estimation of the expected loss parameters, the appropriateness of the methodology used for the generation of the macroeconomic scenarios, the completeness and accuracy of data provided by management, and the reasonableness of management’s criteria for significant increase in credit risk and loan classification by stages; (ii) testing the mathematical accuracy of the impairment calculation for the credit portfolios; (iii) evaluating the reasonableness of the management overlays to the models made by management, if applicable; and (iv) evaluating a sample of individual credit files to determine the reasonableness of management’s classification, discounted cash flows and, where appropriate, corresponding impairment. Professionals with specialized skill and knowledge were used to assist in evaluating the appropriateness of the models used by management and evaluating the reasonableness of assumptions used in the impairment estimation for the credit portfolios.
Goodwill Impairment Assessment of Certain Cash Generating Unit (CGU)
As described in Notes 2 and 17 to the consolidated financial statements, the Company’s consolidated goodwill balance was EUR 14,017 million as of December 31, 2023, which includes the goodwill balance of the Santander US Auto CGU of EUR 1,003 million. Management assesses goodwill for impairment at the end of each annual reporting period or whenever there is any indication of impairment. Potential impairment is identified by management by comparing the value in use of a CGU to its carrying value. Value in use is estimated by management using discounted cash flow projections. Management’s cash flow projections for the CGU include assumptions relating to earnings projections, discount rates determined as the cost of capital taking into account the risk-free rate of return plus a risk
premium and constant growth rates used in order to extrapolate earnings in perpetuity.
The principal considerations for our determination that performing procedures relating to the goodwill impairment assessment of the aforementioned CGU is a critical audit matter are (i) the significant judgment by management when developing the value in use of the CGU; (ii) a high degree of auditor judgment, subjectivity, and effort in performing procedures and evaluating management’s significant assumptions related to earnings projections, discount rates and constant growth rates; and (iii) the audit effort involved the use of professionals with specialized skill and knowledge.
Addressing the matter involved performing procedures and evaluating audit evidence in connection with forming our overall opinion on the consolidated financial statements. These procedures included testing the effectiveness of controls relating to management’s goodwill impairment assessment, including controls over the valuation of the aforementioned CGU. These procedures also included, among others, (i) testing management’s process for developing the value in use estimate; (ii) evaluating the appropriateness of the discounted cash flow model; (iii) evaluating the reasonableness of the earnings projections, the discount rate and the constant growth rates assumptions used by management; and (iv) testing the mathematical accuracy of the discounted cash flow projections. Evaluating the reasonableness of management’s key assumptions involved (i) performing a retrospective comparison of forecasted earnings to actual past performance and previous forecasts; and (ii) evaluating the consistency of the discount rate and constant growth rate with external market and industry data. Professionals with specialized skill and knowledge were used to assist in the evaluation of the appropriateness of management’s discounted cash flow model and reasonableness of the earnings projections, discount rate and constant growth rates assumptions.
Litigation provisions and contingencies
As described in Notes 2 and 25 to the consolidated financial statements, the Company’s consolidated litigation provisions and contingencies balance as of December 31, 2023 were EUR 4,038 million. The Company records provisions for tax and legal proceedings in which management assesses the chances of loss to be probable. Management determines the amounts to be provided for as the best estimate of the expenditure required to settle the corresponding claim based, among other factors, on a case-by-case analysis of the facts and the legal opinion of internal and external counsel or by considering the historical average amount of the loss incurred in claims of the same nature.
The principal considerations for our determination that performing procedures relating to litigation provisions and contingencies is a critical audit matter are the significant judgment by management to assess the intrinsic uncertainty of the obligations for which management recognizes a provision for these proceedings based on estimates, which in turn led to a high degree of auditor judgment and effort in performing procedures and evaluating management’s process for estimating the litigation provisions and contingencies.
Addressing the matter involved performing procedures and evaluating audit evidence in connection with forming our overall opinion on the consolidated financial statements. These procedures included testing the effectiveness of controls relating to the assessment of litigation provisions and contingencies. These procedures also included, among others, obtaining and evaluating letters of audit inquiry with internal
529
and external legal counsel, evaluating the reasonableness of management’s assessment regarding whether an outflow of resources is probable and the contingency is estimable, evaluating management’s assessment of possible contingencies relating to compliance with the tax obligations for all the years open to inspection and evaluating the sufficiency of the Company’s contingency disclosures.
/s/ PricewaterhouseCoopers Auditores, S.L.
February 21, 2024
We have served as the Company’s auditor since 2016
530
Consolidated financial statements | |||||
 | |||||
531
Grupo Santander
| CONSOLIDATED BALANCE SHEETS AS OF 31 DECEMBER 2023, 2022 AND 2021 | ||||||||||||||
| EUR million | ||||||||||||||
| ASSETS | Note | 2023 | 2022 | 2021 | ||||||||||
| CASH, CASH BALANCES AT CENTRAL BANKS AND OTHER DEPOSITS ON DEMAND | ||||||||||||||
| FINANCIAL ASSETS HELD FOR TRADING | ||||||||||||||
| Derivatives | 9 and 11 | |||||||||||||
| Equity instruments | 8 | |||||||||||||
| Debt securities | 7 | |||||||||||||
| Loans and advances | ||||||||||||||
| Central banks | 6 | |||||||||||||
| Credit institutions | 6 | |||||||||||||
| Customers | 10 | |||||||||||||
| NON-TRADING FINANCIAL ASSETS MANDATORILY AT FAIR VALUE THROUGH PROFIT OR LOSS | ||||||||||||||
| Equity instruments | 8 | |||||||||||||
| Debt securities | 7 | |||||||||||||
| Loans and advances | ||||||||||||||
| Central banks | 6 | |||||||||||||
| Credit institutions | 6 | |||||||||||||
| Customers | 10 | |||||||||||||
| FINANCIAL ASSETS DESIGNATED AT FAIR VALUE THROUGH PROFIT OR LOSS | ||||||||||||||
| Debt securities | 7 | |||||||||||||
| Loans and advances | ||||||||||||||
| Central banks | 6 | |||||||||||||
| Credit institutions | 6 | |||||||||||||
| Customers | 10 | |||||||||||||
| FINANCIAL ASSETS AT FAIR VALUE THROUGH OTHER COMPREHENSIVE INCOME | ||||||||||||||
| Equity instruments | 8 | |||||||||||||
| Debt securities | 7 | |||||||||||||
| Loans and advances | ||||||||||||||
| Central banks | 6 | |||||||||||||
| Credit institutions | 6 | |||||||||||||
| Customers | 10 | |||||||||||||
| FINANCIAL ASSETS AT AMORTIZED COST | ||||||||||||||
| Debt securities | 7 | |||||||||||||
| Loans and advances | ||||||||||||||
| Central banks | 6 | |||||||||||||
| Credit institutions | 6 | |||||||||||||
| Customers | 10 | |||||||||||||
| HEDGING DERIVATIVES | 36 | |||||||||||||
| CHANGES IN THE FAIR VALUE OF HEDGED ITEMS IN PORTFOLIO HEDGES OF INTEREST RATE RISK | 36 | ( | ( | |||||||||||
532
| CONSOLIDATED BALANCE SHEETS AS OF 31 DECEMBER 2023, 2022 AND 2021 | ||||||||||||||
| EUR million | ||||||||||||||
| ASSETS | Note | 2023 | 2022 | 2021 | ||||||||||
| INVESTMENTS | 13 | |||||||||||||
| Joint venture entities | ||||||||||||||
| Associated entities | ||||||||||||||
| ASSETS UNDER REINSURANCE CONTRACTS | ||||||||||||||
| TANGIBLE ASSETS | ||||||||||||||
| Property, plant and equipment | 16 | |||||||||||||
| For own-use | ||||||||||||||
| Leased out under an operating lease | ||||||||||||||
| Investment properties | 16 | |||||||||||||
| Of which leased out under an operating lease | ||||||||||||||
| INTANGIBLE ASSETS | ||||||||||||||
| Goodwill | 17 | |||||||||||||
| Other intangible assets | 18 | |||||||||||||
| TAX ASSETS | ||||||||||||||
| Current tax assets | ||||||||||||||
| Deferred tax assets | 27 | |||||||||||||
| OTHER ASSETS | ||||||||||||||
| Insurance contracts linked to pensions | 14 | |||||||||||||
| Inventories | ||||||||||||||
| Other | 19 | |||||||||||||
| NON-CURRENT ASSETS HELD FOR SALE | 12 | |||||||||||||
| TOTAL ASSETS | ||||||||||||||
The accompanying notes 1 to 55 and appendices are an integral part of the consolidated balance sheet as of 31 December 2023.
533
| CONSOLIDATED BALANCE SHEETS AS OF 31 DECEMBER 2023, 2022 AND 2021 | ||||||||||||||
| EUR million | ||||||||||||||
| LIABILITIES | Note | 2023 | 2022 | 2021 | ||||||||||
| FINANCIAL LIABILITIES HELD FOR TRADING | ||||||||||||||
| Derivatives | 9 and 11 | |||||||||||||
| Short positions | 9 | |||||||||||||
| Deposits | ||||||||||||||
| Central banks | 20 | |||||||||||||
| Credit institutions | 20 | |||||||||||||
| Customers | 21 | |||||||||||||
| Marketable debt securities | 22 | |||||||||||||
| Other financial liabilities | 24 | |||||||||||||
| FINANCIAL LIABILITIES DESIGNATED AT FAIR VALUE THROUGH PROFIT OR LOSS | ||||||||||||||
| Deposits | ||||||||||||||
| Central banks | 20 | |||||||||||||
| Credit institutions | 20 | |||||||||||||
| Customers | 21 | |||||||||||||
| Marketable debt securities | 22 | |||||||||||||
| Other financial liabilities | 24 | |||||||||||||
| Memorandum items: subordinated liabilities | 23 | |||||||||||||
| FINANCIAL LIABILITIES AT AMORTIZED COST | ||||||||||||||
| Deposits | ||||||||||||||
| Central banks | 20 | |||||||||||||
| Credit institutions | 20 | |||||||||||||
| Customers | 21 | |||||||||||||
| Marketable debt securities | 22 | |||||||||||||
| Other financial liabilities | 24 | |||||||||||||
| Memorandum items: subordinated liabilities | 23 | |||||||||||||
| HEDGING DERIVATIVES | 36 | |||||||||||||
| CHANGES IN THE FAIR VALUE OF HEDGED ITEMS IN PORTFOLIO HEDGES OF INTEREST RATE RISK | 36 | ( | ||||||||||||
| LIABILITIES UNDER INSURANCE CONTRACTS | 15 | |||||||||||||
| PROVISIONS | 25 | |||||||||||||
| Pensions and other post-retirement obligations | ||||||||||||||
| Other long term employee benefits | ||||||||||||||
| Taxes and other legal contingencies | ||||||||||||||
| Contingent liabilities and commitments | ||||||||||||||
| Other provisions | ||||||||||||||
| TAX LIABILITIES | ||||||||||||||
| Current tax liabilities | ||||||||||||||
| Deferred tax liabilities | 27 | |||||||||||||
| OTHER LIABILITIES | 26 | |||||||||||||
| LIABILITIES ASSOCIATED WITH NON-CURRENT ASSETS HELD FOR SALE | ||||||||||||||
| TOTAL LIABILITIES | ||||||||||||||
534
| CONSOLIDATED BALANCE SHEETS AS OF 31 DECEMBER 2023, 2022 AND 2021 | ||||||||||||||
| EUR million | ||||||||||||||
| EQUITY | Note | 2023 | 2022 | 2021 | ||||||||||
| SHAREHOLDERS´ EQUITY | 30 | |||||||||||||
| CAPITAL | 31 | |||||||||||||
| Called up paid capital | ||||||||||||||
| Unpaid capital which has been called up | ||||||||||||||
| SHARE PREMIUM | 32 | |||||||||||||
| EQUITY INSTRUMENTS ISSUED OTHER THAN CAPITAL | 34 | |||||||||||||
| Equity component of the compound financial instrument | ||||||||||||||
| Other equity instruments issued | ||||||||||||||
| OTHER EQUITY | 34 | |||||||||||||
| ACCUMULATED RETAINED EARNINGS | 33 | |||||||||||||
| REVALUATION RESERVES | 33 | |||||||||||||
| OTHER RESERVES | 33 | ( | ( | ( | ||||||||||
| Reserves or accumulated losses in joint venture investments | ||||||||||||||
| Others | ( | ( | ( | |||||||||||
| (-) OWN SHARES | 34 | ( | ( | ( | ||||||||||
| PROFIT OR LOSS ATTRIBUTABLE TO SHAREHOLDERS OF THE PARENT | ||||||||||||||
| (-) INTERIM DIVIDENDS | 4 | ( | ( | ( | ||||||||||
| OTHER COMPREHENSIVE INCOME OR LOSS | 29 | ( | ( | ( | ||||||||||
Items that will not be reclassified to profit or loss | ( | ( | ( | |||||||||||
| Items that may be reclassified to profit or loss | ( | ( | ( | |||||||||||
| NON-CONTROLLING INTEREST | 28 | |||||||||||||
| Other comprehensive income or loss | ( | ( | ( | |||||||||||
| Other items | ||||||||||||||
| TOTAL EQUITY | ||||||||||||||
| TOTAL LIABILITIES AND EQUITY | ||||||||||||||
| MEMORANDUM ITEMS: OFF BALANCE SHEET AMOUNTS | 35 | |||||||||||||
| Loan commitments granted | ||||||||||||||
| Financial guarantees granted | ||||||||||||||
| Other commitments granted | ||||||||||||||
The accompanying notes 1 to 55 and appendices are an integral part of the consolidated balance sheet as of 31 December 2023.
535
| CONSOLIDATED INCOME STATEMENTS FOR THE YEARS ENDED 31 DECEMBER 2023, 2022 AND 2021 | ||||||||||||||
| EUR million | ||||||||||||||
| (Debit) Credit | ||||||||||||||
| Note | 2023 | 2022 | 2021 | |||||||||||
| Interest income | 38 | |||||||||||||
| Financial assets at fair value through other comprehensive income | ||||||||||||||
| Financial assets at amortized cost | ||||||||||||||
| Other interest income | ||||||||||||||
| Interest expense | 39 | ( | ( | ( | ||||||||||
| Interest income/(charges) | ||||||||||||||
| Dividend income | 40 | |||||||||||||
| Income from companies accounted for using the equity method | 13 | |||||||||||||
| Commission income | 41 | |||||||||||||
| Commission expense | 42 | ( | ( | ( | ||||||||||
| Gain or losses on financial assets and liabilities not measured at fair value through profit or loss, net | 43 | |||||||||||||
| Financial assets at amortized cost | ( | |||||||||||||
| Other financial assets and liabilities | ||||||||||||||
| Gain or losses on financial assets and liabilities held for trading, net | 43 | |||||||||||||
| Reclassification of financial assets at fair value through other comprehensive income | ||||||||||||||
| Reclassification of financial assets at amortized cost | ||||||||||||||
| Other gains (losses) | ||||||||||||||
| Gains or losses on non-trading financial assets and liabilities mandatorily at fair value through profit or loss | 43 | |||||||||||||
| Reclassification of financial assets at fair value through other comprehensive income | ||||||||||||||
| Reclassification of financial assets at amortized cost | ||||||||||||||
| Other gains (losses) | ||||||||||||||
| Gain or losses on financial assets and liabilities measured at fair value through profit or loss, net | 43 | ( | ||||||||||||
| Gain or losses from hedge accounting, net | 43 | ( | ||||||||||||
| Exchange differences, net | 44 | ( | ( | |||||||||||
| Other operating income | 45 | |||||||||||||
| Other operating expenses | 45 | ( | ( | ( | ||||||||||
| Income from insurance and reinsurance contracts | ||||||||||||||
| Expenses from insurance and reinsurance contracts | ( | ( | ( | |||||||||||
536
| CONSOLIDATED INCOME STATEMENTS FOR THE YEARS ENDED 31 DECEMBER 2023, 2022 AND 2021 | ||||||||||||||
| EUR million | ||||||||||||||
| (Debit) Credit | ||||||||||||||
| Note | 2023 | 2022 | 2021 | |||||||||||
| Total income | ||||||||||||||
| Administrative expenses | ( | ( | ( | |||||||||||
| Staff costs | 46 | ( | ( | ( | ||||||||||
| Other general administrative expenses | 47 | ( | ( | ( | ||||||||||
| Depreciation and amortisation cost | 16 and 18 | ( | ( | ( | ||||||||||
| Provisions or reversal of provisions, net | 25 | ( | ( | ( | ||||||||||
| Impairment or reversal of impairment at financial assets not measured at fair value through profit or loss and net gains and losses from changes | ( | ( | ( | |||||||||||
| Financial assets at fair value through other comprehensive income | ( | ( | ( | |||||||||||
| Financial assets at amortized cost | 10 | ( | ( | ( | ||||||||||
| Impairment or reversal of impairment of investments in subsidiaries, joint ventures and associates, net | 17 and 18 | |||||||||||||
| Impairment or reversal of impairment on non-financial assets, net | ( | ( | ( | |||||||||||
| Tangible assets | 16 | ( | ( | ( | ||||||||||
| Intangible assets | 17 and 18 | ( | ( | ( | ||||||||||
| Others | ( | ( | ( | |||||||||||
| Gain or losses on non-financial assets and investments, net | 48 | |||||||||||||
| Negative goodwill recognized in results | ||||||||||||||
| Gains or losses on non-current assets held for sale not classified as discontinued operations | 49 | ( | ( | |||||||||||
| Operating profit/(loss) before tax | ||||||||||||||
| Tax expense or income from continuing operations | 27 | ( | ( | ( | ||||||||||
| Profit/(loss) from continuing operations | ||||||||||||||
| Profit/(loss) after tax from discontinued operations | 37 | |||||||||||||
| Profit/(loss) for the year | ||||||||||||||
| Profit/(loss) attributable to non-controlling interests | 28 | |||||||||||||
| Profit/(loss) attributable to the parent | ||||||||||||||
| Earnings/(losses) per share | ||||||||||||||
| Basic | 4 | |||||||||||||
| Diluted | 4 | |||||||||||||
The accompanying notes 1 to 55 and appendices are an integral part of the consolidated income statement for the year ended 31 December 2023.
537
| CONSOLIDATED STATEMENTS OF RECOGNISED INCOME AND EXPENSE FOR THE YEARS ENDED 31 DECEMBER 2023, 2022 AND 2021 | ||||||||||||||
| EUR million | ||||||||||||||
| Note | 2023 | 2022 | 2021 | |||||||||||
| CONSOLIDATED PROFIT/(LOSS) FOR THE YEAR | ||||||||||||||
| OTHER RECOGNISED INCOME AND EXPENSE | ( | ( | ||||||||||||
| Items that will not be reclassified to profit or loss | 29 | ( | ( | |||||||||||
| Actuarial gains and losses on defined benefit pension plans | ( | ( | ||||||||||||
| Non-current assets held for sale | ||||||||||||||
| Other recognised income and expense of investments in subsidiaries, joint ventures and associates | ( | ( | ||||||||||||
| Changes in the fair value of equity instruments measured at fair value through other comprehensive income | ( | ( | ( | |||||||||||
| Gains or losses resulting from the accounting for hedges of equity instruments measured at fair value through other comprehensive income, net | 36 | |||||||||||||
| Changes in the fair value of equity instruments measured at fair value through other comprehensive income (hedged item) | ( | |||||||||||||
| Changes in the fair value of equity instruments measured at fair value through other comprehensive income (hedging instrument) | ( | ( | ||||||||||||
| Changes in the fair value of financial liabilities at fair value through profit or loss attributable to changes in credit risk | ( | ( | ||||||||||||
| Income tax relating to items that will not be reclassified | ( | |||||||||||||
| Items that may be reclassified to profit or loss | 29 | ( | ( | |||||||||||
| Hedges of net investments in foreign operations (effective portion) | 36 | ( | ( | ( | ||||||||||
| Revaluation gains (losses) | ( | ( | ( | |||||||||||
| Amounts transferred to income statement | ||||||||||||||
| Other reclassifications | ||||||||||||||
| Exchanges differences | ||||||||||||||
| Revaluation gains (losses) | ||||||||||||||
| Amounts transferred to income statement | ||||||||||||||
| Other reclassifications | ||||||||||||||
| Cash flow hedges (effective portion) | 36 | ( | ( | |||||||||||
| Revaluation gains (losses) | ( | ( | ( | |||||||||||
| Amounts transferred to income statement | ( | |||||||||||||
| Transferred to initial carrying amount of hedged items | ||||||||||||||
| Other reclassifications | ||||||||||||||
| Hedging instruments (items not designated) | 36 | |||||||||||||
| Revaluation gains (losses) | ||||||||||||||
| Amounts transferred to income statement | ||||||||||||||
| Other reclassifications | ||||||||||||||
| Debt instruments at fair value with changes in other comprehensive income | ( | ( | ||||||||||||
| Revaluation gains (losses) | 29 | ( | ( | |||||||||||
| Amounts transferred to income statement | ( | ( | ||||||||||||
| Other reclassifications | ||||||||||||||
| Non-current assets held for sale | ||||||||||||||
| Revaluation gains (losses) | ||||||||||||||
| Amounts transferred to income statement | ||||||||||||||
| Other reclassifications | ||||||||||||||
| Share of other recognised income and expense of investments | ||||||||||||||
| Income tax relating to items that may be reclassified to profit or loss | ( | |||||||||||||
| Total recognised income and expenses for the year | ||||||||||||||
| Attributable to non-controlling interests | ||||||||||||||
| Attributable to the parent | ||||||||||||||
The accompanying notes 1 to 55 and appendices are an integral part of the consolidated statement of recognised income and expense for the year ended 31 December 2023.
538
| CONSOLIDATED STATEMENTS OF CHANGES IN TOTAL EQUITY FOR THE YEARS ENDED 31 DECEMBER 2023, 2022 AND 2021 | |||||||||||||||||
| EUR million | |||||||||||||||||
| Capital | Share premium | Equity instruments issued (not capital) | Other equity instruments | Accumulated retained earnings | |||||||||||||
Balance at 31 December 2022 | |||||||||||||||||
| Adjustments due to errors | — | — | — | — | — | ||||||||||||
| Adjustments due to changes in accounting policies | — | — | — | — | — | ||||||||||||
Opening balance at 1 January 2023 | |||||||||||||||||
| Total recognised income and expense | — | — | — | — | — | ||||||||||||
| Other changes in equity | ( | ( | |||||||||||||||
| Issuance of ordinary shares | — | — | — | — | — | ||||||||||||
| Issuance of preferred shares | — | — | — | — | — | ||||||||||||
| Issuance of other financial instruments | — | — | — | — | — | ||||||||||||
| Maturity of other financial instruments | — | — | — | — | — | ||||||||||||
| Conversion of financial liabilities into equity | — | — | — | — | — | ||||||||||||
| Capital reduction | ( | ( | — | — | — | ||||||||||||
Dividends | — | — | — | — | ( | ||||||||||||
| Purchase of equity instruments | — | — | — | — | — | ||||||||||||
| Disposal of equity instruments | — | — | — | — | — | ||||||||||||
| Transfer from equity to liabilities | — | — | — | — | — | ||||||||||||
| Transfer from liabilities to equity | — | — | — | — | — | ||||||||||||
| Transfers between equity items | — | — | — | — | |||||||||||||
| Increases (decreases) due to business combinations | — | — | — | — | — | ||||||||||||
| Share-based payment | — | — | — | ( | — | ||||||||||||
| Others increases or (-) decreases in equity | — | — | — | ||||||||||||||
| Balance at 31 December 2023 | |||||||||||||||||
The accompanying notes 1 to 55 and appendices are an integral part of the consolidated statement of changes in total equity for the year ended 31 December 2023.
539
| Non-controlling interest | ||||||||||||||||||||||||||
| Revaluation reserves | Other reserves | (-) Own shares | Profit attributable to shareholders of the parent | (-) Interim dividends | Other comprehensive income | Other comprehensive income | Other items | Total | ||||||||||||||||||
| ( | ( | ( | ( | ( | ||||||||||||||||||||||
| — | — | — | — | — | — | — | — | |||||||||||||||||||
| — | — | — | — | — | — | — | — | |||||||||||||||||||
| ( | ( | ( | ( | ( | ||||||||||||||||||||||
| — | — | — | — | |||||||||||||||||||||||
| — | ( | ( | ( | ( | ( | ( | ||||||||||||||||||||
| — | — | — | — | — | — | — | ||||||||||||||||||||
| — | — | — | — | — | — | — | — | |||||||||||||||||||
| — | — | — | — | — | — | — | — | |||||||||||||||||||
| — | — | — | — | — | — | — | — | |||||||||||||||||||
| — | — | — | — | — | — | — | — | |||||||||||||||||||
| — | — | — | — | — | — | |||||||||||||||||||||
| — | — | — | — | ( | — | — | ( | ( | ||||||||||||||||||
| — | — | ( | — | — | — | — | — | ( | ||||||||||||||||||
| — | — | — | — | — | — | |||||||||||||||||||||
| — | — | — | — | — | — | — | — | |||||||||||||||||||
| — | — | — | — | — | — | — | — | |||||||||||||||||||
| — | ( | — | ( | ( | ||||||||||||||||||||||
| — | — | — | — | — | — | — | ( | ( | ||||||||||||||||||
| — | — | — | — | — | — | — | — | ( | ||||||||||||||||||
| — | ( | — | — | — | — | — | ( | |||||||||||||||||||
| ( | ( | ( | ( | ( | ||||||||||||||||||||||
540
| CONSOLIDATED STATEMENTS OF CHANGES IN TOTAL EQUITY FOR THE YEARS ENDED 31 DECEMBER 2023, 2022 AND 2021 | |||||||||||||||||
| EUR million | |||||||||||||||||
| Capital | Share premium | Equity instruments issued (not capital) | Other equity instruments | Accumulated retained earnings | |||||||||||||
Balance at 31 December 2021 | |||||||||||||||||
| Adjustments due to errors | — | — | — | — | — | ||||||||||||
| Adjustments due to changes in accounting policies | — | — | — | — | — | ||||||||||||
Opening balance at 1 January 2022 | |||||||||||||||||
| Total recognised income and expense | — | — | — | — | — | ||||||||||||
| Other changes in equity | ( | ( | |||||||||||||||
| Issuance of ordinary shares | — | — | — | — | — | ||||||||||||
| Issuance of preferred shares | — | — | — | — | — | ||||||||||||
| Issuance of other financial instruments | — | — | — | — | — | ||||||||||||
| Maturity of other financial instruments | — | — | — | — | — | ||||||||||||
| Conversion of financial liabilities into equity | — | — | — | — | — | ||||||||||||
| Capital reduction | ( | ( | — | — | — | ||||||||||||
| Dividends | — | — | — | — | ( | ||||||||||||
| Purchase of equity instruments | — | — | — | — | — | ||||||||||||
| Disposal of equity instruments | — | — | — | — | — | ||||||||||||
| Transfer from equity to liabilities | — | — | — | — | — | ||||||||||||
| Transfer from liabilities to equity | — | — | — | — | — | ||||||||||||
| Transfers between equity items | — | — | — | — | |||||||||||||
| Increases (decreases) due to business combinations | — | — | — | — | — | ||||||||||||
| Share-based payment | — | — | — | ( | — | ||||||||||||
| Others increases or (-) decreases in equity | — | — | — | ||||||||||||||
Balance at 31 December 2022 | |||||||||||||||||
The accompanying notes 1 to 55 and appendices are an integral part of the consolidated statement of changes in total equity for the year ended 31 December 2023.
541
Non-controlling interest | ||||||||||||||||||||||||||
Revaluation reserves | Other reserves | (-) Own shares | Profit attributable to shareholders of the parent | (-) Interim dividends | Other comprehensive income | Other comprehensive income | Other items | Total | ||||||||||||||||||
| ( | ( | ( | ( | ( | ||||||||||||||||||||||
| — | — | — | — | — | — | — | — | |||||||||||||||||||
| — | — | — | — | — | — | — | — | |||||||||||||||||||
| ( | ( | ( | ( | ( | ||||||||||||||||||||||
| — | — | — | — | ( | ||||||||||||||||||||||
| — | ( | ( | ( | ( | ( | ( | ||||||||||||||||||||
| — | — | — | — | — | — | — | ||||||||||||||||||||
| — | — | — | — | — | — | — | — | |||||||||||||||||||
| — | — | — | — | — | — | — | — | |||||||||||||||||||
| — | — | — | — | — | — | — | ( | ( | ||||||||||||||||||
| — | — | — | — | — | — | — | — | |||||||||||||||||||
| — | — | — | — | — | — | |||||||||||||||||||||
| — | — | — | — | ( | — | — | ( | ( | ||||||||||||||||||
| — | — | ( | — | — | — | — | — | ( | ||||||||||||||||||
| — | — | — | — | — | — | |||||||||||||||||||||
| — | — | — | — | — | — | — | — | |||||||||||||||||||
| — | — | — | — | — | — | — | — | |||||||||||||||||||
| — | ( | — | ( | ( | ||||||||||||||||||||||
| — | — | — | — | — | — | — | ||||||||||||||||||||
| — | — | — | — | — | — | — | — | ( | ||||||||||||||||||
| — | ( | — | — | — | — | — | ( | ( | ||||||||||||||||||
| ( | ( | ( | ( | ( | ||||||||||||||||||||||
542
| CONSOLIDATED STATEMENTS OF CHANGES IN TOTAL EQUITY FOR THE YEARS ENDED 31 DECEMBER 2023, 2022 AND 2021 | |||||||||||||||||
| EUR million | |||||||||||||||||
| Capital | Share premium | Equity instruments issued (not capital) | Other equity instruments | Accumulated retained earnings | |||||||||||||
Balance at 31 December 2020 | |||||||||||||||||
| Adjustments due to errors | — | — | — | — | — | ||||||||||||
| Adjustments due to changes in accounting policies | — | — | — | — | — | ||||||||||||
Opening balance at 1 January 2021 | |||||||||||||||||
| Total recognised income and expense | — | — | — | — | — | ||||||||||||
| Other changes in equity | — | ( | ( | ( | |||||||||||||
| Issuance of ordinary shares | — | — | — | — | — | ||||||||||||
| Issuance of preferred shares | — | — | — | — | — | ||||||||||||
| Issuance of other financial instruments | — | — | — | — | — | ||||||||||||
| Maturity of other financial instruments | — | — | — | — | — | ||||||||||||
| Conversion of financial liabilities into equity | — | — | — | — | — | ||||||||||||
| Capital reduction | — | — | — | — | — | ||||||||||||
| Dividends | — | ( | — | — | — | ||||||||||||
| Purchase of equity instruments | — | — | — | — | — | ||||||||||||
| Disposal of equity instruments | — | — | — | — | — | ||||||||||||
| Transfer from equity to liabilities | — | — | — | — | — | ||||||||||||
| Transfer from liabilities to equity | — | — | — | — | — | ||||||||||||
| Transfers between equity items | — | ( | — | — | ( | ||||||||||||
| Increases (decreases) due to business combinations | — | — | — | — | — | ||||||||||||
| Share-based payment | — | — | — | ( | — | ||||||||||||
| Others increases or (-) decreases in equity | — | — | — | ||||||||||||||
Balance at 31 December 2021 | |||||||||||||||||
The accompanying notes 1 to 55 and appendices are an integral part of the consolidated statement of changes in total equity for the year ended 31 December 2023.
543
| Non-controlling interest | ||||||||||||||||||||||||||
Revaluation reserves | Other reserves | (-) Own shares | Profit attributable to shareholders of the parent | (-) Interim dividends | Other comprehensive income | Other comprehensive income | Other items | Total | ||||||||||||||||||
| ( | ( | ( | ( | ( | ||||||||||||||||||||||
| — | — | — | — | — | — | — | — | |||||||||||||||||||
| — | — | — | — | — | — | — | — | |||||||||||||||||||
| ( | ( | ( | ( | ( | ||||||||||||||||||||||
| — | — | — | — | ( | ||||||||||||||||||||||
| — | ( | ( | ( | ( | ( | ( | ||||||||||||||||||||
| — | — | — | — | — | — | — | ||||||||||||||||||||
| — | — | — | — | — | — | — | — | |||||||||||||||||||
| — | — | — | — | — | — | — | — | |||||||||||||||||||
| — | — | — | — | — | — | — | — | |||||||||||||||||||
| — | — | — | — | — | — | — | — | |||||||||||||||||||
| — | — | — | — | — | — | — | — | |||||||||||||||||||
| — | — | — | — | ( | — | — | ( | ( | ||||||||||||||||||
| — | — | ( | — | — | — | — | — | ( | ||||||||||||||||||
| — | — | — | — | — | — | |||||||||||||||||||||
| — | — | — | — | — | — | — | — | |||||||||||||||||||
| — | — | — | — | — | — | — | — | |||||||||||||||||||
| — | ( | — | — | ( | ||||||||||||||||||||||
| — | — | — | — | — | — | — | ( | ( | ||||||||||||||||||
| — | — | — | — | — | — | — | — | ( | ||||||||||||||||||
| — | ( | — | — | — | — | — | ( | ( | ||||||||||||||||||
| ( | ( | ( | ( | ( | ||||||||||||||||||||||
544
| CONSOLIDATED STATEMENTS OF CASH FLOWS FOR THE YEARS ENDED 2023, 2022 AND 2021 | ||||||||||||||
| EUR million | ||||||||||||||
| Note | 2023 | 2022 | 2021 | |||||||||||
| A. CASH FLOWS FROM OPERATING ACTIVITIES | ||||||||||||||
| Profit or loss for the year | ||||||||||||||
| Adjustments made to obtain the cash flows from operating activities | ||||||||||||||
| Depreciation and amortisation cost | ||||||||||||||
| Other adjustments | ||||||||||||||
| Net increase/(decrease) in operating assets | ||||||||||||||
| Financial assets held-for-trading | ||||||||||||||
| Non-trading financial assets mandatorily at fair value through profit or loss | ||||||||||||||
| Financial assets at fair value through profit or loss | ( | ( | ||||||||||||
| Financial assets at fair value through other comprehensive income | ( | ( | ( | |||||||||||
| Financial assets at amortized cost | ||||||||||||||
| Other operating assets | ( | ( | ||||||||||||
| Net increase/(decrease) in operating liabilities | ||||||||||||||
| Financial liabilities held-for-trading | ( | |||||||||||||
| Financial liabilities designated at fair value through profit or loss | ( | ( | ||||||||||||
| Financial liabilities at amortized cost | ||||||||||||||
| Other operating liabilities | ( | ( | ||||||||||||
| Income tax recovered/(paid) | ( | ( | ( | |||||||||||
| B. CASH FLOWS FROM INVESTING ACTIVITIES | ( | ( | ( | |||||||||||
| Payments | ||||||||||||||
| Tangible assets | 16 | |||||||||||||
| Intangible assets | 18 | |||||||||||||
| Investments | 13 | |||||||||||||
| Subsidiaries and other business units | ||||||||||||||
| Non-current assets held for sale and associated liabilities | ||||||||||||||
| Other payments related to investing activities | ||||||||||||||
| Proceeds | ||||||||||||||
| Tangible assets | 16 | |||||||||||||
| Intangible assets | 18 | |||||||||||||
| Investments | 13 | |||||||||||||
| Subsidiaries and other business units | ||||||||||||||
| Non-current assets held for sale and associated liabilities | 12 | |||||||||||||
| Other proceeds related to investing activities | ||||||||||||||
| C. CASH FLOW FROM FINANCING ACTIVITIES | ( | ( | ( | |||||||||||
| Payments | ||||||||||||||
| Dividends | 4 | |||||||||||||
| Subordinated liabilities | 23 | |||||||||||||
| Redemption of own equity instruments | ||||||||||||||
| Acquisition of own equity instruments | ||||||||||||||
| Other payments related to financing activities | ||||||||||||||
| Proceeds | ||||||||||||||
| Subordinated liabilities | 23 | |||||||||||||
| Issuance of own equity instruments | ||||||||||||||
| Disposal of own equity instruments | ||||||||||||||
| Other proceeds related to financing activities | ||||||||||||||
545
| CONSOLIDATED STATEMENTS OF CASH FLOWS FOR THE YEARS ENDED 2023, 2022 AND 2021 | ||||||||||||||
| EUR million | ||||||||||||||
| Note | 2023 | 2022 | 2021 | |||||||||||
| D. EFFECT OF FOREIGN EXCHANGE RATE DIFFERENCES | ( | ( | ||||||||||||
| E. NET INCREASE/(DECREASE) IN CASH AND CASH EQUIVALENTS | ( | |||||||||||||
| F. CASH AND CASH EQUIVALENTS AT BEGINNING OF THE YEAR | ||||||||||||||
| G. CASH AND CASH EQUIVALENTS AT END OF THE YEAR | ||||||||||||||
| COMPONENTS OF CASH AND CASH EQUIVALENTS AT END OF THE YEAR | ||||||||||||||
| Cash | ||||||||||||||
| Cash equivalents at central banks | ||||||||||||||
| Other financial assets | ||||||||||||||
| Less, bank overdrafts refundable on demand | ||||||||||||||
| TOTAL CASH AND CASH EQUIVALENTS AT END OF THE YEAR | ||||||||||||||
| In which, restricted cash | ||||||||||||||
The accompanying notes 1 to 55 and appendices are an integral part of the consolidated statement of cash flows for the year ended 31 December 2023.
546
Notes to the consolidated financial statements | |||||
 | |||||
547
Banco Santander, S.A., and Companies composing Grupo Santander
Notes to the consolidated financial statements (consolidated annual accounts) for the year ended 31 December 2023.
1. Introduction, basis of presentation of the consolidated financial statements (consolidated annual accounts) and other information
a) Introduction
Banco Santander, S.A. ('the parent' or 'Banco Santander'), is a private-law entity subject to the rules and regulations applicable to banks operating in Spain, where it was constituted and currently maintains its legal domicile, which is paseo de Pereda, numbers 9 to 12, 39004, Santander, Spain.
The principal headquarters of Banco Santander are located in Ciudad Grupo Santander, Avenida Cantabria s/n, 28660, Boadilla del Monte, Madrid, Spain.
The corporate purpose of Banco Santander, S.A., mainly entails carrying out all kinds of activities, operations and services inherent to the banking business in general and permitted by current legislation, and the acquisition, holding, enjoyment and disposal of all kinds of securities.
In addition to the operations carried on directly by it, Banco Santander is the head of a group of subsidiaries that engage in various business activities and which compose, together with it, Grupo Santander ('Santander' or 'the Group'). Therefore, Banco Santander is obliged to prepare, in addition to its own separate financial statements, the Group's consolidated financial statements, which also include the interests in joint ventures and investments in associates.
At 31 December 2023, Grupo Santander consisted of 762 subsidiaries of Banco Santander, S.A. In addition, other 165 companies are associates of the Group, joint ventures or companies of which the Group holds more than 5 % (excluding the Group companies of negligible interest with respect to the fair presentation that the annual accounts must express).
Grupo Santander consolidated financial statements for 2021 were approved by the shareholders at the group´s annual general meeting on 1 April 2022. Grupo Santander consolidated financial statements for 2022 were approved by the shareholders at the group´s annual general meeting on 31 March 2023. The Group's 2023 consolidated financial statements, the financial statements of the parent and of substantially all the Group companies have not been approved yet by their shareholders at the respective annual general meetings. However, Banco Santander board of directors considers that the aforementioned financial statements will be approved without any significant changes.
b) Basis of presentation of the consolidated financial statements
Under Regulation (EC) n.º 1606/2002 of the European Parliament and of the Council of 19 July 2002 all companies governed by the law of an EU Member State and whose securities are admitted to trading on a regulated market of any Member State must prepare their consolidated financial statements for the years beginning on or after 1 January 2005 in conformity with the International Financial Reporting Standards ('IFRS') previously adopted by the European Union ('EU-IFRS').
In order to adapt the accounting system of Spanish credit institutions with the principles and criteria established by the IFRS adopted by the European Union ('EU-IFRS'), the Bank of Spain published circular 4/2017, dated 27 November 2017, on Public and Confidential Financial Reporting Standards and Financial Statement Formats and the following regulations.
Particularly, during 2023 and 2021, the Bank of Spain published Circulars 1/2023 of 24 February of 2023, and 6/2021 of 22 December of 2021, amending Circular 4/2017 of 27 November to credit institutions on Public and Confidential Financial Reporting Standards and Financial Statement Formats.
Grupo Santander consolidated financial statements for 2023 were authorised by the Bank's directors (at the board meeting on 19 February 2024) in accordance with International Financial Reporting Standards as adopted by the European Union and with Bank of Spain circular 4/2017 and subsequent modifications, and Spanish corporate and commercial law applicable to the Group, using the basis of consolidation, accounting policies and measurement bases set forth in note 2, accordingly, they present fairly the Group's equity and financial position at 31 December 2023, 2022 and 2021 and the consolidated results of its operations and the consolidated cash flows in 2023, 2022 and 2021. These consolidated annual accounts have been prepared on the basis of the accounting records held by Banco Santander and by each of the other companies of the Group, and include the adjustments and reclassifications required to standardise the accounting policies and valuation criteria applied by Grupo Santander. The consolidated financial statements are also in compliance with IFRS as issued by the International Accounting Standards Board ('IFRS – IASB' and together with IFRS adopted by the European Union, 'IFRS'.
The notes to the consolidated financial statements contain additional information to that presented in the consolidated balance sheet, consolidated income statement, consolidated statement of recognised income and expense, consolidated statement of changes in total equity and consolidated statement of cash flows. The notes provide, in a clear, relevant, reliable and comparable manner, narrative descriptions and breakdowns of these statements.
The figures of the consolidated annual accounts are presented in millions of euros unless another alternative monetary unit is indicated, rounded to the nearest million unit.
548
Adoption of new standards and interpretations issued
The following modifications came into force and were adopted by the European Union in 2023:
•IFRS 17 Insurance Contracts and amendments to IFRS 17: new general accounting standard for insurance contracts, which includes the recognition, measurement, presentation and disclosure of information. Insurance contracts combine financial and service provision features that, in many cases, generate variable long-term cash flows. To properly reflect these characteristics, IFRS 17 combines the measurement of future cash flows with the recording of the result of the contract during the service provision period, presents separately the financial results from the results for the provision of the service and allows entities, through the choice of an accounting policy option, to recognize the financial results in the income statement or in other comprehensive income. Applicable retrospectively from 1 January 2023.
The Group has carried out a project to implement IFRS 17 with all affected Group entities and concluded the analysis of the effects of this new standard without having identified any material impact on its consolidated financial statements due to the effects of the first application of standard, except for a reclassification of the balance sheet to the heading 'Liabilities covered by insurance or liabilities under insurance contracts' (see note 1.d).
The most significant aspects of the insurance policy established by the Group are detailed in note 2.i.
•The amendments to IAS 1 Presentation of Financial Statements require companies to disclose material information about their accounting policies rather than their significant accounting policies. Applicable from 1 January 2023.
•The amendments to IAS 8 Accounting Policies, Changes in Accounting Estimates and Errors clarifies how to distinguish changes in accounting policies, which are generally applied retrospectively, from changes in accounting estimates, which are generally applied prospectively. Applicable from 1 January 2023.
•The amendments to IAS 12 Income Taxes require companies to:
(i) recognise deferred tax on transactions that, on initial recognition, give rise to equal amounts of taxable and deductible temporary differences. In addition, entities should recognise deferred tax assets (to the extent that it is probable that they can be utilised) and deferred tax liabilities at the beginning of the earliest comparative period for all deductible and taxable temporary differences associated with:
–Right-of-use assets and lease liabilities.
–Decommissioning, restoration and similar liabilities, and the corresponding amounts recognised as part of the cost of the related assets.
The cumulative effect of recognising these adjustments is recognised in retained earnings, or another component of equity, as appropriate. Applicable from 1 January 2023.
(ii) the second amendment applies to income taxes arising from tax law enacted or substantively enacted to implement the Pillar Two model rules published by the Organisation for Economic Co-operation and Development (OECD), including tax law that implements qualified domestic minimum top-up taxes described in those rules. The amendment includes the mandatory and temporary exception to the recognition and breakdown of deferred tax assets and liabilities derived from said Pillar Two model rules (applicable from the date of publication of the amendment and retrospectively) and establishes additional information requirements:
- If the tax law has entered into force, the related tax expense will be disclosed separately.
- If the tax law is enacted or substantially enacted but has not yet entered into force, reasonably estimable qualitative and quantitative information will be disclosed that helps users of financial information understand the entity's exposure to the rules of the Pillar two model.
The Group applies the exception to the recognition and disclosure of assets and liabilities for deferred taxes in relation to Pillar two taxes, in accordance with the amendments to the IAS 12. However, since Pillar two legislation is not in force at the reporting date of these consolidated annual accounts, Grupo Santander does not have the corresponding exposure to current tax. However, at the end of fiscal year 2023, there are geographies with tax laws for the implementation of substantially enacted Pillar two model rules that have not come into force, including the information required in note 27.f.
The application of the aforementioned amendments to accounting standards and interpretations did not have any material effects on Grupo Santander consolidated financial statements.
549
Likewise, at the date of approval of these consolidated annual accounts, the following standards which effectively came into force have effective dates after 31 December 2023:
•Amendment to IFRS 16 Lease Liability in a Sale and Leaseback requires a seller-lessee to subsequently measure lease liabilities arising from a leaseback without recognising any amount of the gain or loss that relates to the right of use retained. This new requirement does not prevent a seller-lessee from recognising in profit or loss any gain or loss relating to the partial or full termination of a lease. It will be applied retrospectively from 1 January 2024.
•Classification of Liabilities, amendments to IAS 1 Presentation of Financial Statements, considering non-current liabilities those in which the entity has the possibility of deferring payment for more than 12 months from the closing date of the reporting period.
Likewise, an additional amendment to IAS 1 on the classification of liabilities with covenants as current or non-current has been approved, specifying that covenants that must be complied with after the reporting date do not affect the classification of liabilities and require additionally their respective breakdowns.
It must be applied retrospectively in accordance with the normal requirements in IAS 8 Accounting Policies, Changes in Accounting Estimates and Errors. It will apply from 1 January 2024.
Finally, at the date of approval of these consolidated annual accounts, the following standards which effectively come into force after 31 December 2023 had not yet been adopted by the European Union:
•IAS 7 Statement of Cash Flows and IFRS 7 Financial Instruments: Additional disclosures are required for companies entering into supplier financing arrangements. The objective of the new disclosures is to provide information on Supplier Finance Arrangements (SFA) that allows investors to evaluate the effects on an entity's liabilities, cash flows and liquidity risk exposure. These modifications will be applicable from 1 January 2024.
•IAS 21 Effects of changes in foreign currency exchange rates: IAS 21 established the requirements to apply when there is a temporary lack of interchangeability between two currencies, but did not give indications when this situation was not temporary. Given this scenario, IAS 21 has been modified establishing the criteria to identify these situations, specifying how entities should estimate the spot exchange rate, the methodologies and data to be considered, as well as the associated disclosure requirements. It will be applicable from 1 January 2025.
Grupo Santander is currently analyzing the possible effects of these new standards and interpretations, and unless expressly indicated otherwise, no significant impacts are expected from their application.
All accounting policies and measurement bases with a material effect on the consolidated financial statements for 2023 were applied in the preparation of these consolidated annual accounts.
c) Use of critical estimates
The consolidated results and the determination of consolidated equity are sensitive to the accounting policies, measurement bases and estimates used by the directors of Banco Santander in preparing the consolidated financial statements.
The main accounting policies and measurement bases are set forth in note 2.
In the consolidated financial statements estimates were occasionally made by the senior management of Grupo Santander in order to quantify certain of the assets, liabilities, income, expenses and obligations reported herein. These estimates, which were made on the basis of the best information available, relate basically to the following:
•The impairment losses on certain assets: it applies to financial assets at fair value through other comprehensive income, financial assets at amortised cost, non-current assets held for sale, investments, tangible assets and intangible assets (see notes 6, 7, 10, 12, 13, 16, 17, 18 and 54).
•The assumptions used in the actuarial calculation of the post-employment benefit liabilities and commitments and other obligations (see note 25).
•The useful life of the tangible and intangible assets (see notes 16 and 18).
•The measurement of goodwill arising on consolidation (see note 17).
•The calculation of provisions and the consideration of contingent liabilities (see note 25).
•The fair value of certain unquoted assets and liabilities (see notes 6, 7, 8, 9, 10, 11, 20, 21 and 22).
•The recoverability of deferred tax assets (see note 27).
•The fair value of the identifiable assets acquired and the liabilities assumed in business combinations in accordance with IFRS 3 (see note 17).
To update the previous estimates, the Group's management has taken into account the current macroeconomic scenario resulting from the complex geopolitical situation, the levels of inflation and interest rates, as well as the resilience of the labour market being a priority monitoring focus due to the potential uncertainty generated in the Group's estimates.
For this reason, the Management of the Group has particularly evaluated the uncertainties caused by the current environment in relation to credit, liquidity and market risk, taking into account the best information available, to estimate the impact on the provisions for impairment of the credit portfolio, on the rates of interest, and in the valuation of debt instruments, developing in the notes the main estimates made during the period ended December 31, 2023 (see notes 10, 17, 50 and 54).
550
d) Information relating to 2022 and 2021
In accordance with the information contained in note 1.b regarding the first application of IFRS17, it has been restated the balance sheet information relating to "Liabilities under insurance contracts" corresponding to the years closed on 31 December 2022 and 2021, recorded at 1 January 2023, of a portfolio of products for an amount of approximately EUR 16 billion at 31 December 2022 (EUR 18 billion at 31 December 2021), derived from the different treatment that this new standard establishes for the components of an insurance contract.
Additionally, the segment information corresponding to the year ended 31 December 2021 was restated for comparative purposes. In accordance with the Group's organizational structure, as required by IFRS 8 (see note 52).
In order to interpret the changes in the balances with respect to 31 December 2023, it is necessary to take into consideration the exchange rate effect arising from the volume of foreign currency balances held by Grupo Santander in view of its geographic diversity (see note 52.b) and the impact of the appreciation/depreciation of the various currencies against the euro in 2023, based on the exchange rates at the end of 2023: Mexican peso (11.31 %), US dollar (-3.40 %), Brazilian real (5.31 %), Argentine peso (-78.84 %), Sterling pound (2.19 %), Chilean peso (-5.80 %), and Polish zloty (7.86 %); as well as the evolution of the comparable average rates: Mexican peso (10.30 %), US dollar (-2.77 %), Brazilian real (0.43 %), Sterling pound (-1.96 %), Chilean peso (1.13 %) and Polish zloty (3.20 %).
e) Capital management
i. Regulatory and economic capital
Credit institutions must meet a number of minimum capital and liquidity requirements. These minimum requirements are governed by the European Capital Requirements Regulation (hereinafter CRR) and the Capital Requirements Directive (hereinafter CRD).
On 27 October of 2021, the European Commission published the draft of a review of European banking legislation: CRR and CRD. At 8 November 2022, the European Council's proposal was published, and at 24 January 2023, that of the European Parliament. Throughout 2023, progress was made in the discussions on the new texts that will be approved in the first months of the year and their publication is expected to occur between the months of April and May 2024.
The update of the banking package pursues, on the one hand, the implementation of the final Basel III reforms and, on the other hand, strengthening the harmonization of banking supervision in the European Union (EU).
The Basel III final reform, which was agreed at the end of 2017, aims to introduce greater sensitivity in standardised metrics, reduce variability in risk-weighted assets at banks using internal models when calculating requirements and facilitate comparability among banks. Specifically, they propose changes concerning, among other matters, key risk factors, standardised credit risk, internal models, the output floor and operational risk.
The goal of achieving stronger supervision and protection of financial stability is expressed in a series of provisions concerning fit-and-proper requirements, extending the scope by revising certain definitions and additions on establishing third-country branches in the EU in order to achieve greater harmonisation of rules and better supervision of these type of entities.
The new CRR/CRD regulations are generally expected to apply from 1 January 2025, although there will be certain provisions for which an earlier application is foreseen, such as requirements on own funds for cryptoasset exposures.
In addition, during the month of December the EBA, in order to comply with the mandates given in the new banking package, published a consultation to amend some aspects of the Pillar III disclosure framework specifically, the changes include new disclosure requirements on output floor and credit valuation adjustment (CVA) risk and amendments to existing disclosure requirements on credit risk and market risk. Following this consultation, the final text proposal will be submitted to the European Commission in June 2024.
On the other hand, the EBA also published the consultation on the Pillar III Data Hub, which aims to respond to one of the requirements established by the new CRR, to centralise institutions’ prudential disclosures and make prudential information readily available through a single electronic access point on the EBA website. This initiative will facilitate access, usability and comparability of prudential information by all interested users, strengthening the transparency and market discipline of the EU banking sector and further contributing to the soundness of the European financial system.
With regard to the resolution framework, institutions must have an adequate funding structure to ensure that, in the event of financial distress, the institution has sufficient liabilities to absorb losses in order to recover its position or be resolved, while ensuring the protection of depositors and financial stability. For this purpose, global systemically institutions must therefore meet several minimum loss-absorbing requirements, named Total Loss-Absorbing Capacity (TLAC) and Minimum Requirement for own funds and Eligible Liabilities (MREL), which are regulated by the CRR and by the Bank Recovery and Resolution Directive (BRRD).
551
On 25 October 2022, the regulation on the prudential treatment for global systemically important banks was published. This modified both the CRR and the BRRD (Bank Recovery and Resolution Directive) as regards prudential treatment of global systemically important banks (G-SIBs) with a multiple point of entry (MPE) resolution strategy, as well as the methods for indirect underwriting of eligible instruments (Daisy Chains) to meet the minimum requirement for own funds and eligible liabilities. This Regulation, known as the 'Quick Fix', covers the following two objectives:
•The inclusion in BRRD and CRR of references to third countries subsidiaries to adjust the deduction for the holding of TLAC instruments issued from subsidiaries in third countries based on the excess TLAC/MREL existing in those subsidiaries, as well as the adjustment where the sum of the requirements for own funds and eligible liabilities of G-SIBs under an MPE strategy are higher than the theoretical requirements for the same group under a single point of entry (SPE) strategy. That is, the latter adjustment is based on a comparison between the two possible resolution strategies.
Additionally, for those subsidiaries in jurisdictions without a resolution regime in place, the Regulation provides for a transitional period until 31 December 2024. During this transitional period the institutions may adjust the deductions based on the excesses above the capital requirements in subsidiaries in third countries, if they meet certain requirements.
•Inclusion of a deduction scheme for MREL instrument holdings through entities of the same resolution group other than the resolution entity. This Regulation sets a deduction for the intermediate entity (Daisy Chains) that repurchases instruments, and, as there is such a deduction, the intermediate entity is obliged to issue the same amount as it is repurchasing, transferring the internal MREL needs to the resolution entity that will cover it with external MREL.
This Regulation is applicable since the 14 November 2022, except for the provisions relating to Daisy Chains, which apply since the 1 January 2024.
As regards Deposit Guarantee Schemes (DGSs), these are regulated by the Deposit Guarantee Schemes Directive (DGSD), which has not undergone any significant changes since its publication in 2014. The Directive aims to harmonise the DGSs of the Member States, thus ensuring stability and balance in the various different countries. It creates an appropriate framework for depositors to have better access to DGSs through clear scope of coverage, shorter repayment periods, better information and robust funding requirements. This Directive is transposed into Spanish law by Royal Decree 2606/1996, with additional amendments set forth in Royal Decree 1041/2021.
To ensure that eligible deposits are covered, the DGSs collect available financial means through contributions from their members which are performed at least once a year; being the target level of 0.8% of the covered deposits amount as of the 3 July 2024. Annual contributions are determined depending on the covered deposits and the risk profile faced by the institutions which are members of each DGS. The method for calculating contributions is set out in the EBA Guidelines (EBA/GL/2023/02).
In addition to the DGS, the Single Resolution Board (SRB) has built up the Single Resolution Fund (SRF) with annual contributions from banks and investment firms since 2016. The target level of this fund is 1% of covered deposits and the contributions to be made by members are calculated by the SRB based on euro area banks balance sheets and risk profiles. It has recently been officially announced that during 2024 the SRB will not issue a call for contributions to the SRF.
Lastly, on 18 April 2023, the European Commission published its proposal to review the Crisis Management and Deposit Insurance (CMDI) framework. Specifically, several proposals have been submitted:
•Early intervention measures, conditions for resolution and funding for the resolution measure;
•The scope of deposit coverage, use of funds of the deposit guarantee schemes, cross-border cooperation and transparency, and
•Certain aspects of the minimum requirement for own funds and eligible liabilities.
These proposals imply amending regulations such as:
•CRR,
•BRRD,
•Single Resolution Mechanism Regulation (SRMR), which establishes uniform rules and a uniform procedure for the resolution of credit institutions and certain investment firms in the framework of a Single Resolution Mechanism (SRM) and a Single Resolution Fund (SRF).
•Deposit Guarantee Schemes Directive (DGSD).
Additionally, Regulation 241/2014, which establishes the system applicable to prior authorisation to reduce own funds and establishes requirements on eligible liability instruments, was amended in April 2023. Firstly, this amendment extends the need to request approval to be able to reduce, buy back or redeem eligible liabilities; which until April 2023 was limited to own funds. Secondly, additional amendments were made, such as the creation of a new concept of prior general approval to buy back own funds and eligible liability instruments, as well as extending the period granted to the Supervisor and/or Resolution Authority, where appropriate, from 3 months to 4 months.
As regards prudential scope in the field of sustainability, the CRR mandated the EBA to evaluate whether specific prudential analysis of environmental and social risks was appropriate, prior to consulting the European Systemic Risk Board (ESRB). In the last quarter of 2023, both institutions published their respective reports on how existing micro and macroprudential tools can be used to manage environmental and social risks. In its own publication, the EBA made short-term recommendations to expedite integration of the environmental and social risks into the prudential framework, while recommending further work that could lead to a more comprehensive review of the framework.
552
At the international level, and particularly as regards reporting obligations on climate risks, it is important to note that the Basel Committee published a consultation paper at the end of 2023 proposing a series of qualitative and quantitative requirements that should be disclosed in entities' Pillar III reports. In this document, the Committee acknowledges that precise, consistent and quality climate data is still evolving, yet the Committee believes that the disclosure requirements will expedite the availability of said information and will facilitate banks' prospective risk assessments.
In parallel with the sustainable agenda, at the Digital level, the Basel Committee that sets the standards for prudential regulation of the banking sector and which published its principles on the prudential treatment of these exposures in 2022, has opened a consultation to propose specific adjustments to its standard on the prudential treatment of banks' cryptoasset exposures with the purpose of incorporating the developments that these products have undergone in the market. In addition, Basel also published a consultation on future disclosure requirements for banks' on-balance sheet exposures to cryptoassets at the end of 2023. Market discipline, also with regard to new products such as cryptoassets, will undoubtedly continue to be a focus of dialogue between regulators and the industry.
At 31 December 2023 Grupo Santander met the minimum
capital requirements established by current legislation (see note 54.d).
f) Environmental impact
In view of the business activities carried on by the Group entities, the Group does not have any environmental liability, expenses, assets, provisions or contingencies that might be material with respect to its consolidated equity, financial position or results (see note 54.a).
g) Events after the reporting period
In accordance with the agreement reached by the March 2023 general shareholders’ meeting, on 30 January 2024 the board of directors has approved a capital reduction of EUR 179,283,743.50 through the redemption of 358,567,487 shares (representing approximately 2.22 % of the share capital), acquired in the first share buyback program of 2023, with which the share capital has been set at EUR 7,912,789,286 , represented by 15,825,578,572 shares.
2. Accounting p olicies
The accounting policies applied in preparing the consolidated financial statements were as follows:
a) Foreign currency transactions
i. Presentation currency
Banco Santander’s functional and presentation currency is the euro. Also, the presentation currency of the Group is the euro.
ii. Translation of foreign currency balances
Foreign currency balances are translated to euros in two consecutive stages:
•Translation of foreign currency to the functional currency (currency of the main economic environment in which the entity operates).
•Translation to euros of the balances held in the functional currencies of entities whose functional currency is not the euro.
Translation of foreign currency to the functional currency
Foreign currency transactions performed by consolidated entities (or entities accounted for using the equity method) not located in European Monetary Union (“EMU”) countries are initially recognised in their respective currencies. Monetary items in foreign currency are subsequently translated to their functional currencies using the closing rate.
Furthermore:
•Non-monetary items measured at historical cost are translated to the functional currency at the exchange rate at the date of acquisition.
•Non-monetary items measured at fair value are translated at the exchange rate at the date when the fair value was determined.
•Income and expenses are translated at the average exchange rates for the year for all the transactions performed during the year. When applying this criterion, the Group considers whether there have been significant changes in the exchange rates in the year which, in view of their materiality with respect to the consolidated financial statements taken as a whole, would make it necessary to use the exchange rates at the transaction date rather than the aforementioned average exchange rates.
•The balances arising from non-hedging forward foreign currency/foreign currency and foreign currency/euro purchase and sale transactions are translated at the closing rates prevailing in the forward foreign currency market for the related maturity.
553
Translation of functional currencies to euros
The balances in the financial statements of consolidated entities (or entities accounted for using the equity method) whose functional currency is not the euro are translated to euros as follows:
-Assets and liabilities, at the closing rates.
-Income and expenses, at the average exchange rates for the year.
-Equity items, at the historical exchange rates.
iii. Recognition of exchange differences
The exchange differences arising on the translation of foreign currency balances to the functional currency are generally recognised at their net amount under 'Exchange differences, net' in the consolidated income statement, except for exchange differences arising on financial instruments at fair value through profit or loss, which are recognised in the consolidated income statement without distinguishing them from other changes in fair value, and for exchange differences arising on non-monetary items measured at fair value through equity, which are recognised under 'Other comprehensive income–Items that may be reclassified to profit or loss–Exchange differences' except for exchange differences on equity instruments, where the option to irrevocably elect to be measured at fair value through changes in accumulated other comprehensive income, which are recognised in accumulated 'Other Comprehensive Income - Items not to be reclassified to profit or loss - Changes in fair value of equity instruments measured at fair value' through other comprehensive income (see note 29).
The exchange differences arising on the translation to euros of the financial statements denominated in functional currencies other than the euro are recognised in 'Other comprehensive income–Items that may be reclassified to profit or loss–Exchange differences' in the consolidated balance sheet, whereas those arising on the translation to euros of the financial statements of entities accounted for using the equity method are recognised in equity under 'Other comprehensive income–Items that may be reclassified to profit or loss and Items not reclassified to profit or loss–Other recognised income and expense' of investments in subsidiaries, joint ventures and associates (see note 29), until the related item is derecognised, at which time they are recognised in profit or loss.
Exchange differences arising on actuarial gains or losses when converting to euros the financial statements denominated in the functional currencies of entities whose functional currency is different from the euro are recognised under equity 'Other comprehensive income–Items not reclassified to profit or loss–Actuarial gains or (-) losses' on defined benefit pension plans (see note 29).
iv. Entities located in hyperinflationary economies
When a subsidiary operates in a country with hyperinflationary economy, IAS 29 Financial Information in Hyperinflationary Economies is applied, which means that:
–Historical cost of non-monetary assets and liabilities and of the various items of equity have to be adjusted to reflect the changes in the purchasing power of the currency due to inflation from their date of acquisition or incorporation into the consolidated balance sheet.
–The different items of the income statement are adjusted by the inflationary index since their generation, with a balancing entry in 'Other comprehensive income'.
–The loss on the net monetary position is recorded in the income for the year against 'Accumulated Other comprehensive income'.
–All components of the financial statements of the subsidiary are translated at the closing exchange rate.
The deterioration of the economic situation in Argentina over the last years caused, among other impacts, a significant increase in inflation, which by the end of 2018 had reached 48 % per year (147 % accumulated in three years). This led the Group to conclude that it was necessary to apply IAS 29 Financial Information in Hyperinflationary Economies to its activities in the country in question in its consolidated financial statements from that year on.
Inflation during 2023, to the national consumer price index published by the National Statistics and Census Institute, was 211.2 % for the year (94.8 % at 31 December 2022). The exchange rate at 31 December 2023 has been of 893.63 Argentine pesos per euro (189.12 Argentine pesos per euro at 31 December 2022).
At 31 December 2023, no other country in which the consolidated and associated entities of Grupo Santander are located is considered to have a hyperinflationary economy in accordance with the criteria established in this regard by the International Financial Reporting Standards adopted by the European Union.
v. Exposure to foreign currency risk
Grupo Santander hedges a portion of its long-term foreign currency positions using foreign exchange derivative financial instruments (see note 36). Also, the Group manages foreign exchange risk dynamically by hedging its short-term position (with a potential impact on profit or loss) in order to limit the impact of currency depreciations while optimising the cost of financing the hedges.
The following tables show the sensitivity of the consolidated income statement and consolidated equity to percentage changes of ± 1% in the foreign exchange rate positions arising from investments in Grupo Santander companies with currencies other than the euro (with its hedges) and in their results (with its hedges), in which the Group maintains significant balances.
554
The estimated effect on the consolidated equity attributable to Grupo Santander and on consolidated profit and loss account of a 1 % appreciation of the euro against the corresponding currency is as follows:
| EUR million | |||||||||||||||||||||||
| Effect on consolidated equity | Effect on consolidated profit | ||||||||||||||||||||||
| Currency | 2023 | 2022 | 2021 | 2023 | 2022 | 2021 | |||||||||||||||||
| US dollar | ( | ( | ( | ( | ( | ( | |||||||||||||||||
| Chilean peso | ( | ( | ( | ( | ( | ( | |||||||||||||||||
| Pound sterling | ( | ( | ( | ( | ( | ( | |||||||||||||||||
| Mexican peso | ( | ( | ( | ( | ( | ( | |||||||||||||||||
| Brazilian real | ( | ( | ( | ( | ( | ( | |||||||||||||||||
| Polish zloty | ( | ( | ( | ( | ( | ||||||||||||||||||
| Argentine peso | ( | ( | ( | ( | ( | ( | |||||||||||||||||
Similarly, the estimated effect on the Group’s consolidated equity and on consolidated profit and loss account of a 1 % depreciation of the euro against the corresponding currency is as follows:
| EUR million | |||||||||||||||||||||||
| Effect on consolidated equity | Effect on consolidated profit | ||||||||||||||||||||||
| Currency | 2023 | 2022 | 2021 | 2023 | 2022 | 2021 | |||||||||||||||||
| US dollar | |||||||||||||||||||||||
| Chilean peso | |||||||||||||||||||||||
| Pound sterling | |||||||||||||||||||||||
| Mexican peso | |||||||||||||||||||||||
| Brazilian real | |||||||||||||||||||||||
Polish zloty | |||||||||||||||||||||||
| Argentine peso | |||||||||||||||||||||||
The above data were obtained as follows:
a) Effect on consolidated equity: in accordance with the accounting policy detailed in note 2.a.iii, foreign exchange rate impact arising on the translation to euros of the financial statements in the functional currencies of the Group entities whose functional currency is not the euro are recognised in consolidated equity. The potential effect that a change in the exchange rates of the related currency would have on the Group’s consolidated equity was therefore determined by applying the aforementioned change to the net value of each unit’s assets and liabilities -including, where appropriate, the related goodwill- and by taking into consideration the offsetting effect of the hedges of net investments in foreign operations.
b) Effect on consolidated profit: the effect was determined by applying the up and down movements in the average exchange rates of the year, as indicated in note 2.a.ii (except in the case of Argentina, which is a hyperinflationary economy and has applied the closing exchange rate), to translate to euros the income and expenses of the consolidated entities whose functional currency is not the euro, taking into consideration, where appropriate, the offsetting effect of the various hedging transactions in place.
The estimates used to obtain the foregoing data were performed considering the effects of the changes in the exchange rate in standalone basis not considering the effect of the performance of other variables whose changes would affect equity and profit or loss, such as variations in the interest rates of the reference currencies or other market factors. Accordingly, all variables other than the exchange rate variations were kept constant with respect to their positions at 31 December 2023, 2022 and 2021.
b) Basis of consolidation
i. Subsidiaries
Subsidiaries are defined as entities over which the Bank has the capacity to exercise control. The Bank controls an entity when it is exposed, or has rights, to variable returns from its involvement with the investee and has the ability to affect those returns through its power over the investee.
The financial statements of the subsidiaries are fully consolidated with those of the Bank. Accordingly, all balances and effects of the transactions between consolidated companies are eliminated on consolidation.
On acquisition of control of a subsidiary, its assets, liabilities and contingent liabilities are recognised at their acquisition-date fair values. Any positive differences between the acquisition cost and the fair values of the identifiable net assets acquired are recognised as goodwill (see note 17). Negative differences are recognised in profit or loss on the date of acquisition.
Additionally, the share of third parties of Grupo Santander equity is presented under 'Non-controlling interests' in the consolidated balance sheet (see note 28). Their share of the profit for the year is presented under 'Profit attributable to non-controlling interests' in the consolidated income statement.
The results of subsidiaries acquired during the year are included in the consolidated income statement from the date of acquisition to year-end. Similarly, the results of subsidiaries for which control is lost during the year are included in the consolidated income statement from the beginning of the year to the date of disposal.
At 31 December 2023, apart from the structured consolidated entities, Grupo Santander does not control any company in which it maintains a percentage of direct participation in its share capital of less than 50%.
The appendices contain significant information on the subsidiaries.
ii. Interests in joint ventures
Joint ventures are deemed to be entities that are not subsidiaries but which are jointly controlled by two or more unrelated entities. This is evidenced by contractual arrangements whereby two or more parties have interests in entities so that decisions about the relevant activities require the unanimous consent of all the parties sharing control.
555
In the consolidated financial statements, investments in joint ventures are accounted for using the equity method, i.e. at the Group’s share of net assets of the investee, after taking into account the dividends received therefrom and other equity eliminations. The profits and losses resulting from transactions with a joint venture are eliminated to the extent of the Group’s interest therein.
The appendices contain relevant information on the joint ventures.
iii. Associates
Associates are entities over which Banco Santander is in a position to exercise significant influence, but not control or joint control. It is presumed that Banco Santander exercises significant influence if it holds 20% or more of the voting power of the investee.
In the consolidated financial statements, investments in associates are accounted for using the equity method, with the same criteria applicable to shares in joint ventures.
There are certain investments in entities which, although Grupo Santander owns 20% or more of their voting power, are not considered to be associates because the Group is not in a position to exercise significant influence over them. At 31 December 2022, 2021 and 2020 this was the situation of the investment in Project Quasar Investments 2017, S.L., despite maintaining a 49
There are also certain investments in associates where the Group owns less than 20% of the voting rights, as it is determined that it has the capacity to exercise significant influence over them. The impact of these companies is immaterial in the Group's consolidated financial statements.
The appendices contain significant information on the associates.
iv. Structured entities
In some cases, Grupo Santander incorporates entities, or holds ownership interests therein, to enable its customers to access certain investments, or for the transfer of risks or other purposes. Those entities are called 'structured entities' and they are characterized by the fact that since the voting, or similar power is not a key factor in deciding who controls the entity. The control is determined by using internal criteria and procedures and taking into consideration the applicable legislation, as described above. Specifically, for those entities to which this policy applies (mainly investment funds and pension funds), the Group analyses the following factors:
•Percentage of ownership held by Grupo Santander; 20% is established as the general threshold.
•Identification of the fund manager, and verification as to whether it is a company controlled by the Group since this could affect Grupo Santander ability to direct the relevant activities.
•Existence of agreements between investors that might require decisions to be taken jointly by the investors, rather than by the fund manager.
•Existence of currently exercisable removal rights (possibility of removing the manager from his position), since the existence of such rights might limit the manager’s power over the fund, and it may be concluded that the manager is acting as an agent of the investors.
•Analysis of the fund manager’s remuneration regime, taking into consideration that a remuneration regime that is proportionate to the service rendered does not, generally, create exposure of such importance as to indicate that the manager is acting as the principal. Conversely, if the remuneration regime is not proportionate to the service rendered, this might give rise to an exposure that would lead the Group to a different conclusion.
These structured entities also include the securitisation special purpose vehicles, which are consolidated in the case of the Special Purpose Vehicles (SPVs) over which, being exposed to variable yield, it is considered that the Group continues to exercise control.
The exposure associated with unconsolidated structured entities, additional to investments in the equity of investment funds (note 8), are not material with respect to the Group’s consolidated financial statements.
v. Business combinations
A business combination is the bringing together of two or more separate entities or economic units into one single entity or group of entities.
Business combinations whereby Grupo Santander obtains control over an entity or a business are recognised for accounting purposes as follows:
•Grupo Santander measures the cost of the business combination, which is normally the consideration transferred, defined as the acquisition-date fair values of the assets transferred, the liabilities incurred to the former owners of the acquiree and the equity instruments issued, if any, by the acquirer. In cases where the amount of the consideration to be transferred has not been definitively established at the acquisition date, but rather depends on future events, any contingent consideration is recognised as part of the consideration transferred and measured at its acquisition-date fair value. Moreover, acquisition-related costs do not for these purposes form part of the cost of the business combination.
•The fair values of the assets, liabilities and contingent liabilities of the acquired entity or business, including any intangible assets identified in the business combination which might not have been recognised by the acquiree, are estimated and recognised in the consolidated balance sheet; the Group also estimates the amount of any non-controlling interests and the fair value of the previously held equity interest in the acquiree.
•Any positive difference between the aforementioned items is recognised as discussed in note 2.m. Any negative difference is recognised under 'Negative Goodwill' recognised in the consolidated income statement.
Goodwill is only calculated and recognised once, when control of a business or an entity is obtained.
556
vi. Changes in the levels of ownership interests in subsidiaries
Acquisitions and disposals not giving rise to a change in control are recognised as equity transactions, and no gain or loss is recognised in the income statement and the initially recognised goodwill is not remeasured. The difference between the consideration transferred or received and the decrease or increase in non-controlling interests, respectively, is recognised in reserves.
Similarly, when control over a subsidiary is lost, the assets, liabilities and non-controlling interests and any other items recognised in 'Other Comprehensive income' of that company are derecognised from the consolidated balance sheet, and the fair value of the consideration received and of any remaining equity interest is recognised. The difference between these amounts is recognised in profit or loss.
c) Classification of financial instruments
A financial instrument is any contract that gives rise to a financial asset of one entity and a financial liability or equity instrument of another entity.
The following transactions are not treated for accounting purposes as financial instruments:
•Investments in associates and joint ventures (see note 13).
•Rights and obligations under employee benefit plans (see note 25).
•Rights and obligations under insurance contracts (see note 15).
•Contracts and obligations relating to employee remuneration based on own equity instruments (see note 34).
i. Classification of financial assets for measurement purposes
Financial assets are initially classified into the various categories used for management and measurement purposes, unless they have to be presented as 'Non-current assets held for sale' or they relate to 'Cash, cash balances at central banks and other deposits on demand', 'Changes in the fair value of hedged items in portfolio hedges of interest rate risk (asset side)', 'Hedging derivatives and Investments', which are reported separately.
Classification of financial instruments: the classification criteria for financial assets depends on the business model for their management and the characteristics of their contractual flows.
Grupo Santander business models refer to the way in which it manages its financial assets to generate cash flows. In defining these models, the Group takes into account the following factors:
•How key entity staff are assessed and reported on the performance of the business model and the financial assets held in the business model.
•The risks that affect the performance of the business model (and the financial assets held in the business model) and, specifically, the way in which these risks are managed.
•How business managers are remunerated.
•The frequency, the calendar and volume of sales in previous years, as well as expectations of future sales and the reasons of the sales.
The analysis of the characteristics of the contractual flows of financial assets requires an assessment of the congruence of these flows with a basic loan agreement. The Group determines if the contractual cash flows of its financial assets that are only principal and interest payments on the outstanding principal amount at the beginning of the transaction. This analysis takes into consideration four factors (performance, clauses, contractually linked products and currencies). Furthermore, among the most significant judgements used by the Group in carrying out this analysis, the following ones are included:
•The return on the financial asset, in particular in cases of periodic interest rate adjustments where the term of the reference rate does not coincide with the frequency of the adjustment. In these cases, an assessment is made to determine whether or not the contractual cash flows differ significantly from the flows without this change in the time value of money, establishing a tolerance level of 5%.
•When contractual clauses that may modify the cash flows of the financial asset exist, the structure of the cash flows before and after the activation of such clauses is analysed, regardless of the probability of occurrence of the contingent event. The evaluation of contractual flows of financial assets with characteristics associated with ESG is included in this analysis.
•Financial assets whose cash flows have different priority for payment due to a contractual link to underlying assets (e.g. securitisations) require a look-through analysis by the Group so as to review that both the financial asset and the underlying assets are only principal and interest payments and that the exposure to credit risk of the set of underlying assets belonging to the tranche analysed is less than or equal to the exposure to credit risk of the set of underlying assets of the instrument.
Depending on these factors, the asset can be measured at amortised cost, at fair value with changes in other comprehensive income, or at fair value with changes through profit and loss. IFRS 9 also establishes an option to designate an instrument at fair value with changes in profit or loss, when doing so eliminates or significantly reduces a measurement or recognition inconsistency (sometimes referred to as 'accounting asymmetry') that would otherwise arise from measuring assets or liabilities or recognising gains and losses on different bases.
Grupo Santander uses the following criteria for the classification of the financial debt instruments:
•Amortised cost: financial instruments under a business model whose objective is to collect principal and interest flows, over which there is no significant unjustified sales and fair value is not a key element in the management of these assets and contractual conditions they give rise to cash flows on specific dates, which are only payments of principal and interest on the outstanding principal amount. In this sense, unjustified sales are considered to be those other than those related to an increase in the credit risk of the asset, unanticipated funding needs (stress case scenarios). Additionally, the characteristics of its contractual flows represent substantially a 'basic financing agreement'.
557
•Fair value with changes in other comprehensive income: financial instruments held in a business model whose objective is to collect principal and interest cash flows and the sale of these assets, where fair value is a key factor in their management. Additionally, the contractual cash flow characteristics substantially represent a 'basic financing agreement'.
•Fair value with changes in profit or loss: financial instruments included in a business model whose objective is not obtained through the above mentioned models, where fair value is a key factor in managing of these assets, and financial instruments whose contractual cash flow characteristics do not substantially represent a 'basic financing agreement'. In this section it can be enclosed the portfolios classified under 'Financial assets held for trading', 'Non-trading financial assets mandatorily at fair value through profit or loss' and 'Financial assets at fair value through profit or loss'. In this regard, most of the financial assets presented in the category of 'Financial assets designated at value reasonable with change in results' are instruments financial services that, not being part of the portfolio of negotiation, are contracted jointly with other financial instruments that are recorded in the category of 'held for trading', and that by both are recorded at fair value with changes in results, so your record in any other category would produce accounting asymmetries.
Equity instruments will be classified at fair value under IFRS 9, with changes in profit or loss, unless the Group decides, for non-trading assets, to classify them at fair value with changes in other comprehensive income (irrevocably) at initial recognition.
ii. Classification of financial assets for presentation purposes
Financial assets are classified by nature into the following items in the consolidated balance sheet:
•Cash, cash balances at Central Banks and other deposits on demand: cash balances and balances receivable on demand relating to deposits with central banks and credit institutions.
•Loans and advances: includes the debit balances of all credit and loans granted by the Group, other than those represented by securities, as well as finance lease receivables and other debit balances of a financial nature in favour of the Group such as cheques drawn on credit institutions, balances receivable from clearing houses and settlement agencies for transactions on the stock exchange and organised markets, bonds given in cash, capital calls, fees and commissions receivable for financial guarantees and debit balances arising from transactions not originating in banking transactions and services, such as the collection of rentals and similar items. They are classified, on the basis of the institutional sector to which the debtor belongs, into:
–Central banks: credit of any nature, including deposits and money market transactions received from the Bank of Spain or other central banks.
–Credit institutions: credit of any nature, including deposits and money market transactions, in the name of credit institutions.
–Customers: includes the remaining credit, including money market transactions through central counterparties.
•Debt securities: bonds and other securities that represent a debt for their issuer, that generate an interest return, and that are in the form of certificates or book entries.
•Equity instruments: financial instruments issued by other entities, such as shares, which have the nature of equity instruments for the issuer, other than investments in subsidiaries, joint ventures or associates. Investment fund units are included in this item.
•Derivatives: includes the fair value in favour of the Group of derivatives which do not form part of hedge accounting, including embedded derivatives separated from hybrid financial instruments.
•Repurchase agreements and reverse repurchase agreements: Purchases of financial instruments under a non-optional resale (repurchase) agreement at a fixed price (repos) are recognised in the consolidated balance sheet as financing granted, based on the nature of the debtor, under 'Loans and advances with central banks', 'Loans and advances to credit institutions' or 'Loans and advances to customers. Differences between the purchase and sale prices are recognised as interest over the contract term.
•Changes in the fair value of hedged items in portfolio hedges of interest rate risk: this item is the balancing entry for the amounts credited to the consolidated income statement in respect of the measurement of the portfolios of financial instruments which are effectively hedged against interest rate risk through fair value hedging derivatives.
•Hedging derivatives: Includes the fair value in favour of the Group of derivatives, including embedded derivatives separated from hybrid financial instruments, designated as hedging instruments in hedge accounting.
iii. Classification of financial liabilities for measurement purposes
Financial liabilities are initially classified into the various categories used for management and measurement purposes, unless they have to be presented as 'Liabilities associated with non-current assets held for sale' or they relate to 'Hedging derivatives' or changes in the fair value of hedged items in portfolio hedges of interest rate risk (liability side), which are reported separately.
In most cases, changes in the fair value of financial liabilities designated at fair value through profit or loss, caused by the entity's credit risk, are recognized in other comprehensive income.
Financial liabilities are included for measurement purposes in one of the following categories:
•Financial liabilities held for trading (at fair value through profit or loss): this category includes financial liabilities incurred for the purpose of generating a profit in the near term from fluctuations in their prices, financial derivatives not designated as hedging instruments, and financial liabilities arising from the outright sale of financial assets acquired under reverse repurchase agreements (“reverse repos”) or borrowed (short positions).
558
•Financial liabilities designated at fair value through profit or loss: financial liabilities are included in this category when they provide more relevant information, either because this eliminates or significantly reduces recognition or measurement inconsistencies (accounting mismatches) that would otherwise arise from measuring assets or liabilities or recognising the gains or losses on them on different bases, or because a group of financial liabilities or financial assets and liabilities is managed and its performance is evaluated on a fair value basis, in accordance with a documented risk management or investment strategy, and information about the group is provided on that basis to the Group’s key management personnel.
Liabilities may only be included in this category on the date when they are incurred or originated.
•Financial liabilities at amortised cost: financial liabilities, irrespective of their instrumentation and maturity, not included in any of the above-mentioned categories which arise from the ordinary borrowing activities carried on by financial institutions.
iv. Classification of financial liabilities for presentation purposes
Financial liabilities are classified by nature into the following items in the consolidated balance sheet:
•Deposits: includes all repayable balances received in cash by Grupo Santander, other than those instrumented as marketable securities and those having the substance of subordinated liabilities (amount of the loans received, which for credit priority purposes are after common creditors), except for the debt instruments. This item also includes cash bonds and cash consignments received the amount of which may be invested without restriction. Deposits are classified on the basis of the creditor’s institutional sector into:
–Central banks: deposits of any nature, including credit received and money market transactions received from the Bank of Spain or other central banks.
–Credit institutions: deposits of any nature, including credit received and money market transactions in the name of credit institutions.
–Customer: includes the remaining deposits, including money market transactions through central counterparties.
During the 2019 financial year, the European Central Bank announced a new program of longer-term financing operations with a specific objective (TLTRO III), which included special conditions, including a reduction in the interest rate applicable between June 2020 and June 2022 subject to compliance with a certain volume of eligible loans.
Grupo Santander chose to accrue interest in accordance with the specific periods of adjustment to market rates, so that the interest corresponding to said period (-1%) has been recorded in the income statement from June 2020 to June 2022, having met the computable loan threshold that gave rise to the extra rate on that date.
Subsequently, and as a result of the modifications introduced by the European Central Bank in the conditions of the program, which include changes in its interest rates, the Group has updated the effective interest rate at which interest accrues on said financial liability, maintaining the criterion adopted in previous years, and considering said modifications a change in the variable interest rate (which affects the EIR) and is applied prospectively.
•Marketable debt securities: includes the amount of bonds and other debt represented by marketable securities, other than those having the substance of subordinated liabilities (amount of the loans received, which for credit priority purposes are after common creditors, and includes the amount of the financial instruments issued by the Group which, having the legal nature of capital, do not meet the requirements to qualify as equity, such as certain preferred shares issued). This item includes the component that has the consideration of financial liability of the securities issued that are compound financial instruments.
•Derivatives: includes the fair value, with a negative balance for the Group, of derivatives, including embedded derivatives separated from the host contract, which do not form part of hedge accounting.
•Short positions: includes the amount of financial liabilities arising from the outright sale of financial assets acquired under reverse repurchase agreements or borrowed.
•Other financial liabilities: includes the amount of payment obligations having the nature of financial liabilities not included in other items (includes, among others, the balance of lease liabilities), and liabilities under financial guarantee contracts, unless they have been classified as non-performing.
•Repurchase agreements and reverse repurchase agreements: Sales of financial instruments under a non-optional resale (repurchase) agreement at a fixed price (repos) are recognised in the consolidated balance sheet as financing received, based on the nature of the creditor, under 'Deposits from central banks', 'Deposits from credit institutions' or 'Customer deposits'. Differences between the purchase and sale prices are recognised as interest over the contract term.
•Changes in the fair value of hedged items in portfolio hedges of interest rate risk: this item is the balancing entry for the amounts charged to the consolidated income statement in respect of the measurement of the portfolios of financial instruments which are effectively hedged against interest rate risk through fair value hedging derivatives.
•Hedging derivatives: includes the fair value of the Group’s liability in respect of derivatives, including embedded derivatives separated from hybrid financial instruments, designated as hedging instruments in hedge accounting.
559
•The preference shares contingently convertible into ordinary shares eligible as Additional Tier 1 capital (PPCC) -perpetual shares, which may be repurchased by the issuer in certain circumstances, the interest on which is discretionary, and would convert into variable number of newly issued ordinary shares if the capital ratio of the Bank or its consolidated group falls below a given percentage (trigger event), as those two terms are defined in the related issue prospectuses are recognised for accounting purposes by the Group as compound instruments. The liability component reflects the issuer’s obligation to deliver a variable number of shares and the equity component reflects the issuer’s discretion in relation to the payment of the related coupons. In order to effect the initial allocation, the Group estimates the fair value of the liability as the amount that would have to be delivered if the trigger event were to occur immediately and, accordingly, the equity component, calculated as the residual amount, is zero. In view of the aforementioned discretionary nature of the payment of the coupons, they are deducted directly from equity.
•Capital perpetual preference shares (PPCA), with the possibility of purchase by the issuer in certain circumstances, whose remuneration is discretionary, and which will be amortised permanently, totally or partially, in the event that the bank or its consolidated group submits a capital ratio lesser than a certain percentage (trigger event), as defined in the corresponding prospectuses, are accounted for by the Group as equity instruments.
•Derivatives embedded in other financial instruments or in other host contracts are accounted for separately as derivatives if their risks and characteristics are not closely related to those of the host contracts, provided that the host contracts are not classified as financial assets/liabilities designated at fair value through profit or loss or as 'Financial assets/liabilities held for trading'.
d) Measurement of financial assets and liabilities and recognition of fair value changes
In general, financial assets and liabilities are initially recognised at fair value which, in the absence of evidence to the contrary, is deemed to be the transaction price.
In this regard, IFRS 9 states that regular way purchases or sales of financial assets shall be recognised and derecognised on the trade date or on the settlement date. Grupo Santander has opted to make such recognition on the trading date or settlement date, depending on the convention of each of the markets in which the transactions are carried out. For example, in relation to the purchase or sale of debt securities or equity instruments traded in the Spanish market, securities market regulations stipulate their effective transfer at the time of settlement and, therefore, the same time has been established for the accounting record to be made.
The fair value of instruments not measured at fair value through profit and loss is adjusted by transaction costs. Subsequently, and on the occasion of each accounting close, they are valued in accordance with the following criteria:
i. Measurement of financial assets
Financial assets are measured at fair value are valued mainly at their fair value without deducting any transaction cost for their sale.
The fair value of a financial instrument on a given date is taken to be the price that would be received to sell an asset or paid to transfer a liability in an orderly transaction between market participants. The most objective and common reference for the fair value of a financial instrument is the price that would be paid for it on an active, transparent and deep market (quoted price or market price). At 31 December 2023, there were no significant investments in quoted financial instruments that had ceased to be recognised at their quoted price because their market could not be deemed to be active.
If there is no market price for a given financial instrument, its fair value is estimated on the basis of the price established in recent transactions involving similar instruments and, in the absence thereof, of valuation techniques commonly used by the international financial community, taking into account the specific features of the instrument to be measured and, particularly, the various types of risk associated with it.
All derivatives are recognised in the balance sheet at fair value from the trade date. If the fair value is positive, they are recognised as an asset and if the fair value is negative, they are recognised as a liability. The fair value on the trade date is deemed, in the absence of evidence to the contrary, to be the transaction price. The changes in the fair value of derivatives from the trade date are recorded in the consolidated income statement. Specifically, the fair value of financial derivatives traded in organised markets included in the portfolios of financial assets or liabilities held for trading is deemed to be their daily quoted price and if, for exceptional reasons, the quoted price cannot be determined on a given date, these financial derivatives are measured using methods similar to those used to measure derivatives.
The fair value of derivatives is taken to be the sum of the future cash flows arising from the instrument, discounted to present value at the date of measurement (present value or theoretical close) using valuation techniques commonly used by the financial markets: net present value, option pricing models and other methods.
The amount of debt securities and loans and advances under a business model whose objective is to collect the principal and interest flows are valued at their amortised cost, as long as they comply with the 'SPPI' (Solely Payments of Principal and Interest) test, using the effective interest rate method in their determination. Amortised cost refers to the acquisition cost of a corrected financial asset or liability (more or less, as the case may be) for repayments of principal and the part systematically charged to the consolidated income statement of the difference between the initial cost and the corresponding reimbursement value at expiration. In the case of financial assets, the amortised cost includes, in addition, the corrections to their value due to the impairment. In the loans and advances covered in fair value hedging transactions, the changes that occur in their fair value related to the risk or the risks covered in these hedging transactions are recorded.
The effective interest rate is the discount rate that exactly matches the carrying amount of a financial instrument to all its estimated cash flows of all kinds over its remaining life.
560
For fixed rate financial instruments, the effective interest rate coincides with the contractual interest rate established on the acquisition date plus, where applicable, the fees and transaction costs that, because of their nature, form part of their financial return. In the case of floating rate financial instruments, the effective interest rate coincides with the rate of return prevailing in all connections until the next benchmark interest reset date.
Equity instruments and contracts related with these instruments are measured at fair value. However, in certain circumstances the Group estimates cost value as a suitable estimate of the fair value. This can happen if the recent event available information is not enough to measure the fair value or if there is a broad range of possible measures and the cost value represents the best estimates of fair value within this range.
The amounts at which the financial assets are recognised represent, in all material respects, the Group’s maximum exposure to credit risk at each reporting date. Also, Grupo Santander has received collateral and other credit enhancements to mitigate its exposure to credit risk, which consist mainly of mortgage guarantees, cash collateral, equity instruments and personal security, assets leased out under finance lease and full-service lease agreements, assets acquired under repurchase agreements, securities loans and credit derivatives.
ii. Measurement of financial liabilities
In general, financial liabilities are measured at amortised cost, as defined above, except for those included under 'Financial liabilities held for trading' and 'Financial liabilities designated at fair value through profit or loss' and financial liabilities designated as hedged items (or hedging instruments) in fair value hedges, which are measured at fair value. The changes in credit risk arising from financial liabilities designated at fair value through profit or loss are recognised in accumulated other comprehensive income, unless they generate or increase an accounting mismatch, in which case changes in the fair value of the financial liability in all respects are recognised in the income statement.
iii. Valuation techniques
The financial instruments at fair value determined on the basis of published price quotations in active markets (level 1) include government debt securities, private-sector debt securities, derivatives traded in organised markets, securitised assets, shares, short positions and fixed-income securities issued.
In cases where price quotations cannot be observed, management makes its best estimate of the price that the market would set, using its own internal models, described in note 50.c. In most cases, these internal models use data based on observable market parameters as significant inputs (level 2) and, in cases, they use significant inputs not observable in market data (level 3). In order to make these estimates, various techniques are employed, including the extrapolation of observable market data. The best evidence of the fair value of a financial instrument on initial recognition is the transaction price, unless the fair value of the instrument can be obtained from other market transactions performed with the same or similar instruments or can be measured by using a valuation technique in which the variables used include only observable market data, mainly interest rates.
561
iv. Recognition of fair value changes
As a general rule, changes in the carrying amount of financial assets and liabilities are recognised in the consolidated income statement. A distinction is made between the changes resulting from the accrual of interest and similar items, (which are recognised under Interest income or Interest expense, as appropriate), and those arising for other reasons, which are recognised at their net amount under 'Gains/losses on financial assets and liabilities'.
Adjustments due to changes in fair value arising from:
•'Financial assets at fair value with changes in other comprehensive income' are recorded temporarily, in the case of debt instruments in 'Other comprehensive income - Elements that can be reclassified to profit or loss - Financial assets at fair value with changes in other comprehensive income', while in the case of equity instruments are recorded in 'other comprehensive income - Elements that will not be reclassified to line item - Changes in the fair value of equity instruments valued at fair value with changes in other comprehensive income'.
Exchange differences on debt instruments measured at fair value with changes in other comprehensive income are recognised under 'Exchange Differences, net' of the consolidated income statement. Exchange differences on equity instruments, in which the irrevocable option of being measured at fair value with changes in other comprehensive income has been chosen, are recognised in 'Other comprehensive income - Items that will not be reclassified to profit or loss - Changes in the fair value of equity instruments measured at fair value with changes in other comprehensive income'.
•Items charged or credited to 'Items that may be reclassified to profit or loss – Financial assets at fair value through other comprehensive income' and 'Other comprehensive income – Items that may be reclassified to profit or loss – Exchange differences in equity' remain in the Group's consolidated equity until the asset giving rise to them is impaired or derecognised, at which time they are recognised in the consolidated income statement.
•Unrealized capital gains on financial assets at fair value through other comprehensive income classified as 'Non-current assets held for sale' because they form part of a disposal group or a discontinued operation that are recorded in the equity balancing entry 'Other accumulated comprehensive income - Items that can be reclassified in income - Non-current assets as held for sale.
v. Hedging transactions
The consolidated entities use financial derivatives for the following purposes: i) to facilitate these instruments to customers who request them in the management of their market and credit risks; ii) to use these derivatives in the management of the risks of the Group entities’ own positions and assets and liabilities (hedging derivatives); and iii) to obtain gains from changes in the prices of these derivatives (derivatives).
Financial derivatives that do not qualify for hedge accounting are treated for accounting purposes as trading derivatives.
Additionally, certain financial assets and liabilities can be designated as hedging instruments to cover exchange rate risk.
A derivative qualifies for hedge accounting if all the following conditions are met:
1. The derivative hedges one of the following three types of exposure:
a.Changes in the fair value of assets and liabilities, as well as firm commitments, due to fluctuations, among others, in the interest rate and/or exchange rate to which the position or balance to be hedged is subject (fair value hedge).
b.Changes in the estimated cash flows arising from assets and liabilities, commitments and highly probable forecast transactions (cash flow hedge).
c.The net investment in a foreign operation (hedge of a net investment in a foreign operation).
2. It is effective in offsetting exposure inherent in the hedged item or position throughout the expected term of the hedge, which means that:
a.At the date of arrangement the hedge is expected, under normal conditions, to be highly effective (prospective effectiveness).
b.There is sufficient evidence that the hedge was actually effective during the whole life of the hedged item or position (retrospective effectiveness). To this end, the Group checks that the results of the hedge were within a range of 80% to 125% of the results of the hedged item.
3. There must be adequate documentation evidencing the specific designation of the financial derivative to hedge certain balances or transactions and how this hedge was expected to be achieved and measured, provided that this is consistent with the Group’s management of own risks.
The changes in value of financial instruments qualifying for hedge accounting are recognised as follows:
a. In fair value hedges, the gains or losses arising on both the hedging instruments and the hedged items attributable to the type of risk being hedged are recognised directly in the consolidated income statement.
b. In fair value hedges of interest rate risk on a portfolio of financial instruments, the gains or losses that arise on measuring the hedging instruments are recognised directly in the consolidated income statement, whereas the gains or losses due to changes in the fair value of the hedged amount (attributable to the hedged risk) are recognised in the consolidated income statement with a balancing entry under Changes in the fair value of hedged items in portfolio hedges of interest rate risk on the asset or liability side of the balance sheet, as appropriate.
562
c. In cash flow hedges, the effective portion of the change in value of the hedging instrument is recognised temporarily in Other comprehensive income – under Items that may be reclassified to profit or loss – Hedging derivatives – Cash flow hedges (effective portion) until the covered element affects the results, when it is recognised in the consolidated income statement, unless, if the forecast transactions result in the recognition of non-financial assets or liabilities, it is included in the cost of the non-financial asset or liability.
d. In hedges of a net investment in a foreign operation, the gains or losses attributable to the portion of the hedging instruments qualifying as an effective hedge are recognised temporarily in Other comprehensive income under Items that may be reclassified to profit or loss – Hedges of net investments in foreign operations until the gains or losses – on the hedged item are recognised in profit or loss.
e. The ineffective portion of the gains or losses on the hedging instruments of cash flow hedges and hedges of a net investment in a foreign operation is recognised directly under 'Gains/losses on financial assets and liabilities (net)' in the consolidated income statement, in Gains or losses from hedge accounting, net.
If a derivative designated as a hedge no longer meets the requirements described above due to expiration, ineffectiveness or for any other reason, the derivative is classified for accounting purposes as a trading derivative.
When fair value hedge accounting is discontinued, the adjustments previously recognised on the hedged item are amortised to profit or loss at the effective interest rate recalculated at the date of hedge discontinuation. The adjustments must be fully amortised at maturity.
When cash flow hedge accounting is discontinued, any cumulative gain or loss on the hedging instrument recognised in equity under other comprehensive income 'Items that may be reclassified to profit or loss' (from the period when the hedge was effective) remains in this equity item until the forecast transaction occurs, at which time it is recognised in profit or loss, unless the transaction is no longer expected to occur, in which case the cumulative gain or loss is recognised immediately in profit or loss.
e) Derecognition of financial assets and liabilities
The accounting treatment of transfers of financial assets depends on the extent to which the risks and rewards associated with the transferred assets are transferred to third parties:
1. If the Group transfers substantially all the risks and rewards to third parties unconditional -sale of financial assets, sale of financial assets under an agreement to repurchase them at their fair value at the date of repurchase, sale of financial assets with a purchased call option or written put option that is deeply out of the money, securitisation of assets in which the transferor does not retain a subordinated debt or grant any credit enhancement to the new holders, and other similar cases-, the transferred financial asset is derecognised and any rights or obligations retained or created in the transfer are recognised simultaneously.
2. If the Group retains substantially all the risks and rewards associated with the transferred financial asset -sale of financial assets under an agreement to repurchase them at a fixed price or at the sale price plus interest, a securities lending agreement in which the borrower undertakes to return the same or similar assets, and other similar cases-, the transferred financial asset is not derecognised and continues to be measured by the same criteria as those used before the transfer. However, the following items are recognised:
a.An associated financial liability, which is recognised for an amount equal to the consideration received and is subsequently measured at amortised cost, unless it meets the requirements for classification under 'Financial liabilities designated at fair value through profit or loss'.
b.The income from the transferred financial asset not derecognised and any expense incurred on the new financial liability, without offsetting.
3. If the Group neither transfers nor retains substantially all the risks and rewards associated with the transferred financial asset -sale of financial assets with a purchased call option or written put option that is not deeply in or out of the money, securitisation of assets in which the transferor retains a subordinated debt or other type of credit enhancement for a portion of the transferred asset, and other similar cases- the following distinction is made:
a.If the transferor does not retain control of the transferred financial asset, the asset is derecognised and any rights or obligations retained or created in the transfer are recognised.
b.If the transferor retains control of the transferred financial asset, it continues to recognise it for an amount equal to its exposure to changes in value and recognises a financial liability associated with the transferred financial asset. The net carrying amount of the transferred asset and the associated liability is the amortised cost of the rights and obligations retained, if the transferred asset is measured at amortised cost, or the fair value of the rights and obligations retained, if the transferred asset is measured at fair value.
Accordingly, financial assets are only derecognised when the rights to the cash flows they generate have expired or when substantially all the inherent risks and rewards have been transferred to third parties. Similarly, financial liabilities are only derecognised when the obligations they generate have been extinguished or when they are acquired with the intention either to cancel them or to resell them.
Regarding contractual modifications of financial assets, Grupo Santander has differentiated them into two main categories in relation to the conditions under which a modification leads to the disposal of the financial asset (and the recognition of a new financial asset) and those under which the accounting of the original financial instrument with the modified terms is maintained:
563
•Contractual modifications for commercial or market reasons, which are generally carried out at the request of the debtor to apply current market conditions to the debt. The new contract is considered a new transaction and, consequently, it is necessary to derecognize the original financial asset and recognize a new financial asset subject to the classification and measurement requirements established by IFRS 9. The new financial asset will be recorded at fair value and, if applicable, the difference between the carrying amount of the asset derecognized and the fair value of the new asset will be recognized in profit or loss.
•Modifications due to refinancing or restructuring, in which the payment conditions are modified to allow a customer that is experiencing financial difficulties (current or foreseeable) to meet its payment obligations and that, if such modification had not been made, it would be reasonably certain that it would not be able to meet such payment obligations. In this case, the modification does not result in the derecognition of the financial asset, but rather the original financial asset is maintained and does not require a new assessment of its classification and measurement. When assessing credit impairment, the current credit risk (considering the modified cash flows) should be compared with the credit risk at initial recognition. The gross carrying amount of the financial asset (the present value of the renegotiated or modified contractual cash flows that are discounted at the original effective interest rate of the financial asset) should be recalculated, with a gain or loss recognized in profit or loss for the difference.
f) Offsetting of financial instruments
Financial asset and liability balances are offset, i.e. reported in the consolidated balance sheet at their net amount, only if the Group entities currently have a legally enforceable right to set off the recognised amounts and intend either to settle on a net basis, or to realise the asset and settle the liability simultaneously.
g) Impairment of financial assets
i. Definition
Grupo Santander associates an impairment in the value to financial assets measured at amortised cost, debt instruments measured at fair value with changes in other comprehensive income, lease receivables, assets from contracts and loan commitments and the financial guarantees issued that are not measured at fair value through profit or loss.
The impairment for expected credit losses is recorded with a charge to the consolidated income statement for the period in which the impairment arises. In the event of occurrence, the recoveries of previously recognised impairment losses are recorded in the consolidated income statement for the period in which the impairment no longer exists or is reduced.
In the case of purchased or originated credit-impaired assets, the Group only recognizes at the reporting date the changes in the expected credit losses during the life of the asset since the initial recognition as a credit loss. In the case of assets measured at fair value with changes in other comprehensive income, the changes in the fair value due to expected credit losses are charged in the consolidated income statement of the year where the change happened, reflecting the rest of the valuation in other comprehensive income.
As a rule, the expected credit loss is estimated as the difference between the contractual cash flows to be recovered and the expected cash flows discounted using the original effective interest rate. In the case of purchased or originated credit-impaired assets, this difference is discounted using the effective interest rate adjusted by credit rating.
Depending on the classification of financial instruments, which is mentioned in the following sections, the expected credit losses may be along 12 months or during the life of the financial instrument:
•12-month expected credit losses: arising from the potential default events, as defined in the following sections that are estimated to be likely to occur within the 12 months following the reporting date. These losses will be associated with financial assets classified as 'normal risk' as defined in the following sections.
•Expected credit losses over the life of the financial instrument: arising from the potential default events that are estimated to be likely to occur throughout the life of the financial instruments. These losses are associated with financial assets classified as 'normal risk under watchlist' or 'doubtful risk'.
With the purpose of estimating the expected life of the financial instrument all the contractual terms have been taken into account (e.g. prepayments, duration, purchase options, etc.), being the contractual period (including extension options) the maximum period considered to measure the expected credit losses. In the case of financial instruments with an uncertain maturity period and a component of undrawn commitment (e.g.: credit cards), the expected life is estimated through quantitative analyses to determine the period during which the entity is exposed to credit risk, also considering the effectiveness of management procedures that mitigate such exposure (e.g. the ability to unilaterally cancel such financial instruments, etc.).
564
The following constitute effective guarantees:
a) Mortgage guarantees on housing as long as they are first duly constituted and registered in favour of the entity. The properties include:
i.Buildings and building elements, distinguishing among:
–Houses.
–Offices, stores and multi-purpose premises.
–Rest of buildings such as non-multi-purpose premises and hotels.
ii.Urban and developable ordered land.
iii. Rest of properties that classify as: buildings and building elements under construction, such as property development in progress and halted development, and the rest of land types, such as rustic lands.
b) Collateral guarantees on financial instruments in the form of cash deposits, debt securities or equity instruments issued by creditworthy issuers.
c) Other types of real guarantees, including properties received in guarantee and second and subsequent mortgages on properties, as long as the entity demonstrates its effectiveness. When assessing the effectiveness of the second and subsequent mortgages on properties the entity will implement particularly restrictive criteria. It will take into account, among others, whether the previous charges are in favour of the entity itself or not and the relationship between the risk guaranteed by them and the property value.
d) Personal guarantees, as well as the incorporation of new owners, covering the entire amount of the financial instruments and implying direct and joint liability to the entity of persons or other entities whose solvency is sufficiently proven to ensure the repayment of the loan on the agreed terms.
The different aspects that the Group considers for the evaluation of effective guarantees are set out below in relation to the individual analysis.
ii. Financial instruments presentation
For the purposes of estimating the impairment amount, and in accordance with its internal policies, the Group classifies its financial instruments (financial assets, commitments and guarantees) measured at amortised cost or fair value through other comprehensive income in one of the following categories:
•Normal Risk ('stage 1'): includes all instruments that do not meet the requirements to be classified in the rest of the categories.
•Normal risk under watchlist ('stage 2'): includes all instruments that, without meeting the criteria for classification as doubtful or default risk, have experienced significant increases in credit risk since initial recognition.
In order to determine whether a financial instrument has increased its credit risk since initial recognition and is to be classified in stage 2, the Group considers the following criteria:
| Quantitative criteria | Changes in the risk of a default occurring through the expected life of the financial instrument are analysed and quantified with respect to its credit level in its initial recognition. With the purpose of determining if such changes are considered as significant, with the consequent classification into stage 2, each Group unit has defined the quantitative thresholds to consider in each of its portfolios taking into account corporate guidelines ensuring a consistent interpretation in all units. Within the quantitative thresholds, two types are considered: A relative threshold is those that compare current credit quality with credit quality at the time of origination in percentage terms of change. In addition, an absolute threshold compares both references in total terms, calculating the difference between the two. These absolute/relative concepts are used homogeneously (with different values) in all geographies. The use of one type of threshold or another (or both) is determined in accordance with the process described in note 54, below, and is marked by the type of portfolio and characteristics such as the starting point of the average credit quality of the portfolio. | ||||
| Qualitative criteria | In addition to the quantitative criteria indicated, various indicators are used that are aligned with those used by the Group in the normal management of credit risk. Irregular positions of more than 30 days and renewals are common criteria in all Group units. In addition, each unit can define other qualitative indicators, for each of its portfolios, according to the particularities and normal management practices in line with the policies currently in force (i.e. use of management alerts, etc.). The use of these qualitative criteria is complemented with the use of an expert judgement, under the corresponding governance. | ||||
In the case of forbearances, instruments classified as 'normal risk under watchlist' may be generally reclassified to 'normal risk' in the following circumstances: at least two years have elapsed from the date of reclassification to that category or from its forbearance date, the client has paid the accrued principal and interest balance, and the client has no other instruments with more than 30 days past due balances.
•Doubtful Risk ('stage 3'): includes financial instruments, overdue or not, in which, without meeting the circumstances to classify them in the category of default risk, there are reasonable doubts about their total repayment (principal and interests) by the client in the terms contractually agreed. Likewise, off-balance-sheet exposures whose payment is probable and their recovery doubtful are considered in stage 3. Within this category, two situations are differentiated:
–Doubtful risk for non-performing loans: financial instruments, irrespective of the client and guarantee, with balances more than 90 consecutive days on material arrears for principal, interest or expenses contractually agreed.
This category also includes all loan balances for a client when the operations with more than 90 consecutive days on material arrears are greater than 20% of the amounts pending collection.
565
These instruments may be reclassified to other categories if, as a result of the collection of part of the past due balances, the reasons for their classification in this category do not remain and the client does not have balances more than 90 consecutive days on material arrears in other loans.
–Doubtful risk for reasons other than non-performing loans: this category includes doubtful recovery financial instruments that are not more than 90 consecutive days on material arrears.
Grupo Santander considers that a financial instrument to be doubtful for reasons other than delinquency when one or more combined events have occurred with a negative impact on the estimated future cash flows of the financial instrument. To this end, the following indicators, among others, are considered:
a)Negative net equity or decrease because of losses of the client's net equity by at least 50% during the last financial year.
b)Continued losses or significant decrease in revenue or, in general, in the client's recurring cash flows.
c)Generalised delay in payments or insufficient cash flows to service debts.
d)Significantly inadequate economic or financial structure or inability to obtain additional financing by the client.
e)Existence of an internal or external credit rating showing that the client is in default.
f)Existence of overdue customer commitments with a significant amount to public institutions or employees.
These financial instruments may be reclassified to other categories if, as a result of an individualised study, reasonable doubts do not remain about the total repayment under the contractually agreed terms and the client does not have balances of 90 days on material arrears.
In the case of forbearances, instruments classified as doubtful risk may be reclassified to the category of 'normal risk under watchlist' when the following circumstances are present: a minimum period of one year has elapsed from the forbearance date, the client has paid the accrued principal and interest amounts, and the client has no other loan balances of 90 days on material arrears.
•Default Risk: includes all financial assets, or part of them, for which, after an individualised analysis, their recovery is considered remote due to a notorious and irrecoverable deterioration of their solvency.
In any event, except in the case of financial instruments with effective collateral covering a substantial portion of the transaction amount, the Group generally consider as remote the following:
- Those operations that, after an individualized analysis, are categorized as unsustainable debt, assuming an irrecoverability of such debt.
- Transactions classified as doubtful due to non-performing loans with recovery costs that exceed the amounts receivable.
- The operations on which the award is executed. The queue of these operations shall be included under default risk, as the recovery of the flows, provided that no further guarantees associated with the operation remain after the award of the property.
- Those operations on which a deduction is made, the portion of the operation corresponding to that deduction, will be given as a balance at the time of signature.
A financial asset amount is maintained in the balance sheet until they are considered as a "default risk", either all or a part of it, and the write-off is registered against the balance sheet.
In the case of operations that have only been partially derecognised, for forgiveness reasons or because part of the total balance is considered unrecoverable, the remaining amount shall be fully classified in the category of 'doubtful risk', except where duly justified.
The classification of a financial asset, or part of it, as a 'default risk' does not involve the disruption of negotiations and legal proceedings to recover the amount.
iii. Impairment valuation assessment
Grupo Santander has policies, methods and procedures in place to hedge its credit risk, both due to the insolvency attributable to counterparties and its residence in a specific country.
These policies, methods and procedures are applied in the concession, study and documentation of financial assets, commitments and guarantees, as well as in the identification of their impairment and in the calculation of the amounts needed to cover their credit risk.
The impairment represents the best estimation of the financial assets expected credit losses at the balance sheet date, assessed both individually and collectively.
•Individually: for the purposes of estimating the provisions for credit risk arising from the insolvency of a financial instrument, the Group individually assesses impairment by estimating the expected credit losses on those financial instruments that are considered to be significant and with sufficient information to make such an estimate.
Therefore, this classification mostly includes wholesale banking customers —Corporations, specialised financing— as well as some of the largest companies —Chartered and real estate developers— from retail banking. The determination of the perimeter in which the individualised estimate is applied is detailed in a later section.
The individually assessed impairment estimate is equal to the difference between the gross carrying amount of the financial instrument and the estimated value of the expected cash flows receivable discounted using the original effective interest rate of the transaction. The estimate of these cash flows takes into account all available information on the financial asset and the effective guarantees associated with that asset. This estimation process is detailed below.
566
•Collectively: the Group also assesses impairment by estimating the expected credit losses collectively in cases where they are not assessed on an individual basis. This includes, for example, loans with individuals, sole proprietors or businesses in retail banking subject to a standardised risk management.
For the purposes of the collective assessment of expected credit losses, the Group has consistent and reliable internal models. For the development of these models, instruments with similar credit risk characteristics that are indicative of the debtors' capacity to pay are considered.
The credit risk characteristics used to group the instruments are, among others: type of instrument, debtor's sector of activity, geographical area of activity, type of guarantee, aging of past due balances and any other factor relevant to estimating the future cash flows.
Grupo Santander performs retrospective and monitoring tests to evaluate the reasonableness of the collective estimate.
On the other hand, the methodology required to estimate the expected credit loss due to credit events is based on an unbiased and weighted consideration by the probability of occurrence of a series of scenarios, considering a range of three to five possible future scenarios, depending on the characteristics of each unit, which could have an impact on the collection of contractual cash flows, always taking into account the time value of money, as well as all available, reasonable and sustainable information on past events, current conditions and forecasts of the evolution of macroeconomic scenarios that are shown to be relevant for the estimation of this amount (for example: GDP (Gross Domestic Product), housing price, unemployment rate, etc.).
The estimation of expected losses requires expert judgment and the support of historical, current and future information. The probability of loss is measured considering past events, the present situation and future trends of macroeconomic scenarios.
Grupo Santander uses forward-looking information in both internal risk management and prudential regulation processes, so that for the calculation of the impairment loss allowance, various scenarios are incorporated that take advantage of the experience with such information, thus ensuring consistency in obtaining the expected loss.
The complexity of the estimation in this exercise has been derived from the current macroeconomic scenario as a consequence of the war in Ukraine, as well as the increasing level of inflation and interest rates, and the difficulties in the supply chains, which has generated some uncertainty in the evolution of the economy.
Grupo Santander has internally ensured the criteria to be followed for guarantees received from government bodies, both through credit lines and other public guarantees, so that when they are adequately reflected in each of the contracts, they are recognised as mitigating factors of the potential expected losses, and therefore of the provisions to be recognised, based on the provisions of the applicable standard (IFRS 9 Par. B5.5.55). Furthermore, where applicable, these guarantees are appropriately reflected in the mitigation of the significant increase in risk, considering their nature as personal guarantees.
For the estimation of the parameters used in the estimation of impairment provisions -EAD (exposure at default), PD (probability of default), LGD (loss given default)-, the Group based its experience in developing internal models for the estimation of parameters both in the regulatory area and for management purposes, adapting the development of the impairment provision models under IFRS 9.
•Exposure at default: is the amount of estimated risk incurred at the time of the counterparty's analysis.
•Probability of default: is the estimated probability that the counterparty will default on its principal and/or interest payment obligations.
•Loss given default: is the estimate of the severity of the loss incurred in the event of non-compliance. It depends mainly on the updating of the guarantees associated with the operation and the future cash flows that are expected to be recovered.
In any case, when estimating the flows expected to be recovered, portfolio sales are included. It should be noted that due to the Group's recovery policy and the experience observed in relation to the prices of past sales of assets classified as stage 3 and/or default risk, there is no substantial divergence between the flows obtained from recoveries after performing recovery management of the assets with those obtained from the sale of portfolios of assets discounting structural expenses and other costs incurred.
The definition of default implemented by the Group for the purpose of calculating the impairment provision models is based on the definition in Article 178 of Regulation 575/2013 of the European Union (CRR), which is fully aligned with the requirements of IFRS 9, which considers that a 'default' exists in relation to a specific customer/contract when at least one of the following circumstances exists: the entity considers that there are reasonable doubts about the payment of all its credit obligations or that the customer/contract is in an irregular situation for more than 90 consecutive days past due material balances with respect to any significant credit obligation.
Grupo Santander aligned partially and voluntarily during 2022 the accounting definition of Stage 3, as well as the calculation of impairment provision models, to the New Definition of Default, incorporating the criteria defined by the EBA in its implementation guide of the definition of default, capturing the economic deterioration of the operations (days in default - on a daily basis - and materiality thresholds - minimum amount in arrears). The alignment of criteria was done taking into account the criteria of IFRS 9 as well as the accounting principles of unbiased presentation of financial information. Grupo Santander registered an increase in the default rate at around 19 basis points, with no material impact on the provision figures for credit risk.
In addition, the Group considers the risk generated in all cross-border transactions due to circumstances other than the usual commercial risk of insolvency (sovereign risk, transfer risk or risks arising from international financial activity, such as wars, natural catastrophes, balance of payments crisis, etc.).
567
IFRS 9 includes a series of practical solutions that can be implemented by entities, with the aim of facilitating its implementation. In order to achieve a complete and high-level implementation of the standard, and following the best practices of the industry, the Group applies these practical solutions adapting them to their own characteristics and circumstances:
–Rebuttable presumption that the credit risk has increased significantly, when payments are more than 30 days past due: this threshold is used as an additional, but not primary, indicator of significant risk increase.
–Assets with low credit risk at the reporting date: the Group adopts this practice prioritizing its reduced and punctual use and its systematic and periodic justification through quantitative evidence.
This information is provided in more detail in note 54.b.
iv. Detail of individual estimate of impairment
For the individual estimate of the assessment for impairment of the financial asset, the Group has a specific methodology to estimate the value of the cash flows expected to be collected:
•Recovery through the debtor's ordinary activities (going approach).
•Recovery through the execution and sale of the collateral guaranteeing the operations (gone approach).
Gone approach:
a. Evaluation of the effectiveness of guarantees
Grupo Santander assesses the effectiveness of all the guarantees associated considering the following:
•The time required to execute these guarantees.
•Grupo Santander's ability to enforce or assert these guarantees in its favour.
•The existence of limitations imposed by each local unit´s regulation on the foreclosure of collateral.
Under no circumstances the Group considers that a guarantee is effective if its effectiveness depends substantially on the solvency of the debtor, as could be the case:
•Promises of shares or other securities of the debtor himself when their valuation may be significantly affected by a debtor's default.
•Personal cross-collateralisation: when the guarantor of a transaction is, at the same time, guaranteed by the holder of that transaction.
The different types of effective guarantees have been detailed in section i. Definition
b. Valuation of guarantees
Grupo Santander assesses the guarantees on the basis of their nature in accordance with the following:
•Mortgage guarantees on properties associated with financial instruments, using complete individual valuations carried out by independent valuation experts and under generally accepted valuation standards. If this is not possible, alternative valuations are used with duly documented and approved internal valuation models.
•Personal guarantees are valued individually on the basis of the guarantor´s updated information.
•The rest of the guarantees are valued based on current market values.
c. Adjustments to the value of guarantees and estimation of future cash flow inflows and outflows
Grupo Santander applies a series of adjustments to the value of the guarantees in order to improve the reference values:
•Adjustments based on the historical sales experience of local units for certain types of assets.
•Individual expert adjustments based on additional management information.
Likewise, to adjust the value of the guarantees, the time value of money is taken into account based on the historical experience of each of the units, estimating:
•Period of adjudication.
•Estimated time of sale of the asset.
In addition, the Group takes into account all those cash inflows and outflows linked to that guarantee until it is sold:
•Possible future income commitments in favour of the borrower which will available after the asset is awarded.
•Estimated foreclosure costs.
•Asset maintenance costs, taxes and community costs.
•Estimated marketing or sales costs.
Finally, since it is considered that the guarantee will be sold in the future, the Group applies an additional adjustment ('index forward') in order to adjust the value of the guarantees to future valuation expectations.
568
v. Impairment individual assessment scope
Grupo Santander determines the perimeter over which it makes an estimate of the assessment for impairment on an individual basis based on a relevance threshold set by each of the geographical areas and the stage in which the operations are located. In general, the Group applies the individualised calculation of expected losses to the significant exposures classified in stage 3, although Banco Santander, S.A. has also extended its analyses to some of the exposures classified in stage 2.
It should be noted that, in any case and irrespective of the stage in which their transactions are carried out, for customers who do not receive standardised treatment, a relational risk management model is applied, with individualised treatment and monitoring by the assigned risk analyst. In addition to wholesale customers (Santander Corporate & Investment Banking or SCIB) and large companies, this relational management model also includes other segments of smaller companies for which there is information and capacity for more personalised and expert analysis and monitoring. As indicated in the Group's wholesale credit model, the individual treatment of the client facilitates the continuous updating of information. The risk assumed must be followed and monitored throughout its life cycle, enabling anticipation and action to be taken in the event of possible impairments. In this way, the customer's credit quality is analysed individually, taking into account specific aspects such as his competitive position, financial performance, management, etc. In the wholesale risk management model, every customer with a credit risk position is assigned a rating, which has an associated probability of customer default. Thus, individual analysis of the debtor triggers a specific rating for each customer, which determines the appropriate parameters for calculating the expected loss, so that it is the rating itself that initially modulates the necessary coverage, adjusting the severity of the possible loss to the guarantees and other mitigating factors that the customer may have available. In addition, if as a result of this individualised monitoring of the customer, the analyst finally considers that his coverage is not sufficient, he has the necessary mechanisms to adjust it under his expert judgement, always under the appropriate governance.
h) 'Non-current assets' and 'liabilities associated with non-current assets held for sale'
Non-current assets held for sale' includes the carrying amount of individual items, disposal groups or items forming part of a business unit earmarked for disposal (discontinued operations), whose sale in their present condition is highly likely to be completed within one year from the reporting date. Therefore, the recovery of the carrying amount of these items -which can be of a financial nature or otherwise- will foreseeably be effected through the proceeds from their disposal.
Specifically, property or other non-current assets received by the consolidated entities as total or partial settlement of their debtors’ payment obligations to them are deemed to be 'Non-current assets held for sale', unless the consolidated entities have decided to make continuing use of these assets.
'Liabilities associated with non-current assets held for sale' includes the balances payable arising from the assets held for sale or disposal groups and from discontinued operations.
'Non-current assets and disposal groups of items that have been classified as held for sale' are generally recognised at the date of their allocation to this category and are subsequently valued at the lower of their fair value less costs to sell or its book value. 'Non-current assets and disposal groups of items that are classified as held for sale' are not amortised as long as they remain in this category.
The valuation of the portfolio of non-current assets held for sale has been made in compliance with the requirements of International Financial Reporting Standards in relation to the estimate of the fair value of tangible assets and the value-in-use of financial assets.
The value of the portfolio is determined as the sum of the values of the individual elements that compose the portfolio, without considering any total or batch grouping in order to correct the individual values.
For the purposes of its consideration in initial recognition, the Group obtains, at the time of award, the fair value of the corresponding asset by requesting an appraisal from external valuation agencies.
Grupo Santander has in place a corporate policy that ensures the professional competence and the independence and objectivity of the external appraisal agencies, in accordance with the regulations, which require appraisal agencies to meet independence, neutrality and credibility requirements, so that the use of their estimates does not reduce the reliability of its valuations. This policy establishes that all the appraisal companies and agencies with which the Group works in Spain should be registered in the Official Register of the Bank of Spain and that the appraisals performed by them should follow the methodology established in Order ECO/805/2003, of 27 March. The main appraisal companies and agencies with which the Group worked in Spain in 2023 are as follows: Tinsa Tasaciones Inmobiliarias, S.A.U., Krata Sociedad de Tasación, S.A., Sociedad de Tasación, S.A., Global Valuation, S.A.U., Gesvalt Sociedad de Tasación, S.A. y Valoraciones Mediterraneo, S.A.
Also, this policy establishes that the various subsidiaries abroad work with appraisal companies that have recent experience in the area and the type of asset under appraisal and meet the independence requirements established in the corporate policy. They should verify, inter alia, that the appraisal company is not a party related to the Group and that its billings to the Group in the last twelve months do not exceed 15 % of the appraisal company’s total billings.
At 31 December 2023 the fair value less costs to sell of non-current assets held for sale exceeded their carrying amount by EUR 624 million (EUR 631 million at 31 December 2022); however, in accordance with the accounting standards, this unrealised gain could not be recognised.
569
Banco Santander, in compliance with Bank of Spain Circular 4/2017, and subsequent amendments, on public and private financial reporting standards and financial statement models, has developed a methodology that enables it to estimate the fair value and costs of sale of assets foreclosed or received in payment of debts. This methodology is based on the classification of the portfolio of foreclosed assets into different segments. Segmentation enables the intrinsic characteristics of Banco Santander's portfolio of foreclosed assets to be differentiated, so that assets with homogeneous characteristics are grouped by segment.
Thus, the portfolio is segmented into (i) finished assets of a residential and tertiary nature, (ii) developments in progress and (iii) land.1
In determining the critical segments in the overall portfolio, assets are classified on the basis of the nature of the asset and its stage of development. This segmentation is made in order to seek the liquidation of the asset (which should be carried out in the shortest possible time).
When making decisions, the situation and/or characteristics of the asset are fundamentally taken into account, as well as the evaluation of all the determining factors that favour the recovery of the debt. For them, the following aspects are analyzed, among others:
•The time that has elapsed since the adjudication.
•The transferability and contingencies of the foreclosed asset.
•The economic viability from the real estate point of view with the necessary investment estimate.
•The expenses that may arise from the marketing process.
•The offers received, as well as the difficulties in finding buyers.
In the case of real estate assets foreclosed in Spain, which represent 85 % of the Group’s total non-current assets held for sale, the valuation of the portfolio is carried out by applying the following models:
•Market Value Model used in the valuation of finished properties of a residential nature (mainly homes and car parks) and properties of a tertiary nature (offices, commercial premises and multipurpose buildings). For the valuation of finished assets whose availability for sale is immediate, a market sale value provided by a third party external to Banco Santander is considered, calculated under the AVM methodology by the comparable properties method adjusted by our experience in selling similar assets, given the term, price, volume, trend in the value of these assets and the time elapsing until their sale and discounting the estimated costs of sale.
The market value is determined on the basis of the definition established by the International Valuation Standards drawn up by the IVSC (International Valuation Standards Council), understood as the estimated amount for which an asset or a liability should be exchanged on the measurement date between a willing buyer and a willing seller, in an arm's length transaction, after appropriate marketing, and in which the parties have acted with sufficient information, prudently and without coercion.
The current market value of the properties is estimated on the basis of automated valuations obtained by taking comparable properties as a reference; simulating the procedure carried out by an appraiser in a physical valuation according to Order ECO 805/2003: selection of properties and obtaining the unit value by applying homogenisation adjustments. The selection of the properties is carried out by location within the same real estate cluster and according to the characteristics of the properties, filtering by type2, surface area range and age. The model enables a distinction to be made within the municipality under study as to which areas are similar and comparable and therefore have a similar value in the property market, discriminating between which properties are good comparators and which are not.
Adjustments to homogenize the properties are made according to: (i) the age of the property according to the age of the property to be valued, (ii) the deviation of the built area from the common area with respect to the property to be valued and (iii) by age of the date of capture of the property according to the price evolution index of the real estate market.
In addition, for individually significant assets, complete individual valuations are carried out, including a visit to the asset, market analysis (data relating to supply, demand, current sale or rental price ranges and supply-demand and revaluation expectations) and an estimate of expected income and costs.
1. The assets in a situation of 'stopped development' are included under 'land
2. Assets qualified as protected housing are taken into account. The maximum legal value of these assets is determined by the VPO module, obtained from the result of multiplying the State Basic Module (MBE) by a zone coefficient determined by each autonomous community. To carry out the valuation of a protected property, the useful surface area is used in accordance with current regulations.
570
For this segmentation of assets, when they are completed, the real costs are known and the actual expenses for the marketing and sale of the asset must be taken into account. Therefore, Banco Santander uses the actual costs in its calculation engine or, failing that, those estimated on the basis of its observed experience.
•Market Value Model according to Evolution of Market Values used to update the valuation of developments in progress. The valuation model estimates the current market value of the properties based on complete individual valuations by third parties, calculated from the values of the feasibility studies and development costs of the promotion, as well as the selling costs, distinguishing by location, size and type of property. The inputs used in the valuation model for residential assets under construction are actual revenues and costs.
For this purpose, in order to calculate the investment flows, Banco Santander considers, on the basis of the feasibility studies, the expenditure required for construction, the professional fees relating to the project and to project management, the premiums for mandatory building insurance, the developer's administrative expenses, licenses, taxes on new construction and fees, and urban development charges.
With respect to the calculation of income flows, Banco Santander takes into account the square metres built, the number of homes under construction and the estimated selling price over 1.5 years.
The market value will be the result of the difference between the income flows and the investment flows estimated at each moment.
•Land Valuation model. The methodology followed by the Group regarding land valuation consists of updating the individual reference valuation of each of the land on an annual basis, through updated valuation valuations carried out by independent professionals and following the methodology established in the Order ECO/805/2003, of 27 March, whose main verifications in the case of land valuation, regardless of the degree of urbanisation of the land, correspond to:
–Visual verification of the assessed property.
–Registry description.
–Urban planning.
–Visible easements.
–Visible state of occupation, possession, use and exploitation.
–Protection regime.
–Apparent state of preservation.
–Correspondence with cadastral property.
–Existence of expropriation procedure, expropriation plan or project, administrative resolution or file that may lead to expropriation.
–Expiry of the urbanization or building deadlines.
–Existence of a procedure for failure to comply with obligations.
–Verification of surfaces.
For the purposes of valuation, the land will be classified in the following levels:
–Level I: It will include all the lands that do not belong to level II.
–Level II: It shall include land classified as undeveloped where building is not allowed for uses other than agriculture, forestry, livestock or linked to an economic exploitation permitted by the regulations in force. Also included are lands classified as developable that are not included in a development area of urban planning or that, in such an area, the conditions for its development have not been defined.
In those cases where the Group does not have an updated reference value through an ECO valuation for the current year, we use as a reference value the latest available ECO valuation reduced or corrected by the average annual coverage ratio of the land on which we have obtained an updated reference value, through an ECO valuation.
Grupo Santander applies a discount to the aforementioned reference values that takes into account both the discount on the reference value in the sales process and the estimated costs of marketing or selling the land; discount on reference value = % discount on sales + % marketing costs being:
–% discount on Sales: = 100 - (sales price / updated appraisal value).
–marketing costs: calculated on the basis of our historical experience in sales and in accordance with the marketing management fees negotiated with our suppliers of this type of service.
In this way the Group obtains the corrected market value, an amount that we compare with the net cost of each piece of land to determine its correct valuation and conclude with our valuation process.
In addition, in relation to the previously mentioned valuations, less costs to sell, are contrasted with the sales experience of each type of asset in order to confirm that there is no significant difference between the sale price and the valuation.
Impairment losses on an asset or disposal group arising from a reduction in its carrying amount to its fair value (less costs to sell) are recognised under 'Gains or (losses) on non-current assets held for sale not classified as discontinued operations' in the consolidated income statement.
The gains on a non-current asset held for sale resulting from subsequent increases in fair value (less costs to sell) increase its carrying amount and are recognised in the consolidated income statement up to an amount equal to the impairment losses previously recognised.
571
i) Assets under reinsurance contracts and Liabilities under insurance contracts
The Group has prepared the accounting policy that establishes the criteria for recording insurance contracts, in accordance with IFRS 17. This standard defines insurance contracts as contracts under which one party accepts a significant insurance risk from another party by agreeing to compensate the policyholder if a specific uncertain future event negatively affects the policyholder.
IFRS 17 requires a level of aggregation of contracts that the Group identifies in portfolios of contracts with similar risks and that are managed jointly. The Group then divides each portfolio into a minimum of three groups: (i) contracts that are onerous on initial recognition; (ii) contracts that, upon initial recognition, have no significant possibility of subsequently becoming onerous; and (iii) any remaining contract.
For contracts that are considered not to be onerous, a profit margin is recognized in the profit and loss account (referred to as 'Contractual Service Margin' or 'CSM') throughout the period in which the entity performs the service. However, if at the time of initial recognition, or during the period in which the entity performs the service, the contract is onerous, the entity recognizes the loss in the income statement.
Contract limits define the term up to which compliance cash flows must be considered in order to measure an insurance contract. Fulfillment cash flows comprise an unbiased, probability-weighted estimate of future cash flows, a discount adjustment to the present value to reflect the time value of money for monetary and financial risks, and a risk adjustment for non-fulfillment risks. financial. The identification of the contractual limit under IFRS 17 is essential not only for measuring the fulfillment cash flows of a group of contracts, but also for determining the applicable measurement model, in case the contractual limits are identified in a year or more.
Cash flows are within the contractual limit of an insurance contract if they arise from substantial rights and obligations that exist during the reporting period, in which the entity can obligate the insurance policyholder to pay premiums or in which the entity has a substantive obligation to provide services to the insured.
The Group has carried out an analysis of the limits of insurance and reinsurance contracts under IFRS 17, separately, generally applying the General Model (Building Block Approach) to all contracts, except those eligible to be valued by the Simplified Model (Premium Allocation Approach), or the Variable Commission Approach ('VCA' or Variable Fee Approach).
The general model measures a group of contracts as the sum of the fulfillment cash flows and the Contractual Service Margin. The CSM represents benefits not yet recorded that the entity will recognize as providing services under the insurance contract.
Insurance contracts with direct participation apply the VCA as a modified version of the General Model. This should reduce the volatility of results due to the asymmetry between the accounting treatment of the profit and losses of the underlying items attributable to the policyholders and the accounting treatment of the liability owed to those policyholders.
Another aspect considered in measuring the present value of the future cash flows of a group of insurance contracts is the discount rate applied to reflect the time value of money and the financial risks related to those cash flows. The Group has established a generally chosen methodology and guarantees that the calculation components have a homogeneous basis, previously approved by the Group, establishing the base curves provided by the Group and allowing adjustments to these curves based on the expert criteria of each local address.
Likewise, measuring compliance cash flows requires a risk adjustment for non-financial risk. Risk adjustment for non-financial risk is the compensation necessary to withstand uncertainty about the amount and timing of cash flows arising from non-financial risks. If a change in the assumptions occurs, it could affect the income statement or the Other comprehensive income, depending on its nature. The risks covered by the risk adjustment for non-financial risk are insurance risk and other non-financial risks, such as interruption risk and expense risk.
j) Tangible assets
Tangible assets includes the amount of buildings, land, furniture, vehicles, computer hardware and other fixtures owned by the consolidated entities or acquired under finance leases. Tangible assets are classified by use as follows:
i. Property, plant and equipment for own use
Property, plant and equipment for own use – including tangible assets received by the consolidated entities in full or partial satisfaction of financial assets representing receivables from third parties which are intended to be held for continuing use and tangible assets acquired under finance leases– are presented at acquisition cost, less the related accumulated depreciation and any estimated impairment losses (carrying amount higher than recoverable amount).
Depreciation is calculated, using the straight-line method, on the basis of the acquisition cost of the assets less their residual value. The land on which the buildings and other structures stand has an indefinite life and, therefore, is not depreciated.
572
The annual tangible asset depreciation charge is recognised in the consolidated income statement and are essentially equivalent to the following amortization percentages (determined based on the years of estimated useful life, on average, of the different elements):
| Average annual rate | |||||
| Buildings for own use | % | ||||
| Furniture | % | ||||
| Fixtures | % | ||||
| Office and IT equipment | % | ||||
| Lease use rights | Less than the lease term or the useful life of the underlying asset | ||||
At the end of each reporting period, consolidated entities assess whether there is any indication that the carrying amount of an asset exceeds its recoverable amount, in which case they write down the carrying amount of the asset to its recoverable amount and adjust future depreciation charges in proportion to its adjusted carrying amount and to its new remaining useful life, if the useful life needs to be re-estimated.
Similarly, if there is an indication of a recovery in the value of a tangible asset, the consolidated entities recognise the reversal of the impairment loss recognised in prior periods and adjust the future depreciation charges accordingly. In no circumstances may the reversal of an impairment loss on an asset raise its carrying amount above that which it would have if no impairment losses had been recognised in prior years.
The estimated useful lives of the items of property, plant and equipment for own use are reviewed at least at the end of the reporting period with a view to detecting significant changes therein. If changes are detected, the useful lives of the assets are adjusted by correcting the depreciation charge to be recognised in the consolidated income statement in future years on the basis of the new useful lives.
Upkeep and maintenance expenses relating to property, plant and equipment for own use are recognised as an expense in the period in which they are incurred, since they do not increase the useful lives of the assets.
ii. Investment property
'Investment property' reflects the net values of the land, buildings and other structures held either to earn rentals or for obtaining profits by sales due to future increase in market prices.
The criteria used to recognise the acquisition cost of investment property, to calculate its depreciation and its estimated useful life and to recognise any impairment losses thereon are consistent with those described in relation to property, plant and equipment for own use.
In order to evaluate the possible impairment Grupo Santander determines periodically the fair value of its investment property so that, at the end of the reporting period, the fair value reflects the market conditions of the investment property at that date. This fair value is determined annually, taking as benchmarks the valuations performed by independent experts. The methodology used to determine the fair value of investment property is selected based on the status of the asset in question; thus, for properties earmarked for lease, the valuations are performed using the sales comparison approach, whereas for leased properties the valuations are made primarily using the income capitalisation approach and, exceptionally, the sales comparison approach.
In the sales comparison approach, the property market segment for comparable properties is analysed, inter alia, and, based on specific information on actual transactions and firm offers, current prices are obtained for cash sales of those properties. The valuations performed using this approach are considered as level 2 valuations.
In the income capitalisation approach, the cash flows estimated to be obtained over the useful life of the property are discounted taking into account factors that may influence the amount and actual obtainment thereof, such as: (i) the payments that are normally received on comparable properties; (ii) current and probable future occupancy; (iii) the current or foreseeable default rate on payments. The valuations performed using this approach are considered as Level 3 valuations, since significant unobservable inputs are used, such as current and probable future occupancy and/or the current or foreseeable default rate on payments.
iii. Assets leased out under an operating lease
'Property, plant and equipment' - Leased out under an operating lease reflects the amount of the tangible assets, other than land and buildings, leased out by the Group under an operating lease.
The criteria used to recognise the acquisition cost of assets leased out under operating leases, to calculate their depreciation and their respective estimated useful lives and to recognise the impairment losses thereon are consistent with those described in relation to property, plant and equipment for own use.
k) Accounting for leases
The main aspects contained in the regulation (IFRS 16) adopted by the Group are included below:
When the Group acts as lessee, it recognises a right-of-use asset representing its right to use the underlying leased asset with a corresponding lease liability on the date on which the leased asset is available for use by the Group.
Each lease payment is allocated between liability and finance charge. The finance charge is allocated to the income statement during the term of the lease in such a way as to produce a constant periodic interest rate on the remaining balance of the liability for each year.
573
The right-of-use asset is depreciated over the useful life of the asset or the lease term, whichever is shorter, on a straight-line basis. If the Group is reasonably certain to exercise a purchase option, the right-of-use asset is amortized over the useful life of the underlying asset.
Assets and liabilities arising from a lease are initially measured at present value. Lease liabilities include the net present value of the following lease payments:
–Fixed payments (including inflation-linked payments), less any lease incentive receivable.
–Variable lease payments that depend on an index or rate.
–The amounts expected to be paid by the lessee under residual value guarantees.
–The exercise price of a purchase option if the lessee is reasonably certain that it will exercise that option.
–Lease termination penalty payments, if the term of the lease reflects the lessee's exercise of that option.
Lease payments are discounted using the interest rate implicit in the lease. When this interest rate cannot be obtained, the interest rate used in these cases, is the lessee's incremental borrowing rate at the related date. For this purpose, the entity has calculated this incremental borrowing rate taking as reference the listed debt instruments issued by the Group; in this regard, the Group has estimated different interest rate curves depending on the currency and economic environment in which the contracts are located.
In order to construct the incremental borrowing rate, a methodology has been developed at the corporate level. This methodology is based on the need for each entity to consider its economic and financial situation, for which the following factors must be considered:
–Economic and political situation (country risk).
–Credit risk of the company.
–Monetary policy.
–Volume and seniority of the company’s debt instrument issues.
The incremental borrowing rate is defined as the interest rate that a lessee would have to pay for borrowing, given a similar period to the duration of the lease and with similar security, the funds necessary to obtain an asset of similar value to the right-of-use asset in a similar economic environment. The Group entities have a wide stock and variety of financing instruments issued in different currencies to that of the euro (pound, dollar, etc.) that provide sufficient information to be able to determine an "all in rate" (reference rate plus adjustment for credit spread at different terms and in different currencies). In circumstances, where the leasing company has its own financing, this has been used as the starting point for determining the incremental borrowing rate. On the other hand, for those Grupo Santander entities that do not have their own financing, the information from the financing of the consolidated subgroup to which they belong was used as the starting point for estimating the entity's curve, analysing other factors to assess whether it is necessary to make any type of negative or positive adjustment to the initially estimated credit spread.
Right-of-use assets are valued at cost which includes the following:
–The amount of the initial measurement of the lease liability.
–Any lease payment made at or before the commencement date less any lease incentive received.
–Any initial direct costs.
–Restoration costs.
The Group recognises the payments associated with short-term leases and leases of low-value assets on a straight-line basis as an expense in the income statement. Short-term leases are leases with a lease term less than or equal to 12 months (a lease that contains a purchase option is not a short term lease).
l) Intangible assets
Intangible assets are identifiable non-monetary assets (separable from other assets) without physical substance which arise as a result of a legal transaction or which are developed internally by the consolidated entities.
Only assets whose cost can be measured reliably and it is likely that the consolidated entities obtain future economic benefits are recognised.
Intangible assets are recognised initially at acquisition or production cost and are subsequently measured at cost less any accumulated amortisation and any accumulated impairment losses.
i. Goodwill
Any excess of the cost of the investments in the consolidated entities and entities accounted for using the equity method over the corresponding underlying carrying amounts acquired, adjusted at the date of first-time consolidation, is allocated as follows:
a.If it is attributable to specific assets and liabilities of the companies acquired, by increasing the value of the assets (or reducing the value of the liabilities) whose fair values were higher (lower) than the carrying amounts at which they had been recognised in the acquired entities’ balance sheets.
574
b.If it is attributable to specific intangible assets, by recognising it explicitly in the consolidated balance sheet provided that the fair value of these assets within twelve months following the date of acquisition can be measured reliably.
c.The remaining amount is recognised as goodwill, which is allocated to one or more cash-generating units (CGU) (a cash-generating unit is the smallest identifiable group of assets that, as a result of continuing operation, generates cash inflows that are largely independent of the cash inflows from other assets or groups of assets). The cash-generating units represent the Group’s geographical and/or business segments.
Goodwill (only recognised when it has been acquired by consideration) represents, therefore, a payment made by the acquirer in anticipation of future economic benefits from assets of the acquired entity that are not capable of being individually identified and separately recognised.
At the end of each annual reporting period or whenever there is any indication of impairment goodwill is reviewed for impairment (i.e. a reduction in its recoverable amount to below its carrying amount) and, if there is any impairment, the goodwill is written down with a charge to 'Impairment or reversal of impairment on non-financial assets, net - Intangible assets' in the consolidated income statement.
An impairment loss recognised for goodwill is not reversed in a subsequent period.
In the event of sale or departure of an activity that is part of a CGU, the part of the goodwill that can be assigned to said activity would be written-off, taking as a reference the relative value of the same over the total of the CGU at the time of sale or abandonment. If applicable, the distribution by currency of the remaining goodwill will be performed based on the relative values of the remaining activities.
ii. Other intangible assets
Other intangible assets includes the amount of identifiable intangible assets, such as purchased customer lists and computer software.
Other intangible assets can have an indefinite useful life -when, based on an analysis of all the relevant factors, it is concluded that there is no foreseeable limit to the period over which the asset is expected to generate net cash inflows for the consolidated entities- or a finite useful life, in all other cases.
Intangible assets with indefinite useful lives are not amortised, but rather at the end of each reporting period or whenever there is any indication of impairment the consolidated entities review the remaining useful lives of the assets in order to determine whether they continue to be indefinite and, if this is not the case, to take the appropriate steps.
Intangible assets with finite useful lives are amortised over those useful lives using methods similar to those used to depreciate tangible assets.
The intangible asset amortisation charge is recognised under 'Depreciation and amortisation' in the consolidated income statement.
In both cases the consolidated entities recognise any impairment loss on the carrying amount of these assets with a charge to 'Impairment or reversal of impairment on non-financial assets, net - Intangible assets in the consolidated' income statement.
The criteria used to recognise the impairment losses on these assets and, where applicable, the reversal of impairment losses recognised in prior years are similar to those used for tangible assets (see note 2.k).
Internally developed computer software
Internally developed computer software is recognised as an intangible asset if, among other requisites (basically the Group’s ability to use or sell it), it can be identified and its ability to generate future economic benefits can be demonstrated.
Expenditure on research activities is recognised as an expense in the year in which it is incurred and cannot be subsequently capitalised into the carrying amount of the intangible asset.
m) Other assets
Other assets' in the consolidated balance sheet includes the amount of assets not recorded in other items, the breakdown being as follows:
•Inventories: this item includes the amount of assets, other than financial instruments, that are held for sale in the ordinary course of business, that are in the process of production, construction or development for such purpose, or that are to be consumed in the production process or in the provision of services. Inventories include land and other property held for sale in the property development business.
Inventories are measured at the lower of cost and net realisable value, which is the estimated selling price of the inventories in the ordinary course of business, less the estimated costs of completion and the estimated costs required to make the sale.
Any write-downs of inventories -such as those due to damage, obsolescence or reduction of selling price- to net realisable value and other impairment losses are recognised as expenses for the year in which the impairment or loss occurs. Subsequent reversals are recognised in the consolidated income statement for the year in which they occur.
The carrying amount of inventories is derecognised and recognised as an expense in the period in which the revenue from their sale is recognised.
▪Other: this item includes the balance of all prepayments and accrued income (excluding accrued interest, fees and commissions), the net amount of the difference between pension plan obligations and the value of the plan assets with a balance in the entity’s favour, when this net amount is to be reported in the consolidated balance sheet, and the amount of any other assets not included in other items.
n) Other liabilities
'Other liabilities' includes the balance of all accrued expenses and deferred income, excluding accrued interest, and the amount of any other liabilities not included in other categories.
575
o) Provisions and contingent liabilities (assets)
When preparing the financial statements of the consolidated entities, Banco Santander’s directors made a distinction between:
•Provisions: credit balances covering present obligations at the reporting date arising from past events which could give rise to a loss for the consolidated entities, which is considered to be likely to occur and certain as to its nature but uncertain as to its amount and/or timing.
▪Contingent liabilities: possible obligations that arise from past events and whose existence will be confirmed only by the occurrence or non-occurrence of one or more future events not wholly within the control of the consolidated entities. They include the present obligations of the consolidated entities when it is not probable that an outflow of resources embodying economic benefits will be required to settle them. The Group does not recognise the contingent liability. The Group will disclose a contingent liability, unless the possibility of an outflow of resources embodying economic benefits is remote.
▪Contingent assets: possible assets that arise from past events and whose existence is conditional on, and will be confirmed only by, the occurrence or non-occurrence of one or more uncertain future events not wholly within the control of the Group. Contingent assets are not recognised in the consolidated balance sheet or in the consolidated income statement, but rather are disclosed in the notes, provided that it is probable that these assets will give rise to an increase in resources embodying economic benefits.
Grupo Santander’s consolidated financial statements include all the material provisions with respect to which it is considered that it is more likely than not the obligation will have to be settled. In accordance with accounting standards, contingent liabilities must not be recognised in the consolidated financial statements, but must rather be disclosed in the Notes.
Provisions (which are quantified on the basis of the best information available on the consequences of the event giving rise to them and are reviewed and adjusted at the end of each year) are used to cater for the specific obligations for which they were originally recognised. Provisions are fully or partially reversed when such obligations cease to exist or are reduced.
Provisions are classified according to the obligations covered as follows (see note 25):
▪Provision for pensions and similar obligations: includes the amount of all the provisions made to cover post-employment benefits, including obligations to pre-retirees and similar obligations.
▪Provisions for contingent liabilities and commitments: include the amount of the provisions made to cover contingent liabilities -defined as those transactions in which the Group guarantees the obligations of a third party, arising as a result of financial guarantees granted or contracts of another kind- and contingent commitments -defined as irrevocable commitments that may give rise to the recognition of financial assets.
▪Provisions for taxes and other legal contingencies and Other provisions: include the amount of the provisions recognised to cover tax and legal contingencies and litigation and the other provisions recognised by the consolidated entities. Other provisions includes, inter alia, any provisions for restructuring costs and environmental measures.
p) Own equity instruments
Own equity instruments are those meeting both of the following conditions:
▪The instruments do not include any contractual obligation for the issuer (i) to deliver cash or another financial asset to a third party; or (ii) to exchange financial assets or financial liabilities with a third party under conditions that are potentially unfavourable to the issuer.
▪The instruments will or may be settled in the issuer’s own equity instruments and are: (i) a non-derivative that includes no contractual obligation for the issuer to deliver a variable number of its own equity instruments; or (ii) a derivative that will be settled by the issuer through the exchange of a fixed amount of cash or another financial asset for a fixed number of its own equity instruments.
Transactions involving own equity instruments, including their issuance and cancellation, are charged directly to equity.
Changes in the value of instruments classified as own equity instruments are not recognised in the consolidated financial statements. Consideration received or paid in exchange for such instruments, including the coupons on preference shares contingently convertible into ordinary shares and the coupons associated with CCPP, is directly added to or deducted from equity.
q) Equity-instrument-based employee remuneration
Own equity instruments delivered to employees in consideration for their services, if the instruments are delivered once the specific period of service has ended, are recognised as an expense for services (with the corresponding increase in equity) as the services are rendered by employees during the service period. At the grant date the services received (and the related increase in equity) are measured at the fair value of the equity instruments granted. If the equity instruments granted are vested immediately, Grupo Santander recognises in full, at the grant date, the expense for the services received.
When the requirements stipulated in the remuneration agreement include external market conditions (such as equity instruments reaching a certain quoted price), the amount ultimately to be recognised in equity will depend on the other conditions being met by the employees (normally length of service requirements), irrespective of whether the market conditions are satisfied.
If the conditions of the agreement are met but the external market conditions are not satisfied, the amounts previously recognised in equity are not reversed, even if the employees do not exercise their right to receive the equity instruments.
576
r) Recognition of income and expenses
The most significant criteria used by Grupo Santander to recognise its income and expenses are summarised as follows:
i. Interest income, interest expenses and similar items
Interest income, interest expenses and similar items are generally recognised on an accrual basis using the effective interest method. Dividends received from other companies are recognised as income when the consolidated entities’ right to receive them arises.
ii. Commissions, fees and similar items
Fee and commission income and expenses are recognised in the consolidated income statement using criteria that vary according to their nature. The main criteria are as follows:
▪Fee and commission income and expenses relating to financial assets and financial liabilities measured at fair value through profit or loss are recognised when paid.
▪Those arising from transactions or services that are performed over a period of time are recognised over the life of these transactions or services.
▪Those relating to services provided in a single act are recognised when the single act is carried out.
iii. Non-finance income and expenses
They are recognised for accounting purposes when the good is delivered or the non-financial service is rendered. To determine the amount and timing of recognition, a five-step model is followed: identification of the contract with the customer, identification of the separate obligations of the contract, determination of the transaction price, distribution of the transaction price among the identified obligations and finally recording of income as the obligations are satisfied.
iv. Deferred collections and payments
These are recognised for accounting purposes at the amount resulting from discounting the expected cash flows at market rates.
v. Loan arrangement fees
Loan arrangement fees, mainly loan origination, application and information fees, are accrued and recognised in income over the term of the loan.
s) Financial guarantees
Financial guarantees are considered contracts that require the issuer to make specific payments to reimburse the creditor for the loss it incurs when a specific debtor defaults on its due date payment obligation in accordance with the original or modified conditions of debt instrument, regardless of its legal form, which may be, among others, a deposit, financial guarantee, insurance contract or credit derivative.
Grupo Santander initially recognises the financial guarantees provided on the liability side of the consolidated balance sheet at fair value, which is generally the present value of the fees, commissions and interest receivable from these contracts over the term thereof, and simultaneously the Group recognises the amount of the fees, commissions and similar interest received at the inception of the transactions and a credit on the asset side of the consolidated balance sheet for the present value of the fees, commissions and interest outstanding.
Financial guarantees, regardless of the guarantor, instrumentation or other circumstances, are reviewed periodically so as to determine the credit risk to which they are exposed and, if appropriate, to consider whether a provision is required. The credit risk is determined by application of criteria similar to those established for quantifying impairment losses on debt instruments carried at amortised cost (described in note 2.g above).
The provisions made for these transactions are recognised under 'Provisions - Provisions for commitments and guarantees given in the consolidated balance sheet' (see note 25). These provisions are recognised and reversed with a charge or credit, respectively, to 'Provisions or reversal of provisions', net, in the consolidated income statement.
t) Assets under management and investment and pension funds managed by the Group
Assets owned by third parties and managed by the consolidated entities are not presented on the face of the consolidated balance sheet. The investment funds and pension funds managed by the consolidated companies are also not presented in the Group's consolidated balance sheet, as they are owned by third parties.
The commissions generated by these activities are included in the balance of the 'Commission income' chapter of the consolidated profit and loss account.
Note 2.b.iv describes the internal criteria and procedures used to determine whether control exists over the structured entities, which include, inter alia, investment funds and pension funds.
u) Post-employment benefits
Under the collective agreements currently in force and other arrangements, the Spanish banks included in the Group and certain other Spanish and foreign consolidated entities have undertaken to supplement the public social security system benefits accruing to certain employees, and to their beneficiary right holders, for retirement, permanent disability or death, and the post-employment welfare benefits.
Grupo Santander's post-employment obligations to its employees are deemed to be defined contribution plans when the Group makes pre-determined contributions (recognised under Personnel expenses in the consolidated income statement) to a separate entity and will have no legal or effective obligation to make further contributions if the separate entity cannot pay the employee benefits relating to the service rendered in the current and prior periods. Post-employment obligations that do not meet the aforementioned conditions are classified as defined benefit plans (see note 25).
577
Defined contribution plans
The contributions made in this connection in each year are recognised under 'Personnel expenses' in the consolidated income statement.
The amounts not yet contributed at each year-end are recognised, at their present value, under 'Provisions - Provision for pensions' and similar obligations on the liability side of the consolidated balance sheet.
Defined benefit plans
Grupo Santander recognises under 'Provisions - Provision for pensions and similar obligations on the liability side of the consolidated balance sheet' (or under 'Other assets' on the asset side, as appropriate) the present value of its defined benefit post-employment obligations, net of the fair value of the plan assets.
Plan assets are defined as those that will be directly used to settle obligations and that meet the following conditions:
▪They are not owned by the consolidated entities, but by a legally separate third party that is not a party related to the Group.
▪They are only available to pay or fund post-employment benefits and they cannot be returned to the consolidated entities unless the assets remaining in the plan are sufficient to meet all the benefit obligations of the plan and of the entity to current and former employees, or they are returned to reimburse employee benefits already paid by Grupo Santander.
If Grupo Santander can look to an insurer to pay part or all of the expenditure required to settle a defined benefit obligation, and it is practically certain that said insurer will reimburse some or all of the expenditure required to settle that obligation, but the insurance policy does not qualify as a plan asset, the Group recognises its right to reimbursement -which, in all other respects, is treated as a plan asset- under 'Insurance contracts linked to pensions' on the asset side of the consolidated balance sheet.
Grupo Santander will recognise the following items in the income statement:
•Current service cost, (the increase in the present value of the obligations resulting from employee service in the current period), is recognised under 'Staff costs'.
•The past service cost, which arises from changes to existing post-employment benefits or from the introduction of new benefits and includes the cost of reductions, is recognised under 'Provisions or reversal of provisions'.
•Any gain or loss arising from a liquidation of the plan is included in the Provisions or reversion of provisions.
•Net interest on the net defined benefit liability (asset), i.e. the change during the period in the net defined benefit liability (asset) that arises from the passage of time, is recognised under 'Interest expense' and similar charges ('Interest and similar income' if it constitutes income) in the consolidated income statement.
The remeasurement of the net defined benefit liability (asset) is recognised in 'Other comprehensive income' under Items not reclassified to profit or loss and includes:
▪Actuarial gains and losses generated in the year, arising from the differences between the previous actuarial assumptions and what has actually occurred and from the effects of changes in actuarial assumptions.
▪The return on plan assets, excluding amounts included in net interest on the net defined benefit liability (asset).
▪Any change in the effect of the asset ceiling, excluding amounts included in net interest on the net defined benefit liability (asset).
v) Other long-term employee benefits
Other long-term employee benefits, defined as obligations to pre-retirees -taken to be those who have ceased to render services at the entity but who, without being legally retired, continue to have economic rights vis-à-vis the entity until they acquire the legal status of retiree-, long-service bonuses, obligations for death of spouse or disability before retirement that depend on the employee’s length of service at the entity and other similar items, are treated for accounting purposes, where applicable, as established above for defined benefit post-employment plans, except that actuarial gains and losses are recognised under 'Provisions or reversal of provisions', net, in the consolidated income statement (see note 25).
w) Termination benefits
Termination benefits are recognised when there is a detailed formal plan identifying the basic changes to be made, provided that implementation of the plan has begun, its main features have been publicly announced or objective facts concerning its implementation have been disclosed.
x) Income tax
The expense for Spanish income tax and other similar taxes applicable to the foreign consolidated entities is recognised in the consolidated income statement, except when they arise from a transaction whose results are recognised directly in equity, in which case the related tax effect is recognised in equity.
The current income tax expense is calculated as the sum of the current tax resulting from application of the appropriate tax rate to the taxable profit for the year (net of any deductions allowable for tax purposes), and of the changes in deferred tax assets and liabilities recognised in the consolidated income statement.
'Deferred tax assets' and liabilities include temporary differences, which are identified as the amounts expected to be payable or recoverable on differences between the carrying amounts of assets and liabilities and their related tax bases, and tax loss and tax credit carryforwards. These amounts are measured at the tax rates that are expected to apply in the period when the asset is realised or the liability is settled.
578
'Tax assets' include the amount of all tax assets, which are broken down into current -amounts of tax to be recovered within the next twelve months- and deferred -amounts of tax to be recovered in future years, including those arising from tax loss or tax credit carryforwards.
Tax liabilities' includes the amount of all tax liabilities (except provisions for taxes), which are broken down into current -the amount payable in respect of the income tax on the taxable profit for the year and other taxes in the next twelve months- and deferred -the amount of income tax payable in future years.
Deferred tax liabilities are recognised in respect of taxable temporary differences associated with investments in subsidiaries, associates or joint ventures, except when the Group is able to control the timing of the reversal of the temporary difference and, in addition, it is probable that the temporary difference will not reverse in the foreseeable future. In this regard, no deferred tax liabilities of EUR 394.6 million were recognised in relation to the taxation that would arise from the undistributed earnings of certain Group holding companies, in accordance with the legislation applicable in those jurisdictions.
Deferred tax assets are only recognised for temporary differences to the extent that it is considered probable that the consolidated entities will have sufficient future taxable profits against which the deferred tax assets can be utilised, and the deferred tax assets do not arise from, in its initial recognition of (i)a business combination, (ii) an operation that does not affect either the tax result or the accounting result or (iii) on the date of the transaction, does not generate deductible and taxable temporary differences for the same amount (in which case assets and deferred tax liabilities). Other deferred tax assets (tax loss and tax credit carryforwards) are only recognised if it is considered probable that the consolidated entities will have sufficient future taxable profits against which they can be utilised.
Differences generated by the different accounting and tax treatment of any of the income and expenses recorded directly in equity to be paid or recovered in the future are accounted for as temporary differences.
The deferred tax assets and liabilities are reassessed at the reporting date in order to ascertain whether any adjustments need to be made on the basis of the findings of the analyses performed.
y) Residual maturity periods
In note 51 it is provided an analysis of the maturities of the balances of certain items in the consolidated balance sheet.
Santander Group has recorded as 'time liabilities' those recognised financial liabilities in which the counterparty may require payments.
Likewise, when Grupo Santander has committed to having amounts available at different maturity periods, these amounts have been recorded in the first year in which they may be required.
Additionally, for the financial guarantee contracts issued, the Group has recorded the maximum amount of the financial guarantee issued in the first year in which the guarantee can be executed.
z) Consolidated statement of recognised income and expense
This statement presents the income and expenses generated by the Group as a result of its business activity in the year, and a distinction is made between the income and expenses recognised in the consolidated income statement for the year and the other income and expenses recognised directly in consolidated equity.
Accordingly, this statement presents:
a. Consolidated profit for the year.
b. The net amount of the income and expenses recognised in 'Other comprehensive income' under items that will not be reclassified to profit or loss.
c. The net amount of the income and expenses recognised in Other comprehensive income under items that may be reclassified subsequently to profit or loss.
d. The income tax incurred in respect of the items indicated in b and c above, except for the valuation adjustments arising from investments in associates or joint ventures accounted for using the equity method, which are presented net.
e. Total consolidated recognised income and expense, calculated as the sum of a) to d) above, presenting separately the amount attributable to the parent company and the amount relating to non-controlling interests.
The statement presents the items separately by nature, grouping together items that, in accordance with the applicable accounting standards, will not be reclassified subsequently to profit and loss since the requirements established by the corresponding accounting standards are met.
aa) Statement of changes in total equity
This statement presents all the changes in equity, including those arising from changes in accounting policies and from the correction of errors. Accordingly, this statement presents a reconciliation of the carrying amount at the beginning and end of the year of all the consolidated equity items, and the changes are grouped together on the basis of their nature into the following items:
a. Adjustments due to changes in accounting policies and to errors: include the changes in consolidated equity arising as a result of the retrospective restatement of the balances in the consolidated financial statements, distinguishing between those resulting from changes in accounting policies and those relating to the correction of errors.
b. Income and expense recognised in the year: includes, in aggregate form, the total of the aforementioned items recognised in the consolidated statement of recognised 'Income and expense'.
c. Other changes in equity: includes the remaining items recognised in equity, including, inter alia, increases and decreases in capital, distribution of profit, transactions involving own equity instruments, equity-instrument-based payments, transfers between equity items and any other increases or decreases in consolidated equity.
579
ab) Consolidated statement of cash flows
The following terms are used in the consolidated statements of cash flows with the meanings specified:
•Cash flows: inflows and outflows of cash and cash equivalents, which are short-term, highly liquid investments that are subject to an insignificant risk of changes in value, irrespective of the portfolio in which they are classified.
Grupo Santander classifies as cash and cash equivalents the balances recognised under 'Cash, cash balances at central banks' and 'Other deposits on demand' in the consolidated balance sheet.
•Operating activities: the principal revenue-producing activities of credit institutions and other activities that are not investing or financing activities.
•Investing activities: the acquisition or disposal of long-term assets and other investments not included in cash and cash equivalents.
•Financing activities: activities that result in changes in the size and composition of the equity and liabilities that are not operating activities.
During 2023 Grupo Santander received interest amounting to EUR 101,029 million (EUR 69,282 and EUR 48,081 in 2022 and 2021, respectively) and paid interest amounting to EUR 50,954 million (EUR 23,390 and EUR 12,738 in 2022 and 2021, respectively).
Also, dividends received and paid by the Group are detailed in notes 4, 28 and 40, including dividends paid to minority interests (non-controlling interests)
3. Grupo Santander
a) Banco Santander, S.A., and international Group structure
The growth of Grupo Santander in the last decades has led Banco Santander to also act, in practice, as a holding entity of the shares of the various companies in its Group, and its results are becoming progressively less representative of the performance and earnings of the Group. Therefore, each year the bank determines the amount of the dividends to be distributed to its shareholders on the basis of the consolidated net profit, while maintaining the Group’s objectives of capitalisation and taking into account that the transactions of the Bank and of the rest of the Group are managed on a consolidated basis (notwithstanding the allocation to each company of the related net worth effect).
At the international level, the various banks and other subsidiaries, joint ventures and associates of the Group are integrated in a corporate structure comprising various holding companies which are the ultimate shareholders of the banks and subsidiaries abroad.
The purpose of this structure, all of which is controlled Banco Santander, is to optimise the international organisation from the strategic, economic, financial and tax standpoints, since it makes it possible to define the most appropriate units to be entrusted with acquiring, selling or holding stakes in other international entities, the most appropriate financing method for these transactions and the most appropriate means of remitting the profits obtained by the group’s various operating units to Spain.
The Appendices provide relevant data on the consolidated group companies and on the companies accounted for using the equity method.
b) Acquisitions and disposals
Following is a summary of the main acquisitions and disposals of ownership interests in the share capital of other entities and other significant corporate transactions performed in the last three years or pending to be completed:
i.Tender offers for shares of Banco Santander México, S.A., Institución de Banca Múltiple, Grupo Financiero Santander México
On 21 October 2022, Banco Santander, S.A. ('Banco Santander') announced that it intends to make concurrent cash tender offers to acquire all of the shares of Banco Santander México, S.A., Institución de Banca Múltiple, Grupo Financiero Santander México ('Santander Mexico') in Mexico (Shares) and United States (American Depositary Shares ('ADSs')) which were not owned by Grupo Santander, which amount to approximately 3.76 % of Santander Mexico’s share capital.
The offers were launched on 7 February 2023 and were originally scheduled to close on 8 March 2023. On 1 March 2023, Banco Santander announced its decision to extend the expiration date of the offers so that they could be concluded on 10 April 2023. Finally, after the offers' closing, 3.6 % of the capital accepted the offer, which raised the Group's stake in Santander México from 96.2 % to 99.8 %.will be settled on 13 March 2023.
Shareholders who participated in the offerings received 24.52 Mexican pesos (approximately EUR 1.20 ) per Share and USD 6.6876 in cash for each ADS (i.e., the equivalent in United States dollars of 122.6 Mexican pesos in cash for each ADS at the US dollar/Mexican peso exchange rate on the expiration date of 10 April 2023),which corresponded to the book value of the Santander México share according to the quarterly report of Santander México corresponding to the fourth quarter of the year 2022 in accordance with applicable legislation, with a total disbursement by Banco Santander of approximately EUR 300 million.
The operation has led to an increase of EUR 13 million in Reserves and a decrease of EUR 313 million in minority interests.
Once the offers were concluded and settled, Banco Santander proceeded to: (i) withdraw the ADSs from the listing on the New York Stock Exchange (“NYSE”) and the Shares from the registry before the Securities and Exchange Commission ('SEC') in the United States and; (ii) cancel the registration of the Shares in the National Securities Registry of the National Banking and Securities Commission ('CNBV'') and withdraw the listing of the Shares in the Mexican Stock Exchange, S.A.B. de C.V. ('BMV').
580
Said cancellation was approved by the extraordinary general shareholders' meeting of Santander México held on 30 November 2022, with the favourable vote of the holders of the shares that represent more than 95 % of the shares of Santander Mexico, as required by the Mexican Securities Market Law.
Pursuant to Mexican law, on 12 May 2023, Banco Santander and Santander México established a trust (the “Repurchase Trust”), to which the holders of the Shares that remain outstanding after the conclusion of the offers, to sell said Shares to the repurchase trust, at the same cash price that would have been paid to them in the Mexican offer with respect to the same. At the end of the year, said trust has already been liquidated and the Group's effective participation amounts to 99.98 %.
Likewise, on 26 March 2021, Banco Santander, S.A. announced its intention to make a tender offer for all shares of Banco Santander Mexico, S.A., Institución de Banca Múltiple, Grupo Financiero Santander México ('Santander México') that were not owned by Grupo Santander (8.3 % of the share capital of Santander México at that time). The announcement was subsequently supplemented by other publications on 24 May, 8 June and 28 October 2021, in which amendments to some of the terms of the offer were announced.
The offer was finally launched on 3 November 2021 and was settled on 10 December. Banco Santander accepted all of the Santander Mexico Shares and Santander Mexico American Depositary Share (ADS) (securities listed on the New York Stock Exchange, each represented 5 shares of Santander Mexico) tendered and not withdrawn representing approximately 4.5 % of the share capital of Santander México. After the transaction, Grupo Santander held approximately 96.2 % of Santander México share capital.
The shareholders who tendered their shares in the offer received MXN 26.5 (approximately EUR 1 ) per share of Santander México and USD 6.2486 in cash per each ADS (the USD equivalent of MXN 132.50 per ADS based on the USD/MXN exchange rate on the expiration date of 7 December 2021) which meant a disbursement of approximately EUR 335 million.
This transaction entailed a decrease of reserves of EUR 41 million and a decrease of EUR 294 million of minority interests.
ii. Agreement to acquire a significant holding in Ebury Partners Limited
On 28 April 2020, the investment announced on 4 November 2019 in Ebury, a payments and foreign exchange platform for SMEs, was completed. The transaction involved a total disbursement of GBP 357 million (approximately EUR 409 million) of which GBP 70 million (approximately EUR 80 million) was for new shares. By the end of 2019, the Group had already acquired 6.4 % of the company for GBP 40 million (approximately EUR 45 million). Following the disbursement made in April 2020, which gave the Group 50.38 % of the economic rights of the company, without the conditions to obtain control being met, this interest was recorded under 'Investments - Associated entities' in the consolidated balance sheet.
In April 2022 Grupo Santander acquired a new package of shares for GBP 113 million (approximately EUR 135 million) and subscribed in full to a new capital increase, paying an additional GBP 60 million (approximately EUR 72 million). Following these transactions, the Group holds 66.54 % of the economic rights and control of the company.
The total value of the net assets identified in the business combination amounted to EUR 413 million, mainly intangible assets (IT developments, customer lists and brand) and resulted in the recognition of goodwill of EUR 316 million.
No gain or loss was recorded for the difference between the book value and the fair value of the previous holding as this difference was not significant.
The amount contributed by this business to the Group's net attributable profit since the date of acquisition is immaterial . Similarly, the result that this business would have contributed to the Group if the transaction had been carried out on 1 January 2022 would also have been immaterial .
iii. Purchase by SHUSA for shares of Santander Consumer USA
In August 2021 Santander Holdings USA, Inc. ('SHUSA') and Santander Consumer USA Holdings Inc. ('SC') entered into a definitive agreement pursuant to which SHUSA acquired all outstanding shares of common stock of SC not already owned by SHUSA via an all-cash tender offer (the 'Tender Offer') for USD 41.50 per SC common share (the 'Offer Price'), followed by a second-step consisting of a merge (together with the Offer, the 'Transaction') in which a wholly owned subsidiary of SHUSA was merged with and into SC, with SC surviving as a wholly owned subsidiary of SHUSA, and all outstanding shares of common stock of SC not tendered in the Tender Offer were converted into the right to receive the Offer Price in cash. The Offer Price represented a 14 % premium to the closing price of SC common stock of USD 36.43 as of 1 July 2021, the last day prior to the announcement of SHUSA’s initial offer to acquire the remaining outstanding shares of SC’s common stock.
On 31 January 2022, after completion of the customary closing conditions, the Transaction was performed and SHUSA increased its share up to the 100 % of SC's common stock. The transaction has meant a disbursement of USD 2,510 million (around EUR 2,239 million) for the Group, with a decrease of reserves of EUR 487 million and a decrease of EUR 1,752 million of minority interests.
iv. Acquisition of Amherst Pierpont Securities LLC, a US fixed-income broker dealer
On 15 July 2021, Santander Holdings USA, Inc. (SHUSA), reached an agreement to acquire Amherst Pierpont Securities LLC, a market-leading independent fixed-income and structured products broker dealer, through the acquisition of its parent holding company, Pierpont Capital Holdings LLC, for a total consideration of approximately USD 450 million (around EUR 405 million). The operation was closed on 11 April 2022 once the pertinent regulatory approvals have been obtained. Immediately after the acquisition, SHUSA has lent financing to the company for an amount of USD 163 million (approximately EUR 147 million), which the company will use to cancel debt with third parties. Amherst Pierpont Securities LLC will become part of Santander Corporate & Investment Banking, Global business line.
581
The business combination meant the recognition of a goodwill of EUR 158 million and EUR 24 million of intangible assets (mainly relationships with customers) identified in the purchase price allocation, without other relevant value adjustments to net assets of the business.
The amount contributed by this business to the group net attributable profit since the date of acquisition is not material. Similarly, the result that this business would have brought to the group if the transaction had been carried out on 1 January 2022 is also immaterial .
c) Offshore entities
Spanish regulation
According to current Spanish regulation (Law 11/2021, of 9 July, Royal Decree 1080/1991, of 5 July and Order HFP/115/2023, of 9 February), Santander has one subsidiary and three branches in the non-cooperative jurisdictions of Jersey, the Isle of Man and the Cayman Islands (offshore entities). Santander also has two other subsidiaries incorporated in non-cooperative jurisdictions that are tax resident in the UK and subject to British tax law.
i. Offshore subsidiaries
At the reporting date, Grupo Santander has only one subsidiary resident in Jersey, Abbey National International Limited, with activity of services, immaterial losses and no employees as of December 2023.
ii. Offshore branches
Grupo Santander also has three offshore branches in the Cayman Islands, the Isle of Man and Jersey. They report to, and consolidate balance sheets and income statements with, their foreign headquarters. They are taxed either with their headquarters (the Cayman Islands branch in Brazil) or in the territories they are located in (Jersey and Isle of Man, pertain to the UK).
These three offshore branches have a total of 166 employees as of December 2023.
iii. Subsidiaries in non-cooperative jurisdictions that are tax resident in the United Kingdom
Grupo Santander also has two subsidiaries that were incorporated in offshore jurisdictions (one in Bermuda without activity and one in Guernsey with leasing activity) but are not deemed offshore entities because they only operate from and are tax resident in the UK and, thus, are subject to British tax law.
iv. Other offshore holdings
From Brazil, Grupo Santander manages Santander Brazil Global Investment Fund SPC, a segregated portfolio company located in the Cayman Islands. Grupo Santander also has other non-controlling financial interest of a reduced amount in entities located in non-cooperative jurisdictions.
The European Union (EU)
As of October 2023, the EU blacklist comprises 16 jurisdictions where Santander is only present in The Bahamas. In this jurisdiction, Santander has one bank without third-party activity, Santander Bank & Trust Ltd., and one branch of the Swiss bank Banco Santander International SA. These entities have a total of 26 employees as of December 2023.
In 2023, one subsidiary residing in The Bahamas moved its domicile to Spain.
Additionally, the EU grey list comprises 14 jurisdictions which have sufficiently committed to adapt their legislation to international standards, subject to monitoring by the EU. Within these jurisdictions, Santander is mainly present in Hong Kong through a branch.
Organization for Economic Cooperation and Development (OECD)
Grupo Santander is not present in any jurisdictions non-compliant with both OECD standards on transparency and exchange of information for tax purposes (Automatic exchange of information standard -AEOI- and Exchange of information on request standard -EOIR-) according to the last annual report of the OECD Global forum on transparency and exchange of information for tax purposes released in November 2023.
However, the Group is present in The Bahamas and Chile. Although these territories have complete legal and regulatory frameworks in place for the application of the AEOI standard, they need to improve the effectiveness of this standard.
The Group's presence in offshore territories at the end of 2023 is as follows:
Presence of the Group in non-cooperative jurisdictionsa | Spanish legislation | Council of the EU blacklist | OECDb | |||||||||||||||||
| Sub. | Branch | Sub. | Branch | Sub. | Branch | |||||||||||||||
| Jersey | ||||||||||||||||||||
| Isle of Man | ||||||||||||||||||||
| Cayman Islands | ||||||||||||||||||||
| The Bahamas | ||||||||||||||||||||
2023c | ||||||||||||||||||||
| 2022 | ||||||||||||||||||||
aAdditionally, there is one subsidiary constituted in Guernsey and one in Bermuda, but residents for tax purposes in the UK.
bJurisdictions non-compliant with both OECD standards on transparency and exchange of information for tax purposes (AEOI and EOIR). Jersey, the Isle of Man and the Cayman Islands continue to fully comply with both OECD standards.
cIn 2023, one subsidiary residing in The Bahamas moved its domicile to Spain.
Grupo Santander has the right mechanisms (risk management, supervision, verification and review plans, and regular reporting) to prevent reputational, tax and legal risk in entities resident in non-cooperative jurisdictions. Grupo Santander also maintains its policy of limiting and reducing its presence in non-cooperative jurisdictions when possible.
PwC (PricewaterhouseCoopers) member firms audited the financial statements of Grupo Santander’s offshore entities in 2023, 2022 and 2021.
582
4. Distribution of Banco Santander's profit, shareholder remuneration scheme and earnings per share
a) Distribution of Banco Santander's profit and shareholder remuneration scheme
The distribution of the Bank's current annual results that the board of directors will propose for approval by the shareholders at the annual general meeting is as follows:
| EUR million | |||||
| To dividends | |||||
Dividend paid at 31 DecemberA | |||||
Complementary dividendB | |||||
To voluntary reservesC | |||||
| Net profit for the year | |||||
A.Total amount paid as interim dividend, at the rate of EUR 8.10 fixed cents per eligible share (recorded in 'Shareholders' equity - Interim dividends').
B.Fixed complementary dividend of EUR 9.50 gross cents per eligible share, payable in cash as from 2 May 2024. The total amount has been estimated on the assumption that, as a result of the partial implementation of the buyback program announced on February 19, 2024, the number of the Bank's outstanding shares eligible for the dividend will be 15,483,617,874 . Therefore, the total amount of the complementary dividend may be higher if fewer shares are acquired in the buyback program than expected, or lower in the opposite case.
C.Estimated amount corresponding to a complementary dividend of EUR 1,470,943,698 . To be increased or reduced by the same amount by which the total amount of the complementary dividend is respectively lower or higher than the estimate of that complementary dividend.
The transcribed proposal comprises the part of the 2023 shareholder remuneration policy that is implemented through cash dividends (the interim dividend paid in November 2023 of EUR 8.10 cents per share with dividend entitlement, approved by the board of directors on 26 September 2023, and the complementary dividend expected to be paid as of 2 May 2024, of EUR 9.50 cents per share with the dividend entitlement, proposed by the board of directors on 19 February 2023, and therefore subject to approval by the General Meeting of Shareholders).
In addition, the 2023 remuneration policy also includes expected shareholder remuneration through the implementation of a share buyback program to which an amount equivalent to 25 % of the Group's ordinary profit. The first of these programs based on the results of 2023, for an approximate amount of EUR 1,310 million, was completed between September 2023 and January 2024. A second buyback program on account of the 2023 results is planned for an amount of EUR 1,459 million. It also submits to the general meeting of shareholders the agreement for reduction of capital that will allow the amortization of own shares acquired in the repurchase program, subject to the relevant regulatory authorization.
The accounting statement, prepared by the Bank pursuant to legal requirements, evidencing the existence of sufficient liquidity for the payment of the interim dividend on the date and for the amount mentioned above, was as follows:
| EUR million | |||||
| 31 August 2023 | |||||
| Profit before taxes | |||||
| Tax expense | |||||
| Dividends paid in cash | |||||
| Distributable maximum amount | |||||
| Available liquidity | |||||
Finally, and although it is not part of the remuneration charged to the 2023 financial year, it should be noted that pursuant to the resolution of the Bank's General Meeting of Shareholders held on 31 March 2023, on 2 May 2023 the Bank paid a complementary cash dividend of EUR 5.95 cents per share charged to the results of the 2022 financial year. Finally, also charged to the results of 2022, the Bank implemented repurchase programs. The first of them for a maximum amount of EUR 979 million, which ended on January 2023 and the second one, for a maximum amount of EUR 921 million, which ended in April 2023.
583
b) Earnings/loss per share from continuing and discontinued operations
i. Basic earnings / loss per share
Basic earnings/loss per share are calculated by dividing the net profit attributable to the Group, adjusted by the after-tax amount of the remuneration of contingently convertible preference shares (PPCC) recognised in equity and the capital perpetual preference shares (PPCA) (see note 23), if applicable, by the weighted average number of ordinary shares outstanding during that period, excluding the average number of own shares held through that period.
Accordingly:
| 2023 | 2022 | 2021 | |||||||||
| Profit (Loss) attributable to the Parent (EUR million) | |||||||||||
| Remuneration of PPCC and PPCA (EUR million) (note 23) | ( | ( | ( | ||||||||
| Of which: | |||||||||||
| Profit (Loss) from discontinued operations (non controlling interest net) (EUR million) | |||||||||||
| Profit (Loss) from continuing operations (non-controlling interest and PPCC and PPCA net) (EUR million) | |||||||||||
| Weighted average number of shares outstanding | |||||||||||
| Adjusted number of shares | |||||||||||
| Basic earnings (Loss) per share (euros) | |||||||||||
| Of which, from discounted operations (euros) | |||||||||||
| Basic earnings (Loss) per share from continuing operations (euros) | |||||||||||
ii. Diluted earnings / loss per share
Diluted earnings/loss per share are calculated by dividing the net profit attributable to the Group, adjusted by the after-tax amount of the remuneration of contingently convertible preference shares recognised in equity (PPCC) recognised in equity and the capital perpetual preference shares (PPCA) (see note 23), by the weighted average number of ordinary shares outstanding during the year, excluding the average number of treasury shares and adjusted for all the dilutive effects inherent to potential ordinary shares (share options, and convertible debt securities).
Accordingly, diluted earnings/loss per share were determined as follows:
| 2023 | 2022 | 2021 | |||||||||
| Profit (Loss) attributable to the Parent (EUR million) | |||||||||||
| Remuneration of PPCC and PPCA (EUR million) (Note 23) | ( | ( | ( | ||||||||
| Dilutive effect of changes in profit for the period arising from potential conversion of ordinary shares | |||||||||||
| Of which: | |||||||||||
| Profit (Loss) from discontinued operations (net of non-controlling interests) (EUR million) | |||||||||||
| Profit (Loss) from continuing operations (net of non-controlling interests and PPCC and PPCA) (EUR million) | |||||||||||
| Weighted average number of shares outstanding | |||||||||||
| Dilutive effect of options/rights on shares | |||||||||||
| Adjusted number of shares | |||||||||||
| Diluted earnings (Loss) per share (euros) | |||||||||||
| Of which, from discounted operations (euros) | |||||||||||
| Diluted earnings (Loss) per share from continuing operations (euros) | |||||||||||
584
5. Remuneration and other benefits paid to the Bank’s directors and senior managers
The following section contains qualitative and quantitative disclosures on the remuneration paid to the members of the board of directors —both executive and non-executive directors— and senior managers for 2023 and 2022:
a) Remuneration of Directors
i. Bylaw-stipulated emoluments
The annual general meeting held on 22 March 2013 approved an amendment to the Bylaws, whereby the remuneration of directors in their capacity as board members became an annual fixed amount determined by the annual general meeting. This amount shall remain in effect unless the shareholders resolve to change it at a general meeting. However, the board of directors may elect to reduce the amount in any years in which it deems such action justified.
The maximum remuneration established by the annual general meeting was EUR 6 million in 2023 (EUR 6 million in 2022), with two components: (a) an annual emolument and (b) attendance fees.
The specific amount payable for the above-mentioned items to each of the directors is determined by the board of directors. For such purpose, it takes into consideration the positions held by each director on the board, their membership of the board and the board committees and their attendance to the meetings thereof, and any other objective circumstances considered by the board.
The total Bylaw-stipulated emoluments earned by the directors in 2023 amounted to EUR 5.3 million (EUR 4.7 million in 2022).
Annual allotment
In accordance with the remuneration policy approved at the general shareholders' meeting on 31 March 2023, the annual allotment for board and committee membership (except for the executive committee) increased EUR 3,000 compared to the amount approved and established for 2022. Each director received the amounts for serving on the board and its committees and positions held in them included in the chart below for 2022 and 2023:
| Amount per director in euros | 2023 | 2022 | ||||||
| Members of the board of directors | ||||||||
| Members of the executive committee | ||||||||
| Members of the audit committee | ||||||||
| Members of the appointments committee | ||||||||
| Members of the remuneration committee | ||||||||
| Members of the risk supervision, regulation and compliance committee | ||||||||
| Members of the responsible banking, sustainability and culture committee | ||||||||
| Members of the innovation and technology committee | ||||||||
| Chair of the audit committee | ||||||||
| Chair of the appointments committee | ||||||||
| Chair of the remuneration committee | ||||||||
| Chair of the risk supervision, regulation and compliance committee | ||||||||
| Chair of the responsible banking, sustainability and culture committee | ||||||||
| Chair of the innovation and technology committee | ||||||||
Lead independent directorA | ||||||||
| Non-executive Vice Chair | ||||||||
A.Since 2015, Bruce Carnegie-Brown has been allocated EUR 700,000 (including annual allowances and attendance fees) in minimum total annual pay set for the lead independent director, for his services to the board and its committees, particularly as Chair of the nomination and remuneration committees and also as lead independent director; and for the required time and dedication to perform these roles. Bruce Carnegie-Brown has stepped down from his role of Lead Independent Director on 1 October 2023, when he has been succeeded in this position by Glenn Hutchins.
Attendance fees
The directors receive fees for attending board and committee meetings, excluding executive committee meetings, where no attendance fees are received.
For 2023 the board voted to keep the same amounts set out in the 2022 policy.
585
The fees have not been modified since 2016. For 2023 and 2022 they are as follows:
| Attendance fees per director per meeting in euros | 2023 | 2022 | ||||||
| Board of directors | ||||||||
| Audit committee and risk supervision, regulation and compliance committee | ||||||||
| Other committees (excluding executive committee) | ||||||||
ii. Salaries
The executive directors receive salaries. In accordance with the policy approved by the annual general meeting, salaries are composed of a fixed annual remuneration and a variable one, which consists in a unique incentive, which is a deferred variable remuneration plan linked to multi-year objectives, which establishes the following payment scheme:
•40 % of the variable remuneration amount, determined at year-end on the basis of the achievement of the established objectives, is paid immediately.
•The remaining 60 % is deferred over five years , to be paid in five portions, provided that the conditions of permanence in the Group and non-concurrence of the malus clauses are met, and subject to long term metrics, taking into account the following accrual scheme:
–The accrual of the first and second portion (payment in 2025 and 2026) will be conditional on none of the malus clauses being triggered.
–The accrual of the third, fourth, and fifth portion (payment in 2027, 2028 and 2029), is linked to objectives related to the period 2023—2025 and the metrics and scales associated with these objectives. The fulfilment of the objectives determines the percentage to be paid of the deferred amount in these three annuities, and these targets can reduce these amounts and the number of deferred instruments, or increase them up to a maximum achievement ratio of 125 %, so executives have the incentive to exceed their targets.
In accordance with current remuneration policies, the amounts already paid will be subject to a possible recovery (clawback) by the Bank during the period set out in the policy in force at each moment.
The immediate payment (or short-term), as well as each deferred payment (linked to long term metrics and not linked to long-term metrics) will be settled 50 % in cash and the remaining 50 % in instruments, consisting of Banco Santander, S.A. shares, Banco Santander, S.A. share options and restricted stock units (RSUs) of PagoNxt, split as:
◦ the amount of PagoNxt RSUs set for each year; and
◦ the rest, all in instruments of Banco Santander, S.A. The executive director must decide between receiving such amount all in shares, or receiving in equal parts shares and share options of Banco Santander, S.A. In 2023 both directors have chosen all in shares.
Comparative of executive remuneration (Chair and CEO)
The board voted to maintain the same target incentive for Ana Botín in 2023 as in 2022 and established a variable remuneration target for Hector Grisi of EUR 4,200 thousand (aligned with that of his predecessor José Antonio Álvarez). In turn, after five years with no review of gross annual salary, the board resolved that Ana Botín’s gross annual salary would increase a 3% in respect of 2022.
Variable contributions to pensions were not modified in 2023, so the amounts are the22 % of the 30 % of the last three assigned bonus' average.
Variable contributions to pensions were not modified in 2023, so the amounts are the
In 2023, Santander’s strong performance and excellent execution of our strategy enabled us to deliver record attributable profit of EUR 11,076 million (+15.3 % vs. 2022) and a capital ratio of 12.30 % (achieving our public target). We also achieved a very high total shareholder return of 40.5 %( 5 % above our official group of nine peers in relative terms). Because of the double digit growth in net profit coupled with the highest TSR in the last 14 years, the board approved to maintain the same bonus pool as in 2022 at 138.91 % for which an extraordinary adjustment of + 15.57 % was made, in the same manner as the 2021 and 2019 pools were both reduced by extraordinary adjustments (due to worse shareholders return), with a combined impact of -30 %.
As a result, and considering the exceptional contribution made by the Chairman and the CEO to the achievement of these exceptional figures, on the basis of the detailed pool disclosed in the Remuneration section, and due to the fulfillment of their individual objectives, the board of directors, upon recommendation of the remuneration committee, approved the variable remuneration disclosed below, which means an increase of 5 % of Executive Chair's total compensation, and a reduction of 9 % in the case of Héctor Grisi (compared to his predecessor).
Moreover, the ratio of executive directors’ total remuneration to underlying attributable profit fell to 0.19 % from 0.23 % in 2022.
586
iii. Detail by director
The detail, by bank director, of the short-term (immediate) and deferred (not subject to long-term goals) remuneration for 2023 and 2022 is provided below:
| EUR thousand | |||||||||||||||||||||||||||||
| 2023 | |||||||||||||||||||||||||||||
| Bylaw-stipulated emoluments | |||||||||||||||||||||||||||||
| Annual emolument | |||||||||||||||||||||||||||||
BoardF | Executive committee | Audit committee | Appointments committee | Remuneration committee | Risk supervision, regulation and compliance oversight committee | Responsible banking, sustainability and culture committee | Innovation and technology committee | Attendance fees and commissions | |||||||||||||||||||||
| Ana Botín | |||||||||||||||||||||||||||||
Héctor GrisiA | |||||||||||||||||||||||||||||
| José Antonio Álvarez | |||||||||||||||||||||||||||||
| Bruce Carnegie-Brown | |||||||||||||||||||||||||||||
| Homaira Akbari | |||||||||||||||||||||||||||||
Javier BotínB | |||||||||||||||||||||||||||||
| Sol Daurella | |||||||||||||||||||||||||||||
| Henrique de Castro | |||||||||||||||||||||||||||||
| Gina Díez | |||||||||||||||||||||||||||||
| Luis Isasi | |||||||||||||||||||||||||||||
| Ramiro Mato | |||||||||||||||||||||||||||||
| Belén Romana | |||||||||||||||||||||||||||||
| Pamela Walkden | |||||||||||||||||||||||||||||
| Germán de la Fuente | |||||||||||||||||||||||||||||
Glenn Hutchins2 | |||||||||||||||||||||||||||||
Álvaro CardosoC | |||||||||||||||||||||||||||||
R. Martín ChavezD | |||||||||||||||||||||||||||||
Sergio RialE | |||||||||||||||||||||||||||||
| Total 2023 | |||||||||||||||||||||||||||||
| Total 2022 | |||||||||||||||||||||||||||||
A. Director since 1 January 2023.
B.All amounts received were reimbursed to Fundación Botín.
C.Stepped down as director on 1 April 2022.
D.Stepped down as director on 1 July 2022.
E.Stepped down as director on 1 January 2023.
F.Also includes emoluments for other roles in the board.
1. Includes EUR 1,000 thousand for the role as non-executive Chair of Santander España and for Santander España board and committees meetings for Luis Isasi. For José Antonio Álvarez, this amount includes remuneration as strategic advisor of Grupo Santander, life and health insurance contributions (EUR 722 thousand) and the supplement for having waived the death and disability policy (EUR 710 thousand).
2. From 1 October 2023, the Lead Independent Director, non-executive Vice Chair and Chair of remuneration committee is Mr. Glenn Hutchins, succeeding Mr. Carnegie-Brown.
587
| 2023 | 2022 | ||||||||||||||||||||||||||||||||||
| Short-term and deferred (not subject to long-term goals) salaries of executive directors | |||||||||||||||||||||||||||||||||||
| Fixed | Variable - immediate payment | Deferred variable | |||||||||||||||||||||||||||||||||
| In cash | In instruments | In cash | In instruments | Total | Pension contribution | Other remuneration1 | Total | Total | |||||||||||||||||||||||||||
| Ana Botín | |||||||||||||||||||||||||||||||||||
Héctor GrisiA | |||||||||||||||||||||||||||||||||||
| José Antonio Álvarez | |||||||||||||||||||||||||||||||||||
| Bruce Carnegie-Brown | |||||||||||||||||||||||||||||||||||
| Homaira Akbari | |||||||||||||||||||||||||||||||||||
Javier BotínB | |||||||||||||||||||||||||||||||||||
| Sol Daurella | |||||||||||||||||||||||||||||||||||
| Henrique de Castro | |||||||||||||||||||||||||||||||||||
| Gina Díez | |||||||||||||||||||||||||||||||||||
| Luis Isasi | |||||||||||||||||||||||||||||||||||
| Ramiro Mato | |||||||||||||||||||||||||||||||||||
| Belén Romana | |||||||||||||||||||||||||||||||||||
| Pamela Walkden | |||||||||||||||||||||||||||||||||||
| Germán de la Fuente | |||||||||||||||||||||||||||||||||||
Glenn Hutchins2 | |||||||||||||||||||||||||||||||||||
Álvaro CardosoC | |||||||||||||||||||||||||||||||||||
R. Martín ChavezD | |||||||||||||||||||||||||||||||||||
Sergio RialE | |||||||||||||||||||||||||||||||||||
| Total 2023 | — | ||||||||||||||||||||||||||||||||||
| Total 2022 | |||||||||||||||||||||||||||||||||||
Footnotes in previous table.
588
Following is the detail by executive director of the salaries linked to multi-year objectives at their fair Value, which will only be received if the conditions of permanence in the Group, non-applicability of malus clauses and achievement of the established objectives are met (or, as the case may be, of the minimum thresholds thereof, with the consequent reduction of amount agreed-upon at the end of the year) in the terms described in Note 46.
| EUR thousand | |||||||||||||||||
| 2023 | 2022 | ||||||||||||||||
Variable subject to long-term objectives1 | |||||||||||||||||
| In cash | In shares | In RSUs | Total | Total | |||||||||||||
| Ana Botín | |||||||||||||||||
| Héctor Grisi | |||||||||||||||||
| José Antonio Álvarez | |||||||||||||||||
| Total | |||||||||||||||||
1. Corresponds with the fair value of the maximum amount they are entitled to in a total of 3 years: 2027, 2028 and 2029, subject to conditions of continued service, with the exceptions provided, and to the non-applicability of malus clauses and achievement of the objectives established.
The fair value has been determined at the grant date based on the valuation report of an independent expert, Willis Towers Watson. Based on the design of the plan for 2023 and the levels of achievement of similar plans in comparable entities, the fair value considered is 70 % of the variable remuneration subject to long-term objectives. (see note 46).
Note 5.e below includes disclosures on the shares delivered from the deferred remuneration schemes in place in previous years and for which delivery conditions were met, as well as on the maximum number of shares that may be received in future years in connection with the aforementioned 2023 and 2022 variable remuneration plans.
b) Remuneration of the board members as representatives of the Bank
By resolution of the executive committee, all the remuneration received by the Bank’s directors who represent the Bank on the boards of directors of listed companies in which the Bank has a stake, paid by those companies and relating to appointments made on or after 18 March 2002, accrues to the Group. In 2023 the Bank’s directors did not receive any remuneration in respect of these representative duties.
On the other hand, in their personal capacity, in 2023 Homaira Akbari was paid USD 120 thousand (EUR 111 thousand) as member of the board of Santander Consumer USA Holdings, Inc. and EUR 200 thousand as member of the board of PagoNxt S.L., and Henrique de Castro and José Antonio Álvarez were each paid the same EUR 200 755 thousand (EUR 141 thousand) as member of Banco Santander (Brasil) S.A. Likewise, Pamela Walkden was paid GBP 132 thousand (EUR 152 thousand) as member of Santander UK plc and Santander UK Group Holdings.
Likewise, Luis Isasi was paid EUR 1,000 thousand as non-Executive Chair of the board of Santander España and for attending its board and committee meetings (amounts paid by Banco Santander, S.A.).
And finally, José Antonio Álvarez, as strategic adviser of Grupo Santander, received fixed remuneration of EUR1,750 thousand. In addition, he received the life and health insurance contributions, and the supplement for having waived the death and disability policy.
And finally, José Antonio Álvarez, as strategic adviser of Grupo Santander, received fixed remuneration of EUR
c) Post-employment and other long-term benefits
In 2012, the contracts of Ana Botín and other members of the Bank's senior management with defined benefit pension commitments were modified to transform these commitments into a defined contribution system, which covers the contingencies of retirement, disability and death. From that moment on, the Bank makes annual contributions to their pension system for their benefit.
This system gives them the right to receive benefits upon retirement, regardless of whether or not they are active at the Bank at such time, based on contributions to the system, and replaced their previous right to receive a pension supplement in the event of retirement.
The initial balance for Ana Botín in the new defined benefits system corresponded to the market value of the assets from which the provisions corresponding to the respective accrued obligations had materialised on the date on which the old pension commitments were transferred into the new benefits system.
Since 2013, the Bank has made annual contributions to the benefits system for executive directors and other members of executive team, in proportion to their respective pensionable bases, until they leave Grupo Santander or until their retirement within the Group, death, or disability.
The benefit plan system is outsourced to Santander Seguros y Reaseguros, Compañía Aseguradora, S.A., and the economic rights of the foregoing directors under this plan belong to them regardless of whether or not they are active at the Bank at the time of their retirement, death or disability.
In accordance with the provisions of the remuneration regulations, contributions made calculated on variable remuneration are subject to the discretionary pension benefits regime. Under this regime, contributions are subject to malus clauses and clawback according to the policy in force at any given time and during the same period in which the variable remuneration is deferred.
Furthermore, they must be invested in bank shares for a period of five years from the date when the executive director leaves the Group, regardless of whether or not they leave to retire. Once that period has elapsed, the amount invested in shares will be reinvested, along with the remainder of the cumulative balance corresponding to the executive director, or it will be paid to the executive director or to their beneficiaries in the event of a contingency covered by the benefits system.
589
As per the director´s remuneration policy approved at the 23 March 2018 general shareholder´s meeting, the system was changed with a focus on:
•Aligning the annual contributions with practices of comparable institutions.
•Reducing future liabilities by eliminating the supplementary benefits scheme in the event of death (death of spouse or parent) and permanent disability of serving directors.
•Not increasing total costs for the Bank.
The changes to the system were the following:
•Fixed and variable pension contributions were reduced to 22 % of the respective pensionable bases. The gross annual salaries and the benchmark variable remuneration were increased in the corresponding amount with no increase in total costs for the Bank. The pensionable base for the purposes of the annual contributions for the executive directors is the sum of fixed remuneration plus 30 % of the average of their last three variable remuneration amounts. For Héctor Grisi, CEO from 1 January 2023, since he has not been in position for three years, the calculation of variable portion was calculated with his gross variable remuneration agreed in that year.
•The death and disability supplementary benefits were eliminated since 1 April 2018. A fixed remuneration supplement (included in other remuneration in section a.iii in this note) was implemented the same date.
•The total amount insured for life and accident insurance was increased.
The provisions recognised in 2023 and 2022 for retirement pensions were as follows:
| EUR thousand | ||||||||
| 2023 | 2022 | |||||||
| Ana Botín | ||||||||
| Héctor Grisi | ||||||||
| José Antonio Álvarez | ||||||||
| Total | ||||||||
Following is a detail of the balances relating to each of the directors under the welfare system as of 31 December 2023 and 2022:
| EUR thousand | ||||||||
| 2023 | 2022 | |||||||
| Ana Botín | ||||||||
| Héctor Grisi | ||||||||
| José Antonio Álvarez | ||||||||
| Total | ||||||||
d) Insurance
The Group pays for life insurance policies for the Bank’s directors, who will be entitled to receive benefits if they are declared disabled. In the event of death, the benefits will be payable to their heirs. The premiums paid by the Group are included in the 'Other remuneration' column of the table shown in Note 5.a.iii above. Also, the following table provides information on the sums insured for the Bank’s directors:
| Insured capital | ||||||||
| EUR thousand | ||||||||
| 2023 | 2022 | |||||||
| Ana Botín | ||||||||
| Héctor Grisi | ||||||||
| José Antonio Álvarez | ||||||||
| Total | ||||||||
The insured capital has been modified in 2018 for Ana Botín as part of the pension systems transformation set out in note 5.c) above, which has encompassed the elimination of the supplementary benefits systems (death of spouse and death of parent) and the increase of the life insurance annuities.
During 2023 and 2022, the Group has disbursed a total amount of EUR 13.2 million and EUR 48.2 million, respectively, for the payment of civil-liability insurance premiums. These premiums correspond to several civil-liability insurance policies that hedge, among others, directors, senior management and other managers and employees of the Group and the Bank itself, as well as its subsidiaries, in light of certain types of potential claims of third parties. For this reason, it is not possible to disaggregate or individualize the amount that correspond to the directors and executives.
As of 31 December 2023 and 2022, no
590
e) Deferred variable remuneration systems
The following information relates to the maximum number of shares to which the executive directors are entitled at the beginning and end of 2023 and 2022 due to their participation in the deferred variable remuneration systems, which instrumented a portion of their variable remuneration relating to 2023 and prior years, as well as on the deliveries, in shares or in cash, made to them in 2023 and 2022 once the conditions for the receipt thereof had been met (see Note 46):
i) Deferred conditional variable remuneration plan
From 2011 to 2015, the bonuses of executive directors and certain executives (including senior management) and employees who assume risk, who perform control functions or receive an overall remuneration that puts them on the same remuneration level as senior management and employees who assume risk (all of whom are referred to as identified staff) have been approved by the board of directors and instrumented, respectively, through various cycles of the deferred conditional variable remuneration plan. Application of these cycles, insofar as they entail the delivery of shares to the plan beneficiaries, was authorized by the related annual general meetings.
The purpose of these plans was to defer a portion of the bonus of the plan beneficiaries (60 % in the case of executive directors) over a period of five years (three years for the plans approved up to 2014) for it to be paid, where appropriate, in cash and in Santander shares. The remaining 40 % portion of the bonus is paid in cash and Santander shares (in equal parts), upon commencement of this plan, in accordance with the rules set forth below.
In addition to the requirement that the beneficiary remains in Grupo Santander’s employ, the accrual of the deferred remuneration was conditional upon none of the following circumstances existing in the opinion of the board of directors -following a proposal of the remuneration committee-, in relation to the corresponding year, in the period prior to each of the deliveries: (i) poor financial performance of the Group; (ii) breach by the beneficiary of internal regulations, including, in particular, those relating to risks; (iii) material restatement of the Group’s consolidated financial statements, except when it is required pursuant to a change in accounting standards; or (iv) significant changes in the Group’s economic capital or its risk profile. All the foregoing shall be subject in each case to the regulations of the relevant plan cycle.
Similarly, Banco Santander can clawback any paid variable amounts in the scenarios and for the period dictated by the terms and conditions in the said policy.
On each delivery, the beneficiaries are paid an amount in cash equal to the dividends paid for the amount deferred in shares and the interest on the amount deferred in cash. If the Santander Dividendo Elección scrip dividend scheme is applied, payment will be based on the price offered by the Bank for the bonus share rights corresponding to those shares.
The maximum number of shares to be delivered is calculated taking into account the daily volume-weighted average prices for the 15 trading sessions prior to the date on which the board of directors approves the bonus for the Bank’s executive directors for each year.
This plan and the Performance Shares (ILP) plan described below have been integrated for the executive directors and other senior managers in the deferred variable compensation plan linked to multiannual objectives, in the terms approved by the General Meeting of Shareholders held on March 18, 2016.
2021 was the last financial year in which a payment was made in application of this plan.
ii) Deferred variable compensation plan linked to multiannual objectives
In the annual shareholders meeting of 18 March 2016, with the aim of simplifying the remuneration structure, improving the ex-ante risk adjustment and increasing the incidence of long-term objectives, the bonus plan (deferred and conditioned variable compensation plan) and ILP were replaced by one single plan.
The variable remuneration of executive directors and certain executives (including senior management) corresponding to 2023 has been approved by the board of directors and implemented through the eighth cycle of the deferred variable remuneration plan linked to multi-year objectives. The application of the plan was authorised by the annual general meeting of shareholders, as it entails the delivery of shares to the beneficiaries.
As indicated in section a.ii of this note, 60 % of the variable remuneration amount is deferred over five years for executive directors, to be paid, where appropriate, in five portions, provided that the conditions of permanence in the Group, according to the following accrual scheme:
•The accrual of the first and second parts (instalments in 2025 and 2026) is conditional on none of the malus clauses being triggered.
•The accrual of the third, fourth and fifth parts (instalments in 2027, 2028 and 2029) is linked to non-concurrence of malus clauses and the fulfilment of certain objectives related to the 2022‑ 2025 period. These objectives and their respective weights are:
–Banco Santander’s consolidated Return on tangible equity (RoTE) target in 2025 (weight of 40 %).
–Relative performance of Banco Santander's total shareholder return (TSR) in 2023-2025 in respect of the weighted TSR of a peer group comprising 9 credit institutions, with the appropriate TSR ratio based on the group’s TSR among its peers (weight of 40 %).
–Four ESG (environmental, social and governance) metrics. Each of the four Responsible banking targets have the same weighting (and total weight of ESG objective, 20 %).
The degree of compliance with the above objectives determines the percentage to be applied to the deferred amount in these three annuities, with a maximum achievement ratio of 125 %, so executives have the incentive to exceed their targets.
Both the immediate (short-term) and each of the deferred (long-term and conditioned) portions are paid 50 % in cash and the remaining 50 % in instruments.
591
The accrual of deferred amounts (whether or not subject to performance measures) is conditioned, in addition to the permanence of the beneficiary in the Group, to non-occurrence, during the period prior to each of the deliveries, of any the circumstances giving rise to the application of malus as set out in the Group’s remuneration policy in its chapter related to malus and clawback. Likewise, the amounts already paid of the incentive will be subject to clawback by the Bank in the cases and during the term foreseen in said policy, and in accordance with the terms and conditions foreseen in it.
Malus and clawback clauses are triggered by poor financial performance of Banco Santander, a division or area, or exposures from staff as a result of an executive(s)’s management of, at least, one of these factors:
(i)Significant failures in risk management committed by the entity, or by a business unit or risk control.
(ii)The increase suffered by the entity or by a business unit of its capital needs, not foreseen at the time of generation of the exposures.
(iii)Regulatory sanctions or judicial sentences from events that could be attributable to the unit or the personnel responsible for those. Also, the breach of internal codes of conduct of the entity.
(iv)Irregular conduct, whether individual or collective. In this regard, the negative effects derived from the marketing of inappropriate products and the responsibilities of the people or bodies that made those decisions will be specially considered.
In addition to the existing policy on malus and clawback clauses of our remuneration policy, the board of directors of Banco Santander at its meeting held on 28 November 2023, following the proposal from the remuneration committee on 27 November 2023, approved an addendum to our remuneration policy to comply with new SEC (US Securities and Exchange Commission) regulations relating to the recoupment of compensation erroneously received by the executive directors of Banco Santander, S.A. and senior management (according to the regulation) in the event of a financial restatement, as defined under the rule, resulting from material noncompliance with financial reporting requirements under federal securities laws. The new addendum to our remuneration policy, entitled "Financial Statement Restatement Compensation", is included as an exhibit to our Annual Report on Form 20-F report filed with the SEC.
Effective from 2023 variable remuneration plan, the maximum number of shares to be delivered is calculated by taking into account the average weighted daily volume of the average weighted listing prices corresponding to the fifty trading sessions prior to the previous Friday (excluded) to the date on which the bonus is agreed by the board of executive directors of the Bank.
iii) Shares assigned by deferred variable remuneration plans
The following table shows the number of Santander shares assigned to each director already in service and pending delivery as of 1 January 2022, 31 December 2022 and 31 December 2023, as well as the gross shares that were delivered to them in 2022 and 2023, either in the form of an immediate payment or a deferred payment. In this case after having been appraised by the board, at the proposal of the remuneration committee, that the corresponding one-fifth of each plan had accrued. They come from the deferred conditional and linked to multi-year objectives in 2017, 2018, 2019, 2020, 2021, 2022 and 2023 were formalized.
592
| Share-based variable remuneration | |||||||||||||||||||||||
| Maximum number of shares to be delivered at January 1,2022 | Shares delivered in 2022 (immediate payment 2021 variable remuneration) | Shares delivered in 2022 (deferred payment 2020 variable remuneration) | Shares delivered in 2022 (deferred payment 2019 variable remuneration) | Shares delivered in 2022 (deferred payment 2018 variable remuneration) | Shares delivered in 2022 (deferred payment 2017 variable remuneration) | Variable remuneration 2022 (Maximum number of shares to be delivered) | |||||||||||||||||
| 2017 variable remuneration | |||||||||||||||||||||||
| Ana Botín | — | — | — | — | ( | — | |||||||||||||||||
| José Antonio Álvarez | — | — | — | — | ( | — | |||||||||||||||||
| ( | |||||||||||||||||||||||
| 2018 variable remuneration | |||||||||||||||||||||||
| Ana Botín | — | — | — | ( | — | — | |||||||||||||||||
| José Antonio Álvarez | — | — | — | ( | — | — | |||||||||||||||||
| ( | |||||||||||||||||||||||
| 2019 variable remuneration | |||||||||||||||||||||||
| Ana Botín | — | — | ( | — | — | — | |||||||||||||||||
| José Antonio Álvarez | — | — | ( | — | — | — | |||||||||||||||||
| ( | |||||||||||||||||||||||
| 2020 variable remuneration | |||||||||||||||||||||||
| Ana Botín | — | ( | — | — | — | — | |||||||||||||||||
| José Antonio Álvarez | — | ( | — | — | — | — | |||||||||||||||||
| ( | |||||||||||||||||||||||
| 2021 variable remuneration | |||||||||||||||||||||||
| Ana Botín | ( | — | — | — | — | — | |||||||||||||||||
| José Antonio Álvarez | ( | — | — | — | — | — | |||||||||||||||||
| ( | |||||||||||||||||||||||
| 2022 variable remuneration | |||||||||||||||||||||||
| Ana Botín | — | — | — | — | — | — | |||||||||||||||||
| José Antonio Álvarez | — | — | — | — | — | — | |||||||||||||||||
2023 variable remuneration1 | |||||||||||||||||||||||
| Ana Botín | — | — | — | — | — | — | — | ||||||||||||||||
| Héctor Grisi | — | — | — | — | — | — | — | ||||||||||||||||
1.For each director, 40 % of the shares indicated correspond to the short-term variable (or immediate payment). The remaining 60 % is deferred for delivery, where appropriate, by fifths in the next five years , the last three being subject to the fulfilment of multiannual objectives.
593
| Maximum number of shares to be delivered at December 31, 2022 | Instruments matured but not consolidated at January 1, 20232 | Shares delivered in 2023 (immediate payment 2022 variable remuneration) | Shares delivered in 2023 (deferred payment 2021 variable remuneration) | Shares delivered in 2023 (deferred payment 2020 variable remuneration) | Shares delivered in 2023 (deferred payment 2019 variable remuneration) | Shares delivered in 2023 (deferred payment 2018 variable remuneration) | Shares delivered in 2023 (deferred payment 2017 variable remuneration) | Variable remuneration 2023 (Maximum number of shares to be delivered) | Maximum number of shares to be delivered at December 31, 2023 | ||||||||||||||||||||
| — | — | — | — | — | — | ( | — | — | |||||||||||||||||||||
| — | — | — | — | — | — | ( | — | — | |||||||||||||||||||||
| ( | |||||||||||||||||||||||||||||
| — | — | — | — | — | ( | — | — | ||||||||||||||||||||||
| — | — | — | — | — | ( | — | — | ||||||||||||||||||||||
| ( | |||||||||||||||||||||||||||||
| ( | — | — | — | ( | — | — | — | ||||||||||||||||||||||
| ( | — | — | — | ( | — | — | — | ||||||||||||||||||||||
| ( | ( | ||||||||||||||||||||||||||||
| — | — | — | ( | — | — | — | — | ||||||||||||||||||||||
| — | — | — | ( | — | — | — | — | ||||||||||||||||||||||
| ( | |||||||||||||||||||||||||||||
| — | — | ( | — | — | — | — | — | ||||||||||||||||||||||
| — | — | ( | — | — | — | — | — | ||||||||||||||||||||||
| ( | |||||||||||||||||||||||||||||
| — | ( | — | — | — | — | — | — | ||||||||||||||||||||||
| — | ( | — | — | — | — | — | — | ||||||||||||||||||||||
| ( | |||||||||||||||||||||||||||||
| — | — | — | — | — | — | — | — | ||||||||||||||||||||||
| — | — | — | — | — | — | — | — | ||||||||||||||||||||||
2.The levels of achievement of the multi-year metrics of the long-term variable remuneration plans:
1) Fifth cycle of the deferred multi-year objectives variable remuneration plan (2020):83.3 % of achievement for the period 2020-2022.
a. CET1 metric at100 % of achievement for 2022 year-end period (target 12.00 %). Weight of 33.3 %.
b. Underlying BPA growth at150 % of achievement (target growth of 10 %). Weight of 33.3 %.
c. TSR metric at0 % of achievement (minimum target of 33 % not reached). Weight of 33.3 %.
2) Fourth cycle of the deferred multi-year objectives variable remuneration plan (2019):33.3 % of achievement for the period 2019-2021.
a. CET1 metric at100 % of achievement for 2021 year-end period (target 12.00 %). Weight of 33.3 %.
b. Underlying BPA growth at0 % of achievement (target growth of 15 %). Weight of 33.3 %.
c. TSR metric at0 % of achievement (minimum target of 33 % not reached). Weight of 33.3 %.
3) Third cycle of the deferred multi-year objectives variable remuneration plan (2018):33.3 % of achievement for the period 2018-2020.
a. CET1 metric at100 % of achievement for 2020 year-end period (target 11.30 %). Weight of 33.3 %.
b. Underlying BPA growth at0 % of achievement (target growth of 25 %). Weight of 33.3 %.
c. TSR metric at0 % of achievement (minimum target of 33 % not reached). Weight of 33.3 %.
1) Fifth cycle of the deferred multi-year objectives variable remuneration plan (2020):
a. CET1 metric at
b. Underlying BPA growth at
c. TSR metric at
2) Fourth cycle of the deferred multi-year objectives variable remuneration plan (2019):
a. CET1 metric at
b. Underlying BPA growth at
c. TSR metric at
3) Third cycle of the deferred multi-year objectives variable remuneration plan (2018):
a. CET1 metric at
b. Underlying BPA growth at
c. TSR metric at
Furthermore, the maximum number of RSUs of PagoNxt, S.L. to be delivered under the current plan is 9,529 and 8,005 units for Ana Botín and Héctor Grisi, respectively.
594
In addition, the table below shows the cash delivered in 2023 and 2022, by way of either immediate payment or deferred payment, in the latter case once the Board had determined, at the proposal of the remuneration committee, that one-fifth relating to each plan had accrued:
| EUR thousand | |||||||||||||||||
| 2023 | 2022 | ||||||||||||||||
| Cash paid (immediate payment 2022 variable remuneration) | Cash paid (deferred payments from 2021, 2020, 2019 and 2018 variable remuneration) | Cash paid (immediate payment 2021 variable remuneration) | Cash paid (deferred payments from 2020, 2019, 2018 and 2017 variable remuneration) | ||||||||||||||
| Ana Botín | |||||||||||||||||
| Héctor Grisi | |||||||||||||||||
| José Antonio Álvarez | |||||||||||||||||
| Total | |||||||||||||||||
iv) Information on former members of the board of directors
The chart below includes information on the maximum number of shares to which former members of the board of directors, are entitled for their participation in the various deferred variable remuneration systems, which instrumented a portion of their variable remuneration relating to the years in which they were executive directors. Also set forth below is information on the deliveries, whether in shares or in cash, made in 2023 and 2022 to former board members, upon achievement of the conditions for the receipt thereof (see note 46):
| Maximum number of shares to be delivered | ||||||||
| 2023 | 2022 | |||||||
| Deferred conditional variable remuneration plan and linked to objectives (2016) | ||||||||
| Deferred conditional variable remuneration plan and linked to objectives (2017) | ||||||||
| Deferred conditional variable remuneration plan and linked to objectives (2018) | ||||||||
| Deferred conditional variable remuneration plan and linked to objectives (2019) | ||||||||
| Deferred conditional variable remuneration plan and linked to objectives (2020) | ||||||||
| Deferred conditional variable remuneration plan and linked to objectives (2021) | ||||||||
| Deferred conditional variable remuneration plan and linked to objectives (2022) | ||||||||
| Number of shares delivered | ||||||||
| 2023 | 2022 | |||||||
| Deferred conditional variable remuneration plan and linked to objectives (2016) | ||||||||
| Deferred conditional variable remuneration plan and linked to objectives (2017) | ||||||||
| Deferred conditional variable remuneration plan and linked to objectives (2018) | ||||||||
| Deferred conditional variable remuneration plan and linked to objectives (2019) | ||||||||
| Deferred conditional variable remuneration plan and linked to objectives (2020) | ||||||||
| Deferred conditional variable remuneration plan and linked to objectives (2021) | ||||||||
| Deferred conditional variable remuneration plan and linked to objectives (2022) | ||||||||
In addition, EUR 1,417 thousand and EUR 2,759 thousand relating to the deferred portion payable in cash of the aforementioned plans were paid each in 2023 and 2022.
595
f) Loans
Grupo Santander’s direct risk exposure to the bank’s directors and the guarantees provided for them are detailed below. These transactions were made on terms equivalent to those that prevail in arm’s-length transactions or the related compensation in kind was recognized:
| EUR thousand | |||||||||||||||||||||||
| 2023 | 2022 | ||||||||||||||||||||||
| Loans and credits | Guarantees | Total | Loans and credits | Guarantees | Total | ||||||||||||||||||
| Ana Botín | |||||||||||||||||||||||
| José Antonio Álvarez | |||||||||||||||||||||||
| Bruce Carnegie-Brown | |||||||||||||||||||||||
| Javier Botín | |||||||||||||||||||||||
| Sol Daurella | |||||||||||||||||||||||
| Belén Romana | |||||||||||||||||||||||
| Ramiro Mato | |||||||||||||||||||||||
| Homaira Akbari | |||||||||||||||||||||||
| Henrique de Castro | |||||||||||||||||||||||
| Pamela Walkden | |||||||||||||||||||||||
| Luis Isasi | |||||||||||||||||||||||
Sergio Rial1 | |||||||||||||||||||||||
| Héctor Grisi | |||||||||||||||||||||||
| Gina Díez Barroso | |||||||||||||||||||||||
| Glenn Hutchins | |||||||||||||||||||||||
| Germán de la Fuente | |||||||||||||||||||||||
1. Ceased as director of Banco Santander, S.A. on 1 January 2023
g) Senior management
The table below includes the amounts relating to the short-term remuneration of the members of senior management at 31 December 2023 and those at 31 December 2022, excluding the remuneration of the executive directors, which is detailed above. This amount has been reduced by 38 % compared to that reported in 2014 (EUR 80,792 thousand):
| EUR thousand | ||||||||||||||||||||||||||||||||
| Short-term salaries and deferred remuneration | ||||||||||||||||||||||||||||||||
| Variable remuneration (bonus) - Immediate payment | Deferred variable remuneration | |||||||||||||||||||||||||||||||
| Year | Number of persons | Fixed | In cash | In instruments2 | In cash | In instruments3 | Pensions | Other remuneration1 | Total | |||||||||||||||||||||||
| 2023 | ||||||||||||||||||||||||||||||||
| 2022 | ||||||||||||||||||||||||||||||||
1. Includes other remuneration items such as life and medical insurance premiums and localization aids and lastly RSUs from PagoNxt S.L., for his work as a director in said entity.
2. The amount of immediate payment for 2023 is 1,567,930 shares and 1,386,491 share options (2,504,000 Santander shares in 2022).
3. The deferred amount in instruments not linked to long-term objectives for 2023 is 700,305 shares and 554,597 share options ( 1,101,000 Santander shares in 2022).
The board of directors approved the 2023 Digital Transformation Incentive which is a variable remuneration scheme which delivers PagoNxt, S.L. RSUs and premium priced options (PPOs), and is aimed at up to 50 employees whose roles are considered key to PagoNxt’s success, including 1 senior executive who will receive EUR 200 thousand.
See note 46 to the 2023 Group's consolidated financial statements for further information on the Digital Transformation Incentive.
In 2023, the ratio of variable to fixed pay components was 120 % of the total for senior managers, well within the maximum limit of 200 % set by 2023 AGM.
596
Also, the detail of the breakdown of the remuneration linked to long-term objectives of the members of senior management at 31 December 2023 and 31 December 2022 is provided below. These remuneration payments shall be received, as the case may be, in the corresponding deferral periods, upon achievement of the conditions stipulated for each payment (see note 46):
| EUR thousand | ||||||||||||||
Variable remuneration subject to long-term objectives1 | ||||||||||||||
| Year | Number of people | Cash payment | Instrument payment | Total | ||||||||||
| 2023 | ||||||||||||||
| 2022 | ||||||||||||||
1. Relates to the fair value of the maximum annual amounts for years 2027, 2028 and 2029 of the eighth cycle of the deferred conditional variable remuneration plan (2026, 2027 and 2028 for the seventh cycle of the deferred variable compensation plan linked to annual objectives for the year 2022).
Additionally, members of senior management who stepped down from their roles in 2023 consolidated salary remuneration and other remuneration for a total amount of EUR 3,560 thousand (EUR 3,691 thousand in 2022). In 2023 they did not generate any right regarding variable pay subject to long-term objectives (this right has been generated in 2022 for a total amount of EUR 447 thousand).
The maximum number of Santander shares that the members of senior management at each plan grant date (excluding executive directors) were entitled to receive as of 31 December 2023 and 31 December 2022 relating to the deferred portion under the various plans then in force is the following (see note 46):
| Maximum number of shares to be delivered | ||||||||
| 2023 | 2022 | |||||||
| Deferred conditional variable remuneration plan and linked to objectives (2016) | ||||||||
| Deferred conditional variable remuneration plan and linked to objectives (2017) | ||||||||
| Deferred conditional variable remuneration plan and linked to objectives (2018) | ||||||||
| Deferred conditional variable remuneration plan and linked to objectives (2019) | ||||||||
| Deferred conditional variable remuneration plan and linked to objectives (2020) | ||||||||
| Deferred conditional variable remuneration plan and linked to objectives (2021) | ||||||||
| Deferred conditional variable remuneration plan and linked to objectives (2022) | ||||||||
Since the conditions established in the corresponding deferred share-based remuneration schemes for prior years had been met, the following number of Santander shares was delivered in 2023 and 2022 to the senior management, in addition to the payment of the related cash amounts:
| Number of shares delivered | ||||||||
| 2023 | 2022 | |||||||
| Deferred conditional variable remuneration plan and linked to objectives (2016) | ||||||||
| Deferred conditional variable remuneration plan and linked to objectives (2017) | ||||||||
| Deferred conditional variable remuneration plan and linked to objectives (2018) | ||||||||
| Deferred conditional variable remuneration plan and linked to objectives (2019) | ||||||||
| Deferred conditional variable remuneration plan and linked to objectives (2020) | ||||||||
| Deferred conditional variable remuneration plan and linked to objectives (2021) | ||||||||
| Deferred conditional variable remuneration plan and linked to objectives (2022) | ||||||||
As indicated in note 5.c above, senior management participate in the benefit system created in 2012, which covers the contingencies of retirement, disability and death. Banco Santander makes annual contributions to the benefit plans of its senior managers. In 2012, the contracts of the senior managers with benefit pension commitments were amended to transform them into a contribution system. The system, which is outsourced to Santander Seguros y Reaseguros, Compañía Aseguradora, S.A., gives senior managers the right to receive benefits upon retirement, regardless of whether or not they are active at Banco Santander at such time, based on contributions to the system. This new system replaced their previous right to receive a pension supplement in the event of retirement. In the event of pre-retirement, and up to the retirement date, senior managers appointed prior to September 2015 are entitled to receive an annual allowance.
In addition, further to applicable remuneration regulations, from 2016 (inclusive), a discretionary pension benefit component of at least 15 % of total remuneration in contributions to the pension system has been included. Under the regime corresponding to these discretionary benefits, the contributions that are calculated on variable remunerations are subject to malus and clawback clauses, subject to policies applicable at each time, and during the same period in which the variable remuneration is deferred.
Likewise, the annual contributions calculated on variable remunerations must be invested in Bank shares for a period of five years from the date that the senior manager leaves the Group, regardless of whether or not they leave to retire. Once that period has elapsed, the amount invested in shares will be reinvested, along with the remainder of the cumulative balance corresponding to the senior manager, or it will be paid to the senior manager or to their beneficiaries in the event of a contingency covered by the benefits system.
597
The contracts of some members of senior management were modified at the beginning of 2018 with the same objective and changes indicated in section c of this note for Ana Botín. The modifications, which are aimed at aligning the annual contributions with the practices of comparable institutions and reducing the risk of future obligations by eliminating the supplementary scheme for death (widowhood and orphanhood) and permanent disability in service without increasing the costs to the bank, are as follows:
•Contributions to the pensionable bases were reduced. Gross annual salaries were increased in the corresponding amount.
•The death and disability supplementary benefits were eliminated since 1 January 2018 for some members of senior management and since 1 April 2018 for executive directors. A fixed remuneration supplement reflected in other remuneration in the table above was implemented on the same date.
•The amounts insured for life and accident insurance were increased.
All of the above was done without an increase in total cost for the Bank.
The balance as of 31 December 2023 in the pension system for those who were part of senior management at year end amounted to EUR 57 million (EUR 54 million at 31 December 2022).
The net charge to income corresponding to pension amounted to EUR 4.7 million in 2023 (EUR 5.3 million in 31 December 2022).
In 2023 and 2022 there have been no
Additionally, the capital insured by life and accident insurance at 31 December 2023 of this group amounts to EUR 84.4 million (EUR 98 million at 31 December 2022).
h) Post-employment benefits to former directors and former senior executive vice presidents
The post-employment benefits and settlements paid in 2023 to former directors of the Bank, other than those detailed in note 5.c amounted to EUR 5.6 million and EUR 5.6 million in 2022, respectively. Also, the post-employment benefits and settlements paid in 2023 to former executive vice presidents amounted to EUR 15 million and EUR 4.8 million in 2022, respectively.
Contributions to insurance policies that hedge pensions to previous members of the Bank’s board of directors, amounted to EUR 0.17 million in 2023 (EUR 0.17 million in 2022). Likewise, contributions to insurance policies that hedge pensions for previous senior managers amounted to EUR 3.3 million in 2023 (EUR 3.1 million in 2022).
During the 2023 financial year, no releases or charges were recorded in the consolidated income statement for pension commitments and similar obligations held by the Group with previous former members of the bank's board of directors or former members of senior management in 2023 and 2022.
In addition, 'Provisions - Pension Fund and similar obligations' in the consolidated balance sheet as at 31 December 2023 included EUR 46 million in respect of the post-employment benefit obligations to former Directors of the Bank (EUR 48 million at 31 December 2022) and EUR 88 million corresponding to former members of senior management (EUR 99 million at 31 December 2022).
i) Pre-retirement and retirement
The board of directors approved an amendment to the contracts of executive directors whereby they ceased to have the right to pre-retire in case of termination of his contract.
j) Contract termination
The executive directors and members of senior management have indefinite-term employment contracts. Executive directors or senior managers whose contracts are terminated voluntarily or due to breach of duties are not entitled to receive any economic compensation. If Banco Santander terminates the contract for any other reason, they will be entitled to the corresponding legally-stipulated termination benefit, without prejudice to any compensation that may for non-competition obligations, as detailed in the directors' remuneration policy.
If Banco Santander were to terminate her contract, Ana Botín would have to remain at Banco Santander’s disposal for a period of 4 months in order to ensure an adequate transition, and would receive her fixed salary during that period.
k) Information on investments held by the directors in other companies and conflicts of interest
None of the members of the board of directors have declared that they or persons related to them may have a direct or indirect conflict of interest with the interests of Banco Santander, S.A., as set forth in article 229 of the Corporate Enterprises Act.
598
6. Loans and advances to central banks and credit institutions
The detail, by classification, type and currency, of Loans and advances to central banks and credit institutions in the consolidated balance sheets is as follows:
| EUR million | |||||||||||
| 2023 | 2022 | 2021 | |||||||||
| CENTRAL BANKS | |||||||||||
| Classification | |||||||||||
| Financial assets held for trading | |||||||||||
| Non-trading financial assets mandatorily at fair value through profit or loss | |||||||||||
| Financial assets designated at fair value through profit or loss | |||||||||||
| Financial assets designated at fair value through other comprehensive income | |||||||||||
| Financial assets at amortised cost | |||||||||||
| Type | |||||||||||
| Time deposits | |||||||||||
| Reverse repurchase agreements | |||||||||||
| Impaired assets | |||||||||||
| Valuation adjustments for impairment | |||||||||||
| CREDIT INSTITUTIONS | |||||||||||
| Classification | |||||||||||
| Financial assets held for trading | |||||||||||
| Non-trading financial assets mandatorily at fair value through profit or loss | |||||||||||
| Financial assets designated at fair value through profit or loss | |||||||||||
| Financial assets designated at fair value through other comprehensive income | |||||||||||
| Financial assets at amortised cost | |||||||||||
| Type | |||||||||||
| Time deposits | |||||||||||
| Reverse repurchase agreements | |||||||||||
| Non- loans advances | |||||||||||
| Impaired assets | |||||||||||
| Valuation adjustments for impairment | ( | ( | ( | ||||||||
| CURRENCY | |||||||||||
| Euro | |||||||||||
| Pound sterling | |||||||||||
| US dollar | |||||||||||
| Brazilian real | |||||||||||
| Other currencies | |||||||||||
| TOTAL | |||||||||||
The loans and advances to credit institutions classified under 'Financial assets at amortised' cost are mainly time accounts and deposits.
Note 51 contains a detail of their residual maturity periods.
This line item also includes irrevocable payment commitments to the Single Resolution Fund made in accordance with article 70.3 of Regulation 806/2014, which establishes uniform rules and a uniform procedure for the resolution of credit institutions and certain security service companies. investment within the framework of a Single Resolution Mechanism and a Single Resolution Fund, for which, in accordance with the standard, no provision has been recorded, these commitments have not been significant regarding the consolidated annual accounts.
At 31 December 2023 the gross exposure by impairment stage of the assets accounted subject to impairment for amounts to EUR 78,321 million, EUR 0 million and EUR 0 million (EUR 61,898 , EUR 1 million and EUR 0 million in 2022 and EUR 54,833 million, EUR 0 million and EUR 1 million in 2021), and the loan loss provision by impairment stage amounts to EUR 9 million, EUR 0 million and EUR 0 million (EUR 6 million, EUR 0 million and EUR 0 million in 2022 and EUR 8 million, EUR 0 million and EUR 0 million in 2021) in stage 1, stage 2 and stage 3, respectively.
599
7. Debt securities
a) Detail
The detail, by classification, type and currency, of Debt securities in the consolidated balance sheets is as follows:
| EUR million | |||||||||||
| 2023 | 2022 | 2021 | |||||||||
| Classification | |||||||||||
| Financial assets held for trading | |||||||||||
| Non-trading financial assets mandatorily at fair value through profit or loss | |||||||||||
| Financial assets designated at fair value through profit or loss | |||||||||||
| Financial assets designated at fair value through other comprehensive income | |||||||||||
| Financial assets at amortised cost | |||||||||||
| Type | |||||||||||
| Spanish government debt securities | |||||||||||
| Foreign government debt securities | |||||||||||
| Issued by financial institutions | |||||||||||
| Other fixed-income securities | |||||||||||
| Impaired financial assets | |||||||||||
| Impairment losses | ( | ( | ( | ||||||||
| Currency | |||||||||||
| Euro | |||||||||||
| Pound sterling | |||||||||||
| US dollar | |||||||||||
| Brazilian real | |||||||||||
| Other currencies | |||||||||||
| Debt securities excluding impairment adjustments | |||||||||||
| Impairment losses | ( | ( | ( | ||||||||
The increase in the year of the debt securities portfolio under the heading 'Financial assets at fair value with changes in other comprehensive income' is mainly due to the increase in exposure in sovereign debt portfolio.
Likewise, the increase in the debt securities portfolio under the heading 'Financial assets at amortized cost' is due to the continuation of the strategy started in the previous year in which two new business models were created for the optimization of excess liquidity and the management of the maturity of the balance sheet credit and deposit portfolios.
At 31 December 2023, 2022 and 2021 the gross exposure by impairment stage of the book assets amounted to EUR 176,697 million, EUR 148,384 million and EUR 133,437 million in stage 1; EUR 203 million, EUR 75 million and EUR 128 million in stage 2, and EUR 461 million, EUR 404 million and EUR 280 million in stage 3, respectively.
In addition, at 31 December 2023, the Group had EUR 49 million of exposure in assets purchased with impairments, which correspond mainly to the business combinations carried out by the Group with any additional impairment signs.
600
b) Breakdown
The breakdown, by origin of the issuer, of debt securities at 31 December 2023, 2022 and 2021, net of impairment losses, is as follows:
| EUR million | ||||||||||||||||||||||||||||||||||||||||||||
| 2023 | 2022 | 2021 | ||||||||||||||||||||||||||||||||||||||||||
| Private fixed-income | Public fixed-income | Total | % | Private fixed-income | Public fixed-income | Total | % | Private fixed-income | Public fixed-income | Total | % | |||||||||||||||||||||||||||||||||
| Spain | % | % | % | |||||||||||||||||||||||||||||||||||||||||
| United Kingdom | % | % | % | |||||||||||||||||||||||||||||||||||||||||
| Portugal | % | % | % | |||||||||||||||||||||||||||||||||||||||||
| Italy | % | % | % | |||||||||||||||||||||||||||||||||||||||||
| Ireland | % | % | % | |||||||||||||||||||||||||||||||||||||||||
| Poland | % | % | % | |||||||||||||||||||||||||||||||||||||||||
| Other European countries | % | % | % | |||||||||||||||||||||||||||||||||||||||||
| United States | % | % | % | |||||||||||||||||||||||||||||||||||||||||
| Brazil | % | % | % | |||||||||||||||||||||||||||||||||||||||||
| Mexico | % | % | % | |||||||||||||||||||||||||||||||||||||||||
| Chile | % | % | % | |||||||||||||||||||||||||||||||||||||||||
| Other American countries | % | % | % | |||||||||||||||||||||||||||||||||||||||||
| Rest of the world | % | % | % | |||||||||||||||||||||||||||||||||||||||||
| % | % | % | ||||||||||||||||||||||||||||||||||||||||||
The detail, by issuer rating, of Debt securities at 31 December 2023, 2022 and 2021 is as follows:
| EUR million | ||||||||||||||||||||||||||||||||||||||||||||
| 2023 | 2022 | 2021 | ||||||||||||||||||||||||||||||||||||||||||
| Private fixed-income | Public fixed-income | Total | % | Private fixed-income | Public fixed-income | Total | % | Private fixed-income | Public fixed-income | Total | % | |||||||||||||||||||||||||||||||||
| AAA | % | % | % | |||||||||||||||||||||||||||||||||||||||||
| AA | % | % | % | |||||||||||||||||||||||||||||||||||||||||
| A | % | % | % | |||||||||||||||||||||||||||||||||||||||||
| BBB | % | % | % | |||||||||||||||||||||||||||||||||||||||||
| Below BBB | % | % | % | |||||||||||||||||||||||||||||||||||||||||
| Unrated | % | % | % | |||||||||||||||||||||||||||||||||||||||||
| % | % | % | ||||||||||||||||||||||||||||||||||||||||||
During 2023, 2022 and 2021, the distribution of the exposure by rating level of the previous table has not been affected by ratings reviews of the sovereign issuers.
601
The detail, by type of financial instrument, of private fixed-income securities at 31 December 2023, 2022 and 2021, net of impairment losses, is as follows:
| EUR million | |||||||||||
| 2023 | 2022 | 2021 | |||||||||
| Securitised mortgage bonds | |||||||||||
| Other asset-backed bonds | |||||||||||
| Floating rate debt | |||||||||||
| Fixed rate debt | |||||||||||
| Total | |||||||||||
c) Impairment losses
The changes in the impairment losses on debt securities are summarised below:
| EUR million | |||||||||||
| 2023 | 2022 | 2021 | |||||||||
| Balance at beginning of year | |||||||||||
Net impairment losses for the yearA | |||||||||||
| Of which: | |||||||||||
| Impairment losses charged to income | |||||||||||
| Impairment losses reversed with a credit to income | ( | ( | ( | ||||||||
| Exchange differences and other items | ( | ( | |||||||||
| Balance at end of year | |||||||||||
| Of which: | |||||||||||
| By geographical location of risk: | |||||||||||
| European Union | |||||||||||
| Latin America | |||||||||||
A.Of the EUR 24 million corresponding to net provisions for the year ended 31 December 2023 (EUR 16 million and EUR 28 million at 31 December 2022 and 2021, respectively), EUR 23 million relates to financial assets at amortized cost (EUR 17 million and EUR 31 million at 31 December 2022 and 2021, respectively) and EUR 1 million relates to financial assets designated at fair value through other comprehensive income (EUR -1 million and EUR -3 million at 31 December 2022 and 2021, respectively).
At 31 December 2023, 2022 and 2021 the loan loss provision by impairment stage of the assets accounted for under IFRS9 amounted to EUR 30 million, EUR 25 million and EUR 26 million in stage 1, EUR 8 million, EUR 2 million and EUR 8 million in stage 2, and EUR 248 million, EUR 199 million and EUR 181 million in stage 3, respectively.
8. Equity instruments
a) Breakdown
The detail, by classification and type, of Equity instruments in the consolidated balance sheets is as follows:
| EUR million | |||||||||||
| 2023 | 2022 | 2021 | |||||||||
| Classification | |||||||||||
| Financial assets held for trading | |||||||||||
| Non-trading financial assets mandatorily at fair value through profit or loss | |||||||||||
| Financial assets designated at fair value through other comprehensive income | |||||||||||
| Type | |||||||||||
| Shares of Spanish companies | |||||||||||
| Shares of foreign companies | |||||||||||
| Shares of investment funds | |||||||||||
Note 29 contains a detail of the 'Other comprehensive income', recognised in equity, on 'Financial assets designated at fair value through other comprehensive income'.
b) Changes
The changes in 'Financial assets at fair value through other comprehensive income' were as follows:
| EUR million | |||||||||||
| 2023 | 2022 | 2021 | |||||||||
| Balance at beginning of the year | |||||||||||
| Net additions (disposals) | ( | ( | |||||||||
Changes in the fair value of equity instruments measured at fair value through other comprehensive income (EIGR)A | ( | ( | ( | ||||||||
| Changes in the RV hedged with micro-hedging transactions | ( | ||||||||||
| Balance at end of year | |||||||||||
A.They do not include fair value movements for currency risk hedged with hedging instruments.
c) Notifications of acquisitions of investments
The notifications of the acquisitions and disposals of holdings in investees made by the Bank in 2023, in compliance with Article 155 of the Spanish Limited Liability Companies Law and Article 105 of Spanish Securities Market Law 24/1998, are listed in appendix IV.
602
9. Trading derivatives (assets and liabilities) and short positions
a) Trading Derivatives
The detail, by type of inherent risk, of the fair value of the trading derivatives arranged by the Group is as follows (see note 11):
| EUR million | ||||||||||||||||||||
| 2023 | 2022 | 2021 | ||||||||||||||||||
| Debit balance | Credit balance | Debit balance | Credit balance | Debit balance | Credit balance | |||||||||||||||
| Interest rate risk | ||||||||||||||||||||
| Currency risk | ||||||||||||||||||||
| Price risk | ||||||||||||||||||||
| Other risks | ||||||||||||||||||||
b) Short positions
Following is a breakdown of the short positions (liabilities):
| EUR million | |||||||||||
| 2023 | 2022 | 2021 | |||||||||
| Borrowed securities | |||||||||||
| Debt instruments | |||||||||||
| Of which: | |||||||||||
| Banco Santander México, S.A., Institución de Banca Múltiple, Grupo Financiero Santander México | |||||||||||
| Banco Santander, S.A. | |||||||||||
| Equity instruments | |||||||||||
| Of which: | |||||||||||
| Banco Santander, S.A. | |||||||||||
| Short sales | |||||||||||
| Debt instruments | |||||||||||
| Of which: | |||||||||||
| Banco Santander, S.A. | |||||||||||
| Banco Santander (Brasil) S.A. | |||||||||||
| Santander US Capital Markets LLC | |||||||||||
10. Loans and advances to customers
a) Detail
The detail, by classification, of Loans and advances to customers in the consolidated balance sheets is as follows:
| EUR million | |||||||||||
| 2023 | 2022 | 2021 | |||||||||
| Financial assets held for trading | |||||||||||
| Non-trading financial assets mandatorily at fair value through profit or loss | |||||||||||
| Financial assets designated at fair value through profit or loss | |||||||||||
| Financial assets at fair value through other comprehensive income | |||||||||||
| Financial assets at amortized cost | |||||||||||
| Of which: | |||||||||||
| Impairment losses | ( | ( | ( | ||||||||
| Loans and advances to customers disregarding impairment losses | |||||||||||
Note 51 contains a detail of the residual maturity periods of 'Financial assets at amortized cost'.
Note 54 shows the Group’s total exposure, by geographical origin of the issuer.
There are no loans and advances to customers for material amounts without fixed maturity dates.
603
b) Breakdown
Following is a breakdown of the loans and advances granted to the Group's customers, which reflect the Group's exposure to credit risk in its main activity, without considering the balance of value adjustments for impairment, taking into account the type and situation of the transactions, the geographical area of their residence and the type of interest rate on the transactions:
| EUR million | |||||||||||
| 2023 | 2022 | 2021 | |||||||||
| Loan type and status | |||||||||||
| Commercial credit | |||||||||||
| Secured loans | |||||||||||
| Reverse repurchase agreements | |||||||||||
| Other term loans | |||||||||||
| Finance leases | |||||||||||
| Receivable on demand | |||||||||||
| Credit cards receivables | |||||||||||
| Impaired assets | |||||||||||
| Geographical area | |||||||||||
| Spain | |||||||||||
| European Union (excluding Spain) | |||||||||||
| United States and Puerto Rico | |||||||||||
Other OECD countriesA | |||||||||||
| South America (non - OECD) | |||||||||||
| Rest of the world | |||||||||||
| Interest rate formula | |||||||||||
| Fixed rate | |||||||||||
| Floating rate | |||||||||||
A.Includes, mainly, customers from the United Kingdom.
At 31 December 2023, 2022 and 2021 the Group had granted loans amounting to EUR 15,544 million, EUR 14,698 million and EUR 14,131 million to Spanish public sector agencies which had a rating at 31 December 2023 of A (ratings of A at 31 December 2022 and 31 December 2021), and EUR 11,530 million, EUR 12,467 million, and EUR 10,263 million to the public sector in other countries (at 31 December 2023, the breakdown of this amount by issuer rating was as follows: 3.2 % AAA, 15.7 % AA, 1 % A, 69.5 % BBB, 8.9 % below BBB and 1.7 % without rating).
Without considering the public administrations, the amount of the loans and advances at 31 December 2023, 2022 and 2021 amounts to EUR 1,032,063 million, EUR 1,031,523 million and EUR 971,252 million, of which, EUR 998,010 million, EUR 998,689 million and EUR 939,645 million are classified as performing, respectively.
604
Following is a detail, by activity, of the loans to customers at 31 December 2023, net of impairment losses:
| EUR million | ||||||||||||||||||||||||||||||||
| Secured loans | ||||||||||||||||||||||||||||||||
| Net exposure | Loan to value ratioC | |||||||||||||||||||||||||||||||
| Total | Without collateral | Of which property collateral | Of which other collateral | Less than or equal to 40% | More than 40% and less than or equal to 60% | More than 60% and less than or equal to 80% | More than 80% and less than or equal to 100% | More than 100% | ||||||||||||||||||||||||
| Public sector | ||||||||||||||||||||||||||||||||
| Other financial institutions (financial business activity) | ||||||||||||||||||||||||||||||||
| Non-financial corporations and individual entrepreneurs (non-financial business activity) (broken down by purpose) | ||||||||||||||||||||||||||||||||
| Of which: | ||||||||||||||||||||||||||||||||
| Construction and property development | ||||||||||||||||||||||||||||||||
| Civil engineering construction | ||||||||||||||||||||||||||||||||
| Large companies | ||||||||||||||||||||||||||||||||
| SMEs and individual entrepreneurs | ||||||||||||||||||||||||||||||||
| Households – other (broken down by purpose) | ||||||||||||||||||||||||||||||||
| Of which: | ||||||||||||||||||||||||||||||||
| Residential | ||||||||||||||||||||||||||||||||
| Consumer loans | ||||||||||||||||||||||||||||||||
| Other purposes | ||||||||||||||||||||||||||||||||
TotalA | ||||||||||||||||||||||||||||||||
| Memorandum item | ||||||||||||||||||||||||||||||||
Refinanced and restructured transactionsB | ||||||||||||||||||||||||||||||||
A.In addition, the Group has granted advances to customers amounting to EUR 18,529 million, bringing the total of loans and advances to EUR 1,036,349 million.
B.Includes the net balance of the impairment of the accumulated value or accumulated losses in the fair value due to credit risk.
C.The ratio is the carrying amount of the transactions at 31 December 2023 provided by the latest available appraisal value of the collateral.
Note 54 contains information relating to the forborne loan portfolio.
605
Following is the movement of the gross exposure broken down by impairment stage of loans and advances to customers recognised under "Financial assets at amortised cost" and “Financial assets at fair value through other comprehensive income” during 2023, 2022 and 2020:
| 2023 | ||||||||||||||
| EUR million | ||||||||||||||
| Stage 1 | Stage 2 | Stage 3 | Total | |||||||||||
| Balance at the beginning of year | ||||||||||||||
| Movements | ||||||||||||||
| Transfers | ||||||||||||||
| To stage 2 from stage 1 | ( | — | ||||||||||||
To stage 3 from stage 1A | ( | — | ||||||||||||
| To stage 3 from stage 2 | ( | — | ||||||||||||
| To stage 1 from stage 2 | ( | — | ||||||||||||
| To stage 2 from stage 3 | ( | — | ||||||||||||
| To stage 1 from stage 3 | ( | — | ||||||||||||
| Net changes on financial assets | ( | ( | ||||||||||||
| Write-offs | — | — | ( | ( | ||||||||||
| Exchange differences and others | ( | ( | ( | |||||||||||
| Balance at the end of the year | ||||||||||||||
| 2022 | ||||||||||||||
| EUR million | ||||||||||||||
| Stage 1 | Stage 2 | Stage 3 | Total | |||||||||||
| Balance at the beginning of year | ||||||||||||||
| Movements | ||||||||||||||
| Transfers | ||||||||||||||
| To stage 2 from stage 1 | ( | — | ||||||||||||
To stage 3 from stage 1A | ( | — | ||||||||||||
| To stage 3 from stage 2 | ( | — | ||||||||||||
| To stage 1 from stage 2 | ( | — | ||||||||||||
| To stage 2 from stage 3 | ( | — | ||||||||||||
| To stage 1 from stage 3 | ( | — | ||||||||||||
| Net changes on financial assets | ( | ( | ||||||||||||
| Write-offs | — | — | ( | ( | ||||||||||
| Exchange differences and others | ||||||||||||||
| Balance at the end of the year | ||||||||||||||
| 2021 | ||||||||||||||
| EUR million | ||||||||||||||
| Stage 1 | Stage 2 | Stage 3 | Total | |||||||||||
| Balance at the beginning of year | ||||||||||||||
| Movements | ||||||||||||||
| Transfers | ||||||||||||||
| To stage 2 from stage 1 | ( | — | ||||||||||||
| To stage 3 from stage 1 | ( | — | ||||||||||||
| To stage 3 from stage 2 | ( | — | ||||||||||||
| To stage 1 from stage 2 | ( | — | ||||||||||||
| To stage 2 from stage 3 | ( | — | ||||||||||||
| To stage 1 from stage 3 | ( | — | ||||||||||||
| Net changes on financial assets | ( | ( | ||||||||||||
| Write-offs | — | — | ( | ( | ||||||||||
| Exchange differences and others | ||||||||||||||
| Balance at the end of the year | ||||||||||||||
A.It includes the effect of the stage 3 definition alignment with the accounting default definition, mainly by Santander Consumer USA.
In addition, at 31 December 2023, the Group had EUR 694 million (EUR 322 million at 31 December 2022 and EUR 420 million at 31 December 2021) of exposure in assets purchased with impairment of which EUR 273 million still show signs of additional impairment, which correspond mainly to the business combinations carried out by the Group.
606
c) Impairment losses on loans and advances to customers at amortised cost and at fair value through other comprehensive income
The changes in the impairment losses on the assets making up the balances of financial assets at amortised cost and at fair value through other comprehensive income - Loans and advances - Customers:
| EUR million | |||||||||||
| 2023 | 2022 | 2021 | |||||||||
| Amount at beginning of the year | |||||||||||
| Impairment losses charged to income for the year | |||||||||||
| Of which: | |||||||||||
| Impairment losses charged to profit or loss | |||||||||||
| Impairment losses reversed with a credit to profit or loss | ( | ( | ( | ||||||||
| Change of perimeter | ( | ||||||||||
| Write-off of impaired balances against recorded impairment allowance | ( | ( | ( | ||||||||
| Exchange differences and other changes | ( | ( | |||||||||
| Amount at end of the year | |||||||||||
| Which correspond to: | |||||||||||
| Impaired assets | |||||||||||
| Other assets | |||||||||||
| Of which: | |||||||||||
| Individually calculated | |||||||||||
| Collective calculated | |||||||||||
In addition, provisions for debt securities amounting to EUR 24 million were recorded at 31 December 2023 (provisions amounting to EUR 16 million and EUR 28 million as of 31 December 2022 and 2021, respectively), written-off assets recoveries have been recorded in the year amounting to EUR 1,592 million at 31 December 2023 (EUR 1,459 million and EUR 1,383 million at 31 December 2022 and 2021, respectively).
EUR 513 million were recorded in the account for losses on renegotiation or contractual modification at 31 December 2023 (EUR 630 and EUR 0 million at 31 December 2022 and 2021, respectively) mainly due to the impact of the adjustment of the gross amount of mortgage loans denominated and indexed to foreign currencies in Poland, and of the Moratorium law approved in July 2022 in this same country (see note 25.e.)
With this, the impairment recorded in Impairment or reversal of impairment at financial assets not measured at fair value through profit or loss and net gains and losses from changes: 'Financial assets at fair value through other comprehensive income' and 'Financial assets at amortised cost (IFRS 9) and, Loans and receivables (IAS 39)'; amounts EUR 12,956 million at 31 December 2023 (EUR 10,863 million and EUR 7,407 million at 31 December 2022 and 2021, respectively).
Following is the movement of the loan loss provision broken down by impairment stage of loans and advances to customers during 2023, 2022 and 2021:
| 2023 | ||||||||||||||
| EUR million | ||||||||||||||
| Stage 1 | Stage 2 | Stage 3 | Total | |||||||||||
| Loss allowance at the beginning of the year | ||||||||||||||
| Transfers | ||||||||||||||
| To stage 2 from stage 1 | ( | |||||||||||||
| To stage 3 from stage 1 | ( | |||||||||||||
| To stage 3 from stage 2 | ( | |||||||||||||
| To stage 1 from stage 2 | ( | ( | ||||||||||||
| To stage 2 from stage 3 | ( | ( | ||||||||||||
| To stage 1 from stage 3 | ( | ( | ||||||||||||
| Net changes of the exposure and modifications in the credit risk | ( | |||||||||||||
| Write-offs | — | — | ( | ( | ||||||||||
| FX and other movements | ( | ( | ||||||||||||
| Loss allowance at the end of the year | ||||||||||||||
| 2022 | ||||||||||||||
| EUR million | ||||||||||||||
| Stage 1 | Stage 2 | Stage 3 | Total | |||||||||||
| Loss allowance at the beginning of the year | ||||||||||||||
| Transfers | ||||||||||||||
| To stage 2 from stage 1 | ( | |||||||||||||
| To stage 3 from stage 1 | ( | |||||||||||||
| To stage 3 from stage 2 | ( | |||||||||||||
| To stage 1 from stage 2 | ( | ( | ||||||||||||
| To stage 2 from stage 3 | ( | ( | ||||||||||||
| To stage 1 from stage 3 | ( | ( | ||||||||||||
| Net changes of the exposure and modifications in the credit risk | ( | |||||||||||||
| Write-offs | — | — | ( | ( | ||||||||||
| FX and other movements | ||||||||||||||
| Loss allowance at the end of the year | ||||||||||||||
607
| 2021 | ||||||||||||||
| EUR million | ||||||||||||||
| Stage 1 | Stage 2 | Stage 3 | Total | |||||||||||
| Loss allowance at the beginning of the year | ||||||||||||||
| Transfers | ||||||||||||||
| To stage 2 from stage 1 | ( | |||||||||||||
| To stage 3 from stage 1 | ( | |||||||||||||
| To stage 3 from stage 2 | ( | |||||||||||||
| To stage 1 from stage 2 | ( | ( | ||||||||||||
| To stage 2 from stage 3 | ( | ( | ||||||||||||
| To stage 1 from stage 3 | ( | ( | ||||||||||||
| Net changes of the exposure and modifications in the credit risk | ( | |||||||||||||
| Write-offs | — | — | ( | ( | ||||||||||
| FX and other movements | ( | ( | ( | |||||||||||
| Loss allowance at the end of the year | ||||||||||||||
d) Impaired assets and assets with unpaid past-due amounts
The detail of the changes in the balance of the financial assets classified as 'Financial assets Loans to customers' considered to be impaired due to credit risk is as follows:
| EUR million | |||||||||||
| 2023 | 2022 | 2021 | |||||||||
| Balance at beginning of year | |||||||||||
| Net additions | |||||||||||
| Written-off assets | ( | ( | ( | ||||||||
| Changes in the scope of consolidation | ( | ||||||||||
| Exchange differences and other | |||||||||||
| Balance at end of year | |||||||||||
This amount, after deducting the related allowances, represents the Group’s best estimate of the discounted value of the flows that are expected to be recovered from the impaired assets.
At 31 December 2023, the Group’s written-off assets totalled EUR 48,138 million (EUR 43,675 million and EUR 40,585 million at 31 December 2022 and 2021, respectively).
Set forth below for each class of impaired asset are the gross amount, associated allowances and information relating to the collateral and/or other credit enhancements obtained at 31 December 2023:
| EUR million | |||||||||||
| Gross amount | Allowance recognised | Estimated collateral valueA | |||||||||
| Without associated real collateral | |||||||||||
| With real estate collateral | |||||||||||
| With other collateral | |||||||||||
| Total | |||||||||||
A.Including the estimated value of the collateral associated with each loan. Accordingly, any other cash flows that may be obtained, such as those arising from borrowers’ personal guarantees, are not included.
When classifying assets in the previous table, the main factors considered by the Group to determine whether an asset has become impaired are the existence of amounts past due —assets impaired due to arrears— or other circumstances that may arise which will not result in all contractual cash flows being recovered, such as a deterioration of the borrower’s financial situation, the worsening of its capacity to generate funds or difficulties experienced by it in accessing credit.
e) Transferred credits
'Loans and advances to customers' includes, inter alia, the securitised loans transferred to third parties on which the Group has retained the risks and rewards, albeit partially, and which therefore, in accordance with the applicable accounting standards, cannot be derecognised. This is mainly due to mortgage loans, loans to companies and consumer loans in which the group retains subordinate financing and/or grants some kind of credit enhancement to new holders.
Securitisation is used as a tool for the management of regulatory capital and as a means of diversifying the Group's liquidity sources.
The breakdown of securitized loans held on the balance sheet, according to the nature of the financial instrument in which they are originated, is shown below:
| EUR million | |||||||||||
| 2023 | 2022 | 2021 | |||||||||
| Retained on the balance sheet | |||||||||||
| Of which | |||||||||||
| Securitised mortgage assets | |||||||||||
| Of which: UK assets | |||||||||||
| Other securitised assets | |||||||||||
TotalA | |||||||||||
A.Note 22 details the liabilities associated with these securitisation transactions.
At 31 December 2023, Grupo Santander had loans that had been fully derecognised and for which it retained servicing amounting to EUR 13,923 million (EUR 13,711 million and EUR 14,141 million at 31 December 2022 and 2021, respectively).
608
11. Trading derivatives
The detail of the notional amounts and the market values of the trading derivatives held by the Group in 2023, 2022 and 2021 is as follows:
| EUR million | ||||||||||||||||||||||||||
| 2023 | 2022 | 2021 | ||||||||||||||||||||||||
| Notional amount | Market value | Notional amount | Market value | Notional amount | Market value | |||||||||||||||||||||
| Trading derivatives | ||||||||||||||||||||||||||
| Interest rate risk | ||||||||||||||||||||||||||
| Forward rate agreements | ( | |||||||||||||||||||||||||
| Interest rate swaps | ||||||||||||||||||||||||||
| Options, futures and other derivatives | ( | ( | ( | |||||||||||||||||||||||
| Credit risk | ||||||||||||||||||||||||||
| Credit default swaps | ( | ( | ||||||||||||||||||||||||
| Foreign currency risk | ||||||||||||||||||||||||||
| Foreign currency purchases and sales | ( | |||||||||||||||||||||||||
| Foreign currency options | ( | |||||||||||||||||||||||||
| Currency swaps | ( | ( | ( | |||||||||||||||||||||||
| Securities and commodities derivatives and other | ||||||||||||||||||||||||||
| Total | ||||||||||||||||||||||||||
12. Non-current assets
The detail of Non-current assets held for sale in the consolidated balance sheets is as follows:
| EUR million | |||||||||||
| 2023 | 2022 | 2021 | |||||||||
| Tangible assets | |||||||||||
| Of which: | |||||||||||
| Foreclosed assets | |||||||||||
| Of which property assets in Spain | |||||||||||
| Other tangible assets held for sale | |||||||||||
| Other assets | |||||||||||
| Total | |||||||||||
At 31 December 2023, the provisions recognised for the total non-current assets held for sale totalled EUR 2,956 million (EUR 3,425 million and EUR 3,811 million at 31 December 2022 and 2021, respectively). The charges recorded in those years amounted to EUR 139 million, EUR 204 million and EUR 239 million, respectively, and the recoveries during these exercises are amounted to EUR 88 million, EUR 110 million and EUR 98 million, respectively.
609
13. Investments
a) Breakdown
The detail, by company, of Investments is as follows:
| EUR million | |||||||||||
| 2023 | 2022 | 2021 | |||||||||
| Associated entities | |||||||||||
| Merlin Properties, SOCIMI, S.A. | |||||||||||
| Caceis | |||||||||||
| Zurich Santander Insurance America, S.L. - Consolidated | |||||||||||
| Metrovacesa, S.A. | |||||||||||
| CNP Santander | |||||||||||
| Ebury Partners Limited (note 3) | |||||||||||
| Other companies | |||||||||||
| Joint Ventures entities | |||||||||||
| Santander Caceis Latam Holding 1, S.L. - Consolidated (previously Santander Securities Services Latam Holding, S.L) | |||||||||||
| Santander Vida Seguros y Reaseguros, S.A. | |||||||||||
| U.C.I., S.A. - Consolidated | |||||||||||
| Fortune Auto Finance Co., Ltd. | |||||||||||
| Hyundai Capital UK Limited | |||||||||||
| Banco RCI Brasil S.A. | |||||||||||
| Other companies | |||||||||||
| Total Associated entities and Joint ventures | |||||||||||
Of the entities included above, at 31 December 2023, the entities Merlin Properties, SOCIMI, S.A, and Metrovacesa S.A. and Compañía Española de Viviendas en Alquiler, S.A., are the only listed companies.
Below is a breakdown of the Goodwill of the main investments in joint ventures and associates included in the balance of this heading:
| EUR million | |||||||||||
| 2023 | 2022 | 2021 | |||||||||
| Goodwill | |||||||||||
| Of which: | |||||||||||
| Zurich Santander Insurance America, S.L. - Consolidated | |||||||||||
| Caceis | |||||||||||
b) Changes
The changes in the investments were as follows:
| EUR million | |||||||||||
| 2023 | 2022 | 2021 | |||||||||
| Balance at beginning of year | |||||||||||
| Acquisitions (disposals) of companies and capital increases (reductions) | |||||||||||
| Changes in the consolidation method (note 3) | ( | ( | |||||||||
| Of which: | |||||||||||
| Ebury Partners Limited | ( | ||||||||||
| Effect of equity accounting | |||||||||||
| Dividends distributed and reimbursements of share premium | ( | ( | ( | ||||||||
| Of which: | |||||||||||
| Zurich Santander Insurance América, S.L. - Consolidado | ( | ( | ( | ||||||||
| Caceis | ( | ||||||||||
| Hyundai Capital UK Limited | ( | ||||||||||
| Santander Vida Seguros y Reaseguros, S.A.- Consolidated | ( | ( | ( | ||||||||
| CNP Santander | ( | ( | ( | ||||||||
| Merlin Properties, SOCIMI, S.A. | ( | ( | ( | ||||||||
| Metrovacesa, S.A. | ( | ( | ( | ||||||||
| Other global result | ( | ( | |||||||||
| Exchange differences and other changes | ( | ||||||||||
| Balance at end of year | |||||||||||
c) Impairment adjustments
During the years 2023, 2022 and 2021 there was no evidence of significant impairment in the Group's associated interests.
610
d) Other information
A summary of the financial information at the end of December 2023 of the main associates and joint ventures (obtained from the information available at the date of preparation of the consolidated financial statements) is shown below:
| EUR million | ||||||||||||||||||||||||||||||||||||||
| Associates | Joint ventures | |||||||||||||||||||||||||||||||||||||
Merlin Properties, SOCIMI, S.A.A | Metrovacesa, S.A.A | Caceis | Zurich Santander Insurance América, S.L. - Consolidated | CNP Santander | Santander Caceis Latam Holding, S.L. - Consolidated | U.C.I., S.A. - Consolidated | Hyundai Capital UK Limited | Fortune Auto Finance Co., LTD | Santander Vida Seguros y Reaseguros, S.A.- Consolidated (note 3) | Banco RCI Brasil S.A. | ||||||||||||||||||||||||||||
| Current assets | ||||||||||||||||||||||||||||||||||||||
| Non current assets | ||||||||||||||||||||||||||||||||||||||
| Total assets | ||||||||||||||||||||||||||||||||||||||
| Current liabilities | ||||||||||||||||||||||||||||||||||||||
| Non current liabilities | ||||||||||||||||||||||||||||||||||||||
| Total liabilities | ||||||||||||||||||||||||||||||||||||||
| Attributable profit for the period | ( | ( | ||||||||||||||||||||||||||||||||||||
| Other accumulated comprehensive income | ( | ( | ( | ( | ( | ( | ( | ( | ||||||||||||||||||||||||||||||
| Rest of equity | ||||||||||||||||||||||||||||||||||||||
| Total Equity | ||||||||||||||||||||||||||||||||||||||
| Total liabilities and equity | ||||||||||||||||||||||||||||||||||||||
| Ordinary activities income | ||||||||||||||||||||||||||||||||||||||
| Profit (loss) from continuing operations | ( | ( | ||||||||||||||||||||||||||||||||||||
| Profit (loss) for the year from discontinuing operations | ||||||||||||||||||||||||||||||||||||||
A.Data as of 31 December 2022, latest accounts available.
14. Insurance contracts linked to pensions
The detail of Insurance contracts linked to pensions in the consolidated balance sheets is as follows:
| EUR million | |||||||||||
| 2023 | 2022 | 2021 | |||||||||
| Assets relating to insurance contracts covering post-employment benefit plan obligations: | |||||||||||
| Banco Santander, S.A. | |||||||||||
611
15. Liabilities under insurance contracts
The detail of Liabilities under insurance contracts and reinsurance assets in the consolidated balance sheets (see note 2.i) is as follows:
| EUR million | |||||||||||
| 2023 | 2022 | 2021 | |||||||||
| Liabilities relating to insurance contracts | |||||||||||
| Component of the present value of future cash flows (BEL) | |||||||||||
| Risk adjustment (RA) | |||||||||||
| Contractual service margin (CSM) | |||||||||||
| Remaining coverage liability | |||||||||||
| Liabilities for incurred claims (LIC) | |||||||||||
The balance of liabilities under insurance contracts reflected in the consolidated balance sheet includes the following elements:
•Liability for Remaining Coverage (LRC): amount of obligations provisioned to meet the fulfillment of future services assigned to the group on a date for a specific coverage period . The valuation differs depending on the length of the coverage period of the contract groups. In the case of long-term contracts, valued using the General Method (BBA) or the Variable Commission Method (VFA), this amount is formed from the sum of BEL, RA and CSM; In the case of short-term contracts, this amount is calculated using the Premium Allocation Method (PAA).
•Liability for Incurred Claims (LIC): amount of obligations provisioned to meet the fulfillment of past services assigned to the group on a date.
The insurance activity is carried out mainly in the life insurance sector in its life-savings modality. Within the amount of liabilities for insurance contracts, Individual Life Annuities are the product that has the greatest weight in the consolidated balance sheet. This product consists of life annuities where the client contributes a single premium and receives a constant and periodic insured income (monthly, quarterly, semi-annual or annual) until his death where, at that time, the beneficiaries will receive the insured capital of 102 % or 101 % of the premium contributed. This product is valued using the General Method (BBA) methodology and its remaining coverage liability is made up of the following components:
•Best Estimated Liability (BEL): estimate of incoming and outgoing cash flows weighted by their probability of occurrence and discounted to a certain curve in order to reflect the time value of money over time. weather.
•Risk adjustment for non-financial risk (RA): reflects compensation for the uncertainty of cash flows by quantifying the amount necessary to compensate for unexpected losses in liability flows.
•Contractual Service Margin (CSM): future benefit to be recognized during the coverage period.
•The income and expenses recorded in the profit and loss account for the insurance activity, including reinsurance income and expenses, are not material in the Group's consolidated annual accounts.
612
16. Tangible assets
a) Changes
The changes in Tangible assets in the consolidated balance sheets were as follows:
| EUR million | |||||||||||||||||||||||||||||
| Tangible assets | Of which: For leasing | ||||||||||||||||||||||||||||
For own use | Leased out under an operating lease | Investment property | Total | For own use | Leased out under an operating lease | Investment property | Total | ||||||||||||||||||||||
| Cost | |||||||||||||||||||||||||||||
| Balances at 1 January 2021 | |||||||||||||||||||||||||||||
| Additions / disposals (net) due to change in the scope of consolidation | ( | ( | |||||||||||||||||||||||||||
| Additions / disposals (net) | ( | ( | ( | ||||||||||||||||||||||||||
| Transfers, exchange differences and other items | ( | ||||||||||||||||||||||||||||
| Balance at 31 December 2021 | |||||||||||||||||||||||||||||
| Additions / disposals (net) due to change in the scope of consolidation | |||||||||||||||||||||||||||||
| Additions / disposals (net) | ( | ( | ( | ||||||||||||||||||||||||||
| Transfers, exchange differences and other items | |||||||||||||||||||||||||||||
| Balance at 31 December 2022 | |||||||||||||||||||||||||||||
| Additions / disposals (net) due to change in the scope of consolidation | ( | ( | |||||||||||||||||||||||||||
| Additions / disposals (net) | ( | ||||||||||||||||||||||||||||
| Transfers, exchange differences and other items | ( | ( | ( | ||||||||||||||||||||||||||
| Balance at 31 December 2023 | |||||||||||||||||||||||||||||
| Accumulated depreciation | |||||||||||||||||||||||||||||
| Balances at 1 January 2021 | ( | ( | ( | ( | ( | ( | |||||||||||||||||||||||
| Disposals due to change in the scope of consolidation | ( | ||||||||||||||||||||||||||||
| Disposals | |||||||||||||||||||||||||||||
| Charge for the year | ( | ( | ( | ( | ( | ||||||||||||||||||||||||
| Transfers, exchange differences and other items | ( | ( | ( | ( | ( | ||||||||||||||||||||||||
| Balance at 31 December 2021 | ( | ( | ( | ( | ( | ( | |||||||||||||||||||||||
| Disposals due to change in the scope of consolidation | ( | ( | ( | ||||||||||||||||||||||||||
| Disposals | |||||||||||||||||||||||||||||
| Charge for the year | ( | ( | ( | ( | ( | ||||||||||||||||||||||||
| Transfers, exchange differences and other items | ( | ( | ( | ( | ( | ( | |||||||||||||||||||||||
| Balance at 31 December 2022 | ( | ( | ( | ( | ( | ( | |||||||||||||||||||||||
| Disposals due to change in the scope of consolidation | |||||||||||||||||||||||||||||
| Disposals | |||||||||||||||||||||||||||||
| Charge for the year | ( | ( | ( | ( | ( | ||||||||||||||||||||||||
| Transfers, exchange differences and other items | ( | ( | ( | ||||||||||||||||||||||||||
| Balance at 31 December 2023 | ( | ( | ( | ( | ( | ( | |||||||||||||||||||||||
A. Includes contract extensions on operating leases and repurchases.
613
| EUR million | |||||||||||||||||||||||||||||
| Tangible assets | Of which: For leasing | ||||||||||||||||||||||||||||
| For own use | Leased out under an operating lease | Investment property | Total | For own use | Leased out under an operating lease | Investment property | Total | ||||||||||||||||||||||
| Impairment losses | |||||||||||||||||||||||||||||
| Balances at 1 January 2021 | ( | ( | ( | ( | ( | ( | |||||||||||||||||||||||
| Impairment charge for the year | ( | ( | ( | ( | ( | ( | |||||||||||||||||||||||
| Releases | |||||||||||||||||||||||||||||
| Disposals due to change in the scope of consolidation | |||||||||||||||||||||||||||||
| Disposals | |||||||||||||||||||||||||||||
| Exchange differences and other | ( | ( | ( | ( | ( | ( | |||||||||||||||||||||||
| Balance at 31 December 2021 | ( | ( | ( | ( | ( | ( | |||||||||||||||||||||||
| Impairment charge for the year | ( | ( | ( | ( | ( | ( | |||||||||||||||||||||||
| Releases | |||||||||||||||||||||||||||||
| Disposals due to change in the scope of consolidation | |||||||||||||||||||||||||||||
| Disposals | |||||||||||||||||||||||||||||
| Exchange differences and other | ( | ( | |||||||||||||||||||||||||||
| Balance at 31 December 2022 | ( | ( | ( | ( | ( | ( | |||||||||||||||||||||||
| Impairment charge for the year | ( | ( | ( | ( | ( | ( | |||||||||||||||||||||||
| Releases | |||||||||||||||||||||||||||||
| Disposals due to change in the scope of consolidation | |||||||||||||||||||||||||||||
| Disposals | |||||||||||||||||||||||||||||
| Exchange differences and other | ( | ( | ( | ||||||||||||||||||||||||||
| Balance at 31 December 2023 | ( | ( | ( | ( | ( | ( | |||||||||||||||||||||||
| Tangible assets, net | |||||||||||||||||||||||||||||
| Balances at 31 December 2021 | |||||||||||||||||||||||||||||
| Balances at 31 December 2022 | |||||||||||||||||||||||||||||
| Balances at 31 December 2023 | |||||||||||||||||||||||||||||
614
b) Tangible assets - For own use
The detail, by class of asset, of 'Property, plant and equipment' which is owned by the Group in the consolidated balance sheets is as follows:
| EUR million | |||||||||||||||||
Tangible assets for own use | Of which: for leasing | ||||||||||||||||
| Cost | Accumulated depreciation | Impairment losses | Carrying amount | ||||||||||||||
| Land and buildings | ( | ( | |||||||||||||||
| IT equipment and fixtures | ( | ||||||||||||||||
| Furniture and vehicles | ( | ||||||||||||||||
| Construction in progress and other items | ( | ( | |||||||||||||||
| Balances at 31 December 2021 | ( | ( | |||||||||||||||
| Land and buildings | ( | ( | |||||||||||||||
| IT equipment and fixtures | ( | ||||||||||||||||
| Furniture and vehicles | ( | ||||||||||||||||
| Construction in progress and other items | ( | ( | |||||||||||||||
| Balances at 31 December 2022 | ( | ( | |||||||||||||||
| Land and buildings | ( | ( | |||||||||||||||
| IT equipment and fixtures | ( | ||||||||||||||||
| Furniture and vehicles | ( | ||||||||||||||||
| Construction in progress and other items | ( | ( | |||||||||||||||
| Balances at 31 December 2023 | ( | ( | |||||||||||||||
The carrying amount at 31 December 2023 in the foregoing table includes the following approximate amounts EUR 7,119 million (EUR 7,083 million at 31 December 2022 and EUR 6,753 million at 31 December 2021) relating to property, plant and equipment owned by group entities and branches located abroad.
c) Tangible assets - Leased out under an operating lease
Grupo Santander has assets leased out under operating leases where the company is the lessor and do not meet the accounting requirements to be classified as finance leases. The net cost of these leases is recorded as an asset and depreciated on a straight-line basis over the contractual term of the lease to the expected residual value.
The expected residual value and, consequently, the monthly depreciation expense may change during the term of the lease. The Group estimates expected residual values using independent data sources and internal statistical models. It also assesses the estimate of the residual value of these leases and adjusts the depreciation rate in line with the change in the expected value of the asset at the end of the lease.
Grupo Santander periodically assesses its investment in operating leases for impairment in certain circumstances, such as a systemic and material decrease in the values of used vehicles. If assets leased out under operating leases are deemed to be impaired, impairment is measured as the amount by which the carrying amount of the assets exceeds the fair value as estimated by discounted cash flows.
Of the EUR 19,518 million that the Group had assigned to operating leases at 31 December 2023 (EUR 19,555 million and EUR 19,083 at 31 December 2022 and 2021, respectively), EUR 12,525 million (EUR 13,389 and EUR 13,630 at 31 December 2022 and 2021, respectively) relate to vehicles of Santander US Auto's business. The variable lease payments of various items of this business are not significant.
In addition, the maturity analysis of the assets leased out under operating leases from Santander US Auto, is as follows:
| EUR million | |||||
| 2023 | |||||
| Maturity Analysis | |||||
| 2024 | |||||
| 2025 | |||||
| 2026 | |||||
| 2027 | |||||
d) Tangible assets - Investment property
The fair value of investment property at 31 December 2023, 2022, 2021 amounted to EUR 1,163 , 1,153 and 1,088 million, respectively. A comparison of the fair value of investment property at 31 December 2023, 2022 and 2021 with the net book value shows gross unrealised gains of EUR 207 , 124 and 109 million, respectively, attributed completely to the group.
615
The rental income earned from investment property and the direct costs related both to investment properties that generated rental income in 2023, 2022 and 2021 and to investment properties that did not generate rental income in those years are not material in the context of the consolidated financial statements.
17. Intangible assets – Goodwill
The detail of goodwill, based on the cash-generating units giving rise thereto, is as follows:
| EUR million | |||||||||||
| 2023 | 2022 | 2021 | |||||||||
| Banco Santander (Brasil) | |||||||||||
| SAM Investment Holdings Limited | |||||||||||
| Santander Consumer Germany | |||||||||||
| Santander Bank Polska | |||||||||||
| Santander Portugal | |||||||||||
| Santander US Auto | |||||||||||
| Santander España | |||||||||||
Santander Holding USA (ex. Auto)A | |||||||||||
| Santander UK | |||||||||||
| Grupo Financiero Santander (México) | |||||||||||
| Banco Santander - Chile | |||||||||||
| Ebury Partners | |||||||||||
| Santander Consumer Nordics | |||||||||||
| Other companies | |||||||||||
| Total Goodwill | |||||||||||
A.Includes the Santander US Capital Markets LLC's business (previously Amherst Pierpont Securities LLC) (see note 3).
The changes in goodwill were as follows:
| EUR million | |||||||||||
| 2023 | 2022 | 2021 | |||||||||
| Balance at beginning of year | |||||||||||
| Additions (note 3) | |||||||||||
| Of which: | |||||||||||
| Ebury Partners | |||||||||||
Santander Holding USA (ex. Auto) A | |||||||||||
| Impairment losses | ( | ( | |||||||||
| Disposals or changes in scope of consolidation | |||||||||||
| Exchange differences and other items | |||||||||||
| Balance at end of year | |||||||||||
A.Acquisition of Santander US Capital Markets LLC (previously Amherst Pierpont Securities LLC) (see note 3).
Grupo Santander has goodwill generated by cash-generating units located in non-euro currency countries (mainly Brazil, Poland, the United States, the United Kingdom, Chile, Mexico, Norway and Sweden) and, therefore, this gives rise to exchange differences on the translation to euros, at closing rates, of the amounts of goodwill denominated in foreign currencies. Accordingly, in 2023 there was an increase of EUR 240 million (an increase of EUR 494 million in 2022 and EUR 167 million in 2021), due to exchange differences and other items which, pursuant to current standards, were recognised with a change to 'Other comprehensive income - Items that may be reclassified to profit or loss - Exchange differences in other comprehensive income in the consolidated statement of recognised income and expense' (see note 29.d).
At least once per year (or whenever there is any indication of impairment), Grupo Santander performs an analysis of the potential impairment of its recorded goodwill with respect to its recoverable amount. The first step that must be taken in order to perform this analysis is the identification of the cash-generating units, which are the Group's smallest identifiable groups of assets that generate cash inflows that are largely independent of the cash flows of other assets or groups of assets.
The amount to be recovered of each cash-generating unit is determined taking into consideration the carrying amount (including any fair value adjustment arising on the business combination) of all the assets and liabilities of all the independent legal entities composing the cash-generating unit, together with the related goodwill.
The amount to be recovered of the cash-generating unit is compared with its recoverable amount in order to determine whether there is any impairment.
Grupo Santander's directors assess the existence of any indication that might be considered to be evidence of impairment of the cash-generating unit by reviewing information including the following (i) certain macroeconomic variables that might affect its investments (population data, political situation, economic situation —including banking concentration level—, among others) and (ii) various microeconomic variables comparing the investments of the Group with the financial services industry of the country in which the cash-generating unit carries on most of its business activities (balance sheet composition, total funds under management, results, efficiency ratio, capital adequacy ratio, return on equity, among others).
Regardless of whether there is any indication of impairment, every year the Group calculates the recoverable amount of each cash-generating unit to which goodwill, has been allocated and, to this end, it uses price quotations, market references (multiples), internal estimates and valuations performed by internal and external experts.
Firstly, the Group determines the recoverable amount by calculating the fair value of each cash-generating unit on the basis of the quoted price of the cash-generating units, if available.
616
In addition, the Group performs estimates of the recoverable amounts of certain cash-generating units by calculating their value in use using discounted cash flow projections. The main assumptions used in this calculation are (i) earnings projections based on the financial budgets approved by the Group’s directors which cover between and five year periods (unless a longer time horizon can be justified), (ii) discount rates determined as the cost of capital taking into account the risk-free rate of return plus a risk premium in line with the market and the business in which the units operate and (iii) constant growth rates used in order to extrapolate earnings in perpetuity which do not exceed the long-term average growth rate for the market in which the cash-generating unit in question operates.
The cash flow projections used by Group management to obtain the values in use are based on the financial budgets approved by both local management of the related local units and the Group’s directors. The Group’s budgetary estimation process is common for all the cash-generating units. The local management teams prepare their budgets using the following key assumptions:
a) Microeconomic variables of the cash-generating unit: management takes into consideration the current balance sheet structure, the product mix and the business decisions taken by local management in this regard.
b) Macroeconomic variables: growth is estimated on the basis of the changing environment, taking into consideration expected GDP growth in the unit’s geographical location and forecast trends in interest and exchange rates. These data, which are based on external information sources, are provided by the Group’s economic research service.
c) Past performance variables: in addition, management takes into consideration in the projection the difference (both positive and negative) between the cash-generating unit’s past performance and budgets.
During 2023, the Group has recognised impairment losses of EUR 20 million euros of immaterial goodwill that has been recorded under the heading 'Impairment or reversal of the impairment of non-financial assets - Intangible assets' (EUR 0 million and EUR 6 million in 2022 and 2021, respectively). Goodwill is deducted from CET1 for regulatory purposes, so an impairment of goodwill has no impact on the Group's capital ratios.
617
Following is a detail of the main assumptions taken into account in determining the recoverable amount, at 2023 year-end, of the most significant cash-generating units which were valued using the discounted cash flow method:
| 2023 | |||||||||||
| Projected period | Discount rateA | Nominal perpetual growth rate | |||||||||
| Santander UK | % | % | |||||||||
| Santander Bank Polska | % | % | |||||||||
| Santander US Auto | % | % | |||||||||
Santander Holding USA (ex. Auto)B | % | % | |||||||||
| Santander Consumer Germany | % | % | |||||||||
| SAM Investment Holdings, Limited | % | % | |||||||||
| Santander Portugal | % | % | |||||||||
A.Post-tax discount rate.
B.Weighted information of the main assumptions of the segments to which goodwill has been allocated.
The discount and nominal perpetual growth rates taken into account in 2022 and 2021 are presented below for comparison purposes:
Discount rateA | Nominal perpetual growth rate | |||||||||||||
| 2022 | 2021 | 2022 | 2021 | |||||||||||
| Santander UK | % | % | % | % | ||||||||||
| Santander Bank Polska | % | % | % | % | ||||||||||
| Santander US Auto | % | % | % | % | ||||||||||
Santander Holding USA (ex. Auto)B | % | % | % | % | ||||||||||
| Santander Consumer Germany | % | % | % | % | ||||||||||
| SAM Investment Holdings, Limited | % | % | % | % | ||||||||||
| Santander Portugal | % | % | % | % | ||||||||||
A.Post-tax discount rate.
B.Weighted information of the main assumptions of the segments to which goodwill has been allocated.
The variations reflected in the assumptions used in 2023 are mainly a consequence of the current macroeconomic scenario, as well as the level of inflation and difficulties in supply chains, which have led to a rapid increase in central banks' benchmark interest rates in the main countries where the Group's CGU are operating.
Given the degree of uncertainty of the above key assumptions on which the recoverable amount of the cash-generating units is based, the Group performs a sensitivity analysis which consisted of adjusting +/- 50 50 5 %. These changes in the key assumptions in isolation mean that the recoverable amount of all the cash-generating units continues to exceed their amount to be recovered and have been considered by the Group as reasonably possible changes in the business operations of the cash-generating units are not contemplated.
The recoverable amount of Banco Santander - Chile and Banco Santander (Brasil) was calculated as the fair values of the aforementioned cash-generating units obtained from the quoted market prices of their shares at year-end. This value exceeded the amount to be recovered. A significant reduction in the quoted market prices of these cash generating unit could result in an indication of impairment which in turn may lead to a goodwill impairment charge in the future.
618
18. Intangible assets - Other intangible assets
The detail of Intangible assets - Other intangible assets in the consolidated balance sheets and of the changes therein in 2023, 2022, and 2021 is as follows:
| EUR million | ||||||||||||||||||||||||||
| Estimated useful life | 31/12/2022 | Net additions and disposals | Change in scope of consolidation | Amortization and impairment | Application of amortization and impairment | Exchange differences and other | 31/12/2023 | |||||||||||||||||||
| Cost | ( | |||||||||||||||||||||||||
| Brand names | ( | |||||||||||||||||||||||||
| IT developments | ( | |||||||||||||||||||||||||
| Other | ( | |||||||||||||||||||||||||
| Accumulated amortisation | ( | ( | ( | ( | ||||||||||||||||||||||
| Development | ( | ( | ( | ( | ||||||||||||||||||||||
| Other | ( | ( | ( | |||||||||||||||||||||||
| Impairment losses | ( | ( | ( | |||||||||||||||||||||||
| Of which addition | — | — | — | ( | — | — | — | |||||||||||||||||||
| Liberation | — | — | — | — | — | — | ||||||||||||||||||||
| ( | ||||||||||||||||||||||||||
| EUR million | ||||||||||||||||||||||||||
| Estimated useful life | 31/12/2021 | Net additions and disposals | Change in scope of consolidation | Amortization and impairment | Application of amortization and impairment | Exchange differences and other | 31/12/2022 | |||||||||||||||||||
| Cost | ( | |||||||||||||||||||||||||
| Brand names | ||||||||||||||||||||||||||
| IT developments | ( | |||||||||||||||||||||||||
| Other | ( | |||||||||||||||||||||||||
| Accumulated amortisation | ( | ( | ( | ( | ||||||||||||||||||||||
| Development | ( | ( | ( | ( | ||||||||||||||||||||||
| Other | ( | ( | ( | ( | ||||||||||||||||||||||
| Impairment losses | ( | ( | ( | |||||||||||||||||||||||
| Of which addition | — | — | — | ( | — | — | — | |||||||||||||||||||
| Liberation | — | — | — | — | — | — | ||||||||||||||||||||
| ( | ||||||||||||||||||||||||||
619
| EUR million | ||||||||||||||||||||||||||
| Estimated useful life | 31/12/2020 | Net additions and disposals | Change in scope of consolidation | Amortization and impairment | Application of amortization and impairment | Exchange differences and other | 31/12/2021 | |||||||||||||||||||
| Cost | ( | |||||||||||||||||||||||||
| Brand names | ( | |||||||||||||||||||||||||
| IT developments | ( | |||||||||||||||||||||||||
| Other | ( | |||||||||||||||||||||||||
| Accumulated amortisation | ( | ( | ( | ( | ( | |||||||||||||||||||||
| Development | ( | ( | ( | ( | ( | |||||||||||||||||||||
| Other | ( | ( | ( | ( | ( | |||||||||||||||||||||
| Impairment losses | ( | ( | ( | |||||||||||||||||||||||
| Of which addition | — | — | — | ( | — | — | — | |||||||||||||||||||
| Liberation | — | — | — | — | — | — | ||||||||||||||||||||
| ( | ||||||||||||||||||||||||||
In 2023, 2022 and 2021, impairment losses of EUR 53 million, EUR 75 million and EUR 65 million, respectively, were recognised under Impairment or reversal of impairment on non-financial assets, net – intangible assets. This impairment losses are related mainly to the decline in or loss of the recoverable value of certain computer systems and applications as a result of the processes initiated by the Group to adapt to the various regulatory changes and to transform or integrate businesses.
19. Other assets
The detail of 'Other assets' is as follows:
| EUR million | |||||||||||
| 2023 | 2022 | 2021 | |||||||||
| Transactions in transit | |||||||||||
| Net pension plan assets (note 25) | |||||||||||
| Prepayments and accrued income | |||||||||||
| Other (note 2.m) | |||||||||||
620
20. Deposits from central banks and credit institutions
The detail, by classification, counterparty, type and currency, of Deposits from central banks and 'Deposits from credit institutions' in the consolidated balance sheets is as follows:
| EUR million | |||||||||||
| 2023 | 2022 | 2021 | |||||||||
| CENTRAL BANKS | |||||||||||
| Classification | |||||||||||
| Financial liabilities held for trading | |||||||||||
| Financial liabilities designated at fair value through profit or loss | |||||||||||
| Financial liabilities at amortized cost | |||||||||||
| Type | |||||||||||
| Deposits on demand | |||||||||||
| Time deposits | |||||||||||
| Reverse repurchase agreements | |||||||||||
| CREDIT INSTITUTIONS | |||||||||||
| Classification | |||||||||||
| Financial liabilities held for trading | |||||||||||
| Financial liabilities designated at fair value through profit or loss | |||||||||||
| Financial liabilities at amortized cost | |||||||||||
| Type | |||||||||||
| Deposits on demand | |||||||||||
| Time deposits | |||||||||||
| Reverse repurchase agreements | |||||||||||
| Subordinated deposits | |||||||||||
| Currency | |||||||||||
| Euro | |||||||||||
| Pound sterling | |||||||||||
| US dollar | |||||||||||
| Brazilian real | |||||||||||
| Other currencies | |||||||||||
| TOTAL | |||||||||||
At 31 December 2023, the balance of the conditional long-term financing of the European Central Bank (TLTRO- Targeted Long-Term Refinancing Operation-) amounts to EUR 11,583 million, which corresponds to TLRTO III (EUR 33,536 million and EUR 88,894 million at 31 December 2022 and 2021, respectively).
At 31 December 2023, the expense recognized in the consolidated income statement corresponding to TLTRO III amounts to EUR 659 million (income of EUR 489 million and EUR 868 million at 31 December 2022 and 2021, respectively), as a result of the conditions of the financing program (see note 2.c.iv).
21. Customer deposits
The detail, by classification, geographical area and type, of Customer deposits is as follows:
| EUR million | |||||||||||
| 2023 | 2022 | 2021 | |||||||||
| Classification | |||||||||||
| Financial liabilities held for trading | |||||||||||
| Financial liabilities designated at fair value through profit or loss | |||||||||||
| Financial liabilities at amortized cost | |||||||||||
| Geographical area | |||||||||||
| Spain | |||||||||||
| European Union (excluding Spain) | |||||||||||
| United Kingdom | |||||||||||
| United States | |||||||||||
| Rest of America | |||||||||||
| Rest of the world | |||||||||||
| Type | |||||||||||
| Demand deposits- | |||||||||||
| Current accounts | |||||||||||
| Savings accounts | |||||||||||
| Other demand deposits | |||||||||||
| Time deposits- | |||||||||||
| Fixed-term deposits and other term deposits | |||||||||||
| Home-purchase savings accounts | |||||||||||
| Discount deposits | |||||||||||
| Hybrid financial liabilities | |||||||||||
| Subordinated liabilities | |||||||||||
| Repurchase agreements | |||||||||||
Note 51 contains a detail of the residual maturity periods of financial liabilities at amortised cost.
621
22. Marketable debt securities
a) Breakdown
The detail, by classification and type, of Marketable debt securities is as follows:
| EUR million | |||||||||||
| 2023 | 2022 | 2021 | |||||||||
| Classification | |||||||||||
| Financial liabilities held for trading | |||||||||||
| Financial liabilities designated at fair value through profit or loss | |||||||||||
| Financial liabilities at amortized cost | |||||||||||
| Type | |||||||||||
| Bonds and debentures outstanding | |||||||||||
| Subordinated | |||||||||||
| Notes and other securities | |||||||||||
The distribution of the book value of debt securities issued by contractual maturity at 31 December 2023 is shown below:
| EUR million | ||||||||||||||||||||
| Within 3 months | 3 to 12 months | 1 to 3 years | 3 to 5 years | More than 5 years | Total | |||||||||||||||
| Subordinated debt | ||||||||||||||||||||
| Senior unsecured debt | ||||||||||||||||||||
| Senior secured debt | ||||||||||||||||||||
| Promissory notes and other securities | ||||||||||||||||||||
| Debt securities issued | ||||||||||||||||||||
The distribution by contractual maturity of the notional amounts of these debt securities issued at 31 December 2023 is as follows:
| EUR million | ||||||||||||||||||||
| Within 3 months | 3 to 12 months | 1 to 3 years | 3 to 5 years | More than 5 years | Total | |||||||||||||||
| Subordinated debt | ||||||||||||||||||||
| Senior unsecured debt | ||||||||||||||||||||
| Senior secured debt | ||||||||||||||||||||
| Promissory notes and other securities | ||||||||||||||||||||
| Debt securities issued | ||||||||||||||||||||
622
b) Bonds and debentures outstanding
The detail, by currency of issue, of 'Bonds and debentures outstanding' is as follows:
| 2023 | |||||||||||||||||
| EUR million | |||||||||||||||||
| Currency of issue | 2023 | 2022 | 2021 | Outstanding issue amount in foreign currency (Million) | Annual interest rate (%) | ||||||||||||
| Euro | |||||||||||||||||
| US dollar | |||||||||||||||||
| Pound sterling | |||||||||||||||||
| Brazilian real | |||||||||||||||||
| Chilean peso | |||||||||||||||||
| Other currencies | |||||||||||||||||
| Balance at end of year | |||||||||||||||||
623
The changes in 'Bonds and debentures outstanding' were as follows:
| EUR million | |||||||||||
| 2023 | 2022 | 2021 | |||||||||
| Balance at beginning of year | |||||||||||
| Net inclusion of entities in the Group | ( | ||||||||||
| Of which: | |||||||||||
| Auto ABS UK Loans PLC | ( | ||||||||||
| PSA Bank Deutschland GmbH | ( | ||||||||||
| Issues | |||||||||||
| Of which: | |||||||||||
| Banco Santander, S.A. | |||||||||||
| Banco Santander (Brasil) S.A. | |||||||||||
| Santander Consumer USA Holdings Inc. | |||||||||||
| Santander UK Group Holdings plc | |||||||||||
| Santander Consumer Finance, S.A. | |||||||||||
| Santander Holdings USA, Inc. | |||||||||||
| Banco Santander Totta, S.A. | |||||||||||
| Santander Consumer Bank S.p.A. | |||||||||||
| Santander Bank, National Association | |||||||||||
| Santander Consumer Bank AG | |||||||||||
| Banque Stellantis France (previously PSA Banque France) | |||||||||||
| Santander Bank Polska S.A. | |||||||||||
| Santander International Products, Plc. | |||||||||||
| Banco Santander - Chile | |||||||||||
| SC Germany S.A., Compartment Consumer 2023-1 | |||||||||||
| Santander Consumo 4, F.T. | |||||||||||
| SC Germany S.A., Compartment Consumer 2021-1 | |||||||||||
| Redemptions and repurchases | ( | ( | ( | ||||||||
| Of which: | |||||||||||
| Santander Consumer USA Holdings Inc. | ( | ( | ( | ||||||||
| Banco Santander (Brasil) S.A. | ( | ( | ( | ||||||||
| Banco Santander, S.A. | ( | ( | ( | ||||||||
| Santander UK Group Holdings plc | ( | ( | ( | ||||||||
| Santander Consumer Finance, S.A. | ( | ( | ( | ||||||||
| Banque Stellantis France (previously PSA Banque France) | ( | ( | ( | ||||||||
| Banco Santander - Chile | ( | ( | ( | ||||||||
| Banco Santander México, S.A., Institución de Banca Múltiple, Grupo Financiero Santander México | ( | ( | ( | ||||||||
| Santander Holdings USA, Inc. | ( | ( | |||||||||
| Exchange differences and other movements | |||||||||||
| Balance at year-end | |||||||||||
624
c) Notes and other securities
The notes of the Group (see Note 22.a) were issued basically by Santander Consumer Finance, S.A., Santander UK plc, Banco Santander (México), S.A. Institución de Banca Múltiple, Grupo Financiero Santander México, Banco Santander, S.A., Santander Consumer Bank AG, Banque Stellantis France, Banco Santander - Chile and Banco Santander S.A. - Uruguay.
d) Guarantees
Set forth below is information on the liabilities secured by assets:
| EUR million | |||||||||||
| 2023 | 2022 | 2021 | |||||||||
| Asset-backed securities | |||||||||||
| Of which, mortgage-backed securities | |||||||||||
| Other mortgage securities | |||||||||||
| Of which: mortgage-backed bonds | |||||||||||
| Covered bonds (non mortgage and export financing) | |||||||||||
The main characteristics of the assets securing the aforementioned financial liabilities are as follows:
1.Asset-backed securities
a.Mortgage-backed securities- these securities are secured by mortgage assets (see Note 10.e) with average maturities of more than ten years that must: be a first mortgage for acquisition of principal or second residence, be current in payments, have a loan-to-value ratio below 80 % and have a liability insurance policy in force covering at least the appraisal value. The value of the financial liabilities broken down in the foregoing table is lower than the balance of the assets securing them —securitised assets retained on the balance sheet— mainly because the Group repurchases a portion of the bonds issued, and in such cases they are not recognised on the liability side of the consolidated balance sheet.
b.Other asset - backed securities: includes asset-backed securities, notes issued by securitization funds collateralized mainly by mortgage loans that do not meet the above requirements and other loans (mainly personal loans with an average maturity of five years and loans to SMEs with average maturities of seven years ) and private issues of Santander Consumer USA Holdings Inc. collateralized by vehicles assigned under operating leases.
2.Other mortgage securities include mainly:
a.Mortgage-backed bonds with average maturities of more than ten years that are secured by a portfolio of mortgage loans and credits (included in secured loans —see note 10.b—) which must: not be classified as of procedural stage; have available appraisals performed by specialised entities; have a loan-to-value (LTV) ratio below 80 % in the case of home loans and below 60 % for loans for other assets and have sufficient liability insurance.
b.Other debt securities issued as part of the Group’s liquidity strategy in the UK, mainly covered bonds in the UK secured by mortgage loans and other assets.
Grupo Santander has a balance corresponding to mortgage bonds at 31 December 2023 of EUR 24,619 million (all of them issued in euros), which correspond to issues of Banco Santander, SA (with an outstanding face value of EUR 24,457 million).
The issuing entity may repay the mortgage bonds early, if this has been expressly established in the final conditions of the issue in question and in the conditions established there.
None of the mortgage bonds issued by Banco Santander have replacement assets involved.
During 2023, the Bank of Spain has published Circular 1/2023 of 4 February , which modifies Circular 4/2017, repealing the breakdown in the annual accounts and the information related to internal accounting development and management control.
Additionally, Banco Santander, S.A. issues internationalization certificates, which are securities whose capital and interest are guaranteed by loans and credits that are linked to the financing of export contracts or the internationalization of companies.
The fair value of the guarantees received by the Group (financial and non-financial assets) which the Group is authorised to sell or pledge even if the owner of the guarantee has not defaulted is scantly material taking into account the Consolidated financial statements as a whole.
625
23. Subordinated liabilities
a) Breakdown
The detail, by currency of issue, of Subordinated liabilities, deposits and marketable debt securities, in the consolidated balance sheets is as follows:
| 2023 | |||||||||||||||||
| EUR million | Outstanding issue amount in foreign currency (million) | Annual interest rate (%) | |||||||||||||||
| Currency of issue | 2023 | 2022 | 2021 | ||||||||||||||
| Euro | |||||||||||||||||
| US dollar | |||||||||||||||||
| Pound sterling | |||||||||||||||||
| Brazilian real | |||||||||||||||||
| Other currencies | |||||||||||||||||
| Balance at end of year | |||||||||||||||||
Note 51 contains a detail of the residual maturity periods of subordinated liabilities at each year-end.
b) Changes
The movement in the balance of subordinated liabilities in the last three years were as follows:
| EUR million | |||||||||||
| 2023 | 2022 | 2021 | |||||||||
| Balance at beginning of year | |||||||||||
| Net inclusion of entities in the Group | ( | ||||||||||
IssuancesA | |||||||||||
| Of which: | |||||||||||
| Banco Santander, S.A. | |||||||||||
| Banco Santander (Brasil) S.A. | |||||||||||
| Banque Stellantis France | |||||||||||
| Banco Santander - Chile | |||||||||||
Redemptions and repurchasesA | ( | ( | ( | ||||||||
| Of which: | |||||||||||
| Banco Santander, S.A. | ( | ( | ( | ||||||||
| Santander UK plc | ( | ( | |||||||||
| Banque Stellantis France | ( | ||||||||||
| Banco Santander México, S.A., Institución de Banca Múltiple, Grupo Financiero Santander México | ( | ||||||||||
| Exchange differences and other movements | ( | ||||||||||
| Balance at end of year | |||||||||||
A.The balance relating to issuances, redemptions and repurchases (EUR 5,226 million), together with the interest paid in remuneration of these issuances including PPCC (EUR 1,150 million), is included in the cash flow from financing activities.
c) Other disclosures
This caption includes contingent convertible or redeemable preferred participations, as well as other subordinated financial instruments issued by consolidated companies, which do not qualify as equity (preferred shares).
Preferred shares do not have voting rights and are non-cumulative. They have been subscribed by third parties outside the Group, and except for the issues of Santander UK plc, the rest are redeemable by decision of the issuer, according to the terms of each issue.
Banco Santander's contingently convertible preferred participations are subordinated debentures and rank after common creditors and any other subordinated credit that by law and/or by their terms, to the extent permitted by Spanish law, ranks higher than the contingently convertible preferred participations. Their remuneration is conditioned to the obtainment of sufficient distributable profits, and to the limitations imposed by the regulations on shareholders' equity, and they have no voting rights. The other issues of Banco Santander, S.A. mentioned in this caption are also subordinated debentures and, for credit ranking purposes, they rank behind all the common creditors of the issuing entities and ahead of any other subordinated credit that ranks pari passu with the Bank's contingently convertible preferred participations.
The main issues of subordinated debt securities issued, broken down by company, are detailed below:
626
Issues by Banco Santander, S.A.
At 29 December 2023, Banco Santander, S.A., proceeded to prepay all the Tier 1 Contingently Convertible Preferred Securities with ISIN code XS1692931121 for a total nominal amount of EUR 1,000 million and which were traded on the Irish Stock Market 'Global Exchange Market' (the 'PPCC').
At 21 November 2023, Banco Santander, S.A., carried out a placement of two series of contingently convertible preferred shares into newly issued ordinary shares of the Bank, for a total nominal amount of USD 1,150 million (EUR 1,054 million at the exchange rate on the day of issue) and USD 1,350 million (EUR 1,235 million at the exchange rate on the day of issue), respectively.
The issue was carried out at par and the remuneration of the PPCC, whose payment is subject to certain conditions and is also discretionary, was set (i) for the first Series at 9.625 % annually for the first five years and six months, being reviewed every five years thereafter by applying a margin of 530.6 basis points on the five-year UST rate (5-year UST), and (ii) for the second Series at 9.625 % annually for the first ten years , being reviewed thereafter every five years , applying a margin of 529.8 basis points on the five-year UST rate.
At 8 August 2023, Banco Santander, S.A. carried out an issue of subordinated obligations for an amount of 2,000 million dollars (1,821 million euros at the exchange rate on the day of issuance). The issue was carried out at par coupon was set at 6.921 % per year, payable semiannually during the 10-year life of the operation.
At 23 May 2023, Banco Santander, S.A. issued subordinated bonds for an amount of 1,500 million euros for a term of 10 years and 3 months. The issue was carried at 99.739 % and the coupon of the issue was set at 5.75 % annually for the first 5 years and 3 months, with the option of amortization in August 2028, revising the coupon, in case of non-amortization, at a margin of 285 points plus the Euro Swap type 5 years.
At 6 July 2022 and 20 July 2022, two subordinated issues matured for a nominal amount of EUR 114 million and EUR 25 million, respectively.
At 25 April 2022, Banco Santander, S.A. proceeded to prepay all the Tier 1 Contingently Convertible Preferred Securities with ISIN code XS1602466424 and common code 160246642 in circulation, for a total nominal amount of EUR 750 million and which were traded on the Irish Stock Market 'Global Exchange Market' (the 'PPCC').
At 22 November 2021, Banco Santander, S.A. issued subordinated debentures for a term of eleven years , with a redemption option on the tenth anniversary of the issue date, in the amount of USD 1,000 million (EUR 1,007 million at the exchange rate on the day of issue). The issue bears interest at an annual rate of 3.225 %, payable semi-annually, for the first ten years . This issue has an early redemption option in the tenth year from the issue date and if the redemption is not executed in the tenth year, the coupon is repriced at a margin of 160 points over the one-year US government bond.
At 4 October 2021, Banco Santander, S.A. issued subordinated debentures for a term of eleven years , with a redemption option on the sixth anniversary of the issue date, amounting to GBP 850 million (EUR 887 million at the exchange rate on the day of issue). The issue bears interest at an annual rate of 2.25 %, payable annually for the first six years (then repricing at a margin of 165 points over the 5-year UK government bond).
At 21 September 2021, Banco Santander, S.A. carried out a placement of preferential shares contingently convertible into newly issued ordinary shares of the Bank ('PPCC') for a nominal amount of EUR 1,000 million (issue placed on the market EUR 997 million). The issuance was carried out at par and the remuneration of the PPCC, whose payment is subject to certain conditions and is also discretionary, was set at 3.625 % per year for the first eight years , being reviewed every five years applying a margin of 376 basis points over the 5-year Mid-Swap Rate.
At 11 September 2021, Banco Santander, S.A. proceeded to redeem early and voluntarily the entire issue made on 11 September 2014 of tier 1 contingently convertible preference shares (PPCC) with ISIN code XS1107291541 which are traded in the Irish Stock Exchange Market 'Global Exchange Market', for a total nominal amount of EUR 1,500 million.
At 12 May 2021, Banco Santander, S.A. placed the issue of preference shares contingently convertible into newly issued ordinary shares of the Bank, previously announced, for a total nominal amount of EUR 1,578 million, issued in a Series in Dollars of USD 1,000 million (EUR 828 million at the exchange rate on the day of issue) and a Series in Euros for an amount of EUR 750 million. The issuance was carried out at par and the remuneration of the PPCC, whose payment is subject to certain conditions and is also discretionary, was set (i) for the Series in Dollars at 4.750 % per annum for the first six years , being revised every five years applying a margin of 375.3 basis points over the 5-year UST rate and (ii) for the Series in Euros by 4.125 % per annum for the first seven years , being revised every five years applying a margin of 431.1 basis points over the applicable 5-year euro mid-swap.
At 3 December 2020, Banco Santander, S.A. issued subordinated debentures with a ten-year term of USD 1,500 million (EUR 1,222 million at the date of issue). The issue bears interest at an annual rate of 2.749 %, payable semiannually.
At 22 October 2020, it carried out a ten-year subordinated debenture issue for an amount of EUR 1,000 million. The issue bears interest at an annual rate of 1.625 %, payable annually.
At 14 January 2020, it carried out a placement of contingently convertible preferred participations into newly issued ordinary shares of the Bank (the 'PPCCs'), excluding the pre-emptive subscription rights of its shareholders and for a nominal amount of EUR 1,500 million (the 'Issue' and the 'PPCCs'). The Issue was made at par and the remuneration of the PPCCs, the payment of which is subject to certain conditions and is also discretionary, was set at 4.375 % per annum for the first six years , revised every five years thereafter by applying a margin of 453.4 basis points over the 5-year Mid-Swap Rate (5-year Mid-Swap Rate).
627
At 8 February 2019, Banco Santander, S.A, carried out an issue of PPCC for a nominal amount of USD 1,200 million (EUR 1,056 million). The remuneration of the issues whose payment is subject to certain conditions and is also discretionary was set at 7.50 % per annum, for the first five years (revised thereafter by applying a margin of 498.9 points over the SOFR Spread Adjusted ICE Swap 5-year ).
At 19 March 2018, a 'PPCC' issue was carried out, for a nominal amount of EUR 1,500 million. The remuneration of the issue, the payment of which is subject to certain conditions and is also discretionary, was set at 4.75 % per annum, payable quarterly, for the first seven years (revised thereafter by applying a margin of 410 basis points over the Mid-swap rate).
At 8 February 2018, a ten-year subordinated debenture issue of EUR 1,250 million was carried out. The issue accrues annual interest of 2.125 % payable annually.
Issues by Banco Santander - Chile
In January 2022, Banco Santander - Chile carried out an issuance, in the local market, of subordinated obligations with a term of 6 years, for an amount of UF 3.3 million (equivalent to USD 105 million), which accrues an annual interest of 1.25 %.
In June 2020, Banco Santander - Chile issued subordinated debentures for a term of fifteen years , in the amount of UF 5 million (equivalent to USD 185 million). The issue bears annual interest at 3.5 %.
In April 2020, Banco Santander - Chile issued two subordinated debentures, the first for a term of fourteen years , for an amount of UF 3 million (equivalent to USD 100 million), bearing annual interest at 3 %, and the second for a term of nineteen years , for an amount of UF 3 million (equivalent to USD 100 million), bearing annual interest at 3.15 %.
Issues Banco Santander (Brasil) S.A.
At the beginning of October 2023, Banco Santander (Brasil) S.A. carried out an issue of Subordinated Financial Bills (TIER II) in its local market for a 10-year term, with a repurchase option as of the fifth anniversary of the issue date, in the amount of BRL 6,000 million. The issue price was CDI +1.6 % per annum, payable at maturity.
At the end of November 2021, Banco Santander (Brasil) S.A. carried out an issue of Subordinated Financial Bills (TIER II) in its local market for a 10-year term, with a repurchase option as of the fifth anniversary of the issue date, in the amount of BRL 5,500 million. The issue price was CDI 2 % per annum, payable at maturity.
Issues by Banco Santander México, S.A., Institución de Banca Múltiple, Grupo Financiero Santander México
In January 2022, Banco Santander México, S.A. Multiple Institution, Grupo Financiero Santander México proceeded to redeem early a perpetual issue carried out at 30 December 2016 for a nominal amount of USD 500 million, of which 88.2 % of the issue had been acquired by the Group.
At 1 October 2018, a ten-year subordinated debenture issue was made by Banco Santander México, S.A. Institución de Banca Múltiple, Grupo Financiero Santander México for a nominal amount of USD 1,300 million and at an interest rate of 5.95 %, with the group having acquired 75 % of the issue.
Issues by Santander Bank Polska S.A.
At 20 April 2018, Santander Bank Polska S.A. carried out a ten-year subordinated debenture issue with a redemption option on the fifth anniversary of the issue date in the amount of PLN 1,000 million. The issue bears floating interest at Wibor (6M) + 160 basis points payable semi-annually.
The accrued interests from the subordinated liabilities during 2023 amounted to EUR 1,049 million (EUR 992 million and EUR 648 million during 2022 and 2021, respectively).
In addition, interests from the PPCC and PPCA during 2023 amounted to EUR 492 million (EUR 529 million and EUR 566 million in 2022 and 2021, respectively).
24. Other financial liabilities
The detail of Other financial liabilities in the consolidated balance sheets is as follows:
| EUR million | |||||||||||
| 2023 | 2022 | 2021 | |||||||||
| Trade payables | |||||||||||
| Clearing houses | |||||||||||
| Tax collection accounts: | |||||||||||
| Public Institutions | |||||||||||
| Factoring accounts payable | |||||||||||
| Unsettled financial transactions | |||||||||||
| Lease liabilities (note 2.k) | |||||||||||
| Other financial liabilities | |||||||||||
Note 51 contains a detail of the residual maturity periods of other financial liabilities at each year-end.
Lease liabilities
The cash outflow of leases in 2023 was EUR 738 million (EUR 710 million and EUR 715 in 2022 and 2021, respectively).
The analysis of the maturities of lease liabilities at 31 December 2023, 2022 and 2021 is shown below:
| EUR million | |||||||||||
| 2023 | 2022 | 2021 | |||||||||
Maturity Analysis - Discounted payments | |||||||||||
| Within 1 year | |||||||||||
| Between 1 and 3 years | |||||||||||
| Between 3 and 5 years | |||||||||||
| Later than 5 years | |||||||||||
| Total discounted payments at the end of the year | |||||||||||
During 2023, 2022 and 2021 there were no significant variable lease payments not included in the valuation of lease liabilities.
628
25. Provisions
a) Breakdown
The detail of Provisions in the consolidated balance sheets is as follows:
| EUR million | |||||||||||
| 2023 | 2022 | 2021 | |||||||||
| Provision for pensions and other obligations post-employments | |||||||||||
| Other long term employee benefits | |||||||||||
| Provisions for taxes and other legal contingencies | |||||||||||
| Contingent liabilities and commitments (note 2.o) | |||||||||||
| Other provisions | |||||||||||
| Provisions | |||||||||||
b) Changes
The changes in 'Provisions' in the last three years were as follows:
| EUR million | |||||||||||||||||
| 2023 | |||||||||||||||||
| Post employment plans | Long term employee benefits | Contingent liabilities and commitments | Other provisions | Total | |||||||||||||
| Balances at beginning of year | |||||||||||||||||
| Incorporation of Group companies, net | ( | ( | |||||||||||||||
| Additions charged to income | ( | ||||||||||||||||
| Interest expense (note 39) | |||||||||||||||||
Staff costs (note 46) | |||||||||||||||||
| Provisions or reversion of provisions | ( | ||||||||||||||||
| Addition | |||||||||||||||||
| Release | ( | ( | ( | ( | ( | ||||||||||||
| Other additions arising from insurance contracts linked to pensions | |||||||||||||||||
| Changes in value recognised in equity | |||||||||||||||||
| Payments to pensioners and pre-retirees with a charge to internal provisions | ( | ( | ( | ||||||||||||||
| Insurance premiums paid | |||||||||||||||||
| Payments to external funds | ( | ( | |||||||||||||||
| Amounts used | ( | ( | ( | ||||||||||||||
| Transfer, exchange differences and other changes | ( | ( | ( | ||||||||||||||
| Balances at end of year | |||||||||||||||||
629
| EUR million | |||||||||||||||||||||||||||||||||||
| 2022 | 2021 | ||||||||||||||||||||||||||||||||||
| Post employment plans | Long term employee benefits | Contingent liabilities and commitments | Other provisions | Total | Post employment plans | Long term employee benefits | Contingent liabilities and commitments | Other provisions | Total | ||||||||||||||||||||||||||
| Balances at beginning of year | |||||||||||||||||||||||||||||||||||
| Incorporation of Group companies, net | |||||||||||||||||||||||||||||||||||
| Additions charged to income | ( | ||||||||||||||||||||||||||||||||||
| Interest expense (note 39) | |||||||||||||||||||||||||||||||||||
Staff costs (note 46) | |||||||||||||||||||||||||||||||||||
| Provisions or reversion of provisions | ( | ( | ( | ||||||||||||||||||||||||||||||||
| Addition | |||||||||||||||||||||||||||||||||||
| Release | ( | ( | ( | ( | ( | ( | ( | ( | ( | ( | |||||||||||||||||||||||||
| Other additions arising from insurance contracts linked to pensions | ( | ( | ( | ( | |||||||||||||||||||||||||||||||
| Changes in value recognised in equity | ( | ( | |||||||||||||||||||||||||||||||||
| Payments to pensioners and pre-retirees with a charge to internal provisions | ( | ( | ( | ( | ( | ( | |||||||||||||||||||||||||||||
| Insurance premiums paid | ( | ( | |||||||||||||||||||||||||||||||||
| Payments to external funds | ( | ( | ( | ( | |||||||||||||||||||||||||||||||
| Amounts used | ( | ( | ( | ( | |||||||||||||||||||||||||||||||
| Transfer, exchange differences and other changes | ( | ( | |||||||||||||||||||||||||||||||||
| Balances at end of year | |||||||||||||||||||||||||||||||||||
c) Provision for pensions and other obligations post –employments and Other long term employee benefits
The detail of Provisions for pensions and similar obligations is as follows:
| EUR million | |||||||||||
| 2023 | 2022 | 2021 | |||||||||
| Provisions for post-employment plans - Spanish entities | |||||||||||
| Provisions for other similar obligations - Spanish entities | |||||||||||
| Of which pre-retirements | |||||||||||
| Provisions for post-employment plans - United Kingdom | |||||||||||
| Provisions for post-employment plans - Other subsidiaries | |||||||||||
| Provisions for other similar obligations - Other subsidiaries | |||||||||||
| Provision for pensions and other obligations post -employments and Other long term employee benefits | |||||||||||
| Of which defined benefits | |||||||||||
i. Spanish entities - Post-employment plans and other similar obligations
At 31 December 2023, 2022 and 2021, the Spanish entities had post-employment benefit obligations under defined contribution and defined benefit plans. In addition, in various years some of the consolidated entities offered certain of their employees the possibility of taking pre-retirement and, therefore, provisions are recognised each year for the obligations to employees taking pre-retirement -in terms of salaries and other employee benefit costs- from the date of their pre-retirement to the agreed end date.
In December 2020, Banco Santander reached an agreement with the workers' representatives to implement an early retirement and incentivized dismissals plan, which was expected to benefit 3,572 employees during 2021, constituting a provision to cover these commitments amounting to EUR 688 million.
In 2021, to complete the plan announced in 2020, an amount of EUR 139 million was recognised, increasing the number of early retirements and incentivized dismissals plan to 3,915 employees in the total period.
In 2022, the provisions made to cover the commitments with 446 employees covered by early retirement and incentivized dismissals plan amounted to EUR 92 million.
In 2023, the provisions made to cover the commitments with 502 employees covered by early retirements and incentivized dismissals amounted to EUR 160 million.
On 8 July 2021, Banco Santander reached an agreement with the employee representatives for the transformation of defined benefit pension commitments into defined contributions for certain retired personnel from Banco Popular and Banco Pastor. Through the aforementioned Collective Agreement, it was agreed to carry out an offer to replace the life annuities that the passive personnel included in the scope of application of said Collective Agreement had been receiving, for a capitalization fund in the Santander Employees pension plan. The number of beneficiaries who exercised the voluntary option to accept the substitution of the life annuity for a capitalization fund in the Santander Employees pension plan amounted to 1,468 people.
The effect of the reduction of the aforementioned commitments is shown in the tables below under the headings 'Benefits paid by settlement' amounting to EUR 166 million and 'Effect reduction / settlement' amounting to EUR 38 million.
630
The expenses incurred by the Spanish companies in 2023, 2022 and 2021 in respect of contributions to defined contribution plans amounted to EUR 116 million, EUR 101 million and EUR 91 million, respectively.
The amount of the defined benefit obligations was determined on the basis of the work performed by independent actuaries using the following actuarial techniques:
1. Valuation method: projected unit credit method, which sees each period of service as giving rise to an additional unit of benefit entitlement and measures each unit separately.
2. Actuarial assumptions used: unbiased and mutually compatible. Specifically, the most significant actuarial assumptions used in the calculations were as follows:
| Post-employment plans | Other similar obligations | ||||||||||||||||||||||
| 2023 | 2022 | 2021 | 2023 | 2022 | 2021 | ||||||||||||||||||
| Annual discount rate | % | % | % | % | % | % | |||||||||||||||||
| Mortality tables | PE2020 M/F Col. Orden 1 | PE2020 M/F Col. Orden 1 | PE2020 M/F Col. Orden 1 | PE2020 M/F Col. Orden 1 | PE2020 M/F Col. Orden 1 | PE2020 M/F Col. Orden 1 | |||||||||||||||||
| Cumulative annual CPI growth | % | % | % | % | % | % | |||||||||||||||||
| Annual salary increase rate | N/A | N/A | N/A | ||||||||||||||||||||
| Annual social security pension increase rate | % | % | % | N/A | N/A | N/A | |||||||||||||||||
| Annual benefit increase rate | N/A | N/A | N/A | % | % | % | |||||||||||||||||
The discount rate used for the flows was determined by reference to high-quality corporate bonds (at least AA in euros) matching the durations of the commitments. From the bond portfolio considered, callable, putable and sinkable bonds, which could distort the rates, are excluded.
Any changes in the main assumptions could affect the calculation of the obligations. At 31 December 2023, if the discount rate used had been decreased or increased by 50 4.15 % (-50 bp) to -3.85 % (+50 bp),respectively, and an increase or decrease in the present value of the long-term obligations of 1.04 % (-50 bp) to -1.02 % (+50 bp), respectively.
631
These changes would be offset in part by increases or decreases in the fair value of the assets and insurance contracts linked to pensions.
3. The estimated retirement age of each employee is the first at which the employee is entitled to retire or the agreed-upon age, as appropriate.
The fair value of insurance contracts was determined as the present value of the related payment obligations, taking into account the following assumptions:
| Post-employment plans | Other similar obligations | ||||||||||||||||||||||
| 2023 | 2022 | 2021 | 2023 | 2022 | 2021 | ||||||||||||||||||
| Expected rate of return on plan assets | % | % | % | % | % | % | |||||||||||||||||
| Expected rate of return on reimbursement rights | % | % | % | N/A | N/A | N/A | |||||||||||||||||
The funding status of the defined benefit obligations in 2023 and the two preceding years is as follows:
| EUR million | |||||||||||||||||||||||
| Post-employment plans | Other similar obligations | ||||||||||||||||||||||
| 2023 | 2022 | 2021 | 2023 | 2022 | 2021 | ||||||||||||||||||
| Present value of the obligations | |||||||||||||||||||||||
| To current employees | |||||||||||||||||||||||
| Vested obligations to retired employees | |||||||||||||||||||||||
| To pre-retirees employees | |||||||||||||||||||||||
| Long-service bonuses and other benefits | |||||||||||||||||||||||
| Other | |||||||||||||||||||||||
| Less - Fair value of plan assets | |||||||||||||||||||||||
| Provisions - Provisions for pensions | |||||||||||||||||||||||
| Of which: | |||||||||||||||||||||||
| Internal provisions for pensions | |||||||||||||||||||||||
| Net pension assets | ( | ( | ( | ||||||||||||||||||||
| Insurance contracts linked to pensions (note 14) | |||||||||||||||||||||||
| Unrecognised net assets for pensions | ( | ( | ( | ||||||||||||||||||||
632
The amounts recognised in the consolidated income statements in relation to the aforementioned defined benefit obligations are as follows:
| EUR million | |||||||||||||||||||||||
| Post-employment plans | Other similar obligations | ||||||||||||||||||||||
| 2023 | 2022 | 2021 | 2023 | 2022 | 2021 | ||||||||||||||||||
| Current service cost | |||||||||||||||||||||||
| Interest cost (net) | |||||||||||||||||||||||
| Expected return on insurance contracts linked to pensions | ( | ( | ( | ||||||||||||||||||||
| Provisions or reversion of provisions | |||||||||||||||||||||||
| Actuarial (gains)/losses recognised in the year | ( | ( | |||||||||||||||||||||
| Past service cost | |||||||||||||||||||||||
| Pre-retirement cost | |||||||||||||||||||||||
OtherA | ( | ( | ( | ( | ( | ||||||||||||||||||
A.Including reduction/settlement effect
In addition, in 2023 'Other comprehensive income – Items not reclassified to profit or loss – Actuarial gains or (-) losses on defined benefit pension plans' has increased by EUR 10 million with respect to defined benefit obligations (decrease of EUR 295 and EUR 37 million in 2022 and 2021, respectively).
The changes in the present value of the accrued defined benefit obligations were as follows:
| EUR million | |||||||||||||||||||||||
| Post-employment plans | Other similar obligations | ||||||||||||||||||||||
| 2023 | 2022 | 2021 | 2023 | 2022 | 2021 | ||||||||||||||||||
| Present value of the obligations at beginning of year | |||||||||||||||||||||||
| Incorporation of Group companies, net | |||||||||||||||||||||||
| Current service cost | |||||||||||||||||||||||
| Interest cost | |||||||||||||||||||||||
| Pre-retirement cost | |||||||||||||||||||||||
| Effect of curtailment/settlement | ( | ( | ( | ( | ( | ||||||||||||||||||
| Benefits paid | ( | ( | ( | ( | ( | ( | |||||||||||||||||
| Benefits paid due to settlements | ( | ||||||||||||||||||||||
| Past service cost | |||||||||||||||||||||||
| Actuarial (gains)/losses | ( | ( | ( | ( | |||||||||||||||||||
| Demographic actuarial (gains)/losses | ( | ( | ( | ||||||||||||||||||||
| Financial actuarial (gains)/losses | ( | ( | ( | ( | |||||||||||||||||||
| Exchange differences and other items | ( | ( | ( | ||||||||||||||||||||
| Present value of the obligations at end of year | |||||||||||||||||||||||
633
The changes in the fair value of plan assets and of insurance contracts linked to pensions were as follows:
| Plan Assets | |||||||||||||||||||||||
| EUR million | |||||||||||||||||||||||
| Post-employment plans | Other similar obligations | ||||||||||||||||||||||
| 2023 | 2022 | 2021 | 2023 | 2022 | 2021 | ||||||||||||||||||
| Fair value of plan assets at beginning of year | |||||||||||||||||||||||
| Incorporation of Group companies, net | |||||||||||||||||||||||
| Expected return on plan assets | |||||||||||||||||||||||
| Gains/(losses) on settlements | ( | ||||||||||||||||||||||
| Benefits paid | ( | ( | ( | ( | ( | ( | |||||||||||||||||
| Contributions/(surrenders) | |||||||||||||||||||||||
| Actuarial gains/(losses) | ( | ( | ( | ||||||||||||||||||||
| Exchange differences and other items | ( | ( | |||||||||||||||||||||
| Fair value of plan assets at end of year | |||||||||||||||||||||||
| Insurance Contracts linked to pensions | |||||||||||||||||||||||
| EUR million | |||||||||||||||||||||||
| Post-employment plans | Other similar obligations | ||||||||||||||||||||||
| 2023 | 2022 | 2021 | 2023 | 2022 | 2021 | ||||||||||||||||||
| Fair value of insurance contracts linked to pensions at beginning of year | |||||||||||||||||||||||
| Incorporation of Group companies, net | |||||||||||||||||||||||
| Expected return on insurance contracts linked to pensions | |||||||||||||||||||||||
| Benefits paid | ( | ( | ( | ||||||||||||||||||||
| Paid premiums | |||||||||||||||||||||||
| Actuarial gains/(losses) | ( | ( | |||||||||||||||||||||
| Fair value of insurance contracts linked to pensions at end of year | |||||||||||||||||||||||
In view of the conversion of the defined-benefit obligations to defined-contribution obligations, the Group will not make material current contributions in Spain in 2024 to fund its defined-benefit pension obligations.
The plan assets and the insurance contracts linked to pensions are instrumented mainly through insurance policies.
The following table shows the estimated benefits payable at 31 December 2023 for the next ten years:
| EUR million | |||||
| 2024 | |||||
| 2025 | |||||
| 2026 | |||||
| 2027 | |||||
| 2028 | |||||
| 2029 to 2033 | |||||
634
ii. United Kingdom
At the end of each of the last three years, the businesses in the United Kingdom had post-employment benefit obligations under defined contribution and defined benefit plans. The expenses incurred in respect of contributions to defined contribution plans amounted to EUR 87 million in 2023 (EUR 77 million in 2022 and EUR 89 million in 2021).
The amount of the defined benefit obligations was determined on the basis of the work performed by independent actuaries using the following actuarial techniques:
1. Valuation method: projected unit credit method, which sees each period of service as giving rise to an additional unit of benefit entitlement and measures each unit separately.
2. Actuarial assumptions used: unbiased and mutually compatible. Specifically, the most significant actuarial assumptions used in the calculations were as follows:
| 2023 | 2022 | 2021 | |||||||||
| Annual discount rate | |||||||||||
| Mortality tables | The S3 Middle tables weighted at 84% of the CMI_2022 projection with an initial addition of 0.25%, smoothing parameter 7 and improving 1.25%. | The S3 Middle tables weighted at 84% of the CMI_2021 projection with an initial addition of 0.25%, smoothing parameter 7 and improving 1.25%. | The S3 Middle tables weighted at 84% of the CMI_2020 projection with an initial addition of 0.15%, smoothing parameter 7 and improving 1.25%. | ||||||||
| Cumulative annual CPI growth | |||||||||||
| Annual salary increase rate | |||||||||||
| Annual pension increase rate | |||||||||||
The discount rate used for the flows was determined by reference to high-quality corporate bonds (at least AA in pounds sterling) that coincide with the terms of the obligations.
Any changes in the main assumptions could affect the calculation of the obligations. At 31 December 2023, if the discount rate used had been decreased or increased by 50 6.89 % (-50 bp) and -6.18 % (+50 bp), respectively. If the inflation assumption had been increased or decreased by 50 4.69 % (+50 bp) and -4.51 % (-50 bp), respectively. These changes would be offset in part by increases or decreases in the fair value of the assets.
The funding status of the defined benefit obligations in 2023 and the two preceding years is as follows:
| EUR million | |||||||||||
| 2023 | 2022 | 2021 | |||||||||
| Present value of the obligations | |||||||||||
| Less- | |||||||||||
| Fair value of plan assets | |||||||||||
| Provisions - Provisions for pensions | ( | ( | ( | ||||||||
| Of which: | |||||||||||
| Internal provisions for pensions | |||||||||||
| Net assets for pensions | ( | ( | ( | ||||||||
The amounts recognised in the consolidated income statements in relation to the aforementioned defined benefit obligations are as follows:
| EUR million | |||||||||||
| 2023 | 2022 | 2021 | |||||||||
| Current service cost | |||||||||||
| Interest cost (net) | ( | ( | ( | ||||||||
| Provisions or reversal of provisions, net | |||||||||||
| Cost of services provided | |||||||||||
| Others | |||||||||||
| ( | ( | ||||||||||
In addition, in 2023 'Other comprehensive income – Items not reclassified to profit or loss – Actuarial gains or (-) losses on defined benefit pension plans' increased by EUR 687 million with respect to defined benefit obligations (increase of EUR 857 million and decrease of EUR 1,475 million in 2022 and 2021, respectively).
The changes in the present value of the accrued defined benefit obligations were as follows:
| EUR million | |||||||||||
| 2023 | 2022 | 2021 | |||||||||
| Present value of the obligations at beginning of year | |||||||||||
| Net incorporation of companies into the Group | ( | ||||||||||
| Current service cost | |||||||||||
| Interest cost | |||||||||||
| Benefits paid | ( | ( | ( | ||||||||
| Benefits paid by settlements | ( | ||||||||||
| Contributions made by employees | |||||||||||
| Past service cost | |||||||||||
| Actuarial (gains)/losses | ( | ( | |||||||||
| Demographic actuarial (gains)/losses | ( | ( | ( | ||||||||
| Financial actuarial (gains)/losses | ( | ( | |||||||||
| Exchange differences and other items | ( | ||||||||||
| Present value of the obligations at end of year | |||||||||||
635
The changes in the fair value of the plan assets were as follows:
| EUR million | |||||||||||
| 2023 | 2022 | 2021 | |||||||||
| Fair value of plan assets at beginning of year | |||||||||||
| Net incorporation of companies into the Group | ( | ||||||||||
| Expected return on plan assets | |||||||||||
| Benefits paid | ( | ( | ( | ||||||||
| Contributions | |||||||||||
| Actuarial gains/(losses) | ( | ( | |||||||||
| Exchange differences and other items | ( | ||||||||||
| Fair value of plan assets at end of year | |||||||||||
In 2024 the Group expects to make current contributions to fund these obligations for amounts similar to those made in 2023.
The main categories of plan assets as a percentage of total plan assets are as follows:
| 2023 | 2022 | 2021 | |||||||||
| Equity instruments | % | ||||||||||
| Debt instruments | % | % | % | ||||||||
| Properties | % | % | % | ||||||||
| Other | % | % | % | ||||||||
The following table shows the estimated benefits payable at 31 December 2023 for the next ten years:
| EUR million | |||||
| 2024 | |||||
| 2025 | |||||
| 2026 | |||||
| 2027 | |||||
| 2028 | |||||
| 2029 to 2033 | |||||
iii. Other foreign subsidiaries
Certain of the consolidated foreign entities have acquired commitments to their employees similar to post-employment benefits.
At 31 December 2023, 2022 and 2021, these entities had defined-contribution and defined-benefit post-employment benefit obligations. The expenses incurred in respect of contributions to defined contribution plans amounted to EUR 107 million in 2023 (EUR 118 million at 31 December 2022 and EUR 106 million at 31 December 2021).
The actuarial assumptions used by these entities (discount rates, mortality tables and cumulative annual CPI growth) are consistent with the economic and social conditions prevailing in the countries in which they are located.
Specifically, the discount rate used for the flows was determined by reference to high-quality corporate bonds, except in the case of Brazil where there is no extensive corporate bond market and, accordingly the discount rate was determined by reference to the series B bonds issued by the Brazilian National Treasury Secretariat for a term coinciding with that of the obligations. In Brazil the discount rate used was between 8.65 % and 8.70 %, the CPI 3.00 % and the mortality table the AT-2000 Basic.
Any changes in the main assumptions could affect the calculation of the obligations. At 31 December 2023, if the discount rate used had been decreased or increased by 50 4.49 % (-50 bp) and -4.16 % (+50 bp), respectively. These changes would be offset in part by increases or decreases in the fair value of the assets.
636
The funding status of the obligations similar to post-employment benefits and other long-term benefits in 2023 and the two preceding years is as follows:
| EUR million | ||||||||||||||
| 2023 | Of which business in Brazil | 2022 | 2021 | |||||||||||
| Present value of the obligations | ||||||||||||||
| Less- | ||||||||||||||
| Of which: with a charge to the participants | ||||||||||||||
| Fair value of plan assets | ||||||||||||||
| Provisions - Provisions for pensions | ( | |||||||||||||
| Of which: | ||||||||||||||
| Internal provisions for pensions | ||||||||||||||
| Net assets for pensions | ( | ( | ( | ( | ||||||||||
| Unrecognised net assets for pensions | ( | ( | ( | ( | ||||||||||
The amounts recognised in the consolidated income statements in relation to these obligations are as follows:
| EUR million | |||||||||||
| 2023 | 2022 | 2021 | |||||||||
| Current service cost | |||||||||||
| Interest cost (net) | |||||||||||
| Provisions or reversion of provisions | |||||||||||
| (Actuarial gains)/losses recognised in the year | |||||||||||
| Past service cost | |||||||||||
| Pre-retirement cost | ( | ||||||||||
| Other | ( | ( | ( | ||||||||
In addition, in 2023 'Other comprehensive income – Items not reclassified to profit or loss – Actuarial gains or (-) losses on defined benefit pension plans' increased by EUR 247 million with respect to defined benefit obligations (decreased EUR 320 million and EUR 193 million in 2022 and 2021, respectively).
The changes in the present value of the accrued obligations were as follows:
| EUR million | |||||||||||
| 2023 | 2022 | 2021 | |||||||||
| Present value of the obligations at beginning of year | |||||||||||
| Incorporation of Group companies, net | ( | ( | |||||||||
| Current service cost | |||||||||||
| Interest cost | |||||||||||
| Pre-retirement cost | ( | ||||||||||
| Effect of curtailment/settlement | ( | ( | ( | ||||||||
| Benefits paid | ( | ( | ( | ||||||||
| Benefits paid due to settlements | ( | ( | |||||||||
| Contributions made by employees | |||||||||||
| Past service cost | |||||||||||
| Actuarial (gains)/losses | ( | ( | |||||||||
| Demographic actuarial (gains)/losses | |||||||||||
| Financial actuarial (gains)/losses | ( | ( | |||||||||
| Exchange differences and other items | |||||||||||
| Present value of the obligations at end of year | |||||||||||
The changes in the fair value of the plan assets were as follows:
| EUR million | |||||||||||
| 2023 | 2022 | 2021 | |||||||||
| Fair value of plan assets at beginning of year | |||||||||||
| Incorporation of Group companies, net | ( | ( | |||||||||
| Expected return on plan assets | |||||||||||
| Benefits paid | ( | ( | ( | ||||||||
| Contributions | |||||||||||
| Actuarial gains/(losses) | ( | ( | |||||||||
| Exchange differences and other items | |||||||||||
| Fair value of plan assets at end of year | |||||||||||
In 2024 the Group expects to make contributions to fund these obligations for amounts similar to those made in 2023.
637
The main categories of plan assets as a percentage of total plan assets are as follows:
| 2023 | 2022 | 2021 | |||||||||
| Equity instruments | % | ||||||||||
| Debt instruments | % | ||||||||||
| Properties | % | ||||||||||
| Other | % | ||||||||||
The following table shows the estimated benefits payable at 31 December 2023 for the next ten years:
| EUR million | |||||
| 2024 | |||||
| 2025 | |||||
| 2026 | |||||
| 2027 | |||||
| 2028 | |||||
| 2029 to 2033 | |||||
d) Provisions for taxes and other legal contingencies and Other provisions
'Provisions - Provisions for taxes and other legal contingencies' and 'Provisions - Other provisions', which include, inter alia, provisions for restructuring costs and tax-related and non-tax-related proceedings, were estimated using prudent calculation procedures in keeping with the uncertainty inherent to the obligations covered. The definitive date of the outflow of resources embodying economic benefits for the Group depends on each obligation. In certain cases, these obligations have no fixed settlement period and, in other cases, depend on the legal proceedings in progress.
The detail, by geographical area, of Provisions for taxes and other legal contingencies and Other provisions is as follows:
| EUR million | |||||||||||
| 2023 | 2022 | 2021 | |||||||||
| Recognised by Spanish companies | |||||||||||
| Recognised by other EU companies | |||||||||||
| Recognised by other companies | |||||||||||
| Of which: | |||||||||||
| Brazil | |||||||||||
Set forth below is the detail, by type of provision, of the balance at 31 December 2023, 2022 and 2021 of Provisions for taxes and other legal contingencies and Other provisions.
The types of provision were determined by grouping together items of a similar nature:
| EUR million | |||||||||||
| 2023 | 2022 | 2021 | |||||||||
| Provisions for taxes | |||||||||||
| Provisions for employment-related proceedings (Brazil) | |||||||||||
| Provisions for other legal proceedings | |||||||||||
| Provision for customer remediation | |||||||||||
| Provision for restructuring | |||||||||||
| Other | |||||||||||
Relevant information is set forth below in relation to each type of provision shown in the preceding table.
The provisions for taxes include provisions for tax-related proceedings.
The provisions for employment-related proceedings (Brazil) relate to claims filed by trade unions, associations, the prosecutor’s office and ex-employees claiming employment rights to which, in their view, they are entitled, particularly the payment of overtime and other employment rights, including litigation concerning retirement benefits. The number and nature of these proceedings, which are common for banks in Brazil, justify the classification of these provisions in a separate category or as a separate type from the rest. The Group calculates the provisions associated with these claims in accordance with past experience of payments made in relation to claims for similar items. When claims do not fall within these categories, a case-by-case assessment is performed and the amount of the provision is calculated in accordance with the status of each proceeding and the risk assessment carried out by the legal advisers.
The provisions for other legal proceedings include provisions for court, arbitration or administrative proceedings (other than those included in other categories or types of provisions disclosed separately) brought against Grupo Santander companies.
The provisions for customer remediation include mainly the estimated cost of payments to remedy errors relating to the sale of certain products in the UK, as well as the estimated amount related to the floor clauses of Banco Popular Español, S.A.U. To calculate the provision for customer remediation, the best estimate of the provision made by management is used, which is based on the estimated number of claims to be received and, of these, the number that will be accepted, as well as the estimated average payment per case.
The provisions for restructuring include only the costs arising from restructuring processes carried out by the various Group companies.
Lastly, the Other heading contains very atomized and individually insignificant provisions, such as the provisions to cover the operational risk of the different offices of the Group.
Qualitative information on the main litigation is provided in Note 25 e to the consolidated financial statements.
638
The Group's general policy is to record provisions for tax and legal proceedings in which the Group assesses the chances of loss to be probable and the Group does not record provisions when the chances of loss are possible or remote. Grupo Santander determines the amounts to be provided for as its best estimate of the expenditure required to settle the corresponding claim based, among other factors, on a case-by-case analysis of the facts and the legal opinion of internal and external counsel or by considering the historical average amount of the loss incurred in claims of the same nature. The definitive date of the outflow of resources embodying economic benefits for the Group depends on each obligation. In certain cases, the obligations do not have a fixed settlement term and, in others, they depend on legal proceedings in progress.
Regarding their variations in fiscal year 2023, in provisions for labor processes and others of a legal nature, EUR 556 million and EUR 238 million were recorded in Brazil in 2023, making payments of EUR 269 million and EUR 227 million, respectively.
e) Litigation and other matters
i. Tax-related litigation
At 31 December 2023 the main tax-related proceedings concerning the Group were as follows:
•Legal actions filed by Banco Santander (Brasil) S.A. and other Group entities to avoid the application of Law 9.718/98, which modifies the basis to calculate Programa de Integraçao Social (PIS) and Contribuição para Financiamento da Seguridade Social (COFINS), extending it to all the entities income, and not only to the income from the provision of services. In relation of Banco Santander (Brasil) S.A. process, in 2015 the Federal Supreme Court (FSC) admitted the extraordinary appeal filed by the Federal Union regarding PIS, and dismissed the extraordinary appeal lodged by the Brazilian Public Prosecutor's Office regarding COFINS contribution, confirming the decision of Federal Regional Court favourable to Banco Santander (Brasil) S.A. of August 2007. The Federal Supreme Court also admitted the appeals related to the other Group entities both for PIS and COFINS. On June 13, 2023, the Federal Supreme Court ruled unfavorably two cases through General Repercussion (Theme 372), including Banco Santander (Brasil) S.A. case. The Bank has filed a new appeal, considering the possible loss as a contingent liability. The cases of the other Group entities are no longer susceptible of appeal and a provision has been recognized for the amount of the estimated loss.
•Banco Santander (Brasil) S.A. and other Group companies in Brazil have appealed against the assessments issued by the Brazilian tax authorities questioning the deduction of loan losses in their income tax returns (Imposto sobre a Renda das Pessoas Jurídicas - IRPJ - and Contribuçao Social sobre o Lucro Liquido -CSLL-) in relation to different administrative processes of various years on the ground that the requirements under the applicable legislation were not met. The appeals are pending decision in the administrative Court, the Conselho Adminisitrativo de Recursos Fiscais (CARF). No provision was recognised in connection with the amount considered to be a contingent liability.
•Banco Santander (Brasil) S.A. and other Group companies in Brazil are involved in administrative and legal proceedings against several municipalities that demand payment of the Service Tax on certain items of income from transactions not classified as provisions of services. There are several cases in different judicial instances. A provision was recognised in connection with the amount of the estimated loss.
•Banco Santander (Brasil) S.A. and other Group companies in Brazil are involved in administrative and legal proceedings against the tax authorities in connection with the taxation for social security purposes of certain items which are not considered to be employee remuneration. There are several cases in different judicial instances. A provision was recognised in connection with the amount of the estimated loss.
•In May 2003 the Brazilian tax authorities issued separate infringement notices against Santander Distribuidora de Títulos e Valores Mobiliarios, Ltda. (DTVM, actually Santander Brasil Tecnología S.A.) and Banco Santander (Brasil) S.A. in relation to the Provisional Tax on Financial Movements (Contribuição Provisória sobre Movimentação Financeira) of the years 2000 to 2002. The administrative discussion ended unfavourably for both companies, and on July 3, 2015, filed a lawsuit requesting the cancellation of both tax assessments. The lawsuit was judged unfavourably in first instance. Therefore, both plaintiffs appealed to the court of second instance. On December 2020, the appeal was decided unfavourably. Against the judgment, the bank filed a motion for clarification which has not been accepted. Currently it is appealed to higher courts. There is a provision recognized for the estimated loss.
•In December 2010 the Brazilian tax authorities issued an infringement notice against Santander Seguros S.A. (Brasil), (currently Zurich Santander Brasil Seguros e Previdência S.A.), as the successor by merger to ABN AMRO Brasil dois Participações S.A., in relation to income tax (IRPJ and CSLL) for 2005, questioning the tax treatment applied to a sale of shares of Real Seguros, S.A. The administrative discussion ended unfavourably, and the CARF decision has been appealed at the Federal Justice. As the former parent of Santander Seguros S.A. (Brasil) (currently Zurich Santander Brasil Seguros e Previdência S.A.), Banco Santander (Brasil) S.A. is liable in the event of any adverse outcome of this proceeding. No provision was recognised in connection with this proceeding as it is considered to be a contingent liability.
•In November 2014 the Brazilian tax authorities issued an infringement notice against Banco Santander (Brasil) S.A. in relation to corporate income tax (IRPJ and CSLL) for 2009 questioning the tax-deductibility of the amortisation of the goodwill of Banco ABN AMRO Real S.A. performed prior to the absorption of this bank by Banco Santander (Brasil) S.A., but accepting the amortisation performed after the merger. Actually it is appealed before the Higher Chamber of CARF. No provision was recognised in connection with this proceeding as it was considered to be a contingent liability.
639
•Banco Santander (Brasil) S.A. has also appealed against infringement notices issued by the tax authorities questioning the tax deductibility of the amortisation of the goodwill arising on the acquisition of Banco Comercial e de Investimento Sudameris S.A from years 2007 to 2012. No provision was recognised in connection with this matter as it was considered to be a contingent liability.
•Banco Santander (Brasil) S.A. and other companies of the Group in Brazil are undergoing administrative and judicial procedures against Brazilian tax authorities for not admitting tax compensation with credits derived from other tax concepts, not having registered a provision for the amount considered to be a contingent liability.
•Banco Santander (Brasil) S.A. is involved in appeals in relation to infringement notices initiated by tax authorities regarding the offsetting of tax losses in the CSLL of year 2009 and 2019. The appeals are pending decision at the administrative level. No provision was recognised in connection with this matter as it is considered to be a contingent liability.
•Banco Santander (Brasil) S.A. filed a suspensive judicial measure aiming to avoid the withholding income tax (Imposto sobre a Renda Retido na Fonte - IRRF), on payments derived from technology services provided by Group foreign entities. A favorable decision was handed down and an appeal was filed by the tax authority at the Federal Regional Court, where it awaits judgment. No provision was recognized as it is considered to be a contingent liability
•Brazilian tax authorities have issued infringement notices against Getnet Adquirência e Serviços para Meios de Pagamento S.A and Banco Santander (Brasil) S.A. as jointly liable in relation to corporate income tax (IRPJ and CSLL) for 2014 to 2018 questioning the tax-deductibility of the amortization of the goodwill from the acquisition of Getnet Tecnologia Proces S.A., considering that the company would not have complied with the legal requirements for such amortization. A defense against the tax assessment notices were submitted, and the appeal is pending decision in CARF. No provision was recognized as it is considered to be a contingent liability.
The total amount for the aforementioned Brazil lawsuits that are fully provisioned is EUR 815 million, and for lawsuits that qualify as contingent liabilities is EUR 5,567 million.
•Banco Santander appealed before European Courts the Decisions 2011/5/CE of 28 October 2009 (First Decision), and 2011/282/UE of 12 January 2011 (Second Decision) of the European Commission, ruling that the deduction of the financial goodwill regulated pursuant to Article 12.5 of the Corporate Income Tax Law constituted illegal State aid. On October 2021 the Court of Justice definitively confirmed these Decisions. The dismissal of the appeal, that only affects these two decisions, had no impact on results.
At the date of approval of these consolidated annual accounts, there are other less significant tax disputes.
ii. Non-tax-related proceedings
At 31 December 2023 the main non-tax-related proceedings concerning the Group were as follows:
•Payment Protection Insurance (PPI):the dispute relates to the liability for PPI mis-selling complaints relating to pre-2005 PPI policies that two entities of the Axa Group (hereinafter "Axa France" acquired from Genworth Financial International Holdings, Inc. in September 2015. The dispute involves Santander Cards UK Limited (formerly known as GE Capital Bank Limited which was acquired by Banco Santander, S.A. from GE Capital group in 2008) which was the distributor of the policies in dispute and Santander Insurance Services UK Limited (the Santander Entities).
In July 2017, the Santander Entities notified Axa France that they did not accept liability for losses on PPI policies relating to the relevant period. Santander UK plc entered into a Complaints Handling Agreement (CHA) with Axa France pursuant to which it agreed to handle complaints on their behalf, and Axa France agreed to pay redress assessed to be due to relevant policyholders on a without prejudice basis. A standstill agreement was entered into between the Santander Entities and Exe France as a condition of the CHA.
In July 2020, Genworth announced that it had agreed to pay Axa SA circa GBP 624 million in respect of PPI mis-selling losses in settlement of the related dispute concerning obligations under the sale and purchase agreement pursuant to which Genworth sold Axa France to Axa SA. The CHA between Santander UK plc and Axa France terminated on 26 December 2020. On 30 December 2020 Axa France provided written notice to the Santander Entities to terminate the standstill agreement. During 2021, Axa France commenced litigation in the High Court of England and Wales (Commercial Curt) against the Santander Entities seeking recovery of GBP 636 million (EUR 733.5 million) (plus interest) and any further losses relating to pre-2005 PPI.
Judgment in respect of the Santander Entities application for Axa Frances’s claim to be struck out/summarily dismissed was handed down by the Commercial Court on 12 July 2022. In summary, the Commercial Court upheld a significant part of the Santander Entities’ strike-out application and required Axa France to re-plead a significant portion of its pleadings. Axa France updated the amount of losses claimed from GBP 636 million (EUR 733.5 million) to GBP 670 million (EUR 772.7 million) (plus interest) in their Re-Amended Particulars of Claim dated December 2022 (RAPOC).
On 31 January 2023, the Santander Entities filed their Defence to the RAPOC and an Additional Claim. In response, Axa France conceded its claim for charges paid to Santander Entities pursuant to the CHA, reducing the overall value of its claim from GBP 670 million (EUR 772.7 million) to GBP 552 million (EUR 636.6 million) (plus interest) and has agreed to the requested rectification. Axa France filed its Re-Re-Amended Particulars of Claim on 29 June 2023. Trial has been fixed for six weeks, beginning on 3 March 2025.
640
Overall, there remains significant uncertainty as to how the dispute will be resolved. There are ongoing factual issues to be resolved which may have legal consequences including in relation to liability. These issues create uncertainties which mean that it is difficult to reliably predict the outcome of the matter.
In addition, and in relation to PPI more generally, the PPI provision includes an amount relating to legal claims challenging the FCA's industry guidance on the treatment of the Plevin judgment and of recurring non-disclosure assessments. This provision is based on current stock levels, future projected claims, and average redress. There remains a risk that the number of claims issued (whether individually or on a collective basis) in the future may be higher than forecast. The actual cost of customer compensation could differ from the amount provided. It is not currently practicable to provide an estimate of the risk and amount of any further financial impact.
•Motor Finance Broker Commissions: following the FCA’s Motor Market review in 2019 which resulted in a change in rules in January 2021, Santander Consumer (UK) plc (SCUK) has received a number of county court claims and complaints in respect of its historical use of discretionary commission arrangements (DCAs) prior to the 2021 rule changes. In the context of the complaints made to the Financial Ombudsman Service relating to such commission arrangements, the FCA announced on 11 January 2024 that it intends to use its powers under s166 of the Financial Services and Markets Act 2000 to review the historical use of DCAs between lenders and credit brokers (the “FCA Review”) and whether redress should be payable. In line with the FCA's announcement, we have paused the response to customer complaints until at least 20 November 2024. A claim has been issued against SCUK, Santander UK plc and others in the Competition Appeal Tribunal (CAT), alleging that SCUK’s historical commission arrangements in respect of used car financing operated in breach of the Competition Act 1998. While it is possible that certain charges may be incurred in relation to existing or future county court claims, complaints and the CAT proceedings, it is not considered that a legal or constructive obligation has been incurred in relation to these matters that would require a provision to be recognised at this stage. The resolution of such matters is not possible to predict with any certainty and there remain significant inherent uncertainties regarding the existence, scope and timing of any possible outflow which make it impracticable to disclose the extent of any potential financial impact.
•Delforca: dispute arising from equity swaps entered into by Gaesco (now Delforca 2008, S.A. (Delforca)) on shares of Inmobiliaria Colonial, S.A. Banco Santander, S.A. is claiming to Delforca before the Court of Barcelona in charge of the bankruptcy proceedings, a total of EUR 66 million from the liquidation resulting from the early termination of financial transactions due to Delforca's non-payment of the equity swaps. In the same bankruptcy proceedings, Delforca and Mobiliaria Monesa, S.A., parent of Delforca (Monesa) have in turn claimed the Bank to repay EUR 57 million, which the Bank received for the enforcement of the agreed guarantee, as a result of the aforementioned liquidation. On 16 September 2021 the Commercial Court Number 10 of Barcelona has ordered Delforca to pay the Bank EUR 66 million plus EUR 11 million in interest and has dismissed the claims filed by Delforca. This decision has been appealed by Delforca, Monesa and the bankruptcy administrator. On 1 June 2023, the appeal hearing took place and on 15 November 2023 the Provincial Court of Barcelona rendered a judgment dismissing the appeals filed by Delforca, Monesa and the bankruptcy administrator and confirming the first instance judgment. Delforca and Monesa (not the bankruptcy administrator) have filed an appeal in cassation before the Supreme Court against the judgment of the Provincial Court of Barcelona.
Separately, Monesa, filed in 2009 a civil procedure with the Courts of Santander against the Bank claiming damages that have not been specified to date. The procedure is suspended.
•Former employees of Banco do Estado de São Paulo S.A., Santander Banespa, Cia. de Arrendamiento Mercantil: class action filed by AFABESP (an association of retirees and former Banespa employees) claiming payment of a semi-annual bonus provided for in the Bank's bylaws. The final decision rendered on the merits was unfavorable to Santander. However, a favorable decision was subsequently rendered stating that each beneficiary of the decision shall file an individual lawsuit to receive the due amount.
Since the judgments adopted different positions for each case, a procedure called Incident for the Resolution of Repetitive Demands (IRDR) was commenced before the Regional Labor Court (TRT) with the purpose of establishing objective criteria regarding the arguments brought by the Bank, mainly the statute of limitations and limitation of payments until December 2006 (Plan V) .
Finally, due to the divergence between the interpretation of the Federal Constitution, an Action for Allegation of Non-Compliance with a Fundamental Precept (ADPF) was also filed, so that the Federal Supreme Court (STF) settles the issue and indicates the correct statute of limitations to be used in the individual cases filed.
Santander Brazil's external advisers have classified the risk as probable. The recorded provisions are considered sufficient to cover the risks associated with the legal claims that are being substantiated as of 31 December 2023.
641
•'Planos Económicos': like the rest of the banking system in Brazil, Santander Brazil has been the target of customer complaints and collective civil suits stemming mainly from legislative changes and its application to bank deposits (economic plans). At the end of 2017, an agreement between regulatory entities and the Brazilian Federation of Banks (Febraban) with the purpose of closing the lawsuits was reached and was approved by the Supremo Tribunal Federal. Discussions focused on specifying the amount to be paid to each affected client according to the balance in their notebook at the time of the Plan. Finally, the total value of the payments will depend on the number of adhesions there may be and the number of savers who have proved the existence of the account and its balance on the date the indexes were changed. In November 2018, the STF ordered the suspension of all economic plan proceedings for two years from May 2018. On 29 May 2020, the STF approved the extension of the agreement for 5 additional years starting from 3 June 2020. Condition for this extension was to include in the agreement actions related to the 'Collor I Plan'. On 31 December 2023, the provision recorded for the economic plan proceedings amounts to EUR 196.3 million.
•Floor clauses: as a consequence of the acquisition of Banco Popular Español, S.A.U. (Banco Popular), the Group has been exposed to a material number of transactions with floor clauses. The so-called floor clauses are those under which the borrower accepts a minimum interest rate to be paid to the lender, regardless of the applicable reference interest rate. Banco Popular included floor clauses in certain asset-side transactions with customers. In relation to this type of clauses, and after several rulings issued by the Court of Justice of the European Union (CJEU) and the Spanish Supreme Court, and the extrajudicial process established by the Spanish Royal Decree-Law 1/2017, of 20 January, Banco Popular made provisions that were updated in order to cover the effect of the potential return of the excess interest charged for the application of the floor clauses between the contract date of the corresponding mortgage loans and May 2013. On 31 December 2023, after having processed most of the customer requests, the potential residual loss associated with ongoing court proceedings is estimated at EUR 52.6 million, amount which is fully covered by provisions.
•Banco Popular´s acquisition: after the declaration of the resolution of Banco Popular, some investors filed claims against the EU’s Single Resolution Board decision, and the FROB's resolution executed in accordance with the aforementioned decision. Likewise, numerous appeals were filed against Banco Santander, S.A. alleging that the information provided by Banco Popular was erroneous and requesting from Banco Santander, S.A. the restitution of the price paid for the acquisition of the investment instruments or, where appropriate, the corresponding compensation.
In relation to these appeals, on the one hand, the General Court of the European Union (GCUE) selected 5 appeals from among all those filed before the European courts by various investors against the European institutions and processed them as pilot cases. On 1 June 2022, the GCUE rendered five judgements in which it completely dismissed the appeals, (i) supporting the legality of the resolution framework applied to Banco Popular, (ii) confirming the legality of the action of the European institutions in the resolution of Banco Popular and (iii) rejecting, in particular, all the allegations that there were irregularities in the sale process of Banco Popular to Banco Santander, S.A. Although four of these five judgments were initially appealed in cassation before the CJEU, in July 2023 one of the appellants withdrew his appeal. Therefore, only the appeals against three judgments are pending before the CJEU.
On the other hand, in relation to the lawsuits initiated by investors directly against Banco Santander, S.A. derived from the acquisition of Banco Popular, on 2 September 2020, the Provincial Court of La Coruña submitted a preliminary ruling to the CJEU in which it asked for the correct interpretation of the Article 60, section 2 of Directive 2014/59/EU of the European Parliament and of the Council of 15 May, establishing a framework for the restructuring and resolution of credit institutions and investment services companies. Said article establishes that, in the cases of redemption of capital instruments in a bank resolution, no liability will subsist in relation to the amount of the instrument that has been redeemed. On 5 May 2022, the CJEU rendered its judgement confirming that Directive 2014/59/EU of the European Parliament and of the Council does not allow that, after the total redemption of the shares of the share capital of a credit institution or an investment services company subject to a resolution procedure, the shareholders who have acquired shares within the framework of a public subscription offer issued by said company before the start of such a resolution procedure, exercise against that entity or against its successor, an action for liability for the information contained in the prospectus, under Directive 2003/71/EC of the European Parliament and of the Council, or an action for annulment of the subscription contract for those shares, which, taking into account its retroactive effects, gives rise to the restitution of the equivalent value of said shares, plus the interest accrued from the date of execution of said contract.
Regarding this judgment, several courts have referred additional preliminary rulings before the CJEU: (i) in December 2022 the Supreme Court requested three preliminary rulings in respect of its applicability to the holders of subordinated obligations, preferred stocks and subordinated bonds of Banco Popular; (ii) in April 2023, the First Instance Court 3 of Santa Coloma de Farners requested three preliminary rulings to the CJEU asking about pre-emptive subscription rights and the compatibility of the principles of proportionality and legal certainty with the bringing of legal actions by former holders of pre-emptive subscription rights and shares against the entity issuing the securities or against the entity succeeding it, which have been stayed by the CJEU until the preliminary rulings raised by the Supreme Court are resolved; and (iii) in November 2023, the Supreme Court requested another two preliminary rulings which supplement the ones requested in December 2022, regarding to a holder of subordinated bonds who filed a claim against Banco Popular before the resolution.
642
Separately, the Central Court of Instruction 4 is currently conducting preliminary proceedings 42/2017, in which, amongst other things, the following is being investigated: (i) the accuracy of the prospectus for the capital increase with subscription rights carried out by Banco Popular in 2016; and (ii) the alleged manipulation of the share price of Banco Popular until the resolution of the bank in June 2017. During the course of the proceedings, on 30 April 2019, the Spanish National Court, ruled in favour of Banco Santander, S.A. declaring that Banco Santander, S.A. cannot inherit Banco Popular’s potential criminal liability. This ruling was appealed before the Supreme Court, which rejected it. In these proceedings, Banco Santander, S.A. could potentially be subsidiarily liable for the civil consequences. In view of the CJEU ruling of 5 May 2022, the Bank requested confirmation of the exclusion of its subsidiary civil liability status in this criminal proceeding. On 26 July 2022, the Court rejected this request stating that it is a matter to be determined at a later procedural time. This decision was confirmed on appeal by the Chamber of the National Court by judgment of 5 October 2022. The instruction expired on 29 April 2023. The instruction expired on 29 April 2023. On 15 January 2024, the National Court notified the parties that within the first half of February 2024, they will be notified with the ruling transforming the proceedings into an abbreviated procedure.
The estimated cost of any compensation to shareholders and bondholders of Banco Popular recognized in the 2017 accounts amounted to EUR 680 million, of which EUR 535 million were applied to the commercial loyalty program. The CJEU judgement of 5 May 2022 represented a very significant reduction in the risk associated with these claims.
•German shares investigation: the Cologne Public Prosecution Office is conducting an investigation against the Bank, and other group entities based in UK - Santander UK plc, Santander Financial Services Plc and Cater Allen International Limited -, in relation to a particular type of tax dividend linked transactions known as cum-ex transactions.
The Group is cooperating with the German authorities. According to the state of the investigations, the result and the effects for the Group, which may potentially include the imposition of material financial penalties, cannot be anticipated. For this reason, the Bank has not recognized any provisions in relation to the potential imposition of financial penalties.
•Banco Santander, S.A. was sued in a legal proceeding in which the plaintiff alleges that the Bank breached his contract as CEO of the institution: in the lawsuit, the claimant mainly requested a declaratory ruling upholding the existence, validity and effectiveness of such contract and its enforcement together with the payment of certain amounts. For the case that the main request is not granted, the claimant sought a compensation for a total amount of approximately EUR 112 million or, an alternative relief for other minor amounts. Banco Santander, S.A. answered to the legal action stating that the conditions to which the appointment of that position was subject to were not met; that the executive services contract required by law was not concluded; and that in any case, the parties could terminate the contract without any justified cause.
•On 17 May 2021, the plaintiff reduced his claims for compensation to EUR 61.9 million. On 9 December 2021, the Court upheld the claim and ordered the Bank to compensate the claimant in the amount of EUR 67.8 million. By court order of 13 January 2022, the Court corrected and supplemented its judgment, reducing the total amount to be paid by the Bank to EUR 51.4 million and clarifying that part of this amount (buy out) was to be paid under the terms of the offer letter, i.e., entirely in Banco Santander shares, within the deferral period for this type of remuneration at the plaintiff's former employer and subject to the performance metrics or parameters of the plan in force at the Bank, which was that of 2018. As explained in note 5 of the report of the consolidated annual accounts of the year 2022, the degree of performance of these objectives was 33.3 %.
The Bank filed an appeal against the judgment before the Madrid Court of Appeal, which was opposed by the plaintiff. At the same time, the plaintiff filed an application for provisional enforcement of the judgment in the First Instance Court. A court order was issued ordering enforcement of the judgment, and the Bank deposited in the court bank account the full amount provisionally awarded to the claimant, including interest, for an approximate sum of EUR. 35.5 million, within the voluntary compliance period.
On 6 February 2023, Banco Santander was notified with the judgment of 20 January 2023 by which the Madrid Court of Appeal partially upheld the appeal filed by the Bank. The judgment has reduced the amount to be paid by EUR 8 million, which, to the extent that this amount was already paid in the provisional partial enforcement of the judgement of first instance court, must be returned to the Bank together with other amounts for interest, which the appeal judgement also rejects. The plaintiff deposited circa EUR 9.6 million. This amount was received by the Bank on 11 July 2023.
On 11 April 2023, the Bank filed an extraordinary appeal for procedural infringement and an appeal in cassation against the Madrid Court of Appeal’s judgment before Spanish Supreme Court. Existing provisions cover the estimated risk of loss.
•Universalpay Entidad de Pago, S.L. (Upay): has filed a lawsuit against Banco Santander, S.A. for breach of the marketing alliance agreement (MAA) and claims payment (EUR 1,050 million). The MAA was originally entered into by Banco Popular and its purpose is the rendering of acquiring services (point of sale payment terminals) for businesses in the Spanish market. The lawsuit was mainly based on the potential breach of clause 6 of the MAA, which establishes certain obligations of exclusivity, non-competition and customer referral. On 16 December 2022, the Court ruled in favour of the Bank and dismissed the plaintiff's claim in its entirety. The decision has been appealed before the Provincial Court of Madrid and the Bank has filed its opposition to Upay's appeal.
Considering the decision at first instance and following the analysis carried out by the Bank's external lawyers, with the best information available to date, it is considered that no provision needs to be registered.
643
•CHF Polish Mortgage Loans: on 3 October 2019, the CJEU rendered its decision in relation to a judicial proceeding against an unrelated bank in Poland considering that certain contractual clauses in CHF-Indexed loan agreements were abusive. The CJEU left to Polish courts the decision on whether the whole contract can be maintained once the abusive terms have been removed, which should in turn decide whether the effects of the annulment of the contract are prejudicial to the consumer. In case of maintenance of the contract, the court may only integrate the contract with subsidiary provisions of national law and decide, in accordance with those provisions, on the applicable rate.
In 2021, the Supreme Court was expected to take a position regarding the key issues in dispute concerning loans based on foreign currency, clarifying the discrepancies and unifying case law. The Supreme Court met several times, with the last session taking place on 2 September 2021. However, the resolution was not adopted and instead, the Supreme Court referred questions to the CJEU on constitutional issues of the Polish judiciary system. No new date for consideration of the issue has been set and no comprehensive decision by the Supreme Court of the issue is expected in the near future. In the absence of a comprehensive position of the Supreme Court, it is difficult to expect a full unification of judicial decisions, and decisions of the Supreme Court and CJEU issued on particular issues may be important for shaping further case law on CHF matters. The case law of the Polish courts has not yet been fully formed, but the prevailing line of case law is based on the annulment of the loan contract.
On 15 June 2023, the CJEU issued its judgment in Case C-520/21, in which it confirmed that it is national law that is relevant to determine the effect of cancellation of a contract - respecting the principles arising from Directive 93/13/EEC. According to the ruling of the CJEU in that case, the bank's claims in excess of the repayment of the nominal amount of the loan's principal and, as the case may be, the payment of default interest are contrary to the objectives of Directive 93/13/EEC if they were to lead to a profit analogous to the one it intended to make from the performance of the contract and thus eliminate the deterrent effect.
At the same time, the CJEU ruled that, under European law, there is no obstacle to the consumer being able to claim compensation from the bank beyond the return of the installments paid, but at the same time stipulated that such a claim should be evaluated in light of all the circumstances of the case, so that the consumer's possible benefits from the cancellation of the contract do not exceed what is necessary to restore the factual and legal situation in which he would have been without entering into the defective contract and do not constitute an excessive sanction for the entrepreneur (principle of proportionality).
The Polish Financial Supervisory Authority (KNF) on 17 February and on 15 June 2023 expressed its disagreement with the conclusions of the Attorney General that preceded the 15 June 2023 judgment and subsequently, with the judgment itself expressing, in particular, that the ruling is contrary to the principles of proportionality and balance between the protection of values protected by Directive 93/13 and superior values such as stability and security of the financial system.
The case law of national courts implementing the CJEU rulings (including the ruling of 15 June 2023), and the possible position of the Supreme Court will be crucial for the final assessment of the legal risk related to this matter.
At the date of the Group's consolidated financial statements, it is not possible to predict the Supreme Court’s and CJEU decisions on individual cases. Santander Bank Polska and Santander Consumer Bank Poland estimate legal risk using a model which considers different possible outcomes and regularly monitor court rulings on foreign currency loans to verify changes in case law practice.
As of 31 December 2023, Santander Bank Polska S.A. and Santander Consumer Bank S.A. maintain a portfolio of mortgages denominated in or indexed to CHF for an approximate gross amount of PLN 6,398.1 million (EUR 1,473.1 million). As of 1 January 2022, in accordance with IFRS 9 and based on the new best available information, the accounting methodology was adapted so that the gross carrying amount of mortgage loans denominated and indexed in foreign currencies is reduced by the amount in which the estimated cash flows are not expected to cover the gross amount of loans, including as a result of legal controversies relating to these loans. In the absence of exposure or insufficient gross exposure, a provision according to IAS 37 is recorded.
As of 31 December 2023, the total value of adjustment to gross carrying amount in accordance with IFRS9 as well as provisions recorded under IAS37, amount to PLN 5,030.3 million (EUR 1,158.2 million) of which PLN 4,226.9 million (EUR 973.2 million) corresponds to adjustment to gross carrying amount under IFRS 9 and PLN 803.4 million (EUR 185.0 million) to provisions recognized in accordance with IAS 37. Throughout 2023, the adjustment to gross carrying amount in accordance with IFRS9 amounted to PLN 1,651.0 million (EUR 363.6 million), the additional provisions under IAS37 amounted to PLN 445.2 million (EUR 98.1 million) and other costs related to the dispute amounted to PLN 455.8 million (EUR 100.4 million).
These provisions represent the best estimate as at 31 December 2023. Santander Bank Polska and Santander Consumer Bank Poland will continue to monitor and assess appropriateness of those provisions.
644
In December 2020, the KNF presented a proposal for voluntary settlements between banks and borrowers under which CHF loans would be retrospectively settled as PLN loans bearing an interest rate based on WIBOR plus margin. The KNF continues to support the concept of offering such settlements by banks after the verdict of the CJEU on 15 June 2023. The Bank has prepared settlement proposals which consider both the key elements of conversion of home loans indexed to CHF, as proposed by the KNF Chairman, and the conditions defined internally by the Bank. The proposals are being presented to customers. This is reflected in the model which is currently used to calculate legal risk provisions...
•Banco Santander Mexico: dispute regarding a testamentary trust constituted in 1994 by Mr. Roberto Garza Sada in Banca Serfin (currently Santander Mexico) in favor of his four sons in which he affected shares of Alfa, S.A.B. de C.V. (respectively, Alfa and the Trust). During 1999, Mr. Roberto Garza Sada instructed Santander México in its capacity as trustee to transfer 36,700,000 shares from the Trust's assets to his sons and daughters and himself. These instructions were ratified in 2004 by Mr. Roberto Garza Sada before a Notary Public.
Mr. Roberto Garza Sada passed away on 14 August 2010 and subsequently, in 2012, his daughters filed a complaint against Santander Mexico alleging it had been negligent in its trustee role. The lawsuit was dismissed at first instance in April 2017 and on appeal in 2018. In May 2018, the plaintiffs filed an appeal (recurso de amparo) before the First Collegiate Court of the Fourth Circuit based in Nuevo León, which ruled in favor of the plaintiffs on 7 May 2021, annulling the 2018 appeal judgment and condemning Santander Mexico to the petitions claimed, consisting of the recovery of the amount of 36,700,000 Alfa shares, together with dividends, interest and damages.
Santander Mexico has filed various constitutional reviews and appeals against the recurso de amparo referred to above, which have been dismissed by the Supreme Court of Justice of the Nation. As of this date, an amparo review filed by the Bank is pending to be resolved in the Collegiate Courts in the State of Nuevo León, thus the judgment is not final.
On 29 June 2022, Santander México, within the framework of the amparo review filed by the Bank, requested the First Collegiate Court in Civil Matters of the Fourth Circuit of Nuevo León the recusal of two of the three Magistrates who rendered against Santander Mexico, which was resolved in favour of Santander Mexico. Plaintiffs requested the recusal of the third Magistrate who ruled with a dissenting vote against the recurso de amparo referred above and this was resolved in favour of Plaintiffs, and consequently the matter has been referred to the Second Collegiate Court of the Fourth Circuit based in Nuevo León, for it to resolve the matter.
Santander México believes that the actions taken should prevail and reverse the decision against it. The impact of a potential unfavorable resolution for Santander México will be determined in a subsequent proceeding and will also depend on the additional actions that Santander México may take in its defense, so it is not possible to determine it at this time. At the current stage of the proceedings, the provisions recorded are considered to be sufficient to cover the risks deriving from this claim.
•URO Property Holdings, S.A. (before URO Property Holdings, SOCIMI SA): on 16 February 2022, legal proceedings were commenced in the Commercial Court of London against Uro Property Holdings S.A. (Uro), a subsidiary of Banco Santander, S.A., by BNP Paribas Trust Corporation UK Limited (BNP) in its capacity as trustee on behalf of certain bondholders and beneficiaries of security rights. The litigation concerns certain terms of a financing granted to Uro which was supported by a bond issue in 2015. The claimant seeks a declaration by the Court and a monetary award against Uro, in connection with an additional premium above the nominal value of the financing repayment because of Uro having lost its status as SOCIMI (Sociedad Anónima Cotizada de Inversión Inmobiliaria), such loss causing the prepayment of the bond issue and, in the opinion of the claimant BNP, also the obligation to pay the additional premium by Uro. Uro denies being liable to pay that additional premium and filed its defense statement and a counterclaim against the claimant. The trial hearing has been scheduled for November and December 2024. Furthermore, Uro filed a summary judgement application for BNP's claim to be dismissed before trial. The dismissal of this application by the Commercial Court was confirmed by the Appeal Court. It is estimated that the maximum loss associated with this possible contingency, amounts to approximately EUR 250 million.
Banco Santander and the other Group companies are subject to claims and, therefore, are party to certain legal proceedings incidental to the normal course of their business including those in connection with lending activities, relationships with employees and other commercial or tax matters additional to those referred to here.
With the information available to it, the Group considers that, at 31 December 2023, it had reliably estimated the obligations associated with each proceeding and had recognized, where necessary, sufficient provisions to cover reasonably any liabilities that may arise as a result of these tax and legal risks. Disputes in which provisions have been registered but are not disclosed is justified on the basis that it would be prejudicial to the proper defense of the Group. Subject to the qualifications made, it also believes that any liability arising from such claims and proceedings will not have, overall, a material adverse effect on the Group’s business, financial position, or results of operations.
26. Other liabilities
The detail of Other liabilities in the consolidated balance sheets is as follows:
| EUR million | |||||||||||
| 2023 | 2022 | 2021 | |||||||||
| Transactions in transit | |||||||||||
| Accrued expenses and deferred income | |||||||||||
| Other | |||||||||||
645
27. Tax matters
a) Consolidated Tax Group
Pursuant to current legislation, the Consolidated Tax Group includes Banco Santander, S.A. (as the parent) and the Spanish subsidiaries that meet the requirements provided for in Spanish legislation regulating the taxation of the consolidated profits of corporate groups (as the controlled entities).
The other Group companies file income tax returns in accordance with the tax regulations applicable to them.
b) Years open for review by the tax authorities
In January 2024 Spanish tax authorities formalized acts with agreement, conformity and non-conformity relating to the corporate income tax financial years 2017 to 2019.
The adjustments signed in conformity and with agreement had not impact on results and, in relation to the concepts signed in disconformity both for these years and for previous years (corporate income tax 2003 to 2015), Banco Santander, S.A., as the Parent of the Consolidated Tax Group, considers, in accordance with the advice of its external lawyers, that the adjustments made should not have a significant impact on the consolidated financial statements, as there are sound arguments as proof in the appeals filed against them pending at the National Appellate Court (tax years 2003 to 2011) and at the Central Economic Administrative Court (tax years 2012-2015), as well as in the acts that are still pending review by Spanish tax authorities. Consequently, no provision has been recorded for this concept. It should also be noted that, in those cases where it has been considered appropriate, the mechanisms available to avoid international double taxation have been used.
At the date of approval of these consolidated annual accounts subsequent years up to and including 2023, are subject to review.
The other entities have the corresponding years open for review, pursuant to their respective tax regulations.
Because of the possible different interpretations which can be made of the tax regulations, the outcome of the tax audits of the rest of years subject to review might give rise to contingent tax liabilities which cannot be objectively quantified. However, the Group’s tax advisers consider that it is unlikely that such tax liabilities will materialize, and that in any event the tax charge arising therefrom would not materially affect the Group’s consolidated financial statements.
c) Reconciliation
The reconciliation of the income tax expense calculated at the tax rate applicable in Spain (30
| EUR million | |||||||||||
| 2023 | 2022 | 2021 | |||||||||
| Consolidated profit (loss) before tax: | |||||||||||
| From continuing operations | |||||||||||
| From discontinued operations | |||||||||||
| Income tax at tax rate applicable in Spain (30%) | |||||||||||
By the effect of application of the various tax rates applicable in each countryA | ( | ||||||||||
| Of which: | |||||||||||
| Brazil | |||||||||||
| United Kingdom | ( | ( | ( | ||||||||
| United States | ( | ( | ( | ||||||||
| Chile | ( | ( | ( | ||||||||
| Poland | ( | ( | |||||||||
| Effect of profit or loss of associates and joint ventures | ( | ( | ( | ||||||||
| USA electric vehicle leasing incentives | ( | ||||||||||
| Effect of reassessment of deferred taxes | |||||||||||
Permanent differences and other | ( | ||||||||||
| Current income tax | |||||||||||
| Effective tax rate | % | % | |||||||||
| Of which: | |||||||||||
| Continuing operations | |||||||||||
| Of which: | |||||||||||
| Current taxes | |||||||||||
| Deferred taxes | ( | ||||||||||
| Income tax (receipts)/payments | |||||||||||
A.Calculated by applying the difference between the tax rate applicable in Spain and the tax rate applicable in each jurisdiction to the profit or loss contributed to the Group by the entities which operate in each jurisdiction.
646
d) Tax recognised in equity
In addition to the income tax recognised in the consolidated income statement, the Group recognised the following amounts in consolidated equity in 2023, 2022 and 2021:
| EUR million | |||||||||||
| 2023 | 2022 | 2021 | |||||||||
| Other comprehensive income | |||||||||||
| Items not reclassified to profit or loss | ( | ||||||||||
| Actuarial gains or (-) losses on defined benefit pension plans | ( | ||||||||||
| Changes in the fair value of equity instruments measured at fair value through other comprehensive income | ( | ( | |||||||||
| Financial liabilities at fair value with changes in results attributable to changes in credit risk | ( | ||||||||||
| Other recognised income and expense of investments in subsidiaries, joint ventures and associates | ( | ||||||||||
| Items that may be reclassified to profit or loss | ( | ||||||||||
| Cash flow hedges | ( | ||||||||||
| Changes in the fair value of debt instruments through other comprehensive income | ( | ||||||||||
| Other recognised income and expense of investments in subsidiaries, joint ventures and associates | ( | ||||||||||
| Total | ( | ||||||||||
e) Deferred taxes
'Tax assets' in the consolidated balance sheets includes debit balances with the Public Treasury relating to deferred tax assets. 'Tax liabilities' includes the liability for the Group’s various deferred tax liabilities.
In accordance with EU Regulation 575/2013 on prudential requirements for credit institutions and investment firms (CRR), and subsequently amended by EU Regulation 2019/876 of the European Parliament and of the Council, deferred tax assets that do not rely on future profitability arising from temporary differences (referred to hereinafter as 'monetizable deferred tax assets’) meeting certain conditions, should not be deducted from regulatory capital and should not be risk-weighted at 250% according to the thresholds set out in Article 48 of the said Regulation, but shall apply a risk weight of 100% under Article 39.
647
The detail of deferred tax assets, by classification as monetizable or non-monetizable assets, and of deferred tax liabilities at 31 December 2023, 2022 and 2021 is as follows:
| EUR million | ||||||||||||||||||||||||||
| 2023 | 2022 | 2021 | ||||||||||||||||||||||||
MonetizableA | Other | MonetizableA | Other | MonetizableA | Other | |||||||||||||||||||||
| Tax assets | ||||||||||||||||||||||||||
| Tax losses and tax credits | — | — | — | |||||||||||||||||||||||
| Temporary differences | ||||||||||||||||||||||||||
| Of which: | ||||||||||||||||||||||||||
| Non-deductible provisions | — | — | — | |||||||||||||||||||||||
| Valuation of financial instruments | — | — | — | |||||||||||||||||||||||
| Loan losses | ||||||||||||||||||||||||||
| Pensions | ||||||||||||||||||||||||||
| Valuation of tangible and intangible assets | — | — | — | |||||||||||||||||||||||
| Tax liabilities | — | — | — | |||||||||||||||||||||||
| Temporary differences | — | — | — | |||||||||||||||||||||||
| Of which: | ||||||||||||||||||||||||||
| Valuation of financial instruments | — | — | — | |||||||||||||||||||||||
| Valuation of tangible and intangible assets | — | — | — | |||||||||||||||||||||||
| Investments in Group companies | — | — | — | |||||||||||||||||||||||
A.In 2023, the Spanish Economic Administrative Court ruled that in 2017 the requirements for the conversion of part of the monetizable assets of Popular Group into a credit against the Tax Administration were met, allowing the conversion to 995 million euros. This amount has been paid to Banco Santander, without impact on results. The favorable Economic Administrative Court decision has been declared harmful to the public interests and challenged at the National Appellate Court by the Tax Administration. The estimation of this appeal would imply that Grupo Santander should repay the amount refunded and would, once again, credit these monetizable assets with no impact on results except for late payment interests. However, it is considered that there are strong defense arguments in relation to this appeal.
Grupo Santander only recognises deferred tax assets for temporary differences or tax loss and tax credit carryforwards where it is considered probable that consolidated entities that generated them will have sufficient future taxable profits against which they can be utilised.
The deferred tax assets and liabilities are reassessed at the reporting date in order to ascertain whether any adjustments need to be made on the basis of the findings of the analyses performed.
These analyses take into consideration all evidence, both positive and negative, of the recoverability of such deferred tax assets, among which we can find, (i) the results generated by the different entities in previous years, (ii) the projections of results of each entity or fiscal group, (iii) the estimation of the reversal of the different temporary differences according to their nature and (iv) the period and limits established under the applicable legislation of each country for the recovery of the different deferred tax assets, thus concluding on the ability of each entity or fiscal group to recover the deferred tax assets registered.
The projections of results used in this analysis are based on the financial planning approved by both the local directions of the corresponding units and by the Group's directors. The Group's budget estimation process is common for all units. The Group's management prepares its financial planning based on the following key assumptions:
a)Microeconomic variables of the entities that make up the fiscal group in each location: the existing balance structure, the mix of products offered and the commercial strategy at each moment defined by local directions are taken into account, based on the competition, regulatory and market environment.
b)Macroeconomic variables: estimated growths are based on the evolution of the economic environment considering the expected evolution in the gross domestic product of each location, and the forecasts of interest rates, inflation and exchange rates fluctuations. These data are provided by the Group’s Studies Service, based on external sources of information.
Additionally, the Group performs retrospective contrasts (backtesting) on the variables projected in the past. The differential behaviour of these variables with respect to the real market data is considered in the projections estimated in each fiscal year. Thus, and in relation to Spain, the deviations identified by the Directors in recent past years are due to non-recurring events outside the operation of the business, such as the impacts due to the first application of new regulations, the costs assumed for the acceleration of the restructuring plans and the changing effect of the current macroeconomic environment.
648
Finally, and given the degree of uncertainty of these assumptions on the referred variables, the Group conducts a sensitivity analysis of the most significant assumptions considered in the deferred tax assets’ recoverability analysis, considering any reasonable change in the key assumptions on which the projections of results of each entity or fiscal group and the estimation of the reversal of the different temporary differences are based.
In relation to Spain, the sensitivity analysis has consisted of making reasonable changes to the key assumptions, mainly by adjusting 50 basis points for growth (gross domestic product) and adjusting 50 basis points for inflation.
Relevant information is set forth below for the main countries which have recognised deferred tax assets:
Spain
The deferred tax assets recognised at the Consolidated Tax Group total EUR 8,125 million, of which EUR 5,670 million were for monetizable temporary differences with the right to conversion into a credit against the tax administration, EUR 1,774 million for other temporary differences and EUR 681 million for tax losses and credits.
Brazil
The deferred tax assets recognised in Brazil total EUR 7,896 million, of which EUR 5,328 million were for monetizable temporary differences, EUR 1,507 million for other temporary differences and EUR 1,061 million for tax losses and credits.
Mexico
The deferred tax assets recognized in Mexico total EUR 1,456 million, which are temporary differences.
United States
The deferred tax assets recognised in the United States total EUR 932 million, of which EUR 423 million were for temporary differences and EUR 509 million for tax losses and credits.
The Group estimates that the recognised deferred tax assets for temporary differences, tax losses and credits in the different jurisdictions could be recovered in a maximum period of 15 years.
649
The changes in Tax assets - Deferred and Tax liabilities - Deferred in the last three years were as follows:
| EUR million | ||||||||||||||||||||
| Balances at 31 December 2022 | (Charge)/Credit to income | Foreign currency balance translation differences and other items | (Charge)/Credit to asset and liability valuation adjustments | Acquisition for the year (net) | Balances at 31 December 2023 | |||||||||||||||
| Deferred tax assets | ( | ( | ( | |||||||||||||||||
| Tax losses and tax credits | ( | |||||||||||||||||||
| Temporary differences | ( | ( | ( | |||||||||||||||||
| Of which monetizable | ( | ( | ||||||||||||||||||
| Deferred tax liabilities | ( | ( | ( | |||||||||||||||||
| Temporary differences | ( | ( | ( | |||||||||||||||||
| ( | ( | ( | ||||||||||||||||||
| EUR million | ||||||||||||||||||||
| Balance at 31 December 2021 | (Charge)/Credit to income | Foreign currency balance translation differences and other items | (Charge)/Credit to asset and liability valuation adjustments | Acquisition for the year (net) | Balance at 31 December 2022 | |||||||||||||||
| Deferred tax assets | ||||||||||||||||||||
| Tax losses and tax credits | ||||||||||||||||||||
| Temporary differences | ||||||||||||||||||||
| Of which monetizable | ( | |||||||||||||||||||
| Deferred tax liabilities | ( | ( | ( | ( | ( | |||||||||||||||
| Temporary differences | ( | ( | ( | ( | ( | |||||||||||||||
| ( | ( | |||||||||||||||||||
| EUR million | ||||||||||||||||||||
| Balances at 31 December 2020 | (Charge)/Credit to income | Foreign currency balance translation differences and other items | (Charge)/Credit to asset and liability valuation adjustments | Acquisition for the year (net) | Balance at 31 December 2021 | |||||||||||||||
| Deferred tax assets | ( | |||||||||||||||||||
| Tax losses and tax credits | ||||||||||||||||||||
| Temporary differences | ( | |||||||||||||||||||
| Of which monetizable | ( | |||||||||||||||||||
| Deferred tax liabilities | ( | ( | ( | ( | ( | |||||||||||||||
| Temporary differences | ( | ( | ( | ( | ( | |||||||||||||||
| ( | ||||||||||||||||||||
Also, the Group did not recognise deferred tax assets amounting to approximately EUR 11,788 million of which EUR 7,228 million relate to tax losses, EUR 3,648 million to tax credits, and EUR 912 million to other concepts.
650
f) Global Minimum Tax Pillar Two
In the European Union, in December 2022, was adopted Council Directive 2022/2523 on ensuring an overall minimum level of taxation for multinational enterprise groups and large domestic groups in the EU, that had to be transposed by 31 December 2023, entering into force the new minimum taxation on 1 January 2024. The Directive implements at EU level the Pillar Two rules of the OECD's Inclusive Framework on base erosion and profit shifting. Pillar Two applies to multinational groups with a turnover of more than EUR 750 million and entails a minimum tax of 15% calculated on adjusted accounting profit on a jurisdiction-by-jurisdiction basis. In 2023, the OECD has completed these rules by approving administrative guidance and a report on safe harbours in order to simplify their application.
In Spain, on 19 December 2023 the preliminary draft law transposing the European Directive establishing a minimum overall tax level of 15% for multinational companies and large domestic groups was published. Once approved, the law will enter into force on 1 January 2024. Pillar Two legislation has also been enacted or is in the process of being enacted in the United Kingdom and in most EU Member States.
The Group is in scope of this legislation and has performed an assessment of its potential exposure to Pillar Two income taxes taking into consideration the transitory safe harbours. Once the legislation is approved in Spain, Banco Santander S.A. will be the ultimate parent entity liable to pay the additional tax due for those subsidiaries located in jurisdictions below the minimum effective tax rate of 15%. Group entities will also be subject to tax in those countries where a domestic global minimum tax is approved according to the Pillar Two rules.
The assessment of the potential exposure to Pillar Two income taxes is based on the most recent tax filings, country-by-country reporting and financial statements for the Group entities. Based on this assessment, the Pillar Two effective tax rates in most of the jurisdictions in which the Group operates are above 15%. Consequently, the Group does not estimate a significant impact derived from this new regulation, without prejudice to the relevant administrative burdens that will entail its implementation.
g) Tax reforms
The following significant tax reforms were approved in 2023 and previous years:
In Spain, in 2020 the General State Budget Law for 2021 established, among other tax measures, the non deductibility in Corporation Tax of management fees on participations whose dividends or capital gains are exempt, determining the amount of these expenses as a 5% of the dividends or capital gains. In 2021 the General State Budget Law for 2022 established a minimum effective tax rate of 15% (18% for financial entities) on corporate income tax base. In 2022, Law 38/2022 established a new temporary levy on credit institutions and financial credit institutions for fiscal years 2023 and 2024. The levy is calculated as 4.8% of net interest and fees earned in the business carried out in Spain in the precedent year and the payment obligation arises on the first day of each period. Accordingly, this new levy was recorded in January 2023 for an amount of 224 million euros that has been paid during 2023. In January 2024, an estimated amount of 335 million euros has been registered for this concept. Additionally, this law also established a 50% limitation on the integration of negative individual taxable bases into the consolidated tax group’s tax base. This limitation has been in force only in 2023, with a 10 year deadline for the reversal of this positive adjustment.
In December 2023, Royal Decree-Law 8/2023, was approved, which foresees the revision of the configuration of the temporary levy on credit institutions and financial credit institutions during the financial year 2024 for its inclusion into the tax system and its agreement with the Basque Country and Navarre.
In the United Kingdom, the Budget Act for 2021 increased the main Corporation Tax rate from 19% to 25% with effect from 1 April 2023. In addition, and also with effect from 1 April 2023, the Bank Surcharge tax rate was reduced from 8% to 3%, so the corporate tax rate for banks is set at 28%.
In Brazil, Provisional Measure 1.115/2022 and the subsequent Law 14,446, established a temporary increase from 31 August 2022 to 31 December 2022 in 2022 in the rate of contribution on net income (CSLL) of banks from 20% to 21% and for other financial institutions, from 15% to 16%. In addition, Law 14,467/2022, with effect from 2025, amends the rules on the tax deductibility of credit provisions in financial institutions, bringing those rules closer to the accounting recognition criterion. In the tax on financial operations (IOF) in 2021, the applicable rate was 0,38% for credit transactions, increasing temporally to 2.04% for legal persons and to 4.08% for natural persons. Decree 10.997/2022 established the reduction to 0% of the IOF applicable to foreign financing and lending transactions, and a gradual reduction in the rates applicable to foreign exchange transactions until their reduction to 0% as from 2 January 2029.
651
In December 2023, Congress approved Constitutional Amendment 132/2023 on indirect taxation reform. This reform replaces the various existing indirect taxes in Brazil, (applicable at the federal, regional and municipal levels), with two taxes administered at federal level (contribution on goods and services and selective tax) and other administered at the regional and municipal levels (tax on goods and services). The reform will be implemented through Complementary Laws to be approved during 2024. The new system will be gradually implemented over a transitional period of 8 years (from 2026 to 2033).
In Argentina, Law n.º 27630 (National Bulletin of 16 June 2021) amended, with retroactive effect to 1 January 2021, the rate applicable to the corporate income tax, establishing a progressive rate scale which for Banco Santander Argentina S.A. represents an increase from 30% to 35%. In addition, the 7% withholding on dividend distribution was maintained (however, the distribution of pre-2018 reserves is not subject to withholding tax). In addition, during the first quarter of the year 2021, there was an increase in the tax on gross income to financial institutions in both, the City of Buenos Aires (from 7% to 8%) and the Province of Buenos Aires (from 7% to 9%) and also reducing certain exemptions. Finally, since 2019, different laws on the adjustment for tax inflation have been approved in order to partially defer the adjustment.
In the United States, during 2022, the Inflation Reduction Act (IRA) was approved, which, among other measures, imposed a minimum taxation on the accounting performance of certain large companies, through the introduction of a new Alternative Minimum Tax (AMT) as of 2023, as well as relevant tax credits related with investments in clean energies.
In Chile, Law n.º 21,210 on modernization of Chilean tax law was enacted in 2020. It includes several modifications to different tax laws in force in Chile. Among the aspects included, it is worth highlighting the substitute tax that on a temporary basis until 30 April 2022 allows taxing at 30% (instead of the generally applicable 35%) with a credit of the first category tax paid, the tax profits generated up to the 31 December 2016, reducing the fiscal cost of its distribution and other measures about asset depreciation and indirect taxes.
h) Other information
In compliance with the disclosure requirement established in the listing rules instrument 2005 published by the UK Financial Conduct Authority, it is hereby stated that shareholders of the Bank resident in the United Kingdom will be entitled to a tax credit for taxes paid abroad in respect of withholdings that the Bank has to pay on the dividends to be paid to such shareholders if the total income of the dividend exceeds the amount of exempt dividends of GBP 1,000 for the year 2023/24 (GBP 2,000 for the year 2022/2023). The shareholders of the Bank resident in the United Kingdom who hold their ownership interest in the Bank through Santander Nominee Service will be informed directly of the amount thus withheld and of any other data they may require to complete their tax returns in the United Kingdom. The other shareholders of the Bank resident in the United Kingdom should contact their bank or securities broker.
On 18 January 2024, the Spanish Constitutional Court annulled the mandatory reversal of impairment losses that were deducted in previous years and the application of additional limits on the offsetting of tax losses and double taxation deductions introduced in the corporate income tax Law by Royal Decree-Law 3/2016. The application of the Court resolution to previous tax years will not have an impact on results, and the impact on the corporate income tax return that will be filled in 2024 is not expected to be relevant.
Banco Santander, S.A., is part of the Large Business Forum and has adhered since 2010 to the Code of Good Tax Practices in Spain. Also Santander UK is a member of the HMRC’s (His Majesty's Revenue and Customs) Code of Practice on Taxation in the United Kingdom and Santander Portugal has adhered to the Code of Good Tax Practices in Portugal, actively participating in the cooperative compliance programs being developed by these Tax Administrations.
652
28. Non-controlling interests
Non-controlling interests include the net amount of the equity of subsidiaries attributable to equity instruments that do not belong, directly or indirectly, to the Bank, including the portion attributed to them of profit for the year.
a) Breakdown
The detail, by Group company, of 'Equity - Non-controlling interests' is as follows:
| EUR million | |||||||||||
| 2023 | 2022 | 2021 | |||||||||
| Santander Bank Polska S.A. | |||||||||||
| Grupo PSA | |||||||||||
| Santander Consumer USA Holdings Inc. | |||||||||||
| Banco Santander - Chile | |||||||||||
| Banco Santander (Brasil) S.A. | |||||||||||
| Banco Santander México, S.A. Institución de Banca Múltiple, Grupo Financiero Santander México | |||||||||||
Other companiesA | |||||||||||
| Profit/(Loss) for the year attributable to non-controlling interests | |||||||||||
| Of which: | |||||||||||
| Santander Consumer USA Holdings Inc. | |||||||||||
| Grupo PSA | |||||||||||
| Banco Santander - Chile | |||||||||||
| Banco Santander (Brasil) S.A. | |||||||||||
| Santander Bank Polska S.A. | |||||||||||
| Banco Santander México, S.A. Institución de Banca Múltiple, Grupo Financiero Santander México | |||||||||||
| Other companies | |||||||||||
| TOTAL | |||||||||||
A.Includes perpetual Santander UK plc equity instruments convertible at the option of Santander UK plc into preferred shares of Santander UK plc. During 2022, three issues were redeemed early for a nominal amount of GBP 1,700 million (EUR 1,977 million) of which the Group had repurchased GBP 1,050 million (EUR 1,221 million). At 2023 year-end, the outstanding balance on these equity instruments amounted to GBP 500 million (EUR 576 million) (EUR 564 million and EUR 1,363 million in 2022 and 2021, respectively).
b) Changes
The changes in Non-controlling interests are summarised as follows:
| EUR million | |||||||||||
| 2023 | 2022 | 2021 | |||||||||
| Balance at the end of the previous year | |||||||||||
| Balance at beginning of year | |||||||||||
| Other comprehensive income | ( | ||||||||||
| Other | ( | ||||||||||
| Profit attributable to non-controlling interests | |||||||||||
Modification of participation ratesA | ( | ( | ( | ||||||||
| Change of perimeter | ( | ( | |||||||||
| Dividends paid to minority shareholders | ( | ( | ( | ||||||||
Changes in capital and other conceptsB | ( | ||||||||||
| Balance at end of year | |||||||||||
A.Include the effects of the public offer for the acquisition of shares of Banco Santander México, S.A., Institución de Banca Múltiple, Grupo Financiero Santander México that occurred in 2023, purchase of shares of Santander Holdings USA, Inc. on Santander Consumer USA Holdings Inc. that occurred in 2022 and of the public offer for the acquisition of shares of Banco Santander México, S.A., Institución de Banca Múltiple, Grupo Financiero Santander México that occurred in 2021 (see note 3.b).
B.Includes the effect of the amortization of AT1 UK by EUR 756 million at closing of fiscal year 2022.
The foregoing changes are shown in the consolidated statement of changes in total equity.
c) Other information
The financial information on the subsidiaries with significant non-controlling interests at 31 December 2023 is summarised below:
EUR millionA | ||||||||||||||
| Santander Bank Polska S.A. | Banco Santander (Brasil) S.A. | Banco Santander - Chile | Grupo Financiero Santander México, S.A.B. de C.V. | |||||||||||
| Total assets | ||||||||||||||
| Total liabilities | ||||||||||||||
| Net assets | ||||||||||||||
| Total income | ||||||||||||||
| Total profit | ||||||||||||||
A.Information prepared in accordance with the segment reporting criteria described in note 52 and, therefore, it may not coincide with the information published separately by each entity.
653
29. Other comprehensive income
The balances of 'Other comprehensive income' include the amounts, net of the related tax effect, of the adjustments to assets and liabilities recognised in equity through the consolidated statement of recognised income and expense. The amounts arising from subsidiaries are presented, on a line by line basis, in the appropriate items according to their nature.
Respect to items that may be reclassified to profit or loss, the consolidated statement of recognised income and expense includes changes in other comprehensive income as follows:
•Revaluation gains (losses): includes the amount of the income, net of the expenses incurred in the year, recognised directly in equity. The amounts recognised in equity in the year remain under this item, even if in the same year they are transferred to the income statement or to the initial carrying amount of the assets or liabilities or are reclassified to another line item.
•Amounts transferred to income statement: includes the amount of the revaluation gains and losses previously recognised in equity, even in the same year, which are recognised in the income statement.
•Amounts transferred to initial carrying amount of hedged items: includes the amount of the revaluation gains and losses previously recognised in equity, even in the same year, which are recognised in the initial carrying amount of assets or liabilities as a result of cash flow hedges.
•Other reclassifications: includes the amount of the transfers made in the year between the various valuation adjustment items.
654
a) Breakdown of Other comprehensive income - Items that will not be reclassified in results and Items that can be classified in results
EUR millionA | |||||||||||
| 2023 | 2022 | 2021 | |||||||||
Other comprehensive income | ( | ( | ( | ||||||||
Items that will not be reclassified to profit or loss | ( | ( | ( | ||||||||
| Actuarial gains and losses on defined benefit pension plans | ( | ( | ( | ||||||||
| Non-current assets held for sale | |||||||||||
| Share in other income and expenses recognised in investments, joint ventures and associates | ( | ||||||||||
| Other valuation adjustments | |||||||||||
| Changes in the fair value of equity instruments measured at fair value with changes in other comprehensive income | ( | ( | ( | ||||||||
| Inefficiency of fair value hedges of equity instruments measured at fair value with changes in other comprehensive income | |||||||||||
| Changes in the fair value of equity instruments measured at fair value with changes in other comprehensive income (hedged item) | |||||||||||
| Changes in the fair value of equity instruments measured at fair value with changes in other comprehensive income (hedging instrument) | ( | ( | ( | ||||||||
| Changes in the fair value of financial liabilities measured at fair value through profit or loss attributable to changes in credit risk | ( | ( | ( | ||||||||
Items that may be reclassified to profit or loss | ( | ( | ( | ||||||||
| Hedges of net investments in foreign operations (Effective portion) | ( | ( | ( | ||||||||
| Exchange differences | ( | ( | ( | ||||||||
| Hedging derivatives. Cash flow hedges (Effective portion) | ( | ( | ( | ||||||||
| Changes in the fair value of debt instruments measured at fair value with changes in other comprehensive income | ( | ( | |||||||||
| Hedging instruments (items not designated) | |||||||||||
| Non-current assets classified as held for sale | |||||||||||
| Share in other income and expenses recognised in investments, joint ventures and associates | ( | ( | ( | ||||||||
A.Net amount of taxes and minorities
b) Other comprehensive income- Items not reclassified to profit or loss – Actuarial gains or (-) losses on defined benefit pension plans
'Other comprehensive income —Items not reclassified to profit or loss— Actuarial gains or (-) losses on defined benefit pension plans' include the actuarial gains and losses and the return on plan assets, less the administrative expenses and taxes inherent to the plan, and any change in the effect of the asset ceiling, excluding amounts included in net interest on the net defined benefit liability (asset).
Its variation (increase of EUR 1,038 million in the year) is shown in the consolidated statement of recognised income.
The endowment against equity in 2023 amounts to EUR 944 million - see note 25.b -, with the following breakdown:
•Increase of EUR 687 million in the cumulative actuarial losses relating to the Group´s businesses in the UK, mainly due to the evolution of the asset portfolio and the evolution of the discount rate– reduction from 4.88 % to 4.63 %.
•Increase of EUR 184 million in accumulated actuarial losses corresponding to the Group’s business in Brazil, mainly due to the evolution experienced by the discount rate -reduction from 9.44 % to 8.65 % in the main pension benefits and 9.46 % to 8.70 % in medical benefits.
•Increase of EUR 34 million in the accumulates actuarial losses relating to the Group's entities in Germany, mainly due to the evolution experienced by the discount rate -reduction from 4.21 % to 3.57 %.
•Increase of EUR 10 million in the accumulates actuarial losses relating to the Group´s entities in Spain, mainly due to the evolution experienced by the discount rate -reduction from 3.80 % to 3.35 %.
•Increase of EUR 9 million in the accumulates actuarial losses relating to the Group's entities in Portugal, mainly due to the evolution experienced by the discount rate -reduction from 3.70 % to 3.50 %.
•Increase of EUR 20 million in the accumulated actuarial losses corresponding to the Group's businesses in other geographical areas.
The other modification in accumulated actuarial profit or losses is an Increase of EUR 94 million as a result of the evolution of exchange rates and other movements.
655
c) Other comprehensive income - Items that will not be reclassified in results - Changes in the fair value of equity instruments measured at fair value with changes in other comprehensive income
Since the entry into force of IFRS 9, no impairment analysis is performed of equity instruments recognised under 'Other comprehensive income'. IFRS 9 eliminates the need to carry out the impairment estimate on this class of equity instruments and the reclassification to profit and loss on the disposal of these assets, being recognised at fair value with changes in equity.
The following is a breakdown of the composition of the balance as of 31 December 2023, 2022 and 2021 under 'Other comprehensive income - Items that will not be reclassified to profit or loss - Changes in the fair value of equity instruments measured at fair value with changes in other global result' depending on the geographical origin of the issuer:
| EUR million | ||||||||||||||
| 2023 | ||||||||||||||
| Capital gains by valuation | Capital losses by valuation | Net gains/losses by valuation | Fair Value | |||||||||||
| Equity instruments | ||||||||||||||
| Domestic | ||||||||||||||
| Spain | ( | ( | ||||||||||||
| International | ||||||||||||||
| Rest of Europe | ( | |||||||||||||
| United States | ||||||||||||||
| Latin America and rest | ( | |||||||||||||
| ( | ( | |||||||||||||
| Of which: | ||||||||||||||
| Publicly listed | ( | |||||||||||||
| Non publicly listed | ( | ( | ||||||||||||
| EUR million | ||||||||||||||
| 2022 | ||||||||||||||
| Capital gains by valuation | Capital losses by valuation | Net gains/losses by valuation | Fair Value | |||||||||||
| Equity instruments | ||||||||||||||
| Domestic | ||||||||||||||
| Spain | ( | ( | ||||||||||||
| International | ||||||||||||||
| Rest of Europe | ( | |||||||||||||
| United States | ||||||||||||||
| Latin America and rest | ( | |||||||||||||
| ( | ( | |||||||||||||
| Of which: | ||||||||||||||
| Publicly listed | ( | |||||||||||||
| Non publicly listed | ( | ( | ||||||||||||
656
| EUR million | ||||||||||||||
| 2021 | ||||||||||||||
| Capital gains by valuation | Capital losses by valuation | Net gains/losses by valuation | Fair Value | |||||||||||
| Equity instruments | ||||||||||||||
| Domestic | ||||||||||||||
| Spain | ( | ( | ||||||||||||
| International | ||||||||||||||
| Rest of Europe | ( | ( | ||||||||||||
| United States | ( | |||||||||||||
| Latin America and rest | ( | |||||||||||||
| ( | ( | |||||||||||||
| Of which: | ||||||||||||||
| Publicly listed | ( | |||||||||||||
| Non publicly listed | ( | ( | ||||||||||||
d) Other comprehensive income - Items that may be reclassified to profit or loss - Hedge of net investments in foreign operations (effective portion) and exchange differences
The change in 2023 reflects the positive effect of the appreciation of the Brazilian real, the pound sterling, Polish zloty and Mexican peso and the negative effect of the depreciation of the US dollar, Argentine peso and Chilean peso, whereas the change in 2022 reflected positive effect of the appreciation of the Brazilian real, the US dollar and the Mexican peso and the negative effect of the depreciation of the pound sterling. The change in 2021 reflected the positive effect of the generalized appreciation of the main currencies, especially the Brazilian real, the pound sterling, the US dollar and the Mexican peso.
Of the change in the balance in these years, a profit of EUR 249 million, a profit of EUR 496 million and EUR 167 million in 2023, 2022 and 2021, respectively relate to the measurement of goodwill.
The detail, by country is as follows:
| EUR million | |||||||||||
| 2023 | 2022 | 2021 | |||||||||
| Net balance at end of year | ( | ( | ( | ||||||||
| Of which: | |||||||||||
| Brazilian real | ( | ( | ( | ||||||||
| Pound sterling | ( | ( | ( | ||||||||
| Mexican peso | ( | ( | ( | ||||||||
| Argentine peso | ( | ( | ( | ||||||||
| Chilean peso | ( | ( | ( | ||||||||
| US dollar | |||||||||||
| Polish zloty | ( | ( | ( | ||||||||
| Other | ( | ( | ( | ||||||||
657
The breakdown of translation differences by currency is as follows:
| EUR million | ||||||||||||||||||||
| 2023 | Of which: | |||||||||||||||||||
| Currency | Balance at the beginning of the year | Balance at the end of the year | Movement | From goodwill | From resultsA | From net assets | ||||||||||||||
| Brazilian real | ( | ( | ||||||||||||||||||
| Pound sterling | ( | ( | ||||||||||||||||||
| Mexican peso | ( | ( | ||||||||||||||||||
| Argentine peso | ( | ( | ( | ( | ( | |||||||||||||||
| Chilean peso | ( | ( | ( | ( | ( | ( | ||||||||||||||
| US dollar | ( | ( | ( | ( | ||||||||||||||||
| Polish zloty | ( | ( | ||||||||||||||||||
| Other | ( | ( | ( | ( | ( | ( | ||||||||||||||
| Total Group | ( | ( | ||||||||||||||||||
A.Profit and loss items are translated into euros at the average exchange rate for the year as described in note 2 a) ii.
| EUR million | ||||||||||||||||||||
| 2022 | Of which: | |||||||||||||||||||
| Currency | Balance at the beginning of the year | Balance at the end of the year | Movement | From goodwill | From resultsA | From net assets | ||||||||||||||
| Brazilian real | ( | ( | ( | |||||||||||||||||
| Pound sterling | ( | ( | ( | ( | ( | ( | ||||||||||||||
| Mexican peso | ( | ( | ||||||||||||||||||
| Argentine peso | ( | ( | ||||||||||||||||||
| Chilean peso | ( | ( | ||||||||||||||||||
| US dollar | ( | |||||||||||||||||||
| Polish zloty | ( | ( | ( | ( | ( | |||||||||||||||
| Other | ( | ( | ( | |||||||||||||||||
| Total Group | ( | ( | ( | |||||||||||||||||
A.Profit and loss items are translated into euros at the average exchange rate for the year as described in note 2 a) ii.
| EUR million | ||||||||||||||||||||
| 2021 | Of which: | |||||||||||||||||||
| Currency | Balance at the beginning of the year | Balance at the end of the year | Movement | From goodwill | From resultsA | From net assets | ||||||||||||||
| Brazilian real | ( | ( | ||||||||||||||||||
| Pound sterling | ( | ( | ||||||||||||||||||
| Mexican peso | ( | ( | ||||||||||||||||||
| Argentine peso | ( | ( | ||||||||||||||||||
| Chilean peso | ( | ( | ( | ( | ( | ( | ||||||||||||||
| US dollar | ||||||||||||||||||||
| Polish zloty | ( | ( | ( | ( | ( | ( | ||||||||||||||
| Other | ( | ( | ||||||||||||||||||
| Total Group | ( | ( | ||||||||||||||||||
A.Profit and loss items are translated into euros at the average exchange rate for the year as described in note 2 a) ii.
658
e) Other comprehensive income -Items that may be reclassified to profit or loss - Hedging derivatives – Cash flow hedges (Effective portion)
Other comprehensive income – Items that may be reclassified to profit or loss - Cash flow hedges includes the gains or losses attributable to hedging instruments that qualify as effective hedges. These amounts will remain under this heading until they are recognised in the consolidated income statement in the periods in which the hedged items affect it.
f) Other comprehensive income - Items that may be reclassified to profit or loss – Changes in the fair value of debt instruments measured at fair value with changes in other comprehensive income
Includes the net amount of unrealised changes in the fair value of assets classified as Changes in the fair value of debt instruments measured at fair value with changes in other comprehensive income (see note 7).
The breakdown, by type of instrument and geographical origin of the issuer, of 'Other comprehensive income – Items that may be reclassified to profit or loss - Changes in the fair value of debt instruments measured at fair value with changes in other comprehensive income' at 31 December 2023, 2022 and 2021 is as follows:
| EUR million | ||||||||||||||
| 31 December 2023 | ||||||||||||||
| Revaluation gains | Revaluation losses | Net revaluation gains/ (losses) | Fair value | |||||||||||
| Debt instruments | ||||||||||||||
| Issued by Public-sector | ||||||||||||||
| Spain | ||||||||||||||
| Rest of Europe | ( | |||||||||||||
| Latin America and rest of the world | ( | ( | ||||||||||||
| Issued by Private-sector | ||||||||||||||
| Spain | ( | |||||||||||||
Rest of Europe | ( | ( | ||||||||||||
| Latin America and rest of the world | ( | ( | ||||||||||||
| ( | ( | |||||||||||||
| EUR million | ||||||||||||||
| 31 December 2022 | ||||||||||||||
| Revaluation gains | Revaluation losses | Net revaluation gains/ (losses) | Fair value | |||||||||||
| Debt instruments | ||||||||||||||
| Issued by Public-sector | ||||||||||||||
| Spain | ( | |||||||||||||
| Rest of Europe | ( | |||||||||||||
| Latin America and rest of the world | ( | ( | ||||||||||||
| Issued by Private-sector | ||||||||||||||
| Spain | ( | ( | ||||||||||||
Rest of Europe | ( | ( | ||||||||||||
| Latin America and rest of the world | ( | ( | ||||||||||||
| ( | ( | |||||||||||||
659
| EUR million | ||||||||||||||
| 31 December 2021 | ||||||||||||||
| Revaluation gains | Revaluation losses | Net revaluation gains/ (losses) | Fair value | |||||||||||
| Debt instruments | ||||||||||||||
| Issued by Public-sector | ||||||||||||||
| Spain | ||||||||||||||
| Rest of Europe | ( | |||||||||||||
| Latin America and rest of the world | ( | ( | ||||||||||||
| Issued by Private-sector | ||||||||||||||
| Spain | ( | ( | ||||||||||||
| Rest of Europe | ( | ( | ||||||||||||
| Latin America and rest of the world | ( | ( | ||||||||||||
| ( | ||||||||||||||
Since the entry into force of IFRS 9, the Group estimates the expected losses on debt instruments measured at fair value with changes in other comprehensive income. These losses are recorded with a charge to the consolidated income statement for the period.
At the end of the years 2023, 2022 and 2021, the Group recorded under 'Impairment or reversal of impairment on financial assets not measured at fair value through profit or loss', net due to modification of the consolidated income statement, in the line of financial assets at fair value with changes in other comprehensive income a provision of EUR 44 million, EUR 7 million and EUR 19 million in 2023, 2022 and 2021, respectively.
g) Other comprehensive income - Items that may be reclassified to profit or loss and Items not reclassified to profit or loss - Other recognised income and expense of investments in subsidiaries, joint ventures and associates
At 31 December 2023, the heading includes a negative amount of EUR 318 million (EUR 374 million and EUR 376 million in 2022 and 2021, respectively). Of the variation in the balance of said years, a gain of EUR 44 million and EUR 15 million has been transferred to results, and a loss of EUR 6 million in the years 2023, 2022 and 2021, respectively.
30. Shareholders' equity
The changes in Shareholders' equity are presented in the consolidated statement of changes in total equity. Significant information on certain items of Shareholders' equity and the changes during the year are set forth below.
31. Issued capital
a) Changes
At 31 December 2020, Banco Santander's share capital consisted of EUR 8,670 17,340,641,302 0.50
Likewise, at 31 December 2021, Banco Santander's share capital consisted of EUR 8,670 17,340,641,302 0.50
On 1 April 2022, there was a capital reduction amounting to EUR 129,965,136.50 through the redemption of 259,930,273 shares, corresponding to the share buyback program carried out in 2021.
Likewise, on 28 June 2022, Banco Santander decreased its capital by an amount of EUR 143,154,722.50 through the redemption of 286,309,445 shares, corresponding to the share buyback program carried out during the first half of 2022.
Therefore, at 31 December 2022, Banco Santander's share capital consisted of EUR 8,397 million, represented by 16,794,401,584 shares of EUR 0.50 of nominal value each and all of them of a unique class and series. It includes 340,406,572 shares corresponding to the first 2022 share buyback program.
On 21 March 2023, there was a capital reduction amounting EUR 170,203,286 through the redemption of 340,406,572 shares, corresponding to the share buyback program carried out in 2022 and ended in January 2023.
Likewise, on 30 June 2023, there was a capital reduction of EUR 134,924,476.50 through the redemption of 269,848,953 shares, corresponding to the share buyback program during the first half of 2023.
Aforementioned operations have not entailed the return of contributions to the shareholders as Banco Santander was the owner of the redeemed shares.
Therefore, Banco Santander's share capital at 31 December 2023 consisted of EUR 8,092 million, represented by 16,184,146,059 shares of EUR 0.50 of nominal value each and all of them of a unique class and series; including 286,842,316 shares corresponding to the first buyback program of 2023. (See note 1.g.).
660
Banco Santander’s shares are listed on the Spanish Stock Market Interconnection System and on the New York, London and Warsaw Stock Exchanges, and all of them have the same features and rights. Santander shares are listed on the London Stock Exchange under Crest Depository Interest (CDI), each CDI representing one Bank’s share. They are also listed on the New York Stock Exchange under American Depositary Shares (ADS), each ADS representing one share. Additionally, Banco Santander's shares were listed on the traditional listing of the Mexican Stock Exchange (BMV) and since 29 December 2023, they were listed only in the International Quotation System of said stock exchange.
As of 31 December 2023, no Banco Santander shareholder individually held more than 3 % of its total share capital (which is the threshold generally provided for in Spanish regulations for mandatory notification of a significant participation in a listed company). Even though at 31 December 2023, certain custodians appeared in our shareholder registry as holding more than 3 % of our share capital, we understand that those shares were held in custody on behalf of other investors, none of whom exceeded that threshold individually. These custodians were State Street Bank (14.97 %),Chase Nominees Limited (6.89 %), The Bank of New York Mellon Corporation (5.98 %), Citibank New York (3.87 %), BNP (3.09 %).
At 31 December 2023, neither Banco Santander's shareholder registry nor the CNMV's registry showed any shareholder residing in a non-cooperative jurisdiction with a shareholding equal to, or greater than, 1 % of our share capital (which is the other threshold applicable under Spanish regulations).
b) Other considerations
Under Spanish law, only shareholders at the general meeting have the authority to increase share capital. However, they may delegate the authority to approve or execute capital increases to the board of directors. Banco Santander´s Bylaws are fully aligned with Spanish law and do not establish any different conditions for share capital increases.
At 31 December 2023 the shares of the following companies were listed on official stock markets: Banco Santander Argentina S.A.; Banco Santander - Chile; Banco Santander (Brasil) S.A. and Santander Bank Polska S.A.
At 31 December 2023 the number of Banco Santander shares owned by third parties and managed by Group management companies (mainly portfolio, collective investment undertaking and pension fund managers) or jointly managed was 36 million shares, which represented 0.22 % of Banco Santander’s share capital (50 and 45 million shares, representing 0.30 % and 0.26 % of the share capital in 2022 and 2021, respectively). In addition, the number of Banco Santander shares owned by third parties and received as security was 159 million shares (equal to 0.98 % of the Bank’s share capital).
At 31 December 2023 the capital increases in progress at Group companies and the additional capital authorised by their shareholders at the respective general meetings were not material at Group level (see appendix V).
32. Share premium
Share premium includes the amount paid up by the Bank’s shareholders in capital issues in excess of the par value.
The Corporate Enterprises Act expressly permits the use of the share premium account balance to increase capital at the entities at which it is recognised and does not establish any specific restrictions as to its use.
The change in the balance of share premium corresponds to the capital increases detailed in note 31.a).
The decreased produced in 2021 for an amount of EUR 4,034 million was the consequence of applying the result obtained by Banco Santander during the financial year 2020, consisting of losses of EUR 3,557 million, as reflected in the consolidated statements of changes in total equity, and the charge of the dividend for the fiscal year 2020 for an amount of EUR 477 million (see note 31).
The decreased produced in 2022 by an amount of EUR 1,433 million was the consequence of the difference between the purchase value of the redeemed shares (EUR 1,706 million) and the par value of said shares (EUR 273 million) as a consequence of the capital decreases described in note 31.a.
Likewise, in accordance with applicable legislation, a reserve for redeemed capital has been allocated with a charge to the share premium in an amount equal to the nominal value of said redeemed shares (273 million euros).
The decrease produced in 2023 by an amount of EUR 1,595 million has been the consequence of the difference between the purchase value of the redeemed shares (EUR 1,900 million) and the par value of said shares (EUR 305 million) (see note 4.a and consolidated statements of changes in total equity) as a consequence of the capital decreases described in note 31.a.
Likewise, in accordance with the applicable legislation, a reserve has been provided for amortized capital charged to the issue premium for an amount equal to the nominal value of said amortized shares (EUR 305 million).
661
33. Accumulated retained earnings
a) Definitions
The balance of 'Equity - Accumulated gains and Other reserves' includes the net amount of the accumulated results (profits or losses) recognised in previous years through the consolidated income statement which in the profit distribution were allocated in equity, the expenses of own equity instrument issues, the differences between the amount for which the treasury shares are sold and their acquisition price, as well as the net amount of the results accumulated in previous years, generated by the result of non-current assets held for sale, recognised through the consolidated income statement.
b) Breakdown
The detail of Accumulated retained earnings and Reserves of entities accounted for using the equity method is as follows:
| EUR million | |||||||||||
| 2023 | 2022 | 2021 | |||||||||
| Restricted reserves | |||||||||||
Legal reserveA | |||||||||||
| Own shares | |||||||||||
| Revaluation reserve Royal Decree-Law 7/1996 | |||||||||||
| Reserve for retired capital | |||||||||||
| Unrestricted reserves | |||||||||||
Voluntary reservesB | |||||||||||
| Consolidation reserves attributable to the Bank | ( | ( | |||||||||
| Reserves of subsidiaries | |||||||||||
| Reserves of entities accounted for using the equity method | |||||||||||
A.The board of directors has proposed to the general shareholders' meeting the reclassification of the excess that the amount of the balance of the legal reserve account shows over the figure that is equivalent to 20 % of the resulting share capital after the executed capital reductions, to be included in the voluntary reserves account.
B.In accordance with the commercial regulations in force in Spain.
i. Legal reserve
Under the Consolidated Spanish Corporate Enterprises Act, 10 % of net profit for each year must be transferred to the legal reserve. These transfers must be made until the balance of this reserve reaches 20 % of the share capital. The legal reserve can be used to increase capital provided that the remaining reserve balance does not fall below 10 % of the increased share capital amount.
Consequently, once again, after the capital increases described in note 31 had been carried out, the balance of the legal reserve met the percentage of 20 % of the share capital, and at 31 December 2023 the Legal reserve was at the stipulated level.
ii. Reserve for treasury shares
According to the Corporate Enterprises Act, an unavailable reserve equivalent to the amount for which Banco Santander's shares owned by subsidiaries are recorded. This reservation shall be freely available when the circumstances which have obliged its constitution disappear. In addition, this reserve covers the outstanding balance of loans granted by the Group with Banco Santander's share guarantee and the amount equivalent to the credits granted by the Group companies to third parties for the acquisition of own shares.
iii. Revaluation reserve Royal Decree Law 7/1996, of 7 June
The balance of Revaluation reserve Royal Decree-Law 7/1996 can be used, free of tax, to increase share capital. From 1 January 2007, the balance of this account can be taken to unrestricted reserves, provided that the monetary surplus has been realised. The surplus will be deemed to have been realised in respect of the portion on which depreciation has been taken for accounting purposes or when the revalued assets have been transferred or derecognised.
If the balance of this reserve were used in a manner other than that provided for in Royal Decree law 7/1996, of 7 June, it would be subject to taxation.
iv. Reserves of subsidiaries
The detail, by company, of Reserves of subsidiaries, based on the companies’ contribution to the Group (considering the effect of consolidation adjustments) is as follows:
| EUR million | |||||||||||
| 2023 | 2022 | 2021 | |||||||||
| Banco Santander (Brasil) S.A. (Consolidated Group) | |||||||||||
| Santander UK Group | |||||||||||
| Banco Santander México, S.A., Institución de Banca Múltiple, Grupo Financiero Santander México | |||||||||||
| Santander Consumer Finance Group | |||||||||||
| Banco Santander - Chile | |||||||||||
| Banco Santander Argentina S.A. | |||||||||||
| Banco Santander Totta, S.A. (Consolidated Group) | |||||||||||
| Santander Bank Polska S.A. | |||||||||||
| Grupo Santander Holdings USA | |||||||||||
| Santander Investment, S.A. | |||||||||||
| Santander Seguros y Reaseguros, Compañía Aseguradora, S.A. | |||||||||||
| Banco Santander International SA (former Banco Santander (Suisse) S.A) | |||||||||||
| Other companies and consolidation adjustments | ( | ( | ( | ||||||||
| Of which, restricted | |||||||||||
662
34. Other equity instruments and own shares
a) Equity instruments issued not capital and other equity instruments
Other equity instruments includes the equity component of compound financial instruments, the increase in equity due to personnel remuneration, and other items not recognised in other “Shareholders’ equity” items.
On 8 September 2017, Banco Santander, S.A. issued contingent redeemable perpetual bonds (the fidelity bonds) amounting to EUR 981 million nominal value EUR -686 million fair value. On 31 December 2023 amounted to EUR 720 million.
Additionally, at 31 December 2023 the Group had other equity instruments amounting to EUR 195 million.
b) Own shares
'Shareholders’ equity - Own shares' includes the amount of own equity instruments held by all the Group entities.
Transactions involving own equity instruments, including their issuance and cancellation, are recognised directly in equity, and no profit or loss may be recognised on these transactions. The costs of any transaction involving own equity instruments are deducted directly from equity, net of any related tax effect.
At 31 December 2021, the number of treasury shares held by the Group was 277,591,940 (1.60 % of the issued share capital).
During 2022, 713,359,786 shares of the Bank were acquired at an average price of EUR 2.87 per share, of which 286,309,445 relate to the Share Buyback Program carried out during the first half of 2022, and 220,942,806 relate to the Share Buyback Program started on November 22. Likewise, 546,239,718 shares were amortised (note 31) and 201,022,983 shares at an average price of EUR 2.85 per share were transferred, of which 36,700,000 shares correspond to two donations made by Banco Santander to Fundación Banco Santander with extraordinary character.
At 31 December 2022, the number of treasury shares held by the Group was 243,689,025 (1.45 % of the issued share capital).
During 2023, 911,293,677 shares of the Bank were acquired at an average price of EUR 3.41 per share, of which 389,312,719 relate to the Share Buyback Program carried out during the first half of 2023, and 286,842,316 relate to the new Share Buyback Program started on September. Likewise, 610,255,525 shares were amortised (note 31) and 246,911,504 shares at an average price of EUR 3.34 per share have been transferred, of which 6,617,008 shares correspond to the donation made by Banco Santander to Fundación Banco Santander with extraordinary character.
At 31 December 2023, the Group holds 297,815,673 shares of the Bank's issued share capital (1.84 %).
The effect on equity, net of tax, arising from the purchase and sale of Bank shares is of EUR 13 million profit in 2023 (EUR 7 million and EUR 23 million profit in 2022 and 2021, respectively).
35. Memorandum items
Memorandum items relates to balances representing rights, obligations and other legal situations that in the future may have an impact on net assets, as well as any other balances needed to reflect all transactions performed by the consolidated entities although they may not impinge on their net assets.
a) Guarantees and contingent commitments granted
Contingent liabilities includes all transactions under which an entity guarantees the obligations of a third party and which result from financial guarantees granted by the entity or from other types of contracts. The detail is as follows:
| 2023 | 2022 | 2021 | |||||||||
| Loans commitment granted | |||||||||||
| Of which impaired | |||||||||||
| Financial guarantees granted | |||||||||||
| Of which impaired | |||||||||||
| Financial guarantees | |||||||||||
| Credit derivatives sold | |||||||||||
| Other commitments granted | |||||||||||
| Of which impaired | |||||||||||
| Technical guarantees | |||||||||||
| Other | |||||||||||
The breakdown as at 31 December 2023 of the exposures and the provision fund out of balance sheet by impairment stage is EUR 398,243 million and EUR 302 million (EUR 370,729 million and EUR 331 million in 2022 and EUR 337,113 million and EUR 372 million in 2021) in stage 1, EUR 8,528 million and EUR 174 million (EUR 7,092 million and EUR 191 million in 2022 and EUR 10,531 million and EUR 200 million in 2021) in stage 2 and EUR 1,526 million and EUR 226 million (EUR 1,782 million and EUR 212 million in 2022 and EUR 1,584 million and EUR 161 million in 2021) in stage 3, respectively.
Income from guarantee instruments is recognised under 'Fee and commission income' in the consolidated income statements and is calculated by applying the rate established in the related contract to the nominal amount of the guarantee.
i. Loan commitments granted
Loan commitments granted: firm commitments of grating of credit under predefined terms and conditions, except for those that comply with the definition of derivatives as these can be settled in cash or through the delivery of issuance of another financial instrument. They include stand-by credit lines and long-term deposits.
ii. Financial guarantees granted
Financial guarantees includes, inter alia, financial guarantee contracts such as financial bank guarantees, credit derivatives sold, and risks arising from derivatives arranged for the account of third parties.
iii. Other commitments granted
Other contingent liabilities include all commitments that could give rise to the recognition of financial assets not included in the above items, such as technical guarantees and guarantees for the import and export of goods and services.
663
b) Memorandum items
i. Off-balance-sheet funds under management
The detail of off-balance-sheet funds managed by the Group and by joint ventures is as follows:
| EUR million | |||||||||||
| 2023 | 2022 | 2021 | |||||||||
| Investment funds | |||||||||||
| Pension funds | |||||||||||
| Assets under management | |||||||||||
ii. Non-managed marketed funds
Additionally, at 31 December 2023 there are non-managed marketed funds totalling EUR 50,036 million (EUR 48,379 million and EUR 48,385 million at 31 December 2022 and 2021, respectively).
c) Third-party securities held in custody
At 31 December 2023 the Group held in custody debt securities and equity instruments totalling EUR 268,338 million (EUR 231,263 million and EUR 236,153 million at 31 December 2022 and 2021, respectively) entrusted to it by third parties.
36. Hedging derivatives
Grupo Santander, within its financial risk management strategy, and in order to reduce asymmetries in the accounting treatment of its operations, enters into hedging derivatives on interest, exchange rate, credit risk or variation of stock prices, depending on the nature of the risk covered.
Based on its objective, Grupo Santander classifies its hedges in the following categories:
•Cash flow hedges: cover the exposure to the variation of the cash flows associated with an asset, liability or a highly probable forecast transaction. This cover the variable-rate issues in foreign currencies, fixed-rate issues in non-local currency, variable-rate interbank financing and variable-rate assets (bonds, commercial loans, mortgages, etc.).
•Fair value hedges: cover the exposure to the variation in the fair value of assets or liabilities, attributable to an identified and hedged risk. This covers the interest risk of assets or liabilities (bonds, loans, bills, issues, deposits, etc.) with coupons or fixed interest rates, interests in entities, issues in foreign currencies and deposits or other fixed rate liabilities.
•Hedging of net investments abroad: cover the exchange rate risk of the investments in subsidiaries domiciled in a country with a different currency from the functional one of the Group.
664
The following tables contains the detail of the hedging derivatives according to the type of hedging, the hedge risk and the main products used as of 31 December 2023, 2022 and 2021:
| EUR million | |||||||||||||||||
| 2023 | |||||||||||||||||
| Carrying amount | |||||||||||||||||
| Nominal value | Assets | Liabilities | Changes in fair value used for calculating hedge ineffectiveness | Balance sheet line items | |||||||||||||
| Fair value hedges | ( | ||||||||||||||||
| Interest rate risk | ( | Hedging derivatives | |||||||||||||||
| Of which: | |||||||||||||||||
| Interest rate swap | ( | ||||||||||||||||
| Call money swap | ( | ||||||||||||||||
| Exchange rate risk | ( | Hedging derivatives | |||||||||||||||
| Fx forward | ( | ||||||||||||||||
| Future interest rate | ( | ||||||||||||||||
| Interest rate and exchange rate risk | ( | Hedging derivatives | |||||||||||||||
| Interest rate swap | |||||||||||||||||
| Call money swap | ( | ||||||||||||||||
| Currency swap | ( | ||||||||||||||||
| Cash flow hedges | |||||||||||||||||
| Interest rate risk | |||||||||||||||||
| Of which: | |||||||||||||||||
| Future interest rate | |||||||||||||||||
| Interest rate swap | |||||||||||||||||
| Call money swap | |||||||||||||||||
| Exchange rate risk | ( | Hedging derivatives | |||||||||||||||
| Of which: | |||||||||||||||||
| FX forward | |||||||||||||||||
| Currency swap | ( | ||||||||||||||||
| Interest rate and exchange rate risk | ( | Hedging derivatives | |||||||||||||||
| Interest rate swap | ( | ||||||||||||||||
| Currency swap | ( | ||||||||||||||||
| Inflation risk | Hedging derivatives | ||||||||||||||||
| Of which: | |||||||||||||||||
| Currency swap | |||||||||||||||||
| Equity risk | Hedging derivatives | ||||||||||||||||
| Option | |||||||||||||||||
| Hedges of net investments in foreign operations | ( | ||||||||||||||||
| Exchange rate risk | ( | Hedging derivatives | |||||||||||||||
| FX forward | ( | ||||||||||||||||
| ( | |||||||||||||||||
665
| EUR million | |||||||||||||||||
| 2022 | |||||||||||||||||
| Carrying amount | |||||||||||||||||
| Nominal value | Assets | Liabilities | Changes in fair value used for calculating hedge ineffectiveness | Balance sheet line items | |||||||||||||
| Fair value hedges | |||||||||||||||||
| Interest rate risk | Hedging derivatives | ||||||||||||||||
| Of which: | |||||||||||||||||
| Interest rate swap | ( | ||||||||||||||||
| Call money swap | |||||||||||||||||
| Exchange rate risk | ( | Hedging derivatives | |||||||||||||||
| FX forward | ( | ||||||||||||||||
| Future interest rate | |||||||||||||||||
| Interest rate and exchange rate risk | Hedging derivatives | ||||||||||||||||
| Of which: | |||||||||||||||||
| Currency swap | ( | ||||||||||||||||
| Future interest rate | |||||||||||||||||
| Interest rate swap | ( | ||||||||||||||||
| Credit risk | Hedging derivatives | ||||||||||||||||
| CDS | |||||||||||||||||
| Cash flow hedges | ( | ||||||||||||||||
| Interest rate risk | ( | Hedging derivatives | |||||||||||||||
| Of which: | |||||||||||||||||
| Future interest rate | |||||||||||||||||
| Interest rate swap | ( | ||||||||||||||||
| Call money swap | ( | ( | |||||||||||||||
| Exchange rate risk | Hedging derivatives | ||||||||||||||||
| Of which: | |||||||||||||||||
| FX forward | |||||||||||||||||
| Currency swap | |||||||||||||||||
| Interest rate and exchange rate risk | ( | Hedging derivatives | |||||||||||||||
| Interest rate swap | ( | ||||||||||||||||
| Currency swap | |||||||||||||||||
| Inflation risk | Hedging derivatives | ||||||||||||||||
| Of which: | |||||||||||||||||
| Currency swap | |||||||||||||||||
| Equity risk | Hedging derivatives | ||||||||||||||||
| Option | |||||||||||||||||
| Hedges of net investments in foreign operations | ( | ||||||||||||||||
| Exchange rate risk | ( | Hedging derivatives | |||||||||||||||
| FX forward | ( | ||||||||||||||||
666
| EUR million | |||||||||||||||||
| 2021 | |||||||||||||||||
| Carrying amount | |||||||||||||||||
| Nominal value | Assets | Liabilities | Changes in fair value used for calculating hedge ineffectiveness | Balance sheet line items | |||||||||||||
| Fair value hedges | |||||||||||||||||
| Interest rate risk | Hedging derivatives | ||||||||||||||||
| Of which: | |||||||||||||||||
| Interest rate swap | ( | ||||||||||||||||
| Call money swap | |||||||||||||||||
| Exchange rate risk | Hedging derivatives | ||||||||||||||||
| Fx forward | |||||||||||||||||
| Future interest rate | |||||||||||||||||
| Interest rate and exchange rate risk | Hedging derivatives | ||||||||||||||||
| Of which: | |||||||||||||||||
| Currency swap | |||||||||||||||||
| Interest rate swap | ( | ||||||||||||||||
| Credit risk | Hedging derivatives | ||||||||||||||||
| Inflation risk | Hedging derivatives | ||||||||||||||||
| Cash flow hedges | ( | ||||||||||||||||
| Interest rate risk | ( | Hedging derivatives | |||||||||||||||
| Of which: | |||||||||||||||||
| Futures | ( | ||||||||||||||||
| Interest rate swap | ( | ||||||||||||||||
| Call money swap | ( | ||||||||||||||||
| Exchange rate risk | ( | Hedging derivatives | |||||||||||||||
| Of which: | |||||||||||||||||
| FX forward | |||||||||||||||||
| Currency swap | ( | ||||||||||||||||
| Interest rate and exchange rate risk | ( | Hedging derivatives | |||||||||||||||
| Of which: | |||||||||||||||||
| Interest rate swap | ( | ||||||||||||||||
| Currency swap | ( | ||||||||||||||||
| Inflation risk | ( | Hedging derivatives | |||||||||||||||
| Of which: | |||||||||||||||||
| Currency swap | ( | ||||||||||||||||
| Equity risk | ( | Hedging derivatives | |||||||||||||||
| Hedges of net investments in foreign operations | ( | ||||||||||||||||
| Exchange rate risk | ( | Hedging derivatives | |||||||||||||||
| FX forward | ( | ||||||||||||||||
| ( | |||||||||||||||||
667
Considering the main entities or groups within the Group by the weight of their hedging, the main types of hedging that are being carried out in Santander UK Group Holdings plc group and Banco Santander, S.A.
Santander UK Group Holdings plc group enters into fair value and cash flow hedging derivatives depending on the exposure of the underlying. Only designated risks are hedged and therefore other risks, such as credit risk, are managed but not hedged.
Within fair value hedges, Santander UK Group Holdings plc group has portfolios of assets and liabilities at fixed rate that are exposed to changes in fair value due to changes in market interest rates. These positions are managed by contracting mainly interest rate swaps. Effectiveness is assessed by comparing the changes in the fair value of these portfolios generated by the hedged risk with the changes in the fair value of the derivatives contracted.
Santander UK Group Holdings plc group also has access to international markets to obtain financing by issuing fixed-rate debt or investing in fixed rate debt of other issuers, in its functional currency and other currencies. As such, they are exposed to changes in interest rates and exchange rates, mainly in EUR and USD. This risk is mitigated with cross currency swaps e interest rate swaps in which they pay a fixed rate and receive a variable rate. Effectiveness is evaluated using linear regression techniques to compare changes in the fair value of the debt at interest and exchange rates with changes in the fair value of interest rate swaps or cross currency swaps.
Within the cash flow hedges, Santander UK Group Holdings plc group has portfolios of assets and liabilities at variable rates, normally at SONIA or BoE base rate. To mitigate this market rate variability risk, it contracts interest rate swaps.
As Santander UK Group Holdings plc group obtains financing in the international markets, it assumes a significant exposure to currency risk mainly USD and EUR. In addition, it also holds debt securities for liquidity purposes which assume exposure mainly in JPY and CHF. To manage this exchange rate risk, Spot, Forward y Cross Currency Swap are contracted to match the cash flow profile and the maturity of the estimated interest and principal repayments of the hedged item.
Effectiveness is assessed by comparing changes in the fair value of the derivatives with changes in the fair value of the hedged item attributable to the hedged risk by applying a hypothetical derivative method using linear regression techniques.
In addition, within the hedges that cover equity risk, Santander UK Group Holdings plc group offers employees the opportunity to purchase shares of the Bank at a discount under the Sharesave Scheme, exposing the Bank to share price risk. As such, options are purchased allowing them to purchase shares at a pre-set price.
Banco Santander, S.A. covers the risks of its balance sheet in a variety of ways. On the one hand, documented as fair value hedges, it covers the interest rate and foreign exchange risk of fixed-income portfolios at a fixed rate (REPOs are included in this category). Resulting, in an exposure to changes in their fair value due to variations in market conditions based on the various risks hedged, which has an impact on Banco Santander's income statement.
To mitigate these risks, Banco Santander contracts derivatives, mainly Interest Rate Swaps, Cross Currency Swaps, Cap&floors and Forex Forward.
On the other hand, the interest and exchange rate risk of loans granted to corporate clients at a fixed rate or variable rate is covered. These hedges, are carried out through interest rate swaps, cross currency swaps and exchange rate derivatives (forex swaps and forex forward).
In addition, Banco Santander, S.A. manages the interest and exchange risk of debt issues in its various categories (issuing covered bonds, perpetual, subordinated and senior bond) and in different currencies, denominated at fixed rates, and therefore subject to changes in their fair value. These issues are covered through interest rate swaps and cross currency swaps.
The methodology used by Banco Santander, S.A. to measure the effectiveness of fair value hedges is based on comparing the market values of the hedged items (based on the objective risk of the hedge) and of the hedging instruments in order to analyse whether the changes in the market value of the hedged items are offset by the market value of the hedging instruments, thereby mitigating the hedged risk and minimizing volatility in the income statement.
Prospectively, the same analysis is performed, measuring the theoretical market values in the event of parallel variations in the market curves of a positive basis point.
There is a macro hedge of structured loans in which the interest rate risk of fixed-rate loans (mortgage, personal or with other guarantees) granted to legal entities in commercial or corporate banking and wealth clients in the medium-long term is hedged. This hedge is instrumented as a macro hedge of fair value, the main hedging instruments being Interest Rate Swap and Cap&floors. In case of total or partial cancellation or early repayment, the customer is obliged to pay/receive the cost/income of the cancellation of the interest rate risk hedge managed by the Bank.
Regarding cash flow hedges, the objective is to hedge the cash flow exposure to changes in interest rates and exchange rates.
For retrospective purposes, the hypothetical derivative methodology is used to measure effectiveness. By means of this methodology, the hedged risk is modelled as a derivative instrument -not real-, created exclusively for the purpose of measuring the effectiveness of the hedge, and which must comply with the fact that its main characteristics coincide with the critical terms of the hedged item throughout the period for which the hedging relationship is designated. This hypothetical derivative does not incorporate characteristics that are exclusive to the hedging instrument. Additionally, it is worth mentioning that any risk component not associated with the hedged objective risk and effectively documented at the beginning of the hedge is excluded for the purpose of calculating the effectiveness. The market value of the hypothetical derivative that replicates the hedged item is compared with the market value of the hedging instrument, verifying that the hedged risk is effectively mitigated and that the impact on the income statement due to potential ineffectiveness is residual.
668
Prospectively, the variations in the market values of the hedging instrument and the hedged item (represented by the hypothetical derivative) are measured in the event of parallel shifts of a positive basis point in the affected market curves.
There is another macro-hedge, this time of cash flows, the purpose of which is to actively manage the risk-free interest rate risk (excluding credit risk) of a portion of the floating rate assets of Banco Santander, S.A., through the arrangement of interest rate derivatives whereby the bank exchanges floating rate interest flows for others at a fixed rate agreed at the time the transactions are arranged. The items affected by the Macro-hedging have been designated as those in which their cash flows are exposed to interest rate risk, specifically the floating rate mortgages of the Banco Santander, S.A. network referenced to Euribor 12 Months or Euribor Mortgage, with annual renewal of rates, classified as sound risk and which do not have a contractual floor (or, if not, this floor is not activated). The hedged position affecting the Macro Cash Flow Hedge at the present time is near to EUR 10,000 million.
Regarding net foreign investments hedges, basically, they are allocated in Banco Santander, S.A. and Santander Consumer Finance Group. Grupo Santander assumes as a priority risk management objective to minimize -to the limit determined by the Group's Financial Management- the impact on the calculation of the capital ratio of its permanent investments included within the Group's consolidation perimeter, and whose shares or equity interests are legally denominated in a currency other than that of the Group's parent company. For this purpose, financial instruments (generally derivatives) are contracted to hedge the impact on the capital ratio of changes in forward exchange rates. Grupo Santander mainly hedges the risk for the following currencies: BRL, CLP, MXN, CAD, COP, CNY, GBP, CHF, NOK, USD, PLN, UYU and PEN. The instruments used to hedge the risk of these investments are forex swaps, forex forward and spot currency purchases/sales.
For this type of hedges, ineffectiveness scenarios are considered to be of low probability, given that the hedging instrument is designated considering the position determined and the spot rate at which the position is located.
669
The following table sets out the maturity profile of the hedging instruments used in Grupo Santander non-dynamic hedging strategies:
| EUR million | ||||||||||||||||||||
| 31 December 2023 | ||||||||||||||||||||
| Up to one month | One to three months | Three months to one year | One year to five years | More than five years | Total | |||||||||||||||
| Fair value hedges | ||||||||||||||||||||
| Interest rate risk | ||||||||||||||||||||
| Of which: | ||||||||||||||||||||
| Interest rate swap | ||||||||||||||||||||
| Call money swap | ||||||||||||||||||||
| Exchange rate risk | ||||||||||||||||||||
| Fx forward | ||||||||||||||||||||
| Future interest rate | ||||||||||||||||||||
| Interest rate and exchange rate risk | ||||||||||||||||||||
| Of which: | ||||||||||||||||||||
| Interest rate swap | ||||||||||||||||||||
| Call Money Swap | ||||||||||||||||||||
| Currency swap | ||||||||||||||||||||
| Cash flow hedges | ||||||||||||||||||||
| Interest rate risk | ||||||||||||||||||||
| Of which: | ||||||||||||||||||||
| Future interest rate | ||||||||||||||||||||
| Interest rate swap | ||||||||||||||||||||
| Call money swap | ||||||||||||||||||||
| Exchange rate risk | ||||||||||||||||||||
| Of which: | ||||||||||||||||||||
| FX forward | ||||||||||||||||||||
| Currency swap | ||||||||||||||||||||
| Interest rate and exchange rate risk | ||||||||||||||||||||
| Of which: | ||||||||||||||||||||
| Interest rate swap | ||||||||||||||||||||
| Currency swap | ||||||||||||||||||||
| Inflation risk | ||||||||||||||||||||
| Of which: | ||||||||||||||||||||
| Currency swap | ||||||||||||||||||||
| Equity risk | ||||||||||||||||||||
| Option | ||||||||||||||||||||
| Hedges of net investments in foreign operations: | ||||||||||||||||||||
| Exchange rate risk | ||||||||||||||||||||
| FX forward | ||||||||||||||||||||
670
| EUR million | ||||||||||||||||||||
| 31 December 2022 | ||||||||||||||||||||
| Up to one month | One to three months | Three months to one year | One year to five years | More than five years | Total | |||||||||||||||
| Fair value hedges | ||||||||||||||||||||
| Interest rate risk | ||||||||||||||||||||
| Of which: | ||||||||||||||||||||
| Interest rate swap | ||||||||||||||||||||
| Call money swap | ||||||||||||||||||||
| Exchange rate risk | ||||||||||||||||||||
| Fx forward | ||||||||||||||||||||
| Future interest rate | ||||||||||||||||||||
| Interest rate and exchange rate risk | ||||||||||||||||||||
| Of which: | ||||||||||||||||||||
| Currency swap | ||||||||||||||||||||
| Interest rate swap | ||||||||||||||||||||
| Future interest rate | ||||||||||||||||||||
| Credit risk | ||||||||||||||||||||
| CDS | ||||||||||||||||||||
| Cash flow hedges | ||||||||||||||||||||
| Interest rate risk | ||||||||||||||||||||
| Of which: | ||||||||||||||||||||
| Future interest rate | ||||||||||||||||||||
| Interest rate swap | ||||||||||||||||||||
| Call money swap | ||||||||||||||||||||
| Exchange rate risk | ||||||||||||||||||||
| Of which: | ||||||||||||||||||||
| FX forward | ||||||||||||||||||||
| Currency swap | ||||||||||||||||||||
| Interest rate and exchange rate risk | ||||||||||||||||||||
| Interest rate swap | ||||||||||||||||||||
| Currency swap | ||||||||||||||||||||
| Inflation risk | ||||||||||||||||||||
| Of which: | ||||||||||||||||||||
| Currency swap | ||||||||||||||||||||
| Equity risk | ||||||||||||||||||||
| Option | ||||||||||||||||||||
| Hedges of net investments in foreign operations: | ||||||||||||||||||||
| Exchange rate risk | ||||||||||||||||||||
| FX forward | ||||||||||||||||||||
671
| EUR million | ||||||||||||||||||||
| 31 December 2021 | ||||||||||||||||||||
| Up to one month | One to three months | Three months to one year | One year to five years | More than five years | Total | |||||||||||||||
| Fair value hedges | ||||||||||||||||||||
| Interest rate risk | ||||||||||||||||||||
| Of which: | ||||||||||||||||||||
| Interest rate swap | ||||||||||||||||||||
| Call money swap | ||||||||||||||||||||
| Exchange rate risk | ||||||||||||||||||||
| Future interest rate | ||||||||||||||||||||
| Fx forward | ||||||||||||||||||||
| Interest rate and exchange rate risk | ||||||||||||||||||||
| Of which: | ||||||||||||||||||||
| Interest rate swap | ||||||||||||||||||||
| Currency swap | ||||||||||||||||||||
| Credit risk | ||||||||||||||||||||
| Inflation risk | ||||||||||||||||||||
| Cash flow hedges | ||||||||||||||||||||
| Interest rate risk | ||||||||||||||||||||
| Of which: | ||||||||||||||||||||
| Future interest rate | ||||||||||||||||||||
| Interest rate swap | ||||||||||||||||||||
| Call money swap | ||||||||||||||||||||
| Exchange rate risk | ||||||||||||||||||||
| Of which: | ||||||||||||||||||||
| FX forward | ||||||||||||||||||||
| Currency swap | ||||||||||||||||||||
| Interest rate and exchange rate risk | ||||||||||||||||||||
| Of which: | ||||||||||||||||||||
| Interest rate swap | ||||||||||||||||||||
| Currency swap | ||||||||||||||||||||
| Inflation risk | ||||||||||||||||||||
| Of which: | ||||||||||||||||||||
| Currency swap | ||||||||||||||||||||
| Equity risk | ||||||||||||||||||||
| Hedges of net investments in foreign operations | ||||||||||||||||||||
| Exchange rate risk | ||||||||||||||||||||
| FX forward | ||||||||||||||||||||
672
Additionally, for Santander UK Group Holdings plc and Banco Santander, S.A., both the maturity profile, the average interest and exchange rate of hedging instruments by maturity buckets are shown:
Santander UK Group Holdings plc group
| 31 December 2023 | ||||||||||||||||||||
| EUR million | ||||||||||||||||||||
| Up to one month | One to three months | Three months to one year | One year to five years | More than five years | Total | |||||||||||||||
| Fair value hedges | ||||||||||||||||||||
| Interest rate risk | ||||||||||||||||||||
| Interest rate instruments | ||||||||||||||||||||
| Nominal | ||||||||||||||||||||
| Average fixed interest rate (%) GBP | ||||||||||||||||||||
| Average fixed interest rate (%) EUR | ||||||||||||||||||||
| Average fixed interest rate (%) USD | ||||||||||||||||||||
| Interest rate and foreign exchange rate risk | ||||||||||||||||||||
| Exchange and interest rate instruments | ||||||||||||||||||||
| Nominal | ||||||||||||||||||||
| Average GBP/EUR exchange rate | ||||||||||||||||||||
| Average GBP/USD exchange rate | ||||||||||||||||||||
| Average fixed interest rate (%) EUR | ||||||||||||||||||||
| Average fixed interest rate (%) USD | ||||||||||||||||||||
| Cash flow hedges | ||||||||||||||||||||
| Interest rate risk | ||||||||||||||||||||
| Interest rate instruments | ||||||||||||||||||||
| Nominal | ||||||||||||||||||||
| Average fixed interest rate (%) GBP | ||||||||||||||||||||
| Foreign exchange risk | ||||||||||||||||||||
| Exchange and interest rate instruments | ||||||||||||||||||||
| Nominal | ||||||||||||||||||||
| Average GBP/JPY exchange rate | ||||||||||||||||||||
| Average GBP/CHF exchange rate | ||||||||||||||||||||
| Average GBP/EUR exchange rate | ||||||||||||||||||||
| Average GBP/USD exchange rate | ||||||||||||||||||||
| Equity risk | ||||||||||||||||||||
| Equity instruments | ||||||||||||||||||||
| Nominal | ||||||||||||||||||||
| Interest rate and foreign exchange rate risk | ||||||||||||||||||||
| Exchange and interest rate instruments | ||||||||||||||||||||
| Nominal | ||||||||||||||||||||
| Average GBP/EUR exchange rate | ||||||||||||||||||||
| Average GBP/USD exchange rate | ||||||||||||||||||||
| Average fixed interest rate (%) GBP | ||||||||||||||||||||
673
| 31 December 2022 | |||||||||||||||||||||||
| EUR million | |||||||||||||||||||||||
| Up to one month | One to three months | Three months to one year | One year to five years | More than five years | Total | ||||||||||||||||||
| Fair value hedges | |||||||||||||||||||||||
| Interest rate risk | |||||||||||||||||||||||
| Interest rate instruments | |||||||||||||||||||||||
| Nominal | |||||||||||||||||||||||
| Average fixed interest rate (%) GBP | |||||||||||||||||||||||
| Average fixed interest rate (%) EUR | |||||||||||||||||||||||
| Average fixed interest rate (%) USD | |||||||||||||||||||||||
| Interest rate and foreign exchange rate risk | |||||||||||||||||||||||
| Exchange and interest rate instruments | |||||||||||||||||||||||
| Nominal | |||||||||||||||||||||||
| Average GBP/EUR exchange rate | |||||||||||||||||||||||
| Average GBP/USD exchange rate | |||||||||||||||||||||||
| Average fixed interest rate (%) EUR | |||||||||||||||||||||||
| Average fixed interest rate (%) USD | |||||||||||||||||||||||
| Cash flow hedges | |||||||||||||||||||||||
| Interest rate risk | |||||||||||||||||||||||
| Interest rate instruments | |||||||||||||||||||||||
| Nominal | |||||||||||||||||||||||
| Average fixed interest rate (%) GBP | |||||||||||||||||||||||
| Foreign exchange risk | |||||||||||||||||||||||
| Exchange and interest rate instruments | |||||||||||||||||||||||
| Nominal | |||||||||||||||||||||||
| Average GBP/JPY exchange rate | |||||||||||||||||||||||
| Average GBP/CHF exchange rate | |||||||||||||||||||||||
| Average GBP/EUR exchange rate | |||||||||||||||||||||||
| Average GBP/USD exchange rate | |||||||||||||||||||||||
| Equity risk | |||||||||||||||||||||||
| Equity instruments | |||||||||||||||||||||||
| Nominal | |||||||||||||||||||||||
| Interest rate and foreign exchange rate risk | |||||||||||||||||||||||
| Exchange and interest rate instruments | |||||||||||||||||||||||
| Nominal | |||||||||||||||||||||||
| Average GBP/EUR exchange rate | |||||||||||||||||||||||
| Average GBP/USD exchange rate | |||||||||||||||||||||||
| Average fixed interest rate (%) GBP | |||||||||||||||||||||||
674
| 31 December 2021 | ||||||||||||||||||||
| EUR million | ||||||||||||||||||||
| Up to one month | One to three months | Three months to one year | One year to five years | More than five years | Total | |||||||||||||||
| Fair value hedges | ||||||||||||||||||||
| Interest rate risk | ||||||||||||||||||||
| Interest rate instruments | ||||||||||||||||||||
| Nominal | ||||||||||||||||||||
| Average fixed interest rate (%) GBP | ||||||||||||||||||||
| Average fixed interest rate (%) EUR | ||||||||||||||||||||
| Average fixed interest rate (%) USD | ||||||||||||||||||||
| Interest rate and foreign exchange rate risk | ||||||||||||||||||||
| Exchange and interest rate instruments | ||||||||||||||||||||
| Nominal | ||||||||||||||||||||
| Average GBP/EUR exchange rate | ||||||||||||||||||||
| Average fixed interest rate (%) EUR | ||||||||||||||||||||
| Cash flow hedges | ||||||||||||||||||||
| Interest rate risk | ||||||||||||||||||||
| Interest rate instruments | ||||||||||||||||||||
| Nominal | ||||||||||||||||||||
| Average fixed interest rate (%) GBP | ||||||||||||||||||||
| Foreign exchange risk | ||||||||||||||||||||
| Exchange and interest rate instruments | ||||||||||||||||||||
| Nominal | ||||||||||||||||||||
| Average GBP/JPY exchange rate | ||||||||||||||||||||
| Average GBP/EUR exchange rate | ||||||||||||||||||||
| Average GBP/USD exchange rate | ||||||||||||||||||||
| Interest rate and foreign exchange rate risk | ||||||||||||||||||||
| Exchange and interest rate instruments | ||||||||||||||||||||
| Nominal | ||||||||||||||||||||
| Average GBP/EUR exchange rate | ||||||||||||||||||||
| Average GBP/USD exchange rate | ||||||||||||||||||||
| Average fixed interest rate (%) GBP | ||||||||||||||||||||
675
Banco Santander, S.A.
| 31 December 2023 | ||||||||||||||||||||
| EUR million | ||||||||||||||||||||
| Up to one month | One to three months | Three months to one year | One year to five years | More than five years | Total | |||||||||||||||
| Fair value hedges | ||||||||||||||||||||
| Interest rate risk | ||||||||||||||||||||
| Interest rate instruments | ||||||||||||||||||||
| Nominal | ||||||||||||||||||||
| Average fixed interest rate (%) GBP | ||||||||||||||||||||
| Average fixed interest rate (%) EUR | ||||||||||||||||||||
| Average fixed interest rate (%) CHF | ||||||||||||||||||||
| Average fixed interest rate (%) USD | ||||||||||||||||||||
| Foreign exchange risk | ||||||||||||||||||||
| Exchange and interest rate instruments | ||||||||||||||||||||
| Nominal | ||||||||||||||||||||
| Average PEN/USD exchange rate | ||||||||||||||||||||
| Average CNY/EUR exchange rate | ||||||||||||||||||||
| Average AUD/EUR exchange rate | ||||||||||||||||||||
| Average MXN/EUR exchange rate | ||||||||||||||||||||
| Average COP/USD exchange rate | ||||||||||||||||||||
| Average MAD/EUR exchange rate | ||||||||||||||||||||
| Average PEN/EUR exchange rate | ||||||||||||||||||||
| Interest rate and foreign exchange rate risk | ||||||||||||||||||||
| Exchange and interest rate instruments | ||||||||||||||||||||
| Nominal | ||||||||||||||||||||
| Average fixed interest rate (%) AUD/EUR | ||||||||||||||||||||
| Average fixed interest rate (%) CZK/EUR | ||||||||||||||||||||
| Average fixed interest rate (%) RON/EUR | ||||||||||||||||||||
| Average fixed interest rate (%) HKD/EUR | ||||||||||||||||||||
| Average fixed interest rate (%) JPY/EUR | ||||||||||||||||||||
| Average fixed interest rate (%) NOK/EUR | ||||||||||||||||||||
| Average fixed interest rate (%) CHF/EUR | ||||||||||||||||||||
| Average fixed interest rate (%) USD/MXN | ||||||||||||||||||||
| Average fixed interest rate (%) USD/COP | ||||||||||||||||||||
| Average fixed interest rate (%) EUR/USD | ( | |||||||||||||||||||
| Average fixed interest rate (%) USD/CLP | ||||||||||||||||||||
| Average AUD/EUR exchange rate | ||||||||||||||||||||
| Average CZK/EUR exchange rate | ||||||||||||||||||||
| Average EUR/USD exchange rate | ||||||||||||||||||||
| Average HKD/EUR exchange rate | ||||||||||||||||||||
| Average JPY/EUR exchange rate | ||||||||||||||||||||
| Average NOK/EUR exchange rate | ||||||||||||||||||||
| Average RON/EUR exchange rate | ||||||||||||||||||||
| Average CHF/EUR exchange rate | ||||||||||||||||||||
| Average MXN/EUR exchange rate | ||||||||||||||||||||
| Average USD/CLP exchange rate | ||||||||||||||||||||
| Average NZD/EUR exchange rate | ||||||||||||||||||||
| Average USD/MXN exchange rate | ||||||||||||||||||||
| Cash flow hedges | ||||||||||||||||||||
| Interest rate and foreign exchange rate risk | ||||||||||||||||||||
| Interest rate and foreign exchange rate instruments | ||||||||||||||||||||
676
| 31 December 2023 | ||||||||||||||||||||
| EUR million | ||||||||||||||||||||
| Up to one month | One to three months | Three months to one year | One year to five years | More than five years | Total | |||||||||||||||
| Nominal | ||||||||||||||||||||
| Average fixed interest rate (%) CHF/EUR | ||||||||||||||||||||
| Average fixed interest rate (%) AUD/EUR | ||||||||||||||||||||
| Average EUR/GBP exchange rate | ||||||||||||||||||||
| Average AUD/EUR exchange rate | ||||||||||||||||||||
| Average RON/EUR exchange rate | ||||||||||||||||||||
| Average CHF/EUR exchange rate | ||||||||||||||||||||
| Interest rate risk | ||||||||||||||||||||
| Bond Forward instruments | ||||||||||||||||||||
| Nominal | ||||||||||||||||||||
| Average fixed interest rate (%) EUR | ( | ( | ||||||||||||||||||
| Exchange rate risk | ||||||||||||||||||||
| Exchange instruments | ||||||||||||||||||||
| Nominal | ||||||||||||||||||||
| Average exchange rate GBP/EUR | ||||||||||||||||||||
| Hedges of net investments in foreign operations | ||||||||||||||||||||
| Exchange rate risk | ||||||||||||||||||||
| Exchange and interest rate instruments | ||||||||||||||||||||
| Nominal | ||||||||||||||||||||
| Average BRL/EUR exchange rate | ||||||||||||||||||||
| Average CLP/EUR exchange rate | ||||||||||||||||||||
| Average COP/EUR exchange rate | ||||||||||||||||||||
| Average GBP/EUR exchange rate | ||||||||||||||||||||
| Average MXN/EUR exchange rate | ||||||||||||||||||||
| Average USD/EUR exchange rate | ||||||||||||||||||||
| Average PLN/EUR exchange rate | ||||||||||||||||||||
| Average CAD/EUR exchange rate | ||||||||||||||||||||
| Average CHF/EUR exchange rate | ||||||||||||||||||||
| Average UYU/EUR exchange rate | ||||||||||||||||||||
677
| 31 December 2022 | ||||||||||||||||||||
| EUR million | ||||||||||||||||||||
| Up to one month | One to three months | Three months to one year | One year to five years | More than five years | Total | |||||||||||||||
| Fair value hedges | ||||||||||||||||||||
| Interest rate risk | ||||||||||||||||||||
| Interest rate instruments | ||||||||||||||||||||
| Nominal | ||||||||||||||||||||
| Average fixed interest rate (%) GBP | ||||||||||||||||||||
| Average fixed interest rate (%) EUR | ( | |||||||||||||||||||
| Average fixed interest rate (%) CHF | ||||||||||||||||||||
| Average fixed interest rate (%) JPY | ||||||||||||||||||||
| Average fixed interest rate (%) CZK | ||||||||||||||||||||
| Average fixed interest rate (%) NOK | ||||||||||||||||||||
| Average fixed interest rate (%) AUD | ||||||||||||||||||||
| Average fixed interest rate (%) USD | ||||||||||||||||||||
| Average fixed interest rate (%) RON | ||||||||||||||||||||
| Foreign exchange risk | ||||||||||||||||||||
| Exchange and interest rate instruments | ||||||||||||||||||||
| Nominal | ||||||||||||||||||||
| Average GBP/EUR exchange rate | ||||||||||||||||||||
| Average USD/EUR exchange rate | ||||||||||||||||||||
| Average CNY/EUR exchange rate | ||||||||||||||||||||
| Average AUD/EUR exchange rate | ||||||||||||||||||||
| Average MXN/EUR exchange rate | ||||||||||||||||||||
| Average JPY/EUR exchange rate | ||||||||||||||||||||
| Interest rate and foreign exchange rate risk | ||||||||||||||||||||
| Exchange and interest rate instruments | ||||||||||||||||||||
| Nominal | ||||||||||||||||||||
| Average fixed interest rate (%) AUD/EUR | ||||||||||||||||||||
| Average fixed interest rate (%) CZK/EUR | ||||||||||||||||||||
| Average fixed interest rate (%) RON/EUR | ||||||||||||||||||||
| Average fixed interest rate (%) HKD/EUR | ||||||||||||||||||||
| Average fixed interest rate (%) JPY/EUR | ||||||||||||||||||||
| Average fixed interest rate (%) NOK/EUR | ||||||||||||||||||||
| Average fixed interest rate (%) CHF/EUR | ||||||||||||||||||||
| Average fixed interest rate (%) EUR/GBP | ||||||||||||||||||||
| Average fixed interest rate (%) NZD/EUR | ||||||||||||||||||||
| Average fixed interest rate (%) USD/MXN | ||||||||||||||||||||
| Average fixed interest rate (%) USD/COP | ||||||||||||||||||||
| Average fixed interest rate (%) EUR/USD | ( | |||||||||||||||||||
| Average fixed interest rate (%) USD/CLP | ||||||||||||||||||||
| Average AUD/EUR exchange rate | ||||||||||||||||||||
| Average CZK/EUR exchange rate | ||||||||||||||||||||
| Average EUR/GBP exchange rate | ||||||||||||||||||||
| Average EUR/USD exchange rate | ||||||||||||||||||||
| Average HKD/EUR exchange rate | ||||||||||||||||||||
| Average JPY/EUR exchange rate | ||||||||||||||||||||
| Average NOK/EUR exchange rate | ||||||||||||||||||||
| Average RON/EUR exchange rate | ||||||||||||||||||||
| Average CHF/EUR exchange rate | ||||||||||||||||||||
| Average USD/CLP exchange rate | ||||||||||||||||||||
678
| 31 December 2022 | ||||||||||||||||||||
| EUR million | ||||||||||||||||||||
| Up to one month | One to three months | Three months to one year | One year to five years | More than five years | Total | |||||||||||||||
| Average NZD/EUR exchange rate | ||||||||||||||||||||
| Average USD/MXN exchange rate | ||||||||||||||||||||
| Credit risk | ||||||||||||||||||||
| Credit risk instruments | ||||||||||||||||||||
| Nominal | ||||||||||||||||||||
| Cash flow hedges | ||||||||||||||||||||
| Interest rate and foreign exchange rate risk | ||||||||||||||||||||
| Interest rate and foreign exchange rate instruments | ||||||||||||||||||||
| Nominal | ||||||||||||||||||||
| Average fixed interest rate (%) EUR/PEN | ||||||||||||||||||||
| Average fixed rate (%) USD/COP | ||||||||||||||||||||
| Average fixed interest rate (%) EUR/AUD | ||||||||||||||||||||
| Average fixed interest rate (%) AUD/EUR | ||||||||||||||||||||
| Average EUR/GBP exchange rate | ||||||||||||||||||||
| Average AUD/EUR exchange rate | ||||||||||||||||||||
| Average RON/EUR exchange rate | ||||||||||||||||||||
| Average JPY/EUR exchange rate | ||||||||||||||||||||
| Average CHF/EUR exchange rate | ||||||||||||||||||||
| Average NOK/EUR exchange rate | ||||||||||||||||||||
| Average CZK/EUR exchange rate | ||||||||||||||||||||
| Average EUR/PEN exchange rate | ||||||||||||||||||||
| Average EUR/AUD exchange rate | ||||||||||||||||||||
| Interest rate risk | ||||||||||||||||||||
| Bond Forward instruments | ||||||||||||||||||||
| Nominal | ||||||||||||||||||||
| Average fixed interest rate (%) EUR | ( | ( | ( | ( | ||||||||||||||||
| Inflation risk | ||||||||||||||||||||
| Bond Forward instruments | ||||||||||||||||||||
| Nominal | ||||||||||||||||||||
| Average fixed interest rate (%) EUR | ||||||||||||||||||||
| Exchange rate risk | ||||||||||||||||||||
| Exchange instruments | ||||||||||||||||||||
| Nominal | ||||||||||||||||||||
| Average exchange rate GBP/EUR | ||||||||||||||||||||
| Hedges of net investments in foreign operations | ||||||||||||||||||||
| Exchange rate risk | ||||||||||||||||||||
| Exchange and interest rate instruments | ||||||||||||||||||||
| Nominal | ||||||||||||||||||||
| Average BRL/EUR exchange rate | ||||||||||||||||||||
| Average CLP/EUR exchange rate | ||||||||||||||||||||
| Average COP/EUR exchange rate | ||||||||||||||||||||
| Average GBP/EUR exchange rate | ||||||||||||||||||||
| Average MXN/EUR exchange rate | ||||||||||||||||||||
| Average USD/EUR exchange rate | ||||||||||||||||||||
| Average PLN/EUR exchange rate | ||||||||||||||||||||
679
| 31 December 2021 | ||||||||||||||||||||
| EUR million | ||||||||||||||||||||
| Up to one month | One to three months | Three months to one year | One year to five years | More than five years | Total | |||||||||||||||
| Fair value hedges | ||||||||||||||||||||
| Interest rate risk | ||||||||||||||||||||
| Interest rate instruments | ||||||||||||||||||||
| Nominal | ||||||||||||||||||||
| Average fixed interest rate (%) GBP | ||||||||||||||||||||
| Average fixed interest rate (%) EUR | ( | |||||||||||||||||||
| Average fixed interest rate (%) CHF | ||||||||||||||||||||
| Average fixed interest rate (%) JPY | ||||||||||||||||||||
| Average fixed interest rate (%) USD | ||||||||||||||||||||
| Average fixed interest rate (%) RON | ||||||||||||||||||||
| Foreign exchange risk | ||||||||||||||||||||
| Exchange and interest rate instruments | ||||||||||||||||||||
| Nominal | ||||||||||||||||||||
| Average GBP/EUR exchange rate | ||||||||||||||||||||
| Average USD/EUR exchange rate | ||||||||||||||||||||
| Average CNY/EUR exchange rate | ||||||||||||||||||||
| Average PEN/USD exchange rate | ||||||||||||||||||||
| Average JPY/EUR exchange rate | ||||||||||||||||||||
| Interest rate and foreign exchange rate risk | ||||||||||||||||||||
| Exchange and interest rate instruments | ||||||||||||||||||||
| Nominal | ||||||||||||||||||||
| Average fixed interest rate (%) AUD/EUR | ||||||||||||||||||||
| Average fixed interest rate (%) CZK/EUR | ||||||||||||||||||||
| Average fixed interest rate (%) RON/EUR | ||||||||||||||||||||
| Average fixed interest rate (%) HKD/EUR | ||||||||||||||||||||
| Average fixed interest rate (%) JPY/EUR | ||||||||||||||||||||
| Average fixed interest rate (%) NOK/EUR | ||||||||||||||||||||
| Average fixed interest rate (%) CHF/EUR | ||||||||||||||||||||
| Average fixed interest rate (%) USD/COP | ||||||||||||||||||||
| Average fixed interest rate (%) COP/USD | ( | |||||||||||||||||||
| Average fixed interest rate (%) USD/CLP | ||||||||||||||||||||
| Average AUD/EUR exchange rate | ||||||||||||||||||||
| Average CZK/EUR exchange rate | ||||||||||||||||||||
| Average EUR/GBP exchange rate | ||||||||||||||||||||
| Average EUR/USD exchange rate | ||||||||||||||||||||
| Average HKD/EUR exchange rate | ||||||||||||||||||||
| Average JPY/EUR exchange rate | ||||||||||||||||||||
| Average MXN/EUR exchange rate | ||||||||||||||||||||
| Average NOK/EUR exchange rate | ||||||||||||||||||||
| Average RON/EUR exchange rate | ||||||||||||||||||||
| Average CHF/EUR exchange rate | ||||||||||||||||||||
| Average USD/CLP exchange rate | ||||||||||||||||||||
| Average NZD/EUR exchange rate | ||||||||||||||||||||
| Average USD/MXN exchange rate | ||||||||||||||||||||
680
| 31 December 2021 | ||||||||||||||||||||
| EUR million | ||||||||||||||||||||
| Up to one month | One to three months | Three months to one year | One year to five years | More than five years | Total | |||||||||||||||
| Credit risk | ||||||||||||||||||||
| Credit risk instruments | ||||||||||||||||||||
| Nominal | ||||||||||||||||||||
| Cash flow hedges | ||||||||||||||||||||
| Interest rate and foreign exchange rate risk | ||||||||||||||||||||
| Interest rate and foreign exchange rate instruments | ||||||||||||||||||||
| Nominal | ||||||||||||||||||||
| Average fixed interest rate (%) EUR/PEN | ||||||||||||||||||||
| Average fixed interest rate (%) EUR/AUD | ||||||||||||||||||||
| Average fixed interest rate (%) AUD/EUR | ||||||||||||||||||||
| Average EUR/GBP exchange rate | ||||||||||||||||||||
| Average EUR/USD exchange rate | ||||||||||||||||||||
| Average AUD/EUR exchange rate | ||||||||||||||||||||
| Average RON/EUR exchange rate | ||||||||||||||||||||
| Average JPY/EUR exchange rate | ||||||||||||||||||||
| Average CHF/EUR exchange rate | ||||||||||||||||||||
| Average NOK/EUR exchange rate | ||||||||||||||||||||
| Average CZK/EUR exchange rate | ||||||||||||||||||||
| Average EUR/PEN exchange rate | ||||||||||||||||||||
| Average EUR/AUD exchange rate | ||||||||||||||||||||
| Interest rate risk | ||||||||||||||||||||
| Bond Forward instruments | ||||||||||||||||||||
| Nominal | ||||||||||||||||||||
| Average fixed interest rate (%) EUR | ( | ( | ||||||||||||||||||
| Average fixed interest rate (%) USD | ||||||||||||||||||||
| Average fixed interest rate (%) AUD | ||||||||||||||||||||
| Hedges of net investments in foreign operations | ||||||||||||||||||||
| Exchange rate risk | ||||||||||||||||||||
| Exchange and interest rate instruments | ||||||||||||||||||||
| Nominal | ||||||||||||||||||||
| Average BRL/EUR exchange rate | ||||||||||||||||||||
| Average CLP/EUR exchange rate | ||||||||||||||||||||
| Average COP/EUR exchange rate | ||||||||||||||||||||
| Average GBP/EUR exchange rate | ||||||||||||||||||||
| Average MXN/EUR exchange rate | ||||||||||||||||||||
| Average PLN/EUR exchange rate | ||||||||||||||||||||
| Average USD/EUR exchange rate | ||||||||||||||||||||
681
Other geographies
Consumer Group entities mainly have loans portfolios at fixed interest rates and are therefore, exposed to changes in fair value due to movements in market interest rates. The entities manage this risk by contracting interest rate swaps in which they pay a fixed rate and receive a variable rate. Interest rate risk is the only one hedged and, therefore, other risks, such as credit risk, are managed but not hedged by the entities. The interest rate risk component is determined as the change in fair value of fixed rate loans arising solely from changes in a reference rate. This strategy is designated as a fair value hedge and its effectiveness is assessed by comparing changes in the fair value of loans attributable to changes in reference interest rates with changes in the fair value of interest rate swaps.
In addition, in order to access international markets with the aim of obtaining sources of financing, some Consumer Group´s entities issue fixed rate debt in their own currency and in other currencies that differ from their functional currency. Therefore, they are exposed to changes in both interest rates and exchange rates, which they mitigate with derivatives (interest rate swaps, fx forward and cross currency swaps) in which they receive a fixed interest rate and pay a variable interest rate, implemented with a fair value hedge.
The cash flow hedges of the Grupo Santander´s entities hedge the foreign currency risk of loans and financing.
Finally, it has hedges of net investments abroad to hedge the foreign exchange risk of the shareholding in NOK, CNY, PLN, CAD and CHF currencies.
Banco Santander México, S.A., Institución de Banca Múltiple, Grupo Financiero Santander México has mainly long-term loan portfolios at fixed interest rates, portfolios of short-term deposits in local currency, portfolios of Mexican Government bonds and corporate bonds in currencies other than the local currency and are therefore exposed to changes in fair value due to movements in market interest rates, as well as these latter portfolios also to variations in exchange rates. The entity manages this risk by contracting derivatives (interest rate swaps or cross currency swaps) in which they pay a fixed rate and receive a variable rate. Only the interest rate and exchange rate risk is hedged, if applicable, and therefore other risks, such as credit risk, are managed but not hedged by the entity.
The interest rate risk component is determined as the change in the fair value of fixed rate loans arising solely from changes in a reference rate. This strategy is designated as a fair value hedge and its effectiveness is assessed by comparing changes in the fair value of loans attributable to changes in benchmark interest rates with changes in the fair value of interest rate swaps.
Regarding cash flow hedges, Banco Santander México, S.A., Institución de Banca Múltiple, Grupo Financiero Santander México has a portfolio of unsecured bonds issued at a variable rate in its local currency, which it manages with an interest rate swap in which it receives a variable rate and pays a fixed rate. On the other hand, it also has different items in currencies other than the local currency: unsecured fixed rate bonds, commercial bank loans at variable rates, fixed rate issues, Mexican and Brazilian government bonds at fixed rates. In all these portfolios, the Bank is exposed to exchange rate variations, which it mitigates by contracting cross currency swaps or fx forward.
Banco Santander (Brasil) S.A. has, on the one hand, fair value hedges to protect both assets and liabilities from fluctuations in market rates. The market risk coverage management methodology adopted by the Bank segregates transactions by risk factor (BRL/USD exchange rate risk, pre-set interest rate risk in BRL, USD interest rate risk, inflation….). The entity manages this risk by contracting derivatives (interest rate swaps or interest rate futures) to hedge assets or liabilities at a fixed rate.
Brasil has corporate loans in different currencies than the local one and is therefore exposed to changes in fair value due to exchange rates. This risk is mitigated by contracting cross currency swaps or futures.
It also holds a portfolio of long-term corporate bonds with inflation-indexed rates, thus exposed to changes in market value due to changes in market inflation rates. In order to achieve its mitigation, they contract futures in which they pay the indexed inflation and receive variable interest rates.
In the hedge of cash flows, Banco Santander (Brasil) S.A. has portfolios of loans and government bonds in different currency than the entity's functional currency and, therefore, it is subject to the risk of changes in currency rates. This exposure will be mitigated by hiring Cross Currency Swaps and futures.
Finally, they have a portfolio of variable rate government bonds, so they are exposed to changes in the value due to changes in interest rates. In order to mitigate these changes, a future is hired in which a variable rate is paid and a fixed rate is received.
Additionally, Banco Santander - Chile uses fair value hedges with cross currency swaps, interest rate swaps and call money swaps to hedge its exposure to changes in the fair value of the hedged item attributable to interest rates. The aforementioned hedging instruments modify the effective cost of long-term issues, from a fixed interest rate to a variable interest rate.
In addition, it also makes cash flow hedges in which it uses cross currency swaps to cover the risk of variability of flows attributable to changes in the interest rate of bonds and interbank loans issued at variable rates, as well as to cover the variation of foreign currency, mainly in United States dollars. To hedge the inflation risk present in certain items, it uses both forwards and cross currency swaps.
At Santander Bank National Association, Interest Rate Swaps are used to leave commercial loans at a fixed rate at a variable rate in USD indexed to 1-month Libor or SOFR, under cash flow hedges.
682
Regarding the hedged items, the following table shows the detail of the type of hedging, the risk that is hedged and which products are being hedged at 31 December 2023, 2022 and 2021. The products that are being hedged are mainly borrowed deposits, financial deposits, loans, government bonds as assets and financial bonds as liabilities:
| EUR million | |||||||||||||||||||||||||||||
| 31 December 2023 | |||||||||||||||||||||||||||||
| Carrying amount of hedged items | Accumulated amount of fair value adjustments on the hedged item | Balance sheet line item | Change in fair value of hedged item for ineffectiveness assessment | Cash flow reserves or conversion reserves | |||||||||||||||||||||||||
| Assets | Liabilities | Assets | Liabilities | Continuing hedges | Discontinued hedges | ||||||||||||||||||||||||
| Fair value hedges | ( | ( | |||||||||||||||||||||||||||
| Interest rate risk | ( | ( | |||||||||||||||||||||||||||
| Exchange rate risk | ( | ( | |||||||||||||||||||||||||||
| Interest and Exchange rate risk | ( | ( | |||||||||||||||||||||||||||
| Inflation risk | |||||||||||||||||||||||||||||
| Credit risk | |||||||||||||||||||||||||||||
| Cash flow hedges | ( | ( | ( | ||||||||||||||||||||||||||
| Interest rate risk | ( | ( | ( | ||||||||||||||||||||||||||
| Exchange rate risk | ( | ||||||||||||||||||||||||||||
| Interest and Exchange rate risk | ( | ||||||||||||||||||||||||||||
| Inflation risk | ( | ( | |||||||||||||||||||||||||||
| Equity risk | ( | ||||||||||||||||||||||||||||
| Net foreign investments hedges | ( | ||||||||||||||||||||||||||||
| Exchange rate risk | ( | ||||||||||||||||||||||||||||
| ( | ( | ( | ( | ||||||||||||||||||||||||||
| EUR million | |||||||||||||||||||||||||||||
| 31 December 2022 | |||||||||||||||||||||||||||||
| Carrying amount of hedged items | Accumulated amount of fair value adjustments on the hedged item | Balance sheet line item | Change in fair value of hedged item for ineffectiveness assessment | Cash flow reserves or conversion reserves | |||||||||||||||||||||||||
| Assets | Liabilities | Assets | Liabilities | Continuing hedges | Discontinued hedges | ||||||||||||||||||||||||
| Fair value hedges | ( | ( | Loans and advances / Deposits and Debt securities / Debt securities issued | ( | |||||||||||||||||||||||||
| Interest rate risk | ( | ( | ( | ||||||||||||||||||||||||||
| Exchange rate risk | ( | ( | |||||||||||||||||||||||||||
| Interest and Exchange rate risk | ( | ( | ( | ||||||||||||||||||||||||||
| Inflation risk | |||||||||||||||||||||||||||||
| Credit risk | ( | ||||||||||||||||||||||||||||
| Cash flow hedges | ( | ( | |||||||||||||||||||||||||||
| Interest rate risk | ( | ( | |||||||||||||||||||||||||||
| Exchange rate risk | ( | ( | ( | ||||||||||||||||||||||||||
| Interest and Exchange rate risk | ( | ||||||||||||||||||||||||||||
| Inflation risk | ( | ( | |||||||||||||||||||||||||||
| Equity risk | |||||||||||||||||||||||||||||
| Net foreign investments hedges | ( | ||||||||||||||||||||||||||||
| Exchange rate risk | ( | ||||||||||||||||||||||||||||
| ( | ( | ( | ( | ( | |||||||||||||||||||||||||
683
| EUR million | |||||||||||||||||||||||||||||
| 31 December 2021 | |||||||||||||||||||||||||||||
| Carrying amount of hedged items | Accumulated amount of fair value adjustments on the hedged item | Balance sheet line item | Change in fair value of hedged item for ineffectiveness assessment | Cash flow reserves or conversion reserves | |||||||||||||||||||||||||
| Assets | Liabilities | Assets | Liabilities | Continuing hedges | Discontinued hedges | ||||||||||||||||||||||||
| Fair value hedges | Loans and advances / Deposits and Debt securities / Debt securities issued | ( | |||||||||||||||||||||||||||
| Interest rate risk | ( | ||||||||||||||||||||||||||||
| Exchange rate risk | ( | ( | |||||||||||||||||||||||||||
| Interest and Exchange rate risk | ( | ||||||||||||||||||||||||||||
| Inflation risk | |||||||||||||||||||||||||||||
| Credit risk | ( | ||||||||||||||||||||||||||||
| Cash flow hedges | ( | ( | |||||||||||||||||||||||||||
| Interest rate risk | ( | ( | |||||||||||||||||||||||||||
| Exchange rate risk | |||||||||||||||||||||||||||||
| Interest and Exchange rate risk | |||||||||||||||||||||||||||||
| Inflation risk | ( | ( | |||||||||||||||||||||||||||
| Equity risk | |||||||||||||||||||||||||||||
| Net foreign investments hedges | ( | ||||||||||||||||||||||||||||
| Exchange rate risk | ( | ||||||||||||||||||||||||||||
| ( | ( | ||||||||||||||||||||||||||||
684
The cumulative amount of adjustments of the fair value hedging instruments that remain in the balance for hedges items that are no longer adjusted by profit and loss of coverage as at 31 December 2023 is EUR 1,006 million losses (EUR 756 million loss and EUR 460 million profit in 2022 and 2021, respectively).
The net impact of the hedges are shown in the following table:
| EUR million | |||||||||||||||||
| 31 December 2023 | |||||||||||||||||
| Earnings/(losses) recognised in another cumulative overall result | Ineffective recognised in the income statement | Line of the income statement that includes the ineffectiveness of cash flows | Reclassified amount of reserves to the income statement due to: | ||||||||||||||
| Gains or losses financial assets/liabilities | Cover transaction affecting the income statement | Line of the income statement that includes reclassified items | |||||||||||||||
| Fair value hedges | |||||||||||||||||
| Interest rate risk | |||||||||||||||||
| Exchange rate risk | ( | ||||||||||||||||
| Interest rate and exchange rate risk | |||||||||||||||||
| Cash flow hedges | Gains or losses financial assets/liabilities | ( | Interest margin/Gains or losses financial assets/liabilities | ||||||||||||||
| Interest rate risk | ( | ||||||||||||||||
| Exchange rate risk | ( | ( | |||||||||||||||
| Interest rate and exchange rate risk | ( | ||||||||||||||||
| Inflation risk | ( | ||||||||||||||||
| Equity risk | |||||||||||||||||
| Net foreign investments hedges | ( | ||||||||||||||||
| Exchange rate risk | ( | ||||||||||||||||
| ( | |||||||||||||||||
| EUR million | |||||||||||||||||
| 31 December 2022 | |||||||||||||||||
| Earnings/(losses) recognised in another cumulative overall result | Ineffective coverage recognised in the income statement | Line of the income statement that includes the ineffectiveness of cash flows | Reclassified amount of reserves to the income statement due to: | ||||||||||||||
| Gains or losses financial assets/liabilities | Cover transaction affecting the income statement | Line of the income statement that includes reclassified items | |||||||||||||||
| Fair value hedges | |||||||||||||||||
| Interest rate risk | |||||||||||||||||
| Exchange rate risk | ( | ||||||||||||||||
| Interest rate and exchange rate risk | ( | ||||||||||||||||
| Cash flow hedges | ( | ( | Gains or losses financial assets/liabilities | Interest margin/Gains or losses financial assets/liabilities | |||||||||||||
| Interest rate risk | ( | ( | |||||||||||||||
| Exchange rate risk | ( | ( | |||||||||||||||
| Interest rate and exchange rate risk | ( | ( | |||||||||||||||
| Inflation risk | ( | ||||||||||||||||
| Equity risk | |||||||||||||||||
| Net foreign investments hedges hedges | ( | ||||||||||||||||
| Exchange rate risk | ( | ||||||||||||||||
| ( | |||||||||||||||||
685
| EUR million | |||||||||||||||||
| 31 December 2021 | |||||||||||||||||
| Earnings/(losses) recognised in another cumulative overall result | Ineffective coverage recognised in the income statement | Line of the income statement that includes the ineffectiveness of cash flows | Reclassified amount of reserves to the income statement due to: | ||||||||||||||
| Gains or losses financial assets/liabilities | Cover transaction affecting the income statement | Line of the income statement that includes reclassified items | |||||||||||||||
| Fair value hedges | |||||||||||||||||
| Interest rate risk | |||||||||||||||||
| Risk of Exchange rate | ( | ||||||||||||||||
| Risk of interest rate and exchange rate | |||||||||||||||||
| Credit risk | |||||||||||||||||
| Cash flow hedges | ( | ( | Gains or losses financial assets/liabilities | ( | Interest margin/Gains or losses financial assets/liabilities | ||||||||||||
| Interest rate risk | ( | ( | |||||||||||||||
| Exchange rate risk | ( | ||||||||||||||||
| Interest rate and exchange rate risk | ( | ( | ( | ||||||||||||||
| Inflation risk | ( | ( | |||||||||||||||
| Equity risk | ( | ||||||||||||||||
| Net foreign investments hedges | ( | ||||||||||||||||
| Exchange rate risk | ( | ||||||||||||||||
| ( | ( | ( | |||||||||||||||
686
The following table shows the movement in the impact of equity for the year:
| EUR million | |||||||||||
| 2023 | 2022 | 2021 | |||||||||
| Balance at beginning of year | ( | ( | ( | ||||||||
| Cash flow hedges | |||||||||||
| Interest rate risk | ( | ( | |||||||||
| Amounts transferred to income statements | ( | ||||||||||
| Gain or loss in value CFE - recognized in equity | ( | ( | |||||||||
| Exchange rate risk | ( | ||||||||||
| Amounts transferred to income statements | ( | ||||||||||
| Gain or loss in value CFE - recognized in equity | ( | ( | |||||||||
| Interest rate and exchange rate risk | ( | ( | |||||||||
| Amounts transferred to income statements | ( | ||||||||||
| Gain or loss in value CFE - recognized in equity | ( | ( | ( | ||||||||
| Inflation risk | ( | ||||||||||
| Amounts transferred to income statements | |||||||||||
| Gain or loss in value CFE - recognized in equity | ( | ( | |||||||||
| Equity risk | ( | ||||||||||
| Amounts transferred to income statements | |||||||||||
| Gain or loss in value CFE - recognized in equity | ( | ||||||||||
| Net foreign investments hedges | |||||||||||
| Exchange rate risk | ( | ( | ( | ||||||||
| Amounts transferred to income statements | |||||||||||
| Gain or loss in value CFE - recognized in equity | ( | ( | ( | ||||||||
| Minorities, taxes and others | ( | ||||||||||
| Balance at end of year | ( | ( | ( | ||||||||
37. Discontinued operations
No operations were discontinued in 2023, 2022 or 2021.
38. Interest income
Interest and similar income in the consolidated income statement comprises the interest accruing in the year on all financial assets with an implicit or explicit return, calculated by applying the effective interest method, irrespective of measurement at fair value; and the rectifications of income as a result of hedge accounting. Interest is recognised gross, without deducting any tax withheld at source.
The detail of the main interest and similar income items earned in 2023, 2022 and 2021 is as follows:
| EUR million | |||||||||||
| 2023 | 2022 | 2021 | |||||||||
| Loans and advances, central banks | |||||||||||
| Loans and advances, credit institutions | |||||||||||
| Debt instruments | |||||||||||
| Loans and advances, customers | |||||||||||
Other interestA | |||||||||||
A.Mainly include the rectification of income originating from accounting hedges as well as interest on balances in central banks and on demand credit institutions.
Most of the interest and similar income was generated by the Group’s financial assets that are measured either at amortised cost or at fair value through other comprehensive income.
39. Interest expense
Interest expense and similar charges in the consolidated income statement includes the interest accruing in the year on all financial liabilities with an implicit or explicit return, including remuneration in kind, calculated by applying the effective interest method, irrespective of measurement at fair value; the rectifications of cost as a result of hedge accounting; and the interest cost attributable to provisions recorded for pensions.
The detail of the main items of interest expense and similar charges accrued in 2023, 2022 and 2021 is as follows:
| EUR million | |||||||||||
| 2023 | 2022 | 2021 | |||||||||
| Central banks deposits | |||||||||||
| Credit institution deposits | |||||||||||
| Customer deposits | |||||||||||
| Debt securities issued and subordinated liabilities | |||||||||||
| Marketable debt securities | |||||||||||
| Subordinated liabilities (note 23) | |||||||||||
| Provisions for pensions (note 25) | |||||||||||
| Lease Liabilities | |||||||||||
| Other interest expense | |||||||||||
Most of the interest expense and similar charges was generated by the Group’s financial liabilities that are measured at amortised cost.
687
40. Dividend income
Dividend income includes the dividends and payments on equity instruments out of profits generated by investees after the acquisition of the equity interest.
The detail of income from dividends as follows:
| EUR million | |||||||||||
| 2023 | 2022 | 2021 | |||||||||
| Dividend income classified as: | |||||||||||
| Financial assets held for trading | |||||||||||
| Non-trading financial assets mandatorily at fair value through profit or loss | |||||||||||
| Financial assets at fair value through other comprehensive income | |||||||||||
41. Commission income
Commission income comprises the amount of all fees and commissions accruing in favour of the Group in the year, except those that form an integral part of the effective interest rate on financial instruments.
The detail of fee and commission income is as follows:
| EUR million | |||||||||||
| 2023 | 2022 | 2021 | |||||||||
| Coming from collection and payment services | |||||||||||
| Bills | |||||||||||
| Demand accounts | |||||||||||
| Cards | |||||||||||
| Orders | |||||||||||
| Cheques and other | |||||||||||
| Coming from non-banking financial products | |||||||||||
| Investment funds | |||||||||||
| Pension funds | |||||||||||
| Insurance | |||||||||||
| Coming from Securities services | |||||||||||
| Securities underwriting and placement | |||||||||||
| Securities trading | |||||||||||
| Administration and custody | |||||||||||
| Asset management | |||||||||||
| Other | |||||||||||
| Foreign exchange | |||||||||||
| Financial guarantees | |||||||||||
| Commitment fees | |||||||||||
| Other fees and commissions | |||||||||||
42. Commission expense
Commission expense shows the amount of all fees and commissions paid or payable by the Group in the year, except those that form an integral part of the effective interest rate on financial instruments.
The detail of commission expense is as follows:
| EUR million | |||||||||||
| 2023 | 2022 | 2021 | |||||||||
| Commissions assigned to third parties | |||||||||||
| Cards | |||||||||||
| By collection and return of effects | |||||||||||
| Other fees assigned | |||||||||||
| Other commissions paid | |||||||||||
| Brokerage fees on lending and deposit transactions | |||||||||||
| Sales of insurance and pension funds | |||||||||||
| Other fees and commissions | |||||||||||
43. Gains or losses on financial assets and liabilities
The following information is presented below regarding the gains or losses recorded for financial assets or liabilities:
a) Breakdown
The detail, by origin, of Gains/losses on financial assets and liabilities:
| EUR million | |||||||||||
| 2023 | 2022 | 2021 | |||||||||
| Gains or losses on financial assets and liabilities not measured at fair value through profit or loss, net | |||||||||||
| Financial assets at amortized cost | ( | ||||||||||
| Other financial assets and liabilities | |||||||||||
| Of which debt instruments | |||||||||||
Gains or losses on financial assets and liabilities held for trading, netA | |||||||||||
| Gains or losses on non-trading financial assets and liabilities mandatory at fair value through profit or loss | |||||||||||
Gains or losses on financial assets and liabilities measured at fair value through profit or loss, netA | ( | ||||||||||
| Gains or losses from hedge accounting, net | ( | ||||||||||
A.Includes the net result obtained by transactions with debt securities, equity instruments, derivatives and short positions included in this portfolio when the Group jointly manages its risk in these instruments.
688
As explained in note 44, the above breakdown should be analysed in conjunction with the 'Exchange differences, net':
| EUR million | |||||||||||
| 2023 | 2022 | 2021 | |||||||||
| Exchange differences, net | ( | ( | |||||||||
b) Financial assets and liabilities at fair value through profit or loss
The detail of the amount of the asset balances is as follows:
| EUR million | |||||||||||
| 2023 | 2022 | 2021 | |||||||||
| Loans and receivables: | |||||||||||
| Central banks | |||||||||||
| Credit institutions | |||||||||||
| Customers | |||||||||||
| Debt instruments | |||||||||||
| Equity instruments | |||||||||||
| Derivatives | |||||||||||
Grupo Santander mitigates and reduces this exposure as follows:
•With respect to derivatives, the Group has entered into framework agreements with a large number of credit institutions and customers for the netting-off of asset positions and the provision of collateral for non-payment.
At 31 December 2023 the exposure to credit risk of the derivatives presented in the balance sheet is not significant because they are subject to netting and collateral agreements (see note 2.f).
•Loans and advances to credit institutions and Loans and advances includes reverse repos amounting to EUR 44,567 million at 31 December 2023.
Also, mortgage-backed assets totalled EUR 788 million.
•Debt instruments include EUR 51,251 million of Spanish and foreign government securities.
At 31 December 2023 the amount of the change in the year in the fair value of financial assets at fair value through profit or loss attributable to variations in their credit risk (spread) was not material.
The detail of the amount of the liability balances is as follows:
| EUR million | |||||||||||
| 2023 | 2022 | 2021 | |||||||||
| Deposits | |||||||||||
| Central banks | |||||||||||
| Credit institutions | |||||||||||
| Customer | |||||||||||
| Marketable debt securities | |||||||||||
| Short positions | |||||||||||
| Derivatives | |||||||||||
| Other financial liabilities | |||||||||||
At 31 December 2023, the amount of the change in the fair value of financial liabilities at fair value through profit or loss attributable to changes in their credit risk during the year is not material.
In relation to liabilities designated at fair value through profit or loss where it has been determined at initial recognition that the credit risk is recorded in accumulated 'Other comprehensive income' (see 'Statement of recognised income and expense') the amount that the Group would be contractually obliged to pay on maturity of these liabilities at 31 December 2023 is EUR 866 million higher than their carrying amount (EUR 1,044 million higher at 31 December 2022 and EUR 81 million lower at 31 December 2021).
Within Deposits, there are repurchase agreements amounting to EUR 45,956 million at 31 December 2023.
44. Exchange differences, net
Exchange differences shows basically the gains or losses on currency dealings, the differences that arise on translations of monetary items in foreign currencies to the functional currency.
Grupo Santander manages the currencies to which it is exposed together with the arrangement of derivative instruments and, accordingly, the changes in this line item should be analysed together with those recognised under 'Gains/losses on financial assets and liabilities' (see note 43).
689
45. Other operating income and expenses
Other operating income and Other operating expenses in the consolidated income statements include:
| EUR million | |||||||||||
| 2023 | 2022 | 2021 | |||||||||
| Other operating income | |||||||||||
| Non- financial services | |||||||||||
| Other operating income | |||||||||||
| Other operating expense | ( | ( | ( | ||||||||
| Non-financial services | ( | ( | ( | ||||||||
| Other operating expense: | ( | ( | ( | ||||||||
| Of which, credit institutions deposit guarantee fund and single resolution fund | ( | ( | ( | ||||||||
| ( | ( | ( | |||||||||
The amount of the Group recognises in relation to income from sub-leases of rights of use is not material.
46. Staff costs
a) Breakdown
The detail of Staff costs is as follows:
| EUR million | |||||||||||
| 2023 | 2022 | 2021 | |||||||||
| Wages and salaries | |||||||||||
| Social Security costs | |||||||||||
| Additions to provisions for defined benefit pension plans (note 25) | |||||||||||
| Contributions to defined contribution pension funds | |||||||||||
| Other Staff costs | |||||||||||
b) Headcount
The number of employees of Grupo Santander at 31 December 2023, 2022 and 2021 is 212,764 , 206,462 and 199,177 , respectively. For the years 2023, 2022 and 2021 the average number of employees of the Group is 211,514 , 201,516 and 194,589 , respectively, being the average number of employees of Banco Santander, S.A. 24,061 , 23,410 and 24,512 , of which 16 , 17 and 19 are executive directors and Senior management, respectively.
690
The functional breakdown (final employment), by gender, at 31 December 2023 is as follows:
| Functional breakdown by gender | ||||||||||||||||||||||||||
Senior executivesA | Other executives | Other employees | ||||||||||||||||||||||||
| Men | Women | Men | Women | Men | Women | |||||||||||||||||||||
| Europe | ||||||||||||||||||||||||||
| North America | ||||||||||||||||||||||||||
| South America | ||||||||||||||||||||||||||
The same information, expressed in percentage terms at 31 December 2023 is as follows:
| Functional breakdown by gender | ||||||||||||||||||||||||||
Senior executivesA | Other executives | Other employees | ||||||||||||||||||||||||
| Men | Women | Men | Women | Men | Women | |||||||||||||||||||||
| Europe | % | % | % | % | % | % | ||||||||||||||||||||
| North America | % | % | % | % | % | % | ||||||||||||||||||||
| South America | % | % | % | % | % | % | ||||||||||||||||||||
| % | % | % | % | % | % | |||||||||||||||||||||
A.Includes Group Senior Executive VP, Executive VP y VP.
The labour relations between employees and the various Group companies are governed by the related collective agreements or similar regulations.
The number of employees in the Group with disabilities, distributed by professional categories, at 31 December 2023, is as follows:
Number of employeesA | |||||
| 2023 | |||||
| Senior executives | |||||
| Other executives | |||||
| Other employees | |||||
A.An employee with disabilities is considered to be a person who is recognised by the State or the company in each jurisdiction where the Group operates and that entitles them to receive direct monetary assistance, or other types of aid such as, for example, reduction of their taxes. In the case of Spain, employees with disabilities have been considered to be those with a degree of disabilities greater than or equal to 33 %.
The number of Group employees with disabilities at 2022 and 2021, was 4,114 and 3,703 , respectively.
Likewise, the average number of employees of Banco Santander, S.A. with disabilities, equal to or greater than 33 %, during 2023 was 428 (331 and 288 employees during 2022 and 2021). At the end of fiscal year 2023, there were 436 employees (444 and 307 employees at 31 December, 2022 and 2021, respectively).
c) Share-based payments
The main share-based payments granted by the Group in force at 31 December, 2023, 2022 and 2021 are described below.
i. Bank
The variable remuneration policy for the Bank’s executive directors and certain executive personnel of the Bank and of other Group companies includes Bank share-based payments, the implementation of which requires, in conformity with the law and the Bank’s Bylaws, specific resolutions to be adopted by the general meeting.
Were it necessary or advisable for legal, regulatory or other similar reasons, the delivery mechanisms described below may be adapted in specific cases without altering the maximum number of shares linked to the plan or the essential conditions to which the delivery thereof is subject.
These adaptations may involve replacing the delivery of shares with the delivery of cash amounts of an equal value.
691
The plans that include share-based payments are as follows: (i) Deferred and Conditional Variable Remuneration Plan; (ii) Deferred Multiyear Objectives Variable Remuneration Plan; (iii) Digital Transformation Award, (iv) Digital Transformation Award 2022 and (v) Digital Transformation Award 2023. The characteristics of the plans are set forth below:
Deferred variable remuneration systems | Description and plan beneficiaries | Conditions | Calculation Base | ||||||||
| (i) Deferred and conditional variable remuneration plan (2015, 2016, 2017, 2018, 2019, 2020, 2021, 2022 and 2023) | The purpose of these cycles is to defer a portion of the variable remuneration of the beneficiaries over a period of Beneficiaries: •Executive directors and certain executives (including senior management) and employees who assume risk, who perform control functions or receive an overall remuneration which puts them on the same remuneration level as executives and employees who assume risks (fifth cycle) •In the case of the sixth, seventh, eighth, ninth, tenth, eleventh twelfth and thirteenth cycle, the beneficiaries are Material Risk Takers (Identified staff) that are not beneficiaries of the Deferred Multiyear Objectives Variable Remuneration Plan. | For the fifth and sixth cycles (2015 to 2016), the accrual of the deferred compensation is conditioned, in addition to the requirement that the beneficiary remains in the Group's employ, with the exceptions included in the plan regulations on none of the following circumstances existing during the period prior to each delivery, pursuant to the provisions set forth in each case in the plan regulations: •Poor financial performance of the Group. •Breach by the beneficiary of internal regulations, including, in particular, those relating to risks. •Material restatement of the Group's consolidated financial statements, except when it is required pursuant to a change in accounting standards. •Significant changes in the Group’s economic capital or risk profile In the case of the seventh, eighth, ninth, tenth, eleventh, twelfth and thirteenth cycles (2017 to 2022), the accrual of deferred compensation is conditioned, in addition to the permanence of the beneficiary in the Group, with the exceptions contained in the plan's regulations, to non-occurrence of a poor performance of the entity as a whole or of a specific division or area of the entity or of the exposures generated by the personnel: i.significant failures in risk management by the entity , or by a business unit or risk control unit. ii.the increase suffered by the entity or by a business unit of its capital needs, not foreseen at the time of generation of the exposures. iii.Regulatory sanctions or judicial sentences for events that could be attributable to the unit or the personnel responsible for those. Also, the breach of internal codes of conduct of the entity. iv.Irregular behaviours, whether individual or collective, considering in particular the negative effects derived from the marketing of inappropriate products and the responsibilities of the persons or bodies that made those decisions. | Fifth cycle (2015): •Executive directors and members of the Identified Staff with total variable remuneration higher than •Division managers, country heads (of countries which represent at least •Other beneficiaries: Sixth cycle (2016): • Seventh, eighth, ninth, tenth and eleventh cycle (2017, 2018, 2019, 2020 and 2021): •Beneficiaries of these plans with target total variable remuneration higher or equal to •Beneficiaries of these plans with target total variable remuneration between •Other beneficiaries of these plans: Twelfth (2022) and thirteenth (2023) cycle: •Beneficiaries of these plans with target total variable remuneration higher or equal to •Beneficiaries of these plans with target total variable remuneration between •Other beneficiaries of these plans: T | ||||||||
692
Deferred variable remuneration systems | Description and plan beneficiaries | Conditions | Calculation Base | ||||||||
| (ii)Deferred Multiyear Objectives Variable Remuneration Plan (2016, 2017, 2018, 2019, 2020, 2021, 2022 and 2023) | The aim is simplifying the remuneration structure, improving the ex ante risk adjustment and increasing the impact of the long-term objectives on the Group’s most relevant roles. The purpose of these cycles is to defer a portion of the variable remuneration of the beneficiaries over a period of or Beneficiaries Executive directors, senior management and certain executives of the Group’s first lines of responsibility. | In 2016 the accrual is conditioned, in addition to the permanence of the beneficiary in the Group, with the exceptions contained in the plan’s regulations, to non-occurrence of the following circumstances during the period prior to each of the deliveries in the terms set forth in each case in the plan’s regulations: i.Poor performance of the Group. ii.Breach by the beneficiary of the internal regulations, including in particular that relating to risks. iii.Material restatement of the Group’s consolidated financial statements, except when appropriate under a change in accounting regulations. iv.Significant changes in the Group’s economic capital or risk profile. In 2017, 2018, 2019, 2020 and 2021 the accrual is conditioned, in addition to the beneficiary' permanence in the Group, with the exceptions contained in the plan’s regulations, to the non-occurrence of poor financial performance from the entity as a whole or of a specific division or area thereof or of the exposures generated by the personnel, taking into account the following factors: v.Significant failures in risk management committed by the entity, or by a business unit or risk control unit. vi.the increase suffered by the entity or by a business unit of its capital needs, not foreseen at the time of generation of the exposures. vii.Regulatory sanctions or court rulings for events that could be attributable to the unit or the personnel responsible for those. Also, the breach of internal codes of conduct of the entity. viii.Irregular behaviours, whether individual or collective, considering in particular negative effects derived from the marketing of inappropriate products and responsibilities of persons or bodies that made those decisions. Paid half in cash and half in shares. In the seventh cycle, and only for executive directors: half in cash and In the eighth cycle, and for all Identified Staff: half in cash and 25% in shares and 25% in share options, or half in cash and half in shares, according to each executive´s choice. | First cycle (2016): •Executive directors and members of the Identified Staff with total variable remuneration higher than or equal to •Senior managers, country heads of countries representing at least •Other beneficiaries: The second, third, fourth, fifth and sixth cycles (2017, 2018, 2019,2020 and 2021 respectively) are under the aforementioned deferral rules, except that the variable remuneration considered is the target for each executive and not the actual award. In 2016 the metrics for the deferred portion subject to long-term objectives (last third or last three fifths, respectively, for the cases of •Earnings per share (EPS) growth in 2018 over 2015. •Relative Total Shareholder Return (TSR) in the 2016-2018 period measured against a group of credit institutions. •Compliance with the fully-loaded common equity tier 1 (“CET1”) ratio target for financial year 2018. •Compliance with Grupo Santander’s underlying return on risk-weighted assets (“RoRWA”) growth target for financial year 2018 compared to financial year 2015. In the second, third, fourth, fifth and sixth cycle (2017, 2018, 2019, 2020 and 2021) the metrics for the deferred portion subject to long-term objectives (last third or last three fifths, respectively, for the cases of •EPS growth in 2019, 2020, 2021, 2022 and 2023 (over 2016, 2017, 2018, 2019 and 2020, for each respective cycle) •Relative Total Shareholder Return (TSR) measured against a group of •Compliance with the fully-loaded common equity tier 1 (“CET1”) ratio target for financial years 2019, 2020, 2021,2022 and 2023, respectively. In the seventh (2022) and eighth cycle (2023), the metrics for the deferred portion subject to long-term objectives (two last fourths and last three fifths, for the cases of •Banco Santander's consolidated Return on tangible equity (RoTE) target in 2024 (7th cycle) and 2025 (8th cycle). •Relative Total Shareholder Return (TSR) measured against a group of •Five ESG metrics linked to our public targets of our Responsible Banking agenda. | ||||||||
693
Deferred variable remuneration systems | Description and plan beneficiaries | Conditions | Calculation Base | ||||||||
| (iii) Digital Transformation Award (2019, 2020 and 2021) | The 2019, 2020 and 2021 Digital Transformation Incentive (the “Digital Incentive”) is a variable remuneration system that includes the delivery of Santander shares and share options. The aim of the Digital Incentive is to attract and retain the critical skill sets to support and accelerate the digital transformation of the Group. By means of this program, the Group offers a remuneration element which is competitive with the remuneration systems offered by other market operators who also compete for digital talent. The number of beneficiaries is limited to a maximum of | The funding of this incentive is subject to meeting important milestones that are aligned with the Group´s digital roadmap and have been approved by the board of directors, taking into account the digitalization strategy of the Group, with the aim of becoming the best open, responsible global financial services platform. Performance of 2019 incentive was measured based on achievement of the following milestones: (i) Launch of a Global Trade Services (GTS) platform; (ii) launch of a Global Merchant Services (GMS) platform; (iii) migration of our fully digital bank, OpenBank, to a "next generation" platform and launch in The milestones for the 2020 Digital Transformation Award were: (i) rolling out the global merchant services (GMS) platform in The milestones for 2021 were: (i)in relation to Pago Nxt Consumer payment platform: implementation of Superdigital platform in | The Digital Incentive is structured Any delivery of shares, either directly or via exercise of options overs shares, will be subject generally to the Group’s general malus & clawback provisions as described in the Group’s remuneration policy and to the continuity of the beneficiary within the Grupo Santander. In this regard, the board may define specific rules for non-Identified Staff. Vested share options can be exercised until maturity, with all options lapsing after The total achievement for 2021 Digital Incentive was | ||||||||
694
| Deferred variable remuneration systems | Description and plan beneficiaries | Conditions | Calculation base | ||||||||
| (iv) Digital Transformation Award (2022) | The board of directors approved the 2022 Digital Transformation Incentive. It is a variable remuneration scheme splits in • The first one, with the same mechanism than previous years, that delivers Santander shares and share options if the group hits major milestones on its digital roadmap. This is aimed at a group of up to • And the second one, which delivers PagoNxt, S.L. RSUs and premium prices options (PPOs), and is aimed at up to employees (and limited to The aim of the Digital Incentive is to attract and retain the critical skill sets to support and accelerate the digital transformation of the Group. By means of this program, the Group offers a remuneration element which is competitive with the remuneration systems offered by other market operators who also compete for digital talent. | Performance of the first block of the incentive shall be measured based on achievement of the following milestones: i. Edelweiss: Our Santander future retail architecture EDELWEISS will mean moving from our current Core centric banking architecture towards a Customer and Data-Centric Core supported by lean Record Processing engines. ii. Simplification: Speed up the simplification of our technology platform and business model by Reducing the total number of applications in production and reducing number of products in the regions. iii. Agile: Agile ways of working enable a better and faster reaction to customers’ needs and is based on a value-driven delivery that increases efficiency by reducing time-to-market and development costs, and increasing quality. People working in Agile are more collaborative, engaged, empowered and creative. iv. In Digital Consumer Bank: a) To create the BNPL platform connected to at least one merchant in Netherlands and Germany, and to make sure the platform is ready to connect in Spain. b) To support the definition of Openbank US’s IT digital strategy and achieve 2022 milestones in it. c) To have the new leasing platform connected to dealers in Italy. d) To expand the Wabi B2B online business to Germany. To execute the first B2B deal with an Original Equipment Manufacturer or mobility player in at least one country. To expand coches.com business and platform to Portugal. And in regard to the second block of digital incentive: the consolidation of PagoNxt Core Perimeter. | The first block of thee Digital Incentive is structured Any delivery of shares, either directly or via exercise of options overs shares, will be subject generally to the Group’s general malus & clawback provisions as described in the Group’s remuneration policy and to the continuity of the beneficiary within the Grupo Santander. In this regard, the board may define specific rules for non-Identified Staff. Vested share options can be exercised until maturity, with all options lapsing after The total achievement for 2022 Digital Incentive was The second block of Digital Incentive is structures in restricted stock units (RSUs) and premium priced Options (PPOs) of PagoNxt S.L. in a percentage determined by the internal category of the beneficiary. The total achievement for 2022 was | ||||||||
| (iv) Digital Transformation Award (2023) | The board of directors approved the 2022 Digital Transformation Incentive. It is a variable remuneration scheme which delivers PagoNxt, S.L. RSUs and premium prices options (PPOs), and is aimed at up to employees (and limited to With this program, the Group offers a remuneration element which is competitive with the remuneration systems offered by other market operators who also compete for digital talent. | And the performance conditions were focus on key digital projects related with PagoNxt's main businesses (Trade, Merchant and Payments) in its core geographies. | This incentive is structures in restricted stock units (RSUs) and premium priced Options (PPOs) of PagoNxt S.L. in a percentage determined by the internal category of the beneficiary. The average achievement for 2023 was | ||||||||
695
ii. Santander UK plc
The long-term incentive plans on shares of the Bank granted by management of Santander UK plc to its employees are as follows:
| Number of shares (in thousand) | Exercise price in pounds sterlingA | Year granted | Employee group | Number of personsB | Date of commencement of exercise period | Date of expiry of exercise period | |||||||||||||||||
| Plans outstanding at 01/01/2021 | |||||||||||||||||||||||
| Options granted (sharesave) | 2021 | Employees | 01/11/21 | 01/11/24 | |||||||||||||||||||
| 01/11/21 | 01/11/26 | ||||||||||||||||||||||
| Options exercised | ( | ||||||||||||||||||||||
| Options cancelled (net) or not exercised | ( | ||||||||||||||||||||||
| Plans outstanding at 31/12/2021 | |||||||||||||||||||||||
| Options granted (sharesave) | 2022 | Employees | 01/11/22 | 01/11/25 | |||||||||||||||||||
| 01/11/22 | 01/11/27 | ||||||||||||||||||||||
| Options exercised | ( | ||||||||||||||||||||||
| Options cancelled (net) or not exercised | ( | ||||||||||||||||||||||
| Plans outstanding at 31/12/2022 | |||||||||||||||||||||||
| Options granted (sharesave) | 2023 | Employees | 01/11/23 | 01/11/26 | |||||||||||||||||||
| 01/11/23 | 01/11/28 | ||||||||||||||||||||||
| Options exercised | ( | ||||||||||||||||||||||
| Options cancelled (net) or not exercised | ( | ||||||||||||||||||||||
| Plans outstanding at 31/12/2023 | |||||||||||||||||||||||
A.At 31 December, 2023, 2022 and 2021, the euro/pound sterling exchange rate was 1.1525 , 1.1277 and 1.1904 , respectively.
B.Number of accounts/contracts. A single employee may have more than one account/contract.
In 2008 the Group launched a voluntary savings scheme for Santander UK employees (Sharesave Scheme) whereby employees who join the scheme see deducted between GBP 5 and GBP 500 from their net monthly pay over a period of or five years . At the end of the chosen period, the employee may choose between collecting the amount contributed, the interest accrued and a bonus (tax-exempt in the United Kingdom) or exercising options on shares of the Bank in an amount equal to the sum of such three amounts at a fixed price. The exercise price will be the result of reducing by up to 20 % the average purchase and sale prices of the Bank shares in the three trading sessions prior to the approval of the scheme by the UK tax authorities (HMRC). This approval must be received within 21 to 41 days following the publication of the Group’s results for the first half of the year. This scheme was approved by the Board of Directors, at the proposal of the appointments and remuneration committee, and, since it involved the delivery of Bank shares, its application was authorized by the Annual General Meeting held on June 21, 2008. Also, the scheme was authorized by the UK tax authorities (HMRC) and commenced in September 2008. In subsequent years, at the Annual General Meetings held on June 19, 2009, June 11, 2010, June 17, 2011, March 30, 2012, March 22, 2013, March 28, 2014, March 27, 2015, March 18, 2016, April 7, 2017, March 23, 2018, April 12, 2019, April 3, 2020 and March 26, 2021, respectively, the shareholders approved the application of schemes previously approved by the board and with similar features to the scheme approved in 2008.
iii. Fair value
The fair value of the performance share plans was calculated as follows:
a) Deferred variable compensation plan linked to multi-year objectives 2021, 2022 and 2023:
The Group calculates at the grant date the fair value of the plan based on the valuation report of an independent expert, Willis Towers Watson. According to the design of the plan for 2021, 2022 and 2023 and the levels of achievement of similar plans in comparable entities, it has been considered that the fair value is 70 %.
b) Santander UK sharesave plans:
The fair value of each option at the date of grant is estimated using an analytical model that also reflects the correlation between EUR and GBP. This model uses assumptions on the share price, the EUR/GBP FX rate, the EUR/GBP risk-free interest rate, dividend yields, the expected volatilities of both the underlying shares and EUR/GBP for the expected lives of options granted. The weighted average grant-date fair value of options granted during the year was GBP 0.33 (GBP 0.23 and GBP 0.20 reported in 2022 and 2021, respectively).
696
47. Other general administrative expenses
a) Breakdown
The detail of Other general administrative expenses is as follows:
| EUR million | |||||||||||
| 2023 | 2022 | 2021 | |||||||||
| Technology and systems | |||||||||||
| Property, fixtures and supplies (note 2.k) | |||||||||||
| Technical reports | |||||||||||
| Advertising | |||||||||||
| Taxes other than income tax | |||||||||||
| Communications | |||||||||||
| Surveillance and cash courier services | |||||||||||
| Per diems and travel expenses | |||||||||||
| Insurance premiums | |||||||||||
| Other administrative expenses | |||||||||||
The payments associated with short-term leases (leases less than or equal to 12 months) and leases of low-value assets, that the Group recognises as an expense in the income statement is not material.
b) Technical reports and other
Technical reports includes the fees from the various Group companies (detailed in the accompanying appendices) for the services provided by their respective auditors, the detail being as follows:
| EUR million | |||||||||||
| 2023 | 2022 | 2021 | |||||||||
| Audit | |||||||||||
| Audit-related services | |||||||||||
| Tax services | |||||||||||
| All other | |||||||||||
| Total | |||||||||||
The audit services and main non-audit services included for each item in the above breakdown are detailed as follows:
•Audit services: audit of the individual and consolidated financial statements of Banco Santander and its subsidiaries (of which PwC or another firm in its network is the statutory auditor); audit of the interim consolidated financial statements of Banco Santander; audit of the integrated audits prepared in order to file Form 20-F for the annual report with the SEC in the US and the internal control audit (SOx) for required Grupo Santander's entities; the limited review of the financial statements; and the regulatory auditor’s reports on Grupo Santander’s entities.
•Audit-related services: comfort letters; verification of the financial and non-financial information (as required by regulators); and other reviews of documents that, due to their nature, the external auditor provides for submission to domestic or foreign authorities.
•Tax services: tax compliance and advisory services provided to Group companies outside Spain, which have no direct effect on the audited financial statements and are permitted in accordance with independence regulations.
•Other services: agreed-upon procedure reports, assurance reports and special reports performed under the accepted profession's standards; as well as other reports required by the regulator.
The 'Audit' heading includes the fees for the year's audit, regardless of the date the audit was completed. Any subsequent adjustments, which are not significant, and for purposes of comparison, are shown in this note for each year. The fees corresponding to the rest of the services are shown by reference to when the audit committee approved them.
The services commissioned from the Group's auditors meet the independence requirements under applicable European and Spanish law, the SEC rules and the Public Company Accounting Oversight Board (PCAOB), applicable to the Group, and they did not involve in any case the performance of any work that is incompatible with the auditor's role.
Lastly, the Group commissioned services from audit firms other than PwC amounting to EUR 174.1 million in 2023 (EUR 185.5 million and EUR 263.8 million in 2022 and 2021, respectively).
c) Number of branches
The number of offices at 31 December 2023, 2022 and 2021 is as follows:
| Number of branches | |||||||||||
| Group | |||||||||||
| 2023 | 2022 | 2021 | |||||||||
| Spain | |||||||||||
| Group | |||||||||||
697
48. Gains or losses on non financial assets, net
The detail of Gains/ (losses) on disposal of assets not classified as non-current assets held for sale is as follows:
| EUR million | |||||||||||
| 2023 | 2022 | 2021 | |||||||||
| Gains | |||||||||||
| Tangible and intangible assets | |||||||||||
| Investments | |||||||||||
| Losses | |||||||||||
| Tangible and intangible assets | ( | ( | ( | ||||||||
| Investments | |||||||||||
| ( | ( | ( | |||||||||
49. Gains or losses on non-current assets held for sale not classified as discontinued operations
The detail of Gains/(losses) on non-current assets held for sale not classified as discontinued operations is as follows:
| EUR million | |||||||||||
| Net balance | 2023 | 2022 | 2021 | ||||||||
| Tangible assets | ( | ( | |||||||||
| Impairment (note 12) | ( | ( | ( | ||||||||
| Gain (loss) on sale (note 12) | |||||||||||
| Other gains and other losses | |||||||||||
| ( | ( | ||||||||||
698
50. Fair value of financial instruments
a) Detail
The following table summarises the fair values, at the end of each of the years indicated, of the financial assets and liabilities listed below, classified according to the different valuation methodologies used by the Group to determine their fair value:
| EUR million | |||||||||||||||||||||||||||||
| 2023 | 2022 | 2021 | |||||||||||||||||||||||||||
| Published price quotations in active markets (level 1) | Internal Models (level 2 and 3) | Total | Published price quotations in active markets (level 1) | Internal Models (level 2 and 3) | Total | Published price quotations in active markets (level 1) | Internal Models (level 2 and 3) | Total | |||||||||||||||||||||
| Financial assets held for trading | |||||||||||||||||||||||||||||
| Non-trading financial assets mandatorily at fair value through profit or loss | |||||||||||||||||||||||||||||
| Financial assets designated at fair value through profit or loss | |||||||||||||||||||||||||||||
| Financial assets at fair value through other comprehensive income | |||||||||||||||||||||||||||||
| Hedging derivatives (assets) | — | — | — | ||||||||||||||||||||||||||
| Financial liabilities held for trading | |||||||||||||||||||||||||||||
Financial liabilities designated at fair value through profit or lossA | |||||||||||||||||||||||||||||
| Hedging derivatives (liabilities) | — | — | — | ||||||||||||||||||||||||||
Liabilities under insurance contractsA | — | — | — | ||||||||||||||||||||||||||
Grupo Santander has developed a formal process for the systematic valuation and management of financial instruments, which has been implemented worldwide across all the Group’s units. The governance scheme for this process distributes responsibilities between two independent divisions: Treasury (development, marketing and daily management of financial products and market data) and Risk (on a periodic basis, validation of pricing models and market data, computation of risk metrics, new transaction approval policies, management of market risk and implementation of fair value adjustment policies).
The approval of new products follows a sequence of steps (request, development, validation, integration in corporate systems and quality assurance) before the product is brought into production. This process ensures that pricing systems have been properly reviewed and are stable before they are used.
The following subsections set forth the most important products and families of derivatives, and the related valuation techniques and inputs, by asset class:
Fixed income and inflation
The fixed income asset class includes basic instruments such as interest rate forwards, interest rate swaps and cross currency swaps, which are valued using the net present value of the estimated future cash flows discounted taking into account basis (swap and cross currency spreads) determined on the basis of the payment frequency and currency of each leg of the derivative. Vanilla options, including caps, floors and swaptions, are priced using the Black-Scholes model, which is one of the benchmark industry models. More exotic derivatives are priced using more complex models which are generally accepted as standard across institutions.
These pricing models are fed with observable market data such as deposit interest rates, futures rates, cross currency swap and constant maturity swap rates, and basis spreads, on the basis of which different yield curves, depending on the payment frequency, and discounting curves are calculated for each currency. In the case of options, implied volatilities are also used as model inputs. These volatilities are observable in the market for cap and floor options and swaptions, and interpolation and extrapolation of volatilities from the quoted ranges are carried out using generally accepted industry models. The pricing of more exotic derivatives may require the use of non-observable data or parameters, such as correlation (among interest rates and cross-asset), mean reversion rates and prepayment rates, which are usually defined from historical data or through calibration.
699
Inflation-related assets include zero-coupon or year-on-year inflation-linked bonds and swaps, valued with the present value method using forward estimation and discounting. Derivatives on inflation indices are priced using standard or more complex bespoke models, as appropriate. Valuation inputs of these models consider inflation-linked swap spreads observable in the market and estimations of inflation seasonality, on the basis of which a forward inflation curve is calculated. Also, implied volatilities taken from zero-coupon and year-on-year inflation options are also inputs for the pricing of more complex derivatives.
Equity and foreign exchange
The most important products in these asset classes are forward and futures contracts; they also include vanilla, listed and OTC (Over-The-Counter) derivatives on single underlying assets and baskets of assets. Vanilla options are priced using the standard Black-Scholes model and more exotic derivatives involving forward returns, average performance, or digital, barrier or callable features are priced using generally accepted industry models or bespoke models, as appropriate. For derivatives on illiquid stocks, hedging takes into account the liquidity constraints in models.
The inputs of equity models consider yield curves, spot prices, dividends, asset funding costs (repo margin spreads), implied volatilities, correlation among equity stocks and indices, and cross-asset correlation. Implied volatilities are obtained from market quotes of European and American-style vanilla call and put options. Various interpolation and extrapolation techniques are used to obtain continuous volatility for illiquid stocks. Dividends are usually estimated for the mid and long term. Correlations are implied, when possible, from market quotes of correlation-dependent products. In all other cases, proxies are used for correlations between benchmark underlyings or correlations are obtained from historical data.
The inputs of foreign exchange models include the yield curve for each currency, the spot foreign exchange rate, the implied volatilities and the correlation among assets of this class. Volatilities are obtained from European call and put options which are quoted in markets as of-the-money, risk reversal or butterfly options. Illiquid currency pairs are usually handled by using the data of the liquid pairs from which the illiquid currency can be derived. For more exotic products, unobservable model parameters may be estimated by fitting to reference prices provided by other non-quoted market sources.
Credit
The most common instrument in this asset class is the credit default swap (CDS), which is used to hedge credit exposure to third parties. In addition, models for first-to-default (FTD), n-to-default (NTD) and single-tranche collateralised debt obligation (CDO) products are also available. These products are valued with standard industry models, which estimate the probability of default of a single issuer (for CDS) or the joint probability of default of more than one issuer for FTD, NTD and CDO.
Valuation inputs are the yield curve, the CDS spread curve and the recovery rate. For indices and important individual issuers, the CDS spread curve is obtained in the market. For less liquid issuers, this spread curve is estimated using proxies or other credit-dependent instruments. Recovery rates are usually set to standard values. For listed single-tranche CDO, the correlation of joint default of several issuers is implied from the market. For FTD, NTD and bespoke CDO, the correlation is estimated from proxies or historical data when no other option is available.
Valuation adjustment for counterparty risk or default risk
The Credit valuation adjustment (CVA) is a valuation adjustment to over the counter (OTC) derivatives as a result of the risk associated with the credit exposure assumed to each counterparty.
The CVA is calculated taking into account potential exposure to each counterparty in each future period. The CVA for a specific counterparty is equal to the sum of the CVA for all the periods. The following inputs are used to calculate the CVA:
•Expected exposure: including for each transaction the mark-to-market (MtM) value plus an add-on for the potential future exposure for each period. Mitigating factors such as collateral and netting agreements are taken into account, as well as a temporary impairment factor for derivatives with interim payments.
•Severity: percentage of final loss assumed in a counterparty credit event/default.
•Probability of default: for cases where there is no market information (the CDS quoted spread curve, etc.), proxies based on companies holding exchange-listed CDS, in the same industry and with the same external rating as the counterparty, are used.
•Discount factor curve.
The Debit Valuation Adjustment (DVA) is a valuation adjustment similar to the CVA but, in this case, it arises as a result of the Group’s own risk assumed by its counterparties in OTC derivatives.
The CVA at 31 December 2023 amounted to EUR 293 million (resulting in a decrease of 16.5 % compared to 31 December 2022) and DVA amounted to EUR 330 million (resulting in a decrease of 9.3 % compared to 31 December 2022). These decreases are mainly due to movements in credit markets whose spread levels have reduced moderately compared to those of December 2022, partially offset by the upward movement in interest rates.
The CVA at 31 December 2022 amounted to EUR 351 million (resulting in an increase of 48 % compared to 31 December 2021) and DVA amounted to EUR 364 million (resulting in an increase of 125 % compared to 31 December 2021). The increase is mainly due to movements in credit markets whose spread levels have increased substantially compared to those at the end of 2021.
700
The CVA at 31 December 2021 amounted to EUR 237 million (decrease of 41.9 % compared to 31 December 2020) and DVA amounted EUR 162 million (decrease of 30.4 % compared to 31 December 2020). These impacts were mainly due to the continuous improvement in credit markets, the creation of particular credit curves for certain counterparties and the introduction of methodological improvements in the calculation of exposures.
In addition, the Group amounts the funding fair value adjustment (FFVA) is calculated by applying future market funding spreads to the expected future funding exposure of any uncollateralised component of the OTC derivative portfolio. This includes the uncollateralised component of collateralised derivatives in addition to derivatives that are fully uncollateralised. The expected future funding exposure is calculated by a simulation methodology, where available. The FFVA impact is not material for the consolidated annual accounts as of 31 December 2023, 2022 and 2021.
During fiscal year 2023 there have been relevant reclassifications of instruments as Level 3, especially during the last quarter of the year. These changes have been motivated by the implementation of improvements in the classification criteria of financial instruments within the levels of the fair value hierarchy, to comply with regulatory expectations. Thus, the use of expert judgment to determine the observability of valuation inputs has been significantly reduced and objective criteria have been established based on access to price contributors and real market transactions. On the other hand, it has been strengthened the measurement of the significance of unobservable valuation inputs considering all the inputs that impact the valuation, including both market factors and others associated with credit risk.
As a consequence of these improvements, certain instruments have been classified as Level 3 as they are considered to use unobservable and significant inputs in their assessment. Among them, some long-term derivatives may be highlighted, others that incorporate optionality at unobservable terms or operations that include adjustments for credit risk in their valuation in which some of their components turn out to be unobservable and material. Likewise, some debt instruments that are not considered observable have been reclassified based on the new and stricter criteria currently used.
The effects on the consolidated financial statements resulting from the implementation of this new framework have been recognized prospectively in accordance with the provisions of IAS 8.
The rest of the changes in the instruments classified as Level 3 in the year have been due to movements in the volume of the positions of these instruments in the portfolio due to purchases/sales, with no significant variations having been detected in the market observability conditions of their inputs. of valuation.
Valuation adjustments due to model risk
The valuation models described above do not involve a significant level of subjectivity, since they can be adjusted and recalibrated, where appropriate, through internal calculation of the fair value and subsequent comparison with the related actively traded price. However, valuation adjustments may be necessary when market quoted prices are not available for comparison purposes.
The sources of risk are associated with uncertain model parameters, illiquid underlying issuers, and poor quality market data or missing risk factors (sometimes the best available option is to use limited models with controllable risk). In these situations, the Group calculates and applies valuation adjustments in accordance with common industry practice. The main sources of model risk are described below:
•In the fixed income markets, the sources of model risk include bond index correlations, basis spread modelling, the risk of calibrating model parameters and the treatment of near-zero or negative interest rates. Other sources of risk arise from the estimation of market data, such as volatilities or yield curves, whether used for estimation or cash flow discounting purposes.
•In the stock markets, the sources of model risk include forward skew modelling, the impact of stochastic interest rates, correlation and multi-curve modelling. Other sources of risk arise from managing hedges of digital callable and barrier option payments. Also worthy of consideration as sources of risk are the estimation of market data such as dividends and correlation for quanto and composite basket options.
•For specific financial instruments relating to home mortgage loans secured by financial institutions in the UK (which are regulated and partially financed by the Government) and property asset derivatives, the main input is the Halifax House Price Index (HPI). In these cases, risk assumptions include estimations of the future growth and the volatility of the HPI, the mortality rate and the implied credit spreads.
•Inflation markets are exposed to model risk resulting from uncertainty around modelling the correlation structure among various Consumer Price Index (CPI) rates. Another source of risk may arise from the bid-offer spread of inflation-linked swaps.
•The currency markets are exposed to model risk resulting from forward skew modelling and the impact of stochastic interest rate and correlation modelling for multi-asset instruments. Risk may also arise from market data, due to the existence of specific illiquid foreign exchange pairs.
•The most important source of model risk for credit derivatives relates to the estimation of the correlation between the probabilities of default of different underlying issuers. For illiquid underlying issuers, the CDS spread may not be well defined.
701
Set forth below are the financial instruments at fair value whose measurement was based on internal models (levels 2 and 3) at 31 December 2023, 2022 and 2021:
| EUR million | |||||||||||||||||
| Fair values calculated using internal models at | |||||||||||||||||
2023A | |||||||||||||||||
| Level 2 | Level 3 | Valuation techniques | Main assumptions | ||||||||||||||
| ASSETS | |||||||||||||||||
| Financial assets held for trading | |||||||||||||||||
Central banksB | Present value method | Yield curves, FX market prices | |||||||||||||||
Credit institutionsB | Present value method | Yield curves, FX market prices | |||||||||||||||
CustomersB | Present value method | Yield curves, FX market prices | |||||||||||||||
| Debt and equity instruments | Present value method | Yield curves, FX market prices | |||||||||||||||
| Derivatives | |||||||||||||||||
| Swaps | Present value method, Gaussian CopulaC | Yield curves, FX market prices, HPI, Basis, Liquidity | |||||||||||||||
| Exchange rate options | Black-Scholes Model | Yield curves, Volatility surfaces, FX market prices, Liquidity | |||||||||||||||
| Interest rate options | Black's Model, multifactorial advanced models interest rate | Yield curves, Volatility surfaces, FX market prices, Liquidity | |||||||||||||||
| Interest rate futures | Present value method | Yield curves, FX market prices | |||||||||||||||
| Index and securities options | Black's Model, multifactorial advanced models interest rate | Yield curves, Volatility surfaces, FX & EQ market prices, Dividends, Liquidity | |||||||||||||||
| Other | Present value method, Advanced stochastic volatility models and other | Yield curves, Volatility surfaces, FX and EQ market prices, Dividends, Correlation, HPI, Credit, Others | |||||||||||||||
| Hedging derivatives | |||||||||||||||||
| Swaps | Present value method | Yield curves, FX market prices, Basis | |||||||||||||||
| Interest rate options | Black's Model | Yield curves, FX market prices, Volatility surfaces | |||||||||||||||
| Other | Present value method, Advanced stochastic volatility models and other | Yield curves, Volatility surfaces, FX market prices, Credit, Liquidity, Others | |||||||||||||||
| Non-trading financial assets mandatorily at fair value through profit or loss | |||||||||||||||||
| Equity instruments | Present value method | Market price, Interest rates curves, Dividends and Others | |||||||||||||||
| Debt securities | Present value method | Yield curves | |||||||||||||||
| Loans and receivables | Present value method, swap asset model & CDS | Yield curves and Credit curves | |||||||||||||||
| Financial assets designated at fair value through profit or loss | |||||||||||||||||
| Credit institutions | Present value method | Yield curves, FX market prices | |||||||||||||||
CustomersC | Present value method | Yield curves, FX market prices, HPI | |||||||||||||||
| Debt securities | Present value method | Yield curves, FX market prices | |||||||||||||||
| Financial assets at fair value through other comprehensive income | |||||||||||||||||
| Equity instruments | Present value method | Market price, Yield curves, Dividends and Others | |||||||||||||||
| Debt securities | Present value method | Yield curves, FX market prices | |||||||||||||||
| Loans and receivables | Present value method | Yield curves, FX market prices and Credit curves | |||||||||||||||
702
| EUR million | |||||||||||||||||
| Fair values calculated using internal models at | |||||||||||||||||
2023A | |||||||||||||||||
| Level 2 | Level 3 | Valuation techniques | Main assumptions | ||||||||||||||
| LIABILITIES | |||||||||||||||||
| Financial liabilities held for trading | |||||||||||||||||
Central banksB | Present value method | FX market prices, Yield curves | |||||||||||||||
Credit institutionsB | Present value method | FX market prices, Yield curves | |||||||||||||||
| Customers | Present value method | FX market prices, Yield curves | |||||||||||||||
| Derivatives | |||||||||||||||||
| Swaps | Present value method, Gaussian CopulaC | Yield curves, FX market prices, Basis, Liquidity, HPI | |||||||||||||||
| Interest rate options | Black's Model, multifactorial advanced models interest rate | Yield curves, Volatility surfaces, FX market prices, Liquidity | |||||||||||||||
| Exchange rate options | Black-Scholes Model | Yield curves, Volatility surfaces, FX market prices, Liquidity | |||||||||||||||
| Index and securities options | Black-Scholes model | Yield curves, FX market prices | |||||||||||||||
| Futures on interest rate and variable income | Present value method | Yield curves, Volatility surfaces, FX & EQ market prices, Dividends, Correlation, Liquidity, HPI | |||||||||||||||
| Other | Present value method, Advanced stochastic volatility models | Yield curves, Volatility surfaces, FX & EQ market prices, Dividends, Correlation, Liquidity, HPI, Credit, Others | |||||||||||||||
| Short positions | Present value method | Yield curves ,FX & EQ market prices, Equity | |||||||||||||||
| Hedging derivatives | |||||||||||||||||
| Swaps | Present value method | Yield curves ,FX & EQ market prices, Basis | |||||||||||||||
| Interest rate options | Black's Model | Yield curves , Volatility surfaces, FX market prices and Liquidity | |||||||||||||||
| Other | Present value method, Advanced stochastic volatility models and other | Yield curves , Volatility surfaces, FX market prices, Credit, Liquidity, Other | |||||||||||||||
| Financial liabilities designated at fair value through profit or loss | Present value method | Yield curves, FX market prices | |||||||||||||||
Liabilities under insurance contractsD | Present Value Method with actuarial techniques | Mortality tables and interest rate curves | |||||||||||||||
A.Level 2 internal models use data based on observable market parameters, while level 3 internal models use significant non-observable inputs in market data.
B.Includes mainly short-term loans/deposits and repurchase/reverse repurchase agreements with corporate customers (mainly brokerage and investment companies).
C.Includes, mainly, structured loans to corporate clients.
D.See impact of IFRS 17 at 31 December 2022 and 2021 (see Note 1.d)
703
| EUR million | |||||||||||||||||||||||
| Fair values calculated using internal models at | Fair values calculated using internal models at | ||||||||||||||||||||||
2022A | 2021A | ||||||||||||||||||||||
| Level 2 | Level 3 | Level 2 | Level 3 | Valuation techniques | |||||||||||||||||||
| ASSETS | |||||||||||||||||||||||
| Financial assets held for trading | |||||||||||||||||||||||
Central banksB | Present value method | ||||||||||||||||||||||
Credit institutionsB | Present Value method | ||||||||||||||||||||||
CustomersB | Present Value method | ||||||||||||||||||||||
| Debt and equity instruments | Present Value method | ||||||||||||||||||||||
| Derivatives | |||||||||||||||||||||||
| Swaps | Present Value method, Gaussian Copula | ||||||||||||||||||||||
| Exchange rate options | Black-Scholes Model | ||||||||||||||||||||||
| Interest rate options | Black's Model, advanced multifactor interest rate models | ||||||||||||||||||||||
| Interest rate futures | Present Value method | ||||||||||||||||||||||
| Index and securities options | Black's Model, advanced multifactor interest rate models | ||||||||||||||||||||||
| Other | Present Value method, Advanced stochastic volatility models and other | ||||||||||||||||||||||
| Hedging derivatives | |||||||||||||||||||||||
| Swaps | Present Value method | ||||||||||||||||||||||
| Interest rate options | Black’s Model | ||||||||||||||||||||||
| Other | Present Value method, Advanced stochastic volatility models and other | ||||||||||||||||||||||
| Non-trading financial assets mandatorily at fair value through profit or loss | |||||||||||||||||||||||
| Equity instruments | Present Value method | ||||||||||||||||||||||
| Debt securities issued | Present Value method | ||||||||||||||||||||||
| Loans and receivables | Present Value method, swap asset model & CDS | ||||||||||||||||||||||
| Financial assets designated at fair value through profit or loss | |||||||||||||||||||||||
| Credit institutions | Present Value method | ||||||||||||||||||||||
CustomersC | Present Value method | ||||||||||||||||||||||
| Debt securities | Present Value method | ||||||||||||||||||||||
| Financial assets at fair value through other comprehensive income | |||||||||||||||||||||||
| Equity instruments | Present Value method | ||||||||||||||||||||||
| Debt securities | Present Value method | ||||||||||||||||||||||
| Loans and receivables | Present Value method | ||||||||||||||||||||||
704
| EUR million | |||||||||||||||||||||||
| Fair values calculated using internal models at | Fair values calculated using internal models at | ||||||||||||||||||||||
2022A | 2021A | ||||||||||||||||||||||
| Level 2 | Level 3 | Level 2 | Level 3 | Valuation techniques | |||||||||||||||||||
| LIABILITIES | |||||||||||||||||||||||
| Financial liabilities held for trading | |||||||||||||||||||||||
Central banksB | Present Value method | ||||||||||||||||||||||
Credit institutionsB | Present Value method | ||||||||||||||||||||||
| Customers | Present Value method | ||||||||||||||||||||||
| Derivatives | |||||||||||||||||||||||
| Swaps | Present Value method, Gaussian Copula | ||||||||||||||||||||||
| Interest rate options | Black's Model, advanced multifactor interest rate models | ||||||||||||||||||||||
| Exchange rate options | Black-Scholes Model | ||||||||||||||||||||||
| Index and securities options | Black's Model, advanced multifactor interest rate models | ||||||||||||||||||||||
| Interest rate and equity futures | Present Value method | ||||||||||||||||||||||
| Other | Present Value method, Advanced stochastic volatility models and other | ||||||||||||||||||||||
| Short positions | Present Value method | ||||||||||||||||||||||
| Hedging derivatives | |||||||||||||||||||||||
| Swaps | Present Value method | ||||||||||||||||||||||
| Other | Present Value method, Advanced stochastic volatility models and other | ||||||||||||||||||||||
Financial liabilities designated at fair value through profit or lossD | Present Value method | ||||||||||||||||||||||
| Liabilities under insurance contracts | Present Value method with actuarial techniques | ||||||||||||||||||||||
A.Level 2 internal models use data based on observable market parameters, while level 3 internal models use significant non-observable inputs in market data.
B.Includes mainly short-term loans/deposits and repurchase/reverse repurchase with corporate customers (mainly brokerage and investment companies).
C.Includes, mainly, structured loans to corporate clients.
D.Includes, mainly, short-term deposits that are managed based on their fair value.
b) Financial Instruments (level 3)
Set forth below are the Group’s main financial instruments measured using unobservable market data as significant inputs of the internal models (level 3):
•HTC&S (Held to collect and sale) syndicated loans classified in the fair value category with changes in other comprehensive income, where the cost of liquidity is not directly observable in the market, as well as the prepayment option in favour of the borrower.
•Illiquid equity in non-trading portfolios, classified at fair value through profit or loss and at fair value through equity.
•Instruments in Santander UK’s portfolio (loans, debt securities and derivatives) linked to the House Price Index (HPI). Even if the valuation techniques used for these instruments may be the same as those used to value similar products (present value in the case of loans and debt securities, and the Black-Scholes model for derivatives), the main factors used in the valuation of these instruments are the HPI spot rate, the growth and volatility thereof, and the mortality rates, which are not always observable in the market and, accordingly, these instruments are considered illiquid.
•Callable interest rate derivatives (Bermudan-style options) where the main unobservable input is mean reversion of interest rates.
•Trading derivatives on interest rates, taking as an underlying asset titling and with the amortization rate (CPR, Conditional prepayment rate) as unobservable main entry.
• Derivatives from trading on inflation in Spain, where volatility is not observable in the market.
•Equity volatility derivatives, specifically indices and equities, where volatility is not observable in the long term.
•Derivatives on long-term interest rate and FX in some units (mainly South America) where for certain underlyings it is not possible to demonstrate observability to these terms.
•Debt instruments referenced to certain illiquid interest rates, for which there is no reasonable market observability.
The measurements obtained using the internal models might have been different if other methods or assumptions had been used with respect to interest rate risk, to credit risk, market risk and foreign currency risk spreads, or to their related correlations and volatilities. Nevertheless, the Bank’s directors consider that the fair value of the financial assets and liabilities recognised in the consolidated balance sheet and the gains and losses arising from these financial instruments are reasonable.
705
The net amount recognised in profit and loss in 2023 arising from models whose significant inputs are unobservable market data (level 3) amounted to EUR 404 profit (EUR 90 million loss in 2022 and EUR 73 million profit in 2021, respectively).
1.Valuation techniques
The table below shows the effect, at 31 December 2023, 2022 and 2021 on the fair value of the main financial instruments classified as level 3 of a reasonable change in the assumptions used in the valuation. This effect was determined by applying the probable valuation ranges of the main unobservable inputs detailed in the following table:
| 2023 | |||||||||||||||||||||||
| Portfolio/Instrument | Valuation technique | Main unobservable inputs | Range | Weighted average | Impacts (EUR million) | ||||||||||||||||||
| (Level 3) | Unfavourable scenario | Favourable scenario | |||||||||||||||||||||
| Financial assets held for trading | |||||||||||||||||||||||
| Loans and advances to customers | |||||||||||||||||||||||
| Repos/Reverse repos | Other | Long-term repo spread | n.a. | n.a. | ( | ||||||||||||||||||
| Debt securities | |||||||||||||||||||||||
| Corporate debt | Discounted Cash Flows | Credit spread | % | ( | |||||||||||||||||||
| Government debt | Discounted Cash Flows | Discount curve | % | ( | |||||||||||||||||||
| Derivatives | |||||||||||||||||||||||
| CCS | Forward estimation | Interest rate | ( | bps | ( | ||||||||||||||||||
| CDS | Credit default models | Illiquid credit default spread curves | bps | ( | |||||||||||||||||||
| EQ Options | EQ option pricing model | Volatility | % | ( | |||||||||||||||||||
| EQ Options | Local volatility | Volatility | % | ( | |||||||||||||||||||
| FX Options | FX option pricing model | Volatility | % | ( | |||||||||||||||||||
| Inflation Derivatives | Asset Swap model | Inflation Swap Rate | % | ( | |||||||||||||||||||
| IR Options | IR option pricing model | Volatility | % | ( | |||||||||||||||||||
| IRS | Others | Others | n.a. | ( | |||||||||||||||||||
| IRS | Discounted Cash Flows | Credit spread | % | ( | |||||||||||||||||||
| IRS | Discounted Cash Flows | Swap rate | % | ( | |||||||||||||||||||
| IRS | Forward estimation | Interest rate | ( | bps | ( | ||||||||||||||||||
| IRS | Prepayment modelling | Prepayment rate | % | ||||||||||||||||||||
| Property derivatives | Option pricing model | Growth rate | ( | % | ( | ||||||||||||||||||
| Securitisation Swap | Discounted Cash Flows | Constant prepayment rates | ( | % | ( | ||||||||||||||||||
| Structured notes | Price based | Price | ( | % | ( | ||||||||||||||||||
| Financial assets designated at fair value through profit or loss | |||||||||||||||||||||||
| Loans and advances to customers | |||||||||||||||||||||||
| Loans | Discounted Cash Flows | Credit spreads | % | ( | |||||||||||||||||||
| Mortgage portfolio | Black Scholes model | Growth rate | ( | % | ( | ||||||||||||||||||
| Debt securities | |||||||||||||||||||||||
| Other debt securities | Others | Inflation Swap Rate | % | ( | |||||||||||||||||||
706
| 2023 | ||||||||||||||||||||
| Portfolio/Instrument | Valuation technique | Main unobservable inputs | Range | Weighted average | Impacts (EUR million) | |||||||||||||||
| (Level 3) | Unfavourable scenario | Favourable scenario | ||||||||||||||||||
| Non-trading financial assets mandatorily at fair value through profit or loss | ||||||||||||||||||||
| Debt securities | ||||||||||||||||||||
| Property securities | Probability weighting | Growth rate | ( | % | ( | |||||||||||||||
| Equity instruments | ||||||||||||||||||||
| Equities | Price Based | Price | % | ( | ||||||||||||||||
| Financial assets at fair value through other comprehensive income | ||||||||||||||||||||
| Loans and advances to customers | ||||||||||||||||||||
| Loans | Discounted Cash Flows | Credit spread | n.a. | n.a. | ( | |||||||||||||||
| Loans | Discounted Cash Flows | Interest rate curve | % | ( | ||||||||||||||||
| Loans | Discounted Cash Flows | Margin of a reference portfolio | ( | ( | ||||||||||||||||
| Loans | Forward estimation | Credit spread | bps | ( | ||||||||||||||||
| Loans | Market price | Market price | ( | % | ( | |||||||||||||||
| Debt securities | ||||||||||||||||||||
| Corporate debt | Discounted Cash Flows | Margin of a reference portfolio | ( | % | ( | |||||||||||||||
| Government debt | Discounted Cash Flows | Interest rate | % | |||||||||||||||||
| Equity instruments | ||||||||||||||||||||
| Equities | Price Based | Price | % | ( | ||||||||||||||||
| Financial liabilities held for trading | ||||||||||||||||||||
| Derivatives | ||||||||||||||||||||
| Cap&Floor | Volatility option model | Volatility | % | ( | ||||||||||||||||
| CMS | Discounted Cash Flows | Volatility | % | |||||||||||||||||
| FX Options | Volatility option model | Volatility | % | ( | ||||||||||||||||
| IRS | Discounted Cash Flows | Inflation Swap Rate | % | ( | ||||||||||||||||
| Swaptions | Volatility option model | Volatility | % | ( | ||||||||||||||||
A.For each instrument, the valuation technique, the unobservable inputs are shown in the "Main observable inputs" column under probable scenarios, variation range, average value and impact resulting from valuing the position in the established maximum and minimum range.
B.The breakdown of impacts is shown by type of instrument and unobservable inputs.
C.The estimation of the range of variation of the unobservable inputs has been carried out taking into account plausible movements of said parameters depending on the type of instrument.
D.Zero impacts from fully hedged or back-to-back transactions have not been included in this exercise.
707
| 2022 | ||||||||||||||||||||
| Portfolio/Instrument | Impacts (EUR million) | |||||||||||||||||||
| (Level 3) | Valuation technique | Main unobservable inputs | Range | Weighted average | Unfavourable scenario | Favourable scenario | ||||||||||||||
| Financial assets held for trading | ||||||||||||||||||||
| Debt securities | ||||||||||||||||||||
| Corporate debt | Discounted Cash Flows | Credit spread | % | ( | ||||||||||||||||
| Corporate debt | Price based | Market price | % | |||||||||||||||||
| Government debt | Discounted Cash Flows | Discount curve | % | ( | ||||||||||||||||
| Derivatives | ||||||||||||||||||||
| CCS | Discounted Cash Flows | Interest rate | ( | % | ||||||||||||||||
| CCS | Forward estimation | Interest rate | ( | ( | ||||||||||||||||
| CDS | Discounted Cash flows | Credit Spread | ( | |||||||||||||||||
| EQ Options | EQ option pricing model | Volatility | % | ( | ||||||||||||||||
| EQ Options | Local volatility | Volatility | % | ( | ||||||||||||||||
| FRAs | Asset Swap model | Interest rate | % | ( | ||||||||||||||||
| Fx Swap | Others | Others | n.a. | n.a | ( | |||||||||||||||
| Inflation Derivatives | Asset Swap model | Inflation Swap Rate | % | ( | ||||||||||||||||
| Inflation Derivatives | Volatility option model | Volatility | % | ( | ||||||||||||||||
| IR Options | IR option pricing model | Volatility | % | ( | ||||||||||||||||
| IRS | Asset Swap model | Interest rate | % | ( | ||||||||||||||||
| IRS | Discounted Cash Flows | Credit spread | % | ( | ||||||||||||||||
| IRS | Discounted Cash Flows | Swap rate | % | ( | ||||||||||||||||
| IRS | Forward estimation | Interest rate | ( | ( | ||||||||||||||||
| IRS | Others | Others | n.a | ( | ||||||||||||||||
| IRS | Prepayment modelling | Prepayment rate | % | ( | ||||||||||||||||
| Others | Forward estimation | Price | % | ( | ||||||||||||||||
| Property derivatives | Option pricing model | Growth rate | ( | % | ( | |||||||||||||||
| Financial assets designated at fair value through profit or loss | ||||||||||||||||||||
| Loans and advances to customers | ||||||||||||||||||||
| Loans | Discounted Cash Flows | Credit spreads | % | ( | ||||||||||||||||
| Mortgage portfolio | Black Scholes model | Growth rate | ( | % | ( | |||||||||||||||
| Debt securities | ||||||||||||||||||||
| Other debt securities | Others | Inflation Swap Rate | % | ( | ||||||||||||||||
| Non-trading financial assets mandatorily at fair value through profit or loss | ||||||||||||||||||||
| Debt securities | ||||||||||||||||||||
| Corporate debt | Discounted Cash Flows | Margin of a reference portfolio | ( | ( | ||||||||||||||||
| Property securities | Probability weighting | Growth rate | ( | % | ( | |||||||||||||||
| Equity instruments | ||||||||||||||||||||
| Equities | Price Based | Price | % | ( | ||||||||||||||||
708
| Financial assets at fair value through other comprehensive income | ||||||||||||||||||||
| Loans and advances to customers | ||||||||||||||||||||
| Loans | Discounted Cash Flows | Credit spread | n.a. | n.a | ( | |||||||||||||||
| Loans | Discounted Cash Flows | Interest rate curve | % | ( | ||||||||||||||||
| Loans | Discounted Cash Flows | Margin of a reference portfolio | ( | ( | ||||||||||||||||
| Loans | Forward estimation | Credit spread | % | ( | ||||||||||||||||
| Debt securities | ||||||||||||||||||||
| Government debt | Discounted Cash Flows | Interest rate | ( | % | ( | |||||||||||||||
| Equity instruments | ||||||||||||||||||||
| Equities | Price Based | Price | % | ( | ||||||||||||||||
| Financial liabilities held for trading | ||||||||||||||||||||
| Derivatives | ||||||||||||||||||||
| Cap&Floor | Volatility option model | Volatility | % | ( | ||||||||||||||||
| Financial liabilities designated at fair value through profit or loss | ||||||||||||||||||||
| Loans and advances to customers | ||||||||||||||||||||
| Repos/Reverse repos | Others | Long-term repo spread | n.a. | n.a. | ( | |||||||||||||||
A.For each instrument, the valuation technique, the unobservable inputs are shown in the "Main observable inputs" column under probable scenarios, variation range, average value and impact resulting from valuing the position in the established maximum and minimum range.
B.The breakdown of impacts is shown by type of instrument and unobservable inputs.
C.The estimation of the range of variation of the unobservable inputs has been carried out taking into account plausible movements of said parameters depending on the type of instrument.
D.Zero impacts from fully hedged or back-to-back transactions have not been included in this exercise.
709
| 2021 | ||||||||||||||||||||
| Portfolio/Instrument | Impacts (EUR million) | |||||||||||||||||||
| (Level 3) | Valuation technique | Main unobservable inputs | Range | Weighted average | Unfavourable scenario | Favourable scenario | ||||||||||||||
| Financial assets held for trading | ||||||||||||||||||||
| Derivatives | ||||||||||||||||||||
| CCS | Discounted Cash Flows | Interest rate | ( | % | ( | |||||||||||||||
| CCS | Forward estimation | Interest rate | ( | ( | ( | |||||||||||||||
| Convertibility curve - inputs: NDFs Offshore | Forward estimation | Price | % | ( | ||||||||||||||||
| EQ Options | EQ option pricing model | Volatility | % | ( | ||||||||||||||||
| EQ Options | Local volatility | Volatility | % | ( | ||||||||||||||||
| FRAs | Asset Swap model | Interest rate | % | ( | ||||||||||||||||
| FX Options | FX option pricing model | Volatility | % | ( | ||||||||||||||||
| Inflation Derivatives | Asset Swap model | Inflation Swap Rate | ( | % | ( | |||||||||||||||
| Inflation Derivatives | Volatility option model | Volatility | % | ( | ||||||||||||||||
| IR Futures | Asset Swap model | Interest rate | % | ( | ||||||||||||||||
| IR Options | IR option pricing model | Volatility | % | ( | ||||||||||||||||
| IRS | Asset Swap model | Interest rate | ( | % | ( | |||||||||||||||
| IRS | Discounted Cash Flows | Credit spread | % | ( | ||||||||||||||||
| IRS | Discounted Cash Flows | Inflation Swap Rate | ( | % | ( | |||||||||||||||
| IRS | Discounted Cash Flows | Swap Rate | ( | %) | ( | |||||||||||||||
| IRS | Forward estimation | Interest rate | TIIE91( | n.a. | ( | |||||||||||||||
| IRS | Forward estimation | Prepayment rate | n.a. | |||||||||||||||||
| IRS | Others | Others | n.a. | ( | ||||||||||||||||
| IRS | Prepayment modelling | Prepayment rate | % | ( | ||||||||||||||||
| Property derivatives | Option pricing model | Growth rate | % | ( | ||||||||||||||||
| Swaptions | IR option pricing model | Volatility | % | ( | ||||||||||||||||
| Debt securities | ||||||||||||||||||||
| Corporate debt | Price based | Market price | % | |||||||||||||||||
| Financial assets designated at fair value through profit or loss | ||||||||||||||||||||
| Loans and advances to customers | ||||||||||||||||||||
| Loans | Discounted Cash Flows | Credit spreads | % | ( | ||||||||||||||||
| Mortgage portfolio | Black Scholes model | Growth rate | % | ( | ||||||||||||||||
| Debt securities | ||||||||||||||||||||
| Corporate debt | Discounted Cash Flows | Credit spread | % | ( | ||||||||||||||||
| Government debt | Discounted Cash Flows | Discount curve | % | ( | ||||||||||||||||
| Other debt securities | Others | Inflation Swap Rate | % | ( | ||||||||||||||||
| Non-trading financial assets mandatorily at fair value through profit or loss | ||||||||||||||||||||
| Debt securities | ||||||||||||||||||||
| Corporate debt | Discounted Cash Flows | Margin of a reference portfolio | ( | ( | ||||||||||||||||
| Property securities | Probability weighting | Growth rate | % | ( | ||||||||||||||||
| Equity instruments | ||||||||||||||||||||
| Equities | Price Based | Price | % | ( | ||||||||||||||||
710
| 2021 | ||||||||||||||||||||
| Portfolio/Instrument | Impacts (EUR million) | |||||||||||||||||||
| (Level 3) | Valuation technique | Main unobservable inputs | Range | Weighted average | Unfavourable scenario | Favourable scenario | ||||||||||||||
| Financial assets at fair value through other comprehensive income | ||||||||||||||||||||
| Loans and advances to customers | ||||||||||||||||||||
| Loans | Discounted Cash Flows | Credit spread | n.a. | n.a. | ( | |||||||||||||||
| Loans | Discounted Cash Flows | Interest rate curve | ( | % | ( | |||||||||||||||
| Loans | Discounted Cash Flows | Margin of a reference portfolio | ( | ( | ||||||||||||||||
| Loans | Forward estimation | Credit spread | n.a. | |||||||||||||||||
| Debt securities | ||||||||||||||||||||
| Government debt | Discounted Cash Flows | Interest rate | % | ( | ||||||||||||||||
| Equity instruments | ||||||||||||||||||||
| Equities | Price Based | Price | % | ( | ||||||||||||||||
| Financial liabilities held for trading | ||||||||||||||||||||
| Derivatives | ||||||||||||||||||||
| Cap&Floor | Volatility option model | Volatility | % | ( | ||||||||||||||||
| Financial liabilities designated at fair value through profit or loss | ||||||||||||||||||||
| Loans and advances to customers | ||||||||||||||||||||
| Repos/Reverse repos | Asset Swap Repo Model | Long-term repo spread | n.a | n.a. | ( | |||||||||||||||
A.For each instrument, the valuation technique, the unobservable inputs are shown in the "Main observable inputs" column under probable scenarios, variation range, average value and impact resulting from valuing the position in the established maximum and minimum range.
B.The breakdown of impacts is shown by type of instrument and unobservable inputs.
C.The estimation of the range of variation of the unobservable inputs has been carried out taking into account plausible movements of said parameters depending on the type of instrument.
D.Zero impacts from fully hedged or back-to-back transactions have not been included in this exercise.
711
2. Movement of financial instruments classified as Level 3
Lastly, the changes in the financial instruments classified as Level 3 in 2023, 2022 and 2021 were as follows:
| 01/01/2023 | Changes | 31/12/2023 | ||||||||||||||||||||||||||||||
| EUR million | Fair value calculated using internal models (Level 3) | Purchases/ Issuances | Sales/Settlements | Changes in fair value recognised in profit or loss | Changes in fair value recognised in equity | Level reclassifications | Other | Fair value calculated using internal models (level 3) | ||||||||||||||||||||||||
| Financial assets held for trading | ( | — | ||||||||||||||||||||||||||||||
| Customers | — | |||||||||||||||||||||||||||||||
| Debt securities | ( | — | ||||||||||||||||||||||||||||||
| Equity instruments | — | |||||||||||||||||||||||||||||||
| Trading derivatives | ( | — | ( | |||||||||||||||||||||||||||||
| Swaps | ( | — | ( | |||||||||||||||||||||||||||||
| Exchange rate options | — | |||||||||||||||||||||||||||||||
| Interest rate options | — | |||||||||||||||||||||||||||||||
| Index and securities options | ( | ( | — | |||||||||||||||||||||||||||||
| Other | ( | ( | — | |||||||||||||||||||||||||||||
| Financial assets at fair value through profit or loss | ( | — | ( | |||||||||||||||||||||||||||||
| Loans and advances to customers | — | |||||||||||||||||||||||||||||||
| Debt securities | ( | — | ( | |||||||||||||||||||||||||||||
| Non-trading financial assets mandatorily at fair value through profit or loss | ( | — | ( | |||||||||||||||||||||||||||||
| Customers | ( | — | ||||||||||||||||||||||||||||||
| Debt instruments | ( | ( | — | |||||||||||||||||||||||||||||
| Equity instruments | ( | — | ( | |||||||||||||||||||||||||||||
| Financial assets at fair value through other comprehensive income | ( | ( | ||||||||||||||||||||||||||||||
| Loans and advances | ( | |||||||||||||||||||||||||||||||
| Debt securities | ||||||||||||||||||||||||||||||||
| Equity instruments | ( | ( | ||||||||||||||||||||||||||||||
| TOTAL ASSETS | ( | ( | ||||||||||||||||||||||||||||||
| Financial liabilities held for trading | ( | ( | — | ( | ||||||||||||||||||||||||||||
| Trading derivatives | ( | ( | — | ( | ||||||||||||||||||||||||||||
| Swaps | ( | ( | — | ( | ||||||||||||||||||||||||||||
| Exchange rate options | — | |||||||||||||||||||||||||||||||
| Interest rate options | ( | ( | — | |||||||||||||||||||||||||||||
| Index and securities options | ( | ( | — | |||||||||||||||||||||||||||||
| Others | ( | ( | — | |||||||||||||||||||||||||||||
| Hedging derivatives (Liabilities) | ( | — | ( | |||||||||||||||||||||||||||||
| Swaps | ( | — | ( | |||||||||||||||||||||||||||||
| Financial liabilities designated at fair value through profit or loss | ( | ( | — | |||||||||||||||||||||||||||||
| Liabilities under insurance contracts | ( | |||||||||||||||||||||||||||||||
| TOTAL LIABILITIES | ( | ( | ( | |||||||||||||||||||||||||||||
712
| 01/01/2022 | Changes | 31/12/2022 | ||||||||||||||||||||||||||||||
| EUR million | Fair value calculated using internal models (level 3) | Purchases /Issuances | Sales/Settlements | Changes in fair value recognized in profit or loss | Changes in fair value recognized in equity | Level reclassifications | Other | Fair value calculated using internal models (level 3) | ||||||||||||||||||||||||
| Financial assets held for trading | ( | ( | — | ( | ( | |||||||||||||||||||||||||||
| Debt securities | ( | — | ||||||||||||||||||||||||||||||
| Equity instruments | — | ( | ||||||||||||||||||||||||||||||
| Trading derivatives | ( | ( | — | ( | ( | |||||||||||||||||||||||||||
| Swaps | ( | ( | — | ( | ||||||||||||||||||||||||||||
| Exchange rate options | ( | — | ( | |||||||||||||||||||||||||||||
| Interest rate options | ( | — | ( | |||||||||||||||||||||||||||||
| Index and securities options | ( | — | ( | |||||||||||||||||||||||||||||
| Other | ( | — | ||||||||||||||||||||||||||||||
| Financial assets at fair value through profit or loss | ( | ( | — | |||||||||||||||||||||||||||||
| Loans and advances to customers | ( | ( | — | |||||||||||||||||||||||||||||
| Debt securities | ( | — | ||||||||||||||||||||||||||||||
| Non-trading financial assets mandatorily at fair value through profit or loss | ( | — | ( | ( | ||||||||||||||||||||||||||||
| Customers | ( | ( | — | |||||||||||||||||||||||||||||
| Debt securities | ( | ( | — | ( | ( | |||||||||||||||||||||||||||
| Equity instruments | ( | — | ( | |||||||||||||||||||||||||||||
| Financial assets at fair value through other comprehensive income | ( | ( | ||||||||||||||||||||||||||||||
| Loans and advances | ( | |||||||||||||||||||||||||||||||
| Debt securities | ( | |||||||||||||||||||||||||||||||
| Equity instruments | ( | ( | ||||||||||||||||||||||||||||||
| TOTAL ASSETS | ( | ( | ( | |||||||||||||||||||||||||||||
| Financial liabilities held for trading | ( | — | ( | ( | ||||||||||||||||||||||||||||
| Trading derivatives | ( | — | ( | ( | ||||||||||||||||||||||||||||
| Swaps | ( | — | ( | |||||||||||||||||||||||||||||
| Exchange rate options | ( | — | ||||||||||||||||||||||||||||||
| Interest rate options | ( | ( | — | |||||||||||||||||||||||||||||
| Index and securities options | ( | ( | — | ( | ||||||||||||||||||||||||||||
| Others | ( | ( | — | |||||||||||||||||||||||||||||
| Hedging derivatives (Liabilities) | — | |||||||||||||||||||||||||||||||
| Swaps | — | |||||||||||||||||||||||||||||||
| Financial liabilities designated at fair value through profit or loss | ( | — | ||||||||||||||||||||||||||||||
| Liabilities under insurance contracts | ( | — | ||||||||||||||||||||||||||||||
| TOTAL LIABILITIES | ( | — | ( | |||||||||||||||||||||||||||||
713
| 01/01/2021 | Changes | 31/12/2021 | ||||||||||||||||||||||||||||||
| EUR million | Fair value calculated using internal models (level 3) | Purchases/ Issuances | Sales/Settlements | Changes in fair value recognised in profit or loss | Changes in fair value recognised in equity | Level reclassifications | Other | Fair value calculated using internal models (level 3) | ||||||||||||||||||||||||
| Financial assets held for trading | ( | ( | — | ( | ( | |||||||||||||||||||||||||||
| Debt securities | ( | ( | — | ( | ||||||||||||||||||||||||||||
| Equity instruments | ( | — | ||||||||||||||||||||||||||||||
| Trading derivatives | ( | ( | — | ( | ( | |||||||||||||||||||||||||||
| Swaps | ( | ( | — | ( | ||||||||||||||||||||||||||||
| Exchange rate options | ( | — | ||||||||||||||||||||||||||||||
| Interest rate options | ( | ( | — | |||||||||||||||||||||||||||||
| Index and securities options | ( | ( | — | ( | ||||||||||||||||||||||||||||
| Other | ( | ( | — | ( | ||||||||||||||||||||||||||||
| Financial assets at fair value through profit or loss | ( | ( | — | ( | ||||||||||||||||||||||||||||
| Credit entities | — | ( | ||||||||||||||||||||||||||||||
| Loans and advances to customers | ( | — | ||||||||||||||||||||||||||||||
| Debt securities | ( | ( | — | |||||||||||||||||||||||||||||
| Non-trading financial assets mandatorily at fair value through profit or loss | ( | — | ||||||||||||||||||||||||||||||
| Loans and advances to customers | ( | — | ( | |||||||||||||||||||||||||||||
| Debt securities | ( | — | ||||||||||||||||||||||||||||||
| Equity instruments | ( | — | ||||||||||||||||||||||||||||||
| Financial assets at fair value through other comprehensive income | ( | ( | ( | |||||||||||||||||||||||||||||
| Loans and advances | ( | ( | ( | |||||||||||||||||||||||||||||
| Debt securities | ( | ( | ( | |||||||||||||||||||||||||||||
| Equity instruments | ( | ( | ||||||||||||||||||||||||||||||
| TOTAL ASSETS | ( | ( | ( | |||||||||||||||||||||||||||||
| Financial liabilities held for trading | ( | ( | — | ( | ( | |||||||||||||||||||||||||||
| Trading derivatives | ( | ( | — | ( | ( | |||||||||||||||||||||||||||
| Swaps | ( | ( | — | |||||||||||||||||||||||||||||
| Exchange rate options | — | |||||||||||||||||||||||||||||||
| Interest rate options | ( | ( | — | ( | ||||||||||||||||||||||||||||
| Index and securities options | ( | ( | — | ( | ||||||||||||||||||||||||||||
| Securities and interest rate futures | ( | — | ||||||||||||||||||||||||||||||
| Others | ( | ( | — | ( | ||||||||||||||||||||||||||||
| Financial liabilities designated at fair value through profit or loss | ( | — | ( | |||||||||||||||||||||||||||||
| Liabilities under insurance contracts | — | |||||||||||||||||||||||||||||||
| TOTAL LIABILITIES | ( | ( | — | ( | ( | |||||||||||||||||||||||||||
714
51. Other disclosures
a) Residual maturity periods
The detail, by maturity, of the balances of certain items in the consolidated balance sheet at 31 December 2023, 2022 and 2021 is presented below:
| 31 December 2023 | |||||||||||||||||||||||
| EUR million | |||||||||||||||||||||||
| On demand | Within 3 months | 3 to 12 months | 1 to 3 years | 3 to 5 years | More than 5 years | Total | |||||||||||||||||
| Assets | |||||||||||||||||||||||
| Cash, cash balances at Central Banks and other deposits on demand | |||||||||||||||||||||||
| Financial assets at fair value through other comprehensive income | |||||||||||||||||||||||
| Debt securities | |||||||||||||||||||||||
| Loans and advances | |||||||||||||||||||||||
| Customers | |||||||||||||||||||||||
| Financial assets at amortized cost | |||||||||||||||||||||||
| Debt securities | |||||||||||||||||||||||
| Loans and advances | |||||||||||||||||||||||
| Central banks | |||||||||||||||||||||||
| Credits institutions | |||||||||||||||||||||||
| Customers | |||||||||||||||||||||||
| Liabilities | |||||||||||||||||||||||
| Financial liabilities at amortized cost | |||||||||||||||||||||||
| Deposits | |||||||||||||||||||||||
| Central banks | |||||||||||||||||||||||
| Credit institutions | |||||||||||||||||||||||
| Customer deposits | |||||||||||||||||||||||
Marketable debt securitiesA | |||||||||||||||||||||||
| Other financial liabilities | |||||||||||||||||||||||
| Difference (assets less liabilities) | ( | ( | ( | ||||||||||||||||||||
A.Includes promissory notes, certificates of deposit and other short-term debt issues.
See breakdown by type of debt (subordinated debt, senior unsecured debt, senior secured debt, notes and other securities) (see note 22).
715
| 31 December 2022 | |||||||||||||||||||||||
| EUR million | |||||||||||||||||||||||
| On demand | Within 3 months | 3 to 12 months | 1 to 3 years | 3 to 5 years | More than 5 years | Total | |||||||||||||||||
| Assets | |||||||||||||||||||||||
| Cash, cash balances at Central Banks and other deposits on demand | |||||||||||||||||||||||
| Financial assets at fair value through other comprehensive income | |||||||||||||||||||||||
| Debt securities | |||||||||||||||||||||||
| Loans and advances | |||||||||||||||||||||||
| Customers | |||||||||||||||||||||||
| Financial assets at amortized cost | |||||||||||||||||||||||
| Debt securities | |||||||||||||||||||||||
| Loans and advances | |||||||||||||||||||||||
| Central banks | |||||||||||||||||||||||
| Credits institutions | |||||||||||||||||||||||
| Customers | |||||||||||||||||||||||
| Liabilities | |||||||||||||||||||||||
| Financial liabilities at amortized cost | |||||||||||||||||||||||
| Deposits | |||||||||||||||||||||||
| Central banks | |||||||||||||||||||||||
| Credit institutions | |||||||||||||||||||||||
| Customer deposits | |||||||||||||||||||||||
Marketable debt securitiesA | |||||||||||||||||||||||
| Other financial liabilities | |||||||||||||||||||||||
| Difference (assets less liabilities) | ( | ( | ( | ||||||||||||||||||||
A.Includes promissory notes, certificates of deposit and other short-term debt issues.
716
| 31 December 2021 | |||||||||||||||||||||||
| EUR million | |||||||||||||||||||||||
| On demand | Within 3 months | 3 to 12 months | 1 to 3 years | 3 to 5 years | More than 5 years | Total | |||||||||||||||||
| Assets | |||||||||||||||||||||||
| Cash, cash balances at Central Banks and other deposits on demand | |||||||||||||||||||||||
| Financial assets at fair value through other comprehensive income | |||||||||||||||||||||||
| Debt securities | |||||||||||||||||||||||
| Loans and advances | |||||||||||||||||||||||
| Customers | |||||||||||||||||||||||
| Financial assets at amortized cost | |||||||||||||||||||||||
| Debt securities | |||||||||||||||||||||||
| Loans and advances | |||||||||||||||||||||||
| Central banks | |||||||||||||||||||||||
| Credit institutions | |||||||||||||||||||||||
| Customers | |||||||||||||||||||||||
| Liabilities | |||||||||||||||||||||||
| Financial liabilities at amortized cost | |||||||||||||||||||||||
| Deposits | |||||||||||||||||||||||
| Central banks | |||||||||||||||||||||||
| Credit institutions | |||||||||||||||||||||||
| Customer deposits | |||||||||||||||||||||||
Marketable debt securitiesA | |||||||||||||||||||||||
| Other financial liabilities | |||||||||||||||||||||||
| Difference (assets less liabilities) | ( | ( | |||||||||||||||||||||
A.Includes promissory notes, certificates of deposit and other short-term debt issues.
717
The detail of the remaining contractual maturities of the existing financial liabilities at amortised cost at 31 December 2023, 2022 and 2021 is as follows:
| 31 December 2023 | |||||||||||||||||||||||
| EUR million | |||||||||||||||||||||||
| On demand | Within 3 months | 3 to 12 months | 1 to 3 years | 3 to 5 years | More than 5 years | Total | |||||||||||||||||
| Financial liabilities at amortized cost | |||||||||||||||||||||||
| Deposits | |||||||||||||||||||||||
| Central banks | |||||||||||||||||||||||
| Credit institutions | |||||||||||||||||||||||
| Customer | |||||||||||||||||||||||
| Marketable debt securities | |||||||||||||||||||||||
| Other financial liabilities | |||||||||||||||||||||||
| 31 December 2022 | |||||||||||||||||||||||
| EUR million | |||||||||||||||||||||||
| On demand | Within 3 months | 3 to 12 months | 1 to 3 years | 3 to 5 years | More than 5 years | Total | |||||||||||||||||
| Financial liabilities at amortized cost | |||||||||||||||||||||||
| Deposits | |||||||||||||||||||||||
| Central banks | |||||||||||||||||||||||
| Credit institutions | |||||||||||||||||||||||
| Customer | |||||||||||||||||||||||
| Marketable debt securities | |||||||||||||||||||||||
| Other financial liabilities | |||||||||||||||||||||||
.
| 31 December 2021 | |||||||||||||||||||||||
| EUR million | |||||||||||||||||||||||
| On demand | Within 3 months | 3 to 12 months | 1 to 3 years | 3 to 5 years | More than 5 years | Total | |||||||||||||||||
| Financial liabilities at amortized cost | |||||||||||||||||||||||
| Deposits | |||||||||||||||||||||||
| Central banks | |||||||||||||||||||||||
| Credit institutions | |||||||||||||||||||||||
| Customer | |||||||||||||||||||||||
| Marketable debt securities | |||||||||||||||||||||||
| Other financial liabilities | |||||||||||||||||||||||
718
Below is a breakdown of contractual maturities for the rest of financial assets and liabilities as of 31 December 2023, 2022 and 2021:
| 31 December 2023 | ||||||||||||||||||||
| EUR million | ||||||||||||||||||||
| Within 3 months | 3 to 12 months | 1 to 3 years | 3 to 5 years | More than 5 years | Total | |||||||||||||||
| FINANCIAL ASSETS | ||||||||||||||||||||
| Financial assets held for trading | ||||||||||||||||||||
| Derivatives | ||||||||||||||||||||
| Equity instruments | ||||||||||||||||||||
| Debt securities | ||||||||||||||||||||
| Loans and advances | ||||||||||||||||||||
| Central banks | ||||||||||||||||||||
| Credits institutions | ||||||||||||||||||||
| Customers | ||||||||||||||||||||
| Financial assets designated at fair value through profit or loss | ||||||||||||||||||||
| Debt securities | ||||||||||||||||||||
| Loans and advances | ||||||||||||||||||||
| Credit institutions | ||||||||||||||||||||
| Customers | ||||||||||||||||||||
| Non-trading financial assets mandatorily at fair value through profit or loss | ||||||||||||||||||||
| Equity instruments | ||||||||||||||||||||
| Debt securities | ||||||||||||||||||||
| Loans and advances | ||||||||||||||||||||
| Customers | ||||||||||||||||||||
| Financial assets at fair value through other comprehensive income | ||||||||||||||||||||
| Equity instruments | ||||||||||||||||||||
| Hedging derivatives | ||||||||||||||||||||
| Changes in the fair value of hedged items in portfolio hedges of interest rate risk | ( | ( | ( | ( | ( | |||||||||||||||
| TOTAL FINANCIAL ASSETS | ||||||||||||||||||||
719
| 31 December 2023 | ||||||||||||||||||||
| EUR million | ||||||||||||||||||||
| Within 3 months | 3 to 12 months | 1 to 3 years | 3 to 5 years | More than 5 years | Total | |||||||||||||||
| FINANCIAL LIABILITIES | ||||||||||||||||||||
| Financial liabilities held for trading | ||||||||||||||||||||
| Derivatives | ||||||||||||||||||||
| Shorts positions | ||||||||||||||||||||
| Deposits | ||||||||||||||||||||
| Central banks | ||||||||||||||||||||
| Credits institutions | ||||||||||||||||||||
| Customers | ||||||||||||||||||||
| Financial liabilities designated at fair value through profit or loss | ||||||||||||||||||||
| Deposits | ||||||||||||||||||||
| Central banks | ||||||||||||||||||||
| Credits institutions | ||||||||||||||||||||
| Customers | ||||||||||||||||||||
Marketable debt securitiesA | ||||||||||||||||||||
| Hedging derivatives | ||||||||||||||||||||
| Changes in the fair value of hedged items in portfolio hedges of interest rate risk | ( | ( | ( | |||||||||||||||||
| TOTAL FINANCIAL LIABILITIES | ||||||||||||||||||||
A.Includes promissory notes, certificates of deposit and other short-term debt issues (see note 22).
| 31 December 2023 | ||||||||||||||||||||
| EUR million | ||||||||||||||||||||
| Within 3 months | 3 to 12 months | 1 to 3 years | 3 to 5 years | More than 5 years | Total | |||||||||||||||
| Memorandum items | ||||||||||||||||||||
| Loans commitment granted | ||||||||||||||||||||
| Financial guarantees granted | ||||||||||||||||||||
| Other commitments granted | ||||||||||||||||||||
| MEMORANDUM ITEMS | ||||||||||||||||||||
In the Group’s experience, no outflows of cash or other financial assets take place prior to the contractual maturity date that might affect the information broken down above.
720
| 31 December 2022 | ||||||||||||||||||||
| EUR million | ||||||||||||||||||||
| Within 3 months | 3 to 12 months | 1 to 3 years | 3 to 5 years | More than 5 years | Total | |||||||||||||||
| FINANCIAL ASSETS | ||||||||||||||||||||
| Financial assets held for trading | ||||||||||||||||||||
| Derivatives | ||||||||||||||||||||
| Equity instruments | ||||||||||||||||||||
| Debt securities | ||||||||||||||||||||
| Loans and advances | ||||||||||||||||||||
| Central banks | ||||||||||||||||||||
| Credits institutions | ||||||||||||||||||||
| Customers | ||||||||||||||||||||
| Financial assets designated at fair value through profit or loss | ||||||||||||||||||||
| Debt securities | ||||||||||||||||||||
| Loans and advances | ||||||||||||||||||||
| Central banks | ||||||||||||||||||||
| Credit institutions | ||||||||||||||||||||
| Customers | ||||||||||||||||||||
| Non-trading financial assets mandatorily at fair value through profit or loss | ||||||||||||||||||||
| Equity instruments | ||||||||||||||||||||
| Debt instruments | ||||||||||||||||||||
| Loans and advances | ||||||||||||||||||||
| Central banks | ||||||||||||||||||||
| Credits institutions | ||||||||||||||||||||
| Customers | ||||||||||||||||||||
| Financial assets at fair value through other comprehensive income | ||||||||||||||||||||
| Equity instruments | ||||||||||||||||||||
| Hedging derivatives | ||||||||||||||||||||
| Changes in the fair value of hedged items in portfolio hedges of interest rate risk | ( | ( | ( | ( | ( | ( | ||||||||||||||
| TOTAL FINANCIAL ASSETS | ||||||||||||||||||||
721
| 31 December 2022 | ||||||||||||||||||||
| EUR million | ||||||||||||||||||||
| Within 3 months | 3 to 12 months | 1 to 3 years | 3 to 5 years | More than 5 years | Total | |||||||||||||||
| FINANCIAL LIABILITIES | ||||||||||||||||||||
| Financial liabilities held for trading | ||||||||||||||||||||
| Derivatives | ||||||||||||||||||||
| Shorts positions | ||||||||||||||||||||
| Deposits | ||||||||||||||||||||
| Central banks | ||||||||||||||||||||
| Credits institutions | ||||||||||||||||||||
| Customers | ||||||||||||||||||||
| Marketable debt securities | ||||||||||||||||||||
| Other financial liabilities | ||||||||||||||||||||
| Financial liabilities designated at fair value through profit or loss | ||||||||||||||||||||
| Deposits | ||||||||||||||||||||
| Central banks | ||||||||||||||||||||
| Credits institutions | ||||||||||||||||||||
| Customers | ||||||||||||||||||||
Marketable debt securitiesA | ||||||||||||||||||||
| Hedging derivatives | ||||||||||||||||||||
| Changes in the fair value of hedged items in portfolio hedges of interest rate risk | ( | ( | ( | |||||||||||||||||
| TOTAL FINANCIAL LIABILITIES | ||||||||||||||||||||
A.Includes promissory notes, certificates of deposit and other short-term debt issues (see note 22).
| 31 December 2022 | ||||||||||||||||||||
| EUR million | ||||||||||||||||||||
| Within 3 months | 3 to 12 months | 1 to 3 years | 3 to 5 years | More than 5 years | Total | |||||||||||||||
| Memorandum items | ||||||||||||||||||||
| Loans commitment granted | ||||||||||||||||||||
| Financial guarantees granted | ||||||||||||||||||||
| Other commitments granted | ||||||||||||||||||||
| MEMORANDUM ITEMS | ||||||||||||||||||||
722
| 31 December 2021 | ||||||||||||||||||||
| EUR million | ||||||||||||||||||||
| Within 3 months | 3 to 12 months | 1 to 3 years | 3 to 5 years | More than 5 years | Total | |||||||||||||||
| FINANCIAL ASSETS | ||||||||||||||||||||
| Financial assets held for trading | ||||||||||||||||||||
| Derivatives | ||||||||||||||||||||
| Equity instruments | ||||||||||||||||||||
| Debt securities | ||||||||||||||||||||
| Loans and advances | ||||||||||||||||||||
| Central banks | ||||||||||||||||||||
| Credits institutions | ||||||||||||||||||||
| Customers | ||||||||||||||||||||
| Financial assets designated at fair value through profit or loss | ||||||||||||||||||||
| Debt securities | ||||||||||||||||||||
| Loans and advances | ||||||||||||||||||||
| Credit institutions | ||||||||||||||||||||
| Customers | ||||||||||||||||||||
| Non-trading financial assets mandatorily at fair value through profit or loss | ||||||||||||||||||||
| Equity instruments | ||||||||||||||||||||
| Debt instruments | ||||||||||||||||||||
| Loans and advances | ||||||||||||||||||||
| Customers | ||||||||||||||||||||
| Financial assets at fair value through other comprehensive income | ||||||||||||||||||||
| Equity instruments | ||||||||||||||||||||
| Hedging derivatives | ||||||||||||||||||||
| Changes in the fair value of hedged items in portfolio hedges of interest rate risk | ( | ( | ||||||||||||||||||
| TOTAL FINANCIAL ASSETS | ||||||||||||||||||||
723
| 31 December 2021 | ||||||||||||||||||||
| EUR million | ||||||||||||||||||||
| Within 3 months | 3 to 12 months | 1 to 3 years | 3 to 5 years | More than 5 years | Total | |||||||||||||||
| FINANCIAL LIABILITIES | ||||||||||||||||||||
| Financial liabilities held for trading | ||||||||||||||||||||
| Derivatives | ||||||||||||||||||||
| Shorts positions | ||||||||||||||||||||
| Deposits | ||||||||||||||||||||
| Central banks | ||||||||||||||||||||
| Credits institutions | ||||||||||||||||||||
| Customers | ||||||||||||||||||||
| Financial liabilities designated at fair value through profit or loss | ||||||||||||||||||||
| Deposits | ||||||||||||||||||||
| Central banks | ||||||||||||||||||||
| Credits institutions | ||||||||||||||||||||
| Customers | ||||||||||||||||||||
Marketable debt securitiesA | ||||||||||||||||||||
| Hedging derivatives | ||||||||||||||||||||
| Changes in the fair value of hedged items in portfolio hedges of interest rate risk | ||||||||||||||||||||
| TOTAL FINANCIAL LIABILITIES | ||||||||||||||||||||
A.Includes promissory notes, certificates of deposit and other short-term debt issues (see note 22).
| 31 December 2021 | ||||||||||||||||||||
| EUR million | ||||||||||||||||||||
| Within 3 months | 3 to 12 months | 1 to 3 years | 3 to 5 years | More than 5 years | Total | |||||||||||||||
| Memorandum items | ||||||||||||||||||||
| Loans commitment granted | ||||||||||||||||||||
| Financial guarantees granted | ||||||||||||||||||||
| Other commitments granted | ||||||||||||||||||||
| MEMORANDUM ITEMS | ||||||||||||||||||||
724
b) Equivalent euro value of assets and liabilities
The detail of the main foreign currency balances in the consolidated balance sheet, based on the nature of the related items, is as follows:
| Equivalent value in EUR million | ||||||||||||||||||||||||||
| 2023 | 2022 | 2021 | ||||||||||||||||||||||||
| Assets | Liabilities | Assets | Liabilities | Assets | Liabilities | |||||||||||||||||||||
| Cash, cash balances at central banks and other deposits on demand | — | — | — | |||||||||||||||||||||||
| Financial assets/liabilities held for trading | ||||||||||||||||||||||||||
| Non-trading financial assets mandatorily at fair value through profit or loss | — | — | — | |||||||||||||||||||||||
| Other financial assets/liabilities at fair value through profit or loss | ||||||||||||||||||||||||||
| Financial assets at fair value through other comprehensive income | — | — | — | |||||||||||||||||||||||
| Financial assets at amortized cost | — | — | — | |||||||||||||||||||||||
| Investments | — | — | — | |||||||||||||||||||||||
| Tangible assets | — | — | — | |||||||||||||||||||||||
| Intangible assets | — | — | — | |||||||||||||||||||||||
| Financial liabilities at amortized cost | — | — | — | |||||||||||||||||||||||
| Liabilities under insurance contracts | — | — | — | |||||||||||||||||||||||
| Other | ||||||||||||||||||||||||||
c) Fair value of financial assets and liabilities not measured at fair value
The financial assets owned by the Group are measured at fair value in the accompanying consolidated balance sheet, except for cash, cash balances at central banks and other deposits on demand, loans and advances at amortised cost.
Similarly, the Group’s financial liabilities -except for financial liabilities held for trading, those measured at fair value and derivatives other than those having as their underlying equity instruments whose market value cannot be estimated reliably- are measured at amortised cost in the accompanying consolidated balance sheet.
Following is a comparison of the carrying amounts of the Group’s financial instruments measured at other than fair value and their respective fair values at year-end:
i) Financial assets measured at other than fair value
| EUR million | |||||||||||||||||||||||||||||||||||||||||||||||||||||
| 2023 | 2022 | 2021 | |||||||||||||||||||||||||||||||||||||||||||||||||||
| Assets | Carrying amount | Fair value | Level 1 | Level 2 | Level 3 | Carrying amount | Fair value | Level 1 | Level 2 | Level 3 | Carrying amount | Fair value | Level 1 | Level 2 | Level 3 | ||||||||||||||||||||||||||||||||||||||
| Loans and advances | |||||||||||||||||||||||||||||||||||||||||||||||||||||
| Debt securities | |||||||||||||||||||||||||||||||||||||||||||||||||||||
725
ii) Financial liabilities measured at other than fair value
| EUR million | |||||||||||||||||||||||||||||||||||||||||||||||||||||
| 2023 | 2022 | 2021 | |||||||||||||||||||||||||||||||||||||||||||||||||||
LiabilitiesA | Carrying amount | Fair value | Level 1 | Level 2 | Level 3 | Carrying amount | Fair value | Level 1 | Level 2 | Level 3 | Carrying amount | Fair value | Level 1 | Level 2 | Level 3 | ||||||||||||||||||||||||||||||||||||||
| Deposits | |||||||||||||||||||||||||||||||||||||||||||||||||||||
| Debt securities | |||||||||||||||||||||||||||||||||||||||||||||||||||||
A.At 31 December 2023, Grupo Santander had other financial liabilities that amounted to EUR 40,187 million, EUR 37,059 million in 2022 and EUR 29,873 million in 2021.
The main valuation methods and inputs used in the estimates at 31 December 2023 of the fair values of the financial assets and liabilities in the foregoing table were as follows:
•Financial assets at amortised cost: the fair value was estimated using the present value method. The estimates were made considering factors such as the expected maturity of the portfolio, market interest rates, spreads on newly approved transactions or market spreads -when available-.
•Financial liabilities at amortised cost:
i) Deposits: the fair value of short term deposits was taken to be their carrying amount. Factors such as the expected maturity of the transactions and the Group’s current cost of funding in similar transactions are consider for the estimation of long term deposits fair value. It had been used also current rates offered for deposits of similar remaining maturities.
ii) Marketable debt securities and subordinated liabilities: the fair value was calculated based on market prices for these instruments -when available- or by the present value method using market interest rates and spreads, as well as using any significant input which is not observable with market data if applicable.
iii) The fair value of cash, cash balances at central banks and other deposits on demand was taken to be their carrying amount since they are mainly short-term balances.
726
d) Offsetting of financial instruments
Following is the detail of financial assets and liabilities that were offset in the consolidated balance sheets as of 31 December 2023, 2022 and 2021:
| 31 December 2023 | |||||||||||
| EUR million | |||||||||||
| Assets | Gross amount of financial assets | Gross amount of financial assets offset in the balance sheet | Net amount of financial assets presented in the balance sheet | ||||||||
| Derivatives | ( | ||||||||||
| Reverse repurchase agreements | ( | ||||||||||
| Total | ( | ||||||||||
| 31 December 2022 | |||||||||||
| EUR million | |||||||||||
| Assets | Gross amount of financial assets | Gross amount of financial assets offset in the balance sheet | Net amount of financial assets presented in the balance sheet | ||||||||
| Derivatives | ( | ||||||||||
| Reverse repurchase agreements | ( | ||||||||||
| Total | ( | ||||||||||
| 31 December 2021 | |||||||||||
| EUR million | |||||||||||
| Assets | Gross amount of financial assets | Gross amount of financial assets offset in the balance sheet | Net amount of financial assets presented in the balance sheet | ||||||||
| Derivatives | ( | ||||||||||
| Reverse repurchase agreements | ( | ||||||||||
| Total | ( | ||||||||||
| 31 December 2023 | |||||||||||
| EUR million | |||||||||||
| Liabilities | Gross amount of financial liabilities | Gross amount of financial liabilities offset in the balance sheet | Net amount of financial liabilities presented in the balance sheet | ||||||||
| Derivatives | ( | ||||||||||
| Reverse repurchase agreements | ( | ||||||||||
| Total | ( | ||||||||||
| 31 December 2022 | |||||||||||
| EUR million | |||||||||||
| Liabilities | Gross amount of financial liabilities | Gross amount of financial liabilities offset in the balance sheet | Net amount of financial liabilities presented in the balance sheet | ||||||||
| Derivatives | ( | ||||||||||
| Reverse repurchase agreements | ( | ||||||||||
| Total | ( | ||||||||||
| 31 December 2021 | |||||||||||
| EUR million | |||||||||||
| Liabilities | Gross amount of financial liabilities | Gross amount of financial liabilities offset in the balance sheet | Net amount of financial liabilities presented in the balance sheet | ||||||||
| Derivatives | ( | ||||||||||
| Reverse repurchase agreements | ( | ||||||||||
| Total | ( | ||||||||||
At 31 December 2023, Grupo Santander has offset other items amounting to EUR 910 million (EUR 1,024 million and EUR 1,188 million at 31 December 2022 and 2021, respectively).
At 31 December 2023 the balance sheet shows the amounts EUR 151,044 million (EUR 141,529 million and EUR 106,430 million at 31 December 2022 and 2021) on derivatives and repos as assets and EUR 180,539 million (EUR 157,572 million and EUR 104,130 million at 31 December 2022 and 2021, respectively) on derivatives and repos as liabilities that are subject to netting and collateral arrangements.
727
52. Primary and secondary segments reporting
Grupo Santander bases segment reporting on financial information presented to the chief operating decision maker, which excludes certain statutory results items that distort year-on-year comparisons and are not considered for management reporting. This financial information (underlying basis) is computed by adjusting reported results for the effects of certain gains and losses (e.g. capital gains, write-downs, impairment of goodwill, etc.). These gains and losses are items that management and investors ordinarily identify and consider separately to better understand the underlying trends in the business.
Grupo Santander has aligned the information in this note with the underlying information used internally for management reporting and with that presented in Grupo Santander's other public documents.
Grupo Santander executive committee has been determined to be its chief operating decision maker. Grupo Santander's operating segments reflect its organizational and managerial structures. Grupo Santander 's executive committee reviews internal reporting based on these segments to assess performance and allocate resources.
The segments are split by geographic area in which profits are earned and type of business. Grupo Santander prepares the information by aggregating the figures for Grupo Santander’s various geographic areas and business units, relating it to both the accounting data of the units integrated in each segment and that provided by management information systems. The same general principles as those used in Grupo Santander are applied.
We completed the usual annual adjustment of the perimeter of the Global Customer Relationship Model between Retail Banking and Santander Corporate & Investment Banking and between Retail Banking and Wealth Management & Insurance.
Grupo Santander announced at 4 April 2022 changes in the reportable segments to reflect the new reporting structure effective from the first quarter financial information of 2022.
The main changes, which have been applied to management information for all periods included in the annual accounts, relate to the following:
1.Reallocation of certain financial costs of the Corporate Centre as follows:
a.Further clarity in the minimum requirement for own funds and eligible liabilities (MREL) and total loss absorbing capacity (TLAC) regulation makes it possible to allocate the cost of eligible debt issuances to the country units.
b.Other financial costs, primarily associated with the cost of funding the excess capital held by the units above the Group's CET1 ratio, have been reassigned accordingly.
2.Downsizing of 'Other Europe':
a.The Corporate & Investment Banking branches of Banco Santander, S.A. in Europe and other business lines previously reported under 'Other Europe' have been now integrated into the Spain unit to reflect how the business will be managed and supervised, in line with other regions.
Grupo Santander recasted the corresponding information of earlier periods considering the changes included in this section to facilitate a homogeneous comparison.
The above-mentioned changes have no impact on the Group’s reported consolidated financial statements.
a) Primary segments
This primary level of segmentation, which is based on the Group’s management structure, comprises five reportable segments: four operating areas plus the Corporate Centre. The operating areas are:
•Europe: which comprises all business activity carried out in the region, except that included in Digital Consumer Bank.
•North America: which comprises all the business activities carried out in Mexico and the US, which includes the holding company (SHUSA) and the businesses of Santander Bank, Santander Consumer USA, the specialized business unit Banco Santander International, Santander Investment Securities (SIS), Santander's New York branch and Santander US Capital Markets LLC (previously Amherst Pierpont Securities (APS)).
•South America: includes all the financial activities carried out by Grupo Santander through its banks and subsidiary banks in the region.
•Digital Consumer Bank: includes Santander Consumer Finance, which incorporates the entire consumer finance business in Europe, Openbank and ODS.
In addition to these operating units, which report by geographic area and businesses, Grupo Santander continues to maintain the area of Corporate Centre, that includes the centralized activities relating to equity stakes in financial companies, financial management of the structural exchange rate position, assumed within the sphere of Grupo Santander’s assets and liabilities committee, as well as management of liquidity and of shareholders’ equity via issuances.
As Grupo Santander’s holding entity, this area manages all capital and reserves and allocations of capital and liquidity with the rest of businesses. It also incorporates amortization of goodwill but not the costs related to the Grupo Santander’s central services (charged to the areas), except for corporate and institutional expenses related to the Grupo Santander’s functioning.
728
With regard to the balance sheet, due to the required segregation of the various business units (included in a single consolidated balance sheet), the amounts lent and borrowed between the units are shown as increases in the assets and liabilities of each business. These amounts relating to intra-Group liquidity are eliminated and are shown in the Intra-Group eliminations column in the table below in order to reconcile the amounts contributed by each business unit to the consolidated Grupo Santander's balance sheet.
There are no customers located in any of the areas that generate income exceeding 10% of Total income.
The condensed balance sheets and income statements of the various primary segments are as follows:
| EUR million | |||||||||||||||||||||||
| 2023 | |||||||||||||||||||||||
| Balance sheet (condensed) | Europe | North America | South America | Digital Consumer Bank | Corporate Centre | Intra-Group eliminations | Total | ||||||||||||||||
| Total assets | ( | ||||||||||||||||||||||
| Total liabilities | ( | ||||||||||||||||||||||
| Total equity | ( | ||||||||||||||||||||||
| Other customer funds under management | |||||||||||||||||||||||
| Other non-managed marketed customer funds | |||||||||||||||||||||||
| EUR million | |||||||||||||||||||||||
| 2022 | |||||||||||||||||||||||
| Balance sheet (condensed) | Europe | North America | South America | Digital Consumer Bank | Corporate Centre | Intra-Group eliminations | Total | ||||||||||||||||
| Total assets | ( | ||||||||||||||||||||||
| Total liabilities | ( | ||||||||||||||||||||||
| Total equity | ( | ||||||||||||||||||||||
| Other customer funds under management | |||||||||||||||||||||||
| Other non-managed marketed customer funds | |||||||||||||||||||||||
| EUR million | |||||||||||||||||||||||
| 2021 | |||||||||||||||||||||||
| Balance sheet (condensed) | Europe | North America | South America | Digital Consumer Bank | Corporate Centre | Intra-Group eliminations | Total | ||||||||||||||||
| Total assets | ( | ||||||||||||||||||||||
| Total liabilities | ( | ||||||||||||||||||||||
| Total equity | ( | ||||||||||||||||||||||
| Other customer funds under management | |||||||||||||||||||||||
| Other non-managed marketed customer funds | |||||||||||||||||||||||
729
The condensed income statements for the primary segments are as follows:
| EUR million | ||||||||||||||||||||
| 2023 | ||||||||||||||||||||
| Underlying income statement (condensed) | Europe | North America | South America | Digital Consumer Bank | Corporate centre | Total | ||||||||||||||
Net interest incomeA | ( | |||||||||||||||||||
| Net fee income | ( | |||||||||||||||||||
Gains (losses) on financial transactionsB | ( | |||||||||||||||||||
Other operating incomeC | ( | ( | ( | |||||||||||||||||
| Total income | ( | |||||||||||||||||||
| Administrative expenses, depreciation and amortisation | ( | ( | ( | ( | ( | ( | ||||||||||||||
Net operating incomeD | ( | |||||||||||||||||||
Net loan-loss provisionsE | ( | ( | ( | ( | ( | |||||||||||||||
Other gains (losses) and provisionsF | ( | ( | ( | ( | ( | ( | ||||||||||||||
| Operating profit/(loss) before tax | ( | |||||||||||||||||||
| Tax on profit | ( | ( | ( | ( | ( | ( | ||||||||||||||
| Profit from continuing operations | ( | |||||||||||||||||||
| Net profit from discontinued operations | ||||||||||||||||||||
| Consolidated profit | ( | |||||||||||||||||||
| Non-controlling interests | ( | ( | ( | ( | ( | |||||||||||||||
| Attributable profit to the parent | ( | |||||||||||||||||||
A.Net interest income includes the net amount of the profit and loss account items 'Interest income' and 'Interest expense'. It is presented this way because it is how it is presented to the main operational decision maker.
B.Gains (losses) on financial transactions includes the following line items in the statutory income statement, which are presented net for internal reporting and management reporting purposes: Gain or losses on financial assets and liabilities not measured at fair value through profit or loss, net, Gain or losses on financial assets and liabilities held for trading, net, Gains or losses on non-trading financial assets and liabilities mandatorily at fair value through profit or loss, net, Gain or losses on financial assets and liabilities measured at fair value through profit or loss, net, Gain or losses from hedge accounting, net and Exchange differences, net.
C.Other operating income includes the following line items in the statutory income statement, which are presented net for internal reporting and management reporting purposes: Dividend income; Income from companies accounted for using the equity method, Other operating income, Other operating expenses, Income from assets under insurance or reinsurance contracts and Expenses from liabilities under insurance or reinsurance contracts.
D.'Net Operating Income' is used for the Group’s internal reporting and management reporting purposes but is not a line item in the statutory consolidated income statement.
E.'Net loan-loss provisions' refers to Impairment or reversal of impairment at financial assets not measured at fair value through profit or loss and net gains and losses from changes line item in the statutory income statement. Additionally, includes a release of EUR 24 million mainly corresponding to the results by commitments and contingent risks includes in the line of the statutory income statement of provisions or reversal of provisions.
F.Other gains (losses) and provisions includes the following line items in the statutory income statement, which are presented net for internal reporting and management reporting purposes: Provisions or reversal of provisions except a release EUR 24 million mainly corresponding to the results by commitments and contingent risks; Impairment of investments in joint ventures and associates, net; Impairment on non-financial assets, net; Gains or losses on non-financial assets, net; Negative goodwill recognised in results and Gains or losses on non-current assets held for sale not classified as discontinued operations.
730
| EUR million | ||||||||||||||||||||
| 2022 | ||||||||||||||||||||
| Underlying income statement (condensed) | Europe | North America | South America | Digital Consumer Bank | Corporate Centre | Total | ||||||||||||||
Net interest incomeA | ( | |||||||||||||||||||
| Net fee income | ( | |||||||||||||||||||
Gains (losses) on financial transactionsB | ( | |||||||||||||||||||
Other operating incomeC | ( | ( | ||||||||||||||||||
| Total income | ( | |||||||||||||||||||
| Administrative expenses, depreciation and amortisation | ( | ( | ( | ( | ( | ( | ||||||||||||||
Net operating incomeD | ( | |||||||||||||||||||
Net loan-loss provisionsE | ( | ( | ( | ( | ( | |||||||||||||||
Other gains (losses) and provisionsF | ( | ( | ( | ( | ( | ( | ||||||||||||||
| Operating profit/(loss) before tax | ( | |||||||||||||||||||
| Tax on profit | ( | ( | ( | ( | ( | ( | ||||||||||||||
| Profit from continuing operations | ( | |||||||||||||||||||
| Net profit from discontinued operations | ||||||||||||||||||||
| Consolidated profit | ( | |||||||||||||||||||
| Non-controlling interests | ||||||||||||||||||||
| Attributable profit to the parent | ( | |||||||||||||||||||
A.Net interest income includes the net amount of the profit and loss account items 'Interest income' and 'Interest expense'. It is presented this way because it is how it is presented to the main operational decision maker.
B.Gains (losses) on financial transactions includes the following line items in the statutory income statement, which are presented net for internal reporting and management reporting purposes: Gain or losses on financial assets and liabilities not measured at fair value through profit or loss, net, Gain or losses on financial assets and liabilities held for trading, net, Gains or losses on non-trading financial assets and liabilities mandatorily at fair value through profit or loss, net, Gain or losses on financial assets and liabilities measured at fair value through profit or loss, net, Gain or losses from hedge accounting, net and Exchange differences, net.
C.Other operating income includes the following line items in the statutory income statement, which are presented net for internal reporting and management reporting purposes: Dividend income; Income from companies accounted for using the equity method, Other operating income, Other operating expenses, Income from assets under insurance or reinsurance contracts and Expenses from liabilities under insurance or reinsurance contracts.
D.'Net Operating Income' is used for the Group’s internal reporting and management reporting purposes but is not a line item in the statutory consolidated income statement.
E.'Loan loss provisions' refers to Impairment or reversal of impairment at financial assets not measured at fair value through profit or loss and net gains and losses from changes line item in the statutory income statement. Additionally, includes a release of EUR 27 million mainly corresponding to the results by commitments and contingent risks includes in the line of the statutory income statement of provisions or reversal of provisions.
F.Other gains (losses) and provisions includes the following line items in the statutory income statement, which are presented net for internal reporting and management reporting purposes: Provisions or reversal of provisions except a release of EUR 27 million mainly corresponding to the results by commitments and contingent risks; Impairment of investments in joint ventures and associates, net; Impairment on non-financial assets, net; Gains or losses on non-financial assets, net; Negative goodwill recognised in results and Gains or losses on non-current assets held for sale not classified as discontinued operations.
731
| EUR million | ||||||||||||||||||||
| 2021 | ||||||||||||||||||||
| Underlying income statement (condensed) | Europe | North America | South America | Digital Consumer Bank | Corporate Centre | Total | ||||||||||||||
Net interest incomeA | ( | |||||||||||||||||||
| Net fee income | ( | |||||||||||||||||||
Gains (losses) on financial transactionsB | ( | |||||||||||||||||||
Other operating incomeC | ( | ( | ||||||||||||||||||
| Total income | ( | |||||||||||||||||||
| Administrative expenses, depreciation and amortisation | ( | ( | ( | ( | ( | ( | ||||||||||||||
Net operating incomeD | ( | |||||||||||||||||||
Net loan-loss provisionsE | ( | ( | ( | ( | ( | ( | ||||||||||||||
Other gains (losses) and provisionsF | ( | ( | ( | ( | ( | ( | ||||||||||||||
| Operating profit/(loss) before tax | ( | |||||||||||||||||||
| Tax on profit | ( | ( | ( | ( | ( | ( | ||||||||||||||
| Profit from continuing operations | ( | |||||||||||||||||||
| Net profit from discontinued operations | ||||||||||||||||||||
| Consolidated profit | ( | |||||||||||||||||||
| Non-controlling interests | ||||||||||||||||||||
| Attributable profit to the parent | ( | |||||||||||||||||||
A.Net interest income includes the net amount of the profit and loss account items 'Interest income' and 'Interest expense'. It is presented this way because it is how it is presented to the main operational decision maker.
B.Gains (losses) on financial transactions includes the following line items in the statutory income statement, which are presented net for internal reporting and management reporting purposes: Gain or losses on financial assets and liabilities not measured at fair value through profit or loss, net, Gain or losses on financial assets and liabilities held for trading, net, Gains or losses on non-trading financial assets and liabilities mandatorily at fair value through profit or loss, net, Gain or losses on financial assets and liabilities measured at fair value through profit or loss, net, Gain or losses from hedge accounting, net and Exchange differences, net.
C.Other operating income includes the following line items in the statutory income statement, which are presented net for internal reporting and management reporting purposes: Dividend income; Income from companies accounted for using the equity method, Other operating income, Other operating expenses, Income from assets under insurance or reinsurance contracts and Expenses from liabilities under insurance or reinsurance contracts.
D.'Net Operating Income' is used for the Group’s internal reporting and management reporting purposes but is not a line item in the statutory consolidated income statement.
E.'Net loan-loss provisions' refers to Impairment or reversal of impairment at financial assets not measured at fair value through profit or loss and net gains and losses from changes line item in the statutory income statement. Additionally, includes an addition of EUR 29 million mainly corresponding to the results by commitments and contingent risks includes in the line of the statutory income statement of provisions or reversal of provisions.
F.Other gains (losses) and provisions includes the following line items in the statutory income statement, which are presented net for internal reporting and management reporting purposes: Provisions or reversal of provisions except an addition of EUR 29 million mainly corresponding to the results by commitments and contingent risks; Impairment of investments in joint ventures and associates, net; Impairment on non-financial assets, net; Gains or losses on non-financial assets, net; Negative goodwill recognised in results and Gains or losses on non-current assets held for sale not classified as discontinued operations.
732
b) Secondary segments
At this secondary level, Grupo Santander is structured into Retail Banking, Santander Corporate & Investment Banking (SCIB), Wealth Management & Insurance (WM&I) and PagoNxt.
•Retail Banking: this covers all customer banking businesses, including consumer finance, except those of corporate banking which are managed through Santander Corporate & Investment Banking, asset management, private banking and insurance, which are managed by WM&I. The results of the hedging positions in each country are also included, conducted within the sphere of their respective assets and liabilities committees.
•Santander Corporate & Investment Banking (SCIB): this business reflects revenue from global corporate banking, investment banking and markets worldwide including treasuries managed globally (always after the appropriate distribution with Retail Banking customers), as well as equity business.
•Wealth Management & Insurance: includes the asset management business (Santander Asset Management), the corporate unit of Private Banking and International Private Banking in Miami and Switzerland (Santander Private Banking) and the insurance business (Santander Insurance).
•PagoNxt: this includes digital payment solutions, providing global technology solutions for Grupo Santander's banks and new customers in the open market. It is structured in four businesses: Merchant, International Trade, Payments and Consumer.
Although WM&I and PagoNxt do not meet the quantitative thresholds defined in IFRS 8, these segments are considered reportable by Grupo Santander and are disclosed separately because Grupo Santander's management believes that information about these segments are useful to users of the financial statements.
There are no customers located in a place different from the location of the Group's assets that generate revenues in excess of 10% of ordinary revenues.
733
The condensed income statements are as follows:
| EUR million | ||||||||||||||||||||
| 2023 | ||||||||||||||||||||
| Underlying income statement (condensed) | Retail Banking | Santander Corporate & Investment Banking | Wealth Management & Insurance | PagoNxt | Corporate centre | Total | ||||||||||||||
Net interest incomeA | ( | |||||||||||||||||||
| Net fee income | ( | |||||||||||||||||||
Gains (losses) on financial transactionsB | ( | ( | ||||||||||||||||||
Other operating incomeC | ( | ( | ( | |||||||||||||||||
| Total income | ( | |||||||||||||||||||
| Administrative expenses, depreciation and amortisation | ( | ( | ( | ( | ( | ( | ||||||||||||||
Net operating incomeD | ( | |||||||||||||||||||
Net loan-loss provisionsE | ( | ( | ( | ( | ||||||||||||||||
Other gains (losses) and provisionsF | ( | ( | ( | ( | ( | ( | ||||||||||||||
| Operating profit/(loss) before tax | ( | ( | ||||||||||||||||||
| Tax on profit | ( | ( | ( | ( | ( | ( | ||||||||||||||
| Profit/(loss) from continuing operations | ( | ( | ||||||||||||||||||
| Net profit/(loss) from discontinued operations | ||||||||||||||||||||
| Consolidated profit/(loss) | ( | ( | ||||||||||||||||||
| Non-controlling interests | ( | ( | ( | ( | ( | |||||||||||||||
| Attributable profit/(loss) to the parent | ( | ( | ||||||||||||||||||
A.Net interest income includes the net amount of the profit and loss account items 'Interest income' and 'Interest expense'. It is presented this way because it is how it is presented to the main operational decision maker.
B.Gains (losses) on financial transactions includes the following line items in the statutory income statement, which are presented net for internal reporting and management reporting purposes: Gain or losses on financial assets and liabilities not measured at fair value through profit or loss, net, Gain or losses on financial assets and liabilities held for trading, net, Gains or losses on non-trading financial assets and liabilities mandatorily at fair value through profit or loss, net, Gain or losses on financial assets and liabilities measured at fair value through profit or loss, net, Gain or losses from hedge accounting, net and Exchange differences, net.
C.Other operating income includes the following line items in the statutory income statement, which are presented net for internal reporting and management reporting purposes: Dividend income; Income from companies accounted for using the equity method, Other operating income, Other operating expenses, Income from assets under insurance or reinsurance contracts and Expenses from liabilities under insurance or reinsurance contracts.
D.Net Operating Income is used for the Group’s internal reporting and management reporting purposes but is not a line item in the statutory consolidated income statement.
E.Net loan-loss provisions refers to Impairment or reversal of impairment at financial assets not measured at fair value through profit or loss and net gains and losses from changes line item in the statutory income statement. Additionally, includes a release of EUR 24 million mainly corresponding to the results by commitments and contingent risks included in the line provisions or reversal of provisions, net of the statutory income statement.
F.Other gains (losses) and provisions includes the following line items in the statutory income statement, which are presented net for internal reporting and management reporting purposes: Provisions or reversal of provisions except a release of EUR 24 million mainly corresponding to the results by commitments and contingent risks; Impairment of investments in joint ventures and associates, net; Impairment on non-financial assets, net; Gains or losses on non-financial assets, net; Negative goodwill recognized in results and Gains or losses on non-current assets held for sale not classified as discontinued operations.
734
| EUR million | ||||||||||||||||||||
| 2022 | ||||||||||||||||||||
| Underlying income statement (condensed) | Retail Banking | Santander Corporate & Investment Banking (SCIB) | Wealth Management & Insurance | PagoNxt | Corporate Centre | Total | ||||||||||||||
Net interest incomeA | ( | |||||||||||||||||||
| Net fee income | ( | |||||||||||||||||||
Gains (losses) on financial transactionsB | ( | ( | ||||||||||||||||||
Other operating incomeC | ( | ( | ||||||||||||||||||
| Total income | ( | |||||||||||||||||||
| Administrative expenses, depreciation and amortisation | ( | ( | ( | ( | ( | ( | ||||||||||||||
Net operating incomeD | ( | ( | ||||||||||||||||||
Net loan-loss provisionsE | ( | ( | ( | ( | ( | |||||||||||||||
Other gains (losses) and provisionsF | ( | ( | ( | ( | ( | ( | ||||||||||||||
| Operating profit/(loss) before tax | ( | ( | ||||||||||||||||||
| Tax on profit | ( | ( | ( | ( | ( | ( | ||||||||||||||
| Profit/(loss) from continuing operations | ( | ( | ||||||||||||||||||
| Net profit/(loss) from discontinued operations | ||||||||||||||||||||
| Consolidated profit/(loss) | ( | ( | ||||||||||||||||||
| Non-controlling interests | ||||||||||||||||||||
| Attributable profit/(loss) to the parent | ( | ( | ||||||||||||||||||
A.Net interest income includes the net amount of the profit and loss account items 'Interest income' and 'Interest expense'. It is presented this way because it is how it is presented to the main operational decision maker.
B.Gains (losses) on financial transactions includes the following line items in the statutory income statement, which are presented net for internal reporting and management reporting purposes: Gain or losses on financial assets and liabilities not measured at fair value through profit or loss, net, Gain or losses on financial assets and liabilities held for trading, net, Gains or losses on non-trading financial assets and liabilities mandatorily at fair value through profit or loss, net, Gain or losses on financial assets and liabilities measured at fair value through profit or loss, net, Gain or losses from hedge accounting, net and Exchange differences, net.
C.Other operating income includes the following line items in the statutory income statement, which are presented net for internal reporting and management reporting purposes: Dividend income; Income from companies accounted for using the equity method, Other operating income, Other operating expenses, Income from assets under insurance or reinsurance contracts and Expenses from liabilities under insurance or reinsurance contracts.
D.Net Operating Income is used for the Group’s internal reporting and management reporting purposes but is not a line item in the statutory consolidated income statement.
E.Net loan-loss provisions refers to Impairment or reversal of impairment at financial assets not measured at fair value through profit or loss and net gains and losses from changes line item in the statutory income statement. Additionally, includes a release of EUR 27 million mainly corresponding to the results by commitments and contingent risks included in the line provisions or reversal of provisions, net of the statutory income statement.
F.Other gains (losses) and provisions includes the following line items in the statutory income statement, which are presented net for internal reporting and management reporting purposes: Provisions or reversal of provisions except a release of EUR 27 million mainly corresponding to the results by commitments and contingent risks; Impairment of investments in joint ventures and associates, net; Impairment on non-financial assets, net; Gains or losses on non-financial assets, net; Negative goodwill recognized in results and Gains or losses on non-current assets held for sale not classified as discontinued operations.
735
| EUR million | ||||||||||||||||||||
| 2021 | ||||||||||||||||||||
| Underlying income statement (condensed) | Retail Banking | Santander Corporate & Investment Banking (SCIB) | Wealth Management & Insurance | PagoNxt | Corporate Centre | Total | ||||||||||||||
Net interest incomeA | ( | |||||||||||||||||||
| Net fee income | ( | |||||||||||||||||||
Gains (losses) on financial transactionsB | ( | ( | ||||||||||||||||||
Other operating incomeC | ( | |||||||||||||||||||
| Total income | ( | |||||||||||||||||||
| Administrative expenses, depreciation and amortisation | ( | ( | ( | ( | ( | ( | ||||||||||||||
Net operating incomeD | ( | ( | ||||||||||||||||||
Net loan-loss provisionsE | ( | ( | ( | ( | ( | ( | ||||||||||||||
Other gains (losses) and provisionsF | ( | ( | ( | ( | ( | |||||||||||||||
| Operating profit/(loss) before tax | ( | ( | ||||||||||||||||||
| Tax on profit | ( | ( | ( | ( | ( | ( | ||||||||||||||
| Profit/(loss) from continuing operations | ( | ( | ||||||||||||||||||
| Net profit/(loss) from discontinued operations | ||||||||||||||||||||
| Consolidated profit/(loss) | ( | ( | ||||||||||||||||||
| Non-controlling interests | ||||||||||||||||||||
| Attributable profit/(loss) to the parent | ( | ( | ||||||||||||||||||
A.Net interest income includes the net amount of the profit and loss account items 'Interest income' and 'Interest expense'. It is presented this way because it is how it is presented to the main operational decision maker.
B.Gains (losses) on financial transactions includes the following line items in the statutory income statement, which are presented net for internal reporting and management reporting purposes: Gain or losses on financial assets and liabilities not measured at fair value through profit or loss, net, Gain or losses on financial assets and liabilities held for trading, net, Gains or losses on non-trading financial assets and liabilities mandatorily at fair value through profit or loss, net, Gain or losses on financial assets and liabilities measured at fair value through profit or loss, net, Gain or losses from hedge accounting, net and Exchange differences, net.
C.Other operating income includes the following line items in the statutory income statement, which are presented net for internal reporting and management reporting purposes: Dividend income; Income from companies accounted for using the equity method, Other operating income, Other operating expenses, Income from assets under insurance or reinsurance contracts and Expenses from liabilities under insurance or reinsurance contracts.
D.Net Operating Income is used for the Group’s internal reporting and management reporting purposes but is not a line item in the statutory consolidated income statement.
E.Net loan-loss provisions refers to Impairment or reversal of impairment at financial assets not measured at fair value through profit or loss and net gains and losses from changes line item in the statutory income statement. Additionally, includes an addition of EUR 29 million mainly corresponding to the results by commitments and contingent risks included in the line provisions or reversal of provisions, net of the statutory income statement.
F.Other gains (losses) and provisions includes the following line items in the statutory income statement, which are presented net for internal reporting and management reporting purposes: Provisions or reversal of provisions except an addition of EUR 29 million mainly corresponding to the results by commitments and contingent risks; Impairment of investments in joint ventures and associates, net; Impairment on non-financial assets, net; Gains or losses on non-financial assets, net; Negative goodwill recognized in results and Gains or losses on non-current assets held for sale not classified as discontinued operations.
736
c) Reconciliations of reportable segment results
The tables below reconcile the statutory basis results to the underlying results for each of the periods presented as required by IFRS 8. For the purposes of these reconciliations, all material reconciling items are separately identified and described.
Grupo Santander assets and liabilities for management reporting purposes do not differ from the statutory reported figures and therefore are not reconciled.
| EUR million | |||||||||||
| 2023 | |||||||||||
| Reconciliation of statutory results to underlying results | Statutory results | Adjustments | Underlying results | ||||||||
Net interest incomeA | |||||||||||
| Net fee income | |||||||||||
Gains (losses) on financial transactionsB | |||||||||||
Other operating incomeC | ( | ( | |||||||||
| Total income | |||||||||||
| Administrative expenses, depreciation and amortisation | ( | ( | |||||||||
Net operating incomeD | |||||||||||
Net loan-loss provisionsE | ( | ( | |||||||||
Other gains (losses) and provisionsF | ( | ( | ( | ||||||||
| Operating profit/(loss) before tax | |||||||||||
| Tax on profit | ( | ( | ( | ||||||||
| Adjusted profit for the year from continuing operations | |||||||||||
| Profit from discontinued operations (net) | |||||||||||
| Consolidated profit/(loss) | |||||||||||
| Non-controlling interests | ( | ( | ( | ||||||||
| Attributable profit/(loss) to the parent | |||||||||||
A.Net interest income includes the net amount of the profit and loss account items 'Interest income' and 'Interest expense'. It is presented this way because it is how it is presented to the main operational decision maker.
B.Gains (losses) on financial transactions includes the following line items in the statutory income statement, which are presented net for internal reporting and management reporting purposes: Gain or losses on financial assets and liabilities not measured at fair value through profit or loss, net, Gain or losses on financial assets and liabilities held for trading, net, Gains or losses on non-trading financial assets and liabilities mandatorily at fair value through profit or loss, net, Gain or losses on financial assets and liabilities measured at fair value through profit or loss, net, Gain or losses from hedge accounting, net and Exchange differences, net.
C.Other operating income includes the following line items in the statutory income statement, which are presented net for internal reporting and management reporting purposes: Dividend income; Income from companies accounted for using the equity method, Other operating income, Other operating expenses, Income from assets under insurance or reinsurance contracts and Expenses from liabilities under insurance or reinsurance contracts.
D.Net Operating Income is used for the Group’s internal reporting and management reporting purposes but is not a line item in the statutory consolidated income statement.
E.Net loan-loss provisions refers to Impairment or reversal of impairment at financial assets not measured at fair value through profit or loss and net gains and losses from changes line item in the statutory income statement. Additionally, includes a release of EUR 24 million mainly corresponding to the results by commitments and contingent risks includes in the line of the statutory income statement of provisions or reversal of provisions.
F.Other gains (losses) and provisions includes the following line items in the statutory income statement, which are presented net for internal reporting and management reporting purposes: Provisions or reversal of provisions except for a release of EUR 24 million mainly corresponding to results from commitments and contingent risks; Impairment of investments in joint ventures and associates, net; Impairment on non-financial assets, net; Gains or losses on non-financial assets, net; Negative goodwill recognized in results and Gains or losses on non-current assets held for sale not classified as discontinued operations.
Explanation of adjustments:
•Temporary levy on revenue in Spain in the first quarter, totalling EUR 224 million, which was moved from total income to other gains (losses) and provisions.
•Additional provisions for specific cases in the wholesale portfolio of Brazil for an amount of EUR 235 million, net of tax and non-controlling interests (EUR 474 million recorded in net loan-loss provisions, EUR 213 million positive impact in tax and EUR 26 million in non-controlling interests).
737
| EUR million | |||||||||||
| 2022 | |||||||||||
| Reconciliation of statutory results to underlying results | Statutory results | Adjustments | Underlying results | ||||||||
Net interest incomeA | |||||||||||
| Net fee income | |||||||||||
Gains (losses) on financial transactionsB | |||||||||||
Other operating incomeC | |||||||||||
| Total income | |||||||||||
| Administrative expenses, depreciation and amortisation | ( | ( | |||||||||
Net operating incomeD | |||||||||||
Net loan-loss provisionsE | ( | ( | |||||||||
Other gains (losses) and provisionsF | ( | ( | ( | ||||||||
| Operating profit/(loss) before tax | |||||||||||
| Tax on profit | ( | ( | |||||||||
| Adjusted profit for the year from continuing operations | |||||||||||
| Profit from discontinued operations (net) | |||||||||||
| Consolidated profit/(loss) | |||||||||||
| Non-controlling interests | ( | ( | |||||||||
| Attributable profit/(loss) to the parent | |||||||||||
A.Net interest income includes the net amount of the profit and loss account items 'Interest income' and 'Interest expense'. It is presented this way because it is how it is presented to the main operational decision maker.
B.Gains (losses) on financial transactions includes the following line items in the statutory income statement, which are presented net for internal reporting and management reporting purposes: Gain or losses on financial assets and liabilities not measured at fair value through profit or loss, net, Gain or losses on financial assets and liabilities held for trading, net, Gains or losses on non-trading financial assets and liabilities mandatorily at fair value through profit or loss, net, Gain or losses on financial assets and liabilities measured at fair value through profit or loss, net, Gain or losses from hedge accounting, net and Exchange differences, net.
C.Other operating income includes the following line items in the statutory income statement, which are presented net for internal reporting and management reporting purposes: Dividend income; Income from companies accounted for using the equity method, Other operating income, Other operating expenses, Income from assets under insurance or reinsurance contracts and Expenses from liabilities under insurance or reinsurance contracts.
D.Net Operating Income is used for the Group’s internal reporting and management reporting purposes but is not a line item in the statutory consolidated income statement.
E.Net loan-loss provisions refers to Impairment or reversal of impairment at financial assets not measured at fair value through profit or loss and net gains and losses from changes line item in the statutory income statement. Additionally, includes a release of EUR 27 million mainly corresponding to the results by commitments and contingent risks includes in the line of the statutory income statement of provisions or reversal of provisions.
F.Other gains (losses) and provisions includes the following line items in the statutory income statement, which are presented net for internal reporting and management reporting purposes: Provisions or reversal of provisions except for a release of EUR 27 million mainly corresponding to results from commitments and contingent risks; Impairment of investments in joint ventures and associates, net; Impairment on non-financial assets, net; Gains or losses on non-financial assets, net; Negative goodwill recognized in results and Gains or losses on non-current assets held for sale not classified as discontinued operations
Explanation of adjustments:
•Mainly, payment holidays in Poland.
738
| EUR million | |||||||||||
| 2021 | |||||||||||
| Reconciliation of statutory results to underlying results | Statutory results | Adjustments | Underlying results | ||||||||
Net interest incomeA | |||||||||||
| Net fee income | |||||||||||
Gains (losses) on financial transactionsB | |||||||||||
Other operating incomeC | |||||||||||
| Total income | |||||||||||
| Administrative expenses, depreciation and amortisation | ( | ( | |||||||||
Net operating incomeD | |||||||||||
Net loan-loss provisionsE | ( | ( | |||||||||
Other gains (losses) and provisionsF | ( | ( | |||||||||
| Operating profit/(loss) before tax | |||||||||||
| Tax on profit | ( | ( | ( | ||||||||
| Adjusted profit for the year from continuing operations | |||||||||||
| Profit from discontinued operations (net) | |||||||||||
| Consolidated profit/(loss) | |||||||||||
| Non-controlling interests | ( | ( | ( | ||||||||
| Attributable profit/(loss) to the parent | |||||||||||
A.Net interest income includes the net amount of the profit and loss account items 'Interest income' and 'Interest expense'. It is presented this way because it is how it is presented to the main operational decision maker.
B.Gains (losses) on financial transactions includes the following line items in the statutory income statement, which are presented net for internal reporting and management reporting purposes: Gain or losses on financial assets and liabilities not measured at fair value through profit or loss, net, Gain or losses on financial assets and liabilities held for trading, net, Gains or losses on non-trading financial assets and liabilities mandatorily at fair value through profit or loss, net, Gain or losses on financial assets and liabilities measured at fair value through profit or loss, net, Gain or losses from hedge accounting, net and Exchange differences, net.
C.Other operating income includes the following line items in the statutory income statement, which are presented net for internal reporting and management reporting purposes: Dividend income; Income from companies accounted for using the equity method, Other operating income, Other operating expenses, Income from assets under insurance or reinsurance contracts and Expenses from liabilities under insurance or reinsurance contracts.
D.Net Operating Income is used for the Group’s internal reporting and management reporting purposes but is not a line item in the statutory consolidated income statement.
E.Net loan-loss provisions refers to Impairment or reversal of impairment at financial assets not measured at fair value through profit or loss and net gains and losses from changes line item in the statutory income statement. Additionally, includes an addition of EUR 29 million mainly corresponding to the results by commitments and contingent risks includes in the line of the statutory income statement of provisions or reversal of provisions.
F.Other gains (losses) and provisions includes the following line items in the statutory income statement, which are presented net for internal reporting and management reporting purposes: Provisions or reversal of provisions except an addition of EUR 29 million mainly corresponding to results from commitments and contingent risks; Impairment of investments in joint ventures and associates, net; Impairment on non-financial assets, net; Gains or losses on non-financial assets, net; Negative goodwill recognized in results and Gains or losses on non-current assets held for sale not classified as discontinued operations.
Explanation of adjustments:
739
53. Related parties
The parties related to the Group are deemed to include, in addition to its subsidiaries, associates and joint ventures, the Bank's key management personnel (the members of its board of directors and the executive vice presidents, together with their close family members) and the entities over which the key management personnel may exercise significant influence or control.
Following below is the balance sheet balances and amounts of the Group's income statement corresponding to operations with the parties related to it, distinguishing between associates and joint ventures, members of the Bank's board of directors, the Bank's senior management, and other related parties. Related-party transactions were made on terms equivalent to those that prevail in arm's-length transactions or, when this was not the case, the related compensation in kind was recognized.
| EUR million | ||||||||||||||
| 2023 | ||||||||||||||
| Associates and joint ventures | Members of the board of directors | Senior Management | Other related parties | |||||||||||
| Assets | ||||||||||||||
| Cash, cash balances at central banks and other deposits on demand | ||||||||||||||
| Loans and advances: credit institutions | ||||||||||||||
| Loans and advances: customers | ||||||||||||||
| Debt securities | ||||||||||||||
| Others | ||||||||||||||
| Liabilities | ||||||||||||||
| Financial liabilities: credit institutions | ||||||||||||||
| Financial liabilities: customers | ||||||||||||||
| Marketable debt securities | ||||||||||||||
| Others | ||||||||||||||
| Income statement | ||||||||||||||
| Interest income | ||||||||||||||
| Interest expense | ( | ( | ||||||||||||
| Gains/losses on financial assets and liabilities and others | ||||||||||||||
| Commission income | ||||||||||||||
| Commission expense | ( | |||||||||||||
| Other | ||||||||||||||
| Financial guarantees granted and Others | ||||||||||||||
| Loan commitments and Other commitments granted | ||||||||||||||
| Derivative financial instruments | ||||||||||||||
740
| EUR million | ||||||||||||||
| 2022 | ||||||||||||||
| Associates and joint ventures | Members of the board of directors | Senior Management | Other related parties | |||||||||||
| Assets | ||||||||||||||
| Cash, cash balances at central banks and other deposits on demand | ||||||||||||||
| Loans and advances: credit institutions | ||||||||||||||
| Loans and advances: customers | ||||||||||||||
| Debt securities | ||||||||||||||
| Others | ||||||||||||||
| Liabilities | ||||||||||||||
| Financial liabilities: credit institutions | ||||||||||||||
| Financial liabilities: customers | ||||||||||||||
| Marketable debt securities | ||||||||||||||
| Others | ||||||||||||||
| Income statement | ||||||||||||||
| Interest income | ||||||||||||||
| Interest expense | ( | |||||||||||||
| Gains/losses on financial assets and liabilities and others | ( | |||||||||||||
| Commission income | ||||||||||||||
| Commission expense | ( | |||||||||||||
| Other | ||||||||||||||
| Financial guarantees granted and Others | ||||||||||||||
| Loan commitments and Other commitments granted | ||||||||||||||
| Derivative financial instruments | ||||||||||||||
741
| EUR million | ||||||||||||||
| 2021 | ||||||||||||||
| Associates and joint ventures | Members of the board of directors | Senior Management | Other related parties | |||||||||||
| Assets | ||||||||||||||
| Cash, cash balances at central banks and other deposits on demand | ||||||||||||||
| Loans and advances: credit institutions | ||||||||||||||
| Loans and advances: customers | ||||||||||||||
| Debt securities | ||||||||||||||
| Others | ||||||||||||||
| Liabilities | ||||||||||||||
| Financial liabilities: credit institutions | ||||||||||||||
| Financial liabilities: customers | ||||||||||||||
| Marketable debt securities | ||||||||||||||
| Others | ||||||||||||||
| Income statement | ||||||||||||||
| Interest income | ||||||||||||||
| Interest expense | ( | |||||||||||||
| Gains/losses on financial assets and liabilities and others | ( | |||||||||||||
| Commission income | ||||||||||||||
| Commission expense | ( | |||||||||||||
| Other | ||||||||||||||
| Financial guarantees granted and Others | ||||||||||||||
| Loan commitments and Other commitments granted | ||||||||||||||
| Derivative financial instruments | ||||||||||||||
The remaining required information is detailed in notes 5 and 46.c.
742
54. Risk management
a) Risk principles and culture
The principles on which Grupo Santander's risk management and control are based are detailed below. They take into account regulatory requirements, best market practices and are mandatory:
1.All employees are risk managers who must understand the risks associated with their functions and not assume risks that will exceed the Group’s risk appetite or have an unknown impact.
2.Senior managers must make sure Grupo Santander keeps its risk profile within risk appetite, with consistent risk conduct, action, communications, and oversight of our risk culture.
3.Independent risk management and control functions, according to the three lines of defence model of Grupo Santander.
4.Grupo Santander takes a forward-looking, comprehensive approach towards all businesses and risk types.
5.Effective information management to identify, assess, manage and disclose risks at appropriate levels.
1. Key risk types
Grupo Santander's risks categorization ensures effective risk management, control and reporting. The risk framework distinguishes these risk types:
•Credit risk relates to financial loss arising from the default or credit quality deterioration of a customer or counterparty, to which Santander has directly provided credit or assumed a contractual obligation.
•Market risk results from changes in interest rates, exchange rates, equities, commodities and other market factors, and from their effect on profit or capital. It includes the structural risk relates to market movements or balance sheets behaviour will change the value or profit generation of assets or liabilities in the banking book.
•Liquidity risk occurs if liquid financial resources are insufficient or too costly to obtain in order to meet liabilities when they fall due.
•Capital risk is the risk that arises from the possibility of having an inadequate quantity or quality of capital to meet internal business objectives, regulatory requirements or market expectations in the area of structural risk.
Grupo Santander also takes into account, on an ongoing basis in its management of the risk function, operational (includes fraud, technological, cyber, legal and conduct risks), financial crime (includes, among others, money laundering, terrorism financing, violation of international sanctions, corruption, bribery and tax evasion), model, structural (includes risks associated with insurance and pensions), reputational and strategic risks.
Besides, environmental and climate-related risk drivers are considered as factors that could impact the existing risks in the medium-to-long-term. These elements include, on the one hand, those derived from the physical effects of climate change, generated by one-off events as well as by chronic changes in the environment and, on the other hand, those derived from the process of transition to a development model with lower emissions, including legislative, technological or behaviour of economic agents changes.
Given the nature of its operations, the Group has no environment-related liabilities, expenses, assets or contingencies of a material relevance to its consolidated equity, financial situation and results.
Most exposures in sectors potentially affected by climate change risk, according to market consensus and to the execution of our materiality assessment, are with wholesale clients, whose preliminary reviews, credit approval and credit ratings take such risk into account. Customers’ ratings determine the parameters for calculating loan loss (typically in terms of probability of default or “PD”). Thus, when climate factors are relevant, in conjunction with other elements of analysis, they have an impact on the loan loss calculations which support capital and provisions.
Additionally, Grupo Santander has participated in the various climate stress regulatory exercises carried out recently, which have been classified as learning exercises in the industry. Results showed that the Group’s coverage for potential losses would be sufficient in view of portfolio maturity over time.
Therefore, based on the best information available at the time these consolidated annual financial statements were prepared, the Group sees no additional environmental or climate change risk having a substantial impact on its equity, financial situation and results in 2023.
Still, this matter is constantly changing, and, like other banks, the Group is working on developing more methodologies to better measure potential loan loss in line with new management needs, best practice, and regulators’ and supervisors’ requirements. In particular, we monitor progress in this regard both in the prudential area (mandate of the European Banking Authority in article 501c of Regulation (EU) 575/2013), and that resulting from the plan for the second phase of the post-review implementation of IAS 9 by the IASB regarding the calculation of expected losses, planned during 2024.
743
2. Risk and compliance governance
Grupo Santander robust risk and compliance governance structure allows us to conduct effective oversight in line with our risk appetite. It stands on three lines of defence, a structure of committees and strong Group-subsidiary relations, guided by our risk culture, Risk Pro.
2.1 Lines of defence
Grupo Santander model of three lines of defence effectively manages and controls risks:
–First line: formed by business and support areas that take or originate risks are primarily responsible for managing them. The first line detects, measures, controls, monitors and reports on the risks it originates according to internal risk management policies, models and procedures. Risk management must be consistent with the approved risk appetite and related limits.
–Second line: formed by risk and compliance & conduct functions, independently oversees and challenges risk management at the first line of defence. Its duties include ensuring that risks will be managed according to the risk appetite approved by senior management and strengthening our risk culture across the Group.
–Third line: internal audit function, is fully independent to give the board and senior managers assurance of high-quality and efficient risk governance and management to preserve our value, solvency and reputation.
Risk, compliance & conduct, and internal audit are sufficiently separate and autonomous functions, with direct access to the board and its committees.
2.2 Risk committee structure
The board of directors has final oversight of risk management and compliance promoting a sound risk culture and reviewing and approving risk appetite and frameworks, with support from its risk, regulation and compliance committee and its executive committee. The Group's risk governance keeps risk control and risk-taking areas separate.
The Group chief risk officer (Group CRO), who leads the application and execution of risk strategy and promotes proper risk culture, is in charge of overseeing all risks and challenging and advising business lines on risk management.
The Group chief compliance officer (Group CCO), who handles compliance risk and leads the application and execution of the compliance and conduct risk strategy and provides the Group CRO with a complete overview on the situation of risks being monitored.
The Group CRO and the Group CCO report directly to both the risk supervision, regulation and compliance committee and the board of directors.
The executive risk, risk control and compliance and conduct committees are executive committees with powers delegated from the board.
Furthermore, risk functions have forums and regular meetings to manage and control the risks within their purview. Executive committees also delegate some duties to subordinate forums.
Their responsibilities include:
•Inform the Group CRO, the Group CCO, the risk control committee and the compliance and conduct committee if risks are being managed within risk appetite;
•Regularly monitor each key risk type; and
•Overseeing measures to meet supervisors and auditors' expectations.
Besides, Grupo Santander, in order to establish an adequate control environment for the management of each risk types, the Risk and Compliance and Conduct functions have effective internal regulation to create the right environment to manage and control all risks.
Grupo Santander can establish additional governance measures for special situations, as it has done with the covid crisis, the war in Ukraine, the uncertainty caused by the collapse of several regional banks in the US and Credit Suisse, and the current geopolitical situation. We have upgraded the monitoring of all risks, with special attention to the main macroeconomic indicators, liquidity, vulnerable sectors and clients, cybersecurity reinforcement, among other areas. The special situations forums we have activated are enabling us to cope with the geopolitical and macroeconomic environment in a resilient manner.
2.3 The Group's relationship with subsidiaries
Grupo Santander subsidiaries have a model for managing risk, compliance and conduct that is consistent with the frameworks approved by the group’s board of directors, which they adhere to through their own boards and can only adapt to higher standards according to local law and regulation.
Furthermore, the Group's aggregate oversight area advises and validates subsidiaries on internal regulation and operations. This reinforces a common risk management model across Grupo Santander.
The risk and compliance functions will continue to support global businesses and control at a global and local level. In 2023, Grupo Santander continued to build on our group-subsidiary relations model by leveraging our global scale to uncover synergy under a common operating model and platform. The model promotes process simplification and more enhanced control to help grow the business.
The Group CRO, the Group CCO and regional heads of risk are involved in appointing, setting objectives for, reviewing and compensating their country-unit counterparts to promote proper risk management.
Each local CRO/CCO interacts regularly with its regional risk leader and with the Group CRO and the Group CCO, through periodic follow-up meetings, either business or country. There are also meetings between local and global risk and compliance functions to discuss issues specific to each function.
744
Local and global risk and compliance areas also meet to address special matters. Country and regional units work closely to effectively strengthen group-subsidiary relations through these common initiatives:
•Restructuring based on subsidiary benchmarks, strategic vision, and advanced risk management infrastructures and practices.
•Exchange of best practices that will strengthen processes, drive innovation and result in a quantitative impact.
•Search for talent in risk and compliance teams with internal mobility through the global risk talent programme and strong succession plans.
3. Management processes and tools
Grupo Santander has these effective risk management processes and tools:
3.1 Risk appetite and structure of limits
Risk appetite is the aggregate level and types of risk that Grupo Santander deems prudent for our business strategy, even in unforeseen circumstances. In Grupo Santander, these principles influence risk appetite:
•Risk appetite is part of the board's duties. It prepares the risk appetite statement (RAS) for the whole Group every year. In a cascading down process, each subsidiary's board also sets its own risk appetite.
•Comprehensiveness and forward-looking approach. Our appetite includes of all material risks that Santander are exposed to and defines our target risk profile for the current and medium term with a forward-looking view considering stress scenarios.
•Common standards and embedding in the day-to-day risk management. The Group shares the same risk appetite model, which sets common requirements for processes, metrics, governance bodies, controls and standards.. It also ensures an effective and traceable embedding of our appetite into more granular management policies and limits across our subsidiaries.
•Continuous adaptation to market best practices, regulatory requirements and supervisors’ expectations.
•Aligning with business plans and strategy. The risk appetite is a key point of reference for strategic and business planning. Grupo Santander verifies that the three-year strategic plans, the annual budget and capital and liquidity planning are within the limits set in the RAS before Santander approves them.
Grupo Santander's risk appetite and business model rest on the following elements:
•A medium-low, predictable target risk profile, centred on retail and commercial banking, internationally diversified operations and a strong market share;
•Stable, recurrent earnings and shareholder remuneration, sustained by a sound base of capital, liquidity and sources of funding;
•Autonomous subsidiaries that are self-sufficient in terms of capital and liquidity to ensure their risk profiles won't compromise the Group’s solvency;
•An independent Risk function and a senior management actively engaged in supporting a robust control environment and risk culture; and
•A conduct model that protects our customers and our Simple, Personal and Fair culture.
The risk appetite is expressed through qualitative statements and limits on metrics representative of the bank’s risk profile at present and under stress. Those metrics cover all risk types according to our corporate risk framework. Grupo Santander articulates them in five axes that provide the Bank with a holistic view of all risks it incurs in the development of its business model. These five axes are applicable to all Santander's key risk types, and comprise:
•P&L volatility: Control of P&L volatility of business plan under baseline and stressed conditions (aligned with ICAAP stress test).
•Solvency: Control of capital ratios under baseline and stressed scenarios (aligned with ICAAP).
•Liquidity: Control of liquidity ratios under base and stress scenarios (aligned with ILAAP).
•Concentration: Control of credit concentration on top clients, portfolios and industries.
•Non financial: Control on non financial risks aimed to minimize events which could lead to financial loss, operative, technological, legal and regulatory breaches, conduct issues or reputational damage.
b) Credit risk
1. Introduction to the credit risk treatment
Credit risk is the risk of financial loss due to the failure to pay or impaired credit of a customer or counterparty Grupo Santander has financed or maintains a contractual obligation with. It includes counterparty risk, country risk and sovereign risk. It is our most significant risk in terms of exposure and capital consumption.
Credit risk management
Grupo Santander takes a holistic view of the credit risk cycle, including the transaction, the customer and the portfolio, in order to identify, analyse, control and decide on credit risk.
Credit risk identification facilitates active and effective portfolio management and control. Grupo Santander classify external and internal risk in each business to adopt any corrective or mitigating measures through:
1.1. Planning
Grupo Santander´s planning helps to set business targets and draw up action plans within our risk appetite statement.
745
Strategic commercial plans (SCP) are a management and control tool the business and risk areas prepare for Grupo Santander's credit portfolios. They determine commercial strategies, risk policies, resources and infrastructure, ensuring a holistic view of the portfolios.
They provide managers with an updated view of portfolio credit quality to measure credit risk, run internal controls to regularly monitor credit strategy detect significant risk deviation and potential impacts, and take corrective action.
They are suited to the Grupo Santander's risk appetite and subsidiaries’ capital targets, having been reviewed and pre-approved by senior managers before Group management revises and validates them.
1.2. Risk assessment and credit rating
Risk approval generally depends on the applicant’s ability to repay the debt, regardless of any collateral or personal guarantees the Bank requires. Grupo Santander reviews their regular sources of income, including funds and net cash flows from any businesses.
Grupo Santander monitors credit rating drivers to calibrate the decisions and ratings that Group credit quality assessment models determine. Risk management uses these ratings for many things like applying approval limits, pre-approvals, monitoring risk, and policies on pricing credit.
Grupo Santander then uses rating models to measure ability to pay. Depending on each segment, credit rating drivers can be:
•Rating: from mathematical algorithms that have a quantitative model based on balance sheet ratios or macroeconomic variables, and a qualitative module supplemented by the credit analyst’s expert judgement. It is used for SCIB, corporate, institutional and SME segments (with individualised treatment).
•Scoring: system of automatic evaluation of loan applications. It automatically assigns customers an individual score retail on which the subsequent decision is based. It is used for SME segments without an assigned analyst.
Grupo Santander's parameter estimation models, based on econometric models of past defaults and losses, calculate economic and regulatory capital as well as IFRS 9 provisions for each customer portfolio.
Grupo Santander regularly monitors and evaluates models' suitability, predictive capacity, performance, granularity, and compliance with policy, among other factors. Grupo Santander reviews ratings with the latest financial and other relevant information to assess credit risk due to depreciation caused by customers’ lower creditworthiness and manage credit portfolios according to the risk appetite and profile target set out in SCPs, with exposure limits adjusted to an acceptable level for each portfolio and counterparty and for new loan originations.
Grupo Santander uses SCPs to manage credit portfolios, defining limits for each of them and for new originations, in line with the Group´s credit risk appetite and its target risk profile. Transposing the risk appetite to portfolio management strengthens controls over our credit portfolios.
Grupo Santander´s limits, pre-classifications and pre-approvals processes, which are highly automated and digitalized, determine the risk Grupo Santander can assume with each customer. Limits are approved by the executive risk committee (or delegated committees) and should reflect a transaction’s expected risk-return. Santander also uses risk-based pricing tools to make sure portfolio growth is sustainable.
Grupo Santander applies various limits models to each segment:
•Large corporate groups are subject to a pre-classification model based on a system for measuring and monitoring economic capital. Pre-classification models express the level of risk Grupo Santander is willing to assume in transactions with customers/groups.
•Corporates and institutions that meet certain requirements (strong relationships, rating, etc.) are subject to a simpler pre-classification model that sets a recommended risk level for each customer. Transactions above certain limits or with special characteristics could require approval from a senior credit analyst or a committee.
Transactions with large corporates, corporates and institutions above certain limits or with special characteristics could require approval from a senior credit analyst or a committee.
•For individual customers and SMEs with low turnover, Grupo Santander manages large volumes of credit transactions with automatic decision models to classify customers and transactions.
1.3. Scenario analysis
Grupo Santander´s scenario analyses determine the potential risks in its credit portfolios and provide a better understanding of our portfolios' performance under various macroeconomic conditions. They allow us to anticipate management strategies that will avoid future deviations from defined plans and targets. They simulate the impact of alternative scenarios in portfolios’ credit parameters (PD, LGD) and expected credit losses. Grupo Santander compares findings with portfolios’ credit profile indicators to find the right measures for managers to take. Credit risk management of portfolios and SCPs incorporate scenario analyses.
1.4. Monitoring
Regularly monitoring business performance and comparing it to pre-defined plans is key to our management of risk. Grupo Santander's holistic monitoring of customers helps detect impacts on risk performance and credit quality early.
The monitoring process considers projections on the performance of the operations and their characteristics, in addition to any variation in their classification. Anticipation and preventive monitoring uses transactional data sources and advanced analytics (early warning engine) which determines specific actions at the client level, based on the assigned monitoring classification.
746
Monitoring is performed by local and global risk teams and is based on customer segmentation:
•For SCIB, monitoring is initially a function of business managers and risk analysts which provide an up-to-date view of customers’ credit quality to predict a potential customer's deterioration.
•For commercial banking, institutions and SMEs assigned a credit analyst, Grupo Santander tracks customers requiring closer monitoring and review their ratings based on relevant indicators.
•Monitoring of individual customers, businesses and smaller SMEs follows a system of automatic alerts to detect shifts in portfolios’ performance.
Monitoring uses the Santander Customer Assessment Note (SCAN) tool. It helps set individual monitoring levels and frequencies, policies, and actions for customers based on credit quality and particular circumstances. In addition to monitoring customer credit quality, Grupo Santander defines control procedures to analyse portfolios and performance, as well as any deviations from planning or approved alert levels.
1.5. Credit risk mitigation techniques
Grupo Santander generally approves risk according to a borrower’s ability to make due payment, regardless of any additional collateral or personal guarantees Santander may require to modulate exposure.
To determine ability to pay, the Group analyse funds or cash flows from businesses or other regular income, not including guarantors or loan collateral which are always considered as a secondary means of recourse.
In general, guarantees are to reinforce a credit transaction and mitigate a loss if the borrower defaults. Our techniques to mitigate credit risk cover various types of customer and product. Some are for specific transactions (e.g. property) or a series of transactions (e.g. derivatives netting and collateral). Santander groups them by personal guarantees (with a solvent guarantor), collateral (mainly in primary residence mortgages) and hedges with credit derivatives.
The correct acceptance of these mitigation techniques is established by ensuring their legal enforceability in all jurisdictions. The entire process is subject to internal control and effective monitoring of the valuation of the guarantees, especially mortgages.
1.6. Collections & recoveries management
Collections & recoveries, an important area in risk management, develops a global management strategy based on local economic conditions, business models and other recovery-related particulars, with a full approach and general action lines for our subsidiaries. Recovery management follows regulatory requirements set out in the EBA Guidelines on the management of non-performing and forborne exposures.
For effective and efficient recoveries management, the area segments customers based on certain aspects, using new digital channels that help create value in Collections & Recoveries. It follows hi-tech, digital procedures to handle large groups of similar customer profiles and products; but it also adapts management for customers who need an assigned manager and tailored approach.
Collections & Recoveries splits recoveries into four phases: arrears/early delinquency, default, write-offs and foreclosed assets. To recover debt, the Group always seeks alternatives to court action, like forbearance and other arrears management techniques.
Grupo Santander also reviews debt instruments individually and treat them as write-offs (even when they’re not past due) if the Group sees signs of irreversible impairment that suggest recovery to be remote. Though this may lead us to cancel all or part of the gross carrying amount, the Group never interrupt negotiations and legal proceedings to recover debt.
In markets where the real estate risk exposure is high, Grupo Santander can take action to quickly dispose of assets, like selling off portfolios or foreclosed assets with efficient sales instruments to recover as many on-balance-sheet assets as possible.
747
2. Main aggregates and variations
Following are the main aggregates relating to credit risk from our activities with customers:
Main credit risk performance metrics from activity with customersA | |||||||||||||||||||||||||||||||||||
| December data | |||||||||||||||||||||||||||||||||||
Credit risk with customers (EUR million)B | Credit impaired loans (EUR million) | NPL ratio (%) | |||||||||||||||||||||||||||||||||
| 2023 | 2022 | 2021 | 2023 | 2022 | 2021 | 2023 | 2022 | 2021 | |||||||||||||||||||||||||||
| Europe | % | % | % | ||||||||||||||||||||||||||||||||
| Spain | % | % | % | ||||||||||||||||||||||||||||||||
| UK | % | % | % | ||||||||||||||||||||||||||||||||
| Portugal | % | % | % | ||||||||||||||||||||||||||||||||
| Poland | % | % | % | ||||||||||||||||||||||||||||||||
| North America | % | % | % | ||||||||||||||||||||||||||||||||
| US | % | % | % | ||||||||||||||||||||||||||||||||
| Mexico | % | % | % | ||||||||||||||||||||||||||||||||
| South America | % | % | % | ||||||||||||||||||||||||||||||||
| Brazil | % | % | % | ||||||||||||||||||||||||||||||||
| Chile | % | % | % | ||||||||||||||||||||||||||||||||
| Argentina | % | % | % | ||||||||||||||||||||||||||||||||
| Digital Consumer Bank | % | % | % | ||||||||||||||||||||||||||||||||
| Corporate Centre | % | % | % | ||||||||||||||||||||||||||||||||
| Total Group | % | % | % | ||||||||||||||||||||||||||||||||
A.Management perimeter according to the reported segments
B.Includes gross lending to customers, guarantees and documentary credits.
Key figures by geographic region are described below at 31 December 2023:
•Europe: The NPL ratio fell 5 bps to 2.32 % from 2022 because impaired loans decreased significantly in the UK, and in Spain and Portugal due to the NPL portfolio sales.
•North America: The NPL ratio increased 106 bps to 4.09 % from 2022, mainly due to increases at SC USA (normalization of the portfolio) and in Mexico (portfolio growth in higher return-risk segment).
•South America: The NPL ratio decreased 48 bp from 2022 to 5.72 %,due to the portfolio growth in Brazil and the performance of the Chilean portfolio.
•Digital Consumer Bank: The NPL ratio increased 6 bps to 2.12 %, due to a slight increase in impaired loans, not offset by portfolio growth.
In the case of delinquent operations with ICO guarantee, the transfer of the overdue guaranteed amounts will take place as the guarantee is executed, regardless of whether the guarantor is subrogated to the right to receive said amounts, according to the regulation of these guarantees. The derecognition of the transferred guaranteed amounts will entail the recognition, at its fair value, of a collection right against the guarantor.
In addition, the Group is following the measures launched by the governments of Spain, United Kingdom, Portugal and Poland, aimed at relieving the mortgage payment burden for vulnerable customers after the increase in interest rates.
Information on the estimation of impairment losses
The calculation of credit risk provisions is performed at financial asset level, estimating potential credit losses through the difference between the expected cash flows and the contractual cash flows, ensuring that the results are adequate considering the status of the transaction, economic conditions and available forward-looking information.
The IFRS 9 impairment model applies to financial assets valued at amortized cost; debt instruments valued at fair value with changes in other comprehensive income; leasing receivables; and commitments and guarantees not valued at fair value.
The portfolio of financial instruments subject to IFRS 9 has three credit risk categories (or stages) according to the status of each instrument in relation to its level of credit risk:
•Stage 1: financial instruments with no significant increase in risk since initial recognition – the impairment provision reflects expected credit losses from defaults over the twelve months from the reporting date.
•Stage 2: financial instruments with a significant credit risk increase since initial recognition but no materialized impairment event – the impairment provision reflects expected losses from defaults over the financial instrument’s residual life.
748
•Stage 3: financial instruments with true signs of impairment as a result of one or more events resulting in a loss – the impairment provision reflects expected losses for credit risk over the instrument’s expected residual life.
The classification of financial instrument in the IFRS 9 stages is carried out in accordance with the guidelines through the risk management policies of the subsidiaries, which are consistent with the Group's policies.
Estimation of expected loss
Grupo Santander calculates impairment losses using parameters (mainly EAD, PD, LGD and discount rate) based on internal models, the stage in which each financial asset is classified, and regulatory and management expertise. Far from being a simple adaptation, Santander defined and validated them according to specific requirements of IFRS 9 and other guidelines by regulators, supervisors and other international organizations (EBA, NCAs, BIS, GPPC, etc.), such as forward-looking information, point-in-time (PiT) vision, multiple scenarios, calculation of losses for the entire life of the transaction through lifetime PD, etc.
Determination of significant increase in credit risk
In order to determine the classification in stage 2, the Group assesses whether there has been a significant increase in credit risk (SICR) since the initial recognition of the transactions, considering a series of common principles throughout the Group that guarantee that all financial instruments are subject to this assessment, which considers the particularities of each portfolio and type of product on the basis of various quantitative and qualitative indicators. Furthermore, transactions are subject to the expert judgement of the analysts, who set the thresholds under an effective integration in management and implemented according to the approved governance.
The criteria thresholds used by the Group are based on a series of principles, and develop a set of techniques. The principles are as follows:
•Universality: all financial instruments subject to a credit rating must be assessed for their possible SICR.
•Proportionality: the definition of the SICR must take into account the particularities of each portfolio.
•Materiality: its implementation must be also consistent with the relevance of each portfolio so as not to incur in unnecessary costs or efforts.
•Holistic vision: the approach selected must be a combination of the most relevant credit risk aspects (e.g. quantitative and qualitative).
•Application of IFRS 9: the approach must take into consideration IFRS 9 characteristics, focusing on a comparison with credit risk at initial recognition, as well as considering forward-looking information.
•Risk management integration: the criteria must be consistent with those metrics considered in the day-to-day risk management.
•Documentation: Appropriate documentation must be prepared.
The techniques are summarised below:
•Stability of stage 2: in the absence of significant changes in the portfolios credit quality, the volume of assets in stage 2 should maintain a certain stability as a whole.
•Economic reasonableness: at transaction level, stage 2 is expected to be a transitional rating for exposures that could eventually move to a deteriorating credit status at some point or stage 3, as well as for exposures that have suffered credit deterioration and whose credit quality is improving and returns to stage 1.
•Predictive power: it is expected that the SICR definition avoids, as far as possible, direct migrations from stage 1 to stage 3 without having been previously classified in stage 2.
•Time in stage 2: it is expected that the exposures do not remain categorized as stage 2 for an excessive time.
The application of the aforementioned techniques, conclude in the setting of one or several thresholds for each portfolio in each geography. Likewise, these thresholds are subject to a regular review by means of calibration tests, which may entail updating the thresholds types or their values.
Identifying a significant increase in credit risk: when classifying financial instruments under stage 2, Santander considers:
•Quantitative criteria: Grupo Santander reviews and quantifies changes in the risk of default during their expected life based on their credit risk level on initial recognition.
In order to consider significant changes when financial instruments are classified in stage 2, each subsidiary has defined the quantitative thresholds of its portfolios in accordance with the Group's guidelines, ensuring a consistent interpretation in all our geographies. These thresholds can be expressed as an absolute or relative increase in the probability of default.
Within the aforementioned quantitative thresholds we consider two types: we understand a relative threshold as one that compares the current credit quality with the credit quality at the time of granting the operation in percentage terms of variation. For its part, an absolute threshold compares both references in total terms, calculating the difference between them. These absolute/relative concepts are used homogeneously (with different values) in all geographies. The calibration of these two thresholds will depend on the type of portfolio and characteristics such as the starting point of the average credit quality of the portfolio.
•Qualitative criteria: Several indicators aligned with ordinary credit risk management indicators (e.g. past due for over 30 days, forbearance, etc.). Each subsidiary defined these criteria for its portfolios. Santander supplements these qualitative criteria with expert opinions.
When the presumption of a significant deterioration of credit risk is removed, due to a sufficient improvement of the credit quality, the obligor can be re-classified to Stage 1, without any probationary period in Stage 2.
749
•Definition of default: Santander incorporated the new definition to provisions calculation according to the EBA’s guidelines; the Group is also considering applying it to prudential framework. In addition, the default definition and stage 3 have been aligned.
This definition considers the following criteria to classify exposures as stage 3: financial instruments with one or more payments more than 90 consecutive days past due, representing at least 1% of the client's total exposure or the identification of other criteria demonstrating, even in the absence of defaults, that it is unlikely that the counterparty is unlikely to meet all of its financial obligations.
Grupo Santander applies the default criteria to all exposures of the impaired client. Where an obligor belongs to a group, the default criteria may also be applied to all exposures of the Group.
The default classification is maintained during the 3-month test period following the disappearance of all default indicators described above, and this period is extended to one year for forbearances that have been classified as default.
•Expected life of financial instruments: Santander estimates the expected life of financial instruments according to their contractual terms (e.g. prepayments, duration, purchase options, etc.).
The contractual period (including extension options) is the maximum time frame for measuring the expected credit loss. If financial instruments have an undefined maturity period and available balance (e.g. credit cards), Santander estimates its expected life based on the total exposure period and effective management practices to mitigate exposure.
1.Forward-looking vision
To estimate expected losses, Grupo Santander requires a great deal of expert analysis as well as past, present and future data. Santander quantifies expected losses from credit events using an unbiased, weighted consideration of up to five future scenarios that could affect our ability to collect contractual cash flows. These scenarios take into account the time value of money, the relevant information available about past events and current conditions, and projections of macroeconomic factors that are considered important to estimate this amount (e.g. GDP, house prices, rate of unemployment, among others).
Santander uses forward-looking information in internal management and regulatory processes under several scenarios. The Group's guidelines and governance ensure synergy and consistency between these different processes.
2. Additional elements
Additional elements will be required when necessary because they have not been captured under the two previous elements. This has included, among others, the analysis of sectors most affected if their impacts are not sufficiently captured by the macroeconomic scenarios. Also collective analysis techniques, when the potential impairment in a group of clients cannot be identified individually.
With the elements indicated above, Grupo Santander has evaluated in each of the geographical areas the evolution of the credit quality of its customers, for the purposes of their classification in Grupo Santander financial statements.
Management overlays
During fiscal year 2023, the Group has significantly reduced its amount of overlays, homogeneously among its different concepts, mainly due to adjustments associated with uncertainties resulting from the war in Ukraine and the current macroeconomic context, as said adjustments were included in the expected loss models or are no longer required. The amount of overlays at the end of the 2023 financial year is not material.
Exposure and impaired losses
Then, considering the most relevant units of the Group (United Kingdom, Spain, United States, Brazil, also Chile, Mexico, Portugal, Poland, Argentina and Santander Consumer Finance), which represent approximately 96 % of the total Group's provisions. The table below shows the impairment losses associated with each stage as of 31 December 2023, 2022 and 2021. In addition, depending on the transactions credit quality, the exposure is divided into four categories according to Standard & Poor's rating scale:
| Exposure and impairment losses by stage | ||||||||||||||
| EUR million | ||||||||||||||
| 2023 | ||||||||||||||
Credit quality A | Stage 1 | Stage 2 | Stage 3 | Total | ||||||||||
| From AAA to AA- | ||||||||||||||
| From A+ to BB | ||||||||||||||
| From BB- to B- | ||||||||||||||
| CCC and below | ||||||||||||||
Total exposure B | ||||||||||||||
Impairment lossesC | ||||||||||||||
| Exposure and impairment losses by stage | ||||||||||||||
| EUR million | ||||||||||||||
| 2022 | ||||||||||||||
Credit quality A | Stage 1 | Stage 2 | Stage 3 | Total | ||||||||||
| From AAA to AA- | ||||||||||||||
| From A+ to BB | ||||||||||||||
| From BB- to B- | ||||||||||||||
| CCC and below | ||||||||||||||
Total exposureB | ||||||||||||||
Impairment lossesC | ||||||||||||||
750
| Exposure and impairment losses by stage | ||||||||||||||
| EUR million | ||||||||||||||
| 2021 | ||||||||||||||
Credit quality A | Stage 1 | Stage 2 | Stage 3 | Total | ||||||||||
| From AAA to AA- | ||||||||||||||
| From A+ to BB | ||||||||||||||
| From BB- to B- | ||||||||||||||
| CCC and below | ||||||||||||||
Total exposure B | ||||||||||||||
Impairment lossesC | ||||||||||||||
A.Detail of credit quality ratings calculated for Group management purposes.
B.Total exposure includes loan balances (drawn amounts) and off balance (letters of credit + guarantees) and excludes REPOs, FV portfolio, trading portfolio and undrawn commitments.
The remaining units that form the totality of the Group exposure, contributed EUR 68,788 million in stage 1; EUR 1,504 million in stage 2, and EUR 658 million in stage 3 (in 2022 EUR 123,796 million in stage 1; EUR 2,902 million in stage 2, and EUR 2,064 million in stage 3. In 2021, EUR 102,631 million in stage 1; EUR 1,870 million in stage 2, and EUR 2,522 million in stage 3), and impairment losses of EUR 199 million in stage 1; EUR 73 million for stage 2, and EUR 161 million in stage 3 (in 2022, EUR 147 million, EUR 123 million and EUR 294 million and in 2021, EUR 408 million, EUR 322 million and EUR 841 million in stage 1, stage 2 and stage 3, respectively).
The remaining exposure, including all financial instruments not included before, amounts to EUR 598,385 million (EUR 538,364 million in 2022 and EUR 349,228 million in 2021), and it includes all undrawn authorized lines (loan commitments).
As of 31 December 2023, the Group had EUR 743 million net of provisions (EUR 322 million and EUR 420 million at 31 December 2022 and 2021, respectively) of purchased credit-impaired assets, which relate mainly to the business combinations carried out by the Group.
Regarding the evolution of credit risk provisions, the Group, in collaboration with the main geographical areas, monitors them by carrying out sensitivity analyses considering changes in macroeconomic scenarios and main variables that have an impact on the financial assets distribution in the different stages and calculating credit risk provisions.
Additionally, based on consistent macroeconomic scenarios, the Group also performs stress tests and sensitivity analysis in a regular basis, such as ICAAP, strategic plans, budgets and recovery and resolution plans. In this sense, a prospective view of the sensitivity of each of the Group’s loan portfolio is created in relation to the possible deviation from the base scenario, considering both the macroeconomic developments in different scenarios and the three year evolution of the business. These tests include potentially adverse and favourable scenarios.
3.Detail of the main geographical areas
Following is the risk information related to the most relevant geographies in exposure and credit risk allowances.
This information includes sensitivity analysis, consisting on simulations of +/-100 bp in the main macroeconomic variables. A set of specific and complete scenarios is used in each geography, where different shocks that affect both the reference variable as well as the rest of the parameters is simulated. These shocks collect mainly the most relevant risks and may be originated by productivity, tax, wages or exchange and interest rates factors.
Sensitivity is measured as the average variation on expected loss corresponding to the aforementioned movement of +/-100 bp. Following a conservative approach, the negative movements take into account one additional standard deviation in order to reflect the potential higher variability of losses.
3.1. United Kingdom
Portfolio overview
Credit risk with customers in the UK (excluding Santander Consumer UK and Santander London Branch) decreased year-on-year by 2.4 % to EUR 247,360 million. This credit risk represents 22 % of Santander’s loan portfolio is in the UK.
At 1.42 %, the NPL ratio increased 21 bps in comparison to the year end of 2022, due to the increase in the default stock in companies and individuals, as well as the reduction in the total portfolio.
Mortgage portfolio
Because of its size, Grupo Santander closely monitor Santander UK’s mortgage portfolio for the entity itself and the Group.
As of 31 December 2023, the mortgage portfolio of Santander UK decreased by 5.7 % in local currency to EUR 200,173 million. It comprises residential mortgages granted to new and existing customers which are first lien mortgages. There are no second or more liens on mortgaged properties.
Originations fell year on year in 2023 compared to 2022, a sign of a less active housing market on the back of interest rate hikes and a squeeze on households’ purchasing power. House prices continued to fall in 2023 as they had started to in late 2022.
Higher instalments are being mitigated, in part, by our conservative assessments of customers’ ability to pay when approving them for a mortgage. We implemented measures to help customers who were current on their payments, including those under the UK Government’s “Mortgage Carter” in June.
Under Santander's risk management principles, a property must be appraised independently before we can approve a new mortgage. In line with market practices and the law, we get updated values of properties used as mortgage collateral from an independent agency's automatic appraisal system.
751
Santander UK's wide range of mortgages include:
•Interest-only loans (22 %): Customers pay interest every month and repay the principal at maturity. These mortgages, which are common in the UK, require borrowers to have an appropriate repayment vehicle, such as a pension plan or an investment fund. To mitigate inherent risk, Santander UK has restrictive approval requirements, such a maximum loan-to-value (LTV) ratio of 50 % and an assessment of the ability to pay both interest and capital.
•Flexible loans (3 %): Loan agreements allow borrowers to modify monthly payments or draw down additional funds up to a set limit under various conditions.
•Buy-to-let (9 %): Buy-to-let mortgages account for a small portion of the total portfolio and are subject to strict risk approval policies.
Despite the challenging economic environment, the NPL ratio reflects the strength of the mortgage portfolio, which was stable at 1.16 % at the end of December 2023 (+18 bps YoY).
At 31 December 2023, 85 % of the mortgage portfolio had an LTV lower than 70 %.
Information on the estimation of impairment losses
The detail of Santander's UK exposure and impairment losses associated with each of the stages at 31 December, 2023, 2022 and 2021, is shown below.
In addition, the exposure is divided in four tranches of the Standard & Poor's rating scale, according to their current credit quality:
| Exposure and impairment losses by stage | ||||||||||||||
| EUR million | ||||||||||||||
| 2023 | ||||||||||||||
Credit qualityA | Stage 1 | Stage 2 | Stage 3 | Total | ||||||||||
| From AAA to AA- | ||||||||||||||
| From A+ to BB | ||||||||||||||
| From BB- to B- | ||||||||||||||
| CCC and below | ||||||||||||||
Total exposureB | ||||||||||||||
Impairment lossesC | ||||||||||||||
| Exposure and impairment losses by stage | ||||||||||||||
| EUR million | ||||||||||||||
| 2022 | ||||||||||||||
Credit quality A | Stage 1 | Stage 2 | Stage 3 | Total | ||||||||||
| From AAA to AA- | ||||||||||||||
| From A+ to BB | ||||||||||||||
| From BB- to B- | ||||||||||||||
| CCC and below | ||||||||||||||
Total exposure B | ||||||||||||||
Impairment lossesC | ||||||||||||||
| Exposure and impairment losses by stage | ||||||||||||||
| EUR million | ||||||||||||||
| 2021 | ||||||||||||||
Credit quality A | Stage 1 | Stage 2 | Stage 3 | Total | ||||||||||
| From AAA to AA- | ||||||||||||||
| From A+ to BB | ||||||||||||||
| From BB- to B- | ||||||||||||||
| CCC and below | ||||||||||||||
Total exposure B | ||||||||||||||
Impairment lossesC | ||||||||||||||
A.Detail of credit quality ratings calculated for Group management purposes.
B.Total exposure includes loan balances (drawn amounts) and off balance (letters of credit + guarantees) and excludes REPOs, FV portfolio, trading portfolio and undrawn commitments.
C.Includes provisions for undrawn authorized lines (loan commitments).
752
For the estimation of expected losses, prospective information is taken into account. Specifically, Santander UK considers five macroeconomic scenarios, which are updated periodically. The evolution forecasted in 2023 for the next five years of the main macroeconomic indicators used by Santander UK to estimate expected losses is presented below:
| 2024 - 2028 | |||||||||||||||||
| Variables | Pessimistic scenario 3 | Pessimistic scenario 2 | Pessimistic scenario 1 | Base scenario | Optimistic scenario 1 | ||||||||||||
| Interest rate | % | % | % | % | % | ||||||||||||
| Unemployment rate | % | % | % | % | % | ||||||||||||
| Housing price change | - | % | - | % | - | % | % | % | |||||||||
| GDP growth | - | % | % | % | % | % | |||||||||||
Each of the macroeconomic scenarios is associated with a given weight. In terms of allocation, Santander UK associates the highest weighting to the base scenario, while it associates the lowest weightings to the most extreme or severe scenarios. In addition, at 31 December 2023, 2022 and 2021, the weights used by Santander UK reflect the future prospects of the British economy in relation to its current political and economic position so that higher weights are assigned for negative scenarios:
| 2023 | 2022 | 2021 | |||||||||
| Pessimistic scenario 3 | % | % | % | ||||||||
| Pessimistic scenario 2 | % | % | % | ||||||||
| Pessimistic scenario 1 | % | % | % | ||||||||
| Base scenario | % | % | % | ||||||||
| Optimistic scenario 1 | % | % | % | ||||||||
The sensitivity analysis of the main portfolios expected loss to variations of +/-100 bp for the macroeconomic variables used in the construction of the scenarios, as of December 2023, is as follows:
| Change in Provision | ||||||||
| Mortgages | Corporates | |||||||
| GDP Growth | ||||||||
| -100 bp | % | % | ||||||
| 100 bp | - | % | - | % | ||||
| Housing price change | ||||||||
| -100 bp | % | % | ||||||
| 100 bp | - | % | - | % | ||||
| Unemployment rate | ||||||||
| -100 bp | - | % | - | % | ||||
| 100 bp | % | % | ||||||
With regards to the determination of classification in stage 2, the quantitative criteria applied by Santander UK are based on identifying whether any increase in PD for the expected life of the transaction is greater than both an absolute and a relative threshold (the PD used in that assessment are adjusted to the transaction's remaining term and also annualised in order to facilitate that the thresholds defined cover the whole range of the transactions maturity dates). The relative threshold established is common to all portfolios and a transaction is considered to exceed this threshold when the PD for the entire life of the transaction increases by 100 % with respect to the PD at the time of initial recognition. The absolute threshold, on the other hand, is different for each portfolio depending on the characteristics of the transactions, ranging between 360 bps and 30 bps.
In addition, for each portfolio, a series of specific qualitative criteria is defined to indicate that the exposure has experienced a significant increase in credit risk, regardless of the evolution of its PD since the time of initial recognition. Santander UK, among other criteria, considers that an operation presents a significant increase in credit risk when it presents irregular positions for more than 30 days. These criteria depend on the risk management practices of each portfolio.
3.2. Spain
Portfolio overview
Santander España’s credit risk totalled EUR 278,569 million (25 %% of Grupo Santander’s total). It is appropriately diversified among products and customer segments.
The macroeconomic outlook continues to be marked by an environment of high uncertainty, both domestic and international. Economic forecasts for 2024 are being cut due to persistently high inflation, a weaker global scenario and tightening monetary conditions. The Spanish economy has been sustained largely by greater domestic demand in the face of a weaker than expected foreign sector.
753
In a context of growing economic weakness and increasing financing costs, bank credit remained weak during 2023. It decreased significantly in the mortgage portfolio due to the rise in interest rates, which has led to a decrease in demand for credit and an increase in the early amortization of the portfolio, and in the SME segment due to lower demand for financing and the progressive amortization of support and liquidity programs (financing lines of the Official Credit Institute - ICO). On the contrary, the portfolios of larger companies and consumption showed greater resilience despite the environment.
Total credit risk decreased 5 % from December 2022. The ICO loans that were granted as a result of the pandemic (EUR 25,428 million) for which the majority of the grace periods have expired, standing at EUR 18,997 million, representing approx. 7 % of Santander España total portfolio.
The credit portfolio’s NPL ratio was 3.06 %, 21 bps lower than in December 2022. This decrease was due to the good performance of the portfolio motivated by the management of specific cases and portfolio sales.
The NPL coverage ratio remained at 49 % (-2 bps year-on-year). The cost of credit remained stable at 0.62 % (+1 bps vs. December 2022).
Residential mortgage portfolio
Residential mortgages in Spain, including Santander Consumer Finance business, amounted to EUR 61,097 million in 2023 (EUR 63,688 million and EUR 62,324 million in 2022 and 2021, respectively), 99.65 % of which have a mortgage guarantee (99.55 % and 99.33 % in 2022 and 2021, respectively).
| 2023 | ||||||||
| EUR Million | Gross amount | Of which: impaired | ||||||
| Home purchase loans to families | ||||||||
| Without mortgage guarantee | ||||||||
| With mortgage guarantee | ||||||||
| 2022 | ||||||||
| EUR Million | Gross amount | Of which: impaired | ||||||
| Home purchase loans to families | ||||||||
| Without mortgage guarantee | ||||||||
| With mortgage guarantee | ||||||||
| 2021 | ||||||||
| EUR Million | Gross amount | Of which: impaired | ||||||
| Home purchase loans to families | ||||||||
| Without mortgage guarantee | ||||||||
| With mortgage guarantee | ||||||||
The mortgage portfolio for the acquisition of homes in Spain is characterised by its medium-low risk profile, which limits expectations of any potential additional impairment:
•Principal is repaid on all mortgages from the start.
•Early repayment is common so the average life of the transaction is well below that of the contract.
•High quality of collateral, concentrated almost exclusively in financing for first homes.
•The average affordability rate stood at 24 % (26 % and 27 % in 2022 and 2021, respectively).
•The 95 % of the portfolio has a LTV below 80 % calculated as total risk/latest available house appraisal.
•All customers applying for a residential mortgage are subject to a rigorous credit risk and viability assessment, analysing whether their income is sufficient to meet all repayments and will remain stable over the term of the loan.
The NPL ratio for the residential mortgages portfolio stood at 1.49 %, with a reduction of 19 bps, compared to 31 December 2022, mainly due to by portfolio sales.
Starting in mid-2022, the rise in the EURIBOR translated into increases in the instalments paid by clients with variable mortgages (approximately 75 % of the portfolio). This increase is partially mitigated by the conservative evaluation of payment capacity made at the time of admission.
754
Breakdown of the credit with mortgage guarantee to households for house acquisition, according to the percentage that the total risk represents on the amount of the latest available valuation (loan to value):
| 2023 | ||||||||||||||||||||
| Loan to value ratio | ||||||||||||||||||||
| EUR Million | Less than or equal to 40% | More than 40% and less than 60% | More than 60% and less than 80% | More than 80% and less than or equal to 100% | More than 100% | Total | ||||||||||||||
| Gross amount | ||||||||||||||||||||
| Of which impaired | ||||||||||||||||||||
In November 2022, Royal Decree-Law 19/2022 was published, which establishes a Code of Good Practices in response to the rise in interest rates on mortgage loans for primary residences and Royal Decree-Law 6/2012 of protection measures for mortgage debtors without resources. The code of good practices is focused on granting capital grace periods and extending the term of the operations. At 31 December 2023, the requests made have not been significant.
Corporate & SME financing
Credit risk with SME and corporates in commercial banking amounted to EUR 107,613 million, 4.7 % lower than in December 2022, mainly due to the fall in the portfolio of SMEs of 6.1 %. This is Santander Spain's main lending segment, accounting for 39 % of the total, compared to 35 % of CIB's portfolio, which from 2022 includes branches in Europe.
Most of the portfolio corresponds to clients who have been assigned a credit analyst, who performs continuous management of said clients during all phases of the risk cycle.
The portfolio is broadly diversified and not concentrated by sector of activity.
Santander Spain has continued to rely on its support and proximity to SMEs and the self-employed and has positioned itself as the leading entity in ICO Loans in 2023 with a share of 39 %. The majority of this financing was allocated to the ICO Companies and Entrepreneurs Lines and the ICO International Line. ICO financing represents around 35 % of the SME portfolio, and its performance is as expected thanks to our robust risk management policies.
The portfolio’s NPL ratio stood at 5.27 % in December 2023. The NPL ratio decreased by 45 bps compared to December 2022, due to a reduction in the delinquency stock in SMEs, due to the proactive management of delinquent positions with the support of portfolio sales.
Real estate activity
Santander has specialized teams that are in charge of managing real estate business production and risk areas that cover the entire life cycle of these operations.
The changes in gross property development loans to customers were as follows:
| EUR million | |||||||||||
| 2023 | 2022 | 2021 | |||||||||
| Balance at beginning of year | |||||||||||
| Foreclosed assets | ( | ( | |||||||||
| Net variation | ( | ( | |||||||||
| Written-off assets | ( | ( | ( | ||||||||
| Balance at end of year | |||||||||||
The NPL ratio of this portfolio ended the year at 3.04 % (compared with 4.04 % and 5.07 % at December 2022 and 2021, respectively) due to the decrease of non-performing assets in the troubled loan portfolio and, in particular, to the sharp reduction in lending in this segment. The table below shows the distribution of the portfolio. The coverage ratio of the real estate doubtful exposure in Spain stands at 39.19 % (35.11 % and 30.08 % in 2022 and 2021, respectively).
| 2023 | |||||||||||
| EUR Million | Gross amount | Excess of gross exposure over maximum recoverable amount of effective collateral | Specific allowance | ||||||||
| Financing for construction and property development (including land) (business in Spain) | |||||||||||
| Of which impaired | |||||||||||
| Memorandum items written-off assets | — | — | |||||||||
755
| Memorandum items: Data from the public consolidated balance sheet | |||||
| 2023 | |||||
| EUR Million | Carrying amount | ||||
| Total loans and advances to customers excluding the Public sector (business in Spain) (Book value) | |||||
| Total consolidated assets (Total business) (Book value) | |||||
| Impairment losses and credit risk allowances. Coverage for unimpaired assets (business in Spain) | |||||
At year-end, the distribution of this portfolio was as follows:
| 2023 | |||||
| EUR Million | Loans: gross amount | ||||
| 1. Without mortgage guarantee | |||||
| 2. With mortgage guarantee | |||||
| 2.1 Completed buildings | |||||
| 2.1.1 Residential | |||||
| 2.1.2 Other | |||||
| 2.2 Buildings and other constructions under construction | |||||
| 2.2.1 Residential | |||||
| 2.2.2 Other | |||||
| 2.3 Land | |||||
| 2.3.1 Developed consolidated land | |||||
| 2.3.2 Other land | |||||
| Total | |||||
Policies and strategies in place for the management of these risks
The policies in force for the management of this portfolio are periodically reviewed and approved on a regular basis by Santander's senior management.
As has already been disclosed in this section, the Group’s anticipatory management of these risks enabled it to significantly reduce its exposure, and it has a granular, geographically diversified portfolio in which the financing of second residences accounts for a very small proportion of the total.
Mortgage lending on non-urban land represents a low percentage of mortgage exposure to land, while the remainder relates to land already classified as urban or approved for development.
The significant reduction of exposure in the case of residential financing projects in which the construction work has already been completed was based on various actions. As well as the specialised marketing channels already in existence, campaigns were carried out with the support of specific teams of managers for this function who, in the case of the Santander network, were directly supervised by the recoveries business area. These campaigns, which involved the direct management of the projects with property developers and purchasers, reducing sale prices and adapting the lending conditions to the buyers’ needs, enabled loans already in force to be subrogated. These subrogations enable to diversify its risk in a business segment that displays a clearly lower non-performing loans ratio.
In the case of construction-phase projects that are experiencing difficulties of any kind, the policy adopted is to complete the construction work so as to obtain completed buildings that can be sold in the market. To achieve this aim, the projects are analysed on a case-by-case basis in order to adopt the most effective series of measures for each case (structured payments to suppliers to ensure completion of the work, specific schedules for drawing down amounts, etc.).
For the real estate business production, the admission processes are managed by specialized teams that work in direct coordination with the commercial teams, with clearly defined policies and criteria:
•Property developers with a robust solvency profile and a proven track record in the market.
•Medium-high level projects, conducting to contracted demand and significant cities.
•Strict criteria regarding the specific parameters of the transactions: exclusive financing for the construction cost, high percentages of accredited sales, principal residence financing, etc.
•Support of financing of government-subsidised housing, with accredited sales percentages.
•Restricted financing of land purchases dealt with exceptional nature.
In addition to the permanent control performed by its risk monitoring teams, the Group has a specialist technical unit that monitors and controls this portfolio with regard to the stage of completion of construction work, planning compliance and sales control, and validates and controls progress billing payments. The Group has created a set of specific tools for this function. All mortgage distributions, amounts drawn down of any kind, changes made to the grace periods, etc. are authorised on a centralised basis.
Foreclosed properties
At 31 December 2023, the net balance of these assets amounted to EUR 2,448 million (EUR 2,971 million and EUR 3,591 million at 31 December 2022 and 2021, respectively), gross amount of EUR 5,506 million (EUR 6,422 million and EUR 7,364 million at 31 December 2022 and 2021, respectively); recognised allowance of EUR 3,058 million (EUR 3,451 million and EUR 3,773 million at 31 December 2022 and 2021, respectively).
756
The following table shows the detail of the assets foreclosed by the businesses in Spain at the end of 2023:
| 2023 | ||||||||||||||
| EUR Million | Gross carrying amount | Valuation adjustments | Of which impairment losses on assets since time of foreclosure | Net Carrying amount | ||||||||||
| Property assets arising from financing provided to construction and property development companies | ||||||||||||||
| Of which: | ||||||||||||||
| Completed buildings | ||||||||||||||
| Residential | ||||||||||||||
| Other | ||||||||||||||
| Buildings under construction | ||||||||||||||
| Residential | ||||||||||||||
| Other | ||||||||||||||
| Land | ||||||||||||||
| Developed land | ||||||||||||||
| Other land | ||||||||||||||
| Property assets from home purchase mortgage loans to households | ||||||||||||||
| Other foreclosed property assets | ||||||||||||||
| Total property assets | ||||||||||||||
In addition, the Group has shareholdings in entities holding foreclosed assets amounting to EUR 179 million (mainly Project Quasar Investment 2017, S.L. with EUR 155 million), and equity instruments foreclosed or received in payment of debts amounting to EUR 14 million.
In recent years, the Group has considered foreclosure to be a more efficient method for resolving cases of default than legal proceedings. The Group initially recognises foreclosed assets at the lower of the carrying amount of the debt (net of provisions) and the fair value of the foreclosed asset (less estimated costs to sell). Subsequent to initial recognition, the assets are measured at the lower of fair value (less costs to sell) and the amount initially recognised.
The fair value of this type of assets is determined by the market value (appraisal) adjusted with discounts obtained according to internal valuation methodologies based on the entity's sales experience in goods with similar characteristics.
The management of real estate assets on the balance sheet is carried out through companies specializing in the sale of real estate that is complemented by the structure of the commercial network. The sale is realised with at prices in accordance with the market situation and the offer of wholesale buyers.
The gross movement in foreclosed properties were as follows (EUR billion):
| EUR Billion | |||||||||||
| 2023 | 2022 | 2021 | |||||||||
| Gross additions | |||||||||||
| Disposals | ( | ( | ( | ||||||||
| Difference | ( | ( | ( | ||||||||
Information on the estimation of impairment losses
The detail of Santander Spain exposure and impairment losses associated with each of the stages at 31 December, 2023, 2022 and 2021, is shown below. In addition, the exposure is divided in four tranches of the Standard & Poor's rating scale, according to their current credit quality:
| Exposure and impairment losses by stage | ||||||||||||||
| EUR million | ||||||||||||||
| 2023 | ||||||||||||||
Credit quality A | Stage 1 | Stage 2 | Stage 3 | Total | ||||||||||
| From AAA to AA- | ||||||||||||||
| From A+ to BB | ||||||||||||||
| From BB- to B- | ||||||||||||||
| CCC and below | ||||||||||||||
Total exposureB | ||||||||||||||
Impairment lossesC | ||||||||||||||
757
| Exposure and impairment losses by stage | ||||||||||||||
| EUR million | ||||||||||||||
| 2022 | ||||||||||||||
Credit quality A | Stage 1 | Stage 2 | Stage 3 | Total | ||||||||||
| From AAA to AA- | ||||||||||||||
| From A+ to BB | ||||||||||||||
| From BB- to B- | ||||||||||||||
| CCC and below | ||||||||||||||
Total exposureB | ||||||||||||||
Impairment lossesC | ||||||||||||||
| Exposure and impairment losses by stage | ||||||||||||||
| EUR million | ||||||||||||||
| 2021 | ||||||||||||||
Credit quality A | Stage 1 | Stage 2 | Stage 3 | Total | ||||||||||
| From AAA to AA- | ||||||||||||||
| From A+ to BB | ||||||||||||||
| From BB- to B- | ||||||||||||||
| CCC and below | ||||||||||||||
Total exposureB | ||||||||||||||
Impairment lossesC | ||||||||||||||
A.Detail of credit quality ratings calculated for Group management purposes. Excluding the SCIB branches business
B.Total exposure includes loan balances (drawn amounts) and off balance (letters of credit + guarantees) and excludes REPOs, FV portfolio, trading portfolio and undrawn commitments.
C.Includes provisions for undrawn authorized lines (loan commitments).
For the estimation of the expected losses, the prospective information is taken into account. Specifically, Santander Spain considers three macroeconomic scenarios, which are updated periodically. The projected evolution for a period of five years of the main macroeconomic indicators used by Santander Spain for estimating expected losses as of 2023, is presented below:
| 2024-2028 | |||||||||||
| Variables | Pessimistic scenario | Base scenario | Optimistic scenario | ||||||||
| Interest rate | % | % | % | ||||||||
| Unemployment rate | % | % | % | ||||||||
| Housing price change | % | % | % | ||||||||
| GDP growth | % | % | % | ||||||||
Each macroeconomic scenarios is associated with a given weight. As for its allocation, Santander Spain associates the Base scenario with the highest weight, while associating the lower weights to the most extreme scenarios:
| 2023 | 2022 | 2021 | |||||||||
| Pessimistic scenario | % | % | % | ||||||||
| Base scenario | % | % | % | ||||||||
| Optimistic scenario 1 | % | % | % | ||||||||
The sensitivity analysis of the main portfolios expected loss to variations of +/-100 bp for the macroeconomic variables used in the construction of the scenarios, at December 31 2023, is as follows:
| Change in Provision | |||||||||||
| Mortgages | Corporates | Others | |||||||||
| GDP Growth | |||||||||||
| -100 bp | % | % | % | ||||||||
| 100 bp | - | % | - | % | - | % | |||||
| Housing price change | |||||||||||
| -100 bp | % | % | % | ||||||||
| 100 bp | - | % | - | % | - | % | |||||
Regarding the stage 2 classification determination, the quantitative criteria applied in Santander Spain are based on identifying whether any increase in the PD for the entire expected life of the operation is greater than a relative or absolute threshold. The established threshold is different for each portfolio depending on the characteristics of the operations, and an operation is considered to exceed said threshold when the PD for the entire life of the operation increases a certain amount over the PD it had at the time of initial recognition. The values of these thresholds depend on their calibration, carried out periodically, as indicated in previous paragraphs. Additionally, Santander Spain has implemented a backstop to the relative threshold in all portfolios. Consequently, contracts whose current PD has increased more than twice with respect to its PD at the time of its origination will be classified in phase 2.
In addition, a series of specific qualitative criteria are defined that indicate that the exposure has had a significant increase in credit risk, regardless of the evolution of its PD since the moment of initial recognition. Santander Spain, among other criteria, considers that an operation presents a significant increase in risk when it presents irregular positions for more than 30 days or if it is determined based on a system of Early Warning Indicators (EWIs).
758
3.3. United States
Portfolio overview
Santander US’s credit risk increased to EUR 137,893 million at the end of December 2023. It makes up 12.2 % of Grupo Santander's total credit risk.
As of December 2023, Santander US credit investment dropped 1.8 % compared to 2022, mainly due to SCUSA and SBNA Individuals portfolios..
Once the fiscal stimuli were withdrawn and after several increases in interest rates, the NPL rate grew to 4.57 % (+132 bps in the year) due to a higher stock of delinquencies in SC USA, and the cost of risk increased up to 1.92 % (+57 bp in the year).
Santander US includes the following business units:
Santander Bank, National Association (SBNA)
In 2023 lending amounted 58,826 million euros (representing 5 % of the Group's credit risk) and presents a reduction of 9.1 % in 2023, mainly due to the transfer of the CIB portfolio to the New York branch. Excluding the exchange rate effect, the portfolio decreased by 6.0 %.
Its activity is focused on commercial banking with 88 % of the portfolio distributed in individuals (51 %), and approximately 49 % in corporates. To optimize profitability and growth opportunities, the retail segment focuses on the financing of consumer loans, as well as automobile financing and leasing, leaving aside the origination of mortgage loans and loans and lines of credit associated with mortgage guarantees. .
The NPL ratio increased to 1.64 % (+56 bp in the year) as of December 2023 the cost of credit increased to 0.98 % once the provisions were normalized after the extraordinary releases of 2022 that were favoured by the fiscal support and stimulus programs still in force at that time.
Information on the estimation of impairment losses
The detail of Santander Bank, National Association exposure and impairment losses associated with each of the stages at 31 December, 2023, 2022 and 2021, is shown below. In addition, the exposure is divided in four tranches of the Standard & Poor's rating scale, according to their current credit quality:
| Exposure and impairment losses by stage | ||||||||||||||
| EUR million | ||||||||||||||
| 2023 | ||||||||||||||
Credit quality A | Stage 1 | Stage 2 | Stage 3 | Total | ||||||||||
| From AAA to AA- | ||||||||||||||
| From A+ to BB | ||||||||||||||
| From BB- to B- | ||||||||||||||
| CCC and below | ||||||||||||||
Total exposureB | ||||||||||||||
Impairment lossesC | ||||||||||||||
| Exposure and impairment losses by stage | ||||||||||||||
| EUR million | ||||||||||||||
| 2022 | ||||||||||||||
Credit quality A | Stage 1 | Stage 2 | Stage 3 | Total | ||||||||||
| From AAA to AA- | ||||||||||||||
| From A+ to BB | ||||||||||||||
| From BB- to B- | ||||||||||||||
| CCC and below | ||||||||||||||
Total exposureB | ||||||||||||||
Impairment lossesC | ||||||||||||||
| Exposure and impairment losses by stage | ||||||||||||||
| EUR million | ||||||||||||||
| 2021 | ||||||||||||||
Credit quality A | Stage 1 | Stage 2 | Stage 3 | Total | ||||||||||
| From AAA to AA- | ||||||||||||||
| From A+ to BB | ||||||||||||||
| From BB- to B- | ||||||||||||||
| CCC and below | ||||||||||||||
Total exposure B | ||||||||||||||
Impairment lossesC | ||||||||||||||
A.Detail of credit quality ratings calculated for Group management purposes.
B.Total exposure includes loan balances (drawn amounts) and off-balance (letters of credit + guarantees) and excludes REPOs, FV portfolio, trading portfolio and undrawn commitments.
C.Includes provisions for undrawn authorized lines (loan commitments).
759
For the estimation of expected losses, prospective information is taken into account. Specifically, Santander Bank, National Association considers four macroeconomic scenarios, which are updated periodically. The evolution projected in 2023 for a period of five years of the main macroeconomic indicators used Santander Bank, National Association to estimate expected losses is presented below:
| 2024 - 2028 | ||||||||||||||
| Variables | Pessimistic scenario 2 | Pessimistic scenario 1 | Base scenario | Optimistic scenario | ||||||||||
| Interest rate (annual averaged) | % | % | % | % | ||||||||||
| Unemployment rate | % | % | % | % | ||||||||||
| House price change | - | % | - | % | % | % | ||||||||
| GDP growth | % | % | % | % | ||||||||||
Manheim growthA | - | % | - | % | - | % | - | % | ||||||
A. US used vehicle price car index.
Each of the macroeconomic scenarios is associated with a given weight. As for its allocation, Santander Bank, National Association associates the highest weighting to the Base scenario, while associates the lowest weightings to the most extreme scenarios:
| 2023 | 2022 | 2021 | |||||||||
| Pessimistic scenario 2 | % | % | % | ||||||||
| Pessimistic scenario 1 | % | % | % | ||||||||
| Base scenario | % | % | % | ||||||||
| Optimistic scenario | % | % | % | ||||||||
The sensitivity analysis of the main portfolios expected loss to variations of +/-100 bp for the macroeconomic variables used in the construction of the scenarios as of 2023 is as follows:
| Change in Provision | ||||||||
| Mortgages | Corporates | |||||||
| GDP Growth | ||||||||
| -100 bp | ||||||||
| 100 bp | - | - | ||||||
| Housing price change | ||||||||
| -100 bp | ||||||||
| 100 bp | - | - | ||||||
| Unemployment rate | ||||||||
| -100 bp | - | - | ||||||
| 100 bp | ||||||||
In relation to the Stage 2 classification determination, the quantitative criteria applied at SBNA for retail portfolios uses the FICO (Fair Isaac Corporation) score at the time of origination and its current value, establishing different absolute threshold for each portfolio according to their characteristics. A SICR implies changes in that score ranging from 120 bp to 20 bp.
In the case of wholesale portfolios, SBNA uses the transaction's rating as a reference for its PD, taking into account its rating at the time of origination and its current rating, setting absolute thresholds for the different rating bands that depend on each portfolio characteristics.
Additionally, for each portfolio, a series of specific qualitative criteria are defined, which indicate that the exposure has experienced a significant increase in credit risk, regardless of the evolution of its PD since the initial recognition. Santander Bank, National Association, among other criteria, considers that a transaction presents a significant increase in credit risk when it has arrears positions for more than 30 days or if it is determined based on a system of Early Warning Indicators (EWIs).
Santander Consumer USA Inc.
Santander Consumer USA Inc. (SC USA) presents higher risk indicators than other Santander US units due to the nature of its business, which focuses on auto finance via loans and leasing.
At 31 December 2023, lending amounted to EUR 28,876 million (representing 3 % of the Group) and presents a reduction of 9.6 % in 2023. Excluding the exchange rate effect, the portfolio decreased by 6.5 %.
The focus continues to be on managing the relationship between profitability and risk, via management of prices adjusted to the credit quality of the customer/transaction, while improving the dealers' experience. Originations in the auto portfolio did not grow compared to the previous year, as a reflection of the restriction in the supply of new vehicles and the revaluation of used vehicles compared to the levels of previous years.
As of December 2023, the cost of credit is following a normalization trend, from the artificially good situation of previous years, due to government support and stimulus programs. Regarding the NPL ratio, it increased to 18.26 % (+615 bp in the year); and the cost of credit stood at 6.41 % (+173 bp YoY). Non-performing coverage ratio fell to 63 % (-24 pp in the year), in line with the percentages of transfers from default to bad debts, which are at historically low levels.
760
Information on the estimation of impairment losses
The detail of Santander Consumer USA Holding Inc. exposure and impairment losses associated with each of the stages at 31 December 2023, 2022 and 2021, is shown below. In addition, the exposure is divided in four tranches of the Standard & Poor's rating scale, according to their current credit quality:
| Exposure and impairment losses by stage | ||||||||||||||
| EUR million | ||||||||||||||
| 2023 | ||||||||||||||
Credit quality A | Stage 1 | Stage 2 | Stage 3 | Total | ||||||||||
| From AAA to AA- | ||||||||||||||
| From A+ to BB | ||||||||||||||
| From BB- to B- | ||||||||||||||
| CCC and below | ||||||||||||||
Total exposure B | ||||||||||||||
Impairment lossesC | ||||||||||||||
| Exposure and impairment losses by stage | ||||||||||||||
| EUR million | ||||||||||||||
| 2022 | ||||||||||||||
Credit quality A | Stage 1 | Stage 2 | Stage 3 | Total | ||||||||||
| From AAA to AA- | ||||||||||||||
| From A+ to BB | ||||||||||||||
| From BB- to B- | ||||||||||||||
| CCC and below | ||||||||||||||
Total exposure B | ||||||||||||||
Impairment lossesC | ||||||||||||||
| Exposure and impairment losses by stage | ||||||||||||||
| EUR million | ||||||||||||||
| 2021 | ||||||||||||||
Credit quality A | Stage 1 | Stage 2 | Stage 3 | Total | ||||||||||
| From AAA to AA- | ||||||||||||||
| From A+ to BB | ||||||||||||||
| From BB- to B- | ||||||||||||||
| CCC and below | ||||||||||||||
Total exposure B | ||||||||||||||
Impairment lossesC | ||||||||||||||
A.Detail of credit quality ratings calculated for Group management purposes.
B.Total exposure includes loan balances (drawn amounts) and off-balance (letters of credit + guarantees) and excludes REPOs, FV portfolio, trading portfolio and undrawn commitments.
C.Includes provisions for undrawn authorized lines (loan commitments).
For the expected losses estimation, prospective information should be taken into account. Specifically, Santander Consumer USA Holdings Inc. considers four macroeconomic scenarios, periodically updated over a 5 -year time horizon.
761
The evolution forecasted in 2023 for a period of five years of the main macroeconomic indicators used by in Santander Consumer USA Holdings Inc in the estimation of expected losses is shown below:
| 2024 - 2028 | ||||||||||||||
| Variables | Pessimistic scenario 2 | Pessimistic scenario 1 | Base scenario | Optimistic scenario | ||||||||||
| Interest rate (annual averaged) | % | % | % | % | ||||||||||
| Unemployment rate | % | % | % | % | ||||||||||
| House price change | - | % | - | % | % | % | ||||||||
| GDP growth | % | % | % | % | ||||||||||
ManheimA index | - | % | - | % | - | % | - | % | ||||||
A. US used vehicle price car index.
Each of the macroeconomic scenarios is associated with a given weight. Santander Consumer USA Inc. associates the highest weighting to the Base scenario, whereas it associates the lowest weightings to the most extreme or acid scenarios:
| 2023 | 2022 | 2020 | |||||||||
| Pessimistic scenario 2 | % | % | % | ||||||||
| Pessimistic scenario 1 | % | % | % | ||||||||
| Base scenario | % | % | % | ||||||||
| Optimistic scenario | % | % | % | ||||||||
The sensitivity analysis of the main portfolios expected loss to variations of +/-100 bp for the macroeconomic variables used in the construction of the scenarios at the end of 2023 is as follows:
| Change in provision | |||||
| SC Auto | |||||
| Manheim index | |||||
| -100 bp | |||||
| 100 bp | - | ||||
| Unemployment Rate | |||||
| -100 bp | - | ||||
| 100 bp | |||||
| House Price Change | |||||
| -100 bp | |||||
| 100 bp | - | ||||
| GDP growth | |||||
| -100 bp | |||||
| 100 bp | - | ||||
In relation to the stage 2 classification determination, the quantitative criteria applied at SC USA uses the FICO (Fair Isaac Corporation) score at the time of origination and its current value, establishing different absolute threshold for each portfolio according to their characteristics.
Additionally, for each portfolio, a series of specific qualitative criteria are defined, which indicate that the exposure has had a significant increase in credit risk, regardless of the evolution of its PD since the initial recognition. Santander Consumer USA Holdings Inc. among other criteria, considers that a transaction presents a significant increase in credit risk when it has irregular positions for more than 30 days. These criteria depend on the risk management practices of each portfolio.
3.4. Banco Santander (Brasil) S.A.
Portfolio overview
Santander Brasil's credit risk amounted to EUR 113,937 million. It increased by 11.9 % from 2022. Minus the exchange rate effect, it grew by 6.3 %. As of December 2023, Santander Brasil accounts for 10 % of Grupo Santander's loan book.
The Brazilian economy has experienced a slow but continuous recovery, which has slowed down, although the labour market continued to show great resilience as did exports.
Lending to individual observed moderate growth, with a focus on guaranteed portfolios, despite the restrictive measures implemented due to the deterioration of the macroeconomic situation since the second half of 2021. At Santander Auto, the alliance with Stellantis is expected to represent a relevant accelerator of vehicle production given that it is the main brand in Brazil, with 32 % market share. The improvement observed in new production is already beginning to be reflected in metrics at the portfolio level, through the earliest irregularity indicators.
SME lending, which represents 10 % of the total risk, the restrictive admission measures adopted since the end of 2021 were maintained, also incorporating some additional ones, especially in the risk profiles with the worst behaviour, reviewing the strategies to ensure quality credit at budgeted levels, which was achieved during the year, avoiding deterioration in risk metrics.
Regarding lending to corporates, the volume has grown above expectations (as of December 23), showing robust and constant growth. This portfolio growth has been achieved by maintaining stable credit profile and profitability.
The NPL rate went from 7.57 % in December 2022 to 6.56 % in December 2023, and the coverage ratio increased from 80 % to 85 %.
As of 31 December 2023 loan-loss provisions reached EUR 4,701 million, a 6.4 % year-on-year increase (excluding the effect of the exchange rate, the increase would remain at 6 %) Cost of risk rose from 4.79 % in 2022 to 4.77 % in 2023.
762
Information on the estimation of impairment losses
The detail of Banco Santander (Brasil) S.A. exposure and impairment losses associated with each of the stages at 31 December 2023, 2022 and 2021, is shown below. In addition, the exposure is divided in four tranches of the Standard & Poor's rating scale, according to their current credit quality:
| Exposure and impairment losses | ||||||||||||||
| EUR million | 2023 | |||||||||||||
Credit quality A | Stage 1 | Stage 2 | Stage 3 | Total | ||||||||||
| From AAA to AA- | ||||||||||||||
| From A+ to BB | ||||||||||||||
| From BB- to B- | ||||||||||||||
| CCC and below | ||||||||||||||
Total exposureB | ||||||||||||||
Impairment lossesC | ||||||||||||||
| Exposure and impairment losses | ||||||||||||||
| EUR million | 2022 | |||||||||||||
Credit quality A | Stage 1 | Stage 2 | Stage 3 | Total | ||||||||||
| From AAA to AA- | ||||||||||||||
| From A+ to BB | ||||||||||||||
| From BB- to B- | ||||||||||||||
| CCC and below | ||||||||||||||
Total exposureB | ||||||||||||||
Impairment lossesC | ||||||||||||||
| Exposure and impairment losses | ||||||||||||||
| EUR million | 2021 | |||||||||||||
Credit quality A | Stage 1 | Stage 2 | Stage 3 | Total | ||||||||||
| From AAA to AA- | ||||||||||||||
| From A+ to BB | ||||||||||||||
| From BB- to B- | ||||||||||||||
| CCC and below | ||||||||||||||
Total exposureB | ||||||||||||||
Impairment lossesC | ||||||||||||||
A.Detail of credit quality ratings calculated for Group management purposes.
B.Total exposure includes loan balances (drawn amounts) and off-balance (letters of credit + guarantees) and excludes REPOs, FV portfolio, trading portfolio and undrawn commitments.
C.Includes provisions for undrawn authorized lines (loan commitments).
For the expected losses estimation, prospective information is taken into account. Particularly, Santander Brazil considers three macroeconomic scenarios, periodically updated. The evolution for a period of five years of the main macroeconomic indicators used to estimate the expected losses in Santander Brazil is as follows:
2024-2028 | |||||||||||
| Variables | Pessimistic scenario | Base scenario | Optimistic scenario | ||||||||
| Interest rate (annual averaged) | % | % | % | ||||||||
| Unemployment rate | % | % | % | ||||||||
| House price change | % | % | % | ||||||||
| GDP growth | % | % | % | ||||||||
| Burden income | % | % | % | ||||||||
Each macroeconomic scenario is associated with a given weight. Regarding its assignation, Brazil links the highest weight to the base scenario whilst links the lowest weights to the most extreme scenarios:
| 2023 | 2022 | 2021 | |||||||||
| Pessimistic scenario | % | % | % | ||||||||
| Base scenario | % | % | % | ||||||||
| Optimistic scenario | % | % | % | ||||||||
The sensitivity analysis of the main portfolios expected loss to variations of +/-100 bp for the macroeconomic variables used in the construction of the scenarios is at the end of 2023 as follows:
| Change in provision | |||||||||||
| Consumer | Corporate | Other | |||||||||
| GDP growth | |||||||||||
| -100 bp | % | % | % | ||||||||
| 100 bp | - | % | - | % | - | % | |||||
| Unemployment rate | |||||||||||
| -100 bp | - | % | - | % | - | % | |||||
| 100 bp | % | % | % | ||||||||
| Interest rate (SELIC) | |||||||||||
| -100 bp | - | % | - | % | - | % | |||||
| 100 bp | % | % | % | ||||||||
Regarding the stage 2 classification determination, Santander Brazil analyses whether any increase in the PD for the expected entire life of the operation is greater than the combination of an absolute and a relative threshold. The established threshold is different for each portfolio depending on the characteristics of the operations, and an operation is considered to exceed said threshold when the PD for the entire life of the operation increases a certain amount over the PD it had at the time of initial recognition. The values of these absolute and relative thresholds depend on their calibration, carried out periodically, as well as the type of portfolio they affect. Additionally, Santander Brasil plans to introduce in February 2024 a backstop of 200 % to the relative threshold of all portfolios
In addition, for every portfolio, a set of specific qualitative criteria are defined to indicate that the exposure to credit risk has significantly risen, regardless of the evolution of its PD since the initial recognition. Santander Brazil, among other criteria, considers that an operation involves a significant increase in credit risk when it presents irregular positions for more than 30 days or if it is determined based on a system of Early Warning Indicators (EWI).
763
4. Other credit risk aspects
4.1. Credit risk by activity in the financial markets
This section covers credit risk from treasury, with money market financing and counterparty risk products to satisfy the needs of customers (especially credit institutions) and the Group.
Counterparty credit risk is the risk that a customer will default before the final settlement of a transaction’s cash flows. It creates a bilateral credit risk because it can affect both parties to a transaction. It is also uncertain because it depends on market factors, which can be volatile.
Grupo Santander manages counterparties with several credit risk models based on their characteristics and needs. Model segmentation is by business and risk treatment and based on counterparty disclosures as well as the credit risk cycle. The exposure that the counterparty credit risk model covers includes derivatives contracts, repurchase agreements, securities and commodities lending, long settlements and margin lending.
An infrastructure that can quickly and dynamically measure current and potential exposure with various degrees of aggregation and granularity to generate detailed reports is important for decision-making.
To measure exposure, Santander uses two methods: “Mark-to-market” (MtM) (replacement cost of derivatives), plus potential future exposure (“add-on”); and the Monte Carlo simulation for certain countries and products. In addition, Santander calculates capital at risk and unexpected loss (e.g. economic capital, net of collateral and recoveries, after deducting expected loss).
At market close, Santander recalculates its exposure by adjusting transactions to a new time horizon, adapting potential future exposure, and applying netting, collateral and other mitigants. That way, Santander can check exposure daily against the limits approved by senior management within risk appetite. For risk control, the Group uses a real-time integrated system that shows the exposure limit with a counterparty, for any product and term, in all subsidiaries.
As part of the exposure to counterparty credit risk, an additional risk known as wrong-way risk may arise. This risk is the one that arises in the event that the exposure with a portfolio or with a counterparty increases when its credit quality deteriorates. That is, wrong-way risk exists when there is an increase in the risk of default and, as a consequence, the exposure we have with the counterparty increases. Santander has specific models to measure this risk.
Regarding settlement risk, this occurs when the settlement of a transaction involves a bilateral exchange of flows or assets between two counterparties, and there is a risk that one of the parties will fail to comply with their settlement commitments. To measure this risk, Santander has developed a global infrastructure and specific models.
4.2. Concentration risk
Concentration risk control is a vital part of our management. The Group continuously monitors the degree of concentration of its credit risk portfolios using various criteria: geographic areas and countries, economic sectors and groups of customers.
The board, via the risk appetite framework, determines the maximum levels of concentration.
In line with these maximum levels and limits, the executive risk committee establishes the risk policies and reviews the appropriate exposure levels for the effective management of the degree of concentration in Santander’s credit risk portfolios.
Grupo Santander must adhere to the regulation on large risks contained in the CRR, according to which the exposure contracted by an entity with a customer or group of associated customers will be considered a large exposure when its value is equal to or greater than 10 % of eligible capital.
In addition, in order to limit large exposures, no entity may assume exposures exceeding 25 % of its eligible capital with a single customer or group of associated customers, having factored in the credit risk mitigation effect contained in the regulation.
At the end of December, after applying risk mitigation techniques, no group reaches the above-mentioned thresholds.
Regulatory credit exposure with the 20 largest groups within the scope of large risks represented 5.6 % of the outstanding credit risk with customers (lending to customers plus off-balance sheet risks) as of December 2023. While the regulatory credit exposure with the 40 largest groups represents 8.5 % of the credit risk.
764
The detail, by activity and geographical area of the Group's risk concentration at 31 December 2023 is as follows:
| EUR million | |||||||||||||||||
2023A | |||||||||||||||||
| Total | Spain | Other EU countries | America | Rest of the world | |||||||||||||
| Central banks and Credit institutions | |||||||||||||||||
| Public sector | |||||||||||||||||
| Of which: | |||||||||||||||||
| Central government | |||||||||||||||||
| Other central government | |||||||||||||||||
| Other financial institutions (financial business activity) | |||||||||||||||||
| Non-financial companies and individual entrepreneurs (non-financial business activity) (broken down by purpose) | |||||||||||||||||
| Of which: | |||||||||||||||||
| Construction and property development | |||||||||||||||||
| Civil engineering construction | |||||||||||||||||
| Large companies | |||||||||||||||||
| SMEs and individual entrepreneurs | |||||||||||||||||
| Households – other (broken down by purpose) | |||||||||||||||||
| Of which: | |||||||||||||||||
| Residential | |||||||||||||||||
| Consumer loans | |||||||||||||||||
| Other purposes | |||||||||||||||||
| Total | |||||||||||||||||
4.3 Sectors identification and management
Grupo Santander conducts a quarterly review of exposure to customers operating in sectors that could be more affected by macroeconomic conditions (energy consumption, commodity prices, and key macroeconomic variables). This monitoring is complemented by the use of internal tools that allow projecting the behaviour and evolution of clients in each sector under different macroeconomic scenarios. Additionally, this process considers, among other things, the following information at the sector level:
•Market information: Industries’ stock market performance.
•Analysts’ EBITDA forecasts for the coming years.
•Internal information: Changes in credit exposure, defaults (in different timelines) and stagings.
•Our industry experts’ opinion, based on specific details about our exposures and our relationships with customers
4.4. Sovereign risk and exposure to other public sector entities
Sovereign risk occurs in transactions with a central bank. It includes the regulatory cash reserve, issuer risk with the Treasury (public debt portfolio) and risk from transactions with government institutions whose funding only come from the state’s budgetary revenue and not commercial operations.
Grupo Santander's standard for sovereign risk differs somewhat from the European Banking Authority's (EBA) standard for regular stress testing. In particular, the EBA does not consider deposits with central banks, exposures with insurance companies or indirect exposures from guarantees and other financial instruments. However, its standard does generally include entities run by regional, local and central governments.
Santander continues to track and manage transactions with sovereign risk based on available information, such as reports by rating agencies and international organizations. Grupo Santander monitors each country where the Group has cross-border1 and sovereign risk. Santander analyses events that could affect the country’s political or institutional stability and assign its government or central bank a credit rating. This helps us set limits for transactions with sovereign risk.
At the end of December, Grupo Santander´s local sovereign exposure, in currencies other than the official currency of the country of issuance, is not significant (EUR 4,404 million, 1.1 % of total sovereign risk) according to our management criteria. Furthermore, exposure to non-local sovereign issuers involving cross-border risk is even less significant (EUR 11,085 million, 2.7 % of total sovereign risk). Sovereign exposure in Latin America is mostly in local currency, and is recognised in the local accounts and concentrated in short- term maturities.
Over the past few years, total exposure to sovereign risk has remained in line with regulatory requirements and our strategy to manage this portfolio.
765
The shifts observed in the different countries exposure is due to our liquidity management strategy and the hedging of interest and exchange rates risks. Santander's exposure spreads among countries with varied macroeconomic outlooks and dissimilar scenarios in terms of growth, interest and exchange rates.
Our investment strategy for sovereign risk considers country’s credit quality to set the maximum exposure limitsA:
| 2023 | 2022 | 2021 | |||||||||
| AAA | % | % | % | ||||||||
| AA | % | % | % | ||||||||
| A | % | % | % | ||||||||
| BBB | % | % | % | ||||||||
| Less than BBB | % | % | % | ||||||||
A.Internal ratings are applied.
Sovereign exposure at the end of 31 December 2023 is shown in the table below (data in million euros):
| 2023 | 2022 | ||||||||||||||||||||||
| Portfolio | |||||||||||||||||||||||
| Country | Financial assets designated at fair value through profit or loss | Financial assets at fair value through other comprehensive income | Financial assets at amortized cost | Non-trading financial assets mandatorily at fair value through profit or loss | Total net direct exposure | Total net direct exposure | |||||||||||||||||
| Spain | |||||||||||||||||||||||
| Portugal | |||||||||||||||||||||||
| Italy | ( | ||||||||||||||||||||||
| Greece | |||||||||||||||||||||||
| Ireland | |||||||||||||||||||||||
| Rest Eurozone | |||||||||||||||||||||||
| UK | |||||||||||||||||||||||
| Poland | |||||||||||||||||||||||
| Rest of Europe | |||||||||||||||||||||||
| US | |||||||||||||||||||||||
| Brazil | |||||||||||||||||||||||
| Mexico | |||||||||||||||||||||||
| Chile | |||||||||||||||||||||||
| Rest of America | |||||||||||||||||||||||
| Rest of the World | |||||||||||||||||||||||
| TOTAL | |||||||||||||||||||||||
766
5. Forborne loan portfolio
The customer debt redirection policy incorporates the regulatory requirements of the EBA guidelines on the management of non-performing exposures, refinancing and restructuring. This policy acts as a reference for the transposition in our subsidiaries and shares the applicable supervisory expectations.
This policy also sets down rigorous criteria for evaluating, classifying and monitoring forbearances to ensure the strictest possible care and diligence in recovering due amounts. Thus, it dictates that Santander must adapt payment obligations to customers' current circumstances. Our forbearance policy also defines classification criteria to ensure Grupo Santander recognizes risks appropriately. They must remain classified as non-performing or in watch-list for a prudential period for reasonable certainty of repayment. In no case will repayments be used to delay the immediate recognition of losses or so that their use distorts the timely recognition of the risk of non-payment.
At 31 December 2023, forbearance stock fell again and stood at EUR 31,963 million, due to the good payment behaviour in the main geographies. In terms of credit quality, 47 % of the loans is classified as credit impaired, with a coverage ratio of 44 %. In addition, 53 % of the portfolio is classified as performing.
The following terms are used with the meanings specified below:
•Refinancing transaction: transaction that is granted or used, for reasons relating to current or foreseeable financial difficulties of the borrower, to repay one or more of the transactions granted to it, or through which the payments on such transactions are brought fully or partially up to date, in order to enable the borrowers of the cancelled or refinanced transactions to repay their debt (principal and interest) because they are unable, or might foreseeably become unable, to comply with the conditions there of in due time and form.
•Restructured transaction: transaction with respect to which, for economic or legal reasons relating to current or foreseeable financial difficulties of the borrower, the financial terms and conditions are modified in order to facilitate the payment of the debt (principal and interest) because the borrower is unable, or might foreseeably become unable, to comply with the aforementioned terms and conditions in due time and form, even if such modification is envisaged in the agreement.
767
| Current refinancing and restructuring balances | |||||||||||||||||||||||
| Amounts in EUR million, except number of transactions that are in units | |||||||||||||||||||||||
2023 | |||||||||||||||||||||||
| Total | |||||||||||||||||||||||
| Without real guarantee | With real guarantee | ||||||||||||||||||||||
| Maximum amount of the actual collateral that can be considered | Impairment of accumulated value or accumulated losses in fair value due to credit risk | ||||||||||||||||||||||
| Number of transactions | Gross amount | Number of transactions | Gross amount | Real estate guarantee | Rest of real guarantees | ||||||||||||||||||
| Credit entities | |||||||||||||||||||||||
| Public sector | |||||||||||||||||||||||
| Other financial institutions and: individual shareholder | |||||||||||||||||||||||
| Non-financial institutions and individual shareholder | |||||||||||||||||||||||
| Of which financing for constructions and property development | |||||||||||||||||||||||
| Other warehouses | |||||||||||||||||||||||
| Total | |||||||||||||||||||||||
| Financing classified as non-current assets and disposable groups of items that have been classified as held for sale | |||||||||||||||||||||||
| Current refinancing and restructuring balances | |||||||||||||||||||||||
| Amounts in EUR million, except number of transactions that are in units | |||||||||||||||||||||||
| 2023 | |||||||||||||||||||||||
| Of which, non-performing/Doubtful | |||||||||||||||||||||||
| Without real guarantee | With real guarantee | ||||||||||||||||||||||
| Maximum amount of the actual collateral that can be considered | Impairment of accumulated value or accumulated losses in fair value due to credit risk | ||||||||||||||||||||||
| Number of transactions | Gross amount | Number of transactions | Gross amount | Real estate guarantee | Rest of real guarantees | ||||||||||||||||||
| Credit entities | |||||||||||||||||||||||
| Public sector | |||||||||||||||||||||||
| Other financial institutions and: individual shareholder | |||||||||||||||||||||||
| Non-financial institutions and individual shareholder | |||||||||||||||||||||||
| Of which financing for constructions and property development | |||||||||||||||||||||||
| Other warehouses | |||||||||||||||||||||||
| Total | |||||||||||||||||||||||
| Financing classified as non-current assets and disposable groups of items that have been classified as held for sale | |||||||||||||||||||||||
In 2023, the amortised cost of financial assets whose contractual cash flows were modified during the year when the corresponding loss adjustment was valued at an amount equal to the expected credit losses over the life of the asset amounted to EUR 2,902 million (2,379 million in 2022), without these modifications having a material impact on the income statement. Also, during 2023, the total of financial assets that have been modified since the initial recognition, and whose correction for expected loss has gone from being valued during the entire life of the asset to the following twelve months, amounts to EUR 2,804 million (1,677 million in 2022).
The transactions presented in the foregoing tables were classified at 31 December 2023 by nature, as follows:
•Credit impaired: Operations that rest on an inadequate payment scheme will be classified within the non-performing category, regardless they include contract clauses that delay the repayment of the operation throughout regular payments or present amounts written off the balance sheet for being considered irrecoverable.
•Performing: Operations not classifiable as non-performing will be classified within this category. Operations will also be classified as normal if they have been reclassified from the non-performing category for complying with the specific criteria detailed below:
a)A period of a year must have passed from the refinancing or restructuring date.
768
b)The owner must have paid for the accrued amounts of the capital and interests, thus reducing the rearranged capital amount, from the date when the restructuring of refinancing operation was formalised.
c)The owner must not have any other operation with amounts past due by more than 90 consecutive days of material delay on the date of the reclassification to the normal risk category.
Attending to the credit attention 53 % of the forborne loan transactions are classified as other than non-performing. Particularly noteworthy are the level of existing guarantees (45 % of transactions are secured by collateral) and the coverage provided by specific allowances (representing 25 % of the total forborne loan portfolio and 44 % of the non-performing portfolio).
c) Market, structural and liquidity risk
1. Activities subject to market risk and types of market risk
Activities exposed to market risk encompass transactions where risk is assumed as a consequence of potential changes in interest rates, inflation rates, exchange rates, stock prices, credit spreads, commodity prices, volatility and other market factors; the liquidity risk from our products and markets, and the balance-sheet liquidity risk. Therefore, they include trading risks and structural risks.
•Interest rate risk arises from movements in interest rates that reduce the value of a financial instrument, a portfolio or the Grupo Santander. It can affect loans, deposits, debt securities, most assets and liabilities held for trading, and derivatives.
•Inflation rate risk arises from movements in inflation that can reduce the value of a financial instrument, a portfolio or the entire group. It can affect loans, debt securities and derivatives (e.g. inflation swaps and futures) whose profitability is linked to inflation.
•Exchange rate risk is the possibility of loss because the currency of a long or open position will depreciate against the base currency. It can affect debt in subsidiaries whose local currency is not the euro, as well as loans denominated in a foreign currency.
•Equity risk is the possibility of loss from open positions in securities if their market price or expected future dividends fall. It affects shares, stock market indices, convertible bonds and derivatives with shares as the underlying asset (put, call, equity swaps, etc.).
•Credit spread risk is the possibility of loss from open positions in fixed-income securities or credit derivatives if their yield curve, or the recovery rate of their issuer or type change. A spread is the yield difference between financial instruments against a benchmark (e.g. the internal rate of return (IRR) of government bonds and interbank interest rates).
•Commodity price risk is the possibility of loss from movements in commodity prices. Grupo Santander's commodity exposure is minor and stems mainly from commodity derivatives.
•Volatility risk is the possibility of loss caused by movements in interest rates, exchange rates, the stock market, credit spreads and other risk factors affecting portfolio value. It is inherent to all financial instruments whose value considers volatility (especially options contracts).
Derivative contracts (such as options, futures, forwards and swaps) can mitigate market risks partially or fully.
Additionally, other more complex coverage market risks are considered, such as correlation risk, market liquidity risk, prepayment or cancellation risk and subscription risk.
•Correlation risk is the possibility of loss due to an adverse correlation between risk variables that affect portfolio value. Risk variables could be the same (e.g. two FX rates) or different (e.g. an interest rate and a commodity price).
•Market liquidity risk is the possibility that fewer market makers or institutional investors, a large number of transactions, market instability and other factors will cause the Group or a subsidiary to exit a position at a worse market price or trade cost. Exposure to different products and currencies can also increase this risk.
•Pre-payment or cancellation risk originates when mortgages, deposits and other on-balance-sheet instruments give holders the option to buy or sell them, thus altering future cash flows. Potential mismatches on the balance sheet pose a risk since cash flows may have to be reinvested at an interest rate that is potentially lower (assets) or higher (liabilities).
•Underwriting risk is the possibility that the bank will have to hold part of a debt issue it has underwritten or agreed to place if it cannot all be placed among potential buyers.
Balance sheet liquidity risk (unlike market liquidity risk) is the possibility of loss caused by forced disposal of assets or cash flow imbalance if the bank meets its payment obligations late or at excessive cost. It can cause losses by forced asset sales or impacts on margins due to the mismatch between expected cash inflows and outflows.
Pension and actuarial risks (explained at the end of this section) also depend on market variables.
Grupo Santander aim to comply with the Basel Committee’s Fundamental Review of the Trading Book (FRTB) and the EBA’s Guidelines on the management of interest rate risk arising from non-trading book activities. The purpose of several projects Grupo Santander runs is to provide risk control managers and teams with the best market risk management tools under the right governance framework for the models Grupo Santander uses for metric reporting; and to comply with regulation on the risks mentioned above.
769
2. Trading market risk management
Setting market risk limits in a dynamic process according to the risk appetite in the annual limits plan prepared by senior management and extended to all subsidiaries.
The standard methodology for risk management and control in trading, measures the maximum expected loss with a specific level of confidence and time frame. The standard for historical simulation is a confidence level of 99% over one day.
Grupo Santander applies statistical adjustments efficiently to incorporate recent developments affecting our levels of risk. Our time frame is two years or at least 520 days from the reference date of the VaR calculation.
The balance sheet items in the Group’s consolidated position that are subject to market risk are shown below, distinguishing those positions for which the main risk metric is VaR from those for which risk monitoring is carried out using other metrics:
| Risk metric values on the consolidated balance sheet | ||||||||||||||
| EUR million | ||||||||||||||
| Main market risk metric | ||||||||||||||
| Balance sheet amount | VaR | Other | Main risk factor for 'Other' balance | |||||||||||
| Assets subject to market risk | ||||||||||||||
| Cash, cash balances at central banks and other deposits on demand | Interest rate | |||||||||||||
| Financial assets held for trading | ||||||||||||||
| Non-trading financial assets mandatorily at fair value through profit or loss | Interest rate, spread | |||||||||||||
| Financial assets designated at fair value through profit or loss | Interest rate, spread | |||||||||||||
| Financial assets designated at fair value through other comprehensive income | Interest rate, spread | |||||||||||||
| Financial assets at amortized cost | Interest rate, spread | |||||||||||||
| Hedging derivatives | Interest rate, exchange rate | |||||||||||||
| Changes in the fair value of hedged items in portfolio hedges of interest risk | ( | ( | Interest rate | |||||||||||
| Other assets | ||||||||||||||
| Total assets | — | — | ||||||||||||
| Liabilities subject to market risk | ||||||||||||||
| Financial liabilities held for trading | ||||||||||||||
| Financial liabilities designated at fair value through profit or loss | Interest rate, spread | |||||||||||||
| Financial liabilities at amortized cost | Interest rate, spread | |||||||||||||
| Hedging derivatives | Interest rate, exchange rate | |||||||||||||
| Changes in the fair value of hedged items in portfolio hedges of interest rate risk | Interest rate | |||||||||||||
| Other liabilities | ||||||||||||||
| Total liabilities | ||||||||||||||
| Equity | ||||||||||||||
770
The following table displays the latest and average VaR values at 99 % by risk factor over the last three years. It also shows the minimum and maximum VaR values in 2023 and 97.5 % ES at the end of December 2023:
VaR statistics and expected shortfall by risk factorA | |||||||||||||||||||||||||||||||||||
EUR million. VaR at | |||||||||||||||||||||||||||||||||||
| 2023 | 2022 | 2021 | |||||||||||||||||||||||||||||||||
VaR ( | ES ( | VaR | VaR | ||||||||||||||||||||||||||||||||
Min | Average | Max | Latest | Latest | Average | Latest | Average | Latest | |||||||||||||||||||||||||||
| Total Trading | |||||||||||||||||||||||||||||||||||
| Diversification effect | ( | ( | ( | ( | ( | ( | ( | ( | ( | ||||||||||||||||||||||||||
| Interest rate | |||||||||||||||||||||||||||||||||||
| Equities | |||||||||||||||||||||||||||||||||||
| Exchange rate | |||||||||||||||||||||||||||||||||||
| Credit spread | |||||||||||||||||||||||||||||||||||
| Commodities | |||||||||||||||||||||||||||||||||||
| Total Europe | |||||||||||||||||||||||||||||||||||
| Diversification effect | ( | ( | ( | ( | ( | ( | ( | ( | ( | ||||||||||||||||||||||||||
| Interest rate | |||||||||||||||||||||||||||||||||||
| Equities | |||||||||||||||||||||||||||||||||||
| Exchange rate | |||||||||||||||||||||||||||||||||||
| Credit spread | |||||||||||||||||||||||||||||||||||
| Commodities | |||||||||||||||||||||||||||||||||||
| Total North America | |||||||||||||||||||||||||||||||||||
| Diversification effect | ( | ( | ( | ( | ( | ( | ( | ( | ( | ||||||||||||||||||||||||||
| Interest rate | |||||||||||||||||||||||||||||||||||
| Equities | |||||||||||||||||||||||||||||||||||
| Exchange rate | |||||||||||||||||||||||||||||||||||
| Total South America | |||||||||||||||||||||||||||||||||||
| Diversification effect | ( | ( | ( | ( | ( | ( | ( | ( | ( | ||||||||||||||||||||||||||
| Interest rate | |||||||||||||||||||||||||||||||||||
| Equities | |||||||||||||||||||||||||||||||||||
| Exchange rate | |||||||||||||||||||||||||||||||||||
| Commodities | |||||||||||||||||||||||||||||||||||
A. In South and North America, VaR levels of credit spreads and commodities are not shown separately due to their low or null materiality.
VaR at the end of December was slightly higher (EUR 1.9 million) compared to the end of 2022, reflecting the spike in market volatility after the latest meetings of the main Central Banks, albeit generally less volatile this year than previous one.
In 2023, average VaR (EUR 11.7 million) was lower than 2022 for all risk factors except exchange rate, which was slightly higher. Temporary VaR increases owe more to short-term price volatility than to significant changes in positions.
By region, average VaR fell mainly in Europe (in almost every risk factor), while the slight increase in North America was due to interest rates.
Backtesting
Actual losses can differ from predicted losses because of the VaR’s limitations. Grupo Santander measures the accuracy of the VaR calculation model to make sure it is reliable. The most important tests Grupo Santander runs involve backtesting:
•Backtesting of hypothetical P/L and of the entire trading book an exception was observed (daily loss greater than the VaR) on 13 of March, as a consequence of market volatility coinciding with events related to some regional American banks. Regarding to 99 % VaE, an exception (daily profit higher than VaE) was observed on 13 of December as a result of the devaluation of the Argentine peso.
•The exceptions observed in the past year are consistent with the assumptions of the VaR calculation model.
771
IBOR reform
Since 2013, different supranational organizations and authorities (IOSCO and FSB) have promoted and monitored initiatives aimed at carrying out reforms to strengthen interest rate indices. The main objective was to facilitate the transition to the risk-free indices identified in different jurisdictions, highlighting the SONIA index as a replacement for the LIBOR references in pounds, the SOFR for the LIBOR in dollars, and the €STR for the LIBOR in euros.
In this sense and as a result of the joint effort of authorities and market participants, this transition process has been materialized in different milestones during the period between 2019 and 2023, pending, according to the regulatory milestones of the transition, the terms of the 3-month pound LIBOR, and the 1-month, 3-month and 6-month dollar LIBOR, which will continue to be published under a synthetic methodology until the end of March and September 2024, respectively, dates from which publication will cease permanently.
The Group has carried out the operational and technological changes necessary to undertake the transition of these reference indices, with the book amount of financial assets and liabilities as of December 31, 2023 that continue to be referenced to the benchmarks being non-significant. pending transition indices.
3. Structural balance sheet risks
3.1. Main aggregates and variations
Consistent with previous years, the market risk profile of Grupo Santander’s balance sheet remained moderate in 2022 in terms of asset, shareholders’ equity and NII volumes.
Each subsidiary’s finance division manages interest rate risk from commercial banking and is responsible for handling structural risk from interest rate fluctuations.
To measure interest rate risk, Grupo Santander uses statistical models based on strategies to mitigate structural risk with interest-rate instruments (such as bonds and derivatives) to keep risk profile within risk appetite.
The NII and EVE sensitivities below are based on scenarios of parallel interest rate movements from -100 to +100 basis points.
Structural VaR
With such a homogeneous metric as VaR, Grupo Santander can fully monitor market risk in the banking book (excluding SCIB trading activity). The Bank differentiates fixed income based on interest rates and credit spreads in ALCO portfolios, FX rates and shares.
In general, the structural VaR of Grupo Santander total assets and equity is minor.
772
| Structural VaR | ||||||||||||||||||||||||||
EUR million. Structural VaR | ||||||||||||||||||||||||||
| 2023 | 2022 | 2021 | ||||||||||||||||||||||||
| Min | Average | Max | Latest | Average | Latest | Average | Latest | |||||||||||||||||||
| Structural VaR | ||||||||||||||||||||||||||
| Diversification effect | ( | ( | ( | ( | ( | ( | ( | ( | ||||||||||||||||||
VaR Interest RateA | ||||||||||||||||||||||||||
| VaR Exchange Rate | ||||||||||||||||||||||||||
| VaR Equities | ||||||||||||||||||||||||||
A. Includes credit spread VaR on ALCO portfolios.
Structural interest rate risk
•Europe
At the end of December, the net interest income (NII) of our main balance sheets showed positive sensitivities to increases in interest rates. On the same date, in the case of the economic value of equity (EVE), it showed negative sensitivity to increases in interest rates in the case of the UK and positive sensitivity in the case of Spain in the same scenario.
At the end of December, under the scenarios previously described, significant risk of NII sensitivity to the euro amounted to EUR 886.2 million; to the pound sterling, EUR 245.8 million; to the US dollar, EUR 99.4 million; and to the Polish złoty, EUR 24 million, all with risk of rate cuts.
Significant risk of EVE sensitivity to yield curves of the euro was EUR 391.9 million; of the pound sterling, EUR 392.1 million; of the US dollar, EUR 364.3 million euros; and of the Polish złoty, EUR 176.4 million euros, mostly with risk of rate cuts.
Exposure was moderate in relation to annual budget and capital levels in 2023.
•North America
At the end of December, sensitivity of NII on our North America balance sheet to interest rate hikes was positive, while EVE sensitivity was negative.
Exposure was moderate in relation to annual budget and capital levels in 2023.
At the end of December, significant risk to NII was mainly in the US and amounted to EUR 117 million.
The most significant risk to EVE was in the US and amounted to EUR 786 million.
•South America
EVE and NII on our main South American balance sheets are positioned for interest rate cuts.
Exposure in all countries was moderate in relation to the annual budget and capital levels in 2023.
At the end of December, most significant risk to NII was mainly in Chile (EUR 36 million) and in Brazil (EUR 141 million).
Most significant risk to EVE was recorded in Chile (EUR 255 million) and in Brazil (EUR 360 million).
Structural foreign currency rate risk/results hedging
Grupo Santander's structural FX risk stems mainly from the income and hedging of foreign currency transactions for permanent financial investments. In the dynamic management of this risk, Grupo Santander aims to limit the impact of FX rate movements on the core capital ratio. In 2023, the hedged of the different currencies that have an impact on our core capital ratio was close to 100 %.
In December 2023, our permanent exposures (with potential impact on shareholders’ equity) were, from largest to smallest, in US dollars, Brazilian reais, British pounds sterling, Mexican pesos, Chilean pesos and Polish złoty.
Grupo Santander uses FX derivatives to hedge part of those permanent positions. The Finance division manages FX risk and hedging for the expected profits and dividends of subsidiaries whose base currency is not the euro.
Structural equity risk
Grupo Santander holds equity positions in its banking and trading books. They are either equity instruments or stock, depending on the share of ownership or control.
At the end of December 2023, the equities and shareholdings in the banking book were diversified among Spain, China, Morocco, Poland and other countries. Most of them invest in the financial and insurance sectors. Grupo Santander has minor equity exposure to property and other sectors.
Structural equity positions are exposed to market risk. The Group calculates its VaR with a set of market prices and proxies. At the end of the year 2023, VaR at a 99 % confidence level over a one-day horizon was EUR 171 million (EUR 195 million and EUR 309 million in 2022 and 2021, respectively.
773
3.2. Methodologies
Structural interest rate risk
Grupo Santander measures the potential impact of interest rate movements on EVE and NII. Because changing rates may generate impacts, Grupo Santander must manage and control many subtypes of interest rate risk, such as repricing risk, curve risk, basis risk and option risk (e.g. behavioural or automatic).
Interest rate risk in the balance sheet and market conditions and outlooks could necessitate certain financial measures to achieve Grupo Santander's desired risk profile (such as selling positions or setting interest rates on products Grupo Santander markets).
The metrics Grupo Santander uses to monitor IRRBB include NII and EVE sensitivity to interest rate movements.
•Net interest income sensitivity
Net interest income (NII) is the difference between interest income from assets and the interest cost of liabilities in the banking book over a typical one- to three-year horizon (one year being standard in Grupo Santander). Because NII sensitivity is the difference in income between a selected scenario and the base scenario, its values can be as many as considered scenarios. It enables us to see short-term risks and supplement economic value of equity (EVE) sensitivity.
•Economic value of equity sensitivity
Economic value of equity (EVE) is the difference between the current value of all assets minus the current value of all liabilities in the banking book. It does not include shareholders’ equity and non-interest-bearing instruments. The sensitivity of the economic value of own funds is obtained as the difference between said economic value calculated with a selected scenario and that calculated with a base scenario.
Because EVE sensitivity is the difference in EVE between a selected scenario and the base scenario, it can have as many values as considered scenarios. It enables us to see long-term risks and supplement NII sensitivity.
Structural exchange-rate risk/hedging of results
Every day, Grupo Santander measures FX positions, VaR and P/L.
Structural equity risk
Grupo Santander measures equity positions, VaR and P/L.
4. Liquidity risk
Structural liquidity management aims to fund the Group’s recurring activity optimising maturities and costs, while avoiding taking on undesired liquidity risks.
Santander’s liquidity management is based on the following principles:
•Define liquidity risk and provide detailed assessments of current and emerging material liquidity risks.
•Define liquidity risk metrics, review and challenge liquidity risk appetite and limits on first line of defence proposals.
•Evaluates and challenges commercial/business proposals; It provides senior management and business units with the necessary elements to understand the liquidity risk of Santander's businesses and operations.
•Supervise the liquidity risk management of the first line of defence and assess the permanence of businesses within the limits of liquidity risk.
•Reports on compliance with risk appetite limits and exceptions, if any, to governing bodies.
•Provides a consolidated view of liquidity risk exposures and liquidity risk profile.
•Confirms the existence of adequate liquidity procedures to manage the business within the limits of risk appetite.
The effective application of these principles by all institutions comprising the Group required the development of a unique management framework built upon three fundamental pillars:
•A solid organisational and governance model that ensures the involvement of the subsidiaries’ senior management in decision-taking and its integration into the Group’s global strategy. The decision-making process for all structural risks, including liquidity and funding risk, is carried out by local Asset and Liability Committees (ALCOs) in coordination with the global ALCO, which is the body empowered by the Bank's board in accordance with the corporate Asset and Liability Management (ALM) framework.
This governance model has been reinforced as it has been included within Santander's Risk Appetite Framework. This framework meets demands from regulators and market players emanating from the financial crisis to strengthen banks’ risk management and control systems.
•In-depth balance sheet analysis and measurement of liquidity risk, supporting decision-taking and its control. The Group objective is to maintains adequate liquidity levels necessary to cover its short- and long-term needs with stable funding sources, optimising the impact of their costs on the income statement. Grupo Santander’s liquidity risk management processes are contained within a conservative risk appetite framework established in each geographic area in accordance with its commercial strategy. This risk appetite establishes the limits within which the subsidiaries can operate in order to achieve their strategic objectives.
•Management adapted in practice to the liquidity needs of each business. Every year, based on business needs, a liquidity plan is developed which seeks to achieve:
•a solid balance sheet structure, with a diversified presence in the wholesale markets;
•the use of liquidity buffers and limited encumbrance of assets;
•compliance with both regulatory metrics and other metrics included in each entity’s risk appetite statement.
Over the course of the year, all dimensions of the plan are monitored.
774
Grupo Santander continues to develop the ILAAP (Internal Liquidity Adequacy Assessment Process), an internal self-assessment of liquidity adequacy which must be integrated into the Group’s other risk management and strategic processes. It focuses on both quantitative and qualitative matters and is used as an input to the SREP (Supervisory Review and Evaluation Process). The ILAAP evaluates the liquidity position both in ordinary and stressed scenarios.
i. Liquidity risk measurement
Grupo Santander uses the Basel regulatory definition and calculates a set of metrics and stress scenarios in relation to intraday liquidity risk to maintain a high level of management and control. On the one hand, the regulatory liquidity metrics (LCR, NSFR) are prepared following the regulatory criteria established in the CRR-II and CRD IV. Regarding internal metrics, liquidity scenarios are determined using a combination of behavioral observation in actual liquidity crises occurred at other banks, regulatory assumptions and expert judgment.
a) Liquidity Coverage Ratio (LCR)
The liquidity coverage ratio (LCR) is a regulatory metric. Its purpose is to promote the short-term resilience of a bank’s liquidity profile and make sure it has enough high-quality liquid assets to withstand a considerable idiosyncratic or market stress scenario over 30 calendar days.
b) Net Stable Funding Ratio (NSFR)
The net stable funding ratio (NSFR) is a regulatory metric we use to measure long-term liquidity risk. It is the ratio of available stable funding to required stable funding. It requires banks to keep a robust balance sheet, with off-balance-sheet assets and operations financed by stable liabilities.
c) Liquidity buffer
The liquidity buffer is the total liquid assets a bank has to cope with cash outflows during periods of stress. The assets are free of encumbrances and can be used immediately to generate liquidity without losses or excessive discounts. The liquidity buffer is a tool for calculating most liquidity metrics. It is also a metric with defined limits for each subsidiary.
d) Wholesale liquidity metric
The wholesale liquidity metric measures the number of days Grupo Santander would survive if it used liquid assets to cover lost liquidity from a wholesale deposit run-off (without possible renewal) over a set time horizon. Grupo Santander also uses it as an internal short-term liquidity metric to reduce risk from dependence on wholesale funding.
e) Asset Encumbrance metrics
Grupo Santander calculates two metrics to measure asset encumbrance risk. On the one hand, the asset encumbrance ratio gives the proportion of encumbered assets to total assets; on the other, the structural asset encumbrance ratio gives the proportion of encumbered assets by structural funding transaction (namely long-term collateralized issues and credit transactions with central banks).
f) Other additional liquidity indicators
In addition to traditional tools to measure short and long-term liquidity and funding risk, Grupo Santander has a set of additional liquidity indicators to complement those and to measure other non-covered liquidity risk factors. These include concentration metrics, such as the main and the five largest funding counterparties, or the distribution of funding by maturity.
In this sense, deposits do not show a tendency towards concentration, maintaining a stable structure at 31 December 2023, where approximately 75 % are transactional and more than 80 % of retail deposits are insured by deposit guarantee systems of the different countries.
g) Liquidity scenario analysis
As liquidity stress tests, four standard scenarios have been defined:
i.An idiosyncratic scenario of events detrimental only to Santander;
ii.a local market scenario of events highly detrimental to a base country’s financial system or real economy;
iii.a global market scenario of events highly detrimental to the global financial system; and
iv.combined scenario consisting of a combination of more severe idiosyncratic and market events (local and global) occurring simultaneously and interactively.
v.climate scenarios where different stress cases derived from the effects that climate change could have on the economy are collected.
Grupo Santander uses these stress test outcomes as tools to determine risk appetite and support business decision-making.
h) Liquidity early warning indicators
The system of early warning indicators (EWI) consists of quantitative and qualitative liquidity indicators that help predict stress situations and weaknesses in the funding and liquidity structure of Grupo Santander entities. External indicators relate to market-based financial variables; internal indicators relate to our own performance.
i) Intraday liquidity metrics
Grupo Santander follows Basel regulation and calculates several metrics and stress scenarios for intraday liquidity risk to maintain a high level of control.
ii. Liquidity coverage ratio and net stable financing ratio
As regards the liquidity coverage ratio (LCR), the regulatory requirement for this ratio, set at 100%, has been at its maximum level since 2018.
Below is a breakdown of the composition of the Group's liquid assets under the criteria set out in the supervisory prudential reporting (Commission Implementing Regulation (EU) 2017/2114 of 9 November 2017) for the determination of high quality liquid assets for the calculation of the LCR ratio (HQLA):
775
| EUR million | |||||||||||
| 2023 | 2022 | 2021 | |||||||||
| Amount weighted applicable | Amount weighted applicable | Amount weighted applicable | |||||||||
| High-quality liquid assets-HQLAs | |||||||||||
| Cash and reserves available at central banks | |||||||||||
| Marketable assets Level 1 | |||||||||||
| Marketable assets Level 2A | |||||||||||
| Marketable assets Level 2B | |||||||||||
| Total high-quality liquid assets | |||||||||||
In relation to the net stable funding ratio (NSFR), its definition was approved by the Basel Committee in October 2014. The transposition of this requirement to the European regulation took place in June 2019 with the publication in the Official Gazette of the European Union of Regulation (EU) 2019/876 of the European Parliament and of the Council of 20 May 2019. The Regulation establishes that entities must have a net stable financing ratio, as defined in the Regulation, higher 100% from June 2021. The liquidity coverage ratio, broken down by component, and the net stable funding ratio for the Group at year-ends 2023, 2022 and 2021are presented below:
| EUR million | |||||||||||
| 2023 | 2022 | 2021 | |||||||||
| High-quality liquid assets-HQLAs (numerator) | |||||||||||
| Total net cash outflows (denominator) | |||||||||||
| Cash outflows | |||||||||||
| Cash inflows | |||||||||||
| LCR ratio (%) | % | % | % | ||||||||
| NSFR ratio (%) | % | % | % | ||||||||
As regards the funding structure, given the predominantly commercial nature of the Group's balance sheet, the loan portfolio is mainly financed by customer deposits. Note 22, 'Debt securities', shows the composition of these liabilities based on the basis of their nature and classification, the movements and maturity profile of the debt securities issued by the Group, reflecting the strategy of diversification by products, markets, issuers and maturities followed by the Group in its approach to wholesale markets.
The movement in the composition of the buffer between “Level 1 marketable assets” to “Cash and reserves available at central banks” corresponds to a change in criteria in the classification of deposits with the Central Bank, at the request of the regulator.
In the last quarter of 2022, Grupo Santander began to repay in advance a significant part of the financing received under the TLTRO-III program launched by the European Central Bank, which originally matured in 2023. The replacement of these funds has been carried out after having strengthened the balance sheet through a combination of growth in customer deposits, an increase in short-term instruments and greater activity in medium and long-term issuances, which has allowed Grupo Santander to maintain liquidity coverage ratios (LCR ) and net stable funding (NSFR) at prudent levels after the repayment.
iii. Asset encumbrance
Finally, the moderate use of assets by Grupo Santander as collateral in the sources of structural financing of the balance sheet should be highlighted.
In accordance with the guidelines established by the European Banking Authority (EBA) in 2014 on committed and uncommitted assets, the concept of assets committed in financing transactions (asset encumbrance) includes both on-balance sheet assets provided as collateral in transactions to obtain liquidity and off-balance sheet assets that have been received and reused for similar purposes, as well as other assets associated with liabilities for reasons other than financing.
776
The residual maturities of the liabilities associated with the assets and guarantees received and committed are presented below, as of 31 of December of 2023 (EUR thousand million):
| Residual maturities of the liabilities | Unmatured | <=1month | >1 month <=3 months | >3 months <=12 months | >1 year <=2 years | >2 years <=3 years | 3 years <=5 years | 5 years <=10 years | >10 years | Total | ||||||||||||||||||||||
| Committed assets | ||||||||||||||||||||||||||||||||
| Guarantees received committed | ||||||||||||||||||||||||||||||||
The reported Group information as required by the EBA at 2023 year-end is as follows:
| On-balance-sheet encumbered assets | ||||||||||||||
| EUR billion | ||||||||||||||
| Carrying amount of encumbered assets | Fair value of encumbered assets | Fair value of non-encumbered assets | Carrying amount of non-encumbered assets | |||||||||||
| Loans and advances | ||||||||||||||
| Equity instruments | ||||||||||||||
| Debt securities | ||||||||||||||
| Other assets | ||||||||||||||
| Total assets | ||||||||||||||
| Encumbrance of collateral received | ||||||||
| EUR billion | ||||||||
| Fair value of encumbered collateral received or own debt securities issued | Fair value of collateral received or own debt securities issued available for encumbrance | |||||||
| Collateral received | ||||||||
| Loans and advances | ||||||||
| Equity instruments | ||||||||
| Debt securities | ||||||||
| Other collateral received | ||||||||
| Own debt securities issued other than own covered bonds or ABSs | ||||||||
| Encumbered assets and collateral received and matching liabilities | ||||||||
| EUR billion | ||||||||
| Matching liabilities, contingent liabilities or securities lent | Assets, collateral received and own debt securities issued other than covered bonds and ABSs encumbered | |||||||
| Total sources of encumbrance (carrying amount) | ||||||||
On-balance-sheet encumbered assets amounted to EUR 306,300 million, of which 61 % are loans (mortgage loans, corporate loans, etc.). Guarantees received committed amounted to EUR 138,800 million, relating mostly to debt securities received as security in asset purchase transactions and re-used.
Taken together, these two categories represent a total of EUR 445,200 million of encumbered assets, which give rise to EUR 330,600 million matching liabilities.
As of December 2023, total asset encumbrance in funding operations represented 22.4 % of the Group’s extended balance sheet under EBA criteria (total assets plus guarantees received: EUR 1,987,100 million), as of December 2022.
d) Capital risk
In the second line of defence, capital risk management can independently challenge business and first-line activities by:
•Supervising capital planning and adequacy exercises through a review of the main components affecting the capital ratios.
•Identifying key metrics to calculate the Group’s regulatory capital, setting tolerance levels and analysing significant variations, as well as single transactions with impact on capital.
•Reviewing and challenging the execution of capital actions proposed in line with capital planning and risk appetite.
Grupo Santander commands a sound solvency position, above the levels required by regulators and by the European Central bank.
Regulatory capital
At 1 January 2024, at a consolidated level, the Group must maintain a minimum capital ratio of 9.60 % of CET1 (4.50 % being the requirement for Pillar I, 0.98 % being the requirement for Pillar 2R (requirement), 2.50 % being the requirement for capital conservation buffer, 1.25 % being the requirement for global systemically entity (G-SIB) and 0.37 % being the requirement for anti-cyclical capital buffer).
777
Grupo Santander must also maintain a minimum capital ratio of 11.42 % of tier 1 and a minimum total ratio of 13.86 %.
In 2023, the solvency target set was achieved. Santander’s CET1 ratio stood at 12.30 %1 at the close of the year, demonstrating its organic capacity to generate capital. The key regulatory capital figures are indicated below:
| Reconciliation of accounting capital with regulatory capital | |||||||||||
| EUR million | |||||||||||
| 2022 | 2021 | 2020 | |||||||||
| Subscribed capital | |||||||||||
| Share premium account | |||||||||||
| Reserves | |||||||||||
| Treasury shares | ( | ( | ( | ||||||||
| Attributable profit | |||||||||||
Approved dividendC | ( | ( | ( | ||||||||
| Shareholders’ equity on public balance sheet | |||||||||||
| Valuation adjustments | ( | ( | ( | ||||||||
| Non-controlling interests | |||||||||||
| Total Equity on public balance sheet | |||||||||||
| Goodwill and intangible assets | ( | ( | ( | ||||||||
| Eligible preference shares and participating securities | |||||||||||
Accrued dividendC | ( | ( | ( | ||||||||
Other adjustmentsA | ( | ( | ( | ||||||||
Tier 1B | |||||||||||
A.Fundamentally for non-computable non-controlling interests and deductions and reasonable filters in compliance with CRR.
B.Figures calculated by applying the transitional provisions of IFRS 9.
C.Assumes 25 % of ordinary profit, see note 4.a for proposed distribution of results.
Note: Certain figures presented in this capital note have been rounded for ease of presentation. Consequently, the amounts corresponding to the rows or columns of totals in the tables presented in this note may not coincide with the arithmetic sum of the concepts or items that make up the total.
1
The following table shows the capital coefficients and a detail of the eligible internal resources of the Group:
| Capital coefficients | |||||||||||
| EUR million | |||||||||||
| 2023 | 2022 | 2021 | |||||||||
| Level 1 ordinary eligible capital (EUR million) | |||||||||||
| Level 1 additional eligible capital (EUR million) | |||||||||||
| Level 2 eligible capital (EUR million) | |||||||||||
| Risk-weighted assets (EUR million) | |||||||||||
| Level 1 ordinary capital coefficient (CET 1) | % | % | % | ||||||||
| Level 1 additional capital coefficient (AT1) | % | % | % | ||||||||
| Level 1 capital coefficient (TIER1) | % | % | % | ||||||||
| Level 2 capital coefficient (TIER 2) | % | % | % | ||||||||
| Total capital coefficient | % | % | % | ||||||||
| Eligible capital | |||||||||||
| EUR million | |||||||||||
| 2023 | 2022 | 2021 | |||||||||
| Eligible capital | |||||||||||
| Common Equity Tier I | |||||||||||
| Capital | |||||||||||
| (-) Treasure shares and own shares financed | ( | ( | ( | ||||||||
| Share Premium | |||||||||||
| Reserves | |||||||||||
| Other retained earnings | ( | ( | ( | ||||||||
| Minority interests | |||||||||||
| Profit net of dividends | |||||||||||
| Deductions | ( | ( | ( | ||||||||
| Goodwill and intangible assets | ( | ( | ( | ||||||||
| Others | ( | ( | ( | ||||||||
| Additional Tier I | |||||||||||
| Eligible instruments AT1 | |||||||||||
| AT1-excesses-subsidiaries | ( | ||||||||||
| Tier II | |||||||||||
| Eligible instruments T2 | |||||||||||
Excess IRB provision on PE | |||||||||||
| T2-excesses - subsidiaries | ( | ( | ( | ||||||||
| Total eligible capital | |||||||||||
Note: Banco Santander, S.A. and its affiliates had not taken part in any State aid programmes.
1 Data calculated applying the transitional provisions of IFRS 9
778
Leverage ratio
Basel III established the leverage ratio as a non-risk sensitive measure aimed at limiting excessive balance sheet growth relative to available capital.
The Group performs the calculation in accordance with Regulation (EU) 2019/876 of 20 May 2019 amending Regulation (EU) No 575/2013 as regards the leverage ratio.
This ratio is calculated as tier 1 capital divided by leverage exposure. Exposure is calculated as the sum of the following items:
•Accounting assets, excluding derivatives and items treated as deductions from tier 1 capital (for example, the balance of loans is included, but not that of goodwill) further excluding the exposures referred to in Article 429.a (1) of the regulation.
•Off-balance-sheet items (mainly guarantees, unused credit limits granted and documentary credits) weighted using credit conversion factors.
•Inclusion of net value of derivatives (gains and losses are netted with the same counterparty, minus collaterals if they comply with certain criteria) plus a charge for the future potential exposure.
•A charge for the potential risk of security funding transactions.
•Lastly, it includes a charge for the risk of credit derivative swaps (CDS).
With the publication of Regulation (EU) 2019/876 of 20 May, 2019, amending Regulation (EU) n.º 575/2013 as regards the leverage ratio, the final calibration of the ratio is set at 3% for all entities and, for systemic entities G-SIB, is established an additional surcharge which will be 50% of the cushion ratio applicable to the EISM, applicable from January 2023. In addition, modifications are included in its calculation, including the exclusion of certain exposures from the total exposure measure: public loans when exceptional circumstances arise, public loans, transfer loans and officially guaranteed export credits, transfer loans and officially guaranteed export credits.
| EUR million | |||||||||||
| 2023 | 2022 | 2021 | |||||||||
| Leverage | |||||||||||
| Level 1 Capital | |||||||||||
| Exposure | |||||||||||
| Leverage Ratio | % | % | % | ||||||||
Global systemically important banks
Grupo Santander is one of 29 banks designated as global systemically important banks (G-SIBs).
The designation as a globally systemic entity comes from a measurement established by the regulators (FSB and BCBS) that they have implemented based on five indicators (size, interjurisdictional activity, interconnection with other financial entities, substitutability and complexity). The application methodology has been modified in December 2021, incorporating, among other things, an additional score considering the Member States of the SRM as a single jurisdiction.
This definition means it has to fulfil certain additional requirements, which consist mainly of a capital buffer (1 %), in TLAC requirements (total loss absorbing capacity), that Grupo Santander has to publish relevant information more frequently than other banks, greater regulatory requirements for internal control bodies, special supervision and drawing up of special reports to be submitted to supervisors.
Additionally, Grupo Santander appears both on the list of global systemic entities and on the list of domestic systemic entities. Bank of Spain, based on rule 23 of Circular 2/2016, requires the application of the highest of the two corresponding buffers, in the case of Grupo Santander being the domestic one, 1.25 %, a surcharge payable by 2024.
The fact that Grupo Santander has to comply with these requirements makes it a more solid bank than its domestic rivals.
779
55. Additional disclosures
This note includes relevant information about additional disclosure requirements.
55.1 Parent company financial statements
Following are the summarised balance sheets of Banco Santander, S.A. as of December 31, 2023, 2022 and 2021 :
| CONDENSED BALANCE SHEETS (Parent company only) | 31 December 2023 | 31 December 2022 | 31 December 2021 | |||||||||||||||||
| (Millions of Euros) | ||||||||||||||||||||
| Assets | ||||||||||||||||||||
| Cash and due from banks | ||||||||||||||||||||
| Of which: | ||||||||||||||||||||
| To bank subsidiaries | ||||||||||||||||||||
| Trading account assets | ||||||||||||||||||||
| Investment securities | ||||||||||||||||||||
| Of which: | ||||||||||||||||||||
| To bank subsidiaries | ||||||||||||||||||||
| To non-bank subsidiaries | ||||||||||||||||||||
| Net loans and leases | ||||||||||||||||||||
| Of which: | ||||||||||||||||||||
| To non-bank subsidiaries | ||||||||||||||||||||
| Investment in affiliated companies | ||||||||||||||||||||
| Of which: | ||||||||||||||||||||
| To bank subsidiaries | ||||||||||||||||||||
| To non-bank subsidiaries | ||||||||||||||||||||
| Premises and equipment, net | ||||||||||||||||||||
| Other assets | ||||||||||||||||||||
| Total assets | ||||||||||||||||||||
| Liabilities | ||||||||||||||||||||
| Deposits | ||||||||||||||||||||
| Of which: | ||||||||||||||||||||
| To bank subsidiaries | ||||||||||||||||||||
| To non-bank subsidiaries | ||||||||||||||||||||
| Short-term debt | ||||||||||||||||||||
| Long-term debt | ||||||||||||||||||||
| Total debt | ||||||||||||||||||||
| Of which: | ||||||||||||||||||||
| To bank subsidiaries | ||||||||||||||||||||
| To non-bank subsidiaries | ||||||||||||||||||||
| Other liabilities | ||||||||||||||||||||
| Total liabilities | ||||||||||||||||||||
| Stockholders' equity | ||||||||||||||||||||
| Capital stock | ||||||||||||||||||||
| Retained earnings and other reserves | ||||||||||||||||||||
| Total stockholders' equity | ||||||||||||||||||||
| Total liabilities and Stockholders’ Equity | ||||||||||||||||||||
In the financial statements of the Parent Company, investments in subsidiaries, jointly controlled entities and associates are recorded at cost.
780
Following are the condensed statements of income of Banco Santander, S.A. for the years ended December 31, 2023, 2022 and 2021.
| Year ended | ||||||||||||||||||||
| CONDENSED STATEMENTS OF INCOME (Parent company only) | 31 December 2023 | 31 December 2022 | 31 December 2021 | |||||||||||||||||
| (Millions of Euros) | ||||||||||||||||||||
| Interest income | ||||||||||||||||||||
| Interest from earning assets | ||||||||||||||||||||
| Dividends from affiliated companies | ||||||||||||||||||||
| Of which: | ||||||||||||||||||||
| From bank subsidiaries | ||||||||||||||||||||
| From non-bank subsidiaries | ||||||||||||||||||||
| Interest expense | ( | ( | ( | |||||||||||||||||
| Interest income / (charges) | ||||||||||||||||||||
| Provision for credit losses | ( | ( | ( | |||||||||||||||||
| Interest income / (charges) after provision for credit losses | ||||||||||||||||||||
| Non-interest income | ||||||||||||||||||||
| Non-interest expense | ( | ( | ( | |||||||||||||||||
| Income before income taxes | ||||||||||||||||||||
| Income tax benefit (expense) | ( | ( | ||||||||||||||||||
| Net income | ||||||||||||||||||||
781
Following are the condensed statements of comprehensive income of Banco Santander, S.A. for the years ended December 31, 2023, 2022 and 2021:
| Year ended | ||||||||||||||||||||
| CONDENSED STATEMENTS OF COMPREHENSIVE INCOME (Parent company only) | 31 December 2023 | 31 December 2022 | 31 December 2021 | |||||||||||||||||
| (Millions of Euros) | ||||||||||||||||||||
| NET INCOME | ||||||||||||||||||||
| OTHER COMPREHENSIVE INCOME | ( | ( | ( | |||||||||||||||||
| Items that may be reclassified subsequently to profit or loss | ( | ( | ||||||||||||||||||
| Hedging instruments (items not designated) | ||||||||||||||||||||
| Revaluation gains (losses) | ||||||||||||||||||||
| Amounts transferred to income statement | ||||||||||||||||||||
| Other reclassifications | ||||||||||||||||||||
| Debt instruments at fair value with changes in other comprehensive income | ( | ( | ||||||||||||||||||
| Revaluation gains (losses) | ( | ( | ||||||||||||||||||
| Amounts transferred to income statement | ( | ( | ||||||||||||||||||
| Other reclassifications | ||||||||||||||||||||
| Cash flow hedges: | ( | |||||||||||||||||||
| Revaluation gains/(losses) | ( | ( | ||||||||||||||||||
| Amounts transferred to income statement | ( | |||||||||||||||||||
| Amounts transferred to initial carrying amount of hedged items | ||||||||||||||||||||
| Other reclassifications | ||||||||||||||||||||
| Hedges of net investments in foreign operations: | ||||||||||||||||||||
| Exchange differences | ||||||||||||||||||||
| Non-current assets held for sale | ||||||||||||||||||||
| Income tax | ( | |||||||||||||||||||
| Items that will not be reclassified to profit or loss | ( | ( | ( | |||||||||||||||||
| Actuarial gains/(losses) on pension plans | ( | |||||||||||||||||||
| Other recognised income and expense of investments in subsidiaries, joint ventures and associates | ||||||||||||||||||||
| Changes in the fair value of equity instruments measured at fair value through other comprehensive income | ( | ( | ( | |||||||||||||||||
| Gains or losses resulting from the accounting for hedges of equity instruments measured at fair value through other comprehensive income, net | ||||||||||||||||||||
| Changes in the fair value of equity instruments measured at fair value through other comprehensive income (hedged item) | ( | |||||||||||||||||||
| Changes in the fair value of equity instruments measured at fair value through other comprehensive income (hedging instrument) | ( | ( | ||||||||||||||||||
| Changes in the fair value of financial liabilities at fair value through profit or loss attributable to changes in credit risk | ( | ( | ||||||||||||||||||
| Income tax relating to items that will not be reclassified | ( | |||||||||||||||||||
| TOTAL COMPREHENSIVE INCOME | ||||||||||||||||||||
782
Following are the condensed cash flow statements of Banco Santander, S.A. for the years ended December 31, 2023, 2022 and 2021.
| Year ended | ||||||||||||||||||||
| CONDENSED CASH FLOW STATEMENTS (Parent company only) | 31 December 2023 | 31 December 2022 | 31 December 2021 | |||||||||||||||||
| (Millions of Euros) | ||||||||||||||||||||
| 1. Cash flows from operating activities | ||||||||||||||||||||
| Consolidated profit | ||||||||||||||||||||
| Adjustments to profit | ( | |||||||||||||||||||
| Net increase/decrease in operating assets | ( | ( | ( | |||||||||||||||||
| Net increase/decrease in operating liabilities | ( | |||||||||||||||||||
| Reimbursements/payments of income tax | ( | ( | ( | |||||||||||||||||
| Total net cash flows from operating activities (1) | ( | |||||||||||||||||||
| 2. Cash flows from investing activities | ||||||||||||||||||||
| Investments (-) | ( | ( | ( | |||||||||||||||||
| Divestments (+) | ||||||||||||||||||||
| Total net cash flows from investment activities (2) | ||||||||||||||||||||
| 3. Cash flows from financing activities | ||||||||||||||||||||
| Issuance of own equity instruments | ||||||||||||||||||||
| Disposal of own equity instruments | ||||||||||||||||||||
| Acquisition of own equity instruments | ( | ( | ( | |||||||||||||||||
| Issuance of debt securities | ||||||||||||||||||||
| Redemption of debt securities | ( | ( | ( | |||||||||||||||||
| Dividends paid | ( | ( | ( | |||||||||||||||||
| Issuance/Redemption of equity instruments | ||||||||||||||||||||
| Other collections/payments related to financing activities | ( | ( | ( | |||||||||||||||||
| Total net cash flows from financing activities (3) | ( | ( | ( | |||||||||||||||||
| 4. Effect of exchange rate changes on cash and cash equivalents (4) | ( | |||||||||||||||||||
| 5. Net increase/decrease in cash and cash equivalents (1+2+3+4) | ( | |||||||||||||||||||
| Cash and cash equivalents at beginning of period | ||||||||||||||||||||
| Cash and cash equivalents at end of period | ||||||||||||||||||||
55.2 Preference Shares and Preferred Securities
The following table shows the balance of the preference shares and preferred securities as of 31 December 2023, 2022 and 2021:
| 2023 | 2022 | 2021 | ||||||||||||||||||
| (Millions of Euros) | ||||||||||||||||||||
| Preference shares | ||||||||||||||||||||
| Preferred securities | ||||||||||||||||||||
| Total | ||||||||||||||||||||
Both Preference Shares and Preferred Securities are recorded under the “Financial liabilities at amortized cost - Subordinated Liabilities” caption in the consolidated balance sheet as of December 31, 2023, 2022 and 2021.
Preference Shares include the financial instruments issued by the consolidated companies which, although equity for legal purposes, do not meet the requirements for classification as
equity in the financial statements. These shares do not carry any voting rights and are non-cumulative.
Preference shares include non-cumulative preferred non-voting shares issued by Santander UK plc.
Preferred securities include non-cumulative preferred non-voting securities issued by Banco Santander, S.A.
For the purposes of payment priority, preferred securities are junior to all general creditors and to subordinated deposits. The payment of dividends on these securities, which have no voting rights, is conditional upon the obtainment of sufficient distributable profit and upon the limits imposed by Spanish banking regulations on equity.
Preference shares and preferred securities are perpetual securities and there is no obligation that requires the Group to redeem them. All securities have been fully subscribed by third parties outside the Group.
783
Santander Finance Preferred, S.A. (Unipersonal)- issuer of registered securities guaranteed by Banco Santander, S.A.
until November 2017, merged in that date with Banco Santander, S.A.
For further information, see note 23.c.
| Outstanding at 31 December 2023 | ||||||||||||||||||||||||||
| Preference Shares Issuer/Date of issue | Currency | Amount in currency (million) | Interest rate | Redemption Option (A) | ||||||||||||||||||||||
| Santander UK plc, October 1995 | Pounds Sterling | No option | ||||||||||||||||||||||||
| Santander UK plc, February 1996 | Pounds Sterling | No option | ||||||||||||||||||||||||
| Outstanding at 31 December 2023 | ||||||||||||||||||||||||||
| Preferred Securities Issuer/Date of issue | Currency | Amount in currency (million) | Interest rate | Maturity date | ||||||||||||||||||||||
| Banco Santander, S.A., March 2018 | Euro | (B) | Perpetuity | |||||||||||||||||||||||
| Banco Santander, S.A., February 2019 | US Dollar | (C) | Perpetuity | |||||||||||||||||||||||
| Banco Santander, S.A., January 2020 | Euro | (D) | Perpetuity | |||||||||||||||||||||||
| Banco Santander, S.A., May 2021 | US Dollar | (E) | Perpetuity | |||||||||||||||||||||||
| Banco Santander, S.A., May 2021 | Euro | (F) | Perpetuity | |||||||||||||||||||||||
| Banco Santander, S.A., September 2021 | Euro | (G) | Perpetuity | |||||||||||||||||||||||
| Banco Santander, S.A., November 2023 | US Dollar | (H) | Perpetuity | |||||||||||||||||||||||
| Banco Santander, S.A., November 2023 | US Dollar | (I) | Perpetuity | |||||||||||||||||||||||
| Santander Finance Preferred, S.A. (Unipersonal), September 2004 | Euro | €CMS 10 + | Perpetuity | |||||||||||||||||||||||
A.From these dates the issuer can redeem the shares, subject to prior authorization by the national supervisor.
B.Payment is subject to certain conditions and to the discretion of the Bank. The 4.75 % interest rate is set for the first seven years . After that, it will be reviewed by applying a margin of 409.7 basis points on the Mid-Swap Rate.
C.Payment is subject to certain conditions and to the discretion of the Bank. The 7.50 % interest rate is set for the first five years . After that, it will be reviewed every 5 years by applying a margin of 498.9 basis point over the SOFR Spread Adjusted ICE Swap 5-year .
D. Payment is subject to certain conditions and to the discretion of the Bank. The 4.375 % interest rate is set for the first six years . After that, it will be reviewed every 5 years by applying a margin of 453.4 basis point on the 5 -year Mid-Swap Rate.
E.Payment is subject to certain conditions and to the discretion of Banco Santander. The 4.750 % interest rate is set for the first six years , revised every 5 years thereafter by applying a margin of 375.3 basis points over the 5 -year UST rate.
F.Payment is subject to certain conditions and to the discretion of Banco Santander. The 4.125 % interest rate is set for the first seven years , revised every 5 years thereafter by applying a margin of 431.1 basis points over the applicable 5 -year Euro mid-swap.
G. Payment is subject to certain conditions and to the discretion of Banco Santander. The 3.625 % interest rate is set for the first eight years , revised every 5 years thereafter by applying a margin of 376 basis points over the 5 -year Mid-Swap Rate.
H. Payment is subject to certain conditions and to the discretion of Banco Santander. The 9.625 % interest rate is set for the first five years and six months, revised every 5 years thereafter by applying a margin of 530.6 basis points on the five-year UST rate (5 -year UST).
I. Payment is subject to certain conditions and to the discretion of Banco Santander. The 9.625 % interest rate is set for the first ten years , revised every 5 years thereafter by applying a margin of 529.8 basis points on the five-year UST Rate.
784
Appendix | |||||
 | |||||
785
Appendix I
Subsidiaries of Banco Santander, S.A. 1 | |||||||||||||||||||||||
% of ownership held by Banco Santander | Percentage of voting power (d) | ||||||||||||||||||||||
Company | Location | Direct | Indirect | Year 2023 | Year 2022 | Activity | |||||||||||||||||
| 2 & 3 Triton Limited | United Kingdom | 0.00 | % | 100.00 | % | 100.00 | % | 100.00 | % | Real estate | |||||||||||||
| A & L CF (Guernsey) Limited (f) | Guernsey | 0.00 | % | 100.00 | % | 100.00 | % | 100.00 | % | Leasing | |||||||||||||
| A & L CF June (2) Limited (c) | United Kingdom | 0.00 | % | 100.00 | % | 100.00 | % | 100.00 | % | Inactive | |||||||||||||
| A & L CF June (3) Limited | United Kingdom | 0.00 | % | 100.00 | % | 100.00 | % | 100.00 | % | Leasing | |||||||||||||
| A & L CF March (5) Limited (c) | United Kingdom | 0.00 | % | 100.00 | % | 100.00 | % | 100.00 | % | Inactive | |||||||||||||
| A & L CF September (4) Limited | United Kingdom | 0.00 | % | 100.00 | % | 100.00 | % | 100.00 | % | Inactive | |||||||||||||
| Abbey Business Services (India) Private Limited | India | 0.00 | % | 100.00 | % | 100.00 | % | 100.00 | % | Holding company | |||||||||||||
| Abbey Covered Bonds (Holdings) Limited | United Kingdom | — | (a) | — | — | Securitization | |||||||||||||||||
| Abbey Covered Bonds (LM) Limited | United Kingdom | 0.00 | % | 100.00 | % | 100.00 | % | 100.00 | % | Securitization | |||||||||||||
| Abbey Covered Bonds LLP | United Kingdom | — | (a) | — | — | Securitization | |||||||||||||||||
| Abbey National Beta Investments Limited | United Kingdom | 0.00 | % | 100.00 | % | 100.00 | % | 100.00 | % | Inactive | |||||||||||||
| Abbey National Business Office Equipment Leasing Limited | United Kingdom | 0.00 | % | 100.00 | % | 100.00 | % | 100.00 | % | Inactive | |||||||||||||
| Abbey National International Limited | Jersey | 0.00 | % | 100.00 | % | 100.00 | % | 100.00 | % | Financial services | |||||||||||||
| Abbey National Nominees Limited | United Kingdom | 0.00 | % | 100.00 | % | 100.00 | % | 100.00 | % | Inactive | |||||||||||||
| Abbey National PLP (UK) Limited | United Kingdom | 0.00 | % | 100.00 | % | 100.00 | % | 100.00 | % | Inactive | |||||||||||||
| Abbey National Property Investments | United Kingdom | 0.00 | % | 100.00 | % | 100.00 | % | 100.00 | % | Finance company | |||||||||||||
| Abbey National Treasury Services Investments Limited | United Kingdom | 0.00 | % | 100.00 | % | 100.00 | % | 100.00 | % | Inactive | |||||||||||||
| Abbey National Treasury Services Overseas Holdings | United Kingdom | 0.00 | % | 100.00 | % | 100.00 | % | 100.00 | % | Inactive | |||||||||||||
| Abbey National UK Investments | United Kingdom | 0.00 | % | 100.00 | % | 100.00 | % | 100.00 | % | Inactive | |||||||||||||
| Abbey Stockbrokers (Nominees) Limited | United Kingdom | 0.00 | % | 100.00 | % | 100.00 | % | 100.00 | % | Inactive | |||||||||||||
| Abbey Stockbrokers Limited | United Kingdom | 0.00 | % | 100.00 | % | 100.00 | % | 100.00 | % | Inactive | |||||||||||||
| Abent 3T, S.A.P.I de C.V. | Mexico | 0.00 | % | 100.00 | % | 100.00 | % | 100.00 | % | Electricity production | |||||||||||||
| Ablasa Participaciones, S.L. Unipersonal | Spain | 100.00 | % | 0.00 | % | 100.00 | % | 100.00 | % | Holding company | |||||||||||||
| Aduro S.A. | Uruguay | 0.00 | % | 100.00 | % | 100.00 | % | 100.00 | % | Payments and collection services | |||||||||||||
| Aevis Europa, S.L. | Spain | 96.34 | % | 0.00 | % | 96.34 | % | 96.34 | % | Cards | |||||||||||||
| AFB SAM Holdings, S.L. | Spain | 1.00 | % | 99.00 | % | 100.00 | % | 100.00 | % | Holding company | |||||||||||||
| Afisa S.A. | Chile | 0.00 | % | 100.00 | % | 100.00 | % | 100.00 | % | Fund management company | |||||||||||||
| Allane Leasing GmbH | Austria | 0.00 | % | 46.95 | % | 100.00 | % | 100.00 | % | Renting | |||||||||||||
| Allane Location Longue Durée S.a.r.l. | France | 0.00 | % | 46.95 | % | 100.00 | % | 100.00 | % | Renting | |||||||||||||
| Allane Mobility Consulting AG | Switzerland | 0.00 | % | 46.95 | % | 100.00 | % | 100.00 | % | Consulting services | |||||||||||||
| Allane Mobility Consulting B.V. | Netherlands | 0.00 | % | 46.95 | % | 100.00 | % | 100.00 | % | Consulting services | |||||||||||||
786
Subsidiaries of Banco Santander, S.A. 1 | |||||||||||||||||||||||
% of ownership held by Banco Santander | Percentage of voting power (d) | ||||||||||||||||||||||
Company | Location | Direct | Indirect | Year 2023 | Year 2022 | Activity | |||||||||||||||||
| Allane Mobility Consulting GmbH | Germany | 0.00 | % | 46.95 | % | 100.00 | % | 100.00 | % | Consulting services | |||||||||||||
| Allane Mobility Consulting Österreich GmbH | Austria | 0.00 | % | 46.95 | % | 100.00 | % | 100.00 | % | Consulting services | |||||||||||||
| Allane Mobility Consulting S.a.r.l | France | 0.00 | % | 46.95 | % | 100.00 | % | 100.00 | % | Consulting services | |||||||||||||
| Allane Schweiz AG | Switzerland | 0.00 | % | 46.95 | % | 100.00 | % | 100.00 | % | Renting | |||||||||||||
| Allane SE | Germany | 0.00 | % | 46.95 | % | 92.07 | % | 92.07 | % | Renting | |||||||||||||
| Allane Services GmbH & co. KG | Germany | 0.00 | % | 46.95 | % | 100.00 | % | 100.00 | % | Services | |||||||||||||
| Allane Services Verwaltungs GmbH | Germany | 0.00 | % | 46.95 | % | 100.00 | % | 100.00 | % | Management of portfolios | |||||||||||||
| Alliance & Leicester Cash Solutions Limited | United Kingdom | 0.00 | % | 100.00 | % | 100.00 | % | 100.00 | % | Inactive | |||||||||||||
| Alliance & Leicester Commercial Bank Limited | United Kingdom | 0.00 | % | 100.00 | % | 100.00 | % | 100.00 | % | Inactive | |||||||||||||
| Alliance & Leicester Investments (Derivatives) Limited | United Kingdom | 0.00 | % | 100.00 | % | 100.00 | % | 100.00 | % | Inactive | |||||||||||||
| Alliance & Leicester Investments (No.2) Limited | United Kingdom | 0.00 | % | 100.00 | % | 100.00 | % | 100.00 | % | Inactive | |||||||||||||
| Alliance & Leicester Investments Limited (c) | United Kingdom | 0.00 | % | 100.00 | % | 100.00 | % | 100.00 | % | Inactive | |||||||||||||
| Alliance & Leicester Limited | United Kingdom | 0.00 | % | 100.00 | % | 100.00 | % | 100.00 | % | Inactive | |||||||||||||
| Alliance & Leicester Personal Finance Limited | United Kingdom | 0.00 | % | 100.00 | % | 100.00 | % | 100.00 | % | Finance company | |||||||||||||
| Altamira Santander Real Estate, S.A. | Spain | 100.00 | % | 0.00 | % | 100.00 | % | 100.00 | % | Real estate | |||||||||||||
| Alternative Leasing, FIL (Compartimento B) | Spain | 100.00 | % | 0.00 | % | 100.00 | % | 100.00 | % | Investment fund | |||||||||||||
| Amazonia Trade Limited | United Kingdom | 100.00 | % | 0.00 | % | 100.00 | % | 100.00 | % | Inactive | |||||||||||||
| Amherst Pierpont Commercial Mortgage Securities LLC | United States | 0.00 | % | 100.00 | % | 100.00 | % | 100.00 | % | Securitization | |||||||||||||
| Amherst Pierpont International Ltd. | Hong-Kong | 0.00 | % | 100.00 | % | 100.00 | % | 100.00 | % | Inactive | |||||||||||||
| AMS Auto Markt Am Schieferstein GmbH | Germany | 0.00 | % | 90.01 | % | 100.00 | % | — | Vehicle sales | ||||||||||||||
| AN (123) Limited | United Kingdom | 0.00 | % | 100.00 | % | 100.00 | % | 100.00 | % | Inactive | |||||||||||||
| Andaluza de Inversiones, S.A. Unipersonal | Spain | 0.00 | % | 100.00 | % | 100.00 | % | 100.00 | % | Holding company | |||||||||||||
| ANITCO Limited | United Kingdom | 0.00 | % | 100.00 | % | 100.00 | % | 100.00 | % | Inactive | |||||||||||||
| AP Acquisition Trust I | United States | 0.00 | % | 100.00 | % | 100.00 | % | 100.00 | % | Trust company | |||||||||||||
| AP Acquisition Trust II | United States | 0.00 | % | 100.00 | % | 100.00 | % | 100.00 | % | Inactive | |||||||||||||
| AP Asset Acquisition LLC | United States | 0.00 | % | 100.00 | % | 100.00 | % | 100.00 | % | Financial services | |||||||||||||
| Apê11 Tecnologia e Negócios Imobiliários S.A. | Brazil | 0.00 | % | 81.17 | % | 90.00 | % | 90.00 | % | Real estate | |||||||||||||
| APSG GP LLC | United States | 0.00 | % | 100.00 | % | 100.00 | % | 100.00 | % | Holding company | |||||||||||||
| Aquanima Brasil Ltda. | Brazil | 0.00 | % | 100.00 | % | 100.00 | % | 100.00 | % | E-commerce | |||||||||||||
| Aquanima Chile S.A. | Chile | 0.00 | % | 100.00 | % | 100.00 | % | 100.00 | % | Services | |||||||||||||
| Aquanima México S. de R.L. de C.V. | Mexico | 0.00 | % | 100.00 | % | 100.00 | % | 100.00 | % | E-commerce | |||||||||||||
| Aquanima S.A. | Argentine | 0.00 | % | 100.00 | % | 100.00 | % | 100.00 | % | Services | |||||||||||||
| Artarien S.A. | Uruguay | 100.00 | % | 0.00 | % | 100.00 | % | 100.00 | % | Insurance intermediary | |||||||||||||
| Athena Corporation Limited | United Kingdom | 0.00 | % | 100.00 | % | 100.00 | % | 100.00 | % | Financial services | |||||||||||||
| Atlantes Mortgage No. 2 | Portugal | — | (a) | — | — | Securitization | |||||||||||||||||
| Atlantes Mortgage No. 3 | Portugal | — | (a) | — | — | Securitization | |||||||||||||||||
| Atlantes Mortgage No. 4 | Portugal | — | (a) | — | — | Securitization | |||||||||||||||||
787
Subsidiaries of Banco Santander, S.A. 1 | |||||||||||||||||||||||
% of ownership held by Banco Santander | Percentage of voting power (d) | ||||||||||||||||||||||
Company | Location | Direct | Indirect | Year 2023 | Year 2022 | Activity | |||||||||||||||||
| Atual - Fundo de Invest Multimercado Crédito Privado Investimento no Exterior | Brazil | 0.00 | % | 90.19 | % | 100.00 | % | 100.00 | % | Investment fund | |||||||||||||
| Auto ABS Belgium Loans 2019 SA/NV | Belgium | — | (a) | — | — | Securitization | |||||||||||||||||
| Auto ABS DFP Master Compartment France 2013 | France | — | (a) | — | — | Securitization | |||||||||||||||||
| Auto ABS French Leases 2021 | France | — | (a) | — | — | Securitization | |||||||||||||||||
| Auto ABS French Leases 2023 | France | — | (a) | — | — | Securitization | |||||||||||||||||
| Auto ABS French Leases Master Compartment 2016 | France | — | (a) | — | — | Securitization | |||||||||||||||||
| Auto ABS French Loans Master | France | — | (a) | — | — | Securitization | |||||||||||||||||
| Auto ABS French LT Leases Master | France | — | (a) | — | — | Securitization | |||||||||||||||||
| Auto ABS Italian Balloon 2019-1 S.r.l. | Italy | — | (a) | — | — | Securitization | |||||||||||||||||
| Auto ABS Italian Rainbow Loans S.r.l. | Italy | — | (a) | — | — | Securitization | |||||||||||||||||
| Auto ABS Italian Stella Loans 2023-1 S.r.l. | Italy | — | (a) | — | — | Securitization | |||||||||||||||||
| Auto ABS Spanish Loans 2018-1, Fondo de Titulización | Spain | — | (a) | — | — | Securitization | |||||||||||||||||
| Auto ABS Spanish Loans 2020-1, Fondo de Titulización | Spain | — | (a) | — | — | Securitization | |||||||||||||||||
| Auto ABS Spanish Loans 2022-1, Fondo de Titulización | Spain | — | (a) | — | — | Securitization | |||||||||||||||||
| Autodescuento, S.L. | Spain | 0.00 | % | 93.89 | % | 93.89 | % | 93.89 | % | Vehicles purchased by internet | |||||||||||||
| Autohaus24 GmbH | Germany | 0.00 | % | 46.95 | % | 100.00 | % | 100.00 | % | Internet | |||||||||||||
| Auttar HUT Processamento de Dados Ltda. | Brazil | 0.00 | % | 100.00 | % | 100.00 | % | 100.00 | % | IT services | |||||||||||||
| Aviación Antares, A.I.E. | Spain | 99.99 | % | 0.01 | % | 100.00 | % | 100.00 | % | Renting | |||||||||||||
| Aviación Británica, A.I.E. | Spain | 99.99 | % | 0.01 | % | 100.00 | % | 100.00 | % | Renting | |||||||||||||
| Aviación Comillas, S.L. Unipersonal | Spain | 100.00 | % | 0.00 | % | 100.00 | % | 100.00 | % | Renting | |||||||||||||
| Aviación Laredo, S.L. | Spain | 99.00 | % | 1.00 | % | 100.00 | % | 100.00 | % | Air transport | |||||||||||||
| Aviación Oyambre, S.L. Unipersonal | Spain | 100.00 | % | 0.00 | % | 100.00 | % | 100.00 | % | Renting | |||||||||||||
| Aviación Santillana, S.L. | Spain | 99.00 | % | 1.00 | % | 100.00 | % | 100.00 | % | Renting | |||||||||||||
| Aviación Suances, S.L. | Spain | 99.00 | % | 1.00 | % | 100.00 | % | 100.00 | % | Air transport | |||||||||||||
| Aymoré Crédito, Financiamento e Investimento S.A. | Brazil | 0.00 | % | 90.19 | % | 100.00 | % | 100.00 | % | Finance company | |||||||||||||
| Banco Bandepe S.A. | Brazil | 0.00 | % | 90.19 | % | 100.00 | % | 100.00 | % | Banking | |||||||||||||
| Banco de Albacete, S.A. Unipersonal | Spain | 100.00 | % | 0.00 | % | 100.00 | % | 100.00 | % | Banking | |||||||||||||
| Banco Hyundai Capital Brasil S.A. | Brazil | 0.00 | % | 45.09 | % | 50.00 | % | 50.00 | % | Banking | |||||||||||||
| Banco Santander - Chile | Chile | 0.00 | % | 67.13 | % | 67.18 | % | 67.18 | % | Banking | |||||||||||||
| Banco Santander (Brasil) S.A. | Brazil | 0.04 | % | 90.15 | % | 90.80 | % | 90.90 | % | Banking | |||||||||||||
| Banco Santander (México), S.A., Institución de Banca Múltiple, Grupo Financiero Santander México como Fiduciaria del Fideicomiso 100740 | Mexico | 0.00 | % | 99.97 | % | 100.00 | % | 100.00 | % | Finance company | |||||||||||||
| Banco Santander (México), S.A., Institución de Banca Múltiple, Grupo Financiero Santander México como Fiduciaria del Fideicomiso 2002114 | Mexico | 0.00 | % | 99.97 | % | 100.00 | % | 100.00 | % | Finance company | |||||||||||||
| Banco Santander (México), S.A., Institución de Banca Múltiple, Grupo Financiero Santander México como Fiduciaria del Fideicomiso GFSSLPT | Mexico | 0.00 | % | 99.97 | % | 100.00 | % | 100.00 | % | Finance company | |||||||||||||
| Banco Santander Argentina S.A. | Argentina | 0.00 | % | 99.82 | % | 99.78 | % | 99.77 | % | Banking | |||||||||||||
| Banco Santander de Negocios Colombia S.A. | Colombia | 94.90 | % | 5.10 | % | 100.00 | % | 100.00 | % | Banking | |||||||||||||
| Banco Santander International | United States | 0.00 | % | 100.00 | % | 100.00 | % | 100.00 | % | Banking | |||||||||||||
| Banco Santander International SA | Switzerland | 0.00 | % | 100.00 | % | 100.00 | % | 100.00 | % | Banking | |||||||||||||
| Banco Santander México, S.A., Institución de Banca Múltiple, Grupo Financiero Santander México | Mexico | 24.93 | % | 75.05 | % | 99.97 | % | 96.24 | % | Banking | |||||||||||||
788
Subsidiaries of Banco Santander, S.A. 1 | |||||||||||||||||||||||
% of ownership held by Banco Santander | Percentage of voting power (d) | ||||||||||||||||||||||
Company | Location | Direct | Indirect | Year 2023 | Year 2022 | Activity | |||||||||||||||||
| Banco Santander Perú S.A. | Peru | 99.90 | % | 0.10 | % | 100.00 | % | 100.00 | % | Banking | |||||||||||||
| Banco Santander S.A. | Uruguay | 97.75 | % | 2.25 | % | 100.00 | % | 100.00 | % | Banking | |||||||||||||
| Banco Santander Totta, S.A. | Portugal | 0.00 | % | 99.87 | % | 99.96 | % | 99.96 | % | Banking | |||||||||||||
| Banque Stellantis France | France | 0.00 | % | 50.00 | % | 50.00 | % | 50.00 | % | Banking | |||||||||||||
| Bansa Santander S.A. | Chile | 0.00 | % | 100.00 | % | 100.00 | % | 100.00 | % | Real estate | |||||||||||||
| BEN Benefícios e Serviços Instituição de Pagamento S.A. | Brazil | 0.00 | % | 90.19 | % | 100.00 | % | 100.00 | % | Payment services | |||||||||||||
| BEXs Banco de Cambio S/A | Brazil | 0.00 | % | 66.54 | % | 100.00 | % | — | Payment services | ||||||||||||||
| BEXs Tech Participacoes Ltda. | Brazil | 0.00 | % | 66.54 | % | 100.00 | % | — | Holding company | ||||||||||||||
| BEXs Tecnología da Informacao Ltda. | Brazil | 0.00 | % | 66.54 | % | 100.00 | % | — | IT services | ||||||||||||||
| Bilkreditt 7 Designated Activity Company (c) | Ireland | — | (a) | — | — | Securitization | |||||||||||||||||
| Blecno Investments, S.L. Unipersonal | Spain | 100.00 | % | 0.00 | % | 100.00 | % | 100.00 | % | Real estate | |||||||||||||
| BRS Investments S.A. | Argentine | 5.10 | % | 94.90 | % | 100.00 | % | 100.00 | % | Finance company | |||||||||||||
| Camine D - Services, Unipessoal Lda. | Portugal | 0.00 | % | 100.00 | % | 100.00 | % | — | Software | ||||||||||||||
| Cántabra de Inversiones, S.A. | Spain | 100.00 | % | 0.00 | % | 100.00 | % | 100.00 | % | Holding company | |||||||||||||
| Cántabro Catalana de Inversiones, S.A. | Spain | 100.00 | % | 0.00 | % | 100.00 | % | 100.00 | % | Holding company | |||||||||||||
| Capital Street Delaware LP | United States | 0.00 | % | 100.00 | % | 100.00 | % | 100.00 | % | Holding company | |||||||||||||
| Capital Street Holdings, LLC | United States | 0.00 | % | 100.00 | % | 100.00 | % | 100.00 | % | Holding company | |||||||||||||
| Capital Street REIT Holdings, LLC | United States | 0.00 | % | 100.00 | % | 100.00 | % | 100.00 | % | Holding company | |||||||||||||
| Capital Street S.A. | Luxembourg | 0.00 | % | 100.00 | % | 100.00 | % | 100.00 | % | Finance company | |||||||||||||
| Cartasur Cards S.A. | Argentine | 0.00 | % | 99.82 | % | 100.00 | % | — | Finance company | ||||||||||||||
| Casa de Bolsa Santander, S.A. de C.V., Grupo Financiero Santander México | Mexico | 0.00 | % | 99.97 | % | 99.97 | % | 99.97 | % | Securities company | |||||||||||||
| Cater Allen Holdings Limited | United Kingdom | 0.00 | % | 100.00 | % | 100.00 | % | 100.00 | % | Inactive | |||||||||||||
| Cater Allen International Limited | United Kingdom | 0.00 | % | 100.00 | % | 100.00 | % | 100.00 | % | Inactive | |||||||||||||
| Cater Allen Limited | United Kingdom | 0.00 | % | 100.00 | % | 100.00 | % | 100.00 | % | Banking | |||||||||||||
| Cater Allen Lloyd's Holdings Limited (c) | United Kingdom | 0.00 | % | 100.00 | % | 100.00 | % | 100.00 | % | Inactive | |||||||||||||
| Cater Allen Syndicate Management Limited | United Kingdom | 0.00 | % | 100.00 | % | 100.00 | % | 100.00 | % | Inactive | |||||||||||||
| CCAP Auto Lease Ltd. | United States | 0.00 | % | 100.00 | % | 100.00 | % | 100.00 | % | Leasing | |||||||||||||
| Centro de Capacitación Santander, A.C. | Mexico | 0.00 | % | 99.97 | % | 100.00 | % | 100.00 | % | Non-profit institute | |||||||||||||
| Certidesa, S.L. Unipersonal | Spain | 0.00 | % | 100.00 | % | 100.00 | % | 100.00 | % | Aircraft rental | |||||||||||||
| Charlotte 2023 Funding Plc | United Kingdom | 0.00 | % | 100.00 | % | 100.00 | % | — | Securitization | ||||||||||||||
| Charlotte 2023 Holdings Limited | United Kingdom | — | (a) | — | — | Securitization | |||||||||||||||||
| Chrysler Capital Auto Funding II LLC | United States | 0.00 | % | 100.00 | % | 100.00 | % | 100.00 | % | Finance company | |||||||||||||
| Chrysler Capital Master Auto Receivables Funding 2 LLC | United States | 0.00 | % | 100.00 | % | 100.00 | % | 100.00 | % | Finance company | |||||||||||||
| Cianite New Energy, S.r.l. | Italy | 0.00 | % | 49.00 | % | 70.00 | % | — | Renewable energies | ||||||||||||||
| CIMA Finance DAC Series 2022-1 | Ireland | — | (a) | — | — | Securitization | |||||||||||||||||
| CiMA Finance Designated Activity Company Loan Series 2023-11 | Ireland | — | (a) | — | — | Finance company | |||||||||||||||||
789
Subsidiaries of Banco Santander, S.A. 1 | |||||||||||||||||||||||
% of ownership held by Banco Santander | Percentage of voting power (d) | ||||||||||||||||||||||
Company | Location | Direct | Indirect | Year 2023 | Year 2022 | Activity | |||||||||||||||||
| CiMA Finance Designated Activity Company Series 2023-15 | Ireland | — | (a) | — | — | Finance company | |||||||||||||||||
| Cobranza Amigable, S.A.P.I. de C.V. | Mexico | 0.00 | % | 85.00 | % | 100.00 | % | 100.00 | % | Collection services | |||||||||||||
| Community Development and Affordable Housing Fund LLC | United States | 0.00 | % | 96.00 | % | 96.00 | % | 96.00 | % | Asset management | |||||||||||||
| Compagnie Generale de Credit Aux Particuliers - Credipar S.A. | France | 0.00 | % | 50.00 | % | 100.00 | % | 100.00 | % | Banking | |||||||||||||
| Compagnie Pour la Location de Vehicules - CLV | France | 0.00 | % | 50.00 | % | 100.00 | % | 100.00 | % | Banking | |||||||||||||
| Consulteam Consultores de Gestão, Unipessoal, Lda. | Portugal | 100.00 | % | 0.00 | % | 100.00 | % | 100.00 | % | Real estate | |||||||||||||
| Consumer Totta 1 | Portugal | — | (a) | — | — | Securitization | |||||||||||||||||
| Credileads S.A. | Uruguay | 0.00 | % | 100.00 | % | 100.00 | % | 100.00 | % | Advertising | |||||||||||||
| Cyber Guardian Solutions, S.L. Unipersonal | Spain | 0.00 | % | 100.00 | % | 100.00 | % | — | IT consulting | ||||||||||||||
| Darep Designated Activity Company | Ireland | 100.00 | % | 0.00 | % | 100.00 | % | 100.00 | % | Reinsurances | |||||||||||||
| Decarome, S.A.P.I. de C.V. | Mexico | 0.00 | % | 100.00 | % | 100.00 | % | 100.00 | % | Finance company | |||||||||||||
| Decarope S.A.C. | Peru | 0.00 | % | 100.00 | % | 100.00 | % | — | Investment Company | ||||||||||||||
| Deva Capital Advisory Company, S.L. Unipersonal | Spain | 0.00 | % | 100.00 | % | 100.00 | % | 100.00 | % | Advisory services | |||||||||||||
| Deva Capital Holding Company, S.L. Unipersonal | Spain | 100.00 | % | 0.00 | % | 100.00 | % | 100.00 | % | Holding company | |||||||||||||
| Deva Capital Investment Company, S.L. Unipersonal | Spain | 0.00 | % | 100.00 | % | 100.00 | % | 100.00 | % | Holding company | |||||||||||||
| Deva Capital Management Company, S.L. Unipersonal | Spain | 0.00 | % | 100.00 | % | 100.00 | % | 100.00 | % | Advisory services | |||||||||||||
| Deva Capital Servicer Company, S.L. Unipersonal | Spain | 0.00 | % | 100.00 | % | 100.00 | % | 100.00 | % | Holding company | |||||||||||||
| Diglo Servicer Company 2021, S.L. Unipersonal | Spain | 0.00 | % | 100.00 | % | 100.00 | % | 100.00 | % | Real estate management | |||||||||||||
| Diners Club Spain, S.A. Unipersonal | Spain | 100.00 | % | 0.00 | % | 100.00 | % | 100.00 | % | Cards | |||||||||||||
| Dirección Estratega, S.C. | Mexico | 0.00 | % | 100.00 | % | 100.00 | % | 100.00 | % | Services | |||||||||||||
| Drive Auto Receivables Trust 2020-1 | United States | — | (a) | — | — | Securitization | |||||||||||||||||
| Drive Auto Receivables Trust 2020-2 | United States | — | (a) | — | — | Securitization | |||||||||||||||||
| Drive Auto Receivables Trust 2021-1 | United States | — | (a) | — | — | Securitization | |||||||||||||||||
| Drive Auto Receivables Trust 2021-2 | United States | — | (a) | — | — | Securitization | |||||||||||||||||
| Drive Auto Receivables Trust 2021-3 | United States | — | (a) | — | — | Securitization | |||||||||||||||||
| Drive Auto Receivables Trust 2023-1 | United States | — | (a) | — | — | Inactive | |||||||||||||||||
| Drive Auto Receivables Trust 2023-2 | United States | — | (a) | — | — | Inactive | |||||||||||||||||
| Drive Auto Receivables Trust 2023-3 | United States | — | (a) | — | — | Inactive | |||||||||||||||||
| Drive Auto Receivables Trust 2024-1 | United States | — | (a) | — | — | Inactive | |||||||||||||||||
| Drive S.r.l. | Italy | 0.00 | % | 75.00 | % | 75.00 | % | 100.00 | % | Renting | |||||||||||||
| Ductor Real Estate, S.L. Unipersonal | Spain | 100.00 | % | 0.00 | % | 100.00 | % | 100.00 | % | Real estate | |||||||||||||
| Ebury Brasil Consultoria S.A. | Brazil | 0.00 | % | 66.54 | % | 100.00 | % | 100.00 | % | Consulting services | |||||||||||||
| Ebury Brasil Participacões S.A. | Brazil | 0.00 | % | 66.54 | % | 100.00 | % | 100.00 | % | Holding company | |||||||||||||
| Ebury Facilitadora De Pagamentos Ltda. | Brazil | 0.00 | % | 66.54 | % | 100.00 | % | 100.00 | % | Software | |||||||||||||
| Ebury Finance Belgium NV (c) | Belgium | 0.00 | % | 66.54 | % | 100.00 | % | 100.00 | % | Finance company | |||||||||||||
790
Subsidiaries of Banco Santander, S.A. 1 | |||||||||||||||||||||||
% of ownership held by Banco Santander | Percentage of voting power (d) | ||||||||||||||||||||||
Company | Location | Direct | Indirect | Year 2023 | Year 2022 | Activity | |||||||||||||||||
| Ebury Mass Payments Holdco Limited | United Kingdom | 0.00 | % | 66.54 | % | 100.00 | % | 100.00 | % | Holding company | |||||||||||||
| Ebury Mass Payments Limited | United Kingdom | 0.00 | % | 66.54 | % | 100.00 | % | 100.00 | % | Payment services | |||||||||||||
| Ebury Partners (DIFC) Limited | Arab United Emirates | 0.00 | % | 66.54 | % | 100.00 | % | — | Finance company | ||||||||||||||
| Ebury Partners Australia Pty Ltd. | Australia | 0.00 | % | 66.54 | % | 100.00 | % | 100.00 | % | Finance company | |||||||||||||
| Ebury Partners Belgium NV | Belgium | 0.00 | % | 66.54 | % | 100.00 | % | 100.00 | % | Payment services | |||||||||||||
| Ebury Partners Canada Limited | Canada | 0.00 | % | 66.54 | % | 100.00 | % | 100.00 | % | Finance company | |||||||||||||
| Ebury Partners Chile S.p.A. | Chile | 0.00 | % | 66.54 | % | 100.00 | % | — | Finance company | ||||||||||||||
| Ebury Partners China Limited | China | 0.00 | % | 66.54 | % | 100.00 | % | 100.00 | % | Inactive | |||||||||||||
| Ebury Partners Finance Limited | United Kingdom | 0.00 | % | 66.54 | % | 100.00 | % | 100.00 | % | Finance company | |||||||||||||
| Ebury Partners Holdings Limited | United Kingdom | 0.00 | % | 66.54 | % | 100.00 | % | 100.00 | % | Holding company | |||||||||||||
| Ebury Partners Hong Kong Limited | Hong-Kong | 0.00 | % | 66.54 | % | 100.00 | % | 100.00 | % | Finance company | |||||||||||||
| Ebury Partners Limited | United Kingdom | 0.00 | % | 66.54 | % | 66.54 | % | 66.54 | % | Holding company | |||||||||||||
| Ebury Partners Markets Cyprus Limited | Cyprus | 0.00 | % | 66.54 | % | 100.00 | % | — | Finance company | ||||||||||||||
| Ebury Partners Markets Limited | United Kingdom | 0.00 | % | 66.54 | % | 100.00 | % | 100.00 | % | Finance company | |||||||||||||
| Ebury Partners SA (Pty) Ltd. | Republic of South Africa | 0.00 | % | 66.54 | % | 100.00 | % | 100.00 | % | Inactive | |||||||||||||
| Ebury Partners South Africa (Pty) Ltd | Republic of South Africa | 0.00 | % | 66.54 | % | 100.00 | % | — | Finance company | ||||||||||||||
| Ebury Partners Switzerland AG | Switzerland | 0.00 | % | 66.54 | % | 100.00 | % | 100.00 | % | Finance company | |||||||||||||
| Ebury Partners UK Limited | United Kingdom | 0.00 | % | 66.54 | % | 100.00 | % | 100.00 | % | Electronic money | |||||||||||||
| Ebury Payments PTE Ltd. | Singapur | 0.00 | % | 66.54 | % | 100.00 | % | 100.00 | % | Payment services | |||||||||||||
| Ebury Technology Limited | United Kingdom | 0.00 | % | 66.54 | % | 100.00 | % | 100.00 | % | Software | |||||||||||||
| EDT FTPYME Pastor 3, Fondo de Titulización de Activos | Spain | — | (a) | — | — | Securitization | |||||||||||||||||
| Elcano Renovables, S.L. | Spain | 0.00 | % | 70.00 | % | 70.00 | % | 70.00 | % | Holding company | |||||||||||||
| Electrolyser, S.A. de C.V. | Mexico | 0.00 | % | 99.97 | % | 100.00 | % | 100.00 | % | Services | |||||||||||||
| Elevate Tech Platforms, S.L. Unipersonal | Spain | 100.00 | % | 0.00 | % | 100.00 | % | 100.00 | % | Holding company | |||||||||||||
| Em Dia Serviços Especializados em Cobranças Ltda. | Brazil | 0.00 | % | 90.19 | % | 100.00 | % | 100.00 | % | Collection services | |||||||||||||
| Empresa de Créditos Santander Consumo Perú S.A. | Peru | 100.00 | % | 0.00 | % | 100.00 | % | 100.00 | % | Finance company | |||||||||||||
| Erestone S.A.S. (c) | France | 0.00 | % | 90.00 | % | 90.00 | % | 90.00 | % | Inactive | |||||||||||||
| Esfera Fidelidade S.A. | Brazil | 0.00 | % | 90.19 | % | 100.00 | % | 100.00 | % | Services | |||||||||||||
| Evidence Previdência S.A. | Brazil | 0.00 | % | 90.19 | % | 100.00 | % | 100.00 | % | Insurance | |||||||||||||
| Eyemobile Tecnologia S.A. | Brazil | 0.00 | % | 100.00 | % | 100.00 | % | 60.00 | % | IT services | |||||||||||||
| F1rst Tecnologia e Inovação Ltda. | Brazil | 0.00 | % | 90.19 | % | 100.00 | % | 100.00 | % | IT services | |||||||||||||
| Financeira El Corte Inglés, Portugal, S.F.C., S.A. | Portugal | 0.00 | % | 51.00 | % | 100.00 | % | 100.00 | % | Finance company | |||||||||||||
| Financiera El Corte Inglés, E.F.C., S.A. | Spain | 0.00 | % | 51.00 | % | 51.00 | % | 51.00 | % | Finance company | |||||||||||||
| Finsantusa, S.L. Unipersonal | Spain | 0.00 | % | 100.00 | % | 100.00 | % | 100.00 | % | Holding company | |||||||||||||
791
Subsidiaries of Banco Santander, S.A. 1 | |||||||||||||||||||||||
% of ownership held by Banco Santander | Percentage of voting power (d) | ||||||||||||||||||||||
Company | Location | Direct | Indirect | Year 2023 | Year 2022 | Activity | |||||||||||||||||
| First National Motor plc | United Kingdom | 0.00 | % | 100.00 | % | 100.00 | % | 100.00 | % | Inactive | |||||||||||||
| First National Tricity Finance Limited | United Kingdom | 0.00 | % | 100.00 | % | 100.00 | % | 100.00 | % | Inactive | |||||||||||||
| Fondation Holding Auto ABS Belgium Loans | Belgium | — | (a) | — | — | Securitization | |||||||||||||||||
| Fondo de Titulización PYMES Santander 15 | Spain | — | (a) | — | — | Securitization | |||||||||||||||||
| Fondo de Titulización Santander Consumer Spain Auto 2016-2 | Spain | — | (a) | — | — | Securitization | |||||||||||||||||
| Fondo de Titulización Santander Financiación 1 | Spain | — | (a) | — | — | Securitization | |||||||||||||||||
| Fondo de Titulización, RMBS Santander 7 | Spain | — | (a) | — | — | Securitization | |||||||||||||||||
| Fondos Santander, S.A. Administradora de Fondos de Inversión (en liquidación) (c) | Uruguay | 0.00 | % | 100.00 | % | 100.00 | % | 100.00 | % | Fund management company | |||||||||||||
| Foreign Exchange Solutions (UK) Limited (c) | United Kingdom | 0.00 | % | 66.54 | % | 100.00 | % | 100.00 | % | IT services | |||||||||||||
| Foreign Exchange Solutions S.L. (o) | Spain | 0.00 | % | 66.54 | % | 100.00 | % | 100.00 | % | IT services | |||||||||||||
| Fortensky Trading, Ltd. | Ireland | 0.00 | % | 100.00 | % | 100.00 | % | 100.00 | % | Finance company | |||||||||||||
| Fosse (Master Issuer) Holdings Limited | United Kingdom | — | (a) | — | — | Securitization | |||||||||||||||||
| Fosse Funding (No.1) Limited | United Kingdom | 0.00 | % | 100.00 | % | 100.00 | % | 100.00 | % | Securitization | |||||||||||||
| Fosse Master Issuer PLC | United Kingdom | 0.00 | % | 100.00 | % | 100.00 | % | 100.00 | % | Securitization | |||||||||||||
| Fosse Trustee (UK) Limited | United Kingdom | 0.00 | % | 100.00 | % | 100.00 | % | 100.00 | % | Securitization | |||||||||||||
| Freedom Depository Holdings, LLC | United States | 0.00 | % | 100.00 | % | 100.00 | % | 100.00 | % | Holding company | |||||||||||||
| Freedom Depository, LLC | United States | 0.00 | % | 100.00 | % | 100.00 | % | 100.00 | % | Securitization | |||||||||||||
| Fundo de Investimento em Direitos Creditórios Atacado - Não Padronizado | Brazil | 0.00 | % | 90.19 | % | 100.00 | % | 100.00 | % | Investment fund | |||||||||||||
| Fundo de Investimento em Direitos Creditórios Tellus | Brazil | 0.00 | % | 90.19 | % | 100.00 | % | — | Investment fund | ||||||||||||||
| Fundo de Investimentos em Direitos Creditórios Multisegmentos NPL Ipanema VI – Não padronizado | Brazil | 0.00 | % | 90.19 | % | 100.00 | % | 100.00 | % | Investment fund | |||||||||||||
| Gamma, Sociedade Financeira de Titularização de Créditos, S.A. | Portugal | 0.00 | % | 99.87 | % | 100.00 | % | 100.00 | % | Securitization | |||||||||||||
| GC FTPYME Pastor 4, Fondo de Titulización de Activos | Spain | — | (a) | — | — | Securitization | |||||||||||||||||
| Gesban México Servicios Administrativos Globales, S.A. de C.V. | Mexico | 0.00 | % | 100.00 | % | 100.00 | % | 100.00 | % | Services | |||||||||||||
| Gesban Santander Servicios Profesionales Contables Limitada | Chile | 0.00 | % | 100.00 | % | 100.00 | % | 100.00 | % | Accounting services | |||||||||||||
| Gesban Servicios Administrativos Globales, S.L. | Spain | 99.99 | % | 0.01 | % | 100.00 | % | 100.00 | % | Services | |||||||||||||
| Gesban UK Limited | United Kingdom | 0.00 | % | 100.00 | % | 100.00 | % | 100.00 | % | Payments and collection services | |||||||||||||
| Gestión de Inversiones JILT, S.A. Unipersonal | Spain | 100.00 | % | 0.00 | % | 100.00 | % | 100.00 | % | Services | |||||||||||||
| Gestora de Procesos S.A. en liquidación (c) | Peru | 0.00 | % | 100.00 | % | 100.00 | % | 100.00 | % | Holding company | |||||||||||||
| Getnet Adquirência e Serviços para Meios de Pagamento S.A. - Instituição de Pagamento | Brazil | 0.00 | % | 100.00 | % | 100.00 | % | 97.10 | % | Payment services | |||||||||||||
| Getnet Argentina S.A.U. | Argentine | 0.00 | % | 100.00 | % | 100.00 | % | 100.00 | % | Payment methods | |||||||||||||
| Getnet Europe, Entidad de Pago, S.L. Unipersonal | Spain | 0.00 | % | 100.00 | % | 100.00 | % | 100.00 | % | Payment services | |||||||||||||
792
Subsidiaries of Banco Santander, S.A. 1 | |||||||||||||||||||||||
% of ownership held by Banco Santander | Percentage of voting power (d) | ||||||||||||||||||||||
Company | Location | Direct | Indirect | Year 2023 | Year 2022 | Activity | |||||||||||||||||
| Getnet Fundo de Investimento em Direitos Creditórios | Brazil | 0.00 | % | 90.19 | % | 100.00 | % | 100.00 | % | Investment fund | |||||||||||||
| Getnet Merchant Solutions UK Ltd | United Kingdom | 0.00 | % | 100.00 | % | 100.00 | % | 100.00 | % | Financial services | |||||||||||||
| Getnet Sociedade de Credito Direto S.A. | Brazil | 0.00 | % | 100.00 | % | 100.00 | % | 100.00 | % | Finance company | |||||||||||||
| Getnet Uruguay S.A. | Uruguay | 0.00 | % | 100.00 | % | 100.00 | % | 100.00 | % | Payment methods | |||||||||||||
| Gira, Gestão Integrada de Recebíveis do Agronegócio S.A. (p) | Brazil | 0.00 | % | 72.15 | % | 80.00 | % | 80.00 | % | Consulting services | |||||||||||||
| GNXT Serviços de Atendimento Ltda. | Brazil | 0.00 | % | 100.00 | % | 100.00 | % | 100.00 | % | Telemarketing | |||||||||||||
| Golden Bar (Securitisation) S.r.l. | Italy | — | (a) | — | — | Securitization | |||||||||||||||||
| Golden Bar Stand Alone 2019-1 | Italy | — | (a) | — | — | Securitization | |||||||||||||||||
| Golden Bar Stand Alone 2020-1 | Italy | — | (a) | — | — | Securitization | |||||||||||||||||
| Golden Bar Stand Alone 2020-2 | Italy | — | (a) | — | — | Securitization | |||||||||||||||||
| Golden Bar Stand Alone 2021-1 | Italy | — | (a) | — | — | Securitization | |||||||||||||||||
| Golden Bar Stand Alone 2022-1 | Italy | — | (a) | — | — | Securitization | |||||||||||||||||
| Golden Bar Stand Alone 2023-1 | Italy | — | (a) | — | — | Securitization | |||||||||||||||||
| Golden Bar Stand Alone 2023-2 | Italy | — | (a) | — | — | Securitization | |||||||||||||||||
| Grafite New Energy, S.r.l. | Italy | 0.00 | % | 49.00 | % | 70.00 | % | — | Renewable energies | ||||||||||||||
| Gravity Cloud Technology, S.L. | Spain | 100.00 | % | 0.00 | % | 100.00 | % | 100.00 | % | IT services | |||||||||||||
| Grupo Empresarial Santander, S.L. | Spain | 99.62 | % | 0.38 | % | 100.00 | % | 100.00 | % | Holding company | |||||||||||||
| Grupo Financiero Santander México, S.A. de C.V. | Mexico | 100.00 | % | 0.00 | % | 100.00 | % | 100.00 | % | Holding company | |||||||||||||
| Guaranty Car, S.A. Unipersonal | Spain | 0.00 | % | 100.00 | % | 100.00 | % | 100.00 | % | Automotive | |||||||||||||
| Hipototta No. 13 | Portugal | — | (a) | — | — | Securitization | |||||||||||||||||
| Hipototta No. 4 FTC | Portugal | — | (a) | — | — | Securitization | |||||||||||||||||
| Hipototta No. 4 plc | Ireland | — | (a) | — | — | Securitization | |||||||||||||||||
| Hipototta No. 5 FTC | Portugal | — | (a) | — | — | Securitization | |||||||||||||||||
| Hipototta No. 5 plc | Ireland | — | (a) | — | — | Securitization | |||||||||||||||||
| Holbah Santander, S.L. Unipersonal | Spain | 0.00 | % | 100.00 | % | 100.00 | % | 100.00 | % | Holding company | |||||||||||||
| Holding BEXs Banco Participacoes Ltda. | Brazil | 0.00 | % | 66.54 | % | 100.00 | % | — | Holding company | ||||||||||||||
| Holmes Funding Limited | United Kingdom | 0.00 | % | 100.00 | % | 100.00 | % | 100.00 | % | Securitization | |||||||||||||
| Holmes Holdings Limited | United Kingdom | — | (a) | — | — | Securitization | |||||||||||||||||
| Holmes Master Issuer plc | United Kingdom | 0.00 | % | 100.00 | % | 100.00 | % | 100.00 | % | Securitization | |||||||||||||
| Holmes Trustees Limited | United Kingdom | 0.00 | % | 100.00 | % | 100.00 | % | 100.00 | % | Securitization | |||||||||||||
| Hyundai Capital Bank Europe GmbH | Germany | 0.00 | % | 51.00 | % | 51.00 | % | 51.00 | % | Banking | |||||||||||||
| Ibérica de Compras Corporativas, S.L. | Spain | 97.17 | % | 2.83 | % | 100.00 | % | 100.00 | % | E-commerce | |||||||||||||
| Independence Community Bank Corp. | United States | 0.00 | % | 100.00 | % | 100.00 | % | 100.00 | % | Holding company | |||||||||||||
| Innohub, S.A.P.I. de C.V. | Mexico | 0.00 | % | 62.01 | % | 62.01 | % | 40.84 | % | IT services | |||||||||||||
| Insurance Funding Solutions Limited | United Kingdom | 0.00 | % | 100.00 | % | 100.00 | % | 100.00 | % | Inactive | |||||||||||||
| Inversiones Capital Global, S.A. Unipersonal | Spain | 100.00 | % | 0.00 | % | 100.00 | % | 100.00 | % | Holding company | |||||||||||||
| Inversiones Marítimas del Mediterráneo, S.A. | Spain | 0.00 | % | 100.00 | % | 100.00 | % | 100.00 | % | Inactive | |||||||||||||
| Isar Valley S.A. | Luxembourg | — | (a) | — | — | Securitization | |||||||||||||||||
| Isla de los Buques, S.A. | Spain | 99.98 | % | 0.02 | % | 100.00 | % | 100.00 | % | Finance company | |||||||||||||
| Klare Corredora de Seguros S.A. | Chile | 0.00 | % | 33.63 | % | 50.10 | % | 50.10 | % | Insurance intermediary | |||||||||||||
793
Subsidiaries of Banco Santander, S.A. 1 | |||||||||||||||||||||||
% of ownership held by Banco Santander | Percentage of voting power (d) | ||||||||||||||||||||||
Company | Location | Direct | Indirect | Year 2023 | Year 2022 | Activity | |||||||||||||||||
| Landcompany 2020, S.L. Unipersonal | Spain | 100.00 | % | 0.00 | % | 100.00 | % | 100.00 | % | Real estate management | |||||||||||||
| Laparanza, S.A. | Spain | 61.59 | % | 0.00 | % | 61.59 | % | 61.59 | % | Agricultural holding | |||||||||||||
| Lerma Investments 2018, S.L. Unipersonal | Spain | 100.00 | % | 0.00 | % | 100.00 | % | 100.00 | % | Real estate | |||||||||||||
| Liquetine, S.L. Unipersonal | Spain | 0.00 | % | 70.00 | % | 100.00 | % | 100.00 | % | Renewable energies | |||||||||||||
| Liquidity Limited | United Kingdom | 0.00 | % | 100.00 | % | 100.00 | % | 100.00 | % | Factoring | |||||||||||||
| Lynx Financial Crime Tech, S.A. Unipersonal | Spain | 0.00 | % | 100.00 | % | 100.00 | % | 100.00 | % | IT services | |||||||||||||
| MAC No. 1 Limited | United Kingdom | — | (a) | — | — | Mortgage credit company | |||||||||||||||||
| Master Red Europa, S.L. | Spain | 96.34 | % | 0.00 | % | 96.34 | % | 96.34 | % | Cards | |||||||||||||
| Mata Alta, S.L. Unipersonal | Spain | 0.00 | % | 61.59 | % | 100.00 | % | 100.00 | % | Agricultural holding | |||||||||||||
| MCE Bank GmbH | Germany | 0.00 | % | 90.01 | % | 90.01 | % | — | Banking | ||||||||||||||
| MCE Verwaltung GmbH | Germany | 0.00 | % | 90.01 | % | 100.00 | % | — | Real estate rental | ||||||||||||||
| Mercadotecnia, Ideas y Tecnología, S.A. de C.V. | Mexico | 0.00 | % | 70.00 | % | 70.00 | % | 70.00 | % | Payment methods | |||||||||||||
| Merciver, S.L. | Spain | 99.90 | % | 0.10 | % | 100.00 | % | 100.00 | % | Financial advisory | |||||||||||||
| Mercury Trade Finance Solutions S.A.S. | Colombia | 0.00 | % | 50.10 | % | 100.00 | % | 100.00 | % | IT services | |||||||||||||
| Mercury Trade Finance Solutions SpA | Chile | 0.00 | % | 50.10 | % | 100.00 | % | 100.00 | % | Inactive | |||||||||||||
| Mercury Trade Finance Solutions, S.A. de C.V. | Mexico | 0.00 | % | 50.10 | % | 100.00 | % | 100.00 | % | IT services | |||||||||||||
| Mercury Trade Finance Solutions, S.L. | Spain | 0.00 | % | 50.10 | % | 50.10 | % | 50.10 | % | IT services | |||||||||||||
| Merlion Aviation One Designated Activity Company | Ireland | — | (a) | — | — | Renting | |||||||||||||||||
| Midata Service GmbH | Germany | 0.00 | % | 90.01 | % | 100.00 | % | — | IT services | ||||||||||||||
| Mobills Corretora de Seguros Ltda. | Brazil | 0.00 | % | 56.48 | % | 100.00 | % | 100.00 | % | Insurance intermediary | |||||||||||||
| Mobills Labs Soluções em Tecnologia Ltda. - EPP | Brazil | 0.00 | % | 56.48 | % | 100.00 | % | 100.00 | % | IT services | |||||||||||||
| Motor 2016-1 Holdings Limited | United Kingdom | — | (a) | — | — | Securitization | |||||||||||||||||
| Motor 2016-1 PLC | United Kingdom | 0.00 | % | 100.00 | % | 100.00 | % | 100.00 | % | Securitization | |||||||||||||
| Motor 2017-1 Holdings Limited | United Kingdom | — | (a) | — | — | Securitization | |||||||||||||||||
| Motor Securities 2018-1 Designated Activity Company (c) | Ireland | — | (a) | — | — | Securitization | |||||||||||||||||
| Mouro Capital I LP | United Kingdom | 0.00 | % | 100.00 | % | 100.00 | % | 100.00 | % | Investment fund | |||||||||||||
| Multiplica SpA | Chile | 0.00 | % | 100.00 | % | 100.00 | % | 100.00 | % | Payment services | |||||||||||||
| Munduspar Participações S.A. | Brazil | 80.00 | % | 0.00 | % | 80.00 | % | 80.00 | % | Holding company | |||||||||||||
794
Subsidiaries of Banco Santander, S.A. 1 | |||||||||||||||||||||||
% of ownership held by Banco Santander | Percentage of voting power (d) | ||||||||||||||||||||||
| Company | Location | Direct | Indirect | Year 2023 | Year 2022 | Activity | |||||||||||||||||
| Navegante Américo Vespucio SpA | Chile | 0.00 | % | 100.00 | % | 100.00 | % | 100.00 | % | Real estate | |||||||||||||
| Naviera Mirambel, S.L. Unipersonal | Spain | 0.00 | % | 100.00 | % | 100.00 | % | 100.00 | % | Finance company | |||||||||||||
| Naviera Trans Gas, A.I.E. | Spain | 99.99 | % | 0.01 | % | 100.00 | % | 100.00 | % | Renting | |||||||||||||
| Naviera Trans Ore, A.I.E. | Spain | 99.99 | % | 0.01 | % | 100.00 | % | 100.00 | % | Renting | |||||||||||||
| Naviera Transcantábrica, S.L. | Spain | 100.00 | % | 0.00 | % | 100.00 | % | 100.00 | % | Leasing | |||||||||||||
| Naviera Transchem, S.L. Unipersonal | Spain | 100.00 | % | 0.00 | % | 100.00 | % | 100.00 | % | Leasing | |||||||||||||
| NeoAuto S.A.C. | Peru | 0.00 | % | 100.00 | % | 100.00 | % | 55.00 | % | Vehicles purchased by internet | |||||||||||||
| Newco Didier Holding Ltda. | Brazil | 0.00 | % | 66.54 | % | 100.00 | % | — | Holding company | ||||||||||||||
| Newcomar, S.L., en liquidación (c) | Spain | 40.00 | % | 40.00 | % | 80.00 | % | 80.00 | % | Real estate | |||||||||||||
| Novimovest – Fundo de Investimento Imobiliário | Portugal | 0.00 | % | 78.64 | % | 78.74 | % | 78.74 | % | Investment fund | |||||||||||||
| NW Services CO. | United States | 0.00 | % | 100.00 | % | 100.00 | % | 100.00 | % | E-commerce | |||||||||||||
| One Mobility Management GmbH | Germany | 0.00 | % | 46.95 | % | 100.00 | % | 100.00 | % | Services | |||||||||||||
| Open Bank Argentina S.A. | Argentine | 0.00 | % | 99.91 | % | 100.00 | % | 100.00 | % | Banking | |||||||||||||
| Open Bank, S.A. | Spain | 100.00 | % | 0.00 | % | 100.00 | % | 100.00 | % | Banking | |||||||||||||
| Open Digital Market, S.L. | Spain | 0.00 | % | 100.00 | % | 100.00 | % | 100.00 | % | Commerce | |||||||||||||
| Open Digital Services, S.L. | Spain | 99.97 | % | 0.03 | % | 100.00 | % | 100.00 | % | Services | |||||||||||||
| Openbank México, S.A., Institución de Banca Múltiple, Grupo Financiero Santander México | Mexico | 0.00 | % | 100.00 | % | 100.00 | % | 100.00 | % | Banking | |||||||||||||
| Operadora de Carteras Gamma, S.A.P.I. de C.V. | Mexico | 100.00 | % | 0.00 | % | 100.00 | % | 100.00 | % | Holding company | |||||||||||||
| Optimal Investment Services SA | Switzerland | 100.00 | % | 0.00 | % | 100.00 | % | 100.00 | % | Fund management company | |||||||||||||
| Optimal Multiadvisors Ireland Plc / Optimal Strategic US Equity Ireland Euro Fund (b) | Ireland | 0.00 | % | 0.00 | % | 0.00 | % | 0.00 | % | Fund management company | |||||||||||||
| Optimal Multiadvisors Ireland Plc / Optimal Strategic US Equity Ireland US Dollar Fund (b) | Ireland | 0.00 | % | 0.00 | % | 0.00 | % | 0.00 | % | Fund management company | |||||||||||||
| Paga Después, S.A. de C.V. | Mexico | 0.00 | % | 100.00 | % | 100.00 | % | 100.00 | % | Financial services | |||||||||||||
| PagoFX UK Ltd | United Kingdom | 0.00 | % | 100.00 | % | 100.00 | % | 100.00 | % | Payment services | |||||||||||||
| PagoNxt Emoney, E.D.E., S.L. | Spain | 0.00 | % | 100.00 | % | 100.00 | % | 100.00 | % | Financial services | |||||||||||||
| PagoNxt Ltd | United Kingdom | 100.00 | % | 0.00 | % | 100.00 | % | 100.00 | % | Holding company | |||||||||||||
| PagoNxt Merchant SoluçõesTecnológicas Brasil Ltda. | Brazil | 0.00 | % | 100.00 | % | 100.00 | % | 100.00 | % | IT services | |||||||||||||
| PagoNxt Merchant Solutions FZ-LLC | Arab United Emirates | 0.00 | % | 100.00 | % | 100.00 | % | 100.00 | % | Financial services | |||||||||||||
| PagoNxt Merchant Solutions India Private Limited | India | 0.00 | % | 100.00 | % | 100.00 | % | 100.00 | % | Financial services | |||||||||||||
| PagoNxt Merchant Solutions, S.L. | Spain | 0.00 | % | 100.00 | % | 100.00 | % | 100.00 | % | Holding company | |||||||||||||
| PagoNxt One Trade UK Ltd | United Kingdom | 0.00 | % | 100.00 | % | 100.00 | % | 100.00 | % | Inactive | |||||||||||||
| PagoNxt Payments Platform México, S.A. de C.V. | Mexico | 0.00 | % | 100.00 | % | 100.00 | % | 100.00 | % | IT services | |||||||||||||
| PagoNxt Solutions, S.L. | Spain | 0.00 | % | 100.00 | % | 100.00 | % | 100.00 | % | Payment services | |||||||||||||
| PagoNxt Trade Brasil Ltda. | Brazil | 0.00 | % | 100.00 | % | 100.00 | % | 100.00 | % | Financial services | |||||||||||||
| PagoNxt Trade Chile SpA | Chile | 0.00 | % | 100.00 | % | 100.00 | % | 100.00 | % | Services | |||||||||||||
| PagoNxt Trade Services, S.L. | Spain | 0.00 | % | 100.00 | % | 100.00 | % | 100.00 | % | Services | |||||||||||||
| PagoNxt Trade, S.L. | Spain | 0.00 | % | 100.00 | % | 100.00 | % | 100.00 | % | IT services | |||||||||||||
795
Subsidiaries of Banco Santander, S.A. 1 | |||||||||||||||||||||||
% of ownership held by Banco Santander | Percentage of voting power (d) | ||||||||||||||||||||||
| Company | Location | Direct | Indirect | Year 2023 | Year 2022 | Activity | |||||||||||||||||
| PagoNxt US, LLC | United States | 0.00 | % | 100.00 | % | 100.00 | % | — | Inactive | ||||||||||||||
| PagoNxt, S.L. | Spain | 100.00 | % | 0.00 | % | 100.00 | % | 100.00 | % | Holding company | |||||||||||||
| Parasant SA | Switzerland | 100.00 | % | 0.00 | % | 100.00 | % | 100.00 | % | Holding company | |||||||||||||
| Partners Ebury México, S.A. de C.V. | Mexico | 0.00 | % | 66.54 | % | 100.00 | % | — | Payment services | ||||||||||||||
| Paytec Logística e Armazém Ltda. | Brazil | 0.00 | % | 100.00 | % | 100.00 | % | 100.00 | % | Logistics services | |||||||||||||
| Paytec Tecnologia em Pagamentos Ltda. | Brazil | 0.00 | % | 100.00 | % | 100.00 | % | 100.00 | % | Commerce | |||||||||||||
| PBE Companies, LLC | United States | 0.00 | % | 100.00 | % | 100.00 | % | 100.00 | % | Real estate | |||||||||||||
| Pereda Gestión, S.A. | Spain | 99.99 | % | 0.01 | % | 100.00 | % | 100.00 | % | Securities brokerage | |||||||||||||
| Phoenix C1 Aviation Designated Activity Company | Ireland | — | (a) | — | — | Renting | |||||||||||||||||
| Phoenix S.A. | Uruguay | 0.00 | % | 100.00 | % | 100.00 | % | 100.00 | % | Payment methods | |||||||||||||
| Pingham International, S.A. (c) | Uruguay | 0.00 | % | 100.00 | % | 100.00 | % | 100.00 | % | Inactive | |||||||||||||
| Pony S.A. | Luxembourg | — | (a) | — | — | Securitization | |||||||||||||||||
| Pony S.A., Compartment German Auto Loans 2021-1 | Luxembourg | — | (a) | — | — | Securitization | |||||||||||||||||
| Pony S.A., Compartment German Auto Loans 2023-1 | Luxembourg | — | (a) | — | — | Securitization | |||||||||||||||||
| Portal Universia Argentina S.A. | Argentine | 0.00 | % | 75.75 | % | 75.75 | % | 75.75 | % | Internet | |||||||||||||
| Portal Universia Portugal, Prestação de Serviços de Informática, S.A. | Portugal | 0.00 | % | 100.00 | % | 100.00 | % | 100.00 | % | Internet | |||||||||||||
| Precato IV Fundo de Investimento em Direitos Creditórios - Não Padronizados | Brazil | 0.00 | % | 90.19 | % | 100.00 | % | — | Investment fund | ||||||||||||||
| Prime 16 – Fundo de Investimentos Imobiliário | Brazil | 0.00 | % | 90.19 | % | 100.00 | % | 100.00 | % | Investment fund | |||||||||||||
| Punta Lima Wind Farm, LLC | United States | 0.00 | % | 100.00 | % | 100.00 | % | 100.00 | % | Renewable energies | |||||||||||||
| Punta Lima, LLC | United States | 0.00 | % | 100.00 | % | 100.00 | % | 100.00 | % | Leasing | |||||||||||||
| Repton 2023-1 Limited | United Kingdom | — | (a) | — | — | Securitization | |||||||||||||||||
| Retailcompany 2021, S.L. Unipersonal | Spain | 100.00 | % | 0.00 | % | 100.00 | % | 100.00 | % | Real estate | |||||||||||||
| Retop S.A. | Uruguay | 100.00 | % | 0.00 | % | 100.00 | % | 100.00 | % | Finance company | |||||||||||||
| Return Capital S.A. | Brazil | 0.00 | % | 90.19 | % | 100.00 | % | 100.00 | % | Collection services | |||||||||||||
| Roc Aviation One Designated Activity Company | Ireland | — | (a) | — | — | Renting | |||||||||||||||||
| Roc Shipping One Designated Activity Company | Ireland | — | (a) | — | — | Renting | |||||||||||||||||
| Rojo Entretenimento S.A. | Brazil | 0.00 | % | 85.32 | % | 94.60 | % | 94.60 | % | Real estate | |||||||||||||
| SAFO Alternative Lending, S.L. Unipersonal | Spain | 0.00 | % | 100.00 | % | 100.00 | % | 100.00 | % | Finance company | |||||||||||||
| SALCO, Servicios de Seguridad Santander, S.A. | Spain | 99.99 | % | 0.01 | % | 100.00 | % | 100.00 | % | Security | |||||||||||||
| SAM Argentina Sociedad Gerente de Fondos Comunes de Inversión S.A. | Argentine | 0.00 | % | 100.00 | % | 100.00 | % | — | Investment fund management | ||||||||||||||
| SAM Asset Management, S.A. de C.V., Sociedad Operadora de Fondos de Inversión | Mexico | 0.00 | % | 100.00 | % | 100.00 | % | 100.00 | % | Fund management company | |||||||||||||
| SAM Inversiones Argentina S.A. | Argentine | 0.00 | % | 100.00 | % | 100.00 | % | — | Pension fund management company | ||||||||||||||
| SAM Investment Holdings, S.L. | Spain | 92.37 | % | 7.63 | % | 100.00 | % | 100.00 | % | Holding company | |||||||||||||
796
Subsidiaries of Banco Santander, S.A. 1 | |||||||||||||||||||||||
% of ownership held by Banco Santander | Percentage of voting power (d) | ||||||||||||||||||||||
| Company | Location | Direct | Indirect | Year 2023 | Year 2022 | Activity | |||||||||||||||||
| San Créditos Estruturados i Fundo de Investimento em Direitos Creditórios Não Padronizados | Brazil | 0.00 | % | 90.19 | % | 100.00 | % | — | Investment fund | ||||||||||||||
| San Pietro Solar PV, S.r.l. | Italy | 0.00 | % | 56.00 | % | 80.00 | % | — | Renewable energies | ||||||||||||||
| SANB Promotora de Vendas e Cobrança S.A. | Brazil | 0.00 | % | 90.19 | % | 100.00 | % | 100.00 | % | Finance company | |||||||||||||
| Sancap Investimentos e Participações S.A. | Brazil | 0.00 | % | 90.19 | % | 100.00 | % | 100.00 | % | Holding company | |||||||||||||
| Santander (CF Trustee Property Nominee) Limited | United Kingdom | 0.00 | % | 100.00 | % | 100.00 | % | 100.00 | % | Inactive | |||||||||||||
| Santander (CF Trustee) Limited | United Kingdom | — | (a) | — | — | Inactive | |||||||||||||||||
| Santander (UK) Group Pension Schemes Trustees Limited | United Kingdom | 0.00 | % | 100.00 | % | 100.00 | % | 100.00 | % | Inactive | |||||||||||||
| Santander Ahorro Inmobiliario 1, S.A. | Spain | 98.53 | % | 0.00 | % | 98.53 | % | 98.53 | % | Real estate rental | |||||||||||||
| Santander Alternative Investments, S.G.I.I.C., S.A. Unipersonal | Spain | 0.00 | % | 100.00 | % | 100.00 | % | — | Fund management company | ||||||||||||||
| Santander AM Global Working Capital Fund I | Luxembourg | 100.00 | % | 0.00 | % | 100.00 | % | — | Investment fund | ||||||||||||||
| Santander Asesorías Financieras Limitada | Chile | 0.00 | % | 67.45 | % | 100.00 | % | 100.00 | % | Financial advisory | |||||||||||||
| Santander Asset Finance (December) Limited | United Kingdom | 0.00 | % | 100.00 | % | 100.00 | % | 100.00 | % | Leasing | |||||||||||||
| Santander Asset Finance Opportunities | Luxembourg | 100.00 | % | 0.00 | % | 100.00 | % | 100.00 | % | Investment fund | |||||||||||||
| Santander Asset Finance plc | United Kingdom | 0.00 | % | 100.00 | % | 100.00 | % | 100.00 | % | Leasing | |||||||||||||
| Santander Asset Management - SGOIC, S.A. | Portugal | 0.00 | % | 100.00 | % | 100.00 | % | 100.00 | % | Fund management company | |||||||||||||
| Santander Asset Management Chile S.A. | Chile | 0.00 | % | 100.00 | % | 100.00 | % | 100.00 | % | Securities Investment | |||||||||||||
| Santander Asset Management Gerente de Fondos Comunes de Inversión S.A. | Argentine | 0.00 | % | 100.00 | % | 100.00 | % | 100.00 | % | Fund management company | |||||||||||||
| Santander Asset Management Luxembourg, S.A. | Luxembourg | 0.00 | % | 100.00 | % | 100.00 | % | 100.00 | % | Fund management company | |||||||||||||
| Santander Asset Management S.A. Administradora General de Fondos | Chile | 0.00 | % | 100.00 | % | 100.00 | % | 100.00 | % | Fund management company | |||||||||||||
| Santander Asset Management UK Holdings Limited | United Kingdom | 0.00 | % | 100.00 | % | 100.00 | % | 100.00 | % | Holding company | |||||||||||||
| Santander Asset Management UK Limited | United Kingdom | 0.00 | % | 100.00 | % | 100.00 | % | 100.00 | % | Management of funds and portfolios | |||||||||||||
| Santander Asset Management, S.A., SGIIC | Spain | 0.00 | % | 100.00 | % | 100.00 | % | 100.00 | % | Fund management company | |||||||||||||
| Santander Auto Lease Titling Ltd. | United States | 0.00 | % | 100.00 | % | 100.00 | % | 100.00 | % | Leasing | |||||||||||||
| Santander Back-Offices Globales Mayoristas, S.A. | Spain | 100.00 | % | 0.00 | % | 100.00 | % | 100.00 | % | Services | |||||||||||||
| Santander Banca de Inversión Colombia, S.A.S. | Colombia | 100.00 | % | 0.00 | % | 100.00 | % | 100.00 | % | Advisory services | |||||||||||||
| Santander Bank & Trust Ltd. | Bahamas | 0.00 | % | 100.00 | % | 100.00 | % | 100.00 | % | Banking | |||||||||||||
| Santander Bank Polska S.A. | Poland | 67.41 | % | 0.00 | % | 67.41 | % | 67.41 | % | Banking | |||||||||||||
| Santander Bank, National Association | United States | 0.00 | % | 100.00 | % | 100.00 | % | 100.00 | % | Banking | |||||||||||||
| Santander Brasil Administradora de Consórcio Ltda. | Brazil | 0.00 | % | 90.19 | % | 100.00 | % | 100.00 | % | Services | |||||||||||||
| Santander Brasil Gestão de Recursos Ltda. | Brazil | 0.08 | % | 99.92 | % | 100.00 | % | 100.00 | % | Securities Investment | |||||||||||||
797
Subsidiaries of Banco Santander, S.A. 1 | |||||||||||||||||||||||
% of ownership held by Banco Santander | Percentage of voting power (d) | ||||||||||||||||||||||
| Company | Location | Direct | Indirect | Year 2023 | Year 2022 | Activity | |||||||||||||||||
| Santander Capital Holdings LLC | United States | 0.00 | % | 100.00 | % | 100.00 | % | 100.00 | % | Holding company | |||||||||||||
| Santander Capital Structuring, S.A. de C.V. | Mexico | 0.00 | % | 100.00 | % | 100.00 | % | 100.00 | % | Investment Company | |||||||||||||
| Santander Capitalização S.A. | Brazil | 0.00 | % | 90.19 | % | 100.00 | % | 100.00 | % | Insurance | |||||||||||||
| Santander Cards Ireland Limited (f) | Ireland | 0.00 | % | 100.00 | % | 100.00 | % | 100.00 | % | Cards | |||||||||||||
| Santander Cards Limited | United Kingdom | 0.00 | % | 100.00 | % | 100.00 | % | 100.00 | % | Cards | |||||||||||||
| Santander Cards UK Limited | United Kingdom | 0.00 | % | 100.00 | % | 100.00 | % | 100.00 | % | Finance company | |||||||||||||
| Santander Chile Holding S.A. | Chile | 22.11 | % | 77.75 | % | 99.86 | % | 99.86 | % | Holding company | |||||||||||||
| Santander Consulting (Beijing) Co., Ltd. | China | 0.00 | % | 100.00 | % | 100.00 | % | 100.00 | % | Advisory services | |||||||||||||
| Santander Consumer (UK) plc | United Kingdom | 0.00 | % | 100.00 | % | 100.00 | % | 100.00 | % | Finance company | |||||||||||||
| Santander Consumer Auto Receivables Funding 2018-L1 LLC | United States | 0.00 | % | 100.00 | % | 100.00 | % | 100.00 | % | Finance company | |||||||||||||
| Santander Consumer Auto Receivables Funding 2018-L3 LLC | United States | 0.00 | % | 100.00 | % | 100.00 | % | 100.00 | % | Finance company | |||||||||||||
| Santander Consumer Auto Receivables Funding 2018-L5 LLC | United States | 0.00 | % | 100.00 | % | 100.00 | % | 100.00 | % | Finance company | |||||||||||||
| Santander Consumer Auto Receivables Funding 2020-L1 LLC | United States | 0.00 | % | 100.00 | % | 100.00 | % | 100.00 | % | Finance company | |||||||||||||
| Santander Consumer Auto Receivables Funding 2022-B1 LLC | United States | 0.00 | % | 100.00 | % | 100.00 | % | 100.00 | % | Finance company | |||||||||||||
| Santander Consumer Auto Receivables Funding 2022-B2 LLC | United States | 0.00 | % | 100.00 | % | 100.00 | % | 100.00 | % | Finance company | |||||||||||||
| Santander Consumer Auto Receivables Funding 2022-B3 LLC | United States | 0.00 | % | 100.00 | % | 100.00 | % | 100.00 | % | Finance company | |||||||||||||
| Santander Consumer Auto Receivables Funding 2022-B4 LLC | United States | 0.00 | % | 100.00 | % | 100.00 | % | 100.00 | % | Finance company | |||||||||||||
| Santander Consumer Auto Receivables Funding 2023-B1 LLC | United States | 0.00 | % | 100.00 | % | 100.00 | % | 100.00 | % | Finance company | |||||||||||||
| Santander Consumer Auto Receivables Funding 2023-B2 LLC | United States | 0.00 | % | 100.00 | % | 100.00 | % | — | Finance company | ||||||||||||||
| Santander Consumer Auto Receivables Funding 2023-B3 LLC | United States | 0.00 | % | 100.00 | % | 100.00 | % | — | Finance company | ||||||||||||||
| Santander Consumer Auto Receivables Funding 2023-B4 LLC | United States | 0.00 | % | 100.00 | % | 100.00 | % | 100.00 | % | Finance company | |||||||||||||
| Santander Consumer Auto Receivables Funding 2023-B5 LLC | United States | 0.00 | % | 100.00 | % | 100.00 | % | — | Inactive | ||||||||||||||
| Santander Consumer Auto Receivables Funding 2023-B6 LLC | United States | 0.00 | % | 100.00 | % | 100.00 | % | — | Inactive | ||||||||||||||
| Santander Consumer Auto Receivables Funding 2023-L1 LLC | United States | 0.00 | % | 100.00 | % | 100.00 | % | — | Inactive | ||||||||||||||
| Santander Consumer Auto Receivables Funding 2024-B1 LLC | United States | 0.00 | % | 100.00 | % | 100.00 | % | — | Inactive | ||||||||||||||
| Santander Consumer Auto Receivables Funding 2024-B2 LLC | United States | 0.00 | % | 100.00 | % | 100.00 | % | — | Inactive | ||||||||||||||
| Santander Consumer Auto Receivables Funding 2024-B3 LLC | United States | 0.00 | % | 100.00 | % | 100.00 | % | — | Inactive | ||||||||||||||
| Santander Consumer Auto Receivables Funding 2024-L1 LLC | United States | 0.00 | % | 100.00 | % | 100.00 | % | — | Inactive | ||||||||||||||
| Santander Consumer Auto Receivables Funding 2024-L2 LLC | United States | 0.00 | % | 100.00 | % | 100.00 | % | — | Inactive | ||||||||||||||
| Santander Consumer Auto Receivables Funding 2024-L3 LLC | United States | 0.00 | % | 100.00 | % | 100.00 | % | — | Inactive | ||||||||||||||
| Santander Consumer Auto Receivables Grantor Trust 2021-D | United States | — | (a) | — | — | Inactive | |||||||||||||||||
| Santander Consumer Auto Receivables Grantor Trust 2023-A | United States | — | (a) | — | — | Inactive | |||||||||||||||||
798
Subsidiaries of Banco Santander, S.A. 1 | |||||||||||||||||||||||
% of ownership held by Banco Santander | Percentage of voting power (d) | ||||||||||||||||||||||
| Company | Location | Direct | Indirect | Year 2023 | Year 2022 | Activity | |||||||||||||||||
| Santander Consumer Auto Receivables Grantor Trust 2023-B | United States | — | (a) | — | — | Inactive | |||||||||||||||||
| Santander Consumer Auto Receivables Trust 2021-D | United States | — | (a) | — | — | Inactive | |||||||||||||||||
| Santander Consumer Auto Receivables Trust 2023-A | United States | — | (a) | — | — | Inactive | |||||||||||||||||
| Santander Consumer Auto Receivables Trust 2023-B | United States | — | (a) | — | — | Inactive | |||||||||||||||||
| Santander Consumer Bank AG | Germany | 0.00 | % | 100.00 | % | 100.00 | % | 100.00 | % | Banking | |||||||||||||
| Santander Consumer Bank AS | Norway | 0.00 | % | 100.00 | % | 100.00 | % | 100.00 | % | Banking | |||||||||||||
| Santander Consumer Bank GmbH | Austria | 0.00 | % | 100.00 | % | 100.00 | % | 100.00 | % | Banking | |||||||||||||
| Santander Consumer Bank S.A. | Poland | 0.00 | % | 80.44 | % | 100.00 | % | 100.00 | % | Banking | |||||||||||||
| Santander Consumer Bank S.p.A. | Italy | 0.00 | % | 100.00 | % | 100.00 | % | 100.00 | % | Banking | |||||||||||||
| Santander Consumer Credit Services Limited | United Kingdom | 0.00 | % | 100.00 | % | 100.00 | % | 100.00 | % | Finance company | |||||||||||||
| Santander Consumer Finance Global Services, S.L. | Spain | 0.00 | % | 100.00 | % | 100.00 | % | 100.00 | % | IT | |||||||||||||
| Santander Consumer Finance Inc. | Canada | 0.00 | % | 100.00 | % | 100.00 | % | 100.00 | % | Holding company | |||||||||||||
| Santander Consumer Finance Limitada | Chile | 49.00 | % | 34.24 | % | 100.00 | % | 100.00 | % | Finance company | |||||||||||||
| Santander Consumer Finance México, S.A. de C.V., S.O.F.O.M., E.R., Grupo Financiero Santander México | Mexico | 0.00 | % | 99.97 | % | 100.00 | % | 100.00 | % | Inactive | |||||||||||||
| Santander Consumer Finance Oy | Finland | 0.00 | % | 100.00 | % | 100.00 | % | 100.00 | % | Finance company | |||||||||||||
| Santander Consumer Finance Schweiz AG | Switzerland | 0.00 | % | 100.00 | % | 100.00 | % | 100.00 | % | Leasing | |||||||||||||
| Santander Consumer Finance, S.A. | Spain | 100.00 | % | 0.00 | % | 100.00 | % | 100.00 | % | Banking | |||||||||||||
| Santander Consumer Financial Solutions Sp. z o.o. | Poland | 0.00 | % | 80.44 | % | 100.00 | % | 100.00 | % | Leasing | |||||||||||||
| Santander Consumer Holding Austria GmbH | Austria | 0.00 | % | 100.00 | % | 100.00 | % | 100.00 | % | Holding company | |||||||||||||
| Santander Consumer Holding GmbH | Germany | 0.00 | % | 100.00 | % | 100.00 | % | 100.00 | % | Holding company | |||||||||||||
| Santander Consumer Inc. | Canada | 0.00 | % | 100.00 | % | 100.00 | % | 100.00 | % | Finance company | |||||||||||||
| Santander Consumer Leasing B.V. | Netherlands | 0.00 | % | 100.00 | % | 100.00 | % | 100.00 | % | Renting | |||||||||||||
| Santander Consumer Leasing GmbH | Germany | 0.00 | % | 100.00 | % | 100.00 | % | 100.00 | % | Leasing | |||||||||||||
| Santander Consumer Leasing S.A. | France | 0.00 | % | 100.00 | % | 100.00 | % | — | Renting | ||||||||||||||
| Santander Consumer Mobility Services, S.A. | Spain | 0.00 | % | 100.00 | % | 100.00 | % | 100.00 | % | Renting | |||||||||||||
| Santander Consumer Multirent Sp. z o.o. | Poland | 0.00 | % | 80.44 | % | 100.00 | % | 100.00 | % | Leasing | |||||||||||||
| Santander Consumer Operations Services GmbH | Germany | 0.00 | % | 100.00 | % | 100.00 | % | 100.00 | % | Services | |||||||||||||
| Santander Consumer Receivables 10 LLC | United States | 0.00 | % | 100.00 | % | 100.00 | % | 100.00 | % | Finance company | |||||||||||||
| Santander Consumer Receivables 11 LLC | United States | 0.00 | % | 100.00 | % | 100.00 | % | 100.00 | % | Finance company | |||||||||||||
| Santander Consumer Receivables 15 LLC | United States | 0.00 | % | 100.00 | % | 100.00 | % | 100.00 | % | Finance company | |||||||||||||
| Santander Consumer Receivables 16 LLC | United States | 0.00 | % | 100.00 | % | 100.00 | % | 100.00 | % | Finance company | |||||||||||||
| Santander Consumer Receivables 20 LLC | United States | 0.00 | % | 100.00 | % | 100.00 | % | — | Inactive | ||||||||||||||
| Santander Consumer Receivables 21 LLC | United States | 0.00 | % | 100.00 | % | 100.00 | % | — | Inactive | ||||||||||||||
| Santander Consumer Receivables 7 LLC | United States | 0.00 | % | 100.00 | % | 100.00 | % | 100.00 | % | Finance company | |||||||||||||
| Santander Consumer Receivables Funding LLC | United States | 0.00 | % | 100.00 | % | 100.00 | % | 100.00 | % | Finance company | |||||||||||||
799
Subsidiaries of Banco Santander, S.A. 1 | |||||||||||||||||||||||
% of ownership held by Banco Santander | Percentage of voting power (d) | ||||||||||||||||||||||
| Company | Location | Direct | Indirect | Year 2023 | Year 2022 | Activity | |||||||||||||||||
| Santander Consumer Renting S.r.l. | Italy | 0.00 | % | 100.00 | % | 100.00 | % | 100.00 | % | Renting | |||||||||||||
| Santander Consumer Renting, S.L. | Spain | 0.00 | % | 100.00 | % | 100.00 | % | 100.00 | % | Renting | |||||||||||||
| Santander Consumer S.A. | Argentine | 0.00 | % | 99.82 | % | 100.00 | % | 100.00 | % | Finance company | |||||||||||||
| Santander Consumer S.A. Compañía de Financiamiento | Colombia | 79.02 | % | 20.98 | % | 100.00 | % | 100.00 | % | Finance company | |||||||||||||
| Santander Consumer Services GmbH | Austria | 0.00 | % | 100.00 | % | 100.00 | % | 100.00 | % | Services | |||||||||||||
| Santander Consumer Services, S.A. | Portugal | 0.00 | % | 100.00 | % | 100.00 | % | 100.00 | % | Finance company | |||||||||||||
| Santander Consumer Spain Auto 2019-1, Fondo de Titulización | Spain | — | (a) | — | — | Securitization | |||||||||||||||||
| Santander Consumer Spain Auto 2020-1, Fondo de Titulización | Spain | — | (a) | — | — | Securitization | |||||||||||||||||
| Santander Consumer Spain Auto 2021-1, Fondo de Titulización | Spain | — | (a) | — | — | Securitization | |||||||||||||||||
| Santander Consumer Spain Auto 2022-1, Fondo de Titulización | Spain | — | (a) | — | — | Securitization | |||||||||||||||||
| Santander Consumer Spain Auto 2023-1, Fondo de Titulización | Spain | — | (a) | — | — | Securitization | |||||||||||||||||
| Santander Consumer Technology Services GmbH | Germany | 0.00 | % | 100.00 | % | 100.00 | % | 100.00 | % | IT services | |||||||||||||
| Santander Consumer USA Holdings Inc. | United States | 0.00 | % | 100.00 | % | 100.00 | % | 100.00 | % | Holding company | |||||||||||||
| Santander Consumer USA Inc. | United States | 0.00 | % | 100.00 | % | 100.00 | % | 100.00 | % | Finance company | |||||||||||||
| Santander Consumo 4, F.T. | Spain | — | (a) | — | — | Securitization | |||||||||||||||||
| Santander Consumo 5, F.T. | Spain | — | (a) | — | — | Securitization | |||||||||||||||||
| Santander Corredora de Seguros Limitada | Chile | 0.00 | % | 67.21 | % | 100.00 | % | 100.00 | % | Insurance intermediary | |||||||||||||
| Santander Corredores de Bolsa Limitada | Chile | 0.00 | % | 83.24 | % | 100.00 | % | 100.00 | % | Securities company | |||||||||||||
| Santander Corretora de Câmbio e Valores Mobiliários S.A. | Brazil | 0.00 | % | 90.19 | % | 100.00 | % | 100.00 | % | Securities company | |||||||||||||
| Santander Corretora de Seguros, Investimentos e Serviços S.A. | Brazil | 0.00 | % | 90.19 | % | 100.00 | % | 100.00 | % | Insurance intermediary | |||||||||||||
| Santander Customer Voice, S.A. | Spain | 99.50 | % | 0.50 | % | 100.00 | % | 100.00 | % | Services | |||||||||||||
| Santander de Titulización, S.G.F.T., S.A. | Spain | 81.00 | % | 19.00 | % | 100.00 | % | 100.00 | % | Fund management company | |||||||||||||
| Santander Distribuidora de Títulos e Valores Mobiliários S.A. | Brazil | 0.00 | % | 90.19 | % | 100.00 | % | 100.00 | % | Securities company | |||||||||||||
| Santander Drive Auto Receivables Grantor Trust 2023-A | United States | — | (a) | — | — | Inactive | |||||||||||||||||
| Santander Drive Auto Receivables LLC | United States | 0.00 | % | 100.00 | % | 100.00 | % | 100.00 | % | Finance company | |||||||||||||
| Santander Drive Auto Receivables Trust 2020-1 | United States | — | (a) | — | — | Securitization | |||||||||||||||||
| Santander Drive Auto Receivables Trust 2020-2 | United States | — | (a) | — | — | Securitization | |||||||||||||||||
| Santander Drive Auto Receivables Trust 2020-3 | United States | — | (a) | — | — | Securitization | |||||||||||||||||
| Santander Drive Auto Receivables Trust 2020-4 | United States | — | (a) | — | — | Securitization | |||||||||||||||||
| Santander Drive Auto Receivables Trust 2021-1 | United States | — | (a) | — | — | Securitization | |||||||||||||||||
| Santander Drive Auto Receivables Trust 2021-2 | United States | — | (a) | — | — | Securitization | |||||||||||||||||
| Santander Drive Auto Receivables Trust 2021-3 | United States | — | (a) | — | — | Securitization | |||||||||||||||||
| Santander Drive Auto Receivables Trust 2021-4 | United States | — | (a) | — | — | Securitization | |||||||||||||||||
800
Subsidiaries of Banco Santander, S.A. 1 | |||||||||||||||||||||||
% of ownership held by Banco Santander | Percentage of voting power (d) | ||||||||||||||||||||||
| Company | Location | Direct | Indirect | Year 2023 | Year 2022 | Activity | |||||||||||||||||
| Santander Drive Auto Receivables Trust 2022-1 | United States | — | (a) | — | — | Securitization | |||||||||||||||||
| Santander Drive Auto Receivables Trust 2022-2 | United States | — | (a) | — | — | Securitization | |||||||||||||||||
| Santander Drive Auto Receivables Trust 2022-3 | United States | — | (a) | — | — | Securitization | |||||||||||||||||
| Santander Drive Auto Receivables Trust 2022-4 | United States | — | (a) | — | — | Securitization | |||||||||||||||||
| Santander Drive Auto Receivables Trust 2022-5 | United States | — | (a) | — | — | Securitization | |||||||||||||||||
| Santander Drive Auto Receivables Trust 2022-6 | United States | — | (a) | — | — | Securitization | |||||||||||||||||
| Santander Drive Auto Receivables Trust 2022-7 | United States | — | (a) | — | — | Securitization | |||||||||||||||||
| Santander Drive Auto Receivables Trust 2023-1 | United States | — | (a) | — | — | Securitization | |||||||||||||||||
| Santander Drive Auto Receivables Trust 2023-2 | United States | — | (a) | — | — | Securitization | |||||||||||||||||
| Santander Drive Auto Receivables Trust 2023-3 | United States | — | (a) | — | — | Securitization | |||||||||||||||||
| Santander Drive Auto Receivables Trust 2023-4 | United States | — | (a) | — | — | Securitization | |||||||||||||||||
| Santander Drive Auto Receivables Trust 2023-5 | United States | — | (a) | — | — | Securitization | |||||||||||||||||
| Santander Drive Auto Receivables Trust 2023-6 | United States | — | (a) | — | — | Securitization | |||||||||||||||||
| Santander Drive Auto Receivables Trust 2023-A | United States | — | (a) | — | — | Inactive | |||||||||||||||||
| Santander Drive Auto Receivables Trust 2023-S1 | United States | — | (a) | — | — | Securitization | |||||||||||||||||
| Santander Drive Auto Receivables Trust 2024-1 | United States | — | (a) | — | — | Inactive | |||||||||||||||||
| Santander Drive Auto Receivables Trust 2024-2 | United States | — | (a) | — | — | Inactive | |||||||||||||||||
| Santander Drive Auto Receivables Trust 2024-3 | United States | — | (a) | — | — | Inactive | |||||||||||||||||
| Santander Drive Auto Receivables Trust 2024-4 | United States | — | (a) | — | — | Inactive | |||||||||||||||||
| Santander Drive Auto Receivables Trust 2024-5 | United States | — | (a) | — | — | Inactive | |||||||||||||||||
| Santander Drive Auto Receivables Trust 2024-6 | United States | — | (a) | — | — | Inactive | |||||||||||||||||
| Santander Drive Auto Receivables Trust 2024-7 | United States | — | (a) | — | — | Inactive | |||||||||||||||||
| Santander Equity Investments Limited | United Kingdom | 0.00 | % | 100.00 | % | 100.00 | % | 100.00 | % | Finance company | |||||||||||||
| Santander España Servicios Legales y de Cumplimiento, S.L. | Spain | 99.97 | % | 0.03 | % | 100.00 | % | 100.00 | % | Services | |||||||||||||
| Santander Estates Limited | United Kingdom | 0.00 | % | 100.00 | % | 100.00 | % | 100.00 | % | Real estate | |||||||||||||
| Santander European Hospitality Opportunities | Luxembourg | 100.00 | % | 0.00 | % | 100.00 | % | 100.00 | % | Investment fund | |||||||||||||
| Santander F24 S.A. | Poland | 0.00 | % | 67.41 | % | 100.00 | % | 100.00 | % | Finance company | |||||||||||||
| Santander Facility Management España, S.L. Unipersonal | Spain | 100.00 | % | 0.00 | % | 100.00 | % | 100.00 | % | Real estate | |||||||||||||
| Santander Factoring S.A. | Chile | 0.00 | % | 99.86 | % | 100.00 | % | 100.00 | % | Factoring | |||||||||||||
| Santander Factoring Sp. z o.o. | Poland | 0.00 | % | 67.41 | % | 100.00 | % | 100.00 | % | Financial services | |||||||||||||
| Santander Factoring y Confirming, S.A. Unipersonal, E.F.C. | Spain | 100.00 | % | 0.00 | % | 100.00 | % | 100.00 | % | Factoring | |||||||||||||
| Santander Finance 2012-1 LLC | United States | 0.00 | % | 100.00 | % | 100.00 | % | 100.00 | % | Financial services | |||||||||||||
801
Subsidiaries of Banco Santander, S.A. 1 | |||||||||||||||||||||||
% of ownership held by Banco Santander | Percentage of voting power (d) | ||||||||||||||||||||||
| Company | Location | Direct | Indirect | Year 2023 | Year 2022 | Activity | |||||||||||||||||
| Santander Financial Exchanges Limited | United Kingdom | 100.00 | % | 0.00 | % | 100.00 | % | 100.00 | % | Inactive | |||||||||||||
| Santander Financial Services plc | United Kingdom | 0.00 | % | 100.00 | % | 100.00 | % | 100.00 | % | Banking | |||||||||||||
| Santander Financiamientos S.A. | Peru | 100.00 | % | 0.00 | % | 100.00 | % | 100.00 | % | Finance company | |||||||||||||
| Santander Financing S.A.S. | Colombia | 100.00 | % | 0.00 | % | 100.00 | % | 100.00 | % | Financial advisory | |||||||||||||
| Santander Finanse Sp. z o.o. | Poland | 0.00 | % | 67.41 | % | 100.00 | % | 100.00 | % | Financial services | |||||||||||||
| Santander Fintech Holdings, S.L. | Spain | 100.00 | % | 0.00 | % | 100.00 | % | 100.00 | % | Holding company | |||||||||||||
| Santander Fintech Limited (c) | United Kingdom | 100.00 | % | 0.00 | % | 100.00 | % | 100.00 | % | Finance company | |||||||||||||
| Santander Flex Fundo de Investimento Direitos Creditórios | Brazil | 0.00 | % | 90.19 | % | 100.00 | % | — | Investment fund | ||||||||||||||
| Santander Fundo de Investimento SBAC Referenciado di Crédito Privado | Brazil | 0.00 | % | 90.19 | % | 100.00 | % | 100.00 | % | Investment fund | |||||||||||||
| Santander Gestión de Recaudación y Cobranzas Ltda. | Chile | 0.00 | % | 99.86 | % | 100.00 | % | 100.00 | % | Financial services | |||||||||||||
| Santander Global Cards & Digital Solutions Brasil S.A. | Brazil | 0.00 | % | 100.00 | % | 100.00 | % | 100.00 | % | IT consulting | |||||||||||||
| Santander Global Cards & Digital Solutions, S.L. | Spain | 100.00 | % | 0.00 | % | 100.00 | % | 100.00 | % | IT services | |||||||||||||
| Santander Global Consumer Finance Limited | United Kingdom | 0.00 | % | 100.00 | % | 100.00 | % | 100.00 | % | Finance company | |||||||||||||
| Santander Global Facilities, S.A. de C.V. | Mexico | 100.00 | % | 0.00 | % | 100.00 | % | 100.00 | % | Services | |||||||||||||
| Santander Global Services S.A. (c) | Uruguay | 0.00 | % | 100.00 | % | 100.00 | % | 100.00 | % | Services | |||||||||||||
| Santander Global Services, S.L. | Spain | 100.00 | % | 0.00 | % | 100.00 | % | 100.00 | % | Real estate | |||||||||||||
| Santander Global Sport, S.A. | Spain | 100.00 | % | 0.00 | % | 100.00 | % | 100.00 | % | Sports activity | |||||||||||||
| Santander Global Technology and Operations Brasil Ltda. | Brazil | 0.00 | % | 100.00 | % | 100.00 | % | 100.00 | % | IT services | |||||||||||||
| Santander Global Technology and Operations Chile Limitada | Chile | 0.00 | % | 100.00 | % | 100.00 | % | 100.00 | % | IT services | |||||||||||||
| Santander Global Technology and Operations, S.L. Unipersonal | Spain | 100.00 | % | 0.00 | % | 100.00 | % | 100.00 | % | IT services | |||||||||||||
| Santander Green Investment, S.L. | Spain | 99.97 | % | 0.03 | % | 100.00 | % | 100.00 | % | Holding company | |||||||||||||
| Santander Guarantee Company | United Kingdom | 0.00 | % | 100.00 | % | 100.00 | % | 100.00 | % | Leasing | |||||||||||||
| Santander Hipotecario 2 Fondo de Titulización de Activos | Spain | — | (a) | — | — | Securitization | |||||||||||||||||
| Santander Hipotecario 3 Fondo de Titulización de Activos | Spain | — | (a) | — | — | Securitization | |||||||||||||||||
| Santander Holding Imobiliária S.A. | Brazil | 0.00 | % | 90.19 | % | 100.00 | % | 100.00 | % | Real estate | |||||||||||||
| Santander Holding Internacional, S.A. | Spain | 99.95 | % | 0.05 | % | 100.00 | % | 100.00 | % | Holding company | |||||||||||||
| Santander Holdings USA, Inc. | United States | 100.00 | % | 0.00 | % | 100.00 | % | 100.00 | % | Holding company | |||||||||||||
| Santander Inclusión Financiera, S.A. de C.V., S.O.F.O.M., E.R., Grupo Financiero Santander México | Mexico | 0.00 | % | 99.97 | % | 100.00 | % | 100.00 | % | Finance company | |||||||||||||
| Santander Insurance Agency, U.S., LLC | United States | 0.00 | % | 100.00 | % | 100.00 | % | 100.00 | % | Insurance intermediary | |||||||||||||
| Santander Insurance Services UK Limited | United Kingdom | 100.00 | % | 0.00 | % | 100.00 | % | 100.00 | % | Wealth management | |||||||||||||
| Santander Insurance, S.L. | Spain | 100.00 | % | 0.00 | % | 100.00 | % | — | Holding company | ||||||||||||||
| Santander Intermediación Correduría de Seguros, S.A. | Spain | 100.00 | % | 0.00 | % | 100.00 | % | 100.00 | % | Insurance intermediary | |||||||||||||
| Santander International Products, Plc. (e) | Ireland | 99.99 | % | 0.01 | % | 100.00 | % | 100.00 | % | Finance company | |||||||||||||
| Santander Inversiones S.A. | Chile | 0.00 | % | 100.00 | % | 100.00 | % | 100.00 | % | Holding company | |||||||||||||
802
Subsidiaries of Banco Santander, S.A. 1 | |||||||||||||||||||||||
% of ownership held by Banco Santander | Percentage of voting power (d) | ||||||||||||||||||||||
| Company | Location | Direct | Indirect | Year 2023 | Year 2022 | Activity | |||||||||||||||||
| Santander Investment Chile Limitada | Chile | 0.00 | % | 100.00 | % | 100.00 | % | 100.00 | % | Finance company | |||||||||||||
| Santander Investment, S.A. | Spain | 100.00 | % | 0.00 | % | 100.00 | % | 100.00 | % | Banking | |||||||||||||
| Santander Investments GP 1 S.à.r.l. | Luxembourg | 0.00 | % | 100.00 | % | 100.00 | % | 100.00 | % | Fund management company | |||||||||||||
| Santander Inwestycje Sp. z o.o. | Poland | 0.00 | % | 67.41 | % | 100.00 | % | 100.00 | % | Securities company | |||||||||||||
| Santander ISA Managers Limited | United Kingdom | 0.00 | % | 100.00 | % | 100.00 | % | 100.00 | % | Management of funds and portfolios | |||||||||||||
| Santander Lease, S.A., E.F.C. | Spain | 100.00 | % | 0.00 | % | 100.00 | % | 100.00 | % | Leasing | |||||||||||||
| Santander Leasing S.A. | Poland | 0.00 | % | 67.41 | % | 100.00 | % | 100.00 | % | Leasing | |||||||||||||
| Santander Leasing S.A. Arrendamento Mercantil | Brazil | 0.00 | % | 90.19 | % | 100.00 | % | 100.00 | % | Leasing | |||||||||||||
| Santander Leasing, LLC | United States | 0.00 | % | 100.00 | % | 100.00 | % | 100.00 | % | Leasing | |||||||||||||
| Santander Lending Limited | United Kingdom | 0.00 | % | 100.00 | % | 100.00 | % | 100.00 | % | Mortgage credit company | |||||||||||||
| Santander Mediación Operador de Banca-Seguros Vinculado, S.A. | Spain | 100.00 | % | 0.00 | % | 100.00 | % | 100.00 | % | Insurance intermediary | |||||||||||||
| Santander Merchant S.A. | Argentine | 5.10 | % | 94.90 | % | 100.00 | % | 100.00 | % | Finance company | |||||||||||||
| Santander Mortgage Holdings Limited | United Kingdom | 0.00 | % | 100.00 | % | 100.00 | % | 100.00 | % | Holding company | |||||||||||||
| Santander New Business, S.A. | Spain | 99.00 | % | 1.00 | % | 100.00 | % | — | Trade intermediary | ||||||||||||||
| Santander Paraty Qif PLC | Ireland | 0.00 | % | 90.19 | % | 100.00 | % | 100.00 | % | Investment Company | |||||||||||||
| Santander Pensiones, S.A., E.G.F.P. | Spain | 0.00 | % | 100.00 | % | 100.00 | % | 100.00 | % | Pension fund management company | |||||||||||||
| Santander Pensões - Sociedade Gestora de Fundos de Pensões, S.A. | Portugal | 100.00 | % | 0.00 | % | 100.00 | % | 100.00 | % | Pension fund management company | |||||||||||||
| Santander Prime Auto Issuance Notes 2018-A Designated Activity Company | Ireland | — | (a) | — | — | Inactive | |||||||||||||||||
| Santander Prime Auto Issuance Notes 2018-B Designated Activity Company | Ireland | — | (a) | — | — | Inactive | |||||||||||||||||
| Santander Prime Auto Issuance Notes 2018-C Designated Activity Company | Ireland | — | (a) | — | — | Inactive | |||||||||||||||||
| Santander Prime Auto Issuance Notes 2018-D Designated Activity Company | Ireland | — | (a) | — | — | Inactive | |||||||||||||||||
| Santander Prime Auto Issuance Notes 2018-E Designated Activity Company | Ireland | — | (a) | — | — | Inactive | |||||||||||||||||
| Santander Private Banking Gestión, S.A., S.G.I.I.C. | Spain | 100.00 | % | 0.00 | % | 100.00 | % | 100.00 | % | Fund management company | |||||||||||||
| Santander Private Banking s.p.a. in Liquidazione (c) | Italy | 100.00 | % | 0.00 | % | 100.00 | % | 100.00 | % | Finance company | |||||||||||||
| Santander Private Banking UK Limited | United Kingdom | 0.00 | % | 100.00 | % | 100.00 | % | 100.00 | % | Holding company | |||||||||||||
| Santander Private Real Estate Advisory & Management, S.A. | Spain | 99.99 | % | 0.01 | % | 100.00 | % | 100.00 | % | Real estate | |||||||||||||
| Santander Private Real Estate Advisory, S.A. | Spain | 100.00 | % | 0.00 | % | 100.00 | % | 100.00 | % | Real estate | |||||||||||||
| Santander Real Estate Debt 1 sub-fund | Luxembourg | 100.00 | % | 0.00 | % | 100.00 | % | — | Investment fund | ||||||||||||||
| Santander Real Estate, S.A. | Spain | 100.00 | % | 0.00 | % | 100.00 | % | 100.00 | % | Inactive | |||||||||||||
| Santander Retail Auto Lease Funding LLC | United States | 0.00 | % | 100.00 | % | 100.00 | % | 100.00 | % | Finance company | |||||||||||||
803
Subsidiaries of Banco Santander, S.A. 1 | |||||||||||||||||||||||
% of ownership held by Banco Santander | Percentage of voting power (d) | ||||||||||||||||||||||
| Company | Location | Direct | Indirect | Year 2023 | Year 2022 | Activity | |||||||||||||||||
| Santander Retail Auto Lease Trust 2021-A | United States | — | (a) | — | — | Securitization | |||||||||||||||||
| Santander Retail Auto Lease Trust 2021-B | United States | — | (a) | — | — | Securitization | |||||||||||||||||
| Santander Retail Auto Lease Trust 2021-C | United States | — | (a) | — | — | Securitization | |||||||||||||||||
| Santander Retail Auto Lease Trust 2022-A | United States | — | (a) | — | — | Securitization | |||||||||||||||||
| Santander Retail Auto Lease Trust 2022-B | United States | — | (a) | — | — | Securitization | |||||||||||||||||
| Santander Retail Auto Lease Trust 2022-C | United States | — | (a) | — | — | Inactive | |||||||||||||||||
| Santander Revolving Auto Loan Trust 2019-A | United States | — | (a) | — | — | Securitization | |||||||||||||||||
| Santander Revolving Auto Loan Trust 2021-A | United States | — | (a) | — | — | Inactive | |||||||||||||||||
| Santander RMBS 6, Fondo de Titulización | Spain | — | (a) | — | — | Securitization | |||||||||||||||||
| Santander S.A. Sociedad Securitizadora | Chile | 0.00 | % | 67.25 | % | 100.00 | % | 100.00 | % | Fund management company | |||||||||||||
| Santander Secretariat Services Limited | United Kingdom | 0.00 | % | 100.00 | % | 100.00 | % | 100.00 | % | Inactive | |||||||||||||
| Santander Securities LLC | United States | 0.00 | % | 100.00 | % | 100.00 | % | 100.00 | % | Securities company | |||||||||||||
| Santander Seguros y Reaseguros, Compañía Aseguradora, S.A. | Spain | 0.00 | % | 100.00 | % | 100.00 | % | 100.00 | % | Insurance | |||||||||||||
| Santander Servicios Corporativos, S.A. de C.V. | Mexico | 0.00 | % | 99.97 | % | 100.00 | % | 100.00 | % | Services | |||||||||||||
| Santander Technology USA, LLC | United States | 0.00 | % | 100.00 | % | 100.00 | % | 100.00 | % | IT services | |||||||||||||
| Santander Tecnología Argentina S.A. | Argentine | 0.00 | % | 99.83 | % | 100.00 | % | 100.00 | % | IT services | |||||||||||||
| Santander Tecnología México, S.A. de C.V. | Mexico | 0.00 | % | 99.97 | % | 100.00 | % | 100.00 | % | IT services | |||||||||||||
| Santander Totta Seguros, Companhia de Seguros de Vida, S.A. | Portugal | 0.00 | % | 100.00 | % | 100.00 | % | 100.00 | % | Insurance | |||||||||||||
| Santander Totta, SGPS, S.A. | Portugal | 99.91 | % | 0.00 | % | 99.91 | % | 99.91 | % | Holding company | |||||||||||||
| Santander Towarzystwo Funduszy Inwestycyjnych S.A. | Poland | 50.00 | % | 33.70 | % | 100.00 | % | 100.00 | % | Fund management company | |||||||||||||
| Santander Trade Services Limited | Hong-Kong | 0.00 | % | 100.00 | % | 100.00 | % | 100.00 | % | Inactive | |||||||||||||
| Santander Trust S.A. | Argentine | 0.00 | % | 99.99 | % | 100.00 | % | 100.00 | % | Services | |||||||||||||
| Santander UK Group Holdings plc | United Kingdom | 77.67 | % | 22.33 | % | 100.00 | % | 100.00 | % | Holding company | |||||||||||||
| Santander UK Investments | United Kingdom | 100.00 | % | 0.00 | % | 100.00 | % | 100.00 | % | Finance company | |||||||||||||
| Santander UK Operations Limited | United Kingdom | 0.00 | % | 100.00 | % | 100.00 | % | 100.00 | % | Finance company | |||||||||||||
| Santander UK plc | United Kingdom | 0.00 | % | 100.00 | % | 100.00 | % | 100.00 | % | Banking | |||||||||||||
| Santander UK Technology Limited | United Kingdom | 0.00 | % | 100.00 | % | 100.00 | % | 100.00 | % | IT services | |||||||||||||
| Santander US Capital Markets LLC | United States | 0.00 | % | 100.00 | % | 100.00 | % | 100.00 | % | Real Estate investment | |||||||||||||
| Santander Valores S.A. | Argentine | 5.10 | % | 94.73 | % | 100.00 | % | 100.00 | % | Securities company | |||||||||||||
| Santusa Holding, S.L. | Spain | 69.76 | % | 30.24 | % | 100.00 | % | 100.00 | % | Holding company | |||||||||||||
| SBNA Auto Lease Funding LLC | United States | 0.00 | % | 100.00 | % | 100.00 | % | — | Finance company | ||||||||||||||
804
Subsidiaries of Banco Santander, S.A. 1 | |||||||||||||||||||||||
% of ownership held by Banco Santander | Percentage of voting power (d) | ||||||||||||||||||||||
| Company | Location | Direct | Indirect | Year 2023 | Year 2022 | Activity | |||||||||||||||||
| SBNA Auto Lease Trust 2023-A | United States | — | (a) | — | — | Securitization | |||||||||||||||||
| SBNA Auto Lease Trust 2024-A | United States | — | (a) | — | — | Inactive | |||||||||||||||||
| SBNA Auto Lease Trust 2024-B | United States | — | (a) | — | — | Inactive | |||||||||||||||||
| SBNA Auto Lease Trust 2024-C | United States | — | (a) | — | — | Inactive | |||||||||||||||||
| SBNA Investor LLC | United States | 0.00 | % | 100.00 | % | 100.00 | % | — | Holding company | ||||||||||||||
| SC Austria Auto Finance 2020-1 Designated Activity Company | Ireland | — | (a) | — | — | Securitization | |||||||||||||||||
| SC Austria Consumer Loan 2021 Designated Activity Company | Ireland | — | (a) | — | — | Securitization | |||||||||||||||||
| SC Canada Asset Securitization Trust | Canada | — | (a) | — | — | Securitization | |||||||||||||||||
| SC Germany Auto 2014-2 UG (haftungsbeschränkt) (c) | Germany | — | (a) | — | — | Securitization | |||||||||||||||||
| SC Germany Auto 2016-2 UG (haftungsbeschränkt) (c) | Germany | — | (a) | — | — | Securitization | |||||||||||||||||
| SC Germany Auto 2018-1 UG (haftungsbeschränkt) (c) | Germany | — | (a) | — | — | Securitization | |||||||||||||||||
| SC Germany Auto 2019-1 UG (haftungsbeschränkt) | Germany | — | (a) | — | — | Securitization | |||||||||||||||||
| SC Germany Consumer 2018-1 UG (haftungsbeschränkt) (c) | Germany | — | (a) | — | — | Securitization | |||||||||||||||||
| SC Germany Mobility 2019-1 UG (haftungsbeschränkt) (c) | Germany | — | (a) | — | — | Securitization | |||||||||||||||||
| SC Germany S.A. | Luxembourg | — | (a) | — | — | Securitization | |||||||||||||||||
| SC Germany S.A., Compartment Consumer 2020-1 | Luxembourg | — | (a) | — | — | Securitization | |||||||||||||||||
| SC Germany S.A., Compartment Consumer 2021-1 | Luxembourg | — | (a) | — | — | Securitization | |||||||||||||||||
| SC Germany S.A., Compartment Consumer 2022-1 | Luxembourg | — | (a) | — | — | Securitization | |||||||||||||||||
| SC Germany S.A., Compartment Consumer 2023-1 | Luxembourg | — | (a) | — | — | Securitization | |||||||||||||||||
| SC Germany S.A., Compartment Consumer Private 2023-1 | Luxembourg | — | (a) | — | — | Securitization | |||||||||||||||||
| SC Germany S.A., Compartment Leasing 2023-1 | Luxembourg | — | (a) | — | — | Securitization | |||||||||||||||||
| SC Germany S.A., Compartment Mobility 2020-1 | Luxembourg | — | (a) | — | — | Securitization | |||||||||||||||||
| SC Mobility AB | Sweden | 0.00 | % | 100.00 | % | 100.00 | % | — | Renting | ||||||||||||||
| SC Mobility AS | Norway | 0.00 | % | 100.00 | % | 100.00 | % | — | Renting | ||||||||||||||
| SC Poland Consumer 23-1 Designated Activity Company | Ireland | — | (a) | — | — | Securitization | |||||||||||||||||
| SCF Ajoneuvohallinto IX Limited | Ireland | — | (a) | — | — | Securitization | |||||||||||||||||
| SCF Ajoneuvohallinto VII Limited (c) | Ireland | — | (a) | — | — | Securitization | |||||||||||||||||
| SCF Ajoneuvohallinto VIII Limited | Ireland | — | (a) | — | — | Securitization | |||||||||||||||||
| SCF Ajoneuvohallinto X Limited | Ireland | — | (a) | — | — | Securitization | |||||||||||||||||
| SCF Ajoneuvohallinto XI Limited | Ireland | — | (a) | — | — | Securitization | |||||||||||||||||
| SCF Ajoneuvohallinto XII Limited | Ireland | — | (a) | — | — | Securitization | |||||||||||||||||
| SCF Eastside Locks GP Limited | United Kingdom | 0.00 | % | 100.00 | % | 100.00 | % | 100.00 | % | Real estate management | |||||||||||||
| SCF Rahoituspalvelut IX DAC | Ireland | — | (a) | — | — | Securitization | |||||||||||||||||
| SCF Rahoituspalvelut VII Designated Activity Company (c) | Ireland | — | (a) | — | — | Securitization | |||||||||||||||||
| SCF Rahoituspalvelut VIII Designated Activity Company | Ireland | — | (a) | — | — | Securitization | |||||||||||||||||
| SCF Rahoituspalvelut X DAC | Ireland | — | (a) | — | — | Securitization | |||||||||||||||||
| SCF Rahoituspalvelut XI Designated Activity Company | Ireland | — | (a) | — | — | Securitization | |||||||||||||||||
805
Subsidiaries of Banco Santander, S.A. 1 | |||||||||||||||||||||||
% of ownership held by Banco Santander | Percentage of voting power (d) | ||||||||||||||||||||||
| Company | Location | Direct | Indirect | Year 2023 | Year 2022 | Activity | |||||||||||||||||
| SCF Rahoituspalvelut XII DAC | Ireland | — | (a) | — | — | Securitization | |||||||||||||||||
| SCM Poland Auto 2019-1 DAC | Ireland | — | (a) | — | — | Securitization | |||||||||||||||||
| SDMX Superdigital, S.A. de C.V., Institución de Fondos de Pago Electrónico | Mexico | 0.00 | % | 100.00 | % | 100.00 | % | 100.00 | % | Payment platform | |||||||||||||
| Secucor Finance 2021-1, DAC | Ireland | — | (a) | — | — | Securitization | |||||||||||||||||
| Services and Promotions Delaware Corp. | United States | 0.00 | % | 100.00 | % | 100.00 | % | 100.00 | % | Holding company | |||||||||||||
| Services and Promotions Miami LLC | United States | 0.00 | % | 100.00 | % | 100.00 | % | 100.00 | % | Real estate | |||||||||||||
| Servicios de Cobranza, Recuperación y Seguimiento, S.A. de C.V. | Mexico | 0.00 | % | 85.00 | % | 85.00 | % | 85.00 | % | Finance company | |||||||||||||
| Sheppards Moneybrokers Limited | United Kingdom | 0.00 | % | 100.00 | % | 100.00 | % | 100.00 | % | Inactive | |||||||||||||
| Shiloh III Wind Project, LLC | United States | 0.00 | % | 100.00 | % | 100.00 | % | 100.00 | % | Renewable energies | |||||||||||||
| SIB Besaya, S.L. Unipersonal | Spain | 0.00 | % | 100.00 | % | 100.00 | % | 100.00 | % | Holding company | |||||||||||||
| Silk Finance No. 5 | Portugal | — | (a) | — | — | Securitization | |||||||||||||||||
| SMPS Merchant Platform Solutions México, S.A de C.V. | Mexico | 0.00 | % | 100.00 | % | 100.00 | % | 100.00 | % | Payments and collection services | |||||||||||||
| Sociedad Integral de Valoraciones Automatizadas, S.A. Unipersonal | Spain | 100.00 | % | 0.00 | % | 100.00 | % | 100.00 | % | Appraisals | |||||||||||||
| Sociedad Operadora de Tarjetas de Pago Santander Getnet Chile S.A. | Chile | 0.00 | % | 67.13 | % | 100.00 | % | 100.00 | % | Payments and collection services | |||||||||||||
| Socur S.A. | Uruguay | 100.00 | % | 0.00 | % | 100.00 | % | 100.00 | % | Finance company | |||||||||||||
| Solarlaser Limited (c) | United Kingdom | 0.00 | % | 100.00 | % | 100.00 | % | 100.00 | % | Inactive | |||||||||||||
| Solution 4Fleet Consultoria Empresarial S.A. | Brazil | 0.00 | % | 72.15 | % | 80.00 | % | 80.00 | % | Vehicle rental | |||||||||||||
| Sovereign Community Development Company | United States | 0.00 | % | 100.00 | % | 100.00 | % | 100.00 | % | Holding company | |||||||||||||
| Sovereign Delaware Investment Corporation | United States | 0.00 | % | 100.00 | % | 100.00 | % | 100.00 | % | Holding company | |||||||||||||
| Sovereign Lease Holdings, LLC | United States | 0.00 | % | 100.00 | % | 100.00 | % | 100.00 | % | Financial services | |||||||||||||
| Sovereign REIT Holdings, Inc. | United States | 0.00 | % | 100.00 | % | 100.00 | % | 100.00 | % | Holding company | |||||||||||||
| Sovereign Spirit Limited (f) | Bermudas | 0.00 | % | 100.00 | % | 100.00 | % | 100.00 | % | Leasing | |||||||||||||
| SPIRE SA Compartment 2023-265 | Luxembourg | — | (a) | — | — | Finance company | |||||||||||||||||
| SPIRE SA Compartment 2023-374 | Luxembourg | — | (a) | — | — | Finance company | |||||||||||||||||
| SSA Swiss Advisors AG | Switzerland | 0.00 | % | 100.00 | % | 100.00 | % | 100.00 | % | Wealth management | |||||||||||||
| Stellantis Consumer Financial Services Polska Sp. z o.o. | Poland | 0.00 | % | 40.22 | % | 100.00 | % | 100.00 | % | Finance company | |||||||||||||
| Stellantis Financial Services Belux SA | Belgium | 0.00 | % | 50.00 | % | 100.00 | % | 100.00 | % | Finance company | |||||||||||||
| Stellantis Financial Services España, E.F.C., S.A. | Spain | 0.00 | % | 50.00 | % | 50.00 | % | 50.00 | % | Finance company | |||||||||||||
| Stellantis Financial Services Italia S.p.A. | Italy | 0.00 | % | 50.00 | % | 50.00 | % | 50.00 | % | Banking | |||||||||||||
| Stellantis Financial Services Nederland B.V. | Netherlands | 0.00 | % | 50.00 | % | 100.00 | % | 100.00 | % | Finance company | |||||||||||||
| Stellantis Financial Services Polska Sp. z o.o. | Poland | 0.00 | % | 40.22 | % | 50.00 | % | 50.00 | % | Finance company | |||||||||||||
| Stellantis Renting Italia S.p.A. | Italy | 0.00 | % | 50.00 | % | 100.00 | % | 100.00 | % | Renting | |||||||||||||
| Sterrebeeck B.V. | Netherlands | 100.00 | % | 0.00 | % | 100.00 | % | 100.00 | % | Holding company | |||||||||||||
806
Subsidiaries of Banco Santander, S.A. 1 | |||||||||||||||||||||||
% of ownership held by Banco Santander | Percentage of voting power (d) | ||||||||||||||||||||||
| Company | Location | Direct | Indirect | Year 2023 | Year 2022 | Activity | |||||||||||||||||
| Suleyado 2003, S.L. Unipersonal | Spain | 0.00 | % | 100.00 | % | 100.00 | % | 100.00 | % | Securities Investment | |||||||||||||
| Summer Empreendimentos Ltda. | Brazil | 0.00 | % | 90.19 | % | 100.00 | % | 100.00 | % | Real estate management | |||||||||||||
| Superdigital Argentina S.A.U. | Argentine | 0.00 | % | 100.00 | % | 100.00 | % | 100.00 | % | IT services | |||||||||||||
| Superdigital Colombia S.A.S. | Colombia | 0.00 | % | 100.00 | % | 100.00 | % | 100.00 | % | IT services | |||||||||||||
| Superdigital Holding Company, S.L. | Spain | 0.00 | % | 100.00 | % | 100.00 | % | 100.00 | % | Holding company | |||||||||||||
| Superdigital Instituição de Pagamento S.A. | Brazil | 0.00 | % | 100.00 | % | 100.00 | % | 100.00 | % | Payment services | |||||||||||||
| Superdigital Perú S.A.C. | Peru | 0.00 | % | 100.00 | % | 100.00 | % | 100.00 | % | Financial services | |||||||||||||
| Suzuki Servicios Financieros, S.L. | Spain | 0.00 | % | 51.00 | % | 51.00 | % | 51.00 | % | Intermediation | |||||||||||||
| Svensk Autofinans WH 1 Designated Activity Company (c) | Ireland | — | (a) | — | — | Securitization | |||||||||||||||||
| Swesant SA | Switzerland | 0.00 | % | 100.00 | % | 100.00 | % | 100.00 | % | Holding company | |||||||||||||
| SX Negócios Ltda. | Brazil | 0.00 | % | 90.19 | % | 100.00 | % | 100.00 | % | Telemarketing | |||||||||||||
| Tabasco Energía España, S.L. Unipersonal | Spain | 100.00 | % | 0.00 | % | 100.00 | % | 100.00 | % | Holding company | |||||||||||||
| Taxagest Sociedade Gestora de Participações Sociais, S.A. | Portugal | 0.00 | % | 99.87 | % | 100.00 | % | 100.00 | % | Holding company | |||||||||||||
| Taxos Luz, S.L. Unipersonal | Spain | 0.00 | % | 70.00 | % | 100.00 | % | 100.00 | % | Renewable energies | |||||||||||||
| Teatinos Siglo XXI Inversiones S.A. | Chile | 50.00 | % | 50.00 | % | 100.00 | % | 100.00 | % | Holding company | |||||||||||||
| The Alliance & Leicester Corporation Limited | United Kingdom | 0.00 | % | 100.00 | % | 100.00 | % | 100.00 | % | Real estate | |||||||||||||
| The Best Specialty Coffee, S.L. Unipersonal | Spain | 100.00 | % | 0.00 | % | 100.00 | % | 100.00 | % | Restaurant services | |||||||||||||
| Time Retail Finance Limited (c) | United Kingdom | 0.00 | % | 100.00 | % | 100.00 | % | 100.00 | % | Services | |||||||||||||
| TIMFin S.p.A. | Italy | 0.00 | % | 51.00 | % | 51.00 | % | 51.00 | % | Finance company | |||||||||||||
| Tonopah Solar I, LLC | United States | 0.00 | % | 100.00 | % | 100.00 | % | 100.00 | % | Holding company | |||||||||||||
| Tools Soluções e Serviços Compartilhados Ltda. | Brazil | 0.00 | % | 90.19 | % | 100.00 | % | 100.00 | % | Services | |||||||||||||
| Tornquist Asesores de Seguros S.A. (c) | Argentine | 0.00 | % | 99.99 | % | 99.99 | % | 99.99 | % | Inactive | |||||||||||||
| Toro Asset Management S.A. | Brazil | 0.00 | % | 56.48 | % | 100.00 | % | 100.00 | % | Securities Investment | |||||||||||||
| Toro Corretora de Títulos e Valores Mobiliários Ltda. | Brazil | 0.00 | % | 56.38 | % | 62.51 | % | 63.00 | % | Securities company | |||||||||||||
| Toro Investimentos S.A. | Brazil | 0.00 | % | 56.48 | % | 91.32 | % | 91.32 | % | Securities company | |||||||||||||
| Totta (Ireland), PLC | Ireland | 0.00 | % | 99.87 | % | 100.00 | % | 100.00 | % | Finance company | |||||||||||||
| Totta Urbe - Empresa de Administração e Construções, S.A. | Portugal | 0.00 | % | 99.87 | % | 100.00 | % | 100.00 | % | Real estate | |||||||||||||
| Trabajando.com Mexico, S.A. de C.V. en liquidación (c) | Mexico | 0.00 | % | 100.00 | % | 100.00 | % | 100.00 | % | Services | |||||||||||||
| Trainera Venture Finance I, F.C.R.-PYME | Spain | 99.00 | % | 0.00 | % | 99.00 | % | — | Venture capital fund | ||||||||||||||
807
Subsidiaries of Banco Santander, S.A.1 | |||||||||||||||||||||||
% of ownership held by Banco Santander | Percentage of voting power (d) | ||||||||||||||||||||||
Company | Location | Direct | Indirect | Year 2023 | Year 2022 | Activity | |||||||||||||||||
| Trans Skills Employment Services - Sole Proprietorship LLC | Arab United Emirates | 0.00 | % | 66.54 | % | 100.00 | % | — | Human resources services | ||||||||||||||
| Trans Skills Information Technology LLC | Saudi Arabia | 0.00 | % | 66.54 | % | 100.00 | % | — | Inactive | ||||||||||||||
| Trans Skills Investment in Commercial Enterprises & Management Co. LLC | Arab United Emirates | 0.00 | % | 66.54 | % | 100.00 | % | — | Holding company | ||||||||||||||
| Trans Skills South Africa (Pty) Limited | Republic of South Africa | 0.00 | % | 66.54 | % | 100.00 | % | — | Inactive | ||||||||||||||
| Trans Skills Technology Services LLC | Arab United Emirates | 0.00 | % | 66.54 | % | 100.00 | % | — | IT services | ||||||||||||||
| Transolver Finance EFC, S.A. | Spain | 0.00 | % | 51.00 | % | 51.00 | % | 51.00 | % | Leasing | |||||||||||||
| Tresmares Santander Direct Lending, SICC, S.A. | Spain | 99.67 | % | 0.00 | % | 99.67 | % | 99.60 | % | Fund management company | |||||||||||||
| Tuttle and Son Limited (c) | United Kingdom | 0.00 | % | 100.00 | % | 100.00 | % | 100.00 | % | Inactive | |||||||||||||
| TVG-Trappgroup Versicherungsvermittlungs-GmbH | Germany | 0.00 | % | 90.01 | % | 100.00 | % | — | Insurance brokerage | ||||||||||||||
| Universia Brasil S.A. | Brazil | 0.00 | % | 100.00 | % | 100.00 | % | 100.00 | % | Internet | |||||||||||||
| Universia Chile S.A. | Chile | 0.00 | % | 86.84 | % | 86.84 | % | 86.84 | % | Internet | |||||||||||||
| Universia Colombia S.A.S. | Colombia | 0.00 | % | 100.00 | % | 100.00 | % | 100.00 | % | Internet | |||||||||||||
| Universia España Red de Universidades, S.A. | Spain | 0.00 | % | 89.45 | % | 89.45 | % | 89.45 | % | Internet | |||||||||||||
| Universia Holding, S.L. | Spain | 100.00 | % | 0.00 | % | 100.00 | % | 100.00 | % | Holding company | |||||||||||||
| Universia México, S.A. de C.V. | Mexico | 0.00 | % | 100.00 | % | 100.00 | % | 100.00 | % | Internet | |||||||||||||
| Universia Perú, S.A. | Peru | 0.00 | % | 99.40 | % | 99.40 | % | 99.76 | % | Internet | |||||||||||||
| Universia Uruguay, S.A. | Uruguay | 0.00 | % | 100.00 | % | 100.00 | % | 100.00 | % | Internet | |||||||||||||
| Uro Property Holdings, S.A. | Spain | 99.99 | % | 0.00 | % | 99.99 | % | 99.99 | % | Real estate investment | |||||||||||||
| Virtua Advanced Solutions FZE | Arab United Emirates | 0.00 | % | 66.54 | % | 100.00 | % | — | Payment services | ||||||||||||||
| Wallcesa, S.A. | Spain | 100.00 | % | 0.00 | % | 100.00 | % | 100.00 | % | Financial services | |||||||||||||
| Waycarbon Soluções Ambientais e Projetos de Carbono S.A. | Brazil | 0.00 | % | 80.00 | % | 100.00 | % | 100.00 | % | Consulting services | |||||||||||||
| WIM Servicios Corporativos, S.A. de C.V. | Mexico | 0.00 | % | 85.00 | % | 100.00 | % | 100.00 | % | Advisory services | |||||||||||||
| WTW Shipping Designated Activity Company | Ireland | 100.00 | % | 0.00 | % | 100.00 | % | 100.00 | % | Leasing | |||||||||||||
a.Companies over which effective control is maintained.
b.Companies in liquidation. Pending registration.
c.Company in liquidation as at 31 December 2023.
d.Pursuant to Article 3 of Royal Decree 1159/ 2010, of 17 September, approving the rules for the preparation of consolidated annual accounts, in order to determine the voting rights, voting rights held directly by the parent company have been added to those held by companies controlled by the parent company or by other persons acting in their own name but on behalf of a Group company. For these purposes, the number of votes corresponding to the parent company, in relation to the companies indirectly dependent on it, is that corresponding to the dependent company that directly participates in the share capital of the latter.
e.Company resident for tax purposes in Spain.
f.Company resident for tax purposes in the United Kingdom.
(1) Companies issuing preference shares are listed in Annex III, together with other relevant information.
808
Appendix II
| Societies of which Grupo Santander owns more than 5% (c) , entities associated with Grupo Santander and jointly controlled entities | ||||||||||||||||||||||||||
| % of ownership held by Banco Santander | Percentage of voting power (b) | |||||||||||||||||||||||||
| Company | Location | Direct | Indirect | Year 2023 | Year 2022 | Activity | Type of company | |||||||||||||||||||
| Abra 1 Limited | Cayman Island | — | (d) | — | — | Leasing | Joint ventures | |||||||||||||||||||
| Administrador Financiero de Transantiago S.A. | Chile | 0.00 | % | 13.43 | % | 20.00 | % | 20.00 | % | Collection and payment services | Associated | |||||||||||||||
| Aegon Santander Portugal Não Vida - Companhia de Seguros, S.A. | Portugal | 0.00 | % | 49.00 | % | 49.00 | % | 49.00 | % | Insurance | Joint Ventures | |||||||||||||||
| Aegon Santander Portugal Vida - Companhia de Seguros Vida, S.A. | Portugal | 0.00 | % | 49.00 | % | 49.00 | % | 49.00 | % | Insurance | Joint Ventures | |||||||||||||||
| Aeroplan - Sociedade Construtora de Aeroportos, Lda. (a) | Portugal | 0.00 | % | 19.97 | % | 20.00 | % | 20.00 | % | Inactive | — | |||||||||||||||
| Aguas de Fuensanta, S.A. (a) | Spain | 36.78 | % | 0.00 | % | 36.78 | % | 36.78 | % | Food | — | |||||||||||||||
| Alcuter 2, S.L. | Spain | 37.23 | % | 0.00 | % | 37.23 | % | 37.23 | % | Technical services | — | |||||||||||||||
| Alma UK Holdings Ltd (consolidado) | United Kingdom | 30.00 | % | 0.00 | % | 30.00 | % | 30.00 | % | Holding company | Joint Ventures | |||||||||||||||
| Apolo Fundo de Investimento em Direitos Creditórios | Brazil | 0.00 | % | 30.06 | % | 33.33 | % | 33.33 | % | Investment fund | Joint Ventures | |||||||||||||||
| Attijariwafa Bank Société Anonyme (consolidado) | Morocco | 0.00 | % | 5.10 | % | 5.10 | % | 5.10 | % | Banking | — | |||||||||||||||
| AutoFi Inc. | United States | 0.00 | % | 18.01 | % | 4.99 | % | 4.99 | % | E-commerce | — | |||||||||||||||
| Autopistas del Sol S.A. | Argentina | 0.00 | % | 14.17 | % | 14.17 | % | 14.17 | % | Highway concession | — | |||||||||||||||
| Avanath Affordable Housing IV LLC | United States | 0.00 | % | 7.27 | % | 7.27 | % | 7.27 | % | Investment company | — | |||||||||||||||
| Banco RCI Brasil S.A. | Brazil | 0.00 | % | 35.98 | % | 39.89 | % | 39.89 | % | Banking | Joint Ventures | |||||||||||||||
| Banco S3 Caceis México, S.A., Institución de Banca Múltiple | Mexico | 0.00 | % | 50.00 | % | 50.00 | % | 50.00 | % | Banking | Joint Ventures | |||||||||||||||
| Bank of Beijing Consumer Finance Company | China | 0.00 | % | 20.00 | % | 20.00 | % | 20.00 | % | Financial company | Associated | |||||||||||||||
| Bank of Shanghai Co., Ltd. (consolidado) | China | 6.54 | % | 0.00 | % | 6.54 | % | 6.54 | % | Banking | — | |||||||||||||||
| Biomas – Serviços Ambientais, Restauração e Carbono S.A. | Brazil | 0.00 | % | 15.03 | % | 16.67 | % | — | Consulting services | Associated | ||||||||||||||||
| Bizum, S.L. | Spain | 20.92 | % | 0.00 | % | 20.92 | % | 20.92 | % | Payment services | Associated | |||||||||||||||
| CACEIS (consolidado) | France | 0.00 | % | 30.50 | % | 30.50 | % | 30.50 | % | Custody services | Associated | |||||||||||||||
| Campo Grande Empreendimentos Ltda. (a) | Brazil | 0.00 | % | 22.84 | % | 25.32 | % | 25.32 | % | Inactive | — | |||||||||||||||
| Carrow Works (Norwich) Limited | United Kingdom | 0.00 | % | 88.00 | % | 88.00 | % | — | Real Estate investment | Joint Ventures | ||||||||||||||||
| CCPT - ComprarCasa, Rede Serviços Imobiliários, S.A. | Portugal | 0.00 | % | 49.98 | % | 49.98 | % | 49.98 | % | Real Estate services | Joint Ventures | |||||||||||||||
| Centro de Compensación Automatizado S.A. | Chile | 0.00 | % | 22.38 | % | 33.33 | % | 33.33 | % | Collection and payment services | Associated | |||||||||||||||
| Centro para el Desarrollo, Investigación y Aplicación de Nuevas Tecnologías, S.A. | Spain | 0.00 | % | 49.00 | % | 49.00 | % | 49.00 | % | Technology | Associated | |||||||||||||||
| CIP S.A. | Brazil | 0.00 | % | 15.80 | % | 17.52 | % | 17.87 | % | Financial services | Associated | |||||||||||||||
| CNP Santander Insurance Europe Designated Activity Company | Ireland | 0.00 | % | 49.00 | % | 49.00 | % | 49.00 | % | Insurance | Associated | |||||||||||||||
| CNP Santander Insurance Life Designated Activity Company | Ireland | 0.00 | % | 49.00 | % | 49.00 | % | 49.00 | % | Insurance | Associated | |||||||||||||||
| CNP Santander Insurance Services Ireland Limited | Ireland | 0.00 | % | 49.00 | % | 49.00 | % | 49.00 | % | Services | Associated | |||||||||||||||
809
| Societies of which Grupo Santander owns more than 5% (c) , entities associated with Grupo Santander and jointly controlled entities | ||||||||||||||||||||||||||
| % of ownership held by Banco Santander | Percentage of voting power (b) | |||||||||||||||||||||||||
| Company | Location | Direct | Indirect | Year 2023 | Year 2022 | Activity | Type of company | |||||||||||||||||||
| Comder Contraparte Central S.A | Chile | 0.00 | % | 8.37 | % | 12.47 | % | 12.47 | % | Financial services | Associated | |||||||||||||||
| Companhia Promotora UCI | Brazil | 0.00 | % | 25.00 | % | 25.00 | % | 25.00 | % | Financial services | Joint Ventures | |||||||||||||||
| Compañia Española de Financiación de Desarrollo, Cofides, S.A., SME | Spain | 20.18 | % | 0.00 | % | 20.18 | % | 20.18 | % | Financial company | — | |||||||||||||||
| Compañía Española de Seguros de Crédito a la Exportación, S.A., Compañía de Seguros y Reaseguros (consolidado) | Spain | 23.33 | % | 0.55 | % | 23.88 | % | 23.88 | % | Credit Insurance | — | |||||||||||||||
| Compañía Española de Viviendas en Alquiler, S.A. | Spain | 24.07 | % | 0.00 | % | 24.07 | % | 24.07 | % | Real Estate | Associated | |||||||||||||||
| Compañía para los Desarrollos Inmobiliarios de la Ciudad de Hispalis, S.L., en liquidación (a) | Spain | 21.98 | % | 0.00 | % | 21.98 | % | 21.98 | % | Real Estate promotion | — | |||||||||||||||
| Connecting Visions Ecosystems, S.L. | Spain | 19.90 | % | 0.00 | % | 19.90 | % | 19.90 | % | Consulting services | Joint Ventures | |||||||||||||||
| Corkfoc Cortiças, S.A. | Portugal | 0.00 | % | 27.54 | % | 27.58 | % | 27.58 | % | Cork industry | — | |||||||||||||||
| CSD Central de Serviços de Registro e Depósito Aos Mercados Financeiro e de Capitais S.A. | Brazil | 0.00 | % | 18.04 | % | 20.00 | % | 20.00 | % | Financial services | Associated | |||||||||||||||
| Desarrollo Eólico las Majas VI, S.L. | Spain | 45.00 | % | 0.00 | % | 45.00 | % | 45.00 | % | Renewable energies | Joint Ventures | |||||||||||||||
| DoRes Securitisation S.r.l | Italy | — | (d) | — | — | Securitization | Joint Ventures | |||||||||||||||||||
| Enauta Participaçoes S.A. (consolidado) | Brazil | 0.00 | % | 5.52 | % | 6.12 | % | — | Holding company | — | ||||||||||||||||
| Energias Renovables de Ormonde 25, S.L. | Spain | 0.00 | % | 55.00 | % | 55.00 | % | 55.00 | % | Renewable energies | Joint Ventures | |||||||||||||||
| Energias Renovables de Ormonde 26, S.L. | Spain | 0.00 | % | 55.00 | % | 55.00 | % | 55.00 | % | Renewable energies | Joint Ventures | |||||||||||||||
| Energias Renovables de Ormonde 27, S.L. | Spain | 0.00 | % | 55.00 | % | 55.00 | % | 55.00 | % | Renewable energies | Joint Ventures | |||||||||||||||
| Energias Renovables de Ormonde 30, S.L. | Spain | 0.00 | % | 55.00 | % | 55.00 | % | 55.00 | % | Renewable energies | Joint Ventures | |||||||||||||||
| Energias Renovables de Titania, S.L. | Spain | 0.00 | % | 55.00 | % | 55.00 | % | 55.00 | % | Renewable energies | Joint Ventures | |||||||||||||||
| Energias Renovables Gladiateur 45, S.L. | Spain | 0.00 | % | 55.00 | % | 55.00 | % | 55.00 | % | Renewable energies | Joint Ventures | |||||||||||||||
| Energias Renovables Prometeo, S.L. | Spain | 0.00 | % | 55.00 | % | 55.00 | % | 55.00 | % | Renewable energies | Joint Ventures | |||||||||||||||
| Ethias Lease N.V. | Belgium | 0.00 | % | 50.00 | % | 50.00 | % | — | Leasing | Associated | ||||||||||||||||
| Euro Automatic Cash Entidad de Pago, S.L. | Spain | 50.00 | % | 0.00 | % | 50.00 | % | 50.00 | % | Payment services | Associated | |||||||||||||||
| European Hospitality Opportunities S.à r.l. | Luxembourg | 0.00 | % | 49.00 | % | 49.00 | % | 49.00 | % | Holding company | Joint Ventures | |||||||||||||||
| Evacuación Liquesun, S.L. | Spain | 0.00 | % | 35.00 | % | 50.00 | % | — | Exploitation of electrical energy | Joint Ventures | ||||||||||||||||
| Evolve SPV S.r.l. | Italy | — | (d) | — | — | Securitization | Joint Ventures | |||||||||||||||||||
| FAFER- Empreendimentos Urbanísticos e de Construção, S.A. (a) | Portugal | 0.00 | % | 36.58 | % | 36.62 | % | 36.62 | % | Real Estate | — | |||||||||||||||
| Federal Home Loan Bank of Pittsburgh | United States | 0.00 | % | 7.48 | % | 7.48 | % | 6.05 | % | Banking | — | |||||||||||||||
| Federal Reserve Bank of Boston | United States | 0.00 | % | 19.14 | % | 19.14 | % | 19.12 | % | Banking | — | |||||||||||||||
| Fondo de Titulización de Activos UCI 11 | Spain | — | (d) | — | — | Securitization | Joint Ventures | |||||||||||||||||||
| Fondo de Titulización de Activos UCI 14 | Spain | — | (d) | — | — | Securitization | Joint Ventures | |||||||||||||||||||
810
| Societies of which Grupo Santander owns more than 5% (c) , entities associated with Grupo Santander and jointly controlled entities | ||||||||||||||||||||||||||
| % of ownership held by Banco Santander | Percentage of voting power (b) | |||||||||||||||||||||||||
| Company | Location | Direct | Indirect | Year 2023 | Year 2022 | Activity | Type of company | |||||||||||||||||||
| Fondo de Titulización de Activos UCI 15 | Spain | — | (d) | — | — | Securitization | Joint Ventures | |||||||||||||||||||
| Fondo de Titulización de Activos UCI 16 | Spain | — | (d) | — | — | Securitization | Joint Ventures | |||||||||||||||||||
| Fondo de Titulización de Activos UCI 17 | Spain | — | (d) | — | — | Securitization | Joint Ventures | |||||||||||||||||||
| Fondo de Titulización Hipotecaria UCI 12 | Spain | — | (d) | — | — | Securitization | Joint Ventures | |||||||||||||||||||
| Fondo de Titulización, RMBS Green Prado XI | Spain | — | (d) | — | — | Securitization | Joint Ventures | |||||||||||||||||||
| Fondo de Titulización, RMBS Prado IX | Spain | — | (d) | — | — | Securitization | Joint Ventures | |||||||||||||||||||
| Fondo de Titulización, RMBS Prado VII | Spain | — | (d) | — | — | Securitization | Joint Ventures | |||||||||||||||||||
| Fondo de Titulización, RMBS Prado VIII | Spain | — | (d) | — | — | Securitization | Joint Ventures | |||||||||||||||||||
| Fondo de Titulización, RMBS Prado X | Spain | — | (d) | — | — | Securitization | Joint Ventures | |||||||||||||||||||
| Fortune Auto Finance Co., Ltd | China | 0.00 | % | 50.00 | % | 50.00 | % | 50.00 | % | Finance Company | Joint Ventures | |||||||||||||||
| FrauDfense, S.L. | Spain | 0.00 | % | 33.33 | % | 33.33 | % | — | Technological services | Joint Ventures | ||||||||||||||||
| Fremman limited | United Kingdom | 32.99 | % | 0.00 | % | 4.99 | % | 4.99 | % | Finance Company | Associated | |||||||||||||||
| Gestora de Inteligência de Crédito S.A. | Brazil | 0.00 | % | 14.03 | % | 16.00 | % | 10.00 | % | Collection service | Joint Ventures | |||||||||||||||
| Gire S.A. | Argentina | 0.00 | % | 58.23 | % | 58.33 | % | 58.33 | % | Collection and payment services | Associated | |||||||||||||||
| Glenrowan Solar Holdings Pty Ltd | Australia | 49.00 | % | 0.00 | % | 49.00 | % | — | Holding company | Joint Ventures | ||||||||||||||||
| HCUK Auto Funding 2017-2 Ltd | United Kingdom | — | (d) | — | — | Securitization | Joint Ventures | |||||||||||||||||||
| HCUK Auto Funding 2022-1 Limited | United Kingdom | — | (d) | — | — | Securitization | Joint Ventures | |||||||||||||||||||
| Healthy Neighborhoods Equity Fund I LP | United States | 0.00 | % | 22.37 | % | 22.37 | % | 22.37 | % | Real Estate | — | |||||||||||||||
| Hillcrest Private Equity Real Estate LLP | United Kingdom | 0.00 | % | 88.00 | % | 88.00 | % | — | Real Estate | Joint Ventures | ||||||||||||||||
| Hyundai Capital UK Limited | United Kingdom | 0.00 | % | 50.01 | % | 50.01 | % | 50.01 | % | Finance Company | Joint Ventures | |||||||||||||||
| Hyundai Corretora de Seguros Ltda. | Brazil | 0.00 | % | 45.09 | % | 50.00 | % | 50.00 | % | Insurance mediation | Joint Ventures | |||||||||||||||
| Imperial Holding S.C.A. (a) | Luxembourg | 0.00 | % | 36.36 | % | 36.36 | % | 36.36 | % | Securities Investment | — | |||||||||||||||
| Imperial Management S.à r.l. (a) | Luxembourg | 0.00 | % | 40.20 | % | 40.20 | % | 40.20 | % | Holding company | — | |||||||||||||||
| Inverlur Aguilas I, S.L. | Spain | 0.00 | % | 50.00 | % | 50.00 | % | 50.00 | % | Real Estate | Joint Ventures | |||||||||||||||
| Inverlur Aguilas II, S.L. | Spain | 0.00 | % | 50.00 | % | 50.00 | % | 50.00 | % | Real Estate | Joint Ventures | |||||||||||||||
| Inversiones Ibersuizas, S.A. en liquidación (a) | Spain | 25.42 | % | 0.00 | % | 25.42 | % | 25.42 | % | Venture Capital company | — | |||||||||||||||
| Inversiones ZS América Dos Ltda. | Chile | 0.00 | % | 49.00 | % | 49.00 | % | 49.00 | % | Seurities and Real Estate Investment | Associated | |||||||||||||||
| Inversiones ZS América SpA | Chile | 0.00 | % | 49.00 | % | 49.00 | % | 49.00 | % | Seurities and Real Estate Investment | Associated | |||||||||||||||
| LB Oprent, S.A. | Spain | 40.00 | % | 0.00 | % | 40.00 | % | 40.00 | % | Rental of industrial machinery | Associated | |||||||||||||||
811
| Societies of which Grupo Santander owns more than 5% (c) , entities associated with Grupo Santander and jointly controlled entities | ||||||||||||||||||||||||||
| % of ownership held by Banco Santander | Percentage of voting power (b) | |||||||||||||||||||||||||
| Company | Location | Direct | Indirect | Year 2023 | Year 2022 | Activity | Type of company | |||||||||||||||||||
| Mapfre Santander Portugal - Companhia de Seguros, S.A. | Portugal | 0.00 | % | 49.99 | % | 49.99 | % | 49.99 | % | Insurance | Associated | |||||||||||||||
| Massachusetts Business Development Corp. (consolidado) | United States | 0.00 | % | 21.61 | % | 21.61 | % | 21.61 | % | Finance Company | — | |||||||||||||||
| MB Capital Fund IV, LLC | United States | 0.00 | % | 21.51 | % | 21.51 | % | 21.51 | % | Finance Company | — | |||||||||||||||
| Merlin Properties, SOCIMI, S.A. (consolidado) | Spain | 19.03 | % | 5.63 | % | 24.66 | % | 24.64 | % | Real Estate investment | Associated | |||||||||||||||
| Metrovacesa, S.A. (consolidado) | Spain | 31.94 | % | 17.55 | % | 49.49 | % | 49.44 | % | Real Estate promotion | Associated | |||||||||||||||
| Niuco 15, S.L. | Spain | 57.10 | % | 0.00 | % | 57.10 | % | 57.10 | % | Technical services | — | |||||||||||||||
| Ocyener 2008, S.L. | Spain | 0.00 | % | 45.00 | % | 45.00 | % | 45.00 | % | Holding company | Associated | |||||||||||||||
| Operadora de Activos Beta, S.A. de C.V. | Mexico | 49.99 | % | 0.00 | % | 49.99 | % | 49.99 | % | Finance Company | Associated | |||||||||||||||
| Payever GmbH | Germany | 0.00 | % | 10.00 | % | 10.00 | % | 10.00 | % | Software | Associated | |||||||||||||||
| Play Digital S.A. | Argentina | 0.00 | % | 14.69 | % | 14.71 | % | 15.38 | % | Payment platform | Associated | |||||||||||||||
| POLFUND - Fundusz Poręczeń Kredytowych S.A. | Poland | 0.00 | % | 33.70 | % | 50.00 | % | 50.00 | % | Investment management | Associated | |||||||||||||||
| Portland SPV S.r.l. | Italy | — | (d) | — | — | Securitization | Joint Ventures | |||||||||||||||||||
| Premier House (Twickenham) Limited | United Kingdom | 0.00 | % | 88.00 | % | 88.00 | % | — | Real Estate | Joint Ventures | ||||||||||||||||
| Procapital - Investimentos Imobiliários, S.A. (a) | Portugal | 0.00 | % | 39.97 | % | 40.00 | % | 40.00 | % | Real Estate | — | |||||||||||||||
| Project Quasar Investments 2017, S.L. (consolidado) | Spain | 49.00 | % | 0.00 | % | 49.00 | % | 49.00 | % | Holding company | — | |||||||||||||||
| Promontoria Manzana, S.A. (consolidado) | Spain | 20.00 | % | 0.00 | % | 20.00 | % | 20.00 | % | Holding company | Associated | |||||||||||||||
| Redbanc S.A. | Chile | 0.00 | % | 22.44 | % | 33.43 | % | 33.43 | % | Services | Associated | |||||||||||||||
| Redsys Servicios de Procesamiento, S.L. (consolidado) | Spain | 24.90 | % | 0.06 | % | 24.96 | % | 24.96 | % | Cards | Associated | |||||||||||||||
| Retama Real Estate, S.A. Unipersonal | Spain | 0.00 | % | 50.00 | % | 50.00 | % | 50.00 | % | Real Estate | Joint Ventures | |||||||||||||||
| Rías Redbanc S.A. | Uruguay | 0.00 | % | 25.00 | % | 25.00 | % | 25.00 | % | Services | — | |||||||||||||||
| RMBS Belém No.2 | Portugal | — | (d) | — | — | Securitization | Joint Ventures | |||||||||||||||||||
| RMBS Green Belém No.1 | Portugal | — | (d) | — | — | Securitization | Joint Ventures | |||||||||||||||||||
| S3 Caceis Brasil Distribuidora de Títulos e Valores Mobiliários S.A. | Brazil | 0.00 | % | 50.00 | % | 50.00 | % | 50.00 | % | Securities company | Joint Ventures | |||||||||||||||
| S3 Caceis Brasil Participações S.A. | Brazil | 0.00 | % | 50.00 | % | 50.00 | % | 50.00 | % | Holding company | Joint Ventures | |||||||||||||||
| S3 CACEIS Colombia S.A. Sociedad Fiduciaria | Colombia | 0.00 | % | 50.00 | % | 50.00 | % | 50.00 | % | Finance Company | Joint Ventures | |||||||||||||||
| San Preca Federal I Fundo de Investimento em Direitos Creditórios Não-Padronizados | Brazil | 0.00 | % | 45.09 | % | 50.00 | % | 50.00 | % | Investment fund | Joint Ventures | |||||||||||||||
| Sancus Green Investments II, S.C.R., S.A. | Spain | 0.00 | % | 32.95 | % | 32.95 | % | 41.60 | % | Venture Capital company | — | |||||||||||||||
| Santander Allianz Towarzystwo Ubezpieczeń na Życie S.A. | Poland | 0.00 | % | 33.03 | % | 49.00 | % | 49.00 | % | Insurance | Associated | |||||||||||||||
| Santander Allianz Towarzystwo Ubezpieczeń S.A. | Poland | 0.00 | % | 33.03 | % | 49.00 | % | 49.00 | % | Insurance | Associated | |||||||||||||||
| Santander Assurance Solutions, S.A. | Spain | 0.00 | % | 66.67 | % | 66.67 | % | 66.67 | % | Insurance mediation | Joint Ventures | |||||||||||||||
| Santander Auto S.A. | Brazil | 0.00 | % | 45.09 | % | 50.00 | % | 50.00 | % | Insurance | Associated | |||||||||||||||
812
| Societies of which Grupo Santander owns more than 5% (c) , entities associated with Grupo Santander and jointly controlled entities | ||||||||||||||||||||||||||
| % of ownership held by Banco Santander | Percentage of voting power (b) | |||||||||||||||||||||||||
| Company | Location | Direct | Indirect | Year 2023 | Year 2022 | Activity | Type of company | |||||||||||||||||||
| Santander Caceis Latam Holding 1, S.L. | Spain | 0.00 | % | 50.00 | % | 50.00 | % | 50.00 | % | Holding company | Joint Ventures | |||||||||||||||
| Santander Caceis Latam Holding 2, S.L. | Spain | 0.00 | % | 50.00 | % | 50.00 | % | 50.00 | % | Holding company | Joint Ventures | |||||||||||||||
| Santander Generales Seguros y Reaseguros, S.A. | Spain | 0.00 | % | 49.00 | % | 49.00 | % | 49.00 | % | Insurance | Joint Ventures | |||||||||||||||
| Santander Mapfre Hipoteca Inversa, E.F.C., S.A. | Spain | 0.00 | % | 50.00 | % | 50.00 | % | 45.00 | % | Finance Company | Associated | |||||||||||||||
| Santander Mapfre Seguros y Reaseguros, S.A. | Spain | 0.00 | % | 49.99 | % | 49.99 | % | 49.99 | % | Insurance | Associated | |||||||||||||||
| Santander Vida Seguros y Reaseguros, S.A. | Spain | 0.00 | % | 49.00 | % | 49.00 | % | 49.00 | % | Insurance | Joint Ventures | |||||||||||||||
| Sepacon 31, S.L. | Spain | 37.23 | % | 0.00 | % | 37.23 | % | 37.23 | % | Technical services | — | |||||||||||||||
| Servicios de Infraestructura de Mercado OTC S.A | Chile | 0.00 | % | 8.38 | % | 12.48 | % | 12.48 | % | Services | Associated | |||||||||||||||
| SIBS-SGPS, S.A. (consolidado) | Portugal | 0.00 | % | 15.54 | % | 15.56 | % | 16.55 | % | Portfolio Management | — | |||||||||||||||
| SIG RCRS A/B MF 2023 Venture LLC (f) | United States | 0.00 | % | 20.00 | % | 20.00 | % | — | Finance Company | — | ||||||||||||||||
| Siguler Guff SBIC Fund LP | United States | 0.00 | % | 20.00 | % | 20.00 | % | 20.00 | % | Investment company | — | |||||||||||||||
| Sistema de Tarjetas y Medios de Pago, S.A. | Spain | 20.61 | % | 0.00 | % | 20.61 | % | 20.61 | % | Payment methods | Associated | |||||||||||||||
| Sociedad Conjunta para la Emisión y Gestión de Medios de Pago, E.F.C., S.A. | Spain | 45.70 | % | 0.00 | % | 45.70 | % | 45.70 | % | Payment services | Joint Ventures | |||||||||||||||
| Sociedad de Garantía Recíproca de Santander, S.G.R. | Spain | 24.94 | % | 0.22 | % | 25.16 | % | 25.60 | % | Financial services | — | |||||||||||||||
| Sociedad de Gestión de Activos Procedentes de la Reestructuración Bancaria, S.A. | Spain | 22.21 | % | 0.00 | % | 22.21 | % | 22.21 | % | Financial services | — | |||||||||||||||
| Sociedad Interbancaria de Depósitos de Valores S.A. | Chile | 0.00 | % | 19.66 | % | 29.29 | % | 29.29 | % | Securities depository | Associated | |||||||||||||||
| Solar Maritime Designated Activity Company | Ireland | — | (d) | — | — | Leasing | Joint Ventures | |||||||||||||||||||
| STELLANTIS Insurance Europe Limited | Malta | 0.00 | % | 50.00 | % | 50.00 | % | 50.00 | % | Insurance | Joint Ventures | |||||||||||||||
| STELLANTIS Life Insurance Europe Limited | Malta | 0.00 | % | 50.00 | % | 50.00 | % | 50.00 | % | Insurance | Joint Ventures | |||||||||||||||
| Stephens Ranch Wind Energy Holdco LLC (consolidado) | United States | 0.00 | % | 17.00 | % | 17.00 | % | 20.50 | % | Renewable energies | — | |||||||||||||||
| Tecnologia Bancária S.A. | Brazil | 0.00 | % | 17.11 | % | 19.81 | % | 18.98 | % | ATMs | Associated | |||||||||||||||
| Tonopah Solar Energy Holdings I, LLC | United States | 0.00 | % | 26.80 | % | 26.80 | % | 26.80 | % | Holding company | Joint Ventures | |||||||||||||||
| Trabajando.com Chile S.A. | Chile | 0.00 | % | 33.33 | % | 33.33 | % | 33.33 | % | Services | Associated | |||||||||||||||
| Transbank S.A. | Chile | 0.00 | % | 16.78 | % | 25.00 | % | 25.00 | % | Cards | Associated | |||||||||||||||
| Tresmares Growth Fund II, S.C.R., S.A. | Spain | 40.00 | % | 0.00 | % | 40.00 | % | 40.00 | % | Holding company | — | |||||||||||||||
| Tresmares Growth Fund III, S.C.R., S.A. | Spain | 40.00 | % | 0.00 | % | 40.00 | % | 40.00 | % | Holding company | — | |||||||||||||||
| Tresmares Growth Fund Santander, S.C.R., S.A. (e) | Spain | 100.00 | % | 0.00 | % | 100.00 | % | 100.00 | % | Holding company | — | |||||||||||||||
| U.C.I., S.A. | Spain | 50.00 | % | 0.00 | % | 50.00 | % | 50.00 | % | Holding company | Joint Ventures | |||||||||||||||
| UCI Hellas Credit and Loan Receivables Servicing Company S.A. | Greece | 0.00 | % | 50.00 | % | 50.00 | % | 50.00 | % | Financial services | Joint Ventures | |||||||||||||||
| UCI Holding Brasil Ltda. | Brazil | 0.00 | % | 50.00 | % | 50.00 | % | 50.00 | % | Holding company | Joint Ventures | |||||||||||||||
| UCI Mediação de Seguros, Unipessoal Lda. | Portugal | 0.00 | % | 50.00 | % | 50.00 | % | 50.00 | % | Insurance mediation | Joint Ventures | |||||||||||||||
813
| Societies of which Grupo Santander owns more than 5% (c) , entities associated with Grupo Santander and jointly controlled entities | ||||||||||||||||||||||||||
| % of ownership held by Banco Santander | Percentage of voting power (b) | |||||||||||||||||||||||||
| Company | Location | Direct | Indirect | Year 2023 | Year 2022 | Activity | Type of company | |||||||||||||||||||
| UCI Servicios para Profesionales Inmobiliarios, S.A. Unipersonal | Spain | 0.00 | % | 50.00 | % | 50.00 | % | 50.00 | % | Real Estate services | Joint Ventures | |||||||||||||||
| Unicre-Instituição Financeira de Crédito, S.A. | Portugal | 0.00 | % | 21.83 | % | 21.86 | % | 21.86 | % | Finance Company | — | |||||||||||||||
| Unión de Créditos Inmobiliarios, S.A. Unipersonal, EFC | Spain | 0.00 | % | 50.00 | % | 50.00 | % | 50.00 | % | Mortgage company | Joint Ventures | |||||||||||||||
| VCFS Germany GmbH | Germany | 0.00 | % | 50.00 | % | 50.00 | % | 50.00 | % | Marketing | Joint Ventures | |||||||||||||||
| Venda de Veículos Fundo de Investimento em Direitos Creditórios | Brazil | 0.00 | % | 35.87 | % | 39.77 | % | — | Securitization | Joint Ventures | ||||||||||||||||
| Volvo Car Financial Services UK Limited | United Kingdom | 0.00 | % | 50.01 | % | 50.01 | % | 50.01 | % | Leasing | Joint Ventures | |||||||||||||||
| Webmotors S.A. | Brazil | 0.00 | % | 27.06 | % | 30.00 | % | 70.00 | % | Services | Associated | |||||||||||||||
| Zurich Santander Brasil Seguros e Previdência S.A. | Brazil | 0.00 | % | 48.79 | % | 48.79 | % | 48.79 | % | Insurance | Associated | |||||||||||||||
| Zurich Santander Holding (Spain), S.L. Unipersonal | Spain | 0.00 | % | 49.00 | % | 49.00 | % | 49.00 | % | Holding company | Associated | |||||||||||||||
| Zurich Santander Holding Dos (Spain), S.L. Unipersonal | Spain | 0.00 | % | 49.00 | % | 49.00 | % | 49.00 | % | Holding company | Associated | |||||||||||||||
| Zurich Santander Insurance América, S.L. | Spain | 0.00 | % | 49.00 | % | 49.00 | % | 49.00 | % | Holding company | Associated | |||||||||||||||
| Zurich Santander Seguros Argentina S.A. | Argentina | 0.00 | % | 49.00 | % | 49.00 | % | 49.00 | % | Insurance | Associated | |||||||||||||||
| Zurich Santander Seguros de Vida Chile S.A. | Chile | 0.00 | % | 49.00 | % | 49.00 | % | 49.00 | % | Insurance | Associated | |||||||||||||||
| Zurich Santander Seguros Generales Chile S.A. | Chile | 0.00 | % | 49.00 | % | 49.00 | % | 49.00 | % | Insurance | Associated | |||||||||||||||
| Zurich Santander Seguros México, S.A. | Mexico | 0.00 | % | 49.00 | % | 49.00 | % | 49.00 | % | Insurance | Associated | |||||||||||||||
| Zurich Santander Seguros Uruguay S.A. | Uruguay | 0.00 | % | 49.00 | % | 49.00 | % | 49.00 | % | Insurance | Associated | |||||||||||||||
a.Company in liquidation as at 31 December 2023.
b.Pursuant to Article 3 of Royal Decree 1159/ 2010, of 17 September, approving the rules for the preparation of consolidated annual accounts, in order to determine the voting rights, voting rights held directly by the parent company have been added to those held by companies controlled by the parent company or by other persons acting in their own name but on behalf of a group company. For these purposes, the number of votes corresponding to the parent company, in relation to the companies indirectly dependent on it, is that corresponding to the dependent company that directly participates in the share capital of the latter.
c.Excluding the Group companies listed in Appendix I, as well as those which are of negligible interest with respect to the true and fair view that the consolidated financial statements must give (in accordance with articles 48 of the Commercial Code and 260 of the Spanish Companies Act).
d.Companies over which joint control is maintained.
e.Investment managed discretionally by a manager outside the Santander Group, the voting rights not being, in this case, decisive in determining control of the entity.
f.Recently created company, without financial information available.
814
Appendix III
| Issuing subsidiaries of shares and preference shares | ||||||||||||||
| % of ownership held by Banco Santander | ||||||||||||||
| Company | Location | Direct | Indirect | Activity | ||||||||||
| Emisora Santander España, S.A. Unipersonal | Spain | 100.00 | % | 0.00 | % | Finance company | ||||||||
| Santander Global Issuances B.V. (a) | Netherlands | 100.00 | % | 0.00 | % | Finance company | ||||||||
| Santander UK (Structured Solutions) Limited | United Kingdom | 0.00 | % | 100.00 | % | Finance company | ||||||||
| Sovereign Real Estate Investment Trust | United States | 0.00 | % | 100.00 | % | Finance company | ||||||||
a.Company with tax residence in Spain.
815
Appendix IV
Notifications of acquisitions and disposals of investments in 2023
(Art. 155 of the Corporate Enterprises Act and Art. 105 of the Securities Market Law).
Details of the notifications of acquisitions and disposals of participations for 2023 in accordance with Article 105 of the Securities Market Law may be found below:
On 29 June 2023, Banco Santander, S.A. disclosed to the CNMV the increase of its stake in REPSOL, S.A. above the 3% threshold, keeping a stake of 3.213%, as of 23 June 2023.
On 31 July 2023, Banco Santander, S.A. disclosed to the CNMV the decrease of its stake in REPSOL, S.A. below the 3% threshold, keeping a stake of 2.512%, as of 26 July 2023.
In relation to the information required by art.155 of the Corporate Enterprises Act, on the shareholdings in which Grupo Santander owns more than 10% of the capital of another company, and the successive acquisitions of more than 5% of the share capital, see appendices I, II and III.
816
Appendix V
Other information on the Group’s banks
Following is certain information on the share capital of the Group’s main banks based on their total assets.
1. Santander UK plc
a)Number of financial equity instruments held by the Group.
At 31 December 2023, the Company was a subsidiary of Banco Santander, S.A. and Santusa Holding, S.L.
On 12 November 2004 Banco Santander, S.A. acquired the then entire issued ordinary share capital of 1,485,893,636 Ordinary shares of 10p. each. On 12 October 2008 a further 10 billion Ordinary shares of 10p. each were issued to Banco Santander, S.A. and an additional 12,631,375,230 Ordinary shares of 10p. each were issued to Banco Santander, S.A. on 9 January on 2009. On 3 August 2010, 6,934,500,000 Ordinary shares of 10p. each were issued to Santusa Holding, S.L.. With effect from 10 January 2014, Santander UK Group Holdings Limited, a subsidiary of Banco Santander, S.A. and Santusa Holding, S.L., became the beneficial owner of 31,051,768,866 Ordinary shares of 10p. each, being the entire issued ordinary share capital of the Company, by virtue of a share exchange agreement between Santander UK Group Holdings Limited, Banco Santander, S.A. and Santusa Holding, S.L.. Santander UK Group Holdings Limited became the legal owner of the entire issued Ordinary share capital of the Company on 1 April 2014 and on 25 March 2015 became a public limited company and changed its name from Santander UK Group Holdings Limited to Santander UK Group Holdings plc. In addition to this, there are 325,000,000 Non-Cumulative Non-Redeemable 10.375% and 8.625% Sterling Preference Shares of GBP 1.00 each. In addition to this there were 13,780 Series A Fixed (6.222%)/Floating Rate Non-Cumulative Callable Preference Shares of GBP 1.00 each which were redeemed and cancelled in their entirety on 24 May 2019. The legal and beneficial title to the entire issued Preference share capital is held by third parties and is not held by Banco Santander, S.A.
b)Capital increases in progress
At 31 December 2023, there were no approved capital increases.
c)Share capital authorised by the shareholders at the general meeting
The shareholders resolved at the Annual General Meeting held on 6 April 2023, to authorise unconditionally, the company to carry out the following repurchases of the share capital:
(1) To buy back its own 8.625% Sterling Preference shares on the following terms:
(a)The Company may buy back up to 125,000,000 8.625% Sterling Preference shares;
(b)The lowest price which the Company can pay for 8.625% Sterling Preference shares is 75% of the average of the market values of the preference shares for five business days before the purchase is made; and
(c)The highest price (not including expenses) which the Company can pay for each 8.625% Sterling Preference share is 125% of the average of the market values of the preference shares for five business days before the purchase is made.
This authority shall begin on the date of the passing of this resolution and end on the conclusion of the next Annual General Meeting of the Company. The Company may agree, before this authorisation ends, to buy back its own 8.625% preference shares even though the purchase may be completed after this authorisation ends.
(2) To buy back its own 10.375% Sterling Preference shares on the following terms:
(a)The Company may buy up to 200,000,000 10.375% Sterling Preference shares;
(b)The lowest price which the Company can pay for 10.375% Sterling Preference shares is 75% of the average of the market values of the preference shares for five business days before the purchase is made; and
(c)The highest price (not including expenses) which the Company can pay for each 10.375% Sterling Preference share is 125% of the average of the market values of the preference shares for five business days before the purchase is made.
This authority shall begin on the date of the passing of this resolution and end on the conclusion of the next Annual General Meeting of the Company. The Company may agree, before this authorisation ends, to buy back its own 10.375% preference shares even though the purchase may be completed after this authorisation ends.
d) Rights on founder’s shares, “rights” bonds, convertible debentures and similar securities or rights
Not applicable.
e) Specific circumstances that restrict the availability of reserves
Not applicable.
f) Non-Group entities which hold, directly or through subsidiaries, 10% or more of equity
Not applicable.
g) Quoted equity instruments
The preference share capital of Santander UK plc is traded on the London Stock Exchange under the following details:
•10.375% Sterling Preference - ISIN: GB0000064393
•8.625% Sterling Preference - ISIN: GB0000044221
2. Santander Financial Services plc
a)Number of financial equity instruments held by the Group
The Group holds ordinary shares amounting to GBP 249,998,000 through Santander UK Group Holdings plc (249,998,000 ordinary shares with a par value of GBP 1 each).
817
The Group also holds 1,000 tracker shares (shares without voting rights but with preferential dividend rights) amounting to GBP 1,000 and 1,000 B tracker shares amounting to GBP 1,000 through Santander UK Group Holdings plc, both with a par value of GBP 1 each.
Additionally, the company issued GBP 50 million additional tier 1 (AT ) capital securities to Santander UK Group Holdings plc on 19 December 2022.
b)Capital increases in progress
No approved capital increases are in progress.
c)Capital authorised by the shareholders at the general meeting
Not applicable.
d)Rights on founder’s shares, “rights” bonds, convertible debentures and similar securities or rights
Not applicable.
e)Specific circumstances that restrict the availability of reserves
Not applicable.
f)Non-Group entities which hold, directly or through subsidiaries, 10% or more of equity
Not applicable.
g)Quoted equity instruments
Not applicable.
3. Banco Santander (Brasil) S.A.
a) Number of financial equity instruments held by the Group
The Group holds 3,440,170,512 ordinary shares and 3,273,507,089 preference shares through Banco Santander, S.A. and its subsidiaries Sterrebeeck B.V., Grupo Empresarial Santander, S.L., Banco Santander, S.A..
The shares composing the share capital of Banco Santander (Brasil) S.A. have no par value and there are no pending payments. At 2023 year-end, the bank’s treasury shares consisted of 27,192,697 ordinary shares and 27,192,697 preferred shares, with a total of 54,385,394 shares.
In accordance with current bylaws (Article 5.7), the preference shares do not confer voting rights on their holders, except under the following circumstances:
a)In the event of transformation, merger, consolidation or spin-off of the company.
b)In the event of approval of agreements between the company and the shareholders, either directly, through third parties or other companies in which the shareholders hold a stake, provided that, due to legal or bylaw provisions, they are submitted to a general meeting.
c)In the event of an assessment of the assets used to increase the company’s share capital.
The General Assembly may, at any moment decide to convert the preference shares into ordinary shares, establishing a reason for the conversion.
However, the preference shares do have the following advantages (Article 5.6):
a)Their dividends are 10% higher than those distributed to ordinary shares.
b)Priority in the dividends distribution.
c)Participation, on the same terms as ordinary shares, in capital increases resulting from the reserves and profits capitalization and in the distribution of bonus shares arising from the capitalization of retained earnings, reserves or any other funds.
d)Priority in the reimbursement of capital in the event company’s dissolution.
e)In the event of a public offering due to a change in control of the company, the holders of preferred shares are guaranteed the right to sell the shares at the same price paid for the block of shares transferred as part of the change of control, i.e. they are treated the same as shareholders with voting rights.
b) Capital increases in progress
No approved capital increases are in progress.
c) Capital authorised by the shareholders at the general meeting
The company is authorised to increase share capital, subject to approval by the Board of Directors, up to a limit of 9,090,909,090 ordinary shares or preferred shares, and without need to maintain any ratio between any of the different classes of shares, provided they remain within the limits of the maximum number of preferred shares provided in Law.
As of 31 December 2023, the share capital consists of 7,498,531,051 shares (3,818,695,031 ordinary shares and 3,679,836,020 preferred shares).
d) Rights on founder’s shares, “rights” bonds, convertible debentures and similar securities or rights
At the general meeting held on 21 December 2016 the shareholders approved the rules relating to the deferred remuneration plans for the directors, management and other employees of the company and of companies under its control. Shares delivery is linked to achievement of certain targets.
e) Specific circumstances that restrict reserves availability
The only restriction on the availability of Banco Santander (Brasil) S.A.’s reserves is connected to the requirement for the legal reserve formation (restricted reserves), which can only be used to offset losses or to increase capital.
The legal reserve requirement is set-forth in Article 193 of the Brazilian Corporations Law, which establishes that before allocating profits to any other purpose, 5% of profits must be transferred to the legal reserve, which must not exceed 20% of the company’s share capital.
818
f) Non-Group entities which hold, directly or through subsidiaries, 10% or more of equity
Not applicable.
g) Listed capital instruments
All the shares are listed on the São Paulo Stock Exchange ( B3 - Brasil, Bolsa, Balcão) and the shares deposit certificates (American Depositary Receipts - ADR) are listed on the New York Stock Exchange (NYSE).
4. Santander Bank, National Association
a) Number of financial equity instruments held by the Group
At 31 December 2023, the Group held 530,391,043 ordinary shares that carry the same voting and dividend acquisition rights over Santander Holdings USA, Inc. (SHUSA). This holding company and Independence Community Bank Corp. (ICBC) hold 1,237 ordinary shares with a par value of USD 1 each, which carry the same voting rights. These shares constitute all the share capital of Santander Bank, National Association (SBNA). SHUSA holds an 80.84% ownership interest in SBNA, and the remaining 19.16% belongs to ICBC. ICBC is wholly owned by SHUSA. There is no shareholders’ meeting for the ordinary shares of SBNA.
b) Capital increases in progress
At 31 December 2023 there were no approved capital increases.
c) Capital authorised by the shareholders at the general meeting
Not applicable.
d) Rights on founder’s shares, “rights” bonds, convertible debentures and similar securities or rights
Not applicable.
e) Specific circumstances that restrict the availability of reserves
Not applicable.
f) Non-Group entities which hold, directly or through subsidiaries, 10% or more of equity
Not applicable.
g) Quoted equity instruments
Not applicable.
5. Banco Santander México, S.A., Institución de Banca Múltiple, Grupo Financiero Santander México
a) Number of financial instruments of capital held by the group.
Grupo Financiero Santander México, S.A. de C.V. ('Grupo Financiero') and Gesban México Servicios Administrativos Globales, S.A. de C.V. (México), hold 5,087,801,602 shares which represent the 74.97% of the capital stock of Banco Santander México and Banco Santander, S.A. holds 1,691,806,903 shares which represent the 24.92% of such capital stock.
On November 30, 2022, an Extraordinary Shareholders' Meeting of Banco Santander México, S.A. was held at which it was approved (a) to cancel the registration of all of the shares representing the capital stock of the Company in the National Securities Registry (RNV) maintained by the National Banking and Securities Commission and to delist them from the Mexican Stock Exchange (Bolsa Mexicana de Valores, S.A.B. de C.V.), and (b) delist the American Depositary Shares (each representing five series "B" shares of the Company) from the New York Stock Exchange and delist the Company's series "B" shares and such American Depositary Shares from registration with the US Securities and Exchange Commission; and (c) to conduct certain tender offers for the series "B" shares representing the capital stock of the Company and the American Depositary Shares.
Tender offers for the acquisition of shares were carried out from February 7 to April 10, 2023, where Banco Santander, S.A. acquired a total of 244,306,313 Series “B” shares.
Once the offers were finalized and in accordance with the Mexican regulation, on May 8, 2023, a trust was established for a period of 6 months, to carry out the acquisition of shares of Banco Santander México, including those represented by American Depositary Shares listed on the New York Stock Exchange (which were not owned at that time by Banco Santander, S.A. or its subsidiaries) owned by shareholders who did not participate in the tender offers made by Banco Santander, S.A.
On May 4 and 12, 2023, respectively, the Bank was delisted from the New York Stock Exchange, LLC and the RNV .
On November 8, 2023, the trust ended; as a result, Banco Santander, S.A. repurchased 9,243,880 Series “B” shares from shareholders who did not participate in the tender offers, leaving a total of 1,714,399 shares of the Series “B” in the hands of minority shareholders.
b) Ongoing capital stock increases.
To this date there are not ongoing capital stock increases.
819
c) Authorized Capital by the Shareholders Meeting.
On April 20, 2021, the Company held an Extraordinary General Shareholders' Meeting, at which, among other items, it was approved an increase in the authorized capital stock of the Company to 6,825,447,481.00 Mexican pesos represented by 1,805,300,000 unsubscribed and unpaid shares, which are held in treasury so that the Company may issue Capital Instruments representing non-preferred subordinated debt, This increase was approved by the National Banking and Securities Commission (CNBV) through official communication number 312-3/10039041/2021 dated November 8, 2021.
As a result of said agreement, the Company requested the update of the registration of the shares representing the capital stock of Banco Santander Mexico, S.A. in the RNV, which was authorized by the CNBV through official communication number 153/2800/2022 dated May 20, 2022.In the aforementioned official communication, it was requested that the Company adjusted the amounts in pesos corresponding to the capital stock to include cents, and therefore, through an Extraordinary General Stockholders' Meeting held on July 19, 2022, the corresponding adjustment was made, which was authorized by the CNBV through official communication number 312-3/93573/2023 dated January 3, 2023.
The capital stock of the Bank is 32,485,600,109.44 Mexican pesos represented by a total of 8,592,294,357 shares with a nominal value of 3.780782962 Mexican pesos each one; divided in 4,385,824,012 stocks “F” Series and 4,206,470,345 shares “B” Series. The capital stock is constituted as follows:
• Paid-in and subscribed capital of the Bank is 25,660,152,628.14 Mexican pesos represented by a total of 6,786,994,357 shares with a nominal value of 3.780782962 Mexican pesos each one; divided in 3,464,309,145 shares “F” Series and 3,322,685,212 shares Series.
•The authorized capital stock for the conversion of obligations into shares of the Company is 6,825,447,481.30 Mexican pesos, represented by a total of 1,805 ,300,000 shares with a nominal value of 3,780782962 Mexican pesos each; divided into 921,514,867 Series “F” shares and 883,785,133 Series “B shares ". which are kept in the treasury of the Bank.
d) Rights incorporated into parts of founder, bonds or debt, convertible obligations and securities or similar rights.
(i)The Board of Directors on its meeting held on October 22, 2015, was updated regarding the situation of the debt issuance of Banco Santander Mexico, S.A. , which had been previously ratified in the meeting held on October 17, 2013, in order to issue debt for the amount of 6,500 million dollars in local or international markets, for a maximum period of 15 years, senior or subordinated debt including debt instruments qualifying for purposes of capital in accordance with the legislation in force, which can be implemented individually or through several issuance programs.
The approved debt issuance of Banco Santander México, S.A., Institución de Banca Múltiple, Grupo Financiero Santander México is currently composed as follows:
820
| Instrument | Type | Term | Amount | Available | ||||||||||
| Issuance Program of unsecured bonds and unsecured certificates of deposit | Revolving | 4-Mar-2026 | 55,000 million Mexican pesos, or its equivalent in UDIs, dollars or any other foreign currency | $10,060 million Mexican pesos | ||||||||||
| Private banking structured bonds Act with subsequent placements (JBSANPRIV 21-1) | Not RevolvingA | 28-Ene-2026 | 20,000 million Mexican pesos | $0 million Mexican pesos | ||||||||||
| Private banking structured bonds Act with subsequent placements (JBSANPRIV 22-1) | Not RevolvingA | 9-Mar-2027 | 20,000 million Mexican pesos | $0 million Mexican pesos | ||||||||||
| Private banking structured bonds Act with subsequent placements (JBSANPRIV 22-2) | Not RevolvingA | 28-Oct-2027 | 20,000 million Mexican pesos | $0 million Mexican pesos | ||||||||||
| Private structured bonds Act with subsequent placements (JBSANPRIV 23-1) | Not Revolving | 47010 | 20,000 million Mexican pesos | $7,825 million Mexican pesos | ||||||||||
| Private structured bonds Act with subsequent placements (JBSANPRIV 23-2) | Not Revolving | 47095 | 20,000 million Mexican pesos | $20,000 million Mexican pesos | ||||||||||
| Public banking structured bonds Act with subsequent placements (JBSANPRIV 22-1) | Not Revolving | 16-Dic-2027 | 10,000 million Mexican pesos | $10,000 million Mexican pesos | ||||||||||
| Capital Notes (Tier 2 Capital) | Not Revolving | 1-Oct-2028 | 1,300 million American dollars | N/A | ||||||||||
| Senior notes 144.ª/RegS | Not Revolving | 17-Abr-2025 | 1,750 million American dollars | N/A | ||||||||||
| Subordinated Notes, perpetual and convertible (Tier 1) | Not Revolving | perpetual | 700 million American dollars | N/A | ||||||||||
A.The issuance of the structured private banking bonds isn’t revolving. Once placed the amount laid down in the corresponding brochure a new certificate will be issued on the authorized amount.
(ii)The Board of Directors on its meeting held on January 27, 2011 approved the general conditions for the senior debt issue among international markets up to 1,500 million American dollars. On October 18, 2012 such senior debt issuance under 144ª Rules was approved on the amount of up to 1,000 million American dollars, for a term of 5 to 10 years. The issuance was approved with the purpose of obtaining resources to finance the increase in business assets and the liquidity of the Bank.
(iii) On September 20, 2018, Banco Santander México, issued and placed equity instruments, subordinated, preferential, and not convertible into shares, governed by foreign law, representative of the complementary part of the net capital of Banco Santander Mexico (Tier 2 subordinated preferred capital notes), for the amount of 1,300 million American dollars (the “Instruments”), whose resources were used mainly for the acquisition of the 94.07% of the Subordinated Notes 2013.
The amount issued of 1,300 million American dollars covers in full the sum of the repurchase of the Subordinated Notes 2013, for 1,222,907,000 American dollars.
Regarding the acquisition of the Subordinated Notes 2013: (a) the acquired total amount was 1,222,907,000 American dollars (nominal value), at a price of 1,010.50 American dollars and (b) the amount acquired by Banco Santander, S.A. (Spain), was a nominal 1,078,094,000 American dollars.
In connection with the issuance of the Instruments, the total amount distributed with Banco Santander, S.A. (Spain), was 75% of such issuance; that is, the placed amount was 975 million.
Therefore, the Bank’s General Extraordinary Shareholder´s Meeting held on September 10, 2018, among other subjects, approved to ratify the issuance limit for up to 6,500 million and a term of 15 years, senior or subordinate, in local and/or international markets, instrumented individually or through issuance programs, which was previously authorized by the Board of Directors on its meeting held on April 26, 2018. Likewise, such meeting approved the issuance of Tier 2 preferred subordinated debt for an amount of 1,300 million American dollars.
On January 30, 2019, Banco Santander México paid off the total remaining due amount of the Subordinated Notes 2013.
On April 17th., 2020, Banco Santander Mexico issued an international Senior Note, due on five years in the global market, on the amount of 1,750 million dollars, with a rate of 5.375 per cent, whereas the demand exceeded three times the placed amount. The due date of such notes will be April 17th, 2025.
On June 15th., 2020, the Bank’s Shareholders' Meeting was held, which approved to increase the debt securities issuance in order to be settled in the amount of 10,000 million American dollars, to be used considering the following, among others: i) issuance of debt securities in local and international markets; ii) senior or subordinated debt, including in both cases preferred and not preferred securities, and debt securities classified as capital on a regulatory point of view. The Board of Directors on its meeting held on June 18th., 2020, ratified the 10,000 million American dollars limit approved by the above mentioned Shareholders Meeting.
On April 20, 2021, a General Extraordinary Shareholders' Meeting of Banco Santander México was held, where among other issues, it was approved that the Bank may issue subordinated non preferential perpetual and convertible capital
821
notes, to be placed abroad, in accordance with the Banco de Mexico authorization.
On September 15, 2021, Banco Santander Mexico issued abroad the “Perpetual Subordinated Non-Preferred Contingent Convertible Additional Tier 1 Notes”, up to an amount of 700 million American dollars. On the same date, the Bank paid the “2016 Obligations” issued by the Bank, on a fixed initial rate of 4.625% up to an amount of 700,000,000 American dollars.
e) Specific circumstances restricting the availability of reserves.
According to the Law of Financial Institutions, general dispositions applicable to financial institutions, General Corporations law and the bylaws, the Bank has to constitute or increase its capital reserves to ensure the solvency to protect the payments system and the public savings.
The Bank increases its legal reserve annually accordingly to the results obtained in the fiscal year (benefits).
The Bank must constitute the different reserves established in the legal provisions applicable to financial institutions, which are determined accordingly to the qualification granted to credits and they are released when the credit rating improves, or when it is settled.
f) Entities outside the Group which own, directly or through subsidiaries, a stake equal to or greater than 10% of the equity.
Not applicable.
g) Equity instruments admitted to trading.
Not applicable.
6. Banco Santander Totta, S.A
a) Number of equity instruments held by the Group
The Group holds 1,391,248,074 ordinary shares through its subsidiaries: Santander Totta, SGPS, S.A. with 1,376,219,267 shares, Taxagest Sociedade Gestora de Participações Sociais, S.A. with 14,593,315 shares, and Banco Santander Totta, S.A. with 435,492 treasury shares, all of which have a par value of EUR 1 each and identical voting and dividend rights and are subscribed and paid in full.
b) Capital increases in progress
At 31 December 2023, there were no equity increases in progress.
c) Capital authorised by the shareholders at the general meeting
Not applicable.
d) Rights on founder’s shares, “rights” bonds, convertible debentures and similar securities or rights
Not applicable.
e) Specific circumstances that restrict the availability of reserves
Under Article 296 of the Portuguese Companies’ Code, the legal and merger reserves can only be used to offset losses or to increase capital.
Non-current asset revaluation reserves are regulated by Decree- Law 31/98, under which losses can be offset or capital increased by the amounts for which the underlying asset is depreciated, amortised or sold.
f) Non-Group entities which hold, directly or through subsidiaries, 10% or more of equity
Not applicable.
g) Equity instruments
Not applicable.
7. Santander Consumer Bank AG
a) Number of financial equity instruments held by the Group
At 31 December 2023, through Santander Consumer Holding GmbH, the Group held 30,002 ordinary shares with a par value of EUR 1,000 each, all of which carry the same voting rights.
b) Capital increases in progress
Not applicable.
c) Capital authorised by the shareholders at the general meeting
Not applicable.
d) Rights on founder’s shares, “rights” bonds, convertible debentures and similar securities or rights
Not applicable.
e) Specific circumstances that restrict the availability of reserves
Not applicable.
f) Non-Group entities which hold, directly or through subsidiaries, 10% or more of equity
Not applicable.
g) Quoted equity instruments
Not applicable.
8. Banco Santander - Chile
a) Number of equity instruments held by the Group
The Group holds a 67.18% ownership interest in its subsidiary in Chile corresponding to 126,593,017,845 ordinary shares of Banco Santander - Chile through its subsidiaries: Santander Chile Holding S.A. with 66,822,519,695 ordinary shares, Teatinos Siglo XXI Inversiones S.A., with 59,770,481,573 ordinary shares and Santander Inversiones S.A. with 16,577 fully subscribed and paid ordinary shares that carry the same voting and dividend rights.
b) Capital increases in progress
At 31 December 2023, there were no approved capital increases.
c) Capital authorised by the shareholders at the general meeting
Share capital at 31 December 2023 amounted to CLP 891,302,881,691.
822
d) Rights on founder’s shares, “rights” bonds, convertible debentures and similar securities or rights
Not applicable.
e) Specific circumstances that restrict the availability of reserves
Remittances to foreign investors in relation to investments made under the Statute of Foreign Investment (Decree-Law 600/1974) and the amendments thereto require the prior authorisation of the foreign investment promotion agency.
f) Non-Group entities which hold, directly or through subsidiaries, 10% or more of equity
Not applicable.
g) Quoted equity instruments
All the shares are listed on the Chilean stock exchanges and, through American Depositary Receipts (ADRs), on the New York Stock Exchange (NYSE).
9. Santander Bank Polska S.A.
a) Number of financial equity instruments held by the Group
At 31 December, 2023, Banco Santander, S.A. held 68,880,774 ordinary shares with a par value of PLN 10 each, all of which carry the same voting rights.
b) Capital increases in progress
At 31 December, 2023, there were no equity increases in progress.
c) Capital authorised by the shareholders at the general meeting
There was no share capital increase in 2023.
d) Rights on founder’s shares, “rights” bonds, convertible debentures and similar securities or rights
Not applicable.
e) Specific circumstances that restrict the availability of reserves
Not applicable.
f) Non-Group entities, which hold, directly or through subsidiaries, 10% or more of equity
Not applicable.
g) Quoted equity instruments
All the shares of Santander Bank Polska S.A. are listed on the Warsaw Stock Exchange.
823
Appendix VI
Annual banking report
Grupo Santander’s total tax contribution (taxes incurred directly and by third parties, generated in the course of business) is around EUR 19.9 billion, including more than EUR 9.6 billion in taxes incurred directly (corporate income tax, non-recoverable value added tax (VAT) and other indirect taxes, employer Social Security contributions, payroll taxes and other taxes and levies).
This report complies with Article 89 of Directive 2013/36/EU of the European Parliament and of the Council of 26 June 2013 on access to the activity of credit institutions and the prudential supervision of credit institutions and investment firms, and its transposition into Spanish law pursuant to Article 87 of Act 10/2014 of 26 June on the regulation, supervision and capital adequacy of credit institutions.
The criteria used to prepare this report were:
a) Name(s), activities and location
Appendices I to III to the consolidated financial statements contain details of the companies operating in each jurisdiction, including their name(s), location and activities.
Santander main activity in the jurisdictions where operate is commercial banking. The Group primarily operates in ten markets through subsidiaries that are autonomous in capital and liquidity. This has clear strategic and regulatory advantages, since it limits the risk of contagion between units, imposes a double layer of global and local oversight, and facilitates crisis management and resolution.
b) Turnover and profit or loss before tax
Turnover in this report is Total income, and profit or loss before tax, Operating profit/(loss) before tax, both as defined and presented in the consolidated income statement that forms part of the consolidated financial statements.
c) Number of full-time equivalent employees
The data on full-time equivalent employees stem from the average headcount of each jurisdiction.
d) Tax on profit or loss
In the absence of specific criteria, we have included the amount effectively paid (EUR 5,214 million in 2023, with an effective tax rate of 31.7%) in respect of taxes whose effect is recognized under Income tax in the consolidated income statement.
Taxes effectively paid by the companies in each jurisdiction include:
•Supplementary payments relating to income tax returns, usually for prior years.
•Advances, prepayments, withholdings made or borne in respect of tax on profit or loss for the year. We included taxes borne abroad in the jurisdiction of the company that bore them.
•Refunds received with respect to prior years’ returns.
•Where appropriate, the amount payable from assessments and litigation relating to these taxes.
The foregoing form part of the cash flow statement and differ from the corporate income tax expense recognized in the consolidated income statement (EUR 4,276 million in 2023, representing an effective rate of 26.0%, see note 27). This is because each country’s tax regulations establish:
•when taxes must be paid. There is often a mismatch between the payment dates and the generation of the income bearing the tax.
•their own calculation criteria to define temporary or permanent restrictions on expense deduction, exemptions and relief or deferrals of certain income, generating the differences between the accounting profit (or loss) and taxable profit (or tax loss) which is ultimately taxed; tax loss carry forwards from prior years, tax credits and/or relief, etc., must also be added. In certain cases, special regimes such as the tax consolidation of companies in the same jurisdiction are established.
e) Public subsidies
In the context of the legally-required disclosures, this was interpreted as any aid or subsidy in line with the European Commission’s Guidance on the notion of State aid. Grupo Santander did not receive significant public subsidies in 2023.
824
The breakdown of information is as follows:
| 2023 | ||||||||||||||
Jurisdiction | Turnover (EUR million) | Full-time equivalent employees | Gross profit or loss before tax (EUR million) | Tax on profit or loss (EUR million) | ||||||||||
| Germany | 1,524 | 5,422 | 375 | 173 | ||||||||||
| Argentina | 1,574 | 8,152 | 552 | 54 | ||||||||||
| Australia | 6 | 61 | — | — | ||||||||||
| Austria | 218 | 333 | 104 | 16 | ||||||||||
| Bahamas | 45 | 26 | 37 | — | ||||||||||
| Belgium | 98 | 217 | 58 | 5 | ||||||||||
| Brazil1 | 12,424 | 57,438 | 2,033 | 1,396 | ||||||||||
| Canada | 73 | 275 | 9 | 1 | ||||||||||
| Chile | 2,244 | 9,573 | 938 | 167 | ||||||||||
| China | 25 | 104 | (8) | — | ||||||||||
| Colombia | 87 | 1,092 | 3 | 20 | ||||||||||
| United Arab Emirates | 4 | 79 | (4) | — | ||||||||||
| Spain2 | 9,994 | 35,142 | 2,013 | 323 | ||||||||||
| United States | 7,072 | 13,250 | 752 | 446 | ||||||||||
| Denmark | 216 | 224 | 112 | 34 | ||||||||||
| Finland | 101 | 157 | 51 | 8 | ||||||||||
| France | 916 | 987 | 567 | 43 | ||||||||||
| Greece | 9 | 54 | — | — | ||||||||||
| Hong Kong | 96 | 225 | 15 | 9 | ||||||||||
| India | — | 97 | — | — | ||||||||||
| Ireland | 20 | 1 | 3 | 1 | ||||||||||
| Isle of Man | 49 | 88 | 31 | 3 | ||||||||||
| Italy | 578 | 1,294 | 233 | 68 | ||||||||||
| Jersey | 20 | 72 | 10 | 2 | ||||||||||
| Luxembourg | 532 | 27 | 524 | 193 | ||||||||||
| Mexico | 5,872 | 30,444 | 2,134 | 840 | ||||||||||
| Norway | 243 | 516 | 118 | 5 | ||||||||||
| Netherlands | 155 | 362 | 96 | 114 | ||||||||||
| Peru | 196 | 867 | 74 | 28 | ||||||||||
| Poland | 3,600 | 12,601 | 1,513 | 150 | ||||||||||
| Portugal | 2,058 | 5,307 | 1,348 | 302 | ||||||||||
| United Kingdom | 6,436 | 21,118 | 2,444 | 728 | ||||||||||
| Romania | 5 | 30 | 3 | — | ||||||||||
| Singapore | 24 | 36 | 9 | 1 | ||||||||||
| Sweden | 153 | 275 | 44 | 19 | ||||||||||
| Switzerland | 165 | 359 | 29 | 8 | ||||||||||
| Uruguay | 591 | 1,528 | 239 | 57 | ||||||||||
| Consolidated Group Total | 57,423 | 207,833 | 16,459 | 5,214 | ||||||||||
1.Including the information relating to a branch in the Cayman Islands, the profits of which are taxed in full in Brazil. The contribution of this branch profit before tax from continuing operations is EUR 492 million.
2.Includes the Corporate Centre.
At 31 December 2023, the Group’s return on assets (ROA) was 0.69%.
825
General information
Corporate information
Banco Santander, S.A. is a Spanish bank, incorporated as sociedad anónima in Spain and is the parent company of Grupo Santander. Banco Santander, S.A. operates under the commercial name Santander.
The Bank’s Legal Entity Identifier (LEI) is 5493006QMFDDMYWIAM13 and its Spanish tax identification number is A-39000013. The Bank is registered with the Companies Registry of Cantabria, and its Bylaws have been adapted to the Spanish Companies Act by means of the notarial deed instrument executed in Santander on 29 July 2011 before the notary Juan de Dios Valenzuela García, under number 1209 of his book and filed with the Companies Registry of Cantabria in volume 1006 of the archive, folio 28, page number S-1960, entry 2038.
The Bank is also registered in the Official registry of entities of Bank of Spain with code number 0049.
The Bank’s registered office is at:
Paseo de Pereda, 9-12
39004 Santander
Spain
39004 Santander
Spain
The Bank’s principal executive offices are located at:
Santander Group City
Avda. de Cantabria s/n
28660 Boadilla del Monte
Madrid
Spain
Telephone: (+34) 91 259 65 20
Avda. de Cantabria s/n
28660 Boadilla del Monte
Madrid
Spain
Telephone: (+34) 91 259 65 20
Corporate history
The Bank was established in the city of Santander by public deed before the notary José Dou Martínez on 3 March 1856, which was later ratified and amended in part by a second public deed dated 21 March 1857 executed before the notary José María Olarán. The Bank commenced operations upon incorporation on 20 August 1857 and, according to article 4 of the Bylaws, its duration shall be for an indefinite period. It was transformed into a credit corporation (sociedad anónima de crédito) by public deed, executed before notary Ignacio Pérez, on 14 January 1875 and registered in the Companies Registry Book of the Government’s Trade Promotion Section in the province of Santander. The Bank amended its Bylaws to conform to the Spanish public companies act of 1989 by means of a public deed executed in Santander on 8 June 1992 before the notary José María de Prada Díez and recorded in his notarial record book under number 1316.
On 15 January 1999, the boards of directors of Santander and Banco Central Hispanoamericano, S.A. agreed to merge Banco Central Hispanoamericano, S.A. into Santander, and to change Banco Santander’s name to Banco Santander Central Hispano, S.A. The shareholders of Santander and Banco Central Hispanoamericano, S.A. approved the merger on 6 March 1999, at their respective general meetings and the merger became effective in April 1999.
The Bank’s general shareholders’ meeting held on 23 June 2007 approved the proposal to change back the name of the Bank to Banco Santander, S.A.
As indicated above, the Bank brought its Bylaws into line with the Spanish Companies Act by means of a public deed executed in Santander on 29 July 2011.
The Bank’s general shareholders’ meeting held on 22 March 2013 approved the merger by absorption of Banco Español de Crédito, S.A.
On 7 June 2017, Santander acquired the entire share capital of Banco Popular Español, S.A. in an auction in connection with a resolution plan adopted by the European Single Resolution Board (the European banking resolution authority) and executed by the FROB (the Spanish banking resolution authority) following a determination by the European Central Bank that Banco Popular was failing or likely to fail, in accordance with Regulation (EU) 806/2014 establishing a framework for the recovery and resolution of credit institutions and investment firms. On 24 April 2018, the Bank announced that the boards of directors of Banco Santander, S.A. and Banco Popular Español, S.A.U. had agreed to an absorption of Banco Popular by Banco Santander. The legal absorption was effective on 28 September 2018.
826
Shareholder and investor relations
Santander Group City
Pereda, 2ª planta
Avda. de Cantabria, s/n
28660 Boadilla del Monte
Madrid
Spain
Telephone: (+34) 91 276 92 90
accionistas@santander.com
Pereda, 2ª planta
Avda. de Cantabria, s/n
28660 Boadilla del Monte
Madrid
Spain
Telephone: (+34) 91 276 92 90
accionistas@santander.com
investor@gruposantander.com
Hard copies of the Bank’s annual report can be requested by shareholders free of charge at the address and phone number indicated above.
Customer service department
Apartado de Correos 35.250
28080 Madrid
santander_reclamaciones@gruposantander.es
28080 Madrid
santander_reclamaciones@gruposantander.es
Media enquiries
Santander Group City
Arrecife, 2ª planta
Avda. de Cantabria, s/n
28660 Boadilla del Monte
Madrid
Spain
Telephone: (+34) 91 289 52 11
comunicacion@gruposantander.com
Arrecife, 2ª planta
Avda. de Cantabria, s/n
28660 Boadilla del Monte
Madrid
Spain
Telephone: (+34) 91 289 52 11
comunicacion@gruposantander.com
Banking Ombudsman in Spain
(Defensor del cliente en España)
(Defensor del cliente en España)
Mr José Luis Gómez-Dégano
Calle Raimundo Fernández Villaverde, 61
Calle Raimundo Fernández Villaverde, 61
28003 Madrid
Telephone: (+34) 91 429 56 61
Telephone: (+34) 91 429 56 61
oficina@defensorcliente.es
827

santander.com
| Cross-reference to Form 20-F | Consolidated directors' report | Consolidated financial statements | Supplemental information | |||||||||||||||||
Part 2.
Supplemental information

829 | ||
| Cross-reference to Form 20-F | Consolidated directors' report | Consolidated financial statements | Supplemental information | |||||||||||||||||
Table of contents:
| 1. Presentation of financial and other information | |||||
| 2. Cautionary statement regarding forward-looking statements | |||||
3. Selected financial data | |||||
| 4. Risk factors | |||||
| 5. Information on the company | |||||
| Average balance sheets and interest rates | |||||
| Other statistical disclosure requirements | |||||
| 6. Supplement to the operating and financial review disclosure in the directors’ report | |||||
| 7. Tabular disclosure of contractual obligations | |||||
| 8. Employees | |||||
| 9. Competition | |||||
| 10. Supervision and regulation | |||||
| 11. Shareholders remuneration | |||||
| 12. The offer and listing | |||||
| 13. Additional information | |||||
| Memorandum and articles of association | |||||
| Material contracts | |||||
| Exchange controls | |||||
| Taxation | |||||
| Documents on display and other | |||||
| 14. Recent events | |||||
| 15. Controls and procedures | |||||
| 16. Corporate governance | |||||
| 17. Exhibits | |||||
| 18. Signature | |||||
830 | ||
1. Presentation of financial and other information
Accounting principles
Under Regulation (EC) No. 1606/2002 of the European Parliament and of the Council of 19 July 2002, all companies governed by the law of an EU Member State (a 'Member State') and whose securities are admitted to trading on a regulated market of any Member State must prepare their consolidated financial statements in conformity with the International Financial Reporting Standards as previously adopted by the European Union ('EU-IFRS'). The Bank of Spain Circular 4/2004 of 22 December 2004 on Public and Confidential Financial Reporting Rules and Formats ('Circular 4/2004') required Spanish credit institutions to adapt their accounting systems to the principles derived from the adoption by the European Union of International Financial Reporting Standards. This Circular was repealed on 1 January 2018 by Bank of Spain Circular 4/2017, of 27 November 2017 on Public and Confidential Financial Reporting Rules and Formats ('Circular 4/2017'). Therefore, Grupo Santander (the 'Group' or 'Santander') is required to prepare its consolidated financial statements for the years ended 31 December 2023, 31 December 2022 and 31 December 2021 in conformity with EU-IFRS and Bank of Spain’s Circular 4/2017. Differences between EU-IFRS, Bank of Spain’s Circulars and International Financial Reporting Standards as issued by the International Accounting Standards Board ('IFRS-IASB') are not material. Therefore, we assert that the financial information contained in this annual report on Form 20-F complies with IFRS-IASB.
Our auditors, PricewaterhouseCoopers Auditores, S.L., an independent registered public accounting firm, have audited our consolidated financial statements in respect of the years ended 31 December 2023, 2022 and 2021 prepared in accordance with IFRS-IASB. See the audit report issued by PricewaterhouseCoopers Auditores, S.L. in Part 1 of this annual report on Form 20-F.
We have presented our financial information according to the classification format for banks used in Spain. We have not reclassified the line items to comply with Article 9 of Regulation S-X, as permitted by the rules and regulations of the SEC. Article 9 is a regulation of the US Securities and Exchange Commission that contains presentation requirements for bank holding company financial statements.
General information
Our consolidated financial statements included in Part 1 of this annual report on Form 20-F are in Euros, which are denoted 'euro', 'euros', 'EUR' or '€' throughout this annual report. Also, throughout this annual report, when we refer to:
•'we', 'us', 'our', the 'Group', 'Grupo Santander' or 'Santander', we mean Banco Santander, S.A. and its subsidiaries, unless the context otherwise requires;
•'dollars', 'USD', 'US$' or '$', we mean United States dollars; and
•'pounds', 'GBP' or '£', we mean United Kingdom pounds.
When we refer to 'net interest income' we mean 'interest income/(charges)'.
When we refer to 'staff costs' we mean 'personnel expenses'.
When we refer to 'profit before tax' we mean 'operating profit/(loss) before tax'.
When we refer to 'average balances' for a particular period, we mean the average of the month-end balances for that period, unless otherwise noted. We do not believe that monthly averages present trends that are materially different from trends that daily averages would show. In calculating our interest income, we include any interest payments we received on non-accruing loans if they were received in the period when due.
When we refer to 'loans', we mean loans, leases, discounted bills and accounts receivable, unless otherwise noted. The loan to value 'LTV' ratios disclosed in this report refer to LTV ratios calculated as the ratio of the outstanding amount of the loan to the most recent available appraisal value of the mortgaged asset. Additionally, if a loan shows signs of impairment, we update the appraisals which are then used to estimate allowances for loan losses.
When we refer to the 'non-performing loans ratio' ('NPL ratio'), we mean credit impaired loans and advances to customers, customer guarantees and customer commitments granted divided by total risk (total loans and advances to customers, customer guarantees and customer commitments granted, including those that are credit impaired).
When we refer to 'credit impaired balances', unless otherwise noted, we mean credit impaired loans and advances to customers, customer guarantees and customer commitments granted.
When we refer to 'allowances for credit losses', unless otherwise noted, we mean allowances for inherent losses of impaired assets. Allowances reflect expected credit losses.
When we refer to 'perimeter effect', we mean growth or reduction derived from changes in the companies that we consolidate resulting from acquisitions, dispositions or other reasons.
Where a translation of foreign exchange is given for any financial data, unless otherwise noted, we use the exchange rates of the relevant period (as of the end of such period for balance sheet data and the average exchange rate of such period for income statement data) as published by the European Central Bank (ECB).
Management makes use of certain financial measures in local currency to help in the assessment of ongoing operating performance. These non-GAAP financial measures include the results of operations of our subsidiary banks located outside the eurozone, excluding the impact of foreign exchange. We analyse these banks’ performance on a local currency basis to better measure the comparability of results between periods. Because changes in foreign currency exchange rates have a non-operating impact on the results of operations, we believe that evaluating their performance on a local currency basis provides an additional and meaningful assessment of performance to both management and the company’s investors. Variances in financial metrics, excluding the exchange rate impact, are calculated by translating the components of the financial metrics to our euro presentation
831 | ||
| Cross-reference to Form 20-F | Consolidated directors' report | Consolidated financial statements | Supplemental information | |||||||||||||||||
currency using the same foreign currency exchange rate for both periods presented. For a discussion of the accounting principles used in translation of foreign currency-denominated assets and liabilities to euros, see note 2(a) to our 'Consolidated financial statements' included in Part 1 of this annual report on Form 20-F. In addition, throughout this report on Form 20-F we make use of other alternative performance measures. See more information in sections '8.
'Alternative performance measures (APMs)' in the 'Consolidated directors’ report -Economic and financial review' and 9.8 'Alternative performance measures (APMs) in the 'Consolidated directors’ report -Responsible banking' in Part 1 of this annual report on Form 20-F.
2. Cautionary statement regarding forward-looking statements
Banco Santander advises that this annual report on Form 20-F contains statements that constitute 'forward-looking statements' within the meaning of the US Private Securities Litigation Reform Act of 1995. Forward-looking statements include, but are not limited to, information regarding:
•future business development;
•shareholders' remuneration policy;
•exposure to various types of market risks;
•management strategy;
•capital expenditures;
•earnings and other targets;
•asset portfolios; and
•non-financial information.
Forward-looking statements may be identified by words such as 'expect', 'project', 'anticipate', 'should', 'intend', 'probability', 'risk', 'VaR', 'RoRAC', 'RoRWA', 'TNAV', 'target', 'goal', 'objective', 'estimate', 'future', 'commitment', 'commit', 'focus', 'pledge' and similar expressions which are found throughout this annual report on Form 20-F. We include forward-looking statements throughout this Form 20-F, including but not limited to, the 'Operating and Financial Review and Prospects' and 'Quantitative Analysis About Market Risk' sections and the emissions and other climate-related performance data, statistics, metrics and/or targets. Forward-looking statements are not guarantees of future performance and involve risks and uncertainties, and actual results may differ materially from those in the forward-looking statements.
Written and/or oral forward-looking statements may also be made in the periodic reports to the US Securities and Exchange Commission, shareholders' and investors' reports, offering circulars, prospectuses, press releases and other written materials, and in oral statements made by our directors, officers or employees to third parties, including financial analysts.
You should understand that the following important factors, in addition to those discussed in section 4. 'Risk factors', section 5.'Information on the Company', 'Consolidated directors’ report -Economic and financial review' in Part 1 of this annual report on Form 20-F, section 6.'Supplement to the operating and financial review disclosure in the directors’ report' and elsewhere in this annual report on Form 20-F, could affect our future results and could cause those results
or other outcomes to differ materially from those anticipated in any forward-looking statement:
832 | ||
Economic and Industry Conditions
•general economic or industry conditions in Spain, the UK, other European countries, the US, Brazil, other Latin American countries and the other areas where we have significant operations or investments;
•effects of wars and conflicts (including the wars in Ukraine and the Middle East) or the outbreak of public health emergencies on the global economy;
•climate-related conditions, regulations, targets and weather events;
•uncertainty over the scope of actions that may be required by us, governments and others to achieve goals relating to climate, environmental and social matters, as well as the evolving nature of underlying science and industry and governmental standards and regulations;
•exposure to various market risks, principally including interest rate risk, foreign exchange rate risk, equity price risk and risks associated with new benchmark indices;
•a worsening of the economic environment in Spain, the UK, other European countries, the US, Brazil, other Latin American countries and the other areas where we have significant operations or investments, and increase of the volatility in the capital markets;
•the effects of a decline in real estate prices, particularly in Spain and the UK;
•the effects of results of UK political developments, including the UK’s exit from the European Union;
•monetary and interest rate policies of the ECB and various central banks;
•inflation or deflation;
•the effects of non-linear market behaviour that cannot be captured by linear statistical models, such as the VaR model we use;
•changes in competition and pricing environments;
•the inability to hedge some risks economically;
•changes in demographics, consumer spending, investment or saving habits;
•changes in energy prices;
•potential losses from early repayments on our loan and investment portfolios, declines in value of collateral securing our loan portfolio, and counterparty risk; and
•changes in competition and pricing environments as a result of the progressive adoption of the internet for conducting financial services and/or other factors.
Political and Governmental Factors
•political instability in Spain, the UK, other European countries, the US, Brazil, other Latin American countries and the other areas where we have significant operations or investments;
•changes in Spanish, UK, EU, US, Latin American, or other jurisdictions’ legislation, regulations or taxes, including changes in regulatory capital and liquidity requirements, especially in view of the UK exit of the EU; and
•increased regulation in response to financial crises.
Transaction and Commercial Factors
•damage to our reputation;
•acquisitions or restructurings of businesses that may not perform in accordance with our expectations and our ability to integrate successfully our acquisitions and related challenges that result from the inherent diversion of management’s focus and resources from other strategic opportunities and operational matters; and
•the outcome of our negotiations with business partners and governments.
Operating Factors
•the adequacy of loss reserves;
•potential losses associated with an increase in the level of impairment by counterparties to other types of financial instruments;
•technical difficulties and/or failure to improve or upgrade our information technology;
•changes in our access to liquidity and funding on acceptable terms, including as a result of credit spread shifts or downgrades in our credit ratings or those of our more significant subsidiaries;
•our exposure to operational losses (e.g., failed internal or external processes, people and systems);
•changes in our ability to recruit, retain and develop appropriate senior management and skilled personnel;
•the occurrence of force majeure, such as natural disasters, epidemics and pandemics, that impact our operations or impair the asset quality of our loan portfolio;
•the impact of changes in the composition of our balance sheet on future interest income / (charges);
•potential losses associated with cyberattacks, data breaches, data losses and other security incidents; and
•our own decisions and actions including those affecting or changing our practices, operations, priorities, strategies, policies or procedures.
The forward-looking statements contained in this report on Form 20-F speak only as of the date of this report. We do not undertake to update any forward-looking statement to reflect events or circumstances after the date of this report or to reflect the occurrence of unanticipated events.
833 | ||
| Cross-reference to Form 20-F | Consolidated directors' report | Consolidated financial statements | Supplemental information | |||||||||||||||||
3. Selected financial data
Selected consolidated financial information
We have selected the following financial information from our consolidated financial statements. You should read this information in connection with, and it is qualified in its entirety by reference to, our 'Consolidated financial statements' included in Part 1 of this annual report on Form 20-F.
From 1 January 2023, we apply retrospectively IFRS 17 'Insurance Contracts and amendments to IFRS 17' which did not have material impacts on our consolidated financial statements except for a balance sheet reclassification for an amount of approximately EUR 16 billion as of 31 December 2022 (EUR 18 billion at 31 December 2021) from a portfolio of products registered in 'Customer deposits' to 'Liabilities covered by insurance or reinsurance contracts'. See note 1.b to our consolidated financial statements included in Part 1 of this report.
In the consolidated financial statements included in Part 1 of this annual report on Form 20-F we present our audited financial statements for the years 2023, 2022 and 2021.
| Year ended 31 December, | |||||||||||
| BALANCE SHEET (EUR million) | 2023 | 2022 | 2021 | ||||||||
| Total assets | 1,797,062 | 1,734,659 | 1,595,835 | ||||||||
| Loans and advances to customers | 1,036,349 | 1,036,004 | 972,682 | ||||||||
| Customer deposits | 1,047,169 | 1,009,722 | 900,554 | ||||||||
| Total customer funds (A) | 1,306,942 | 1,239,981 | 1,135,866 | ||||||||
| Total equity | 104,241 | 97,585 | 97,053 | ||||||||
| CAPITALIZATION (EUR million) | |||||||||||
| Shareholders' equity | 130,443 | 124,732 | 119,649 | ||||||||
| Other comprehensive income | (35,020) | (35,628) | (32,719) | ||||||||
| Stockholders' equity (B) | 95,423 | 89,104 | 86,930 | ||||||||
| Non-controlling interest (including net income of the period) | 8,818 | 8,481 | 10,123 | ||||||||
| Total equity | 104,241 | 97,585 | 97,053 | ||||||||
| Subordinated debt issued by Banco Santander, S.A. or issued by subsidiaries and guaranteed by Banco Santander, S.A., excluding preferred securities and preferred shares | 15,070 | 11,900 | 11,845 | ||||||||
| Other Subordinated debt (C) | 6,559 | 5,930 | 5,541 | ||||||||
| Preferred securities (D) | 9,081 | 7,898 | 8,601 | ||||||||
| Preferred shares (D) | 202 | 198 | 209 | ||||||||
| Total subordinated debt | 30,912 | 25,926 | 26,196 | ||||||||
| Total capitalization and Indebtedness | 135,153 | 123,511 | 123,249 | ||||||||
| Stockholders’ Equity per average share (B) | 5.90 | 5.29 | 5.03 | ||||||||
| Stockholders’ Equity per share at period end (B) | 6.01 | 5.38 | 5.09 | ||||||||
| INCOME STATEMENT (EUR million) | |||||||||||
| Interest income / (charges) | 43,261 | 38,619 | 33,370 | ||||||||
| Total income | 57,423 | 52,117 | 46,404 | ||||||||
| Net operating income (E) | 31,998 | 28,214 | 24,989 | ||||||||
| Operating profit/(loss) before tax | 16,459 | 15,250 | 14,547 | ||||||||
| Profit from continuing operations | 12,183 | 10,764 | 9,653 | ||||||||
| Profit attributable to the Parent | 11,076 | 9,605 | 8,124 | ||||||||
| PERFORMANCE | |||||||||||
| ROE (F) | 11.91 | % | 10.67 | % | 9.66 | % | |||||
| RoTE (G) | 15.06 | % | 13.37 | % | 11.96 | % | |||||
| ROA | 0.69 | % | 0.63 | % | 0.62 | % | |||||
| SOLVENCY RATIOS | |||||||||||
| Fully loaded CET1 (H) | 12.3 | % | 12.0 | % | 12.1 | % | |||||
| Phased-in CET1 (H) | 12.3 | % | 12.2 | % | 12.5 | % | |||||
834 | ||
| CREDIT QUALITY DATA | 2023 | 2022 | 2021 | ||||||||
| Loans and advances to customers | |||||||||||
| Allowances for total balances as a percentage of total gross loans | 2.15 | % | 2.14 | % | 2.31 | % | |||||
| Credit impaired balances as a percentage of total gross loans (I) | 3.22 | % | 3.11 | % | 3.18 | % | |||||
| Allowances for total balances as a percentage of credit impaired balances (I) | 67 | % | 69 | % | 73 | % | |||||
| Net loan charge-offs as a percentage of total gross loans | 1.16 | % | 1.02 | % | 0.77 | % | |||||
| Ratios adding contingent liabilities to loans and advances to customers (J) | |||||||||||
| Allowances for total balances as a percentage of total loans and contingent liabilities | 2.07 | % | 2.08 | % | 2.25 | % | |||||
| Credit impaired balances as a percentage of total loans and contingent liabilities (K) (I) | 3.14 | % | 3.08 | % | 3.16 | % | |||||
| Allowances for total balances as a percentage of credit impaired balances (K) (I) | 66 | % | 68 | % | 71 | % | |||||
| Net loan and contingent liabilities charge-offs as a percentage of total loans and contingent liabilities | 1.08 | % | 0.96 | % | 0.73 | % | |||||
| MARKET CAPITALIZATION AND SHARES | |||||||||||
| Number of shareholders | 3,662,377 | 3,915,388 | 3,936,922 | ||||||||
| Shares (millions) | 16,184 | 16,794 | 17,341 | ||||||||
| Share price (EUR) | 3.780 | 2.803 | 2.941 | ||||||||
| Market capitalization (EUR million) | 61,168 | 47,066 | 50,990 | ||||||||
| Payout ratio (L) | 25 | % | 20 | % | 20 | % | |||||
| PER SHARE INFORMATION | |||||||||||
| Average number of shares (EUR thousands) (M) | 16,172,085 | 16,848,345 | 17,272,055 | ||||||||
| Basic earnings per share (EUR) | 0.654 | 0.539 | 0.438 | ||||||||
| Basic earnings per share continuing operation (EUR) | 0.654 | 0.539 | 0.438 | ||||||||
| Diluted earnings per share (EUR) | 0.651 | 0.537 | 0.436 | ||||||||
| Diluted earnings per share continuing operation (EUR) | 0.651 | 0.537 | 0.436 | ||||||||
| Remuneration (EUR) (N) | 0.1760 | 0.1178 | 0.10 | ||||||||
| Remuneration (US$) (N) | 0.1945 | 0.1258 | 0.11 | ||||||||
| OPERATING DATA | |||||||||||
| Number of employees (O) | 212,764 | 206,462 | 199,177 | ||||||||
| Number of branches | 8,518 | 9,019 | 9,229 | ||||||||
(A)Total customer funds includes customer deposits, mutual funds, pension funds and managed portfolios. See notes 21 and 35 to our 'Consolidated financial statements' included in Part 1 of this annual report on Form 20-F.
(B)Equals the sum of the amounts included at the end of each year as 'Shareholders’ Equity' and 'Other comprehensive income' as stated in our 'Consolidated financial statements' included in Part 1 of this annual report on Form 20-F. We have deducted the book value of treasury stock from stockholders’ equity.
(C)Other Subordinated debt includes issuances by subsidiaries not guaranteed by Banco Santander, S.A. excluding preferred securities and preferred shares.
(D)In our 'Consolidated financial statements' included in Part 1 of this annual report on Form 20-F, preferred securities and preferred shares are included under 'Subordinated liabilities'.
(E)Net Operating Income is used for the Group’s internal reporting and management reporting purposes but is not a line item in the statutory consolidated income statement. Net operating income equals the sum of 'Total income', 'Administrative expenses' and 'Depreciation and amortization' as stated in our 'Consolidated financial statements' included in Part 1 of this annual report on Form 20-F.
(F)The Return on average stockholders’ equity ratio is calculated as profit attributable to the Parent divided by average stockholders’ equity.
(G)The Return on average tangible equity ratio (ROTE) is calculated as profit attributable to the Parent excluding goodwill impairment divided by the monthly average of: capital + reserves + retained earnings + other comprehensive income (excluding non-controlling interests) - goodwill - other intangible assets. We provide this non-GAAP financial measure as an additional measure to return on equity to provide a way to look at our performance which is closely aligned to our capital position.
835 | ||
| Cross-reference to Form 20-F | Consolidated directors' report | Consolidated financial statements | Supplemental information | |||||||||||||||||
| (million euros, except percentages) | |||||||||||
| 2023 | 2022 | 2021 | |||||||||
| Profit attributable to the parent | 11,076 | 9,605 | 8,124 | ||||||||
| Profit attributable to the parent excluding goodwill impairment | 11,096 | 9,605 | 8,130 | ||||||||
| Average equity | 93,035 | 89,986 | 84,133 | ||||||||
| Effect of goodwill and other intangible assets | (19,361) | (18,164) | (16,169) | ||||||||
| Average tangible equity | 73,675 | 71,822 | 67,964 | ||||||||
| Return on equity (ROE) | 11.91 | % | 10.67 | % | 9.66 | % | |||||
| Return on tangible equity (ROTE) | 15.06 | % | 13.37 | % | 11.96 | % | |||||
(H)Fully-loaded CET1 ratios are calculated without application of the transitory IFRS 9 provisions nor the subsequent amendments introduced by Regulation 2020/873 of the European Union. The phased-in CET1 ratios reflect the application of the transitory provisions and subsequent amendments introduced by Regulation 2020/873 of the European Union.
(I)Reflect Bank of Spain classifications. These classifications differ from the classifications applied by US banks in reporting loans as non-accrual, past due, restructured and potential problem loans. See note 2 to our 'Consolidated financial statement' included in Part 1 of this annual report on Form 20-F.
(J)We disclose these ratios because our credit risk exposure comprises loans and advances to customers as well as contingent liabilities, all of which are subject to impairment and, therefore, allowances are taken in respect thereof.
(K)Credit impaired balances include credit impaired loans and advances, customer guarantees and customer commitments granted.
(L)The pay-out ratio is calculated as cash dividends paid plus cash dividends payable on account of the net attributable income of the period (i.e., in 2023, we include the 8.10 euro cent interim dividend paid in November 2023 and the 9.50 euro cent final dividend payable in May 2024) divided by profit attributable to the Parent. Therefore, it does not include in the numerator the amounts paid as scrip dividends or share buybacks. See note 4 to our 'Consolidated financial statements' included in Part 1 of this annual report on Form 20-F. The 50% underlying pay-out goal for 2023 indicated by the Group is calculated as total dividends charged to the net attributable income of the period (including around 50% of the total through share buybacks) divided by underlying attributable profit, and is subject to approval of the final dividend at the 2024 AGM and completion of the Second 2023 Buyback Programme under the terms agreed by the board.
(M)Average number of shares is calculated on a monthly basis as the weighted average number of shares outstanding in the relevant year, net of treasury stock.
(N)With regard to the 2021 shareholder remuneration policy, on 28 September 2021 the board announced its intention to pay out an interim distribution of approximately 40% of the Group's underlying profit (half through a cash dividend and half through a shares buyback).
Interim remuneration. Accordingly, it authorized the payment of an interim dividend of EUR 4.85 cents per share (i.e., 20% of the Group's underlying profit for the first half of 2021), in cash and charged against 2021 profits. The interim dividend was paid on 2 November 2021. The board also voted to launch the First 2021 Buyback Programme worth 841 million euros (20% of the Group's underlying profit for the first half of 2021) once the ECB approved it on 28 September 2021. The First 2021 Buyback Programme was completed on 26 November 2021, and resulted in the acquisition of a total of 259,930,273 shares.
Final remuneration. On 24 February 2022, pursuant to the 2021 shareholder remuneration policy, the board of directors voted to: (i) submit a resolution at the 1 April 2022 AGM (the '2022 AGM') to approve a final cash dividend in the gross amount of EUR 5.15 cents per share (approximately 20% of the Group’s underlying profit for the second half of 2021); and (ii) implement a Second 2021 Buyback Programme worth 865 million euros (approximately 20% of the Group’s underlying profit for the second half of 2021). After approval at the 2022 AGM, the cash dividend was paid on 2 May 2022, and the Second 2021 Buyback Programme was completed on 6 May 2022, resulting in the acquisition of a total of 286,309,445 shares. As a result, total shareholder remuneration totalled approximately EUR 3.4 billion, equivalent to approximately 40% of 2021 underlying attributable profit.
With regard to the remuneration policy against the 2022 earnings, the board continued the policy of allocating approximately 40% of the Group's underlying profit to shareholder remuneration, split in approximately equal parts in cash dividends and share buybacks.
Interim remuneration. On 27 September 2022, the board authorized the payment of an interim cash dividend against 2022 results of 5.83 euro cents per share (equivalent to approximately 20% of the Group's underlying profit in the first half 2022). The interim dividend was paid on 2 November 2022. The board also agreed to implement the First 2022 Buyback Programme worth approximately 979 million euros (approximately 20% of the Group's underlying profit in first half 2022) following the ECB approval on 17 November 2022. The First 2022 Buyback Programme was completed on 31 January 2023, and resulted in the acquisition of a total of 340,406,572 shares.
Final remuneration. On 27 February 2023, per the 2022 shareholder remuneration policy, the board of directors voted to: (i) submit a resolution at the 31 March 2023 AGM to approve a final cash dividend in the gross amount of 5.95 euro cents per share entitled to receive dividends (following the approval at the AGM, the dividend was paid on 2 May 2023); and (ii) implement a Second 2022 Buyback Programme worth 921 million euros, that commenced on 1 March 2023 and was completed on 21 April 2023, resulting in the acquisition of a total of 269,848,953 shares. After the above-mentioned actions, the shareholders' remuneration for 2022 amounted to 3,842 million euros (approximately 40% of the underlying profit in 2022) split in approximately equal parts in cash dividends (1,942 million euros) and share buybacks (1,900 million euros).
With regard to the remuneration policy against the 2023 earnings, the board followed a policy of allocating 50% of the Group’s reported profit, excluding non-cash, non-capital ratios impact items, to shareholder remuneration, distributed in approximately 50% in cash dividend and 50% in share buybacks.
Interim remuneration. On 26 September 2023, the board resolved to pay an interim cash dividend against the 2023 results of 8.10 euro cents per share entitled to the dividend (equivalent to approximately 25% of the Group's reported profit in the first half of 2023). The interim dividend was paid on 2 November 2023. The board also agreed to implement the First 2023 Buyback Programme worth approximately EUR 1,310 million (equivalent to approximately 25% of the Group's reported profit in the first half of 2023). The First 2023 Buyback Programme was completed on 25 January 2024, and resulted in the acquisition of a total of 358,567,487 shares.
Final remuneration. Under the 2023 shareholder remuneration policy, on 19 February 2024, the board of directors resolved to submit a resolution at the 2024 AGM to approve a final cash dividend in the gross amount of 9.50 euro cents per share entitled to dividends. If approved at the AGM, the dividend would be payable from 2 May 2024. The board of directors also resolved to implement the Second 2023 Buyback Programme worth 1,459 million euros, for which the appropriate regulatory authorisation has been obtained and which commenced on 20 February 2024. Once the above-mentioned actions are completed, total shareholder remuneration for 2023 would be of 5,538 million euros (approximately 50% of the Group's reported profit in 2023), distributed in approximately 50% in cash dividend (2,769 million euros) and 50% in share buybacks (2,769 million euros). These amounts have been estimated assuming that, as a consequence of the partial execution of the Second 2023 Buyback Programme at the time of payment of the cash dividend, the number of outstanding shares entitled to the final cash dividend will be 15,483,617,874. Therefore, that amount may be higher if fewer shares than planned are acquired in the Second 2023 Buyback Programme; otherwise, it will be lower.
For more information see section 3.3.'Dividends and shareholder remuneration' in the 'Corporate governance' chapter included in Part 1 of this annual report on Form 20-F.
(O)We adjusted the number of employees for 2021 following a change to headcount criteria in our units in the UK and Poland to align the criteria throughout the Group.
Set forth below is a table showing our allowances for credit impaired balances broken down by various categories as disclosed and discussed throughout this annual report on Form 20-F:
836 | ||
| 2023 | 2022 | 2021 | |||||||||
| Allowances refers to: | |||||||||||
| Allowances for total balances (A) | 23,490 | 23,418 | 23,698 | ||||||||
| Allowances for contingent liabilities and commitments | 702 | 734 | 734 | ||||||||
| Allowances for total balances (excluding contingent liabilities and commitments): | 22,788 | 22,684 | 22,964 | ||||||||
| Other allowances (B) | 295 | 232 | 222 | ||||||||
| Allowances for total balances (excluding contingent liabilities and commitments) | 23,083 | 22,916 | 23,186 | ||||||||
| Of which: | |||||||||||
| Allowances for customers | 22,788 | 22,684 | 22,964 | ||||||||
| Allowances for credit institutions and other financial assets | 9 | 6 | 7 | ||||||||
| Allowances for Debt instruments | 286 | 226 | 215 | ||||||||
| Allowances for Financial assets at amortised cost | 22,950 | 22,888 | 23,164 | ||||||||
| Allowances for Financial assets at fair value through other comprehensive income | 133 | 28 | 22 | ||||||||
(A) Allowances for credit impaired loans and advances to customers, customer guarantees and customer commitments granted.
(B) Includes mainly allowances for debt instruments.
837 | ||
| Cross-reference to Form 20-F | Consolidated directors' report | Consolidated financial statements | Supplemental information | |||||||||||||||||
4. Risk factors
Risk factor summary
1. Macro-economic and political risks
1.1 Our growth, asset quality and profitability, among others, may be adversely affected by a slowdown in one or more of the economies in which we operate, volatile macroeconomic and political conditions and persistent high inflation.
1.2 The continuance or escalation of the war in Ukraine and the conflict in the Middle East could materially affect our financial position and increase our operational risk.
1.3 The global covid-19 pandemic materially impacted our business, and the continuance of this pandemic or any future outbreak of any other highly contagious diseases or other public health emergencies, could materially and adversely impact our business, financial condition, liquidity and results of operations.
1.4 The UK’s withdrawal from the European Union has had and could continue to have a material adverse effect on our UK-based operations, financial condition and prospects.
2. Risks relating to our business
2.1 Legal, regulatory and compliance risks for our business model
2.1.1 We are exposed to risk of loss from legal and regulatory proceedings.
2.1.2 We are subject to extensive regulation and regulatory and governmental oversight which could adversely affect our business, operations and financial condition.
2.1.3 We are subject to potential action by any of our regulators or supervisors, particularly in response to customer complaints.
2.1.4 We are subject to review by tax authorities, and an incorrect interpretation by us of tax laws and regulations may have a material adverse effect on us.
2.1.5 We may not be able to detect or prevent money laundering and other financial crime activities fully or on a timely basis, which could expose us to additional liability and could have a material adverse effect on us.
2.1.6 Changes in taxes and other assessments may adversely affect us.
2.2 Credit risks
2.2.1 The credit quality of our loan portfolio may deteriorate, and our loan loss reserves could be insufficient to cover our loan losses, which could have a material adverse effect on us.
2.2.2 The value of the collateral securing our loans may not be sufficient, and we may be unable to realize the full value of the collateral securing our loan portfolio.
2.2.3 We are subject to counterparty risk in our banking business.
2.3 Operational and technology risks
2.3.1 Any failure to improve or upgrade our information technology infrastructure and information management systems in an effective, timely and cost-effective manner, including in response to new or modified cybersecurity and data privacy laws, rules and regulations, could have a material adverse effect on us.
2.3.2 Any failure or disruption of our operational processes or systems, or data breaches and other security incidents with respect to our or our third-party vendors’ systems could adversely affect our business or reputation, and create significant legal, regulatory or financial exposure.
2.3.3 We rely on third parties and affiliates for important products and services.
2.3.4 We utilize artificial intelligence, which could expose us to liability or adversely affect our business.
2.4 Liquidity and funding risks
2.4.1 Liquidity and funding risks are inherent in our business and could have a material adverse effect on us.
2.4.2 Credit, market and liquidity risk may have an adverse effect on our credit ratings and our cost of funds. Any downgrade in our credit rating would likely increase our cost of funding, require us to post additional collateral or take other actions under some of our derivative and other contracts and adversely affect our interest margins and results of operations.
2.5 Market risks
2.5.1 Our financial results are constantly exposed to market risk. We are subject to fluctuations in interest rates and other market risks, which may materially and adversely affect us and our profitability.
2.5.2 We are subject to market, operational and other related risks associated with our derivative transactions that could have a material adverse effect on us.
2.5.3 Market conditions have resulted and could result in material changes to the estimated fair values of our financial assets. Negative fair value adjustments could have a material adverse effect on our operating results, financial condition and prospects.
2.6 Risks related to our industry
2.6.1 Goodwill impairments may be required in relation to acquired businesses.
2.6.2 Changes in our pension liabilities and obligations could have a material adverse effect on us.
2.6.3 We depend in part on dividends and other funds from subsidiaries.
2.6.4 Increased competition, including from non-traditional providers of banking services such as financial technology providers, and industry consolidation may adversely affect our results of operations.
838 | ||
2.6.5 If we are unable to manage the growth of our operations, to integrate successfully our inorganic growth, or to execute successfully any of our strategic actions, this could have an adverse impact on our profitability.
2.7 Risk management
2.7.1 Failure to successfully implement and continue to improve our risk management policies, procedures and methods, including our credit risk management systems, could materially and adversely affect us, and we may be exposed to unidentified or unanticipated risks.
2.8 Model risk
2.8.1 We rely on models for many of our decisions. Their inaccurate or incorrect use could have a material adverse effect on us.
3. General risks
3.1 Risks related to our industry
3.1.1 Climate change can create transition risks, physical risks, and other risks that could adversely affect us.
3.1.2 The financial problems faced by our customers could adversely affect us.
3.1.3 Our ability to maintain our competitive position depends, in part, on the success of new products and services we offer our customers and on our ability to offer products and services that meet the customers’ needs during the whole life cycle of the products or services. Our failure to manage various risks we face as we expand our range of products and services could have a material adverse effect on us.
3.1.4 We rely on recruiting, retaining and developing appropriate senior management and skilled personnel.
3.1.5 Damage to our reputation could cause harm to our business prospects.
3.1.6 We engage in transactions with our subsidiaries or affiliates that others may not consider to be on an arm’s-length basis.
3.2 Reporting and control risks
3.2.1 Changes in accounting standards could impact reported earnings.
3.2.2 Our financial statements are based in part on assumptions and estimates which, if inaccurate, could cause material misstatement of the results of our operations and financial position.
3.2.3 Disclosure controls and procedures over financial and non-financial reporting may not prevent or detect all errors or acts of fraud.
3.3 Foreign private issuer and other risks
3.3.1 Our corporate disclosure may differ from disclosure regularly published by issuers of securities in other countries, including the United States.
3.3.2 Investors may find it difficult to enforce civil liabilities against us or our directors and officers.
3.3.3 As a holder of ADSs you will have different shareholders’ rights than do shareholders of companies incorporated in the United States and certain other jurisdictions.
3.3.4 ADS holders may be subject to additional risks related to holding ADSs rather than shares.
1. Macro-economic and political risks
1.1 Our growth, asset quality and profitability, among others, may be adversely affected by a slowdown in one or more of the economies in which we operate, volatile macroeconomic and political conditions and persistent high inflation.
A slowdown or recession of one or more of the economies in which we operate could lead major financial institutions, including some of the world’s largest global commercial banks, investment banks, mortgage lenders, mortgage guarantors and insurance companies to experience significant difficulties, including runs on deposits, the need for government aid or assistance or the need to reduce or cease providing funding to borrowers (including to other financial institutions).
Volatile conditions in the global financial markets could also have a material adverse effect on us, including on our ability to access capital and liquidity on financial terms acceptable to us, if at all. If capital markets financing ceases to become available, or becomes excessively expensive, we may be forced to raise the rates we pay on deposits to attract more customers and become unable to maintain certain liability maturities. Any such increase in capital markets funding availability or costs or in deposit rates could have a material adverse effect on our interest margins and liquidity.
In particular, we face, among others, the following risks related to the economic downturn and volatile conditions:
•Reduced demand for our products and services.
•Increased regulation of our industry. Compliance with such regulation would likely continue to increase our costs and may affect the pricing for our products and services, increase our conduct and regulatory risks related to non-compliance and limit our ability to pursue business opportunities.
•Inability of our borrowers to timely or fully comply with their existing obligations. Macroeconomic shocks may negatively impact the income of our customers, both retail and corporate, and may adversely affect the recoverability of our loans, resulting in increased loan losses.
839 | ||
| Cross-reference to Form 20-F | Consolidated directors' report | Consolidated financial statements | Supplemental information | |||||||||||||||||
•The process we use to estimate losses inherent in our credit exposure requires complex judgements, including forecasts of economic conditions and how these economic conditions might impair the ability of our borrowers to repay their loans. The degree of uncertainty concerning economic conditions may adversely affect the accuracy of our estimates, which may, in turn, impact the reliability of the process and the sufficiency of our loan loss allowances.
•The value and liquidity of the portfolio of investment securities that we hold may be adversely affected.
The recoverability of our loan portfolios and our ability to increase the amount of loans outstanding and our results of operations and financial condition in general, are dependent to a significant extent on the level of economic activity in Europe (in particular, Spain and the United Kingdom (UK)), North America (in particular, Mexico and the United States) and South America (in particular, Brazil). The credit quality of our loan portfolio may deteriorate as a result of these risks and our loan loss reserves could be insufficient to cover our loan losses, which could have a material adverse effect on us. See risk factor '2.2.1 The credit quality of our loan portfolio may deteriorate and our loan loss reserves could be insufficient to cover our loan losses, which could have a material adverse effect on us'.
In addition, we are exposed to sovereign debt in these regions. Our net exposure to sovereign debt at 31 December 2023 amounted to EUR 160,975 million (8.96% of our total assets at that date) of which the main exposures in the eurozone relate to Spain and Portugal with net exposure of EUR 39,627 million and EUR 6,859 million, respectively. In North America, the main exposures relate to Mexico and the US (EUR 20,825 million and EUR 21,304 million, respectively) and in South America to Brazil (EUR 27,733 million). For more information on our exposure to sovereign debt, see note 54.b) 4.4 to our 'Consolidated financial statements' included in Part 1 of this annual report on Form 20-F. Recessionary conditions in the economies of Europe, North America or some of the South American countries in which we operate, would likely have a significant adverse impact on our loan portfolio and sovereign debt holdings and, as a result, on our financial condition, cash flows and results of operations.
Our revenues are also subject to risk of deterioration from unfavourable political and diplomatic developments, social instability, international conflicts, and changes in governmental policies, including expropriation, nationalization, international ownership legislation, sanctions, interest-rate caps, fiscal and monetary policies globally.
For the year ending 31 December 2023, 45% of the underlying profit attributable to the Parent came from Europe (of which 20% was from Spain and 13% from the UK), 25% from South America (16% from Brazil), 20% from North America (8% from the United States and 13% from Mexico) and 10% from the Digital Consumer Bank segment (primarily
Europe). As of 31 December 2023, our total assets stood at 55% in Europe (28% in Spain and 19% in the UK), 19% in South America (13% in Brazil), 17% in North America (11% in the United States and 6% in Mexico) and 9% in the Digital Consumer Bank segment (primarily Europe).1
In particular, the main regions where we operate are subject to the following macroeconomic and political conditions, which could have a material adverse effect on our business, results of operations, financial condition and prospects:
•Governmental and regulatory authorities throughout the world, particularly in Europe and the United States, implemented fiscal and monetary policies and initiatives in response to the adverse effects of the covid-19 pandemic on the economy, individual businesses and households. These fiscal and monetary policy measures accelerated the economic recovery in 2021 but in turn significantly increased public debt and introduced risks of economic overheating in certain countries. In 2022, inflationary pressures intensified due to a number of factors, including the revitalization of demand for consumer goods, labour shortages, supply chain issues and the rise of the prices of energy, oil, gas and other commodities exacerbated by the war in Ukraine. In an effort to contain inflation, central banks increased interest rates during 2022 and 2023 contributing to a slowdown of the global economy. Most of the countries in which we operate experienced an environment of persistent high inflation, and even though inflation has fallen in most of our markets during 2023, central banks are expected to sustain high interest rates to address persistent underlying inflation pressures through mid-2024. Prolonged periods of high inflation are likely to result in higher operating costs, a decrease in the purchasing power of families with the consequent increase in delinquencies in our credit portfolios, and lower economic growth derived from the tightening of monetary and fiscal policies aimed at containing inflation, among other risks, any of which could have a material adverse effect on our operations, financial condition and prospects.
Among the risks that could negatively affect the economies and financial markets of the regions where we operate and lead to a further slowdown of the global economy, recession and/or stagflation are (i) the continuance or escalation of the war in Ukraine and the conflict in the Middle East; (ii) further increases in the prices of energy and other commodities that can lead to further inflationary pressures; (iii) the continued breakdown of global supply chains; and (iv) the maintenance of tight monetary and fiscal policies or the tightening thereof, including by rising or maintaining high interest costs.
•Scenarios of political tensions and instability throughout the world stemming from a variety of factors, such as heightened polarization and political fragmentation, may lead to shifting and unpredictable outcomes in political elections, legislative and policy-making efforts, social conditions and the global economy and could erode the rule
1 Percentages calculated using as denominator the underlying profit of total operating areas (i.e., without considering the -EUR 998 million underlying losses accounted for in the Corporate Center resulting from centralized management of the areas) and the total assets of total operating areas (i.e., without considering EUR 254,705 million total assets accounted for in the Corporate Center and without intra-group eliminations).
840 | ||
of law in certain long-standing democracies. Furthermore, increasing public debt levels together with rising interest costs may not be sustainable, which could lead certain countries into sovereign debt crises. A deterioration of the global economic, political and financial environment, particularly in Europe and the Americas, could have a material adverse impact on the financial sector, affecting our operating results, financial position and prospects.
In particular, the risk of returning in Europe to a fragile and volatile environment and to heightened political tensions could be aggravated if, among others, (i) the policies implemented to provide emergency assistance and support to Ukraine, to alleviate the consequences of the war in the European Union (EU) countries and to contain inflation do not succeed, (ii) the reforms aimed at improving productivity and competition fail, (iii) the banking union and other measures of European integration do not take hold, or (iv) anti-European groups become more widespread.
•The shift of the global economy’s centre of gravity from the Atlantic to the Pacific and, more particularly, China's ambition to reach higher levels of economic power through increasing their relevance as key trading partners and source of financing for Latin American economies, could negatively impact US and European banks, particularly those like us with limited presence in Asia, reducing our global market share and customer base and affecting our business, operating results, financial condition and prospects.
•Growing protectionism and trade tensions, such as the tensions between the United States and China in recent years, could have a negative impact on the economies of the countries where we operate, which would also impact our operating results, financial condition and prospects.
•Uncertain economic outlook for China could negatively affect the world economy which would also impact our operating results, financial condition and prospects.
•The economies of some of the countries where we operate, particularly in Latin America, face long-standing structural problems, including weaknesses in infrastructure, economic competitiveness and education, high levels of social inequality, rising inflation and increasing public debt levels and have experienced significant volatility in recent decades. This volatility resulted in fluctuations in the levels of deposits and in the relative economic strength of various segments of the economies to which we lend. In addition, some of the countries where we operate are particularly affected by commodities price fluctuations, which in turn may affect financial market conditions through exchange rate fluctuations, interest rate volatility and deposits volatility. In addition, we are exposed to variations in our net interest income or in the fair value of our assets and liabilities resulting from exchange rate fluctuations. Fiscal instability, political tensions and financial volatility, particularly in Brazil, Mexico and Argentina, could have a negative impact on the economy of these countries and may have a material adverse effect on us.
1.2 The continuance or escalation of the war in Ukraine and the conflict in the Middle East could materially affect our financial position and increase our operational risk.
On 24 February 2022, Russia launched a large-scale military action against Ukraine. The war in Ukraine has caused an ongoing humanitarian crisis in Europe as well as volatility in financial markets globally, heightened inflation, shortages and increases in the prices of energy, oil, gas and other commodities. The continuance or escalation of the war, including its extension to other countries in the region, could lead to further increases in energy, oil and gas prices (particularly if supplies to Europe are interrupted) and heightened inflationary pressures, which in turn could lead to further increases in interest rates and market volatility. In addition, the war has exacerbated supply chain problems, particularly to those businesses most sensitive to rising energy prices. The war and its effects could exacerbate the current slowdown in the global economy and could negatively affect the payment capacity of some of our customers, especially those with more exposure to the Russian or Ukrainian markets.
In response to the Russian military action against Ukraine, several countries, including the US, the EU member states, the UK and other UN member states, have imposed severe sanctions on Russia and Belarus, including freezing/blocking assets, targeting major Russian banks, the Russian Central Bank, and certain Russian companies and individuals, imposing trade restrictions against Russia and Russian interests, as well as the disconnection of certain Russian banks from the SWIFT system (Society for Worldwide Interbank Financial Telecommunication). In addition, the sanctions imposed also include a ban on trading in sovereign debt and other securities. The scale of sanctions is unprecedented, complex and rapidly evolving, and poses continuously increasing operational risk to the Group. Our corporate framework and policies are designed to ensure compliance with applicable laws, regulations and economic sanctions in the countries in which we operate, including US, UK, EU and UN economic sanctions. We cannot predict whether any of the countries in which we operate will enact additional economic sanctions or trade restrictions in response to the Russian military action against Ukraine. While we do not knowingly engage in direct or indirect dealings with sanctioned parties according to applicable sanctions, or in direct dealings with the sanctioned countries/territories, we may on occasion have indirect dealings within the sanctioned countries/territories, but aim to operate in line with applicable US, EU, UK and UN blocking and sectoral sanctions regulations.
Furthermore, the risk of cyberattacks on companies and institutions has increased and could increase even further. Although we are actively monitoring the situation, there can be no assurance that our cybersecurity and data protection measures and defences will be effective at identifying, preventing, mitigating or remediating any such cyberattacks.
On 7 October 2023, Hamas launched an attack on Israel targeting Israeli civilians. In response, Israel declared war against Hamas, attacking Hamas targets in Gaza and the
841 | ||
| Cross-reference to Form 20-F | Consolidated directors' report | Consolidated financial statements | Supplemental information | |||||||||||||||||
region. The war, the escalation of the conflict and any resulting conflicts in the region could lead to higher oil and gas prices, the imposition of sanctions, travel and import/export restrictions, increased inflationary pressures and market volatility, among other potential consequences. In response to the war in Gaza, since mid-November 2023, Houthi rebels in Yemen have targeted and carried out attacks on commercial shipping vessels travelling through the Red Sea which may result in further disruptions in supply chains.
We do not have a physical presence in Russia and Ukraine and our physical presence in the Middle East is very limited. Further, our direct exposure to Russian, Ukrainian or Middle Eastern markets is not material. However, the impact of the wars and sanctions on global markets, macroeconomic conditions globally, and other potential future geopolitical tensions and consequences remain uncertain and may exacerbate our operational risk. Episodes of economic and market volatility and pressure on supply chains and inflation may continue to occur and could worsen if the wars persist or increase in severity. As a result, our businesses, results of operations and financial position could be adversely affected by any of these factors directly or indirectly arising from the war in Ukraine and the conflict in the Middle East.
1.3 The global covid-19 pandemic materially impacted our business, and the continuance of this pandemic or any future outbreak of any other highly contagious diseases or other public health emergencies, could materially and adversely impact our business, financial condition, liquidity and results of operations.
Although the World Health Organization declared an end to covid-19 as a public health emergency, certain adverse consequences of the covid-19 pandemic continued to impact the macroeconomic environment in 2023 and may persist for some time.
If new covid-19 waves, the emergence of variants or strains resistant to existing or new vaccines, or any other highly contagious diseases or other public health emergencies force countries to re-adopt measures that restrict economic activity, the macroeconomic environment could deteriorate and adversely impact our business and results of operations, which could include, but is not limited to (i) a continued decreased demand for our products and services; (ii) further material impairment of our loans and other assets including goodwill; (iii) decline in the value of collateral; (iv) constraints on our liquidity due to market conditions, exchange rates and customer withdrawal of deposits and continued draws on lines of credit; and (v) downgrades to our credit ratings. See risk factor '2.4.2 Credit, market and liquidity risk may have an adverse effect on our credit ratings and our cost of funds. Any downgrade in our credit rating would likely increase our cost of funding, require us to post additional collateral or take other actions under some of our derivative and other contracts and adversely affect our interest margins and results of operations'.
Moreover, our operations could still be impacted by risks from remote work or bans on non-essential activities. If, as a result of any future public health emergencies, we become unable to successfully operate our business from remote
locations including, for example, due to failures of our technology infrastructure, increased cybersecurity risks, or governmental restrictions that affect our operations, this could result in business disruptions that could have a material and adverse effect on our business.
In light of the impact that the covid-19 pandemic had on the economic situation and forecasts in the markets where we operate, a review was carried out in 2020 to evaluate both goodwill and the recoverability of deferred tax assets. As a result of this review, in 2020 we adjusted the valuation of our goodwill and deferred tax assets, resulting in a non-recurring impairment of EUR 12,600 million. Furthermore, at the end of 2020 we recorded additional allowances for impairment of financial assets at amortized cost of EUR 3,105 million due to the effect of the covid-19 pandemic. In 2021, 2022 and 2023 we did not record additional provisions related to the pandemic.
The resurgence of covid-19 or other variants or strains, or any future outbreak of any other highly contagious diseases, or other public health emergencies may have adverse effects on our business, financial condition, liquidity and results of operations or cause other risks to us.
1.4 The UK’s withdrawal from the European Union has had and could continue to have a material adverse effect on our UK-based operations, financial condition and prospects.
On 31 January 2020, the UK ceased to be a member of the EU and a limited trade deal was agreed between the UK and the EU with the relevant new regulations coming into force on 1 January 2021.
The trade deal, however, did not include agreements on certain areas such as financial services and data adequacy. The European Commission (the 'Commission') is expected to decide in 2024 whether to extend the data adequacy decisions for the UK for an additional period of up to a maximum of four years. If the Commission does not extend the decisions, then the decisions will expire on 27 June 2025. As a result, Santander UK has had, and will continue to have, a limited ability to provide cross-border services to EU customers and to trade with EU counterparties. For more information on cross-border transfers of personal data, see risk factor ‘2.1.2 We are subject to extensive regulation and regulatory and governmental oversight which could adversely affect our business, operations and financial conditions. – Data privacy and cybersecurity’.
Following a consultation on the optimal structure for UK financial services post-Brexit, the Financial Services and Markets Act 2023 ('FSMA 2023') received royal assent on 29 June 2023. FSMA 2023 establishes a framework for HM Treasury to revoke EU-derived financial services legislation and for it to be replaced by Financial Conduct Authority (FCA) and Prudential Regulation Authority (PRA) rules, with the intention of delivering a comprehensive FSMA model of regulation under which the regulators have extensive rule-making powers. This process of revoking and replacing retained EU law may result in material changes to the UK regulatory regime and the impact of these reforms on Santander UK is difficult to predict.
842 | ||
The wider and continuing impact of Brexit on financial markets through market fragmentation, reduced access to finance and funding, and a lack of access to certain financial market infrastructure, may affect our operations, financial condition and prospects and those of our customers.
Residual risks remain around the impact of Brexit on the UK’s economy. Brexit has contributed to global covid-19 pandemic-related supply and labour market constraints and reduced economic output and exports as businesses attempt to adapt the new cross-border procedures and rules applicable in the UK and in the EU to their activities, products, customers and suppliers.
The UK’s withdrawal from the EU has been hampered by the overlay and development of economic risks from the covid-19 pandemic, the war in Ukraine and the conflict in the Middle East and the longer-term effects are difficult to assess. Further, there is ongoing political and economic uncertainty, such as increased friction with the EU and EU countries, which could negatively affect Santander UK’s customers and counterparties and have a material adverse effect on our operations, financial condition and prospects.
We considered these circumstances in our assessment of the recoverability of the cash-generating unit that supports Santander UK's goodwill, which was impaired during 2020 and 2019. In 2021, 2022 and 2023, there was no impairment of Santander UK's goodwill. See note 17 to our 'Consolidated financial statements' included in Part 1 of this annual report on Form 20-F.
2. Risks relating to our business
2.1 Legal, regulatory and compliance risks for our business model
2.1.1 We are exposed to risk of loss from legal and regulatory proceedings.
We face risk of loss from legal and regulatory proceedings, including tax proceedings, that could subject us to monetary judgements, regulatory enforcement actions, fines and penalties. The current regulatory and tax enforcement environment in the jurisdictions in which we operate reflects an increased supervisory focus on enforcement, combined with uncertainty about the evolution of the regulatory regime, and may lead to material operational and compliance costs.
We are from time to time subject to regulatory investigations and civil and tax claims, and party to certain legal proceedings incidental to the normal course of our business, including, among others, in connection with conflicts of interest, lending and derivatives activities, relationships with our employees and other commercial, data protection or tax matters. In view of the inherent difficulty of predicting the outcome of legal matters, particularly where the claimants seek very large or indeterminate damages, or where the cases present novel legal theories, involve a large number of parties or are in the early stages of investigation or discovery, we cannot state with certainty what the eventual outcome of
these pending matters will be or what the eventual loss, fines or penalties related to each pending matter may be.
The amount of our reserves in respect of these matters, which considers the likelihood of future cash outflows associated with each of such claims, is substantially less than the total amount of the claims asserted against us, and, in light of the uncertainties involved in such claims and proceedings, there is no assurance that the ultimate resolution of these matters will not significantly exceed the reserves currently accrued by us. As a result, the outcome of a particular matter may be material to our operating results for a particular period. As of 31 December 2023, we had provisions for taxes, other legal contingencies and other provisions for EUR 4,634 million. See more information in note 25.d) to our 'Consolidated financial statements' included in Part 1 of this annual report on Form 20-F.
For example, in Poland we are exposed to significant litigation in connection with CHF indexed and CHF denominated loans in which we are facing claims that those loans or clauses included in them are abusive. Whilst the Court of Justice of the European Union ('CJEU') and the Polish Supreme Court have issued several rulings on this matter (including the CJEU ruling of 15 June 2023), sufficient case law has not yet been developed. The case law of the Polish national courts implementing the CJEU rulings (including the ruling of 15 June 2023) and the possible position of the Polish Supreme Court will be crucial for the final assessment of the legal risk related to this matter. See note 25.e) to our 'Consolidated financial statements' included in Part 1 of this annual report on Form 20-F.
As of the date of this report, it is not possible to predict the Polish Supreme Court’s and CJEU’s decisions on individual cases. As of 31 December 2023, Santander Bank Polska S.A. and Santander Consumer Bank S.A. maintained a portfolio of mortgages denominated in or indexed to CHF for an approximate gross amount of PLN 6,398.1 million (EUR 1,473.1 million) and the total value of the adjustments to gross carrying amount in accordance with IFRS9 as well as the provisions recorded under IAS37, amount to PLN 5,030.3 million (EUR 1,158.2 million). The provisions and adjustments recorded are deemed sufficient to cover the risks associated with the legal claims against us. However, in the event that we are required to make higher payments than estimated, either with respect to existing or new claims, there could be a significant adverse effect on our results and financial situation.
2.1.2 We are subject to extensive regulation and regulatory and governmental oversight which could adversely affect our business, operations and financial condition.
As a financial institution, we are subject to extensive regulation, which materially affects our businesses. In Spain and the other jurisdictions where we operate, there is continuing political, competitive and regulatory scrutiny of the banking industry, including banking practices, products, services and pricing policies. Political involvement in the regulatory process, in the behaviour and governance of the banking sector and in the major financial institutions in which the local governments have a direct financial interest, and in
843 | ||
| Cross-reference to Form 20-F | Consolidated directors' report | Consolidated financial statements | Supplemental information | |||||||||||||||||
their products and services and the prices and other terms they apply to them, is likely to continue. Accordingly, the statutes, regulations and policies to which we are subject may be changed at any time. In addition, the interpretation and the application by regulators of the laws and regulations to which we are subject may also change from time to time. Extensive legislation and regulation affecting the financial services industry has been adopted in regions that directly or indirectly affect our business, including Spain, the United States, the EU, the UK, Latin America and other jurisdictions, and further regulations are in the process of being implemented. The manner in which those laws and related regulations are applied to the operations of financial institutions is still evolving. Moreover, to the extent these regulations are implemented inconsistently in the various jurisdictions in which we operate, we may face higher compliance costs. Any legislative or regulatory actions and any required changes to our business operations resulting from such legislation and regulations, as well as any deficiencies in our compliance with such legislation and regulation, could result in fines, significant loss of revenue, limit our ability to pursue business opportunities in which we might otherwise consider engaging, limit our ability to provide certain products and services, affect the value of assets that we hold, require us to increase our prices and therefore reduce demand for our products, impose additional compliance and other costs on us or otherwise adversely affect our businesses. In particular, legislative or regulatory actions resulting in enhanced prudential standards, in particular with respect to capital and liquidity, could impose a significant regulatory burden on us or on our subsidiaries and could limit the bank subsidiaries’ ability to distribute capital and liquidity to us, thereby negatively impacting us. Future liquidity standards could require us to maintain a greater proportion of assets in highly-liquid but lower-yielding financial instruments, which would negatively affect our net interest margin. Moreover, regulatory and supervisory authorities periodically review our allowance for loan losses. Such regulators and supervisors may recommend that we increase our allowance for loan losses or to recognize further losses. Any such additional provisions for loan losses, as recommended by these regulatory and supervisory agencies, whose views may differ from those of our management, could have an adverse effect on our earnings and financial condition. Accordingly, there can be no assurance that future changes in regulations or in their interpretation or application will not adversely affect us.
The wide range of regulations, actions and proposals which most significantly affect us, or which could most significantly affect us in the future, relate to capital requirements, funding and liquidity and development of a fiscal and banking union in the EU, which are discussed in further detail below. Moreover, there is uncertainty regarding the future of financial reforms in the United States (US) and the impact that potential financial reform changes to the US banking system may have on ongoing international regulatory proposals. In general, regulatory reforms adopted or proposed in the wake of the financial crisis have increased and may continue to materially increase the Group's operating costs and negatively impact the Group's business
model. Furthermore, regulatory authorities have substantial discretion in how to regulate banks, and this discretion, and the means available to the regulators, have been increasing during recent years. Regulation may be imposed on an ad hoc basis by governments and regulators in response to a crisis, and these may especially affect financial institutions such as us that are deemed to be a global systemically important institution (G-SII). The main regulations and regulatory and governmental oversight that can adversely impact us include but are not limited to the items below. See more details in section 10.'Supervision and regulation'.
Capital requirements, liquidity, funding and structural reform
Increasingly onerous capital requirements constitute one of our main regulatory challenges. Increasing capital requirements may adversely affect our profitability and create regulatory risk associated with the possibility of failure to maintain required capital levels. As a Spanish financial institution, we are subject to the Capital Requirements Regulation (Regulation (EU) No 575/2013) (CRR) and the Capital Requirements Directive (Directive 2013/36/EU) (CRD IV), through which the EU began implementing the Basel III capital reforms from 1 January 2014. While the CRD IV required national transposition, the CRR was directly applicable in all the EU member states. This regulation is complemented by several binding technical standards and guidelines issued by the European Banking Authority (EBA), directly applicable in all EU member states, without the need for national implementation measures. The implementation of the CRD IV into Spanish law took place through Royal Decree Law 14/2013 and Law 10/2014, Royal Decree 84/2015, of 13 February, implementing Law 10/2014 (Royal Decree 84/2015), Bank of Spain Circular 2/2014 and Bank of Spain Circular 2/2016.
On 27 June 2019, a comprehensive package of reforms amending CRR, CRD IV as well as the European Bank Recovery and Resolution Directive (Directive 2014/59/EU) (BRRD) and Regulation (EU) No 1093/2010 (SRM Regulation) came into force: (i) Directive (EU) 2019/878 of the European Parliament and of the Council of 20 May 2019 amending CRD IV with respect to exempted entities, financial holding companies, mixed financial holding companies, remuneration, supervisory measures and powers and capital conservation measures (CRD V); (ii) Directive (EU) 2019/879 of the European Parliament and of the Council of 20 May 2019 amending BRRD with respect to loss-absorbing and recapitalisation capacity of credit institutions and investment firms and Directive 98/26/EC (BRRD II); (iii) Regulation (EU) 2019/876 of the European Parliament and of the Council of 20 May 2019 amending CRR with respect to the leverage ratio, the net stable funding ratio, requirements for own funds and eligible liabilities, counterparty credit risk, market risk, exposures to central counterparties, exposures to collective investment undertakings, large exposures, reporting and disclosure requirements, and Regulation (EU) 648/2012 (CRR II); and (iv) Regulation (EU) 2019/877 of the European Parliament and of the Council of 20 May 2019 amending the SRM Regulation with respect to the loss-absorbing and recapitalisation capacity of credit institutions
844 | ||
and investment firms (SRMR II, and together with CRD V, BRRD II and CRR II, the EU Banking Reforms).
The EU Banking Reforms cover multiple areas, including the Pillar 2 framework, the leverage ratio, mandatory restrictions on distributions, permission for reducing own funds and eligible liabilities, macroprudential tools, a new category of 'non-preferred' senior debt that should only be bailed-in after junior ranking instruments but before other senior liabilities, changes to the definitions of Tier 2 and Additional Tier 1 instruments, the minimum requirement for own funds and eligible liabilities (MREL) framework and the integration of the total loss absorbing capacity (TLAC) standard into EU legislation as mentioned above.
With respect to the European Commission's proposal to create a new asset class of 'non-preferred' senior debt, on 27 December 2017, Directive 2017/2399 amending Directive 2014/59/EU with respect to the ranking of unsecured debt instruments in insolvency hierarchy was published in the Official Journal of the European Union and sets forth a harmonised national insolvency ranking of unsecured debt instruments to facilitate the issuance by credit institutions of senior 'non-preferred' instruments. Before that, Royal Decree-Law 11/2017, of 23 June, approving urgent measures on financial matters created in Spain the new asset class of senior 'non-preferred' debt.
CRD V Directive and BRRD II were partially implemented into Spanish law through Royal Decree-Law 7/2021, of 27 April, (RDL 7/2021) which amended, amongst others, Law 10/2014 and Law 11/2015, of 18 June, on the Recovery and Resolution of Credit Institutions and Investment Firms (Law 11/2015). Furthermore, Royal Decree 970/2021, of 8 November, amended Royal Decree 84/2015, and Circulars 5/2021 and 3/2022 of the Bank of Spain, amended Circular 2/2016, and completed the implementation into Spanish law of CRDV. In addition, Royal Decree 1041/2021, of 23 November, amended Royal Decree 1012/2015, of 6 November, which implemented Law 11/2015 (Royal Decree 1012/2015) and completed the implementation of BRRD II. Of note, however, is the uncertainty regarding how the EU Banking Reforms will be applied by the relevant authorities.
On 27 October 2021, the European Commission published legislative proposals to amend CRR and the CRD IV, as well as a separate legislative proposal to amend CRR and BRRD in the area of resolution. In particular, the main objectives of the European Commission’s legislative proposals are to strengthen the risk-based capital framework, enhance the focus on environmental, social and governance (ESG) risks in the prudential framework, further harmonise supervisory powers and tools and reduce institutions´ administrative costs related to public disclosures and to improve access to institutions´ prudential data. Moreover, these legislative proposals include the following: (i) a directive of the European Parliament and of the Council amending CRD IV with respect to supervisory powers, sanctions, third-country branches, and environmental, social and governance risks, and amending BRRD; (ii) a regulation of the European Parliament and of the Council and its annex amending CRR with respect to requirements for credit risk, credit valuation
adjustment risk, operational risk, market risk and the output floor; and (iii) a regulation of the European Parliament and of the Council amending CRR and BRRD with respect to the prudential treatment of global systemically important institutions (G-SIIs) with a multiple point of entry resolution strategy and a methodology for the indirect subscription of instruments eligible for meeting the minimum requirement for own funds and eligible liabilities (the so-called 'daisy chains' proposal).
The European Parliament and the Council adopted on 19 October 2022 Regulation (EU) 2022/2036 amending CRR and BRRD, which partially started to apply on 14 November 2022. The timing for the final implementation of these legislative proposals is unclear as of the date of this annual report on Form 20-F and new or amended elements may be introduced through the course of the legislative process. Furthermore, with respect to (i) above, the Directive will need to be implemented in each of the member states, and the way it will be implemented may vary depending on the relevant member state.
In addition, on 18 April 2023, the European Commission adopted a legislative package proposal to adjust and strengthen the EU’s existing bank crisis management and deposit insurance framework (CMDI Proposal), which had been under development for some time and was accelerated in light of recent bank failures. The package contains further amendments to the BRRD, the SRM Regulation and Directive 2014/49/EU of the European Parliament and of the Council on deposit guarantee schemes, which aim at further preserving financial stability, protecting taxpayers and depositors, and supporting the real economy and its competitiveness. As of the date of this report there is a high degree of uncertainty with regards to the adjustments to the CMDI Proposal and when they will be finally implemented in the EU.
Credit institutions, such as the Bank, are required, on a standalone and consolidated basis, to hold a minimum amount of regulatory capital of 8% of risk weighted assets (of which at least 4.5% must be Common Equity Tier 1 (CET1) capital and at least 6% must be Tier 1 capital). In addition to the minimum regulatory capital requirements, the CRD IV also introduced five capital buffer requirements that must be met with CET1 capital: (1) the capital conservation buffer for unexpected losses, requiring additional CET1 of up to 2.5% of total risk weighted assets; (2) the institution-specific counter-cyclical capital buffer (consisting of the weighted average of the counter-cyclical capital buffer rates that apply in the jurisdictions where the relevant credit exposures are located), which may require as much as additional CET1 capital of 2.5% of total risk weighted assets or higher pursuant to the requirements set by the competent authority; (3) the G-SIIs buffer requiring additional CET1 which shall be not less than 1% of risk weighted assets; (4) the other systemically important institutions buffer, which may be as much as 2% of risk weighted assets; and (5) the CET1 systemic risk buffer to prevent systemic or macroprudential risks of at least 1% of risk weighted assets (to be set by the competent authority). Entities are required to comply with the 'combined buffer requirement' (broadly, the combination of the capital conservation buffer, the institution-specific counter-cyclical
845 | ||
| Cross-reference to Form 20-F | Consolidated directors' report | Consolidated financial statements | Supplemental information | |||||||||||||||||
buffer and the higher of (depending on the institution) the systemic risk buffer, the G-SIIs buffer and the other systemically important institutions (O-SII) buffer, in each case as applicable to the institution). In addition, under the current framework, institutions must also comply with an additional capital requirement (Pillar 2) which is annually set for each institution on an individual basis. Under the CRD V, where an institution is subject to a systemic risk buffer, that buffer will be cumulative with the applicable G-SIIs buffer or the other systemically important institution buffer.
While the capital conservation buffer and the G-SII buffer are mandatory, the Bank of Spain has greater discretion in relation to the counter-cyclical capital buffer, the O-SII buffer and the systemic risks buffer. The European Central Bank (ECB) also has the ability to provide certain recommendations in this respect.
As of the date of this report, we are required to maintain a capital conservation buffer of additional CET1 capital of 2.5% of risk weighted assets, a G-SII / O-SII buffer of additional CET1 capital of 1.25% of risk weighted assets and a counter-cyclical capital buffer of additional CET1 capital of 0.3693% of risk weighted assets. Bank of Spain agreed on 13 December 2023 to maintain the counter-cyclical buffer applicable to credit exposures in Spain at 0% for the first quarter of 2024.
Moreover, article 104 of the CRD IV, as implemented by Article 68 of Law 10/2014, and similarly Article 16 of Council Regulation (EU) No 1024/2013 of 15 October 2013 conferring specific tasks on the ECB concerning policies relating to the prudential supervision of credit institutions (the SSM Regulation), also contemplate that in addition to the minimum Pillar 1 capital requirements and any applicable capital buffer, supervisory authorities may impose further Pillar 2 capital requirements to cover other risks, including those risks incurred by the individual institutions due to their activities not considered to be fully captured by the minimum capital requirements under the CRD IV and CRR which should be set according to the specific situation of an institution excluding macroprudential or systemic risks, but including the risks incurred by individual institutions due to their activities (including those reflecting the impact of certain economic and market developments on the risk profile of an individual institution). This may result in the imposition of additional capital requirements on us and/or the Group pursuant to this Pillar 2 framework. Any failure by us and/or the Group to maintain its Pillar 1 minimum regulatory capital ratios and any Pillar 2 additional capital requirements or TLAC/MREL Requirements (as defined below) could result in administrative actions or sanctions (including restrictions on discretionary payments), which, in turn, may have a material adverse impact on our results of operations.
In accordance with articles 104a and b of the CRD V, as implemented in Spain by article 69 and 69bis of Law 10/2014, the institutions specific Pillar 2 capital shall consist of two parts: Pillar 2 requirements and Pillar 2 guidance. Pillar 2 requirements are binding, and breaches can have direct legal consequences for banks, while Pillar 2 guidance is not directly binding and a failure to meet Pillar 2 guidance does not automatically trigger legal action, even though the
ECB expects banks to meet Pillar 2 guidance. Failure to comply with the Pillar 2 guidance is not relevant for the purposes of triggering the automatic restriction of the distribution and calculation of the 'Maximum Distributable Amount' but, in addition to certain other measures, competent authorities are entitled to impose further Pillar 2 capital requirements where an institution repeatedly fails to follow the Pillar 2 capital guidance previously imposed.
Although CRR and CRD V do not require disclosure of the Pillar 2 guidance, the Market Abuse Regulation (MAR) ESMA Guidelines on delay in the disclosure of inside information and interaction with prudential supervision, as amended on 5 January 2022, provide that Pillar 2 guidance may be inside information if, for example, the difference between the Pillar 2 guidance and the institution’s level of capital is not minor and is likely to involve a major reaction by the institution, such as a capital increase; or if the institution’s Pillar 2 guidance is not in line with market expectations. To the extent that Pillar 2 guidance constitutes inside information, it will need to be disclosed pursuant to the obligations applicable to the Bank contained in Regulation (EU) No 596/2014 of 16 April 2014, on market abuse.
The ECB is required to carry out assessments under the CRD IV of the additional Pillar 2 capital requirements at least on an annual basis that may be imposed for each of the European banking institutions subject to the Single Supervisory Mechanism (the SSM) and accordingly requirements may change from year to year. Any additional capital requirement that may be imposed on us and/or the Group by the ECB pursuant to these assessments may require us and/or the Group to hold capital levels similar to, or higher than, those required under the full application of the CRD IV. There can be no assurance that the Group will be able to continue to maintain such capital ratios.
In addition to the above, the EBA published on 19 December 2014 its final guidelines for common procedures and methodologies in respect of its supervisory review and evaluation process, as revised on 18 March 2022 with the aim of implementing the amendments to the CRD V Directive and CRR II and promoting convergence towards best supervisory practices (SREP and the SREP EBA Guidelines). Included in this were the EBA's proposed guidelines for a common approach to determining the amount and composition of additional Pillar 2 capital requirements implemented on 1 January 2016. Under these guidelines, national supervisors must set a composition requirement for the Pillar 2 additional capital requirements to cover certain specified risks of at least 56% CET1 capital and at least 75% Tier 1 capital. Under Article 104(a) of CRD V (implemented into Spanish law by Article 94.6 of Royal Decree 84/2015), EU banks are now allowed to meet Pillar 2 requirements with these minimum proportions of CET1 capital and tier 1 capital.
The SREP EBA Guidelines also contemplate that national supervisors should not set additional capital requirements in respect of risks which are already covered by capital buffer requirements and/or additional macroprudential requirements; and, accordingly, the above 'combined buffer requirement' is in addition to the Pillar 1 and Pillar 2 capital
846 | ||
requirements. Therefore, capital buffers would be the first layer of capital to be eroded pursuant to the applicable stacking order, as set out in the 'Opinion of the EBA on the interaction of Pillar 1, Pillar 2 and combined buffer requirements and restrictions on distributions' published on 16 December 2015. In this regard, under Article 141 of the CRD IV, member states of the EU must require that an institution that fails to meet the 'combined buffer requirement', be prohibited from paying any 'discretionary payments' (which are defined broadly by the CRD IV as payments relating to CET1, variable remuneration and discretionary pension benefits and distributions relating to Additional Tier 1 capital instruments), until it calculates its applicable restrictions and communicates them to the regulator. Thereafter, any such discretionary payments shall be subject to such restrictions. The restrictions shall be scaled according to the extent of the breach of the 'combined buffer requirement' and calculated as a percentage of the profits of the institution since the last distribution of profits or 'discretionary payment'. Such calculation shall result in a Maximum Distributable Amount in each relevant period. As an example, the scaling is such that in the bottom quartile of the 'combined buffer requirement', no 'discretionary distributions' will be permitted to be paid. Articles 43 to 49 of Law 10/2014 and Chapter II of Title II of Royal Decree 84/2015 implement the above provisions in Spain. In particular, Article 48 of Law 10/2014 and Articles 73 and 74 of Royal Decree 84/2014 deal with restrictions on distributions. Furthermore, pursuant to article 16bis of Law 11/2015 and article 48ter of Law 10/2014, the calculation of the Maximum Distributable Amount, as well as consequences of, and pending, such calculation could also take place as a result of the breach of MREL and a breach of the leverage ratio buffer requirement.
CRD V further clarifies that Pillar 2 requirements should be positioned in the relevant stacking order of own funds requirements above the Pillar 1 capital requirements and below the 'combined buffer requirement' or the leverage ratio buffer requirement, as applicable.
We announced on 11 December 2023 that we received the ECB's decision regarding prudential minimum capital requirements effective as of 1 January 2024, following the results of SREP. The ECB's decision establishes a Pillar 2 requirement (P2R) of 1.74% at a consolidated level of which at least 0.98% must be covered with CET1. Accordingly, the minimum CET1 and capital requirements as of 1 January 2024 are 9.60% and 13.86% on a consolidated basis, respectively. As of 31 December 2023, on a consolidated basis, our total capital ratio was 16.39% while our CET1 ratio was 12.30%. If we had not applied the transitory IFRS 9 provisions, nor the subsequent amendments introduced by Regulation 2020/873 of the European Union, the fully-loaded CET1 ratio would have been 12.26%.
In addition to the above, the CRR also contains a binding 3% Tier 1 leverage ratio (LR) requirement, and which institutions must meet in addition and separately to their risk-based requirements.
Moreover, article 92.1a of CRR includes a LR buffer for G-SIIs to be met with Tier 1 capital and set at 50% of the applicable risk weighted G-SIIs buffer and that is in force since 1 January 2023. Pursuant to Article 141b of the CRD IV and Article 48ter of Law 10/2014, G-SIIs are also obliged to determine their Maximum Distributable Amount and restrict discretionary payments where they do not meet the leverage ratio buffer requirement under Article 92.1a of CRR.
Under article 92a of CRR, institutions such as the Bank that are identified as resolution entities and are G-SII shall satisfy the following requirements for own funds and eligible liabilities: (a) 18 per cent of risk weighted assets, and (b) 6.75 per cent of its leverage ratio exposure (the Pillar 1 TLAC/MREL Requirements for G-SIIs). On top of that, Article 45 of the BRRD provides that EU member states shall ensure that institutions meet, at all times, a MREL requirement (TLAC/MREL Requirements). The EU Banking Reforms integrate the TLAC standard into the existing MREL rules and to ensure that both requirements are met with the largely similar instruments, with the exception of the subordination requirement which will be partially institution-specific and determined by the resolution authority. Therefore, institutions such as the Bank could be subject to an institution-specific TLAC/MREL Requirement, which may be higher than the Pillar 1 TLAC/MREL Requirements for G-SIIs.
According to new article 16.a) of the BRRD, any failure by an institution to meet the 'combined buffer requirement' when considered in addition to the applicable minimum TLAC/MREL Requirements is intended to be treated in a similar manner as a failure to meet the 'combined buffer requirement' on top of its minimum regulatory capital requirements (i.e. a resolution authority will have the power to impose restrictions or prohibitions on discretionary payments by the Bank). The referred article 16.a) of BRRD includes a potential nine-month grace period, whereby the resolution authority will assess on a monthly basis whether to exercise its powers, after such nine-month period the resolution authority is compelled to exercise its power to restrict discretionary payments (subject to certain limited exceptions). These restrictions were implemented in Spain by means of article 16bis of Law 11/2015.
On 18 May 2023 we announced that we received a formal notification from the Bank of Spain with our binding minimum MREL requirement, both total and subordinated, for the resolution group of Banco Santander at a sub-consolidated level, as determined by the SRB. The total MREL requirement, which became effective on 1 January 2024, has been set at 29.81% of the resolution group’s total risk weighted assets. The subordination requirement was set at 10.27%. As of 31 December 2023, the structure of own funds and eligible liabilities of the resolution group of Banco Santander met the requirement. Future requirements are subject to ongoing review by the resolution authority.
Additionally, the Basel Committee is currently in the process of reviewing and issuing recommendations in relation to risk asset weightings which may lead to increased regulatory scrutiny of risk asset weightings in the jurisdictions that are members of the Basel Committee.
847 | ||
| Cross-reference to Form 20-F | Consolidated directors' report | Consolidated financial statements | Supplemental information | |||||||||||||||||
In addition to the above, the Group shall also comply with the liquidity coverage ratio (LCR) and the net stable funding ratio (NSFR) requirements provided in CRR. As of 31 December 2023, the Group’s LCR was 166%, above the 100% minimum requirement. In relation to the NSFR, the institutions shall maintain from 28 June 2021 an NSFR (calculated in accordance with Title IV of the CRR) of at least 100%. As of 31 December 2023, the Group's NSFR was 123%, above the 100% minimum requirement.
In this regard, there can be no assurance that the application of the existing regulatory requirements, standards or recommendations will not require us to issue additional securities that qualify as own funds or eligible liabilities, to maintain a greater proportion of its assets in highly-liquid but lower-yielding financial instruments, to liquidate assets, to curtail business or to take any other actions, any of which may have a material adverse effect on the Group's business, results of operations and/or financial position.
EU fiscal and banking union
The project of achieving a European banking union was launched in the summer of 2012. Its main goal is to resume progress towards the European single market for financial services by restoring confidence in the European banking sector and ensuring the proper functioning of monetary policy in the eurozone.
The banking union is expected to be achieved through new harmonized banking rules (the single rulebook) and a new institutional framework with stronger systems for both banking supervision and resolution that will be managed at the European level. Its two main pillars are the SSM and the Single Resolution Mechanism (SRM).
The SSM (comprised by both the ECB and the national competent authorities) is designed to assist in making the banking sector more transparent, unified and safer. In accordance with the SSM Regulation, the ECB fully assumed its new supervisory responsibilities within the SSM, in particular direct supervision of the largest European banks (including us), on 4 November 2014.
The SSM represented a significant change in the approach to bank supervision at a European and global level, and resulted in the direct supervision by the ECB of the largest financial institutions, including us, and indirect supervision of around 3,500 financial institutions and is now one of the largest in the world in terms of assets under supervision. In the coming years, the SSM is expected to continue working on the establishment of a new supervisory culture importing best practices from the 19 national competent authorities that are part of the SSM and promoting a level playing field across participating EU member states. Several steps have already been taken in this regard such as the publication of the Supervisory Guidelines; the approval of the Regulation (EU) No 468/2014 of the ECB of 16 April 2014, establishing the framework for cooperation within the SSM between the ECB and national competent authorities and with national designated authorities (the SSM Framework Regulation); the approval of a Regulation (Regulation (EU) 2016/445 of the European Central Bank of 14 March 2016 on the exercise of
options and discretions available in Union law) and a set of guidelines on the application of CRR's national options and discretions, etc. In addition, the SSM is an extra cost for the financial institutions that are required to fund its operations through payment of supervisory fees.
The other main pillar of the EU banking union is the SRM, the main purpose of which is to ensure a prompt and coherent resolution of failing banks in Europe at minimum cost for the taxpayers and the real economy. The SRM Regulation establishes uniform rules and a uniform procedure for the resolution of credit institutions and certain investment firms in the framework of the SRM and a Single Resolution Fund (SRF). Under the intergovernmental agreement (IGA) signed by 26 EU member states on 21 May 2014, contributions by banks raised at national level were transferred to the SRF. The new Single Resolution Board (SRB), which is the central decision-making body of the SRM, started operating on 1 January 2015 and has fully assumed its resolution powers on 1 January 2016. The SRB is responsible for managing the SRF and its mission is to ensure that credit institutions and other entities under its oversight, which face serious difficulties, are resolved effectively with minimal costs to taxpayers and the real economy. From that date onwards, the SRF is also in place, funded by contributions from European banks in accordance with the methodology approved by the Council of the EU. The Single Resolution Board communicated on 6 July 2023 that the SRF is intended to reach a total amount of EUR 77.6 billion by 2024 and to be used as a separate backstop only after an 8% bail-in of a bank's liabilities has been applied to cover capital shortfalls (in line with the BRRD).
In order to complete such banking union, a single deposit guarantee scheme is still needed, which may require a change to the existing European treaties. This is the subject of continued negotiation by European leaders to ensure further progress is made in European fiscal, economic and political integration.
Regulations adopted towards achieving a banking and/or fiscal union in the EU and decisions adopted by the ECB in its capacity as our main supervisory authority may have a material impact on our business, financial condition and results of operations.
Moreover, regulations adopted on structural measures to improve the resilience of EU credit institutions may have a material impact on our business, financial condition, results of operations and prospects. These regulations, if adopted, may also cause us to invest significant management attention and resources to make any necessary changes.
Global Minimum Tax
On 22 December 2022, the European Commission approved Directive 2022/2523 ensuring a minimum effective tax rate for the global activities of large multinational groups. The Directive follows closely the OECD Inclusive Framework on Base Erosion and Profit Shifting, and should have been transposed by the Member States into domestic law throughout 2023, and should enter into force for fiscal years starting on 1 January 2024. On 19 December 2023, the Spanish Council of Ministers approved in an initial phase the
848 | ||
Draft Law to transpose the European Directive that establishes a global minimum taxation level of 15% for multinational corporations and large national groups. In other relevant countries where the Group is present, the regulation is enacted or substantially enacted (UK and most EU countries). The OECD has supplemented these rules with administrative guidance and a safe harbour document to facilitate their application during the first three years.
Banking Reform in the UK
In accordance with the provisions of the Financial Services (Banking Reform) Act 2013, UK banking groups that hold significant retail deposits (more than £25 billion of 'core deposits'), including Santander UK, were required to separate or ‘ring-fence’ their retail banking activities from their wholesale banking activities by 1 January 2019.
Santander UK completed its ring-fencing plans in advance of the legislative deadline of 1 January 2019. However, given the complexity of the ring-fencing regulatory regime and the material impact on the way Santander UK conducts its business operations in the UK, there is a risk that Santander UK may be found to be in breach of one or more ring-fencing requirements. This might occur, for example, if prohibited business activities are found to be taking place within the ring-fence, mandated retail banking activities are found being carried on in a UK entity outside the ring-fenced part of the group or Santander UK breached a PRA ring-fencing rule. If Santander UK were found to be in breach of any of the ring-fencing requirements placed upon it under the ring-fencing regime, it could be subject to supervisory or enforcement action by the PRA, the consequences of which might include substantial financial penalties, imposition of a suspension or restriction on Santander UK’s activities in the UK or, in the most serious of cases, forced restructuring of the UK group, entitling the PRA (subject to the consent of the UK government) to require the sale of a Santander ring-fenced bank or other parts of the UK group. Following the publication of the final report of the Independent Panel on Ring-Fencing and Proprietary Trading on 15 March 2022, HM Treasury announced its intention to implement certain limited reforms to the ring-fencing regime, including increasing the ring-fencing core deposit threshold from £25 billion to £35 billion, introducing a de-minimis threshold to allow ring-fenced banks to incur an exposure to relevant financial institutions ('RFIs') of up to £100,000 per RFI at any one time, and allowing ring-fenced banks to establish operations outside of the UK or the EEA, have exposure to RFIs that qualify as small and medium-sized enterprises (SMEs) and undertake a wider range of activities such as market standard trade finance activities or inflation swaps. In September 2023, HM Treasury published a consultation on the reforms and drafted secondary legislation which the government intends to lay before Parliament in early 2024. These proposed reforms of the ring-fencing regime may lead to further review or amendment of Santander UK’s operational and compliance arrangements in relation to the regime.
United States significant regulation
The financial services industry continues to experience significant financial regulatory reform in the United States, including from capital, leverage, funding, liquidity, and tax regulation, fiscal and monetary policies established by central banks and financial regulators, changes to global trade policies, and other legal and regulatory actions. Many
of these reforms significantly affected and continue to affect our revenues, costs and organizational structure in the United States and the scope of our permitted activities. We continue to monitor the changing political, tax and regulatory environment in the United States. We believe that it is likely that there will be further material changes in the way major financial institutions like us are regulated in the United States. The scope of regulation and the intensity of supervision will likely remain higher under the Biden Administration, including increased scrutiny and supervision by our regulators. Although it remains difficult to predict the exact impact these changes will have on our business, financial condition, results of operations and cash flows for a particular future period, further reforms could result in fines, loss of revenue, higher compliance costs, additional limits on our activities, constraints on our ability to enter into new businesses and other adverse effects on our businesses.
The full spectrum of risks that result from pending or future US financial services legislation or regulations cannot be fully known; however, such risks could be material and we could be materially and adversely affected by them. See section 10.'Supervision and regulation' for a summary of certain significant US financial regulations applicable to our business.
Enhanced prudential standards
As a large foreign banking organization ('FBO') with significant US operations, we are subject to enhanced prudential standards that require Banco Santander to, among other things, establish or designate a US intermediate holding company (an 'IHC') and to hold its entire ownership interest in substantially all of its US subsidiaries under such IHC. The Bank designated its wholly-owned subsidiary, Santander Holdings USA, as its US IHC. As a US IHC, Santander Holdings USA is subject to an enhanced supervision framework that includes enhanced risk-based and leverage capital requirements, liquidity requirements, risk management and governance requirements, stress-testing and capital planning requirements, and resolution planning requirements. Collectively, the enhanced prudential standards impose a significant regulatory burden on Santander Holdings USA, in particular with respect to capital and liquidity, which could limit its ability to distribute capital and liquidity to the Bank, thereby negatively affecting the Bank.
Banco Santander is classified as a Category IV FBO, and Santander Holdings USA is classified as a Category IV IHC, though this categorization may change depending on the scope and composition of our activities. Category IV institutions are subject to the least exacting level of enhanced prudential standards. Both Banco Santander and Santander Holdings USA are now generally subject to less restrictive enhanced prudential standards and capital and liquidity requirements than under previously applicable regulations, as described in more detail in the relevant sections below.
Resolution planning
We are required to prepare and submit periodically to the Federal Reserve Board and the Federal Deposit Insurance Corporation ('FDIC') a plan, commonly called a living will (the '165(d) plan'), for the orderly resolution of our subsidiaries
849 | ||
| Cross-reference to Form 20-F | Consolidated directors' report | Consolidated financial statements | Supplemental information | |||||||||||||||||
and operations that are domiciled in the United States in the event of future material financial distress or failure. We, on behalf of our insured depository institution ('IDI') subsidiary, Santander Bank, N.A. ('Santander Bank'), must also submit a separate IDI resolution plan ('IDI plan') to the FDIC. The 165(d) plan and the IDI plan require substantial effort, time and cost to prepare and are subject to review by the Federal Reserve Board and the FDIC, in the case of the 165(d) plan, and by the FDIC only, in the case of the IDI plan. If, after reviewing our 165(d) plan and any related re-submissions, the Federal Reserve Board and the FDIC jointly determine that we failed to cure identified deficiencies, they may jointly impose on our US operations more stringent capital, leverage or liquidity requirements, or restrictions on our growth, activities or operations, or even divestitures, which could have an adverse effect on our business. Banco Santander filed its most recent 165(d) plan on 30 June 2022, and its most recent IDI plan on 28 June 2018. As a result of the Economic Growth, Regulatory Relief, and Consumer Protection Act and following changes to applicable regulations, Banco Santander is now a triennial reduced filer that is required to submit its next 165(d) plan in the form of a reduced resolution plan by 1 July 2025. With respect to our IDI plan, the FDIC announced in November 2018 that the agency planned to revise the IDI plan rule and that the next IDI plan submissions would not be required until the rulemaking process was complete. While the FDIC lifted this moratorium in January 2021 for IDIs with USD100 billion or more in assets under the IDI rule, the moratorium remains in place for covered IDIs below this asset threshold. In August 2023, the FDIC released a proposal to amend the IDI plan rule. Under the proposal, IDIs with USD100 billion or more in assets would be required to submit an IDI plan and IDIs with more than USD 50 billion, but less than USD100 billion, would not be required to submit an IDI plan but instead, they would be required to submit an informational filing intended to support the development of strategic options for resolution of the IDI by the FDIC.
Banco Santander will continue to monitor developments related to the FDIC’s proposed IDI rule and will assess the impacts of the proposal on its operations.
OTC derivatives regulation
Title VII of the Dodd-Frank Act amended the US Commodity Exchange Act and the Exchange Act, among other statutes, to establish an extensive framework for the regulation of over-the-counter ('OTC') derivatives, including mandatory clearing of certain standardized OTC derivatives and the trading of such instruments through regulated trading venues, subject to exceptions, and transaction reporting. In addition, Title VII requires the registration of swap dealers and major swap participants with the Commodity Futures Trading Commission ('CFTC') and of security-based swap dealers and major security-based swap participants with the SEC, and requires the CFTC and SEC to adopt regulations imposing capital, margin, business conduct, record keeping and other requirements on such entities. The CFTC and the SEC have completed the majority of their regulations in this area, which are generally in effect. Banco Santander is registered as a non-US swap dealer with the CFTC and registered as a non-US security-based swap dealer with the SEC.
These rules, and similar rules being considered by regulators in other jurisdictions that may also apply to us, and the potential conflicts and inconsistencies between them, increase our costs for engaging in swaps and other derivatives activities and present compliance challenges.
Volcker Rule
Section 13 of Bank Holding Company Act and its implementing rules (collectively, the 'Volcker Rule') prohibits 'banking entities' from engaging in certain forms of proprietary trading or from sponsoring, or investing in 'covered funds,' in each case subject to certain exceptions. The Volcker Rule also limits the ability of banking entities and their affiliates to enter into certain transactions with covered funds with which they or their affiliates have certain relationships. Banking entities such as Banco Santander were required to bring their activities and investments into compliance with the requirements of the Volcker Rule by the end of the conformance period applicable to each requirement. Banco Santander has assessed how the Volcker Rule affects its businesses and subsidiaries, and has brought its activities into compliance. Banco Santander has adopted processes to establish, maintain, enforce, review and test the compliance program designed to achieve and maintain compliance with the Volcker Rule. The Volcker Rule contains exclusions and certain exemptions for market-making, hedging, underwriting, trading in US government and agency obligations and certain foreign government obligations, and trading solely outside the United States, and also permits certain ownership interests in certain types of funds to be retained.
Banco Santander will continue to monitor Volcker Rule-related developments and assess their impact on its operations, as necessary.
United States Capital, Liquidity and Related Requirements and Supervisory Actions
As a US IHC and bank holding company, Santander Holdings USA is subject to the US Basel III capital rules, which implement in the United States the capital components of the Basel Committee’s international capital and liquidity standards known as Basel III. Under the Tailoring Rules, Santander Holdings USA is not subject to the liquidity coverage ratio ('LCR') or the net stable funding ratio ('NSFR') requirements, since it is a Category IV IHC with less than USD 50 billion in weighted short-term wholesale funding.
In July 2023, the US federal banking agencies proposed significant amendments to the Basel III capital rules that would apply to Santander Holdings USA and Santander Bank. The proposed rule generally would require Category I-IV banking organizations, including Santander Holdings USA and Santander, to calculate risk-weighted assets under both the current standardized approach and a new, more risk sensitive, approach referred to as the 'Expanded Risk-Based Approach.' Total risk-weighted assets under the Expanded Risk-Based Approach would include standardized approaches for credit risk, operational risk and credit evaluation adjustment risk, as well as a new approach for market risk that would be based on internal models and standardized supervisory models. Under the proposal, Santander Holdings
850 | ||
USA and Santander Bank would be subject to the lower of the two resulting capital ratios from the current standardized approach and the Expanded Risk-Based Approach. The proposal, if enacted would have an effective date of 1 July 2025, with certain elements having a three-year phase-in period.
Banco Santander will continue to monitor developments related to the proposed amendments to the Basel III capital rules and will assess the impacts of the proposal on its operations.
Total Loss-Absorbing Capacity and Long-Term Debt requirements
In addition to the above-mentioned capital and liquidity requirements, Santander Holdings USA is subject to the Federal Reserve Board’s final rule implementing the FSB’s international Total Loss Absorbing Capital ('TLAC') standard, which establishes certain TLAC, long-term debt ('LTD') and clean holding company requirements for US IHCs of non-US G-SIIs, including Santander Holdings USA. Santander Holdings USA is compliant with all applicable requirements. Compliance with the final TLAC rule has resulted in increased funding expenses for Santander Holdings USA and, indirectly, the Bank.
In August 2023, the US federal banking agencies released a proposal that would require certain US and foreign banking organizations to issue and maintain long-term debt and clean holding company requirements to improve resolvability (the 'Proposed LTD rule'). The Proposed LTD rule would apply these requirements to IDIs with USD100 billion or more in total consolidated assets (excluding IDIs of U.S. G-SIIs). Santander Bank's total consolidated assets have fluctuated above and below USD100 billion and therefore Santander Bank may become subject to the Proposed LTD rule when the rule becomes final. Although Santander Holdings USA is already subject to TLAC, LTD and clean holding company requirements as an IHC of a non-US G-SII, the Proposed LTD rule may still affect Santander Holdings USA by, for example, reducing the amount of LTD with remaining maturities of less than two years that counts toward Santander Holdings USA’s TLAC requirement.
Banco Santander will continue to monitor developments related to the Proposed LTD Rule and will assess the impacts of the proposal on its operations.
Stress testing and capital planning
Certain of our US subsidiaries, including Santander Holdings USA, are subject to supervisory stress testing and capital planning requirements in the United States. The Federal Reserve Board expects companies subject to stress testing and capital planning processes, such as Santander Holdings USA, to have sufficient capital to withstand a highly adverse operating environment and to be able to continue operations, maintain ready access to funding, meet obligations to creditors and counterparties, and serve as credit intermediaries. In addition, the Federal Reserve Board evaluates the planned capital actions of these bank holding companies, including planned capital distributions such as dividend payments or stock repurchases.
As a Category IV IHC under the Tailoring Rules, Santander Holdings USA is required to submit a capital plan to the Federal Reserve on an annual basis. Santander Holdings USA is also subject to supervisory stress testing on a two-year cycle. Banco Santander continues to evaluate planned capital actions in its annual capital plan and on an ongoing basis.
Under the Federal Reserve Board's Stress Capital Buffer ('SCB') rule, the Federal Reserve Board uses the results of its supervisory stress test and a firm's planned common dividends to establish the size of a firm’s SCB requirement, subject to a floor of 2.5 percent. Santander Holdings USA must maintain capital ratios above the sum of the minimum capital requirements and any applicable capital buffers, including the SCB, in order to avoid restrictions on the distribution of capital, including in the form of dividends or share repurchases. Santander Holdings USA’s SCB for the period between 1 October 2023 and 30 September 2024 is 2.5%, resulting in a total CET1 capital requirement of 7.0%. This amount could increase in future years based on the results of the Federal Reserve Board’s periodic supervisory stress tests and capital planning requirements applicable to Santander Holdings USA.
Single counterparty credit limits
The US operations of the Bank are subject to single counterparty credit limits, which impose percentage limitations on net credit exposures to individual counterparties (aggregated based on affiliation), generally as a percentage of tier 1 capital. Under the amendments to the US single counterparty credit limits rule made by the Tailoring Rules, Santander Holdings USA is not subject to the single counterparty credit limits rule at the IHC level. In addition, although the Bank remains subject to the US single counterparty credit limit rules with respect to its US operations, it has elected to use substituted compliance by certifying that it complies with its home-country single counterparty credit limits, instead of separately complying with the Federal Reserve Board's implementation of these requirements.
Other supervisory actions and restrictions on US activities
In addition to the foregoing, US bank regulatory agencies from time to time take supervisory actions under certain circumstances that restrict or limit a financial institution’s activities. In some instances, we are subject to significant legal restrictions on our ability to publicly disclose these actions or the full details of these actions. Furthermore, as part of the regular examination process, US banking regulators may advise our US banking subsidiaries to operate under various restrictions as a prudential matter. Currently, under the US Bank Holding Company Act, we and our US banking and bank holding company subsidiaries may not be able to engage in certain categories of new activities in the US or acquire shares or control of other companies in the US. Any such actions or restrictions, if and in whatever manner imposed, could adversely affect our costs and revenues. Moreover, efforts to comply with non-public supervisory actions or restrictions could require material investments in additional resources and systems, as well as a significant commitment of managerial time and attention. As a result, such supervisory actions or restrictions could have a material
851 | ||
| Cross-reference to Form 20-F | Consolidated directors' report | Consolidated financial statements | Supplemental information | |||||||||||||||||
adverse effect on our business and results of operations; and we may be subject to significant legal restrictions on our ability to publicly disclose these matters or the full details of these actions.
In addition to such confidential actions and restrictions, we may from time to time be subject to public supervisory actions in the United States. For example, in March 2017, Santander Holdings USA and SCUSA entered into a written agreement with the Federal Reserve Bank of Boston ('FRB Boston') pursuant to which Santander Holdings USA and SCUSA agreed to submit written plans acceptable to the FRB Boston to strengthen board oversight of the management and operations of SCUSA and to strengthen board and senior management oversight of SCUSA’s risk management program, SCUSA agreed to submit a written revised compliance risk management program acceptable to the FRB Boston and Santander Holdings USA agreed to submit written revisions to its firm-wide internal audit program of SCUSA’s compliance risk management program. The written agreement between Santander Holdings USA, SCUSA and the FRB Boston dated 21 March 2017 was terminated on 2 February 2021.
Anti-Money Laundering and economic sanctions
A major focus of US, UK and EU governmental policy relating to financial institutions is aimed at preventing money laundering and terrorist financing. In the US, the Bank Secrecy Act, as amended by the USA PATRIOT Act of 2001 and the Anti-Money Laundering Act of 2021, contains provisions intended to detect and prevent the use of the US financial system for money laundering and terrorist financing activities. Under the Bank Secrecy Act, US financial institutions, including US branches and subsidiaries of non-US banks, are required to, among other things, maintain an anti-money laundering ('AML') program, verify the identity of clients, identify and verify the beneficial owners of certain legal entity clients, conduct ongoing customer due diligence, monitor for and report suspicious transactions, report on cash transactions exceeding specified thresholds, and respond to requests for information by regulatory authorities and law enforcement agencies. The Financial Crimes Enforcement Network of the US Department of the Treasury and US federal and state bank regulatory agencies, as well as the US Department of Justice, have the authority to impose significant civil money penalties for violations of those requirements. Similar approaches to preventing money laundering exist in the UK and the EU through their own respective competent authorities on anti-money laundering/countering the financing of terrorism ('AML/CFT').
There is also scrutiny of compliance with applicable US, UK and EU economic sanctions against certain foreign countries, governments, individuals and entities to counter threats to respective US, UK or EU national security, foreign policy, or the economy. In the US, economic sanctions are administered by the Office of Foreign Assets Control ('OFAC') of the US Department of the Treasury. OFAC-administered sanctions take many different forms. For example, sanctions may include: (1) restrictions on US persons’ trade with or investment in a sanctioned country, including prohibitions against direct or indirect imports from and exports to a
sanctioned country and prohibitions on US persons engaging in financial transactions relating to, making investments in, or providing investment-related advice or assistance to, a sanctioned country; and (2) blocking of assets of targeted governments or 'specially designated nationals,' by prohibiting transfers of property subject to US jurisdiction, including property in the possession or control of US persons. Blocked assets, such as property and bank deposits, cannot be paid out, withdrawn, set off or transferred in any manner without a license from OFAC. In addition, non-US persons can be liable for 'causing' a sanctions violation by a US person or can violate US sanctions by exporting services from the United States to a sanctions target, for example by engaging in transactions with targets of US sanctions denominated in US dollars that clear through US financial institutions (including through US branches or subsidiaries of non-US banks). In addition, the US government has imposed various sanctions that prevent non-US persons, including non-US financial institutions, from engaging in certain activities undertaken outside the United States and without the involvement of any US persons ('secondary sanctions'). If a non-US financial institution were determined to have engaged in activities targeted by certain US secondary sanctions, it could lose its ability to open or maintain correspondent or similar accounts with US financial institutions, among other potential consequences.
Failures to comply with applicable US, UK or EU AML laws or regulations or economic sanctions could have severe legal and reputational consequences, including significant civil and criminal penalties, and certain AML violations could result in a termination of banking licenses. The lack of certainty on possible requirements arising from any new AML laws or sanctions could pose risks given the possible penalties for financial crime compliance failings. If such penalties are incurred, then they could have a material adverse effect on our operations, financial condition and prospects. In addition, US regulators have taken actions against non-US bank holding companies requiring them to improve their oversight of their US subsidiaries’ Bank Secrecy Act programs and compliance. Further, US federal banking agencies are required, when reviewing bank and bank holding company acquisition or merger applications, to take into account the effectiveness of the AML compliance record of the applicant. See also section 10.'Supervision and Regulation'.
Data privacy and cybersecurity
We receive, maintain, transmit, store and otherwise process proprietary, sensitive and confidential data, including public and non-public personal information of our customers, employees, counterparties and other third parties, including, but not limited to, personally identifiable information and personal financial information. The collection, sharing, use, retention, disclosure, protection, transfer and other processing of this information is governed by stringent federal, state, local and foreign laws, rules, regulations and standards, and the regulatory framework for data privacy and cybersecurity is in considerable flux and evolving rapidly. As data privacy and cybersecurity risks for banking organizations and the broader financial system have significantly increased in recent years, data privacy and cybersecurity issues have
852 | ||
become the subject of increasing legislative and regulatory focus. Internationally, virtually every jurisdiction in which we operate has established its own data privacy and cybersecurity legal framework with which we must comply. For example, on 25 May 2018, the Regulation (EU) 2016/279 of the European Parliament and of the Council of 27 April 2016, on the protection of natural persons with regard to the processing of personal data and on the free movement of such data (the 'General Data Protection Regulation' or 'GDPR') became directly applicable in all member states of the EU. To align the Spanish legal regime with the GDPR, Spain enacted the Organic Law 3/2018, of 5 December, on Data Protection and the safeguarding of digital rights which repealed the Spanish Organic Law 15/1999, of 13 December, on Data Protection. Additionally, following the UK’s withdrawal from the EU, we also are subject to the UK General Data Protection Regulation ('UK GDPR') (i.e., a version of the GDPR as implemented into UK law). Although a number of basic existing principles have remained the same, the GDPR and UK GDPR introduced extensive new obligations on both data controllers and processors, as well as rights for data subjects. The GDPR and UK GDPR, together with national legislation, regulations and guidelines of the EU member states governing the processing of personal data, impose strict obligations and restrictions on the ability to collect, use, retain, protect, disclose, transfer and otherwise process personal data. In particular, the GDPR and UK GDPR include obligations and restrictions concerning the security and confidentiality of personal data, such as obtaining consent from the individuals to whom the personal data relates for certain processing activities, using safeguards on transfers of personal data out of the EEA and the UK, respectively, and making notifications with respect to certain security breaches, among others. The GDPR and UK GDPR also impose significant fines and penalties for non-compliance of up to the higher of 4% of annual worldwide turnover or EUR 20 million (or GBP 17.5 million under the UK GDPR) and, for other specified infringements, fines and penalties of up to the higher of 2% of annual worldwide turnover or EUR 10 million (or GBP 8.7 million under UK GDPR). European data protection authorities have already imposed fines for GDPR violations up to, in some cases, hundreds of millions of euros. While the UK GDPR currently imposes substantially the same obligations as the GDPR, the UK GDPR will not automatically incorporate changes to the GDPR going forward (which would need to be specifically incorporated by the UK government). Moreover, the UK government has publicly announced plans to reform the UK GDPR in ways that, if formalized, are likely to deviate from the GDPR, all of which creates a risk of divergent parallel regimes and related uncertainty, along with the potential for increased compliance costs and risks for affected businesses.
The implementation of the GDPR, UK GDPR and other data protection regimes has required substantial amendments to our procedures and policies. The changes have impacted, and could further adversely impact, our business by increasing our operational and compliance costs. We expect the number of jurisdictions adopting their own data privacy and cybersecurity laws to increase, which will likely require us to devote additional significant operational resources for our
compliance efforts and incur additional significant expenses. This legal environment is also likely to increase our exposure to risk of claims alleging non-compliance with all applicable data privacy and cybersecurity laws, rules, regulations and standards.
Recent legal developments in the EEA, including recent rulings from the Court of Justice of the European Union and from various EU member state data protection authorities, have created complexity and uncertainty regarding transfers of personal data from the EEA to the United States and other so-called third countries outside the EEA. While we have taken steps to mitigate the impact on us, such as implementing the SCCs, the efficacy and longevity of these mechanisms remain uncertain. Although the UK currently has an adequacy decision from the European Commission, such that SCCs are not required for the transfer of personal data from the EEA to the UK, that decision will sunset on 27 June 2025 unless extended and it may be revoked in the future by the European Commission if the UK data protection regime is reformed in ways that deviate substantially from the GDPR. Adding further complexity for international data transfers, in March 2022, the UK adopted its own International Data Transfer Agreement for transfers of personal data out of the UK to so-called third countries, as well as an international data transfer addendum that can be used with the SCCs for the same purpose. Moreover, on 10 July 2023, the European Commission adopted an adequacy decision concluding that the US ensures an adequate level of protection for personal data transferred from the EEA to the US under the EU-U.S. Data Privacy Framework (followed on 12 October 2023, with the adoption of an adequacy decision in the UK for the UK-US Data Bridge). However, the adequacy decision does not foreclose, and is likely to face, future legal challenges and the ongoing legal uncertainty may increase our costs and our ability to efficiently process personal data from the EEA or the UK. In addition to the ongoing legal uncertainty with respect to data transfers from the EEA or the UK, additional costs may need to be incurred in order to implement necessary safeguards to comply with the GDPR and the UK GDPR and potential new rules and restrictions on the flow of data across borders could increase the cost and complexity of conducting business in some markets. If our policies and practices or those of our vendors are, or are perceived to be, insufficient, or if our users have concerns regarding the transfer of data from the EEA or the UK to the US, we could be subject to enforcement actions or investigations by individual EU or UK data protection authorities or lawsuits by private parties.
Additionally, the EU adopted Regulation (EU) 2022/2554, or the Digital Operational Resilience Act (‘DORA’), in November 2022, which will be effective from 17 January 2025. DORA, which will apply as lex specialis for the financial sector regarding cybersecurity, aims to achieve a common level of digital operational resilience as well as consolidate and upgrade existing Information Communication Technologies ('ICT') risk requirements that had been addressed separately in different regulations and directives, such as Directive (EU) 2022/2555 (otherwise known as the NIS 2 Directive). DORA establishes a set of uniform requirements for network and
853 | ||
| Cross-reference to Form 20-F | Consolidated directors' report | Consolidated financial statements | Supplemental information | |||||||||||||||||
information systems security structured in five pillars: (i) ICT risk management and governance, (ii) ICT-related incident management, classification and reporting, (iii) digital operational resilience testing, (iv) management of third-party ICT risk, and (v) information and intelligence sharing. The financial sector faces risks and uncertainties regarding the implementation of DORA given that it has stringent compliance timelines and its technical standards are still under public consultation (final version of the standards expected by July 2024).
While we have taken steps to mitigate the impact of such complexities and uncertainties on us by implementing supplementary measures in accordance with the applicable laws and regulations, the efficacy and longevity of these mechanisms remain uncertain due to the fast-moving regulatory environment.
In the United States, there are numerous federal, state and local data privacy and cybersecurity laws, rules, regulations and standards governing the collection, sharing, use, retention, disclosure, protection, transfer and other processing of personal information, including federal and state data privacy laws, data breach notification laws and data disposal laws. For example, at the federal level, among other laws, rules, regulations and standards, we are subject to the Gramm-Leach-Bliley Act ('GLBA'), which requires financial institutions to, among other things, periodically disclose their privacy policies and practices relating to sharing non-public personal information and enables retail customers to opt out of our ability to share such personal information with unaffiliated third parties under certain circumstances. The GLBA also requires financial institutions to implement a comprehensive information security program that includes administrative, technical and physical safeguards to ensure the security and confidentiality of customer records and information. Like other lenders, Santander Bank and other of our US subsidiaries also use credit bureau data in their underwriting activities, and the use of such data is regulated under the Fair Credit Reporting Act ('FCRA'). Santander Bank and our US subsidiaries are also subject to the rules and regulations promulgated under the authority of the Federal Trade Commission, which regulates unfair or deceptive acts or practices, including with respect to data privacy and cybersecurity. Further, in the spring of 2022, federal banking regulators imposed a new cybersecurity-related notification rule that requires banking organizations to notify their primary federal regulator as soon as possible and within 36 hours of incidents that, among other things, have materially disrupted or degraded, or are reasonably likely to materially disrupt or degrade, the banking organization’s ability to deliver services to a material portion of its customer base, jeopardize the key viability of key operations of the banking organization, or impact the stability of the financial sector. The rule also imposes requirements on bank service providers to notify their affected banking organization customers of certain computer-security incidents. Moreover, the United States Congress has recently considered, and is currently considering, various proposals for more comprehensive data privacy and cybersecurity legislation, to which we and our US subsidiaries may be
subject if passed. There also has been increasing regulatory scrutiny from the SEC with respect to adequately disclosing risks concerning cybersecurity and data privacy, which increases the risk of investigations into the cybersecurity practices, and related disclosures, of companies within its jurisdiction, which at a minimum can result in distraction of management and diversion of resources for targeted businesses.
Data privacy and cybersecurity are also areas of increasing state legislative focus, and states are increasingly proposing or enacting legislation that relates to data privacy and cybersecurity. For example, the California Consumer Privacy Act, as amended by the California Privacy Rights Act (collectively, ‘CCPA’), gives California residents the right to, among other things, request disclosure of personal information collected about them, and whether that information has been sold or shared with others, the right to request deletion of personal information (subject to certain exceptions), the right to opt out of the sale of their personal information, and the right not to be discriminated against for exercising their rights. Other states where we do business, or may in the future do business, or from which we otherwise collect, or may in the future otherwise collect, personal information of residents have enacted, or are considering enacting, comprehensive data privacy and cybersecurity laws that share similarities with the CCPA. These state statutes, and other similar state or federal laws that may be enacted in the future, may require us to modify our data processing practices and policies, incur substantial compliance-related costs and expenses, and otherwise suffer adverse impacts on our business. In addition, laws in all 50 US states generally require businesses to provide notice under certain circumstances to consumers whose personal information has been disclosed as a result of a data breach, and we may be required to report events related to data privacy or cybersecurity issues, events where customer information may be compromised, unauthorized access to our systems and other security breaches, to affected individuals or the relevant regulatory authorities. These laws are not consistent, and compliance in the event of a widespread data breach is difficult and may be costly.
Additionally, our New York branch is supervised by the New York State Department of Financial Services ('NYDFS'). The NYDFS issued Cybersecurity Requirements for Financial Services Companies, which took effect in 2017 and was recently amended, and which require banks, insurance companies and other financial services institutions regulated by the NYDFS to establish and maintain a cybersecurity program designed to protect consumers and ensure the safety and soundness of New York State’s financial services industry. The cybersecurity regulation includes specific requirements for these institutions’ cybersecurity compliance programs and imposes an obligation to conduct ongoing, comprehensive risk assessments. Further, on an annual basis, each institution is required to submit a certification of compliance with these requirements.
Data privacy and cybersecurity laws, rules, regulations and standards continue to evolve and may result in ever-increasing public scrutiny and escalating levels of
854 | ||
enforcement and sanctions. We may become subject to new legislation, regulations, rules or standards concerning data privacy or cybersecurity, which could require us to incur significant additional costs and expenses in order to comply. We could also be adversely affected if such new legislation, regulations, rules or standards are adopted or if existing legislation, regulations, rules or standards are modified or interpreted such that we are required to alter our systems, business practices, processes or privacy policies. If cybersecurity, data privacy, data protection, data transfer or data retention laws, rules, regulations or standards are implemented, interpreted or applied in a manner inconsistent with our current practices or policies, or if we fail to comply (or are perceived to have failed to comply) with applicable laws, rules, regulations and standards relating to data privacy and cybersecurity, we may be subject to substantial fines, civil or criminal penalties, costly litigation (including class actions), claims, proceedings, judgments, awards, penalties, sanctions, regulatory enforcement actions, government investigations or inquiries, or other adverse impacts, or be ordered to change our business practices, policies or systems in a manner that adversely impacts our operating results, any of which could have a material adverse effect on our operating results, financial condition and prospects.
Artificial intelligence ('AI')
We utilize, and are continuing to explore further uses of, AI in connection with our business, products and services. However, regulation of AI is rapidly evolving worldwide as legislators and regulators are increasingly focused on these powerful emerging technologies. The technologies underlying AI and its uses are subject to a variety of laws and regulations, including intellectual property, privacy, data protection and information security, consumer protection, competition, and equal opportunity laws, and are expected to be subject to increased regulation and new laws or new applications of existing laws and regulations. AI is the subject of ongoing review by various US governmental and regulatory agencies, and various US states and other foreign jurisdictions are applying, or are considering applying, their platform moderation, cybersecurity, and data protection laws and regulations to AI or are considering legal frameworks for AI.
For example, in Europe, on 8 December 2023, the Council of the European Union, European Parliament and European Commission reached provisional agreement on a revised draft of the Artificial Intelligence Act ('AI Act') which is currently expected to be enacted in early 2024. The current draft of the AI Act, if enacted, would establish a risk-based governance framework for regulating AI systems operating in the EU market. This framework would categorize AI systems based on the risks associated with such AI systems’ intended purposes as creating “unacceptable”, “high” or “limited” risks. While the AI Act has not been enacted or enforced, there is a risk that our current or future AI-powered software or applications may be categorized as certain risk categories that may obligate us to comply with the applicable requirements of the AI Act, which may impose additional costs on us, increase our risk of liability, or adversely affect our business. For example, “high” risk AI systems are
required, among other things, to implement and maintain certain risk and quality management systems, conduct certain conformity and risk assessments, use appropriate data governance and management practices, including in development and training, and meet certain standards related to testing, technical robustness, transparency, human oversight, and cybersecurity. Even if our current AI-powered software or applications are not categorized as “high” risk AI systems, we may be subject to additional transparency and other obligations for “limited” risk AI systems. The AI Act sets forth certain penalties, including fines of up to the greater of EUR 35 million or 7% of worldwide annual turnover for the prior year for violations related to offering prohibited AI systems or data governance, fines of up to the greater of EUR 15 million or 3% of worldwide annual turnover for the prior year for violations related to the requirements for “high” risk AI systems, and fines of up to the greater of EUR 7.5 million or 1.5% of worldwide annual turnover for the prior year for violations related to supplying incorrect, incomplete or misleading information to EU and member state authorities. If enacted in this form or a similar form, this regulatory framework is expected to have a material impact on the way AI is regulated in the EU (and, potentially, globally), together with developing guidance and decisions in this area.
We may not be able to anticipate how to respond to these rapidly evolving laws and regulations, and we may need to expend resources to adjust our offerings in certain jurisdictions if the legal and regulatory frameworks are inconsistent across jurisdictions. Furthermore, because AI technology itself is highly complex and rapidly developing, it is not possible to predict all of the legal or regulatory risks that may arise relating to the use of AI. If laws and regulations relating to AI are implemented, interpreted or applied in a manner inconsistent with our current practices or policies, such laws and regulations may adversely affect our use of AI and our ability to provide and to improve our services, require additional compliance measures and changes to our operations and processes, result in increased compliance costs and potential increases in civil claims against us, any of which could adversely affect our operating results, financial condition and prospects.
2.1.3 We are subject to potential action by any of our regulators or supervisors, particularly in response to customer complaints.
As noted above, our business and operations are subject to increasingly significant rules and regulations that are required to conduct banking and financial services business. These apply to business operations, affect financial returns, include reserve and reporting requirements, and prudential and conduct of business regulations. These requirements are set by the relevant central banks and regulatory authorities that authorize, regulate and supervise us in the jurisdictions in which we operate.
In their supervisory roles, the regulators seek to maintain the safety and soundness of financial institutions with the aim of strengthening the protection of customers and the financial system. The supervisors’ continuing supervision of financial institutions is conducted through a variety of regulatory tools,
855 | ||
| Cross-reference to Form 20-F | Consolidated directors' report | Consolidated financial statements | Supplemental information | |||||||||||||||||
including the collection of information by way of prudential returns, reports obtained from skilled persons, visits to firms and regular meetings with management to discuss issues such as performance, risk management and strategy. In general, these regulators have a more outcome-focused regulatory approach that involves more proactive enforcement and more punitive penalties for infringement. As a result, we face increased supervisory scrutiny (resulting in increasing internal compliance costs and supervision fees), and in the event of a breach of our regulatory obligations we are likely to face more stringent regulatory fines. Some of the regulators, particularly the CFPB under the Biden administration, are focusing intently on consumer protection and on conduct risk and will continue to do so. This has included a focus on the design and operation of products, the behaviour of customers and the operation of markets. Such a focus could result, for example, in pricing regulations that could restrict our ability to charge certain levels of interest in credit transactions or in regulation that would prevent us from bundling products that we offer to our customers. Some of the laws in the relevant jurisdictions in which we operate, give the regulators the power to make temporary product intervention rules either to improve a firm’s systems and controls in relation to product design, product management and implementation, or to address problems identified with financial products. These problems may potentially cause significant detriment to consumers because of certain product features or governance flaws or distribution strategies. Such rules may prevent institutions from entering into product agreements with customers until such problems have been solved. Some of the regulatory regimes in the relevant jurisdictions in which we operate, require us to be in compliance across all aspects of our business, including the training, authorization and supervision of personnel, systems, processes and documentation. If we fail to comply with the relevant regulations, there would be a risk of an adverse impact on our business from sanctions, fines or other actions imposed by the regulatory authorities. Customers of financial services institutions, including our customers, may seek redress if they consider that they have suffered loss as a result of the mis-selling of a particular product, or through incorrect application of the terms and conditions of a particular product. Given the inherent unpredictability of litigation and the evolution of judgements by the relevant authorities, it is possible that an adverse outcome in some matters could harm our reputation or have a material adverse effect on our operating results, financial condition and prospects arising from any penalties imposed or compensation awarded, together with the costs of defending such an action, thereby reducing our profitability.
2.1.4 We are subject to review by tax authorities, and an incorrect interpretation by us of tax laws and regulations may have a material adverse effect on us.
The preparation of our tax returns requires the use of estimates and interpretations of complex tax laws and regulations and is subject to review by tax authorities. We are subject to the income tax laws of Spain and the other jurisdictions in which we operate. These tax laws are complex and subject to different interpretations by the taxpayer and relevant governmental tax authorities, which are sometimes
subject to prolonged evaluation periods until a final resolution is reached. In establishing a provision for income tax expense and filing returns, we must make judgements and interpretations about the application of these inherently complex tax laws. If the judgement, estimates and assumptions we use in preparing our tax returns are subsequently found to be incorrect, there could be a material adverse effect on our results of operations. In some jurisdictions, the interpretations of the tax authorities are unpredictable and frequently involve litigation, which introduces further uncertainty and risk as to tax expense.
2.1.5 We may not be able to detect or prevent money laundering and other financial crime activities fully or on a timely basis, which could expose us to additional liability and could have a material adverse effect on us.
We are required to comply with applicable AML/CFT, anti-bribery and corruption, sanctions and other laws and regulations (collectively, financial crime compliance ('FCC') regulations). These laws and regulations require us, among other things, to conduct full customer due diligence (including sanctions and politically exposed person screening), keep our customer, account and transaction information up to date and have FCC policies and procedures in place detailing what is required from those responsible. We are also required to conduct FCC training for our employees and to report suspicious transactions and activity to appropriate law enforcement following full investigation by our local FCC team.
Financial crime continues to be the subject of enhanced regulatory scrutiny and supervision by regulators globally. AML/CFT, anti-bribery and corruption and sanctions laws and regulations are increasingly complex and detailed. Key standard-setting and regulatory bodies continue to provide guidelines to strengthen the interaction and cooperation between prudential and AML/CFT supervisors. Compliance with these laws and regulations requires automated systems, sophisticated monitoring and skilled compliance personnel.
We maintain updated policies and procedures aimed at detecting and preventing the use of our banking network for money laundering and other financial crime related activities. However, emerging technologies, such as cryptocurrencies and innovative payment methods, could limit our ability to track the movement of funds. Our ability to comply with the legal requirements depends on our ability to improve detection and reporting capabilities and reduce variation in control processes and oversight accountability. These require implementation and embedding within our business effective controls and monitoring, which in turn requires on-going changes to systems and operational activities. Financial crime is continually evolving and, as noted, is subject to increasingly stringent regulatory oversight and focus. This requires proactive and adaptable responses from us so that we are able to deter threats and criminality effectively. As a global bank, we are particularly exposed to this risk. Even known threats can never be fully eliminated, and there will be instances where we may be used by other parties to engage in money laundering and other illegal or improper activities. In addition, we rely heavily on our employees to assist us by spotting such activities and reporting them, and our
856 | ||
employees have varying degrees of experience in recognizing criminal tactics and understanding the level of sophistication of criminal organizations. Where we outsource any of our customer due diligence, customer screening or anti financial crime operations, we remain responsible and accountable for full compliance and any breaches. If we are unable to apply the necessary scrutiny and oversight of third parties to whom we outsource certain tasks and processes, there remains a risk of regulatory breach.
If we are unable to comply fully with applicable laws, regulations and expectations, our regulators and relevant law enforcement agencies have the ability and authority to impose significant fines and other penalties on us, including requiring a complete review of our business systems, day-to-day supervision by external consultants and ultimately the revocation of our banking license.
We have been, and may in the future be, subject to negative coverage in the media about us or our clients, including with respect to alleged conduct such as failure to detect and/or prevent any financial crime activities or comply with FCC regulations. Negative media coverage of this type about us, whether it has merit or not, could materially and adversely affect our reputation and perception among current and potential clients, investors, vendors, partners, regulators and other third parties, which in turn could have a material adverse effect on our operating results, financial condition and prospects as well as damage our customers’ and investors’ confidence and the market price of our securities.
The reputational damage to our business and global brand could be severe if we were found to have breached AML/CFT, anti-bribery and corruption or sanctions requirements. Our reputation could also suffer if we are unable to protect our customers’ bank products and services from being used by criminals for illegal or improper purposes.
The Brazilian Public Federal Prosecutor’s Office or 'MPF' has charged one of our officers in connection with the alleged bribery of a Brazilian tax auditor to secure favourable decisions in tax cases, resulting in a claimed benefit of R$83 million (approximately USD15 million) for us. On 23 October 2018, the officer was formally indicted and asked to present his defence. On 5 November 2018, the officer in question presented his defence. Proceedings had been ongoing until 25 October 2021, when a São Paulo federal judge requested additional documents from a Brasília federal judge in order to proceed with discovery. Proceedings have since been stayed. We are not a party to these proceedings. We have voluntarily provided information to the Brazilian authorities and have relinquished the benefit of certain tax credits to which the allegations relate in order to show good faith.
In addition, while we review our relevant counterparties’ internal policies and procedures with respect to such matters, we expect our relevant counterparties to maintain and properly apply their own appropriate compliance procedures and internal policies. Such measures, procedures and internal policies may not be completely effective in preventing third parties from using our (and our relevant counterparties’) services as a conduit for illicit purposes (including illegal cash
transactions) without our (and our relevant counterparties’) knowledge. If we are associated with, or even accused of being associated with, breaches of AML/CFT, anti-bribery and corruption or sanctions requirements, our reputation could suffer and/or we could become subject to fines, sanctions and/or legal enforcement (including being added to ‘watch lists' that would prohibit certain parties from engaging in transactions with us), any one of which could have a material adverse effect on our operating results, financial condition and prospects.
Any such risks could have a material adverse effect on our operating results, financial condition and prospects.
See also risk factor '2.1.2 We are subject to extensive regulation and regulatory and governmental oversight which could adversely affect our business, operations and financial condition - United States Significant Regulation - Anti-Money Laundering and economic sanctions'.
2.1.6 Changes in taxes and other assessments may adversely affect us.
The legislatures and tax authorities in the tax jurisdictions in which we operate regularly enact reforms to the tax and other assessment regimes to which we and our customers are subject. Such reforms include changes in tax rates and, occasionally, enactment of temporary taxes, the proceeds of which are earmarked for designated governmental purposes.
The effects of these changes and any other changes that result from enactment of additional tax reforms cannot be quantified and there can be no assurance that any such reforms would not have an adverse effect upon our business.
For example, Law 38/2022, of 27 December, established a temporary tax on financial credit institutions in Spain. The tax is calculated as 4.8% of the sum of interest income/charges and commission income/expenses derived from the business activities carried out in Spain. Royal Decree-Law 8/2023, of 27 December, foresees the revision of this temporary tax during 2024 for its inclusion into the tax system on a permanent basis.
2.2 Credit risks
2.2.1 The credit quality of our loan portfolio may deteriorate, and our loan loss reserves could be insufficient to cover our loan losses, which could have a material adverse effect on us.
Risks arising from changes in credit quality and the recoverability of loans and amounts due from counterparties are inherent to a wide range of our businesses. Non-performing or low credit quality loans have in the past negatively impacted our results of operations and could do so in the future. In particular, the amount of our reported credit impaired loans may increase in the future as a result of growth in our total loan portfolio, including as a result of loan portfolios that we may acquire in the future (the credit quality of which may turn out to be worse than we had anticipated), or factors beyond our control, such as adverse changes in the credit quality of our borrowers and counterparties or a general deterioration in economic conditions in the regions
857 | ||
| Cross-reference to Form 20-F | Consolidated directors' report | Consolidated financial statements | Supplemental information | |||||||||||||||||
where we operate or in global economic and political conditions, including as a result of the continuance or escalation of the war in Ukraine and the conflict in the Middle East. In certain markets, the combined pressure of economic downturn, high inflation and high interest rates may impact the ability of our customers to repay their debt. If we were unable to control the level of our credit impaired or poor credit quality loans, this could have a material adverse effect on us.
Our loan loss reserves are based on our current assessment of and expectations concerning various factors affecting the quality of our loan portfolio. These factors include, among other things, our borrowers’ financial condition, repayment abilities and repayment intentions, the realizable value of any collateral, the prospects for support from any guarantor, government macroeconomic policies, interest rates and the legal and regulatory environment. Because many of these factors are beyond our control and there is no infallible method for predicting loan and credit losses, we cannot assure that our current or future loan loss reserves will be sufficient to cover actual losses. If our assessment of and expectations concerning the above-mentioned factors differ from actual developments, if the quality of our total loan portfolio deteriorates, for any reason, or if the future actual losses exceed our estimates of expected losses, we may be required to increase our loan loss reserves, which may adversely affect us. Additionally, in calculating our loan loss reserves, we employ qualitative tools and statistical models which may not be reliable in all circumstances and which are dependent upon data that may not be complete. For further details regarding our risk management policies, see risk factor '2.7.1 Failure to successfully implement and continue to improve our risk management policies, procedures and methods, including our credit risk management system, could materially and adversely affect us, and we may be exposed to unidentified or unanticipated risks'.
On 31 December 2023, our net loans and advances to customers amounted to EUR 1,036,349 million (compared to EUR 1,036,004 million as of 31 December 2022).
Our loan portfolio is mainly located in Europe (in particular, Spain and the UK), North America (in particular the United States) and South America (in particular Brazil). At 31 December 2023, Europe accounted for 55% of our total loan portfolio (Spain accounted for 23% of our total loan portfolio and the UK, where the loan portfolio consists primarily of residential mortgages, accounted for 24%), North America accounted for 17% (of which the United States represents 12% of our total loan portfolio), South America accounted for 15% (of which Brazil represents 9% of our total loan portfolio) and the Digital Consumer Bank segment (primarily Europe) accounted for 13%.
Mortgage loans are one of our principal assets, comprising 43% of our net loans and advances as of 31 December 2023, mainly located in Spain and the UK. 81% of such mortgage loans are residential. If Spain or the UK experience situations of economic stagnation, persistent housing oversupply, decreased housing demand, rising unemployment levels, subdued earnings growth, greater pressure on disposable
income, a decline in the availability of mortgage finance or continued global markets volatility, for instance, home prices could decline, while mortgage delinquencies, forbearances and our NPL ratio could increase, which in turn could have a material adverse effect on our business, financial condition and results of operations. At 31 December 2023, the NPL ratio of residential mortgage loans for the Group in Spain and the UK was 1.49% and 1.16%, respectively.
At 31 December 2023, our total Group NPL ratio stood at 3.14% as compared to 3.08% at 31 December 2022. Coverage as of 31 December 2023 was 66% as compared to 68% a year earlier.
Impairment on financial assets not measured at fair value through profit or loss (net) in 2023 was EUR 12,956 million (mainly related to loans and advances to customers), a 19% increase as compared to EUR 10,863 million in 2022, mainly affected by the provisions resulting from the charges in Poland for CHF mortgages, the increase in the US (due to normalization) and higher provisions recorded in Brazil in line with credit portfolio growth.
At 31 December 2023, the gross amount of our refinancing and restructuring operations was EUR 31,963 million (3% of total gross loans and credits), of which EUR 8,721 million have real estate collateral. At the same date, the net amount of non-current assets held for sale totalled EUR 3,014 million, of which EUR 2,773 million were foreclosed assets.
2.2.2 The value of the collateral securing our loans may not be sufficient, and we may be unable to realize the full value of the collateral securing our loan portfolio.
The value of the collateral securing our loan portfolio may fluctuate or decline due to factors beyond our control, including as a result of macroeconomic factors, especially those affecting Europe, North America and South America or the continuance or escalation of the war in Ukraine and the conflict in the Middle East. The value of the collateral securing our loan portfolio may be adversely affected by force majeure events, such as natural disasters (including as a result of climate change), particularly in locations where a significant portion of our loan portfolio is composed of real estate loans. We may also not have sufficiently recent information on the value of collateral, which may result in an inaccurate assessment for impairment losses of our loans secured by such collateral. If any of the above were to occur, we may need to make additional provisions to cover actual impairment losses of our loans, which may materially and adversely affect our results of operations and financial condition.
In addition, auto industry technology changes, accelerated by environmental rules, could affect our auto consumer business in the EU and the US, particularly residual values of leased vehicles. This transformation could affect our auto finance business in view of (i) a transition from fuel to electric engines, environmental aspects related to emissions and transition risks derived from political and regulatory decisions (e.g., traffic restrictions in city centres); (ii) growing customer preferences for car leasing, subscription, car sharing and other services instead of vehicle ownership; (iii) greater
858 | ||
market concentration in certain manufacturers, distributors and other agents; and (iv) more online sales channels. In addition, the auto industry could also suffer from supply chain disruption and shortages of batteries, semi-conductors and others in the wake of the wars, geopolitical and macroeconomic tensions, conflicts and other events, affecting guarantees, residual used car value and loan delinquencies. Although we monitor the auto portfolios and dealers and we have launched specific plans to tackle particular issues, the auto industry changes and disruptions described above could have a material adverse effect on our operating results, financial condition and prospects.
At 31 December 2023, 43% of our loans and advances to customers have property collateral while 22% have other types of collateral (securities, pledges and others).
2.2.3 We are subject to counterparty risk in our banking business.
We are exposed to counterparty risk in addition to credit risks associated with lending activities. Counterparty risk may arise from, for example, investing in securities of third parties, entering into derivative contracts under which counterparties have obligations to make payments to us or executing securities, futures, currency or commodity trades from proprietary trading activities that fail to settle at the required time due to non-delivery by the counterparty or systems failure by clearing agents, clearing houses or other financial intermediaries.
We routinely transact with counterparties in the financial services industry, including brokers and dealers, commercial banks, investment banks, mutual funds, hedge funds and other institutional clients. Defaults by, and even rumours or questions about the solvency of, certain financial institutions and the financial services industry generally have led to market-wide liquidity problems and could lead to losses or defaults by other institutions. Many of the routine transactions we enter into expose us to significant credit risk in the event of default by one of our significant counterparties.
2.3 Operational and technology risks
2.3.1 Any failure to improve or upgrade our information technology infrastructure and information management systems in an effective, timely and cost-effective manner, including in response to new or modified cybersecurity and data privacy laws, rules and regulations, could have a material adverse effect on us.
Our ability to remain competitive depends in part on our ability to upgrade our information technology in an effective, timely and cost-effective manner. We must continually make significant investments in, and improvements to, our information technology infrastructure and information management systems in order to meet the needs of our customers. We cannot guarantee that in the future we will be able to maintain the level of capital expenditures necessary to support the continuous improvement and upgrading of our information technology infrastructure and information management systems and networks. To the extent we are dependent on any particular technology or technological
solution, we may be harmed if such technology or technological solution becomes non-compliant with existing industry standards or applicable laws, rules or regulations, fails to meet or exceed the capabilities of our competitors’ equivalent technologies or technological solutions, becomes increasingly expensive to service, retain and update, becomes subject to third-party claims of intellectual property infringement, misappropriation or other violation, or malfunctions or functions in a way we did not anticipate. Additionally, new technologies and technological solutions, such as AI, are continually being released. As such, it is difficult to predict the problems we may encounter in improving our technologies’ functionality. There is no assurance that we will be able to successfully adopt new technology as critical systems and applications become obsolete and better ones become available. Any failure to effectively improve or upgrade our information technology infrastructure and information management systems and networks in an effective, timely and cost-efficient manner could have a material adverse effect on us.
2.3.2 Any failure or disruption of our operational processes or systems, or data breaches and other security incidents with respect to our or our third-party vendors’ systems could adversely affect our business or reputation, and create significant legal, regulatory or financial exposure.
Like other financial institutions, in conducting our banking operations, we receive, manage, hold, transmit and otherwise process certain proprietary, sensitive or confidential information, including personal information of customers and employees, as well as a large number of assets. Accordingly, our business relies on our ability to process a large number of transactions efficiently and accurately, and on our ability to rely on our digital technologies, computer and email services, software and networks, as well as on the secure storage, transmission and other processing of proprietary confidential, sensitive and personal data and other information using our computer systems and networks or those of our third-party vendors. Our operations must also comply with complex and evolving laws and regulations in the countries in which we operate. The proper and secure functioning of our financial controls, accounting and other data collection and processing systems is critical to our business and to our ability to compete effectively. Data breaches, data losses and other security incidents, including fraudulent withdrawal of money, can result from, among other things, inadequate personnel, inadequate or failed internal control processes and systems, or external events or actors that interrupt normal business operations and may include cyberattacks, disruptions, failures, unauthorized access or misuse, software bugs, server malfunctions, software and hardware failure, malware and ransomware, social engineering and phishing attacks, denial-of-service attacks, misconduct, fraud, and other events that could have a serious impact on us. We also face the risk that the design of our or our third-party vendors’ cybersecurity controls and procedures prove to be inadequate or are circumvented such that our data or client records are incomplete, not recoverable or not securely stored. Moreover, it is not always possible to deter or prevent employee errors or misconduct, and the precautions we take
859 | ||
| Cross-reference to Form 20-F | Consolidated directors' report | Consolidated financial statements | Supplemental information | |||||||||||||||||
to detect and prevent this activity may not always be effective. Any material disruption or slowdown of our systems could cause information, including data related to customer requests, to be lost or to be delivered to our clients with delays or errors, which could reduce demand for our services and products, produce customer claims and materially and adversely affect us.
We prioritize early identification, monitoring and mitigation of risks (including those resulting from our interactions with third parties) in our goal to provide a resilient and secure operational environment. In this regard, although (i) we have policies, procedures and controls in place designed to safeguard proprietary, sensitive and confidential information, including personal information, (ii) we take protective technical measures and monitor and develop our systems and networks to protect our technology infrastructure, data and information from misappropriation or corruption, and (iii) we work with our clients, vendors, service providers, counterparties and other third parties to develop secure data and information processing, collection, authentication, management, usage, storage and transmission capabilities and to ensure the eventual destruction of proprietary, sensitive and confidential information, including personal information, we, our third-party vendors or other third parties with which we do business have been and may continue to be subject to cyberattacks and other cybersecurity incidents. The implementation of our cybersecurity policies, procedures, controls and technical measures is designed to reduce the risk of such cybersecurity incidents but does not guarantee full protection against potential threats or cyberattacks or a risk-free environment. This is especially applicable in the current global environment, with the war in Ukraine and the conflict in the Middle East resulting in an increased risk of cyberattacks, and other disruptions in response to, or retaliation for, the sanctions and costs imposed on Russia and certain other countries directly or indirectly involved in the wars. Additionally, the shift to remote work policies for a significant portion of our workforce, as they access our secure systems and networks remotely, and our customers’ increased reliance on digital banking products and other digital services, including mobile payment products, has also increased the risk of cyberattacks (see risk factor '1.3 The global covid-19 pandemic materially impacted our business, and the continuance of this pandemic or any future outbreak of any other highly contagious diseases or other public health emergencies, could materially and adversely impact our business, financial condition, liquidity and results of operations').
While we generally perform cybersecurity due diligence on our key vendors, because we do not control our vendors and our ability to monitor their cybersecurity is limited, we cannot ensure the cybersecurity measures they take will be sufficient to protect any information we share with them. Due to applicable laws and regulations or contractual obligations, we may be held responsible for security breaches, cyberattacks or other similar incidents attributed to our vendors as they relate to the information we share with them.
In addition, we may also be impacted by cyberattacks against national critical infrastructures of the countries where we operate, such as telecommunications networks. Our information technology systems are dependent on such critical infrastructure and any cyberattack against such critical infrastructure could negatively affect our ability to service our customers. As we do not operate such critical infrastructure, we have limited ability to protect our information technology systems from the adverse effects of a cyberattack. For further information see the 'Risk, compliance and conduct management' chapter in Part 1 of this annual report on Form 20-F.
We have seen in recent years the information technology systems and networks of companies and organizations being increasingly targeted, and the techniques used to obtain unauthorized, improper or illegal access to such information technology systems and networks have become increasingly complex and sophisticated, including through the use of AI. Furthermore, such techniques change frequently and are often not recognized or detected until after they have been launched and can originate from a wide variety of sources, including organized crime, hackers, activists, terrorists, nation-states, nation-state supported actors and others, any of which may see their effectiveness enhanced by the use of AI. As attempted attacks continue to evolve in scope and sophistication, we may incur significant costs in order to modify or enhance our protective measures against such attacks, or to investigate or remediate any vulnerability or resulting breach, or in communicating cyberattacks or other security incidents to our customers, affected individuals or regulators, as applicable.
If we cannot maintain effective and secure proprietary, confidential, sensitive and personal data, or if we or our third-party vendors fall victim to successful cyberattacks, penetrations, compromises, breaches or circumventions of our information technology systems or networks or experience other security incidents in the future, we may incur substantial costs and suffer other negative consequences, such as disruption to our operations, misappropriation of personal, proprietary, confidential or sensitive information, remediation costs (including liabilities for stolen assets or information, repairs of system damage, among others), increased cybersecurity protection costs, lost revenues arising from the unauthorized use of personal, proprietary, confidential or sensitive information or the failure to retain or attract our customers following an operational or security incident, litigation and legal risks (including claims from customers, employees or other third parties, regulatory action, reporting obligations, investigation, fines and penalties), increased insurance premiums, reputational damage affecting our customers’ and the investors’ confidence, as well as damages to our competitiveness, stock price and long-term shareholder value. In addition, our remediation efforts may not be successful, and we may not have adequate insurance to cover these losses. While we maintain insurance coverage, we cannot assure you that such coverage will be adequate or otherwise protect us from liabilities or damages with respect to claims alleging compromises of proprietary, confidential,
860 | ||
sensitive or personal data or otherwise relating to data privacy and cybersecurity matters. In addition, we cannot be sure that our existing insurance coverage will continue to be available on acceptable terms or at all, or that our insurers will not deny coverage to any future claim. Moreover, even when a failure of or interruption in our or our third-party vendors’ systems or facilities is resolved in a timely manner or an attempted cyberattack, data breach or security incident is successfully avoided or thwarted, substantial resources and management attention are expended in doing so, and to successfully avoid or resolve any such incidents, we may be required to take actions that could adversely affect customer satisfaction or retention, as well as harm our reputation.
Any of the cyberattacks, data breaches, data losses and other security incidents described above could have a material adverse effect on our business, financial condition and results of operations.
2.3.3 We rely on third parties and affiliates for important products and services.
Third party vendors and certain affiliated companies provide key components of our business infrastructure such as loan and deposit servicing systems, back office and business process support and software, information technology production and support, internet connections and network access, including cloud-based services, as well as those of our service providers. Relying on these third parties and affiliated companies can be a source of operational and regulatory risk to us, including with respect to security breaches affecting such parties. We are also subject to risk with respect to security breaches affecting the vendors and other parties that interact with these service providers. As our interconnectivity with these third parties and affiliated companies increases, we increasingly face the risk of operational failure with respect to their systems. We may be required to take steps to protect the integrity of our operational systems, thereby increasing our operational costs and potentially decreasing customer satisfaction.
In addition, any problems caused by these third parties or affiliated companies, including as a result of them not providing us their services for any reason, or performing their services poorly, could adversely affect our ability to deliver products and services to customers and otherwise conduct our business, which could lead to reputational damage and regulatory investigations and intervention. While we have diversified providers for the main services and keep strict and close monitoring on them, in some instances, replacing these third-party vendors could also entail significant delays and expense. Further, the operational and regulatory risk we face as a result of these arrangements may be increased to the extent that we restructure such arrangements. Any restructuring could involve significant expense to us and entail significant delivery and execution risk which could have a material adverse effect on our business, operations and financial condition.
2.3.4 We utilize artificial intelligence, which could expose us to liability or adversely affect our business.
We utilize, and are continuing to explore further uses of, AI in connection with our business, products and services.
However, there are significant risks involved in utilizing AI and no assurance can be provided that our use will enhance our products or services or produce the intended results. For example, AI algorithms may be flawed, insufficient, of poor quality, reflect unwanted forms of bias or contain other errors or inadequacies, any of which may not be easily detectable; AI has been known to produce false inferences or outputs; AI may subject us to new or heightened legal, regulatory, ethical or other challenges; AI may involve inappropriate or controversial data practices by developers and end-users, or other factors adversely affecting public opinion of AI, any of which could impair the acceptance of AI solutions, including those incorporated into our products and services. If the AI solutions that we create or use are deficient, inaccurate or controversial, we could incur operational inefficiencies, competitive harm, legal liability, brand or reputational harm, or other adverse impacts on our business and financial results. Additionally, if any of our employees, contractors, vendors or service providers use any third-party AI-powered solutions in connection with our business, it may lead to the inadvertent disclosure or incorporation of our proprietary, confidential, sensitive or personal information into publicly available or third-party training sets which may impact our ability to realize the benefit of our intellectual property or proprietary, confidential, sensitive or personal information, harming our competitive position and business. If we do not have sufficient rights to use the data or other material or content on which our AI solutions or other AI tools we use rely, we also may incur liability through the violation of applicable laws and regulations, third-party intellectual property, privacy or other rights, or contracts to which we are a party.
2.4 Liquidity and funding risks
2.4.1 Liquidity and funding risks are inherent in our business and could have a material adverse effect on us.
Liquidity risk is the risk that we either do not have sufficient financial resources available to meet our obligations as they are due, or we can only secure them at excessive cost. This risk is inherent in any banking business and can be heightened by a number of enterprise-specific factors, including over-reliance on a particular source of funding, changes in credit ratings or market-wide phenomena such as market dislocation, including as a result of the continuance or escalation of the war in Ukraine and of the conflict in the Middle East. While we have in place liquidity management processes to mitigate and control these risks, as well as an organizational model based on autonomous subsidiaries in terms of capital and liquidity which limits the possibility of contagion between them, systemic market factors make it difficult to eliminate these risks completely. Constraints in the supply of liquidity, including in inter-bank lending, could materially and adversely affect the cost of funding of our business, and extreme liquidity constraints may affect our current operations and our ability to fulfil regulatory liquidity requirements, as well as limit growth possibilities.
Our cost of obtaining funding is directly related to prevailing interest rates and to our credit spreads. Increases in interest rates, such as those announced throughout 2022 and 2023
861 | ||
| Cross-reference to Form 20-F | Consolidated directors' report | Consolidated financial statements | Supplemental information | |||||||||||||||||
by the ECB, the Bank of England and the Federal Reserve, and/or in our credit spreads could significantly increase the cost of our funding. Credit spreads variations are market-driven and may be influenced by market perceptions of our creditworthiness. Changes to interest rates and our credit spreads may occur frequently and could be unpredictable and highly volatile.
We rely, and will continue to rely, primarily on retail deposits to fund lending activities. The ongoing availability of this type of funding is sensitive to a variety of factors beyond our control, such as general economic conditions and the confidence of retail depositors in the economy and in the financial services industry, and the availability and extent of deposit guarantees, as well as competition for deposits between banks or with other products, such as mutual funds. Any of these factors could increase the amount of retail deposit withdrawals in a short period of time, thereby reducing our ability to access retail deposit funding on appropriate terms, or at all, in the future. If these circumstances were to arise, this could have a material adverse effect on our operating results, financial condition and prospects.
In the first half of 2023, the liquidity issues faced by Silicon Valley Bank and other banks in the United States, and the issues faced by the Swiss bank Credit Suisse, caused withdrawals of deposits from these banks and volatility in international markets. Central banks took measures designed to guarantee the liquidity of the banking system. Although we do not have material exposure to the affected banks, the spread or potential spread of these or other issues to the broader financial sector could have a material adverse effect on our operating results, financial condition and prospects.
Central banks took extraordinary measures to increase liquidity in the financial markets as a response to the financial crisis and the covid-19 pandemic. In Europe, the ECB's pandemic emergency purchase programme (PEPP) was finalized by the end of March 2022, although maturing principal payments are expected to be repurchased until at least the end of 2024. If these facilities, which are progressively being reduced, were to be rapidly removed, this could have an adverse effect on our ability to access liquidity and on our funding costs.
Additionally, our activities could be adversely impacted by liquidity tensions arising from generalized drawdowns of committed credit lines to our customers.
We cannot assure that in the event of a sudden or unexpected shortage of funds in the banking system, we will be able to maintain levels of funding without incurring high funding costs, a reduction in the term of funding instruments or the liquidation of certain assets. If this were to happen, we could be materially adversely affected.
Finally, the implementation of internationally accepted liquidity ratios might require changes in business practices that affect our profitability. The LCR is a liquidity standard that measures if banks have sufficient high-quality liquid assets to cover expected net cash outflows over a 30-day
liquidity stress period. At 31 December 2023, our LCR ratio was 166%, above the 100% minimum requirement. The NSFR provides a sustainable maturity structure of assets and liabilities such that banks maintain a stable funding profile in relation to their activities. At the end of 2023, this ratio stood at 123% for the Group and over 100% for all our main subsidiaries.
2.4.2 Credit, market and liquidity risk may have an adverse effect on our credit ratings and our cost of funds. Any downgrade in our credit rating would likely increase our cost of funding, require us to post additional collateral or take other actions under some of our derivative and other contracts and adversely affect our interest margins and results of operations.
Credit ratings affect the cost and other terms upon which we are able to obtain funding. Rating agencies regularly evaluate us, and their ratings of our debt are based on a number of factors, including our financial strength and conditions affecting the financial services industry. In addition, due to the methodology of the main rating agencies, our credit rating is affected by the rating of Spanish sovereign debt. If Spain’s sovereign debt is downgraded our credit rating would also likely be downgraded.
Any downgrade in our debt credit ratings would likely increase our borrowing costs and require us to post additional collateral or take other actions under some of our derivative and other contracts, and could limit our access to capital markets and adversely affect our commercial business. For example, a ratings downgrade could adversely affect our ability to sell or market some of our products, engage in certain longer-term and derivatives transactions and retain our customers, particularly customers who need a minimum rating threshold in order to invest. In addition, under the terms of certain of our derivative contracts and other financial commitments, we may be required to maintain a minimum credit rating or terminate such contracts or require the posting of collateral. Any of these results of a ratings downgrade could reduce our liquidity and have an adverse effect on us, including our operating results and financial condition.
We have the following ratings by the major rating agencies as of the report dates indicated below:
| Banco Santander, S.A. | ||||||||||||||
| Rating agency | Long term | Short term | Last report date | Outlook | ||||||||||
| Fitch Ratings | A- (Senior A) | F2 (Senior F1) | Dec 2023 | Stable | ||||||||||
| Moody's | A2 | P-1 | Jul 2023 | Stable | ||||||||||
| Standard & Poor's | A+ | A-1 | Oct 2023 | Stable | ||||||||||
| DBRS | A (High) | R-1 (Middle) | Sep 2023 | Stable | ||||||||||
862 | ||
| Santander UK, plc | ||||||||||||||
| Rating agency | Long term | Short term | Last report date | Outlook | ||||||||||
| Fitch Ratings | A+ | F1 | Dec 2023 | Stable | ||||||||||
| Moody's | A1 | P-1 | Jun 2023 | Stable | ||||||||||
| Standard & Poor's | A | A-1 | Jun 2023 | Stable | ||||||||||
| Banco Santander (Brasil) | (Foreign currency) | |||||||||||||
| Rating agency | Long term | Short term | Last report update | Outlook | ||||||||||
| Moody's | Ba1 | - | Feb 2023 | Stable | ||||||||||
| Standard & Poor's | BB | B | Dec 2023 | Stable | ||||||||||
We conduct substantially all of our material derivative activities through Banco Santander and Santander UK. We estimate that as of 31 December 2023, if all the rating agencies were to downgrade Banco Santander’s long-term senior debt ratings by one notch, we would be required to post up to EUR 210 million in additional collateral pursuant to derivative and other financial contracts. A hypothetical two-notch downgrade would result in a further requirement to post up to EUR 178 million in additional collateral. We estimate that as of 31 December 2023, if all the rating agencies were to downgrade Santander UK’s long-term credit ratings by one notch, and thereby trigger a short-term credit rating downgrade, this could result in contractual outflows from Santander UK’s total liquid assets of £1.2 billion (equivalent to EUR 1.4 billion) of cash and additional collateral that Santander UK would be required to post under the terms of secured funding and derivatives contracts. A hypothetical two-notch downgrade would result in a further outflow of £0.8 billion (equivalent to EUR 0.9 billion) of cash and collateral under secured funding and derivatives contracts.
While certain potential impacts of these downgrades are contractual and quantifiable, the full consequences of a credit rating downgrade are inherently uncertain, as they depend on numerous dynamic, complex and inter-related factors and assumptions, including market conditions at the time of any downgrade, whether any downgrade of our long-term credit rating precipitates downgrades to our short-term credit rating, and assumptions about the potential behaviours of various customers, investors and counterparties. Actual outflows could be higher or lower than the preceding hypothetical examples, depending upon certain factors including which credit rating agency downgrades our credit rating, any management or restructuring actions that could be taken to reduce cash outflows and the potential liquidity impact from loss of unsecured funding (such as from money market funds) or loss of secured funding capacity. Although unsecured and secured funding stresses are included in our stress testing scenarios and a portion of our total liquid assets is held against these risks, a credit rating downgrade could still have a material adverse effect on us.
In addition, if we were required to cancel our derivatives contracts with certain counterparties and were unable to replace such contracts, our market risk profile could be altered.
There can be no assurance that the rating agencies will maintain the current ratings or outlooks. In general, the future evolution of Santander's ratings is linked, to a large extent, to the general macroeconomic outlook which includes the impact of the continuance or escalation of the war in Ukraine and of the conflict in the Middle East on our asset quality, profitability and capital. Failure to maintain favourable ratings and outlooks could increase our cost of funding and adversely affect interest margins, which could have a material adverse effect on us.
2.5 Market risks
2.5.1 Our financial results are constantly exposed to market risk. We are subject to fluctuations in interest rates and other market risks, which may materially and adversely affect us and our profitability.
Our financial results are constantly exposed to market risk. In 2022 and 2023, inflationary pressures, increases in the prices of energy, oil, gas and other commodities and the continuance or escalation of the war in Ukraine and of the conflict in the Middle East caused and could continue to cause high market volatility, which could materially and adversely affect us and our trading and banking book.
Economic activities exposed to market risk include (i) transactions where risk is assumed as a consequence of potential changes in interest rates, inflation rates, exchange rates, stock prices, credit spreads, commodity prices, volatility and other market factors; (ii) the liquidity risk from our products and markets; and (iii) the balance sheet liquidity risk.
As described below, market risk affects (i) our interest income / (charges); (ii) the market value of our assets and liabilities, in particular of our securities holdings, loans and deposits and derivatives transactions; and (iii) other areas of our business such as the volume of loans originated or credit spreads.
The performance of financial markets may cause changes in the value of our investment and trading portfolios. The volatility of world equity markets due to the continued economic uncertainty and sovereign debt crisis has had a particularly strong impact on the financial sector. Continued volatility may affect the value of our investments in equity securities and, depending on their fair value and future recovery expectations, could become a permanent impairment which would be subject to write-offs against our results.
Market risk could include unexpected or unpredictable risks related to periods in which the market does not calculate prices efficiently (for example, during market interruptions or shocks).
Variations in our interest income / (charges)
863 | ||
| Cross-reference to Form 20-F | Consolidated directors' report | Consolidated financial statements | Supplemental information | |||||||||||||||||
Interest rates are sensitive to many factors beyond our control, including increased regulation of the financial sector, monetary policies and domestic and international economic and political conditions. Variations in interest rates could affect the interest earned on our assets and the interest paid on our borrowings, thereby affecting our interest income / (charges), which comprises the majority of our revenue, reducing our growth rate and potentially resulting in losses. In addition, costs we incur as we implement strategies to reduce interest rate exposure could increase in the future (which, in turn, will impact our results).
Due to the historically low interest rate environment in the eurozone, in the UK and in the US in recent years, the rates on many of our interest-bearing deposit products were priced at or near zero or negative, limiting our ability to further reduce rates and thus negatively impacting our margins and our results of operations.
Throughout 2022 and 2023, central banks, including the ECB, the Bank of England and the Federal Reserve, increased interest rates to contain inflation.
Increases in interest rates may reduce the volume of loans we originate. Sustained high interest rates have historically discouraged customers from borrowing and have resulted in increased delinquencies in outstanding loans and deterioration in the quality of assets. Increases in interest rates may reduce the value of our financial assets and may reduce gains or require us to record losses on sales of our loans or securities. Additionally, a shrinking yield premium between short-term and long-term market interest rates coupled with inflation, could adversely affect our business and results of operations.
At 31 December 2023, the risk on net interest income over a one year period, measured as the sensitivity to parallel changes in the worst-case scenario of ±100 basis points, (i) was positive in Europe (i.e., a decrease in interest rates would potentially produce a decrease in net interest income) and mainly in the euro, at EUR 886 million, the British pound at EUR 246 million, the Polish zloty, at EUR 24 million, and the US dollar, at EUR 99 million; (ii) was positive in North America (i.e., a decrease in interest rates would potentially produce a decrease in net interest income) and the risk was mainly located in the US (EUR 117 million); and (iii) was negative in South America (i.e., an increase in interest rates would potentially produce a decrease in net interest income) and was mainly found in Chile (EUR 36 million) and Brazil (EUR 141 million).
Variations in the market value of our assets and liabilities
The market risk in relation to the change in the market value of our assets and liabilities refers to the loss of value of assets or increase in the value of liabilities due to fluctuations in their prices in the markets where those assets or liabilities are traded, or even if not traded, in the value that a third party outside the Group would be willing to offer in a hypothetical transaction.
The standard methodology that we apply for risk management is Value at Risk (VaR), which measures the maximum expected loss within a certain confidence level and time frame.
In relation to structural balance sheet risks:
•At 31 December 2023, the maximum expected loss in the value of assets and liabilities due to variations in interest rate was EUR 380.2 million (EUR 304.5 million and EUR 287.8 million at 31 December 2022 and 2021, respectively), measured with a VaR confidence level of 99% and a temporary horizon of one day.
•At 31 December 2023, the maximum expected loss in the value of assets and liabilities due to variations in exchange rate was EUR 642.9 million (EUR 461.0 million and EUR 655.2 million at 31 December 2022 and 2021, respectively), measured with a VaR confidence level of 99% and a temporary horizon of one day.
•At 31 December 2023, the maximum expected loss in the value of assets and liabilities due to variations in equity portfolio was EUR 171.1 million (EUR 195.4 million and EUR 309.1 million at 31 December 2022 and 2021, respectively), measured with a VaR confidence level of 99% and a temporary horizon of one day.
In relation to the trading portfolio, the Santander Corporate & Investment Banking segment VaR closed December 2023 with EUR 13.5 million.
We are also exposed to foreign exchange rate risk as a result of mismatches between assets and liabilities denominated in different currencies. Fluctuations in the exchange rate between currencies may negatively affect our earnings and value of our assets and securities.
If any of these risks were to materialize, our net interest income or the market value of the Group's assets and liabilities could suffer a material adverse impact.
2.5.2 We are subject to market, operational and other related risks associated with our derivative transactions that could have a material adverse effect on us.
We enter into derivative transactions for trading purposes as well as for hedging purposes. We are subject to market, credit and operational risks associated with these transactions, including basis risk (the risk of loss associated with variations in the spread between the asset yield and the funding and/or hedge cost) and credit or default risk (the risk of insolvency or other inability of the counterparty to a particular transaction to perform its obligations thereunder, including providing sufficient collateral).
Market practices and documentation for derivative transactions differ by country. In addition, the execution and performance of these transactions depend on our ability to maintain adequate control and administration systems. Moreover, our ability to adequately monitor, analyse and report derivative transactions continues to depend, largely, on our information technology systems. These factors further
864 | ||
increase the risks associated with these transactions and could have a material adverse effect on us.
At 31 December 2023, the notional value of the trading derivatives in our books amounted to EUR 7,837,818 million (with a market value of EUR 56,328 million of debit balance and EUR 50,589 million of credit balance).
At 31 December 2023, the nominal value of the hedging derivatives in our books within our financial risk management strategy and with the aim of reducing asymmetries in the accounting treatment of our operations amounted to EUR 418,294 million (with market value of EUR 5,297 million in assets and EUR 7,656 million in liabilities).
2.5.3 Market conditions have resulted and could result in material changes to the estimated fair values of our financial assets. Negative fair value adjustments could have a material adverse effect on our operating results, financial condition and prospects.
In the past, financial markets have been subject to significant stress resulting in steep falls in perceived or actual financial asset values, particularly due to volatility in global financial markets and the resulting widening of credit spreads, including as a result of the war in Ukraine and the covid-19 pandemic. We have material exposures to securities, loans and other investments that are recorded at fair value and are therefore exposed to potential negative fair value adjustments. Asset valuations in future periods, reflecting then-prevailing market conditions, may result in negative changes in the fair values of our financial assets and these may also translate into increased impairments. In addition, the value ultimately realized by us on disposal may be lower than the current fair value. Any of these factors could require us to record negative fair value adjustments, which may have a material adverse effect on our operating results, financial condition or prospects.
In addition, to the extent that fair values are determined using financial valuation models, such values may be inaccurate or subject to change, as the data used by such models may not be available or may become unavailable due to changes in market conditions, particularly for illiquid assets, and particularly in times of economic instability. In such circumstances, our valuation methodologies require us to make assumptions, judgements and estimates in order to establish fair value, and reliable assumptions are difficult to make and are inherently uncertain and valuation models are complex, making them inherently imperfect predictors of actual results. Any consequential impairments or write-downs could have a material adverse effect on our operating results, financial condition and prospects.
2.6 Risks related to our industry
2.6.1 Goodwill impairments may be required in relation to acquired businesses.
We have made business acquisitions in recent years and may make further acquisitions in the future. It is possible that the goodwill which has been attributed, or may be attributed, to these businesses may have to be written-down if our valuation assumptions are required to be reassessed as a
result of any deterioration in their underlying profitability, asset quality and other relevant matters. Impairment testing in respect to goodwill is performed annually, or more frequently if there are impairment indicators present, and comprises a comparison of the carrying amount of the cash-generating unit with its recoverable amount. Goodwill impairment does not, however, affect our regulatory capital. In 2021 we recognized an impairment of goodwill of EUR 6 million, while no impairment was recognized in 2022 and an impairment of EUR 20 million was recognized in 2023. See note 17 to our 'Consolidated financial statements' included in Part 1 of this annual report on Form 20-F. There can be no assurances that we will not have to write down the value attributed to goodwill in the future, which would adversely affect our results and net assets.
2.6.2 Changes in our pension liabilities and obligations could have a material adverse effect on us.
We provide retirement benefits for many of our former and current employees through a number of defined benefit pension plans. We calculate the amount of our defined benefit obligations using actuarial techniques and assumptions, including mortality rates, the rate of increase of salaries, discount rates, inflation, the expected rate of return on plan assets, and others. The accounting and disclosures are based on IFRS-IASB and on those other requirements defined by the local supervisors. Given the nature of these obligations, changes in the assumptions that support valuations, including market conditions, can result in actuarial losses which would in turn impact the financial condition of our pension funds. Because pension obligations are generally long term obligations, fluctuations in interest rates have a material impact on the projected costs of our defined benefit obligations and therefore on the amount of pension expense that we accrue.
Any increase in the current size of the funding deficit in our defined benefit pension plans could result in our having to make increased contributions to reduce or satisfy the deficits, which would divert resources from use in other areas of our business. Any such increase may be due to certain factors over which we have no or limited control. Increases in our pension liabilities and obligations could have a material adverse effect on our business, financial condition and results of operations.
At 31 December 2023, our provision for pensions and other obligations amounted to EUR 3,105 million. See more information in note 25.c) to our 'Consolidated financial statements' included in Part 1 of this annual report on Form 20-F.
2.6.3 We depend in part on dividends and other funds from subsidiaries.
Some of our operations are conducted through our financial services subsidiaries. As a result, our ability to pay dividends, to the extent we decide to do so, depends in part on the ability of our subsidiaries to generate earnings and to pay dividends to us. Payment of dividends, distributions and advances by our subsidiaries will be contingent upon their earnings and business considerations and is or may be limited by legal, regulatory and contractual restrictions. For instance,
865 | ||
| Cross-reference to Form 20-F | Consolidated directors' report | Consolidated financial statements | Supplemental information | |||||||||||||||||
the repatriation of dividends from our Argentine subsidiaries have been subject to certain restrictions. Additionally, our right to receive any assets of any of our subsidiaries as an equity holder of such subsidiaries upon their liquidation or reorganization will be effectively subordinated to the claims of our subsidiaries’ creditors, including trade creditors.
We also have to comply with increased capital requirements, which could result in the imposition of restrictions or prohibitions on discretionary payments including the payment of dividends and other distributions to us by our subsidiaries. In 2020, given the uncertainties about the economic impact of the covid-19 pandemic, the ECB, the Prudential Regulation Authority of the UK and the Federal Reserve of the United States, imposed limitations on the distribution of dividends which were in force until the third quarter of 2021. Since then, supervisors assess the capital and dividend distribution plans for each entity as part of their regular supervisory process and make individualized recommendations.
To the extent that these recommendations, or other similar measures that may be taken by supervisory authorities from other regions, are applied by some of our subsidiaries, it could have a material adverse effect on our business, financial condition and results of operations.
At 31 December 2023, dividend income for Banco Santander, S.A. represented 52% of its total income.
2.6.4 Increased competition, including from non-traditional providers of banking services such as financial technology providers, and industry consolidation may adversely affect our results of operations.
We face substantial competition in all parts of our business, including in payments, in originating loans and in attracting deposits. The competition in originating loans comes principally from other domestic and foreign banks, mortgage banking companies, consumer finance companies, insurance companies and other lenders and purchasers of loans.
In addition, there has been a trend towards consolidation in the banking industry, which has created larger banks with which we must now compete. There can be no assurance that this increased competition will not adversely affect our growth prospects, and therefore our operations. We also face competition from non-bank competitors, such as brokerage companies, department stores (for some credit products), leasing and factoring companies, mutual fund and pension fund management companies and insurance companies.
Non-traditional providers of banking services, such as internet based e-commerce providers, mobile telephone companies and internet search engines may offer and/or increase their offerings of financial products and services directly to customers. These non-traditional providers of banking services currently have an advantage over traditional providers because they are not subject to banking regulation. Several of these competitors may have long operating histories, large customer bases, strong brand recognition and significant financial, marketing and other resources. They
may adopt more aggressive pricing and rates and devote more resources to technology, infrastructure and marketing.
New competitors may enter the market or existing competitors may adjust their services with unique product or service offerings or approaches to providing banking services. If we are unable to successfully compete with current and new competitors, or if we are unable to anticipate and adapt our offerings to changing banking industry trends, including technological changes, our business may be adversely affected. In addition, our failure to effectively anticipate or adapt to emerging technologies or changes in customer behaviour, including among younger customers, could delay or prevent our access to new digital-based markets, which would in turn have an adverse effect on our competitive position and business. Furthermore, the widespread adoption of new technologies, including distributed ledger, AI and/or biometrics, to provide services such as digital currencies, cryptocurrencies and payments, could require substantial expenditures to modify or adapt our existing products and services as we continue to grow our internet and mobile banking capabilities and could entail new direct risks (including financial and non-financial risks) and indirect risks related to loss of business opportunities. Our customers may choose to conduct business or offer products in areas that may be considered speculative or risky. Further growth of such new technologies and mobile banking platforms could negatively impact the value of our investments in bank premises, equipment and personnel for our branch network. The persistence or acceleration of this shift in demand towards internet and mobile banking may necessitate further changes to our retail distribution strategy, which may include closing, restructuring and/or selling certain branches (as we have been doing in recent years). These actions could lead to losses on these assets and may lead to increased expenditures to renovate, reconfigure or close a number of our remaining branches or to otherwise reform our retail distribution channel. Furthermore, our failure to implement such changes to our distribution strategy swiftly and effectively could have an adverse effect our competitive position. As part of these restructuring processes, in 2021 we faced costs for a net impact of EUR -530 million, mainly in the UK and Portugal, while no restructuring costs were accounted for in 2022 and 2023.
In particular, we face the challenge to compete in an ecosystem where the relationship with the consumer is based on access to digital data and interactions. This access is increasingly dominated by digital platforms who are already eroding our results in very relevant markets such as payments. This privileged access to data can be used as a leverage to compete with us in other adjacent markets and may reduce our operations and margins in core businesses such as lending or wealth management. The alliances that our competitors are starting to build with large technology firms can make it more difficult for us to successfully compete with them and could adversely affect us.
Increasing competition could also require that we increase our rates offered on deposits or lower the rates we charge on loans, which could also have a material adverse effect on us, including our profitability. It may also negatively affect our
866 | ||
business results and prospects by, among other things, limiting our ability to increase our customer base and expand our operations and increasing competition for investment opportunities.
If our customer service levels were perceived by the market to be materially below those of our competitor financial institutions, we could lose existing and potential business. If we are not successful in retaining and strengthening customer relationships, we may lose market share, incur losses on some or all of our activities or fail to attract new deposits or retain existing deposits, which could have a material adverse effect on our operating results, financial condition and prospects.
2.6.5 If we are unable to manage the growth of our operations, to integrate successfully our inorganic growth, or to execute successfully any of our strategic actions, this could have an adverse impact on our profitability.
We allocate management and planning resources to develop strategic plans for organic growth, and to identify possible acquisitions and disposals and areas for restructuring our businesses. From time to time, we evaluate acquisition and partnership opportunities that we believe offer additional value to our shareholders and are consistent with our business strategy. However, we may not be able to identify suitable acquisition or partnership candidates, and our ability to benefit from any such acquisitions and partnerships will depend in part on our successful integration of those businesses. Any such integration entails significant risks such as unforeseen difficulties in integrating operations and systems, unexpected liabilities or contingencies relating to the acquired businesses, including legal claims and delivery and execution risks. We can give no assurances that our expectations with regards to integration and synergies will materialize. We also cannot provide assurance that we will, in all cases, be able to manage our growth effectively or deliver our strategic growth objectives. Challenges that may result from our strategic growth decisions include our ability to:
•manage efficiently the operations and employees of expanding businesses;
•maintain or grow our existing customer base;
•assess the value, strengths and weaknesses of investment or acquisition candidates, including local regulation that can reduce or eliminate expected synergies;
•finance strategic investments or acquisitions;
•align our current information technology systems adequately with those of an enlarged group;
•apply our risk management policy effectively to an enlarged group; and
•manage a growing number of entities without over-committing management or losing key personnel.
Any failure to manage growth effectively or to execute successfully any of our strategic actions could have a material
adverse effect on our operating results, financial condition and prospects.
In addition, any acquisition or venture could result in the loss of key employees and inconsistencies in standards, controls, procedures and policies.
Moreover, the success of the acquisition or venture will at least in part be subject to a number of political, economic and other factors that are beyond our control. Any of these factors, individually or collectively, could have a material adverse effect on us.
Furthermore, there is no assurance that the changes to our operating model that became effective on 1 January 2024, which included the reorganization of our primary and secondary segments, will yield all of the expected benefits in the timeframes that we expect, if at all.
2.7 Risk management
2.7.1 Failure to successfully implement and continue to improve our risk management policies, procedures and methods, including our credit risk management systems, could materially and adversely affect us, and we may be exposed to unidentified or unanticipated risks.
Risk management is a central part of our activities. We seek to manage and control our risk exposure through a forward-looking management model, based on robust governance and advanced risk management tools, supported by a risk culture that permeates the organization. While our management model uses a broad and diversified set of risk monitoring, control and mitigation techniques, such management model may not be fully effective at mitigating our risk exposure in all economic market environments or against all types of risk, including risks that we may fail to identify or anticipate.
Some of our tools and metrics for managing risk are based on our use of observed historical market behaviour. We apply statistical and other tools to these observations to arrive at quantifications of our risk exposures. These tools and metrics may fail to predict future risk exposures. These risk exposures could, for example, arise from factors we did not anticipate or correctly evaluate in our statistical models. This would limit our ability to manage our risks. Thus, our losses could be significantly higher than the historical measures indicate. In addition, our statistical models may not take all risks into account or measure emerging risks correctly.
Our approach to managing risks could prove insufficient, exposing us to material unanticipated losses. We could face adverse consequences as a result of decisions, which may lead to actions by management, based on models that are poorly developed, implemented or used, or as a result of the modelled outcome being misunderstood or the use of such information for purposes for which it was not designed. If existing or potential customers or counterparties believe our risk management is inadequate, they could take their business elsewhere or seek to limit their transactions with us. Any of these factors could have a material adverse effect on our reputation, operating results, financial condition and prospects.
867 | ||
| Cross-reference to Form 20-F | Consolidated directors' report | Consolidated financial statements | Supplemental information | |||||||||||||||||
As a retail bank, one of the main types of risks inherent in our business is credit risk. For example, an important feature of our credit risk management system is to employ an internal credit rating to assess the particular risk profile of individual customers and SMEs. As this process involves detailed analyses of the customer, taking into account both quantitative and qualitative factors, it is subject to human or information technology systems errors. In exercising their judgement on our customers' current or future credit risk behaviour, our management models may not always be able to assign an accurate credit rating, which may result in a higher exposure to credit risks than indicated by our risk rating system.
Some of the models and other analytical and judgement-based estimations we use in managing risks are subject to review by, and require the approval of, our regulators. If models do not comply with all their expectations, our regulators may require us to make changes to such models, may approve them with additional capital requirements or we may be precluded from using them. Any of these possible situations could limit our ability to expand our businesses or have a material impact on our financial results.
We set concentration limits according to risk appetite, we develop risk policies and reviews to manage credit risk concentration and we are subject to regulatory limits on large exposures. However, if we fail to anticipate deteriorating sectors or regions, we fail to comply with internal or regulatory concentration limits, or if one or more of our largest borrowers fail to service their loans, our operating results, financial condition and prospects could be adversely affected.
Failure to effectively implement, consistently monitor or continuously improve our credit risk management system may result in an increase in the level of non-performing loans and a higher risk exposure for us, which could have a material adverse effect on us.
In addition, failure to successfully execute any of our decisions and actions affecting or changing our practices, operations, priorities, strategies, policies, procedures, or frameworks, could have a material adverse effect on us.
Our board of directors is responsible for the approval of the Group’s general policies and strategies, and in particular for the corporate risk framework. In addition to the executive committee, which maintains a special focus on risk, the board has a specific risk supervision, regulation and compliance committee. See more information in section 2.3 ‘Risk and Compliance governance’ in the 'Risk management and compliance' chapter and in section 4 'Board of directors' in the 'Corporate governance' chapter in Part 1 of this annual report on Form 20-F.
2.8 Model risk
2.8.1 We rely on models for many of our decisions. Their inaccurate or incorrect use could have a material adverse effect on us.
We use models for admission (scoring and rating) and behavioural credit processes, for the calculation of capital, provisions, market and structural risk, operational, compliance and liquidity risk. A model is a system, approach or quantitative method that applies statistical, economic, financial or mathematical theories, techniques or hypotheses to transform input data into quantitative estimates and forecasts. It involves simplified representations of real world relationships between characteristics, values and observed assumptions that allows us to focus on specific aspects.
Model risk is the negative consequence of decisions based on inaccurate, improper or incorrect use of models. Sources of model risk include (i) incorrect or incomplete data in the model itself or the modelling method used in systems; and (ii) incorrect use or implementation of the model.
Model risk can cause financial loss, erroneous commercial and strategic decision-making or damage to our transactions any of which could have a material adverse effect on our operating results, financial condition and prospects. In addition, our regulatory models and the underlying methodologies are subject to scrutiny from our supervisors, who could identify potential weaknesses or deficiencies that may result in enforcement actions, including sanctions, fines and/or the imposition of stricter capital requirements, as well as mandates and recommendations with respect to the methodologies underlying our models, which could also lead us to more onerous or inefficient capital consumptions.
Unprecedented movement in economic and market drivers related to external events such as the war in Ukraine, the conflict in the Middle East and the covid-19 pandemic, required monitoring and adjustment of financial models (including credit loss models, capital models, traded risk models and models used in the asset/liability management process) to comply with the guidance and recommendations of standard setters, regulators and supervisors, particularly for credit loss models. It also resulted in the use of mitigants for model limitations, such as adjustments to model outputs to reflect consideration of management judgment. The performance and usage of models was and may continue to be impacted by the consequences of external events. In addition, data obtained during these external events may not be representative and may distort the calibration of the models in the future, which could have a material adverse effect on us.
In addition, the fair value of our financial assets, determined using financial valuation models, may be inaccurate or subject to change and, as a consequence, we may have to register impairments or write-downs that could have a material adverse effect on our operating results, financial condition and prospects. See more information in risk factor '2.5.3 Market conditions have resulted and could result in material changes to the estimated fair values of our financial assets. Negative fair value adjustments could have a material adverse effect on our operating results, financial condition and prospects'.
3. General risks
868 | ||
3.1 Risks related to our industry
3.1.1 Climate change can create transition risks, physical risks, and other risks that could adversely affect us.
There is an increasing focus over the risks of climate change and related environmental sustainability matters. Climate change may imply two primary drivers of financial risk that could adversely affect us:
•Transition risks associated with the move to a low-carbon economy, both at idiosyncratic and systemic levels, such as through policy, regulatory and technological changes and business and consumer preferences, which could increase our expenses and impact our strategies.
•Physical risks related to discrete events, such as flooding and wildfires, and extreme weather impacts and longer-term shifts in climate patters, such as extreme heat, sea level rise and more frequent and prolonged drought, which could result in financial losses that could impair asset values and the creditworthiness of our customers. Such events could disrupt our operations or those of our customers or third parties on which we rely and do business with, including through direct damage to assets and indirect impacts from supply chain disruption and market volatility.
These primary drivers could materialize, among others, in the following financial risks:
•Credit risks: Physical climate change could lower corporate revenues, increase operating costs and lead to increased credit exposure. Severe weather could also affect collateral value. Additionally, companies with business models not aligned with the transition to a low-carbon economy may face a higher risk of reduced corporate earnings and business disruption due to new regulations or market shifts.
•Market risks: Market changes in the most carbon-intensive sectors could affect energy and commodity prices, corporate bonds, equities and certain derivatives contracts. Increasing frequency of severe weather events could affect macroeconomic conditions, weakening fundamental factors such as economic growth, employment and inflation and lead to higher volatility.
•Liquidity risks: Companies could face liquidity risks derived from cash outflows to improve their reputation in the market or solve climate-related problems. Extreme weather events could also affect the value of our high-quality liquid assets or cause sovereign debt to rise limiting our access to capital markets.
•Operational risks: Severe weather events could directly damage assets and impact business continuity, both our customers' and ours. Climate-related financial risks could also cause operational risk losses from litigation if, for example, we are perceived to misrepresent sustainability-related practices, achievements, metrics goals or targets.
•Regulatory compliance risks: Increased regulatory compliance risk may result from the increasing focus, pace, breadth and depth of regulatory expectations requiring implementation in short timeframes across multiple jurisdictions and from changes in public policy, laws and regulations in connection with climate change and related environmental sustainability matters.
•Reputational risks: Our reputation and client relationships may be damaged as a result of our practices, disclosures and decisions related to climate change and the environment, or to the practices or involvement of our clients, vendors or suppliers in certain industries or projects being associated with causing or exacerbating climate change. Furthermore, parties who may suffer losses from the effects of climate change may seek compensation from those they hold responsible such as state entities, regulators, investors and lenders. We could face conduct risks derived from misrepresentations in our sustainability-related disclosures, including our practices, achievements, metrics, goals and targets or the sustainability characteristics of our products or of our customers, investors or other stakeholders (greenwashing).
•Strategic risks: Our strategy could be affected if we fail to achieve our net-zero or other targets, including those related to the activities that we finance and those concerning our own operations.
As climate risk is interconnected with all key risk types, we have developed and continue to enhance processes to embed climate risk considerations into our core processes and risk management cycle; however, because the timing and severity of climate change may not be predictable and is rapidly evolving, our risk management strategies may not be effective in mitigating climate risk exposure. Additionally, we may become subject to new or heightened regulatory requirements relating to climate change, which may result in increased regulatory, compliance or other costs. As the risks, perspective and focus of regulators, shareholders, employees, and other stakeholders regarding climate change are evolving rapidly, it can be difficult to assess the ultimate impact on us of climate change-related risks, compliance risks, and uncertainties.
We periodically disclose information such as emissions and other climate-related performance data, statistics, metrics and/or targets. If we lack robust and high-quality climate-related procedures, controls and data, we may not be able to disclose reliable climate-related information. In addition, because the climate-related information is based on current expectations and future estimates about Santander's and third-parties' operations and businesses and addresses matters that are uncertain to varying degrees, we may not be able to meet our estimates, targets or commitments or we may not be able to achieve them within the timelines we announce. Actual or perceived shortcomings with respect to these emissions and other climate-related initiatives and reporting could result in litigation or regulatory enforcement and impact our ability to hire and retain employees, increase our customer base, and attract and retain certain types of investors.
869 | ||
| Cross-reference to Form 20-F | Consolidated directors' report | Consolidated financial statements | Supplemental information | |||||||||||||||||
Any of the conditions described above, or our failure to identify other climate-related risks, could have a material adverse effect on our business, financial condition and results of operations.
3.1.2 The financial problems faced by our customers could adversely affect us.
Potential market turmoil and economic recession could materially and adversely affect the liquidity, credit ratings, businesses and/or financial conditions of our customers, which could in turn increase our non-performing loan ratios, impair our loan and other financial assets and result in decreased demand for borrowings and deposits in general. In addition, our customers may further significantly decrease their risk tolerance to non-deposit investments such as stocks, bonds and mutual funds, which would adversely affect our fee and commission income. Any of the conditions described above could have a material adverse effect on our business, financial condition and results of operations.
3.1.3 Our ability to maintain our competitive position depends, in part, on the success of new products and services we offer our customers and on our ability to offer products and services that meet the customers’ needs during the whole life cycle of the products or services. Our failure to manage various risks we face as we expand our range of products and services could have a material adverse effect on us.
The success of our operations and our profitability depends, in part, on the success of new products and services we offer our customers and our ability to offer products and services that meet their needs during their entire life cycle. However, our customers’ needs or desires may change over time, and such changes may render our products and services obsolete, outdated or unattractive, and we may not be able to develop new products that meet our customers’ changing needs. Our success is also dependent on our ability to anticipate and leverage new and existing technologies that may have an impact on products and services in the banking industry. Technological changes may further intensify and complicate the competitive landscape and influence customer behaviour. If we cannot respond in a timely fashion to the changing needs of our customers, we may lose existing or potential customers, which could in turn materially and adversely affect us. In addition, the cost of developing products is likely to affect our results of operations.
As we expand the range of our products and services, some of which may be at an early stage of development in the markets of certain regions where we operate, we will be exposed to new and potentially increasingly complex risks, such as the conduct risk in the relationship with customers, and development expenses. Our employees and risk management systems, as well as our experience and that of our partners may not be sufficient to enable us to properly manage such risks. Any or all of these factors, individually or collectively, could have a material adverse effect on us.
While we have successfully increased our customer service levels in recent years, should these levels ever be perceived by the market to be materially below those of our competitor financial institutions, we could lose existing and potential
new business. If we are not successful in retaining and strengthening customer relationships, we may lose market share, incur losses on some or all of our activities or fail to attract new deposits or retain existing deposits, which could have a material adverse effect on our operating results, financial condition and prospects.
3.1.4 We rely on recruiting, retaining and developing appropriate senior management and skilled personnel.
Our continued success depends in part on the continued service of key members of our senior executive team and other key employees. The ability to continue to attract, train, motivate and retain highly qualified and talented professionals is a key element of our strategy. The successful implementation of our strategy and culture depends on the availability of skilled and appropriate management, both at our head office and in each of our business units. If we or one of our business units or other functions fails to staff its operations appropriately or loses one or more of its key senior executives or other key employees and fails to replace them in a satisfactory and timely manner, our business, financial condition and results of operations, including control and operational risks, may be adversely affected.
Our ability to attract and retain qualified employees is affected by perceptions of our culture, social and corporate governance policies and management, our profile in the markets in which we operate and the professional opportunities we offer.
In addition, the financial industry has and may continue to experience more stringent regulation of employee compensation, which could have an adverse effect on our ability to hire or retain the most qualified employees. If we fail or are unable to attract and appropriately train, motivate and retain qualified professionals, our business may also be adversely affected.
3.1.5 Damage to our reputation could cause harm to our business prospects.
Maintaining a robust risk management framework based on robust ethical principles and corporate values is critical to protect our reputation and our brand, attract and retain customers, investors and employees and conduct business transactions with counterparties. Damage to our reputation could materially and adversely affect our perception among current and potential clients, investors, vendors, partners, regulators and other third parties, which in turn could have a material adverse effect on our operating results, financial condition, and prospects as well as damage our customers' and investors' confidence and the market price of our securities. Harm to our reputation could arise from numerous sources, including, among others, employee misconduct, including the possibility of fraud perpetrated by our employees, litigation or regulatory enforcement, failure to deliver minimum standards of service and quality, negative perceptions regarding our ability to maintain the security of our technology systems and protect customer data (including as a result of a cybersecurity incident), dealing with sectors that are not well perceived by the public (weapons industries or embargoed countries, for example), dealing with customers in sanctions lists, rating downgrades, significant
870 | ||
variations in our share price throughout the year, compliance failures, unethical behaviour, actual or alleged conduct in any number of activities, including lending practice, sales and marketing, corporate governance and corporate culture, and the activities of customers and counterparties, including activities that negatively affect the environment. Our reputation could also suffer if we are the subject of negative coverage in the media, whether it has merit or not.
Actions by the financial services industry generally or by certain members of, or individuals in, the industry can also affect our reputation. For example, the role played by financial services firms in the financial crisis and the seeming shift toward increasing regulatory supervision and enforcement has caused public perception of us and others in the financial services industry to decline.
Additionally, we could suffer significant reputational harm that could affect our business, results of operations and prospects from any negative perceptions regarding topics related to environmental, social and corporate governance policies. There has been increased focus by customers, shareholders, investor advocacy groups, employees, regulators and other stakeholders on these topics, and our policies, practices and disclosures in these areas could come under scrutiny. Governments may implement new or additional regulations and standards or investors, customers and other stakeholders may impose new expectations or focus investments in ways that cause significant shifts in disclosure, consumption and behaviours that may have negative impacts on our business. If regulators or stakeholders consider our efforts to be ineffective, inadequate or unsatisfactory, whether real or perceived, it could harm our reputation, business and prospects and we could be subject to enforcement, other supervisory actions or other harm.
We could also suffer significant reputational harm if we fail to identify and manage potential conflicts of interest properly. The failure, or perceived failure, to adequately address conflicts of interest could affect the willingness of clients to deal with us, or give rise to litigation or enforcement actions against us, which could have an adverse effect on our operating results, financial condition and prospects.
We may be the subject of misinformation and misrepresentations deliberately propagated in media or social media to harm our reputation or for other deceitful purposes, or by profiteering short sellers seeking to gain an illegal market advantage by spreading false information about us. There can be no assurance that we will effectively neutralize and contain a false information that may be propagated regarding the Group, which could have an adverse effect on our operating results, financial condition and prospects.
3.1.6 We engage in transactions with our subsidiaries or affiliates that others may not consider to be on an arm’s-length basis.
We and our affiliates have entered into a number of services agreements pursuant to which we render services, such as
administrative, accounting, finance, treasury, legal services and others.
Spanish and US law provide for several procedures designed to ensure that the transactions entered into with or among our financial subsidiaries and/or affiliates do not deviate from prevailing market conditions for those types of transactions.
We are likely to continue to engage in transactions with our affiliates. Future conflicts of interests may arise between us and any of our affiliates, or among our affiliates, which may not be resolved in our favour.
3.2 Reporting and control risks
3.2.1 Changes in accounting standards could impact reported earnings.
The accounting standard setters and other regulatory bodies periodically change the financial accounting and reporting standards that govern the preparation of our consolidated financial statements. These changes can materially impact how we record and report our financial condition and results of operations, as well as affect the calculation of our capital ratios. In some cases, we could be required to apply a new or revised standard retroactively, resulting in the restatement of prior period financial statements. For further information about developments in financial accounting and reporting standards, see note 1 to our 'Consolidated financial statements' included in Part 1 of this annual report on Form 20-F.
3.2.2 Our financial statements are based in part on assumptions and estimates which, if inaccurate, could cause material misstatement of the results of our operations and financial position.
The preparation of financial statements requires management to make judgements, estimates and assumptions that affect the reported amounts of assets, liabilities, income and expenses. Due to the inherent uncertainty in making estimates, actual results reported in future periods may be based upon amounts which differ from those estimates. Estimates, judgements and assumptions are continually evaluated and are based on historical experience and other factors, including expectations of future events that are believed to be reasonable under the circumstances. Revisions to accounting estimates are recognized in the period in which the estimate is revised and in any future periods affected. The accounting policies deemed critical to our results and financial position, based upon materiality and significant judgements and estimates, include impairment of loans and advances, goodwill impairment, valuation of financial instruments, deferred tax assets provision and pension obligation for liabilities.
If the judgement, estimates and assumptions we use in preparing our consolidated financial statements are subsequently found to be incorrect, there could be a material effect on our results of operations and a corresponding effect on our funding requirements and capital ratios.
3.2.3 Disclosure controls and procedures over financial and non-financial reporting may not prevent or detect all errors or acts of fraud.
871 | ||
| Cross-reference to Form 20-F | Consolidated directors' report | Consolidated financial statements | Supplemental information | |||||||||||||||||
Disclosure controls and procedures, including internal controls over financial and non-financial reporting (including climate-related reporting), are designed to provide reasonable assurance that information required to be disclosed by the company in reports filed or submitted under the Exchange Act is accumulated and communicated to management, and recorded, processed, summarized and reported within the time periods specified in the US Securities and Exchange Commission’s rules and forms. These disclosure controls and procedures have inherent limitations which include the possibility that judgements in decision-making can be faulty and that breakdowns occur because of errors or mistakes. Additionally, controls can be circumvented by any unauthorized override of the controls. Consequently, our businesses are exposed to risk from potential non-compliance with policies, employee misconduct or negligence and fraud, which could result in regulatory sanctions, civil claims and serious reputational or financial harm. In recent years, a number of multinational financial institutions have suffered material losses due to the actions of ‘rogue traders’ or other employees. It is not always possible to deter employee misconduct and the precautions we take to prevent and detect this activity may not always be effective. Accordingly, because of the inherent limitations in the control system, misstatements due to error or fraud may occur and not be detected.
3.3 Foreign private issuer and other risks
3.3.1 Our corporate disclosure may differ from disclosure regularly published by issuers of securities in other countries, including the United States.
Issuers of securities in Spain are required to make public disclosures that are different from, and that may be reported under presentations that are not consistent with, disclosures required in other countries, including the United States. In particular, for regulatory purposes, we currently prepare and will continue to prepare and make available to our shareholders statutory financial statements in accordance with IFRS-IASB, which differs from US Generally Accepted Accounting Principles in a number of respects. In addition, as a foreign private issuer, we are not subject to the same disclosure requirements in the United States as a domestic US registrant under the Exchange Act, including the requirements to prepare and issue quarterly reports, the proxy rules applicable to domestic US registrants under Section 14 of the Exchange Act or the insider reporting and short-swing profit rules under Section 16 of the Exchange Act. Accordingly, the information about us available to you will not be the same as the information available to shareholders of a US company and may be reported in a manner that you are not familiar with.
3.3.2 Investors may find it difficult to enforce civil liabilities against us or our directors and officers.
The majority of our directors and officers reside outside of the United States. In addition, a substantial portion of our assets and the assets of our directors and officers are located
outside of the United States. Although we have appointed an agent for service of process in any action against us in the United States, none of our directors or officers has consented to service of process in the United States or to the jurisdiction of any United States court. As a result, it may be difficult for investors to effect service of process within the United States on such persons.
Additionally, investors may experience difficulty in Spain enforcing foreign judgements obtained against us and our executive officers and directors, including in any action based on civil liabilities under the US federal securities laws. Based on the opinion of Spanish counsel, there is doubt as to the enforceability against such persons in Spain, whether in original actions or in actions to enforce judgements of US courts, of liabilities based solely on the US federal securities laws.
3.3.3 As a holder of ADSs you will have different shareholders’ rights than do shareholders of companies incorporated in the United States and certain other jurisdictions.
Our corporate affairs are governed by our Bylaws and by Spanish corporate law, which may differ from the legal principles that would apply if we were incorporated in a jurisdiction in the United States or in certain other jurisdictions outside Spain. Under Spanish corporate law, you may have fewer and less well-defined rights to protect your interests than under the laws of other jurisdictions outside Spain.
Although Spanish corporate law imposes restrictions on insider trading and price manipulation, the form of these regulations and the manner of their enforcement may differ from that in the US securities markets or markets in certain other jurisdictions. In addition, in Spain, self-dealing and the preservation of shareholder interests may be regulated differently, which could potentially disadvantage you as a holder of the shares underlying ADSs.
3.3.4 ADS holders may be subject to additional risks related to holding ADSs rather than shares.
Because ADS holders do not hold their shares directly, they are subject to the following additional risks, among others:
•as an ADS holder, you may not be able to exercise the same shareholder rights as a direct holder of ordinary shares;
•we and the depositary may amend or terminate the deposit agreement without the ADS holders’ consent in a manner that could prejudice ADS holders or that could affect the ability of ADS holders to transfer ADSs; and
•the depositary may take or be required to take actions under the Deposit Agreement that may have adverse consequences for some ADS holders in their particular circumstances.
872 | ||
5. Information on the company
5.1. Average balance sheets and interest rates
The following tables include, by domicile of the Group entity at which the relevant asset or liability is accounted for, our average balances and interest rates for the past three years. Domestic balances are those of Group entities domiciled in Spain, which reflect our domestic activities, and international balances are those of Group entities domiciled outside of Spain, which reflect our foreign activities.
To better understand the behaviour of average balance sheets and interest rates, we have split our foreign activities into 'International - Mature markets’ which include Europe (except for Spain and Poland) and the United States and ‘International - Developing markets’ which include South America, Mexico and Poland.
You should read the following tables and the tables included under '-Changes in Interest Income / (charges) -Volume and Rate Analysis' and '-Assets-Earning Assets-Yield Spread' in conjunction with the following:
•We have included in interest income loan arrangement fees and other similar items;
•We have not recalculated tax-exempt income on a tax-equivalent basis because the effect of doing so would not be significant;
•We have included income and expenses from interest-rate hedging transactions as a separate line item under interest income and expenses if these transactions qualify for hedge accounting under IFRS-IASB. If these transactions did not qualify for such treatment, we have included income and expenses on these transactions elsewhere in our income statement. See note 2 to our 'Consolidated financial statements' included in Part 1 of this annual report on Form 20-F for a discussion of our accounting policies for hedging activities;
•We have stated average loan balances on a net basis, netting our allowances for credit losses; and
•All average data have been calculated as the simple average of month-end balances over the relevant date range, which is not significantly different from having used daily averages.
873 | ||
| Cross-reference to Form 20-F | Consolidated directors' report | Consolidated financial statements | Supplemental information | |||||||||||||||||
| Year ended 31 December, | |||||||||||||||||||||||||||||||||||
| 2023 | 2022 | 2021 | |||||||||||||||||||||||||||||||||
| ASSETS | Average Balance | Interest | Average Rate | Average Balance | Interest | Average Rate | Average Balance | Interest | Average Rate | ||||||||||||||||||||||||||
| (in millions of euros, except percentages) | |||||||||||||||||||||||||||||||||||
| Cash balances at central banks and other deposits on demand, and loans and advances to central banks and credit institutions (A) | 310,887 | 16,467 | 5.30 | % | 304,935 | 7,139 | 2.34 | % | 265,417 | 2,682 | 1.01 | % | |||||||||||||||||||||||
| Domestic | 117,332 | 4,694 | 4.00 | % | 111,697 | 1,166 | 1.04 | % | 112,621 | 809 | 0.72 | % | |||||||||||||||||||||||
| International - Mature markets | 124,570 | 5,611 | 4.50 | % | 139,105 | 1,971 | 1.42 | % | 109,672 | 542 | 0.49 | % | |||||||||||||||||||||||
| International - Developing markets | 68,985 | 6,162 | 8.93 | % | 54,133 | 4,002 | 7.39 | % | 43,124 | 1,331 | 3.09 | % | |||||||||||||||||||||||
| Of which | |||||||||||||||||||||||||||||||||||
| Reverse repurchase agreements | 55,570 | 4,745 | 8.54 | % | 39,572 | 1,862 | 4.71 | % | 38,236 | 707 | 1.85 | % | |||||||||||||||||||||||
| Domestic | 24,292 | 1,336 | 5.50 | % | 19,072 | 146 | 0.77 | % | 23,390 | 29 | 0.12 | % | |||||||||||||||||||||||
| International - Mature markets | 4,845 | 278 | 5.74 | % | 4,713 | 55 | 1.17 | % | 5,101 | 15 | 0.29 | % | |||||||||||||||||||||||
| International - Developing markets | 26,433 | 3,131 | 11.85 | % | 15,787 | 1,661 | 10.52 | % | 9,745 | 663 | 6.80 | % | |||||||||||||||||||||||
| Loans and advances to customers | 1,036,547 | 70,619 | 6.81 | % | 1,031,226 | 54,110 | 5.25 | % | 943,071 | 38,649 | 4.10 | % | |||||||||||||||||||||||
| Domestic | 265,322 | 10,581 | 3.99 | % | 272,826 | 5,929 | 2.17 | % | 254,232 | 4,799 | 1.89 | % | |||||||||||||||||||||||
| International - Mature markets | 546,641 | 28,771 | 5.26 | % | 552,674 | 19,821 | 3.59 | % | 513,910 | 16,090 | 3.13 | % | |||||||||||||||||||||||
| International - Developing markets | 224,584 | 31,267 | 13.92 | % | 205,726 | 28,360 | 13.79 | % | 174,929 | 17,760 | 10.15 | % | |||||||||||||||||||||||
| Of which | |||||||||||||||||||||||||||||||||||
| Reverse repurchase agreements | 46,382 | 3,603 | 7.77 | % | 43,505 | 1,026 | 2.36 | % | 36,660 | 60 | 0.16 | % | |||||||||||||||||||||||
| Domestic | 8,725 | 261 | 2.99 | % | 9,509 | 42 | 0.44 | % | 9,521 | 7 | 0.07 | % | |||||||||||||||||||||||
| International - Mature markets | 36,546 | 3,210 | 8.78 | % | 33,068 | 919 | 2.78 | % | 25,622 | 18 | 0.07 | % | |||||||||||||||||||||||
| International - Developing markets | 1,111 | 132 | 11.88 | % | 928 | 65 | 7.00 | % | 1,517 | 35 | 2.31 | % | |||||||||||||||||||||||
| Debt securities | 224,304 | 14,501 | 6.46 | % | 183,013 | 10,416 | 5.69 | % | 168,834 | 5,724 | 3.39 | % | |||||||||||||||||||||||
| Domestic | 71,507 | 2,503 | 3.50 | % | 45,932 | 809 | 1.76 | % | 42,740 | 313 | 0.73 | % | |||||||||||||||||||||||
| International - Mature markets | 51,327 | 1,444 | 2.81 | % | 43,877 | 803 | 1.83 | % | 40,579 | 446 | 1.10 | % | |||||||||||||||||||||||
| International - Developing markets | 101,470 | 10,554 | 10.40 | % | 93,204 | 8,804 | 9.45 | % | 85,515 | 4,965 | 5.81 | % | |||||||||||||||||||||||
| Income from hedging operations | 3,561 | (236) | (723) | ||||||||||||||||||||||||||||||||
| Domestic | (45) | 16 | 20 | ||||||||||||||||||||||||||||||||
| International - Mature markets | 2,955 | 480 | (91) | ||||||||||||||||||||||||||||||||
| International - Developing markets | 651 | (732) | (652) | ||||||||||||||||||||||||||||||||
| Other interest | 104 | 1 | 131 | ||||||||||||||||||||||||||||||||
| Domestic | (47) | (121) | (29) | ||||||||||||||||||||||||||||||||
| International - Mature markets | 63 | 40 | 13 | ||||||||||||||||||||||||||||||||
| International - Developing markets | 88 | 82 | 147 | ||||||||||||||||||||||||||||||||
| Total Interest earning assets | 1,571,738 | 105,252 | 6.70 | % | 1,519,174 | 71,430 | 4.70 | % | 1,377,322 | 46,463 | 3.37 | % | |||||||||||||||||||||||
| Domestic | 454,161 | 17,686 | 3.89 | % | 430,455 | 7,799 | 1.81 | % | 409,593 | 5,912 | 1.44 | % | |||||||||||||||||||||||
| International - Mature markets | 722,538 | 38,844 | 5.38 | % | 735,656 | 23,115 | 3.14 | % | 664,161 | 17,000 | 2.56 | % | |||||||||||||||||||||||
| International - Developing markets | 395,039 | 48,722 | 12.33 | % | 353,063 | 40,516 | 11.48 | % | 303,568 | 23,551 | 7.76 | % | |||||||||||||||||||||||
| Other non-interest earning assets | 201,365 | 201,099 | 186,577 | ||||||||||||||||||||||||||||||||
| Assets from discontinued operations | — | — | — | ||||||||||||||||||||||||||||||||
| Total Average Assets | 1,773,103 | 105,252 | 1,720,273 | 71,430 | 1,563,899 | 46,463 | |||||||||||||||||||||||||||||
Note: As of 31 December 2023, 2022 and 2021, Total average assets attributed to international activities accounted for 69%, 70% and 69%, respectively, of the Group’s Total average assets. (International - Mature markets accounted for 44%, 46% and 46% and International - Developing markets accounted for 25%, 24% and 23%, respectively).
(A) As of 31 December 2022 and 2021, interest includes income from liabilities reported in 'Deposits from central banks and credit institutions' related to funding from the European Central Bank.
874 | ||
| Year ended 31 December, | |||||||||||||||||||||||||||||||||||
| 2023 | 2022 | 2021 | |||||||||||||||||||||||||||||||||
| LIABILITIES AND STOCKHOLDERS' EQUITY | Average Balance | Interest | Average Rate | Average Balance | Interest | Average Rate | Average Balance | Interest | Average Rate | ||||||||||||||||||||||||||
| (in millions of euros, except percentages) | |||||||||||||||||||||||||||||||||||
| Deposits from central banks and credit institutions (B) | 175,164 | 9,350 | 5.34 | % | 214,879 | 3,636 | 1.69 | % | 197,997 | 1,750 | 0.88 | % | |||||||||||||||||||||||
| Domestic | 62,366 | 2,723 | 4.37 | % | 92,373 | 560 | 0.61 | % | 96,209 | 376 | 0.39 | % | |||||||||||||||||||||||
| International - Mature markets | 63,456 | 2,989 | 4.71 | % | 78,230 | 972 | 1.24 | % | 63,047 | 227 | 0.36 | % | |||||||||||||||||||||||
| International - Developing markets | 49,342 | 3,638 | 7.37 | % | 44,276 | 2,104 | 4.75 | % | 38,741 | 1,147 | 2.96 | % | |||||||||||||||||||||||
| Of which | |||||||||||||||||||||||||||||||||||
| Repurchase agreements | 55,619 | 3,737 | 6.72 | % | 34,298 | 1,349 | 3.93 | % | 28,763 | 703 | 2.44 | % | |||||||||||||||||||||||
| Domestic | 34,123 | 1,686 | 4.94 | % | 17,321 | 186 | 1.07 | % | 11,268 | 18 | 0.16 | % | |||||||||||||||||||||||
| International - Mature markets | 6,542 | 388 | 5.93 | % | 2,743 | 50 | 1.82 | % | 2,300 | 8 | 0.35 | % | |||||||||||||||||||||||
| International - Developing markets | 14,954 | 1,663 | 11.12 | % | 14,234 | 1,113 | 7.82 | % | 15,195 | 677 | 4.46 | % | |||||||||||||||||||||||
| Customer deposits | 1,011,471 | 33,238 | 3.29 | % | 963,359 | 16,994 | 1.76 | % | 870,063 | 5,452 | 0.63 | % | |||||||||||||||||||||||
| Domestic | 302,379 | 3,269 | 1.08 | % | 286,233 | 698 | 0.24 | % | 272,352 | 282 | 0.10 | % | |||||||||||||||||||||||
| International - Mature markets | 468,602 | 12,386 | 2.64 | % | 460,386 | 3,279 | 0.71 | % | 406,890 | 706 | 0.17 | % | |||||||||||||||||||||||
| International - Developing markets | 240,490 | 17,583 | 7.31 | % | 216,740 | 13,017 | 6.01 | % | 190,821 | 4,464 | 2.34 | % | |||||||||||||||||||||||
| Of which | |||||||||||||||||||||||||||||||||||
| Repurchase agreements | 73,193 | 7,084 | 9.68 | % | 57,646 | 3,199 | 5.55 | % | 41,475 | 520 | 1.25 | % | |||||||||||||||||||||||
| Domestic | 4,602 | 263 | 5.71 | % | 2,327 | 24 | 1.03 | % | 7,918 | — | — | % | |||||||||||||||||||||||
| International - Mature markets | 46,992 | 4,125 | 8.78 | % | 37,380 | 1,099 | 2.94 | % | 19,311 | 6 | 0.03 | % | |||||||||||||||||||||||
| International - Developing markets | 21,599 | 2,696 | 12.48 | % | 17,939 | 2,076 | 11.57 | % | 14,246 | 514 | 3.61 | % | |||||||||||||||||||||||
| Marketable debt securities (A) | 288,345 | 12,751 | 4.42 | % | 255,721 | 8,464 | 3.31 | % | 234,887 | 4,838 | 2.06 | % | |||||||||||||||||||||||
| Domestic | 134,045 | 4,184 | 3.12 | % | 111,682 | 2,262 | 2.03 | % | 104,602 | 1,538 | 1.47 | % | |||||||||||||||||||||||
| International - Mature markets | 108,912 | 4,219 | 3.87 | % | 107,374 | 2,262 | 2.11 | % | 102,330 | 1,670 | 1.63 | % | |||||||||||||||||||||||
| International - Developing markets | 45,388 | 4,348 | 9.58 | % | 36,665 | 3,940 | 10.75 | % | 27,955 | 1,630 | 5.83 | % | |||||||||||||||||||||||
| Of which | |||||||||||||||||||||||||||||||||||
| Commercial paper | 29,195 | 1,329 | 4.55 | % | 17,907 | 375 | 2.09 | % | 17,794 | 135 | 0.76 | % | |||||||||||||||||||||||
| Domestic | 21,509 | 888 | 4.13 | % | 12,377 | 222 | 1.79 | % | 12,247 | 22 | 0.18 | % | |||||||||||||||||||||||
| International - Mature markets | 5,641 | 243 | 4.31 | % | 4,280 | 60 | 1.40 | % | 4,582 | 59 | 1.29 | % | |||||||||||||||||||||||
| International - Developing markets | 2,045 | 198 | 9.68 | % | 1,250 | 93 | 7.44 | % | 965 | 54 | 5.60 | % | |||||||||||||||||||||||
| Other interest-bearing liabilities (C) | 23,139 | 638 | 2.76 | % | 23,861 | 216 | 0.91 | % | 27,855 | 216 | 0.78 | % | |||||||||||||||||||||||
| Domestic | 16,109 | 469 | 2.91 | % | 16,616 | 93 | 0.56 | % | 20,179 | 70 | 0.35 | % | |||||||||||||||||||||||
| International - Mature markets | 4,830 | 1 | 0.02 | % | 5,416 | 1 | 0.02 | % | 5,822 | 30 | 0.52 | % | |||||||||||||||||||||||
| International - Developing markets | 2,200 | 168 | 7.64 | % | 1,829 | 122 | 6.67 | % | 1,854 | 116 | 6.26 | % | |||||||||||||||||||||||
| Expenses from hedging operations | 4,436 | 2,055 | (368) | ||||||||||||||||||||||||||||||||
| Domestic | 1,045 | 218 | (153) | ||||||||||||||||||||||||||||||||
| International - Mature markets | 1,756 | 207 | (147) | ||||||||||||||||||||||||||||||||
| International - Developing markets | 1,635 | 1,630 | (68) | ||||||||||||||||||||||||||||||||
| Other interest | 1,578 | 1,446 | 1,205 | ||||||||||||||||||||||||||||||||
| Domestic | 567 | 435 | 306 | ||||||||||||||||||||||||||||||||
| International - Mature markets | 304 | 186 | 109 | ||||||||||||||||||||||||||||||||
| International - Developing markets | 707 | 825 | 790 | ||||||||||||||||||||||||||||||||
| Total interest-bearing liabilities | 1,498,119 | 61,991 | 4.14 | % | 1,457,820 | 32,811 | 2.25 | % | 1,330,802 | 13,093 | 0.98 | % | |||||||||||||||||||||||
| Domestic | 514,899 | 12,257 | 2.38 | % | 506,904 | 4,266 | 0.84 | % | 493,342 | 2,419 | 0.49 | % | |||||||||||||||||||||||
875 | ||
| Cross-reference to Form 20-F | Consolidated directors' report | Consolidated financial statements | Supplemental information | |||||||||||||||||
| Year ended 31 December, | |||||||||||||||||||||||||||||||||||
| 2023 | 2022 | 2021 | |||||||||||||||||||||||||||||||||
| LIABILITIES AND STOCKHOLDERS' EQUITY | Average Balance | Interest | Average Rate | Average Balance | Interest | Average Rate | Average Balance | Interest | Average Rate | ||||||||||||||||||||||||||
| (in millions of euros, except percentages) | |||||||||||||||||||||||||||||||||||
| International - Mature markets | 645,800 | 21,655 | 3.35 | % | 651,406 | 6,907 | 1.06 | % | 578,089 | 2,595 | 0.45 | % | |||||||||||||||||||||||
| International - Developing markets | 337,420 | 28,079 | 8.32 | % | 299,510 | 21,638 | 7.22 | % | 259,371 | 8,079 | 3.11 | % | |||||||||||||||||||||||
| Other non-interest bearing liabilities | 173,299 | 163,832 | 138,824 | ||||||||||||||||||||||||||||||||
| Non-Controlling interest | 8,650 | 8,635 | 10,140 | ||||||||||||||||||||||||||||||||
| Stockholders' Equity | 93,035 | 89,986 | 84,133 | ||||||||||||||||||||||||||||||||
| Liabilities from discontinued operations | — | — | — | ||||||||||||||||||||||||||||||||
| Total average liabilities and Stockholders' Equity | 1,773,103 | 61,991 | 1,720,273 | 32,811 | 1,563,899 | 13,093 | |||||||||||||||||||||||||||||
Note: As of 31 December 2023, 2022 and 2021, Total average liabilities attributed to international activities accounted for 65%, 65% and 63%, respectively, of the Group’s Total average liabilities. (International - Mature markets accounted for 41%, 43% and 42% and International - Developing markets accounted for 24%, 22% and 21%, respectively).
(A)Does not include contingently convertible preference shares and perpetual subordinated notes because they do not accrue interests. We include them under 'Other non-interest bearing liabilities'.
(B)As of 31 December 2022 and 2021, interest includes expenses from assets reported in 'Cash and deposits on demand and loans and advances to central banks and credit institutions' related to liquidity placed in the European Central Bank.
(C) Includes 'Liabilities under insurance or reinsurance contracts', reflecting the retrospective application of the new accounting standard IFRS 17 from 1 January 2023, which meant the reclassification of a portfolio of products for approximately EUR 16 billion registered as of 31 December 2022 (EUR 18 billion at 31 December 2021) in 'Customer deposits' to 'Liabilities under insurance or reinsurance contracts' (see note 1.b to our consolidated financial statements in Part 1 of this report). The 2022 and 2021 average balance information has been updated for comparative purposes but not the Interest information, following the approach adopted by the Group in the financial statements.
Changes in Interest Income / (Charges)-Volume and Rate Analysis
The following tables include, by domicile of the Group entity at which the relevant asset or liability is accounted for, changes in our net interest income attributable to changes in average volume and changes in average rate for 2023 compared to 2022 and 2022 compared to 2021. We have calculated volume variances based on changes in average balances and rate variances based on changes in interest rates on average interest-earning assets and average interest-bearing liabilities, as applicable. You should read the following tables and the footnotes thereto in light of our observations noted in the preceding sub-section entitled ‘-Average Balance Sheets and Interest Rates'.
876 | ||
Year ended 31 December, | |||||||||||
| 2023 / 2022 | |||||||||||
Increase (Decrease) due to changes in | |||||||||||
INTEREST INCOME | Volume (1) | Rate (2) | Net Change | ||||||||
| (in millions of euros) | |||||||||||
| Cash balances at central banks and other deposits on demand, and loans and advances to central banks and credit institutions | 1,064 | 8,264 | 9,328 | ||||||||
| Domestic | 62 | 3,466 | 3,528 | ||||||||
| International - Mature markets | (226) | 3,866 | 3,640 | ||||||||
| International - Developing markets | 1,228 | 932 | 2,160 | ||||||||
| Of which | |||||||||||
| Reverse repurchase agreements | 1,291 | 1,592 | 2,883 | ||||||||
| Domestic | 50 | 1,140 | 1,190 | ||||||||
| International - Mature markets | 2 | 221 | 223 | ||||||||
| International - Developing markets | 1,239 | 231 | 1,470 | ||||||||
| Loans and advances to customers | 2,237 | 14,272 | 16,509 | ||||||||
| Domestic | (167) | 4,819 | 4,652 | ||||||||
| International - Mature markets | (219) | 9,169 | 8,950 | ||||||||
| International - Developing markets | 2,623 | 284 | 2,907 | ||||||||
| Of which | |||||||||||
| Reverse repurchase agreements | 117 | 2,460 | 2,577 | ||||||||
| Domestic | (4) | 223 | 219 | ||||||||
| International - Mature markets | 106 | 2,185 | 2,291 | ||||||||
| International - Developing markets | 15 | 52 | 67 | ||||||||
| Debt securities | 1,583 | 2,502 | 4,085 | ||||||||
| Domestic | 611 | 1,083 | 1,694 | ||||||||
| International - Mature markets | 154 | 487 | 641 | ||||||||
| International - Developing markets | 818 | 932 | 1,750 | ||||||||
| Income from hedging operations | 3,797 | — | 3,797 | ||||||||
| Domestic | (61) | — | (61) | ||||||||
| International - Mature markets | 2,475 | — | 2,475 | ||||||||
| International - Developing markets | 1,383 | — | 1,383 | ||||||||
| Other interest | 103 | — | 103 | ||||||||
| Domestic | 74 | — | 74 | ||||||||
| International - Mature markets | 23 | — | 23 | ||||||||
| International - Developing markets | 6 | — | 6 | ||||||||
| Total Interest earning assets | 8,784 | 25,038 | 33,822 | ||||||||
| Domestic | 519 | 9,368 | 9,887 | ||||||||
Year ended 31 December, | |||||||||||
| 2023 / 2022 | |||||||||||
Increase (Decrease) due to changes in | |||||||||||
INTEREST INCOME | Volume (1) | Rate (2) | Net Change | ||||||||
| (in millions of euros) | |||||||||||
| International - Mature markets | 2,207 | 13,522 | 15,729 | ||||||||
| International - Developing markets | 6,058 | 2,148 | 8,206 | ||||||||
Year ended 31 December, | |||||||||||
| 2022 / 2021 | |||||||||||
Increase (Decrease) due to changes in | |||||||||||
INTEREST INCOME | Volume (1) | Rate (2) | Net Change | ||||||||
| (in millions of euros) | |||||||||||
| Cash balances at central banks and other deposits on demand, and loans and advances to central banks and credit institutions | 586 | 3,871 | 4,457 | ||||||||
| Domestic | (7) | 364 | 357 | ||||||||
| International - Mature markets | 180 | 1,249 | 1,429 | ||||||||
| International - Developing markets | 413 | 2,258 | 2,671 | ||||||||
| Of which | |||||||||||
| Reverse repurchase agreements | 523 | 632 | 1,155 | ||||||||
| Domestic | (6) | 123 | 117 | ||||||||
| International - Mature markets | (1) | 41 | 40 | ||||||||
| International - Developing markets | 530 | 468 | 998 | ||||||||
| Loans and advances to customers | 5,138 | 10,323 | 15,461 | ||||||||
| Domestic | 368 | 762 | 1,130 | ||||||||
| International - Mature markets | 1,274 | 2,457 | 3,731 | ||||||||
| International - Developing markets | 3,496 | 7,104 | 10,600 | ||||||||
| Of which | |||||||||||
| Reverse repurchase agreements | (11) | 977 | 966 | ||||||||
| Domestic | 0 | 35 | 35 | ||||||||
| International - Mature markets | 7 | 894 | 901 | ||||||||
| International - Developing markets | (18) | 48 | 30 | ||||||||
| Debt securities | 546 | 4,146 | 4,692 | ||||||||
| Domestic | 25 | 471 | 496 | ||||||||
| International - Mature markets | 39 | 318 | 357 | ||||||||
| International - Developing markets | 482 | 3,357 | 3,839 | ||||||||
| Income from hedging operations | 487 | — | 487 | ||||||||
| Domestic | (4) | — | (4) | ||||||||
| International - Mature markets | 571 | — | 571 | ||||||||
877 | ||
| Cross-reference to Form 20-F | Consolidated directors' report | Consolidated financial statements | Supplemental information | |||||||||||||||||
Year ended 31 December, | |||||||||||
| 2022 / 2021 | |||||||||||
Increase (Decrease) due to changes in | |||||||||||
INTEREST INCOME | Volume (1) | Rate (2) | Net Change | ||||||||
| International - Developing markets | (80) | — | (80) | ||||||||
| Other interest | (130) | — | (130) | ||||||||
| Domestic | (92) | — | (92) | ||||||||
| International - Mature markets | 27 | — | 27 | ||||||||
| International - Developing markets | (65) | — | (65) | ||||||||
| Total Interest earning assets | 6,627 | 18,340 | 24,967 | ||||||||
| Domestic | 290 | 1,597 | 1,887 | ||||||||
| International - Mature markets | 2,091 | 4,024 | 6,115 | ||||||||
| International - Developing markets | 4,246 | 12,719 | 16,965 | ||||||||
Year ended 31 December, | |||||||||||
| 2023 / 2022 | |||||||||||
Increase (Decrease) due to changes in | |||||||||||
INTEREST CHARGES | Volume (1) | Rate (2) | Net Change | ||||||||
| (in millions of euros) | |||||||||||
| Deposits from central banks and credit institutions | (190) | 5,904 | 5,714 | ||||||||
| Domestic | (238) | 2,401 | 2,163 | ||||||||
| International - Mature markets | (216) | 2,233 | 2,017 | ||||||||
| International - Developing markets | 264 | 1,270 | 1,534 | ||||||||
| Of which | |||||||||||
| Repurchase agreements | 506 | 1,882 | 2,388 | ||||||||
| Domestic | 318 | 1,182 | 1,500 | ||||||||
| International - Mature markets | 129 | 209 | 338 | ||||||||
| International - Developing markets | 59 | 491 | 550 | ||||||||
| Customer Deposits | 1,632 | 14,612 | 16,244 | ||||||||
| Domestic | 42 | 2,529 | 2,571 | ||||||||
| International - Mature markets | 60 | 9,047 | 9,107 | ||||||||
| International - Developing markets | 1,530 | 3,036 | 4,566 | ||||||||
| Of which | |||||||||||
| Repurchase agreements | 837 | 3,048 | 3,885 | ||||||||
| Domestic | 42 | 197 | 239 | ||||||||
| International - Mature markets | 347 | 2,679 | 3,026 | ||||||||
| International - Developing markets | 448 | 172 | 620 | ||||||||
| Marketable debt securities | 1,420 | 2,867 | 4,287 | ||||||||
| Domestic | 519 | 1,403 | 1,922 | ||||||||
Year ended 31 December, | |||||||||||
| 2023 / 2022 | |||||||||||
Increase (Decrease) due to changes in | |||||||||||
INTEREST CHARGES | Volume (1) | Rate (2) | Net Change | ||||||||
| (in millions of euros) | |||||||||||
| International - Mature markets | 33 | 1,924 | 1,957 | ||||||||
| International - Developing markets | 868 | (460) | 408 | ||||||||
| Of which | |||||||||||
| Commercial paper | 336 | 618 | 954 | ||||||||
| Domestic | 241 | 425 | 666 | ||||||||
| International - Mature markets | 24 | 159 | 183 | ||||||||
| International - Developing markets | 71 | 34 | 105 | ||||||||
| Other interest-bearing liabilities (3) | 24 | 398 | 422 | ||||||||
| Domestic | (3) | 379 | 376 | ||||||||
| International - Mature markets | 0 | 0 | 0 | ||||||||
| International - Developing markets | 27 | 19 | 46 | ||||||||
| Expenses from hedging operations | 2,381 | — | 2,381 | ||||||||
| Domestic | 827 | — | 827 | ||||||||
| International - Mature markets | 1,549 | — | 1,549 | ||||||||
| International - Developing markets | 5 | — | 5 | ||||||||
| Other interest | 132 | — | 132 | ||||||||
| Domestic | 132 | — | 132 | ||||||||
| International - Mature markets | 118 | — | 118 | ||||||||
| International - Developing markets | (118) | — | (118) | ||||||||
| Total interest-bearing liabilities | 5,399 | 23,781 | 29,180 | ||||||||
| Domestic | 1,279 | 6,712 | 7,991 | ||||||||
| International - Mature markets | 1,544 | 13,204 | 14,748 | ||||||||
| International - Developing markets | 2,576 | 3,865 | 6,441 | ||||||||
878 | ||
Year ended 31 December, | |||||||||||
| 2022 / 2021 | |||||||||||
Increase (Decrease) due to changes in | |||||||||||
INTEREST CHARGES | Volume (1) | Rate (2) | Net Change | ||||||||
| (in millions of euros) | |||||||||||
| Deposits from central banks and credit institutions | 234 | 1,652 | 1,886 | ||||||||
| Domestic | (16) | 200 | 184 | ||||||||
| International - Mature markets | 67 | 678 | 745 | ||||||||
| International - Developing markets | 183 | 774 | 957 | ||||||||
| Of which | |||||||||||
| Repurchase agreements | (29) | 675 | 646 | ||||||||
| Domestic | 14 | 154 | 168 | ||||||||
| International - Mature markets | 2 | 40 | 42 | ||||||||
| International - Developing markets | (45) | 481 | 436 | ||||||||
| Customer Deposits | 802 | 10,740 | 11,542 | ||||||||
| Domestic | 15 | 401 | 416 | ||||||||
| International - Mature markets | 105 | 2,468 | 2,573 | ||||||||
| International - Developing markets | 682 | 7,871 | 8,553 | ||||||||
| Of which | |||||||||||
| Repurchase agreements | 175 | 2,504 | 2,679 | ||||||||
| Domestic | — | 24 | 24 | ||||||||
| International - Mature markets | 11 | 1,082 | 1,093 | ||||||||
| International - Developing markets | 164 | 1,398 | 1,562 | ||||||||
| Marketable debt securities | 819 | 2,807 | 3,626 | ||||||||
| Domestic | 110 | 614 | 724 | ||||||||
| International - Mature markets | 86 | 506 | 592 | ||||||||
| International - Developing markets | 623 | 1,687 | 2,310 | ||||||||
| Of which | |||||||||||
| Commercial paper | 14 | 226 | 240 | ||||||||
| Domestic | 0 | 200 | 200 | ||||||||
| International - Mature markets | (4) | 5 | 1 | ||||||||
| International - Developing markets | 18 | 21 | 39 | ||||||||
| Other interest-bearing liabilities (3) | (18) | 18 | 0 | ||||||||
| Domestic | (14) | 37 | 23 | ||||||||
| International - Mature markets | (2) | (27) | (29) | ||||||||
| International - Developing markets | (2) | 8 | 6 | ||||||||
Year ended 31 December, | |||||||||||
| 2022 / 2021 | |||||||||||
Increase (Decrease) due to changes in | |||||||||||
INTEREST CHARGES | Volume (1) | Rate (2) | Net Change | ||||||||
| (in millions of euros) | |||||||||||
| Expenses from hedging operations | 2,423 | — | 2,423 | ||||||||
| Domestic | 371 | — | 371 | ||||||||
| International - Mature markets | 354 | — | 354 | ||||||||
| International - Developing markets | 1,698 | — | 1,698 | ||||||||
| Other interest | 241 | — | 241 | ||||||||
| Domestic | 129 | — | 129 | ||||||||
| International - Mature markets | 77 | — | 77 | ||||||||
| International - Developing markets | 35 | — | 35 | ||||||||
| Total interest-bearing liabilities | 4,501 | 15,217 | 19,718 | ||||||||
| Domestic | 595 | 1,252 | 1,847 | ||||||||
| International - Mature markets | 687 | 3,625 | 4,312 | ||||||||
| International - Developing markets | 3,219 | 10,340 | 13,559 | ||||||||
(1)We calculate the volume variance as the result of the average interest rate of the earlier period multiplied by the difference between the average balances of both periods.
(2)We calculate the rate variance as the result of the average balance of the earlier period multiplied by the difference between the average interest rates of both periods.
(3) The volume and rate analysis is affected by the retrospective application of the new accounting standard IFRS 17 from 1 January 2023, which meant the reclassification of a portfolio of products for approximately EUR 16 billion as of 31 December 2022 (EUR 18 billion at 31 December 2021) registered at that date in 'Customer deposits' to 'Liabilities under insurance or reinsurance contracts' (see note 1.b to our consolidated financial statements in Part 1 of this report). The 2022 and 2021 average balance information has been updated for comparative purposes but not the Interest information, following the approach adopted by the Group in the financial statements.
Interest-earning assets-yield spread
The following table analyses our average interest-earning assets, interest and similar income and net interest income by domicile of the Group entity at which they are accounted for. Furthermore, it shows gross yields, net yields and yield spreads for each of the years indicated. You should read this table and the footnotes thereto in light of our observations
879 | ||
| Cross-reference to Form 20-F | Consolidated directors' report | Consolidated financial statements | Supplemental information | |||||||||||||||||
noted in the preceding sub-section entitled ‘-Average Balance Sheets and Interest Rates’, and the footnotes thereto.
Year ended 31 December, | |||||||||||
| 2023 | 2022 | 2021 | |||||||||
| (in millions of euros, except percentages) | |||||||||||
| Average interest earning assets | 1,571,738 | 1,519,174 | 1,377,322 | ||||||||
| Domestic | 454,161 | 430,455 | 409,593 | ||||||||
| International - Mature markets | 722,538 | 735,656 | 664,161 | ||||||||
| International - Developing markets | 395,039 | 353,063 | 303,568 | ||||||||
| Interest and similar income | 105,252 | 71,430 | 46,463 | ||||||||
| Domestic | 17,686 | 7,799 | 5,912 | ||||||||
| International - Mature markets | 38,844 | 23,115 | 17,000 | ||||||||
| International - Developing markets | 48,722 | 40,516 | 23,551 | ||||||||
| Interest income / (charges) (A) | 43,261 | 38,619 | 33,370 | ||||||||
| Domestic | 5,429 | 3,533 | 3,493 | ||||||||
| International - Mature markets | 17,189 | 16,208 | 14,405 | ||||||||
| International - Developing markets | 20,643 | 18,878 | 15,472 | ||||||||
| Gross yield (B) | 6.70 | % | 4.70 | % | 3.37 | % | |||||
| Domestic | 3.89 | % | 1.81 | % | 1.44 | % | |||||
| International - Mature markets | 5.38 | % | 3.14 | % | 2.56 | % | |||||
| International - Developing markets | 12.33 | % | 11.48 | % | 7.76 | % | |||||
| Net yield (C) | 2.75 | % | 2.54 | % | 2.42 | % | |||||
| Domestic | 1.20 | % | 0.82 | % | 0.85 | % | |||||
| International - Mature markets | 2.38 | % | 2.20 | % | 2.17 | % | |||||
| International - Developing markets | 5.23 | % | 5.35 | % | 5.10 | % | |||||
| Yield spread (D) | 2.56 | % | 2.45 | % | 2.39 | % | |||||
| Domestic | 1.51 | % | 0.97 | % | 0.95 | % | |||||
| International - Mature markets | 2.03 | % | 2.08 | % | 2.11 | % | |||||
| International - Developing markets | 4.01 | % | 4.26 | % | 4.65 | % | |||||
(A)Interest income / (charges) is the net amount of interest and similar income and interest expense and similar charges. See 'Income Statement' in the consolidated financial statements included in Part 1 of this annual report on Form 20-F.
(B)Gross yield is the quotient of interest income divided by average earning assets.
(C)Net yield is the quotient of interest income / (charges) divided by average earning assets.
(D)Yield spread is the difference between gross yield on earning assets and the average cost of interest-bearing liabilities. For a discussion of the changes in yield spread for 2023 and 2022, see section 3.2 'Results' in the 'Economic and financial review' chapter in Part 1 of this annual report on Form 20-F. For a discussion of the changes in yield spread for 2022 and 2021, see section 3.2 'Results' in the 'Economic and financial review' chapter in Part 1 of our annual report for the year ended 2022 on Form 20-F.
Interest-earning assets-composition
The following table shows, by domicile of the Group entity at which the relevant asset is accounted for, the percentage mix of our average interest-earning assets for the years indicated. You should read this table in light of our observations noted in the preceding sub-section entitled ‘-Average Balance Sheets and Interest Rates’, and the footnotes thereto.
Year ended 31 December, | |||||||||||
| 2023 | 2022 | 2021 | |||||||||
| Cash balances at central banks and other deposits on demand, and loans and advances to central banks and credit institutions | 19.78 | % | 20.07 | % | 19.27 | % | |||||
| Domestic | 7.47 | % | 7.35 | % | 8.18 | % | |||||
| International - Mature markets | 7.93 | % | 9.16 | % | 7.96 | % | |||||
| International - Developing markets | 4.38 | % | 3.56 | % | 3.13 | % | |||||
| Loans and advances to customers | 65.95 | % | 67.88 | % | 68.47 | % | |||||
| Domestic | 16.88 | % | 17.96 | % | 18.46 | % | |||||
| International - Mature markets | 34.78 | % | 36.38 | % | 37.31 | % | |||||
| International - Developing markets | 14.29 | % | 13.54 | % | 12.70 | % | |||||
| Debt securities | 14.27 | % | 12.05 | % | 12.26 | % | |||||
| Domestic | 4.55 | % | 3.02 | % | 3.10 | % | |||||
| International - Mature markets | 3.27 | % | 2.89 | % | 2.95 | % | |||||
| International - Developing markets | 6.45 | % | 6.14 | % | 6.21 | % | |||||
880 | ||
5.2. Other statistical disclosure requirements
5.2.1. Assets
The following table shows as of 31 December 2023, the balances and weighted-average yields(*) for our debt
securities not held at fair value through earnings, for each range of maturities:
| Year ended 31 December 2023 | |||||||||||||||||||||||||||||
| Maturing Within 1 Year | Yield Within 1 Year | Maturing Between 1 and 5 Years | Yield 1 and 5 Years | Maturing Between 5 and 10 Years | Yield 5 and 10 Years | Maturing After 10 Years | Yield After 10 Years | Total | |||||||||||||||||||||
| Debt securities | (in millions of euros, except percentages) | ||||||||||||||||||||||||||||
| Domestic: | |||||||||||||||||||||||||||||
| Spanish Government | 1,497 | 1.69 | % | 5,129 | 1.42 | % | 18,387 | 2.52 | % | 4,708 | 3.26 | % | 29,721 | ||||||||||||||||
| Issued by financial institutions | 1,459 | 9.29% (**) | 44 | 0.68 | % | 14 | 0.88 | % | — | — | % | 1,517 | |||||||||||||||||
| Other fixed-income securities | 47 | 2.23 | % | 238 | 5.33 | % | 115 | 3.63 | % | 110 | 3.14 | % | 510 | ||||||||||||||||
| Total Domestic | 3,003 | 5,411 | 18,516 | 4,818 | 31,748 | ||||||||||||||||||||||||
| International: | |||||||||||||||||||||||||||||
| Mature | |||||||||||||||||||||||||||||
| Foreign government | 18,343 | 0.98 | % | 8,266 | 3.05 | % | 8,726 | 2.69 | % | 11,242 | 3.34 | % | 46,577 | ||||||||||||||||
| Issued by financial institutions | 1,067 | 2.61 | % | 4,333 | 3.83 | % | 1,259 | 3.08 | % | 16 | 2.48 | % | 6,675 | ||||||||||||||||
| Other fixed-income securities | 3,548 | 2.40 | % | 2,036 | 5.52 | % | 4,293 | 1.65 | % | 9,200 | 1.86 | % | 19,077 | ||||||||||||||||
| Total Mature | 22,958 | 14,635 | 14,278 | 20,458 | 72,329 | ||||||||||||||||||||||||
| Developing | |||||||||||||||||||||||||||||
| Foreign government | 19,053 | 7.21 | % | 32,608 | 7.14 | % | 4,396 | 4.68 | % | 2,448 | 6.88 | % | 58,505 | ||||||||||||||||
| Issued by financial institutions | 41 | 5.44 | % | 1,118 | 2.05 | % | 506 | 2.35 | % | 1 | 4.15 | % | 1,666 | ||||||||||||||||
| Other fixed-income securities | 3,845 | 10.88 | % | 7,290 | 10.78 | % | 1,631 | 12.05 | % | 110 | 10.02 | % | 12,876 | ||||||||||||||||
| Total Developing | 22,939 | 41,016 | 6,533 | 2,559 | 73,047 | ||||||||||||||||||||||||
| Total international | 45,897 | 55,651 | 20,811 | 23,017 | 145,376 | ||||||||||||||||||||||||
| Total debt securities | 48,900 | 61,062 | 39,327 | 27,835 | 177,124 | ||||||||||||||||||||||||
(*) For each range of maturities, the weighted-average yield is calculated as the sum of the product of the balances of the debt securities maturing in that period multiplied by their respective interest rates, divided by the total balance of the debt securities maturing in that period..
(**) Includes 3 medium-term notes in BRL issued by the Instituto de Crédito Oficial (Spain).
Loan portfolio
At 31 December 2023, our total loans and advances to customers equalled EUR 1,059.1 billion (59% of our total assets). Net of allowances for credit losses, loans and advances to customers equalled EUR 1,036.3 billion at 31 December 2023 (58% of our total assets). In addition to loans, we had outstanding as of 31 December 2023, 2022 and 2021,
EUR 279.6 billion, EUR 274.1 billion and EUR 262.7 billion, respectively, of undrawn balances available to third parties.
At 31 December 2023, our loans and advances to associated companies and jointly controlled entities amounted to EUR 9,275 million (see notes 5.f and 53 to our 'Consolidated financial statements' included in Part 1 of this annual report on Form 20-F).
Excluding government-related loans and advances, the largest outstanding exposure to a single counterparty at 31 December 2023 was EUR 1.6 billion (0.15% of total loans and advances, including government-related loans), and the five next largest exposures totalled EUR 5.9 billion (0.6% of total loans, including government-related loans).
Maturity
The following table sets forth an analysis by maturity of our loans, by type and status, as of 31 December 2023:
881 | ||
| Cross-reference to Form 20-F | Consolidated directors' report | Consolidated financial statements | Supplemental information | |||||||||||||||||
| Maturity | |||||||||||||||||||||||||||||||||||||||||||||||||||||||||||
| Less than one year | One to five years | Five to fifteen years | Over fifteen years | Total | |||||||||||||||||||||||||||||||||||||||||||||||||||||||
| Balance | % of Total | Balance | % of Total | Balance | % of Total | Balance | % of Total | Balance | % of Total | ||||||||||||||||||||||||||||||||||||||||||||||||||
| (in millions of euros, except percentages) | |||||||||||||||||||||||||||||||||||||||||||||||||||||||||||
| Loans and advances to customers in Spain: (A) | |||||||||||||||||||||||||||||||||||||||||||||||||||||||||||
| Commercial credit | 14,124 | 4 | % | — | — | % | 70 | — | % | — | — | % | 14,194 | 1 | % | ||||||||||||||||||||||||||||||||||||||||||||
| Secured loans | 4,516 | 1 | % | 12,015 | 4 | % | 30,638 | 16 | % | 47,322 | 21 | % | 94,491 | 9 | % | ||||||||||||||||||||||||||||||||||||||||||||
| Reverse repurchase agreements | 762 | — | % | — | — | % | — | — | % | — | — | % | 762 | — | % | ||||||||||||||||||||||||||||||||||||||||||||
| Other term loans | 20,475 | 6 | % | 35,515 | 11 | % | 19,246 | 10 | % | 2,073 | 1 | % | 77,309 | 7 | % | ||||||||||||||||||||||||||||||||||||||||||||
| Finance leases | 469 | — | % | 2,872 | 1 | % | 1,095 | 1 | % | 9 | — | % | 4,445 | — | % | ||||||||||||||||||||||||||||||||||||||||||||
| Receivable on demand | 2,461 | 1 | % | 8 | — | % | 3 | — | % | — | — | % | 2,472 | — | % | ||||||||||||||||||||||||||||||||||||||||||||
| Credit cards receivables | 2,149 | 1 | % | 207 | — | % | 5 | — | % | — | — | % | 2,361 | — | % | ||||||||||||||||||||||||||||||||||||||||||||
| Impaired assets | 2,911 | 1 | % | 2,157 | 1 | % | 1,428 | 1 | % | 1,150 | 1 | % | 7,646 | 1 | % | ||||||||||||||||||||||||||||||||||||||||||||
| Total loans and advances to customers in Spain | 47,867 | 15 | % | 52,774 | 17 | % | 52,485 | 28 | % | 50,554 | 23 | % | 203,680 | 19 | % | ||||||||||||||||||||||||||||||||||||||||||||
| Loans and advances to customers outside Spain: (A) | |||||||||||||||||||||||||||||||||||||||||||||||||||||||||||
| Commercial credit | 39,530 | 12 | % | 1,850 | 1 | % | 54 | — | % | — | — | % | 41,434 | 4 | % | ||||||||||||||||||||||||||||||||||||||||||||
| Secured loans | 65,791 | 20 | % | 127,960 | 41 | % | 103,124 | 54 | % | 163,009 | 73 | % | 459,884 | 43 | % | ||||||||||||||||||||||||||||||||||||||||||||
| Reverse repurchase agreements | 38,187 | 12 | % | 1,733 | 1 | % | — | — | % | 3,502 | 2 | % | 43,422 | 4 | % | ||||||||||||||||||||||||||||||||||||||||||||
| Other term loans | 83,712 | 25 | % | 98,922 | 31 | % | 29,534 | 16 | % | 6,008 | 3 | % | 218,176 | 21 | % | ||||||||||||||||||||||||||||||||||||||||||||
| Finance leases | 11,861 | 4 | % | 21,738 | 7 | % | 670 | — | % | 9 | — | % | 34,278 | 3 | % | ||||||||||||||||||||||||||||||||||||||||||||
| Receivable on demand | 8,758 | 3 | % | 821 | — | % | 225 | — | % | 1 | — | % | 9,805 | 1 | % | ||||||||||||||||||||||||||||||||||||||||||||
| Credit cards receivables | 20,125 | 6 | % | 1,824 | 1 | % | 61 | — | % | — | — | % | 22,010 | 2 | % | ||||||||||||||||||||||||||||||||||||||||||||
| Impaired assets | 13,914 | 4 | % | 7,107 | 2 | % | 4,181 | 2 | % | 1,246 | 1 | % | 26,448 | 2 | % | ||||||||||||||||||||||||||||||||||||||||||||
| Total loans and advances to customers outside Spain | 281,878 | 85 | % | 261,955 | 83 | % | 137,849 | 72 | % | 173,775 | 77 | % | 855,457 | 81 | % | ||||||||||||||||||||||||||||||||||||||||||||
| Total loans and advances to customers, gross | 329,745 | 100 | % | 314,729 | 100 | % | 190,334 | 100 | % | 224,329 | 100 | % | 1,059,137 | 100 | % | ||||||||||||||||||||||||||||||||||||||||||||
(A) Credit of any nature granted to credit institutions is included in the 'Loans and advances to credit institutions' caption of our balance sheet.
882 | ||
Fixed and Variable Rate Loans
The following table sets forth a breakdown of our fixed and variable rate loans, by type and status, having a maturity of more than one year at 31 December 2023:
| Fixed and variable rate loans having a maturity of more than one year | ||||||||||||||||||||
| Domestic | International | Total | ||||||||||||||||||
| (in millions of euros) | ||||||||||||||||||||
| Fixed rate | ||||||||||||||||||||
| Commercial credit | 70 | 496 | 566 | |||||||||||||||||
| Secured loans | 30,915 | 276,993 | 307,908 | |||||||||||||||||
| Reverse repurchase agreements | — | 2,323 | 2,323 | |||||||||||||||||
| Other term loans | 42,932 | 68,490 | 111,422 | |||||||||||||||||
| Finance leases | 2,234 | 17,528 | 19,762 | |||||||||||||||||
| Receivable on demand | 9 | 933 | 942 | |||||||||||||||||
| Credit cards receivables | 212 | 1,818 | 2,030 | |||||||||||||||||
| Impaired assets | 1,791 | 7,758 | 9,549 | |||||||||||||||||
| Total Fixed rate | 78,163 | 376,339 | 454,502 | |||||||||||||||||
| Variable rate | ||||||||||||||||||||
| Commercial credit | — | 1,408 | 1,408 | |||||||||||||||||
| Secured loans | 59,060 | 117,100 | 176,160 | |||||||||||||||||
| Reverse repurchase agreements | — | 2,912 | 2,912 | |||||||||||||||||
| Other term loans | 13,902 | 65,974 | 79,876 | |||||||||||||||||
| Finance leases | 1,742 | 4,889 | 6,631 | |||||||||||||||||
| Receivable on demand | 2 | 114 | 116 | |||||||||||||||||
| Credit cards receivables | — | 67 | 67 | |||||||||||||||||
| Impaired assets | 2,944 | 4,776 | 7,720 | |||||||||||||||||
| Total Variable rate | 77,650 | 197,240 | 274,890 | |||||||||||||||||
| Total | 155,813 | 573,579 | 729,392 | |||||||||||||||||
883 | ||
| Cross-reference to Form 20-F | Consolidated directors' report | Consolidated financial statements | Supplemental information | |||||||||||||||||
Credit Ratios
The following table sets out the impairment losses to total loans outstanding ratio and the net charge-offs to average loans outstanding ratios for the periods ended 31 December 2023, 2022 and 2021 (see note 10 to our 'Consolidated financial statements'):
| 31 December | |||||||||||||||||
| 2023 | 2022 | 2021 | |||||||||||||||
| (in millions of euros, except percentages) | |||||||||||||||||
| Impairment losses to total loans outstanding | 2.15 | % | 2.14 | % | 2.31 | % | |||||||||||
| Allowances for credit losses | 22,788 | 22,684 | 22,964 | ||||||||||||||
| Total loans outstanding | 1,059,137 | 1,058,688 | 995,646 | ||||||||||||||
| Net Charge-offs during the period to average loans outstanding: | |||||||||||||||||
| Commercial credit | 0.28 | % | 0.38 | % | 0.23 | % | |||||||||||
| Net Charge-off during the period | 141 | 197 | 89 | ||||||||||||||
| Average loans outstanding | 49,673 | 51,535 | 39,513 | ||||||||||||||
| Secured loans | 0.63 | % | 0.85 | % | 0.69 | % | |||||||||||
| Net Charge-off during the period | 3,652 | 4,990 | 3,702 | ||||||||||||||
| Average loans outstanding | 582,007 | 583,899 | 538,935 | ||||||||||||||
| Reverse repurchase agreements | n/a | n/a | n/a | ||||||||||||||
| Net Charge-off during the period | n/a | n/a | n/a | ||||||||||||||
| Average loans outstanding | 46,382 | 43,505 | 36,660 | ||||||||||||||
| Other term loans | 2.21 | % | 1.43 | % | 1.06 | % | |||||||||||
| Net Charge-off during the period | 6,730 | 4,308 | 3,020 | ||||||||||||||
| Average loans outstanding | 304,776 | 301,252 | 284,235 | ||||||||||||||
| Finance leases | 0.11 | % | 0.31 | % | 0.10 | % | |||||||||||
| Net Charge-off during the period | 44 | 125 | 37 | ||||||||||||||
| Average loans outstanding | 38,764 | 39,829 | 38,348 | ||||||||||||||
| Receivable on demand | 1.49 | % | 1.73 | % | 0.36 | % | |||||||||||
| Net Charge-off during the period | 196 | 207 | 35 | ||||||||||||||
| Average loans outstanding | 13,132 | 11,964 | 9,640 | ||||||||||||||
| Credit cards receivables | 6.01 | % | 4.12 | % | 4.25 | % | |||||||||||
| Net Charge-off during the period | 1,492 | 949 | 823 | ||||||||||||||
| Average loans outstanding | 24,832 | 23,039 | 19,360 | ||||||||||||||
| Total Loans | 1.16 | % | 1.02 | % | 0.80 | % | |||||||||||
| Net Charge-off during the period | 12,255 | 10,776 | 7,706 | ||||||||||||||
| Average loans outstanding | 1,059,566 | 1,055,023 | 966,690 | ||||||||||||||
For the purpose of calculating the net charge-offs during the period to average loans outstanding ratio, net charge-offs consist of charge-offs against credit loss allowance less recoveries of loans previously charged-off and loans outstanding refer to gross loans and advances to customers. Reverse repurchase agreements are collateralized and therefore cannot be charged-off.
884 | ||
Credit impaired balances ratios
The following table shows the total amount of our computable credit risk, our credit impaired loans and contingent liabilities, our allowances for credit impaired
balances, our net loans and contingent liabilities charged-off, the NPL ratio, the coverage ratio and the net charge-offs to computable credit risk ratio at the dates indicated:
| At 31 December, | |||||||||||||||||
| 2023 | 2022 | 2021 | |||||||||||||||
| (in millions of euros, except percentages) | |||||||||||||||||
| Computable credit risk (A) | 1,133,898 | 1,124,121 | 1,051,115 | ||||||||||||||
| Credit impaired balances | 35,620 | 34,673 | 33,234 | ||||||||||||||
| Allowances for credit impaired balances | 23,490 | 23,418 | 23,698 | ||||||||||||||
| Net loans and contingent liabilities charged-off | 12,255 | 10,776 | 7,706 | ||||||||||||||
| Ratios: | |||||||||||||||||
| NPL ratio (B) | 3.14 | % | 3.08 | % | 3.16 | % | |||||||||||
| Coverage ratio (C) | 66 | % | 68 | % | 71 | % | |||||||||||
| Net loan and contingent liabilities charged-off to computable credit risk | 1.08 | % | 0.96 | % | 0.73 | % | |||||||||||
(A)Computable credit risk is the sum of the face amounts of loans and advances to customers, customer guarantees and customer commitments granted, including those that are credit impaired. Excluding country risk.
(B)Credit impaired balances (credit impaired loans and advances to customers, customer guarantees and customer commitments granted) to computable credit risk.
(C)Allowances for credit impaired balances as a percentage of credit impaired balances.
885 | ||
| Cross-reference to Form 20-F | Consolidated directors' report | Consolidated financial statements | Supplemental information | |||||||||||||||||
5.2.2. Liabilities
Deposits
The primary components of our customer deposits and our deposits from central banks and credit institutions are demand, time and notice deposits. Our retail customers are the primary source of our demand, time and notice deposits. For an analysis of average domestic and international deposits for 2023, 2022 and 2021, see section 5.1.'Average Balance Sheets and Interest Rates’.
We compete actively with other commercial banks and with savings banks for domestic deposits. Our share of customer deposits in the Spanish banking system was 26% at 30 September 2023 (most recent available data), according to figures published by the Spanish Banking Association (‘AEB’) and the Confederación Española de Cajas de Ahorros (‘CECA’). See section 9. 'Competition'.
The following table shows the amounts of insured and uninsured total customer deposits excluding repurchase agreements.
| 31 December 2023 | 31 December 2022 | 31 December 2021 | |||||||||
| (in millions of euros) | |||||||||||
| Insured deposits | 502,461 | 485,288 | 470,571 | ||||||||
| Uninsured deposits | 465,886 | 461,043 | 393,626 | ||||||||
| Total deposits | 968,347 | 946,331 | 864,197 | ||||||||
Note: From 1 January 2023, we apply retrospectively IFRS 17 'Insurance Contracts and amendments to IFRS 17' which meant a reclassification for an amount of approximately EUR 16 billion as of 31 December 2022 (EUR 18 billion at 31 December 2021) from a portfolio of products registered in 'Customer deposits' to 'Liabilities covered by insurance or reinsurance contracts'. See note 1.b to our consolidated financial statements included in Part 1 of this report.
The table below shows, as of 31 December 2023, the amounts of insured and uninsured customer time deposits. In addition, the table shows the amounts of uninsured time deposits either because they exceed the deposit insurance regimes or other reasons.
| 31 December 2023 | |||||
| Time deposits | (in millions of euros) | ||||
| Insured time deposits | 98,569 | ||||
| Uninsured time deposits | 208,516 | ||||
| Excess over guaranteed limit | 120,402 | ||||
| Otherwise uninsured | 88,113 | ||||
| Total time deposits | 307,085 | ||||
The following table shows the maturity of uninsured customer time deposits for the year ended 31 December 2023.
| 31 December 2023 | |||||||||||||||||
| Domestic | International | Total | |||||||||||||||
| (in millions of euros) | |||||||||||||||||
| Under 3 months | 37,516 | 79,362 | 116,878 | ||||||||||||||
| 3 to 6 months | 10,504 | 13,929 | 24,433 | ||||||||||||||
| 6 to 12 months | 6,656 | 23,109 | 29,765 | ||||||||||||||
| Over 12 months | 11,569 | 25,871 | 37,440 | ||||||||||||||
| Total | 66,245 | 142,271 | 208,516 | ||||||||||||||
886 | ||
The following table contains information of the deposit insurance regimes in the main countries where we are present:
| Country | Guarantee fund | Definition | ||||||
| Spain | Fondo de Garantía de Depósitos (FGD) | The FGD guarantees deposits in cash and securities or other financial instruments held by credit institutions, up to the limit of EUR 100,000 for cash deposits or, in the case of deposits in other currencies, the equivalent sum at the applicable exchange rates. The FGD also guarantees the following deposits, irrespective of their amount, for three months from the moment the funds have been credited or these deposits have become legally transferable: (1) deposits from real estate transactions involving private residential properties; (2) deposits deriving from payments received by the depositor on a one-off basis in connection with marriage, divorce, retirement, dismissal, disability or death; and (3) deposits concerning insurance payments or indemnity payments for damages as a result of a criminal act or judicial error. | ||||||
| UK | The Financial Services Compensation Scheme (FSCS) | The Financial Services Compensation Scheme (FSCS) protects UK authorised banks, building societies and credit unions up to £85,000 per depositor in the event of their insolvency. If deposits or savings are in a joint account the total of FSCS protection doubles to £170,000. The FSCS is fully funded by the financial services industry. Firms authorized by the FCA and the PRA pay an annual levy which is calculated based on the size of the firm. | ||||||
| Portugal | Fundo de Garantia de Depósitos | The Fundo de Garantía de Depósitos guarantees the reimbursement of the total value of the cash balances of each depositor, per participating credit institution, up to a limit of EUR 100,000. However, the following deposits will be fully guaranteed and, as such, potentially beyond the EUR 100,000 limit, for a period of one year from the date the amount has been credited to the relevant deposit account: deposits related to private urban residential real estate transactions; deposits with social purposes; and deposits resulting from insurance payments or compensation for damages. | ||||||
| Germany | Einlagensicherungsfonds | In the event of bank insolvency, legal deposit protection guarantees sums of up to EUR 100,000 per customer. Guaranteed deposits include basically demand, time and savings deposits and registered savings bonds. The liabilities of bearer and order bonds are not guaranteed. The Deposit Protection Fund protects deposits regardless of the currency in which they are held. However, the deposit protection fund has the right to make compensation in euros. | ||||||
| Poland | Bankowy Fundusz Gwarancyjny (BFG) | The deposit guarantee system covers accumulated funds: (1) in all domestic banks, i.e., with registered office in the territory of the Republic of Poland, (2) in cooperative credit unions, and (3) in branches of foreign banks (i.e., branches of banks with their head office abroad, in the territory of a non-EU country) to the extent that the deposit guarantee system of that country fails to provide guarantees at least in the amount provided by the BFG. The level of coverage in all the countries of the European Union since 31 December 2010, is EUR 100,000 (or its equivalent in national currency). | ||||||
| US | Federal Deposit Insurance Corporation (FDIC) | The standard insurance amount is US$250,000 per depositor, per insured bank, for each account ownership category. A deposit account opened in an FDIC-insured bank is automatically covered. | ||||||
| Mexico | Instituto para la Protección al Ahorro Bancario (IPAB) | The IPAB is the federal institution (decentralized of the Ministry of Finance and Public Credit of Mexico) responsible for protecting depositors. Deposit insurance coverage is limited to a maximum of 400,000 UDIs ('Unidades de Inversión’, which are inflation indexed currency units) per bank and depositor. The IPAB guarantees, among others, funds deposited in savings accounts, time deposits such as certificates of deposit and deposits associated to debit cards. | ||||||
| Brazil | Fundo Garantidor de Créditos (FGC) | The FGC protects depositors and investors within the scope of the National Financial System, up to the limits established by the regulations. The maximum amount of guarantee per person against the same member institution, or against all member institutions of the same financial corporation, will be of R$ 250,000.00. The following credits are duly covered by the ordinary guarantee granted by the FGC: (1) demand deposits or deposits drawable upon prior notice; (2) savings deposits; (3) time deposits with or without the issuance of certificate; (4) deposits kept in accounts other than checking accounts used for registration and control of the flow of funds relative to the payment of salaries, compensation, retirement benefits, pension and the like; (5) bills of exchange; (6) real estate notes; (7) mortgage notes; (8) real estate credit notes; (9) agribusiness credit notes; and (10) repurchase agreements that have as object securities issued by an affiliated company after 8 March 2012. | ||||||
887 | ||
| Cross-reference to Form 20-F | Consolidated directors' report | Consolidated financial statements | Supplemental information | |||||||||||||||||
| Chile | Comisión para el Mercado Financiero (CMF)- Ley General de Bancos | The ‘Ley General de Bancos’ protects depositors according to certain limits defined by articles 144 to 153 in paragraph 3 of title XV. The guarantee covers individually a maximum of 200 UFs ('Unidades de Fomento’, which are inflation indexed currency units) per credit institution and calendar year; and the maximum of the guarantee of all the obligations that the banking system has with the same individual will be of 400 UFs per calendar year. Exceptions: (i) the guarantee does not cover term deposits, savings accounts balances and notes where the depositor is an institution (including profit and non-profit institutions); and (ii) the guarantee covers 100% of demand deposits (both for institutions and individuals) in the event of forced liquidation of a bank . | ||||||
| Argentina | Sistema de Seguros de Depósitos | The Deposit Insurance System guarantees up to AR$ 6,000,000 per person, account and deposit. In the accounts in name of two or more persons, the guarantee shall not exceed the limit of AR$ 6,000,000, regardless the number of depositors; this amount will be proportionally distributed among the depositors. The following deposits, in AR$ and foreign currency, are covered by the system: check accounts, current accounts opened in cooperative credit institutions, savings accounts, fixed term deposits, payroll/social security and special accounts and term investments. | ||||||
888 | ||
6. Supplement to the operating and financial review disclosure in the directors’ report
This section supplements the 'Consolidated directors’ report -Economic and financial review' in Part 1 of this annual report on Form 20-F in order to give information on the variations of the results and financial condition for 2022 as compared to 2021. You should read this information in connection with, and it is qualified in its entirety by reference to, our 'Consolidated financial statements' included in Part 1 of this annual report on Form 20-F.
Consolidated income statement. Variations 2022 compared to 2021 for the Group and by primary and secondary segments.
See Group variations in 'Part 1. Consolidated directors´ report-Economic and financial review. Section 3.2. Results' in our annual report for the year ended 2022 on Form 20-F filed with the Securities and Exchange Commission on 1 March 2023.
See primary and secondary segments variations in 'Part 1. Consolidated directors´ report-Economic and financial review. Section 4. Financial information by segments' in our annual report for the year ended 2022 on Form 20-F filed with the Securities and Exchange Commission on 1 March 2023.
Such sections are incorporated herein by reference.
Financial condition. Variations 2022 compared to 2021
See 'Part 1. Consolidated directors´ report-Economic and financial review. Section 3. Group financial performance' in our annual report for the year ended 2022 on Form 20-F filed with the Securities and Exchange Commission on 1 March 2023. Such section is incorporated herein by reference.
889 | ||
| Cross-reference to Form 20-F | Consolidated directors' report | Consolidated financial statements | Supplemental information | |||||||||||||||||
7. Tabular disclosure of contractual obligations
The following table summarises our contractual obligations by remaining maturity at 31 December 2023:
| Contractual obligations | |||||||||||||||||||||||||||||
| (in millions of euros) | Less than 1 year | More than 1 year but less than 3 years | More than 3 year but less than 5 years | More than 5 years | Total | ||||||||||||||||||||||||
| Deposits from central banks and credit institutions (A) | 81,285 | 30,280 | 10,544 | 7,919 | — | 130,028 | |||||||||||||||||||||||
| Customer deposits (A) | 944,627 | 31,052 | 11,617 | 7,984 | — | 995,280 | |||||||||||||||||||||||
| Marketable debt securities (A) | 91,811 | 92,554 | 57,639 | 61,204 | — | 303,208 | |||||||||||||||||||||||
| Liabilities under insurance contracts (B) | 2,321 | 3,738 | 4,444 | 7,296 | — | 17,799 | |||||||||||||||||||||||
| Lease obligations | 586 | 918 | 480 | 416 | — | 2,400 | |||||||||||||||||||||||
| Other long-term liabilities (C) | 1,647 | 2,978 | 2,892 | 7,007 | — | 14,524 | |||||||||||||||||||||||
| Contractual interest payment (D) | 19,720 | 13,459 | 13,974 | 33,916 | — | 81,069 | |||||||||||||||||||||||
| Total | 1,141,997 | 174,979 | 101,590 | 125,742 | 1,544,308 | ||||||||||||||||||||||||
(A)Financial liabilities at amortized cost.
(B)Includes life insurance contracts in which the investment risk is borne by the policy holder and insurance savings contracts.
(C)Other long-term liabilities relate to pensions and similar obligations and include the estimated benefit payable for the next ten years.
(D)Calculated for the amortized cost portfolios of Deposits from credit institutions, Customer deposits and Marketable debt securities based on average interest rates at 31 December 2023, for all maturities, and assuming that obligations with maturities of more than five years have an average life of ten years.
The table above excludes the 'fixed payments' of our derivatives since derivatives contracts executed by the Group apply close-out netting across all outstanding transactions, that is, these agreements provide for settlements to be made on a maturity or settlement date for the differences that arise, and as such, the obligation to be settled in the future is not fixed at the present date and is not determined by the fixed payments.
For a description of our trading and hedging derivatives, which are not reflected in the above table, see note 36 to our 'Consolidated financial statements' included in Part 1 of this annual report on Form 20-F.
890 | ||
8. Employees
As of 31 December 2023, we had 212,764 employees (as compared to 206,462 in 2022 and 199,177 in 2021) of which 35,266 were employed in Spain (as compared to 34,153 in 2022 and 32,800 in 2021) and 177,498 were employed outside Spain (as compared to 172,309 in 2022 and 166,377 in 2021). The terms and conditions of employment in the non-government-owned banks in Spain are negotiated on an industry-wide basis with the trade unions. This process has historically produced collective agreements binding on all the non-government-owned banks and their employees. The 2019-2023 agreement was signed on 29 January 2021. Although the agreement's original expiration date was 31 December 2023, it is automatically extended until the relevant parties enter a new agreement replacing and superseding the terms of the current agreement. The terms and conditions of employment in many of our subsidiaries outside Spain (including in Argentina, Portugal, Italy, Uruguay, Chile, Mexico, Germany, the UK, Brazil and Poland) are negotiated either directly or indirectly (on an industry-wide basis) with the trade unions.
The table below shows our employees by geographic area:
Number of employees (A) | |||||||||||||||||
| 31 December 2023 | 31 December 2022 | 31 December 2021 | |||||||||||||||
| Spain | 35,266 | 34,153 | 32,800 | ||||||||||||||
| United Kingdom | 24,221 | 22,905 | 20,992 | ||||||||||||||
| Rest of Europe | 29,395 | 28,668 | 27,834 | ||||||||||||||
| Brazil | 57,868 | 55,653 | 52,573 | ||||||||||||||
| Rest of Latin America | 52,672 | 50,405 | 49,262 | ||||||||||||||
| US | 12,579 | 13,971 | 15,096 | ||||||||||||||
| Canada | 239 | 230 | 212 | ||||||||||||||
| Asia | 499 | 451 | 382 | ||||||||||||||
| Other | 25 | 26 | 26 | ||||||||||||||
| TOTAL | 212,764 | 206,462 | 199,177 | ||||||||||||||
(A) We adjusted the number of employees for 2021 following a change to headcount criteria in our units in the UK and Poland to align the criteria throughout the Group.
The employee data presented in the table above is prepared according to the criteria of the legal entity where the employee works for. Such criteria is not comparable to that of the employee data included in 'Consolidated directors’ report - Economic and financial review- Section 4' in Part 1 of this annual report on Form 20-F which are prepared according to the Group’s management’s criteria.
9. Competition
Competition in Spain
We face strong competition in all of our principal areas of operation from other banks, savings banks, credit co-operatives, brokerage services, on-line banks, insurance companies and other financial services firms.
Banks
At the end of September 2023 (most recent available information), Banco Bilbao Vizcaya Argentaria, Caixabank and Santander accounted for approximately 63.7% of loans and 64.4% of deposits in the Spanish financial system, according to figures published by the AEB and the CECA.
Foreign banks also have a presence in the Spanish banking system as a result of liberalization measures adopted by the Bank of Spain in 1978. At 31 December 2023, there were 78 foreign banks (of which 74 were from European Union countries) with branches in Spain. In addition, there were 15 Spanish subsidiary banks of foreign banks (of which 5 were from European Union countries).
The ECB is responsible for authorizing and revoking the authorization of credit institutions, and authorizing the purchase of qualifying holdings, under the terms of the European regulations which establish the competences conferred on the ECB and the Single Supervisory Mechanism. In these cases, the Bank of Spain, as the national competent authority (NCA), will submit to the ECB plans for the granting of an authorization or the acquisition of a qualifying holding, and where applicable, proposals for the revocation of authorization.
Any financial institution organized and licensed in another Member State of the European Union may conduct business in Spain from an office outside Spain, without first having obtained prior authorization from the Spanish authorities to do so. The opening of a branch of any financial institution authorized in another Member State of the European Union does not need prior authorization or specific allocation of resources either.
Financial institutions which are not authorized in another Member State of the European Union do not benefit from the 'Community Passport', and are therefore required to obtain prior authorization from the Bank of Spain to operate in Spain with branches. The procedure to obtain such authorization from the Bank of Spain is similar to the one set up for the establishment of new Spanish banks in Law 10/2014 of 26 June 2014, on Organization, Supervision and Solvency of Credit Entities and the Royal Decree 84/2015, of 13 February 2015, which develops Law 10/2014. These branches of institutions from countries outside of the European Union must necessarily be ascribed to the Spanish Deposit Guarantee Fund, in case there is no system of coverage in their home country, or if the system guarantees less than €100,000 per depositor (in this case, for the difference up to such €100,000). These institutions may also be authorized to operate in Spain and to provide services (no branches),
891 | ||
| Cross-reference to Form 20-F | Consolidated directors' report | Consolidated financial statements | Supplemental information | |||||||||||||||||
although, in this case, the institutions cannot raise funds from the public.
Spanish law requires prior approval by the Bank of Spain for a Spanish bank to acquire a significant interest in a bank organized outside of the European Union, create a new bank outside the European Union or open a branch outside of the European Union. Spanish banks must provide prior notice to the Bank of Spain to conduct any other business outside of Spain.
The opening by a Spanish bank of branches outside of Spain requires prior application to the Bank of Spain, which includes providing information about the country where the branch will be located, the address, program of activities and names and resumes of the branch’s managers. The opening by a Spanish bank of representative offices requires prior notice to the Bank of Spain detailing the activities to be performed.
Brokerage services
We face competition in our brokerage activities in Spain from other brokerage houses, including those of other financial institutions.
Any investment services company authorized to operate in another Member State of the European Union may conduct business in Spain from an office outside of Spain, once the Spanish Securities Markets Commission ('CNMV') receives notice from the institution’s home country supervisory authority on the institution’s proposed activities in Spain.
Credit entities have access, as members, to the Spanish stock exchanges, in accordance with the provisions established by the European Union Investment Services Directive.
We also face strong competition in our mutual funds, pension funds and insurance activities from other banks, savings banks, insurance companies and other financial services firms.
On-line banks and insurance companies
The entry of on-line banks into the Spanish banking system has increased competition, mainly in customer funds businesses such as deposits. Insurance companies and other financial service firms also compete for customer funds.
Competition outside Spain
In addition, we face strong competition outside of Spain, particularly in Argentina, Brazil, Chile, Mexico, Portugal, the UK, Germany, Poland, and the US. In these corporate and institutional banking markets, we compete with the large domestic banks active in these markets and with the major international banks.
The global banking crisis resulted in the withdrawal or disappearance of a number of market participants and significant consolidation of competitors, particularly in the US and UK competition for retail deposits has intensified significantly reflecting the difficulties in the wholesale money markets.
In several of these markets there are regulatory barriers to entry or expansion, and the state ownership of banks. Competition is generally intensifying as more players enter
markets that are perceived to be de-regulating and offer significant growth potential.
Competition for corporate and institutional customers in the UK is from UK banks and from large foreign financial institutions that are also active and offer combined investment and commercial banking capabilities. Santander UK’s main competitors are established UK banks, building societies and insurance companies and other financial services providers (such as supermarket chains and large retailers).
In the UK credit card market, large retailers and specialist card issuers, including major US operators, are active in addition to the UK banks. In addition to physical distribution channels, providers compete through direct marketing activity and the Internet.
In the United States, Santander Bank competes in the Northeastern, New England and New York retail and mid-corporate banking markets with local and regional banks and other financial institutions. Santander Bank also competes in the US in large corporate lending and specialized finance markets, and in fixed-income trading and sales. Competition is principally with the large US commercial and investment banks and international banks active in the US. Santander Consumer USA Inc., our full-service specialized consumer finance company focused on vehicle finance and third-party servicing based in Dallas, Texas, primarily competes against national and regional banks in the United States, as well as with automobile manufacturers’ captive finance businesses, to originate loans and leases to finance consumers’ purchases of new and used cars.
Competition by fintech providers
In recent years, the development of the internet, as well as advances in mobile and other technologies, have given way for significant changes and transformation of certain financial-related services which had historically been provided almost exclusively by financial (and thereby, regulated) institutions, such as commercial banks. Non-bank digital service providers (known as fintechs) have entered the financial services market and currently compete (and cooperate) among each other and with banks. Fintechs include startup firms specializing in specific services or niches of the financial services market, or large digital players (known as BigTechs), which include companies such as Amazon, Facebook and Apple.
Due to certain regulations, such as those related to financial stability, which are not always applicable to non-bank financial services providers, competition between banks and non-bank players is not entirely on a level playing field. Whereas banks are generally required to apply banking-level controls to all subsidiaries, regardless of their activities, and therefore are required to assume certain costs or carry out longer internal processes with respect to certain activities (i.e. corporate governance requirements), fintechs may only be subject to activity-specific regulations, if at all, and may be able to provide new services that are not yet subject to regulation without facing the same obstacles a bank could face in attempting to provide such new services.
See Item 4. Risk Factors. '2.6.4 Increased competition, including from non-traditional providers of banking services
892 | ||
such as financial technology providers, and industry consolidation may adversely affect our results of operations'.
10. Supervision and regulation
Single Supervisory Mechanism and Single Resolution Mechanism
The project of achieving a European banking union was launched in the summer of 2012. Its main goal is to resume progress towards the European single market for financial services by restoring confidence in the European banking sector and ensuring the proper functioning of monetary policy in the eurozone. The banking union is expected to be achieved through new harmonised banking rules (the single rulebook) and a new institutional framework with stronger systems for both banking supervision and resolution that will be managed at the European level. Its two main pillars are the Single Supervisory Mechanism (the 'SSM') and the Single Resolution Mechanism (the 'SRM'). As a further step to a fully-fledged banking union, in November 2015, the European Commission put forward a proposal for a European Deposit Insurance Scheme (EDIS), which intends to provide a stronger and more uniform degree of insurance cover for all retail depositors in the banking union.
Pursuant to Article 127(6) of the Treaty on the Functioning of the EU and the SSM Framework Regulation, the ECB is responsible for specific tasks concerning the prudential supervision of credit institutions established in participating Member States. Since 2014, it carries out these supervisory tasks within the SSM framework, composed of the ECB and the relevant national authorities. The ECB is responsible for the effective and consistent functioning of the SSM, with a view to carrying out effective banking supervision, contributing to the safety and soundness of the banking system and the stability of the financial system.
The ECB is responsible for the effective and consistent functioning of the SSM and exercises oversight over the functioning of the system. To ensure efficient supervision, credit institutions were categorized as 'significant' and 'less significant'. In accordance with the SSM Regulation, the ECB fully assumed its new supervisory responsibilities within the SSM on 4 November 2014.
The ECB supervises directly the significant banks, including us, through the Joint Supervisory Teams (JSTs), which are responsible for the day-to-day supervision of these institutions. These teams comprise staff from the ECB and the NCAs, whose work is coordinated by an ECB staff member, assisted by one or more NCA sub-coordinators. Among other duties, these teams are responsible for the ongoing assessment of institutions’ risk profiles, solvency and liquidity, and prepare the draft decisions to be presented to the Supervisory Board. All other less-significant institutions are directly supervised by NCAs, and indirectly supervised by the ECB.
In relation to significant institutions, the NCAs, including the Bank of Spain, must assist the ECB, contributing their experience and most of the supervisors making up the JSTs. Also, among other tasks, they provide support for on-site inspections (to be carried out by non-JST teams), gather and transmit any information required, participate in the
preparation of supervisory decisions, and collaborate on sanction procedures.
In the case of less-significant institutions, the NCAs supervise them directly, while the ECB supervises them indirectly. In these cases, the ECB, which has ultimate responsibility for the functioning of the SSM, may issue guidelines to ensure consistent supervision in participating countries, request additional information, or even take over the direct supervision of an institution if it considers it necessary.
The participants in the SSM are all the countries that form part of the Eurosystem and all European Union countries which are not in the eurozone, but which want to establish a close cooperation with the ECB and therefore accept this new supervision system.
Article 6.4 of the Council Regulation (EU) 1024/2013 of 15 October 2013, conferring specific tasks on the ECB concerning policies relating to the prudential supervision of credit institutions (the 'SSM Regulation'), establishes the criteria under which an institution shall not be considered 'less significant'. In particular, if any of the following conditions is met :
•Size: Its consolidated total assets are worth over 30 billion euros.
•Cross border activities: Its assets are worth more than 20% of the GDP of the country in which it is established, unless the consolidated total assets are less than 5 billion euros, or it has subsidiaries in more than one participant country, with cross-border assets or liabilities representing a significant part of its total assets and liabilities.
•Economic importance: it is considered by it NCA an institution of significance with regard to the domestic economy. In any case, it will include the three most significant credit institutions in each member state (unless justified by particular circumstances).
Additionally, entities for which public financial assistance has been requested or received from the European Stability Mechanism or the European Financial Stability Facility shall not be considered 'less significant'.
Based on these criteria, as of 1 November 2023 the ECB directly supervised 113 'significant banks' in the euro area. In the case of Spain, as of the date of this report, 10 significant credit institutions and financial holding groups are directly supervised by the ECB. We have been categorized as a significant institution.
To directly supervise the significant banks, the ECB has created two directorate generals, DG Microprudential Supervision I and DG Microprudential II, which perform the continuous day-to-day monitoring of the 113 groups. The supervision of specific aspects or matters, what is known as on-site inspection, is carried out by different teams. The ECB has thus adopted a different model to that place at the Bank of Spain to date: functionally separating the continuous monitoring of banks and inspection visits.
With regard to significant Spanish banks, the Bank of Spain, in addition to providing its experience and most of the staff of the joint supervisory teams, will shoulder the weight of on-
893 | ||
| Cross-reference to Form 20-F | Consolidated directors' report | Consolidated financial statements | Supplemental information | |||||||||||||||||
site inspections, it will participate in the preparation of all the decisions to be adopted by the ECB Supervisory Board and it will be active in the exercise of its sanctioning powers. As regards the sanctioning regime, the ECB is responsible for imposing sanctions, provided that three requirements are met: that the sanction is imposed on the credit institution, i.e. on the legal person; that it stems from non-compliance with directly applicable European Union legal rules; and that the sanctions are of a pecuniary nature. In the remaining cases, power will continue to be exercised by the national supervisory authorities, without prejudice to the ECB being able to demand that the appropriate proceedings be initiated.
There are certain areas of banking activity whose supervision is not assumed by the SSM, but continue to be within the purview of the national authorities. The Bank of Spain thus continues to exercise supervisory powers in the areas of money laundering prevention, consumer protection and, partly, in the oversight of financial markets. It also retains the supervision of banking foundations associated with regional governments. In addition to this, the Bank of Spain, like the other national supervisory authorities participating in the SSM, fully retains its supervisory powers over non-bank financial institutions, other financial institutions and entities related to the financial sector such as payment institutions, electronic money institutions, credit financial intermediaries, mutual guarantee companies, currency-exchange bureau and appraisal companies.
Until 1 January 1999, the Bank of Spain was the entity responsible for implementing Spanish monetary policy. As of that date, the start of Stage III of the European Monetary Union, the European System of Central Banks and the ECB became jointly responsible for Spain’s monetary policy. The European System of Central Banks consists of the national central banks of the twenty-eight Member States belonging to the European Union, whether they have adopted the euro or not, and the ECB. The 'Eurosystem' is the term used to refer to the ECB and the national central banks of the Member States which have adopted the euro. The ECB is responsible for the monetary policy of the European Union. The Bank of Spain, as a member of the European System of Central Banks, takes part in the development of the European System of Central Banks’ powers including the design of the European Union’s monetary policy.
The ECB has delegated the authority to issue the euro to the central banks of each country participating in Stage III. These central banks are also in charge of executing the European Union’s monetary policy in their respective countries. The countries that have not adopted the euro will have a seat in the European System of Central Banks, but will not have a say in the monetary policy or instructions laid out by the governing council to the national central banks.
Since 1 January 1999, the Bank of Spain has performed the following basic functions attributed to the European System of Central Banks:
•defining and implementing the Eurosystem's monetary policy;
•conducting foreign exchange transaction consistent with the provisions of Article 111 of the Treaty on European Union, and holding and managing the States’ official currency reserves;
•promoting the sound working of payment systems in the eurozone; and
•issuing legal tender bank notes.
Notwithstanding the European Monetary Union, the Bank of Spain, as the Spanish national central bank, continues to be responsible for:
•holding and managing the currency and precious metal reserves not transferred to the ECB;
•promoting the sound working and stability of the financial system and, without prejudice to the functions of the ECB, of national payment systems;
•supervising solvency and compliance with the specific rules of credit institutions, other entities and financial markets, for which it has been assigned supervisory responsibility;
•placing currency in circulation and the performance, on behalf of the State, of all such other related functions;
•preparing and publishing statistics relating to its functions, and assisting the ECB in the compilation of the necessary statistical information;
•rendering treasury services and acting as financial agent for government debt; and
•advising the Spanish Government and preparing the appropriate reports and studies.
The other main pillar of the EU banking union is the SRM, the main purpose of which is to ensure a prompt and coherent resolution of failing banks in Europe at minimum cost for the taxpayers and the real economy. The SRM Regulation establishes uniform rules and a uniform procedure for the resolution of credit institutions and certain investment firms in the framework of the SRM and a Single Resolution Fund ('SRF'). The SRF became effective on 1 January 2016 and will be financed by bank contributions raised at national and at banking union level which will be pooled at Union level in accordance with an intergovernmental agreement on the transfer and progressive mutualization of those contributions, thus increasing financial stability and limiting the link between the perceived fiscal position of individual Member States and the funding costs of banks and undertakings operating in those Member States. At a national level, the Spanish Law 11/2015 of June 2018, on recovery and resolution of credit entities and investment firms, transposes the SRF regulation from Directive 2014/59/EU which sets the rules at European level, also creating National Resolution Funds to be financed by credit institutions and investment firms, and whose financial resources are intended to reach by 2024 a total amount of 1% of the covered deposits of all banks in participating Member States (i.e., around EUR 55 billion) and to be used as a separate backstop only after an 8% bail-in of a bank's liabilities has been applied to cover capital shortfalls (in line with BRRD). Contributions made by Santander to the Single Resolution Fund in 2023 amounted to EUR 293 million.
Deposit Guarantee Fund scheme
The Deposit Guarantee Scheme (Fondo de Garantía de Depósitos, or the FGD) operates under the rules of the
894 | ||
European Union and the guidance of Bank of Spain, guarantees in the case of the Bank and our Spanish banking subsidiaries: (i) bank deposits up to €100,000 per depositor; and (ii) securities and financial instruments which have been assigned to a credit institution for its deposit, register or for other such services, up to €100,000 per investor. Taking into account the principle of minimal capital impact, the FGD may participate in resolution proceedings by granting financial support in exceptional cases.
The FGD is funded by annual contributions from banks. The target level of Member States FGD contributions is to collect 0.8 per cent of the total amount of covered deposits by 3 July 2024.
As of 31 December 2023, the Bank and its domestic bank subsidiaries were members of the FGD and thus were obligated to make annual contributions to it. The contributions made by the Bank to the FGD amounted to EUR 247 million in 2023. Contributions made by the Group to the different local deposit guarantee funds amounted to EUR 826 million in 2023.
On 16 April 2014, the recast Deposit Guarantee Schemes Directive was published (Directive 2014/49/EU of the European Parliament and of the Council of 16 April 2014 on deposit guarantee schemes (recast)), which is aimed at eliminating certain differences between the laws of the European Union Member States as regards the rules on deposit guarantee schemes to which those credit institutions are subject. Law 11/2015, of 18 June, for the recovery and resolution of credit institutions and investment firms, Royal Decree 1012/2015, Circular 8/2015 and Circular 5/2016 transpose the Deposit Guarantee Schemes Directive to the Spanish legislation.
Investment Guarantee Fund
Royal Decree 948/2001, of 3 August, regulates investor guarantee schemes (sistemas de indemnización de los inversores) related to both investment firms and to credit institutions. These schemes are set up through an investment guarantee fund for securities broker and broker-dealer firms and the deposit guarantee funds already in place for credit institutions. A series of specific regulations have also been enacted, defining the system for contributing to the funds.
The General Investment Guarantee Fund Management Company was created in a relatively short period of time and is a business corporation with capital in which all the fund members hold an interest. Member firms must make a joint annual contribution to the fund equal to 0.06% over the 5% of the securities that they hold on their client’s behalf. However, it is foreseen that these contributions may be reduced if the fund reaches a level considered to be sufficient.
Liquidity requirements - Reserve ratio, liquidity coverage ratio and net stable funding ratio
Regulation (EU) 2021/378 of the ECB of 22 January 2021, on the application of minimum reserve requirements (recast), requires credit institutions in each Member State that participates in the European Monetary Union, including us, to place a specific percentage of their 'Reserve Base' liabilities with their respective National Central Banks ('NCBs') in the form of interest bearing deposits as specified below (the 'Reserve Ratio').
'Reserve Base' liabilities are broadly defined as deposits and debt securities issued. Liabilities which (i) are owed to any other institution which is subject to minimum reserve requirements and which is not exempt from the ECB’s minimum reserve system and (ii) liabilities which are owed to the ECB or to a participating NCB are excluded from the Reserve Base. If an institution has liabilities owed to a branch of the same entity, or in relation to the head office or registered office of the same entity, which are located outside participating EU Member States it shall include such liabilities in the reserve base. Minimum reserves shall be calculated using the following reserve ratios: (a) 0% shall apply to (i) deposits with agreed maturity over two years; (ii) deposits redeemable at notice over two years; (iii) repos and (iv) debt securities issued with an agreed maturity over two years; and (b) 1.0 % shall apply to all other liabilities included in the reserve base.
Additionally, according to article 460.2 of CRR, a liquidity coverage ratio ('LCR') has been progressively introduced since 2015 with the following phasing-in: (a) 60% of the LCR in 2015; (b) 70% as of 1 January 2016; (c) 80% as of 1 January 2017; and (d) 100% as of 1 January 2018. As of 31 December 2023, our LCR was 166%, comfortably exceeding the regulatory requirement. Additionally, further to the package of reforms published on June 2019, which amended CRR, among others, with respect to liquidity requirements, whereby institutions shall maintain a net stable funding ratio (NSFR) of at least 100% from June 2021. The NSFR aims to ensure that institutions' long term assets and off-balance-sheet items are adequately met with a diverse set of funding instruments that are stable both under normal and stressed conditions. As of 31 December 2023, the Group's NSFR was 123% above the 100% minimum requirement.
Investment ratio
In the past, the government used the investment ratio to allocate funds among specific sectors or investments. As part of the liberalization of the Spanish economy, it was gradually reduced to a rate of zero percent as of 31 December 1992. However, the law that established the ratio has not been abolished and the government could re-impose the ratio, subject to applicable EU requirements.
Concentration of risk
An institution’s exposure to a client or group of connected clients is considered a large exposure where its value is equal to or exceeds 10% of its eligible capital (article 392 of the Capital Requirements Regulation 575/2013 -CRR-).
In accordance with article 395 of CRR, an institution shall not incur an exposure, after taking into account the effect of the credit risk mitigation, to a client or group of connected clients the value of which exceeds 25% of its Tier 1 capital. Where that client is an institution or an investment firm or where a group of connected clients includes one or more institutions or investment firms, that value shall not exceed the greater of 25% of the institution’s Tier 1 capital and €150 million, provided that the sum of exposure values, after taking into account the effect of the credit risk mitigation in accordance with Articles 399 to 403 of the CRR, to all connected clients that are not institutions or investment firms does not exceed 25% of the institution’s Tier 1 capital. Where the amount of €150 million is higher than 25 % of the institution’s Tier 1 capital, the value of the exposure, after having taken into
895 | ||
| Cross-reference to Form 20-F | Consolidated directors' report | Consolidated financial statements | Supplemental information | |||||||||||||||||
account the effect of credit risk mitigation in accordance with Articles 399 to 403 of CRR shall not exceed a reasonable limit in terms of the institution’s Tier 1 capital. That limit shall be determined by the institution in accordance with the policies and procedures referred to in Article 81 of Directive 2013/36 (CRD), in order to address and control concentration risk. That limit shall not exceed 100% of the institution’s Tier 1 capital. Additionally, a G-SII shall not incur an exposure to another G-SII or a non-EU G-SII, the value of which, after taking into account the effect of the credit risk mitigation in accordance with Articles 399 to 403 of the CRR, exceeds 15 % of its Tier 1 capital. A G-SII shall comply with such limit no later than 12 months from the date on which it came to be identified as a G-SII. Where the G-SII has an exposure to another institution or group which comes to be identified as a G-SII or as a non- EU G-SII, it shall comply with such limit no later than 12 months from the date on which that other institution or group came to be identified as a G-SII or as a non-EU G-SII.
See section 4. 'Risk Factor'. 2.1.2. Capital requirements, liquidity, funding and structural reform'.
Restrictions on dividends
We may only pay dividends (including interim dividends) if such payment is in compliance with the applicable capital requirement regulations (described under '-Capital Adequacy Requirements' herein) and other requirements. Credit institutions must comply at all times with the 'combined capital buffers' requirement established in articles 43 of Law 10/2014, article 58 of the Royal Decree 84/2015, and in article 6 of the Circular 2/2016. The 'combined capital buffers' requirement is defined as the total common equity tier 1 capital necessary to comply with the obligation to have a capital conservation buffer, and, where appropriate: a) institution-specific countercyclical capital buffer; b) a global systemically important institution (G-SII) buffer; c) a buffer for other systemically important institutions; and d) a systemic risk buffer.
Pursuant to article 48.2 of the Law 10/2014, credit institutions which do not fulfil the requirement of combined capital buffers, or those institutions for which a common equity tier 1 capital distribution results in their decline to a level where the combined buffer requirement is not fulfilled, shall calculate the maximum distributable amount (MDA), in accordance with article 73 of the Royal Decree 84/2015. Until the MDA has been calculated and such MDA has been immediately reported to the Bank of Spain none of the following actions can be performed by the credit institutions: a) make a distribution in connection with common equity tier 1 capital; b) create an obligation to pay variable remuneration or discretionary pension benefits or pay variable remuneration if the obligation to pay was created at a time when the institution failed to meet the combined buffer requirements; and c) make payments on additional tier 1 instruments. The restrictions shall only apply to payments that result in a reduction of common equity tier 1 or in a reduction of the profits reduced, provided that the suspension or cancellation of the payment does not constitute an event of default of the payment obligations or other circumstances that lead to the opening of an insolvency proceeding. In addition, according to Article 16.a) of the BRRD, any failure by an institution to meet the combined buffer requirement when considered in addition to the applicable minimum TLAC/MREL Requirements is intended to be treated in a similar manner as
a failure to meet the combined buffer requirement on top of its minimum regulatory capital requirements, i.e. a resolution authority will have the power to impose restrictions or prohibitions on discretionary payments by a credit institution. The referred Article 16.a) of the BRRD includes a potential nine-month grace period whereby the resolution authority will assess on a monthly basis whether to exercise its powers, after such nine-month period the resolution authority is compelled to exercise its power to restrict discretionary payments (subject to certain limited exceptions). These restrictions have been implemented in Spain by means of Article 16bis of Law 11/2015.
After the restrictions imposed in response to the effects of the covid-19 pandemic, the ECB on 23 July 2021, decided in Recommendation 2021/31 not to extend the restrictions beyond 30 September 2021, and it has reinstated the pre-pandemic supervisory practices by which it recommends that banks under its direct supervision exercise extreme prudence on dividends and share buy backs.
Data protection
On 25 May 2018, the GDPR became directly applicable in all Member States of the EU. To align the Spanish legal regime with the GDPR, Spain enacted the Organic Law 3/2018, of 5 December, on Data Protection and the safeguarding of digital rights which repealed the Spanish Organic Law 15/1999, of 13 December, on Data Protection.
Although a number of basic existing principles remained the same, the GDPR introduced extensive new obligations on both data controllers and processors, as well as rights for data subjects. The GDPR also imposes significant fines and penalties for a non-compliance of up to the higher of 4% of annual worldwide turnover or €20 million and, for other specified infringements, fines and penalties of up to the higher of 2% of annual worldwide turnover or €10 million. For more information, see risk factor ‘2.1.2 We are subject to extensive regulation and regulatory and governmental oversight which could adversely affect our business, operations and financial conditions. – Data privacy and cybersecurity’.
Limitations on Types of Business
Spanish banks are subject to certain limitations on the types of businesses in which they may engage directly, but they are subject to few limitations on the types of businesses in which they may engage indirectly. Law 10/2014 and Royal Decree 84/2015 established the regulation for governance, authorization, supervision and solvency for credit institutions.
Mortgage legislation
Mortgages and mortgage loans in Spain are subject to extensive and scattered regulation. Several reform efforts in recent years have resulted in changes to mortgage regulation in Spain. Key aspects of such regulation are described below.
Royal Decree-Law 6/2012, of 9 March, on urgent measures to protect mortgage debtors without financial resources introduced measures to enable the restructuring of mortgage debt and easing of collateral foreclosure aimed to protect especially vulnerable debtors (as amended by Royal Decree-Law 5/2017).
Such measures include the following:
896 | ||
•the moderation of interest rates charged on mortgage arrears;
•the improvement of extrajudicial procedures as an alternative to legal foreclosure;
•the introduction of a voluntary code of conduct among lenders for regulated mortgage debt restructuring affecting especially vulnerable debtors; and
•where restructuring is not viable, lenders may, where appropriate and on an optional basis, offer the debtor partial debt forgiveness.
Law 1/2013, of 14 May, on measures to protect mortgagees, debt restructuring and social rents, introduced important modifications to mortgage law and civil procedure law (as amended by Royal Decree-Law 5/2017). The most relevant modifications are:
•broadening the potential beneficiaries of the moratorium of Royal Decree 6/2012;
•limitation of the interest rates applied for delay or arrears;
•in the context of an auction, the base value of the property shall be the value set forth in the relevant mortgage deed and in no case shall it be less than 75% of the official appraisal value of the property;
•the possibility of suspension of enforcement proceedings when the loan or credit facility secured by the mortgage contains abusive clauses; and
•modification of the out-of-court notarial procedure.
Royal Decree-Law 11/2014, following the judgement of the EU Court of Justice of 17 July 2014, regarding Spanish foreclosure processes, allows debtors to appeal against a court’s resolution which rejects his or her opposition to the execution of a mortgage.
The Mortgage Credit Directive 2014/17/EU on credit agreements for consumers relating to residential immovable property was adopted on 4 February 2014, and implemented in Spain through Law 5/2019, of March (which is described below) . This Directive aimed to create a Union-wide mortgage credit market with a high level of consumer protection. It applies to both secured credit and home loans.
Royal Decree-Law 1/2015 of 27 February on the 'second chance' mechanism is to regulate such mechanism. This allows an individual who has been declared bankrupt to be discharged of outstanding obligations as long as he or she fulfils certain requirements: (i) the bankruptcy proceedings must have concluded, (ii) the debtor must have acted in good faith, the Royal Decree being restrictive as to when a debtor is considered to have acted in good faith, and (iii) the bankruptcy judge has to approve the terms of the discharge (and may revoke his or her approval under certain circumstances upon request of any creditor in the following five years). Discharge from mortgage obligations would only apply to the outstanding debts after the foreclosure, as long as such debts are considered ordinary or subordinate according to the Spanish Insolvency Law. Co-debtors and guarantors, if any, would remain liable.
Law 25/2015, of 28 July, on the 'second chance' mechanism reducing the financial burden and other measures of a social nature, entered into force on 30 July 2015. It is the result of the passage through parliament of Royal Decree-Law 1/2015, which also allowed some new changes to be added, such as introduction of a fee protection account for insolvency managers, limits on the remuneration of insolvency managers and the introduction of greater flexibility to a number of elements of the second chance mechanism.
Royal Decree-Law 1/2017, of 20 January, on urgent consumer protection measures in respect of interest rate floor clauses, was published in the Official Gazette of the Spanish Rate on 21 January. The objective of the Royal Decree-Law is to regulate - with the incentive provided by the rules on costs, a simple and orderly avenue, voluntary for the consumer that facilitates reaching an agreement with the credit institution that allows them to settle their differences through the restitution of these amounts, thus averting the risk of overwhelming the courts. The principle inspiring the mechanism that is set in motion is the willingness of agreeing to an out-of-court settlement procedure prior to filing a lawsuit, at no additional cost for the consumer and which credit institutions must heed.
On 16 March 2019, the Official Gazette of the Spanish State published the new Law 5/2019 of 15 March on Credit Agreements Relating to Real Estate Property, which partially transposed the Directive 2014/17/EU of the European Parliament and of the Council of 4 February 2014, on credit agreements for consumers relating to residential immovable property. The most relevant modifications included in the new law are:
•it covers credits and loans to individuals in connection with residential real estate properties (including land and the preservation of real estate properties), excluding reverse mortgages;
•establishes a seven-day period for consumers to evaluate the mortgage-related documents, supervised by a Notary Public (Notario Público);
•clarifies some controversial issues in which litigation has arisen in the past years (mainly, benchmark interest rates references, foreign currencies submission and default interests);
•establishes the possible fees that may be charged on borrowers;
•forbids linked sales; and
•settles rules regarding the early termination of mortgages based exclusively on the amount of defaulted payments by the borrower (in light of recent court decisions declaring null and void some early termination clauses for their abusive terms).
On 24 November 2021, Royal Decree-Law 24/2021 (RDL 24/2021) on covered bonds (implementing Directive 2019/2162) was approved in Spain and it entered into force on 8 July 2022 replacing Law 2/1981, of March 25, on the regulation of the mortgage market, article 13 of Law 14/2013, of September 27, on support for entrepreneurs and their internationalization, Article 13 of Law 44/2002, of
897 | ||
| Cross-reference to Form 20-F | Consolidated directors' report | Consolidated financial statements | Supplemental information | |||||||||||||||||
November 22, on financial system reform measures and the fourth additional provision of Law 5/2015, of April 27, 2015, on the promotion of business financing which constituted, among others, the former regime of covered bonds. Covered bonds issued prior to 8 July 2022 pursuant to the former regulatory regime are, as from 8 July 2022, governed by RDL 24/2021 and its implementing measures.
New covered bonds regulation introduced by means of RDL 24/2021 provides for significant changes in relation to the issue and maintenance of these type of instruments, including, among others, the liquidity buffer, extendable maturity structures, requirements to provide periodic information to holders of covered bonds, supervision of covered bonds (cover pool monitor and public supervision) and insolvency or resolution of the issuer of the covered bonds.
Consumer alternative dispute resolution systems for consumer disputes
Law 7/2017, of 2 November, seeks to ensure access for Spanish and European consumers to independent, impartial, transparent and effective alternative dispute resolution systems. For financial institutions, a specific law shall be passed and financial institutions will be forced to participate in those alternative dispute resolution mechanism.
Payment accounts
Royal Decree-Law 19/2017, of 24 November, on basic payment accounts, account switching and the comparability of payment account fees. The Royal Decree-Law transposes Directive 2014/92/EU of the European Parliament and of the Council of 23 July 2014, on the comparability of fees related to payment accounts, payment account switching and access to basic payment accounts. This Directive supplements Directive 2007/64/EC of the European Parliament and of the Council of 13 November 2007, on payment services in the internal market, which will be replaced by Directive (EU) 2015/2366 of the European Parliament and of the Council of 25 November 2015, on payment services in the internal market, that will repeal the first one as of 13 January 2018. This RD-law establishes certain protections for clients and potential clients in connection with their relationships with credit institutions in the context of the opening of and general functioning of basic payment accounts, the switching of accounts and transparency in connection with fees related to payment accounts.
Payment Services
The second Payment Services Directive (EU) 2015/2366 ('PSD2') allows authorized third parties (with consent) to access customer information that was previously only accessible to banks. PSD2 applies to payments within the EEA and has been implemented in Spain through Royal Decree-Law 19/2018, of 23 November. This Royal Decree-Law expands the scope of the consumer protection provisions included in PSD2 (related to transparency and information sharing) to 'microenterprises' and prohibits merchants from requesting additional charges for using specific payment methods, including credit cards.
Royal Decree-Law 19/2018 was amended, among others, by Royal Decree-Law 8/2023 in order to limit the charged of commissions for cash withdrawals for vulnerable groups.
Vulnerable group include persons over 65 years of age and certain persons with a recognized disability.
Mutual Fund Regulation
Law 22/2014 of 12 November introduced a new legal regime for private investment entities in order to implement (i) Directive 2011/61/EU of the European Parliament and of the Council of June 8 on Alternative Investment Fund Managers, and (ii) Directive 2013/14/EU of the European Parliament and of the Council of 21 May.
Asset Management Activities
Asset management activities in the EU are expected to be significantly impacted by the following regulation referred to below:
(i) Regulation (EU) 2017/1131 of the European Parliament and of the Council of 14 June 2017, on money market funds ('MMFs'), which (with the exception of certain articles which have been in force since 20 July 2017) applied beginning on 21 July 2018. The Regulation introduces a broad set of new regulatory measures that apply to MMFs established, managed or marketed in the EU. In light of the perceived systemic risk presented by MMFs, the Regulation aims to make these investment products more resilient and resistant to contagion risks. It does this by imposing rules on eligible assets, portfolio diversification, portfolio maturity and valuation of assets and introduces new categories of MMFs that can offer a constant net asset value per share if they meet certain requirements. The Regulation is meant to be an important step in adopting a uniform set of rules that are designed to ensure that MMFs are, as far as possible, in a position to honour redemption requests from investors, especially during stressed market conditions, and therefore remain a reliable tool for investors’ cash management needs;
(ii) Regulation (EU) 2019/1238 of the European Parliament and of the Council of 20 June 2019, on a pan-European Personal Pension Product ('PEPP'). The PEPP constitutes one of the key measures towards the European Commission’s project to create a single market for capital in the EU. It aims to provide pension providers with the tools to offer PEPPs outside their national markets, thereby creating a large and competitive EU-level market for personal pensions which allows consumers to voluntarily complement their savings for retirement, while benefiting from solid consumer protection. PEPPs have the same standard features wherever they are sold in the EU and can be offered by a broad range of providers, such as insurance companies, banks, occupational pension funds, investment firms and asset managers. They complement existing state-based, occupational and national personal pensions, but not replace or harmonize national personal pension regimes. In accordance with the Proposal, PEPP providers need to be authorized by the European Insurance and Occupational Pensions Authority (EIOPA).
(iii) Regulation (EU) 2019/834 of the European Parliament and of the Council of 20 May 2019, amending Regulation (EU) No 648/2012 as regards the clearing obligation, the suspension of the clearing obligation, the reporting requirements, the risk-mitigation techniques for OTC derivatives contracts not cleared by a central counterparty, the registration and supervision of trade repositories and the requirements for trade repositories;
898 | ||
(iv) Royal Decree 62/2018, of 9 February, reduces the maximum fees which may be charged to investors in connection with pension funds and plans and allows them to withdraw their savings after ten years of having made them from 2025 onwards. This Royal Decree introduces other minor changes to the regulation of pension funds and plans in Spain, including (a) reducing fee limits; (b) making the regulation of investments in closed-end funds more flexible; (c) clarification of the net asset value reference date used to determine the value of payments; (d) eliminating restrictions on delegation and related-party transactions; and (e) modifying time limits for the receipt of vested rights, order of priority for garnishment orders, reporting regime for participants and the schedule for adapting documentation for pension plans;
(v) Royal Decree-Law 3/2020 and Royal Decree 738/2020 implementing Directive (EU) 2016/2341 of the European Parliament and of the Council of 14 December 2016, on the activities and supervision of institutions for occupational retirement provisions. This Law (i) clarifies the access cross-border pension plans activities, (ii) articulates a governance system to protect investors, (iii) adapts the Spanish legislation to the Directive and (iv) regulates the terms and scope of the prudential supervision to be carried out by the competent authority and the exchange of information with other competent authorities;
(vi) Law 11/2018 of 28 December modifying the Code of Commerce, Royal Decree-Law 1/2010 of 2 July and Law 22/2015 of 20 July in relation to non-financial information and diversity include the following amendments to Law 35/2003 on Collective Investment Schemes: (i) recognition of electronic communication with clients, and only requiring communication in paper when requested by a participant, (ii) extension of omnibus accounts to participants and preexistent positions, equalizing the distribution of national and foreign ICCs and (iii) inclusion of the sanctions system from UCITS (Undertakings for Collective Investments in Transferable Securities) V and reducing the penalties for serious and very serious infringements;
(vii) Royal Decree-Law 19/2018 of 23 November on payment services and other urgent financial measures, also introduced a sanctions system for money market funds, modified the Stock Market Law to include some provisions applicable to asset management companies and introduced several European regulations into Spanish law (including regulations related to Benchmarks, MAR, PRIIPS and transparency in securities financing transactions);
(viii) Commission Delegated Regulation (EU) 2018/1619 of 12 July 2018, amending Delegated Regulation (EU) 2016/438 regarding the safe-keeping duties of depositaries; and
(ix) Directive and Regulation (EU) regarding the cross-border distribution of collective investment funds (UCITS, FIA, FECR and FESE) with the aim of reducing regulatory barriers for the cross-border distribution of funds, in relation to the European capital markets union.
Spanish capital companies act
The consolidated text of the Spanish Capital Companies Act adopted under Legislative Royal Decree 1/2010, of 2 July, repealed the former regulation, adopted under Legislative
Royal Decree 1564/1989, of 22 December and Law 2/1995, of 23 March. This royal legislative decree consolidated the legislation for public limited companies (sociedades anónimas) and limited liability companies (sociedades de responsabilidad limitada) in a single text, bringing together the contents of the two aforementioned acts.
Law 25/2011 of 1 August, partially amended the Spanish Capital Companies Act and incorporated Directive 2007/36/EC, of 11 July, on the exercise of certain rights of shareholders in listed companies.
Also, an amendment on corporate governance was introduced by Law 31/2014 of 3 December. The main changes introduced by this law are related to the rights of shareholders (assistance, information and voting), the calling of a general shareholders’ meeting and the duties of the board of directors and the audit committee, appointments committee and remuneration committee.
Royal Decree-Law 18/2017, of 24 November, which modifies the Commercial Code, the revised text of the Spanish Capital Companies Act approved by Royal Decree Legislative 1/2010, of 2 July, and Law 22/2015, of 20 July, on Audit of Accounts, regarding non-financial information and diversity. By virtue of the amendment introduced, the affected texts require the inclusion in the management report of public limited companies, limited liability companies and limited partnerships for actions that, simultaneously, have the status of 'public interest' entities whose number average of workers employed during the year exceeds 500 and, additionally, are considered large companies, in the terms defined by Directive 2013/34, of non-financial information of a social and environmental nature. The inclusion of such information in the management report will affect the 'public interest' entities defined in Article 15 of the Auditing Regulations, which include banks, insurance companies, listed companies, investment fund managers and pension funds., as well as, in general, all the large companies.
Law 5/2021, of 12 April, which modified the revised text of the Companies Act and other financial regulations concerning the promotion of the long-term involvement of shareholders in listed companies incorporating in Spain Directive (EU) 2017/828.
Spanish auditing law
Law 22/2015, of 20 July, on Auditing, adapted Spain’s internal legislation to the changes incorporated in Directive 2014/56/EU of the European Parliament and of the Council, of 16 April, amending Directive 2006/43/EC of the European Parliament and of the Council of 17 May, on statutory audits of annual accounts and consolidated accounts, to the extent that they were inconsistent. Together with this Directive, approval was also given to Regulation (EU) 537/2014 of the European Parliament and of the Council, of 16 April, on specific requirements regarding statutory audit of public-interest entities. Such Directive and Regulation constitute the fundamental legal regime that should govern audit activity in the European Union. Law 22/2015 regulates general aspects of access to audit practice and the requirements to be followed in that practice, from objectivity and independence, to the organization of auditors and performance of their work, as well as the regime for their oversight and the sanctions available to ensure the efficacy of the regulations. Law
899 | ||
| Cross-reference to Form 20-F | Consolidated directors' report | Consolidated financial statements | Supplemental information | |||||||||||||||||
22/2015 was amended by virtue of the Law 5/2021, of 12 April, which also modified the revised text of the Companies Act and other financial regulations concerning the promotion of the long-term involvement of shareholders in listed companies with the objective of incorporating in Spain Directive (EU) 2017/828 and thus the provisions to, among other issues, include the annual report on directors’ remuneration among the information whose existence must be checked by the auditor when analysing the management report of listed companies, and adjust the requirement to establish an audit committee to public interest entities when they are dependent entities in group structures. In addition, Law 28/2022, of 21 December and Royal Decree-Law 20/2022, of 27 December recently included certain amendments to Law 22/2015 such as an amendment to the statutory audit of public-interest entities which now can be extended up to a maximum of fourteen years if a different audit firm is simultaneously engaged to act jointly in such additional period or for ten additional years if a public call for tenders for the statutory audit is made in accordance with Article 16(2) to (5) of Regulation (EU) 537/2014 of the European Parliament and of the Council, of 16 April.
Law 11/2015 of 18 June, on the recovery and resolution of credit institutions and investment firms
Law 11/2015 transposes a very important part of EU Law into Spanish law in respect of the recovery and resolution mechanisms for credit institutions and investment firms (the 'institutions'). It further assumes many of the provisions of Law 9/2012 of 14 November 2012, on the restructuring and resolution of credit institutions, which it partially repeals.
The regime set in place constitutes a special and full administrative procedure that seeks to ensure maximum speed in the intervention of an institution so as to provide for the continuity of its core functions, while minimising the impact of its non-viability on the economic system and on public resources. It regulates, among others, internal recapitalisation as a resolution instrument conceived as a 'bail-in' arrangement (the absorption of losses by the shareholders and by the creditors of an institution under resolution) and, further to Royal Decree-Law 7/2021, the minimum requirement for own funds and eligible liabilities (MREL).
In this respect, liabilities eligible for bail-in are all the institution’s liabilities that are not expressly excluded or have not been excluded further to a decision by the FROB. These liabilities shall be susceptible to amortization or conversion into capital for the internal recapitalisation of the institution concerned. Among the liabilities excluded are deposits guaranteed by the Deposit Guarantee Fund (up to €100,000) and liabilities incurred with employees, trade creditors and the tax or social security authorities.
Certain changes were made to the regime applicable in the event of the insolvency of an institution, in order to provide greater protection to the deposits of individuals and SMEs. In this respect, the following shall be considered as privileged credits: (i) deposits guaranteed by the Deposit Guarantee Fund (maximum of €100,000) and the rights to which they may have been subrogated should the guarantee have been made effective and (ii) the portion of the deposits of individuals and SMEs that exceeds the guaranteed level, and
those deposits of those individuals and SMEs that would be guaranteed had they not been set up in branches located outside the EU. Additionally, further to the above-mentioned Royal Decree-Law 7/2021, changes have been implemented to ensure that all claims resulting from own funds items have, in national laws governing normal insolvency proceedings, a lower priority ranking than any claim that does not result from an own funds item.
Royal Decree 1012/2015 (as further amended by Royal Decree 1041/2021), which partially transposes the BRRD and develops Law 11/2015, includes a package of measures aimed at: (i) establishing the criteria for the application of the regulation for the resolution of credit entities, (ii) establishing the content of the recovery and resolution plans for credit entities, (iii) regulating the use of the resolution instruments set in Law 11/2015, and in particular, the actions to be carried out by the FROB, (iv) establishing the regime applicable to the FROB in connection with the managing of the funds addressed to finance the resolution procedures and to the contributions that credit entities must make to the National Resolution Fund and, (v) establishing the regime applicable to the resolution of cross border entities.
Markets in Financial Instruments (MiFID II)
Royal Decree-Law 14/2018, of September 28, modifies the Stock Markets Law to partially implement Directive 2014/65 relating to the markets of financial instruments ('MiFID II'), which process began under Royal Decree-Law 21/2017. This Royal Decree-Law aims to improve the soundness, transparency and regulation of the Spanish financial market’s trading activities, increase investor protection and harmonize Spanish financial markets regulations with those of other member states.
PRIIPs
Regulation (EU) 1286/2014 (The Packaged Retail and Insurance-Based Investment Products ('PRIIPs') Regulation) was adopted on 29 December 2014 and came into force on 1 January 2018. The PRIIPs Regulation requires product manufacturers to create and maintain key information documents ('KIDs') and persons advising or selling PRIIPs to provide retail investors based in the EEA with KIDs to enable investors to better understand and compare products.
A PRIIP is defined as any investment where the amount repayable to the investor is subject to fluctuations because of exposure to reference values. In addition to insurance products, some examples of PRIIPs are options, futures, CFDs and structured products.
The main objectives of the PRIIPs Regulation are to: (i) ensure understanding and comparability between similar products in order to help the investors make investment decisions, (ii) improve transparency and increase confidence in the retail investment market and (iii) promote a single European insurance market.
On 7 September 2021, the European Commission adopted a Delegated Regulation amending the regulatory technical standards laid down in Delegated Regulation (EU) 2017/653 as regards the underpinning methodology and presentation of performance scenarios, the presentation of costs and the methodology for the calculation of summary cost indicators, the presentation and content of information on past
900 | ||
performance and the presentation of costs by PRIIPs offering a range of options for investment and alignment of the transitional arrangement for PRIIP manufacturers offering units of funds referred to in Article 32 of Regulation (EU) No 1286/2014 as underlying investment options with the prolonged transitional arrangement laid down in that Article. The date of application of that Delegated Regulation is 1 July 2022, but it is important to reflect the need to give management companies, investment companies and persons advising on, or selling, units of UCITS and non-UCITS sufficient time to prepare for the end of the transitional arrangement and thus for the obligation to draw up a KID.
In order to ensure that the need for sufficient time to prepare for the obligation to produce a KID is met, it was necessary to extend the transitional arrangement until 31 December 2022.
Regulation (EU) No 1286/2014 was therefore amended accordingly by Regulation (EU) 2021/2259 of the European Parliament and of the Council of 15 December 2021.
EMIR
As referred above, on May 28, 2019, Regulation (EU) 2019/834 of the European Parliament and of the Council of 20 May 2019 amending Regulation (EU) No 648/2012 as regards the clearing obligation, the suspension of the clearing obligation, the reporting requirements, the risk-mitigation techniques for OTC derivatives contracts not cleared by a central counterparty, the registration and supervision of trade repositories and the requirements for trade repositories was published in the Official Journal of the European Union. Such regulation introduced substantive amendments to the European Market Infrastructure Regulation ('EMIR') relating to the clearing obligation, the suspension of the clearing obligation, the reporting requirements, the risk-mitigation techniques for uncleared OTC derivatives contracts, the registration and supervision of trade repositories, and the requirements for trade repositories. Many of the changes aim to reduce compliance costs for end-user counterparties that are non-financial counterparties ('NFCs') and smaller financial counterparties ('FCs'). Some of these changes include (i) an exemption from the reporting of intragroup transactions; (ii) an exemption for small FCs from the clearing obligation, (iii) removal of the obligation and legal liability for reporting when an NFC transacts with an FC, and (iv) a determination of the NFC clearing obligation on an asset-class-by-asset-class basis.
Spanish tax legislation
On 19 December 2023, the Council of Ministers approved, in an initial phase, the Draft Law to transpose the European Directive 2022/2523 that establishes a global minimum taxation level of 15% for multinational corporations and large national groups. The text aims to impose a global minimum level on multinational or domestic groups with a turnover exceeding 750 million euros in at least two of the last four fiscal years. After the approval in the initial phase, the text will need to be ratified by the Government and sent to Parliament. It is expected to enter into force for fiscal years starting on 1 January 2024.
Royal Decree-Law 8/2023, of 27 December, which adopts measures to address the economic and social consequences derived from the conflicts in Ukraine and the Middle East, as well as to alleviate the effects of the drought. Among other
measures, it provides that the two levies approved by Law 38/2022, of 27 December establishing temporary levies on energy and on credit and financial credit institutions will be reviewed in order to consider their incorporation into the tax system on a permanent basis in 2024.
For more information see notes 27.f and 27.g to our 'Consolidated financial statements' included in Part 1 of this annual report on Form 20-F.
United States supervision and regulation
Our operations are subject to extensive federal and state banking and securities regulation and supervision in the United States. We engage in US banking activities directly through our New York branch and Santander Holdings USA, our US top-tier IHC. Santander Holdings USA consolidates the majority of our US operations, including our subsidiary Edge Act corporation Banco Santander International in Miami, Santander Bank, a national bank that has branches throughout the Northeast US, and SCUSA, an auto financing company. We also engage in securities activities in the United States directly through our broker-dealer subsidiaries, Santander Securities LLC and Santander US Capital Markets LLC. On 3 February 2023, our broker dealer subsidiaries Santander Investment Securities Inc and Amherst Pierpont Securities LLC merged, the new entity being Santander US Capital Markets LLC.
Banking statutes and regulations are continually under review by Congress and state legislatures. In addition to laws and regulations, federal and state regulatory agencies may issue policy statements, interpretive letters and similar guidance applicable to our US operations. Any change in the statutes, regulations or regulatory policies applicable to our US operations, including changes in their interpretation or implementation, could have a material effect on our business or organization.
Both the scope of the laws and regulations, and the intensity of the supervision to which we are subject, continue to change in response to political, technological and market changes. Regulatory enforcement and fines have also increased across the banking and financial services sector. In 2018, the United States government enacted the Economic Growth, Regulatory Relief, and Consumer Protection Act (EGRRCPA), applying enhanced prudential standards to FBOs with greater than USD100 billion in global total consolidated assets, such as Banco Santander.
In October 2019, the federal banking agencies issued final rules (the 'Tailoring Rules') that adjust the thresholds at which certain enhanced prudential standards and capital and liquidity requirements apply to certain banking organizations, including large FBOs such as Banco Santander, and the US IHCs of FBOs, such as Santander Holdings USA. The Tailoring Rules establish risk-based categories for FBOs and their US IHCs that determine whether and to what extent enhanced prudential standards and certain capital and liquidity requirements apply to FBOs and their US IHCs. Banco Santander is classified as a Category IV FBO, and Santander Holdings USA is classified as a Category IV IHC. Category IV institutions are subject to the least exacting level of enhanced prudential standards. Both Banco Santander and Santander Holdings USA are now generally subject to less restrictive
901 | ||
| Cross-reference to Form 20-F | Consolidated directors' report | Consolidated financial statements | Supplemental information | |||||||||||||||||
enhanced prudential standards and capital and liquidity requirements than under previously applicable regulations.
The following discussion describes certain elements of the comprehensive US regulatory framework applicable to us or our US operations. This discussion is not intended to describe all laws and regulations applicable to Santander Holdings USA and its subsidiaries or to our US operations in general.
Regulatory authorities
We are a financial holding company and a bank holding company under the Bank Holding Company Act, by virtue of our ownership of Santander Bank and other activities conducted by our US operations. As a result, we and our US operations are subject to regulation, supervision and examination by the Federal Reserve System, including both the Federal Reserve Board and Federal Reserve Banks, such as the Federal Reserve Bank of New York (the 'FRB New York') and the Federal Reserve Bank of Boston (‘FRB Boston’).
Santander Holdings USA is subject to primary supervision, regulation and examination by the Federal Reserve System, which serves as the consolidated supervisor of our US operations. The primary regulators of our US non-bank subsidiaries directly regulate the activities of those subsidiaries, with the Federal Reserve exercising a supervisory role. Such non-bank subsidiaries include, for example, broker-dealers registered with the SEC and investment advisers registered with the SEC.
Our IHC and Enhanced Prudential Standards
The Federal Reserve Board has imposed greater risk-based and leverage capital requirements, liquidity requirements, risk management and governance requirements, capital planning and stress testing requirements, risk management requirements and other enhanced prudential standards for bank holding companies that exceed certain asset thresholds. Santander Holdings USA is classified as a Category IV IHC and is subject to the enhanced prudential standards and capital and liquidity requirements applicable to these organizations.
Our US Depository Institution
Santander Bank is a national banking association chartered under the laws of the United States. As a national bank, the activities of Santander Bank are limited to those specifically authorized under the National Bank Act and related OCC regulations and interpretations. Santander Bank is subject to comprehensive primary supervision, regulation and examination by the OCC. As an insured depository institution, Santander Bank is also subject to regulation and examination by the FDIC.
The Federal Deposit Insurance Corporation Improvement Act of 1991 ('FDICIA') provides for extensive regulation of depository institutions (such as Santander Bank), including requiring federal banking regulators to take 'prompt corrective action' with respect to FDIC-insured depository institutions that do not meet minimum capital requirements. For this purpose, FDICIA establishes five capitalization categories: 'well capitalized,' 'adequately capitalized,' 'undercapitalized,' 'significantly undercapitalized' and 'critically undercapitalized.' As an insured depository institution’s capital level declines, and the depository institution falls into lower categories (or if it is placed in a lower category by the discretionary action of its supervisor),
greater limits are placed on its activities and federal banking regulators are authorized (and, in many cases, required) to take increasingly more stringent supervisory actions, which could ultimately include the appointment of a conservator or receiver for the depository institution. In addition, FDICIA generally prohibits an FDIC-insured bank from making any capital distribution (including payment of a dividend) or payment of a management fee to its holding company if the bank would thereafter be undercapitalized. If an insured depository institution becomes 'undercapitalized,' it is required to submit to federal regulators a capital restoration plan guaranteed by the depository institution’s holding company. If an undercapitalized depository institution fails to submit an acceptable plan, it is treated as if it were 'significantly undercapitalized.' Significantly undercapitalized depository institutions may be subject to a number of restrictions, including requirements to sell sufficient voting stock to become adequately capitalized, requirements to reduce total assets and restrictions on accepting deposits from correspondent banks. 'Critically undercapitalized' depository institutions are subject to appointment of a receiver or conservator.
Other supervised US operations
Our New York branch is licensed by the New York State Department of Financial Services ('NYDFS') to conduct a commercial banking business. Its activity is mainly focused on wholesale banking, lending, markets activity on rates and currencies derivatives and transactional services to corporate and institutional investors. Our New York branch is supervised by the FRB New York and the NYDFS, but its deposits are not insured (or eligible to be insured) by the FDIC.
Banco Santander International is supervised by the Federal Reserve Bank of Atlanta. SCUSA is regulated and supervised by the FRB Boston and various state regulators.
Restrictions on activities
Federal and state banking laws and regulations impose certain requirements and restrict our ability to engage, directly or indirectly through subsidiaries, in activities or make investments, directly or indirectly, in companies in the United States.
As a financial holding company and a bank holding company under the Bank Holding Company Act, we are subject to regulation and supervision by the Federal Reserve Board. As a financial holding company, the scope of our permitted activities and investments in the United States is broader than that permitted for bank holding companies that are not also financial holding companies, although it is nevertheless subject to certain limitations and restrictions. Our US activities and investments are limited to those that are financial in nature or incidental or complementary to a financial activity, as determined by the Federal Reserve Board. To maintain our financial holding company status, we and all of our subsidiaries must be 'well capitalized' and 'well managed' as determined by the Federal Reserve Board. If at any time we fail to meet these capital and management requirements, the Federal Reserve Board may impose limitations or conditions on the conduct of our activities and we may not commence in the United States any new activities otherwise permissible for financial holding companies or acquire any shares in any US
902 | ||
company under Section 4(k) of the Bank Holding Company Act, subject to certain narrow exceptions, without prior Federal Reserve Board approval.
We are required to obtain the prior approval of the Federal Reserve Board before directly or indirectly acquiring the ownership or control of more than 5% of any class of voting shares of a US bank or other depository institution, or a depository institution holding company. Under the Bank Holding Company Act and Federal Reserve Board regulations, our US banking operations (including our New York branch) are also restricted from engaging in certain 'tying' arrangements involving products and services.
Santander Bank is subject to requirements and restrictions under federal and state law, including requirements to maintain reserves against deposits, restrictions on the types and amounts of loans that may be made and the interest that may be charged thereon, and limitations on the types of investments that may be made and the types of services that may be offered. In addition, the OCC has issued a final rule implementing the Dodd-Frank Act’s provisions relating to lending limits. Various consumer laws and regulations also affect the operations of these subsidiaries.
Under US federal banking laws, state-licensed branches and agencies of foreign banks (such as our New York branch) may not, as a general matter, engage as a principal in any type of activity not permissible for their federally-chartered or licensed counterparts, unless the Federal Reserve Board determines that the additional activity is consistent with sound banking practices. United States federal banking laws also subject state branches and agencies to the single-borrower lending limits, which are substantially similar to the lending limits applicable to national banks. For our US branches, these single-borrower lending limits are based on the worldwide capital of the entire foreign bank (e.g., Santander, in the case of our New York branch).
Under the New York State Banking Law and regulations, our New York branch is required to maintain eligible high-quality assets with banks in the State of New York, as security for the protection of depositors and certain other creditors. The New York State Banking Law also empowers the Superintendent of Financial Services to establish asset maintenance requirements for branches of foreign banks, expressed as a percentage of each branch’s liabilities. The current designated percentage is 0%, although the Superintendent of Financial Services may impose additional asset maintenance requirements upon individual branches on a case-by-case basis.
The New York State Banking Law authorizes the Superintendent of Financial Services to take possession of the business and property of a New York branch of a foreign bank under certain circumstances, generally involving violation of law, conduct of business in an unsafe manner, impairment of capital, suspension of payment of obligations, or initiation of liquidation proceedings against the foreign bank at its domicile or elsewhere. In liquidating or dealing with a branch’s business after taking possession of a branch, only the claims of depositors and other creditors that arose out of transactions with a branch are to be accepted by the Superintendent of Financial Services for payment out of the business and property of the foreign bank in the State of New
York, without prejudice to the rights of the holders of such claims to be satisfied out of other assets of the foreign bank. After such claims are paid, the Superintendent of Financial Services will turn over the remaining assets, if any, to the foreign bank or its duly appointed liquidator or receiver.
Under the International Banking Act of 1978, as amended, the Federal Reserve Board may terminate the activities of any US office of a foreign bank if it determines (i) that the foreign bank is not subject to comprehensive supervision on a consolidated basis in its home country (unless the home country is making demonstrable progress toward establishing such supervision), (ii) that there is reasonable cause to believe that such foreign bank or its affiliate has violated the law or engaged in an unsafe or unsound banking practice in the United States and, as a result of such violation or practice, the continued operation of the US office would be inconsistent with the public interest or with the purposes of federal banking laws or, (iii) for a foreign bank that presents a risk to the stability of the US financial system, the home country of the foreign bank has not adopted, or made demonstrable progress toward adopting, an appropriate system of financial regulation to mitigate such risk.
There are various qualitative and quantitative restrictions on the extent to which we and our non-bank subsidiaries can borrow or otherwise obtain credit from our US banking subsidiaries or engage in certain other transactions involving those subsidiaries. In general, these transactions must be on terms that would ordinarily be offered to unaffiliated entities, must be secured by designated amounts of specified collateral and are subject to volume limitations. These restrictions also apply to certain transactions of our New York branch with certain of our US affiliates.
Supervision, examination and enforcement
The Federal Reserve Board, OCC and FDIC have broad supervisory and enforcement authority with regard to bank holding companies and banks, including the power to conduct examinations and investigations, impose non-public supervisory agreements, issue cease and desist orders, impose fines and other civil and criminal penalties, terminate deposit insurance and appoint a conservator or receiver. In addition, Santander Holdings USA, Santander Bank, SCUSA and other of our US subsidiaries are subject to supervision, regulation and examination by the Consumer Financial Protection Bureau ('CFPB'), which is the primary administrator of most federal consumer financial statutes and our primary US consumer financial regulator. Supervision and examinations are confidential, and the outcomes of these actions may not be made public.
Bank regulators have various remedies available if they determine that the financial condition, capital resources, asset quality, earnings prospects, management, liquidity or other aspects of a banking organization’s operations are unsatisfactory. The regulators may also take action if they determine that the banking organization or its management is violating or has violated any law or regulation. The regulators have the power to, among other things, enjoin unsafe or unsound practices, require affirmative actions to correct any violation or practice, issue administrative orders that can be judicially enforced, direct increases in capital, direct the sale of subsidiaries or other assets, limit dividends and distributions, restrict growth, assess civil monetary penalties,
903 | ||
| Cross-reference to Form 20-F | Consolidated directors' report | Consolidated financial statements | Supplemental information | |||||||||||||||||
remove officers and directors, and terminate deposit insurance.
Engaging in unsafe or unsound practices or failing to comply with applicable laws, regulations and supervisory agreements could subject the Bank, its subsidiaries, including Santander Holdings USA, and their respective officers, directors and institution-affiliated parties to the remedies described above and other sanctions. In addition, the FDIC may terminate a bank’s depository insurance upon a finding that the bank’s financial condition is unsafe or unsound or that the bank has engaged in unsafe or unsound practices or has violated an applicable rule, regulation, order or condition enacted or imposed by the bank’s regulatory agency.
In March 2017, Santander Holdings USA and SCUSA entered into a written agreement with the FRB Boston pursuant to which Santander Holdings USA and SCUSA agreed to submit written plans acceptable to the FRB Boston to strengthen board oversight of the management and operations of SCUSA and to strengthen board and senior management oversight of SCUSA’s risk management program. SCUSA agreed to submit a written revised compliance risk management program acceptable to the FRB Boston and Santander Holdings USA agreed to submit written revisions to its firm-wide internal audit program of SCUSA’s compliance risk management program. The written agreement between Santander Holdings USA and the FRB Boston dated 21 March 2017 was terminated on 4 February 2021.
As a separate supervisory matter, US bank regulatory agencies from time to time take supervisory actions under certain circumstances that restrict or limit a financial institution’s activities, including in connection with examinations, which take place on a continual basis. In some instances, we are subject to significant legal restrictions on our ability to publicly disclose these actions or the full details of these actions, including those in examination reports. In addition, as part of the regular examination process, our US banking and bank holding company subsidiaries’ regulators may advise our US banking subsidiaries to operate under various restrictions as a prudential matter. Currently, under the US Bank Holding Company Act, we and our US banking and bank holding company subsidiaries may not be able to engage in certain categories of new activities in the US or acquire shares or control of other companies in the US. Any such actions or restrictions, if and in whatever manner imposed, could adversely affect our costs and revenues. Moreover, efforts to comply with any non-public supervisory actions or restrictions may require material investments in additional resources and systems, as well as a significant commitment of managerial time and attention. As a result, such supervisory actions or restrictions, if and in whatever manner imposed, could have a material adverse effect on our business and results of operations and, in certain instances, we may be subject to significant legal restrictions on our ability to publicly disclose these matters or the full details of these actions.
US Capital Standards applicable to our US banking operations
Basel III regulatory capital framework
The US bank regulators have implemented the Basel III capital framework for US banks and bank holding companies,
including Santander Holdings USA and Santander Bank. The US Basel III capital rules differ in certain respects from those Basel III rules implemented in the EU. The minimum capital ratios under the US Basel III capital rules include a total capital to risk-weighted assets of 8%, Tier 1 capital to risk-weighted assets of 6% and CET1 capital to risk-weighted assets of 4.5%. In addition, as of 1 January 2024, Santander Holdings USA, on a consolidated basis, must maintain a capital buffer of greater than 2.5% to avoid being subject to limitations on its ability to make capital distributions and certain discretionary bonus payments.
In July 2023, the US federal banking agencies proposed significant amendments to the US Basel III capital rules to implement the Basel Committee’s international capital standards. The proposed rule generally would require Category I-IV banking organizations, including Santander Holdings USA and Santander Bank, to calculate risk-weighted assets under both the current standardized approach and a new, more risk sensitive, approach referred to as the “Expanded Risk-Based Approach.” Total risk-weighted assets under the Expanded Risk-Based Approach would include standardized approaches for credit risk, operational risk and credit valuation adjustment risk, as well as a new approach for market risk that would be based on internal models and standardized supervisory models. Under the proposal, Santander Holdings USA and Santander Bank would be subject to the lower of the two resulting capital ratios from the current standardized approach and the Expanded Risk-Based Approach. The proposal, if enacted, would have an effective date of July 1, 2025, with certain elements having a three-year phase-in period.
Banco Santander will continue to monitor developments related to the proposed amendments to the Basel III capital rules and will assess the impacts of the proposal on its operations.
Stress testing and capital planning
As our US IHC, Santander Holdings USA is subject to supervisory stress testing and capital planning requirements. Santander Holdings USA is required to submit a capital plan annually to the Federal Reserve Board for supervisory review. Santander Holdings USA is required to include within its capital plan an assessment of the expected uses and sources of capital and a description of all planned capital actions over the nine-quarter planning horizon, a detailed description of the process for assessing capital adequacy, its capital policy, and a discussion of any expected changes to its business plan that are likely to have a material impact on its capital adequacy.
The Federal Reserve Board expects companies subject to stress testing and capital planning processes, such as Santander Holdings USA, to have sufficient capital to withstand a highly adverse operating environment and to be able to continue operations, maintain ready access to funding, meet obligations to creditors and counterparties, and serve as credit intermediaries. In addition, the Federal Reserve Board evaluates the planned capital actions of these bank holding companies, including planned capital distributions such as dividend payments or stock repurchases. This involves a quantitative assessment of capital based on supervisor-run stress tests that assess the ability to maintain capital levels above certain minimum ratios, after taking all capital actions
904 | ||
included in a bank holding company’s capital plan, under baseline and stressful conditions throughout the nine-quarter planning horizon. As part of the supervisory stress testing process, the Federal Reserve Board evaluates whether bank holding companies have sufficient capital to continue operations throughout times of economic and financial market stress and whether they have robust, forward-looking capital planning processes that account for their unique risks.
Stress capital buffer requirement
The Federal Reserve Board’s Stress Capital Buffer (‘SCB’) rule applies to the consolidated operations of US IHCs, including Santander Holdings USA.
The SCB rule subjects covered banking organizations to a firm-specific and dynamic stress capital buffer, which is calculated during each applicable supervisory stress testing cycle. For Santander Holdings USA, the SCB is equal to the greater of (i) the maximum decline in its CET1 Risk-Based Capital Ratio under the severely adverse scenario over the supervisory stress test measurement period, plus the sum of the ratios of the dollar amount of our planned common stock dividends to our projected risk-weighted assets for each of the fourth through seventh quarters of the supervisory stress test projection period, and (ii) 2.5%.
Santander Holdings USA’s current SCB, calibrated based on the results of the 2022 supervisory stress tests, is 2.5%. Santander Holdings USA’s SCB is next subject to recalibration based on the results of the 2024 supervisory stress tests.
The SCB rule also implemented related changes to capital planning and stress testing processes for the consolidated operations of US IHCs subject to the stress buffer requirements, including Santander Holdings USA. In particular, the rule limits projected capital actions to planned common stock dividends in the fourth through seventh quarters of the supervisory stress test projection period and assumes that the consolidated operations of IHCs maintain a constant level of assets and risk-weighted assets throughout the supervisory stress test projection period.
Total loss-absorbing capacity and long-term debt requirements
Santander Holdings USA is required, pursuant to the final total loss-absorbing capacity rule of the Federal Reserve Board, to comply with certain Total Loss Absorbing Capital (‘TLAC’) requirements, including minimum long-term debt requirements, applicable to US IHCs of non-US G-SIBs. The main purpose of the minimum TLAC and LTD requirements is to ensure that covered US IHCs, such as Santander Holdings USA, will have enough loss-absorbing resources at the point of failure to be recapitalized through the conversion of eligible LTD to equity or otherwise by imposing losses on eligible LTD or other forms of TLAC. The minimum TLAC and LTD requirements for a covered US IHC under the rule vary depending on the home country resolution authority’s preferred resolution strategy. Because the competent authorities informed Banco Santander, S.A. that Santander Holdings USA would enter Chapter 11 proceedings under the resolution strategy for the Group, Santander Holdings USA is a resolution covered IHC and is required to maintain external and internal TLAC that collectively amount to at least 18% of risk-weighted assets (plus a TLAC buffer of an additional 2.5% composed solely of common equity tier 1 capital) and at least
9% of average total consolidated assets, as well as external and internal LTD that collectively amount to at least 6% of risk-weighted assets and at least 3.5% of average total consolidated assets. The final rule also established a clean holding company framework that imposes certain restrictions on the types of liabilities or arrangements that may be incurred or entered into by a covered US IHC. It also imposes a cap on the aggregate amount of certain unrelated liabilities of the covered US IHC equal to 5% of the covered US IHC’s TLAC.
In August 2023, the US federal banking agencies released a proposal that would require certain US and foreign banking organizations to issue and maintain long-term debt and clean holding company requirements to improve resolvability (the “LTD rule”). The proposed LTD rule would apply these requirements to insured depository institutions (‘IDIs’) with USD100 billion or more in total consolidated assets (excluding IDIs of U.S. G-SIBs). Santander Bank would not be subject to the proposed LTD rule because it has less than USD100 billion in total consolidated assets. Although Santander Holdings USA is already subject to TLAC, LTD and clean holding company requirements as an IHC of a non-US G-SIB, the proposed LTD rule may still affect Santander Holdings USA by, for example, reducing the amount of LTD with remaining maturities of less than two years that counts toward Santander Holdings USA’s TLAC requirement.
Banco Santander will continue to monitor developments related to the proposed LTD Rule and will assess the impacts of the proposal on its operations.
Liquidity requirements
Liquidity coverage ratio
Under the Tailoring Rules, Santander Holdings USA is not subject to the liquidity coverage ratio ('LCR') requirement since it is a Category IV IHC with less than USD50 billion in weighted short-term wholesale funding. The LCR is one of the liquidity components of the international Basel III framework, and requires firms to meet certain liquidity measures by holding an adequate amount of unencumbered high-quality liquid assets to cover its projected net cash outflows over a 30 day stress scenario window.
Net stable funding ratio
Under the Tailoring Rules, Santander Holdings USA is not subject to the net stable funding ratio (‘NSFR’) requirement since it is a Category IV IHC with less than USD50 billion in weighted short-term wholesale funding.
Volcker rule
Section 13 of Bank Holding Company Act and its implementing rules (collectively, the 'Volcker Rule') prohibits 'banking entities' from engaging in certain forms of proprietary trading or from sponsoring, or investing in 'covered funds,' in each case subject to certain exceptions. The Volcker Rule also limits the ability of banking entities and their affiliates to enter into certain transactions with covered funds with which they or their affiliates have certain relationships. Banking entities such as Banco Santander were required to bring their activities and investments into compliance with the requirements of the Volcker Rule by the end of the conformance period applicable to each requirement. Banco Santander has assessed how the Volcker Rule affects its businesses and subsidiaries, and has brought
905 | ||
| Cross-reference to Form 20-F | Consolidated directors' report | Consolidated financial statements | Supplemental information | |||||||||||||||||
its activities into compliance. Banco Santander has adopted processes to establish, maintain, enforce, review and test the compliance program designed to achieve and maintain compliance with the Volcker Rule. The Volcker Rule contains exclusions and certain exemptions for market-making, hedging, underwriting, trading in US government and agency obligations and certain foreign government obligations, and trading solely outside the United States, and also permits certain ownership interests in certain types of funds to be retained.
Banco Santander will continue to monitor Volcker Rule-related developments and assess their impact on its operations, as necessary.
OTC derivatives regulation
Title VII of the Dodd-Frank Act amended the US Commodity Exchange Act and the Exchange Act, among other statutes, to establish an extensive framework for the regulation of OTC derivatives by the CFTC and the SEC, including mandatory clearing of certain standardized OTC derivatives and the trading of such instruments through regulated trading venues, subject to exceptions, and transaction reporting. In addition, Title VII requires the registration of swap dealers and major swap participants with the CFTC and of security-based swap dealers and major security-based swap participants with the SEC. Banco Santander, S.A. is provisionally registered as a non-US swap dealer with the CFTC and is conditionally registered as a non-US security-based swap dealer with the SEC.
As a result of its registration as a swap dealer and its registration as a security-based swap dealer, Banco Santander, S.A. is subject to margin, segregation of counterparty collateral, business conduct, recordkeeping, clearing, execution, reporting and other requirements. In general, as a non-US swap dealer and a non-US security-based swap dealer, Banco Santander, S.A. is not subject to all CFTC and SEC requirements, including certain business conduct standards, when entering into swaps or security-based swaps with non-US counterparties without a sufficient nexus to the United States. In addition, subject to conditions, Banco Santander, S.A. may comply with EU OTC derivatives requirements in lieu of some CFTC requirements, including portfolio reconciliation, portfolio compression and trade confirmation requirements, pursuant to substituted compliance determinations issued by the CFTC. Similarly, subject to conditions, Banco Santander, S.A. may comply with EU and Spanish requirements in lieu of certain requirements of the Exchange Act, including risk control, internal supervision, chief compliance officer, antitrust, counterparty protection, recordkeeping, reporting, and notification, pursuant to substituted compliance determinations issued by the SEC.
In the EU, the implementation of the European Market Infrastructure Regulation ('EMIR') and the recast Markets in Financial Instruments Directive along with the related Markets in Financial Instruments Regulation (together, MiFID II) establish a comparable, but not identical, regulatory regime for OTC derivatives. For example, EMIR requires the mandatory clearing of certain standardized OTC derivatives and the posting of initial and variation margin by specified types of counterparties in relation to uncleared OTC derivatives. EMIR also requires counterparties to implement
risk mitigation processes and procedures and mandates reporting of all derivative transactions to trade repositories. MiFID II specifies that a subset of derivatives that are subject to mandatory clearing under EMIR must be traded on regulated trading venues. The combined effect of the US and EU requirements, and the actual and potential conflicts and inconsistencies between them, presents challenges and risks to the Group’s OTC derivatives business. Substituted compliance rulings and equivalence determinations by the European Commission allow for some limited relief from these challenges, and the Group has established cross-border working groups to meet regulatory requirements where there may be some cross-border overlap.
The full impact of the various US and non-US regulatory developments in this area is difficult to assess as the rules are complex and constantly evolving.
QFC stay rules
The US banking agencies have adopted QFC stay rules that impose contractual requirements on covered QFCs to which covered entities are parties. Banco Santander’s US operations, including Santander Bank, are treated as covered entities under the QFC stay rules. Under the QFC stay rules, covered QFCs generally:
(1) must explicitly recognize the FDIC’s authority to stay the exercise of default rights under, and transfer the covered QFC under, the Federal Deposit Insurance Act and Title II of the Dodd-Frank Act, and their implementing regulations; and
(2) may not (a) permit the exercise of any cross-default right against a covered entity based on an affiliate’s entry into receivership, insolvency, liquidation, resolution or similar proceedings, subject to certain creditor protections, or (b) prohibit the transfer of any credit enhancement (including a guarantee) provided by an affiliate in the G-SIB group that is a covered entity upon any affiliate in the G-SIB group entering into receivership, insolvency, liquidation, resolution, or similar proceedings.
Single-counterparty credit limits
The US operations of Banco Santander are subject to single counterparty credit limits, which impose percentage limitations on net credit exposures to individual counterparties (aggregated based on affiliation), generally as a percentage of tier 1 capital. Under the amendments to the US single counterparty credit limits rule made by the Tailoring Rules, Santander Holdings USA is not subject to the single counterparty credit limits rule at the IHC level. In addition, although Banco Santander remains subject to the amended rules with respect to its US operations, it has elected to use substituted compliance by certifying that it complies with its home-country single counterparty credit limits, instead of complying with the Federal Reserve Board's implementation of these requirements.
Resolution planning
We are required to prepare and submit periodically to the Federal Reserve Board and the FDIC a plan, commonly called a living will (the '165(d) plan'), for the orderly resolution of our subsidiaries and operations that are domiciled in the United States in the event of future material financial distress or failure. We, on behalf of our IDI subsidiary, Santander Bank, must also submit a separate IDI resolution plan to the
906 | ||
FDIC. The 165(d) plan and the IDI plan require substantial effort, time and cost to prepare and are subject to review by the Federal Reserve Board and the FDIC, in the case of the 165(d) plan, and by the FDIC only, in the case of the IDI plan. If, after reviewing our 165(d) plan and any related re-submissions, the Federal Reserve Board and the FDIC jointly determine that the 165(d) Plan is not credible and that deficiencies are not cured in a timely manner, they may jointly impose on our US operations more stringent capital, leverage or liquidity requirements or restrictions on our growth, activities or operations., or even divestitures, which could have an adverse effect on our business. Banco Santander filed its most recent 165(d) plan on 30 June 2022, and its most recent IDI plan on 28 June 2018. As a result of EGRRCPA and following changes to applicable regulations, Banco Santander is now a triennial reduced filer that is required to submit its next 165(d) plan in the form of a reduced resolution plan by 1 July 2025. With respect to our IDI plan, the FDIC announced in November 2018 that the agency planned to revise the IDI plan rule and that the next IDI plan submissions would not be required until the rulemaking process was complete. While the FDIC lifted this moratorium in January 2021 for IDIs with USD100 billion or more in assets under the IDI rule, the moratorium remains in place for covered IDIs below this asset threshold, such as Santander Bank. In August 2023, the FDIC released a proposal to amend the IDI plan rule. Under the proposal, IDIs with more than USD50 billion, but less than USD100 billion, such as Santander Bank, would not be required to submit an IDI plan. Instead, they would be required to submit an informational filing intended to support the development of strategic options for resolution of the IDI by the FDIC.
Banco Santander will continue to monitor developments related to the FDIC’s proposed IDI rule and will assess the impacts of the proposal on its operations.
Federal Reserve Board proposed supervisory guidance and Large Financial Institution rating system
In August 2017, the Federal Reserve Board issued a proposal on corporate governance to enhance the effectiveness of boards of directors and refocus the Federal Reserve Board’s supervisory expectations for boards of directors on their core responsibilities. The corporate governance proposal consists of three parts. The first part, the board effectiveness guidance, is proposed supervisory guidance identifying the attributes of effective boards of directors and is applicable to certain bank and savings and loan holding companies with total consolidated assets of USD 50 billion or more (other than those that are US IHCs of foreign banking organizations), as well as to certain designated systemically important non-bank financial companies supervised by the Federal Reserve Board. This part would not apply to Santander Holdings USA, but the Federal Reserve Board solicited comments on how the guidance could be adapted to apply to US IHCs of FBOs, signalling that Santander Holdings USA could fall within the scope of a related future proposal. The second and third parts of the corporate governance proposal would revise certain supervisory expectations for boards and clarify expectations for communicating supervisory findings to an institution’s board of directors and senior management.
In January 2018, the Federal Reserve Board proposed supervisory guidance setting out core principles of effective
senior management, the management of business lines, independent risk management and controls. This proposed supervisory guidance, which would apply to our combined US operations including Santander Holdings USA, and our New York branch, would be used in connection with the supervisory assessment of governance and controls under the LFI Rating System described below.
In November 2018, the Federal Reserve adopted a new rating system, the LFI Rating System, to align its supervisory rating system for large financial institutions, including Santander Holdings USA, with its current supervisory programs for these firms. As compared to the rating system it replaced, which will continue to be used for smaller BHCs, the LFI Rating System places a greater emphasis on capital and liquidity, including related planning and risk management practices. Santander Holdings USA received its first rating under the LFI Rating System in 2020.
Source of strength
Santander Holdings USA is required to serve as a source of financial and managerial strength to its US depository institution subsidiaries, and, under appropriate conditions, to commit resources to support those subsidiaries. This support may be required by the Federal Reserve at times when we might otherwise determine not to provide it or when doing so is not otherwise in the interests of Santander Holdings USA or the Group’s stockholders or creditors. The Federal Reserve may require Santander Holdings USA to make capital injections into a troubled subsidiary bank and may charge Santander Holdings USA with engaging in unsafe and unsound practices if Santander Holdings USA fails to commit resources to such a subsidiary bank or if it undertakes actions that the Federal Reserve believes might jeopardize the bank holding company’s ability to commit resources to such subsidiary bank.
Under these requirements, Santander Holdings USA may in the future be required to provide financial assistance to its US depository institution subsidiaries should they experience financial distress. Capital loans by Santander Holdings USA to its US depository institution subsidiaries would be subordinate in right of payment to deposits and certain other debts of the US depository institution subsidiaries. In the event of Santander Holdings USA’s bankruptcy, any commitment by Santander Holdings USA to a federal bank regulatory agency to maintain the capital of its US depository institution subsidiaries would be assumed by the bankruptcy trustee and entitled to a priority of payment.
Consumer protection regulation and supervision
The operations of Santander Bank and SCUSA are subject to supervision and regulation by the CFPB with respect to federal consumer protection laws. Our US operations are also subject to certain state consumer protection laws, and under the Dodd-Frank Act, state attorneys general and other state officials are empowered to enforce certain federal consumer protection laws and regulations. State authorities have recently increased their focus on and enforcement of consumer protection rules. These federal and state consumer protection laws apply to a broad range of our activities and to various aspects of our business and include laws relating to interest rates, auto lending, fair lending, disclosures of credit terms and estimated transaction costs to consumer borrowers, debt collection practices, the use of and the
907 | ||
| Cross-reference to Form 20-F | Consolidated directors' report | Consolidated financial statements | Supplemental information | |||||||||||||||||
provision of information to consumer reporting agencies, and the prohibition of unfair, deceptive or abusive acts or practices in connection with the offer, sale or provision of consumer financial products and services.
The CFPB has promulgated many mortgage-related final rules, including rules related to the ability to repay and qualified mortgage standards, mortgage servicing standards, loan originator compensation standards, high-cost mortgage requirements, HMDA requirements and appraisal and escrow standards for higher priced mortgages. In addition, several proposed revisions to mortgage-related rules are pending finalization. The mortgage-related final rules issued by the CFPB have materially restructured the origination, servicing and securitization of residential mortgages in the United States. For example, under the CFPB’s Ability to Repay and Qualified Mortgage rule, before making a mortgage loan, a lender must establish that a borrower has the ability to repay the mortgage. 'Qualified mortgages,' as defined in the rule, are presumed to comply with this requirement and, as a result, present less litigation risk to lenders. For a loan to qualify as a qualified mortgage, the loan must satisfy certain limits on terms and conditions, pricing and a maximum debt-to-income ratio. Loans eligible for purchase, guarantee or insurance by a government agency or government-sponsored enterprise are exempt from some of these requirements. Satisfying the qualified mortgage standards, ensuring correct calculations are made for individual loans, recordkeeping and monitoring, as well as understanding the effect of the qualified mortgage standards on CRA obligations, impose significant new compliance obligations on, and involve compliance costs for, US mortgage lenders, including ours.
Federal and state regulators have also been increasingly focused on sales practices of branch personnel, including taking regulatory action against other financial institutions. We monitor and review our sales practices in light of evolving regulatory expectations. Any restrictions on our ability to offer our products could reduce earnings, increase compliance costs and expose us to litigation or regulatory actions.
Community Reinvestment Act
The CRA is intended to encourage banks to help meet the credit needs of their service areas, including low- and moderate-income neighbourhoods, consistent with safe and sound banking practices. The relevant federal bank regulatory agency, the OCC in Santander Bank’s case, examines each bank and assigns it a public CRA rating. A bank’s record of fair lending compliance is part of the resulting CRA examination report. Santander Bank is subject to the CRA. Santander Bank’s most recent public CRA report of examination rated Santander Bank as 'Outstanding' for the 1 January 2017 through 31 December 2019 evaluation period. The OCC takes into account Santander Bank’s CRA rating in considering certain regulatory applications Santander Bank makes, including applications related to establishing and relocating branches, and the Federal Reserve Board does the same with respect to certain regulatory applications Santander Holdings USA makes. In October 2023, the Federal Reserve Board, FDIC, and OCC finalized rules that materially revise the current CRA framework, including new assessment area requirements, new methods of calculating credit for lending, investment, and service activities, and additional data collection and reporting requirements. The revised CRA framework will be effective beginning in April 2024.
FDIC as receiver or conservator of Santander Bank
Upon the insolvency of an insured depository institution, such as Santander Bank, the FDIC may be appointed as the conservator or receiver of the institution. Under the Dodd-Frank Act’s Orderly Liquidation Authority, upon the insolvency of a bank holding company, such as Santander Holdings USA, the FDIC may be appointed as conservator or receiver of the bank holding company, if certain findings are made by the FDIC, the Federal Reserve Board and the Secretary of the Treasury, in consultation with the President. Acting as a conservator or receiver, the FDIC would have broad powers to transfer any assets or liabilities of the institution without the approval of the institution’s creditors.
Lending standards and guidance
The US bank regulatory agencies have adopted uniform regulations prescribing standards for extensions of credit that are secured by liens or interests in real estate or made for the purpose of financing permanent improvements to real estate. Under these regulations, all insured depository institutions, such as Santander Bank, must adopt and maintain written policies establishing appropriate limits and standards for extensions of credit that are secured by liens or interests in real estate or are made for the purpose of financing permanent improvements to real estate. These policies must establish loan portfolio diversification standards, prudent underwriting standards (including loan-to-value limits) that are clear and measurable, loan administration procedures, and documentation, approval and reporting requirements. The real estate lending policies must reflect consideration of the federal bank regulatory agencies’ Interagency Guidelines for Real Estate Lending Policies.
FDIC insurance
The Deposit Insurance Fund ('DIF') provides insurance coverage for certain deposits up to a standard maximum deposit insurance amount of USD250,000 per depositor per insured depository institution and is funded through assessments on insured depository institutions, based on the risk each institution poses to the DIF. The FDIC recently required large insured depository institutions, including Santander Bank, to enhance the recordkeeping systems to facilitate prompt payment of insured deposits if such an institution were to fail. The rule required us to reconfigure our information technology systems to be able to provide certain required information by 1 April 2020.
Data privacy and cybersecurity
We are subject to a variety of increasingly stringent federal, state, local, and foreign laws, regulations, rules and standards relating to data privacy and cybersecurity, and the regulatory framework for data privacy and cybersecurity is in considerable flux and evolving rapidly. As data privacy and cybersecurity risks for banking organizations and the broader financial system have significantly increased in recent years, data privacy and cybersecurity issues have become the subject of increasing legislative and regulatory focus.
At the federal level, the GLBA requires financial institutions to, among other things, periodically disclose their privacy policies and practices relating to sharing non-public personal information and enables retail customers to opt out of our ability to share such personal information with unaffiliated third parties under certain circumstances. The GLBA also
908 | ||
requires financial institutions to implement a comprehensive information security program that includes administrative, technical and physical safeguards to ensure the security and confidentiality of customer records and information. These security and privacy policies and procedures for the protection of personal and confidential information are in effect across all businesses and geographic locations. Federal law also makes it a criminal offence, except in limited circumstances, to obtain or attempt to obtain customer information of a financial nature by fraudulent or deceptive means.
Like other lenders, Santander Bank and other of our US subsidiaries also use credit bureau data in their underwriting activities. Use of such data is regulated under the FCRA, and the FCRA also regulates reporting information to credit bureaus, prescreening individuals for credit offers, sharing of information between affiliates, and using affiliate data for marketing purposes. Like other businesses in the US, Santander Bank and our US subsidiaries are also subject to the rules and regulations promulgated under the authority of the Federal Trade Commission, which regulates unfair or deceptive acts or practices, including with respect to data privacy and cybersecurity. Moreover, the United States Congress has recently considered, and is currently considering, various proposals for more comprehensive data privacy and cybersecurity legislation, to which we and our US subsidiaries may be subject if passed.
In addition, the enactment of the Cyber Incident Reporting for Critical Infrastructure Act (‘CIRCIA’) in 2022, once rulemaking is complete, will require, among other things, certain companies to report significant cyber incidents to the Cybersecurity and Infrastructure Security Agency (‘CISA’) within 72 hours from the time the company reasonably believes the incident occurred. Under the CIRCIA, the CISA must publish a notice of proposed rulemaking by March 2024 and issue a final rule within 18 months of such publication.
Federal banking regulators, as well as the SEC and related self-regulatory organizations, regularly issue guidance regarding cybersecurity that is intended to enhance cyber risk management among financial institutions. A financial institution is expected to establish a framework of internal control, first, second and third lines of defence, and risk management policies, procedures and processes that are designed to address the cyber risks that it faces in its business operations. A financial institution’s management is expected to maintain sufficient business continuity planning processes to ensure the rapid recovery, resumption and maintenance of the institution’s operations after a cyberattack. A financial institution is also expected to develop appropriate processes to enable recovery of data and business operations if the institution or its critical service providers fall victim to a cyberattack.
For example, in October 2016, federal banking regulators issued an advance notice of proposed rulemaking regarding enhanced cyber risk management standards, which would apply to a wide range of large financial institutions and their third-party service providers, including our US bank subsidiaries. The proposed standards would expand existing cybersecurity regulations and guidance to focus on cyber risk governance and management; management of internal and external dependencies; and incident response, cyber resilience and situational awareness. In addition, the proposal
contemplates more stringent standards for institutions with systems that are critical to the financial sector. Additionally, in September 2016, the Federal Financial Institutions Examination Council ('FFIEC') issued an Information Security booklet, which includes guidelines for evaluating the adequacy of information security programs (including effective threat identification, assessment and monitoring, and incident identification assessment and response), assurance reports and testing of information security programs. The FFIEC also developed a Cybersecurity Assessment Tool in May 2017 to help financial institutions identify their risks and determine their preparedness for cybersecurity threats. In September 2022, the FFIEC also issued a Cybersecurity Resource Guide for Financial Institutions designed to help financial institutions meet their security control objectives and prepare to respond to cyber incidents, including ransomware incidents.
Further, in the spring of 2022, federal banking regulators imposed a new cybersecurity-related notification rule that requires banking organizations to notify their primary federal regulator as soon as possible and within 36 hours of incidents that, among other things, have materially disrupted or degraded, or are reasonably likely to materially disrupt or degrade, the banking organization’s ability to deliver services to a material portion of its customer base, jeopardize the viability of key operations of the banking organization, or impact the stability of the financial sector. The rule also imposes requirements on bank service providers to notify their affected banking organization customers of certain computer-security incidents.
Data privacy and cybersecurity are also areas of increasing state legislative focus, and states are increasingly proposing or enacting legislation that relates to data privacy and cybersecurity. Various state laws and regulations apply, or may apply in the future, to Santander Holdings USA’s and our subsidiaries’ operations, and may impose additional requirements on Santander Holdings USA and our subsidiaries or otherwise impact Santander Holdings USA’s or our subsidiaries’ ability to share certain personal information with affiliates or non-affiliates for marketing or other purposes, or to contact customers with marketing offers.
For example, the CCPA applies to for-profit businesses that conduct business in California and meet certain revenue or data collection thresholds. The CCPA gives California residents the right to, among other things, request disclosure of personal information collected about them, and whether that information has been sold or shared with others, the right to request deletion of personal information (subject to certain exceptions), the right to opt out of the sale of their personal information, and the right not to be discriminated against for exercising their rights. The CCPA contains a private right of action for California residents as well as enforcement capabilities for both the California Attorney General and a state agency created under the California Privacy Rights Act. The CCPA contains several exemptions, including an exemption applicable to personal information that is collected, processed, sold or disclosed subject to the GLBA. While the CCPA does not currently have, and is not expected to have, a material impact on Banco Santander’s US operations, the CCPA is indicative of a trend towards greater state-level regulation of data privacy and cybersecurity in the United States. A number of other states have enacted, or are
909 | ||
| Cross-reference to Form 20-F | Consolidated directors' report | Consolidated financial statements | Supplemental information | |||||||||||||||||
considering enacting, comprehensive data privacy laws that share similarities with the CCPA. In addition, laws in all 50 US states generally require businesses to provide notice under certain circumstances to consumers whose personal information has been disclosed as a result of a data breach. These laws are not consistent, and compliance in the event of a widespread data breach is difficult and may be costly. Banco Santander continues to assess the requirements of such laws and proposed legislation and their applicability to our operations.
Additionally, the NYDFS issued Cybersecurity Requirements for Financial Services Companies, which took effect in 2017 and was recently amended, which require banks, insurance companies and other financial services institutions regulated by the NYDFS to establish and maintain a cybersecurity program designed to protect consumers and ensure the safety and soundness of New York State’s financial services industry. The cybersecurity regulation adds specific requirements for these institutions’ cybersecurity compliance programs and imposes an obligation to conduct ongoing, comprehensive risk assessments. Further, on an annual basis, each institution is required to submit a certification of compliance with these requirements.
Internationally, virtually every jurisdiction in which we operate has established its own data privacy and cybersecurity legal framework with which we must comply. For example, the GDPR creates additional requirements for the protection of natural persons with respect to the processing of personal data and on the free movement of such data. The GDPR, together with national legislation, regulations and guidelines of the EU member states governing the processing of personal data, imposes strict obligations and restrictions on the ability to collect, use, retain, protect, disclose, transfer and otherwise process personal data. In particular, the GDPR includes obligations and restrictions concerning the security and confidentiality of personal data and the rights of individuals to whom the personal data relates, such as obtaining consent from such individuals, the transfer of personal data out of the EEA and security breach notifications. Additionally, following the UK’s withdrawal from the EU, Banco Santander is also subject to the UK GDPR, a version of the GDPR as implemented into UK law. While a number of basic existing principles have remained the same, the UK GDPR will not automatically incorporate changes made to the GDPR going forward (which would need to be specifically incorporated by the UK government). Moreover, the UK government has publicly announced plans to reform the UK GDPR in ways that, if formalized, are likely to deviate from the GDPR, all of which creates a risk of divergent parallel regimes and related uncertainty, along with the potential for increased compliance costs and risks for affected businesses. The GDPR and UK GDPR authorize significant fines and penalties for non-compliance of up to the higher of 4% of annual worldwide turnover or EUR 20 million (or GBP 17.5 million under the UK GDPR) and, for other specified infringements, fines and penalties of up to the higher of 2% of annual worldwide turnover of EUR 10 million (or GBP 8.7 million under the UK GDPR). European data protection authorities have already imposed fines for GDPR violations up to, in some cases, hundreds of millions of euros.
Recent legal developments in the EEA, including recent rulings from the CJEU and from various EU member state data protection authorities, have created complexity and uncertainty regarding transfers of personal data from the EEA to the US and other so-called third countries outside the EEA. While we have taken steps to mitigate the impact on us, such as implementing SCCs, the efficacy and longevity of these mechanisms remains uncertain. Although the UK currently has an adequacy decision from the European Commission, such that SCCs are not required for the transfer of personal data from the EEA to the UK, that decision will sunset in June 2025 unless extended and it may be revoked in the future by the European Commission if the UK data protection regime is reformed in ways that deviate substantially from the GDPR. Adding further complexity for international data transfers, in March 2022, the UK adopted its own International Data Transfer Agreement for transfers of personal data out of the UK to so-called third countries, as well as an international data transfer addendum that can be used with the SCCs for the same purpose. Moreover, on 10 July 2023, the European Commission adopted an adequacy decision concluding that the US ensures and adequate level of protection for personal data transferred from the EEA to the US under the EU-U.S. Data Privacy Framework (followed on 12 October 2023, with the adoption of an adequacy decision in the UK for the UK-US Data Bridge). However, the adequacy decision does not foreclose, and is likely to face, future legal challenges and the ongoing legal uncertainty may increase our costs and our ability to efficiently process personal data from the EEA or the UK.
Additionally, the EU adopted DORA, in November 2022, which will be effective from 17 January 2025. DORA, which will apply as lex specialis for the financial sector regarding cybersecurity, aims to achieve a common level of digital operational resilience as well as consolidate and upgrade existing ICT risk requirements that had been addressed separately in different regulations and directives, such as Directive (EU) 2022/2555 (otherwise known as the NIS 2 Directive). DORA establishes a set of uniform requirements for network and information systems security structured in five pillars: (i) ICT risk management and governance, (ii) ICT-related incident management, classification and reporting, (iii) digital operational resilience testing, (iv) management of third-party ICT risk, and (v) information and intelligence sharing. The financial sector faces risks and uncertainties regarding the implementation of DORA given that it has stringent compliance timelines and its technical standards are still under public consultation (final version of the standards expected by July 2024), and the efficacy and longevity of any steps we may take to mitigate the impact of DORA remain uncertain due to the fast-moving regulatory environment.
The implementation of the GDPR, UK GDPR and other data protection regimes has required substantial amendments to Banco Santander’s procedures and policies, which have impacted, and could further adversely impact, Banco Santander’s business by increasing its operational and compliance costs. We expect the number of jurisdictions adopting their own data privacy and cybersecurity laws, regulations, rules and standards to increase, which will require us to devote additional significant operational resources and incur additional significant expenses and will also increase our exposure to risks of claims alleging non-
910 | ||
compliance with all applicable data privacy and cybersecurity laws, rules, regulations and standards.
Artificial Intelligence
We utilize, and are continuing to explore further uses of, AI in connection with our business, products and services. However, regulation of AI is rapidly evolving worldwide as legislators and regulators are increasingly focused on these powerful emerging technologies. The technologies underlying AI and its uses are subject to a variety of laws and regulations, including intellectual property, privacy, data protection and information security, consumer protection, competition, and equal opportunity laws, and are expected to be subject to increased regulation and new laws or new applications of existing laws and regulations. AI is the subject of ongoing review by various US governmental and regulatory agencies, and various US states and other foreign jurisdictions are applying, or are considering applying, their platform moderation, cybersecurity, and data protection laws and regulations to AI or are considering legal frameworks for AI.
For example, in Europe, on December 8, 2023, the Council of the European Union, European Parliament and European Commission reached provisional agreement on a revised draft of the AI Act which is currently expected to be enacted in early 2024. The current draft of the AI Act, if enacted, would establish a risk-based governance framework for regulating AI systems operating in the EU market. This framework would categorize AI systems based on the risks associated with such AI systems’ intended purposes as creating “unacceptable”, “high”, “limited” or “minimal” risks. While the AI Act has not been enacted or enforced, there is a risk that that our current or future AI-powered software or applications may be categorized as certain risk categories that may obligate us to comply with the applicable requirements of the AI Act, which may impose additional costs on us, increase our risk of liability, or adversely affect our business. For example, “high” risk AI systems are required, among other things, to implement and maintain certain risk and quality management systems, conduct certain conformity and risk assessments, use appropriate data governance and management practices, including in development and training, and meet certain standards related to testing, technical robustness, transparency, human oversight, and cybersecurity. Even if our current AI-powered software or applications are not categorized as “high” risk AI systems, we may be subject to additional transparency and other obligations for “limited” or “minimal” risk AI systems. The AI Act sets forth certain penalties, including fines of up to the greater of EUR 35 million or 7% of worldwide annual turnover for the prior year for violations related to offering prohibited AI systems or data governance, fines of up to the greater of EUR 15 million or 3% of worldwide annual turnover for the prior year for violations related to the requirements for “high” risk AI systems, and fines of up to the greater of EUR 7.5 million or 1.5% of worldwide annual turnover for the prior year for violations related to supplying incorrect, incomplete or misleading information to EU and member state authorities. If enacted in this form or a similar form, this regulatory framework is expected to have a material impact on the way AI is regulated in the EU (and, potentially, globally), together with developing guidance and decisions in this area.
We may not be able to anticipate how to respond to these rapidly evolving laws and regulations, and we may need to
expend resources to adjust our offerings in certain jurisdictions if the legal and regulatory frameworks are inconsistent across jurisdictions. Furthermore, because AI technology itself is highly complex and rapidly developing, it is not possible to predict all of the legal or regulatory risks that may arise relating to the use of AI. If laws and regulations relating to AI are implemented, interpreted or applied in a manner inconsistent with our current practices or policies, such laws and regulations may adversely affect our use of AI and our ability to provide and to improve our services, require additional compliance measures and changes to our operations and processes, result in increased compliance costs and potential increases in civil claims against us, any of which could adversely affect our operating results, financial condition and prospects.
Compensation
The compensation practices of our US subsidiaries are subject to oversight by the Federal Reserve Board and, with respect to some of our subsidiaries and employees, by other financial regulatory bodies. The scope and content of compensation regulation in the financial industry are continuing to develop, and we expect that these regulations and resulting market practices will continue to evolve over a number of years.
Anti-Money Laundering
The Bank Secrecy Act, as amended by the USA PATRIOT Act and the Anti-Money Laundering Act of 2021, contains provisions intended to detect and prevent the use of the US financial system for money laundering and terrorist financing activities. Under the Bank Secrecy Act, US financial institutions, including US branches and subsidiaries of non-US banks, are required to, among other things, maintain an AML program, verify the identity of clients, identify and verify the beneficial owners of certain legal entity clients, conduct ongoing customer due diligence, monitor for and report suspicious transactions, report on cash transactions exceeding specified thresholds, and respond to requests for information by regulatory authorities and law enforcement agencies. Santander Bank is subject to the Bank Secrecy Act and therefore is required to maintain a system of internal controls, provide its employees with AML training, designate an AML compliance officer and undergo an annual, independent audit to assess the effectiveness of its AML program. Santander Bank has implemented policies, procedures and internal controls that are designed to comply with its US AML requirements.
US bank regulators are focusing their examinations on AML compliance, and we will continue to monitor and augment, where necessary, our (including our US branches’ and subsidiaries’) AML compliance programs. Failures to comply with applicable US AML laws and regulations could have severe legal and reputational consequences, including significant civil monetary and criminal penalties and termination of US banking licenses. In addition, US regulators have taken actions against non-US bank holding companies requiring them to improve their oversight of their US subsidiaries’ Bank Secrecy Act programs and compliance. Further, US federal banking agencies are required, when reviewing bank and bank holding company acquisition or merger applications, to take into account the effectiveness of the AML compliance record of the applicant.
US sanctions
911 | ||
| Cross-reference to Form 20-F | Consolidated directors' report | Consolidated financial statements | Supplemental information | |||||||||||||||||
OFAC is responsible for administering economic sanctions imposed against designated foreign countries, governments, individuals and entities pursuant to various Executive Orders, statutes and regulations. OFAC-administered sanctions take many different forms. For example, sanctions may include: (1) restrictions on US persons’ trade with or investment in a sanctioned country, including prohibitions against direct or indirect imports from and exports to a sanctioned country and prohibitions on US persons engaging in financial transactions relating to, making investments in, or providing investment-related advice or assistance to, a sanctioned country; and (2) blocking of assets of targeted governments or 'specially designated nationals,' by prohibiting transfers of property subject to US jurisdiction, including property in the possession or control of US persons. Blocked assets, such as property and bank deposits, cannot be paid out, withdrawn, set off or transferred in any manner without a license from OFAC. In addition, non-US persons can be liable for 'causing' a sanctions violation by a US person or can violate US sanctions by exporting services from the United States to a sanctions target, for example by engaging in transactions with targets of US sanctions denominated in US dollars that clear through US financial institutions (including through US branches or subsidiaries of non-US banks).
Failure to comply with applicable US sanctions could have serious legal and reputational consequences, including significant civil monetary penalties and, in the most severe cases, criminal penalties.
In addition, the US government has imposed various sanctions that prevent non-US persons, including non-US financial institutions, from engaging in certain activities undertaken outside the United States and without the involvement of any US persons ('secondary sanctions'). If a non-US financial institution were determined to have engaged in activities targeted by certain US secondary sanctions, it could lose its ability to open or maintain correspondent or payable-through accounts with US financial institutions, among other potential consequences.
Disclosure pursuant to Section 219 of the Iran threat reduction and Syria human rights act
Pursuant to Section 219 of the Iran Threat Reduction and Syria Human Rights Act of 2012, which added Section 13(r) to the Securities Exchange Act of 1934, as amended (the 'Exchange Act'), an issuer is required to disclose in its annual or quarterly reports, as applicable, whether it or any of its affiliates knowingly engaged in certain activities, transactions or dealings relating to Iran or with individuals or entities designated pursuant to certain Executive Orders. Disclosure is generally required even where the activities, transactions or dealings were conducted in compliance with applicable law.
The following activities are disclosed in response to Section 13(r) with respect to the Group and its affiliates. During the period covered by this report:
•Santander UK holds seven blocked accounts for five customers that are currently designated by the US under the Specially Designated Global Terrorist (SDGT) sanctions programme. Revenues and profits generated by Santander UK on these accounts in the year ended 31 December 2023
were negligible relative to the overall profits of Banco Santander, S.A.
•Santander Consumer Finance, S.A. holds through its Belgian branch seven blocked correspondent accounts for an Iranian bank that is currently designated by the US under the Specially Designated Global Terrorist (SDGT) sanctions programme. The accounts have been blocked since 2008. No revenues or profits were generated by the Belgian branch on these accounts in the year ended 31 December 2023.
•Santander Brasil holds three blocked accounts for three customers with domicile in Brazil designated by the US under the Specially Designated Global Terrorist (SDGT) sanctions programme. Revenues and profits generated by Santander Brasil on these accounts in the year ended 31 December 2023 were negligible relative to the overall profits of Banco Santander, S.A.
•The Group also has certain legacy performance guarantees for the benefit of an Iranian bank that is currently designated by the US under the Specially Designated Global Terrorist (SDGT) sanctions programme (stand-by letters of credit to guarantee the obligations – either under tender documents or under contracting agreements – of contractors who participated in public bids in Iran) that were in place prior to April 27, 2007.
In the aggregate, all of the transactions described above resulted in gross revenues and net profits in the year ended 31 December 2023 which were negligible relative to the overall revenues and profits of Banco Santander, S.A. The Group has undertaken significant steps to withdraw from the Iranian market such as closing its representative office in Iran and ceasing all banking activities therein, including correspondent relationships, deposit taking from Iranian entities and issuing export letters of credit, except for the legacy transactions described above. The Group is not contractually permitted to cancel these arrangements without either (i) paying the guaranteed amount (in the case of the performance guarantees), or (ii) forfeiting the outstanding amounts due to it (in the case of the export credits). As such, the Group intends to continue to provide the guarantees and hold these assets in accordance with company policy and applicable laws.
Monetary policy and exchange controls
The decisions of the European System of Central Banks influence conditions in the money and credit markets, thereby affecting interest rates, the growth in lending, the distribution of lending among various industry sectors and the growth of deposits. Monetary policy has had a significant effect on the operations and profitability of Spanish banks in the past and this effect is expected to continue in the future. Similarly, the monetary policies of governments in other countries in which we have operations, particularly in Latin America, the United States and the United Kingdom, affect our operations and profitability in those countries. We cannot predict the effect which any changes in such policies may have upon our operations in the future, but we do not expect it to be material.
The European Monetary Union has had a significant effect upon foreign exchange and bond markets and has involved
912 | ||
modification of the internal operations and systems of banks and of inter-bank payments systems. Since 1 January 1999, the start of Stage III, see '-Supervision and Regulation-Single Supervisory Mechanism, Bank of Spain and the European Central Bank,' Spanish monetary policy has been affected in several ways. The euro has become the national currency of the then fifteen participating countries and the exchange rates between the currencies of these countries were fixed to the euro. Additionally, the European System of Central Banks became the entity in charge of the European Union’s monetary policy.
913 | ||
| Cross-reference to Form 20-F | Consolidated directors' report | Consolidated financial statements | Supplemental information | |||||||||||||||||
11. Shareholders remuneration
The table below sets forth the historical per share and per ADS (each of which represents the right to receive one of our shares) amounts of interim and total remuneration payments in respect of each fiscal year indicated.
| Euro per Share | Dollars per ADS | ||||||||||||||||||||||||||||||||||||||||||||||||||||||||||
| First | Second | Third | Fourth | Total | First | Second | Third | Fourth | Total | ||||||||||||||||||||||||||||||||||||||||||||||||||
| 2019(A) | 0.096 | 0.096 | n.a. | n.a. | 0.19 | 0.106 | 0.115 | n.a. | n.a. | 0.22 | |||||||||||||||||||||||||||||||||||||||||||||||||
| 2020(A) | 0.0275 | n.a. | n.a. | n.a. | 0.0275 | 0.034 | n.a. | n.a. | n.a. | 0.034 | |||||||||||||||||||||||||||||||||||||||||||||||||
| 2021(A) | 0.0485 | 0.0515 | n.a. | n.a. | 0.10 | 0.0561 | 0.0541 | n.a. | n.a. | 0.1102 | |||||||||||||||||||||||||||||||||||||||||||||||||
| 2022(A) | 0.0583 | 0.0595 | n.a. | n.a. | 0.1178 | 0.0575 | 0.0651 | n.a. | n.a. | 0.1227 | |||||||||||||||||||||||||||||||||||||||||||||||||
| 2023(A) | 0.0810 | 0.0950 | n.a. | n.a. | 0.1760 | 0.0858 | 0.1024 | n.a. | n.a. | 0.1882 | |||||||||||||||||||||||||||||||||||||||||||||||||
(A)With regard to the 2021 shareholder remuneration policy, on 28 September 2021 the board announced its intention to pay out an interim distribution of approximately 40% of the Group's underlying profit (half through a cash dividend and half through a shares buyback).
Interim remuneration. Accordingly, it authorized the payment of an interim dividend of EUR 4.85 cents per share (i.e., 20% of the Group's underlying profit for the first half of 2021), in cash and charged against 2021 profits. The interim dividend was paid on 2 November 2021. The board also voted to launch the First 2021 Buyback Programme worth 841 million euros (20% of the Group's underlying profit for the first half of 2021) once the ECB approved it on 28 September 2021. The First 2021 Buyback Programme was completed on 26 November 2021, and resulted in the acquisition of a total of 259,930,273 shares.
Final remuneration. On 24 February 2022, pursuant to the 2021 shareholder remuneration policy, the board of directors voted to: (i) submit a resolution at the 1 April 2022 AGM (the '2022 AGM') to approve a final cash dividend in the gross amount of EUR 5.15 cents per share (approximately 20% of the Group’s underlying profit for the second half of 2021); and (ii) implement a Second 2021 Buyback Programme worth 865 million euros (approximately 20% of the Group’s underlying profit for the second half of 2021). After approval at the 2022 AGM, the cash dividend was paid on 2 May 2022, and the Second 2021 Buyback Programme was completed on 6 May 2022, resulting in the acquisition of a total of 286,309,445 shares. As a result, total shareholder remuneration totalled approximately EUR 3.4 billion, equivalent to approximately 40% of 2021 underlying attributable profit.
With regard to the remuneration policy against the 2022 earnings, the board continued the policy of allocating approximately 40% of the Group's underlying profit to shareholder remuneration, split in approximately equal parts in cash dividends and share buybacks.
Interim remuneration. On 27 September 2022, the board authorized the payment of an interim cash dividend against 2022 results of 5.83 euro cents per share (equivalent to approximately 20% of the Group's underlying profit in the first half 2022). The interim dividend was paid on 2 November 2022. The board also agreed to implement the First 2022 Buyback Programme worth approximately 979 million euros (approximately 20% of the Group's underlying profit in first half 2022) following the ECB approval on 17 November 2022. The First 2022 Buyback Programme was completed on 31 January 2023, and resulted in the acquisition of a total of 340,406,572 shares.
Final remuneration. On 27 February 2023, per the 2022 shareholder remuneration policy, the board of directors voted to: (i) submit a resolution at the 31 March 2023 AGM to approve a final cash dividend in the gross amount of 5.95 euro cents per share entitled to receive dividends (following the approval at the AGM, the dividend was paid on 2 May 2023); and (ii) implement a Second 2022 Buyback Programme worth 921 million euros, that commenced on 1 March 2023 and was completed on 21 April 2023, resulting in the acquisition of a total of 269,848,953 shares. After the above-mentioned actions, the shareholders' remuneration for 2022 amounted to 3,842 million euros (approximately 40% of the underlying profit in 2022) split in approximately equal parts in cash dividends (1,942 million euros) and share buybacks (1,900 million euros).
With regard to the remuneration policy against the 2023 earnings, the board followed a policy of allocating 50% of the Group’s reported profit, excluding non-cash, non-capital ratios impact items, to shareholder remuneration, distributed in approximately 50% in cash dividend and 50% in share buybacks.
Interim remuneration. On 26 September 2023, the board resolved to pay an interim cash dividend against the 2023 results of 8.10 euro cents per share entitled to the dividend (equivalent to approximately 25% of the Group's reported profit in the first half of 2023). The interim dividend was paid on 2 November 2023. The board also agreed to implement the First 2023 Buyback Programme worth approximately EUR 1,310 million (equivalent to approximately 25% of the Group's reported profit in the first half of 2023). The First 2023 Buyback Programme was completed on 25 January 2024, and resulted in the acquisition of a total of 358,567,487 shares.
Final remuneration. Under the 2023 shareholder remuneration policy, on 19 February 2024, the board of directors resolved to submit a resolution at the 2024 AGM to approve a final cash dividend in the gross amount of 9.50 euro cents per share entitled to dividends. If approved at the AGM, the dividend would be payable from 2 May 2024. The board of directors also resolved to implement the Second 2023 Buyback Programme worth 1,459 million euros, for which the appropriate regulatory authorisation has been obtained and which commenced on 20 February 2024. Once the above-mentioned actions are completed, total shareholder remuneration for 2023 would be of 5,538 million euros (approximately 50% of the Group's reported profit in 2023), distributed in approximately 50% in cash dividend (2,769 million euros) and 50% in share buybacks (2,769 million euros). These amounts have been estimated assuming that, as a consequence of the partial execution of the Second 2023 Buyback Programme at the time of payment of the cash dividend, the number of outstanding shares entitled to the final cash dividend will be 15,483,617,874. Therefore, that amount may be higher if fewer shares than planned are acquired in the Second 2023 Buyback Programme; otherwise, it will be lower.
For more information see section 3.3.'Dividends and shareholder remuneration' in the 'Corporate governance' chapter included in Part 1 of this annual report on Form 20-F.
Note: 2019 data adjusted to reflect the capital increase of December 2020.
12. The offer and listing
Santander’s shares
In 2023, Santander was the most actively traded stock on the Spanish stock exchange. At 31 December 2023, the stock had a 11.75% weighting in the IBEX 35 Index and was ranked third among all Spanish issuers represented in this index. In 2023, 11,132 million shares were traded, for a cash amount of EUR 38,144 million. Our market capitalization of EUR 61,168 million at 2023 year-end made us one of the largest banks in the eurozone by market capitalization.
At 31 December 2023, a total of 4,085,590,470 shares, or 25.24% of our share capital, were held by 1,294 depositary receipt registered holders in our American Depositary Share
Program. Citibank, N.A. is the depositary of our American Depositary Share Program.
At 31 December 2023, 60.76% of our shares were held of record by non-residents of Spain.
American Depositary Shares
Our ADSs have been listed and traded on the New York Stock Exchange since 30 July 1987. Each ADS represents one of our shares and is evidenced by an American Depositary Receipt or 'ADR.' Under the deposit agreement, pursuant to which ADRs have been issued, Citibank, N.A. is the depositary and holder from time to time of ADRs. At 31 December 2023, we had outstanding a total of 620,105,304 ADRs of which 5,886,511 were held by 10,816 registered holders with Citibank, N.A. Since certain of such of our shares and our ADSs are held by nominees, the number of record holders is not representative
914 | ||
of the number of beneficial owners. Our directors and executive officers owned 695,748 ADRs as of 31 December 2023, according to the information of the Spanish CNMV.
Our depositary is Citibank, N.A., with its principal office located at 388 Greenwich Street, New York, New York 10013, US.
Each ADS represents the right to receive one Common Stock of Santander, pay value EUR 0.50 each.
The following ADS fees are payable under the terms of the Deposit Agreement:
| Service | Rate | By Whom Paid | ||||||
| (1) Issuance of ADSs (e.g., an issuance upon a deposit of Shares, upon a change in the ADS(s)-to-Share(s) ratio, or for any other reason), excluding issuances as a result of distributions described in paragraph (4) below. | Up to USD 5.00 per 100 ADSs (or fraction thereof) issued. | Person for whom ADSs are issued. | ||||||
| (2) Cancellation of ADSs (e.g., a cancellation of ADSs for Delivery of deposited Shares, upon a change in the ADS(s)-to-Share(s) ratio, or for any other reason). | Up to USD 5.00 per 100 ADSs (or fraction thereof) cancelled. | Person for whom ADSs are being cancelled. | ||||||
| (3) Distribution of cash dividends or other cash distributions (e.g., upon a sale of rights and other entitlements). | Up to USD 5.00 per 100 ADSs (or fraction thereof) held. | Person to whom the distribution is made. | ||||||
| (4) Distribution of ADSs pursuant to (i) stock dividends or other free stock distributions, or (ii) an exercise of rights to purchase additional ADSs. | Up to USD 5.00 per 100 ADSs (or fraction thereof) held. | Person to whom the distribution is made. | ||||||
| (5) Distribution of securities other than ADSs or rights to purchase additional ADSs (e.g., spin-off shares). | Up to USD 5.00 per 100 ADSs (or fraction thereof) held. | Person to whom the distribution is made. | ||||||
| (6) ADS Services. | Up to USD 5.00 per 100 ADSs (or fraction thereof) held on the applicable record date(s) established by the Depositary. | Person holding ADSs on the applicable record date(s) established by the Depositary. | ||||||
| (7) Registration of ADS Transfers (e.g., upon a registration of the transfer of registered ownership of ADSs, upon a transfer of ADSs into DTC and vice versa, or for any other reason). | Up to USD 5.00 per 100 ADSs (or fraction thereof) transferred. | Person for whom or to whom ADSs are transferred. | ||||||
| (8) Conversion of ADSs of one series for ADSs of another series (e.g., upon conversion of Partial Entitlement ADSs for Full Entitlement ADSs, or upon conversion of Restricted ADSs into freely transferable ADSs, and vice versa). | Up to USD 5.00 per 100 ADSs (or fraction thereof) converted. | Person for whom ADSs are converted or to whom the converted ADSs are delivered. | ||||||
In 2023, the Depositary made direct payments and reimbursements to us in the gross amount of USD 11,185,335 for expenses related to investor relations with no withholding for tax purposes in the US.
Trading by Santander’s subsidiaries in the shares
We and/or some of our subsidiaries, in accordance with market practice, as permitted under the relevant European regulations and according to our internal policy, have regularly purchased and sold our shares for our own account. We expect that we and/or our subsidiaries may continue to purchase and sell our shares from time to time.
Our trading activities in our shares are driven by orders, which are matched by the market’s computer system according to price and time entered. Santander’s broker (which is Banco Santander, S.A. after the absorption of Santander Investment Bolsa, S.V., S.A.U. and Popular Bolsa, S.V., S.A.U.) and the other brokers authorized to trade on the continuous market ('Member Firms') are not required to and do not serve as market makers maintaining independently established bid and ask prices. Rather, Member Firms place orders for their customers, or for their own account, into the market’s computer system. If an adequate counterparty order is not available on the continuous market at that time, the Member Firm may solicit counterparty orders from among its own clients and/or may accommodate the client by filling the client’s order as principal.
Under the Spanish Capital Companies Law, a company and its subsidiaries are prohibited from purchasing shares of the company in the primary market. However, purchase of the shares is permitted in the secondary market provided that: (1) the aggregate nominal value of the shares previously held by the company and its subsidiaries (referred to as 'treasury stock' or 'autocartera') does not exceed 10% of the total outstanding capital stock of the company, (2) the purchases are authorized at a meeting of the shareholders of the acquiring company and, if the acquisition relates to shares in the parent company, the acquiring company’s parent, and (3) such purchases, together with the shares previously held by the company and its subsidiaries, do not result in a net equity less than the company’s stock and the minimum reserves stipulated by law and our Bylaws. See more information in section 2.5. 'Treasury shares' in the 'Corporate governance' chapter in Part 1 of this annual report on Form 20-F.
Spanish Royal Decree 1362/2007, of October 19, requires that the CNMV be notified each time the acquisition of treasury stock made since the last notification reaches 1% of the voting rights of the company, regardless of any other preceding sales. Furthermore, the Spanish Capital Companies Law establishes, in relation to the treasury stock shares (held by us and our affiliates), that the exercise of the right to vote and other non-financial rights attached to them shall be suspended. Financial rights arising from treasury stock held directly by us, with the exception of the right to allotment of
915 | ||
| Cross-reference to Form 20-F | Consolidated directors' report | Consolidated financial statements | Supplemental information | |||||||||||||||||
new bonus shares, shall be attributed proportionately to the rest of the shares.
The portion of overall trading volume in Santander ordinary shares transacted by Group subsidiaries continues to vary from day to day and from month to month, and is expected to continue to do so in the future. In 2023, 19.2% of the total volume traded in Santander ordinary shares executed on the Primary Spanish Stock Exchange (Bolsas y Mercados Españoles) was transacted by Banco Santander, S.A. The portion of trading volume in shares allocable to purchases and sales as principal by our companies (treasury shares) was approximately 5.2% in the same period. The monthly average
percentage of outstanding shares held by our subsidiaries ranged from 0.05% to 2.13% in 2023. At 31 December 2023, Banco Santander, S.A. and our subsidiaries held 297,815,673 shares (1.84% of our total capital stock as of that date), of which 286,842,316 shares relate to the First Buyback Programme 2023, pending to be amortized.
Purchases of equity securities by the issuer and affiliated purchasers
The following table shows the purchases of shares made by the Bank or any of its affiliated purchasers during 2023:
| 2023 | Total number of shares -or units purchased (A) | Average price paid per share (or unit) in euros | Total number of shares (or units) purchased as part of publicly announced plans or programs (B) | Euro value of the maximum number of shares (or units) that may yet be purchased under the plans or programs (B) | ||||||||||||||||||||||
| January | 127,007,944 | 3.04 | 105,966,627 | 43,284,247 | ||||||||||||||||||||||
| February | 37,475,283 | 3.35 | 13,497,139 | 921,000,000 | ||||||||||||||||||||||
| March | 214,435,120 | 3.36 | 185,500,000 | 295,187,184 | ||||||||||||||||||||||
| April | 108,615,021 | 3.39 | 84,348,953 | — | ||||||||||||||||||||||
| May | 13,992,359 | 3.14 | ||||||||||||||||||||||||
| June | 25,280,221 | 3.10 | ||||||||||||||||||||||||
| July | 6,370,711 | 3.50 | ||||||||||||||||||||||||
| August | 10,641,739 | 3.58 | ||||||||||||||||||||||||
| September | 33,158,258 | 3.46 | 1,310,000,000 | |||||||||||||||||||||||
| October | 168,050,717 | 3.54 | 158,278,640 | 749,908,102 | ||||||||||||||||||||||
| November | 58,999,110 | 3.48 | 49,179,885 | 575,037,161 | ||||||||||||||||||||||
| December | 107,267,194 | 3.83 | 79,383,791 | 271,052,800 | ||||||||||||||||||||||
| Total | 911,293,677 | 676,155,035 | ||||||||||||||||||||||||
(A) The number of shares purchased includes securities lending and short positions.
(B) Purchases related to the Buyback Programmes pursuant to the resolutions adopted by the general shareholders' meeting held on 3 April 2020. For more information see 2.5 'Treasury shares' in the 'Corporate governance' chapter in Part 1 of this annual report on Form 20-F and note 34.b) to our 'Consolidated financial statements' in Part 1 of this annual report on Form 20-F.
During 2023, all purchases and sales of equity securities were made in open-market transactions.
916 | ||
13. Additional information
13.1. Memorandum and articles of association
Bylaws
The following summary of the material terms of our Bylaws is not meant to be complete and is qualified in its entirety by reference to our Bylaws. Because this is a summary, it may not contain all the information that is important to you. You should read our Bylaws carefully before you decide to invest. Copies of our Bylaws are incorporated by reference.
Banco Santander's Bylaws were approved by our shareholders at the annual general shareholders’ meeting held on 21 June 2008 and incorporated with the office of the Commercial Registry on 11 August 2008.
Subsequently, Article 5 of Banco Santander’s Bylaws has been updated several times, mostly to show the current share capital and the number of shares outstanding.
In 2023, the share capital was amended on the back two capital reductions:
•on 15 March 2023 by EUR 170,203,286 (c. 2.03% of share capital) under the authorization of the 2022 AGM, and which was registered in the Commercial Registry on 20 March 2023; and
•on 27 June 2023 by EUR 134,924,476.50 (c. 1.64% of share capital) in the terms agreed at the 2023 AGM, and which was registered with the Commercial Registry on 30 June 2023.
On 30 January 2024, the board of directors agreed, under the authorization of the 2023 AGM, to reduce the share capital in the amount of EUR 179,283,743.50, by cancelling the 358,567,487 repurchased own shares (c. 2.22% of share capital), acquired through the First 2023 Buyback Programme carried out within the 2023 shareholder remuneration policy. The share capital is currently EUR 7,912,789,286 represented by 15,825,578,572 shares.
Our current Bylaws are included as Exhibit 1.1 to this annual report. The Bylaws are also available on our corporate website (www.santander.com), which does not form part of this annual report on Form 20-F, under the heading 'Shareholders and investors-Corporate Governance - Bylaws'.
Rules and regulations of the board and rules and regulations for the general meeting
Aside from the Bylaws, the Rules and regulations of the board and the Rules and regulations for the general shareholders' meeting also form part of the internal governance rules of Banco Santander.
On 25 July 2023, the board of directors resolved to amend the Rules and regulations of the board of directors with the purpose of:
•adapting them to the new provisions of Act 2/2023 of 20 February on the protection of persons who report violations of the law and the fight against corruption, establishing the board's responsibility for implementing an internal system (Canal Abierto) and delegating
oversight of such system to the audit and risk supervision, regulation and compliance committees;
•aligning them with the EBA guidelines on improving resolvability for institutions and resolution authorities, which will apply from January 2024, to outline the board's oversight of crisis management planning, with support from the risk supervision, regulation and compliance committee; and
•introducing technical improvements to increase the board's effectiveness in the performance of its duties.
For further information regarding amendments to the Rules and regulations of the board that occurred during 2023, we refer to section 4.3 'Board functioning and effectiveness' in the 'Corporate governance' chapter in Part 1 of this annual report on Form 20-F.
The Rules and regulations of the board, as amended, and the Rules and regulations of the general shareholders' meeting are available on our corporate website (www.santander.com), which does not form part of this annual report on Form 20-F, under the heading 'Shareholders and investors-Corporate Governance-Rules and Regulations of the Board of Directors' and 'Shareholders and investors-Corporate Governance-Rules and Regulations for the General Shareholders’ Meeting', respectively.
Corporate object and purpose
Article 2 of our Bylaws states that the corporate objective and purpose of Banco Santander consists of carrying out all types of activities, operations and services specific to the banking business in general and which are permitted under current legislation and the acquisition, holding and disposal of all types of securities.
Certain provisions regarding shareholder rights
As at the date of the filing of this report, Banco Santander’s capital comprises one share class only (ordinary shares), which grant all shareholders the same rights. Banco Santander may issue non-voting shares for a nominal amount of no more than one-half of the paid-up share capital, and redeemable shares for a nominal amount of no more than one-fourth of its share capital.
Our Bylaws do not contain any provisions relating to sinking funds.
Our Bylaws do not specify what actions or quorums are required to change the rights of shareholders. Under Spanish law, the rights of shareholders may only be changed by an amendment to the Bylaws that complies with the requirements explained below under 'Meetings and Voting Rights'.
Meetings and voting rights
We hold our annual general shareholders’ meeting during the first six months of each fiscal year on a date set by the board of directors. Extraordinary meetings may be called from time to time by the board of directors whenever the board considers it advisable for corporate interests, and whenever so requested by shareholders representing at least 3% of the outstanding share capital of Banco Santander. Notices of all
917 | ||
| Cross-reference to Form 20-F | Consolidated directors' report | Consolidated financial statements | Supplemental information | |||||||||||||||||
meetings have to be published at least one month prior to the date set for the meeting, except in those instances in which a different period is established by law, in the Official Gazette of the Commercial Registry or in one of the national newspapers with the largest circulation in Spain, on the website of the CNMV and on Banco Santander’s website (www.santander.com). In addition, under Spanish law, the agenda of the meeting must be sent to the CNMV and the Spanish Stock Exchanges and published on the company’s website. We held one ordinary general shareholder meeting on 31 March 2023.
Each Banco Santander share entitles the holder to one vote. Registered holders of any number of shares who are current in the payment of capital calls will be entitled to attend shareholders’ meetings. Our Bylaws do not contain provisions regarding cumulative voting.
Any Banco Santander share may be voted by proxy. Subject to the limitations imposed by Spanish law, proxies may be given to any individual or legal person, must be in writing or by remote means of communication and are valid only for a single meeting. According to Spanish law, if a director or another person acting on their behalf makes a public solicitation for proxies (thus obtaining more than three proxies), the director holding the proxies may not exercise the voting rights attached to the represented shares (unless specific instructions were given by the shareholder) in connection with any items in respect of which the director or such other person is subject to a conflict of interest and, in any event, in connection with decisions relating to:
•the director's appointment or ratification, removal, dismissal or withdrawal as director;
•the institution of a derivative action against the director; or
•the approval or ratification of transactions between Banco Santander and the director in question, companies controlled or represented by the director, or persons acting on the director's behalf.
In accordance with the Rules and regulations for the general shareholders' meeting, from the date when the call of the general shareholders' meeting is published, our corporate website includes the text of all resolutions proposed by the board of directors with respect to the agenda items and the details regarding the manner and procedures for shareholders to follow to confer representation on any individual or legal entity. The manner and procedures for electronic delegation and voting via the Internet are also indicated.
In 2004, our shareholders could exercise their voting and representation rights prior to the general shareholder's meeting by electronic means (via the Internet). Since 2005, our shareholders were also able to attend via the Internet (besides attending and voting in person) and were also able to vote in real time on the Internet on the resolutions considered at the meeting.
Only registered holders of Banco Santander shares on record at least five days prior to the day on which a meeting is scheduled may attend and vote at shareholders’ meetings. As a registered shareholder, the depositary will be entitled to vote the Banco Santander shares underlying the Santander
ADSs. The deposit agreement requires the depositary to accept voting instructions from holders of Santander ADSs and to execute such instructions to the extent permitted by law.
In general, resolutions passed at a general meeting are binding on all shareholders. In certain circumstances, Spanish law gives dissenting or absent shareholders the right to have their Santander shares redeemed at prices determined in accordance with established formula or criteria. Treasury shares held by Banco Santander or its affiliates are counted for the purpose of determining quorums but may not be voted by Banco Santander or by its affiliates.
Resolutions at general meetings are passed provided that, regarding the voting capital present or represented at the meeting, the number of votes in favour is higher than the number of votes against, except for the foregoing cases in which the law and the Bylaws require a greater majority.
In accordance with Spanish law, a quorum on first call for a duly constituted ordinary or extraordinary general meeting of shareholders requires the presence in person or by proxy of shareholders representing at least 25% of the subscribed voting capital. On the second call there is no quorum requirement.
Notwithstanding the above, a quorum of at least 50% of the subscribed voting capital is required on the first call for a duly constituted ordinary or extraordinary general meeting of shareholders voting any to adopt the following resolutions:
•the issuance of debentures;
•the increase or reduction of share capital;
•the exclusion or limitation of pre-emptive rights;
•the transformation, merger, split-off, or the overall assignment of assets and liabilities;
•the relocation of the registered office abroad; and
•any other amendment to our Bylaws.
A quorum of 25% of the subscribed voting capital is required for a duly constituted ordinary or extraordinary general meeting of shareholders voting on such actions on the second call.
The valid approval of all the above listed actions requires the favourable vote of more than half of the votes corresponding to the shares represented in person or by proxy at the general shareholders’ meeting, except when on second call shareholders representing less than fifty percent of the subscribed share capital with the right to vote are in attendance - in which case the favourable vote of two-thirds of the share capital represented in person or by proxy at the general shareholders’ meeting shall be required.
For purposes of determining the quorum, those shareholders who vote by mail or via the Internet are counted as present at the meeting, as provided by the Rules and regulations of the general meeting. The quorum at the 2019 annual general meeting (AGM) was 68.50% of Banco Santander’s share capital, while the quorum at the 2019 extraordinary general meeting was 59.22% of Banco Santander's share capital; the
918 | ||
quorum at the April 2020 AGM was 65.0% of Banco Santander’s share capital, and the quorum at the October 2020 AGM was 60.34% of Banco Santander’s share capital; the quorum at the March 2021 AGM was 67.67% of Banco Santander’s share capital; the quorum at the April 2022 AGM was 68.78% of Banco Santander’s share capital; and the quorum at the March 2023 AGM was 67.56% of Banco Santander’s share capital.
Changes in capital
See sections '2.1.'Share capital', 2.2. 'Authority to increase capital', 2.5 'Treasury shares', 3.4. '2023 AGM' and 3.5. 'Our next AGM in 2024' in the 'Corporate governance' chapter in Part 1 of this annual report on Form 20-F.
Dividends
See section 3.3.'Dividends and shareholder remuneration' in the 'Corporate governance' chapter in Part 1 of this annual report on Form 20-F.
Preemptive rights
In the event of a capital increase, each shareholder has a preferential right by operation of law to subscribe shares in proportion to their shareholding in each new issue of Banco Santander shares. The same right is vested on shareholders upon the issuance of convertible debt. However, shareholders' preemptive rights may be excluded under certain circumstances by specific approval at the general meeting (or upon its delegation by the board of directors) and preemptive rights are deemed excluded by operation of law in the relevant capital increase when our shareholders approve:
•capital increases following conversion of convertible bonds into Banco Santander shares;
•capital increases due to the absorption of another company or of part of the spin-off assets of another company, when the new shares are issued in exchange for the new assets received; or
•capital increases due to Banco Santander’s tender offer for securities using Banco Santander’s shares as all or part of the consideration.
If capital is increased by the issuance of new shares in return for capital from certain reserves, the resulting new Banco Santander's shares will be distributed pro rata to existing shareholders.
Redemption
Our Bylaws do not contain any provisions relating to redemption of shares except as set forth in connection with capital reductions. Nevertheless, pursuant to Spanish law, redemption rights may be created at a duly held general meeting. Such meeting will establish the specific terms of any redemption rights created.
Registration and transfers
The Banco Santander shares are in book-entry form in the Iberclear system. We maintain a registry of shareholders. We do not recognize, at any given time, more than one person as
the person entitled to vote each share in the shareholders meeting.
Under Spanish law and regulations, transfers of shares quoted on a stock exchange are normally made through a Sociedad o Agencia de Valores, credit entities and investment services companies that are members of the Spanish stock exchange.
Transfers executed through stock exchange systems are implemented pursuant to the stock exchange clearing and settlement procedures of Iberclear. Transfers executed 'over the counter' are implemented pursuant to the general legal regime for book-entry transfer, including registration by Iberclear.
New shares may not be transferred until the capital increase is registered with the Commercial Registry.
Liquidation rights
Upon a liquidation of Banco Santander, our shareholders would be entitled to receive pro-rata any assets remaining after the payment of our debts, taxes and expenses of the liquidation. Holders of non-voting shares, if any, would be entitled to receive reimbursement of the amount paid before any amount is distributed to the holders of voting shares.
Change of control
Our Bylaws do not contain any provisions that would have an effect of delaying, deferring or preventing a change in control of the company and that would operate only with respect to a merger, acquisition or corporate restructuring involving Santander or any of our subsidiaries. Nonetheless, certain aspects of Spanish law described in the following section may delay, defer or prevent a change of control of the Bank or any of our financial subsidiaries in the event of a merger, acquisition or corporate restructuring.
Legal restrictions on acquisitions of our shares
See section 3.2.'Shareholder rights' in the 'Corporate governance' chapter in Part 1 of this annual report on Form 20-F.
Reporting requirements
Royal Decree 1362/2007 requires that any entity which acquires or transfers shares and as a consequence the number of voting rights held exceeds, reaches or falls below the threshold of 3%, 5%, 10%, 15%, 20%, 25%, 30%, 35%, 40%, 45%, 50%, 60%, 70%, 75%, 80% or 90%, of the voting rights of a company, for which Spain is the member state of origin, listed on a Spanish stock exchange or on any other regulated market in the European Union, must, within 4 trading days from the date on which the person becomes aware or should have become aware of the circumstance obliging him or her to notify, notify and report it to such company, and to the Spanish CNMV. From 27 November 2015, notification must be given of financial instruments with a financial effect similar to that of holding shares, regardless of whether settlement is made through shares or in cash. For these purposes it should be considered as financial instruments negotiable securities, options, futures, swaps, forward rate agreements, contracts for difference and any
919 | ||
| Cross-reference to Form 20-F | Consolidated directors' report | Consolidated financial statements | Supplemental information | |||||||||||||||||
other contract or agreement with similar financial effects that can be settled by delivering the underlying securities or in cash, and any others established by the Ministry of Economics and Competitiveness and, with its express authorization, the Spanish Securities and Exchange Market Commission. To calculate whether the thresholds for notification of major holdings have been met, the voting rights corresponding to holding shares (physical position) and financial instruments (derivative position) will be added together. The number of voting rights attributable to a financial instrument will be calculated by referring to the theoretical total amount of shares underlying the financial instrument. When the financial instrument is only settled in cash, the number of voting rights will be calculated by multiplying the number of underlying shares by the delta of the instrument (sensitivity of the price of the instrument to the price of the underlying value). To calculate the voting rights, only long positions, which cannot be netted with short positions relating to the same underlying issuer, will be considered. All these calculations will be made under the provisions of Commission Delegated Regulation (EU) 2015/761.
This duty to report the holding of a significant stake is applicable not only to the acquisitions and transfers in the terms described above, but also to those cases in which in the absence of an acquisition or transfer of shares, the percentage of an individual’s voting rights exceeds, reaches or falls below the thresholds that trigger the duty to report, as a consequence of an alteration in the total number of voting rights of an issuer. Similar disclosure obligations apply, among others, in the event of: (i) certain voting, deposit, temporary transfer or other agreements regarding the relevant shares; or (ii) custodians or proxy-holders who can exercise with discretion the voting rights attached to the relevant shares. The above-mentioned threshold percentage will be 1% or any multiple of 1% whenever the person who has the duty to notify is a resident of a non-cooperative jurisdictions or of a country or territory where there is no taxation or where there is no obligation to exchange tax information (in accordance with Spanish law).
In addition, any Spanish company listed on the Spanish stock exchanges must report any acquisition by such company (or a subsidiary) of the company’s own shares if the acquisition, together with any acquisitions since the date of the last report and without deducting sales of its own shares by the company or by its subsidiaries, causes the company’s ownership of its own shares to exceed 1% of its voting rights. See section '12. 'The Offer and Listing-Trading by Santander’s Subsidiaries in the Shares'.
Members of the board of directors and top managers of any listed company must report to the CNMV the acquisition or disposal of shares or other securities or financial instruments of the issuer which are linked to these shares.
Board of directors
See section 4.'Board of directors' in the 'Corporate governance' chapter in Part 1 of this annual report on Form 20-F.
Certain powers of the board of directors
The actions of the members of the board are limited by Spanish law and certain general provisions contained in our
Bylaws. For instance, Article 57 of our Bylaws states that the directors will be liable to Banco Santander, to our shareholders and to our corporate creditors for any damages that they may cause by acts or omissions which are contrary to law or to the Bylaws or by acts or omissions contrary to the duties inherent in the exercise of their office, provided that there has been wilful misconduct or negligence.
According to Article 40 of our Bylaws, in line with Recommendation 12 of the Code of Good Governance of listed companies, the board of directors will be guided by corporate interest, understood as the achievement of a business that is profitable and sustainable over the long term and that promotes the continuity thereof and the maximization of the company's value.
The authority to approve any transaction between Banco Santander and a director or a significant shareholder (or their related parties) is reserved to the board of directors (unless the value of the transaction exceeds 10% of the total assets of Banco Santander, in which case the authority to approve such transaction corresponds to the general shareholders’ meeting). Prior to such approval, it is the audit committee's responsibility to report on transactions which entail or might entail any situation of conflict of interest, related-party transactions or transactions which entail the use of corporate assets.
See information on related-party transactions and conflicts of interest in section 4.12.'Related-party transactions and other conflicts of interest' in the 'Corporate governance' chapter in Part 1 of this annual report on Form 20-F.
See information on compensation in section '6.'Remuneration' in the 'Corporate governance' chapter in Part 1 of this annual report on Form 20-F.
Board of directors requirements
There are no mandatory retirement provisions due to age for board members in our Bylaws or in the Rules and regulations of our board of directors. These regulations contain provisions relating to the cessation of directorship for other reasons.
In addition, there are no share ownership requirements in our Bylaws or in the rules and regulations of the board of directors.
Pursuant to Spanish law, directors appointed by the board but whose appointment remains subject to ratification by the shareholders may not necessarily be a shareholder of the Bank and, pursuant to the rules and regulations of the board, proprietary directors must submit their resignation proportionately when the shareholder that they represent parts with its shareholdings or reduces them in a significant manner. Our Bylaws and Rules and regulations of the board do not otherwise require ownership of Santander shares for a director’s qualification.
13.2. Material contracts
The Bank is not a party to any contract outside its ordinary course of business that is material to the Group as a whole.
13.3. Exchange controls
Restrictions on foreign investments
920 | ||
On 4 July 2003, Law 19/2003 on the legal regime governing the movement of capital and financial transactions with foreign countries was approved which updated Spanish exchange control and money laundering prevention provisions, by recognizing the principle of freedom of the movement of capital between Spanish residents and non-residents. The law established procedures for the declaration of capital movements for purposes of administrative or statistical information and authorizes the Spanish Government to take measures which are justified on grounds of public policy or public security. It also provided the mechanism to take exceptional measures with regard to third countries if such measures have been approved by the European Union or by an international organization to which Spain is a party. Royal Decree 664/1999, on Foreign Investments (23 April 1999), established a new framework for the regulation of foreign investments in Spain which, on a general basis, should no longer require any prior consents or authorisations from authorities in Spain (without prejudice to specific regulations for several specific sectors, such as television, radio, mining, telecommunications, etc.). Likewise, Royal Decree 664/1999 requires notification of all foreign investments in Spain and liquidations of such investments upon completion of such investments to the Investments Registry of the Ministry of Economy and Finance, strictly for administrative statistical and economical purposes. Only investments from 'tax haven' countries (as they are defined in Royal Decree 1080/1991), shall require notice before and after performance of the investment, except that no prior notice shall be required for: (1) investments in securities or participations in collective investment schemes that are registered with the CNMV, and (2) investments that do not increase the foreign ownership of the capital stock of a Spanish company to over 50%. In specific instances, the Council of Ministers may agree to suspend, all or part of, Royal Decree 664/1999 following a proposal of the Minister of Economy and Competitiveness, or, in some cases, a proposal by the head of the government department with authority for such matters and a report of the Foreign Investment Body. These specific instances included a determination that the investments, due to their nature, form or condition, affect activities, or may potentially affect activities relating to the exercise of public powers, national security or public health. Royal Decree 664/1999 was suspended for investments relating to national defence. Whenever Royal Decree 664/1999 was suspended, the affected investor should obtain prior administrative authorization in order to carry out the investment.
Notwithstanding the above, Spanish Royal Decree-Law 8/2020, of 17 March, on urgent extraordinary measures to address the economic and social impact of covid-19 (as amended from time to time, 'RDL 8/2020'), suspended, effective as of 18 March 2020, the regime on the deregulation of foreign direct investment in Spain, indefinitely, until the Spanish Government decides otherwise. To that end, it added a new Article 7 bis and established new rules on sanctions in Articles 8 and 12 of Law 19/2003, of 4 July. The RDL 8/2020 was based in this regard on Regulation EU 2019/452 of the European Parliament and of the Council of 19 March 2019 establishing a framework for the screening of foreign direct investments into the Union ('Regulation 2019/452'), some of the provisions of which it reproduces almost literally. As a result of RDL 8/2020, the need for authorisation for foreign investment has become the norm, when it had previously only been required exceptionally, for very specific sectors,
when carried out by residents of countries outside the European Union ('EU') and the European Free Trade Association ('EFTA'). Later, Royal Decree-Law 34/2020, of 17 November, on urgent measures to support business solvency and the energy sector as well as on taxation ('RDL 34/2020'), further restricted the freedom to carry out foreign investments in Spain, with a transitional rule until 31 December 2024 (as extended by Royal Decree-Law 20/2022 of 27 December), which also required prior authorisation to be obtained for investments in companies listed in Spain or unlisted companies in Spain if the value of the investment made by residents of other EU and EFTA countries exceeds 500 million euros. For these purposes, companies listed in Spain will be considered those whose shares are, in whole or in part, admitted to trading in an official Spanish secondary market and have their registered office in Spain.
13.4. Taxation
The following is a discussion of the material Spanish and US federal income tax consequences to you of the ownership and disposition of ADSs or shares.
The description of Spanish tax consequences below is intended as a general guide and applies to you only if you are a non-resident of Spain and your ownership of ADSs or shares is not effectively connected with a permanent establishment or fiscal base in Spain and you are a US resident entitled to the benefits of the Convention Between the United States of America and the Kingdom of Spain for the Avoidance of Double Taxation and the Prevention of Fiscal Evasion with Respect to Taxes on Income, as amended by the protocol signed by the United States of America and the Kingdom of Spain that entered into force on 27 November 2019 (the 'Treaty').
This summary is for general information only and does not constitute tax advice. You should consult your own tax adviser as to the particular tax consequences to you of owning the shares or ADSs including your eligibility for the benefits of the Treaty, the applicability or effect of any special rules to which you may be subject, and the applicability and effect of state, local, foreign and other tax laws and possible changes in tax law.
Spanish tax considerations
The following is a summary of material Spanish tax matters and is not exhaustive of all the possible tax consequences to you of the acquisition, ownership and disposition of ADSs or shares. This discussion is based upon the tax laws of Spain and regulations thereunder, which are subject to change, possibly with retroactive effect.
Taxation of dividends
Under Spanish law, dividends paid by a Spanish resident company to a holder of ordinary shares or ADSs not residing in Spain for tax purposes and not operating through a permanent establishment in Spain are generally subject to Spanish Non-Resident Income Tax at a 19% rate.
We will withhold tax on the gross amount of dividends at the tax rates referred to above, following the procedures set forth by the Order of 13 April 2000. However, under the Treaty and
921 | ||
| Cross-reference to Form 20-F | Consolidated directors' report | Consolidated financial statements | Supplemental information | |||||||||||||||||
subject to the fulfilment of certain requirements, you may be entitled to a general reduced rate of 15%.
To benefit from the Treaty’s general reduced rate of 15%, you must provide our depositary, Citibank, N.A., with a certificate from the US Internal Revenue Service (the 'IRS') stating that to the knowledge of the IRS, you are a resident of the United States within the meaning of the Treaty. The IRS certificate will be valid for one year from the date of issue, unless it includes a specific year for which a tax resident is considered, in which case the certificate will be deemed applicable during that year.
According to the Order of 13 April 2000, to get a direct application of the Treaty-reduced rate of 15%, the certificate referred to above must be provided to our depositary before the tenth day following the end of the month in which the dividends were distributable by us. If you fail timely to provide our depositary with the required documentation, you may obtain a refund of the amount withheld exceeding 15% that would result from the Spanish tax authorities in accordance with the procedures below. In the event of dividends distributed as a share premium distribution, the return is considered to reduce the acquisition value of the shares or equity held by the non-resident shareholders, and the excess over such acquisition value is taxed, as return on movable capital, at 19% unless a domestic exemption or a Double Tax Treaty sets forth otherwise. In this regard, under the Treaty and subject to the fulfilment of certain requirements, you may be entitled to a general reduced rate of 15%. No tax withholding applies in this case.
A scrip dividend will be treated as follows:
•If the holder of ordinary shares or ADSs elects to receive newly issued ordinary shares or ADSs it will be considered a delivery of fully paid-up shares free of charge and, hence, will not be considered income for purposes of the Spanish Non-Resident Income Tax. The acquisition value, both of the new ordinary shares or ADSs received in the scrip dividend and of the ordinary shares or ADSs from which they arise, will be the result of dividing the total original cost of the shareholder’s portfolio by the number of shares, both old and new. The acquisition date of the new shares will be that of the shares from which they arise.
•If the holder of ordinary shares or ADSs elects to sell the rights on the market, the full amount obtained from the sale of rights will be treated as a taxable capital gain for the holder at the time the transfer takes place (please refer to “-Taxation of capital gains” below).
•If the holder of ordinary shares or ADSs elects to receive the proceeds from the sale of rights back to us at a fixed price, the tax regime applicable to the amounts received will be that applicable to cash dividends described above.
Spanish refund procedure
According to Spanish Regulations on Non-Resident Income Tax, approved by Royal Decree 1776/2004, dated 30 July 2004, as amended, and the Order EHA/3316 dated 17 December 2010, a refund of the amount withheld in excess of the rate provided by the Treaty can be obtained from the relevant Spanish tax authorities. To pursue the refund claim, if
you are a US resident entitled to the benefits of the Treaty, you are required to file all of the following:
•the applicable Spanish Tax Form (currently, Form 210),
•the certificate of tax residence referred to in the preceding section, and
•evidence that Spanish Non-Resident Income Tax was withheld with respect to you.
For the purposes of the Spanish refund procedure, the holder must file Form 210 (together with the corresponding documentation) within the period from 1 February of the year following the year in which the Non-Resident Income Tax was withheld and ending four years after the end of the filing period in which we reported and paid such withholding taxes. The Spanish Revenue Office must make the refund within six months after the refund claim is filed. If such period lapses without receipt of the refund, the holder is entitled to receive interest for late payment on the amount of the refund claimed. For further details, prospective holders should consult their tax advisors.
You are urged to consult your own tax adviser regarding refund procedures and any US tax implications of receipt of a refund.
Taxation of capital gains
Under Spanish law, any capital gains derived from the transfer of securities issued by Spanish tax residents are deemed to be Spanish-source income and, therefore, are taxable in Spain. If you are a US resident, income from the sale of ADSs or shares will be treated as capital gains for Spanish tax purposes. Spanish Non-Resident Income Tax is levied at a 19% rate on capital gains realized by persons not residing in Spain for tax purposes who are not entitled to the benefit of any applicable treaty for the avoidance of double taxation. Capital gains and losses will be calculated separately for each transaction and losses may not be offset against capital gains.
Notwithstanding the above, capital gains derived from the transfer of shares on an official Spanish secondary stock market by any holder who is a resident of a country that has entered into a treaty for the avoidance of double taxation with Spain containing an 'exchange of information' clause will be exempt from taxation in Spain. In addition, under the Treaty, if you are a US resident, capital gains realized by you upon the disposition of ADSs or shares will not be taxed in Spain. You are required to establish that you are entitled to this exemption by providing to the relevant Spanish tax authorities an IRS certificate of residence in the United States, together with the appropriate Spanish 210 Form, between 1 January and 20 January of the calendar year following the year in which the transfer of ADSs or shares took place.
Spanish wealth tax
Individuals not resident in Spain for tax purposes who hold shares or ADSs located in Spain are subject to the Spanish wealth tax (Spanish Law 19/1991), which imposes a tax on property and rights located in Spain or that can be exercised within the Spanish territory on the last day of any year. The Spanish tax authorities might take the view that all shares of
922 | ||
Spanish corporations and all ADSs representing such shares are located in Spain for Spanish tax purposes. If such a view were to prevail, non-residents of Spain who held shares or ADSs on the last day of any year would be subject to the Spanish wealth tax for such year on the average market value of such shares or ADSs during the last quarter of such year (this average price of listed shares is published in the Official State Gazette every year). Notwithstanding the above, the first EUR 700,000 of net wealth owned by an individual (resident or non-resident) will be exempt from taxation.
As a result of the above legislation, non-residents of Spain who hold or held shares, ADSs, or other assets or rights located in Spain according to Spanish wealth tax law, on the last day of the year, the combined value of which exceeds EUR 700,000 might be subject to the Spanish wealth tax on that excess amount at marginal rates varying between 0.2% and 3.5% (the highest bracket increased by 1% since 2021), and would be obliged to file the corresponding wealth tax return.
Solidarity Tax on large fortunes
On 28 December 2022, Law 38/2022 introduced a solidarity tax on large fortunes as a temporary measure that would be implemented in 2023 and 2024 for the 2022 and 2023 tax years. This is a complementary tax to Spanish Wealth Tax for high net-worth individuals, which is charged on net assets over EUR 3 million establishing a progressive tax rate from 0% up to EUR 3 million, 1.7% up to EUR 5.3 million, 2.1% up to EUR 10 million and to 3.5% for a net wealth of over EUR 10 million. The Royal Decree-Law of 28 December 2023 extended its application for another year (tax year 2024) and added the exemption from taxation for the first 700,000 euros for non-resident taxpayers.
Because of its complementary nature with the current Wealth Tax, the text provides that the amount an individual pays in wealth tax (as calculated under the local autonomous communities rules) may be deducted from the solidarity tax in order to avoid double taxation between the solidarity tax and the wealth tax.
It modifies the Spanish Wealth tax, including an amendment in relation to the tax liability of non-residents who are liable for this tax as non-resident taxpayers and also a new provision stating that securities will be considered to be located in Spain if they represent an investment in the equity of entities, not traded on organized markets, whose assets (directly or indirectly) consist of a portion higher than 50% of real estate located in Spain.
Spanish inheritance and gift taxes
Transfers of shares or ADSs upon death or by gift are subject to Spanish inheritance and gift taxes (Spanish Law 29/1987) if the transferee is a resident of Spain for tax purposes, or if the shares or ADSs are located in Spain at the time of gift or death, or the rights attached thereto could be exercised or have to be fulfilled in the Spanish territory, regardless of the residence of the beneficiary. In this regard, the Spanish tax authorities might determine that all shares of Spanish corporations and all ADSs representing such shares are located in Spain for Spanish tax purposes. The applicable tax rate, after applying all relevant factors, ranges between 0%
and 81.6% for individuals. Non Spanish resident taxpayers (both EU and non-EU citizens) receiving assets located in Spain by way of inheritance or donation will be eligible to apply the same benefits or tax reductions that Spanish resident taxpayer of such region is entitled to recognize.
Gifts granted to corporations non-resident in Spain are subject to Spanish Non-Resident Income Tax at a 19% tax rate on the fair market value of the shares as a capital gain. If the donee is a United States corporation, the exclusions available under the Treaty described in the section '-Taxation of capital gains' above will be applicable.
Transfer tax and VAT
The subscription, acquisition and transfer of ADSs or shares will be exempt from Spanish transfer tax and value-added tax. Additionally, no Spanish Stamp Duty or registration tax will be levied as a result of such subscription, acquisition and transfer.
Financial Transactions Tax
The acquisition of ADS or shares will be subject to the Spanish Financial Transaction Tax at a 0.2% tax rate from 16 January 2021 except for (i) the acquisition of shares exclusively aimed at the issuance of depositary receipts; (ii) the acquisition of depositary receipts in exchange for the supply of the Spanish shares that will be represented by the depositary receipts; and (iii) transactions to cancel depositary receipts via supply of the Spanish shares represented by them.
Compliance
In certain circumstances, the Spanish tax authorities can impose penalties for any failure to comply with any of the Spanish tax requirements referred to above. Such penalties may in certain cases be based on the amount of tax payable.
US Federal Income Tax considerations
The following summary describes the material US federal income tax consequences of the ownership and disposition of ADSs or shares, but it does not purport to be a comprehensive description of all of the tax considerations that may be relevant to a particular person’s decision to hold such securities. The summary applies only to US Holders (as defined below) that hold ADSs or shares as capital assets for US federal income tax purposes. In addition, it does not describe all of the tax consequences that may be relevant in light of the US Holder’s particular circumstances, including the potential application of the provisions of the Internal Revenue Code of 1986, as amended (the 'Code') known as the Medicare contribution tax, state, local or non-United States tax laws, and tax consequences applicable to US Holders subject to special rules, such as:
•financial institutions;
•insurance companies;
•dealers and traders in securities that use a mark-to-market method of tax accounting;
•persons holding ADSs or shares as part of a 'straddle', conversion transaction or integrated transaction;
923 | ||
| Cross-reference to Form 20-F | Consolidated directors' report | Consolidated financial statements | Supplemental information | |||||||||||||||||
•persons whose 'functional currency' is not the US dollar;
•persons liable for the alternative minimum tax;
•tax exempt entities, 'individual retirement accounts' and 'Roth IRAs';
•partnerships or other entities classified as partnerships for US federal income tax purposes;
•persons that own or are deemed to own 10% or more of our shares by vote or value;
•persons that acquired our ADSs or shares pursuant to the exercise of an employee stock option or otherwise as compensation; or
•persons holding ADSs or shares in connection with a trade or business outside the United States.
If an entity that is classified as a partnership for US federal income tax purposes holds shares or ADSs, the US federal income tax treatment of a partner will generally depend on the status of the partner and the activities of the partnership. Partnerships holding shares or ADSs and partners in such partnerships should consult their tax advisers as to the particular US federal income tax consequences of owning and disposing of the shares or ADSs.
This summary is based on the Code, administrative pronouncements, judicial decisions, final, temporary and proposed regulations released by the US Department of the Treasury ('Treasury Regulations'), and the Treaty, all as of the date hereof, changes to any of which may affect the tax consequences described herein, possibly with retroactive effect. In addition, this summary assumes that each obligation provided for in or otherwise contemplated by the deposit agreement or any other related document will be performed in accordance with its terms. US Holders are urged to consult their own tax advisers as to the US, Spanish and other tax consequences of the ownership and disposition of ADSs or shares in their particular circumstances.
As used herein, a 'US Holder' is, for US federal income tax purposes, a beneficial owner of ADSs or shares who is eligible for the benefits of the Treaty and is:
•a citizen or individual resident of the United States;
•a corporation, or other entity taxable as a corporation, created or organized in or under the laws of the United States, any state thereof or the District of Columbia; or
•an estate or trust the income of which is subject to US federal income taxation regardless of its source.
In general, for US federal income tax purposes, US Holders of ADSs will be treated as the owners of the underlying shares represented by those ADSs. Accordingly, no gain or loss will be recognized if a US Holder exchanges ADSs for the underlying shares represented by those ADSs.
Recently released Treasury Regulations ('the Foreign Tax Credit Regulations') may in some circumstances prohibit a US person from claiming a foreign tax credit with respect to certain non-US taxes that are not creditable under applicable income tax treaties. The US Internal Revenue Service (the
"IRS") recently released a notice which indicates that the Treasury Department and the IRS are considering amendments to the Foreign Tax Credit Regulations and provides temporary relief from certain provisions of these new regulations for taxable years ending before the date that a notice or other guidance withdrawing or modifying the temporary relief is issued (or any later date specified in such notice or other guidance). Accordingly, US investors that are not eligible for Treaty benefits should consult their tax advisers regarding the creditability or deductibility of any Spanish taxes imposed on dividends on, or dispositions of, ADS or shares. As noted above, the discussions below regarding the creditability of any Spanish taxes do not address the foreign tax credit consequences to holders of ADSs or shares that do not qualify for the benefits of the Treaty.
Except as specifically discussed under '-Passive Foreign Investment Company Rules' below, this discussion assumes that we were not, and will not become, a passive foreign investment company ('PFIC') for US federal income tax purposes.
Taxation of distributions
To the extent paid out of our current or accumulated earnings and profits (as determined in accordance with US federal income tax principles), distributions, including the amount of any Spanish withholding tax, made with respect to ADSs or shares (other than certain pro rata distributions of our capital stock or rights to subscribe for shares of our capital stock) will be includible in the income of a US Holder as foreign-source ordinary dividend income. Because we do not maintain calculations of our earnings and profits under US federal income tax principles, it is expected that distributions generally will be reported to US Holders as dividends. These dividends will be included in a US Holder’s income on the date of the US Holder’s (or in the case of ADSs, the depositary’s) receipt of the dividends, and will not be eligible for the 'dividends-received deduction' generally allowed to corporations receiving dividends from US corporations under the Code. The amount of the distribution will equal the US dollar value of the euros received, calculated by reference to the exchange rate in effect on the date that distribution is received (which, for US Holders of ADSs, will be the date that distribution is received by the depositary), whether or not the depositary or US Holder in fact converts any euros received into US dollars at that time. If the dividend is converted into US dollars on the date of receipt, a US Holder generally will not be required to recognize foreign currency gain or loss in respect thereof. A US Holder may have foreign currency gain or loss if the euros are converted into US dollars after the date of receipt. Any gain or loss resulting from the conversion of euros into US dollars will be treated as ordinary income or loss, as the case may be, and will be US-source.
A scrip dividend will be treated as a distribution of cash, even if a US Holder elects to receive the equivalent amount in shares. In that event, the US Holder will be treated as having received the US dollar fair market value of the shares on the date of receipt, and that amount will be the US Holder’s tax basis in those shares. The holding period for the shares will begin on the following day.
924 | ||
Subject to generally applicable limitations that may vary depending upon a US Holder’s individual circumstances, dividends paid to certain non-corporate US Holders may be taxable at rates applicable to long-term capital gains. A US Holder must satisfy minimum holding period requirements in order to be eligible to be taxed at these favourable rates. Non-corporate US Holders are urged to consult their own tax advisers regarding the availability of the reduced rate on dividends in their particular circumstances.
Subject to certain generally applicable limitations that may vary depending upon a US Holder’s circumstances, a US Holder electing to apply the benefits of the Treaty will be entitled to a credit against its US federal income tax liability for Spanish income taxes withheld at a rate not exceeding the rate provided by the Treaty. Spanish income taxes withheld in excess of the rate applicable under the Treaty will not be eligible for credit against such US Holder’s federal income tax liability. See '-Spanish tax considerations-Spanish refund procedure' for a discussion of how to obtain a refund of amounts withheld in excess of the applicable Treaty rate. The limitation on foreign taxes eligible for credit is calculated separately with regard to specific classes of income. Instead of claiming a credit, a US Holder electing to apply the benefits of the Treaty may, at its election, deduct such otherwise creditable Spanish taxes in computing taxable income, subject to generally applicable limitations. An election to deduct foreign taxes instead of claiming foreign tax credits applies to all taxes paid or accrued in the taxable year to foreign countries and possessions of the United States.
The rules governing foreign tax credits are complex, and US Holders are urged to consult their own tax advisers to determine whether they are subject to any special rules that limit their ability to make effective use of foreign tax credits.
Sale or exchange of ADSs or shares
A US Holder will realize gain or loss on the sale or exchange of ADSs or shares in an amount equal to the difference between the US Holder’s tax basis in the ADSs or shares and the amount realized on the sale or exchange, in each case as determined in US dollars. Subject to the discussion of the passive foreign investment company rules below, the gain or loss will be capital gain or loss and will be long-term capital gain or loss if the US Holder held the ADSs or shares for more than one year. This gain or loss will generally be US-source gain or loss for foreign tax credit purposes.
However, US Holders that are eligible for benefits under the Treaty may be able to elect to treat the gain as foreign-source income under the Treaty and claim a foreign tax credit in respect of Spanish taxes on disposition gains. The Foreign Tax Credit Regulations generally preclude a US Holder from claiming a foreign tax credit with respect to Spanish income taxes on gains from dispositions of common shares if the US Holder does not elect to apply the benefits of the Treaty. However, in that case it is possible that any Spanish taxes on disposition gains may either be deductible or reduce the amount realized on the disposition. The rules governing foreign tax credits and the deductibility of foreign taxes are complex. US Holders are urged to consult their own tax advisers regarding the consequences of the imposition of any non-US tax on disposition gains and the creditability or
deductibility of the non-US taxes in their particular circumstances (including any applicable limitations).
Passive Foreign Investment Company rules
We believe that we were not a PFIC for US federal income tax purposes for the 2023 taxable year. However, because our PFIC status depends upon the composition of our income and assets and the fair market value of our assets (including, among others, less than 25% owned equity investments) from time to time, and upon certain proposed Treasury Regulations that are not yet in effect but are proposed to become effective for taxable years after 31 December 1994, there can be no assurance that we were not or will not be a PFIC for any taxable year. In addition, if recently proposed Treasury Regulations are finalized in their current form, our PFIC status will also depend on the location of activities that produce active banking income and the location of our customers.
If we were a PFIC for any taxable year during which a US Holder owns ADSs or shares, any gain recognized by a US Holder on a sale or other disposition of ADSs or shares would be allocated ratably over the US Holder’s holding period for the ADSs or shares. The amounts allocated to the taxable year of the sale or other exchange and to any year before we became a PFIC would be taxed as ordinary income. The amounts allocated to each other taxable year would be subject to tax at the highest rate in effect for individuals or corporations, as appropriate, for that taxable year, and an interest charge would be imposed on the amount allocated to each of those taxable years. Further, any distribution in respect of ADSs or shares in excess of 125% of the average of the annual distributions on ADSs or shares received by the US Holder during the preceding three years or the US Holder’s holding period, whichever is shorter, would be subject to taxation as described above. Certain elections may be available that would result in alternative treatments (such as mark-to-market treatment) of the ADSs or shares.
In addition, if we were a PFIC in a taxable year in which we paid a dividend or the prior taxable year, the reduced rate on dividends discussed above with respect to certain non-corporate US Holders would not apply.
If we were a PFIC for any taxable year during which a US Holder owned the ADSs or shares, the US Holder would generally be required to file IRS Form 8621 with its annual US federal income tax return, subject to certain exceptions.
Information reporting and backup withholding
925 | ||
| Cross-reference to Form 20-F | Consolidated directors' report | Consolidated financial statements | Supplemental information | |||||||||||||||||
Payment of dividends and sales proceeds that are made within the United States or through certain US-related financial intermediaries generally are subject to information reporting, and may be subject to backup withholding, unless (i) the US Holder is an exempt recipient or (ii) in the case of backup withholding, the US Holder provides a correct taxpayer identification number and certifies that it is not subject to backup withholding. The amount of any backup withholding from a payment to a US Holder will be allowed as a credit against the US Holder’s US federal income tax liability and may entitle the US Holder to a refund, provided that the required information is timely furnished to the IRS.
Certain US Holders who are individuals and specified entities that are formed or availed of for purposes of holding certain foreign financial assets may be required to report information relating to their ownership of an interest in certain foreign financial assets, including stock of a non-US entity, subject to certain exceptions (including an exception for interests held in custodial accounts maintained by a US financial institution). US Holders are urged to consult their tax advisers regarding the effect, if any, of this requirement on the ownership and disposition of ADSs or shares.
13.5. Documents on display
We are subject to the information requirements of the Exchange Act, except that as a foreign issuer, we are not
subject to the proxy rules or the short-swing profit disclosure rules of the Exchange Act. In accordance with these statutory requirements, we file or furnish reports and other information with the SEC. Reports and other information filed or furnished by us with the SEC may be inspected and copied at the public reference facilities maintained by the SEC at Room 1580,100 F Street, N.E., Washington, D.C. 20549, and at the SEC’s regional offices at 200 Vesey Street, Suite 400, New York, New York 10281-1022 and 175 W. Jackson Boulevard, Suite 900, Chicago, Illinois 60604. Copies of such material may also be inspected at the offices of the New York Stock Exchange, 11 Wall Street, New York, New York 10005, on which our ADSs are listed. In addition, the SEC maintains a website that contains information filed electronically with the SEC, which can be accessed on the internet at http://www.sec.gov. The information contained on this website does not form part of this annual report on Form 20-F.
13.6. Share ownership of Directors and senior management
As of 21 February 2024, the direct, indirect and represented holdings of our current directors and senior managers were as follows:
926 | ||
| Shares | Options on Banco Santander shares | |||||||||||||||||||||||||
| Directors | Direct Stake | Indirect Stake | Represented Stake | Total shares | % of Capital Stock | Direct | Indirect | |||||||||||||||||||
| Ana Botín-Sanz de Sautuola y O´Shea | 1,893,028 | 31,161,724 | 33,054,752 | 0.209 | % | 903,995 | 1,337,614 | |||||||||||||||||||
| Héctor Grisi | 1,938,074 | 1,938,074 | 0.012 | % | 123,990 | |||||||||||||||||||||
| Glenn Hutchins | 524,027 | 524,027 | 0.003 | % | ||||||||||||||||||||||
| José Antonio Álvarez Álvarez | 2,617,170 | 2,617,170 | 0.017 | % | 610,123 | |||||||||||||||||||||
| Homaira Akbari | 67,826 | 100,913 | 168,739 | 0.001 | % | |||||||||||||||||||||
| Javier Botín-Sanz de Sautuola y O´Shea | 5,502,083 | 25,598,851 | 156,958,921 (A) | 188,059,855 | 1.188 | % | ||||||||||||||||||||
| Bruce Carnegie-Brown | 59,940 | 59,940 | 0.000 | % | ||||||||||||||||||||||
| Sol Daurella Comadrán | 149,483 | 476,837 | 626,320 | 0.004 | % | |||||||||||||||||||||
| Henrique de Castro | 2,982 | 2,982 | 0.000 | % | ||||||||||||||||||||||
| Germán de la Fuente | 10,000 | 10,000 | 0.000 | % | ||||||||||||||||||||||
| Gina Díez Barroso | 27,000 | 27,000 | 0.000 | % | ||||||||||||||||||||||
| Luis Isasi Fernández de Bobadilla | 45,000 | 45,000 | 0.000 | % | ||||||||||||||||||||||
| Ramiro Mato García-Ansorena | 506,860 | 506,860 | 0.003 | % | ||||||||||||||||||||||
| Belén Romana García | 208 | 4 | 212 | 0.000 | % | |||||||||||||||||||||
| Pamela Ann Walkden | 82,608 | 82,608 | 0.001 | % | ||||||||||||||||||||||
| TOTAL | 13,426,289 | 57,338,329 | 156,958,921 | 194,668,787 | 1.230 | % | 1,638,108 | 1,337,614 | ||||||||||||||||||
(A)Includes shares owned by Fundación Botín (chaired by Javier Botín) and syndicated shares. It includes shares corresponding to Ana Botín that are also included within their direct or indirect shareholdings, but excludes Javier Botín's syndicated shares. See section 2.4 'Shareholders’ agreements' in the 'Corporate governance' chapter. In subsection A.3 of section 9.2 'Statistical information on corporate governance required by the CNMV', we adapted this information to the CNMV’s format and, therefore, added all the syndicated shares as Javier Botín’s shareholdings.
| Shares | Options on Banco Santander shares | ||||||||||||||||||||||
| Senior Managers | Direct Stake | Indirect Stake (A) | Total shares | % of Capital Stock | Direct | Indirect | |||||||||||||||||
| Daniel Barriuso | 59,346 | 59,346 | 0.000 | % | 96,585 | ||||||||||||||||||
| Alexandra Brandao | 124,342 | 124,342 | 0.001 | % | 117,656 | ||||||||||||||||||
| Juan Manuel Cendoya | 1,227,027 | 3 | 1,227,030 | 0.008 | % | ||||||||||||||||||
José Doncel | 932,116 | 1,825 | 933,941 | 0.006 | % | ||||||||||||||||||
| Mahesh Aditya | 75,340 | 75,340 | 0.000 | % | |||||||||||||||||||
| José Antonio García Cantera | 2,330,724 | 2 | 2,330,726 | 0.015 | % | ||||||||||||||||||
| Juan Guitard | 1,716,391 | 1,716,391 | 0.011 | % | |||||||||||||||||||
| José María Linares | 594,258 | 594,258 | 0.004 | % | 564,099 | ||||||||||||||||||
| Mónica López-Monís | 434,417 | 818 | 435,235 | 0.003 | % | ||||||||||||||||||
| Dirk Marzluf | 1,321,765 | 1,321,765 | 0.008 | % | 572,725 | ||||||||||||||||||
| Víctor Matarranz | 810,706 | 9 | 810,715 | 0.005 | % | 111,111 | |||||||||||||||||
| José Luis de Mora | 737,635 | 737,635 | 0.005 | % | 202,534 | ||||||||||||||||||
| Jaime Pérez Renovales | 830,367 | 17,380 | 847,747 | 0.005 | % | ||||||||||||||||||
| Marjolein van Hellemondt-Gerdingh | 249,006 | 249,006 | 0.002 | % | 95,349 | ||||||||||||||||||
| TOTAL | 11,443,440 | 20,037 | 11,463,477 | 0.072 | % | 1,760,059 | |||||||||||||||||
(A)Includes family shares.
13.7. Unresolved staff comments
None.
13.8. Cybersecurity risk management
At Santander, cybersecurity risk management is an integral part of our operational risk management and control model. Our cybersecurity risk management is designed to align with international best practices and provide a framework to
measure and monitor the cyber risk profile and control environment, including threats and incidents associated with the use of third-party service providers through our supplier risk management model and internal control framework, and
927 | ||
| Cross-reference to Form 20-F | Consolidated directors' report | Consolidated financial statements | Supplemental information | |||||||||||||||||
facilitate coordination across different departments of our company.
Our operational risk model, where cybersecurity risk is embedded, establishes the items needed to manage and control operational risk properly according to regulatory standards and best management practices. Its phases are: (i) strategic planning; (ii) identification and assessment of risks and internal controls; (iii) ongoing monitoring of the operational risk profile; (iv) risk response decisions including risk mitigation and risk transfer measures; and (v) disclosure, reporting and escalation of relevant operational risk events, including cybersecurity risk, to senior risk executives in the shortest time possible. Operational Risk control self-assessment (RCSA) is one of our main operational risk tools. It integrates specific reviews that allow for the identification of cyber, technology, fraud, third party supplier risk as well as other risk drivers that could lead to operational risk or failure to meet regulatory expectations. RCSA is implemented in Heracles, which is our management and reporting system for operational risk throughout the Group, supporting the operational risk programme and tools with a Governance, Risk and Compliance (GRC) approach.
Additionally, in light of an increase in cyber and environmental related risks, as well as regulatory requirements (in particular DORA), the Group has strengthened the supplier risk management model and the internal control framework and a new IT platform is being developed to properly assess and manage the risks in outsourcing and third-party agreements.
In 2023, we have implemented new controls following a cyber threat-led approach, covering current areas of risk and new attack methods. In addition to the evolution of our Ransomware readiness and Data Leakage Prevention frameworks developed in 2022, a new Distributed Denial of Service framework has been designed, responding to the increased threat derived by the geopolitical backdrop. New controls have been developed, notably around supply chain, backup and recovery and fraud prevention measures reinforced by leveraging behavioural biometric solutions and machine learning technology. Further, to strengthen our response, streamline operations, and maximise resources, the Santander Fusion Center was inaugurated in 2023, enabling closer collaboration between cyber and IT monitoring teams. The Fusion Center operates 24 hours a day, 7 days per week, providing services to all entities of the Group, detecting, monitoring, and responding to operational failures and cybersecurity events. In addition to regular testing and reviews performed by our cybersecurity team, independent third-party certification authorities review and certify our critical cybersecurity processes. Certifications are periodically reviewed and updated, certifying new processes and controls on an annual basis.
For information on our overall risk management process and tools, and risk reporting structure, see sections 2.3 ‘Risk, compliance & conduct governance’ , 2.4 ‘Risk management processes and tools’ in the ‘Risk, compliance & conduct management’ chapter in Part 1 of this annual report on Form 20-F. For details on the measurement, monitoring and control of cybersecurity-related risks, and their respective mitigation plans, and cybersecurity initiatives see 5. ‘ Research, development, and innovation (R&D&I) - Cybersecurity’ in the ‘Economic and financial review’ chapter and 6.2 ‘Operational risk management (including Cyber risk)’ in the ‘Risk, compliance & conduct management’ chapter of this annual report on Form
20-F. For more details on the cybersecurity initiatives, including training and awareness we ran in 2023, see 5. ‘Acting responsibly towards customers’ in the ‘Responsible banking’ chapter of this annual report on Form 20-F.
The board of directors and its delegated committees are the highest decision making and monitoring bodies regarding management of the cybersecurity risk. The innovation and technology committee of the board of directors is in charge of assisting the board in the supervision of cybersecurity risks in coordination with the risk supervision, regulation and compliance and audit committees. The three committees are jointly responsible for monitoring the cybersecurity strategy of the Group and the internal audit coverage of cybersecurity risk, managing and controlling cybersecurity risks and monitoring cybersecurity threats. Homaira Akbari, an independent non-executive director who is member of the audit and innovation and technology board committees, has many years of experience supervising the cybersecurity risks and has held various roles at technology companies such as Microsoft Corporation and Thales Group. For more information regarding the board committees see sections 4.5 'Audit committee activities in 2023', 4.8 'Risk supervision, regulation and compliance committee activities in 2023' and 4.10 'Innovation and technology committee activities in 2023' in the ‘Corporate governance’ chapter of this annual report on Form 20-F.
Management is responsible for identifying, considering and assessing material cybersecurity risks on an ongoing basis, establishing processes to ensure that such potential cybersecurity risk exposures are monitored, putting in place appropriate mitigation measures and maintaining cybersecurity programs. The Group Chief Operating & Technology Officer and dedicated personnel are certified and experienced information systems security professionals and information security managers. The Group Chief Operating & Technology Officer joined Grupo Santander in 2018 and has held senior management and IT-related positions within Santander and other companies such as AXA Group. Management, including the Group Chief Operating & Technology Officer and our Global Chief Information Security Officer (CISO), regularly update the board of directors, the innovation and technology, risk supervision, regulation and compliance and audit committees on the Group’s cybersecurity programs, material cybersecurity risks and mitigation strategies and provide cybersecurity reports that cover, among other topics, cybersecurity threats and incidents and updates of the Group’s cybersecurity programs and mitigation strategies.
In the reporting period, an increase in cybersecurity events has been observed, primarily related to Distributed Denial of Service (DDoS) attacks derived from the geopolitical situation, and isolated events involving third-party service providers, which were promptly addressed and resolved. None of these events materially affected our operations. Our team remains vigilant and committed to enhancing our cybersecurity measures to protect against evolving digital threats.
Despite our efforts, we cannot eliminate all risks from cybersecurity threats, or provide assurances that we have not experienced an undetected cybersecurity incident. For more information about these risks, please see 4. 'Risk Factors – 2.3 Operational and technology risks'.
928 | ||
14. Recent events
No significant events occurred from 1 January 2024 to the date of filing of this annual report on Form 20-F except for the following:
In accordance with the shareholders' resolution taken at the March 2023 general shareholders’ meeting, on 30 January 2024
the board of directors approved a capital reduction of EUR 179,283,743.5 through the redemption of 358,567,487 shares (representing approximately 2.22% of the capital, acquired in the First 2023 Buyback Programme.
15. Controls and procedures
(a) Evaluation of Disclosure Controls and Procedures
As of 31 December 2023, Banco Santander, S.A., under the supervision and with the participation of its management, including its disclosure committee, its chief executive officer, chief financial officer, and chief accounting officer, performed an evaluation of the effectiveness of the design and operation of its disclosure controls and procedures (as defined in Rule 13a-15 (e) under the Exchange Act). There are, as described below, inherent limitations to the effectiveness of any control system, including disclosure controls and procedures. Accordingly, even effective disclosure controls and procedures can provide only reasonable assurance of achieving their control objectives.
Based on such evaluation, Banco Santander, S.A.’s chief executive officer, chief financial officer and chief accounting officer concluded that Santander’s disclosure controls and procedures at 31 December 2023, were effective in ensuring that information Banco Santander, S.A. is required to disclose in the reports it files or submits under the Exchange Act is (1) recorded, processed, summarized and reported within the time periods specified in the SEC’s rules and forms, and (2) accumulated and communicated to Banco Santander, S.A.’s management, including its disclosure committee, chief executive officer, chief financial officer and the chief accounting officer, as appropriate to allow timely decisions regarding required disclosures.
(b) Management’s Report on Internal Control over Financial Reporting
The management of Banco Santander, S.A., is responsible for establishing and maintaining adequate internal control over financial reporting as defined in Rule 13a-15 (f) under the Exchange Act.
Our internal control over financial reporting is a process designed by, or under the supervision of, the Bank’s principal executive and principal financial officers and effected by the Bank’s board of directors, management and other personnel, to provide reasonable assurance regarding the reliability of financial reporting and the preparation of consolidated financial statements for external purposes, in accordance with generally accepted accounting principles. For Banco Santander, S.A., generally accepted accounting principles refer to the International Financial Reporting Standards as issued by the International Accounting Standards Board ('IFRS-IASB').
Our internal control over financial reporting includes those policies and procedures that:
•Pertain to the maintenance of records that in reasonable detail accurately and fairly reflect the transactions and dispositions of our assets;
•Provide reasonable assurance that transactions are recorded as necessary to permit preparation of financial statements in accordance with generally accepted accounting principles, and that our receipts and expenditures are being made only in accordance with authorizations of our management and directors; and
•Provide reasonable assurance regarding prevention or timely detection of unauthorized acquisition, use or disposition of our assets that could have a material effect on the financial statements.
Because of its inherent limitations, internal control over financial reporting may not prevent or detect misstatements. Also, projections of any evaluation of effectiveness to future periods are subject to the risk that controls may become inadequate because of changes in conditions, or that the degree of compliance with the policies or procedures may deteriorate.
We have adapted our internal control over financial reporting to the most rigorous international standards and comply with the guidelines set by the Committee of Sponsoring Organizations of the Treadway Commission in its Internal Control - integrated framework. These guidelines have been extended and installed in our Group companies, applying a common methodology and standardizing the procedures for identifying processes, risks and controls, based on the Internal Control - integrated framework.
The documentation, update and maintenance processes in the Group’s companies have been constantly directed and monitored by a global coordination team, which set the guidelines for its development and supervised its execution at the unit level.
The general framework is consistent, as it assigns to management specific responsibilities regarding the structure and effectiveness of the processes related directly and indirectly with the production of consolidated financial statements, as well as the controls needed to mitigate the risks inherent in these processes.
Under the supervision and with the participation of the management of the Group, including our chief executive officer, our chief financial officer and our chief accounting officer, we conducted an evaluation of the effectiveness of our internal control over financial reporting as of 31 December 2023, based on the framework set forth by the
929 | ||
| Cross-reference to Form 20-F | Consolidated directors' report | Consolidated financial statements | Supplemental information | |||||||||||||||||
Committee of Sponsoring Organizations of the Treadway Commission ('COSO') in Internal Control - Integrated Framework (2013). Based on the assessment performed, management concluded that as of 31 December 2023, the Group´s internal control over financial reporting was effective.
PricewaterhouseCoopers Auditores, S.L. (PCAOB ID 1306 ) which has audited the consolidated financial statements of the Group for the year ended 31 December 2023, has also audited the effectiveness of the Group’s internal control over financial reporting under auditing standards of the Public Company Accounting Oversight Board (United States) as stated in their report on page 510 to our consolidated financial statements included in Part 1 of this annual report on Form 20-F.
(c) Changes in internal controls over financial reporting.
There was no change in our internal control over financial reporting that occurred during the period covered by this annual report that has materially affected, or is reasonably likely to materially affect, our internal control over financial reporting.
Principal accountant fees and services
The services commissioned from the Group’s auditors meet the independence requirements stipulated by the Audit Law, the US Securities and Exchange Commission (SEC) rules and the Public Company Accounting Oversight Board (PCAOB) and any other legislation in force in each of the countries relevant to the audit, and they did not involve the performance of any work that is incompatible with the audit function.
The Group Audit Committee is required to pre-approve the audit and non-audit services performed by the Group’s auditors in order to assure that the provision of such services do not impair the audit firm’s independence.
In the first months of each year, the Group Audit Committee proposes to the board the appointment of the independent auditor. At that time, the Group Audit Committee pre-approves the audit and audit related services that the appointed auditors will be required to carry out during the year to comply with the applicable regulation. These services will be included in the corresponding audit contracts of the Bank and of any other company of the Group with its principal auditing firm.
In addition, non-recurring audit or audit-related services and all non-audit services provided by the Group’s principal auditing firm are subject to case-by-case pre-approval by the Group Audit Committee.
During 2023, the Group Audit Committee reviewed the policies and procedures to manage the approval of services to be rendered by the auditor. A list of pre-approved audit related services and a list of non-audit services allowed to be provided by the auditor, including the most common non-prohibited services that may be required from the auditor, was adopted. Specific approval is required for the non-audit services and those not included in the list. The Chief Accounting Officer is in charge of managing the process and must report monthly to the Group Audit Committee detailing all services to be provided by auditors, including those pre-approved and others requiring individual approval.
All services provided by the Group’s principal auditing firm in 2023 detailed in note 47.b to our consolidated financial statements included in Part 1 of this annual report on Form 20-F were approved by the audit committee.
16. Corporate governance
The following is a summary of the main differences between our corporate governance practices and those applicable to domestic issuers under the NYSE listing standards.
Independence of the directors on the board of directors
Under the NYSE corporate governance rules, a majority of the board of directors of any US company listed on the NYSE must be composed of independent directors, whose independence is determined in accordance with highly detailed rules promulgated by the NYSE.
Under Spanish law, article 529 duodecies of the Spanish Companies Act, passed by Royal Decree-Law 1/2010 (2 July 2010), sets out the requirements to be considered an independent director in a listed company but not a required number of independent directors. There is a non-binding recommendation established in the Spanish Corporate Governance Code that the number of independent directors represent at least half of the total size of the board. Likewise, Article 6.1 of the Rules and regulations of the board states that the board shall aim for the number of independent directors to account for at least half of all directors. Article 42.1 of our Bylaws sets that the shareholders at the general shareholders’ meeting shall endeavour to ensure that independent directors account for at least one-third of the total number of directors.
Banco Santander's board of directors currently has ten independent directors (out of fifteen directors total), as defined in Article 6.2.c) of the Rules and regulations of the board.
In accordance with article 529 duodecies of the Spanish Companies Act, Article 6.2.c) of the Rules and regulations of the board defines the concept of an independent director as follows:
'External or non-executive directors who have been appointed based on their personal or professional status and who perform duties not conditioned by relationships with the Company, or its Group or with the significant shareholders or management thereof shall be considered independent directors.
In no event may directors be classified as independent directors if they:
i)Have been employees or executive directors of companies within the Group, except after the passage of 3 or 5 years, respectively, since the end of such relationship.
ii)Receive from the Company or from another Group company any amount or benefit other than as director remuneration, unless it is immaterial for the director.
For purposes of the provisions of this subsection, neither dividends nor pension supplements that a director receives by reason of the director’s prior professional or
930 | ||
employment relationship shall be taken into account, provided that such supplements are unconditional and therefore, the company paying them may not discretionarily suspend, modify or revoke the accrual thereof without breaching its obligations.
iii)Are, or have been during the preceding 3 years, a partner of the external auditor or the party responsible for auditing the Company or any other Group company during such period.
iv)Are executive directors or senior officers of another company in which an executive director or senior officer of the Company is an external director.
v)Maintain, or have maintained during the last year, a significant business relationship with the Company or with any Group company, whether in their own name or as a significant shareholder, director or senior officer of an entity that maintains or has maintained such relationship.
Business relationships shall be considered the relationship of a provider of goods or services, including financial services, and that of an adviser or consultant.
vi)Are significant shareholders, executive directors or senior officers of an entity that receives, or has received during the preceding 3 years, donations from the Company or the Group.
Those who are merely members of the board of a foundation that receives donations shall not be considered included in this item.
vii)Are spouses, persons connected by a similar relationship of affection, or relatives to the second degree of an executive director or senior officer of the Company.
viii)Have not been proposed, whether for appointment or for renewal, by the appointments committee.
ix)Have been directors for a continuous period that exceeds 12 years.
x)Are, as regards a significant shareholder or shareholder represented on the board, in one of the circumstances set forth in items (i), (v), (vi) or (vii) of this subsection 2(c). In the event of a kinship relationship as set forth in item (vii), the limitation shall apply not only with respect to the shareholder, but also with respect to the proprietary directors thereof in the affiliated company.
Proprietary directors who lose such status as a result of the sale of its shareholding by the shareholder they represent may only be re-elected as independent directors if the shareholder they have represented until then has sold all its shares in the company.
A director who owns an equity interest in the Company may have the status of independent director provided that the director meets all the conditions set out in this paragraph 2 (c) and, in addition, the shareholding thereof is not significant.'
The independence standards set forth in the Rules and regulations of the board may not necessarily be consistent
with, or as stringent as, the director independence standards established by the NYSE.
Under the NYSE rules, the members of our audit committee meet the independence criteria for foreign private issuers set forth in Rule 10A-3 under the Exchange Act.
Independence of the directors on the audit, nomination committee, remuneration committee and risk supervision, regulation and compliance committee
In accordance with the NYSE corporate governance rules, all US companies listed on the NYSE must have a compensation committee and a nominating and corporate governance committee and all members of such committees must be independent in accordance with highly detailed rules promulgated by the NYSE. All the members of the nomination committee of Banco Santander’s board are independent directors; the remuneration committee is composed of five non-executive directors (four are independent and one, in the opinion of the board, is neither proprietary nor independent); and the risk supervision, regulation and compliance committee is composed of five directors (four are independent and one, in the opinion of the board, is neither proprietary nor independent). The chair of those three committees is independent in accordance with the standards set forth in the previously mentioned Article 6.2. c) of the Rules and regulations of the board. These independence standards may not necessarily be consistent with, or as stringent as, the director independence standards established by the NYSE.
As at the date of present document, none of the members of the nomination committee, the remuneration committee or the risk supervision, regulation and compliance committee is an executive director, member of senior management or employee of Banco Santander, and no executive director or member of senior management has held a position on the board (or the remuneration committee) of companies that employ members of the nomination committee, the remuneration committee and the risk supervision, regulation and compliance committee.
Separate meetings for non-executive directors
In accordance with the NYSE corporate governance rules, non-executive directors must meet periodically outside of the presence of management. Although this practice is not required under Spanish law, several meetings among non-executive directors held by the Lead Independent Director are organized during the year. During 2023, in order to facilitate discussion and open dialogue among the independent directors, the Lead Independent Director held five meetings with non-executive directors without executive directors present, where they were able to voice their views and opinions. The meetings were also a valuable opportunity to discuss other matters, including board training topics, strategy execution, executive director and key management performance, succession planning and reflections on areas for continuous improvement with regard to the effectiveness and culture of the board and its committees.
The audit committee; the nomination committee; the remuneration committee; and the risk supervision, regulation and compliance committee of Banco Santander are composed entirely of non-executive directors, according to articles 17,
931 | ||
| Cross-reference to Form 20-F | Consolidated directors' report | Consolidated financial statements | Supplemental information | |||||||||||||||||
18, 19 and 20 of our Rules and regulation of the board of directors, respectively. The first two committees are composed entirely of independent directors.
In 2023, the audit committee met 15 times; the nomination committee met 13 times; the remuneration committee met 12 times; and the risk supervision, regulation and compliance committee met 17 times.
Code of ethics
Under the NYSE corporate governance rules, all US companies listed on the NYSE must adopt a Code of Business Conduct and Ethics which contains certain required topics. In March 2000, Santander adopted a General Code of Conduct, as subsequently amended from time to time, that applies to members of the board and to all employees of Santander, notwithstanding the fact that certain persons are also subject to the Code of Conduct in Securities Markets (CCSM) or to other Codes of Conduct related specifically to the activity or lines of business in which they undertake their responsibilities.
The current General Code of Conduct set an open door policy by which any Santander employee who becomes aware not only of an allegedly unlawful act or an act in breach of the General Code of Conduct or of our internal regulations, but also of any action that is not aligned with Santander´s corporate behaviours or Simple, Personal and Fair (SPF) corporate culture, may report such act directly to compliance management through the appropriate whistleblowing channel (Canal Abierto).
As at 31 December 2023, no waivers with respect to the General Code of Conduct had been applied for or granted.
In addition, we abide by a Code of Conduct in Securities Markets (CCSM), which was approved on 28 July 2003. This policy applies to those employees who perform professional activities related to stock markets or manage inside information due to their professional activities for the Group. On 30 June 2020, the board of directors approved an update of the CCSM to include aspects which mainly seek the alignment of its content and definitions with current regulations, the internal organizational structure and best-practices from CNMV.
Both codes are available to the public on our corporate website, which does not form part of this annual report on Form 20-F, at www.santander.com under the heading 'Information for shareholders and investors-corporate governance-codes of conduct'.
Shareholder approval of new share issuances
As a company listed on the NYSE, we are subject to the NYSE corporate governance listing standards. Section 312.03(c) of the NYSE Listed Company Manual requires shareholder approval of new share issuances above the 20% threshold specified therein in certain circumstances. However, NYSE rules permit a foreign private issuer like us to follow the corporate governance practices of its home country. Certain corporate governance practices in Spain, which is our home country, differ significantly from the NYSE corporate governance listing standards. We have elected to follow the
Spanish practices rather than Section 312.03(c) of the NYSE Listed Company Manual.
932 | ||
17. Exhibits
Exhibit Number | Description | |||||||
| 1.1 | ||||||||
| 2.1 | ||||||||
| 2.2 | ||||||||
| 8.1 | List of Subsidiaries (incorporated as Appendices I, II and III of our Financial Statements filed with this Form 20-F). | |||||||
| 12.1 | ||||||||
| 12.2 | ||||||||
| 12.3 | ||||||||
| 13.1 | ||||||||
| 15.1 | ||||||||
| 97.1 | ||||||||
101.SCH | Inline XBRL Taxonomy Extension Schema Document | |||||||
101.CAL | Inline XBRL Taxonomy Extension Calculation Linkbase Document | |||||||
101.LAB | Inline XBRL Taxonomy Extension Label Linkbase Document | |||||||
101.PRE | Inline XBRL Taxonomy Extension Presentation Linkbase Document | |||||||
101.DEF | Inline XBRL Taxonomy Extension Definition Linkbase Document | |||||||
We will furnish to the SEC, upon request, copies of any unfiled instruments that define the rights of holders of long-term debt of Santander.
933 | ||
18. Signature
The registrant hereby certifies that it meets all of the requirements for filing on Form 20-F and that it has duly caused and authorized the undersigned to sign this annual report on its behalf.
| BANCO SANTANDER, S.A. | |||||||||||
| By: | /s/ José G. Cantera | ||||||||||
| Name: | José G. Cantera | ||||||||||
| Title: | Chief Financial Officer | ||||||||||
Date: 21 February 2024
934 | ||