

ABOUT THIS INTEGRATED REPORT This Integrated report (report) describes the progress of Sibanye Stillwater Limited (Sibanye-Stillwater or the Group) in delivering on its strategy, purpose and vision. It demonstrates how we create and preserve value for our stakeholders over the short, medium and long term, across the six capitals: human, financial, intellectual, natural, manufactured, social and relationship, noting that value creation in some areas can lead to value erosion in others. This report also includes material information on where our activities eroded value. Sibanye-Stillwater publishes this 2023 Integrated report as its primary combined report which integrates material sustainability, operational and financial information, with further detail (financial and non-financial) made available in supplemental documents published on our website at www.sibanyestillwater.com/news-investors/reports/annual. OUR 2023 REPORTS ––––––––––––––––––––––––––––––––––––––––––––––––––––––––––––––––––––––––––––––––––––––––––––––––––––––––––––––––––––––––––––––––––––––––– These reports cover the financial year from 1 January to 31 December 2023* INTEGRATED REPORT NOTICE OF ANNUAL GENERAL MEETING AND SUMMARISED FINANCIALS GROUP ANNUAL FINANCIAL REPORT COMPANY FINANCIAL STATEMENTS MINERAL RESOURCES AND MINERAL RESERVES REPORT SUPPORTING FACT SHEETS AND SUPPLEMENTARY INFORMATION AVAILABLE ONLINE ––––––––––––––––––––––––––––––––––––––––––––––––––––––––––––––– • Group Impact supplement 2023 • Progressing the UN’s SDGs • Environmental incidents in 2023 • Biodiversity management • Social and labour plans (SLPs): Summary of projects • Climate change supplement • Sustainability content index • Tailings management • Care for iMali: Taking care of personal finance • Combating illegal mining • Sibanye-Stillwater’s ICMM self-assessment for 2023 • The Good Neighbor Agreement • Definitions for sustainability/ESG indicators • Application of King IV Principles in 2023 • ESG scorecard for the long term incentive (LTI) awards * This report encompasses data pertaining to the financial year ended on 31 December 2023. As necessary or where pertinent, certain information has been incorporated subsequent to year-end Approach, scope and boundary As noted above, this is a combined report. On the next page, there is an outline of what sections cover our õ Core Integrated report as the concise option. For the 2023 year ended 31 December 2023, annual data is provided where possible by region, segment and at the Group level. Material events occurring post year-end and before the date of publication of this report are covered in this report and/or in the Group Annual financial report (note 41) available at www.sibanyestillwater.com/news-investors/reports/annual. Given that our South African (SA) region (which includes the SA PGM operations and the SA gold operations) accounted for 75% of total revenue, and 96% of our workforce in 2023, and that the bulk of our material ESG-related activities take place in South Africa, the major emphasis of this report is on our SA activities. However, we also offer extensive detail on our American region (referred to as the US region, where our material operations comprise the US PGM operations), the European region (EU region for short which includes the Sandouville nickel refinery and Keliber lithium project) and the Australian region (the AUS region currently comprising the Century operation which has been consolidated for ten months during 2023, and the Mount Lyell project) where information is relevant. We do not report (or report minimally) on operations we do not manage/operate and in which we are minority shareholders. About our cover designs: Our strategic differentiator Inclusive, diverse and bionic, is depicted in the cover as a fingerprint, with small markings that signify computer code. As technology becomes ever more capable and powerful, the fear exists of the possible loss of human individuality, the loss of our independent spirit. The design reminds us what this strategic differentiator points to, the potential for humanity to be enhanced through using technology (“bionic”), and the potential for uniqueness and diverse individual identity to find its expression in service to our vision and purpose. We value the contributions of our employees (each having left their unique “fingerprint” on our business) and we honour their commitment to our values, which ripples out, amplifying the Group’s capacity to innovate and evolve.
HOW TO READ THIS REPORT CONTENTS ––––––––––––––––––––––––––––––––––––––––––––––––––––––––––––––––––––––––––––––––––––––––––––––––––––––––––––––––––––––––––––––––––––––– õ CORE INTEGRATED REPORT While the full report contains detail relevant to our broader set of stakeholders, these demarcated sections comprise our core Integrated report. The remaining content within the broader report provides additional detail relating to our performance. OUR BUSINESS AND LEADERSHIP More about this report 2 Materiality and our material matters 3 About Sibanye-Stillwater 5 Our value journey from 2013 7 Board and executive leadership 8 Chairman’s and Chief Executive Officer’s review 13 Corporate governance 19 WHAT DRIVES US Our purpose, vision, strategy and values – a summary 34 External environment for our business and operations 36 Unpacking our three-dimensional strategy 48 Managing our risks and opportunities within the external environment 51 How strategy interfaces with risks and opportunities 69 Engaging with our stakeholders 71 How we create value: our business model 80 Capital trade-offs: strategic management for shared value 84 The green-shaded sections provide a view of our performance against the Group’s stated strategic essentials and differentiators for the year under review OUR PERFORMANCE Maintaining a profitable business and optimising capital allocation 89 Chief Financial Officer’s report 90 Achieving operational excellence and optimising long-term resource value 103 Delivering value from our operations and projects 104 Mineral Resources and Mineral Reserves: a summary 114 Ensuring safety and wellbeing 124 Continuous safe production 125 Health, wellbeing and occupational hygiene 136 Inclusive, diverse and bionic 147 Empowering our workforce 148 Harnessing innovation 171 ESG embedded as the way we do business 180 Social, Ethics and Sustainability Committee: Chairman’s 2023 report 181 Minimising our environmental impact 186 Socioeconomic development 213 Governance in sustainability: our considered decision-making 229 REWARDING DELIVERY Remuneration report 233 Part 1: Background statement 235 Part 2: Remuneration policy 239 Part 3: Implementation report 253 ANCILLARY INFORMATION Detail on Board committees 272 Four-year statistical review 277 Statement of assurance 285 Our material matters – determination, definitions and references 287 Our shared value in numbers 290 Shareholder information 291 Disclaimer 294 Administrative and corporate information 295 NAVIGATING THE REPORT ––––––––––––––––––––––––––––––––––––––––––––––––––––––––––––– Links to supplementary information Refers to one or more UN SDG targets, sdgs.un.org/goals – also see Progressing the UN’s SDGs supplementary disclosure available at www.sibanyestillwater.com/news- investors/reports/annual Refers to related information available online at the URL provided Refers to a related fact sheet or supplementary information available online Refers to related information elsewhere in the report Capital resources Strategic icons Your feedback and suggestions are welcome. Please direct them to James Wellsted, EVP: Investor Relations and Corporate Affairs at ir@sibanyestillwater.com www.sibanyestillwater.com IR - 1 2 3 5 1 4

MORE ABOUT THIS REPORT REPORTING FRAMEWORKS AND GUIDANCE –––––––––––––––––––––––––––––––––––––––––––––––––––––––––––––––––– In compiling this report, we considered (among others) the following frameworks, standards, and guidelines: • International Integrated Reporting Framework • International Financial Reporting Standards Accounting Standards (IFRS Accounting Standards) • Global Reporting Initiative (GRI) Standards • Johannesburg Stock Exchange (JSE) Sustainability and Climate Disclosure Guidance • King Report on Corporate Governance™ for South Africa, 2016 (King IV) • The JSE Listings Requirements and the Listing Standards of the New York Stock Exchange (NYSE); and US federal securities laws applicable to foreign private issuers • Task Force on Climate-Related Financial Disclosures (TCFD) • South Africa’s Companies Act 71 of 2008, as amended • South Africa’s Mining Charter III and social and labour plans (SLPs) • Sustainability Accounting Standards Board (SASB), Metals and Mining Standards Sustainability organisations to improve responsible mining and business: • Extractive Industry Transparency Initiative (EITI) expectations for supporting companies • Initiative for Responsible Mining Assurance (IRMA) • International Council on Mining and Metals (ICMM) assurance and validation procedure • World Gold Council (WGC)’s Responsible Gold Mining Principles (RGMPs) • United Nations Global Compact (UNGC) Principles and the Sustainable Development Goals (SDGs) A separate King IV disclosure report is available online (See Application of King IV Principles in 2023, and the Sustainability content index supplementary disclosure, www.sibanyestillwater.com/news-investors/reports/annual/). Furthermore, in line with our listing on the NYSE, an annual report on Form 20-F (Form 20-F) is filed with the US Securities and Exchange Commission (SEC). We are a member of the ICMM, and the report aligns to its principles as it does with those of the United Nations Global Compact, of which we are a participant. See Governance in sustainability: Our considered decision- making, page 229. DIRECTORS’ STATEMENT OF RESPONSIBILITY –––––––––––––––––––––––––––––––––––––––––––––––––––––––––––––––––– As required by King IV, our Board acknowledges that it is responsible for good governance, ethical leadership and responsible corporate citizenship. The Board applies the principles of King IV, by which it recognises the triple context (society, economy, environment) in which the Group operates and its responsibility to create value sustainably, over the long term, across the six capitals. Notwithstanding trade-offs that may be required, we believe that, in support of our commitment to stakeholder capitalism and delivery of shared value, balanced appreciation for all the forms of capital delivers superior overall results. The Board, supported by the Audit Committee, has ultimate responsibility for this report and for vouchsafing its integrity and completeness. Having applied its collective expertise, the Board confirms that this report is a fair and transparent review of Sibanye-Stillwater, its principal material matters, its current profile and performance, and its ability to create value in the short, medium and long term. Sibanye-Stillwater’s Integrated report, presented in line with the International Integrated Reporting Framework, was approved for release to stakeholders by the Board on 26 April 2024 and signed on its behalf by: Dr Vincent Maphai Chairman of the Board and the Nomination and Governance Committee Neal Froneman Chief Executive Officer Charl Keyter Chief Financial Officer Timothy Cumming Remuneration Committee: Chairman Harry Kenyon-Slaney Risk Committee: Chairman Lead Independent Director Dr Elaine Dorward-King Social, Ethics and Sustainability Committee: Chairman Keith Rayner Audit Committee: Chairman Jeremiah Vilakazi Safety and health Committee: Chairman ASSURANCE ––––––––––––––––––––––––––––––––––––––––––––––––––––––––––––––––––––––––––––––––––––––––––––––––––––––––––––––––––––––––––––––––––––––– Our Internal audit function assesses financial, governance, operational, business, compliance and risk management controls. Internal audit is overseen by the Chief Financial Officer and reports functionally into the Audit Committee. This committee reports, in turn, to the Board. Specifically, Internal audit assured the accuracy of the figures reported in the Mining Charter. This includes detail for various headings across our reporting suite, including ownership, employment equity, human resource development, housing and living conditions, project spend, project implementation, procurement, and enterprise development. As part of other assurance performed during the financial year, Internal audit reviewed the underlying processes supporting certain of the key indicators presented. These include indicators for safety, emergency preparedness, dust, noise- induced hearing loss, management of explosives, tailings management, water management, Mining Charter, social labour plans, metal accounting, and sustainability Key Performance Indicators (KPIs). Independent external assurance provider, KPMG Inc (KPMG), provided limited assurance on selected sustainable development performance indicators, in accordance with the International Standards on Assurance Engagements (ISAE) 3000 (revised) and the ISAE 3410. See KPMG’s Statement of assurance, page 285. The financial information included in this report is derived from our Annual financial statements, independently audited by Ernst & Young Inc (EY). EY did not, however, audit or review this report. IR - 2

MATERIALITY AND OUR MATERIAL MATTERS Materiality is determined from the perspective of relevance (shared value creation and purpose) and of quantitative and qualitative impact (financial impact, production volume or reputational). The Group’s financial materiality is R750 million for the 2023 year. Material matters are those that are required to be managed strategically and with accountability. Material matters are also about disclosing information which focuses on the needs of primary stakeholders. This year, Sibanye-Stillwater applied a double materiality lens (both “outside-in” and “inside-out” approaches) to its determination of material matters. The outside-in approach considers how our business is impacted by sustainability issues, and what the effect is on our current and future cash flows/enterprise value over the short, medium and long term. The inside-out approach considers how Sibanye-Stillwater’s business impacts our stakeholders, including society, the environment, and the economy over the short, medium and long term. Thus, determining material matters involves multifaceted considerations, including engagement with stakeholders (e.g., investors), and perusing media reports and analysts’ reports. For our environmental, social and governance (ESG) matters we also considered reputational surveys of the Group, in terms of how our stakeholders view us; similarly, we considered internal assessments of employee opinion. This report provides detail of material matters relevant to investors and to interested stakeholders, including government, organised labour, customers and employees. Additionally, we contracted Deloitte – as an independent party – to facilitate a materiality workshop in the last quarter of 2023. Featuring the C-Suite, senior executives, and operational and functional specialists, the workshop applied the double materiality perspective, with the final approval of the list by the CEO and the CFO. After independently facilitated discussions involving all relevant decision-makers, we identified fourteen material matters (M1-M14). MATERIAL MATTERS MAP ––––––––––––––––––––––––––––––––––––––––––––––––––––––––––––––––––––––––––––––––––––––––––––––––––––––––––––––––––––––––––––––––––––––– The material matters map demonstrates material matters in relation to financial materiality and impact materiality. The colour of the squares of each material issue is representative of the three-dimensional business strategy (see page 48). Double materiality results IR - 3 MATERIAL MATTERS BUSINESS STRATEGIC PILLARS Profitability Maintaining a profitable business and optimising capital allocation Safety and health Ensuring safety and wellbeing Licence to operate Prospering in every region in which we operate Capital allocation Maintaining a profitable business and optimising capital allocation Energy supply and security ESG embedded as the way we do business Sociopolitical instability Prospering in every region in which we operate Macroeconomic and geopolitical volatility Building a pandemic resilient ecosystem Inclusive, diverse and bionic Climate transitional risk ESG embedded as the way we do business Climate physical risk ESG embedded as the way we do business Water management ESG embedded as the way we do business Culture and values Strategic foundation Innovation and digital evolution Strategic foundation Talent management and core skills Prospering in every region in which we operate Diversity and inclusion Ensuring safety and wellbeing Building a pandemic resilient ecosystem Inclusive, diverse and bionic Refer to • Page 287 for the Materiality determination process • Page 288 for the Definitions and references within the report

IR - 4 OUR BUSINESS AND LEADERSHIP About Sibanye-Stillwater 5 Our value journey from 2013 7 Board and executive leadership 8 Chairman and Chief Executive Officer’s review 13 Corporate governance 19 1

ABOUT SIBANYE-STILLWATER CORPORATE PROFILE Sibanye-Stillwater is a multinational mining and metals processing group with a diverse portfolio of operations, projects and investments across five continents. The Group is also one of the foremost global recyclers of PGM autocatalysts and has interests in leading mine tailings retreatment operations. Sibanye-Stillwater is one of the world’s largest primary producers of platinum, palladium, and rhodium and is a top tier gold producer. It also produces and refines iridium and ruthenium, nickel, chrome, copper and cobalt. The Group has recently begun to diversify its asset portfolio into battery metals mining and processing and increase its presence in the circular economy by growing its recycling and tailings reprocessing exposure globally. For more information, see www.sibanyestillwater.com. MINERAL RESERVES AND RESOURCES –––––––––––––––––––––––––––––––––––––––––––––––––––––––––––––––––––––––––––––––––––––––––––––––––––––––––––––––––––––––––––––––––– Global footprint with extensive precious metals Mineral Reserves of 65.3 million ounces (Moz) that support long life of mines (which is 17.1% of our Mineral Resources, 382.5Moz). 55.1% increase in attributable lithium Mineral Resources. 702kt of lithium carbonate equivalent (LCE) (Keliber lithium and Rhyolite Ridge projects). LOSS FOR 2023 YEAR1 R37 billion (US$2 billion) 68% GREEN REVENUE FACTOR2 WORKFORCE 82,788 ESG SALIENT FEATURES 24% of employee promotions in SA were awarded to women The financial closure has been achieved and construction has begun on renewable energy projects (total 267MW) in South Africa A 10% reduction in serious injury frequency rate, a record low for the Group Exemplar award for outstanding Tuberculosis (TB) programme 22Mt CO2e year-on-year decrease in scope 1 and 2 emissions Completion of a TCFD reporting gap analysis and scenario modelling of climate related risks SA region promoted 1,560 employees from our internal talent pool (A-D band) Conformance achieved to the Global Industry Standard on Tailings Management for very high and extreme consequence tailings storage facilities OUR ESG CREDENTIALS ESG-related indices (not limited to these) in which we are currently included: 1 See the Consolidated Income statement in the Group Annual Financial Report for the year ended 31 December 2023 2 The FTSE Russell green revenue factor is defined by FTSE Russell as the percentage of revenue that is derived from products that have a positive environmental utility which help prevent, restore and/or adapt to issues deriving from climate change, natural resource limitations and environmental degradation. This measure enables precise identification of green products and services across the entire value chain and helps investors assess revenue exposure to green activities within the Group. Based on the criteria developed by FTSE Russel, Sibanye-Stillwater utilised revenue from the following operations in determining its FTSE Russell green revenue factor: SA gold (limited to the Cooke operation); SA PGMs (excluding Mimosa); and US PGMs (including recycling) The FTSE Russell green revenue factor is a non-IFRS measure and it should not be considered in isolation or as a substitute for measures of performance prepared in accordance with IFRS Accounting Standards IR - 5 2023 REVENUE PER PRODUCT (Rbn) 71.1 30.3 5.2 4.3 2.1 0.7 PGMs Gold Chrome Nickel Zinc Other 2023 PRODUCTION 1.7Moz SA 4E PGMs 811koz gold 427koz US 2E PGM 310koz US 3E PGM recycling 76kt zinc metal produced (payable) 7.1kt nickel 2023 REVENUE PER OPERATION R113.7bn (US$6.2bn) 55.6 29.1 10.5 13.3 3.0 2.3 -0.1 SA PGM operations SA gold operations US PGM underground operations US PGM recycling Sandouville nickel refinery Century zinc retreatment operation Group corporate and reconciling items CLICK TO VIEW

ABOUT SIBANYE-STILLWATER continued IR - 6 A UNIQUE, GREEN PORTFOLIO OF GEOGRAPHICALLY DIVERSIFIED ASSETS AND COMMODITIES AMERICAS ASSETS US PGM OPERATIONS Stillwater mine (100%) Mineral Reserves: 15.7Moz 2E East Boulder mine (100%) Mineral Reserves: 10.6Moz 2E PGM EXPLORATION Marathon (13.9%)* Mineral Resources: 0.8Moz 2E PGM RECYCLING Columbus Met complex (100%) LITHIUM EXPLORATION Rhyolite-Ridge (6.91%)* Mineral Resources: 232kt LCE COPPER EXPLORATION Altar (48.61%)* Mineral Resources: 6,386Mlb Cu SOUTHERN AFRICAN ASSETS SA PGM OPERATIONS Marikana (80.64%) Mineral Reserves: 16.5Moz 4E Rustenburg (74%) Mineral Reserves: 9.3Moz 4E Kroondal (87%) Mineral Reserves: 0.7Moz 4E Mimosa (50%)* Mineral Reserves: 1.6Moz 4E SA PGM EXPLORATION Akanani (80.13%) Mineral Resources: 31.6Moz 4E Limpopo: Voorspoed and Doornvlei (80.64%), and Dwaalkop (40.32%) Mineral Resources: 19.9Moz 4E SA GOLD OPERATIONS Kloof (100%) Mineral Reserves: 1.8Moz Au Beatrix (100%) Mineral Reserves: 0.7Moz Au Driefontein (100%) Mineral Reserves: 2.9Moz Au Cooke surface (76%) Mineral Reserves: 0.1Moz Au DRDGOLD (50.28%)* Mineral Reserves: 2.9Moz Au SA GOLD DEVELOPMENT Burnstone (100%) Mineral Reserves: 2.5Moz Au SA GOLD EXPLORATION SOFS (Southern Free State project) (100%) Mineral Resources: 6.9Moz Au SA URANIUM EXPLORATION Beisa (100%) Mineral Resources: 27.0Mlb U₃O₈ Cooke (76%) Mineral Resources: 32.2Mlb U₃O₈ EUROPEAN ASSETS LITHIUM DEVELOPMENT Keliber lithium project (79.82%) Mineral Reserves: 182kt LCE NICKEL OPERATIONS Sandouville refinery (100%) AUSTRALIAN ASSETS ZINC OPERATIONS Century (100%) Mineral Reserves: 1,726Mlbs Zn COPPER EXPLORATION Mount Lyell (100%) Mineral Resources: 1,609Mlbs Cu CIRCULAR ECONOMY OPERATIONS BATTERY METALS GREEN METALS * Non-managed PGM = platinum group metals, Au = gold, Cu = copper, LCE = lithium carbonate equivalent, Zn = Zinc, U3O8 = uranium Mineral Resources are inclusive of Mineral Reserves 1. Verkor is a planned French gigafactory in which Sibanye-Stillwater participates through a convertible bond and equity. Verkor’s headquarter is located in Grenoble, but planned plant is to be located in Dunkirk (just north of Sandouville) 2. Mt Lyell is a copper asset in Tasmania which is currently on care and maintenance. A feasibility study, which considers the re-establishment of the operation, is underway 3. Acquisition effective March 2024

OUR VALUE JOURNEY FROM 2013 IR - 7 • Gold Fields unbundled its South African gold assets (Kloof, Driefontein and Beatrix), forming Sibanye Gold Limited • Listed on the Johannesburg and New York stock exchanges • August 2013, Cooke operations are acquired from Gold One • Market cap1 R10 billion US$1.2 billion 1 Source: EquityRT, with numbers quoted at the end of each year except for 2013, which represents the market capitalisation on the day of listing 2 Source: FactSet, Year-to-date, market capitalisation as at 31 March 2024 Since its inception in 2013, Sibanye-Stillwater has created value for stakeholders as it has evolved and grown by diversifying its portfolio by commodity and by geography. The Group has transformed from a South African gold mining company into a multinational, diversified mining and metals processing Group with a portfolio of operations, projects and investments across five continents and with a market capitalisation of R61.4 billion (US$3.3 billion). We have returned over R46 billion (US$3 billion) in additional value to investors in the form of dividends and share buybacks, over four times our initial market capitalisation on listing of R10 billion (US$1.2 billion). See Our shared value in numbers on page 290 of this report. TIMELINE OF NOTEWORTHY OCCURRENCES • 2024 Market cap2 R61.4 billion US$3.3 billion • Acquired 100% of Reldan in 2024 (March) • Announce the first PGM transactions: Rustenburg assets and Aquarius Platinum PLC • Entered PGM sector with South African acquisitions: – Kroondal, Mimosa and Platinum Mile (April) – Rustenburg operations (November) • Acquired a 38.05% stake in DRDGOLD Limited, a world leader in gold tailings retreatment; vending of certain surface gold tailings facilities and processing assets into that company (July/August) • Acquired: – SFA Oxford, a leading analytical and consulting metals market company and globally recognised authority on PGMs (February) – Lonmin Plc, Marikana operations (South Africa), which includes processing and smelter plants, as well as base and precious metals refineries (June) • Acquired Stillwater Mining Company (Montana, US) in May • Rebranded as Sibanye-Stillwater (August) • Increased holding in DRDGOLD to 50.1% (January) • Internal restructuring whereby holding company Sibanye-Stillwater Limited became the listed entity and Sibanye Gold Limited its subsidiary (February) • Acquired 30% stake in Keliber Oy • Acquired 19.99% in New Century Resources, an Australian zinc tailings reprocessing facility (December) • Announced the acquisition of 50% of Kroondal from Amplats (January) • Acquired 100% of Sandouville nickel refinery (February) • Increased Keliber holding to 85% (November) • Market cap1 R70.5 billion (US$3.8 billion) • Celebrated a decade of shared value • Keliber rights issue results in Finnish Minerals Group to 20%, our share ~80% • Acquired 100% of New Century in 2023, and executed an option to take ownership of Mt Lyell copper project • Acquired Wits Gold, including Burnstone and other projects in Free State province, South Africa • Implemented our unique cost optimisation and operating model

BOARD AND EXECUTIVE LEADERSHIP OUR BOARD AS AT 31 DECEMBER 2023 BOARD CHARACTERISTICS1 Independent Non-Executive Chairman A unitary Board with an appropriate balance of relevant diversity in gender, culture, age, fields of knowledge, skills and experience. The offices of Chairman and CEO are not occupied by the same person. Lead Independent Director Independent, non-executive directors 85% Female directors 31% TENURE1 The Group believes it is beneficial for new directors to be brought onto the Board periodically to refresh the Group’s thinking in a manner that supports both continuity and appropriate succession planning. Sibanye-Stillwater recognises that a variety of director tenures within the boardroom is beneficial to ensure board quality and continuity of experience. BOARD DIVERSITY1 Director rotation ensures a fresh perspective while maintaining continuity of skills and institutional experience. Mr Nkosemntu Nika and Ms Susan van der Merwe will retire at the 2024 annual general meeting (AGM). In terms of the Companies Act 71 of 2008, the election of members of the Audit Committee (Keith Rayner, Timothy Cumming, Richard Menell and Sindiswa Zilwa) will be put to a shareholder vote at the AGM. The Nominating and Governance Committee has undertaken the Board independence assessment as required by the Companies Act, King IV and the JSE Listings Requirements. In addition, the Audit Committee has undertaken the independence assessments as per the U.S. Securities and Exchange Commission (SEC) requirements, and confirms that for the year under review the Audit Committee members were and are all independent as per the SEC audit committee independence assessments criteria. 1 All information as at 31 December 2023 2 Historically disadvantaged persons (HDPs) as defined in the MPRDA BOARD AND EXECUTIVE LEADERSHIP IR - 8 TENURE AT SIBANYE-STILLWATER (YEARS) 13 1 2 8 Sibanye-Stillwater Sibanye Gold (preceding entity) Two to four years Less than two years More than four years GENDER DIVERSITY (%) 69% 31% Male Female RACE AND CULTURE (%) 39% 46% 15% Other SA excluding HDPs² HDP² Other nationalities BOARD AGE (YEARS) 10 3 Older than 60 Between 50 and 60

OUR BOARD continued Committees A filled icon indicates chair of the committee Board Chairman Investment Committee Remuneration Committee Safety and Health Committee Audit Committee Nominating and Governance Committee Risk Committee Social, Ethics and Sustainability Committee Independent non-executive directors DR VINCENT MAPHAI (72) Independent Non-Executive Chairman of the Board PhD, University of Natal; Advanced Management Programme (Harvard University) South African citizen, appointed Independent Non-executive Chairman of the Board on 24 February 2020 Appointment date to preceding Board of Sibanye Gold 1 June 2019 RICHARD MENELL (68) Lead Independent Director (until 1 January 2024) MA (Natural Sciences, Geology), MSc (Mineral Exploration and Management) SA and US citizen, appointed to the Sibanye- Stillwater Board on 24 February 2020 Appointment date to preceding Board of Sibanye Gold on 1 January 2013 HARRY KENYON-SLANEY (63) Lead Independent Director (from 1 January 2024) BSc (Hons) (Geology), International Executive Programme UK citizen, appointed 24 February 2020 Appointment date to preceding Board of Sibanye Gold on 16 January 2019 • Chairman of the Board • Nominating and Governance Committee (Chair) • Investment Committee (Chair until 31 December 2023) • Risk Committee (Chair until 31 December 2023) • Risk Committee (Chair from 1 January 2024) • Safety and Health Committee (Chair until 31 December 2023) • Corporate affairs and transformation • Strategy • An exceptional career with regards to societal transitions, political and human science, thereby bringing a wealth of knowledge to the sustainability function • Risk management • All aspects of the mining industry, operationally and at executive management and board level • Geology • Financial management • With a mining career of more than 40 years, he brings a wealth of knowledge on various ESG matters, including climate change and sustainability • Operations • Geology • Health and safety • Business transformation • With a distinguished career that includes executive roles in energy and mining, he brings extensive expertise on climate change and sustainability • Business development TIMOTHY CUMMING (66) BSc (Hons) (Engineering), BA (PPE), MA SA citizen, appointed 24 February 2020 Appointment date to preceding Board of Sibanye Gold 21 February 2013 DR ELAINE DORWARD-KING (66) BSc (Chemistry), PhD (Analytical Chemistry) US citizen, appointed 27 March 2020 JEREMIAH VILAKAZI (63) BA, MA, MBA SA citizen, appointed 24 February 2020 Appointment date to preceding Board of Sibanye Gold on 1 January 2013 • Remuneration Committee (Chair) • Investment Committee • Social, Ethics and Sustainability Committee (Chair from 1 January 2024) • Social, Ethics and Sustainability Committee (Chair until 31 December 2023) • Safety and Health Committee (Chair from 1 January 2024) • Engineering in the mining industry • Leadership and strategic development • Financial, investment and risk management • ESG matters including the understanding of Board duties with respect to tailings storage facilities (TSFs), and also potential risks that TSFs pose and the controls required to manage, monitor and mitigate the risks • Mining • Health and safety • An extensive career holding various executive sustainability positions responsible for all ESG matters, including climate change and sustainability • Understanding of Board duties with respect to TSFs, the potential risks TSFs pose, and the controls required to manage, monitor and mitigate the risks • Risk management • Mining industry leadership • Strategic investments • Shaping major public service policies in post-1994 South Africa • Advocacy • Having held various executive positions in his extensive career, his expertise in transformation and corporate governance underpins his expertise in ESG matters, including climate change and sustainability matters BOARD AND EXECUTIVE LEADERSHIP continued IR - 9

Independent non-executive directors continued SINDISWA ZILWA (56) BCompt (Hons), CTA, CA(SA) Chartered Director (SA) Cybersecurity certificate programme: Managing Risk in the Information age SA citizen, appointed 1 January 2021 KEITH RAYNER (67) BCom, CTA, CA(SA) SA citizen, appointed 24 February 2020 Appointment date to preceding Board of Sibanye Gold on 1 January 2013 PHILIPPE FRANÇOIS MARIE-JOSEPH BOISSEAU (62) MSc (Theoretical Physics) French citizen, appointed 8 April 2024 • Audit Committee (Chair) • Investment Committee (Chair from 1 January 2024) • Auditing and Accounting • Risk management • Executive management and governance • Regulatory compliance • In line with the proposed U.S. Securities and Exchange Commission (SEC) regulations, the Board, through the Nominating and Governance Committee, appointed Sindiswa as the Board of Directors’ cybersecurity expert • Corporate finance and accounting • Risk management • Executive management and governance • Regulatory compliance • He brings extensive financial expertise to sustainability matters, including climate change • In compliance with the Sarbanes-Oxley Act, the Board has identified Keith Rayner as the Audit Committee’s financial expert • Engineering • Executive management and governance • Strategic and operational knowledge of technology, markets, investors, consumers and regulations • With a distinguished career that includes executive roles in refining, upstream, gas, retail and renewable energy his expertise will be of great value to the energy transition and mining SUSAN VAN DER MERWE (69) BA SA citizen, appointed 24 February 2020 Appointment date to preceding Board of Sibanye Gold on 21 February 2013 NKOSEMNTU NIKA (66) BCom, BCompt (Hons), Advanced Management Programme, CA(SA) SA citizen, appointed 24 February 2020 Appointment date to preceding Board of Sibanye Gold on 21 February 2013 SAVANNAH DANSON (56) BA (Hons) Communication Science and Finance, MBA, Strategic Planning and Finance SA citizen, appointed 24 February 2020 Appointment date to preceding Board of Sibanye Gold 23 May 2017, resigned in March 2024 • Diplomacy • Foreign affairs liaison at the highest levels of government and regulators • Risk management • Finance and accounting at both private and public sector organisations • Risk management • Having exceptional financial expertise, he brings economic expertise to sustainability matters, including climate change • Strategic communication • Financial and risk management • Mining • Infrastructure management Executive directors NEAL FRONEMAN (64) Chief Executive Officer BSc Mech Eng (Ind Opt), BCompt SA citizen, appointed 24 February 2020 Appointment date to preceding Board of Sibanye Gold on 1 January 2013 CHARL KEYTER (50) Chief Financial Officer BCom, MBA, ACMA and CGMA SA citizen, appointed 24 February 2020 Appointment date to preceding Board of Sibanye Gold on 9 November 2012 • Operations management • Mergers and acquisitions • Risk management and strategy • ESG matters, including climate change and sustainability • Financial and corporate finance management • Mergers, acquisitions and integration • Executive management and governance • Risk management BOARD AND EXECUTIVE LEADERSHIP continued IR - 10 Committees A filled icon indicates chair of the committee Audit Committee Investment Committee Nominating and Governance Committee Remuneration Committee Risk Committee Safety and Health Committee Social, Ethics and Sustainability Committee Detailed biographies and information on other public directorships are available on our corporate website (www.sibanyestillwater.com) and in our Form 20-F, available at www.sibanyestillwater.com/news-investors/ reports/annual

C-SUITE AND SENIOR MANAGEMENT as at 26 April 2024 NEAL FRONEMAN (64) Chief Executive Officer BSc Mech Eng (Ind Opt), BCompt CHARL KEYTER (50) Chief Financial Officer BCom, MBA, ACMA and CGMA THEMBA NKOSI (51) Chief People and Culture Officer BA Hons (Employment Relations), University of Johannesburg; BTech (Human Resources), Peninsula Technikon; Human Resources Executive Programme, University of Michigan RICHARD STEWART (48) Chief Regional Officer: Southern Africa BSc (Hons), PhD (Geology), University of the Witwatersrand; MBA, Warwick Business School (UK); PrSciNat LERATO LEGONG (45) Chief Legal Officer LLB, University of Pretoria ROBERT VAN NIEKERK (59) Chief Technical and Innovation Officer National Higher Diploma (Metalliferous Mining), Technikon Witwatersrand; BSc (Mining Engineering), University of the Witwatersrand; South African Mine Manager’s Certificate of Competency MIKA SEITOVIRTA (62) Chief Regional Officer: Europe MSc (Econ), University of Vaasa, Finland MELANIE NAIDOO-VERMAAK (49) Chief Sustainability Officer BSc (Hons), MSc (Sustainable Development), MBA CHARLES CARTER (61) Chief Regional Officer: Americas BA (Hons), University of Cape Town; D.Phil, Oxford University LAURENT CHARBONNIER (49) Chief Commercial and Development Officer École Centrale Paris, Institut d’Etudes Politiques de Paris For full profiles of the members of the C-suite and senior management, see www.sibanyestillwater.com/about-us/leadership/ BOARD AND EXECUTIVE LEADERSHIP continued IR - 11 Executive directors C-Suite (Prescribed officers) Executive Vice Presidents

C-SUITE AND EXECUTIVE MANAGEMENT as at 26 April 2024 continued THABISILE PHUMO (50) Stakeholder relations B.A Hons (Corporate Communication) University of Johannesburg KEVIN ROBERTSON (58) US PGM operations NHD (Economic Geology), Witwatersrand Technikon; Post-Experience Diploma in Engineering Business Management, Warwick University (UK); Graduate Diploma in Engineering (Mining Engineering) University of the Witwatersrand; Master of Engineering, University of the Witwatersrand, PrSciNat RICHARD COX (51) SA gold operations Stanford Executive Program, Stanford University Graduate School of Business; MBA (cum laude), Gordon Institute of Business Science; BSc (Mining), University of the Witwatersrand DAWIE VAN ASWEGEN (47) SA PGM operations ND Metalliferous Mining, NHD Metalliferous Mining, Managers Certificate of Competency, Junior Management Programme (JMP), Management Development Programme (MDP), Baccalaureus Technology, University of Johannesburg Degree: Mining Engineering, Advanced Management – Duke Corporate Education Programme (LIA), London KLEANTHA PILLAY (46) Sales and marketing BSc.Eng (Chem) & MSc.Eng (Chem), University of Natal; MBA, University of Cambridge BHEKI KHUMALO (50) Human resources BA, BA (Hons), MA (Clinical Psychology) (University of KwaZulu Natal), LLB (University of South Africa) WILLIAM TAYLOR (55) Technical services Southern Africa (SA) region; Group Champion Health and Safety Bachelor of Mining Technology, University of Johannesburg JAMES WELLSTED (54) Investor relations and Corporate affairs BSc (Hons) Geology Wits University GEORGE ASHWORTH (65) Chief of staff BA in Engineering and a M Phil in Control Engineering and Operational research, Cambridge University GREG COCHRAN (62) Head of uranium BSc (Mining Engineering) and MSc (Mining Engineering and Mineral Economics), University of the Witwatersrand; MBA, Cranfield School of Management (UK); South African Mine Managers’ certificate of competency: Underground coal mines; South African Mine Managers’ certificate of competency: Underground metalliferous mines (from 1 June 2024) BOARD AND EXECUTIVE LEADERSHIP continued IR - 12 Executive directors C-suite (Prescribed officers) Executive Vice Presidents For full profiles of the members of the C-suite and senior management, see www.sibanyestillwater.com/about-us/leadership/

Dr Vincent Maphai – Chairman Neal Froneman – Chief Executive Officer The challenging macroeconomic and geopolitical environment during 2023 contributed to a general decline in commodity prices (other than gold) during the year. This has significantly impacted the profitability of the global mining sector. The precipitous decline in PGM prices from record levels in early 2022 in particular, has materially affected Group profitability. Along with various operational disruptions which affected production, earnings for 2023 were substantially reduced from the record levels experienced in the recent past. Despite this, our disciplined approach to capital allocation has ensured that we maintained a solid financial position at year end, with a well-staggered debt maturity profile and net debt to adjusted EBITDA of 0.58x, well within comfort levels. Our SA gold operations achieved a turnaround for 2023, which was pleasing after several challenging years. Our SA PGM operations, although impacted by lower PGM prices, maintained industry- leading cost control, with all-in sustaining costs only increasing by 4% to approximately R20,000 per 4E ounce, ensuring positive margins. Operating cost increased by 12% to R21,951/4Eoz (US$1,192/4Eoz. Despite delivering within 2023 production guidance, our US PGM operations and the Sandouville refinery reported increased financial losses, negatively impacting Group profitability for the year. Proactive measures taken to address loss making assets during 2023 and 2024 to date, are expected to secure annual gross savings and capex deferrals of approximately R6.6 billion (US$375 million) better positioning our business in a lower price environment for ongoing sustainability. We recognise however that if low commodity prices persist, earnings are going to remain under pressure and, with ongoing inflationary cost pressure, there may be further restructuring required. We have a strong balance sheet as a buffer, but will continue to manage our financial position in terms of our earnings and cash flow. This may require further repositioning to address losses at the US PGM operations and the Sandouville refinery. We were also able to advance our Green metals strategy during 2023, with the commencement of construction of the Keliber lithium refinery in Q1 2023 and subsequently, the concentrator earthworks starting in Q4 2023. In the Australian region we completed the 100% acquisition of New Century Resources and exercised our option to acquire 100% of the Mount Lyell copper project. We are also excited by the outcomes of initial studies regarding the potential to convert the Sandouville refinery into a facility to produce precursor cathode active material (pCAM) for the European automotive battery ecosystem. *Note: The discussion in this section includes a description of certain non-IFRS financial metrics used to assess operational performance. For a further description of Sibanye- Stillwater’s financial performance, see the Chief Financial Officer’s Report on page 90. SAFETY –––––––––––––––––––––––––––––––––––––––––––––––––––––––––––––––––– Regrettably, we experienced an increase in fatalities at our mines, with eleven colleagues losing their lives while on duty. The increase in fatalities is deeply concerning for management and the Board and is receiving intensified attention. We extend our heartfelt condolences to the loved ones, family and friends of those who passed. The 11 fatalities included five contractors. Among these, four contractors were fatally injured in a single incident at Burnstone due to a design fault in the conveyor structure they were working on. The Conveyor will be reconstructed in due course with a new design factoring in new learnings. Implementing critical controls and critical lifesaving behaviours is core to our safety strategy to eliminate fatal incidents and achieve our aspiration of Zero harm. Despite the increase in fatalities during 2023, we strongly believe that the application of these controls should greatly reduce risks that may lead to fatal and serious injuries and ensuring compliance with these controls throughout the Group is our primary focus. More detail about the Group’s safety performance and actions taken is available in the relevant section on page 125 of this report. Positive indications that the safety culture to which we aspire is taking root are increasingly observed. Self-stoppages of work by operational crews in unsafe environments rose to over 50% of total reported stoppages, indicating improved ownership of safety at the CHAIRMAN’S AND CHIEF EXECUTIVE OFFICER’S REVIEW continued IR - 13 CHAIRMAN’S AND CHIEF EXECUTIVE OFFICER’S REVIEW* “We are focused on our Strategic essentials as we navigate through the low price environment. In addition, we have implemented proactive initiatives to protect and strengthen the Balance sheet.”

operator level. With near-miss incident reporting strongly encouraged by management and also improving, we are better able to promote effective learning that supports safety management across our operations. We are pleased that our serious injury frequency rate (SIFR) improved by 10% year-on-year to 2.61 (per million hours worked), which is the lowest rate ever recorded by the Group. High potential incidents (HPIs) have also decreased significantly from the baseline rate established for injuries with the potential for loss of life. With our employee and contractor numbers having increased by 128% since 2013, the trends in the following graphs reflect how our strategy is delivering positive progress in ensuring that 82,788 people work more safely and make values-based decisions in line with clear safety standards. The health and safety of our employees is our first priority and we remain resolute in our efforts to ensure Zero harm in the workplace. For more detail on safety and health, please see Ensuring safety and wellbeing, from page 125. Group – SIFR (per million hours worked) 3.50 3.88 4.68 4.16 3.57 3.70 3.03 3.03 3.77 2.91 2.61 2013 2014 2015 2016 2017 2018 2019 2020 2021 2022 2023 0.00 2.00 4.00 6.00 Group – FIFR (per million hours worked) 0.10 0.12 0.06 0.10 0.07 0.16 0.04 0.06 0.13 0.03 0.07 2013 2014 2015 2016 2017 2018 2019 2020 2021 2022 2023 0.00 0.05 0.10 0.15 0.20 Workforce (000) vs fatalities 8 11 7 9 8 20 6 8 18 4 6 1 1 0 5 3 4 0 1 3 1 5 36 44 46 75 66 65 85 85 85 84 83 Employee fatals Contractor fatals Workforce Linear (Workforce) 2013 2014 2015 2016 2017 2018 2019 2020 2021 2022 2023 0 25 50 0 20 40 60 80 100 SHARED VALUE TO ALL STAKEHOLDERS ––––––––––––––––––––––––––––––––––––––––––––––––––––––––––––––––––––––––––––––––––––––––––––––––––––––––––––––––––––––––––––––––––––––– CHAIRMAN’S AND CHIEF EXECUTIVE OFFICER’S REVIEW continued IR - 14 36,274 employees incl. contractors R6.16 billion paid in salaries and benefits R1.05 billion invested in socioeconomic development and CSI R554 million taxes and royalties1 R316 million invested in training and development 82,788 employees incl. contractors R30.6 billion paid in salaries and benefits R2.7 billion invested in socioeconomic development and CSI R4.1 billion taxes and royalties1 R1 billion invested in training and development ~R1.1 billion paid over the last two years (2022 & 2023) to over 65,000 beneficiaries in the form of dividends and other employee share option scheme payments 20232013 In 2023, we celebrated ten years of shared value creation from our business activities, and it is important to reflect how the flow of value has escalated over that period. To deliver superior shared value we remain committed to the codes, standards and framework we subscribe to for responsible conduct of our business, including our commitment to the ten principles of the United Nations Global Compact (UNGC). 1 Taxes and royalties paid as per the consolidated statement of cash flows in the Group Annual financial report

The Group is a significant employer globally. In 2013, we employed 36,274 people (including contractors) exclusively in South Africa. By 2023, this had increased by 128% to 82,788 worldwide, with the vast majority of these still in South Africa. Considering the unemployment crisis in South Africa, we recognise the importance of our operations to society in providing jobs, purpose and livelihoods to tens of thousands of South Africans and their dependents. Salaries and benefits received by employees and contractors have increased from R6 billion (US$0.6 billion) in 2013 to R30.6 billion (US$1.7 billion) in 2023, with a cumulative benefit of R189 billion (US$12.8 billion) since 2013. In addition, approximately 65,000 employees and their beneficiaries have received R1.1 billion (US$62 million) in dividends and share options over the last two years. The value of our socioeconomic development and corporate social investment (CSI) programmes since 2013 has grown from just over R1 billion (US$109 million) to over R2.7 billion (US$146 million) for 2023, a 156% increase. This translates to a 39% increase in real terms after accounting for inflation at CPI. The cumulative value of the benefit to communities (e.g., improved infrastructure, businesses, jobs) since 2013 amounts to R16.9 billion (US$1.2 billion). In addition to these benefits, the Sibanye Foundation (a non-profit company) was registered in 2023 to invest in additional societal upliftment programmes, funded by the equivalent of 1.5% of dividends paid to shareholders, with R212 million (US$11 million) of funding committed to date. Most of the funds will be deployed to support social impact projects in South Africa, where we have partnered with Gift of the Givers (disaster response) and Breadline Africa (educational infrastructure to support childhood development). Taxes and royalties paid by the Group in the jurisdictions where we operate have increased from R554 million (US$58 million) in 2013 to R17.9 billion (US$1.2 billion) for 2021, R10.7 billion (US$653 million) for 2022, and R4.1 billion (US$224 million) for 2023. Cumulatively we have paid R47.8 billion (US$3.2 billion) in taxes and royalties in the jurisdictions where we operate since 2013. Our shareholders have not only benefited from significant capital growth but also received R46 billion (US$3.0 billion) in dividends and share buybacks, which is particularly noteworthy, given that our initial market capitalisation was only R10 billion (US$1.2 billion) on listing in February 2013. We believe that these statistics reflect compelling evidence of shared value which has accrued to all stakeholders from our business activities in the ecosystems where we operate, in line with our purpose and vision. See Social, Ethics and Sustainability Committee Chairman’s report on page 181; see Group Impact supplement 2024. Our strategic positioning We are confident that the portfolio of metals we have built will have enduring application in existing and new technologies. Gold continues to demonstrate its relevance in providing financial stability during periods of economic volatility. We maintain a consistent view that PGM’s have substantial longevity in automotive applications, especially through the emergence of hybrid vehicles. This view is partly informed by our analysis on the outlook for battery-electric vehicles (BEV) and the market fundamentals of the battery metals which will be critical for the growth in BEV production. We forecast supply deficits relative to current market BEV growth forecasts as vehicle electrification accelerates into the second half of the decade, with the development of new projects unable to meet projected demand from 2026. We expect this to result in slower BEV growth than currently forecast, with demand for ICE vehicles and PGMs being sustained for longer. In this scenario, both battery metal and PGM prices should be well supported. The developing hydrogen economy is also likely to support demand for PGMs in future, with the European Commission having recently announced some €7 billion in funding for over 30 hydrogen projects. This includes electrolyser deployment for renewable hydrogen production and the construction of liquid organic hydrogen carrier terminal capacity for handling hydrogen, which is positive for growth in demand for platinum, iridium, and ruthenium. We are also supporting the development of electrolysers that use ruthenium as a credible alternative option to scarce iridium and are financing research into possible applications for palladium in the hydrogen economy. Our portfolio of operations and projects is exceptionally well- positioned to address critical market requirements for minerals that are key to global sustainability. OPERATIONAL PERFORMANCE –––––––––––––––––––––––––––––––––––––––––––––––––––––––––––––––––– As we have covered our operational results in detail during our H2 and year end 2023 results on 5 March 2024, supported by references in the Delivering value from our operations and projects section within this report, we only cover operational performance at a high level in this section. Our key profit contributor in recent years, the SA PGM operations, maintained an encouraging operational performance, with all in sustaining cost (AISC)(excluding third party PoC) only increasing by 4% to R20,054/4Eoz (US$1,089/4Eoz) year-on-year, while operating cost (excluding third party PoC) increased by 12% to R21,951/4Eoz (US$1,192/4Eoz). The 4% increase in AISC is a commendable performance given ongoing inflationary pressures and compares favourably against higher unit cost increases reported by industry peers, with expectations that the SA PGM operations will move further down the industry cost curve. A significant contributor to the lower AISC in 2023 was by-product credits which increased by 26% to R10.9 billion (US$592 million) and reduced AISC for 2023 by R6,592/4Eoz (US$358/4Eoz), mainly through our chrome business. Chrome represented 47% of the R10.9 billion (US$592 million) by- product credits for 2023 compared with 40% of R8.6 billion (US$528 million) for 2022. This outcome is the result of a deliberate focus on increasing chrome production, which we identified as strategically significant soon after acquiring the Kroondal and Rustenburg operations. On 29 February 2024, damage to surface infrastructure at the Siphumelele shaft resulted in the suspension of production from the shaft. The incident occurred when an ore collector bin attached to the shaft headgear sheared off and fell to the ground, damaging a surface ore conveyor belt system. There were no injuries as a result of the incident, however, the incapacitation of the ore collector bin and the collapse of the conveyor system necessitated the suspension of production and employees were placed on leave while the damage was assessed and repair work commenced. Repairs at the Siphumelele shaft have progressed according to schedule. All employees returned from leave on Monday, 15 April CHAIRMAN’S AND CHIEF EXECUTIVE OFFICER’S REVIEW continued IR - 15

2024 for start-up procedures. The shaft is on schedule to resume production during May 2024, as planned. The SA gold operations achieved a R7.1 billion (US$412 million) turnaround in adjusted EBITDA year-on-year. Correspondingly, the SA gold operations achieved a significant reduction in losses for the year of R2.2 billion (US$151 million) from R4.5 billion (US$276 million) in 2022 to R2.3 billion (US$125 million) in 2023. This achievement illustrates the benefit of greater stability in production and exposure to a higher gold price which can drive strong financial results. Direct year-on-year comparisons are difficult given the industrial action, lock out and subsequent production build up, which affected 2022, as well as the closure of Beatrix 4 shaft at the end of that year, along with the shaft incident at Kloof 4 shaft and fire at Driefontein 5 shaft which significantly impacted production for H2 2023. Production from the US PGM underground operations steadily improved over the course of 2023, following the shaft incident at the Stillwater mine in March 2023, regaining sustainable levels during Q4 2023. Mined 2E PGM production of 427,272 2Eoz for 2023 was 1% higher than for 2022 and in line with revised guidance of 420k 2Eoz to 430k 2Eoz. Both the Stillwater and East Boulder mines continue to be constrained by limited operational flexibility due to a reduced developed state and an ongoing shortage of critical skills, with the consequent reliance on contractors elevating costs. Production for 2024 has been repositioned for a lower PGM price environment, with cost structures being reassessed for a lower sustainable production level rather than pursuing growth. The global autocatalyst recycling market remains depressed, mainly as a result of the uncertain global economic outlook, recessionary concerns and higher interest rates, which have inhibited consumer demand for new vehicles resulting in light duty vehicles remaining in service for longer periods before being scrapped. These factors continued to impact receipt and feed rates at the US PGM recycling operation during 2023. Average spent autocatalyst fed by the US recycling operation for 2023 declined by 44% to 10.5 tonnes per day compared with 18.8 tonnes per day for 2022, significantly lower than average rates of around 24 tonnes fed in 2021, with total PGM ounces fed of 310,314 3Eoz, 48% lower year-on-year. Production from the Sandouville nickel refinery for 2023 improved modestly due to better plant utilisation and higher nickel recoveries, although more downtime than planned and higher than expected maintenance costs resulted in elevated operating costs and sustaining capital costs. During the study on repurposing the nickel refinery to produce nickel sulphate (NiSO4), the Group identified an alternative option and has assessed the potential of producing precursor cathode active material (pCAM). A scoping study on the viability of producing pCAM at the Sandouville plant was conducted between November 2023 and January 2024 and the results are encouraging, both with regards to the market and the production costs that could be achieved as a brownfield project. A pre-feasibility study commenced during March 2024. Further announcements will be made on this as the various stages of feasibility work are completed. Sibanye-Stillwater also completed a pre-feasibility study on PGM autocatalyst recycling using European feedstocks. It was concluded that the project was not viable due to unfavourable evolution of market conditions in Europe with no further work to be conducted. Construction activities of the Keliber lithium refinery in Kokkola, Finland have continued since March 2023. Similarly, the earthworks and selected infrastructure works commenced at the Päiväneva concentrator site in Q4 2023. The mining permit for the Rapasaari mine became legally valid in December 2023 as the Vaasa Administrative Court (Court) rejected the appeal lodged against the permit. On 23 February 2024, the Court issued a ruling on three appeals, including Sibanye-Stillwater’s appeal of certain emission-related permit conditions in connection with the environmental permit for the Rapasaari mine and the Päiväneva concentrator issued in December 2022 (Environmental permit). The Court upheld and partially amended the Environmental permit as requested by Sibanye-Stillwater, while referring certain permit conditions pertaining to the placement of Rapasaari mine’s waste rock and certain waste fractions from the concentrator, the aftercare plan for the extractive waste areas and the associated financial guarantees for further review. As the Environmental Permit was otherwise affirmed, the permit remains in effect, allowing the construction work at the Päiväneva concentrator to continue in line with the original time frames for the project. While the full impact of the Court’s ruling on the Rapasaari mine related permit conditions has not yet been determined, a delay is expected in the commencement of the Rapasaari mine operations. Sibanye-Stillwater is in the process of assessing the overall impact, if any, on the Keliber lithium project. See Operational excellence, page 103; and for year-end results, see www.sibanyestillwater.com/news-investors/reports/quarterly/2023/ FINANCIAL PERFORMANCE AND CAPITAL ALLOCATION –––––––––––––––––––––––––––––––––––––––––––––––––––––––––––––––––– Adjusted EBITDA for 2023 was lower at R20.6 billion (US$1.1 billion), with a loss for the year of R37.4 billion (US$2 billion) mainly due to lower commodity prices and a R47.5 billion (US$2.6 billion) impairment of assets.] Normalised earnings were lower at R1.8 billion (US$0.1 billion), turning negative for H2 2023 resulting in no final dividend being declared in line with our dividend policy to distribute up to 35% of normalised earnings to shareholders. Our disciplined, approach to capital allocation maintained our strong financial position, with net debt to adjusted EBITDA of 0.58x at year end well within our comfort levels. While we are continuing our investments in organic growth during 2024, we will approach capital allocation in a prudent manner in order to protect our balance sheet through the current down cycle. In April 2023, we refinanced and increased our US dollar revolving credit facility (RCF) to US$1 billion and funding for the Reldan transaction was secured through the issue of a low coupon convertible bond towards year end. This further enhanced Group liquidity, which remains solid with headroom of just under R50 billion split roughly half cash and half available debt facilities. We are also considering various alternative capital and financing opportunities including revenue protection and monetisation should they be required. In 2023/2024 we implemented a hedge at our SA gold operations of over 60% of 2024 production, with a floor of R1.1m/kg and a ceiling of R1.4m/kg, protecting revenue downside while retaining significant upside. We are focused on our strategic essentials as we navigate through the down cycle and have implemented proactive initiatives to protect and strengthen our balance sheet. CHAIRMAN’S AND CHIEF EXECUTIVE OFFICER’S REVIEW continued IR - 16

Please see the CFO’s report on page 90 of this report for a further financial overview. POSITIONING FOR SUSTAINABILITY ––––––––––––––––––––––––––––––––––––––––––––––––––––––––––––––––––––––––––––––––––––––––––––––––––––––––––––––––––––––––––––––––––––––– The significant decline in palladium and rhodium prices during 2023 prompted a proactive response to address loss making assets. The decisive implementation of cost saving and capital preservation opportunities during H2 2023 and 2024 to date, is expected to yield approximately R6.6 billion (US$375 million) in cost and capital savings (aiming at resetting the cost base) and capital reduction and/or deferrals, which will benefit near and medium term cash flow. These initiatives include: Repositioning actions/events unlocking expected cost and capital benefits R US$ February 2022 Noted the likely prospect of a global economic downturn post the invasion of Ukraine n/a n/a August 2022 Repositioning of US PGM operations for anticipated palladium price weakness n/a n/a February 2023 Closure of Beatrix 4 Shaft and Kloof 2 processing plant R500m US$29m From May 2023 Entered into gold ZAR hedges (zero cost collars) to protect price downside* n/a n/a November 2023 Raised US$500m convertible bond to fund the recycling strategy at a 4.25% interest rate n/a n/a November 2023 Closure of Kloof 4 shaft R1.1bn US$63m November 2023 Further repositioning of US PGM operations for ongoing decline in 2E basket price R3bn US$171m November 2023 Deferral of capital investment in Burnstone project and corporate savings R1.2bn US$69m February 2024 Closure of Simunye shaft, rightsizing of Siphumelele and Rowland shafts and conditional operations at 4 Belt shaft R750m US$43m Total estimated benefit expected** R6.6bn US$375m *60% of 2024 production hedged with floor of R1.1million/kg and cap of R1.4 million/kg ** The above financial information and the information on which it is based has not been reviewed or reported on by Sibanye-Stillwater’s auditors In February 2023, at our SA gold operations, we closed the Beatrix 4 shaft and Kloof 2 processing plant; and in November 2023, we closed Kloof 4 shaft. In November 2023, in response to the rapid decline in the 2E basket price, we went through a further repositioning of our US PGM operations and during February 2024 at our SA PGM operations the closure of the Simunye shaft, right-sizing of the Siphumelele and Rowland shafts and conditional operation of 4 Belt (4B) shaft were agreed and implemented at the time. On 18 April 2024 however, the closure of the end-of-life 4B was announced, despite all the efforts to restore the shaft to profitability, the shaft remained loss- making. Various avoidance measures to limited the impact on the affected 1,496 employees ans 54 contractors were successful as only 65 employees were subjected to forced retrenchment as well as 54 contractors who had been terminated. On 11 April 2024, we announced that the ongoing Group business review has identified a need to address losses at the Beatrix 1 shaft, which has been unable to deliver planned production, and the Kloof 2 plant which, after the closure of the Kloof 4 shaft during 2023, has had insufficient processing material available to cover overheads. The deferral of capital expenditure at the Burnstone project, announced in February 2024, also requires restructuring aligned with the reduction in planned capital activities. The reduction in the operational footprint in the SA region, due to the recent restructuring and closure of loss-making shafts and from proposed future restructuring or closures, has resulted in the capacity of the direct and shared services functions for the SA region and operations being surplus to current and future requirements. As a result, the Group proposes a re-alignment of the regional services, shared services and direct services structures to align with the requirements of the reduced operational footprint. This will reduce direct operational services costs and regional overhead costs which are allocated to the operations, thereby contributing to the sustainability of the SA region. We recognise however that if low commodity prices persist and with ongoing inflationary cost pressures, there may be further restructuring required. This may include further repositioning to address losses at the US PGM operations and the Sandouville refinery. We have a strong balance sheet as a buffer, but will continue to manage our business to ensure sustainability. THE BOARD AND GOVERNANCE –––––––––––––––––––––––––––––––––––––––––––––––––––––––––––––––––– We had some changes to the C-suite and some new executive management appointments during 2023 and 2024 to date, and are delighted to welcome Melanie Naidoo-Vermaak, our new Chief Sustainability Officer to the Group from 1 January 2024. We would also like to congratulate George Ashworth who was promoted from SVP to EVP: Chief of Staff on 1 March 2024. On 20 March 2024, we announced the appointment of Greg Cochran as EVP: Head of uranium to drive the realisation of value from the uranium assets in the portfolio. There were no changes to the Board of Sibanye-Stillwater during 2023. However, the tenure of six non-executive directors on the Board exceeds nine years and, in accordance with King IV, Sibanye-Stillwater effected some changes to the composition of its board committees, effective from January 2024. • Harry Kenyon-Slaney has been appointed as Lead Independent Director and Chair of the Risk Committee • Jerry Vilakazi has been appointed Chair of the Safety and Health Committee • Elaine Dorward-King has been appointed as Chair of the Social, Ethics and Sustainability Committee • Keith Rayner has been appointed as Chair of the Investment Committee In addition, to the above changes, Nkosemntu Nika and Susan van der Merwe will retire at the 2024 AGM, and Savannah Danson resigned on 11 March 2024 after serving on the board since May 2017 due to an increasing external workload. CHAIRMAN’S AND CHIEF EXECUTIVE OFFICER’S REVIEW continued IR - 17

On 8 April 2024, Philippe Boisseau (Philippe) was appointed as an Independent Non-Executive Director of the Group. The Board welcomes Philippe to Sibanye-Stillwater and looks forward to his valuable contribution to the ongoing development of the Group. We value our Board’s diversity, which is essential given the global footprint we operate in and the diverse challenges we face as a key supplier of strategically important metals, and believe that the Board has an appropriately balanced composition that is conducive to effective leadership. See Board and executive leadership, page 8. THE CHANGING ENVIRONMENT FOR OUR BUSINESS –––––––––––––––––––––––––––––––––––––––––––––––––––––––––––––––––– The global perspective In 2021, we introduced the concept of grey elephants (highly probable, high impact, yet often ignored trends that are shaping the 2020s) to characterise the remarkable changes being experienced in the world. The grey elephants, which are presented in more detail in the section on strategy on page 35, continue to provide a guide for our strategic positioning. While all the grey elephants are of importance for our business, certain ones were particularly prominent in 2023. With 2023 again being the warmest year on record globally, our strategy to build a portfolio of green metals directly addresses the Angry Planet elephant. We also recognise the physical and transition risks that create both threats and opportunities for our business. As part of our commitment to align with the Task Force on Climate-Related Financial Disclosures (TCFD), we engaged a team of experts in 2023 to help us complete a comprehensive analysis of climate change related implications for the business (See Climate change supplementary). Geopolitical developments continue to drive a shift to Multipolarity, with supply chains reconfiguring and regional security of supply becoming a growing imperative. Critical mineral value chains are a prominent feature with legislation and incentives being passed in many jurisdictions to secure control over minerals that are key resources for a sustainable future. This includes a focus on recycling and resource stewardship with regulation mandating the responsible use of scarce resources. The strategic presence that we have established in Europe and North America positions us as a meaningful partner in these ecosystems. We are acutely aware of the growing threat and opportunity posed by the Intelligent advances elephant, with machine learning and artificial intelligence advancing at a remarkable rate into mainstream application during 2023. The fifth industrial revolution is upon us, and our response is to embrace technology to augment human performance by evolving into an Inclusive, diverse and bionic organisation. For more on the external environment for our business and operations, see page 36. We note the strides made by Group Technology and innovation in building an innovative, digital-first organisation that pioneers a fully- integrated digital mining enterprise that will strengthen decision- making capabilities through the accessibility of relevant information. See Harnessing innovation, page 171. For additional information on how we are responding to the dynamic external environment, please see Managing our risks and opportunities within the external environment, page 51. Load curtailment and crime in South Africa Eskom’s energy availability factor (EAF) declined further to 55% for 2023, marking a consistent decline from 58% in 2022, 62% in 2021, and 65% in 2020. The draft Integrated Resource Plan recently released by the Department of Mineral Resources and Energy highlights a likely national energy deficit until 2027, suggesting that South Africa will continue to face load shedding and load curtailment in the near term. We will continue to support Business for South Africa in working with government to address these issues in the national interest. We are also pursuing our key strategy of developing self-generation projects, with financial close secured on three projects during 2023. These are currently in construction and set to deliver 267MW of renewable power (solar and wind) to our operations from end-2025 onwards. In addition, five further projects with combined generating capacity of 365MW are currently in development and set to reach financial close during 2024. Altogether this will provide about 30% of our total energy requirements in South Africa from 2027. While delivering meaningful cost savings through lower tariffs than the public utility, we will secure a significant reduction in our carbon footprint. We welcome the significant capital investment by the project developers of between R12 billion and R14 billion enabled through our power off-take commitment that underpins that investment. See Minimising our environmental impact, page 190. Sibanye-Stillwater is proud to participate and lead the South African business-government workstreams dedicated to resolving the electricity, transport and logistics, and crime and corruption crises in South Africa. Despite some inroads in 2023, illegal mining and copper cable theft continue to be a significant concern at our SA gold and SA PGM operations. We will continue to work with the police and other authorities in the criminal justice system to deal with this threat to business continuity and to the safety of our employees, while supporting government in strengthening the systems to combat crime and corruption through the Business for South Africa work. (See Combatting illegal mining fact sheet, www.sibanyestillwater.com/newsinvestors/reports/annual). CLOSING REMARKS –––––––––––––––––––––––––––––––––––––––––––––––––––––––––––––––––– We thank our 82,788 colleagues for their contributions to the growth and evolution of the Group. This commitment and resilience will ensure that we not only sustain through the current challenges, but emerge in a better position. We also value our relationships with our mine communities, with governments and regulators, as well as with all the stakeholders who make our success possible. We will continue to work with our partners to deliver superior shared value. We also thank members of the Board and the C-suite for the constructive discussions that makes it an exciting and rewarding endeavour to be involved in this organisation. Vincent T Maphai Neal Froneman Chairman Chief Executive Officer 26 April 2024 CHAIRMAN’S AND CHIEF EXECUTIVE OFFICER’S REVIEW continued IR - 18

RESPONSIBLE SOURCING –––––––––––––––––––––––––––––––––––––––––––––––––––––––––––––––––––––––––––––––––––––––––––––––––––––––––––––––––––––––––––––– Sibanye-Stillwater recognises the risks of significant adverse impacts that may be associated with extracting, processing, trading, handling and exporting minerals. Sibanye-Stillwater recognises the need to combat systematic or widespread abuses of human rights, to avoid contributing to geopolitical conflict, to comply with high standards of anti-money laundering practice, and to combating terrorist financing practices. Towards these ends, we adopted the policy on the responsible sourcing of metals. See our due diligence information, page 231. KEY GOVERNANCE DOCUMENTS ––––––––––––––––––––––––––––––––––––––––––––––––––––––––––––––––– CORPORATE GOVERNANCE WHAT WE DID IN 2023 SUCCESSES • Board evolution and succession planning (see page 25) • CEO succession planning (see page 28) • Review of the Code of ethics • Adoption of three new policies: Whistleblower policy; Anti-Bribery and corruption policy; Anti-Money laundering and counter-terrorism policy (AML) • Integration and implementation of the governance framework in new regions • Adoption of a recovery policy relating to the clawback of compensation awarded erroneously as a result of an accounting restatement CHALLENGES • Challenging operating environment with the grey elephants (see page 35) For a comprehensive list of governance documents refer to www.sibanyestillwater.com/about-us/governance CORPORATE GOVERNANCE IR - 19 Key governance information is available on our website (click on a document below to download) Sustainability strategy Environmental, social and governance Air quality Biodiversity Climate change Energy and decarbonisation Mineral and non-mineral waste Water health management Water stewardship Tailings stewardship Complaints and grievance procedure Human rights policy Health and safety Heritage Indigenous people, host communities and mining Land management Partnership for development Post-mining socioeconomic sustainability and closure Transparency of mineral revenues Security Stakeholder engagement policy Material stewardship Responsible business Risk management Tax risk management Group tax strategy Ethics and corporate governance Code of ethics (available in 7 languages) • Policy for the responsible sourcing of metals • Policy statement: responsible sourcing of metalsPO LI C Y • Brakpan PMR platinum sponge accreditation certificate • Brakpan PMR palladium sponge accreditation certificate 20 23 • Conflict-free gold report • Assurance report on conflict-free gold report • Compliance report on responsible sourcing of platinum/palladium • Independent practitioner’s limited assurance report • Sibanye-Stillwater / Western Platinum (Pty) Ltd palladium good delivery certificate • Brakpan PMR responsible platinum and palladium certificate • Brakpan PMR rhodium sponge accreditation certificate 20 22

COMMITMENT TO GOVERNANCE AND VALUE CREATION The Board of Sibanye-Stillwater is dedicated to providing effective, responsible, and ethical leadership, firmly committed to upholding robust standards of corporate governance in all aspects of our operations. Our deliberations and choices are consistently shaped by our overarching vision and purpose: to lead in superior shared value for all stakeholders while safeguarding global sustainability through our metal. Sibanye-Stillwater embraces the principles of the King IV Report on Corporate GovernanceTM for South Africa, 2016 (King IV), the South African Companies Act 71 of 2008 (as amended) (the Act), the JSE Listings Requirements, the NYSE Listed Company Manual and other relevant laws and regulations. While the Board is unwavering in its adherence to legislation, regulations and codes, the Group’s commitment to good governance goes beyond compliance and is deeply rooted in our iCARES values. We are resolute in our commitment to uphold the highest standards of integrity, transparency, and accountability, ensuring that our actions consistently reflect our unwavering dedication to fostering good governance principles. ETHICAL LEADERSHIP AND CORPORATE CITIZENSHIP The Board assumes ultimate responsibility for the Group’s ethical performance and holds management accountable for implementing Sibanye-Stillwater’s Code of ethics (the Code) and ensuring that the organisation is a values-driven one. The Code is binding on directors and employees (full-time and part-time) and we encourage all third-parties who do business with us to adopt it as well. During 2023, a review of the Code was undertaken to ensure alignment not only with the European region’s (Sandouville refinery and the Keliber lithium project) and the Australian region’s (Century surface tailings operation and the Mount Lyell copper exploration project) respective Codes, but also with focus areas to ensure ongoing relevance and completeness. The significant amendments to the previous version of the Code include: • Incorporation of principles addressing alcohol, drugs, and substance abuse; payment errors; and compliance with laws and regulations under professional conduct • Revision of the Conflict of interest section to align with the new Conflict of interest, gifts, sponsorships, and/or donations policy, alongside the integration of principles concerning prohibited donations, reflecting evolving practices in corporate governance • Introduction of new sections on ESG, human rights; artificial intelligence; money laundering and terrorist financing; and lobbying activities, demonstrating responsiveness to emerging stakeholder interests The Code is publicly available to the workforce, our suppliers and other external parties. In addition, we facilitate ethics education sessions for employees and third-parties who do business with us. This induction covers topics such as conflicts of interests, anti- corruption, human rights, procurement policies, amongst other ethics-related topics (See Empowering our workforce, page 160). Due to the growth of the Group, the education and monitoring procedures of the Code have lacked consistency across regions. Efforts are underway to standardise these processes in 2024. With the aim of combatting corruption and fostering ethical and anti- corruption behaviour to our suppliers we educate them accordingly. Anti-corruption and ethics training on the updated Code of ethics for the directors and employees (full-time and part-time) and suppliers is scheduled for the second quarter of 2024. See Socioeconomic development, page 227. The Board, through the Audit Committee and the Social, Ethics and Sustainability Committee, oversees compliance with Sibanye- Stillwater’s Code of ethics. These two committees assist the Board in reviewing adherence to compliance and ethics programmes, including anti-bribery, anti-corruption, sanctions, competition, fraud, market manipulation, and anti-money laundering laws and regulations. At a Group level, and across all regions, the Internal audit department performs audits on various governance processes. 16.5 Breaches (and suspected breaches) of any company policy (including transgressions of the Code) are picked up in audits and detected through internal systems. Our Security risk assessments also include an evaluation of corruption and collusion. All incidents of unethical behaviour, fraud, theft and corrupt activities are investigated. Our Risk tolerance framework includes ethics and corporate governance. Our anti-bribery, anti-money laundering, and counter- terrorism financing policies confirm the Group’s zero-tolerance approach to malfeasance. The Anti-corruption and bribery sets out our approach to prevention of bribery and other forms of corruption. We only do business with customers, suppliers, distributors, counterparties and agents who are verifiably legitimate and who are funded by legitimate sources. Our ethical practices are reviewed annually by external parties as part of the International Council on Mining and Metals (ICMM) and World Gold Council Responsible Gold Mining Principles (WGC RGMP) assurance processes. We have verification and vetting processes for our suppliers, to minimise the risk of non-compliance. Verifications of qualifications and criminal record screening of new employees (as well as those being promoted) are part of our practice to mitigate risks relating to corruption and unethical conduct (See Socioeconomic development, page 227). CORPORATE GOVERNANCE continued IR - 20

Toll-free lines and an anonymous email address to report irregularities, unethical or unlawful behaviour (including tax concerns) and misconduct without fear of victimisation. sibanyestillwater@tip-offs.com South Africa: 0800 001 987 United States: 1-800-317-0287 Finland: 0800 772 244 France: 0805 080 544 Australia: 1 800 633 293 Our toll-free lines and anonymous email address are accessible to employees, suppliers, and customers. Whistleblower reports are both anonymous and confidential and are managed by Protection Services. Reports of tip-offs are reviewed by the Audit Committee and the Social, Ethics, and Sustainability Committee. Our Whistleblower policy ensures protection and confidentiality for those who disclose concerns. The Group works with governments, NGOs and advocacy groups when the need arises. In 2024, the Group adopted an Anti-bribery and corruption policy that allows the Group to make donations or contributions to NGOs, advocacy groups, or political structures in countries where this is legally permitted. Political donations are considered especially high-risk as the support of any political parties or candidates can be perceived as an attempt to gain an improper business advantage. The Group will not, either directly or indirectly through intermediaries and other third parties, offer, promise, or provide money or anything of value or otherwise seek to exercise improper influence in our business relationships with the intention of obtaining a benefit or any improper advantage in conducting business. Accordingly, the making of donations of any amount to local or national governments, political parties, politicians, or their affiliates (e.g., political committees organised to support a candidate) is prohibited without the prior consultation and approval as required by the Group Approval Framework. Any such approval includes confirmation that the donation is for a proper purpose and complies with all applicable laws. Any such donations shall be recorded in the Group’s Donations to political structures register and is to be made in accordance with the following guidelines and principles in mind: • All donations to political structures must be transparently recorded and disclosed and reported in accordance with legal requirements and company policies • The Group will adhere to all applicable laws, regulations, and industry standards governing donations in the jurisdictions in which it operates • Under no circumstances will donations be made to gain undue influence, favours, or preferential treatment • The Group shall ensure that any donations are used by the recipient for their intended purpose • The Group shall review and update its donation policies periodically to reflect changes in legislation or best practice In Q1 2023, New Century Resources contributed AUS$14,300 to the Liberal Party of Tasmania for membership of the Leaders Forum Program for CY2023. This is a legacy contribution that was entered into prior to the takeover of New Century Resources by Sibanye- Stillwater. The contribution amount is below the disclosure level for political contributions in Tasmania. This contribution was subject to the internal approvals process that was in place for New Century Resources at the time. See www.sibanyestillwater.com/about-us/governance Declarations and conflicts of interest and related-party transactions We recognise the importance of identifying and managing conflicts of interest to uphold the trust and confidence of our stakeholders. To this end, our directors and key executives are required to make comprehensive declarations of any conflicts of interest or potential conflicts of interest that may arise in the course of their duties. These declarations are made regularly and promptly updated as circumstances change, ensuring transparency and accountability in decision-making processes. The Board’s Conflict of interest policy is contained in the Board charter, which is publicly available on our website. This policy requires that all Board and committee members declare at the start of each meeting any conflicts of interest in respect of the agenda. In addition, as per the Code, King IV, the Companies Act of 2008 (as amended), the JSE Listings Requirements, and the NYSE Listed Company Manual, directors and prescribed officers must submit a declaration of all their material interests at least once a year or at any time their circumstances change. Schedule 13 of the JSE Listings Requirements declarations are also a standing agenda item of the Board and directors are required to declare whether any change has occurred to their statements as per schedule 13. Conflicts of interests are minuted, and affected directors are recused from debating and voting on matters on which they are conflicted. There were no conflicts of interest during the year by which a non-executive director had to be recused from a meeting. The Board holds senior managers and employees to similar standards of ethics. The Code requires that all employees, directors, and officers holding D-Band or middle management level and above complete annual declarations of interest in the prescribed format, or earlier if circumstances change, unless prohibited by applicable local laws and regulations. In addition to the annual declaration mandate, any employee that has an actual or potential conflict of interest must also complete the declaration in the prescribed format. CORPORATE GOVERNANCE continued IR - 21

Declarations in the South African operations are updated on the electronic Employee self service (ESS) system. Digitalisation of the process assists in keeping an audit trail. We aim to move other regions to the electronic system for these submissions during 2024 and 2025 as well. Sibanye-Stillwater is committed to conducting related- party transactions with transparency, fairness, and adherence to regulatory requirements. Such transactions, which involve parties with a close relationship to the Group, are subject to rigorous scrutiny and oversight by our Audit Committee. These are disclosed in detail in our Group Annual financial report. Securities trading and insider trading policy Our Securities trading policy and related information is overseen by the Equities Trading Committee, which is an executive committee. This committee monitors compliance with the JSE Listings Requirements and applicable laws on insider trading. In addition, the committee determines when the Group is in a prohibited period, being either a closed (blackout) period and/or a price-sensitive period. In terms of the policy, prescribed officers, the Company secretary, directors of Sibanye-Stillwater, directors of major subsidiaries, and senior managers require clearance to deal in Sibanye-Stillwater securities. Clearance to deal may not be given during prohibited periods. Directors’ clearance for dealing during open periods is provided by the Chairman of the Board, or the Lead Independent Director, as the case may be, in consultation with the Equities Trading Committee. In December 2022, the U.S. Securities and Exchange Commission (SEC) implemented revisions to certain rules under the U.S. Exchange Act concerning trading programmes for corporate insiders. These modifications included the adoption of new regulations mandating that SEC-registered companies, including foreign private issuers like Sibanye-Stillwater, publicly disclose their insider trading policies. Consequently, Sibanye-Stillwater intends to include its Insider trading policy as an exhibit to its annual report on Form 20-F for the year ending 31 December 2024. During the first half of 2024, we will actively engage in crafting a comprehensive Global insider trading policy that aligns with relevant regulations and industry standards. Good corporate citizenship Sibanye-Stillwater acknowledges that partnerships and collaborations may be necessary to co-exist with society and contribute towards social needs in all jurisdictions in which we operate. This is reinforced by the drive to be locally relevant, build robust business ecosystems, create shared value, and to be a good corporate citizen (See Social, Ethics and Sustainability Committee: Chairman’s report, page 181). Tax transparency and governance We conduct our tax affairs in good faith and have a Tax risk management framework (approved by the Board) to guide our reporting and to monitor tax obligations. Our King IV-aligned Tax strategy is supported by a Group tax policy, which includes information about our processes and policies for compliance. See www.sibanyestillwater.com/news-investors/reports/regulatory/ The US PGM operations have internal tax specialists and external tax consultants who monitor regulation as it becomes law, advising the US region and the Group. Status reports are reviewed by the Audit Committee at least half-yearly, or as and when necessary. During 2023, the Group acquired 100% of New Century Resources Limited and created a single Australian tax group for the region. As a result of the New Century Resources Limited acquisition, the Group also acquired an option to acquire 100% of Copper Mines of Tasmania, which option was exercised towards the end of 2023. All the Australia Tax Group’s tax filings have been submitted and the Australia Tax Group is therefore tax compliant. The Group also has operations in Europe. In February 2022, Sibanye- Stillwater successfully concluded the €87 million transaction to acquire French mining group Eramet SA’s Sandouville hydrometallurgical nickel processing facilities near Le Havre, France’s second-largest industrial port. Located in Finland, the Keliber lithium project, in which the Group holds a 79.8% share, is strategically positioned close to critical and growing regional end- user battery markets for lithium hydroxide in Europe. The European entities are also tax compliant with all tax filings being submitted timeously. All cross border connected party transactions entered into between any group entities where Sibanye-Stillwater has a presence are entered into at arm’s length in line with the transfer pricing regulations of the respective jurisdictions in which they operate. This includes all European, United States, South-African and Australian entities. Group tax strategy is the responsibility of the Board, via the Audit Committee. The tax strategy is aligned to the Group's purpose: our contributions support the principle of public-private collaboration, contributing to the national fiscus’ development objectives. CORPORATE GOVERNANCE continued IR - 22 In 2023, 853 declarations were made across the Group of which only 291 had a potential conflict of interest (2022: 777; 295)

OUR FIVE TAX OBJECTIVES ––––––––––––––––––––––––––––––––––––––––––––––––––––––––––––––––––––––––––––––––––––––––––––––––––––––––––––––––––––––––––––––––––––––– CORPORATE GOVERNANCE continued IR - 23 Embedding ESG excellence through tax Focusing on operational excellence in tax Providing value- based tax support Managing tax risk Engaging with stakeholders regarding tax Our taxes help generate long-term value for stakeholders (employees, the communities in which we operate, governments and shareholders) in accordance with the Group’s Risk management framework. Mining royalties and revenues are a means by which we directly and indirectly (depending on the region and on the operation) share value with our stakeholders. They are not, however, the only recipients. We are committed to long-term shareholder return and socioeconomic value for the countries in which we operate. We align our structures, processes and policies with applicable laws, international standards and best practices as these evolve and develop. This includes optimised tax processes and procedures to drive efficiency and effectiveness, reduce complexity and mitigate adverse and or unexpected financial or reputational consequences. A strong values-based, ethical culture when considering tax, provides a solid foundation for decision-making and conduct in support of our purpose. To bolster this position we endorse the Extractive Industries Transparency Initiative (EITI) and we participate in ICMM working groups to improve transparency on mineral revenues. See Sustainability content index at www.sibanyestillwater.co m/news-investors/reports/ annual. Furthermore, our Transparency of mineral revenues position statement articulates our commitments to transparent disclosure. We maintain sound tax risk management practices and systems that are consistent with international best practice in line with the Group's Enterprise Risk Management Framework (ERMF). It is essential to manage and mitigate tax risks and challenges arising as a result of the local regulatory, legislative, and socioeconomic context. This will assist in protecting the Group's assets, its reputation and the interest of all stakeholders, in order to achieve the Group’s strategic objectives. Our Tax risk management policy is available at tax-risk- management-policy- september2021.pdf We promote transparent and open working relationships with tax authorities and early engagement in advance of undertaking transactions and filing tax returns. We continue to monitor ongoing developments and formalisation of tax legislation and regulation and will engage with stakeholders where appropriate to ensure the Group’s interests are appropriately represented in the shaping of the changing tax landscape.
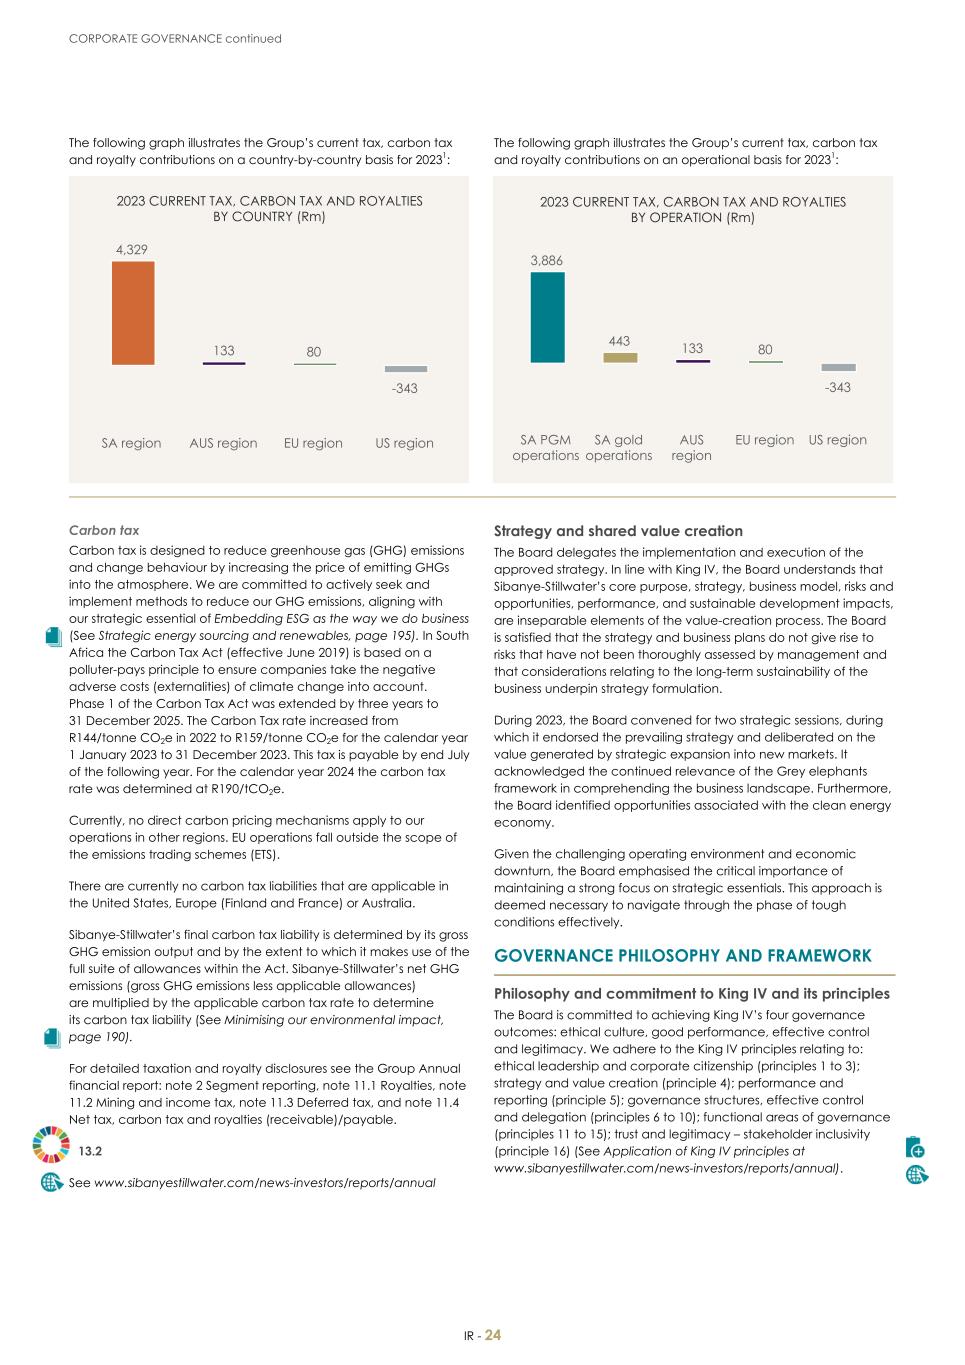
The following graph illustrates the Group’s current tax, carbon tax and royalty contributions on a country-by-country basis for 20231: The following graph illustrates the Group’s current tax, carbon tax and royalty contributions on an operational basis for 20231: Carbon tax Carbon tax is designed to reduce greenhouse gas (GHG) emissions and change behaviour by increasing the price of emitting GHGs into the atmosphere. We are committed to actively seek and implement methods to reduce our GHG emissions, aligning with our strategic essential of Embedding ESG as the way we do business (See Strategic energy sourcing and renewables, page 195). In South Africa the Carbon Tax Act (effective June 2019) is based on a polluter-pays principle to ensure companies take the negative adverse costs (externalities) of climate change into account. Phase 1 of the Carbon Tax Act was extended by three years to 31 December 2025. The Carbon Tax rate increased from R144/tonne CO2e in 2022 to R159/tonne CO2e for the calendar year 1 January 2023 to 31 December 2023. This tax is payable by end July of the following year. For the calendar year 2024 the carbon tax rate was determined at R190/tCO2e. Currently, no direct carbon pricing mechanisms apply to our operations in other regions. EU operations fall outside the scope of the emissions trading schemes (ETS). There are currently no carbon tax liabilities that are applicable in the United States, Europe (Finland and France) or Australia. Sibanye-Stillwater’s final carbon tax liability is determined by its gross GHG emission output and by the extent to which it makes use of the full suite of allowances within the Act. Sibanye-Stillwater’s net GHG emissions (gross GHG emissions less applicable allowances) are multiplied by the applicable carbon tax rate to determine its carbon tax liability (See Minimising our environmental impact, page 190). For detailed taxation and royalty disclosures see the Group Annual financial report: note 2 Segment reporting, note 11.1 Royalties, note 11.2 Mining and income tax, note 11.3 Deferred tax, and note 11.4 Net tax, carbon tax and royalties (receivable)/payable. 13.2 See www.sibanyestillwater.com/news-investors/reports/annual Strategy and shared value creation The Board delegates the implementation and execution of the approved strategy. In line with King IV, the Board understands that Sibanye-Stillwater’s core purpose, strategy, business model, risks and opportunities, performance, and sustainable development impacts, are inseparable elements of the value-creation process. The Board is satisfied that the strategy and business plans do not give rise to risks that have not been thoroughly assessed by management and that considerations relating to the long-term sustainability of the business underpin strategy formulation. During 2023, the Board convened for two strategic sessions, during which it endorsed the prevailing strategy and deliberated on the value generated by strategic expansion into new markets. It acknowledged the continued relevance of the Grey elephants framework in comprehending the business landscape. Furthermore, the Board identified opportunities associated with the clean energy economy. Given the challenging operating environment and economic downturn, the Board emphasised the critical importance of maintaining a strong focus on strategic essentials. This approach is deemed necessary to navigate through the phase of tough conditions effectively. GOVERNANCE PHILOSOPHY AND FRAMEWORK –––––––––––––––––––––––––––––––––––––––––––––––––––––––––––––––––– Philosophy and commitment to King IV and its principles The Board is committed to achieving King IV’s four governance outcomes: ethical culture, good performance, effective control and legitimacy. We adhere to the King IV principles relating to: ethical leadership and corporate citizenship (principles 1 to 3); strategy and value creation (principle 4); performance and reporting (principle 5); governance structures, effective control and delegation (principles 6 to 10); functional areas of governance (principles 11 to 15); trust and legitimacy – stakeholder inclusivity (principle 16) (See Application of King IV principles at www.sibanyestillwater.com/news-investors/reports/annual). CORPORATE GOVERNANCE continued IR - 24 2023 CURRENT TAX, CARBON TAX AND ROYALTIES BY COUNTRY (Rm) 4,329 133 80 -343 SA region AUS region EU region US region 2023 CURRENT TAX, CARBON TAX AND ROYALTIES BY OPERATION (Rm) 3,886 443 133 80 -343 SA PGM operations SA gold operations AUS region EU region US region

Approach: Corporate governance framework Our Group Corporate governance framework involves a cloud-based governance, risk and compliance (GRC) system, aligning us to global best practice. The system allows for a clear separation between the Board’s responsibilities from management’s responsibilities; with the 32 GRC elements broken up between 16 Board governance and performance elements, and 16 management responsibility elements. During 2023, the focus was on operationalising the corporate governance framework across new regions. The new regions were assessed against the following management responsibility elements: Management responsibility elements Planning Operational performance Risk management Ethics Compliance Monitoring & evaluation reporting Internal controls and audit Information security IT governance Business continuity management Business processes Business intelligence & knowledge management Records and contracts management Standards and quality management Group wellness and skills Independence, tenure, diversity and inclusivity The Board operates a unitary board, consisting of 13 members, with 11 individuals, including the chairman, serving as independent non- executive directors. A lead independent director assumes responsibilities in the chair's absence, offering support and acting as a conduit between the chair and other board members when necessary. Notably, the roles of Chairman and CEO are separate to ensure clear delineation of responsibilities. All members of key committees such as the Audit Committee, Investment Committee, Remuneration Committee, and Social, Ethics, and Sustainability Committee are independent. Oversight of board composition is delegated to the Nominating and Governance Committee, which regularly evaluates board diversity, tenure, rotation, and independence of non-executive directors. The Nominating and Governance Committee has robustly tested, through an independent evaluation the independence of all non- executive directors in the year under review. Recognising the evolving discourse on the tenure of independent non-executive directors, the Nominating and Governance Committee acknowledges both the benefits of long-serving directors in providing expertise and stability, as well as the importance of refreshing the board's perspective through periodic inclusion of new members. Engaging with shareholders and conducting an assessment of our governance framework, the Board has endorsed a policy on director independence. This policy strikes a balance between introducing fresh perspectives, succession planning, maintaining board expertise, and ensuring continuity of experience. The policy stipulates that to be deemed independent, a director's cumulative tenure must not exceed 12 years from their initial appointment. This approach aims to foster a board composition that promotes ongoing renewal while leveraging the valuable expertise and stability provided by experienced directors. To this end, the Board announced during 2023, the following changes (effective 1 January 2024) to the composition of its board committees: • Mr Harry Kenyon-Slaney was appointed as Lead Independent Director, Chair of the Risk Committee effective and member of the Nominating and Governance Committee with effect from 1 May 2024 • Mr Jerry Vilakazi was appointed Chair of the Safety and Health Committee • Dr Elaine Dorward-King was appointed Chair of the Social, Ethics and Sustainability Committee • Mr Keith Rayner was appointed chair of the Investment Committee CORPORATE GOVERNANCE continued IR - 25 The Corporate governance framework presents a governance picture of the new regions in the shape of a diamond Based on the assessment of the 16 governance elements, it has been determined that the regions are effectively governed, and their governance framework is both efficient and transparent, meeting Group and global standards. All assessed areas have been marked as green, indicating strong performance. However, there are a few amber areas identified, signalling areas for improvement. These amber areas are slated for implementation by the end of 2024, ensuring continued enhancement and alignment with best practices in governance.

• In addition to the changes above, Mr Nkosemntu Nika and Ms Susan van der Merwe will retire at the 2024 Annual General Meeting (AGM) These changes were necessitated by six non-executive directors’ tenure with the Board exceeding nine years and in order to manage a smooth transition to a more balanced profile that ensures that independence is maintained and compliance to the 12 year policy. In addition to the above changes, the Board announced the following further changes: • Ms Savannah Danson resigned from the Board on 11 March 2024 • Harry Kenyon-Slaney was appointed as member of the Nominating and Governance Committee on 11 March 2024 • Philippe François Marie-Joseph Boisseau who was appointed on 8 April 2024 who is eligible and available for election will stand for election at the 2024 AGM In light of the announced changes to various Board committees, which impact the skill sets and gender targets, the Board through its recruitment process will identify suitable replacements and stakeholders will be promptly informed once these appointments have been made. The Board through the Nominating and Governance Committee together with the Board recruitment subcommittee assisted by an external expert research team has rigorously been searching and interviewing candidates with the following skills: • Upstream background: Global mining executive with an understanding of international reputation with operating experience across the relevant metal types • Candidates with downstream background with deep understanding of customers and markets across the battery metal value chain • Candidates with energy transition background with a deep understanding of the energy transition and climate/ decarbonisation as an investment theme. Inclusive of low carbon energy sources and energy as a service business model understanding • Specialist technical background Given the Group’s varied regions of operation, and our commitment to diversity and inclusion, the Board has a policy wherein the directors are diverse in academic qualifications, industry knowledge, age, culture, experience, race and gender. The Board treats each individual on the merits of their contribution to the organisation and their sincerity in performing their duties, and as policy of the Board no one individual has unfettered decision- making power. Diversity of members’ background, experience and group (race and gender) identity, helps to ensure a range of views at Board and sub-committee meetings. The Board adopted the Mining Charter III race and gender targets, by which the Board should comprise a minimum of 50% HDPs, 20% of whom should be women. On 31 December 2023, the female representation on the Board is at 31% and HDP is 46%. A Diversity equity and inclusion council (DEIC) was established by management in 2022 and has been accelerating practices which reflect an inclusive business. (See Empowering our workforce, page 155). The Social, Ethics and Sustainability Committee continued to focus on WiM, and on promoting women in management and executive leadership. Governance structures, effective control and delegation Board committee structures The Board Charter is reviewed annually and is aligned with relevant legislation and listings requirements in South Africa, the US and global best practices in governance. See www.sibanyestillwater.com/about-us/governance We have the required board committees and relevant membership as recommended in King IV, the NYSE Listed Company Manual and the JSE. More information on the board committees, responsibilities, members and attendance to meetings is contained in Detail about board committees, page 272. The composition of board committees, and the distribution of authority between the chair and other directors, is balanced, and dynamics are participative. Members can comfortably challenge each other when there are divergent views. The Board encourages clear decision-making and maintains a vigilant approach to corporate governance and risk management. The Audit Committee is satisfied that the auditor (comprising the external audit firm and audit engagement partner) is independent. We are aligned to section 23 of the Sarbanes-Oxley Act and Section 92 of the Companies Act 71 of 2008 which stipulates that the designated auditor must rotate after five years. To this end, the Audit Committee has conducted a thorough review and has approved the replacement of the designated individual partner, Lance Ian Neame Tomlinson, with Allister Carshagen. Following scrutiny, the Audit Committee is content with the summary of outcomes from the designated auditor's latest Internal Quality Review, the Auditor Suitability Review and a comprehensive assessment of the independence of the designated auditor, as well as the summary and results of all legal and disciplinary proceedings concluded within the past five years. The CFO is responsible for the finance function. Internal audit is predominantly in-sourced, with consultants assisting as and when required. The CFO is responsible for the administration of the Internal audit department. The Chief Audit Executive (CAE) reports into the Audit Committee Chair. The effectiveness of the CFO function and that of the CAE is annually assessed by the Audit Committee. In terms of Para 3.84(g)(i) of the JSE Listings Requirements, the Audit Committee noted that it was satisfied that the CFO has the appropriate expertise and experience to fulfil his role. The Committee was also satisfied with the performance of the finance function as per King IV. The Internal audit function is externally reviewed every five years as per the Global Internal Audit StandardsTM, with the next review expected to be performed in 2026. The last review was conducted by PWC in 2021 and a rating of Generally Conforms against the Institute of Internal Auditors Standards was achieved. In terms of King IV, Principle 15, Recommended Practice 52, the Committee was satisfied that the CAE has the necessary competence, gravitas and objectivity. The Board, assisted by the Social, Ethics and Sustainability Committee and the Safety and Health Committee has oversight of ESG, climate change-related matters, and stakeholder engagement. We have dedicated executive roles for stakeholder engagement across the regions. In interacting with stakeholders we are guided by the Code of ethics and by our Stakeholder engagement policy statement. CORPORATE GOVERNANCE continued IR - 26

See Engaging with our stakeholders, page 71 and Managing our risks and opportunities within the external operating environment, page 51. Our Memorandum of incorporation does not contain restrictions to shareholder voting rights. The Board ensures that reports issued by the Group are accurate and helpful to stakeholders in assessing our performance and future prospects. The Board has mandated the CEO through the Disclosure Committee to review and approve all regulatory announcements, media releases, fact sheets, investor presentations and similar disclosures. The Disclosure Committee also monitors all means of disclosure. A detailed mandate outlines the delegation of authority and approvals framework. This indicates matters reserved for the Board, its committees and management. The Board is satisfied that delegation to management contributes to an effective arrangement by which authority and responsibilities are exercised. The mandate is reviewed annually. In developing our Integrated report, we are guided by the Value Reporting Foundation’s <IR> Framework, and we aim to report on the various components of value creation and value depletion. This includes our business model and strategy, how we respond to our external environment, risks and opportunities, how we respond to the needs and interests of our key stakeholders, our activities and performance, and our outlook in the medium to long term. The Audit Committee reviews the Integrated report and recommends it to the Board for approval, as it does with the Annual financial statements, King IV disclosures and other assurance reports. The Board oversees and monitors performance and delivery in the strategic focus areas, and in so doing takes accountability for the Group’s performance. Related reporting is also overseen and approved by the Board. All the Group’s reporting is available at www.sibanyestillwater.com/news-investors/reports/annual We commit to providing the investment community with clear, concise, accurate and timely information on our operations, and to providing financial performance that informs stakeholders as to how value was enhanced or depleted across the six capitals. We further commit to listening to our stakeholders and undertake continued engagement with stakeholders. This report, our primary report on shared value creation, demonstrates the Board’s integrated thinking and has been reviewed and approved by the Board. Policy on outside directorships and overboarding (serving on an excessive number of boards) It is accepted and acknowledged that independent non- executive directors (INED) may have business interests other than those of Sibanye-Stillwater. Any director is, while holding office at Sibanye-Stillwater, at liberty to accept other board appointments so long as the appointments are not in conflict with the business and approved strategy of Sibanye-Stillwater and do not materially interfere with his/her performance as an INED of the Group. All appointments must first be discussed with the Chairman of the Board before being accepted. Full compliance with the obligations of directors in connection with conflicts of interests and overboarding, as provided for in the Companies Act and corporate governance principles, is expected of all directors. As part of the vetting process for directors, a professional commitment and a statement that he/she has sufficient time available to carry out INED responsibilities to Sibanye-Stillwater is required. This is a contractual arrangement that is monitored through performance reviews. INEDs have provided the Company with this statement. Furthermore, the requirement for directors to provide a professional commitment statement and assurance of sufficient time availability aligns with governance expectations set by governance principles outlined by King IV, JSE, and NYSE requirements. This ensures that directors can effectively fulfil their responsibilities to Sibanye- Stillwater while engaging in outside business interests. Overall, Sibanye-Stillwater's policy demonstrates a commitment to transparency, accountability, and effective governance practices in line with the expectations of King IV, the JSE Listing requirements, and NYSE regulations. Board effectiveness and performance evaluations In line with Principle 9 of King IV, good governance requires that the Board schedules regular opportunities to have its effective performance reviewed by an external evaluator, with every two years considered an appropriate frequency. The 2023 external Board evaluation indicated that the Board is operating effectively, and that most aspects of the Board’s performance meet expectations, with only a few areas identified for improvement, being: • Dedicated discussions on strategy to ensure thorough examination and alignment with organisational objectives • Stakeholder engagements: more intensive stakeholder engagements would aid in enhancing shareholder understanding of the organisation's strategy, particularly regarding the impact of commodity prices Additionally, the Committees of the Board were recognised for functioning effectively and contributing positively to the overall governance framework. Through the external Board evaluation process, the directors conducted a review of the performance of the Company Secretary, as required by paragraph 3.84 (h) of the JSE Listings Requirements. In accordance with this provision, the Board of Directors carefully assessed and ensured the competence, qualifications, and experience of the Company Secretary. As part of its responsibilities, the Board has incorporated into its work plan a training opportunity aimed at understanding climate-related risks and opportunities. This initiative aims to equip directors with a foundational understanding of climate science, regulatory frameworks, industry trends, and emerging best practices related to climate change. By building competence in climate change matters through board education and expertise recruitment, the Board endeavours to enhance its ability to effectively address climate-related challenges and opportunities. Furthermore, the Board acknowledges that this responsibility is shared with the Social, Ethics, and Sustainability Committee. Collaboratively, both entities will work towards ensuring that the Board maintains a high level of knowledge and competence in climate change matters. In the long term, the Board aims to conduct evaluations to assess its members' proficiency and expertise in climate change-related issues, thereby reinforcing its commitment to sustainable and responsible governance. CORPORATE GOVERNANCE continued IR - 27

Competence on sustainability ESG and sustainability are of material importance to the Group. Where appropriate, training sessions are conducted to provide directors with a more detailed understanding of ESG and sustainability issues. During 2023, an in-depth separate engagement on climate change disclosure practices were provided to the members of the Board. During the engagement, progress on TCFD, as well as global disclosure requirements were discussed as well as an update on the energy and decarbonisation strategy was provided. See the Climate change supplement, www.sibanyestillwater.com/news-investors/reports/annual/. In accordance with the ICMM and the GISTM, the Board of Directors is the final decision-making authority on issues relating to tailings management. To satisfy the GISTM requirements, one or more members of the Board need to have an understanding of tailings storage facilities risks, and the controls required to manage, monitor and mitigate the risks. Two directors on our Board qualify for this stipulation. See www.sibanyestillwater.com/about-us/governance/ Succession planning As part of the Board's ongoing evolution process and proactive measures to ensure compliance with independence requirements and good governance standards, the Board continued its discussions regarding Board evolution and succession planning in 2023. This process aims to facilitate a smooth transition to a more balanced profile while upholding independence, with particular focus on the succession of the Chairman of the Board and the CEO. Regarding the Chairman, Sibanye-Stillwater has established a retirement age for directors, with the approved age being 72 years. However, the Board reserves the right to extend this age limit to 75, provided that the director is available and fit to carry out their duties. In 2024, Dr Maphai reached the age of 72, and given his availability and continued ability to fulfil his duties, the Board expressed satisfaction with his performance and leadership. Consequently, the Board resolved to extend Dr Maphai's term for one year, with further extensions subject to annual review. Regarding the CEO, the Board is content with the CEO's performance against agreed-upon measures and targets. Additionally, the Remuneration Committee conducted an annual review of the CEO's dual services arrangements and approved the continuation into the ensuing year. Although the Board contemplates extending the CEO’s tenure beyond his normal retirement age, a priority area for the Board in 2023 was the implementation of a comprehensive CEO succession plan. This plan is being developed with the assistance of an external service provider and will be communicated to stakeholders once formalised. These evaluations and succession planning measures undertaken by the Board underscore its unwavering commitment to upholding governance standards and ensuring that key roles within the organisation are filled by individuals with the requisite skills and expertise. By conducting thorough evaluations and succession planning processes, the Board demonstrates its dedication to ensuring the effectiveness of its leadership team. Moreover, these initiatives reflect the Board's proactive approach to planning for continuity and succession in key positions, thereby safeguarding the organisation's long-term sustainability and success. Overall, these efforts serve to strengthen governance practices and enhance organisational resilience. CORPORATE GOVERNANCE continued IR - 28 Key areas of Board deliberation in 2023 • Focus on the Strategic Essentials • Embedding ESG • Oversight of ethical and values-driven culture • Supervision of safe production strategy • Implementation of the Board external evaluation recommendations • Safety performance and embedding the safe production strategy • Approval of proactive initiatives implemented to protect and strengthen the Balance Sheet • Driving innovative market development Planned areas of focus for 2024 • Conclusion of the CEO succession planning • Continued review of the Board evolution process • Continued embedding of the strategic differentiators • Continue driving innovative market development • Protect and strengthen the Balance Sheet

FUNCTIONAL GOVERNANCE AREAS ––––––––––––––––––––––––––––––––––––––––––––––––––––––––––––––––––––––––––––––––––––––––––––––––––––––––––––––––––––––––––––––––––––––– Risk management Responsible governance entity: Audit Committee and Risk Committee The Board, in line with Principle 15 of King IV, is the guardian of assurance, ensuring that assurance services and functions create an effective control environment. These services also underpin the integrity of information used for internal decision-making and the organisation's external reports. Assurance structure The Risk Management department designs the combined assurance model, while its implementation is overseen by the Audit Committee. Risk Management is responsible for communicating key risks and material issues to the Risk Committee and the Audit Committee. Materiality and reporting Our Strategic risk register, complemented by operational risk registers, harmonises risks with material issues and our strategic goals. It serves as the primary reference for organisational reporting purposes. The combined assurance model for strategic risks and controls is presented to the Risk Committee annually for review. Committee synergy The Audit Committee chairman also serves as a member of the Risk Committee. This cross-referencing promotes more effective oversight of risks. King IV recommends that the governing body should consider having one or more members that have joint membership on both committees as this will assist in more effective functioning in both committees. Four members of both the Audit Committee and Risk Committee serve on both Committees. Sarbanes-Oxley Act (SOX) compliance We've identified and implemented controls related to Financial reporting risks, ensuring the integrity of our internal control over financial reporting for the Group. With respect to the financial year ended 31 December 2023, management has identified a material weakness in internal control over financial reporting due to design and operating deficiencies which resulted from insufficient evidence of management review and performance of control procedures, including the level of precision in the execution of controls and procedures to ascertain completeness and accuracy of information produced by the company. These deficiencies impacted cash and cash equivalents in the South African region and platinum group metals inventory in process at the smelter at Western Platinum Proprietary Limited and Stillwater Mining Company. The material weakness did not result in a misstatement in respect of the initial consolidated financial information, the condensed consolidated financial statements for the year ended and as of 31 December 2023 distributed to shareholders on 5 March 2024 as required by JSE Listings Requirements, the Annual Financial Report for the year ended and as of 31 December 2023. Management strives to continuously improve the diligence in the identification and documentation of key controls. Management initiated remedial measures to further enhance its processes and controls over financial reporting and is actively engaged to formulate a comprehensive plan for remediation of the material weakness. Management conducts quarterly SOX self-assessments, forming the basis for SOX certification. These certifications are independently verified by external auditors. Sustainability assurance Both internal and external audit functions adopt a combined assurance model for auditing sustainability Key Performance Indicators (KPIs), which are subject to annual assurance reviews. Assurance Responsible governance entity: Audit Committee and Risk Committee CORPORATE GOVERNANCE continued IR - 29 For more detail on our 2023 risks and opportunities, see Managing our risks and opportunities within the external environment, page 51. Also see “Risk factors” in our Form 20-F, at www.sibanyestillwater.com/news-investors/reports/annual

Assurance levels Assurance levels are grouped as per the below diagram: Regulatory compliance Responsible governance entity: all Board Committees CORPORATE GOVERNANCE continued IR - 30 Line functions that own and manage risk • Policies and procedures • Control Frameworks • SOX management self-assessment • Delegation of authority • Management reviews and monitoring • Periodic self-assessment • Cyber security assessments Internal specialist functions providing oversight • Risk management • Regulatory compliance • Legal • Group ICT • Group tax • SOX compliance • Company secretary • Safety inspections Internal assurance providers • Internal audit • Protection Services Forensic Investigators External assurance providers • External financial assurance • External assurance of selected sustainability indicators • Tailings management technical specialist assurance • Water management technical assurance • LPPM,1 responsible platinum and palladium external assurance • ISO certifications / IRMA / ICMM / WGC RGMP2 Regulatory inspectors and oversight bodies • Minerals Council • National, provincial and local Government department inspections, for example in South Africa the Department of Mineral Resources and Energy; Department of Water, Safety inspections , Receiver of Revenue; in Australia Department of Environment, Science and Innovation, Resources Safety and Health Queensland and Revenue Services in all our regions • Board subcommittees and governance committees 1 London Platinum and Palladium Market (LPPM) 2 International standards organisation (ISO), Initiative for Responsible Mining Assurance (IRMA), International Council on Mining and Metals (ICMM), World Gold Council Responsible Gold Mining Principles (WGC RGMP) LE V EL S O F A SS U RA N C E

OVERVIEW • Dedicated compliance officers at our US and SA operations directly monitor non-compliance • The European region uses external legal advisors to ensure compliance with relevant laws • The Company is operating in conformity with its Memorandum of Incorporation and complies with the provisions of the Companies Act (South Africa) RESPONSIBILITIES • Responsible functional departments handle legislative and regulatory compliance – Regional compliance functions support by simplifying laws and notifying management of legislative changes – The compliance function manages compliance risk by distributing a compliance methodology – It compiles regulatory compliance risk profiles and offers advice on strategic compliance issues • At the US PGM operations, a Compliance committee that includes site and service Group leadership meets quarterly to discuss recent developments and to strategise for the upcoming quarter MONITORING • Compliance risk profiling of applicable legislation was conducted with relevant departments. • Based on the outcome of the Compliance Risk profile sessions, the following legislation has been identified as critical to Sibanye- Stillwater SA region (i.e., non-compliance may potentially lead to the revocation of our licence to operate, and/or significant financial loss or reputational damage): – SA region – Mine Health and Safety Act 29 of 1996 and the Mineral and Petroleum Resources Development Act 28 of 2002 – National Environmental Management Act 107 of 1998 and National Environmental Management: Air Quality Act 39 of 2004 – National Environmental Management: Waste Act 59 of 2008 and the National Water Act 36 of 1998 – Hazardous Substances Act 15 of 1973 and Explosives Act 13 of 1956 • Finland – Environmental Protection Act (57/2014). Water Act (587/2011) and Waste Act (646/2011) – Nature Conservation Act (1096/1996) and Dam Safety Act (494/2009) – Act on the Safe Handling and Storage of Dangerous Chemicals and Explosives (390/2005). and Rescue Act (379/2011) – Occupational Safety Act (738/2002) and Government Decree on the Safety of Construction Work (2005/2009) – Mining Act (621/2011), GDPR and The Data Protection Act (1050/2018) (based on General Data Protection Regulation (EU) 2016/679) • AUS region – Work Health and Safety Act 2011 (Cth) – Mining and Quarrying Safety and Health Act 1999 (Qld) – Mineral Resources Act 1989 (Qld) – Environmental Protection Act 1994 (Qld) – Mineral Resources Development Act 1995 (Tas) – Environmental Management and Pollution Control Act 1994 (Tas) – Mines Work Health and Safety (Supplementary Requirements) Act 2012 • Other key legislation includes: – Compensation for Occupational Injuries and Diseases Act 130 of 1993 – Occupational Disease in Mines and Works Act 78 of 1973 – National Environmental Management Biodiversity Act 10 of 2004 – Protection of Personal Information Act 4 of 2013 – Carbon Tax Act 15 of 2019 – The Financial Intelligence Centre Act No 38 of 2001 • The following are critical to our US PGM operations: Montana Metal Mine Reclamation Act and Federal Mine Safety and Health Act COMPLIANCE • We have refined our monitoring system to track fines and penalties. There were no material or repeated regulatory penalties, sanctions or fines for contraventions of, or non-compliance with, legislative or regulatory obligations in 2023 KEY CHANGES • 2023 Regulatory updates: – In 2023 there were 617 updates to laws, regulations, supervisory, and other requirements affecting the SA region. This represents a decrease from 778 updates in 2022 CORPORATE GOVERNANCE continued IR - 31

Biannual profiling • Biannual profiling, although not mandated by regulations, is adopted to track laws and regulations • The primary objective is to assign accountability and responsibility for compliance commitments • Regulatory risk profiles highlight areas of weakness • Departmental management assesses risk within their department and contribute to the compliance risk profile sessions Threats to our licence to operate In 2023 no material issues posed a significant risk of license revocation. Specific regulatory areas are closely monitored, including: • Mining Charter • Carbon Tax Act (2019) • Companies Second Amendment Bill (2023) • The JSE Listings Requirements • South Africa’s Companies Act 71 of 2008, as amended • Climate Change Bill (2022) • National Health Insurance Bill (2019) in South Africa • National Water Act (1998) • National Water Amendment Act (2014) • Procedural Requirements for the Water Use Licence Applications and Appeals (Regulations) • Financial Intelligence Centre Act No 38 of 2001 • Montana Metal Mine Reclamation Act • Federal Mine Safety and Health Act (1977) • Occupational Safety and Health Act (1970) • Clean Water Act (1972) • Clean Air Act (1970) in the US On 6 March 2024, the SEC adopted rules (The Enhancement and Standardization of Climate-Related Disclosures for Investors” to enhance and standardise climate related disclosures by public companies beginning with annual reports for the year ending 31 December 2025. The rules increase transparency and aim to provide consistent, comparable information for investors requiring registrants, to disclose “any climate-related risks that have materially impacted or are reasonably likely to have a material impact on the registrant, including on its business strategy, results of operations, or financial conditions.” The SOX Compliance Office and management will be working on an action plan to meet the requirements of the rule. The EU’s Corporate Sustainability Reporting Directive (effective January 2023 for reporting in 2024) has added areas of information by which companies must disclose on climate impact. In June 2023 the International Sustainability Standards Board (an independent organisation) issued standards for disclosing climate-related issues. Information governance During the year we commissioned Hannes Snellman Attorneys to assess our compliance with the GDPR (Europe’s data privacy and security law) and in-country privacy legislation for the European region. Recommendations are in the process of being implemented and is expected to be completed during 2024. After implementation of GDPR requirements in the European region, focus will move to the Australian region to assess compliance with the Australian Privacy Act. We are compliant with jurisdictional legislation in the Southern African region and have introduced measures to safeguard the integrity and confidentiality of personally identifiable information. Technology and information Responsible governance entity: Audit Committee and Risk Committee Our ICT governance framework is aligned to COBIT 5 and ISO 27001. Our ICT risk governance framework and strategy is reviewed annually and was approved for 2023. Our Group ICT charter, aligned with King IV and ISO 27001, was approved by the Audit Committee, and is reviewed annually. Operationally, the CFO, supported by executive management, provides high-level direction for our ICT strategy. The SA, EU, AUS and US operations each have a dedicated ICT manager, all of whom report into the Group ICT function. Oversight is provided by the Audit Committee, with the Board having ultimate responsibility. The Risk Committee monitors and provides oversight of identified ICT risks. See Harnessing innovation, page 171. Remuneration Responsible governance entity: Remuneration Committee supported by other specialist committees Sibanye-Stillwater is committed to rewarding and encouraging ethical leadership. Our remuneration incentive framework includes targets for safety improvement and ESG performance. See Remuneration report for various ways in which safety and ESG performance affects remuneration outcomes, from page 253. CORPORATE GOVERNANCE continued IR - 32

### ### Our purpose, vision, strategy and values - a summary 34 External environment for our business and operations 36 Unpacking our three-dimensional strategy 48 Managing our risks and opportunities within the external environment 51 How strategy interfaces with risks and opportunities 69 Engaging with our stakeholders 71 How we create value: our business model 80 Capital trade-offs: strategic management for shared value 84 IR - 33 WHAT DRIVES US 2

OUR PURPOSE, VISION, STRATEGY AND VALUES OUR PURPOSE TO SAFEGUARD GLOBAL SUSTAINABILITY THROUGH OUR METALS This purpose statement reflects our aspiration to make a positive social and environmental impact through the commodities we mine and produce (green metals) and how we do so (ESG embedded as the way we do business), not least through our role in contributing to decarbonising the global economy. OUR VISION TO BE A LEADER IN SUPERIOR SHARED VALUE FOR ALL STAKEHOLDERS This vision statement speaks to our conviction that responsibly-derived minerals (mining that minimises harm to people and the planet) are the source of significant economic, social and environmental benefit to society, both globally and locally. OUR STRATEGY Our strategy speaks to our ambition to secure for the Group a position in the global resources sector as a progressive, forward-thinking provider of green metals and energy solutions. Our strategy has a three-dimensional approach, in which our priorities are layered in terms of: strategic foundation; strategic essentials; strategic differentiators. We unpack our strategy on page 48 of this report. THE CONTEXT FOR OUR STRATEGY ––––––––––––––––––––––––––––––––––––––––––––––––––––––––––––––––––––––––––––––––––––––––––––––––––––––––––––––––––––––––––––––––––––––– In a world with increasing volatility and an accelerating pace of change, we recognise that the future is inherently uncertain with levels of strategic risk elevating. This is the basis of both threats and opportunities for our business. Anticipation through monitoring of early signals combined with agility in positioning of the business using anti-fragility principles enables us to seize advantage through active engagement with critical risks, (see External environment for our business and operations on page 36) • Decarbonisation is a key concern for governments and business across the world. In response, the world’s energy mix is moving towards reduced greenhouse gas (GHG) emissions. We expect that current trends toward nuclear power, renewable energy (wind, solar, battery storage), green hydrogen, and the electrification of mobility, will intensify. Our response is to build a Unique portfolio of green metals and energy solutions that reverse climate change, contributing towards the world’s critical needs • Geopolitical developments are changing allegiances and trading patterns across the world, with national elections scheduled to take place in 64 countries in 2024 likely to further impact foreign policies and geopolitics. Security of supply is becoming a stronger priority, for nations and for regional blocs, with the integrity of critical minerals value chains of significant importance. This presents key opportunities for the Group to differentiate its offer, partnering to Build pandemic-resilient ecosystems that are invulnerable to geopolitical developments • Intelligent advances are accelerating, with digital technologies fulfilling an increasing role in every facet of life. Rapid advances in artificial intelligence provide massive transformative opportunities, while also raising a new spectrum of ethical issues. This presents opportunities to “rewire” our business to embrace new capabilities and augment human performance through technology taking key business outcomes to a different level. We are committed to our quest to become Inclusive, diverse and bionic as a strategic differentiator • While divisions are starting to emerge, stakeholder expectations of business are placing continued high levels of scrutiny on ESG and sustainability credentials. We believe that the most successful businesses will be those that earn stakeholder credibility by demonstrating meaningful socioeconomic purpose beyond the delivery of returns to their shareholders. We recognise this as an opportunity to distinguish ourselves in the market by being Recognised as a force for good, and thereby strategically differentiating ourselves by creating superior shared value through our business activities. This underscores our commitment to stakeholder capitalism We use the term “grey elephants” (see the next page for more detail) to refer to highly-probable, high-impact, yet often neglected catalysts of change that are shaping the 2020s; events with global repercussions, such as the COVID-19 pandemic, Russia’s invasion of Ukraine, and the conflicts in the Middle East. While the grey elephants signal disruption and threat to conventional business activity, they also present significant opportunities for organisations that embrace the future, and are bold and agile enough to capture the moment. Early awareness of grey elephants and decisive strategic responses are required to sustain business effectiveness. OUR PURPOSE, VISION, STRATEGY AND VALUES IR - 34

OUR PURPOSE, VISION, STRATEGY AND VALUES continued IR - 35 Future trends identified – as illustrated by the grey elephants: We have been tracking how the grey elephants are shaping the context for our business since our 2020 integrated report. The grey elephants cover seven major global trends that we expect to have a pronounced impact on the fabric of global society and the global economy. Acute disruptive events with global implications, which we have characterised as pandemics, are an important additional component of the grey elephant framework. Such events have a dramatic impact on society and the economy, creating conditions conducive to change and stimulating acceleration in the major global trends represented by the other grey elephants. The graphic below identifies how the grey elephants have played out in 2023, with a focus on aspects of relevance to our business activities. These developments validate the grey elephants as a compelling framework through which to anticipate the future world in which we will operate and conduct business, assisting us in remaining relevant to future conditions. Economies are not responding in the expected way to central bank interventions with strong economic activity continuing despite high interest rate environments. This is one of the key factors causing distortions in commodity markets. Departures from traditional demographic age profiles are influencing national competitiveness in many parts of the world with associated changes in social dynamics. 2023 was the warmest year on record with an increasing number of extreme weather events and sustained shifts in local climates. Impetus towards establishment of a global clean energy economy is building. Sentiment is divided on whether commercial incentives are a key element in catalysing social advancement by stimulating economic growth through at risk investment that promotes innovation. The most successful economies are those that recognise the value generated by private capital with an ability to earn strong financial returns coupled with a commitment to sustainability. Confidence in the supply of critical resources is under threat with increasing disruption to global supply chains. As a result, many nations are seeking to reduce dependence on dominant sources and gain control of their own assured supply channels. The voice of society is becoming stronger fuelled, despite censorship, by abundant availability of information much of which is unverified or propagated by influencers through social media. While national elections will take place in a record 64 countries in 2024, alternative platforms for expression are increasingly being utilised. Allegiances are shifting in response to geopolitical developments and as foreign policies evolve across the world with significant implications for critical minerals supply chains. Many African countries are in a unique position as part of a non- aligned region with relatively undeveloped significant mineral resources. Generative artificial intelligence emerged into general application in 2023 with adoption at an unprecedented rate. These developments have profound implication with business needing to establish frameworks for responsible use to leverage benefits of the technology. Adapting culture and strategy to navigate the grey elephants sharply transforming the world

EXTERNAL ENVIRONMENT FOR OUR BUSINESS AND OPERATIONS DEVELOPMENTS IN THE EXTERNAL ENVIRONMENT –––––––––––––––––––––––––––––––––––––––––––––––––––––––––––––––––– This section expands on the summary statements on the impact of the grey elephants, providing an overview of critical factors that are creating current and future context for Sibanye-Stillwater. This perspective helps us understand how strategic risks are evolving and creating a combination of threats and opportunities for our business. As expected, the world is being subjected to ever-more dynamic change as we move through the 2020s, requiring agility to capitalise on the opportunities that present themselves, as well as the evolving threats that need to be managed. The 2023 year was the warmest on record, maintaining a trend that has become established over recent years. This has been perceived as more frequent extreme weather events with higher potential for increased asset damage and business interruption. Detailed work to individual asset level ensures that we have accurate understanding under a range of future scenarios with ability to apply optimised measures to safeguard the business. The changes are also resulting in the evolution local climate conditions, which we must consider in our operational planning and design. While the physical risks related to climate change are important, transition risks are becoming more prominent as policy evolves across many spheres to promote clean energy more aggressively and consumer preferences lean more toward environmentally- friendly and sustainable products. The global economy continued to be under considerable pressure during the year under review as the protracted war on inflation by central banks in western economies continued with higher interest rates and inflation remaining stubbornly high. While economic growth has surpassed expectations under these circumstances, key commodity markets have come under significant pressure. Indications are that interest rates have now peaked with a loosening cycle to commence during 2024. While a delicate balance is required to avoid economic instability, signs are promising that recession will be avoided in western economies. The Chinese economy is also starting to adopt stimulus measures to reignite growth, which has been sluggish. The termination of the zero Covid policy has had positive implications for commodity demand. China is pursuing aggressive strategies around vehicle electrification by leveraging its dominance in battery metals processing to support a growing export trade of more cost-effective electric vehicles with lower performance mainly for the mass market segment with its domestic market not fully absorbing production. These initiatives are being countered by intensifying measures to promote establishment of regional supply chains for critical minerals in western economies. Political developments, with national elections taking place in 64 countries in 2024, are likely to result in amended policy trajectories and new allegiances being formed. These trade developments are taking place in a world where global supply chains are experiencing substantial reconfiguration in response to geopolitical developments. With restrictions imposed on supply from Russia into western economies, trade flows have diverted through the east. Instability in the Middle East triggered by the Israel/Palestine conflict is lengthening critical trade routes coupled with reduced capacity in the Panama Canal due to shortages of available water. Africa, as a non-aligned region of the world with substantial undeveloped green mineral resources, has significant potential to participate in the evolving trade patterns with eastern and western economies seeking to establish partnerships that will secure access to critical minerals. Despite these ongoing significant developments, supply concerns were alleviated during 2023 as greater certainty on future world trade flows emerged allowing for substantial destocking within the PGM value chain. While electrification of vehicle fleets continues to progress, obstacles to the accelerated adoption of battery-electric vehicles (BEVs) are starting to emerge. These include cost of ownership considerations, insurance premiums and resale values, range anxiety and charging times especially in expansive geographies, reliability under adverse weather conditions, and the availability in the longer term of critical battery metals. While most of these challenges will eventually be resolved, they will inhibit the rate of adoption of BEVs with hybrids starting to be recognised as a credible pathway to secure decarbonisation. This is expected to increase the proportion of vehicles incorporating autocatalysts above most recent analyst projections requiring greater uptake of PGMs. With substantial recognition among stakeholders of minerals as a critical contributor to decarbonisation of the world economy, and given the growing awareness that mining is uniquely positioned to bring economic activity into areas that are not well catered for by other economic sectors, significant developments are taking place around standards for responsible mining. With the proliferation of sustainability frameworks creating confusion, a quest has been launched by four of the major global mining associations to create a simplified, coherent standards landscape that has support and involvement across the broad range of stakeholders with interests in how mining is conducted. By alleviating unhelpful administrative burdens, it is expected that greater energy will be focused on EXTERNAL ENVIRONMENT FOR OUR BUSINESS AND OPERATIONS IR - 36

maximising the positive benefits of mining while avoiding social and environmental harm. Challenging operating conditions continue to be experienced across the corporation’s global operations with substantial variability in the factors of influence across the regions. Some of the more significant issues are high inflation, shortages of employees with required skills and experience, scarcity of critical resources, and changing weather patterns. At our South African operations, modest improvements are being realised in electricity supply, transport and logistics, and combatting crime and corruption albeit from a very low base. The efforts of organised business to support government in these areas are starting to deliver progress and we have gained operating experience that allows us to more effectively mitigate the impact of public services falling short of the required standards. Material factors in our external business environment CLIMATE CHANGE Climate change increases the physical risks to our operations with potential for asset damage and business interruption through more frequent intense weather events and changed climatic conditions. While the measures taken to limit carbon emissions will impose new costs on the business unless decarbonisation efforts are effective, they will also create new business opportunities through the technologies required in a low carbon economy and the associated requirements for green minerals. Impact Our strategic response Related risks Related opportunities We continue to experience changing climatic conditions such as heat and drought along with more intense weather extremes such as flooding. This has caused asset damage and business interruptions to varying extents across our global operations with the regional flooding at Century being the most notable event of 2023. We are experiencing increased costs related to carbon emissions, though these are being mitigated through the work to decarbonise our operations. The technology transition required to fight the war on global warming will create substantial new business opportunities in green metals and energy solutions with PGMs retaining sustained future relevance. Technologies for the low carbon economy generally involve increased electrification based on the use of renewable and other carbon neutral electricity generation. The implications for commodity demand are substantial, creating new opportunities for green metals and new applications for PGMs, which will remain relevant in conventional automotive power trains for the foreseeable future. Limitations on supply of critical minerals are likely to require alternative innovative low-carbon solutions. We are working at the asset level to mitigate vulnerability to weather events and changing climatic conditions based on detailed analytical work. This includes ensuring that our tailings storage facilities will withstand changing weather. All our operations have committed to an accelerated pathway to becoming carbon neutral by 2040 in conformance with science-based targets. We are investing in appropriate technologies and innovations consistent with the circumstances in each region. Further, we have signed up to the major relevant protocols and standards on reducing GHG emissions and are committed to transparency in our disclosures on carbon emissions. While our existing portfolio of metal production is relevant to the clean energy economy, our business strategy includes building a unique portfolio of green metals and energy solutions that will be instrumental in contributing towards lowering the carbon intensity of the global economy. This includes strengthening our presence in secondary mining and recycling to complement our primary mining activities. (For a full discussion of our extensive response to climate change, See Minimising our environmental impact, page 189 and the Climate change supplement.) 2, 3 See pages 59 to 60 1, 2, 3, 6, 7 See page 67 13.2 OUTLOOK Climate change is increasingly being recognised as the most significant major threat to planet earth with more concerted efforts expected to reduce lifecycle carbon emissions through a clean energy economy. Greater pressure will be placed on producing minerals with a lower carbon footprint, which will favour secondary mining and recycling as a favoured source of minerals. There will also be increasing demand for metals with applications in the broad range of technologies involved in the clean energy economy. China’s dominance in renewable energy and battery production, and in certain strategic mineral value chains, continues to represent a major concern to western nations with measures being taken to promote the establishment of regional value chains for security of supply. EXTERNAL ENVIRONMENT FOR OUR BUSINESS AND OPERATIONS continued IR - 37

AUTOMOTIVE POWERTRAIN TRANSFORMATION Automotive powertrains are transforming from internal combustion engine domination to electrified vehicles. While the transition is accelerating stimulated by the introduction of regulation and restrictions on the average carbon intensity of manufactured vehicles, various barriers are being encountered to the take up of new technologies, among the most important of which are the range and charging times of battery-electric vehicles, costs and resale values, insurance premiums, the status of charging infrastructure, and availability of critical minerals. Hybrids are increasingly representing an effective lower-carbon alternative. Impact Our strategic response Related risks Related opportunities While the proportion of vehicles that use internal combustion engines, which includes hybrid vehicles, will progressively decline, this will be offset by increases in the overall volumes of vehicles manufactured and sold. Markets for PGMs are expected to remain relatively stable over the short to medium term, with increasing requirements for supply of battery metals to service the growing demand for electrified vehicles. We are positioning our production profile of PGMs to align with the longer-term market requirements while building up capability to service the requirements of the electrified vehicle market through meaningful participation in automotive battery value chains particularly in Europe and North America. We are also working with our partners to develop new applications for PGMs to offset an eventual decline in the autocatalyst market. 6, 8, 10 See pages 62, 64 and 66 1, 2, 5, 6 See page 67 OUTLOOK In the longer term, stronger impacts for PGM demand in vehicles with internal combustion engines can be expected, with acceleration in the introduction of battery electric vehicles as barriers to adoption are progressively eliminated. Introduction of fuel cell vehicles powered by green hydrogen especially in the heavy duty vehicle sector will create new applications, especially for platinum, with palladium and rhodium demand under greater threat. Overall, the transportation market will become more commodity intensive with a strong demand for battery metals and copper. GEOPOLITICAL DEVELOPMENTS The world trade landscape is steadily evolving due to geopolitical developments with key flashpoints triggering realignment of relationships between major economies and reconfiguration of global trade flows. Multipolarity is increasing with growing nationalism and the establishment of coherent regional supply chains driven by strong legislative incentives. Impact Our strategic response Related risks Related opportunities The most significant implication is the emerging imperative for establishment of regionally cohesive supply chains for critical minerals to counter China’s dominance in key areas. This creates opportunities to become embedded in European and US value chains, which cover automotive battery and clean energy markets. Developments are also likely to be positive for gold, which may counter increasing volatility associated with geopolitical developments. There is potential for South Africa’s affiliations in a multipolar world to impact on the Group’s trade relationships with trade partners in western economies, although Constitutional safeguards allow for distancing of the Group’s positioning. Our strategy includes a strong focus on building an anti-fragile and pandemic-resilient business that will prosper through periods of intense volatility and capture the opportunities that emerge. This thrust considers pandemics broadly catering for the broad range of trigger events that cause disruption to world order. In Europe and North America, we are building meaningful relationships with supply chain partners to ensure that supply requirements for critical minerals are met. This includes expanding our recycling operations, which offer excellent ESG performance, while contributing to the overall resilience of the Group. As a western-facing business, we are maintaining strong positive relationships with our strategic partners in western ecosystems. 6, 7, 8 See pages 62 to 64 2, 3, 4, 6 See page 67 OUTLOOK We expect to see further increases in multipolarity as strategic affiliations evolve globally and regional value chains become more prominent. The record number of elections globally in 2024, with potential for new political dispensations to come into power, may have implications for the foreign policies of major world economies affecting the geopolitical landscape. EXTERNAL ENVIRONMENT FOR OUR BUSINESS AND OPERATIONS continued IR - 38

PUBLIC AND REGULATORY ATTITUDES TO MINING Stakeholders expect that mining should be conducted responsibly, causing no harm to society or the environment. However, there is also increasing recognition that mining creates positive societal value through its economic contribution to local economies, and that critical minerals are essential for the required move towards a low-carbon economy. Policies and incentives are being introduced by governments of several major economies to promote the establishment of critical minerals supply, while stringent regulatory frameworks remain in place around the permitting of mining operations. Impact Our strategic response Related risks Related opportunities Our legitimacy to conduct our operations is derived from the state, from communities neighbouring our operations, and from society at large. We are also exposed to capital markets in the US and Europe, with stringent positions on ESG and sustainability. While conformance to stringent responsible mining standards are important to avoid environmental and societal harm, there is an equally strong imperative to demonstrate a strong flow of shared value to all stakeholders as a result of our operating and business activities. While not affording any scope for relaxation of ESG and sustainability standards, changing stakeholder attitudes towards critical and strategic minerals mitigate in favour of reduced opposition to mining permits; with regulatory support forthcoming to promote security of mineral supply. We subscribe to some of the world’s leading ESG indices and to global best practice mining standards. (See Governance in sustainability: Our considered decision- making, page 229). Priority ESG issues are well represented in our risk matrices, as is stakeholder sentiment. The performance conditions for our long-term incentive payments are weighted 20% toward ESG. Our overall brand rationale is that we are instrumental in shaping new green mineral supply chains and in creating superior shared value for all stakeholders through our activities. In terms of our newer regions of operation, we are well integrated in these ecosystems as a strategic partner who will contribute towards building supply chain security. 2, 3, 4, 7 See pages 59, 60, 61 and 63 1, 2, 3, 7 See page 67 OUTLOOK The mining standards landscape is expected to evolve, with rationalisation to address the proliferation of standards that has been experienced in recent years. Stakeholder involvement will become more pronounced in the governance of credible standards. We expect stakeholder attitudes will increasingly be shaped by the recognition that responsibly-mined minerals are necessary for a sustainable future. Regulators will promote the mining of strategic minerals, while not relaxing the requirements for responsible mining. There is also increasing expectation for corporations to demonstrate that they are contributing meaningfully towards local socioeconomic and environmental priorities in the areas in which they operate with nature positive operations becoming an increasing focus. EXTERNAL ENVIRONMENT FOR OUR BUSINESS AND OPERATIONS continued IR - 39 SAFFY SHAFT AT THE SA PGM OPERATIONS

PUBLIC SERVICES IN SOUTH AFRICA The quality of public services in South Africa continues to decline, which affects business competitiveness. The reliability of electricity supply is deteriorating, with persistent loadshedding as operational generation capacity falls short of national demand, a continued high carbon footprint and above inflation escalation in tariffs. Bulk water supply is also starting to come under pressure with more frequent shortcomings in service delivery. The country’s ports and rail network do not provide the transport and logistics services required for effective operations. While crime is driven by the social and economic context, state machinery is proving ineffective in combatting crime and corruption. Impact Our strategic response Related risks Related opportunities Shortcomings in public service delivery are having an adverse effect on business competitiveness causing significant production losses and a need to incur additional expenditure to compensate. Electricity and crime are the major factors, although transport issues are material for our chrome business. In addition to the operational and cost implications, the high carbon footprint of our mineral production that is predominantly driven by the carbon intensity of the national electricity supply impacts negatively on the global acceptability of our products. Through organised business associations, we are working with government to address the shortcomings that detract from the quality of key public services and to press for reform that would allow greater private sector involvement in service delivery. In parallel, where legislation allows, we are implementing projects to address our own requirements for services. Most critically, we are commissioning several private power projects to supply renewable energy to our operations. (See Minimising our environmental impact, page 193 and the Climate change supplement, www.sibanyestillwater.com/news-investors/ reports/annual/). In addition, we are steadily improving our protocols for energy management that reduce impact on the business arising from load curtailment. Additionally, we are making headway in combatting the impact of crime through more effective security management that preserves the integrity of our assets and secures greater operational continuity. (See the Combating Illegal mining fact sheet, www.sibanyestillwater.com/news-investors/ reports/annual/. 1, 4 See pages 58 and 61 1, 5 See page 67 OUTLOOK Although there is reluctance from the current government to implement meaningful reforms that will strengthen state control on the delivery of public services, there are signs of meaningful progress in addressing the challenges of service delivery that are being enabled through the private sector. In the electricity area, several major power stations are recovering from long-term periods of unavailability over the next one to two years with new initiatives contemplated to strengthen the transmission grid permitting accelerated introduction of renewables that can provide low carbon electricity at more cost-effective lifecycle pricing. The outcome of the forthcoming national election in 2024 will be critical in setting political direction around the provision of public services. EXTERNAL ENVIRONMENT FOR OUR BUSINESS AND OPERATIONS continued IR - 40 WONDERKOP WASTEWATER TREATMENT WORKS AT SA PGM OPERATIONS

SOCIOPOLITICAL INSTABILITY IN SOUTH AFRICA Challenging social conditions and inequality that have arisen from prolonged periods of low national economic growth and unemployment have created a volatile social context. These factors create an environment that is prone to social protests, which sometimes become violent, and are conducive to high levels of criminal activity, including the proliferation of organised criminal syndicates. The country is also in the midst of political transition to multi-party politics as support for the ruling party has declined to its lowest levels since the start of the democratic era. Institutional capacity of the state to drive the national strategy of developmental growth has correspondingly been eroded. Impact Our strategic response Related risks Related opportunities Social protest and criminal activity have significant impacts on business effectiveness, with our South African gold operations particularly vulnerable to illegal mining. There are also unfortunate developments in the regulatory environment and statements from political leaders that create concerns about the strategic trajectory of foreign and domestic policy. These factors increase business costs and create property rights concerns among investors, thereby inhibiting investor confidence. With the depressed levels of society’s confidence in political and other forms of leadership, recent studies such as the Edelman trust barometer reflect that business is increasingly regarded among the most trusted partners to society. Our work to build meaningful relationships with local communities through shared value creation is yielding solid returns through reductions in the incidence of social protest that disrupt our operations. The work conducted at Marikana since we took over those operations has been particularly effective in normalising relationships. We also engage in intensive advocacy with government through the key business associations to secure the policy quality and certainty, and the government accountability that is required for the private sector to contribute effectively to economic growth and social development. 4, 9 See pages 61 and 65 6, 7 See page 67 OUTLOOK The outcome of the national election in 2024 will be a critical point in South Africa’s political history with many potential scenarios that may include a move into a phase of coalition politics. This could create a volatile sociopolitical context with significant contestation. This may provide opportunities for business to further consolidate its role as a trusted partner of society capable of delivering superior shared value. EXTERNAL ENVIRONMENT FOR OUR BUSINESS AND OPERATIONS continued IR - 41

COMMODITY FUNDAMENTALS GREEN METALS PLATINUM, PALLADIUM AND RHODIUM – applications, review and outlook PGM demand is largely driven by autocatalysts, accounting for approximately 40% of platinum demand, 90% of rhodium demand and 85% of palladium demand. Platinum (Pt) has traditionally been used in diesel vehicles, however substitution of palladium with platinum in gasoline vehicles has been adopted by the market as a result of the relative prices of each metal. Around 40% of platinum demand is accounted for by industrial uses, e.g., catalysts in the chemicals and petrochemicals industries, and in the manufacture of glass. Platinum jewellery, predominantly in China, accounts for the remaining demand. The use of platinum in fibreglass-reinforced materials in carbon reduction applications such as vehicle lightweighting and wind power may also prove important for demand. Palladium (Pd) is largely an autocatalyst metal, which accounts for some 85% of its demand. Palladium is also used in chemicals processing. Rhodium (Rh) is also largely an autocatalyst metal, with autocatalysts accounting for approximately 90% of its demand. Rhodium is also used in catalysts for chemicals processing. Rhodium’s use in a Rh-Pt alloy in the manufacture of glass has declined significantly in recent years due to its high price, and has been replaced by platinum. REVIEW OF 2023 OUTLOOK All three PGMs saw prices fall in 2023. Palladium and rhodium prices fell sharply as auto demand remained muted and Chinese glass manufacturers began selling Rh. Russian production continued to reach the market, alleviating short-lived supply concerns and price hikes. The platinum price was volatile, starting 2023 at US$1,074/oz and varying between a high of over US$1,100/oz in April and a low of US$845/oz in November, ultimately ending the year at US$987/oz. The palladium price continued to fall from the record level seen in 2022, dropping 39% during 2023 from US$1,793/oz to US$1,104/oz. The rhodium price also continued to decline, falling 64% from US$12,250/oz to US$4,425/oz. Global primary palladium supply was flat year-on-year at 6.2Moz. Primary platinum supply grew slightly, up from 5.7Moz in 2022 to 5.9Moz in 2023 and rhodium supply was flat at 0.74Moz. Eskom load curtailment had less of an impact on South African mined production than previously anticipated, but there were still excess in-process inventory stocks at the end of the year which remain to be processed. During the second half of the year, PGM basket prices fell significantly, resulting in PGM producers increasingly focusing on cost-saving measures and cutting capital budgets as margins become tighter. Nornickel exceeded production guidance despite the challenges related to changing sources of mining equipment from Western Europe to China. Nornickel is not directly sanctioned, but metal sales shifted increasingly into Asia and away from Europe during 2023, which is reflective of ‘self-sanctioning’ by end users. Automotive production grew to just over 90 million light vehicles in total. Production of vehicles with internal combustion engines (i.e., including hybrid vehicles), and hence a PGM-containing autocatalyst, grew 7% year-on-year to almost 80 million units, while battery-electric vehicle production grew much more rapidly, by 39% to almost 11 million units. Platinum demand in autocatalysts increased in 2023, by around half a Moz, as price-induced substitution of palladium for platinum continued in tri-metal catalysts for light-duty gasoline vehicles, led by China and North America. Palladium autocatalyst demand remained largely flat as a result of substitution from palladium to platinum in some light-duty gasoline vehicles. Light duty gasoline production volumes, particularly hybrids, were up in 2023, while electric vehicle growth slowed. Vehicles with a combustion engine and therefore a PGM-containing autocatalyst comprised approximately 87% of light vehicle production in 2023. Net jewellery demand for platinum fell by 1% in 2023, to remain just above the million ounce mark, at 1,070koz. China, the dominant market for platinum jewellery, had a slow start to 2023, but signs of improvement in retail sales and platinum shipments were seen towards the end of the year. Industrial demand for platinum and palladium declined slightly in 2023, with electrical demand down as consumer spending on electronics slowed in a weak macro environment in major markets. Secondary supply of PGMs declined sharply as a result of muted new car purchasing and therefore lower scrappage rates as older cars remain on the road for longer. 2023 ended with platinum moving into deficit (-320koz), palladium’s deficit widening (-1Moz) and rhodium moving into a modest deficit (-50koz). As PGM basket prices fell sharply in H2 2023, some high-cost PGM mines have become unprofitable. Consequently, there has been a reduction by some producers in capital spend, investment and in some cases partial closures of unprofitable areas. Section 189 processes have begun at mines on the Western Limb in South Africa. If PGM prices remain low there is a risk of further cutbacks in primary PGM production from high-cost mines. Eskom remains an issue for PGM producers in South Africa with the utility provider projecting a 2GW shortfall for the entirety of 2024. Consequently, loadshedding is likely to remain an almost permanent fixture. That said, producers were able to manage load curtailment well in 2023 despite loadshedding being in place for 332 days in the year. Nornickel is conducting maintenance on the Nadezdha smelter in 2024 which is expected to result in lower projected output year-on-year. It remains a challenging environment for autocatalyst recycling. A modest recovery in secondary supply is anticipated for 2024 as light vehicle sales rise and second-hand car prices fall resulting in more end-of-life vehicles. Light vehicle production is expected to increase modestly in 2024 with the share of battery-electric vehicles increasing from 12% in 2023 to 15% in 2024. Autocatalyst demand for palladium and rhodium is expected to fall very slightly while platinum benefits from substitution in light duty gasoline catalysts. Demand for platinum jewellery is expected to remain flat in 2024 as it faces intensifying competition from gold jewellery, other products competing for a shrinking share of wallet and cautious consumers in China. EXTERNAL ENVIRONMENT FOR OUR BUSINESS AND OPERATIONS continued IR - 42

IRIDIUM – applications, review and outlook Iridium (Ir) and ruthenium (Ru) are used together in several industrial chemical processes, including the manufacture of acetic acid, a key intermediate in the manufacture of certain bulk chemicals. Iridium and ruthenium are used in combination for electrode coatings that can withstand the harsh operating environment of a wide range of electrochemical processes, including the production of bulk chemical intermediates such as chlorine and sodium hydroxide. In the electrical sector, iridium’s high temperature stability and purity have led to the use of iridium crucibles in the production of crystalline materials such as sapphire for use in LED lighting manufacturing and, more recently, lithium tantalate used in the production of surface acoustic wave (SAW) filters, which are found in smartphones and other digital devices. Iridium tips improve the performance of automotive spark plugs, in turn improving combustion efficiency in gasoline engines, and further strengthening the link between ICE vehicles and PGMs. Iridium (along with platinum) is also used as an alloy component in some medical devices, notably guide wires and stents. This is thanks to its biocompatibility and mechanical properties for micro machining tiny devices. Iridium is playing a rapidly increasing role in the hydrogen economy, as the key metal (along with platinum) in proton exchange membrane (PEM) electrolysers used in the production of green hydrogen from water using renewable electricity. Significant thrifting is expected to ensure a long-term sustainable iridium market. REVIEW OF 2023 OUTLOOK Hydrogen sector growth slowed in 2023 as the rising cost of capital, lack of demand and uncertainties around government subsidies put some green hydrogen projects on hold. Thrifting of electrolyser catalysts to a lower iridium content produced promising results from research initiatives. Demand for iridium in the electrochemical sector remained robust as the chloralkali and copper-foil sectors retained a strong appetite for mixed metal oxide electrodes. Evidence of price-induced demand destruction in the electrical, jewellery and automotive sectors was evident, as end-users pared back iridium usage by switching to alternative materials. Hydrogen sector demand is expected to remain subdued in 2024 as inflationary pressures persist, especially in Europe and the US. Europe’s preference for PEM technology is expected to strengthen throughout 2024, providing a slight lift to iridium demand. Despite an anticipated recovery of the smartphone sector in 2024, demand for iridium crucibles is expected to be capped as crucible manufacturers continue with price-induced substitution. Price-induced substitution is expected to continue in applications where iridium can be substituted for cheaper materials. RUTHENIUM – applications, review and outlook As per above, ruthenium (Ru) and iridium (Ir) are used together for several applications. The electrical sector in data storage is helping drive global ruthenium demand. Ruthenium, along with platinum, forms part of the magnetic layer in hard disk drives. In the longer term, Chip resistors, which are ubiquitous in consumer and industrial electronics, rely on compounds that contain ruthenium and this sector is becoming increasingly important for demand. The unique chemical and physical properties of ruthenium mean that it is also utilised in numerous semiconductor materials and components, which enable increasing miniaturisation and efficiency in various electronic devices. Ruthenium is taking some share of the gasoline spark plug market, where its durability exceeds that of iridium and platinum. It is also an effective catalyst in the production of ammonia. The hydrogen economy is also a growing area of demand for ruthenium, both in the production and use of hydrogen. It is used in proton exchange membrane (PEM) fuel cells; it is particularly important where only slightly impure hydrogen is available, as the carbon monoxide contaminants deactivate the platinum electrodes. Ruthenium is starting to be used also in PEM electrolysers, alongside iridium; previously ruthenium was insufficiently stable in the PEM electrolyser environment, but improvements to catalyst design are showing long term stability. This substitution is expected to help alleviate some of the pressure on iridium supply. REVIEW OF 2023 OUTLOOK Macroeconomic headwinds in most regions slowed consumer demand for ruthenium-based hard disk drives. The normalisation of supply chains following the end of the pandemic left many disk-makers with excessive inventories. Hard-disk drive (HDD) manufacturers shifted closer to a build-to-order approach as visibility into customer demand became clearer. Inventories continued to be drawn down resulting in diminishing demand for new metal. Demand for ruthenium in the hydrogen sector continued to grow as some ruthenium replaced iridium in PEM electrolysers. The chemical sector was impacted by high inflation and cost-pressures in 2023, which weighed on utilisation rates in the ammonia sector. The chemical sector is expected to show signs of recovery as inflationary pressures ease and operating rates return to normal. Planned capacity expansions in the caprolactam industry are anticipated to resume. Demand for ruthenium catalysts in ammonia synthesis and cracking is likely to increase as ammonia plays an important role as a fuel and hydrogen carrier. The commercial roll-out of higher content ruthenium catalysts for PEM electrolysers is anticipated to gain pace from 2024 onwards. Solid-state drives are likely to take a greater market share of memory applications requiring greater speed and energy-efficiency, however their development costs are higher than HDDs. EXTERNAL ENVIRONMENT FOR OUR BUSINESS AND OPERATIONS continued IR - 43

LITHIUM – applications, review and outlook Lithium (Li) and its compounds have been used in a variety of commercial applications since the 1920s. They have been used in the manufacture of high-temperature lubricants, high strength-to-weight alloys, heat-resistant glass and ceramics and, more recently, in the synthesis of the cathode of lithium-ion batteries (LIBs). The high energy-to-weight-ratio of lithium-ion batteries, the fact they can be recharged multiple times, and their ability to retain charge, make them ideal for EVs, and consumer electronics. They are also becoming important for large battery energy storage systems (BESS) to provide grid resilience for renewable electricity generation. Two lithium chemicals are used in LIB synthesis: lithium carbonate and lithium hydroxide. Traditionally, LIB fabrication required the former but the latter is expected to become the dominant lithium chemical as nickel-rich LIBs become the preferred chemistry in EVs. Gross lithium demand is forecast to grow to more than 2.8 million lithium carbonate equivalent (LCE) tonnes by 2030, and to over 4.3 million LCE tonnes by 2040. Given the political pressure for EVs and battery-electric storage and the decline in lithium prices in 2023, there are concerns as to the sufficiency of lithium supply over the long term. Furthermore, China’s dominance in the processing of lithium is also causing Western governments to shore up their lithium supply chains. Chinese companies control some 80% of the supply chain of lithium-ion batteries (from battery precursor to LiB production). BACKGROUND AND REVIEW OF 2023 OUTLOOK China continues to be the primary driver of global BEV demand and production. BEV production from China increased by 28% in 2023 to 6.8 million units, meaning that nearly a quarter of light-duty vehicles (LDVs) produced in China are now BEVs. Chinese BEV sales growth slowed during the year owing to the removal of subsidies and weaker consumer confidence caused by a worsening macroeconomic outlook and a BEV price war. However, PHEV sales outperformed, and battery pack sizes continued to increase. Globally, production of BEVs increased to 11 million units in 2023 or 12% of global LDV production, with strong growth also recorded in Europe (+51%) and the USA (+56%). Gross lithium demand is estimated to have increased by 42% last year, mainly driven by increased global demand from the battery sector. BEVs and PHEVs are estimated to have been responsible for almost 90% of this growth in gross demand, with Chinese PHEV production and sales in particular exceeding market expectations during 2023. Primary lithium supply is estimated to have increased by 51% in response to the growth in demand, with supply growth coming from Australia, Chile and China, primarily. As a result of slower Chinese demand growth, sizeable inventories in China and this strong growth in supply globally, battery-grade lithium carbonate prices declined during 2023, averaging slightly less than $40,000/t for the year. Lithium carbonate remains the main battery-grade lithium precursor in China due to the resurgence of lithium iron phosphate (LFP) cathodes locally. While lithium hydroxide remains the source of demand growth in Europe and North America, owing to the midstream supply chain being dominated by nickel-rich cathodes, the risk of rising BEV exports from Chinese OEMs presents a risk to faster LFP uptake in Asian and European markets. Lithium demand for 2024 is forecast to increase by 29% from 2023 levels, with the majority of this growth again coming from growth in demand from automotive batteries. The decline in prices last year has tempered the supply response somewhat, with primary lithium production predicted to rise by 28% in 2024, tightening the market. Consequently, lithium prices are forecast to reach a floor this year, with rising prices needed to help incentivize new projects that will be required to meet long-term demand growth. New projects remain well placed to meet market requirements in the next few years, under the right conditions. The increased focus on environmental and social factors in recent years has added to the complexity of permitting and developing new projects, with timelines significantly extended, despite efforts to streamline permitting in some western regions. Considering current projections for BEV penetration into the global automotive market, significant investment in new lithium supply will be required to meet forecast demand over the next decade. In our view, the various risks and inevitable delays to new projects mean that supply growth may struggle to keep pace with forecast demand, increasing the risk of shortfalls in lithium supply in the second half of the decade, which would maintain higher prices for longer. It is worth noting that while lithium-iron phosphate remains a risk to our lithium hydroxide demand outlook, it will likely be more than offset by higher overall EV production volumes, and therefore overall lithium demand. EXTERNAL ENVIRONMENT FOR OUR BUSINESS AND OPERATIONS continued IR - 44

NICKEL – applications, review and outlook Nickel (Ni) has excellent physical and chemical properties that make it ideal for use in alloys – especially when used with chromium, or with iron (ferronickel), as well as with other metals, to produce stainless steels that are heat-resistant. There are at least 3,000 nickel alloys, including stainless steel, for use in a range of industries, to produce a range of goods, including vehicle crankshafts and axles, propeller shafts, scientific and surgical equipment, and pipelines. Nickel alloys are also used in a range of household products such as kitchen sinks, cooking utensils, and washing machines. Importantly for our green metals strategy, nickel alloys are used in PV solar panels and wind turbines (which use about two tonnes of nickel). Nickel has excellent properties: a high melting point (1,454 degrees C); can withstand extreme low temperatures; resistant to corrosion and oxidation; good catalytic properties; fully recyclable. Nickel is an essential component in Li-ion batteries, enabling batteries to store greater amounts of energy and to reduce the use of more expensive cobalt. However, around two-thirds of nickel demand still comes from stainless steel production, whereas batteries capture under 15% of the nickel market production. This balance is forecast to change dramatically in the coming decade with demand growth expected to be driven increasingly by the EV sector. With global EV sales expected to exceed 35 million by 2030, demand for nickel (like lithium) is expected to grow. Further, pressure is growing on producers to reduce the carbon footprint and physical impact of nickel mining and processing; giving an advantage to mines and refineries that offer a reliable, socially, and environmentally assured supply of products. REVIEW OF 2023 OUTLOOK Nickel demand from the battery sector is estimated to have grown by nearly 30% in 2023 compared with 2022, with the vast majority of growth coming from BEVs. The stainless-steel market recovered from the contraction seen in 2022, growing 4% year-on-year. Growth was centred in China, the largest producer of stainless-steel, though was moderately impacted by the ongoing difficulties in the real estate sector. The nickel price declined significantly in 2023, owing to an oversupply of class 2 nickel from Indonesia. Meanwhile, lower than expected BEV sales and sluggish battery-grade nickel demand from China pushed nickel sulphate into a discount against the LME benchmark price for much of the year. Chinese investment in Indonesian nickel processing has remained strong and the pipeline of projects producing a range of semi- refined products is growing. Indonesia has become the largest nickel producer and production there is relatively low cost. Furthermore, new generation HPAL plants in Indonesia are ramping up more smoothly than previously anticipated, with two additional plants expected to come online in 2024. The surge in class 2 nickel production more than doubled the size of the nickel market surplus in 2023. Total nickel supply is estimated to have risen 20% in 2023, while demand is estimated to have risen by just 7% (net of recycling). The nickel market is forecast to remain in a significant surplus in 2024. Primary supply growth is expected to slow to 9% year-on-year as commissioning of new plants slows and some smelter closures take effect. Demand growth is expected to outstrip that of supply (11% year-on-year), and thus the market surplus is forecast to shrink compared to 2023. The surplus is expected to keep pressure on the nickel price, however. EXTERNAL ENVIRONMENT FOR OUR BUSINESS AND OPERATIONS continued IR - 45 THE SANDOUVILLE NICKEL REFINERY IN FRANCE, IN THE EUROPEAN REGION

ZINC – applications, review and outlook Zinc (Zn) is the 23rd most abundant element in the Earth’s crust. Its primary use is as a galvanising agent (corrosion protection) in stainless-steel alloys, though many other industries use zinc. China is the largest source of demand for zinc, primarily because it is the largest producer of stainless-steel. Galvanized steel is used extensively in the automotive industry in chassis components, in construction, and household appliances. Zinc compounds also have important uses in health and nutrition. Several compounds are used in common fertilisers to increase crop yields and fortify micronutrient levels in food. Zinc is highly recyclable and can be recovered and reprocessed with very minimal losses. It fits well in our green metal strategy as zinc coatings play an essential part in protecting solar, wind and energy infrastructure from corrosion. REVIEW OF 2023 OUTLOOK Mined zinc production fell by 1.4% year-on-year in 2023, which was due to minor production declines in Australia, Mexico, Ireland and other countries. Boliden placed the Tara mine in Ireland on care and maintenance in June 2023, and a three-month strike at Newmont’s Penasquito mine in Mexico impacted North American production. Conversely, refined zinc production rose moderately in 2023, mainly as a result of a significant rise in Chinese refinery output. Total Chinese refined zinc production grew 11% year-on-year in 2023 (source: Shanghai Metal Markets). Zinc demand growth in India and China offset declines elsewhere in 2023, bringing total 2023 demand to 13.7 Mt (source: International Lead and Zinc Study Group). India’s zinc demand rose by 16% in 2023 thanks to growth in the automotive and construction sectors. In Europe, a weaker economy led to lower regional demand for zinc, and a corresponding increase in LME zinc stocks, which rose to their highest level since 2021. Demand growth in China and India were not sufficient to offset losses elsewhere, which swung the zinc market into a surplus for 2023. This pressured the price of zinc, which fell 12% over the course of the year. The outlook is mixed for the zinc market in 2024. In Europe, demand for galvanised steel in the automotive sector could be held back by a relatively weak macroeconomic picture, and a decline in German industrial output may see lower demand in construction. Indian zinc demand is likely to maintain robust growth in 2024 as the country is forecast to be the outperformer in terms of economic growth among the major World economies. China’s energy transition demand for zinc is anticipated to remain supportive in 2024 as solar installations and New energy vehicle (NEV) production are expected to continue rapid growth, albeit slightly slower than in 2023. European zinc supply may contract again in 2024. A major European zinc smelter with nameplate capacity of 315 ktpa of refined zinc was placed in care and maintenance in January 2024 owing to high energy costs and discontinued government support for the industry. EXTERNAL ENVIRONMENT FOR OUR BUSINESS AND OPERATIONS continued IR - 46 THE CENTURY ZINC OPERATION IN THE AUSTRALIAN REGION

GOLD – applications, review and outlook Gold (Au) has historically enjoyed a reputation for being one of the most precious and lustrous of metals; hence its use as a store of value and for jewellery. In the modern era, gold’s properties have been innovatively applied in a number of technological, industrial and medical applications. Gold is used in catalytic converters and in space travel to protect against radiation and heat. In the medical field, gold nanoparticles have become commonplace in rapid diagnostic testing. Amongst a range of interesting developments, gold nanoparticles are being used to improve the efficiency of solar cells; while research into the use of gold in fuel cell catalysts could also prove fruitful. Regardless of potential breakthrough applications for gold, it remains a sought-after and precious substance for people the world over. REVIEW OF 2023 OUTLOOK Gold demand remained strong in 2023 after a ten-year demand record was hit in 2022. Despite rising interest rates, another blistering year for central bank gold purchases and resilient jewellery demand supported the gold price, pushing gold to a new all-time-high during the year. Total annual gold demand was 5% lower than 2022 levels at 4,448 tonnes. Central bank purchases of 1,037 tonnes were just 45 tonnes below the record set in 2022 and offset a decline in ETF investment demand. Globally, jewellery demand held up well in 2023 as gold prices rose, rising marginally to 2,093 tonnes. Chinese gold jewellery demand recovered from a Covid-impacted 2022, and the appetite for gold was surprisingly resilient, given the high gold price environment. In India, the second- largest gold market, high average gold prices encouraged a shift in consumer preferences towards lighter-weight and lower carat gold pieces. Consequently, demand fell 6% to 562 tonnes in 2023. Investment demand suffered a decline in both bar & coin purchases and significant outflows from gold-backed ETFs, bringing total investment to the lowest level since 2014. ETF holdings fell by 244 tonnes, more than double the outflows seen in 2022. Bar and coin purchases declined by 3%, or 33 tonnes year-on-year. European markets, particularly Germany declined, though were mostly offset by gains in Asian markets. Annual mined gold supply increased by 1% to 3,644 tonnes in 2023, and recycled supply jumped by 9% to 1,237 tonnes owing to elevated prices leading to higher levels of selling among consumers. Total gold supply rose for a second year in a row to just below 4,900 tonnes. The LBMA gold price averaged US$1,943/oz in 2023. Last year was the fourth consecutive year with a new record high average LBMA gold price, despite facing significant headwinds from the US dollar and elevated global interest rates. Source: World Gold Council, Gold Demand Trends Full Year and Q4 2023 report Gold surged to a new record high of US$2,183/oz in March 2024 despite the consensus view being that the Federal Reserve will cut rates later in the year rather than sooner. While US inflation has continued to fall, the rate of decline has slowed, and central bankers are generally erring on the side of a ‘higher-for-longer’ policy. Monetary easing by the Fed later in the year could weaken the dollar and support a higher gold price. Central banks are continuing to purchase gold on a regular basis underpinning demand. A robust economy should support consumer spending in India, although, with the gold price remaining high, jewellery purchases could stall as Indian consumers are very price conscious. An improvement in the Chinese economy would also support jewellery demand. With the gold price continuing to rise and the stock market underperforming, bar and coin demand in China is likely to remain robust. Geopolitical risks have not receded and could support safe haven demand for gold. A reversal in the trend of outflows from gold ETFs would be positive for gold in 2024. EXTERNAL ENVIRONMENT FOR OUR BUSINESS AND OPERATIONS continued IR - 47 GOLD POUR IN PROGRESS AT THE SA GOLD OPERATIONS

UNPACKING OUR THREE-DIMENSIONAL STRATEGY OUR STRATEGIC FOUNDATION This defines the impact we aspire to make in the global economy and in local societies influenced by our operations; it is the difference our business makes. It embraces our purpose, vision and values, as well as the core principles that guide our decisions, including our commitment to ESG excellence and shared value. Our Umdoni tree is at the heart of our strategic foundation and represents our fundamental approach to business. The Sibanye-Stillwater Umdoni tree symbolises our approach to stakeholder capitalism. The roots of the tree hold our values, signifying that below the surface of success and competition, Sibanye-Stillwater iCARES. Our roots, our iCARES values, are at the heart of all that we do, the decisions we make and how we conduct our business. These values are enshrined in our Code of ethics and form the basis of the organisational growth and culture rejuvenation programme currently underway. iCARES VALUES INNOVATION We intentionally find new ways to do things better. We will all understand the need to innovate, develop innovators, encourage innovation, invite everyone to innovate; and we recognise innovation. COMMITMENT We are committed to the protection of life, health and the environment; to operational excellence, to high standards of governance, to ethical conduct and regulatory compliance, and to adhering to best practice industry disclosure and reporting standards. ACCOUNTABILITY We are accountable to our stakeholders for delivering on our key operational targets and strategic objectives; for identifying, managing and mitigating the risks inherent in our business; and for maximising the return on capital deployed. RESPECT We treat people fairly, respect each other, value the richness of human diversity and support employees in realising their full potential. ENABLING We enable prosperous and sustainable operations by engaging with our stakeholders, empowering our employees in their professional development, and offering doorstep communities skills and resources to thrive post- mining. SAFETY We acknowledge that working at depth, with heavy machinery, presents risks to life and limb; therefore we prioritise all practical, technical and behavioural measures to reduce safety and health risks to near zero. OUR STRATEGIC ESSENTIALS Support attainment of operational and business excellence We have five strategic imperatives that are instrumental for us to compete on the global stage. OUR STRATEGIC DIFFERENTIATORS Represent the opportunities that we have identified to be distinctive in the global minerals industry Our four strategic differentiators represent our opportunities to be distinctive in the global minerals industry. ADVANCING OUR THREE-DIMENSIONAL STRATEGY IR - 48 We represent our business ethos through the indigenous South African Umdoni tree our values are the fundamental roots of our organisation, which provide a solid basis for the way we do business the trunk of the tree (our people) represents the material strength of the company the leaves on the branches represent all our stakeholders the tree’s seeds and fruits signify the varying benefits and value that our success will bring to those stakeholders

The graphic below summarises our strategic foundation, essentials, and differentiators, which constitute a powerful three-dimensional blueprint for execution of our business strategy. STRATEGIC DELIVERY IN 2023 AND PROGRESS TOWARDS DIFFERENTIATION ––––––––––––––––––––––––––––––––––––––––––––––––––––––––––––––––––––––––––––––––––––––––––––––––––––––––––––––––––––––––––––––––––––––– For detailed disclosure of the performance against our strategic essentials areas in 2022, see section 03 of this report (from page 88 onwards). Below is a concise summary of key aspects of strategic delivery. Performance/progress made per strategic essential to date, its status and link to area in this report OUR STRATEGIC ESSENTIALS Support attainment of operational and business excellence Performance/advances made Status For detail, see these sections Overall achievement Steady performance and ongoing focus More work to be done Ensuring safety and wellbeing • Record low serious injury frequency rate of 2.61 per million hours worked • Received 18 safety awards at the Southern African Institute of Mining and Metallurgy (SAIMM) MineSafe conference on 29 November 2023 • 27 consecutive months without fatalities due to gravity related fall of ground • Unfortunately, we still lost 11 of our colleagues during the year under review – regression in fatalities magnified by Burnstone conveyor contractor incident • Awarded the Exemplar award, from the Ending Workplace TB organisation, for outstanding workplace TB programme • Continuous safe production • Health, wellbeing and occupational health • Empowering our workforce • Leadership view Prospering in every region in which we operate • Advanced the Marikana renewal programme • Certified as a level 6 B-BBEE contributor, a second consecutive year of improvement from level 8 status • Concluded a five-year wage agreement at Kroondal PGM operations bringing stability • Socioeconomic development • Empowering our workforce • Leadership view Achieving operational excellence and optimising long-term resource value • SA PGM - industry leading cost control with a 4% increase in AISC/4Eoz: R20,054 (US$1,089) • Load curtailment well managed and effective utilisation of processing capacity resulting in zero inventory increases • Restructuring of high-cost shafts concluded in February 2024 • SA PGM operations profitable despite depressed PGM basket price • Restructuring of Kloof 4 shaft successfully concluded during Q4 2023, with final closure during H1 2024 • SA gold – Underscoring the benefit of gold’s safe haven status during global economic downturns • US PGM – Repositioned for a production profile aligned to market developments; ongoing work to improve performance with focus on addressing all cost drivers to ensure profitability • Leadership view • Delivering value from operations and projects • Mineral resources and reserves • Optimising capital allocation Maintaining a profitable business and optimising capital allocation • Weaker commodity prices (except gold reduced cash generation with gearing at net debt at 0.58x net debt: adjusted EBITDA³ at 2023 year-end • Low-risk and well-staggered debt maturity ladder • No final dividend declared due to loss for H2 2023 in line with dividend policy • Leadership view • Optimising capital allocation ESG embedded as the way we do business • 267MW of renewable energy projects in construction • Global industry standard on tailings management – conformance in SA and US operations facilities • Sibanye-Stillwater foundation established and first allocations made to benefit social upliftment • Social, Ethics and Sustainability Committee Chairman – ESG summary • Minimising our environmental impact • Socioeconomic development • Governance in sustainability • Optimising capital allocation ADVANCING OUR THREE-DIMENSIONAL STRATEGY continued IR - 49

OUR STRATEGIC DIFFERENTIATORS Opportunities to distinguish ourselves in the global minerals industry We continue to make meaningful progress in our quest to deliver distinctive value in the mineral resource sector. In the table below, we highlight some noteworthy achievements that advance our differentiation. Delivery of our differentiators is supported by work to instil a culture of innovation that seeks to adopt ways of doing things better, to promote an environment of trust and transparency with all our stakeholders, and to adopt anti-fragility principles that make the organisation stronger through anticipatory responses to the shocks that create threats and opportunities for our business. Advances achieved Recognised as a force for good • Pyramid of positive change adopted as the framework to optimise the impact of our business as a Force for good • Incubation of SMME’s through funding and mentorship under our supplier development programme • Social criteria incorporated into adjudication of procurement events • Socioeconomic impact reporting detailing shared value embedded as routine practice • Stronger emphasis on socioeconomic impact in structuring and evaluating community programmes Inclusive, diverse and bionic • "Leading Inclusively" workshops fostering collaboration and diverse perspectives, promoting inclusive leadership • Developed a diversity and Inclusion in-house online site reinforcing commitment to psychological safety and diversity of thought • Launched initiative to develop digital fluency and hone digital skills across all levels to promote digital adoption • Delivery of initiatives leveraging advanced analytics and AI, enhancing human decision-making and improving efficiency Building pandemic-resilient ecosystems • Developed resilience strategies for strategic commodities to counter supply chain challenges • Enhanced transparency and accessibility of procurement to promote inclusion of surrounding communities in our business ecosystem • Launched a supplier diagnostic programme to assess issues facing suppliers and guide them to become more sustainable • Established community forums to build shared understanding on issues relating to tailings storage facilities • Secured credible positioning as a partner for development of the Europe battery value chain Unique global portfolio of green metals and energy solutions that reverse climate change • Concluded 100% acquisition of New Century Resources • Exercised our option on Mount Lyell as the basis for advancing feasibility work on re-opening the mine • Finalised the acquisition of Reldan strengthening our recycling presence • Secured promising results from a concept study to repurpose Sandouville as a pCAM facility for the Europe automotive battery ecosystem • Achieved several meaningful milestones on development of the Keliber lithium project • Steady progress maintained towards launch of the Rhyolite Ridge lithium project ADVANCING OUR THREE-DIMENSIONAL STRATEGY continued IR - 50 Good Corporate Citizenship: At the base of the pyramid, good corporate citizenship represents the minimum requirement. How we demonstrate adherence to laws and regulations, paying liveable wages, treating employees fairly, and acting ethically in all business dealings. Corporate Social Investment (CSI) & Corporate Social Responsibility (CSR): The next level involves going beyond legal obligations to proactively contribute to societal welfare This includes philanthropy, volunteer programs, and partnerships with non-profit organisations. Environmental, Social, and Governance (ESG): As we moves up the pyramid, the focus broadens to encompass sustainable and responsible business practices across all areas of operation. This requires consideration of environmental impact, social equity, and corporate governance in decision-making processes. Creating Shared Value: At the apex of the pyramid, the activities we undertake to create shared value, where business success and societal progress are mutually reinforcing. A Pyramid of positive change: A framework for operationalising our intent to deliver superior shared value by being Recognised as a force for good

MANAGING OUR RISKS AND OPPORTUNITIES WITHIN THE EXTERNAL ENVIRONMENT OUR APPROACH –––––––––––––––––––––––––––––––––––––––––––––––––––––––––––––––––– Enterprise-wide risk management is an integral component of our business strategy and is fully integrated into our strategic planning. This enables the Group to make informed decisions, reduce potential downside impacts and actively pursue upside impacts of uncertainties, ensuring long-term success. Our risk management objectives and practices are aligned with the Group’s purpose, mission and values. Our risk management culture cascades into all our business units, operations, and projects. It is actively introduced into any acquisitions during their integration into the Group. In line with risk management best practices, we have a dedicated Risk Committee that reports to the Board,which has ultimate oversight over, and responsibility for, risk management. Implementation and execution of effective risk management is delegated to management. (See Corporate governance, page 29). Our enterprise risk management (ERM) framework follows the principles outlined in leading best practice standards, including ISO 31000, COSO (Committee of Sponsoring Organizations of the Treadway Commission), and King IV, which positions risk management as a key area of governance. Our ERM process undergoes an annual independent external review against best practice ERM frameworks. Our Group Strategic risk register outlines our top primary strategic risks to the future of the business with detail on triggers, underlying vulnerabilities, consequences, current controls and planned future control enhancements. The aim is to lower residual risk to target levels, which are informed by our risk appetite and tolerance frameworks. Our Group risk matrix follows the 5X5 matrix with impact along the Y-axis and probability along the X-axis. Risk assessment is on both the inherent risk (risk exposure before mitigating current controls) and residual risk (remaining risk exposure after taking into account the effectiveness of mitigating current controls. In line with the ERM framework, organisational structure risk and opportunity identification and mitigation is cascaded throughout the organisation with risk registers at the various levels to ensure appropriate management risk exposures by the appropriate leadership levels in the organisation. Each of the regions (SA, US, Europe and Australia) maintains a regional risk register. The South Africa region further maintains risk registers for each of its operating segments, SA PGM and SA gold segments. Operational and business unit risk registers are maintained at the operational levels. MANAGING OUR RISKS AND OPPORTUNITIES WITHIN THE EXTERNAL ENVIRONMENT continued IR - 51 BATHOPELE OPERATION AT THE SA PGM OPERATIONS

Our risk management process Governance structures involved ESTABLISHING THE CONTEXT • Review and update strategic and operational goals • Evaluate internal and external environments and the impact on strategic and operational objectives • Review our risk appetite per strategic risk category • Set and approve risk tolerance levels • Review and update the impact matrix • Review and update the role and responsibility matrix IDENTIFY • Implement risk management processes in line with the ERM framework – daily at the operational and business units • Identify threats or opportunities to strategic goals • Scan internal and external business and operating environment for new risks • Compile risk register – by function for Group, operating segment, operations, service departments and/or business units ANALYSE AND EVALUATE • Interrogate risks to understand root causes and consequences to strategic focus areas • Assess the severity and likelihood of risks • Rank risks according to severity and likelihood • Assess and prioritise mitigation ASSESSMENT AND RESPONSE • Identify current controls • Develop further enhancement plans and implement controls • Monitor adequacy of controls REVIEW REPORT AND MONITOR Roles and responsibilities matrix: Executive management: • Responsible for overall risk governance, for managing and monitoring success of controls and mitigation plans, and for determining whether risks are within the limits of our risk appetite • Participates in annual strategic risk workshop; reviews risk register; conducts risk analyses, e.g., PESTLE • Is supported by Corporate strategy and Group Risk management functions • Reports to the Risk Committee Risk Committee and Board: • Reviews Group and Regional priority risk registers submitted by executive management (twice yearly) • Assesses and approves Group risk appetite and tolerance levels annually All levels of management, outside formal review cycles, are responsible for monitoring and responding timeously to risks and material developments. Governance structures involved A At operating level, business units and Group level C Executive management E Board B Risk management function D Risk Committee MANAGING OUR RISKS AND OPPORTUNITIES WITHIN THE EXTERNAL ENVIRONMENT continued IR - 52

Risk appetite and tolerance The Sibanye-Stillwater Board remains accountable for the appropriateness of the risk management processes and systems within the Group. This responsibility to determine, implement and monitor risk appetite and risk tolerance has been delegated to the Risk Committee. Our risk appetite and risk tolerance framework (RATF) is approved by the Board annually. Risk appetite is a strategic statement of the amount of risk we are willing to accept in pursuit of our goals. Our risk tolerance framework has key risk indicators and defined tolerance levels, with triggers for remedial action and escalation processes where appetite has been exceeded. We take into consideration relevant multiple internal and external factors in defining our risk appetite, to understand the severity of the consequences and likelihood of the risk should it materialise. A review of current controls and status of planned control enhancements by management to mitigate the risk is performed. A risk with residual risk that exceeds our risk appetite threatens the achievement of our strategic or operational objectives. In this instance, further planned control enhancements may need to be implemented or accelerated to ensure that the residual risk exposure is managed within acceptable appetite levels. We are prepared to conduct mining operations where there is a relatively high degree of uncertainty – such as regulatory change, unreliability of bulk infrastructure, and sociopolitical instability – provided this can be justified in terms of commercial returns. We take a moderate to high-risk approach to variability in production and financial delivery from our operations for business plan delivery. We will, however, consider all mitigating measures to keep our operations sustainable. We tightly manage factors within our control, such as input costs, new technologies and know-how, and the availability of critical expertise and skills. Our competitive advantage and growth prospects depend on bold, ethical leadership guiding the Group to achieve strategic goals. To ensure boldness does not become rashness, we invest in research and development and in intelligence, to provide, among other things, an objective view on commodity markets. We conduct in-depth due diligence on productivity and cost structures. Large acquisitions or major organic growth projects are kept within a moderate risk appetite. Further, when contemplating the use of financial instruments, our approach is low-risk. Leverage, indebtedness and liquidity are kept at prudent levels. Innovation as a critical tool for risk management We recognise need to leverage new technologies, methodologies and approaches to identify, assess, mitigate and monitor risks and opportunities in a more effective and efficient manner to improve our overall risk maturity. For more information, see the Harnessing innovation section on page 171 for more about what we do for safety and other areas of the business. COMPLIANCE MONITORING –––––––––––––––––––––––––––––––––––––––––––––––––––––––––––––––––– Our Group compliance function monitors compliance with global corporate standards and requirements associated with our stock exchange listings, as well as regional compliance departments for Southern Africa and Europe; noting that the Americas region has a fully functional compliance department which mirror some of the corporate functions based in South Africa (e.g., tax). Each region has taken responsibility for its own regulatory compliance, information governance, and privacy programmes and activities, within the broader guidance and strategy of Group compliance. Regulatory compliance As per our compliance risk profile sessions, we identified legislative requirements as being mission critical (whereby non-compliance could lead to revocation of our licence to operate, and/or significant financial loss or reputational damage). These include the Companies Act, JSE Listings Requirements, U.S. Securities and Exchange Commission requirements, Carbon Tax Act, FICA, LPPM Responsible Platinum Palladium Guidance (RPPG), and the King IV Report on Corporate Governance for South Africa, 2016 (King IV). It should be noted that FICA was amended in December 2022, and we initiated a gap analysis to determine functional responsibility for the new requirements. (Noting that there is an 18- month transitional grace period for the new FICA regulations to be embedded before fines will be issued for non-compliance). Our compliance with the above is sound and our licence to operate is not at risk. Our management sessions into regulatory compliance also highlighted the following South African legislation for special risk focus: the Mining Charter, Carbon Tax Act (2019), Companies Amendment Bill (2021), Climate Change Bill (2022), National Health Insurance Bill (2019), General Laws Act (Anti-money Laundering and Combatting of Terrorism Financing, 2022). See the list of regulations on page 31 for more information. MANAGING OUR RISKS AND OPPORTUNITIES WITHIN THE EXTERNAL ENVIRONMENT continued IR - 53

TOP 10 RESIDUALLY1 RANKED RISKS –––––––––––––––––––––––––––––––––––––––––––––––––––––––––––––––––––––––––––––––––––––––––––––––––––––––––––––––––––––––––––––––––––––– Change in top 10 residual risk ranking ñ Elevated to top 10 residual ranking ö Increased ÷ Decreased residual risk ranking ú No change in residual risk ranking ø New risk Residual risk ranking status Low ranking (1-6) Medium ranking (7-19) High ranking (20-25) Risk description Ranking Ranking change Residual risk rating Related strategic objectives2023 2022 1. ENERGY AVAILABILITY Risk of energy shortages; loadshedding and load curtailment in SA (including risk of a total blackout) 1 1 ú 9 Achieving Strategic Essentials Prospering in every region in which we operate 2. CLIMATE CHANGE – PHYSICAL RISKS Climate change physical risks/perils include, inter alia: Drought/water stress, heatwave, tropical windstorm, temperate windstorm, riverine flood, coastal flood and freeze impacting operations in various regions 2 6 ö 9 Develop a climate change resilient business 3. CLIMATE CHANGE – TRANSITIONAL RISKS Transition risks may pose varying levels of financial, market, liability, technology, investor sentiment and reputational risk to organisations 3 6 ö 9 Develop a climate change resilient business 4. FAILURE TO ENABLE RESILIENT COMMUNITIES Of particular relevance to SA region; insufficient infrastructure and measures to support communities; collapse of social cohesion; high youth unemployment 4 2 ÷ 9 Instrumental in building pandemic- resilient ecosystems 5. LACK OF TECHNICAL AND OPERATING CAPABILITY Highly competitive closed environment (well established networks that we would need to break through) 5 9 ö 9 Building a portfolio of global green metals and energy solutions that reverse climate change 6. ENTRY INTO NEW MARKETS AND GEOGRAPHIES Inability to operate effectively in unfamiliar markets or geographies 6 12 ñ 9 Building a portfolio of global green metals and energy solutions that reverse climate change 7. COMPANY RESILIENCE AGAINST CATASTROPHES AND PANDEMICS Company instability due to inability to adapt and recover from disruptions as a result of catastrophes and pandemics 7 10&21 ö 9 Instrumental in building pandemic- resilient ecosystems 8. RATE OF TECHNOLOGICAL CHANGE (IN RESPECT OF CURRENT AND FUTURE OPERATIONS AND ENERGY SOLUTIONS): Inability to master novel technologies and to keep up with evolving energy solutions 8 16 ñ 9 Building a portfolio of global green metals and energy solutions that reverse climate change 9. NOT GENERATING SUFFICIENT RETURNS TO DELIVER ON FORCE FOR GOOD STRATEGY Organisational profitability falling short of planned/expected levels, resulting in below expected returns/cash flow 9 5 ÷ 9 Recognised as a force for good 10. SUB-OPTIMAL AND FAILED ACQUISITIONS (DD AND INTEGRATION) Misinformation from due diligence processes and inability to integrate to realise value 10 19 ñ 9 Building a portfolio of global green metals and energy solutions that reverse climate change 1 Residual risk is the amount of risk that remains after current internal controls are taken into account For more information on these risks, see page 58 of this section. MANAGING OUR RISKS AND OPPORTUNITIES WITHIN THE EXTERNAL ENVIRONMENT continued IR - 54

SIBANYE-STILLWATER RISK MATRIX Risk ranking based on residual risk rating Risk description Inherent risk rating Residual risk rating 1 Risk of energy shortages; loadshedding and load curtailment in SA (including risk of a total blackout) 16 9 2 Climate change physical risks/perils include, inter alia: Drought/water stress, heatwave, tropical windstorm, temperate windstorm, riverine flood, coastal flood and freeze impacting operations in various regions 16 9 3 Transition risks may pose varying levels of financial, market, liability, technology, investor sentiment and reputational risk to organizations 16 9 4 Of particular relevance to SA region; insufficient infrastructure and measures to support communities; collapse of social cohesion; high youth unemployment 12 9 5 Highly competitive closed environment (well established networks that we would need to break through) 16 9 6 Inability to operate effectively in unfamiliar markets or geographies 16 9 7 Company instability due to inability to adapt and recover from disruptions as a result of catastrophes and pandemics 12 9 8 Inability to master novel technologies and to keep up with evolving energy solutions 16 9 9 Organisational profitability falling short of planned/expected levels, resulting in below expected returns/ cash flow 16 9 10 Misinformation from due diligence processes and inability to integrate to realise value 16 9 MANAGING OUR RISKS AND OPPORTUNITIES WITHIN THE EXTERNAL ENVIRONMENT continued IR - 55

Risk dynamics – movement in Group risk rankings Energy availability/security still poses a great risk to our operations, especially in South Africa. Diverse stakeholder expectations (Risk 7 in 2022), Inability to fund expansion (Risk 3 in 2022) and Failure of the ecosystem concept (Risk 8 in 2022), declined in risk ranking and these risks are no longer included in the top 10 risks. They do, however, remain part of the top strategic risks of the Group to ensure that risk mitigations continue to be applied consistently. Impact of climate change (Risk 6 in 2022) was reviewed and split into climate change – Physical risks (Risk 2 in 2023) and Climate change – Transitional risks (Risk 3 in 2023), as a result of the improved understanding of climate-related impacts in the business. Climate change impacts and Health and safety remain our top material risks from strategic and operational perspectives. Entry into new markets and geographies (Risk 12 in 2022) has risen into the top 10 risks. These four risks, together with an explanation for the change in their risk status, are: Previous ranking (2022) Risk Explanation for decrease in residual risk 3 Inability to fund expansion Commodity prices are subdued, making it more challenging to generate cash and limiting credit ratings and debt capacity. The significant further decline in palladium and rhodium prices during 2023 prompted a Group-wide review of all operations and a focus on bottom of the cycle austerity and value preservation. Restructuring, cost saving and capital preservation opportunities were identified and implemented during 2023 and 2024 to date. 4 Failure to grow in targeted commodities and regions Competition for critical resources intensifying with increasing emphasis on region or jurisdiction security of access to minerals changing the dynamics for entry. Sources, extraction methods and processing/refining developments evolving rapidly making preferred entry strategy less obvious. There have been significant advances in understanding the clean energy economy implications for metal demands and the region strategies to secure access to critical minerals, also contributing to a reduced residual impact. 7 Diverse stakeholder expectations Shared value is the recognition that all stakeholders should experience benefits from our activities, an idea that is well illustrated by our Umdoni tree (See Our purpose, vision and strategy, page 34). We have dedicated executive roles for stakeholder engagement across the regions. In interacting with stakeholders we are guided by the Code of ethics and by our Stakeholder engagement policy statement. We value our relationships with our mine communities, with governments and regulators, as well as with all the stakeholders who make our success possible. Sibanye-Stillwater acknowledges the partnerships and collaborations necessary to co-exist with various stakeholders all jurisdictions in which we operate. 8 Failure of the ecosystem concept Stakeholder appetite for collective solutions in the mutual interest is improving as times become more challenging, with regional ecosystem thinking becoming stronger in a multi-polar world. We are continuously working on holding ourselves accountable to exacting standards and being faithful to core values and principles. This has led to improved levels of trust and transparency among stakeholders, which is critical for productive socioeconomic ecosystems. Regard for expectations of stakeholders within the ecosystem through definition of shared value is improving with a culture of mutual respect, though gaps remain too ideal. TOP RISKS BY REGION ––––––––––––––––––––––––––––––––––––––––––––––––––––––––––––––––––––––––––––––––––––––––––––––––––––––––––––––––––––––––––––––––––––––– Risk and opportunity identification and management is cascaded to the various levels of the organisation. This ensures that risks or opportunities that may be identified and could be material to the delivery of the Group’s overall strategy are tracked and mitigated by the responsible leadership, with their understanding and line of sight. Regional risk registers are maintained for the regions in which we operate. Certain risks are generic to all regions, while other risks are specific to certain regions and its operations. Only regions with a risk exposure material to Group outcomes are included in our disclosure. The 2023 top risks identified for each of the regions were: Risks applicable to all operations Declines in safety and health performance and under-delivery on plans/expectations; expected returns not realised from expansion projects are highlighted as part of the top five risks across all the regions. Commodity prices/economic downturn are also recognised as having an impact on the ability to achieve operational plans. The SA region continues to experience uncertainty over electricity supply, with the skills/labour shortage still a concern for the US region. Various mitigation strategies have been implemented to mitigate the risk exposures in each region. SA region US region EU region • Risk 1: Security of electricity supply • Risk 2: Crime • Risk 3: Commodity price trajectory • Risk 4: Continuous improvement in health and safety objectives • Risk 5: Under-delivery on operational plans • Risk 1: Failure to deliver on business plans (Annual and Long Term) • Risk 2: Labour/skills shortage • Risk 3: Economic impacts • Risk 4: Catastrophic mining or processing unit accident • Risk 5: Change in, or non-compliance with, environmental or mining regulations (or social licence) • Risk 1: Unsuccessful financial turnaround for Sandouville current business model • Risk 2: Safety incidents/accidents • Risk 3: Brand deficit • Risk 4: Project delivery delays and cost overruns • Risk 5: Economic downturn (unfavourable commodity pricing) MANAGING OUR RISKS AND OPPORTUNITIES WITHIN THE EXTERNAL ENVIRONMENT continued IR - 56

OUTLOOK – SIGNIFICANT EMERGING RISKS AND TRENDS –––––––––––––––––––––––––––––––––––––––––––––––––––––––––––––––––––––––––––––––––––––––––––––––––––––––––––––––––––––––––––––––––––––– Specific emerging Group risks The emerging risks currently being closely monitored are: Management oversight over new acquisitions, joint venture (JV) or associate investments How do we ensure that new acquisitions have the same good corporate governance and responsible citizen procedures as the Group? There is also the risk of unrealised value due to strategic misalignment at JVs, associates or partnerships. This risk is overseen by our Chief Commercial Development Officer and relates to the strategies: Unique global portfolio of green metals and energy solutions that reverse climate change; Maintaining a profitable business and optimising capital allocation; ESG embedded as the way we do business. We hold thorough audits (if necessary using third-party auditors) to assess compliance of these companies to our standards and values. Additionally, we take care to assess their skills, financial strength and reputation in the marketplace. Global trend in replacing ICE vehicles with EVs We are heavily reliant on sales of PGM to the automotive sector for use in catalytic converters. It is common cause that throughout the developed world, and including China, EV sales are rising faster than ICE sales, with their zero tailpipe emissions being a distinct advantage. Demand for PGM for use in autocatalysts will hold in the short to medium term (indeed, stiffer emissions standards could even see it rise), but the long-term prospect is that EVs will one day completely replace ICEs. Our green metals strategy addresses this risk, as do the investments and acquisitions we are making in green metals and battery metals. Our research (through SFA Oxford) suggests exciting opportunities in the green hydrogen economy. This represents an attractive new application area for platinum and the minor PGM elements. Increasingly exacting ESG expectations Ever-growing ESG stringency from investors and financing institutions threatens our ability to raise finance. Navigating the complexity of ESG and sustainability compliance is becoming ever harder, particularly given that the Group operates in multiple territories in the context of a complex and multifaceted global regulatory and compliance environment. Our controls for this risk are centred around our sustainability strategy. Further, we have position statements for key environmental areas (water, land, biodiversity, energy) and policy frameworks for priority areas. We are committed to adhering to ICMM, and the WGC responsible mining principles, which are assured by external assurance providers. Additionally, we have embedded our Rules of life philosophy across all jurisdictions. Our institutional structures are being improved to define exactly who is responsible for executing and reporting on which aspect. We are considering ESG across the full value chain, including mergers and acquisitions, and closure. We are diversifying into recycling, across all our metals. We are developing a socioeconomic strategy (including social cohesion), as well as science-based targets and ESG related LTIs. Value realisation through capital allocation External factors, most significantly the steep decline in PGM prices, are impacting on the Group’s profitability and cash generation. Proactive review of short term capital allocation and prudent financial management can assist in navigating these challenges, ensuring resilience through a depressed phase in the commodity cycles. The CFO owns this risk, which relates to our strategic essential, Maintaining a profitable business and optimising capital allocation, and our strategic differentiator, Unique global portfolio of green metals and energy solutions that reverse climate change. Our financial decision-making is governed by best practice structures and mechanisms to manage liquidity and costs, with debt well planned for the long term, and costs planned and managed within clear limits (See Profitable business and capital allocation, page 89). On 16 November 2021, the Group completed a two-tranche corporate bond offering of US$675 million; 4.0% notes due on 16 November 2026 (the 2026 notes), and US$525 million 4.5% notes due on 16 November 2029 (the 2029 notes). In November 2023, the Group also executed the well-timed issue of a US$500 million convertible bond due in 2028 with a portion of the proceeds to be applied to fund the acquisition of Reldan. For additional information about our risks, see “Risk Factors” in our Form 20-F www.sibanyestillwater.com/newsinvestors/reports/annual Risk Explanation Our response MANAGING OUR RISKS AND OPPORTUNITIES WITHIN THE EXTERNAL ENVIRONMENT continued IR - 57

Top 10 Group strategic risks: description, likely impact and related mitigating action Strategic risks are the risks that could threaten the Group’s ability to deliver on expected outcomes, with a negative impact on our ability to grow and prosper. The top 10 Group strategic risks are ranked according to their residual risk and potential to negatively impact our ability to deliver on our three-dimensional strategy. The residual risk ranking is based on exposure levels, once current controls have been implemented and applied. OPERATIONAL I ECONOMIC I FINANCIAL I SOCIAL 1. ENERGY AVAILABILITY Risk of energy shortages; loadshedding and load curtailment in SA (including risk of a total blackout) MATERIAL MATTERS: M5 SDGs IMPACTED: 7.2, 7.3 Type of risk and strategic impact Underlying vulnerabilities and triggers RELATED STRATEGIC OBJECTIVE Achieving strategic essentials, particularly Prospering in every region in which we operate CAPITALS AFFECTED Human resources, social and relationship, financial BOARD OVERSIGHT COMMITTEES Risk Committee; Audit Committee; Safety and Health Committee; Social, Ethics and Sustainability Committee; and Investment Committee. The Chief Technical and Innovation Officer is ultimately responsible for this risk. Our greatest exposure remains in the SA region, which is facing energy-supply challenges. We continue to have a high reliance on Eskom for energy supply, and insufficient geographical diversification. For both the Europe and SA regions, the inability to adapt to frequent and significant load curtailments remains a major challenge. Land claims disputes have also caused delays in our renewable projects in South Africa. Consequences Current control Planned control enhancement The consequences of a lack of energy availability include: 1. Risk of energy shortages and national load shedding / curtailment (EU/RSA) 2. Increased production costs 3. Production interruptions 4. Closing of operations 5. Retained or increased carbon intensity, reduced demand for products 6. Failure to deliver on our carbon neutrality or STBi targets 7. ESG underperformance and reputational damage 8. Total blackout, risk to personnel and infrastructure, and social unrest Operational protocols have been communicated and implemented to ensure that all responsible teams understand load curtailment requirements, as well as evacuation procedures at affected sites. Other controls include: 1. Utility generation performance monitoring 2. Emergency power supply 3. Energy and decarbonisation strategy implementation, including renewable portfolio (RSA) 4. Industry advocacy, including engagement with government, NERSA and Eskom We continue to look for, and implement, alternative solutions to reduce dependence on Eskom power. Our planned enhancement actions include: • Alternative dispatchable or baseload energy solutions assessment (gas, hydro, biomass, etc.) • Enhanced load curtailment scenario planning, including a case of prolonged blackout • Investigating energy storage solutions • Development of regional carbon neutrality roadmaps • Develop a group green and energy solutions strategy • BioniCCube – R&D/market development fund • Building energy management and technical competencies • Stakeholder engagements on land claims MANAGING OUR RISKS AND OPPORTUNITIES WITHIN THE EXTERNAL ENVIRONMENT continued IR - 58

OPERATIONAL I ECONOMIC I FINANCIAL I SOCIAL 2. CLIMATE CHANGE – PHYSICAL RISKS Climate change physical risks/perils include, inter alia: Drought/water stress, heatwave, tropical windstorm, temperate windstorm, riverine flood, coastal flood and freeze impacting operations in various regions MATERIAL MATTERS: M9 SDGs IMPACTED: 13.1, 13.3 Type of risk and strategic impact Underlying vulnerabilities and triggers RELATED STRATEGIC OBJECTIVE Instrumental in building pandemic- resilient ecosystems CAPITALS AFFECTED Social and relationship, financial, manufactured, human BOARD OVERSIGHT COMMITTEES Social, Ethics and Sustainability Committee; Risk Committee; and Audit Committee. The Chief Financial Officer, with support from Chief Regional Officers, is ultimately responsible for this risk. 1. Vulnerable asset base with large carbon footprint 2. Energy intensive South African mines dependent on upstream carbon intensive power from the national utility, Eskom 3. Eskom's ability to diversify (renewables) 4. State of Eskom infrastructure and ability to integrate into the grid 5. Production interruption and community impacted by changing weather and climate conditions 6. Increased input costs 7. Inadequate global response to reverse climate change 8. Supporting infrastructure damage and supply chain disruptions Consequences Current control Planned control enhancement 1. Region-specific carbon tax (financial impact) with significant impact in SA from 2026, given Eskom risk exposure (pass on of carbon footprint cost) 2. Increased cost and reduced availability of materials (timber, cyanide, explosives, lime, cement, diesel and water) 3. Anticipated carbon border taxes 4. Ability to meet the Group commitment to be carbon neutral by 2040 compromised/ eroded demand for products due to carbon intensity 5. Investment decisions made today could be affected by weather variability associated with long-term climate change in the future 6. Impacted communities (basic services, hygiene, displacement, food security); angry people and political environment surrounding the mines 7. Financial, production, environmental and safety impact; flooding, TSF impacts, environmental incidents, incremental weather effects, etc. 8. Reduced investability, increased cost of capital and reputational damage TSFs 1. Reputational damage 2. Financial impact: change in operational methodology and infrastructure expansion, cessation of operations 3. Impacted communities: lives and livelihoods affected due to catastrophic failure Our risk mitigation actions remain centered around our Sustainability strategy. The following current controls are in place to manage the risk exposure: 1. Green metals and energy solutions strategy implementation 2. Roadmap to carbon neutrality by 2040 3. Energy and decarbonisation strategy 4. ICMM aligned Group climate change and energy and decarbonisation position statements (Strategy and execution) 5. GHG interventions: renewables implementation, onsite coal independence, methane sealing initiatives and supplier engagements 6. Monitoring, measurement and reporting of carbon emissions against rolling five-year carbon budgets 7. Carbon emissions; Board and executive- aligned Long-term incentive (LTI) metrics 8. Standardised Group reporting system for energy and GHGs 9. Disclosure through participation in the CDP initiative 10. Alignment and reporting to Task Force on Climate-related Financial Disclosure (TCFD) recommendations 11. Climate change scenario analysis based on the latest IPCC reports and assessment of climate change risks and opportunities 12. Compliance with air quality legal emission requirements with abatement initiatives (NOx, SO2) 13. The implementation of energy-efficiency projects 14. TSFs: Global Industry Standard on Tailings Management (GISTM) conformance 15. Rigorous surveillance programmes with internal (Tailings engineering) independent review • With ESG and sustainability being central to our Group ambitions, we have identified further planned mitigating actions to enhance our controls over climate change • We are in the process of developing and implementing a Climate change strategy, and will continue to actively pursue strategic opportunities in green metals, recycling and other energy-related businesses that aid in the global low-carbon transition • Undertaking the TCFD scenario analysis will assist with appropriate financial planning required to manage unidentified climate change risks and opportunities. As a Group, we are committed to a climate change response programme which will include regular reviews and updates of climate change risks and opportunities • We will continue to develop decarbonisation projects and alternatives, and consider appropriate carbon trading schemes MANAGING OUR RISKS AND OPPORTUNITIES WITHIN THE EXTERNAL ENVIRONMENT continued IR - 59

OPERATIONAL I ECONOMIC I FINANCIAL I SOCIAL 3. CLIMATE CHANGE – TRANSITIONAL RISKS Transitioning to a lower-carbon economy may entail extensive policy, legal, technology, and market changes to address mitigation and adaptation requirements related to climate change. MATERIAL MATTERS: M8 SDGs IMPACTED: 13.2 Type of risk and strategic impact Underlying vulnerabilities and triggers RELATED STRATEGIC OBJECTIVE Instrumental in building pandemic- resilient ecosystems CAPITALS AFFECTED Social and relationship, financial, manufactured, human BOARD OVERSIGHT COMMITTEES Social, Ethics and Sustainability Committee; Risk Committee; and Audit Committee. The Chief Financial Officer, with support from Chief Regional Officers, is ultimately responsible for this risk. 1. Policy and legal: new climate change-related mandatory business requirements 2. Change in technologies and fuel sources: changing or new commodity requirements 3. Market: ESG requirements, with carbon as a focal point 4. Market: carbon taxes, increased input costs 5. Reputational: failure to act or perform will erode competitiveness 6. South Africa's restrictive and bureaucratic legislation 7. Ensuring a just transition/impoverished communities 8. Decarbonisation technology availability and viability (e.g., green H2, low-profile BEVs) 9. TSF instability: elevated phreatic surface, earthquakes 10. Rainfall in excess of TSF design (insufficient freeboard and related infrastructure capacity) Consequences Current control Planned control enhancement 1. Region-specific carbon tax (financial impact) with significant impact in SA from 2026, given Eskom risk exposure (pass on of carbon footprint cost) 2. Increased cost and reduced availability of materials (timber, cyanide, explosives, lime, cement, diesel and water) 3. Anticipated carbon border taxes 4. Ability to meet the Group commitment to be carbon neutral by 2040 compromised/ eroded demand for products due to carbon intensity 5. Investment decisions made today, could be affected by weather variability associated with long-term climate change in the future 6. Impacted communities (basic services, hygiene, displacement, food security); angry people and political environment surrounding the mines 7. Financial, production, environmental and safety impact; flooding, tailings storage facilities (TSF) impacts, environmental incidents, incremental weather effects, etc. 8. Reduced investability, increased cost of capital and reputational damage TSFs 1. Reputational damage 2. Financial impact: change in operational methodology and infrastructure expansion, cessation of operations 3. Impacted communities: lives and livelihoods affected due to catastrophic failure Our risk mitigation actions remain centered around our Sustainability strategy. The following current controls are in place to manage the risk exposure: 1. Green metals strategy 2. Roadmap and action plans to carbon neutrality by 2040 3. Energy and decarbonisation strategy and ICMM aligned Group climate change and energy and decarbonisation position statements (Strategy and execution) 4. Green house gas interventions – renewables implementation, onsite coal independence, methane sealing initiatives, engaging suppliers, etc. 5. Monitoring, measurement and reporting of carbon emissions against rolling five-year carbon budgets and Board and executive aligned metrics (LTIP) 6. Standardised group reporting system for energy and green house gas 7. Radical disclosure through participation in the CDP initiative 8. Alignment and reporting to Task Force on Climate-Related Financial Disclosure (TCFD) recommendations 9. Climate change scenario analysis based on the latest IPCC reports and assessment of climate change risks and opportunities 10. Compliance with air quality legal emission requirements with abatement initiatives (NOx, SO2); 11. The implementation of energy efficiency projects 12. Automation – implementation and roll out of online carbon inventory and monthly reporting of adherence to carbon budgets/LTIPs; 13. TSF - Global Industry Standard on Tailings Management (GISTM) alignment 14. TSF - Rigorous surveillance programmes with internal (Tailings Engineering) independent review (EOR"s, ITRB) 15. Visibly Felt Leadership (i.e., well equipped Board, C-suite, Regional leadership, etc.) 16. Actively pursuing strategic opportunities in green metals, recycling and other energy related businesses that aid in the global low-carbon transition 1. Develop and implement a Climate resilience roadmap 2. Development and implementation of a Group Climate change strategy and/or Decarbonisation Strategies 3. TCFD scenario analyses to assist with the financial planning required to manage identified climate change risks and opportunities (both physical and transitional risks) 4. Developing a carbon offsets policy, implementing appropriate carbon trading schemes, investigate carbon storage - impact hard to abate emissions. 5. Absolute emission reduction targets to be ratified by Science Based Targets initiative (SBTi) 6. Climate change risk insurance 7. Development of pipeline of decarbonisation projects and alternatives (e.g., creating project optionality, multiple sites, etc.) 8. Modelling tailings storage facilities climate change risks 9. Further enhancements to tailings storage facilities surveillance programs through use of new technologies MANAGING OUR RISKS AND OPPORTUNITIES WITHIN THE EXTERNAL ENVIRONMENT continued IR - 60

OPERATIONAL I ECONOMIC I FINANCIAL I SOCIAL 4. FAILURE TO ENABLE RESILIENT COMMUNITIES Insufficient infrastructure and measures to support communities, collapse of social cohesion and high youth unemployment in South Africa MATERIAL MATTER: M6 SDGs IMPACTED: 1.4, 8.3, 9.3, 10.4 Type of risk and strategic impact Underlying vulnerabilities and triggers RELATED STRATEGIC OBJECTIVE Instrumental in building pandemic- resilient ecosystems CAPITALS AFFECTED Intellectual, financial, manufactured, human BOARD OVERSIGHT COMMITTEES Risk Committee; Audit Committee; Safety and Health Committee; and Social, Ethics and Sustainability Committee. The Chief Sustainability Officer is ultimately responsible for this risk. 1. Political ideologies in various jurisdiction fragmenting society 2. Inequality in societies 3. Lack of economic growth 4. South African context • Exposure to legacy issues • Lack of basic municipal service delivery • Increased unemployment • Illegal mining activity • Increasing activism and unmet social expectations • Historical perceptions of business and mining as exploitive of society • Political uncertainty • Angry people due to other economic factors impacting household income (e.g., high inflation rates, etc.) Consequences Current control Planned control enhancement 1. Operational disruptions and mine blockages 2. Interests of stakeholders not aligned, leading to elevated conflict levels 3. Negative investor sentiment 4. Pressure from NGOs and other regulatory and governmental stakeholders 5. Unproductive workforce Our stakeholders are an integral part of our business. It is our intent to ensure appropriate and meaningful stakeholder engagements throughout all aspects of our business. Our stakeholders have the ability to contribute to the success and sustainability of our business. 1. Consistent and effective stakeholder engagement 2. Communicate the positive socioeconomic impact derived from our mining 3. Public relations campaigns 4. Investment in local economic development, through strategic partnerships 5. Socioeconomic compact with multiple stakeholders 6. Central engagement forum 7. South African context 8. Deliver Social and labour plans (SLPs) 9. Enterprise and supplier development programme 10. Local recruitment strategy 11. ESG Strategic framework The following planned control enhancements have been committed to: 1. Pursue partnerships to build modern towns around our operations 2. Helping communities design pandemic reaction plans 3. Assume a leading role in district development models/programmes in South Africa 4. Embedding ESG Strategic framework within communities MANAGING OUR RISKS AND OPPORTUNITIES WITHIN THE EXTERNAL ENVIRONMENT continued IR - 61

OPERATIONAL I ECONOMIC I FINANCIAL I SOCIAL 5. LACK OF TECHNICAL AND OPERATING CAPABILITY Highly competitive closed environment (well-established networks that would require breaking through) MATERIAL MATTERS: M12, M13 SDGs IMPACTED: 8.5, 9.2 Type of risk and strategic impacts Underlying vulnerabilities and triggers RELATED STRATEGIC OBJECTIVE Unique global portfolio of green metals and energy solutions that reverse climate change CAPITALS AFFECTED Financial BOARD OVERSIGHT COMMITTEES Investment Committee; Audit Committee and Risk Committee. The Chief Technical and Innovation Officer is ultimately responsible for this risk. 1. Behavioural competencies required to lead teams 2. Necessary skill set required 3. Entry into new operating regions 4. Highly competitive market for technical skills 5. No business track record to rely on 6. Reliance on third-party knowledge of commodities and regions with which we are unfamiliar 7. Cultural and procedural fluency across different regions 8. Inability to attract technical and operational capability required 9. Inability to form partnerships needed with third parties 10. Neglecting to focus on the cultural and procedural requirements Consequences Current control Planned control enhancement 1. Lack of growth 2. Operating failure 3. Safe performance consequences 4. Not meeting the requirements of off take agreements 5. Inability to execute our strategy 6. Financial impact 7. Lack of investor confidence 1. Small office, home office (SOHO) and digital workplace philosophy allows for global skills sourcing (wider talent pool) 2. Positioning within supply chains and developing credible partnerships 3. Business intelligence research (business development, including market development and SFA Oxford) 4. Market-competitive Total Reward to attract and retain critical talent 5. Succession planning and skills retention 1. Implement a competitive strategy to attract and retain key talent 2. Development of our central technical capacity 3. Strategically planned change management 4. Strategic manpower planning and structuring for future skills requirements 5. Development, conclusion and implementation of strategic differentiation roadmaps OPERATIONAL I ECONOMIC I FINANCIAL I SOCIAL 6. ENTRY INTO NEW MARKETS AND GEOGRAPHIES Inability to operate effectively in unfamiliar markets or geographies MATERIAL MATTERS: M1, M7, M13 SDGs IMPACTED: 8.5, 9.2 Type of risk and strategic impacts Underlying vulnerabilities and triggers RELATED STRATEGIC OBJECTIVE Unique global portfolio of green metals and energy solutions that reverse climate change CAPITALS AFFECTED Financial BOARD OVERSIGHT COMMITTEES Remuneration Committee; Safety and Health Committee; Audit Committee and Risk Committee. The Chief Regional Officers and the Chief Technical and Innovation Officer is ultimately responsible for this risk. 1. Limited resources – Talent and experience in new areas of business 2. Internalising skills necessary to support long term strategies (new lobbying, cultural and technological skills) 3. Talent scarcity in developed economies Consequences Current control Planned control enhancement 1. Value destructive acquisition with failed integration and impairments 2. Failure to re-rate the company and remain too exposed to SA 3. Not having sufficient critical mass for the new battery metals (BM) portfolio 1. Ecosystem building with improved political visibility in EU/US/Australia 2. Partnerships have been an essential tool to unlock situations 3. Clearly articulated strategy supported by Board and investors 4. We now have the beginning of a platform in both EU/US to accelerate the growth in battery metals with organic optionality 5. Appropriate continuous development Due Diligence (DD) processes 6. Strict Capital Allocation Transfer of front office senior talent to EU/US/ Australia to boost networking and origination MANAGING OUR RISKS AND OPPORTUNITIES WITHIN THE EXTERNAL ENVIRONMENT continued IR - 62

OPERATIONAL I ECONOMIC I FINANCIAL I SOCIAL 7. COMPANY RESILIENCE AGAINST CATASTROPHES AND PANDEMICS Group's instability due to inability to adapt and recover from disruptions as a result of catastrophes and pandemics MATERIAL MATTERS: M1, M2, M6, M9, M10 SDGs IMPACTED: 1.5, 3.3, 3.8, 6a, , 11.5, 13.1 Type of risk and strategic impact Underlying vulnerabilities and triggers RELATED STRATEGIC OBJECTIVE Instrumental in building pandemic- resilient ecosystems CAPITALS AFFECTED Human, intellectual, social and relationship BOARD OVERSIGHT COMMITTEES Social, Ethics and Sustainability Committee; Risk Committee; Audit Committee; and Safety and Health Committee. The Chief Regional Officers are ultimately responsible for mitigating against this risk. 1. Labour intensive operations 2. Political instability in the jurisdictions of operations 3. Global data flows 4. Interconnected supply chains 5. Multiple risks realising concurrently 6. Understanding what value is for stakeholder expectations (understanding our value add within ecosystems) 7. Geographic concentration of production 8. High fixed cost 9. Employees living in informal accommodation/settlements 10. Uncertain country response to a pandemic 11. Supply/Demand impacted Consequences Current control Planned control enhancement 1. Loss of production 2. Compromised safety and wellbeing of employees 3. Labour and community unrest and safety impact due to loss of people a result of illness or isolation 4. Job losses (i.e., Livelihoods of employees lost) 5. Business disruptions and decreased productivity 6. Reputational damage to brand 7. Insufficient liquidity and cash flow 8. Limited cash inflow to offset fixed/ committed outflows during a pandemic 9. Elevated leverage 10. Higher costs – onerous pandemic health requirements 11. Demand destruction 1. ESG Strategic Framework 2. Integrated core resilience competencies (i.e. business continuity, disaster recovery, incident management and emergency response) 3. Workforce resilience (e.g., Learning and development to maintain workforce productivity) 4. Developed innovation management strategy 5. Developed technology research, development strategy 6. Developed technology incubation, prototyping and commercialisation strategy 7. Developed digital prototyping and flexible resourcing/investment model 8. Market intelligence 9. Stakeholder Shared Value Strategy 10. Conservative financial policies 11. Capital allocation framework 12. Revolving credit facilities and other sources of liquidity (overnight facilities) 13. "Lessons learnt" during COVID-19 14. Commodity and geographical diversification 1. Positioning Sibanye-Stillwater in a Pandemic resilient ecosystem that supports business continuity 2. Completion of the anti-fragility workstream 3. Supporting the building of capable institutions in our ecosystems and sustainable communities 4. Further commodity and geographical diversification 5. Enhanced communication of shared value with Stakeholders MANAGING OUR RISKS AND OPPORTUNITIES WITHIN THE EXTERNAL ENVIRONMENT continued IR - 63

OPERATIONAL I ECONOMIC I FINANCIAL I SOCIAL 8. RATE OF TECHNOLOGICAL CHANGE (IN RESPECT OF CURRENT AND FUTURE OPERATIONS AND ENERGY SOLUTIONS) Ability to master novel technologies and stay abreast with rapidly-evolving energy solutions MATERIAL MATTER: M12 SDG IMPACTED: 9.5 Type of risk and strategic impact Underlying vulnerabilities and triggers RELATED STRATEGIC OBJECTIVE Unique global portfolio of green metals and energy solutions that reverse climate change CAPITALS AFFECTED Financial BOARD OVERSIGHT COMMITTEES Investment Committee; Audit Committee and Risk Committee. The Chief Technical and Innovation Officer is ultimately responsible for this risk. 1. Limited technical capability/capacity in new processes 2. Global availability of appropriate skills 3. Knowledge of the latest processing technologies 4. Minimalist approach to R&D 5. Reduced spending on capex R&D during times of economic downturn 6. Limited capability/capacity in new energy solutions and markets currently 7. New entrant with limited commodity diversification 8. Possibility of other alternatives and substitutions 9. Access and barriers to attractive investment opportunities Consequences Current control Planned control enhancement 1. Inability to deliver on strategic (and business) objectives due to technology that does not deliver as planned 2. Retrofitting of operational technology (business disruption, additional cost) 3. Unavailability of growth opportunities 4. High-cost producer, excessive costs without corresponding benefits 5. Reputational damage 6. Inability to attract and retain top talent 7. Poor investments and/or impairments 8. Not delivering on our strategy 9. Limited investment opportunities 10. Inability to enter markets at the right price point 11. Inability to attract and retain top talent 12. Reduced shareholder/stakeholder confidence 1. Case studies relevant to technology change 2. Internal knowledge of novel technology 3. Current ability as an operator (general operational competence) 4. Leverage consulting capacity in support of learning and decision-making 5. Research capability (SFA Oxford and other) 6. Energy and decarbonisation strategy and implementation 7. Group Green Metals Strategy 8. Bionic Cube – R&D/Market development fund 9. Evolving technical competencies and bench strength 10. Leveraged internal capability, capacity, skills and knowledge to the benefit of the Group 1. Thorough due diligence, technology studies and engineering design 2. Acquire specific skills relative to our strategy 3. Strategic partnerships in support of learning and decision-making 4. Transparency of technology project portfolio to encourage re-use and knowledge share 5. Strategic partnerships – technology, supply chain, production, manufacturing etc. 6. R&D capacity in relevant fields (hydrogen, BEVs etc.) 7. Enhance/add appropriate technical competencies and bench strength MANAGING OUR RISKS AND OPPORTUNITIES WITHIN THE EXTERNAL ENVIRONMENT continued IR - 64

OPERATIONAL I ECONOMIC I FINANCIAL I SOCIAL 9. NOT GENERATING SUFFICIENT RETURNS TO DELIVER ON FORCE FOR GOOD STRATEGY Organisational profitability falling short of planned/expected levels, resulting in below expected returns/cash flow MATERIAL MATTERS: M1, M4 SDGs IMPACTED: 1.4, , 3.3, 6.3, 6.4.1, 7.2, 8.5, 9.4, 10.4, 11.3, 12.2, 12.5, 13.1, 15.3, 15.5, 16.10, 17.14, 17.16 Type of risk and strategic impacts Underlying vulnerabilities and triggers RELATED STRATEGIC OBJECTIVE Recognised as a force for good CAPITALS AFFECTED Intellectual, financial BOARD OVERSIGHT COMMITTEES Audit Committee and Risk Committee. The Chief Financial Officer is ultimately responsible for this risk. 1. PGM exposure to economic vulnerabilities 2. PGMs currently form a significant portion of the Sibanye-Stillwater portfolio 3. High fixed cost to variable cost ratio (a function of medium to deep level underground mines) 4. Labour intensive operations at SA gold and SA PGM operations 5. Marginal assets within portfolio 6. Dependence on key infrastructure 7. Lack of mining flexibility and technical complexity (e.g., seismicity) 8. Large community presence around operations 9. Reliance on third-party suppliers for bulk services such as water and electricity 10. Availability of technical skills 11. Geographically concentrated operations 12. Unwieldy labour relations and regulations Consequences Current control Planned control enhancement 1. Reduced cash flow 2. Sub-optimal credit ratings 3. Inability to raise equity capital 4. Loss of investor confidence 5. Downscaling and asset restructuring 6. Domino-effect as downscaling passes fixed costs on to other operations 7. Reputational impact 8. Failure to meet stakeholder expectations 9. Deterioration of stakeholder relationships 10. Difficulty delivering on community programmes 11. Inability to deliver on expectations for value creation 12. Negative impact on the sustainability of the business 1. Operational planning – monthly, quarterly and yearly – realistic targets – flexibility 2. Detailed capital planning and scheduling 3. Formal operations review through all management levels up to Board at appropriate frequencies 4. Recovery planning to address production shortfalls 5. Regional leadership providing dedicated strategic business management 6. Strong segment operational leadership 7. Stakeholder engagement programmes 8. Data analytics and digital systems 9. Technological capability enhancement 10. Long term strategic planning (life of mine planning) 11. Conformance to global standards for critical ESG outcomes 12. Long-term strategic market intelligence 1. Diversification of business activities 2. Securing independence from unreliable public services in South Africa 3. Business taking leadership position in supporting enhanced public service delivery 4. Application of intelligent advances in the business 5. Instilling a strengthened culture of innovation 6. Embedding anti-fragility and pandemic resilience 7. Endemic trust and transparency 8. Communicating our shared value/impact across all stakeholders MANAGING OUR RISKS AND OPPORTUNITIES WITHIN THE EXTERNAL ENVIRONMENT continued IR - 65

10. SUBOPTIMAL AND FAILED ACQUISITIONS Misinformation from due diligence processes and inability to integrate to realise value. MATERIAL MATTER: M3, M11, M12, M13 SDGs IMPACTED: 9,2,9.4, 17.14 Type of risk and strategic impacts Underlying vulnerabilities and triggers RELATED STRATEGIC OBJECTIVE Unique global portfolio of green metals and energy solutions that reverse climate change CAPITALS AFFECTED Financial BOARD OVERSIGHT COMMITTEES Investment Committee; Audit Committee and Risk Committee. The Chief Technical and Innovation Officer is ultimately responsible for this risk. 1. Economic environment changes (recession) nullifying assumptions made during due diligence processes 2. Volatile commodity prices and exchange rates, departure from long term outlook/forecasts Operational disruptions – e.g., environmental, social, operational, etc. 3. Inability to meet "Embedding ESG" trajectory resulting in capital being withheld 4. Organisational capability stretched to do effective integration 5. Loss of critical value-adding skills followed by replacement skills shortages 6. Stakeholder opposition and interference 7. Cultural/technological incompatibility OPERATIONAL I ECONOMIC I FINANCIAL I SOCIAL Consequences Current control Planned control enhancement 1. Value destruction – reputational, loss of stakeholder confidence and financial losses 2. Inability to pursue value accretive growth 3. Inability to retain skills 4. Margin and balance sheet pressure 1. Regional leadership structures 2. Third-party assistance in due diligence processes – technical, financial and legal 3. Confidence in market intelligence 4. Integration capacity and capability 5. Detailed integration plans 6. Close monitoring of progress and issues by integration committee 7. Experience and track record of acquisition integration with ability to customise to requirements of specific instances 8. Good management systems 1. Adequate and timeous involvement of internal expertise 2. Regional stakeholder involvement process 3. Group Technical to lead enhanced detailed technical due diligence processes with functional inputs and reviews where relevant 4. Bench strength created ahead of acquisition completion MANAGING OUR RISKS AND OPPORTUNITIES WITHIN THE EXTERNAL ENVIRONMENT continued IR - 66

PURSUING OPPORTUNITIES While the primary focus of risk is often on the threats to the business and how these can be mitigated, it is equally important to recognise the opportunities that arise that can be capitalised on in pursuit of our Group Strategy. It is incumbent on leadership to seize opportunities and convert them into profits and value creation for our stakeholders, especially in a world where the only constant is change. Our anti-fragile leadership culture is rooted in a balanced view where opportunity management and threat mitigation take on similar importance. Opportunity Considerations 1. Commodity applications and energy solutions to address climate change and the environment This theme is woven throughout the report and is addressed by our green metals strategy, which is to build a Unique global portfolio of green metals and energy solutions that reverse climate change as a key strategic differentiator in our refreshed corporate strategy. While we expect vehicle electrification to accelerate, shortages of critical battery metals and other factors that impede adoption are likely to cap the rate of electrification of the global vehicle fleet. Hybrid vehicles are likely to start fulfilling a significant role. There may also be a need for other decarbonisation alternatives such as synfuels extending the life of internal combustion engine vehicles in support of a low carbon economy, with major positive implication for PGM demand. We expect that an eventual decline in combustion engined vehicles will be compensated by tougher emissions standards, i.e., increased loadings compensating for decreasing volumes. High-capacity stationary batteries will be increasingly required in a renewable energy economy using a range of alternative technologies and mineral requirements. While lithium-ion is currently preferred for most bulk energy storage applications as it is well proven, it is not the ideal solution as other battery technologies have preferable characteristics in these applications. Vanadium redox flow and other technologies are exciting prospects with significant potential. A further exciting development that is gaining traction is green hydrogen, which we expect will impact demand for our metals from midway through this decade and sustain it for decades to come. Our exposure to iridium is an excellent opportunity as proton-exchange membranes (PEM) become a standard electrolyser technology for generating green hydrogen and fuel cells will create substantial new platinum demand. Our acquisitions and partnerships at Keliber, Sandouville and Century have launched our pivot to capitalise on these opportunities with substantial further progress expected to expand our involvement in new energy opportunities. We are also engaging in market development initiatives to stimulate new applications for the strategic commodities in our portfolio. 2. The need for security of supply of critical minerals With geopolitical developments causing increased multipolarity in the world, many nations are recognising the need to obtain security of supply through regional value chains that dilute dominant positions that have been built up. Legislation is being passed to incentivise local production through all stages of the mineral value chain most significantly in North America and Europe. The scope extends to countries that have robust and dependable trade relationships to qualify for the benefits that are available. In addition to providing stability to already established existing operations as strategic assets in those jurisdictions, there is significant political will to promote the formation of coherent regional supply chains from mining to manufacture of finished goods. Becoming a meaningful partner in the North American and European ecosystems represents a significant opportunity. 3. The imperative of resource stewardship and green production of scarce minerals The clean energy economy will require the use of a broader range of minerals in greater quantities, many of which are in relatively short supply. Not only will these minerals need to be produced with a lower carbon footprint to secure the desired reduction in global carbon emissions, they will need to be recovered for future use after their initial application is complete. For example, many countries are starting to legislate the recycling of automotive batteries to recover the green metals placing onerous duties on automotive manufacturers to ensure that this happens. Some manufacturing companies are starting to specify a preference for recycled metals in their supply chain policies, as it is recognised that this will avoid the need for carbon emissions associated with the mining, processing and refining of new metal that would otherwise be required. While primary mining will remain essential to satisfy growing demand for critical minerals, these developments are expected to impose a significant requirement for growth of recycling operations and secondary mining to reprocess mining waste from previous mining activities creating significant new business opportunities. 4. Strengthening the role of investment commodities in the global monetary system The role of gold as an investment commodity providing stability to the world’s financial systems continues to be demonstrated despite the challenges from alternative digital financial instruments with limited or no solid backing for their value. The crypto currency developments in 2022 have aptly demonstrated they do not represent a viable alternative being subject to extreme volatility. As the global economy navigates challenging times with the battle on inflation steadily being won through an interest rate hiking cycle that has most likely peaked, gold is likely to gain renewed emphasis as a preferred investment medium. Further, gold is a credible asset class that can be accredited under responsible mining standards, with the traceability to source that can be provided through the application of blockchain tokens. The World Gold Council’s work on Gold247TM to promote integrity, accessibility and fungibility through gold backed digital tokenisation is expected to invigorate gold in broader markets with our investment in Glint (a global gold-based payments platform) also speaking to this opportunity. While traceability and ESG accreditation functionality may lag relative to stakeholder expectations for commodities with industrial applications, this is an increasingly important market imperative to realise gold’s opportunities as a favoured investment medium. MANAGING OUR RISKS AND OPPORTUNITIES WITHIN THE EXTERNAL ENVIRONMENT continued IR - 67

Opportunity Considerations 5. Strategic partnership mechanism for building new business activities On the back of the successful partnership with DRDGOLD (a commercially smart environmental clean-up operator) that leverages our gold tailings storage facilities resources in South Africa, we are extending the model of strategic partnership into a number of other areas as an effective pathway to growth in new business areas. This provides flexibility and optionality for us to become involved as a partner in newly emerging value chains that are under development to meet rapidly evolving market requirements. Recent strategic partnerships include a 30% stake in Keliber that we extended to a controlling majority stake during 2022, a 20% stake in New Century Resources that elevated to full ownership during the period under review, and a 50% interest in the joint venture with ioneer to develop the Rhyolite Ridge project along with a 7% investment in ioneer. We have also initiated collaborative market development exercises for critical commodities and taken up stakes in energy solution businesses through our BioniCCube portfolio to leverage our green metals. Our strategic partnership model to secure meaningful involvement in coherent value chains is an important element in our strategic differentiator to Build pandemic-resilient ecosystems. 6. Africa as an emerging source of critical minerals While South Africa’s investment climate remains constrained by a broad range of challenges, several African countries have taken active measures to create an environment conducive to attracting foreign investment in mining. Across the African continent, there are plentiful untapped minerals resources and established mineral industries in need of reinvigoration that contain critical minerals required to meet the world’s low carbon economy requirements, with Zambia representing a prime example. With Africa uniquely positioned between the western and eastern worlds, there is significant contestation between major world powers to gain control of Africa’s resource base. This shapes substantial opportunity for companies with their roots in Africa to discharge meaningful roles in realising value from the mineral resources. Despite unreliable bulk services, high levels of crime and corruption, regulatory uncertainty and sociopolitical instability that create an elevated hurdle rate for investment, South Africa is still a rich source of mineral resources with significant untapped potential and limited competition for the available resources. Should a more favourable sociopolitical environment develop through meaningful reform in line with the intensive business advocacy that is being pursued, substantial new investment opportunities could be indicated. 7. Stakeholder sentiment and regulatory frameworks We have long recognised that companies with good sustainability and ESG credentials deliver superior financial returns to their shareholders in addition to the superior shared value that they deliver to all stakeholders through being a force for good. This has been particularly critical in mining that has attracted a reputation for being extractive and harmful to people and the planet. With the recognition growing that strategic green minerals are critical in the war on climate change and atmospheric pollution, a significant shift in stakeholder and regulatory attitudes is in progress. While expectations around upholding stringent standards for responsible mining are continually becoming more intense, work is being conducted to rationalise the mining standards landscape on a basis that will secure greater acceptability among stakeholders. Social sentiment towards mining has improved with supportive regulatory measures, including preferential funding and incentives, starting to be implemented. For mining corporations that are committed to strong sustainability and ESG frameworks, these developments represent a significant opportunity to establish activities in jurisdictions where significant obstacles to permitting were encountered. Securing recognition from stakeholders and regulators for our business activities as a Force for good allows us to capitalise most effectively on these opportunities. 8. Becoming a digital-first organisation Intelligent advances continue to progress at a remarkable pace enabling substantial opportunities for changes in work practices that afford improved effectiveness and efficiency, along with digital tools for the augmentation of human performance. This is captured through our Inclusive, diverse and bionic strategic differentiator. Following the trigger of the COVID-19 pandemic to adopt remote working arrangements, a digital-first approach to business has, where appropriate, yielded substantial benefits. Adapting to take advantage of the capabilities of virtual interaction with appropriate safeguards and guidelines to protect against pitfalls is creating a different form of connectedness within the company along with significant business efficiency benefits. This opportunity will mature over time. We also continue to see rapid improvement in digital tools, with generative artificial intelligence graduating into mainstream application during 2023. Learning how to use generative artificial intelligence effectively without incurring the undesirable outcomes that are possible affords significant potential. While we are continually increasing our use of digital tools such as digital twins to facilitate more informed and pro-active decision-making that enhances safety, productivity, working environments and ESG compliance, the extreme pace at which digital technologies are developing is expected to open new horizons through rapid and agile adoption. MANAGING OUR RISKS AND OPPORTUNITIES WITHIN THE EXTERNAL ENVIRONMENT continued IR - 68

HOW STRATEGY INTERFACES WITH RISKS AND OPPORTUNITIES Strategic differentiators Related strategic risk Related opportunity Recognised as a force for good a a a a a a a a aa 1, 3, 7 Inclusive, diverse and bionic a aa aa a aa 8 Building pandemic- resilient ecosystems a aa a a a a aa a a 2, 4, 5, 7 Unique global portfolio of green metals and energy solutions that reverse climate change aa aa aa a a 1, 2, 3, 4, 5, 6, 7 Risk 1: Energy Availability Risk 2: Climate change - physical risks Risk 3: Climate change - transitional risks Risk 4: Failure to enable resilient communities Risk 5: Lack of technical and operating capability Risk 6: Entry into new markets and geographies Risk 7: Company resilience against catastrophes and pandemics Risk 8: Rate of technologic al change (In respect of current and future operations and energy Risk 9: Not generating sufficient returns to deliver on "force for good" strategy Risk 10: Sub- optimal and failed acquisitions (DD and integration) Double ticks (aa) in this table represent primary linkages, with a single tick (a) representing secondary linkages 1 Opportunity 1: Commodity applications and energy solutions to address climate change and the environment 2 Opportunity 2: The need for security of supply of critical minerals 3 Opportunity 3: The imperative of resource stewardship and green production of scarce minerals 4 Opportunity 4: Strengthening the role of investment commodities in the global monetary system 5 Opportunity 5: Strategic partnership mechanism for building new business activities 6 Opportunity 6: Africa as an emerging source of critical minerals 7 Opportunity 7: Stakeholder sentiment and regulatory frameworks 8 Opportunity 8: Becoming a digital-first organisation HOW STRATEGY INTERFACES WITH RISKS AND OPPORTUNITIES IR - 69

Risk 1: Energy Availability Risk 2: Climate change - physical risks Risk 3: Climate change - transitional risks Risk 4: Failure to enable resilient communities Risk 5: Lack of technical and operating capability Risk 6: Entry into new markets and geograp hies Risk 7: Company resilience against catastrophes and pandemics Risk 8: Rate of technological change (In respect of current and future operations and energy solutions) Risk 9: Not generating sufficient returns to deliver on "force for good" strategy Risk 10: Sub-optimal and failed acquisitions (DD and integration) Strategic essentials Related strategic risk Related opportunity Ensuring safety and wellbeing a a aa a a a 1,7, 8 Prospering in every region in which we operate aa a a a a aa a aa 1, 2,3, 4, 6,7 Achieving operational excellence and optimising long- term resource value a a a a a aa aa a 4, 8 Maintaining a profitable business and optimising capital allocation a a a a a a 1,4, 5 ESG embedded as the way we do business a aa aa aa aa a a a a 1, 2, 3, 6, 7 Double ticks (aa) in this table represent primary linkages, with a single tick (a) representing secondary linkages 1 Opportunity 1: Commodity applications and energy solutions to address climate change and the environment 2 Opportunity 2: The need for security of supply of critical minerals 3 Opportunity 3: The imperative of resource stewardship and green production of scarce minerals 4 Opportunity 4: Strengthening the role of investment commodities in the global monetary system 5 Opportunity 5: Strategic partnership mechanism for building new business activities 6 Opportunity 6: Africa as an emerging source of critical minerals 7 Opportunity 7: Stakeholder sentiment and regulatory frameworks 8 Opportunity 8: Becoming a digital-first organisation HOW STRATEGY INTERFACES WITH RISKS AND OPPORTUNITIES continued IR - 70

ENGAGING WITH OUR STAKEHOLDERS WHAT WE DID IN 2023 SUCCESSES • Improved relationships with organised labour • Letsema methodology gaining traction in Marikana • Implementation of employee value proposition strategy • Material progress with Australian integration activities CHALLENGES • Trust deficit which hinders effective engagement and creation of shared value • Illegal land occupation and diverse stakeholder perspectives and expectations • Demand for business and employment opportunities respectively, resulting in illegal protests • Dysfunctional municipalities leading to poor basic service delivery The canopy of our Umdoni tree denotes our stakeholders Our iCARES values and Stakeholder engagement policy statement (www.sibanyestillwater.com/sustainability/reports-policies/) guide our approach to engagement. Our commitment to trust and transparency with stakeholders is a core part of our business ethos. Our vision is to be a leader in superior shared value for all stakeholders. As symbolised by our Umdoni tree, our stakeholders (and what our relationship with them promises) are: government (economic value), customers (assured product), suppliers (fair market access), employees (better lives), organised labour (membership), communities (upliftment), shareholders (total returns), environment (clean water, air, land). In 2023, we continued to endeavour towards a social compact with stakeholders at our South African operations as per the aspects of the Good Neighbor Agreement (GNA) in the US. In the 23 years of the GNA’s existence, there has been no formal conflict, no arbitration, and no environmental litigation – a significant achievement for any mining company. See The Good Neighbor Agreement fact sheet. We also believe we can only improve our stakeholder relationships by responding to local sensitivities or crises. In a recent perception study the SA region reviewed the quality of its relationships and its performance relative to stakeholder expectations. In terms of the the Perception study (Perception index) conducted, the SA region scored between 40–49% in 2023 (2022: 30–40%), which shows an improvement in stakeholder perceptions. Stakeholder relations are an important matter to Sibanye-Stillwater and we consider the benefits that our decisions will bring to our stakeholders by considering the impact on other stakeholders and the long-term sustainability of our operations. We also consider the environment to be a stakeholder (sharpening our focus on environmental matters). See Minimising our environmental impact, page 186. ENGAGING WITH OUR STAKEHOLDERS IR - 71

Nature of relationship in 2023: Constructive I CORDIAL I Strained COMMUNITIES Why we engage Related strategic differentiator Recognised as a force for good Related residual risks • Failure to enable resilient communities • Not generating sufficient returns to deliver on “force for good” strategy • Misaligned community expectations (SA PGM operations) • Illegal mining and copper theft (SA region) Related opportunities • Strategic partnerships mechanism for building new business activities • Commodity applications and energy solutions to address climate change and the environment Related material matters • Licence to operate • Sociopolitical instability • Talent management and core skills • Climate physical risks • Water management • Safety and health • Profitability Sibanye-Stillwater adopts a stakeholder inclusive approach that balances the needs of our host communities. We have an open-door policy to stakeholders and we proactively deal with issues that concern them. We engage on issues that are material to communities and a grievance mechanism is in place to raise concerns. Stakeholder perception studies take the temperature on attitudes toward the Group. SA region Nature of relationship in 2023: Constructive I CORDIAL I Strained Increasing community pressure is partly due to historical disparities, poor delivery of basic services, increasing poverty and high levels of unemployment. Community protests sometimes disrupt our operations. We engage with our communities to ensure that we manage the social risks and deliver tangible value for communities by 1) helping them take advantage of available opportunities that we offer; 2) learning from them about how we can help to expand socioeconomic opportunities; 3) planning for post-mining economies by considering socioeconomic conditions once a mine has reached end of life. US region Nature of relationship in 2023: CONSTRUCTIVE I Cordial I Strained We regularly engage with the local residents of Sweet Grass country, in which our East Boulder mine is located, and Stillwater County, where our Stillwater mine is located. The US operations has a Good Neighbor Agreement (GNA) in place with environmental protection organisations. The GNA remains a legally-binding agreement holding us to a higher environmental standard than is required by federal and state regulation. The GNA is used as a vehicle for dispute resolution and stakeholder engagement. EU region Nature of relationship in 2023: CONSTRUCTIVE I Cordial I Strained Sandouville requires ongoing engagement with various actors to share our vision for the operations as a leading battery metals platform in Europe. We will not achieve this vision without their buy-in. Keliber is on track to be the first integrated (both mining and refining) lithium hydroxide supplier in Europe, further contributing to our battery metals strategy. We seek to identify stakeholder needs and expectations in a systematical manner and managed effectively. AUS region Nature of relationship in 2023: CONSTRUCTIVE I Cordial I Strained Through the Gulf Communities Agreement the Century operation shares the benefits of mining with the traditional owners of the lands and waters impacted by the Century operation. Active engagements continue to implement the associated initiatives in a manner agreed with impacted communities. ENGAGING WITH OUR STAKEHOLDERS continued IR - 72

How we engage Issues that concern both parties in 2023 Our response and strategy to enhance the quality of our relationship Our primary methods of engagement are: • Meetings, dialogues and town hall engagements with stakeholders • Open days • Pitso – a Sotho word for traditional assembly or gathering (SA region) • Written communications (reports and letters) • Data-free digital information app, Ulwazi (SA region) • Local media and platforms • Industry events • GNA routine interactions • AUS region: Aboriginal development benefit trust, Century environment committee, Century liaison and advisory committee, and Century employment and training committee SA region: Principle issues of concern remains perceived lack of procurement opportunities, employment demands, illegal mining’s impact and air quality matters. US region: Priority issues are talent management and core skills, climate-related risks, and environmental impact. EU region: Priority issues relates to human rights, climate risks, biodiversity, economic contributions and licence to operate. AUS region: Priority issues are development and implementation of the training plan to maximise benefits to local Aboriginal people. See detail on community grievances at the end of this section. ESG awareness is a standing item in community engagement agendas. SA region: Our broad-based livelihoods (BBL) programme promotes self-sustaining food security programmes, Community Gender Based Violence support programme and we have a capacity support programme for municipalities, among various other outreach initiatives. Marikana renewal engagements continues. US region: An engagement process was formalised, aligned to the Initiative for Responsible Mining Assurance (IRMA) requirements. Community giving team committed to support charitable and non-profit interests remain in place. EU region: Engagement strategy involves school, university and industry event participation. For Keliber, a cooperation agreement in place with local vocational institute to support training and development. AUS region: Formal forum engagements are maintained with the Burke and Carpentaria Shire Councils, landowners and interested groups from lower Gulf of Carpentaria. OUTLOOK Enhance engagements in the new jurisdictions of operations to co-create superior value for all stakeholders. • SA region: Sibanye-Stillwater builds trust by demonstrating its shared value, and by supporting constructive partnerships between government, business, labour, and doorstep communities • US region: The relationship with our US community stakeholders, as well as with the neighbouring landowners is anticipated to remain constructive as we continue to be guided by the tenets of the GNA • EU region: Enhance engagements in the new jurisdictions of operations to co-create superior value for all stakeholders • AUS region: Stakeholder engagement and community development initiatives at the Century operations have continued while our Australian operations personnel engage with a wide range of local stakeholders as studies into the proposed restart of the Mt Lyell Copper Mine progress ENGAGING WITH OUR STAKEHOLDERS continued IR - 73

Nature of relationship in 2023: CONSTRUCTIVE I Cordial I Strained EMPLOYEES AND ORGANISED LABOUR Why we engage Related strategic essential and differentiator Ensuring safety and wellbeing; Recognised as a force for good; Inclusive, diverse and bionic Related residual risks • Failure to enable resilient communities • Lack of technical and operating capability • Company resilience against catastrophes and pandemics • Not generating sufficient returns to deliver on the “force for good” strategy Opportunities • Becoming a digital-first organisation Material matters • Safety and health • Licence to operate • Sociopolitical instability • Talent management and core skills • Culture and values • Diversity and inclusion Sibanye-Stillwater employs 82,788 people at its operations. In the interests of ameliorating conditions that may lead to costly strike action, or other labour disturbances, it is imperative that we build constructive relationships with unions, and with employees generally, based on mutual trust and understanding. How we engage Issues that concern both parties in 2023 Our response and strategy to enhance the quality of our relationship The WeROne app is our digital platform for engaging with employees. Further methods include: • Meetings (face-to-face and virtual) • Company briefs • Text messages • Podcasts We engage with recognised trade unions through: • Formal meetings • Regional meetings, every quarter Various options, formal and informal, are available to employees to raise concerns or to log a grievance. We encourage employees to speak up and express themselves, particularly if it relates to workplace safety. Also see Care for iMali: Taking care of personal finance fact sheet, www.sibanyestillwater.com/news- investors/reports/annual/ • Culture and values (finding common cause) • Safety and health (promoting compliance and encouraging employees to speak up about unsafe conditions) • Talent management and core skills (a conducive work environment for encouraging career growth) • Diversity and inclusion (a welcoming environment for women; no discrimination) • Licence to operate (credibility as a compliant employer who cares) • Group-wide organisational growth programme to promote a shared, values- based culture • Safety commitments to critical controls, critical life-saving behaviours and critical management routines (See Safe production, page 125) • Quarterly employee updates are provided by EVPs in operations; strategic conversations are held by the C-suite to allow for interaction on performance and strategic focus areas OUTLOOK Engagements with employees and organised labour are conducted in a spirit of mutual respect. ENGAGING WITH OUR STAKEHOLDERS continued IR - 74

Nature of relationship in 2023: CONSTRUCTIVE I Cordial I Strained INVESTORS AND CAPITAL PROVIDERS Why we engage Related strategic essential and differentiator Ensuring safety and wellbeing; Maintaining a profitable business and optimising capital allocation Related top residual risks • Energy availability • Climate change – Physical risks • Entry into new markets and geographies • Not generating sufficient returns to deliver on “force for good” strategy • Company resilience against catastrophes and pandemics • Sub-optimal and failed acquisitions (due diligence and integration) Opportunities • Need for security of supply of critical minerals • Strengthening the role of investment commodities in the global monetary system • The imperative of resource stewardship and green production of scarce minerals Our material matters • Profitability • Capital allocation • Macroeconomic and geopolitical volatility • Culture and values • Safety and health • Climate transitional and physical risks By understanding the requirements of our investors and capital providers, and meeting their value expectations, we grow trust in our organisation, which, in turn strengthens our access to capital. Our relationship with investors and shareholders is constructive and transparent – in line with our public disclosures. How we engage Issues that concern both parties in 2023 Our response and strategy to enhance the quality of our relationships • Investor meetings: one-on-one and groups • Telephone and conference calls • Conferences and investor days • Formal, regular reporting • Company and regulatory announcements • Profitability and protecting the Balance sheet during the downturn in PGM prices • Understanding the PGM markets and when a price recovery is likely • Allocating capital wisely and preserving cash • Safety and climate risks • Possibility of PGM supply cuts and plans for the US PGM operations as a primary palladium producer • Concerns about the losses incurred at the Sandouville refinery • Responsible management of Sibanye- Stillwater’s financial position to ensure we meet stakeholder expectations • Providing details on the proactive actions taken to protect and strengthen the Balance sheet • Alternatives (pCAM production) for the Sandouville refinery moving from concept to prefeasibility stage • Investors receive regular updates relating to all material matters OUTLOOK Positive, as we deepen understanding of our battery metals strategy and our purpose to Safeguard global sustainability through our metals. ENGAGING WITH OUR STAKEHOLDERS continued IR - 75

Nature of relationship in 2023: Constructive I CORDIAL I Strained GOVERNMENT AND REGULATORS Why we engage Related strategic essentials and differentiators Prospering in every region in which we operate; Ensuring safety and wellbeing; Building pandemic-resilient ecosystems Related risks • Energy availability • Failure to enable resilient communities • Climate change – Physical risks • Entry into new markets and geographies Opportunities • Strategic partnership mechanism for building new business activities • Africa as an emerging source of critical minerals • Stakeholder sentiment and regulatory frameworks Material matters • Safety and health • Licence to operate • Sociopolitical instability • Culture and values As a South Africa domiciled company, Sibanye-Stillwater supports growth and development in the region, through investment (our own and others). We contribute to the fiscus, provide jobs, uplift low-income communities, train people, improve infrastructure, etc., and are de facto partners of government in their developmental aims. We engage with them to promote a more amenable operating environment through pragmatic policy-making, law and order, and fair enforcement of regulation, among other matters. Our permits depend on fulfilling various ESG commitments, notably the Social Labour Plans (SLP), on which we engage with government bodies. How we engage Issues that concern both parties in 2023 Our response and strategy to enhance the quality of our relationship • Monthly and quarterly meetings held with various government departments; ad hoc meetings when the need arises • Written reports • Engagement through industry bodies such as the Minerals Council in South Africa and the National Mining Association in the US • Engagement on critical minerals strategy • Regulatory compliance • Delivery on SLPs • B-BBEE compliance • Policy coherence and pragmatism • Illegal mining and other law and order issues • Detailed project plans with defined timelines communicated to the DMRE • Continued to work with industry bodies to solve regulatory challenges OUTLOOK In terms of security, in 2023 our engagements with authorities yielded an improved/encouraging response. We will continue to engage with government at different levels: national, regional and local. Our engagements in other regions are generally good, with the shared goal of economic prosperity. ENGAGING WITH OUR STAKEHOLDERS continued IR - 76

Nature of relationship in 2023: Constructive I CORDIAL I Strained SUPPLIERS AND CUSTOMERS Why we engage Related strategic essentials and differentiators Achieving operational excellence and optimising long-term resource value Related risks • Failure to enable resilient communities • Entry into new markets and geographies • Rate of technological change (in respect of current and future operations and energy solutions) • Not generating sufficient returns to deliver on force for good Opportunities • Commodity applications and energy solutions to address climate change and the environment • Strategic partnership mechanism for building new business activities Material matters • Climate physical risks • Licence to operate • Sociopolitical instability • Macroeconomic and geopolitical volatility There is increasing third-party focus on value chains (from an ESG perspective), and thus we engage suppliers to ensure they are committed to meeting our ESG standards. The automotive industry is our main PGM customer category. These customers are becoming increasingly concerned about their value chain and the ESG credentials of suppliers; thus we need to assure them of such. We need to consider our scope 3 emissions (i.e., the emissions of suppliers in delivering to us). How we engage Issues that concern both parties in 2023 Our response and strategy to enhance the quality of our relationship • Frequent written, verbal and in-person engagements as required, as well as workshops for suppliers • Customers engaged through our marketing function • Conducting annual customer surveys to ensure we are meeting requirements and improving our service • Broadening engagement with customers to include access to experts on specific topics of interest such as carbon, communities, etc. • Engagements through membership organisations such as the International Platinum Association • Supplier days (including ESG awareness supplier day) • Small, medium and micro enterprise training development initiatives • Transparency in the procurement process • Market intelligence and understanding trends • Complying with long-term supply agreements with customers • Increasing engagements on ESG sand sustainability topics (including emissions) • Progressing responsible sourcing practices • The Coupa procurement system in the SA region improves tracking, cost control and compliance, streamlining supplier registration and helping smaller players join our supply chain. See Socioeconomic development, page 223 • We assist companies willing to pursue empowerment transactions to enhance their B-BBEE status • Two toll-free lines for reporting irregularities and misconduct; independently managed to ensure confidentiality OUTLOOK Responsible sourcing is a Group sustainability priority; we will continue to improve assurance in this area. ENGAGING WITH OUR STAKEHOLDERS continued IR - 77

SA stakeholder grievances Sibanye-Stillwater has a grievance procedure and a grievance register. The procedure forms an integral part of stakeholder awareness to ensure that all stakeholders are empowered to report any social, environmental and governance related issues. Communication materials translated into local languages are shared with all relevant stakeholders on a regular basis. All social incidents are recorded and closed out appropriately following investigation and remedial actions. The outcome of each investigation is shared with the complainant timeously or in some cases, especially where the issue is common, shared with stakeholders during engagement forums. All recorded social incidents are classified according to impact on both the affected stakeholder(s) and to impact on Sibanye Stillwater. Enough resources are allocated, especially where there are potential human rights issues. Sibanye-Stillwater applies a cross-functional model approach when attending to grievances. The experiences of this multi-disciplinary approach ensures improved risk management as well as management and effectiveness of controls. Social incidents, corrective actions and preventive actions that reduce the likelihood of a social incident recurring are evaluated to ensure they would not result in unforeseen negative impacts, particularly in human rights. Some of the prescribed reporting mechanisms include social media monitoring, radio channels, self-reporting (where employees proactively report incidences before they have adverse negative impact to stakeholders), e-mail, letter, phone (including the anonymous toll-free line which is independently managed). Moreover, stakeholders can walk into any office at Sibanye-Stillwater and register a complaint. Sibanye-Stillwater officials are often called to receive memorandums during community and labour protest. All memorandums received are responded. In 2023, the SA region accounted for 123 complaints (171 in 2022) relating to various categories, as outlined in the graph below. Our US region also monitors grievances received and received 13 complaints. Also see our Grievance procedure available, www.sibanyestillwater.com/sustainability/reports-policies/ US REGION: TOTAL NUMBER OF COMPLAINTS AND GRIEVANCES IN 2022 4 17 1 Traffic Community development Air Quality Tailings storage facility SA REGION: TOTAL NUMBER OF COMPLAINTS AND GRIEVANCES IN 2023 16 12 3 21 27 10 11 4 2 5 12 Procurement (local SMMEs opportunities/tender process/complaints about non-local businesses) (2022: 46) Community development (2022: 45) Housing and infrastructure (2022: 8) Environmental issues (2022: 10) Recruitment opportunities (2022: 37) Cultural heritage and land (2022: 2) Training and skills development (2022: 3) Safety issues (tailings and illegal mining) (2022: 7) Health and wellness (2022: 0) Transport and engineering (2022: 9) Legal related matters (2022: 8) ENGAGING WITH OUR STAKEHOLDERS continued IR - 78

SA REGION: COMPLAINTS AND GRIEVANCES OPEN AND CLOSED PER OPERATIONS Issue open 2023 Issue closed 2023 Issue open 2022 Issue closed 2022 Burnstone Driefontein Kloof and Cooke Beatrix Rustenburg Limpopo Marikana Brakpan 0 10 20 30 40 50 60 70 80 0 25 50 75 100 COMPLAINTS AND GRIEVANCE PROCEDURE FLOW-CHART ENGAGING WITH OUR STAKEHOLDERS continued IR - 79

HOW WE CREATE VALUE: OUR BUSINESS MODEL HOW WE CREATE VALUE: OUR BUSINESS MODEL continued IR - 80 At the heart of our value creation business model, sits the Umdoni tree. The leaves of our Umdoni tree represent all our stakeholders. These relationships that we rely on are nurtured through upholding our values – the roots of the tree, see our Strategy unpacked, page 48 The value creation process (references and links to relevant sections) FINANCIAL MANUFACTURED INTELLECTUAL HUMAN RISKS AND OPPORTUNITIES (see page 51) STRATEGY AND RESOURCE ALLOCATION (See Chairman’s and CEO’s Review, page 16 and CFO’s Report, page 92) PERFORMANCE (Section 3, see page 88) OUTLOOK (See Strategic Differentiators, page 50, Operational Outlook, page 110, and Future Focus summaries in each performance section SOCIAL AND RELATIONSHIP NATURAL Value creation (preservation, diminution) over time, see Capital Trade-offs, page 84 MISSION AND VISION Material matters and factors in our external business environment impact on our ability to create and preserve value for our stakeholders (see page 3) FINANCIAL MANUFACTURED INTELLECTUAL HUMAN SOCIAL AND RELATIONSHIP NATURAL Page 81 Page 82 Page 82 Page 83 Grey elephants – aspects of relevance to our business activities (see page 35) Source: See https://integratedreportingsa.org/ircsa/wp-content/uploads/2017/05/13-12-08-THE-INTERNATIONAL-IR-FRAMEWORK-2-1.pdf (see page 36)

INPUTS Key resources and relationships needed for value creation NATURAL CAPITAL • Mineral Reserves: 2023 Mineral Reserves 65.3Moz (2022: 70.7Moz) • Land under management: 63,891ha in SA (2022:63,891ha) 1,133ha in US (2022: 1,089ha) 483ha in Europe 58,609ha in Australia • Volume of rock extracted: PGM 37.2Mt (2022: 37.8Mt) gold 31.9Mt (2022: 36.2Mt) • Resources consumed: – 52,076Ml water (2022: 39,441Ml) – 6.8TWh electricity (2022: 6.13TWh) – 33,823kl diesel (2022: 34,985kl) FINANCIAL CAPITAL • Equity, debt and cash flow used to enhance other resource inputs • R22.1bn/US$1.2bn spent to sustain and grow the business (2022: R15.9bn/US$971m) • Building meaningful relationships with downstream partners to meet their supply for critical commodities HUMAN CAPITAL • An empowered workforce totalling 82,788 permanent and contract employees across the Group (2022: 84,481) • R1.05bn invested at the SA region, US$3.6m (R66.3m) at the US region and €0.22m (R4.3m) at the EU region in training and skills development (2022: R1.08bn, US$5.21m (R85.2m) and €0.15m (R2.58m)) • Fatal elimination strategy focused on critical controls, critical life saving behaviour and critical management routines • Group-wide cultural transformation programme underway MANUFACTURED CAPITAL • Mining rights and leases and monitoring of key regulatory areas • Operational infrastructure, associated infrastructure and equipment • Production costs 2023: R90bn/US$5bn (2022: R95bn/US$6bn) • Capital expenditure (growth projects) 2023: R7bn/US$373m (2022: R4bn/US$264m) • Expenditure on sustaining the business and ore reserve development 2023: R15.2bn/US$825m (2022: R11.6bn/ US$708m) SOCIAL AND RELATIONSHIP CAPITAL • Baseline of socioeconomic status of host communities in South Africa as input to post-mining planning • Partnerships with government on human settlements, and alternative economic programmes • Confidence from shareholders and investors • Capacity-building of local municipalities and traditional authorities • Responsible sourcing framework in place INTELLECTUAL CAPITAL • Optimised mining and processing processes underpinned by institutional knowledge, intellectual property, company culture, and operating systems • Skills and expertise required in being one of the world’s largest PGM producers • New acquisition grows the talent pool and introduces new skills for continuous learning For more information on risks, see Managing our risks and opportunities within the external operating environment, page 51 HOW WE CREATE VALUE: OUR BUSINESS MODEL continued IR - 81

BUSINESS ACTIVITIES ACROSS OUR VALUE CHAIN OUTPUTS AND BY-PRODUCTS OUTPUTS MINING BY-PRODUCT • Platinum 1,152,025oz (2022: 1,124,891oz) • Palladium 855,717oz (2022: 841,330oz) • Rhodium 157,747oz (2022:153,401oz) • Gold 841,697oz (2022: 652,860oz)1 • 3E PGMs recycled 310,314oz (2022: 598,774oz) • Nickel 7,125tNi (2022: 6,842) • Zinc (payable) 76kt • Tailings 41.5Mt (2022: 41.31Mt) • Waste rock 3.12Mt (2022: 3.44Mt) • Hazardous waste to landfill 46,764.73t (2022: 30,426.5t) HOW WE CREATE VALUE: OUR BUSINESS MODEL continued IR - 82 The fruits of our Umdoni tree signify the shared value we create for our stakeholders through delivering on our output objectives (See Our shared value in numbers on page 290) 82,788 employees incl. contractors R30.6 billion paid in salaries and benefits R2.7 billion invested in socioeconomic development and CSI R4.1 billion taxes and royalties2 R1 billion invested in training and development ~R1.1 billion paid over the last two years (2022 & 2023) to over 65,000 beneficiaries in the form of dividends and other employee share option scheme payments 1 From PGM and SA gold operations 2 Taxes and royalties paid as per the consolidated statement of cash flows in the Group Annual financial report 2023 ACQUIRE AND MINE ACQUIRE AND RETREAT/RECYCLE EXTRACT, PROCESS AND REFINE ENVIRONMENTALLY MANAGE AND REHABILITATE SALES AND MARKETING • Primary producer of platinum, palladium and rhodium and top- tier gold producer • Produces iridium, ruthenium, nickel, chrome, copper and cobalt • Meaningful progress with the growth in the EU region and development of Rhyolite Ridge project in Nevada • One of the foremost global recyclers of PGM autocatalysts • Owns and operates the Century zinc tailings retreatment operation • Acquired Reldan, a recycling group which reprocesses various waste streams, including industrial and electronic waste to recycle green precious metals • Our value chain for 2023 included the mining, refining and marketing of precious metals and base metals • Majority shareholder in DRDGOLD, a specialist in the recovery of residue metal from retreatment of surface tailings • Increased exposure to circular economy through our autocatalyst recycling facilities in the US and zinc retreatment facility in Australia • The particular combination of chemical and physical properties of PGMs, means they retain intrinsic value to end- markets. PGMs have unique catalytic properties, and high thermal resistance. Their uses of in higher- volume industrial and medical application with iridium and ruthenium, give it them an important niche technology application SOURCES OF COMPETITIVE ADVANTAGE • Geographic and product diversity; cash-generative assets • Mine-to-market PGM pipeline on two continents, including recycling • Ability to deliver strategic transactions and partnerships • Agile and adaptable leadership, with extensive experience

OUTCOMES The material impacts of our activities on our key resources and relationships l Value created l Value preserved l Value eroded See supplementary information, Progressing the UN’s SDGs NATURAL CAPITAL l	Total GHG emissions (scope 1 and 2): 6,631Mt CO2e (2022: 6.686Mt CO2e) l	Carbon intensity: 0.14t CO2e per tonne milled (2022: 0.13t CO2e per tonne) l	R1.91m/US$0.1m carbon tax paid (2022: R1.89m/US$0.1m) l	Two level 3 environmental incidents (2022: one level 3) l	12,635 Ml reduction in net water used (2022: 8,208 Ml) l	8,228 hectares disturbed by our mining activities (2022: 6,048) ALIGNING OUTCOMES WITH THE SUSTAINABILITY THEMES AND SDGs Developing a climate change-resilient business Secondary SDGs 1, 2, 6, 7, 9, 11 FINANCIAL CAPITAL l	Revenue R113.7bn/US$6.2bn (2022: R138bn/US$8.4bn) l	Net cash decreased from R5.9bn/US$344m to (R11.9bn)/(US$642m) l	Headline earnings of R1.8bn/US$0.1bn (2022: R18.4bn/US$1.1bn) l	Share price decreased by 44% to R24.90/US$1.35 per share at year-end (2022: 9% decrease to R44.72/US$2.73 per share) l	Market capitalisation (31 Mar 2024) of R61.4bn/US$3.3bn (31 Mar 2023: R104bn/US$5.9bn) l	Total dividends of R5.3bn/US$289m paid for 2023 (2022: R9.5bn/US$578m) Data-driven and considered decision-making Secondary SDGs 9, 12, 17 HUMAN CAPITAL l	Tragically, there was one fatality at the US PGM, two fatalities at the SA PGM, and eight fatalities at the SA gold operations (2022: five) l	Recorded an overall decrease in the number of lost-time injuries to 766 (2022: 668) l	R30.6bn/US$1.7bn paid in salaries and wages to employees (2022: R26.5bn/US$1.6bn) l	Focus on gender diversity has increased: 17.2% of all employees are female (2022: 16.2%) and female board members remained 31% in 2023 (2022: 31%) l	At our SA operations the TB rate per 1,000 employees reduced year-on-year from 4.95 to 4.23 Embedding human rights and ethics: Inside and out Secondary SDGs 1, 2, 3, 4, 8, 9, 10 MANUFACTURED CAPITAL l	Construction of the Keliber lithium refinery commenced in Q1 2023 and concentrator earth works started in Q4 2023 l	Capital investment of c. R12-14bn funded through third-party power purchase agreements (PPAs) for renewable projects at SA operations; development of a diverse fleet of battery-electric and semiautonomous vehicles Developing a climate change-resilient business Secondary SDGs 1, 2, 6, 7, 9, 11 SOCIAL AND RELATIONSHIP CAPITAL l	R105bn/US$5.7bn in total economic value distributed (2022: R120bn/US$7.3bn) l	Maintained the Good Neighbor Agreement l	Invested R2.6 bn/US$142m on social and labour plans and CSI (2022: R2.3bn/US$141m) l	Responsible and preferential local procurement of R25,018 million (2022: R21,415m) in South Africa l	R4.1bn/US$0.2bn paid in taxes and royalties (2022: R10.7bn/US$0.7bn) l	Robust relations with the governments in South Africa, US and EU Entrenching long-term economic sustainability: Integrated post mining economy Secondary SDGs 1, 4, 6, 8, 9, 11, 12, 17 INTELLECTUAL CAPITAL l	Invested in developing and maintaining the Group’s mining processes, operating systems and company culture, including through our investments in skills development, research and development, and increasing digitalisation of processes across our operations l	Invested R87.8m in innovation and technology (2022: R125m) l	Supported 580 bursaries at tertiary level (2022: 563) (numbers inclusive of bursaries retained from previous year) Data-driven and considered decision-making Secondary SDGs 9, 12, 17 HOW WE CREATE VALUE: OUR BUSINESS MODEL continued IR - 83

CAPITAL TRADE-OFFS: STRATEGIC MANAGEMENT FOR SHARED VALUE 1 Our proactive initiatives implemented to protect and strengthen the Balance sheet force us to optimise loss-making sections and may also slow growth in green metals and energy solutions Links to: 2023 STRATEGIC ESSENTIAL: Maintaining a profitable business and optimising capital allocation 2023 STRATEGIC DIFFERENTIATOR: Unique global portfolio of green metals and energy solutions 2023 MATERIAL MATTERS: M1, M4 SDGs IMPACTED: 8.2, 8.5, 7.3, 9.4, , 17.13 • With weaker commodity prices impacting the profitability of the Group during 2023 and start of 2024, net cash generation slowed • Limited profitability/losses impact the amount of cash available for distribution in line with the Capital allocation framework • Proactive initiatives to protect and strengthen the balance sheet may include reducing non-essential growth capital, contemplating slowing the allocation to our battery metal projects and/or growing through acquisitions while profitability is low • Proactive measures include lower cost to reduce cash flow, which results in restructuring despite various mitigation measures implemented to limit job losses • Alternative funding mechanisms may include streams, hedges or pre-pays, which will assist in lowering the risks of higher leverage and improving liquidity, providing upfront funding of equity in nature, but giving away future production/sales in possibly stronger price environments CAPITALS IMPACTED l Value created l Value preserved l Value eroded HUMAN CAPITAL l	When done proactively, human resources (jobs) will be preserved in future l	Improving the livelihoods of employees, contractors and suppliers who have been impacted by restructuring l	Losing the skills and funds invested into upskilling employees when employees are retrenched FINANCIAL CAPITAL l	Low commodity prices resulting in reduced profitability and/or losses l	Proactive initiatives may preserve some financial capital in future l	Should the initiatives be effective and reduce the cost structure, value will be created when commodity prices increase again l	With cash preservation, the financial capital allocated to our green metals might be reduced SOCIAL AND RELATIONSHIP CAPITAL l	Low morale in sections where rightsizing and cost reduction are required l	Working together with trade unions, employees and stakeholders to find alternatives to retrenchments preserves and sometimes even builds relationships with job preservation as common outcome INTELLECTUAL CAPITAL l	Losing the skills and funds invested into upskilling employees when employees are retrenched l	May delay some non-core innovation projects as part of the cash preservation efforts, delaying creation of some intellectual capital MANUFACTURED CAPITAL l	Slowing or stopping construction of some projects and merger and acquisitions l	Advancing only the best and most strategic projects due to the more focused investment CAPITAL TRADE-OFFS: STRATEGIC MANAGEMENT FOR OPTIMUM VALUE CREATION IR - 84 We recognise that there is a constant flow between and within capitals as they are created or eroded. Daily decisions which result in capital trade-offs are causal to these interdependencies. The following captures a selection of key trade-offs through which various capital stocks were enhanced or depleted through our operations. Further, the decision to select the following key trade-offs was informed by our material matters, risk universe, and our strategy. Although this is not an exhaustive list, the below provides an overview of how we draw the links between our capital components that influence value creation over time. We have linked the capital trade-offs below with the relevant Strategic pillars, our Material matters and the SDGs, to which each relates. Also, see our Group impact supplement to read about the impacts as a result of capital trade-offs, www.sibanyestillwater.com/ news-investors/reports/annual/. MATERIAL MATTERS (see page 3) M1 Profitability M2 Safety and health M3 Licence to operate M4 Capital allocation M5 Energy supply and security M6 Sociopolitical instability M7 Macroeconomic and geopolitical volatility M8 Climate transitional risk M9 Climate physical risk M10 Water management M11 Culture and values M12 Innovation and digital evolution M13 Talent management and core skills M14 Diversity and inclusion

2 Our commitment to Zero harm safety, overrides meeting short-term production targets Links to: 2023 STRATEGIC ESSENTIAL: Ensuring safety and wellbeing 2023 MATERIAL MATTERS: M1, M2, M3, M11, M12 SDGs IMPACTED: 8.8, 3.8, 9.2 • Our commitment to maintaining a safe working environment and to delivering on our aspiration of Zero harm, underpins all our activities • Focus on leading indicators and risky behaviours means improved reporting and recording of high-potential injuries • Voluntary work stoppages are implemented when there are clearly identified risks, affirming our core principle of Zero harm over meeting production targets • Investment of financial capital and workforce time to secure health and safety improvement and management across all aspects of our operations CAPITALS IMPACTED l Value created l Value preserved l Value eroded HUMAN CAPITAL l	Time invested in safety training of staff l	More effectively-trained workforce, with an embedded safety culture l	Lowest serious injury frequency rate recorded for the 2023 year l	Safeguarding the lives of our employees daily l	Eleven fatalities despite our efforts l	Potential for fewer jobs if safer technologies replace certain high-risk activities FINANCIAL CAPITAL l	Costs incurred from capital invested in safety programmes, initiatives, and technologies l	Reduced legal stoppages (e.g., Section 54s) as a result of improved safety sustains stable production l	Reduced care and maintenance costs l	Reduced legal liabilities and remedial costs SOCIAL AND RELATIONSHIP CAPITAL l	Safe production in line with ICMM requirements l	Increased trust or perception with improved safety results l	Life saving behaviour INTELLECTUAL CAPITAL l	Technical capabilities and expertise, safety certification, Zero harm framework, deployment of new technology MANUFACTURED CAPITAL l	Investment in new safe technologies l	Investment in visualising of safety risks through communication technology CAPITAL TRADE-OFFS: STRATEGIC MANAGEMENT FOR OPTIMUM VALUE CREATION continued IR - 85 A NOTICE BOARD UNDERGROUND AT THE MARIKANA SA PGM OPERATIONS

3 Disrupting traditional ways of work to embrace our position as a digital-first organisation Links to: 2023 STRATEGIC DIFFERENTIATORS: Inclusive, diverse and bionic Building a pandemic-resilient ecosystem 2023 MATERIAL MATTERS: M2, M11, M12 SDGs IMPACTED: 8.5, 9.2, 13.3,17.17 • By embracing digital-first we are making significant investments in new technologies, adopting modernised work systems, and supporting more flexible remote working patterns • Our drive to become a digital-first organisation is disrupting traditional ways of working, resulting in some potentially significant changes in terms of people, plant, and processes CAPITALS IMPACTED l Value created l Value preserved l Value eroded FINANCIAL CAPITAL l	Substantial financial investment in technology innovation l	Delivering enhanced efficiencies and creating new market opportunities HUMAN CAPITAL l	Key benefits to employees: less commuting, facilitation of transnational teamwork, access to greater pool of global talent through remote working l	Improved safety, productivity and working environment through new technologies l	Skills retention and attraction owing to ease-of-work and remote opportunities l	Potential job losses and changes to existing tasks as digital technology replaces existing work needs SOCIAL AND RELATIONSHIP CAPITAL l	Possible erosion of in-person relationship building and personal connection l	Potential to increase diversity and inclusion NATURAL CAPITAL l	Environmental benefits through enhanced operational efficiencies and productivity l	Environmental cost associated with e-waste and emissions from energy-intensive data centre INTELLECTUAL CAPITAL l	Investing in technologies, systems and processes l	Sibanye-Stillwater iXS technology incubation and development initiative, data security and protection l	Key capacity and capability constraints limiting digital transformation l	WITS University Digimine partnership MANUFACTURED CAPITAL l	Existing plant and equipment becomes obsolete l	Commitment to continuous improvement and updates maintains digital infrastructure l	Global supply chain shortage impacting the availability of technology CAPITAL TRADE-OFFS: STRATEGIC MANAGEMENT FOR OPTIMUM VALUE CREATION continued IR - 86

4 Mining mineral resources to advance our green metals strategy Links to: 2023 STRATEGIC DIFFERENTIATOR: Unique global portfolio of green metals and energy solutions that reverse climate change 2023 MATERIAL MATTERS: M4, M8, M9 SDGs IMPACTED: 6.4.1, 13.1, 11.5, 9.4, 7.2, 12.2 • To position Sibanye-Stillwater as a key resource player in the emerging low-carbon economy, we are making substantial investments in exploration, mining and acquisition through our green metals strategy (excluding the recycling and secondary mining investments) • These investments and activities carry financial risks and have associated social and environmental impacts, but offer significant long-term benefits in providing the resources necessary to effect the transition to a low-carbon economy CAPITALS IMPACTED l Value created l Value preserved l Value eroded FINANCIAL CAPITAL l	Costs incurred in investment in green metals strategy l	Protecting share price through improved reputation and fulfilling the ESG agenda l	Potential access to green financing l	Financial sustainability and agility in the face of volatile global dynamics NATURAL CAPITAL l	Possible negative environmental impacts associated with exploration and extraction of ‘green metals’ l	Role of metals in supporting the transition to a lower-carbon economy SOCIAL AND RELATIONSHIP CAPITAL l	Employment opportunities through growth l	Supplying the green economy with metals – supports wider value chain and new growth opportunities relating to green technology l	Perceived negative social/local community impact of mining MANUFACTURED CAPITAL l	Investment in new plant, equipment and technologies INTELLECTUAL CAPITAL l	Increased geographical and product diversity l	Stimulating innovation in green energy and battery metal intelligence l	Upskilling as pioneers in the sector HUMAN CAPITAL l	Employment opportunities and opportunities to upskill l	Potential long-term health impacts on employees through occupational hygiene exposure 5 Protecting workers’ rights to a fair wage and upholding our social licence to operate, while ensuring the Group’s business viability in an increasingly competitive environment Links to: 2023 STRATEGIC DIFFERENTIATOR: Recognised as a force for good 2023 MATERIAL MATTERS: M1, M3, M6, M13 SDGs IMPACTED: 8.6, 10.4 • We uphold workers’ fundamental rights to freedom of association and collective bargaining and hold wage negotiations to agree fair remuneration and note that local laws also protect these rights • Fair wages and active engagement maintain productivity and social stability. Our wage dispute mechanisms minimise industrial action • Wages also constitute a large part of our costs and, therefore, to keep the Group competitive and profitable, we will make the case against unreasonable wage demands that threaten the viability of our operations • In March 2022, two unions (NUM and AMCU) at our SA gold operations embarked on protected strike action after rejecting our wage offer; the strike lasted three months, ending in June, after which we signed a three-year agreement with the unions (NUM, AMCU, UASA and Solidarity) • We’ve since secured five-year wage agreements at our Rustenburg, Marikana, and Kroondal PGM operations, ensuring short to medium-term stability CAPITALS IMPACTED l Value created l Value preserved l Value eroded FINANCIAL CAPITAL l	Periodic wage increases l	Costs incurred from any productivity decline during industrial action l	Longer-term viability ensured through trust-based negotiations that balance employee needs with the Group’s competitiveness SOCIAL AND RELATIONSHIP CAPITAL l	Constructive relationships built with fair labour practices and frank engagement l	Any failure to prevent industrial action results in unrest and increased distrust l	Compliance with labour legislation HUMAN CAPITAL l	Employment opportunities protected l	Failure to reach resolution of wage negotiations l	Lost operational time and loss of income when embarking on industrial action in the short term l	Preserving jobs and livelihoods in the medium to long term CAPITAL TRADE-OFFS: STRATEGIC MANAGEMENT FOR OPTIMUM VALUE CREATION continued IR - 87

3.1 Maintaining a profitable business and optimising capital allocation 89 Chief Financial Officer’s report 90 3.2 Achieving operational excellence and optimising long-term resource value 103 Delivering value from our operations and projects 104 Mineral Resources and Mineral Reserves: a summary 114 3.3 Ensuring safety and wellbeing 124 Continuous safe production 125 Health, wellbeing and occupational hygiene 136 3.4 Inclusive, diverse and bionic 147 Empowering our workforce 148 Harnessing innovation 171 3.5 ESG embedded as the way we do business 180 Social, Ethics and Sustainability Committee: Chairman’s report 181 Minimising our environmental impact 186 Socioeconomic development 213 Governance in sustainability: Our considered decision-making 229 SIBANYE-STILLWATER INTEGRATED REPORT 2022 88 OUR PERFORMANCE 3

OUR BUSINESS AND LEADERSHIP WHAT DRIVES US OUR PERFORMANCE REWARDING DELIVERY ANCILLARY INFORMATION £ DOWNLOAD CORE INTEGRATED REPORT IR - 89 MAINTAINING A PROFITABLE BUSINESS AND OPTIMISING CAPITAL ALLOCATION

CHARL KEYTER – Chief Financial Officer WHAT WE DID IN 2023 SUCCESSES • Equity funding for the Keliber lithium project complete • SA gold operations entered into a gold hedge with ~60% of 2024 production hedged at a floor of R1.1m/kg and cap of R1.4m/kg • SA PGM operations continue to move down the industry cost curves despite instances of load curtailment and other operational factors impacting production e.g., copper cable theft • US$500m convertible bond provides financial flexibility at reasonable cost, partially designated to fund the Reldan acquisition and the balance to enable further delivery on our strategic growth objectives • Group decarbonisation accelerated with three renewable energy projects providing 267MW of solar and wind energy, financed through a third-party power purchase agreement (PPAs) which assists with capital preservation • Solid balance sheet and financial flexibility with strong liquidity headroom and 0.58x net debt: adjusted EBITDA ratio CHALLENGES • Earnings and cashflow impacted by steep decline in PGM commodity prices • Lower medium to long term prices (PGM and nickel), operational constraints, above inflation increases and deferral of the Burnstone project to preserve cash in terms of the Group’s Capital allocation framework, resulted in an impairment of R47.5bn (US$2.6bn) across the Group • Loss for the period of R37.4bn (US$2bn) compared to a profit of R19.0bn (US$1.2bn) for 2022 • No final dividend due to loss for H2 2023, in line with dividend policy From a financial perspective, the entirety of our strategy applies, but with special emphasis on our strategic essential: Achieving operational excellence and optimising long-term resource value. The related material financial matters identified in our materiality determination process are Capital allocation and Profitability. Governance of our financial performance and reporting is overseen and monitored by the Audit Committee, on behalf of the Board. (See Corporate governance). MAINTAINING A PROFITABLE BUSINESS AND OPTIMISING CAPITAL ALLOCATION – CFO REPORT IR - 90 CHIEF FINANCIAL OFFICER’S REPORT “With a well-staggered debt maturity ladder, in a weak PGM price environment we will focus on meeting production targets, capitalise on cost saving initiatives and responsibly preserve cash on our balance sheet.”

2023 – A BRIEF OVERVIEW ––––––––––––––––––––––––––––––––––––––––––––––––––––––––––––––––––––––––––––––––––––––––––––––––––––––––––––––––––––––––––––––––––– During 2023, we had to navigate an environment of lower commodity prices, with the exception of gold, continued industry wide global slowdown of the autocatalysts recycling market at our US PGM recycling business, and localised operational challenges in South Africa such as copper cable theft, floods and heavy rainfall at both our Century zinc retreatment operation and Sandouville nickel refinery. Our managed SA gold operations achieved increased production, following the impact of the strike in 2022, to capitalise on the higher average gold price during 2023. This translated into revenue for 2023 of R113.7 billion (US$6.2 billion), compared to R138.3 billion (US$8.4 billion) for 2022. In terms of project capital to date, we have spent approximately R2.7 billion (US$148 million) on Burnstone, R2.0 billion (US$110 million) on K4 and R2.5 billion (€124 million) on Keliber. On 25 April 2023, the equity raise was completed with the Finnish Minerals Group, increasing its holding in the Keliber lithium project from 14% to 20%, by subscribing for €54 million of the €104 million rights issue. Despite operating in a challenging lower commodity price environment during 2023, we have maintained our cash reserves which at year end were R25.6 billion ($1.4 billion). We also paid out an in interim dividend of R1.5 billion (US$81 million) at a 35% of normalised earnings dividend pay-out ratio for half year 2023. In line with Sibanye-Stillwater’s Dividend policy and its Capital allocation framework, the Board of Directors resolved not to declare a final dividend for 2023. Net debt to adjusted EBITDA ended at 0.58x for 2023 from a net cash to adjusted EBITDA ratio of 0.14x in 2022. The steep decline in PGM prices impacted both adjusted EBITDA and free cash flow and contributed to the deterioration in net debt to adjusted EBITDA in 2023. In November 2023, the Group executed the well-timed issue of the US$500 million convertible bond due in 2028, which was multiple times oversubscribed. These convertible bonds provide financial flexibility at a reasonable cost under market conditions. Lower revenues for 2023 were mainly due to the lower commodity prices, primarily PGM prices, and the impact of the slowdown of the autocatalysts recycling market at our US PGM recycling business. Despite above inflation increases in almost all input costs, cost of sales before amortisation and depreciation was down 2%. Group adjusted EBITDA for 2023 decreased by 50% or R20.6 billion (US$1.1billion) to R20.6 billion (US$1.1 billion). Taxes and royalties decreased due to the lower profitability. The Group ended with a loss for the year of R37.4 billion (US$2.0 billion), after raising non-cash impairments of R47.5 billion (US$2.6 billion), and normalised earnings1 of R1.8 billion (US$0.1 billion). 1 Normalised earnings is not calculated in accordance with IFRS Accounting Standards. See – Annual financial report - Management’s discussion and analysis of the financial statements – Non-IFRS Measures on page AFR-41 for more information on the metrics presented by Sibanye-Stillwater Percentage of revenue per segment by geographical location of customers purchasing from Group operations GOLD – DECEMBER 2023 44% 56% SA UK PGM – DECEMBER 2023 14% 22% 46% 18% SA UK USA Other BATTERY METALS – DECEMBER 2023 19% 4% 3% 5% 8%16% 45% UK Belgium USA France Luxembourg Germany Other GOLD – DECEMBER 2022 39% 61% SA UK PGM – DECEMBER 2022 12% 22% 47% 19% SA UK USA Other BATTERY METALS – DECEMBER 2022 63%8% 8% 4% 4% 13% UK Belgium USA France Luxembourg Other At year-end 2023, we were in a net debt position1 of R11.9 billion (US$642 million) compared to a net cash position of R5.9 billion (US$344 million) at the end of 2022. In line with this, the net debt/(cash): adjusted EBITDA ratio went from (0.14) in 2022 to 0.58 in 2023; a deterioration but well within the covenant threshold of 2.5x. Adjusted free cash flow2 for 2023 was negative R10.6 billion (US$577 million), compared to R9.5 billion (US$581 million) in 2022. 1 Net (cash)/debt represents borrowings and bank overdraft less cash and cash equivalents. Borrowings are only those borrowings that have recourse to Sibanye-Stillwater and, therefore, exclude the Burnstone Debt and include the derivative financial instrument. Net (cash)/debt excludes cash of Burnstone 2 Adjusted free cash flow is defined as cash flows from operating activities before dividends paid, net interest paid and deferred revenue advance received, less additions to property, plant and equipment. Management considers adjusted free cash flow to be an indicator of cash available for repaying debt, other investing activities, and paying dividends MAINTAINING A PROFITABLE BUSINESS AND OPTIMISING CAPITAL ALLOCATION – CFO REPORT IR - 91

OUR MOST NOTABLE FINANCIAL MATTERS –––––––––––––––––––––––––––––––––––––––––––––––––––––––––––––––– Liquidity At year-end 2023 the Group had committed undrawn debt facilities of R20.8 billion (US$1.1 billion), as compared to R16.4 billion (US$1.0 billion) in 2022, and available cash and cash equivalents of R25.6 billion (US$1.4 billion) compared to R26.1 billion (US$1.5 billion) in 2022, contributing to the available cash and undrawn debt liquidity buffer of R49.5 billion (US$2.7 billion), compared to R44.9 billion (US$2.6 billion) in 2022. At year-end 2023, the Group’s total assets exceeded its total liabilities by R51.6 billion (US$2.8 billion), compared to R91.0 billion (US$5.3 billion) in 2022. On 6 April 2023, the Group concluded the refinancing of the US$600 million RCF. The new facility is US$1 billion RCF for a period of three years, with two optional one-year extensions from the effective date of the facility. During November 2023 Sibanye- Stillwater through its subsidiary, Stillwater Mining Company, had a successful placement of a US$500 million senior, unsecured, guaranteed convertible bond. The proceeds were partially used to finance the Reldan acquisition and the balance will enable the Group to maintain strong liquidity. In line with the Group’s commodity price hedging policy and to safeguard the viability of its higher cost gold operations, on 3 May 2023, Sibanye Gold Proprietary Limited (SGL) concluded a gold hedge agreement which commenced on 4 May 2023. The agreement is structured at monthly average prices, comprising the delivery of 154,320 ounces of gold over 12 months (12,860 ounces per month) with a zero cost collar which establishes a floor and cap of R34,214 and R46,050 per ounce, respectively. Further, on 17 November 2023, SGL concluded two additional gold hedge agreements which commenced on 17 November 2023. The agreements are structured at monthly average prices, comprising the delivery of 120,000 and 240,000 ounces of gold over 12 months, respectively. The agreements have a zero cost collar which establishes a floor of R34,214 per ounce for both agreements and cap of R43,545 and R43,800 per ounce, respectively. During the year, the Group entered into two substantially similar wind energy power purchase agreements (PPAs) and a solar PPA, providing a total of 267MW clean energy which is expected to reach commercial operation in 2025. These projects will provide approximately 15% of our SA electricity requirements and enables the Group to reduce its scope 2 emissions. These projects will be funded, build and operated by a project consortium and therefore positively contribute to preserving the Group’s liquidity. Credit ratings The Group received revised downward credit ratings from Fitch and S&P Global as tabled below: Credit rating agency Previous Current Most recent ratings change Fitch BB stable outlook BB negative outlook February 2024 Moody's Ba2 positive outlook Ba2 positive outlook May 2022 S&P Global BB stable outlook BB - December 2023 Fitch downgraded its rating to BB negative but affirmed its long-term issuer default rating at BB and has also affirmed the rating for the bonds issued by Stillwater Mining Company (guaranteed by the Group) at BB. The Fitch negative outlook reflects a weaker than forecast performance for 2024 due to a material slump in prices for PGMs over the last four months, at a time when heavy investments into battery materials are planned. S&P’s negative outlook reflects risks to earnings and leverage arising from further unanticipated weaknesses in PGM prices, All-in-sustaining costs (AISC) that remain above commodity price levels at selected assets and the possibility of additional mergers and acquisitions or elevated project costs. An improved credit rating gives us access to lower interest rates for future financing. A change in credit rating, however, has been expected given the uncertain market outlook on PGM prices. CAPITAL ALLOCATION • Continued investment in value-accretive projects • Project capex to date1 – Burnstone: R2.7bn (US$148m); K4: R2.0bn (US$110m) and Keliber R2.5bn (€124m) • Burnstone slowed down further review in 2024 • 2024 planned project capital2 – Burnstone ~R0.4bn (US$22m), K4 ~R0.9bn (US$51m) and Keliber ~R6.9bn (€361m) • Cash reserves of R25.6bn(US$1.4bn2) • Provides flexibility and optionality • R1.5bn (US$82m4) H1 2023 dividend paid, with no final dividend declared in line with dividend policy • Equivalent of 1.5% of declared dividends allocated to Sibanye-Stillwater Foundation NPC5 – established in H2 2021 (registered H2 2023) total allocation to date of R212m (US$11m5). R42m (US$2m) utilised from the Sibanye Foundation for projects at the SA and EU regions • Net debt: adjusted EBITDA of 0.58x well within comfort range • Undrawn revolving credit facilities of ZAR RCF R1.5bn (US$81m3) and US$ RCF US$1bn (R18.6bn3) at 31 Dec 2023 • Refinanced the US$600 million RCF to a US$1bn facility in April 2023 • Convertible bond of US$500m issued in November 2023 – partially allocated for Reldan acquisition • All management incentive scheme allocations now cash-settled (eliminated ~3% to 5% dilution) • Acquired 100% of New Century Resources – integration underway • Option to acquire 100% of Mt Lyell copper in Tasmania exercised – undergoing a Class 3 feasibility study • Acquisition of Reldan concluded 15 March 2024 • BioniCCubE – Investments made during 20231: Verkor €15m (R299m), Glint £1.3m (R31m) and other (incl. Enhywhere) ~€1m (R16m) 1 Using the average rate for FY2023 of R18.42/US$, R19.94/€ and R23.93/£ 2 Using FY2024 guidance rates of R17.50/US$, R19.00/€ 3 Using the closing rate for FY2023 of R18.57/US$ 4 Using the average rate for H1 2023 of R18.21/US$ 5 The Sibanye Foundation NPC is a registered Non-Profit Company and Public Benefit Organisation, using an average rate of R18.62/US$ MAINTAINING A PROFITABLE BUSINESS AND OPTIMISING CAPITAL ALLOCATION – CFO REPORT IR - 92

For 2024, planned project capital for Burnstone is R390 million (US$22 million) which relates to critical work which will continue to ensure a successful ramp up post the delay, R900 million (US$51 million) for K4, and R6.9 billion (€361 million) for Keliber. Total capital expenditure, for 2024, is estimated at approximately R20.5 billion (US$1.2 billion) at a planned Rand/US$ rate of 17.50:1. The significant decline in palladium and rhodium prices during 2023, was larger than anticipated, prompting a Group wide review of all operations and a focus on bottom of the cycle austerity and value preservation. With that in mind we have taken a decision to defer capital expenditure on the Burnstone project which is expected to ramp-up again during 2025. R b n EXPECTED CAPITAL EXPENDITURE (EXCLUDING RHYOLITE RIDGE) SA PGM operations US PGM operations SA gold operations (excl. DRD) Burnstone PGM recycling (Columbus Met) Sandouville nickel refinery Keliber lithium project (incl. funded portion) Keliber - already funded (illustrative)* Century Mount Lyell project 2023 Actuals 2024 2025 2026 2027 2028 2029 2030 2031 2032 2033 2034 2035 0 5 10 15 20 Dividends Our policy in terms of dividends is to return at least 25% to 35% of normalised earnings to shareholders. For 2023, the Group reported normalised earnings of R1.8 million (US$0.1 billion), compared to R21.0 billion (US$1.3 billion) for 2022. In line with Sibanye-Stillwater’s dividend policy and its Capital Allocation Framework, the Board of Directors resolved not to declare a final dividend (2022: 122 SA cents per share) for the year ended 31 December 2023. With the interim dividend of 53 (2022: 138) SA cents per share, which was declared and paid, this brings the total dividend for the year ended 31 December 2023 to 53 (2022: 260) SA cents per share. The interim dividend amounted to a payout of 35% of normalised earnings for the six months ended 30 June 2023 (2022: 35% of normalised earnings for the year ended 31 December 2022). Profitability Cost-saving initiatives In light of the challenging operating environment with macroeconomic and geopolitical uncertainty persisting and the steep decline in PGM prices we have already taken proactive and decisive actions, which tangibly address financial losses and better position the business for sustainability. These included the closure of Kloof 4 shaft, the further repositioning of US PGM operations for ongoing decline in 2E basket price, the deferral of capital investment in Burnstone project and the restructuring at our SA PGM operations which resulted in the closure of Simunye shaft, rightsizing of Siphumelele and Rowland shafts, with the conditional operations at 4 Belt shaft. Inflation pressures The South African Reserve Bank (SARB) has a monetary inflation target range of 3% to 6%. The SARB’s Monetary Policy Committee forecasts the headline Consumer Price Index (CPI) for 2024 at 4.6%, 2025 at 4.5% and 4.5% for 2026. For South Africa, the headline CPI was at 6% for 2023. South Africa continued to be affected by higher inflation rates, coupled with a weaker rand, resulting in higher prices for imported goods which led to above inflation cost increases on essential input costs which include electricity, diesel, reagents and steel costs. In the United States inflation slowed markedly in 2023 and the Congressional Budget Office (CBO) projects inflation to slow further in 2024 to a rate roughly in line with the Federal Reserve’s long term goal of 2% by 2026. The French central bank, forecast that inflation would average 2.5% in 2024, nearing the European Central Bank’s 2% target towards the end of 2024 and was forecast to average 1.7% in 2025 and 2026. According to the Bank of Finland, inflation is expected to decline further in 2024, to below 1% but will increase slightly in 2025. The Reserve Bank of Australia forecast inflation to decline to 3.1% by December 2024, returning to the target range of 2% to 3% in 2025, and to the midpoint in 2026. Above-inflation increases put pressure on the Group’s profitability and Sibanye-Stillwater strives to limit above-inflation cost increases thus ensuring the sustainability of our operations. MAINTAINING A PROFITABLE BUSINESS AND OPTIMISING CAPITAL ALLOCATION – CFO REPORT IR - 93

SUMMARY OF THE ANNUAL FINANCIAL STATEMENTS ––––––––––––––––––––––––––––––––––––––––––––––––––––––––––––––––––––––––––––––––––––––––––––––––––––––––––––––––––––––––––––––––––––––– All our operations, except the gold operations, were affected by lower commodity prices during 2023. The decline in commodity prices is characterised by the persistent macro-economic and geopolitical uncertainty. Localised operational challenges in South Africa (a factor in load curtailment and copper cable theft) continued to impact production, as did the floods and heavy rainfall at both our Century zinc retreatment operation and Sandouville nickel refinery. Positively, the increase in the gold price together with increased production resulted in an improved performance from the SA gold operations. In light if these challenges, the Group focused on identifying cost savings and capital preservation opportunities, whilst maintaining liquidity and remaining on track with our current capital commitments for 2024. Group financial performance Revenue Group revenue for 2023 decreased by 18% to R113.7 billion (US$6.2 billion) mainly due to lower sales volumes at the US PGM Recycling operations and lower average US and SA PGM basket prices. The 13% weaker rand relative to the US dollar, reduced the impact of the lower average US$ PGM basket prices in rand terms for the US PGM Recycling, US PGM underground and SA PGM operations. Cost of sales Group cost of sales, before amortisation and depreciation, reduced from R94.5 billion (US$5.8 billion) in 2022 to R89.8 billion (US$4.9 billion) in 2023. The lower US PGM recycling sales volumes and lower average PGM basket prices, which impacts the cost of purchasing recycling material and third-party purchase of concentrate (PoC) at the US PGM Recycling and Marikana operations (SA PGM), were the primary reasons for the 5% decrease in the Group cost of sales, before amortisation and depreciation. At the managed SA gold operations, the higher underground production volumes, following the strike during 2022 which resulted in lower production volumes, contributed an increase in cost of sales. Loss/(profit) before royalties, carbon tax and tax Group profit before royalties, carbon tax and tax decreased by 230% or R68.5 billion (US$3.7 billion) which is mainly attributable to the impairment of R47.5 billion (US$2.6 billion), an onerous contract provision of R1.9 billion (US$0.1 billion) and the lower average PGM basket prices during 2023. Adjusted EBITDA Group adjusted EBITDA for 2023 decreased by 50% or R20.6 billion (US$1.1 billion) to R20.6 billion (US$1.1 billion). Adjusted EBITDA from the US PGM underground operations decreased by 89% to R0.7 billion (US$35 million) mainly due to a lower average 2E PGM basket price and for the US PGM recycling operations decreased by 52% to R0.6 billion (US$33 million) mainly due to lower sales volumes and lower average 3E PGM basket price. Adjusted EBITDA for the SA PGM operations decreased by 54% to R17.6 billion (US$1.0 billion) due to lower average 4E PGM basket prices. The negative adjusted EBITDA in 2022 at the SA gold operations reversed to a positive adjusted EBITDA of R3.5 billion (US$0.2 billion) in 2023, mainly due to higher volumes sold and a 21% increase in the rand gold price. Negative adjusted EBITDA from the Sandouville nickel refinery increased by 170% to a negative of R1.3 billion (US$72 million), mainly due to a 4% lower average rand nickel equivalent basket price. The Century zinc retreatment operation generated a negative adjusted EBITDA of R0.3 billion (US$15 million). Cost of production The All-in sustaining cost (AISC) at the US PGM operations increased by 33% to US$1,872/2Eoz in 2023 primarily due to above inflation increases in costs, mainly impacting maintenance, propane and diesel costs, and higher underground support, stope mining and surface facilities costs. The AISC at the SA PGM operations of R20,286/4Eoz (including third-party PoC) increased only by 1% from R20,078/4Eoz primarily due to higher production volumes and exceptional cost containment initiatives despite above inflation increases in costs of electricity, imported spares, explosives and fuel. Unit costs at the SA gold operations decreased by 11% to R1,127,138/kg in 2023 and was mainly due to higher production volumes following the strike which occurred during 2022 at the managed SA gold operations, partially offset by above average inflationary increases in electricity, explosives and support consumables costs and higher fissure water pumping costs, maintenance and safety costs to minimise the impact of production stoppages. See Chairman and CEO’s review, page 13 for more on operational performance. Capital expenditure Total capital expenditure for 2023 was R22.4 billion (US$1.2 billion), up from R15.9 billion (US$971 million) in 2022. Capital expenditure at the US PGM operations for 2023 was R6.8 billion (US$371 million) compared to R5.4 billion (US$330 million) for 2022, at the SA PGM operations for 2023 was R5.6 billion (US$307 million) compared to R5.1 billion (US$311 million) in 2022, at the managed SA gold operations was R5.4 billion (US$0.3 million) compared to R3.8 billion (US$232 million) in 2022, at the Sandouville refinery was R0.2 billion (US$13 million) compared to R0.1 billion (US$5 million) in 2022 and on the Keliber lithium project was R2.5 billion (US$134 million) compared to R0.7 billion (US$45 million) in 2022. In 2023 our capital expenditure at the Century zinc tailings retreatment facility was R0.2 billion (US$9 million), with no comparative figure for 2022. MAINTAINING A PROFITABLE BUSINESS AND OPTIMISING CAPITAL ALLOCATION – CFO REPORT IR - 94

US dollar SA rand 2022 2023 Figures are in millions unless otherwise stated 2023 2022 8,448 6,172 Revenue 113,684 138,288 (6,208) (5,417) Cost of sales (99,768) (101,624) (5,775) (4,873) Cost of sales, before amortisation and depreciation (89,756) (94,537) (433) (544) Amortisation and depreciation (10,012) (7,087) 73 74 Interest income 1,369 1,203 (173) (179) Finance expense (3,299) (2,840) (13) (6) Share-based payment expenses (113) (218) (261) 13 Gain/(loss) on financial instruments 235 (4,279) 38 107 Gain on foreign exchange differences 1,973 616 79 (64) Share of results of equity-accounted investees after tax (1,174) 1,287 (225) (318) Other costs (5,858) (3,679) 68 67 Other income 1,232 1,110 10 6 Gain on disposal of property, plant and equipment 105 162 — (2,576) (Impairments)/reversal of impairments (47,454) 6 (22) (28) Restructuring costs (515) (363) (9) (26) Transaction costs (474) (152) — 49 Gain on acquisition 898 — 13 20 Occupational healthcare gain 365 211 1,818 (2,106) (Loss)/profit before royalties, carbon tax and tax (38,794) 29,728 (112) (57) Royalties (1,050) (1,834) 1 — Carbon tax (2) 10 1,707 (2,163) (Loss)/profit before tax (39,846) 27,904 (545) 131 Mining and income tax 2,416 (8,924) 1,162 (2,032) (Loss)/profit for the period (37,430) 18,980 (Loss)/profit for the period attributable to: 1,126 (2,051) - Owners of Sibanye-Stillwater (37,772) 18,396 36 19 - Non-controlling interests (NCI) 342 584 Earnings per ordinary share (cents) 40 (72) Basic earnings per share (1,334) 651 40 (72) Diluted earnings per share (1,334) 650 16.37 18.42 Average R/US$ rate Note: The translation of the consolidated income statement into US dollar is based on the average exchange rate for the year ended 31 December 2023 of R18.42:US$1 (2022: R16.37:US$1) and is provided as supplementary information. Consolidated income statement for the year ended 31 December 2023 Interest income Interest income for 2023 increased by R166 million (US$1 million) to R1,369 million (US$74 million) (2022: R1,203 million or US$73 million). Interest income mainly includes interest received on cash deposits amounting to R998 million (US$54 million)(2022: R910 million or US$56 million), interest received on rehabilitation obligation funds of R339 million (US$18 million)(2022: R235 million or US$14 million), interest earned on right of recovery asset of R25 million (US$1 million) (2022: R31 million or US$2 million) and other interest earned of R7 million (US$0 million) (2022: R27 million or US$2 million). Finance expense Finance expense for 2023 increased by R459 million (US$25 million) (2022: R344 million or US$21 million) mainly due to a R146 million (US$8 million) increase (2022: R245 million or US$15 million) in interest on borrowings following an increase in average outstanding borrowings for 2023, R147 million increase (US$8 million) (2022: decrease R4 million or US$— million) in unwinding of the environmental rehabilitation obligation, R71 million (US$4 million) (2022: R78 million or US$5 million) increase in the unwinding of the Marikana dividend obligation, R12 million (US$1 million) increase (2022: R2 million or US$— million) in interest on lease liabilities, R1 million (US$— million) increase (2022: R17 million or US$1 million) in the unwinding of the finance costs on the deferred revenue transactions and an increase of R150 million (US$8 million) (2022: R12 million or US$1 million) in sundry interest, all partially offset by a R181 million (US$10 million) decrease (2022: increase R108 million or US$7 million) in Rustenburg deferred payment, R15 million (US$1 million) decrease (2022: R36 million or US$2 million) in the Pandora deferred payment and a R15 million (US$1 million) decrease (2022: increase R8 million or US$— million) in interest on the occupational healthcare obligation. MAINTAINING A PROFITABLE BUSINESS AND OPTIMISING CAPITAL ALLOCATION – CFO REPORT IR - 95

Gain/(loss) on financial instruments The 2022 net loss on financial instruments of R4,279 million (US$261 million) reversed into a net gain of R235 million (US$13 million) for 2023, representing a year-on-year positive movement of R4,514 million (US$274 million). The net gain for 2023 is mainly attributable to a combined fair value gain of R2,137 million (US$116 million) on the Rustenburg (R346 million or US$19 million) (2022: fair value loss R1,190 million or US$73 million) and Marikana (R1243 million or US$67 million) (2022: fair value loss R965 million or US$59 million) operations B-BBEE cash-settled share-based payment obligations and the Marikana dividend obligation (R548 million or US$30 million) (2022: fair value loss R650 million or US$40 million), all due to lower forecast cash flows over the respective life-of-mines. In addition, fair value gains on the zinc and palladium hedge contracts of R491 million (US$27 million) (2022: nil) and R72 million (US$4 million) (2022: fair value loss R241 million or US$15 million), respectively also contributed to the net gain on financial instruments. These gains were partially offset by the fair value loss on the derivative financial instrument relating to US$ Convertible Bonds, which was issued during November 2023, of R2,136 million (US$116 million) (2022: nil), fair value losses on the gold hedge contract of R140 million (US$8 million) (2022: nil), Keliber dividend obligation of R287 million (US$16 million) (2022: nil) and SRPM contingent consideration (Kroondal acquisition) of R137 million (US$7 million) (2022: nil). Gain on foreign exchange differences The gain on foreign exchange differences was R1,973 million (US$107 million) in 2023 compared with a gain of R616 million (US$38 million) in 2022. The gain on foreign exchange differences in 2023 was mainly due to a net foreign currency translation gain reclassified to profit or loss with the deregistration of foreign subsidiaries of R1,663 million (US$90 million), foreign exchange gains of R173 million (US$9 million) on intra-group loans with a real foreign exchange exposure, foreign exchange gains of R214 million (US$12 million) on receivables and payables, partially offset by a R231 million (US$13 million) loss on the Burnstone debt due to a weaker rand. Restructuring costs Maintaining loss-making operations is not sustainable over an extended period. Cross-subsidising loss making operations erodes value, is a drain on cash flows and, as a result, threatens the sustainability and economic viability of other operations. Therefore, the Group consistently reviews and assesses the operating and financial performance of its assets. Restructuring costs of R515 million (US$28 million) (2022: R363 million or US$22 million) were incurred during 2023 which mainly related to the SA gold operations (R114 million or US$6 million) (2022: R330 million or US$20 million), SA PGM operations (R351 million or US$19 million) (2022: R26 million or US$2 million) and US PGM operations (R41 million or US$2 million) (2022: nil). Restructuring costs include a provision and actual costs amounting to R303 million (US$16 million) (2022: R315 million or US$19 million) for voluntary separation packages, voluntary early retirement packages and involuntary retrenchments mainly relating to the S189 process at the SA gold operations (Beatrix R6 million or US$— million (2022: R287 million or US$18 million) and Kloof of R100 million or US$5 million (2022: R28 million or US$2 million)) and SA PGM operations (Marikana of R211 million or US$11 million (2022: nil), Rustenburg of R86 million or US$5 million (2022: nil) and Kroondal of R46 million or US$2 million (2022: nil)). Transaction costs Transaction costs were R474 million (US$26 million) in 2023 compared with R152 million (US$9 million) in 2022. The transaction costs in 2023 mainly included acquisition related advisory and legal fees of R129 million (US$7 million) (2022: R80 million or US$5 million) and other transaction related general legal and advisory fees of R316 million (US$17 million) (2022: R72 million or US$4 million) and convertible bond fees of R29 million (US$2 million) (2022: nil). Share of results of equity-accounted investees after tax The loss from share of results of equity-accounted investees of R1,174 million (US$64 million) in 2023 (2022: R1,287 million or US$79 million profit) was primarily due to share of losses of R1,479 million (US$80 million) (2022: R1,061 million or US$65 million profit) relating to the Group’s 50% attributable share in Mimosa, partially offset by the equity accounted profit of R315 million (US$17 million) (2022: R236 million or US$14 million) relating to the 44% interest in Rand Refinery. A lower estimated value in use for Mimosa led to an after tax equity accounted impairment of property, plant and equipment amounting to R1,384 million (US$75 million) (2022: nil) and was the main reason for the equity accounted loss from Mimosa. Royalties, mining and income tax Royalties decreased by 43% to R1,050 million (US$57 million) in 2023 from R1,834 million (US$112 million) in 2022. The decrease in 2023 was mainly due to the decreased revenue and profitability at the SA PGM operations as a result of the lower PGM prices in 2023, partially offset by the increase in royalties payable by New Century which was acquired during 2023. Mining and income tax charge decreased from R8,924 million (US$545 million) to a net credit of R2,416 million (US$131 million) which is mainly attributable to the loss before tax in 2023 compared to a profit in 2022. Dividends Sibanye-Stillwater’s Dividend policy is to return at least 25% to 35% of normalised earnings to shareholders; noting that after due consideration of future requirements the dividend may be increased beyond these levels. For 2023, the Group reported normalised earnings of R1,752 million (US$95 million), compared to R21,021 million (US$1,284 million) for 2022. In line with Sibanye-Stillwater’s dividend policy and its Capital Allocation Framework, the Board of Directors resolved not to declare a final dividend (2022: 122 SA cents per share) for the year ended 31 December 2023 and together with the interim dividend of 53 (2022: 138) SA cents per share, which was declared and paid, this brings the total dividend for the year ended 31 December 2023 to 53 (2022: 260) SA cents per share. The interim dividend amounted to a payout of 35% of normalised earnings for the six months ended 30 June 2023 (2022: 35% of normalised earnings for the year ended 31 December 2022). The interim dividend paid for 2023 was R1,501 million (US$81 million) (2022: R3,905 million or US$239million) translating to 53 SA cents (2022: 138 SA cents) per share. This brings the total dividend paid for the year ended 31 December 2023 to R1,501 million (US$81 million) (2022: R7,359 million or US$450 million) or 53 SA cents (2022: 260 SA cents) per share. MAINTAINING A PROFITABLE BUSINESS AND OPTIMISING CAPITAL ALLOCATION – CFO REPORT IR - 96

Other costs Other costs were R5,858 million (US$318 million) in 2023 compared with R3,679 million (US$225 million) in 2022. Included in other costs for 2023 was a provision of R1,865 million (US$101 million) (2022: nil) recognised for an onerous supply contract at the Sandouville nickel refinery. Sustained losses incurred at the Sandouville nickel refinery resulted in the Group's assessment and conclusion that the supply contract is onerous, as the unavoidable costs of meeting the obligations under the contract exceed the expected economic benefits. Other costs also included care and maintenance costs of R1,378 million (US$75 million) (2022: R794 million or US$49 million), corporate social investment costs of R149 million (US$8 million)(2022: R237 million or US$14 million), cost incurred on employee and community trusts of R469 million (US$25 million)(2022: R429 million or US$26 million), exploration costs of R183 million (US$10 million) (2022: R12 million or US$1 million), non-mining royalties of R84 million (US$5 million) (2022: R235 million or US$14 million), strike related costs of R3 million (US$0 million) (2022: R258 million or US$16 million), service entity costs of R366 million (US$20 million) (2022: R569 million or US$35 million), loss on deconsolidation of a subsidiary of R— million (US$— million) (2022: R309 million or US$19 million), and other of R1,361 million (US$74 million) (2022: R836 million or US$51 million). Other income Other income was R1,232 million (US$67 million) in 2023 compared with R1,110 million (US$68 million) in 2022. Included in other income for 2023 was the gain on remeasurement of previously held interest in the Kroondal PSA of R298 million (US$16 million), following SRPM's acquisition of RPM's 50% interest in the Kroondal PSA. In accordance with the requirements of IFRS 3, the Group remeasured its previously held 50% interest in Kroondal PSA to fair value at the effective date of the acquisition. Other income also included change in estimate of environmental rehabilitation obligation, and right of recovery receivable and payable of R45 million (US$2 million) (2022: R71 million or US$4 million), service entity income of R497 million (US$27 million) (2022: R464 million or US$28 million), sundry income of R387 million (US$21 million) (2022: R429 million or US$26 million), profit on sale of Lonmin Canada of R0 million (US$0 million) (2022: R145 million or US$9 million), gain on increase in equity-accounted investment of R5 million (US$0 million) (2022: R0 million or US$0 million) and gain on deregistration of a subsidiary of R0 million (US$0 million) (2022: R1 million or US$0 million). (Impairments)/reversal of impairments During 2023 the Group recognised impairments of R47,454 million (US$2,576 million) compared to a net reversal of impairments in 2022 of R6 million (US$0 million). The impairments related to: • A 5.3% decrease of Mimosa's expected life of mine average recovered grade due to plant recoveries being affected by a change in the mineralogy of the ore, combined with above inflationary increases in working costs, resulted in a decrease in the expected future net cash flows from Mimosa. The lower value in use led to an after tax equity accounted impairment of property, plant and equipment amounting to R1,384 million (US$75 million)and the further impairment of the investment in the equity-accounted investee of R423 million (US$23 million) • Various operational constraints, as previously reported, in the ramp-up of the Blitz project, coupled with higher than inflation increases in operating costs and a decrease in medium to long-term forecast palladium prices, resulted in a decrease in the expected future net cash flows from the US PGM operation. The higher weighted average cost of capital, driven by a higher beta, in combination with the aforementioned factors, contributed to the reduced value in use at year end, which led to an impairment of property, plant and equipment and goodwill amounting to R38,900 million (US$2,112 million). In addition, goodwill allocated to the US PGM operation amounting to R60 million (US$3 million) pertaining to the acquisition of SFA (Oxford) was impaired • An onerous supply contract, higher fixed and variable costs, significantly reduced expected sustainable production volumes and higher than initially expected sustaining capital expenditure, resulted in the decrease in expected future net cash flows from the Sandouville nickel refinery. This, together with lower nickel prices, reduced the value in use at year end and led to an impairment of property, plant and equipment, intangible assets and goodwill amounting to R1,606 million (US$87 million). • Lower than expected production volumes, above inflationary increases in operating costs, higher sustaining capital, the relative short life-of- mine and the diminishing window of opportunity to develop and operate the expansion projects concurrent with the ongoing operation, resulted in a decrease in the expected future net cash flows from the Century zinc retreatment operation (Century). The lower value in use led to an impairment of property, plant and equipment amounting to R3,689 million (US$200 million) • Consistent with the requirements of the Group’s capital allocation framework, the Burnstone project (included in the SA Gold corporate and reconciling items reportable segment) will be delayed and is expected to ramp-up again during 2025. The additional costs during the delay, the deferral of mine ramp-up and higher weighted average cost of capital due to an increase in the beta, risk free rate and cost of debt, has resulted in a decrease in the expected future net cash flows from Burnstone. The lower value in use led to an impairment of property, plant and equipment amounting to R1,115 million (US$61 million) • Operational constraints, including seismicity and cooling, at the Kloof 4 shaft, compounded by the shaft incident during H2 2023 that damaged the shaft infrastructure, resulted in a severe deterioration in productivity that negatively impacted the financial viability of the Kloof 4 shaft. Consequently, during 2023, following a consultative process, the Group announced the closure of Kloof 4 shaft, which led to the specific impairment of property, plant and equipment amounting to R1,616 million (US$88 million) MAINTAINING A PROFITABLE BUSINESS AND OPTIMISING CAPITAL ALLOCATION – CFO REPORT IR - 97

Revenue US dollar SA rand % change 2022 2023 Figures in million 2023 2022 % change (27) 8,448 6,172 Total 113,684 138,288 (18) (33) 844 569 US PGM (underground) 10,494 13,823 (24) (63) 1,971 723 US PGM (recycled) 13,318 32,267 (59) (31) 4,378 3,019 SA PGM 55,593 71,665 (22) 65 768 1,267 Managed SA gold 23,327 12,568 86 (2) 322 316 DRDGOLD 5,816 5,274 10 (15) 192 164 Sandouville refinery1 3,024 3,140 (4) N/A — 122 Century zinc retreatment operation2 2,251 — N/A (70) (27) (8) Group corporate (139) (449) (69) 16.37 18.42 Average Rand/US$ rate 1 The Sandouville refinery is included in the Group results since the effective date of the acquisition on 4 February 2022 2 The Century zinc tailings retreatment operation is included in the Group results since the effective date of the acquisition on 22 February 2023 Group revenue for 2023 decreased by 18% to R113,684 million (US$6,172 million) mainly due to lower sales volumes at the US PGM Recycling operations and lower average US$ PGM basket prices. Revenue from the US PGM underground operations decreased by 24% to R10,494 million (US$569 million) (2022: R13,823 million or US$844 million) in 2023 due to a 33% lower average 2E basket price of US$1,243/2Eoz, partially offset by a 13% weaker rand relative to the US dollar and 2% or 6,451 2Eoz increase in mined ounces sold, which correlates with the higher production achieved. Revenue from US PGM recycling operation decreased by 59% to R13,318 million (US$723 million) (2022: R32,267 million or US$1,971 million) in 2023, due to 52% lower sales volumes and a 24% lower average 3E basket price of US$2,334/3Eoz. The impact of lower US recycling sales volumes and lower average 2E and 3E PGM basket prices for the US PGM operations was partially offset by the 13% weaker rand. Revenue from the SA PGM operations decreased by 22% to R55,593 million (US$3,019 million) in 2023 from R71,665 million (US$4,378 million) in 2022, due to a 32% lower average 4E basket price received of R28,979/4Eoz, partially offset by a 4% or 58,179 4Eoz increase in PGMs sold. Revenue from the managed SA gold operations increased by 86% to R23,327 million (US$1,267 million) (2022: R12,568 million or US$768 million) in 2023, mainly due to a 21% higher rand gold price of R1,146,734/kg and the 53% or 7,069 kg increase in gold sold volumes following the strike which occurred during 2022. Revenue from DRDGOLD increased by 10% to R5,816 million (US$316 million) in 2023 (2022: R5,274 million or US$322 million) mainly due to a 21% higher rand gold price received of R1,143,531/kg, partially offset by 9% lower sales volumes. Revenue from the Sandouville nickel refinery decreased by 4% to R3,024 million (US$164 million) (2022: R3,140 million or US$192 million) in 2023, mainly due to a 4% lower average rand nickel equivalent basket price of R441,138/tNi, partially offset by marginal increase in sales volumes of 8tNi. The Century zinc retreatment operation contributed R2,251 million (US$122 million) or 2% towards revenue since its acquisition on 22 February 2023. Cost of sales, before amortisation and depreciation US dollar SA rand % change 2022 2023 Figures in million 2023 2022 % change (16) (5,775) (4,873) Total (89,756) (94,537) (5) 16 (456) (528) US PGM (underground) (9,680) (7,459) 30 (64) (1,893) (690) US PGM (recycled) (12,711) (30,993) (59) 1 (1,971) (1,992) SA PGM (36,699) (32,280) 14 8 (1,002) (1,087) Managed SA gold (20,041) (16,394) 22 (5) (231) (219) DRDGOLD (4,040) (3,780) 7 6 (222) (235) Sandouville refinery1 (4,329) (3,631) 19 N/A — (122) Century zinc retreatment operation2 (2,256) — N/A 16.37 18.42 Average Rand/US$ rate 1 The Sandouville refinery is included in the Group results since the effective date of the acquisition on 4 February 2022 2 The Century zinc tailings retreatment operation is included in the Group results since the effective date of the acquisition on 22 February 2023 Cost of sales, before amortisation and depreciation decreased by 5% to R89,756 million (US$4,873 million) in 2023 from R94,537 million (US$5,775 million) in 2022. MAINTAINING A PROFITABLE BUSINESS AND OPTIMISING CAPITAL ALLOCATION – CFO REPORT IR - 98

Cost of sales, before amortisation and depreciation at the US PGM underground operations increased by 30% to R9,680 million (US$528 million) due to above inflation increases in costs, mainly impacting maintenance, propane and diesel, a R1,374 million (US$75 million) write-down of inventory to net realisable value as a result of the lower commodity price and higher underground support, stope mining and surface facilities costs. An increase of 2% in sales volumes to 425,007 2Eoz, in line with production volumes which also increased by 1% year-on-year to 427,272 2Eoz, had a limited impact on cost of sales. Cost of sales, before amortisation and depreciation at the US PGM recycling operation decreased, in line with the decrease in revenue, by 59% from R30,993 million (US$1,893 million) to R12,711 million (US$690 million) mainly due to lower average PGM basket prices and a 48% decrease in volumes, following the industry wide global slowdown in the autocatalyst recycling market, which started in the second quarter of 2022, and continued to affect receipt rates of spent autocatalysts during 2023 at the recycle operations. Cost of sales, before amortisation and depreciation at the SA PGM operations increased by 14% to R36,699 million (US$1,992 million) due to an increase of 4% in PGMs sold and above inflation increases on imported spares, fuel, electricity and explosives. Mined underground 4E PGM production decreased by 1% to 1,392,238 4Eoz and surface production volumes excluding third-party PoC were 10% higher at 164,381 4Eoz. Third-party concentrate purchased and processed at the Marikana smelting and refining operations increased by 52% to 96,403 4Eoz. Third-party PoC material is purchased at a higher cost, than own mined ore, due to the direct correlation to the basket price of PGMs. Cost of sales, before amortisation and depreciation at the managed SA gold operations increased by 22% to R20,041 million (US$1,087 million) due to a 46% increase in production volumes following the strike which occurred during 2022 and above inflationary increases in electricity, explosives and support consumables costs. Higher maintenance and safety costs, to minimise the impact of production stoppages, and fissure water pumping costs also contributed to higher cost of sales. Cost of sales, before amortisation and depreciation from DRDGOLD increased by 7% to R4,040 million (US$219 million) due to above inflationary cost increases on machine hire, contractor reclamation costs, steel, diesel and electricity. Cost of sales, before amortisation and depreciation at the Sandouville nickel refinery increased by 19% to R4,329 million (US$235 million) due to higher maintenance costs while sales volumes remaining flat at 6,855tNi. Century zinc retreatment operation contributed R2,256 million (US$122 million) or 3% towards cost of sales since its acquisition on 22 February 2023. Loss/(profit) before royalties, carbon tax and tax US dollar SA rand % change 2022 2023 Figures in million 2023 2022 % change (216) 1,816 (2,106) Total1,2 (38,794) 29,728 (230) (1785) 144 (2,427) US PGM (underground) (44,712) 2,365 (1991) (64) 92 33 US PGM (recycled) 603 1,498 (60) (53) 2,019 939 SA PGM 17,303 33,058 (48) (81) (344) (67) SA gold (1,227) (5,626) (78) 582 (39) (266) Sandouville nickel refinery3 (4,900) (635) 672 N/A — (248) Century zinc retreatment operation4 (4,575) — N/A (14) (57) (49) Group corporate (894) (927) (4) 16.37 18.42 Average rand/US$ rate 1 Included within total Loss/(profit) before royalties, carbon tax and tax for the Group for both 2023 and 2022 is the European region corporate and reconciling items which include the Keliber project and also included for 2023 is Australian region corporate and reconciling items which include Mt Lyell 2 Included in total Group is Group corporate which comprises mainly the Wheaton Stream transaction, corporate tax, interest and transaction costs 3 The Sandouville refinery is included in the Group results since the effective date of the acquisition on 4 February 2022 4 The Century zinc tailings retreatment operation is included in the Group results since the effective date of the acquisition on 22 February 2023 Group loss before royalties, carbon tax and tax of R38,794 million (US$2,106 million) for 2023 decreased by 230% from a profit before royalties, carbon tax and tax of R29,728 million (US$1,816 million) in 2022. At the US PGM underground operations profit before royalties, carbon tax and tax of R2,365 million (US$144 million) in 2022 decreased to a loss before royalties, carbon tax and tax of R44,712 million (US$2,427 million) in 2023 mainly due to an impairment of property, plant and equipment and goodwill of R38,900 million (US$2,112 million) and lower average PGM basket prices during 2023. For the US PGM recycling operations profit before royalties, carbon tax and tax of R1,498 million (US$92 million) decreased by 60% to R603 million (US$33 million) mainly due to lower sales volumes and lower 3E PGM basket prices. Profit before royalties, carbon tax and tax for the SA PGM operations decreased by 48% to R17,303 million (US$939 million) mainly due to lower 4E PGM basket prices. The loss before royalties, carbon tax and tax in 2023 at the SA gold operations decreased by 78% to R1,227 million (US$67 million) in 2023, mainly due to higher volumes sold and a 21% increase in the rand gold price. At the Sandouville nickel refinery the loss before royalties, carbon tax and tax in 2023 increased by 672% to R4,900 million (US$266 million), mainly due to an impairment of property, plant and equipment of R1,606 million (US$87 million), an onerous contract provision of R1,865 million (US$101 million) and a lower average rand nickel equivalent basket price. The Century zinc retreatment operation generated a loss before royalties, carbon tax and tax of R4,575 million (US$248 million) which included an impairment of property, plant and equipment of R3,689 million (US$200 million). MAINTAINING A PROFITABLE BUSINESS AND OPTIMISING CAPITAL ALLOCATION – CFO REPORT IR - 99

Adjusted earnings before interest, tax depreciation and amortisation (EBITDA)1 US dollar SA rand % change 2022 2023 Figures in million 2023 2022 % change (56) 2,510 1,116 Total2 20,556 41,111 (50) (91) 386 35 US PGM (underground) 710 6,330 (89) (58) 78 33 US PGM (recycled) 607 1,274 (52) (59) 2,330 958 SA PGM 17,620 38,135 (54) (188) (219) 193 SA gold 3,523 (3,546) (199) 140 (30) (72) Sandouville nickel refinery3 (1,328) (492) 170 N/A — (15) Century zinc retreatment operation4 (285) — N/A (71) (31) (9) Group corporate (159) (504) (68) 16.37 18.42 Average rand/US$ rate 1 Adjusted EBITDA is not calculated in accordance with IFRS Accounting Standards. See – Annual financial report - Management’s discussion and analysis of the financial statements – Non-IFRS Measures on page AFR-40 for more information on the metrics presented by Sibanye-Stillwater 2 Included within total adjusted EBITDA for the Group for both 2023 and 2022 is the European region corporate and reconciling items which include the Keliber project and also included for 2023 is Australian region corporate and reconciling items which include Mt Lyell 3 The Sandouville refinery is included in the Group results since the effective date of the acquisition on 4 February 2022 4 The Century zinc tailings retreatment operation is included in the Group results since the effective date of the acquisition on 22 February 2023 Group Adjusted EBITDA of R20,556 million (US$1,116 million) in 2023 decreased by 50% from R41,111 million (US$2,511million) in 2022. Adjusted EBITDA from the US PGM underground operations decreased by 89% to R710 million (US$35 million) mainly due to a lower 2E PGM basket prices and for the US PGM recycling operations decreased by 52% to R607 million (US$33 million) mainly due to lower sales volumes and lower 3E PGM basket prices. Adjusted EBITDA for the SA PGM operations decreased by 54% to R17,620 million (US$958 million) due to lower 4E PGM basket prices. The negative adjusted EBITDA in 2022 at the SA gold operations reversed to a positive adjusted EBITDA of R3,523 million (US$193 million) in 2023, mainly due to higher volumes sold and a 21% increase in the rand gold price. Negative adjusted EBITDA from the Sandouville nickel refinery increased by 170% to a negative of R1,328 million (US$72 million), mainly due to a 4% lower average rand nickel equivalent basket price. The Century zinc retreatment operation generated a negative adjusted EBITDA of R285 million (US$15 million). A d ju st e d E BI TD A ( U S$ b ill io n ) N e t d e b t: a d ju ste d EBITD A ra tio THE GROUP GENERATED EARNINGS DESPITE THE DECREASE IN PGM PRICES Earnings¹ and gearing 0.6 2.6 2.5 1.4 -0.06 -0.17 -0.14 0.58 SA gold operations SA PGM operations US PGM operations US PGM recycling Sandouville nickel refinery Century zinc retreatment operation Net debt (cash): adjusted EBITDA (rhs) 2016 2017 2018 2019 2020 2021 2022 2023 -1 0 1 2 3 4 5 -1 0 1 2 3 MAINTAINING A PROFITABLE BUSINESS AND OPTIMISING CAPITAL ALLOCATION – CFO REPORT IR - 100 1 Adjusted EBITDA is not calculated in accordance with IFRS Accounting Standards. See – Annual financial report - Management’s discussion and analysis of the financial statements – Non-IFRS Measures on page AFR-43 for more information on the metrics presented by Sibanye-Stillwater

Consolidated statement of financial position as at 31 December 2023 US dollar SA rand 2022 2023 Figures in million 2023 2022 Assets 6,216 4,368 Non-current assets 81,119 105,867 4,516 3,303 Property, plant and equipment 61,338 76,909 16 30 Right-of-use assets 560 279 489 27 Goodwill and other intangibles 502 8,322 497 385 Equity-accounted investments 7,148 8,471 196 171 Other investments 3,179 3,340 312 319 Environmental rehabilitation obligation funds 5,927 5,306 47 28 Other receivables 523 798 143 105 Deferred tax assets 1,942 2,442 3,567 3,328 Current assets 61,822 60,764 1,549 1,420 Inventories 26,363 26,384 440 479 Trade and other receivables 8,900 7,500 5 1 Other receivables 26 81 42 52 Tax receivable 973 723 1,531 1,376 Cash and cash equivalents 25,560 26,076 9,783 7,696 Total assets 142,941 166,631 Equity and liabilities 5,155 2,592 Equity attributable to owners of Sibanye-Stillwater 48,730 88,101 1361 1,361 Stated capital 21,647 21,647 2,801 2,532 Other reserves 35,553 32,673 993 (1,301) Accumulated profit (8,470) 33,781 187 185 Non-controlling interests 2,877 2,903 5,342 2,777 Total equity 51,607 91,004 3,254 2,957 Non-current liabilities 54,927 55,408 1,327 1,343 Borrowings and derivative financial instrument 24,946 22,606 12 21 Lease liabilities 384 208 502 673 Environmental rehabilitation obligation and other provisions 12,505 8,552 46 22 Occupational healthcare obligation 400 781 293 146 Cash-settled share-based payment obligations 2,718 4,991 147 183 Other payables 3,407 2,500 376 341 Deferred revenue 6,327 6,399 1 3 Tax and royalties payable 64 11 550 225 Deferred tax liabilities 4,176 9,360 1,187 1,962 Current Liabilities 36,407 20,219 7 834 Borrowings and derivative financial instrument 15,482 122 7 11 Lease liabilities 198 111 3 — Occupational healthcare obligation — 44 17 23 Cash-settled share-based payment obligations 432 284 919 887 Trade and other payables 16,464 15,653 228 109 Other payables 2,015 3,891 1 16 Deferred revenue 305 21 5 37 Tax and royalties payable 679 93 9,783 7,696 Total equity and liabilities 142,941 166,631 17.03 18.57 Closing R/US$ rate Note: The translation of the consolidated statement of financial position is based on the closing exchange rate as at 31 December 2023 of R18.57:US$1 (2022: R17.03:US$1) and is provided as supplementary information only MAINTAINING A PROFITABLE BUSINESS AND OPTIMISING CAPITAL ALLOCATION – CFO REPORT IR - 101
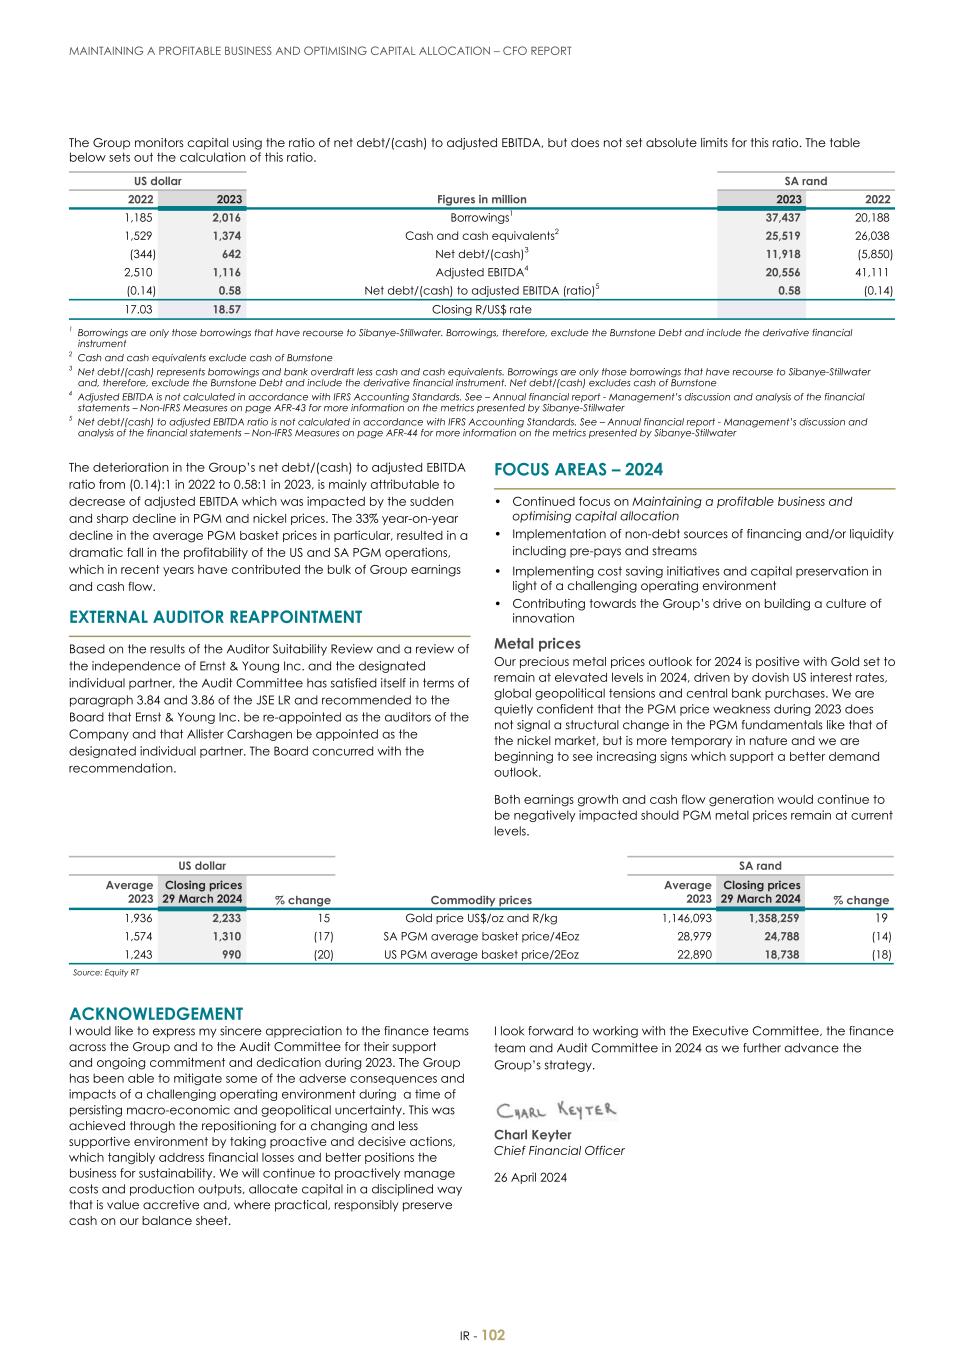
The Group monitors capital using the ratio of net debt/(cash) to adjusted EBITDA, but does not set absolute limits for this ratio. The table below sets out the calculation of this ratio. US dollar SA rand 2022 2023 Figures in million 2023 2022 1,185 2,016 Borrowings1 37,437 20,188 1,529 1,374 Cash and cash equivalents2 25,519 26,038 (344) 642 Net debt/(cash)3 11,918 (5,850) 2,510 1,116 Adjusted EBITDA4 20,556 41,111 (0.14) 0.58 Net debt/(cash) to adjusted EBITDA (ratio)5 0.58 (0.14) 17.03 18.57 Closing R/US$ rate 1 Borrowings are only those borrowings that have recourse to Sibanye-Stillwater. Borrowings, therefore, exclude the Burnstone Debt and include the derivative financial instrument 2 Cash and cash equivalents exclude cash of Burnstone 3 Net debt/(cash) represents borrowings and bank overdraft less cash and cash equivalents. Borrowings are only those borrowings that have recourse to Sibanye-Stillwater and, therefore, exclude the Burnstone Debt and include the derivative financial instrument. Net debt/(cash) excludes cash of Burnstone 4 Adjusted EBITDA is not calculated in accordance with IFRS Accounting Standards. See – Annual financial report - Management’s discussion and analysis of the financial statements – Non-IFRS Measures on page AFR-43 for more information on the metrics presented by Sibanye-Stillwater 5 Net debt/(cash) to adjusted EBITDA ratio is not calculated in accordance with IFRS Accounting Standards. See – Annual financial report - Management’s discussion and analysis of the financial statements – Non-IFRS Measures on page AFR-44 for more information on the metrics presented by Sibanye-Stillwater The deterioration in the Group’s net debt/(cash) to adjusted EBITDA ratio from (0.14):1 in 2022 to 0.58:1 in 2023, is mainly attributable to decrease of adjusted EBITDA which was impacted by the sudden and sharp decline in PGM and nickel prices. The 33% year-on-year decline in the average PGM basket prices in particular, resulted in a dramatic fall in the profitability of the US and SA PGM operations, which in recent years have contributed the bulk of Group earnings and cash flow. EXTERNAL AUDITOR REAPPOINTMENT –––––––––––––––––––––––––––––––––––––––––––––––––––––––––––––––––– Based on the results of the Auditor Suitability Review and a review of the independence of Ernst & Young Inc. and the designated individual partner, the Audit Committee has satisfied itself in terms of paragraph 3.84 and 3.86 of the JSE LR and recommended to the Board that Ernst & Young Inc. be re-appointed as the auditors of the Company and that Allister Carshagen be appointed as the designated individual partner. The Board concurred with the recommendation. FOCUS AREAS – 2024 –––––––––––––––––––––––––––––––––––––––––––––––––––––––––––––––––– • Continued focus on Maintaining a profitable business and optimising capital allocation • Implementation of non-debt sources of financing and/or liquidity including pre-pays and streams • Implementing cost saving initiatives and capital preservation in light of a challenging operating environment • Contributing towards the Group’s drive on building a culture of innovation Metal prices Our precious metal prices outlook for 2024 is positive with Gold set to remain at elevated levels in 2024, driven by dovish US interest rates, global geopolitical tensions and central bank purchases. We are quietly confident that the PGM price weakness during 2023 does not signal a structural change in the PGM fundamentals like that of the nickel market, but is more temporary in nature and we are beginning to see increasing signs which support a better demand outlook. Both earnings growth and cash flow generation would continue to be negatively impacted should PGM metal prices remain at current levels. US dollar SA rand Average 2023 Closing prices 29 March 2024 % change Commodity prices Average 2023 Closing prices 29 March 2024 % change 1,936 2,233 15 Gold price US$/oz and R/kg 1,146,093 1,358,259 19 1,574 1,310 (17) SA PGM average basket price/4Eoz 28,979 24,788 (14) 1,243 990 (20) US PGM average basket price/2Eoz 22,890 18,738 (18) Source: Equity RT ACKNOWLEDGEMENT I would like to express my sincere appreciation to the finance teams across the Group and to the Audit Committee for their support and ongoing commitment and dedication during 2023. The Group has been able to mitigate some of the adverse consequences and impacts of a challenging operating environment during a time of persisting macro-economic and geopolitical uncertainty. This was achieved through the repositioning for a changing and less supportive environment by taking proactive and decisive actions, which tangibly address financial losses and better positions the business for sustainability. We will continue to proactively manage costs and production outputs, allocate capital in a disciplined way that is value accretive and, where practical, responsibly preserve cash on our balance sheet. I look forward to working with the Executive Committee, the finance team and Audit Committee in 2024 as we further advance the Group’s strategy. Charl Keyter Chief Financial Officer 26 April 2024 MAINTAINING A PROFITABLE BUSINESS AND OPTIMISING CAPITAL ALLOCATION – CFO REPORT IR - 102

IR - 103 ACHIEVING OPERATIONAL EXCELLENCE AND OPTIMISING LONG-TERM RESOURCE VALUE

DELIVERING VALUE FROM OUR OPERATIONS AND PROJECTS WHAT WE DID IN 2023 SUCCESSES • Record low serious injury frequency rate for the Group • Load curtailment in SA region well managed and effective utilisation of processing capacity resulting in zero inventory increases • Further restructuring at the US PGM operations for lower prices and operational flexibility • AUS region’s Century operation returned to positive Adjusted EBITDA post the regional floods in March 2023 and exercised option to acquire 100% of the Mt Lyell copper exploration project (previously operated mine) CHALLENGES • Lower commodity prices for PGMs weighing on the profitability of the US PGM and the SA PGM operations • Challenges at the Sandouville nickel refinery exacerbated with the weaker nickel price during 2023 OVERVIEW OF THE OPERATIONAL PERFORMANCE FOR THE YEAR ––––––––––––––––––––––––––––––––––––––––––––––––––––––––––––––––––––––––––––––––––––––––––––––––––––––––––––––––––––––––––––––––– This section provides a synopsis of the operational performance for the 2023 year. The discussion includes a description of certain non-IFRS financial metrics used to assess operational performance. For a further description of Sibanye-Stillwater’s financial performance, see the Chief Financial Officer’s Report on page 89. US region US PGM operations Production from the US PGM underground operations steadily improved over the course of 2023, following the shaft incident at the Stillwater West mine during Q1 2023, achieving sustainable levels during Q4 2023. Mined 2E PGM production of 427,272 2Eoz for 2023 was 1% higher than for 2022 and in line with revised guidance of 420k 2Eoz to 430k 2Eoz. Both the Stillwater and East Boulder mines continued to be constrained by limited operational flexibility due to a reduced developed state and an ongoing shortage of critical skills, with the consequent reliance on contractors elevating costs. Production for 2024 has been repositioned for a lower PGM price environment, with cost structures being reassessed to maintain recent production levels rather than pursuing growth. Total operating costs for 2023 increased by 4% to US$500 million (R9.2 billion), however AISC increased by 18% to US$1,872/2Eoz (R34,465/2Eoz), mainly due to a 20% increase in ore reserve development (ORD) expenditure to US$211 million (R3.9 billion) and a 63% increase in sustaining capital expenditure to US$118 million (R2.2 billion) and lower than planned production. ORD expenditure increases were as a result of continued reliance on contractors and increased ORD across the operations to increase mining flexibility. ORD expenditure comprised 26% of and contributed US$494/2Eoz (R9,102/2Eoz) to AISC for 2023, compared to US$419/2Eoz (R6,855/2Eoz) for 2022. Sustaining capital expenditure, which contributed US$277/2Eoz (R5,097/2Eoz) to AISC for 2023 (15% of AISC for 2023 from 11% for 2022) included fleet replacement of underground mining equipment, equipping of critical life of mine ventilation raises at both mines (including fans and a heat exchanger at East Boulder), underground network infrastructure (fibre) and expenditure associated with the smelter rebuild. With many of these capital items completed and some deferred, sustaining capital is forecast to halve in 2024. The decision to suspend further growth capital at Stillwater East in terms of the August 2022 repositioning plan resulted in project capital expenditure declining by 49% for 2023 to US$42 million (R774 million). Following the completion of the Benbow decline in September 2022, the remaining project capital spent in 2023 was invested to complete the 56 East holing to the Benbow decline, and towards the processing plant upgrade, with the first line of the processing plant successfully commissioned. Mined 2E PGM sold for 2023 increased by 2% to 425,007 2Eoz, in line with the production increase. The 33% decline in the average 2E PGM basket price for 2023 to US$1,243/2Eoz (R22,890/2Eoz) and higher costs were the main drivers of a 91% decline in adjusted EBITDA from the US PGM mined operations to US$35 million (R710 million). DELIVERING VALUE FROM OUR OPERATIONS AND PROJECTS IR - 104
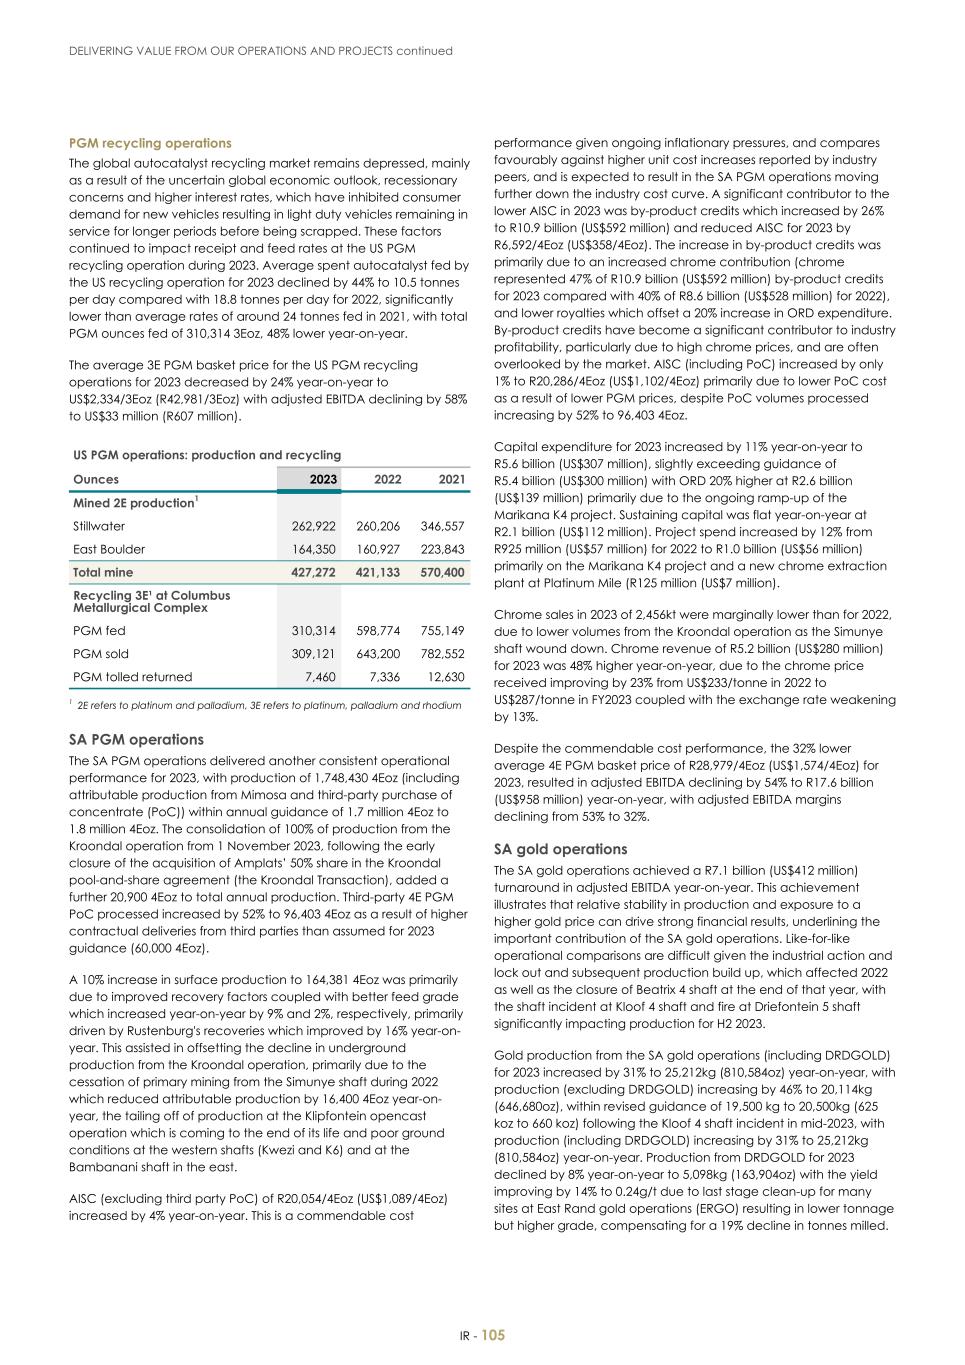
PGM recycling operations The global autocatalyst recycling market remains depressed, mainly as a result of the uncertain global economic outlook, recessionary concerns and higher interest rates, which have inhibited consumer demand for new vehicles resulting in light duty vehicles remaining in service for longer periods before being scrapped. These factors continued to impact receipt and feed rates at the US PGM recycling operation during 2023. Average spent autocatalyst fed by the US recycling operation for 2023 declined by 44% to 10.5 tonnes per day compared with 18.8 tonnes per day for 2022, significantly lower than average rates of around 24 tonnes fed in 2021, with total PGM ounces fed of 310,314 3Eoz, 48% lower year-on-year. The average 3E PGM basket price for the US PGM recycling operations for 2023 decreased by 24% year-on-year to US$2,334/3Eoz (R42,981/3Eoz) with adjusted EBITDA declining by 58% to US$33 million (R607 million). US PGM operations: production and recycling Ounces 2023 2022 2021 Mined 2E production1 Stillwater 262,922 260,206 346,557 East Boulder 164,350 160,927 223,843 Total mine 427,272 421,133 570,400 Recycling 3E¹ at Columbus Metallurgical Complex PGM fed 310,314 598,774 755,149 PGM sold 309,121 643,200 782,552 PGM tolled returned 7,460 7,336 12,630 1 2E refers to platinum and palladium, 3E refers to platinum, palladium and rhodium SA PGM operations The SA PGM operations delivered another consistent operational performance for 2023, with production of 1,748,430 4Eoz (including attributable production from Mimosa and third-party purchase of concentrate (PoC)) within annual guidance of 1.7 million 4Eoz to 1.8 million 4Eoz. The consolidation of 100% of production from the Kroondal operation from 1 November 2023, following the early closure of the acquisition of Amplats’ 50% share in the Kroondal pool-and-share agreement (the Kroondal Transaction), added a further 20,900 4Eoz to total annual production. Third-party 4E PGM PoC processed increased by 52% to 96,403 4Eoz as a result of higher contractual deliveries from third parties than assumed for 2023 guidance (60,000 4Eoz). A 10% increase in surface production to 164,381 4Eoz was primarily due to improved recovery factors coupled with better feed grade which increased year-on-year by 9% and 2%, respectively, primarily driven by Rustenburg's recoveries which improved by 16% year-on- year. This assisted in offsetting the decline in underground production from the Kroondal operation, primarily due to the cessation of primary mining from the Simunye shaft during 2022 which reduced attributable production by 16,400 4Eoz year-on- year, the tailing off of production at the Klipfontein opencast operation which is coming to the end of its life and poor ground conditions at the western shafts (Kwezi and K6) and at the Bambanani shaft in the east. AISC (excluding third party PoC) of R20,054/4Eoz (US$1,089/4Eoz) increased by 4% year-on-year. This is a commendable cost performance given ongoing inflationary pressures, and compares favourably against higher unit cost increases reported by industry peers, and is expected to result in the SA PGM operations moving further down the industry cost curve. A significant contributor to the lower AISC in 2023 was by-product credits which increased by 26% to R10.9 billion (US$592 million) and reduced AISC for 2023 by R6,592/4Eoz (US$358/4Eoz). The increase in by-product credits was primarily due to an increased chrome contribution (chrome represented 47% of R10.9 billion (US$592 million) by-product credits for 2023 compared with 40% of R8.6 billion (US$528 million) for 2022), and lower royalties which offset a 20% increase in ORD expenditure. By-product credits have become a significant contributor to industry profitability, particularly due to high chrome prices, and are often overlooked by the market. AISC (including PoC) increased by only 1% to R20,286/4Eoz (US$1,102/4Eoz) primarily due to lower PoC cost as a result of lower PGM prices, despite PoC volumes processed increasing by 52% to 96,403 4Eoz. Capital expenditure for 2023 increased by 11% year-on-year to R5.6 billion (US$307 million), slightly exceeding guidance of R5.4 billion (US$300 million) with ORD 20% higher at R2.6 billion (US$139 million) primarily due to the ongoing ramp-up of the Marikana K4 project. Sustaining capital was flat year-on-year at R2.1 billion (US$112 million). Project spend increased by 12% from R925 million (US$57 million) for 2022 to R1.0 billion (US$56 million) primarily on the Marikana K4 project and a new chrome extraction plant at Platinum Mile (R125 million (US$7 million). Chrome sales in 2023 of 2,456kt were marginally lower than for 2022, due to lower volumes from the Kroondal operation as the Simunye shaft wound down. Chrome revenue of R5.2 billion (US$280 million) for 2023 was 48% higher year-on-year, due to the chrome price received improving by 23% from US$233/tonne in 2022 to US$287/tonne in FY2023 coupled with the exchange rate weakening by 13%. Despite the commendable cost performance, the 32% lower average 4E PGM basket price of R28,979/4Eoz (US$1,574/4Eoz) for 2023, resulted in adjusted EBITDA declining by 54% to R17.6 billion (US$958 million) year-on-year, with adjusted EBITDA margins declining from 53% to 32%. SA gold operations The SA gold operations achieved a R7.1 billion (US$412 million) turnaround in adjusted EBITDA year-on-year. This achievement illustrates that relative stability in production and exposure to a higher gold price can drive strong financial results, underlining the important contribution of the SA gold operations. Like-for-like operational comparisons are difficult given the industrial action and lock out and subsequent production build up, which affected 2022 as well as the closure of Beatrix 4 shaft at the end of that year, with the shaft incident at Kloof 4 shaft and fire at Driefontein 5 shaft significantly impacting production for H2 2023. Gold production from the SA gold operations (including DRDGOLD) for 2023 increased by 31% to 25,212kg (810,584oz) year-on-year, with production (excluding DRDGOLD) increasing by 46% to 20,114kg (646,680oz), within revised guidance of 19,500 kg to 20,500kg (625 koz to 660 koz) following the Kloof 4 shaft incident in mid-2023, with production (including DRDGOLD) increasing by 31% to 25,212kg (810,584oz) year-on-year. Production from DRDGOLD for 2023 declined by 8% year-on-year to 5,098kg (163,904oz) with the yield improving by 14% to 0.24g/t due to last stage clean-up for many sites at East Rand gold operations (ERGO) resulting in lower tonnage but higher grade, compensating for a 19% decline in tonnes milled. DELIVERING VALUE FROM OUR OPERATIONS AND PROJECTS continued IR - 105

AISC for the SA gold operations (excluding DRDGOLD) decreased by 19% year-on-year to R1,186,846/kg (US$2,005/oz), which was at the lower end of revised guidance of R1,190,000 – R1,290,000/kg (US$2,056 – US$2,230/oz). A 53% increase in gold sold to 20,343kg (654,043oz), offset a 65% increase in ORD expenditure to R2.7 billion (US$146 million) and a 6% increase in sustaining capital expenditure to R1.0 billion (US$56 million). AISC for the SA gold operations (including DRDGOLD) for 2023 decreased by 11% to R1,127,138/kg (US$1,904/oz), primarily due to 35% more gold sold. Total capital expenditure from the SA gold operations (excluding DRDGOLD) increased by 42% to R5.4 billion (US$293 million) in line with guidance. Capital expenditure on ORD increased by 65% to R2.7 billion (US$146 million) due to a catch up from lower development rates for 2022 to restore operational flexibility with sustaining capital increasing by only 6% reflecting the Kloof 4 shaft incident and the closure of the Beatrix 4 shaft. Project capital at the SA gold operations (including DRDGOLD) increased in 2023 by 94% to R2.6 billion (US$139 million) with project capital invested at the Burnstone project increasing by 62% to R1.5 billion (US$82 million). Project capital at DRDGOLD increased six-fold to R882 million (US$48 million) with spending on the Phase 1 20MW solar project and related infrastructure at ERGO. Phase 2 is an additional 40MW with battery backup (160MW) estimated to be completed 12 months after Phase 1. Project spending on the Kloof 4 deepening project came to an end due to the Kloof 4 shaft accident, declining by 44% to R117 million (US$6 million). The average rand gold price received in 2023 increased by 21% to R1,146,093/kg (US$1,936/oz), due to depreciation of the rand relative to the US dollar and an 8% higher dollar gold price. With significantly higher production (and gold sold) and lower AISC, this resulted in a significant improvement in profitability of the SA gold operation. Adjusted EBITDA from the SA gold operations (including DRDGOLD) improved from an adjusted EBITDA loss of R3.5 billion (US$219 million) for 2022 to adjusted EBITDA of R3.5 billion (US$193 million), a significant turnaround of R7.1 billion (US$412 million). Given the improved outlook for the gold price and ongoing rand weakness resulting in the spot gold price averaging over R1.2 million/kg year-to-date, together with an expected period of operational stability post the recent restructuring with high costs shafts closed and costs reducing, the outlook for the SA gold operations for 2024 is very positive. European region Sandouville nickel refinery The acquisition of the Sandouville nickel refinery in Le Havre, France was concluded on 4 February 2022, so comparing 2022 with 2023 should be seen in this context. Although production at Sandouville for 2023 improved slightly due to better plant utilisation and higher nickel recoveries, excessive downtime due to higher than expected maintenance continues to impact production leading to higher than expected operating costs and elevated sustaining capital costs. Total nickel production from the Sandouville nickel refinery of 7,125 tonnes for 2023 was within guidance of 7kt to 7.5kt, with total nickel production increasing relative to H2 2022 and H1 2023, due to improved plant stability achieved during H2 2023, despite being constrained by heavy rainfall which affected the wastewater treatment, resulting in the loss of approximately 44 production days. Total nickel production included 1,411 tonnes of nickel salts and 5,714 tonnes of nickel metal. This was as a result of prioritising nickel metal production over nickel salts due to weaker plating markets. Premiums on spot cathode sales were adversely impacted by an oversupply of nickel cathode. Nickel equivalent AISC for 2023 of US$35,474/tNi (R653,246/tNi) was slightly below guidance of US$36,513-37,469/tNi (€33,715-34,588/tNi). AISC in 2023 was impacted by increased operating costs of US$235 million (R4,329 billion) due to higher costs relating to plant maintenance, and an increase in variable costs (reagents, energy including electricity and gas), and higher sustaining capital which increased by 145% to US$13 million (R248 million). Total nickel sold in 2023 of 6,855 tonnes (including salts and metal) was in line with 2022. As a result of higher costs and unfavourable raw material inventory valuation adjustments caused by constant declines in the nickel price, the adjusted EBITDA loss of US$72 million (R1.3 billion) was significantly higher than the 2022 loss of US$30 (R492 million). During the study to repurpose the nickel refinery to produce nickel sulphate (NiSO4), the Group identified an alternative option and has assessed the potential of producing precursor cathode active material (pCAM). A scoping study on the viability of producing pCAM at the Sandouville plant was conducted between November 2023 and January 2024 and the results are encouraging, both with regards to the market and the production costs that could be achieved as a brownfield project. A pre-feasibility study will commence during March 2024. Further announcements will be made on this as soon as various stages of the study are completed. To optimize the use of resources, the project that has been referred to as "battery recycling" is now a side stream of the pCAM project, looking into the possibility of using black mass produced by battery recyclers as feedstock. Sibanye-Stillwater also completed a pre-feasibility study on PGM autocatalysts recycling using European feedstocks. It was concluded that the project was not viable due to unfavourable evolution of market conditions in Europe and it has been stopped. Keliber lithium project – see page 112 of this section under the project section Australian region Century zinc tailings retreatment operation Sibanye-Stillwater acquired control of New Century Resources Limited from 22 February 2023, enhancing the Group's exposure to tailings retreatment. The integration of New Century into Sibanye- Stillwater is progressing well. The Century zinc tailings retreatment operation (Century operation) produced 76 kilotonnes (kt) of payable zinc metal at an AISC of US$1,975/tZn (R36,361/tZn) for 2023. Production was severely impacted by adverse weather conditions in March 2023 which resulted in the flooding of the operation and the suspension of hydro mining for approximately three weeks. A return to normalised levels of production was achieved in mid-April 2023. Total capital expenditure from the Century operation of US$9 million (R165 million) included US$6 million (R114 million) of sustaining capital expenditure and US$3 million (R51 million) of growth projects. The Century operation adjusted EBITDA loss for the year was US$15 million (R285 million). However, with the average equivalent zinc concentrate price rising by 8% from H1 2023 to H2 2023, payable zinc metal produced increasing from 24kt to 51kt and AISC 27% lower to US$1,766/tZn (R32,878/tZn), the Century operation delivered a significantly improved financial result in H2 2023, with adjusted EBITDA improving from an adjusted EBITDA loss of US$28 million (R502 million) for H1 2023 to a positive adjusted EBITDA of US$13million (R217 million) for H2 2023. Mt Lyell copper project – see page 113 of this section under the project section DELIVERING VALUE FROM OUR OPERATIONS AND PROJECTS continued IR - 106

SA and US PGM operations (2023) Total PGM operations1 SA PGM operations US PGM3 operationsTotal1 Marikana1 Kroondal2 Mimosa Platinum Mile Rustenburg Production (attributable)4 Ore milled 000t 37,223 36,048 9,880 3,068 1,392 10,150 11,560 1,174 Underground 000t 17,960 16,786 6,253 3,068 1,392 — 6,073 1,174 Surface 000t 19,262 19,262 3,626 — — 10,150 5,486 — Plant head grade g/t 2.32 1.99 2.64 2.28 3.43 0.73 2.28 12.50 Underground g/t 3.89 3.29 3.63 2.28 3.43 — 3.41 12.50 Surface g/t 0.85 0.85 0.92 — — 0.73 1.03 — Plant recoveries % 75.71 72.67 78.86 82.83 75.77 21.75 77.69 90.97 Underground % 86.13 84.96 86.60 82.83 75.77 — 86.21 90.97 Surface % 31.23 31.23 26.26 — — 21.75 46.46 — Yield g/t 1.75 1.44 2.08 1.89 2.60 0.16 1.77 11.37 Underground g/t 3.35 2.80 3.14 1.89 2.60 — 2.94 11.37 Surface g/t 0.27 0.27 0.24 — — 0.16 0.48 — PGM production (4E/2E) 000oz 2,100 1,673 660 186 116 52 658 427 Underground 000oz 1,936 1,509 632 186 116 — 574 427 Surface 000oz 164 164 28 — — 52 84 — PGM sales (4E/2E) 000oz 2,145 1,720 753 186 110 52 619 425 Price and cost5 Average PGM basket price received6 R/oz 27,715 28,979 29,181 29,586 25,942 25,924 28,807 22,890 US$/oz 1,505 1,574 1,585 1,607 1,409 1,408 1,564 1,243 All-in sustaining cost7 R/oz 23,158 20,054 22,742 19,441 24,255 11,486 18,204 34,465 US$/oz 1,258 1,089 1,235 1,056 1,317 624 989 1,872 All-in cost7 R/oz 24,075 20,726 24,105 19,549 24,255 13,899 18,204 36,277 US$/oz 1,307 1,125 1,309 1,062 1,317 755 989 1,970 Capital expenditure5 Ore reserve development Rm 6,440 2,551 1,882 — — — 669 3,889 Sustaining capital Rm 4,236 2,058 1,097 287 1,057 30 644 2,178 Growth projects Rm 1,812 1,038 893 20 — 125 — 774 Total Rm 12,488 5,647 3,872 307 1,057 155 1,313 6,841 US$m 678 307 210 17 57 8 71 371 The average exchange rate for 2023 was R18.42/US$ Note: The comparative high-level 2022 operational information is available in this report on page 282 of the Four-year review section, as well as within the full year results booklet available on the website at www.sibanyestillwater.com/news-investors/reports/quarterly/2023/ Figures may not add as they are rounded independently. 1 Total PGM operations, Total SA PGM operations and Marikana excludes the production and costs associated with the purchase of concentrate (PoC) from third parties 2 Kroondal operations for the year ended December 2023 includes production and costs for two months (November and December 2023) at 100% 3 The US PGM operations’ underground production is converted to metric tonnes and kilograms, and performance is translated into rand. In addition to the US PGM operations’ underground production, the operation treats various recycling material which is excluded from the statistics shown above 4 Mimosa represent 50% attributable production, Kroondal represent 50% attributable production for ten months (January to October) while Platinum Mile is 100% owned and incorporated 5 Total PGM operations and Total SA PGM operations’ unit cost and capital expenditure totals exclude the financial results of Mimosa, which is equity accounted, and excluded from revenue and cost of sales 6 The average PGM basket price is the PGM revenue per 4E/2E ounce prior to a purchase of concentrate adjustment 7 "All-in costs" and "all-in sustaining costs" are not calculated in accordance with IFRS Accounting Standards. See pages AFR-44 to AFR-45 for more information on the non-IFRS figures presented by Sibanye-Stillwater DELIVERING VALUE FROM OUR OPERATIONS AND PROJECTS continued IR - 107

SA gold operations (2023) Unit Total Driefontein Kloof Beatrix Cooke DRDGOLD Production Ore milled 000t 31,941 1,495 2,965 1,785 4,289 21,408 Underground 000t 4,055 1,237 1,399 1,420 — — Surface 000t 27,886 258 1,565 366 4,289 21,408 Yield g/t 0.79 4.86 2.51 2.37 0.28 0.24 Underground g/t 4.45 5.76 4.85 2.93 — — Surface g/t 0.26 0.52 0.42 0.22 0.28 0.24 Gold production kg 25,212 7,258 7,433 4,237 1,186 5,098 000oz 811 233 239 136 38 164 Underground kg 18,064 7,125 6,783 4,156 — — 000oz 581 229 218 134 — — Surface kg 7,148 133 650 81 1,186 5,098 000oz 230 4 21 3 38 164 Gold sales kg 25,429 7,224 7,708 4,192 1,219 5,086 000oz 818 232 248 135 39 164 Price and costs Gold price received R/kg 1,146,093 1,147,979 1,145,952 1,145,992 1,146,842 1,143,531 US$/oz 1,936 1,939 1,936 1,936 1,937 1,931 All-in sustaining cost1 R/kg 1,127,138 1,187,292 1,242,735 1,100,668 1,117,309 888,321 US$/oz 1,904 2,005 2,099 1,859 1,887 1,500 All-in cost1 R/kg 1,230,328 1,187,292 1,257,914 1,100,668 1,117,309 1,061,738 US$/oz 2,078 2,005 2,125 1,859 1,887 1,793 Capital expenditure Ore reserve development Rm 2,697 1,461 912 324 — — Sustaining capital Rm 1,457 490 421 114 — 432 Growth projects2 Rm 2,554 — 117 — — 882 Total Rm 6,708 1,951 1,450 438 — 1,314 US$m 364 106 79 24 — 71 Average exchange rate in 2023 was R18.42/US$ Note: The comparative high-level 2022 operational information is available in this report on page 282 of the Four-year review section, as well as within the full year results booklet available on the website at www.sibanyestillwater.com/news-investors/reports/quarterly/2023/ Figures may not add as they are rounded independently. 1 All-in cost is calculated in accordance with the World Gold Council guidance. All-in cost excludes income tax, costs associated with merger and acquisition activities, working capital, impairments, financing costs, one-time severance charges and items needed to normalise earnings. All-in cost is made up of All-in sustaining cost, being the cost to sustain current operations, given as a sub-total in the All-in cost calculation, together with corporate and major capital expenditure associated with growth. All-in sustaining cost per kilogram (and ounce) and All-in cost per kilogram (and ounce) is calculated by dividing the All-in sustaining cost and All-in cost, respectively, in a period by the total gold sold over the same period 2 Project expenditure for 2023 includes corporate project expenditure to the value of R1,555 million (US$84 million) – the majority of which was related to the Burnstone project DELIVERING VALUE FROM OUR OPERATIONS AND PROJECTS continued IR - 108

Sandouville nickel refinery (2023) Battery metal split Unit Total Sandouville nickel refinery Volumes produced Nickel Salts1 tonnes 1,411 Nickel Metal tonnes 5,714 Total Nickel production tNi 7,125 Nickel Cakes2 tonnes 320 Cobalt Chloride (CoCl2) 3 tonnes 127 Ferric Chloride (FeCl3) 3 tonnes 1,214 Volumes sales Nickel Salts1 tonnes 1,134 Nickel Metal tonnes 5,721 Total Nickel sold tNi 6,855 Nickel cakes2 tonnes 21 Cobalt Chloride (CoCl2) 3 tonnes 116 Ferric Chloride (FeCl3) 3 tonnes 1,214 Nickel recovery yield4 % 96.49 Price and costs Nickel equivalent average basket price5 R/tNi 441,138 US$/tNi 23,955 Nickel equivalent sustaining cost6 R/tNi 653,246 US$/tNi 35,474 Capital expenditure Ore reserve development Rm Sustaining capital Rm 248 Growth projects Rm Total Rm 248 US$m 13 Average exchange rate in 2023 was R18.42/US$ Note: The comparative high-level 2022 operational information is available in this report on page 282 of the Four-year review section, as well as within the full year results booklet available on the website at www.sibanyestillwater.com/news-investors/reports/quarterly/2023/ Figures may not add as they are rounded independently Figures may not add as they are rounded independently 1 Nickel salts consist of anhydrous nickel, nickel chloride low sodium, nickel chloride standard, nickel carbonate and nickel chloride solution 2 Nickel cakes occur during the processing of nickel matte and are recycled back into the nickel refining process 3 Cobalt chloride and ferric chloride are obtained from nickel matte through a different refining process on an order basis 4 Nickel recovery yield is the percentage of total nickel recovered from the matte relative to the nickel contained in the matte received 5 The Nickel equivalent average basket price per tonne is the total nickel revenue adjusted for other income - non-product sales divided by total nickel equivalent tonnes sold 6 Nickel equivalent sustaining cost" is not calculated in accordance with IFRS Accounting Standards. See pages AFR-44 to AFR-45 for more information on the non-IFRS figures presented by Sibanye-Stillwater DELIVERING VALUE FROM OUR OPERATIONS AND PROJECTS continued IR - 109

Century zinc retreatment operations (2023) Unit Total Century zinc retreatment operation1 Production Ore mined and processed kt 6,097 Processing feed grade % 3.11 Plant recoveries % 48.53 Concentrate produced2 kt 204 Concentrate zinc grade3 % 45.16 Metal produced (zinc in concentrate)4 kt 92 Zinc metal produced (payable)5 kt 76 Zinc sold6 kt 94 Zinc sold (payable)7 kt 77 Price and costs Average equivalent zinc concentrate price8 R/tZn 31,815 US$/tZn 1,728 All-in sustaining cost9 R/tZn 36,361 US$/tZn 1,975 All-in cost9 R/tZn 39,359 US$/tZn 2,137 Capital expenditure Ore reserve development Rm Sustaining capital Rm 114 Growth projects Rm 51 Total Rm 165 Total capital expenditure US$m 9 Average exchange rate in 2023 was R18.42/US$ Figures may not add as they are rounded independently 1 Century is a leading tailings management and rehabilitation company that currently owns and operates the Century zinc tailings retreatment operation in Queensland, Australia. Century was acquired by the Group on 22 February 2023 2 Concentrate produced is the dry concentrate which has been processed that contains zinc, silver and waste material 3 Concentrate zinc grade is the percentage of zinc contained in the concentrate produced 4 Metal produced (zinc in concentrate) is the zinc metal contained in the concentrate produced 5 Zinc metal produced (payable) is the payable quantity of zinc metal produced after applying smelter content deductions 6 Zinc sold is the zinc metal contained in the concentrate sold 7 Zinc sold (payable) is the payable quantity of zinc metal sold after applying smelter content deductions 8 Average equivalent zinc concentrate price is the total zinc sales revenue recognised at the price expected to be received excluding the fair value adjustments divided by the payable zinc metal sold 9 All-in cost is calculated in accordance with the World Gold Council guidance. All-in cost excludes income tax, costs associated with merger and acquisition activities, working capital, impairments, financing costs, one-time severance charges and items needed to normalise earnings. All-in cost is made up of All-in sustaining cost, being the cost to sustain current operations, given as a sub-total in the All-in cost calculation, together with corporate and major capital expenditure associated with growth. All-in sustaining cost per tonne and All-in cost per tonne are calculated by dividing the All-in sustaining cost and All-in cost, respectively, in a period by the total tonnes of zinc metal produced (payable) in the same period FUTURE FOCUS – OPERATIONAL OUTLOOK ––––––––––––––––––––––––––––––––––––––––––––––––––––––––––––––––––––––––––––––––––––––––––––––––––––––––––––––––––––––––––––––––––––––– In addition to the 2024 production guidance, the Group continues to share material updates with the market, see www.sibanyestillwater.com/news- investors/news/news-releases 2024 Production guidance4 Production All-in sustaining costs Total capital US PGM operations (2E mined) 440 - 460 koz US$1,365 - 1,425/oz1 US$175m – US$190m incl. US$13m project capital)(R3.1- 3.3bn incl R228m) US Recycling (3E) 300 - 350 koz n/a US$700k (R12m)² SA PGM operations (4E PGMs) 1.80 - 1.90 moz³ R21,800 - 22,500/4E oz (US$1,245 -1,285/4E oz)² R6,0bn (US$348m)² SA gold operations (excluding DRDGOLD) 19,500 - 20,500kg (627 - 659 koz) R1,100k - 1,200k/kg (US$1,955 - 2,133/oz)² R3,9bn (US$223m) (incl. R390m (US$22m) for Burnstone project capital)² EU - Sandouville nickel refinery5 7.5 - 8.5 kt €21,000 - 23,000/t (R399 – R437k/t)² Nickel equivalent sustaining cost €8.0m (R152m)² EU - Keliber lithium project n/a n/a €361m (R6.86bn)² AUS - Century zinc operation 87k – 100k tonnes (payable) A$3,032-3,434/t (R35,560-40,285/t /US$2,032 – 2,302/t) A$17m(US$11m/R196m) AUS - Mount Lyell copper project6 n/a n/a A$6.6m (US$4m/R77m) Note: Guidance does not take into account the impact of unplanned events 1. US PGM AISC are impacted by tax and royalties paid based on PGM prices, current guidance was based on spot 2E PGM prices of US$1,150/oz 2. Estimates are converted at an exchange rate of R17.50/US$, R19.00/€ and R11.73/A$ 3. SA PGM operations production guidance and costs include third party POC (exclude cost of purchasing third party material). Production includes 50% of the attributable Mimosa production, while Mimosa is excluded from AISC and capital due to it being equity accounted 4. Source: Company forecasts as announced on 5 March 2024 5. Current assumptions, subject to change 6. Mt Lyell was an operating copper mine which closed and is currently under care and maintenance DELIVERING VALUE FROM OUR OPERATIONS AND PROJECTS continued IR - 110

MAJOR INVESTMENT IN OPERATIONAL SUSTAINABILITY ––––––––––––––––––––––––––––––––––––––––––––––––––––––––––––––––– SA projects Marikana K4 SA PGM project The Marikana K4 project, a long-life and low-cost PGM project,was acquired in 2019 as part of the Lonmin acquisition and forms part of the Marikana operation at the SA PGM operations. At acquisition date, most of the major infrastructure was already in place. Sibanye-Stillwater approved the go-ahead of the project in early 2021, with stoping production commencing during the 2022 year. At the end of the 2023 year, the following milestones had been achieved: • Reef tonnes hoisted for H2 2023 of 216,022 tonnes with production of 17,897 4Eoz • K4 primary development advanced with primary waste metres developed in H2 2023 of 4,526 meters and primary reef development of 1,860 meters • Merensky ore pass rehabilitation is well advanced and progressing in line with schedule • Surface infrastructure for the raise boring of the up cast and down cast ventilation shafts has been established • Project capital spent for 2023 of R893 million (US$48million) was consistent with 2022 of R924 million (US$56 million) * Amounts translated at the average rate of R18.42/US$ for FY2023 and project expenditure to date, R16.37/US$ for FY2022, R17.50/US$ for FY2024 Plan Burnstone SA gold project The Burnstone project, located near Balfour, 80km southeast of Johannesburg in the Mpumalanga province, is a shallow- to medium-depth gold operation which is expected to mine the Kimberley Reef to about a kilometre below surface for more than 20 years. The project re-start was approved in 2021. Our productivity investments will help to efficiently extract Burnstone’s Mineral Resources and Reserves, at a forecast production rate of ~138koz per annum, and will create 2,500 sustainable jobs. Further, we are creating opportunities for procurement, SMME development, and skills transfer in the area. The Burnstone project progressed well during H2 2023. Due to the redesign requirements on the waste conveyor, the rock handling system was approached in two phases. Phase 1 which includes the underground ore handling, shaft hoisting and truck loading on surface infrastructure was completed, and the project is now able to hoist by using Tip 1 on 40 level. • The surface rail yard is nearing completion with 95% of the surface area having been concreted • The surface change houses and the office building civil works have been completed and the steel structures are being erected • 40-level workshops have shown substantial progress following delays experienced with support work Project capital spent at Burnstone in 2023 was R1.5 billion (US$82 million) in line with guidance, with R698 million (US$37 million) spent in H2 2023. Consistent with the requirements of the Group’s capital allocation framework, the Burnstone project (included in the SA gold corporate and reconciling items reportable segment) will be deferred. Kloof projects (infrastructure optimisation) The Group has advanced the Kloof Integration Project, which aims to optimise and rationalise the infrastructure between No. 1 and No. 3 shafts, resulting in operating cost savings. This project also facilitates access to additional mineral resources which will support the Kloof LoM from 2025 onwards with an additional 0.7Moz mineral reserves. This phase entails the re-opening of old development between No. 1 and No. 3 shafts which will allow the mining of the remaining VCR at No. 3 Shaft, as well as the secondary reefs (the LR and KR) from No.1 Shaft, well into the latter part of the Kloof LoM. DELIVERING VALUE FROM OUR OPERATIONS AND PROJECTS continued IR - 111 SURFACE INFRASTRUCTURE AT THE SA GOLD DRIEFONTEIN OPERATION

Projects in Europe Keliber lithium hydroxide (LiOH) project Construction activities of the Keliber lithium refinery in Kokkola, Finland have continued successfully after the start of construction in March 2023. Similarly, the earthworks and selected infrastructure works commenced at the Päiväneva concentrator site in late 2023. The mining permit for the Rapasaari mine became legally valid in December 2023 as the Vaasa Administrative Court rejected the appeal lodged against the permit. On 23 February 2024, the Vaasa Administrative Court (Court) issued a ruling on three appeals, including Sibanye-Stillwater’s appeal of certain emission-related permit conditions in connection with the environmental permit for the Rapasaari mine and the Päiväneva concentrator issued in December 2022 (Environmental Permit). The Court upheld and partially amended the Environmental Permit as requested by Sibanye-Stillwater, while referring certain permit conditions back to the Permitting Authority (Regional State Administrative Agency for Western and Inland Finland) for further review. These conditions pertain to the placement of Rapasaari mine’s waste rock and certain waste fractions from the concentrator, the aftercare plan for the extractive waste areas and the associated financial guarantees. As the Environmental Permit was otherwise affirmed, the permit remains in effect despite the Court’s ruling, allowing the construction work at the Päiväneva concentrator to continue in all material respects in accordance with existing plans. The full impact of the Court’s ruling on the Rapasaari mine related permit conditions has not yet been determined. Based on preliminary analyses, Sibanye-Stillwater expects the process to obtain the required permit decision from the Permitting Authority will delay commencement of the Rapasaari mine operations. Sibanye-Stillwater is in the process of assessing the overall impact, if any, to timing of the Sibanye-Stillwater’s Keliber lithium project. The Lithium refinery in Kokkola and the Syväjärvi mine are not affected by the ruling of the Court. Sandouville nickel refinery (Normandy, France) On 4 February 2022, Sibanye-Stillwater bought the Sandouville nickel hydrometallurgical processing facility from Eramet SA at a cost of €87 million (R1.5 billion). The integration of Sandouville is now at a mature state with notable progress in the areas of safety, energy management, human capital, commercial, ICT, financial and management accounting. Sandouville’s production was severely hampered by plant availability. Multiple opportunities for improvement have been identified and scopes of work developed aimed at stabilising key operating sections and processes. The acquisition was done on the grounds that it was an opportunity to supply critical metals into key regional ecosystems. During the study on repurposing the nickel refinery to produce nickel sulphate (NiSO4), the Group identified an alternative option and has assessed the potential of producing precursor cathode active material (pCAM). A scoping study on the viability of producing pCAM at the Sandouville plant was conducted between November 2023 and January 2024 and the results are encouraging, both with regards to the market and the production costs that could be achieved as a brownfield project. A pre-feasibility study commenced during March 2024. Further announcements will be made on this as the various stages of feasibility work are completed. Sibanye-Stillwater also completed a pre-feasibility study on PGM autocatalyst recycling using European feedstocks. It was concluded that the project was not viable due to unfavourable evolution of market conditions in Europe with no further work to be conducted. Projects in the Americas Rhyolite Ridge (Esmeralda County, Nevada, USA) Rhyolite Ridge is an advanced stage exploration project located in Esmeralda County, Nevada, US. Rhyolite Ridge aims to extract a large, shallow lithium-boron deposit, located close to existing infrastructure, in between Las Vegas and Reno, Nevada. It is expected to be one of the first large-scale US lithium projects to enter production. The 50:50 JV agreement between Sibanye-Stillwater and ioneer Limited, whereby ioneer would maintain the operational management responsibility, is subject to the satisfaction of certain conditions precedent before Sibanye-Stillwater will commit funding to the project. During 2023, ioneer submitted its Mine plan of operations (MPO) application for stage 1 mining, for review by the Bureau of Land Management (BLM). The BLM published a Notice of intent in the Federal Register during November 2022, which marked the commencement of work on the environmental impact statement (EIS) and public engagement process in accordance with the requirements of the National Environmental Policy Act (NEPA). The NEPA process culminates in the BLM’s Record of decision (ROD), a positive ROD will allow the company to commence construction of the Rhyolite Ridge Project. On completion of the NEPA process, once the MPO has been finalised, a Nevada Division of Environmental Protection - Bureau of Mining Regulation and Reclamation (NDEP-BMRR) Reclamation Permit will be applied for, which would be the final major permit required. During January 2023, the U.S. Department of Energy offered conditional commitment for a loan of up to US$700 million for the Rhyolite Ridge Project. Financial closure of the loan is conditional on several achievements including a positive record of decision (ROD) and a final investment decision (FID). Effective 31 March 2023, ioneer announced an updated and materially increased Mineral Resource estimate for the South Basin, totalling 3,350kt of Lithium Carbonate Equivalent (LCE), which now incorporates additional mineralised types and layers within the same mineralisation footprint. Study work in support of the MPO is ongoing, aimed towards fulfilling some of the conditions precedent, which will enable the Group to make a final investment decision. During 2023, ioneer completed a successful geotechnical drilling program that covers the southern and southeastern sections of the South basin. Work continues on updates for Mineral Resources and Mineral Reserves, capital and operating cost estimates and the financial model. A final, updated FS is expected during Q3 2024. A key permitting milestone was recently (January 2024) achieved with the completion by the BLM of the administrative draft Environmental Impact Statement (EIS). A final ROD is expected by Q3 2024, which combined with the completion of the updated FS will lead to an FID. Altar The Altar exploration project is a shallow to intermediate depth copper-gold porphyry deposit located in San Juan province, Argentina, approximately 10km from the Argentine-Chile border and 180km west of the city of San Juan. Sibanye-Stillwater acquired the Altar project in 2017 as part of the Stillwater acquisition. DELIVERING VALUE FROM OUR OPERATIONS AND PROJECTS continued IR - 112

Aldebaran Resources entered into a JV agreement with Sibanye- Stillwater in 2018 to acquire a 60%, and eventually 80%, interest in the Altar project, subject to funding certain exploration expenditures. Aldebaran Resources also assumed management of the JV. As at 31 December 2023, Aldebaran have spent the required expenditure for the initial 60% earn-in purposes and has given notice that they intend progressing exploration expenditure to secure an 80% interest in the project. Sibanye-Stillwater currently also holds a 14.35% equity stake in Aldebaran. As at 31 December 2023, our attributable Mineral Resources at Altar, based on both direct (40%) and indirect (equity interest) interest, equalled 684.7 million tonnes at 0.4% copper and 0.1 g/t gold (containing 6.386 billion pounds of copper and 2.1 million ounces of gold). Marathon The Marathon project is an advanced-stage PGM-gold-copper exploration project, at feasibility study level, located approximately 10km north of the town of Marathon, Ontario, Canada. The project is managed and operated by Generation Mining. As at 31 December 2023, Sibanye-Stillwater owned an effective 13.9% equity interest in Generation Mining. On 31 March 2023 Generation Mining released the results of a feasibility study update. The planned operation is expected to produce an average of 166,000 ounces of payable palladium and 41 million pounds of payable copper per year over a 13-year mine life. Over its life, the Marathon Project is anticipated to produce 2,122,000 ounces of palladium, 517 million lbs of copper, 485,000 ounces of platinum, 158,000 ounces of gold and 3,156,000 ounces of silver in payable metals. During 2023, Generation Mining continued the environmental approval process, while advancing detailed engineering on the project as well as arranging the production financing. Generation Mining finalised an offtake term sheet during 2023, for the treatment of copper concentrate from the project and advanced project financing by executing a mandate letter to arrange a senior secured project finance facility of up to US$400 million to fund the construction and development of the project. They also advanced project permitting, with all outstanding permits expected to be obtained during 2024. Projects in Australia Mount Lyell (Queenstown, Tasmania) With the full acquisition of New Century Resources during 2023, the group obtained the option to acquire the historic (in care and maintenance) Mount Lyell (Mt Lyell) copper project in Tasmania, Australia. The property is located close to the west coast of Tasmania, near the township of Queenstown, 170km north-west of Hobart. The option was exercised in November 2023, and the property is currently the subject of a feasibility study into the re- opening of the mine. The historic mine, where first mining took place in 1883, was closed and placed on care and maintenance during 2014 after over 100 years of production from both open pit and underground mining areas. The current underground workings were last mined using a sub-level caving mining method. Open pit and sub level open stoping mining methods were historically employed prior to 1999. The project study, which will be advanced to an Association for the Advancement of Cost Engineering (AACE) Class 3 Level in H2 2024, targets mining from three underground deposits (Prince Lyell, Western Tharsis and Copper Chert), via sub-level caving and open stoping mining methods. It anticipates the construction of a new concentrator plant, as well as the refurbishing of the historic vertical shaft. In H2 2023, US$5 million (R85 million) was expensed and an additional US$14 million (R268 million) was capitalised in recognition of the acquisition consideration and transaction cost. Other projects The Group also has a considerable number of projects in South Africa (at various stages) which could potentially be developed depending on developments in the economic and regulatory environment. More information about these projects is available in the Mineral Reserves and Resources report. See www.sibanyestillwater.com/news-investors/reports/annual https://www.msci.com/our-solutions/esg-investing/esg-ratings DELIVERING VALUE FROM OUR OPERATIONS AND PROJECTS continued IR - 113 MOUNT LYELL EXPLORATION PROJECT IN TASMANIA, AUSTRALIA

MINERAL RESOURCES AND MINERAL RESERVES: A SUMMARY WHAT WE DID IN 2023 SUCCESSES • Updated the Mineral Resource Estimate at the Keliber lithium project and achieved an overall 55.1% increase in Group attributable lithium Mineral Resources to 702kt of LCE (incl. Rhyolite Ridge) • Exercised the Mt Lyell copper mine option in Tasmania, and declared a project copper Mineral Resource of 79.4Mt, at 0.92% Cu and 0.2 g/t Au, for 1,609Mlb of contained copper • Increased our attributable zinc Mineral Resources to 3,002Mlb (+257%) and Mineral Reserves to 1,726Mlb (+287%) on the back of the acquisition of New Century Resources • Acquired 50% share held by Anglo American Platinum (Amplats) in the Kroondal PSA, adding 0.5Moz of 4E PGM Mineral Reserves within the Kroondal Mining Right, plus unlocking access to approximately 1Moz within the SRPM (Rustenburg) mining right via the Kroondal declines CHALLENGES • Despite maintaining stable Mineral Reserves (Unchanged) and Mineral Resources (+4.4%) over life of mine at our US PGM operations, further restructuring, following the mid-2022 repositioning, has taken place to protect margins and to ensure long-term value in light of the low palladium price environment • Gold Mineral Resources of 41.2Moz (-23%) and Mineral Reserves of 10.9 Moz (-15.7%) at our SA Gold operations and projects have been negatively impacted by the closure of Kloof 4# as well as Beatrix West • At our SA PGM operations, 4E PGM Mineral Reserves declined to 28.1Moz (-10.4%), largely driven by depletion (-1.9Moz) and the exclusion of the North Hill Project at Mimosa (-1.5Moz) As a dual-listed company, on the JSE and the NYSE, Sibanye-Stillwater is required to report Mineral Resources and Mineral Reserves in accordance with the SAMREC Code and subpart 1300 under Regulation S-K of the US Securities Act of 1933 (S-K 1300). APPROACH AND SALIENT FEATURES –––––––––––––––––––––––––––––––––––––––––––––––––––––––––––––––––– The statement of Mineral Resources and Mineral Reserves, as at 31 December 2023, outlines the attributable Mineral Resources and Mineral Reserves at each of our operating mines and projects. The Mineral Resources and Mineral Reserves are compared to the last full declaration made, as at 31 December 2022, and therefore include a 12-month period of production depletion due to mining activity. The statement is underpinned by appropriate Mineral Resources management processes and protocols that ensure adequate corporate governance. MINERAL RESOURCES AND MINERAL RESERVES: A SUMMARY IR - 114

This section is a condensed overview of the Mineral Resources and Mineral Reserves Report 2023, and comprises a high-level review of Mineral Resources and Mineral Reserves, as at 31 December 2023, and details the location, geology, mining, processing, operational statistics and changes at each of the Group’s mining operations and projects. The detailed statement of Mineral Resources and Mineral Reserves is available online at www.sibanyestillwater.com/news-investors/reports/annual/ Sibanye-Stillwater has extensive Mineral Resources and Mineral Reserves, the majority of which are precious metals located in the Americas and Southern Africa, as well as battery metals in Europe and the Americas, and zinc and copper in Australia. 2023 PRECIOUS METALS MINERAL RESERVES (70Moz) 26.3 28.1 5.5 2.5 2.9 1.2 3.4 US PGM operations SA PGM operations SA gold operations SA gold projects DRDGOLD AUS Zinc (AuEq) EUR & US Lithium (AuEq) 2023 PRECIOUS METALS MINERAL RESOURCE (420.1Moz) 87.8 3.5 182.8 51.5 36.5 15.6 4.7 2.2 2.0 20.6 12.9 US PGM operations Americas PGM&gold projects SA PGM operations SA PGM projects SA gold operations SA gold projects DRDGOLD AUS Zinc (AuEq) SA U3O8 (AuEq) AUS & Americas Copper (AuEq) EUR & US Lithium (AuEq) The Group reports in accordance with both the JSE listing requirements and the US Securities and Exchange Commission (SEC) rules and guidelines on commodity prices used for the estimation of Mineral Resources and Mineral Reserves at all managed operations, development, and exploration properties. Forward-looking prices, based on extensive market research that reflect “through the cycle” pricing, is considered in Mineral Resources and Mineral Reserves estimations. Mineral Resources price assumptions, which focus on longer timeframes, are based on moderately higher prices than for Mineral Reserves to reflect the ore-body flexibility. For the PGM mineral properties, the US$ based, forward-looking commodity prices used for the 2023 life of mine process has largely been retained from 2022, with the only change relating to rhodium, where prices have been adjusted downwards to US$6,000/oz from US$8,000/ oz. The longer term outlook of US$1,250/oz for platinum and palladium are maintained based on our evaluation of sustainable, through the cycle, price assumptions. At our South African gold operations, the most recent (at the time of estimation) bank consensus forward-looking prices were used for the determination of Mineral Reserves. This recognises an increase in spot gold price, while still maintaining a conservative longer-term outlook. Regarding base metals, adjustments to our longer-term outlooks for chrome ore and uranium have been made. Over the past year a 42% increase in lumpy chrome ore prices have been sustained, well above our previous assumptions of US$150–US$165/tonne, with current spot at approximately US$280/tonne. Over the past year, there has been a structural shift in the long-term fundamentals for uranium, underpinned by the recognition of uranium as a potential source of green energy, and a crucial contributor to the global decarbonisation requirements. This has resulted in the U3O8 spot price recently breaching US$100/lb and long term consensus prices breaching US$60/lb U3O8. As a result, the adjustments in the long- term contract price to US$60/lb is deemed reasonable and reflects a price that is sustainable in the foreseeable future. The commodity prices used in the estimation of Mineral Resources and Mineral Reserves at non-managed entities are provided in the notes to the relevant tables. At the Keliber lithium project, the estimates still reflect the Keliber Competent Persons (CP's) review, prior to the company taking majority ownership and were conducted at a price varying between US$13,450/t and US$16,500/t LiOH.H2O. The exchange rates used for the Mineral Resources and Mineral Reserves Declaration as at 31 December 2023 is R17.00:US$ (up from R16.00:US$ at end 2022, reflecting the continuing deteriorating long-term Rand:US$ outlook), US$1.12:EUR, R19:EUR and US$0.75:AUD. MINERAL RESOURCES AND MINERAL RESERVES: A SUMMARY continued IR - 115

2023 price decks for managed Mineral Resources & Mineral Reserves (excluding SA gold Mineral Reserves) 31 December 2023 31 December 2022 MINERAL RESOURCES MINERAL RESERVES MINERAL RESERVES Precious metals US$/oz R/oz R/kg US$/oz R/oz R/kg US$/oz R/oz R/kg Gold 1,800 30,600 983,812 1,650 28,050 901,828 1,650 26,400 850,000 Platinum 1,500 25,500 819,843 1,250 21,250 683,203 1,250 20,000 643,014 Palladium 1,500 25,500 819,843 1,250 21,250 683,203 1,250 20,000 643,014 Rhodium 8,000 136,000 4,372,498 6,000 102,000 3,279,374 8,000 128,000 4,115,292 Iridium 3,000 51,000 1,639,687 2,500 42,500 1,366,406 2,500 40,000 1,286,029 Ruthenium 350 5,950 191,297 300 5,100 163,969 300 4,800 154,323 Base metals US$/lb US$/tonne R/tonne US$/lb US$/tonne R/tonne US$/lb US$/tonne R/tonne Nickel 7.94 17,500 297,500 7.35 16,200 275,400 7.35 16,200 259,200 Copper 4.54 10,000 170,000 4.06 8,950 152,150 4.06 8,950 143,200 Cobalt 25 55,116 936,964 22 48,502 824,528 22 48,502 776,026 Zinc 1.30 2,866 48,722 1.15 2,535 43,100 N/A N/A N/A Uranium oxide (U3O8)¹ 60 132,277 2,248,712 50 110,231 1,873,927 50 110,231 1,763,696 Chromium oxide (Cr₂O₃), (42% concentrate)¹ 0.10 220 3,740 0.09 200 3,400 0.06 150 2,400 Lithium carbonate 14.97 33,000 561,000 13.61 30,000 510,000 N/A N/A N/A Lithium hydroxide 15.88 35,000 595,000 14.51 32,000 544,000 N/A N/A N/A 1 Long-term contract prices Sibanye-Stillwater 2023 price deck for Mineral Reserves at managed gold operations 2024 2025 2026 2027 Long Term (US$/oz) 1,984 1,875 1,750 1,700 1,600 (R/kg) 1,179,872 1,091,092 975,333 934,075 941,374 AMERICAS –––––––––––––––––––––––––––––––––––––––––––––––––––––––––––––––––– Platinum Group Metals US PGM operations • Total 2E PGM Mineral Resources of 87.8Moz, a year-on-year increase of 4.4% • Total 2E PGM Mineral Reserves of 26.3Moz, unchanged year-on-year • Given our longer term outlook on PGM prices, Mineral Reserves and Mineral Resources have remained relatively stable, with Mineral Resources depletion off-set by successful brownfield exploration activity, and enhanced by continued improvement in estimation practices. In light of the current depressed palladium price, ongoing review of the US PGM operations production and ramp-up profiles are currently taking place A detailed reconciliation of the 2022 to 2023 US PGM operations Mineral Reserves is shown in the adjacent table. Factors 2E PGM (Moz) 2022 Reserves 26.3 Depletion (0.5) Post depletion 25.8 Inclusion/exclusion 0.2 Estimation 2.2 Modifying factors (1.9) 2023 Reserves 26.3 PGM Exploration projects in the Americas During 2023, the Group’s equity interest in Generation Mining, the owner and manager of the Marathon PGM Project in Canada, reduced from 18.19% to 13.9%. This has resulted in an associated -18.9% decrease in attributable Mineral Resources to 36.0Mt, grading 0.7g/t PGM, 0.2% Cu, 1.6 g/t Ag and 0.1 g/t Au. Battery Metals Lithium exploration projects • Total Mineral Resources of 24.9Mt grading 0.17% Li (for 232kt LCE) and 3.9% H3BO3 for 971kt of H3BO3 The attributable Mineral Resources in the Rhyolite Ridge Lithium- Boron project (Rhyolite Ridge project), via the Group's 6.91% shareholding in ioneer Ltd., were positively impacted by an updated Mineral Resource Estimate, which now incorporates additional mineralised horizons within the same footprint. Copper exploration projects • Total copper Mineral Resources of 6,386Mlb, a decrease of -39.4% The Group's attributable total copper Mineral Resources were impacted by a 60% earn-in the Altar project by Aldebaran Resources Ltd (Aldebaran). Including the 14.35% equity interest in Aldebaran, the Group’s total attributable interest equals 48.61%. MINERAL RESOURCES AND MINERAL RESERVES: A SUMMARY continued IR - 116

SOUTHERN AFRICA –––––––––––––––––––––––––––––––––––––––––––––––––––––––––––––––––– Platinum Group Metals SA PGM operations • Total 4E PGM Mineral Resources of 182.8Moz, a year-on-year increase of 3.1% • Total 4E PGM Mineral Reserves of 28.1Moz, a year-on-year decrease of -10.4% Mineral Resources were positively impacted (+8.97Moz) by the re- incorporation of the Schaapkraal Mineral Resources into the Marikana operation, which was previously excluded subject to the final approval of the prospecting right renewal. Mineral Reserves were primarily impacted by the exclusion of the North Hill Project at Mimosa in Zimbabwe (-1.5Moz) due to commercial considerations and depletion (-1.9Moz). The acquisition of a further 50% in the Kroondal operation added 0.5Moz, while adjustments in modifying factors, estimation methodology and geological interpretation accounted for the balance of the changes. This acquisition will allow SRPM’s Mineral Resources to be mined from the low-cost Kroondal infrastructure, bringing forward value, and extending the life of the Kroondal trackless operations by up to 10 years. The attributable Mineral Reserves relating to the anticipated extension of the Kroondal operations into the SRPM mining right (mainly at Kopaneng and Bambanani), totalling 0.995Moz, are reflected under the Rustenburg mining right. Due to the Groups 74% effective ownership in SRPM, the attributable interest in Kroondal has changed from 50% to 87%. A detailed reconciliation of the 2022 to 2023 SA PGM operations Mineral Reserves is shown below. SA PGM operations – Mineral Reserves reconciliation Factors 4E PGM (Moz) 31-Dec-22 31.4 Depletion (1.9) Post depletion 29.5 Geological interpretation (0.1) Estimation methodology (0.2) Economic valuation (1.5) Modifying factors (0.1) Attr. % gain Kroondal 0.5 31-Dec-23 28.1 SA PGM exploration projects • Total 4E PGM Mineral Resources of 51.5Moz, a decrease of -3% The only year-on-year change relates to the exclusion of the care and maintenance Blue Ridge Mineral Resource, where a decision was made to progress with official mine closure. The Group, through its subsidiary Akanani Mining Proprietary Limited (Akanani), was the holder of a new order (converted) prospecting right MPT No. 249/2006 for platinum group metals, gold, silver, nickel, copper and cobalt on the farms Moordkopje and Zwartfontein which covered 40.95km². The right was renewed and ultimately expired on 3 April 2021. An application for conversion to a mining right was submitted by Sibanye-Stillwater in March 2021, prior to expiry of the converted prospecting right. Based on what Sibanye- Stillwater believes is an incorrect interpretation of the prevailing legislation and case law, the Department of Mineral Resources and Energy granted a prospecting right to a third-party applicant. Sibanye-Stillwater has referred the dispute to the High Court for review and is of the view that its prospects of success in this review application are good. The group is continuing to report the Mineral Resources. Gold SA gold operations • Total gold Mineral Resources of 41.2Moz, a year-on-year decrease of -22.7% • Total gold Mineral Reserves of 8.4Moz, a year-on-year decrease of -18.4% The change in Mineral Resources is mainly attributed to the closure of Kloof 4 Shaft (-6.1Moz), the exclusion of the below infrastructure Eastern Boundary Area (EBA) area at Kloof 7 Shaft (-4.9Moz) due to it having no reasonable prospect for eventual economic extraction (RPEEE) post the closure of Kloof 4 Shaft, and the cessation of Beatrix 4 Shaft (-1.5Moz), off-set by minor additions elsewhere. Apart from depletion (-0.8Moz), the change in Mineral Reserves are mainly attributed to the closure of Kloof 4 Shaft (-1.5Moz) as well as further adjustments at Driefontein and Kloof operations due to area exclusions and changes in the Mineral Resource (0.5Moz). A detailed reconciliation of the 2022 to 2023 SA gold operations Mineral Reserves is provided below. SA gold operations – Mineral Reserves reconciliation Factors Gold (Moz) 31-Dec-22 10.3 Depletion (0.8) Post depletion 9.5 Area inclusions/exclusions 0.2 Geological interpretation 0.3 Economic valuation (1.6) 31-Dec-23 8.4 SA gold - Burnstone development project • Total gold Mineral Resources of 8.8Moz, a year-on-year decrease of -4% • Total gold Mineral Reserves of 2.5Moz, a year-on-year decrease of -5.4% The decrease in Mineral Resources is due to a reduction in the Inferred Mineral Resources based on estimation practices. The minor reduction in Mineral Reserves was driven by the exclusion of a small area based on logistical considerations. SA gold - Southern Free State (SOFS) exploration project • Total gold Mineral Resources of 6.9Moz, remained unchanged at the SOFS) project Uranium SA Uranium exploration projects • Total U3O8 Mineral Resources of 59.2Moz, a year-on-year decrease of -11.1% Uranium Mineral Resources occur as co-mineralisation within tonnage also reported under the SA gold Mineral Resources. MINERAL RESOURCES AND MINERAL RESERVES: A SUMMARY continued IR - 117

A review of the economic potential of the remaining uranium Mineral Resources associated with the Millsite tailings storage facilities (TSFs), has resulted in the exclusion of -7.4Mlb. EUROPE –––––––––––––––––––––––––––––––––––––––––––––––––––––––––––––––––– Battery Metals Keliber lithium development project • Lithium carbonate equivalent (LCE) Mineral Resources of 471kt, a year-on-year increase of 28.6% • Lithium carbonate equivalent (LCE) Mineral Reserves of 182kt, a year-on-year decrease of -6% During 2023, ongoing, successful exploration activities at the Keliber lithium project in Finland has resulted in an increase of the Mineral Resources at the previously reported deposits, as well as the identification of additional mineralised areas. A revision in estimation methodology, which now better delineates and distinguishes between ore and barren material inclusions, has also had a positive impact on the reported grade, which has increased to 1.21% Li₂O. The reported Mineral Reserves are still based on the previous (2021) Mineral Resource estimate, and will be updated with the new Resource estimate during 2024. The decrease of -6% is due to a reduction in attributable ownership from 84.96% to 79.82%. AUSTRALIA –––––––––––––––––––––––––––––––––––––––––––––––––––––––––––––––––– Century operation • Zinc Mineral Resources of 3,002Mlb, a year-on-year increase of 257% • Zinc Mineral Reserves of 1,726Mlb, a year-on-year increase of 287% The year-on-year change in Mineral Resources and Mineral Reserves were primarily driven by the increase in attributable ownership to 100%, off-set partially by mining depletion off the finite TSF Mineral Reserves. The Watson's Lode Inferred Mineral Resource, previously reported on, has been excluded due to unfavourable RPEEE considerations, driven by structural complexity. Mt Lyell copper mine • Copper Mineral Resources of 1,609Mlb During 2023, with the 100% acquisition of New Century Resources, the Group obtained the option to acquire the historic Mt Lyell Copper mine, situated in Tasmania, from Vedanta Resources. The option was exercised during November 2023. A study into the feasibility of reopening the mine is in progress. CORPORATE GOVERNANCE –––––––––––––––––––––––––––––––––––––––––––––––––––––––––––––––––– This Mineral Resource and Mineral Reserve declaration represents a condensed and consolidated summary of the full Sibanye- Stillwater Mineral Resource and Mineral Reserve declaration available in the Group Mineral Resource and Mineral Reserve Report, at www.sibanyestillwater.com/news-investors/reports/ annual The Mineral Resources and Mineral Reserves are estimates at a particular date, and are affected by fluctuations in mineral prices, exchange rates, operating costs, mining permits, changes in legislation and operating factors. By-product metals that do not provide a material contribution to potential revenue flows are typically excluded from the statements. Sibanye-Stillwater prepares and reports its Mineral Resources and Mineral Reserves in accordance with the SAMREC Code, the updated Section 12 of the JSE Listings Requirements, and S-K 1300. For non-managed mineral properties, Mineral Resources and Mineral Reserves are in certain cases prepared under different codes, such as JORC and NI-43-101. These codes are closely aligned with SAMREC, form part of the Committee for Mineral Reserves International Reporting Standards (CRIRSCO). See Sibanye- Stillwater's Mineral Reserves and Mineral Resource Report for SK-1300 compliance disclosures. . All financial models used to determine the managed Mineral Reserves are based on current tax regulations as at 31 December 2023. Rounding-off of figures may result in minor computational discrepancies. Where this happens, it is not deemed significant. There are teams of Competent Persons (CPs), designated in terms of the respective national reporting codes, who take responsibility for the reporting of Mineral Resources and Mineral Reserves. Corporate governance on the overall compliance of the Group’s figures and responsibility for the generation of a Group consolidated statement has been overseen by the lead CPs, included below. The Group has the written confirmation of the lead CP’s that the information, as disclosed in this report, is compliant with the relevant security exchanges’ listing requirements (Section 12 of the JSE Listings Requirements, SAMREC Table 1 and S-K1300), and that it may be published in the form and context in which it was intended. For the managed operations, Stephan Stander is the Group Lead CP for Mineral Resources; and Tom van den Berg is the Group Lead CP for Mineral Reserves. Stephan is a registered member of the South African Council for Natural Scientific Professions (SACNASP 400089/96). Tom is a registered member of the South African Institute of Mining and Metallurgy (SAIMM 700497). MINERAL RESOURCES AND MINERAL RESERVES: A SUMMARY continued IR - 118

Mineral Resources Inclusive of Mineral Reserves 31 Dec 2023 31 Dec 2022 Attributable 100% Attributable 100% PGM Tonnes Grade PGM PGM Tonnes Grade PGM PGM (Mt) (g/t) (Moz) (Moz) (Mt) (g/t) (Moz) (Moz) Americas¹ Operations Measured 44.5 15.2 21.7 21.7 42.6 13.7 18.7 18.7 Indicated 49.1 14.2 22.4 22.4 50.4 12.8 20.7 20.7 Measured + Indicated 93.6 14.7 44.1 44.1 93.0 13.2 39.4 39.4 Inferred 113.8 11.9 43.7 43.7 114.0 12.2 44.8 44.8 Exploration Measured 22.1 0.8 0.6 4.1 18.8 0.8 0.5 2.8 Indicated 10.0 0.6 0.2 1.3 21.5 0.6 0.4 2.3 Measured + Indicated 32.1 0.7 0.7 5.4 40.3 0.7 0.9 5.1 Inferred 4.0 0.5 0.1 0.4 5.0 0.5 0.1 0.4 Southern Operations Measured 416.3 4.3 58.1 79.1 419.7 4.3 58.2 81.8 Africa² Indicated 648.9 4.3 89.5 113.5 644.1 4.3 89.3 113.7 Measured + Indicated 1,065.1 4.3 147.5 192.6 1,063.7 4.3 147.6 195.5 Inferred 242.0 4.5 35.2 44.9 212.3 4.4 29.7 38.5 Exploration Measured 1.8 4.2 0.2 0.3 1.8 4.2 0.2 0.3 Indicated 244.5 4.1 32.5 45.1 253.7 4.1 33.5 47.0 Measured + Indicated 246.2 4.1 32.7 45.4 255.4 4.1 33.7 47.3 Inferred 158.8 3.7 18.8 26.2 165.4 3.7 19.4 27.5 Total Measured + Indicated 1,437.0 4.9 225.2 287.6 1,452.4 4.7 221.5 287.3 Grand total 1,955.6 5.1 323.0 402.8 1,949.1 5.0 315.6 398.5 Attributable 100% Attributable 100% GOLD Tonnes Grade Gold Gold Tonnes Grade Gold Gold (Mt) (g/t) (Moz) (Moz) (Mt) (g/t) (Moz) (Moz) Southern Operations Measured 465.0 1.7 24.7 27.4 483.5 1.8 28.5 31.4 Africa Indicated 390.9 1.2 14.6 17.0 401.8 1.4 18.2 20.6 Measured + Indicated 855.9 1.4 39.3 44.4 885.3 1.6 46.7 51.9 Inferred 22.7 2.6 1.9 2.0 35.4 5.8 6.6 6.7 Development Measured 1.0 5.6 0.2 0.2 1.1 6.2 0.2 0.2 Indicated 24.8 5.6 4.5 4.5 25.5 5.6 4.6 4.6 Measured + Indicated 25.9 5.6 4.7 4.7 26.6 5.7 4.8 4.8 Inferred 29.3 4.3 4.1 4.1 31.5 4.2 4.3 4.3 Exploration Measured — — — — — — — — Indicated 44.1 4.5 6.4 6.4 44.1 4.5 6.4 6.4 Measured + Indicated 44.1 4.5 6.4 6.4 44.1 4.5 6.4 6.4 Inferred 4.0 3.6 0.5 0.5 4.0 3.6 0.5 0.5 Australia Exploration Measured 3.7 0.2 — — — — — — Indicated 51.4 0.3 0.4 0.4 — — — — Measured + Indicated 55.1 0.2 0.4 0.4 — — — — Inferred 24.3 0.1 0.1 0.1 — — — — Americas Exploration Measured 332.1 0.1 1.2 2.8 656.7 0.1 2.5 2.6 Indicated 292.1 0.1 0.8 1.7 614.2 0.1 1.7 2.5 Measured + Indicated 624.2 0.1 2.0 4.4 1,270.9 0.1 4.1 5.2 Inferred 96.5 0.1 0.2 0.5 202.7 0.1 0.5 0.8 Total Measured + Indicated 1,605.2 1.0 52.8 60.4 2,226.9 0.9 62.1 68.4 Grand total 1,782.1 1.0 59.5 67.4 2,500.5 0.9 73.9 80.6 MINERAL RESOURCES AND MINERAL RESERVES: A SUMMARY continued IR - 119

Attributable 100% Attributable 100% LITHIUM Tonnes Li Li₂O LCE LCE Tonnes Li Li₂O LCE LCE (Mt) (%) (%) (kt) (kt) (Mt) (%) (%) (kt) (kt) Europe³ Development Measured 3.3 0.62 1.33 108 135 3.7 0.55 1.18 106 125 Indicated 8.0 0.57 1.22 241 302 8.0 0.48 1.03 202 238 Measured + Indicated 11.3 0.58 1.25 349 437 11.6 0.50 1.07 309 364 Inferred 4.5 0.51 1.10 122 153 2.8 0.38 0.82 57 67 Americas³ Exploration Measured 3.0 0.17 0.37 28 403 2.7 0.17 0.37 25 357 Indicated 17.3 0.17 0.37 160 2,317 6.1 0.16 0.33 50 725 Measured + Indicated 20.4 0.17 0.37 188 2,720 8.8 0.16 0.35 75 1,082 Inferred 4.5 0.18 0.39 44 630 1.4 0.16 0.35 12 167 Total Measured + Indicated 31.6 0.32 0.69 537 3,157 20.4 0.35 0.76 384 1,446 Grand total 40.7 0.32 0.70 702 3,940 24.6 0.35 0.74 453 1,680 Attributable 100% Attributable 100% URANIUM Tonnes Grade U₃O₈ U₃O₈ Tonnes Grade U₃O₈ U₃O₈ (Mt) (kg/t) (Mlb) (Mlb) (Mt) (kg/t) (Mlb) (Mlb) Southern Exploration Measured 63.8 0.24 33.2 41.0 158.0 0.12 40.4 50.5 Africa Indicated 47.5 0.25 25.9 28.3 49.1 0.24 26.1 28.5 Measured + Indicated 111.4 0.24 59.1 69.3 207.0 0.15 66.5 79.0 Inferred 0.04 1.10 0.1 0.1 0.04 1.10 0.1 0.1 Grand total 111.4 0.24 59.2 69.4 207.1 0.15 66.6 79.1 Attributable 100% Attributable 100% COPPER Tonnes Grade Copper Copper Tonnes Grade Copper Copper (Mt) (%) (Mlb) (Mlb) (Mt) (%) (Mlb) (Mlb) Australia Exploration Measured 3.7 0.89 73 73 — — — — Indicated 51.4 0.91 1,036 1,036 — — — — Measured + Indicated 55.1 0.91 1,108 1,108 — — — — Inferred 24.3 0.94 501 501 — — — — Americas Exploration Measured 332.1 0.42 3,062 6,807 656.7 0.43 6,179 6,558 Indicated 292.1 0.41 2,622 5,643 614.2 0.40 5,477 6,321 Measured + Indicated 624.2 0.41 5,683 12,450 1,270.9 0.42 11,656 12,879 Inferred 96.5 0.41 871 1,893 202.7 0.41 1,812 2,098 Total Measured + Indicated 679.3 0.45 6,792 13,558 1,270.9 0.42 11,656 12,879 Grand total 800.2 0.46 8,163 15,952 1,473.6 0.41 13,468 14,977 Attributable 100% Attributable 100% ZINC Tonnes Grade Zinc Zinc Tonnes Grade Zinc Zinc (Mt) (%) (Mlb) (Mlb) (Mt) (%) (Mlb) (Mlb) Australia Operations Measured 25.6 3.1 1,750 1,750 7.3 3.1 491 2,467 Indicated — — — — — — — — Measured + Indicated 25.6 3.1 1,750 1,750 7.3 3.1 491 2,467 Inferred — — — — — — — — Exploration Measured 1.0 4.8 106 106 0.2 4.8 21 106 Indicated 8.9 5.7 1,111 1,111 1.8 5.7 221 1,111 Measured + Indicated 9.9 5.6 1,217 1,217 2.0 5.6 242 1,217 Inferred 0.6 2.7 35 35 0.5 6.5 66 331 Total Measured + Indicated 35.5 3.8 2,967 2,967 9.2 3.6 733 3,684 Grand total 36.1 3.8 3,002 3,002 9.7 3.7 799 4,015 MINERAL RESOURCES AND MINERAL RESERVES: A SUMMARY continued IR - 120

Mineral Resources Exclusive of Mineral Reserves 31 Dec 2023 31 Dec 2022 Attributable 100% Attributable 100% PGM Tonnes Grade PGM PGM Tonnes Grade PGM PGM (Mt) (g/t) (Moz) (Moz) (Mt) (g/t) (Moz) (Moz) Americas¹ Operations Measured 21.1 11.5 7.8 7.8 19.3 10.4 6.4 6.4 Indicated 19.3 9.2 5.7 5.7 19.1 7.9 4.8 4.8 Measured + Indicated 40.4 10.4 13.5 13.5 38.3 9.1 11.3 11.3 Inferred 113.8 11.9 43.7 43.7 114.0 12.2 44.8 44.8 Exploration Measured 22.1 0.8 0.6 4.1 18.8 0.8 0.5 2.8 Indicated 10.0 0.6 0.2 1.3 21.5 0.6 0.4 2.3 Measured + Indicated 32.1 0.7 0.7 5.4 40.3 0.7 0.9 5.1 Inferred 4.0 0.5 0.1 0.4 5.0 0.5 0.1 0.4 Southern Operations Measured 262.0 4.6 38.8 52.4 262.8 4.7 39.3 54.6 Africa² Indicated 534.3 4.1 70.9 90.1 499.9 4.2 67.4 86.0 Measured + Indicated 796.4 4.3 109.7 142.5 762.6 4.4 106.7 140.6 Inferred 240.9 4.5 34.9 44.5 205.3 4.4 28.8 37.4 Exploration Measured 1.8 4.2 0.2 0.3 1.8 4.2 0.2 0.3 Indicated 244.5 4.1 32.5 45.1 253.7 4.1 33.5 47.0 Measured + Indicated 246.2 4.1 32.7 45.4 255.4 4.1 33.7 47.3 Inferred 158.8 3.7 18.8 26.2 165.4 3.7 19.4 27.5 Total Measured + Indicated 1,115.0 4.4 156.7 206.9 1,096.7 4.3 152.6 204.3 Grand total 1,632.5 4.8 254.2 321.7 1,586.4 4.8 245.7 314.4 Attributable 100% Attributable 100% GOLD Tonnes Grade Gold Gold Tonnes Grade Gold Gold (Mt) (g/t) (Moz) (Moz) (Mt) (g/t) (Moz) (Moz) Southern Africa Operations Measured 242.7 2.2 17.1 17.8 249.9 2.5 19.8 20.5 Indicated 286.9 1.4 12.5 14.1 297.9 1.7 15.8 17.4 Measured + Indicated 529.7 1.7 29.6 31.9 547.7 2.0 35.6 37.9 Inferred 22.7 2.6 1.9 2.0 35.4 5.8 6.6 6.7 Development Measured 0.4 4.4 0.1 0.1 0.3 13.4 0.1 0.1 Indicated 10.9 4.4 1.6 1.6 5.8 11.1 2.1 2.1 Measured + Indicated 11.4 4.4 1.6 1.6 6.0 11.2 2.2 2.2 Inferred 29.3 4.3 4.1 4.1 31.5 4.2 4.3 4.3 Exploration Measured — — — — — — — — Indicated 44.1 4.5 6.4 6.4 44.1 4.5 6.4 6.4 Measured + Indicated 44.1 4.5 6.4 6.4 44.1 4.5 6.4 6.4 Inferred 4.0 3.6 0.5 0.5 4.0 3.6 0.5 0.5 Australia Exploration Measured 3.7 0.2 — — — — — — Indicated 51.4 0.3 0.4 0.4 — — — — Measured + Indicated 55.1 0.2 0.4 0.4 — — — — Inferred 24.3 0.1 0.1 0.1 — — — — Americas Exploration Measured 332.1 0.1 1.2 2.8 656.7 0.1 2.5 2.6 Indicated 292.1 0.1 0.8 1.7 614.2 0.1 1.7 2.5 Measured + Indicated 624.2 0.1 2.0 4.4 1,270.9 0.1 4.1 5.2 Inferred 96.5 0.1 0.2 0.5 202.7 0.1 0.5 0.8 Total Measured + Indicated 1,264.5 1.0 40.0 44.8 1,868.8 0.8 48.3 51.7 Grand total 1,441.3 1.0 46.7 51.8 2,142.4 0.9 60.1 63.9 MINERAL RESOURCES AND MINERAL RESERVES: A SUMMARY continued IR - 121

Attributable 100% Attributable 100% LITHIUM Tonnes Li Li₂O LCE LCE Tonnes Li Li₂O LCE LCE (Mt) (%) (%) (kt) (kt) (Mt) (%) (%) (kt) (kt) Europe³ Development Measured 0.4 0.58 1.25 12 15 0.5 0.47 1.02 13 16 Indicated 3.5 0.56 1.20 103 129 3.3 0.48 1.04 86 101 Measured + Indicated 3.9 0.56 1.20 115 144 3.9 0.48 1.04 100 117 Inferred 3.6 0.50 1.07 94 118 2.8 0.38 0.82 57 67 Americas³ Exploration Measured 3.0 0.17 0.37 28 403 2.7 0.17 0.37 25 357 Indicated 17.3 0.17 0.37 160 2,317 6.1 0.16 0.33 50 725 Measured + Indicated 20.4 0.17 0.37 188 2,720 8.8 0.16 0.35 75 1,082 Inferred 4.5 0.18 0.39 44 630 1.4 0.16 0.35 12 167 Total Measured + Indicated 24.2 0.24 0.51 303 2,864 12.7 0.26 0.56 175 1,199 Grand total 32.3 0.26 0.55 440 3,612 16.9 0.27 0.58 244 1,433 Attributable 100% Attributable 100% URANIUM Tonnes Grade U₃O₈ U₃O₈ Tonnes Grade U₃O₈ U₃O₈ (Mt) (kg/t) (Mlb) (Mlb) (Mt) (kg/t) (Mlb) (Mlb) Southern Exploration Measured 63.8 0.24 33.2 41.0 158.0 0.12 40.4 50.5 Africa Indicated 47.5 0.25 25.9 28.3 49.1 0.24 26.1 28.5 Measured + Indicated 111.4 0.24 59.1 69.3 207.0 0.15 66.5 79.0 Inferred 0.04 1.10 0.1 0.1 0.04 1.10 0.1 0.1 Grand total 111.4 0.24 59.2 69.4 207.1 0.15 66.6 79.1 Attributable 100% Attributable 100% COPPER Tonnes Grade Copper Copper Tonnes Grade Copper Copper (Mt) (%) (Mlb) (Mlb) (Mt) (%) (Mlb) (Mlb) Australia Exploration Measured 3.7 0.89 73 73 — — — — Indicated 51.4 0.91 1,036 1,036 — — — — Measured + Indicated 55.1 0.91 1,108 1,108 — — — — Inferred 24.3 0.94 501 501 — — — — Americas Exploration Measured 332.1 0.42 3,062 6,807 656.7 0.43 6,179 6,558 Indicated 292.1 0.41 2,622 5,643 614.2 0.40 5,477 6,321 Measured + Indicated 624.2 0.41 5,683 12,450 1,270.9 0.42 11,656 12,879 Inferred 96.5 0.41 871 1,893 202.7 0.41 1,812 2,098 Total Measured + Indicated 679.3 0.45 6,792 13,558 1,270.9 0.42 11,656 12,879 Grand total 800.2 0.46 8,163 15,952 1,473.6 0.41 13,468 14,977 Attributable 100% Attributable 100% ZINC Tonnes Grade Zinc Zinc Tonnes Grade Zinc Zinc (Mt) (%) (Mlb) (Mlb) (Mt) (%) (Mlb) (Mlb) Australia Exploration Measured 1.0 4.8 106 106 0.2 4.8 21 106 Indicated 8.9 5.7 1,111 1,111 1.8 5.7 221 1,111 Measured + Indicated 9.9 5.6 1,217 1,217 2.0 5.6 242 1,217 Inferred 0.6 2.7 35 35 0.5 6.5 66 331 Grand total 10.5 5.4 1,252 1,252 2.4 5.8 308 1,548 MINERAL RESOURCES AND MINERAL RESERVES: A SUMMARY continued IR - 122

Mineral Reserves 31 Dec 2023 31 Dec 2022 Attributable 100% Attributable 100% PGM Tonnes Grade PGM PGM Tonnes Grade PGM PGM (Mt) (g/t) (Moz) (Moz) (Mt) (g/t) (Moz) (Moz) Americas¹ Operation Proved 10.9 13.5 4.8 4.8 10.0 13.5 4.3 4.3 Probable 49.5 13.6 21.5 21.5 50.3 13.6 22.0 22.0 Proved + Probable 60.4 13.5 26.3 26.3 60.2 13.6 26.3 26.3 Southern Africa² Operation Proved 113.2 3.5 12.9 17.8 128.9 3.5 14.7 21.4 Probable 132.8 3.6 15.3 19.3 151.2 3.4 16.7 21.6 Proved + Probable 246.0 3.6 28.1 37.1 280.0 3.5 31.4 43.0 Grand total Proved + Probable 306.4 5.5 54.5 63.4 340.3 5.3 57.7 69.3 Attributable 100% Attributable 100% GOLD Tonnes Grade Gold Gold Tonnes Grade Gold Gold (Mt) (g/t) (Moz) (Moz) (Mt) (g/t) (Moz) (Moz) Southern Africa Operation Proved 211.8 0.8 5.4 7.3 227.8 0.9 6.6 8.7 Probable 124.2 0.8 3.0 3.9 124.6 0.9 3.7 4.5 Proved + Probable 336.0 0.8 8.4 11.2 352.4 0.9 10.3 13.2 Development Proved — — — — — — — — Probable 19.8 4.0 2.5 2.5 20.5 4.0 2.7 2.7 Proved + Probable 19.8 4.0 2.5 2.5 20.5 4.0 2.7 2.7 Grand total Proved + Probable 355.8 1.0 10.9 13.7 373.0 1.1 12.9 15.9 Attributable 100% Attributable 100% LITHIUM Tonnes Li Li₂O LCE LCE Tonnes Li Li₂O LCE LCE (Mt) (%) (%) (kt) (kt) (Mt) (%) (%) (kt) (kt) Europe³ Development Proved 3.1 0.48 1.04 80 101 3.3 0.48 1.04 85 101 Probable 4.6 0.42 0.90 102 127 4.9 0.42 0.90 108 127 Grand total Proved + Probable 7.7 0.44 0.96 182 228 8.2 0.44 0.96 194 228 Attributable 100% Attributable 100% ZINC Tonnes Grade Zinc Zinc Tonnes Grade Zinc Zinc (Mt) (%) (Mlb) (Mlb) (Mt) (%) (Mlb) (Mlb) Australia Operation Proved 26.1 3.0 1,726 1,726 6.8 3.0 446 2,240 Probable — — — — — — — — Grand total Proved + Probable 26.1 3.0 1,726 1,726 6.8 3.0 446 2,240 Note: Mineral Resources and Mineral Reserves are attributable, based on legal equity interest, and metal content is additionally stated on a 100% basis. Details on attributable interests can be found in the Mineral Resource and Mineral Reserves Report 2023. 1 For the US PGM operations, PGM is represented by the 2E (Pt and Pd) 2 For the SA PGM operations, PGM is represented by the 4E (Pt, Pd, Rh and Au) 3 For the Lithium Mineral Resources, LCE content was calculated by multiplying the Li (%) content by a factor of 5.323. Lithium Hydroxide Monohydrate (LiOH.H2O) can be derived from LCE by dividing by a factor of 0.88. MINERAL RESOURCES AND MINERAL RESERVES: A SUMMARY continued IR - 123

OUR BUSINESS AND LEADERSHIP WHAT DRIVES US OUR PERFORMANCE REWARDING DELIVERY ANCILLARY INFORMATION IR - 124 ENSURING SAFETY AND WELLBEING

CONTINUOUS SAFE PRODUCTION WHAT WE DID IN 2023 SUCCESSES • A 10% reduction in the serious injury frequency rate (2.91 to 2.61), setting a record low for the Group • Leading indicators demonstrating risk reduction across the Group SA region • Outstanding serious injury frequency rate for surface operations, improving 13% year-on-year US region • System to monitor critical management routines implemented EU region • More than 95% of employees signed our Life-saving commitment book • High percentage (>80%) of the actions of the fatal elimination plans executed in the first year of implementation AUS region • No serious injuries recorded for the 2023 calendar year CHALLENGES • Regrettable loss of eleven lives at our operations • Regression of lagging indicators – total recordable injury frequency rate, lost time injury frequency rate and fatal injury frequency rate TARGETS AND KEY OBJECTIVES Status See ALIGNMENT WITH SDGs • Maintaining ISO 45001 certification1 Achieved Page 126 8 See the supplementary disclosure – Progressing the UN’s SDGs www.sibanyestillwater.com/news- investors/reports/annual MATERIAL MATTERS M2 Safety and Health M3 Licence to operate • Eliminating fatalities Achieve Zero harm In progress Page 127 • Group TRIFR benchmark of 4.0 per million hours worked expected to be achieved by the end of 2025 In progress Page 132 • TRIFR benchmarks for 2023 – Group: 4.84 per million hours worked • SA gold operations: 4.97 per million hours worked • SA PGM operations: 4.58 per million hours worked • US operations: 6.76 per million hours worked Not achieved Page 132 1 Excluding AUS region and Keliber lithium project APPROACH –––––––––––––––––––––––––––––––––––––––––––––––––––––––––––––––––– Protecting the safety and health of our employees and stakeholders is our primary objective. Our approach to health and safety is underpinned by our iCARES values and is a strategic essential to our business. We remain committed to eliminating fatal incidents and achieving our goal of Zero harm. Implementing critical controls and critical lifesaving behaviours is core to our safety strategy. Such interventions have been essential to the progress towards reducing the risks associated with fatal and serious injuries. Through compliance, we aim to block the path to death and mine without fatalities. We empower and encourage crew and frontline supervisors to stop work immediately should conditions be unsafe. In 2023 and going forward into 2024, our leadership focus is shifting from control implementation to behaviour and management routines. We will also continue to engineer out risk through the roll out of technology and innovation where appropriate to bolster safety. This includes the rollout of approximately 650 digital devices to automate the capture of safety incidents. More than 3,000 devices will be issued over the next two years to other service department employees and frontline supervisors. During 2023, we invested R893 million at our SA PGM operations (2022: R768 million), R573 million at our SA gold operations (2022: R649 million) and US$18 million (2022: US$32 million) at our US PGM operations in safety management initiatives, including personal protective equipment (PPE), capital outlay and training. As a minimum requirement, all employees receive training on our safety standards and safe work procedures through annual refresher and induction programmes. During the year, we invested a total of 555,368 hours on safety and health-related training. CONTINUOUS SAFE PRODUCTION IR - 125

Zero harm is our ultimate objective, but the immediate goal is to eliminate high-energy fatals (these relate to high energy source incidents such as fall of ground, mobile equipment related) and serious incidents through our Fatal elimination strategy. This strategy is comprised of the three key pillars: critical controls, critical life saving behaviours, and critical management routines. We are dedicated to embedding an operational safety culture that enables our teams to work to standards and to stop any unsafe work without hesitation. ACCOUNTABILITY, GOVERNANCE AND ASSURANCE GOVERNANCE ACCOUNTABILITY Board • Safety and Health Committee • Audit Committee • Risk Committee Executive Committee and C-suite • Our Safe production strategy is driven by the CEO and senior leadership with support from the Board • High-potential incidents and fatal incidents are reviewed by the Group high-potential incident and fatal review committee. Lessons and subsequent actions are shared throughout the Group Operational • The operational SVP, assisted by their VP at each site, assumes the first line of responsibility and is supported by the operational safety department • Together with regional safety senior managers, the Group champion for Health and Safety provides support to the chief regional officers • At the SA region, managers and mine overseers are responsible for safety tracking and monitoring • At the SA and US PGM regions the joint health and safety committees meet monthly at each operation to address safety concerns • Our SA PGM operations have 2,708 workplace safety representatives and 43 full-time safety representatives, our SA gold operations have 1,941 workplace safety representatives and 36 full-time safety representatives; our US operations have 100 safety representatives. These employees monitor safety performance through inspections, and they participate in incident investigations • We encourage a bottom-up approach to safety, empowering our workforce to take responsibility for safety For more details see Board and executive leadership, page 8. RELEVANT LEGISLATION AND REGULATIONS (list not exhaustive, only key regulations listed) South Africa • Mine Health and Safety Act and Regulations 29 of 1996 • Occupational Health and Safety Act 85 of 1993 United States • Federal Mine Safety and Health Act of 1977 • The Occupational Safety and Health Act of 1970 • Other US’ governmental divisions such as the Bureau of Alcohol, Tobacco, Firearms and Explosives, the Nuclear Regulatory Commission, and the Department of Homeland Security also regulate operations in the interests of public security Europe Finland • Occupational Safety Act 738 of 2002 • Rescue Act 379/2011 • Act on the Safe Handling and Storage of Dangerous Chemicals and Explosives 390 of 2005 France • Code du Travail (Labor Code) • Code de la Santé Publique (Public Health Code) Australia • Work Health and Safety Act 2011 (Cth) • Mining and Quarrying Safety and Health Act 1999 (Qld) • Mining and Quarrying Safety and Health Regulation 2017 (Qld) • Resources Safety and Health Queensland Act 2020 (Qld) • Mines Work Health and Safety Regulations 2022 (Tas) • Mines Work Health and Safety (Supplementary Requirements) Act 2012 (Tas) • Mines Work Health and Safety (Supplementary Requirements) Regulations 2022 (Tas) ASSURANCE AND REVIEWS • Ongoing workplace inspections assess conformance to our own standards and to legal requirements • Internal audit and through the Pivot OHS system monitor various parameters; several external agencies (e.g., DMRE) conduct safety inspections and unscheduled audits • External and internal audits are facilitated by the Group’s internal audit department and include safety audits that measure compliance, reporting on leading and lagging indicators, including Initiative for Responsible Mining Assurance (IRMA), International Council on Mining and Metals (ICMM) and World Gold Council (WGC) requirements • ISO 45001:2018 Occupational Health and Safety system gap audits are conducted to measure compliance for certification; certification audits are conducted by external parties • We are active participants in the ICMM Health and Safety working group. We regularly compare our standards against third-party benchmarks. Our operations in the SA region and the US region are ISO 45001 certified, as is Sandouville refinery • All operations have various internal safety audits • Emergency response testing is not only performed on site, but our emergency testing of our tailings storage facilities has been extended to include our host communities • High-potential incident and fatality reviews offer another layer of oversight • A formal agreement with the majority union covering safety and health, defining how full-time and part-time safety representatives are elected, trained and appointed • Independent review of our safety programme, by a leading industry safety expert Key supporting policies and policy statements Health and safety policy statement (see www.sibanyestillwater.com/about-us/governance), Emergency mandatory code of practices, Group minimum standards, Critical controls, Critical life-saving behaviours, Critical management routines, Operational risk management procedure, Occupational hygiene risk assessment procedure CONTINUOUS SAFE PRODUCTION continued IR - 126

ZERO HARM STRATEGIC FRAMEWORK ––––––––––––––––––––––––––––––––––––––––––––––––––––––––––––––––––––––––––––––––––––––––––––––––––––––––––––––––––––––––––––––––––––––– OVERVIEW –––––––––––––––––––––––––––––––––––––––––––––––––––––––––––––––––– Eliminating fatal incidents was the primary focus in 2023 and the immediate priority in achieving our “culture of care”, through which we enhance safety, health, and overall wellbeing. We continued with our Fatal elimination strategy, with the focus on preventing high-energy risks and high-potential incidents (HPIs) in our operations. The strategy is benchmarked against global best practice and was reviewed by an independent safety expert. In 2023, eleven of our colleagues tragically lost their lives in eight mine related incidents. We are truly saddened at the loss, and our deepest condolences go out to family and friends of the deceased. The most serious incident, in which four contractors lost their lives, involved the collapse of a newly constructed surface waste rock conveyor at the Burnstone project at the SA gold operations. Senior leadership, with guidance from our safety professionals, have developed and implemented comprehensive safety initiatives (systems and programmes) that are benchmarked against ICMM peers and integrate industry-leading practices. Despite the eleven fatalities in the year under review, the trend in our Serious injury frequency rate (SIFR) was positive. The evidence suggests that putting an extra focus on eliminating high-energy fatal (or near fatal) incidents can also be beneficial for improving overall injury metrics. Injury frequency rates are measured according to total recordable injury frequency rate (TRIFR), which measures the rate of recordable injuries per million hours worked. One of our milestones on our journey to Zero harm is a TRIFR of 4.0 to be achieved by 2025. In order to achieve our TRIFR target, we are focused on specific interventions addressing low consequence incidents and further improving the organisational culture. For the Group, our TRIFR deteriorated from 5.07 in 2022 to 5.24 in 2023; as did our lost time injury frequency rate (LTIFR), from 4.41 to 4.57; while our SIFR improved from 2.91 to 2.61. Unfortunately, our fatal injury frequency rate (FIFR) deteriorated from 0.03 in 2022 to 0.07 in 2023. Fatal elimination strategy Our Fatal elimination strategy puts the emphasis on leading indicators and behaviours, rather than lagging or historical measures. It also focuses on improved reporting and recording of HPIs; this includes those incidents where there was an injury with the potential for loss of life (IPLL), and incidents where there was no injury but there was the potential for loss of life (NIPLL), i.e., near misses. Enhanced reporting of HPIs by operational teams provides a more comprehensive measure of high energy risks in our operations, promotes greater awareness of risk, and facilitates a proactive approach in risk mitigation. To achieve the goal of zero fatalities we are dedicated to “blocking the path to death” in all workplaces all the time. This requires that we identify workplace areas that have a risk for high energy incidents, that we implement controls to mitigate these risks, and that we influence the behaviour of employees and the culture of the organisation toward risk mitigation and avoidance. CONTINUOUS SAFE PRODUCTION continued IR - 127

Extensive data collected over the past two years strongly supports the fact that the Group has seen a significant reduction in risk at our operations. This includes a 31% reduction in our SIFR and a 26% reduction in our TRIFR for 2023, compared to 2021. We saw a significant increase in reported near miss incidents during the year, and a 40% decline in the HPI frequency rate for 2023, when compared to H2 of 2022 (from 3.64 to 2.18). The significant increase in frontline safety stoppages is also a strong leading indicator of the increased safety awareness and culture of our frontline staff who are more likely now to stop work that cannot be performed safely and therefore block the path to death. In addition, there is a strong correlation between operational leadership’s commitment to safety and reduced risk for that operation. All of these indicators validate that our Fatal elimination strategy, benchmarked against industry best practice, is appropriate and delivering the expected results. During the year, we made good progress on specific health and safety priorities outlined below: • Aligned line management on their accountability in terms of real risk reduction, safety, and our desired safety culture • Integrated a “fair and just” behavior model into the HPI investigation process; an industry-leading practice • Operations produced animation videos and other audiovisual material to better inform employees about Group minimum standards (GMS), about the dangers of uncontrolled energy release events, and about how to support the learning-from- incidents process • Rolled out leadership mirror assessments down to supervisor level, supported with critical behavioural skills and supervisor leadership practice intervention • Adopted frontline supervisor safety critical work routines, which will enable them to practice routines that build the safety culture Group minimum standards for safety We have 19 GMS for safety, with supporting critical controls, critical life-saving behaviours and critical management routines to eliminate fatal incidents and high potential risk areas. Compliance with these standards is routinely monitored as part of our comprehensive suite of leading indicator metrics. During the year, a detailed gap analysis against the related performance standards expectations was conducted and action plans are in place to close this out. Innovating for safety Much was done in the past few years to engineer out risk in our highest risk areas of Rail Bound Equipment (RBE), Trackless Mobile Machinery (TMM) and scrapers and winches. This has included the implementation of technology and significant increases in the use of collected data to improve behaviour. Various initiatives are in the research and development/testing phase. In terms of level 9 collision avoidance, our data-based systems implemented on our underground locomotives (RBE), improve engineering controls and provide insights into operator behaviour, safeguarding loader operators. Our TMM level 9 collision avoidance in the SA region is of industry-leading standard. Level 9 collision avoidance is an electronic system that automatically slows down the machine and applies a controlled stop when a dangerous interaction is detected if an Operator failed to act. We are rolling out improved winch signalling and safety systems; and we are developing proximity detection that enables automated interventions when employees enter high-risk areas. We are also developing missing person locator and person tracking solutions, which involve equipping cap lamps with missing person locator tags. To achieve many of these initiatives, requires significant upgrading of our lamprooms, to enable tagging and tracking, which allow for intelligent reporting on all data (consolidated through the lamproom) interpreted visually to offer key insights into behavioural and operational safety performance. New lamproom management features include: • Automated asset allocation • Passive asset tracking (lamproom only) • Critical item checking • Gas detection instruments and critical tool testing • Time and attendance integration • Employee restriction when red ticket or training expires, or when items on person do not match allocation, or when critical tools are not checked Personnel locating is now scoped as an outcome for proximity detection systems (PDS), and we are testing enhanced PDS (that includes personnel locating) with different suppliers of locomotives, winches and TMMs. New features include: • Active tagging of employees for missing person location; interaction with future PDS solutions; data transfer from other systems • Handheld scanner for locating active tags in areas where employees are lost or incapacitated • Tag reporting For more on innovation and technology as it relates to safety, please refer to page 174 of this report. Driver monitoring During the year (in light of evidence from our learning from incident and HPI investigations), we modified our Group minimum requirements for vehicles and driving. The most important interventions have been for our high-volume ore transport vehicles, which have been installed with real-time tracking (dashboard cameras, GPS), two-way radio, fatigue monitoring, and speed detection and warning system. LDVs and busses are being installed with all the above, but prioritising fatigue monitoring. We are investing in a technology solution to monitor drivers and to intervene before an incident occurs, in the interests of their safety and those around the vehicle. We have already implemented such a system for TMMs. An intelligent camera acts as an early warning detection system to discern fatigue and driver distraction. A live control room, supplemented by in-cab communication, and complemented by human intervention is proving effective in reducing accidents. We have recorded a reduction in detection alerts as drivers adopt safer habits. Rail-bound equipment (RBE) During 2023, in the SA region, we tragically had three fatal incidents involving RBE. Our objective is to eliminate RBE-related fatalities by removing (or at least drastically reducing) the possibility of a judgment error when an unsafe condition arises. Much work has been accomplished to this end for the SA region; key developments include: • Behaviour monitoring of locomotive driver and guard (implemented at SA gold operations; in preparation at SA PGM) CONTINUOUS SAFE PRODUCTION continued IR - 128

• Locomotive to beacon technology, with locomotive speed restricted when in close proximity to the beacon, or to an employee’s lamp While there are various technical challenges to implementing a fail- safe detection system, including the different types of hardware required and the different environments in which they operate, we remain committed to applying best practice, while striving to obtain industry-leading solutions that can be rolled out across our operations. Winch signalling and warning system Our focus is to eliminate fatalities relating to winches, with technologies and (with the exception of Beatrix mine due to flammable gas risks). We have implemented advanced winch signalling systems across the SA region, which allows for visual and audible warning for startup along the scraper path. Humanising safety by “visualising the risk” We use visual messaging and industrial theatre to reduce RBE, rock fall, winch-related incidents, and other fatal risks. All persons going for training are inducted into the Fatal elimination programme, the GMS, critical controls, critical lifesaving behaviours, and critical management routines. New employees, when inducted, are informed of their obligation to uphold these requirements. Critical controls We have critical controls to mitigate high-energy risk. These are embedded into our safety management system and are assessed on an ongoing basis to ensure they are relevant for the fatal elimination plans of the specific site. Deviations and non-conformance to critical controls are an important leading indicator for safety risks, allowing management to intervene timeously. Behaviour model and leadership A critical aspect of the Fatal elimination strategy is in dealing with high risk activities. In 2023, 224 employees in the SA region were dismissed for safety violations (2022: 225). It is most regrettable to have to dismiss employees, but we are compelled to draw a non- negotiable line on unsafe behaviour. We use a behavioural model to review safety related incidents, differentiating between lapses/mistake, violations, and reckless or wilful violations. Our revised behaviour model was applied across all regions during 2023 and is seen as industry best practice. All HPIs are investigated using the behavioural model, allowing management to better classify the critical control, critical lifesaving behaviours and critical management routine failures. In addition, the model gives us clear guidelines for sanctioning offending parties, including disciplinary action and dedicated training. Incentive/bonus systems to encourage safe behaviour Our Zero harm strategy includes aligning incentives for safety compliance; and aligning incentives to compliance with leading indicators, i.e., critical controls, critical lifesaving behaviours and critical management routines. We are in an advanced stage of implementing this new incentive structure across the SA region. In terms of lagging indicators, the fatal incident penalty is applicable at Group, segment and operational levels. A penalty is applied if the FIFR is not 20% below the three-year trailing average, calculated on the 2020, 2021 and 2022 numbers for the respective operations. The penalty is applied to the total short-term incentive and not to the safety component only. The potential penalty is capped at a maximum of 30% of the total short-term incentive. See Remuneration policy, page 256 and 264 Emergency planning Our Group crisis management plan explains the general procedures to follow during and after a crisis. Management has been trained in emergency control, including established mandatory codes of practice for emergency preparedness and response plans. In the event of a major incident, senior management are mandated to set up an emergency control room to manage the crisis. All operational employees are trained in emergency protocols and drills are regularly conducted. All supervisors are trained in first aid and have full access to first aid equipment. The majority of ordinary employees (46,894), have received first aid training. All underground workings are equipped with secondary escape routes and emergency refuge bays, and are regularly inspected by management teams. Rescue proto teams are deployed during an emergency. Across the SA region we have 145 rescue team members, 20 proto teams, 37 medical practitioners, and 194 registered nurses. We have Rescue 911 paramedic deployments to all our operations. During 2023, the Southern African Institute of Mining and Metals recognised the excellence of the proto teams from the Driefontein shaft. Tragically, an underground fire at Driefontein Hlanganani shaft led to the loss of life of one of our colleagues. However, the life-sustaining refuge bays, regular emergency drills, and effective emergency response meant we could successfully evacuate 24 employees from refuge chambers at Hlanganani and Masakhane shafts. At our US operations we have 22 mine rescue team personnel, and 17 emergency medical services team personnel. Additionally, we have 14 employees who are both equipped to perform mine rescues and provide emergency medical services. We experienced a concerning increase in the number of gassing incidents in the SA region. Current controls were reviewed, and these additional controls were implemented: • Videos and training on fire and gas inhalation • Videos and training on the donning of self-contained self- rescuers • Revision of the Group gassing procedure • Extension of current fire detection systems • Service level agreements with suppliers for immediate replacement and fixing of faulty gas detection heads As part of our journey to conformance with the Global Industry Standard on Tailings Management, detailed site-specific Emergency Preparedness and Response Plans were drafted for all operations. Various training initiatives were held with our communities, including a focus on emergency response. See also our Tailings management fact sheet, www.sibanyestillwater.com/ news-investors/reports/annual/. CONTINUOUS SAFE PRODUCTION continued IR - 129

Impact of illegal mining at the SA operations The operating environment in the SA region remains challenging from a security and crime standpoint. Crime statistics released by the authorities, and those recorded by Sibanye-Stillwater Protection services, indicate an upward trend in serious and violent crimes, organised crime, and social activism. In response, Protection services has sought to gain better control over the environment in which it operates. It adopts appropriate technologies for early warning systems and intruder detection systems, including CCTV, remotely piloted aircraft, and intelligence reports. Where necessary, it deploys well-trained stopper and response teams that provide backup to routine security personnel. Our SA gold operations are a target for organised crime syndicates dealing in precious metals; illegal underground mining is our biggest security threat. During 2023, we recorded 459 incidents of illegal mining and 1,239 arrests of illegal miners at our SA gold operations. At our SA PGM operations the main threat is organised crime syndicates dealing in the illicit trade of copper and non-ferrous metals, leading to underground intrusions and theft of copper cable. For the year under review we dealt with 2,010 copper related incidents, with 642 suspects arrested by Protection services; direct financial losses relating to copper theft amounted to R113 million, of which R19 million was recovered by Protection services. It is encouraging that many arrests are now being affected before illegal miners enter the underground workings. This is testimony to improvements in our security control environment. Raids on illicit supply chains also yielded significant arrests. Illegal miners and syndicate leaders have intensified their use of complicit employees to gain access to the underground workings and compromise our access controls. In terms of addressing the integrity of security officials, Protection services continues to work with the Group’s Organisational growth function, with PSiRA (Private Security Industry Regulatory Authority), and with business partners as we refine our efforts to address collusion. Systems for doing so include vetting, screening, profiling and investigating employees. This is an ongoing initiative. For the year under review, 451 incidents of collusion with illegal miners were recorded. Protection services is working closely with the operations and the authorities to implement solutions to mitigate the challenges posed by copper theft, including underground sealing programmes, engineering solutions, and preventive and detective controls. In addition, security control environments within the SA PGM operations are being technology enabled with early warning systems, unmanned aerial vehicles, as well as tactical response and stopper teams. We are also conducting R&D and testing for other technologies that could aid in our efforts to tackle copper theft and illegal mining. Part of our efforts involves disrupting the illicit flow of copper. We work proactively with the authorities and other stakeholders to identify and apprehend higher tier criminals, with the aim of stemming the illicit outflow of copper from the country. Criminals targeting our operations are brazen and often resort to violence against Protection services employees. In the year under review there were 158 attacks on Protection services personnel, with 27 of our personnel injured in 19 incidents. To ensure safety and operational preparedness of our frontline employees we are confronting criminals according to our rules of engagement and life-saving behaviours. The Protection services policies and procedures are aligned to the Voluntary Principles on Security and Human Rights (a multi-stakeholder initiative to guide best practice on human rights in mining and other industries). We will continue to be strategic in responding to the threat of crime. This involves collaborating with peers and with the authorities, using data and other means to analyse crime patterns, and support the apprehension of higher tier criminals by law enforcement. See Combating illegal mining fact sheet 2023, www.sibanyestillwater.com/news-investors/reports/annual Social unrest Social unrest continues to be a risk in the SA region, exacerbated by the concerning socioeconomic outlook for the country. High unemployment, a lack of delivery of basic services, and limited employment opportunities all contribute to pressure on the Group to employ more people and to offer more in the way of procurement opportunities. In the absence of a well-functioning state, people look to large businesses (like ours) for support and may be prepared to use disruptive and threatening means to elicit further action. The Group respects legitimate and legal protest action. However, the situation is sometimes exacerbated by individuals (and entities) whose agenda is not to improve people’s lives, but of violence and intimidation for their own benefit. Protection services is working closely with the SAPS Special Task Force in identifying and dismantling these mafia-type structures. In 2023, there were 101 incidents of community related protests and unrest, with 95 at our SA PGM operations, and six at our SA gold operations. When these incidents threatened to disrupt operations, they were defused through discussions with community leaders by our sustainable development teams, supported by management and Protection services. It is a concern that 62% of the protest actions were directed at the Group. We are considering a multipronged approach to win the hearts and minds of our communities. We are working to strengthen relationships between the authorities and Protection services and this has improved over the last year. Public safety The Group launched project Isando to work with the local community in enhancing safety. Management is also tightening security around its operations, using technical and community- based intelligence to minimise the impact of crime risks (or social risks generally) on its employees, on the local mining community, and on its operations. We embark on routine road safety initiatives, in conjunction with local authorities, to improve awareness and compliance to road safety rules. CONTINUOUS SAFE PRODUCTION continued IR - 130

PERFORMANCE –––––––––––––––––––––––––––––––––––––––––––––––––––––––––––––––––––––––––––––––––––––––––––––––––––––––––––––––––––––––––––––––––––––– Critical management routines are a key component of our Fatal elimination strategy, comprising the system of checks to ensure our critical controls work and that everyone understands their duty in following lifesaving behaviours. We are not satisfied with the currently low level of compliance, which is responsible for most incidents. In Q3 2023, we conducted a baseline audit on key safety management routines. We are using the audit to set targets for an improved performance in 2024. 19 million SA PGM processing operations 16 May 2023 11 million Marikana surface operations 6 August 2023 9 million SA PGM operations 19 June 2023 Marikana West (K3 and 4B/1B) 21 June 2023 7 million Kroondal and Rustenburg operations 3 July 2023 6 million Marikana operations 8 September 2023 Marikana concentrators 24 January 2023 5 million Karee 3 shaft 11 May 2023 Marikana conventional mining 1 November 2023 4 million Rustenburg operations 20 April 2023 Rustenburg mining including Bathopele 29 May 2023 4B/1B shaft 7 October 2023 Marikana mining (excluding K4) 26 September 2023 3 million Kroondal operations 22 July 2023 Thembelani shaft 9 October 2023 Marikana mining (excluding K4) 21 June 2023 2 million TMM operations 5 May 2023 Rustenburg plants and concentrators 20 September 2023 Karee 4 shaft 11 September 2023 1 million Bambanani Shaft 8 July 2023 Kroondal West (Kwezi and K6) 29 July 2023 Rustenburg Surface Operations 25 August 2023 Kroondal & Rustenburg Surface Operations 31 March 2023 Kroondal & Rustenburg Operations 20 September 2023 Rowland Shaft 19 October 2023 Saffy Shaft 7 September 2023 Marikana East (Saffy and E3) 1 April 2023 Fatality-free shifts worked SA and US PGM operations Date achieved Fatality-free shifts worked SA gold operations Date achieved 3 million SA gold operations 9 March 2023 2 million Driefontein Ya Rona shaft 27 January 2023 Driefontein operations 27 February 2023 Kloof Masimthembe shaft 19 May 2023 Beatrix operations 16 August 2023 Kloof Manyano shaft 16 August 2023 1 million Beatrix North (3#) 4 March 2023 Kloof operations 10 March 2023 Driefontein Masakhane shaft 13 September 2023 Kloof Thuthukani shaft 4 December 2023 In memoriam We offer our heartfelt condolences to the family and friends of those who lost their lives on our mines during 2023. 31 March 2023 Driefontein Mining Pitseng Shaft Employee Male Loco Driver Diesel MW Rail Bound Equipment 13 April 2023 Burnstone Surface Contractor Male Assistant Grade 1 Construction MW Structure Collapsed 13 April 2023 Burnstone Surface Contractor Male Belt Level Supervisor Structure Collapsed 13 April 2023 Burnstone Surface Contractor Male Artisan Assistant Grade 1 Surface MW Structure Collapsed 13 April 2023 Burnstone Surface Contractor Male General Surface Labourer MW Structure Collapsed 28 June 2023 Driefontein Mining Hlanganani Shaft Employee Male Special Team Leader Stoping MW Fall of Ground (Seismic related) 13 July 2023 Driefontein Mining Hlanganani Shaft Employee Male Developer Fire Incident 18 July 2023 KHU -Khuseleka Employee Male Scraper Winch Operator UG Rail Bound Equipment 01 August 2023 Kloof Mining Masimthembe Shaft Employee Male Special Team Leader Development MW Person Falling - Heights 12 November 2023 MAR - Karee 3 Shaft Employee Male Artisan Assistant UG Wky Rail Bound Equipment 13 November 2023 US Stillwater Mine Contractor Male Underground Contractor Caught Between Date Operation Employee/ contractor Gender Occupation Incident CONTINUOUS SAFE PRODUCTION continued IR - 131

Safety performance* 2023 2022 2021 Group US region EU region AUS region5 SA region Group4 US region EU region SA region Group US region SA region PGMs PGMs Gold PGMs PGM Gold PGMs PGMs Gold Fatalities 11 1 0 0 2 8 5 0 0 3 2 21 2 6 13 Fatal injury frequency rate1 0.07 0.23 0.00 0.00 0.02 0.13 0.03 0.00 0.00 0.03 0.04 0.13 0.44 0.07 0.19 Number of lost-time injuries 766 31 5 1 437 292 668 18 5 420 225 951 31 529 391 Lost-time injury frequency rate (LTIFR)1 4.57 7.03 6.14 1.90 4.37 4.72 4.41 4.03 8.88 4.36 4.48 6.02 6.77 6.21 5.72 Total injury frequency rate3 6.99 23.58 74.89 24.70 6.44 5.64 6.29 23.07 71.01 5.63 5.34 9.80 33.80 9.89 7.40 Number of serious injuries 437 25 4 0 223 185 441 18 1 262 160 598 27 297 274 Serious injury frequency rate (SIFR)1 2.61 5.67 4.91 0.00 2.23 2.99 2.91 4.03 1.78 2.72 3.19 3.78 5.90 3.49 4.01 Medically treated injury frequency rate (MTIFR)1, 2 0.67 3.63 1.23 3.80 0.64 0.49 0.66 3.58 1.78 0.54 0.62 1.08 3.71 0.88 1.16 Total recordable injury frequency rate (TRIFR)1 5.24 10.66 6.14 5.70 5.01 5.21 5.07 7.61 10.65 4.90 5.10 7.10 10.48 7.09 6.88 Total recordable injuries 878 47 5 3 501 322 768 34 6 472 256 1,122 48 604 470 Number of Section 54/ regulator work stoppages 83 4 0 0 39 40 105 3 0 77 25 82 3 42 37 Total hours worked (millions) 167.6 4.4 0.8 0.5 100.0 61.9 151.5 4.5 0.6 96.2 50.2 158.1 4.6 85.1 68.3 * Note: Safety statistics include contractors. For site specific safety performance, see Group impact supplement, www.sibanyestillwater.com/news-investors/reports/annual/ 1 Per million hours worked: total number of injuries x 1,000,000 hours worked 2 Also referred to as treat-and-return injury frequency rate, which includes certain minor injuries 3 The US operations’ statistics for 2021 included instantaneous gas exposure without consideration of a 15-minute time weighted average 4 The SA gold operations recorded a fatal incident on 27 February 2022, this was however restated to the date of accident 21 October 2021, as per reporting protocol. Mr Madie (a contractor)) was injured during a scraping and rigging accident on 21 October 2021 and passed away as a result of his injuries on 27 February 2022 5 AUS region data included from 01 March – 31 December Safety performance: Contractors only 2023 2022 2021 Group US region EU region AUS region SA region Group US region EU region SA region Group US region SA region PGMs PGMs Gold PGMs PGM Gold PGMs PGMs Gold Fatal injury frequency rate 0.12 1.03 0.00 0 0.00 0.26 0.03 0 0.00 0.00 0.09 0.1 0 0.07 0.13 Lost-time injury frequency rate (LTIFR) 2.42 6.18 9.77 0 1.91 2.95 3.07 3.95 20.03 3.36 2.16 3.75 0.97 5.38 2.35 Total injury frequency rate 4.29 20.60 70.86 0 3.25 3.41 5.11 19.76 140.18 4.34 2.97 5.95 16.53 7.58 3.62 Serious injury frequency rate (SIFR) 1.18 4.12 9.77 0 0.61 1.77 1.58 3.95 0.00 1.61 1.35 1.54 0.00 2.00 1.21 Medically treated injury frequency rate (MTIFR) 0.58 7.21 4.89 0 0.46 0.26 0.83 5.93 5.01 0.76 0.45 1.12 1.94 1.03 1.14 Total recordable injury frequency rate (TRIFR) 2.97 14.42 9.77 0 2.37 3.21 3.9 9.88 25.03 4.12 2.61 4.86 2.92 6.41 3.49 8.8 CONTINUOUS SAFE PRODUCTION continued IR - 132
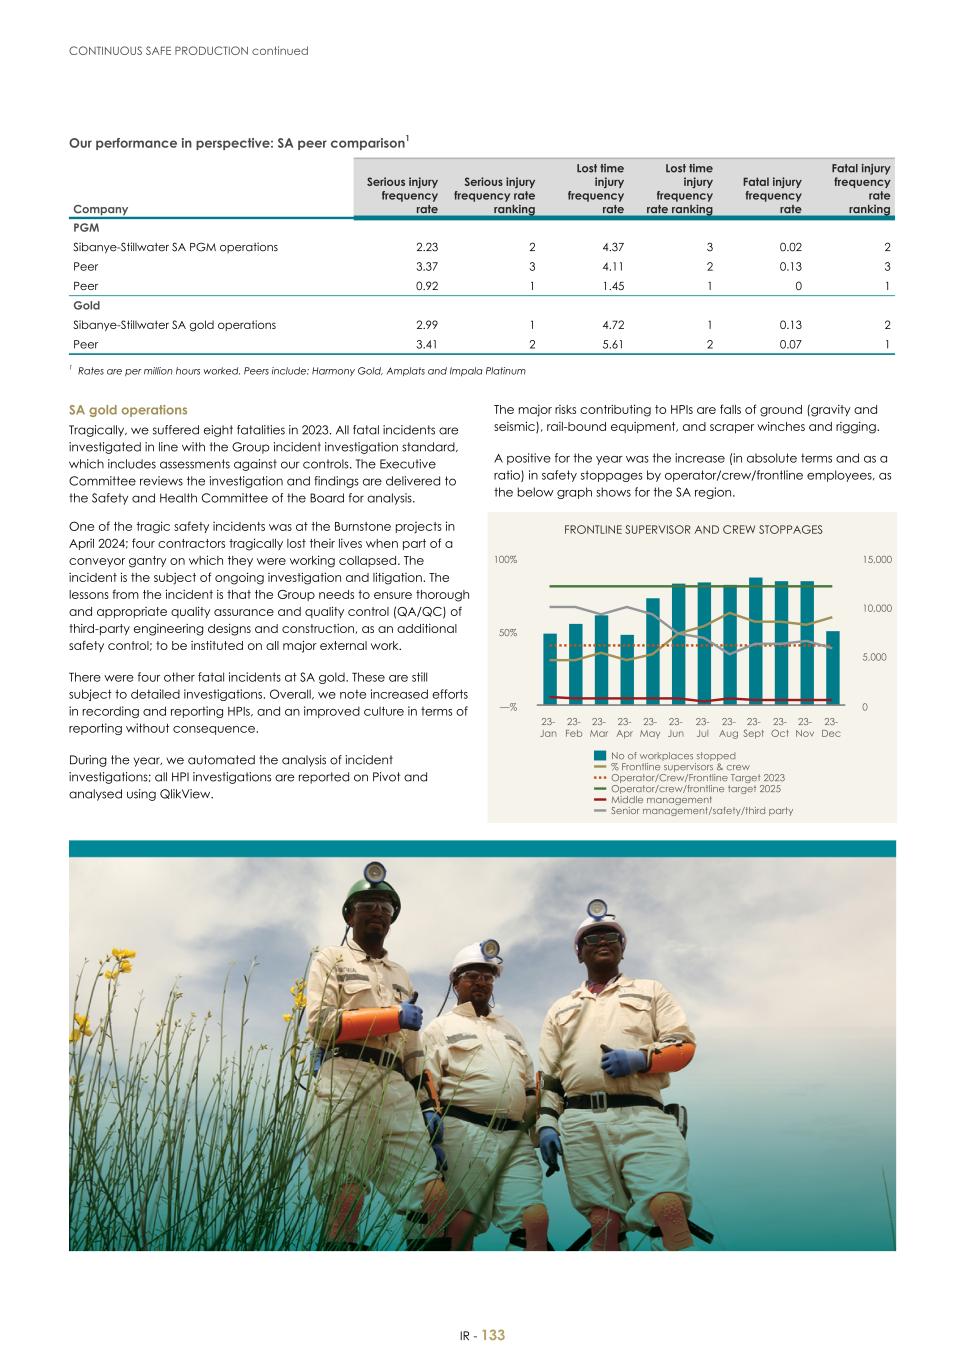
Our performance in perspective: SA peer comparison1 Company Serious injury frequency rate Serious injury frequency rate ranking Lost time injury frequency rate Lost time injury frequency rate ranking Fatal injury frequency rate Fatal injury frequency rate ranking PGM Sibanye-Stillwater SA PGM operations 2.23 2 4.37 3 0.02 2 Peer 3.37 3 4.11 2 0.13 3 Peer 0.92 1 1.45 1 0 1 Gold Sibanye-Stillwater SA gold operations 2.99 1 4.72 1 0.13 2 Peer 3.41 2 5.61 2 0.07 1 1 Rates are per million hours worked. Peers include: Harmony Gold, Amplats and Impala Platinum SA gold operations Tragically, we suffered eight fatalities in 2023. All fatal incidents are investigated in line with the Group incident investigation standard, which includes assessments against our controls. The Executive Committee reviews the investigation and findings are delivered to the Safety and Health Committee of the Board for analysis. One of the tragic safety incidents was at the Burnstone projects in April 2024; four contractors tragically lost their lives when part of a conveyor gantry on which they were working collapsed. The incident is the subject of ongoing investigation and litigation. The lessons from the incident is that the Group needs to ensure thorough and appropriate quality assurance and quality control (QA/QC) of third-party engineering designs and construction, as an additional safety control; to be instituted on all major external work. There were four other fatal incidents at SA gold. These are still subject to detailed investigations. Overall, we note increased efforts in recording and reporting HPIs, and an improved culture in terms of reporting without consequence. During the year, we automated the analysis of incident investigations; all HPI investigations are reported on Pivot and analysed using QlikView. The major risks contributing to HPIs are falls of ground (gravity and seismic), rail-bound equipment, and scraper winches and rigging. A positive for the year was the increase (in absolute terms and as a ratio) in safety stoppages by operator/crew/frontline employees, as the below graph shows for the SA region. FRONTLINE SUPERVISOR AND CREW STOPPAGES No of workplaces stopped % Frontline supervisors & crew Operator/Crew/Frontline Target 2023 Operator/crew/frontline target 2025 Middle management Senior management/safety/third party 23- Jan 23- Feb 23- Mar 23- Apr 23- May 23- Jun 23- Jul 23- Aug 23- Sept 23- Oct 23- Nov 23- Dec —% 50% 100% 0 5,000 10,000 15,000 CONTINUOUS SAFE PRODUCTION continued IR - 133

SA PGM operations Tragically, our SA PGM operations recorded two fatalities this year. The fatalities were both caused by underground rail-bound equipment. The following control enhancements were implemented to prevent similar accidents: • Addressing organisational culture and behaviour by holding VPs accountable • Planning non-essential work outside normal working hours, e.g., Sunday creates a risk environment that requires appropriate management supervision • New extended telescopic arms were designed on mechanical loaders when operating in wide excavations • Research into new loader technology, removing people from high risk environments is progressing Operational teams continue to embed the fatal elimination plans at VP and mine overseer levels. US PGM operations Tragically, the US operations recorded one fatal incident that involved a contract employee in the last quarter 2023. The fatal investigation was performed by the Mine Safety and Health Administration (MSHA). In 2023 significant progress was made to align our safety and health platform. The US PGM operations successful in upgraded reporting, such that it can be viewed and analysed on QlikView. Additionally, we implemented an offline digital application through Power BI (an HSE dashboard) to complete critical management routine audits. In 2023 we saw improvements in terms of frontline teams stopping work for safety reasons, and improvements in leading indicator data. Our GMS audits show that frontline teams are taking on the learnings and responding positively to our safety culture. US region: Injuries by category 2023 2022 2021 Struck by objects (tools, equipment and others) 12 4 13 Strains/soft tissue injuries 5 4 4 Slips/trips/falls 7 7 6 Caught in/between 6 7 12 Rockfall 4 3 5 Operating equipment 4 5 2 Operating jackleg 0 2 0 Eye injuries 2 0 4 Chemical burns/other 6 2 2 Other 1 0 0 Total 47 34 48 EU region The high injury rate of the EU region is partly as a result of how injuries are recorded. Legislation requires that relatively minor incidents are recorded as lost workday incidents. Keliber lithium project Two lost time injuries took place at our Keliber lithium project, one a finger injury during maintenance work and another a slip causing a twisted finger. The major risks contributing to HPIs were inadequate area isolation and lift works. Since the safety performance usually experienced at Finnish construction sites is significantly lower than the Group target, special attention has been paid to site monitoring resources and training. Each site will have two dedicated HSE supervisors working full-time on monitoring, training, and reporting. Sandouville refinery Safety results, specifically related to total recordable injuries, continued to improve during the year and are in line with targets. Sandouville management normalised safety reporting data to align it with Group and ICMM reporting methodology and make it directly comparable to other operations. Sandouville refinery employees received training on Sibanye- Stillwater’s safety methods and models. In 2023 we completed a gap analysis on the GMS and fatal elimination plan to ensure alignment to the critical control, critical lifesaving behaviours and management routines. We continue to embed our safety approach as we further integrate the European region into Group standards and processes. EU region: Injuries by category Struck by objects (tools, equipment and others) 0 0 0 0 0 0 Strains/soft tissue injuries 0 0 0 1 1 0 Slips/trips/falls 4 3 1 2 2 0 Caught in/ between 1 0 1 0 0 0 Rockfall 0 0 0 0 0 0 Operating equipment 0 0 0 1 1 0 Operating jackleg 0 0 0 0 0 0 Eye injuries 0 0 0 0 0 0 Chemical burns 0 0 0 0 0 0 Other 0 0 0 2 2 0 Total 5 3 2 6 6 0 2023 2022 EU region Sando uville Keliber EU region Sando uville Keliber AUS region For 2023 (recording from its incorporation) Century operations had a total of three recordable injuries. In terms of safety and health, the Australian region has shown a high level of readiness to comply with our Group minimum standards. AUS region (Century operation): Injuries by category 2023 Struck by objects (tools, equipment and others) 1 Strains/soft tissue injuries 1 Slips/trips/falls 0 Caught in/between 0 Rockfall 0 Operating equipment 0 Operating jackleg 0 Eye injuries 0 Chemical burns 0 Other 1 Total 3 CONTINUOUS SAFE PRODUCTION continued IR - 134

FUTURE FOCUS ––––––––––––––––––––––––––––––––––––––––––––––––––––––––––––––––––––––––––––––––––––––––––––––––––––––––––––––––––––––––––––––––––––––– GROUP The key safety focus for 2024 will remain on the three pillars of the Zero harm strategic framework: enabling environment, empowered people, world class systems, with the following overarching objectives: • Everyone takes responsibility to reduce risk, with line management ultimately accountable for real risk reduction and promoting the desired safety culture in their operations • VPs are accountable for embedding the fatal elimination strategy at their operations and for addressing organisational culture and behaviour • Improved reporting and data analysis to allow for informed decision-making and targeted interventions, enhancing continuous learning and improvement • Setting our supervisors up for success through critical behavioural skills and leadership work routines • Reinforcing the belief across the organisation that “I can do my work safely, all of the time, without getting injured” AUS REGION • Complete integration of critical controls • Critical risk reviews completed • Improvement to incident investigation standard EU REGION • Closing actions identified from Group minimum standard gap analysis, to ensure readiness for full compliance • Operationally deploy critical control audits SA REGION • Three-tier critical control verification process implemented to Manager, Supervisor and Operator • Closing actions identified from Group minimum standard gap analysis, to ensure readiness for full compliance • Continue to drive the Fatal elimination strategy via line management accountability with focussed coaching support as needed through proactive analysis of the leading data • Further improving the organisational culture and the belief that work can be done without harm • Implementation of the Digital leading indicator project US REGION • Closing actions identified from Group minimum standard gap analysis, to ensure readiness for full compliance • Improvement to reporting and tracking of safety and health data • Further improve Management of change within the operations • Continued effort to reduce risk through the use of leading indicator data CONTINUOUS SAFE PRODUCTION continued IR - 135

HEALTH, WELLBEING AND OCCUPATIONAL HYGIENE WHAT WE DID IN 2023 SUCCESSES • Since 2023, a group-wide wellbeing assessment in place • Awarded the Exemplar award, from the Ending Workplace TB organisation, for outstanding workplace TB programme • SA gold recognised by the Southern African Institute of Mining and Metallurgy for its occupational medicine approach • US operations had a reduction in diesel particulate matter through improved ventilation engineering CHALLENGES • Wellbeing initiatives depend on voluntary participation, potentially leaving some individuals unengaged for various reasons. Confidentiality is emphasised in the utilisation of employee health and wellbeing support programmes • In certain regions, strict regulations limit cross-border health data sharing. Our local teams navigate these constraints effectively TARGETS AND KEY OBJECTIVES Status See ALIGNMENT WITH SDGs • Development of mental health resilience In progress Page 139 3 MATERIAL MATTERS M2 Safety and Health M3 Licence to operate • Universal health coverage across the business In progress Page 138 • Roll out of custom-made hearing protection for identified groups in the SA region Completed Page 146 APPROACH –––––––––––––––––––––––––––––––––––––––––––––––––––––––––––––––––– Our iCARES values guide our approach to health and wellbeing. Safety and health is one of the top material issues for the business. We encourage worker participation and consultation through health and safety committees for shafts and operations (e.g., Driefontein). During the year, we invested R111 million in primary healthcare, R77 million in occupational healthcare and R6.7 million in employee wellbeing at our South African operations. Additionally, our Australian region saw an investment of A$581,827.24 during the same period. Our healthcare to employees includes: • Occupational health resources that assess risks, determine fitness to work, and manage disease and rehabilitation • Primary healthcare centres with doctors and nurses managing cases 24/7 • Employee assistance programme (EAP) that includes counselling for employees and immediate family, provided by ICAS via 24/7 multilingual toll-free call centre and on-site social workers • Emergency medical services equipped with paramedics and 24/7 rescue capability • Hospital network with specialised care for trauma and for occupational injuries and diseases • Employees and contractors who are engaged in risk-prone occupations are required to participate in an annual medical examination with non-risk workers also needing to undergo medical surveillance at least every second year HEALTH, WELLBEING AND OCCUPATIONAL HYGIENE IR - 136

ACCOUNTABILITY, GOVERNANCE AND ASSURANCE GOVERNANCE ACCOUNTABILITY Board • Social, Ethics and Sustainability Committee • Audit Committee C-suite • The ESG Committee • Chief Regional Officers Operational • The Group Champion Health and Safety oversees health and wellbeing programmes at Sibanye-Stillwater • The Senior Safety Manager oversees employee health and wellbeing at the US operations; site safety managers provide support to the Senior Safety Manager • Dedicated health and safety officers see to it that our health and safety programmes are effectively implemented RELEVANT LEGISLATION AND REGULATIONS (list not exhaustive, only key regulations listed) South Africa • Mine Health and Safety Act of 1996 • Occupational Diseases in Mines and Works Act of 78 of 1973 • Compensation for Occupational Injuries and Diseases Act 130 of 1993 • National Nuclear Regulator Act 1999, Act 47 of 1999, and Regulations • Mine Health and Safety Council milestones United States • Federal Mine Safety and Health Act of 1977 • Occupational Safety and Health Act of 1970 Europe Finland • Occupational Safety Act (738/2002) • Occupational Health Care Act (1383/2002) • Workers’ Compensation Act (459/2015) France • REACH Regulation (1272/2008 EC) • CLP Regulation (1272/2008) • Occupational risk assessment document (DUERP) is compulsory Australia • Work Health and Safety Act 2012 (Tas) • Mines Work Health and Safety Regulations 2022 (Tas) • Mines Work Health and Safety (Supplementary Requirements) Act 2012 (Tas) • Mines Work Health and Safety (Supplementary Requirements) Regulations 2022 (Tas) • Mining and Quarrying Safety and Health Act 1999 (Qld) • Mining and Quarrying Safety and Health Regulation 2017 (Qld) • Resources Safety and Health Queensland Act 2020 (Qld) ASSURANCE AND REVIEWS • Sibanye-Stillwater’s health performance is monitored and verified by several external agencies such as Registrar for Medical Schemes, the Mine Safety and Health Council, Montana Department of Labor and Industry, Department of Health and the Department of Mineral Resources and Energy (DMRE) • Audits relating to the Compensation for Occupational Injuries and Diseases Act (COIDA), in terms of compensation for occupational injuries and diseases; external limited assurance on selected key sustainability performance indicators by KPMG (page 285); Occupational Diseases in Mines and Works Act audits for TB and silicosis cases • At the US PGM operations the Blue Cross and Blue Shield of Montana and the brokers and actuaries for Hub International insurance review our performance • In France, compliance with occupational health laws is enforced by the labour inspectorate • In Finland compliance with occupational safety and health laws are enforced by regional state administrative agencies • Queensland, Australia, is overseen by Resources Safety and Health Queensland (RSHQ); compliance audits are submitted to RSHQ, with any exceedances investigated and findings shared with the department Key supporting policies and policy statements: Health and safety policy statement Mandatory code of practices and standards in place for e.g. COVID-19, emergency preparedness, thermal stress, noise, and the like All operations (excluding AUS region and Keliber lithium project) are ISO 45001 certified HEALTH, WELLBEING AND OCCUPATIONAL HYGIENE continued IR - 137

SDG 3 UNDERPIN SA REGION’S HEALTH STRATEGY 2020-2022 2023-2025 2026-2030 • Sibanye-Stillwater restricted and or aligned medical schemes • Medical Schemes Amendment Bill (Act) • National Health Insurance policy (NHI) • Health financing (pooling) • Primary healthcare access; occupational health services and wellbeing • Primary healthcare and secondary healthcare access • Occupational health clinics network • Enhanced data driven occupational health services and wellness efficiency 1 Timelines could potentially be impacted due to government rollout regressions Occupational health fatalities worse than mine accidents There are far more deaths caused by occupational respiratory disease than by mine accidents; the ratio estimated at around 5:1. The MHSC (Mine Health and Safety Council), among others, has called on the industry to take a more holistic approach to the issue of employee wellbeing by focusing more on occupational health and on general wellness in the workplace, including mental health. HEALTHCARE PROVISION –––––––––––––––––––––––––––––––––––––––––––––––––––––––––––––––––––––––––––––––––––––––––––––––––––––––––––––––––––––––––––––––––––––– Medical schemes Universal Healthcare coverage is one of the United Nations Sustainable Development Goals 2015-2030 (UN SDG 3.8) to which Sibanye- Stillwater subscribes. In 2013, only 8% of our employees had a medical scheme membership; in 2023, 95% of our employees in South Africa are on medical schemes. 3.8 SA region Access to care: Sibanye-Stillwater ensures that all employees are members of a registered medical scheme, whether it is in the capacity of a principle member of a dependant on a spouse’s medical scheme. Access to care will be improved by use of digital technologies which will connect employees with registered preferred providers by telemedicine. Quality care: Sibanye-Stillwater is responsible for the selection of trauma facilities for injury-on-duty victims and trauma-related incidents. Our employees are carefully triaged on scene and directed to the appropriate definitive care facility, with severe trauma being managed in level one trauma Facilities. Our Occupational health services and Primary healthcare services are subjected to both external and Internal health audits. Effective healthcare: Through our Occupational health services and partnerships with medical schemes, we drive value-based healthcare by monitoring provider performance against objective health targets. Both non-communicable diseases such as diabetes and hypertension as well as communicable disease outcomes are monitored by our team. Financial risk protection: The performance of medical schemes is monitored annually to determine the split between healthcare and non- healthcare expenditure. Of specific importance is the Out of pocket expenses incurred by our employees and the team continues to work with stakeholders to reduce this burden, which in 2022 amounted to over R140 million. The SA region is still on track to establish a multi- commodity in-house restrictive medical scheme which will provide cost-effective care to employees and reduce out of pocket health expenditure. See Care for iMali: Taking care of personal finance fact sheet, www.sibanyestillwater.com/news-investors/reports/annual/ Sources of healthcare funding (R million) 2023 2022 2021 SA region SA region SA region Total US PGM EU AUS PGMs Gold Total US PGM EU PGMs Gold Total US PGM PGMs Gold Medical schemes 2,626 733 0 0 1,142 751 2,266 539 — 1008 719 1629 — 952 677 Company-funded2 849 629 1 0 115 105 719 444 — 130.63 144.53 762.23 4773 423 129.67 209.59 Compensation for occupational injuries and diseases### 379 NA 1 NA 197 182 289 NA NA 144 145 291 NA 125 166 Occupational diseases in Mines and Works Act dust levies### 37 NA NA NA 6 31 31 NA NA 4.00 27.00 40 NA 6 34 Total2 3,891 1,362 0 0 1,460 1,069 3,306 984 — 1,287 1,036 — — — — 1 The SA region’s cost is inclusive of the Rand Mutual insurance.The EU region reflects the occupational health-related costs 2 For EU region inclusive of the expenses related to the health survey and is EURO 40981.02 for 2023 HEALTH, WELLBEING AND OCCUPATIONAL HYGIENE continued IR - 138

Funding employee healthcare (number of employees) 2023 2022 2021 US region EU region 1 AUS region SA region Total PGMs Gold Total US PGM EU region1 PGMs Gold Total US PGM PGMs Gold Principal medical scheme members 62,944 1,775 269 0 36,656 24,244 63,656 1,774 230 35,170 26,482 66,544 1,867 35,849 28,828 Employees on medical schemes – Principal members (%) 98 95 94 — 98 97 99 97 100 98 100 98 95 99 97 1 For Sandouville refinery and Keliber lithium project 3.8 US region The US government does not provide universal health cover. Health and welfare benefits are provided through a contracted national partner providing access to primary care and speciality care for employees and families. We have partnered with a local hospital in Montana to assist employees with infertility treatment, family planning, and artificial insemination. This gives credence to our commitment to UN SDG 3.7, which supports universal access to sexual and reproductive health. 3.7 EU region All of our Keliber employees are covered by occupational healthcare at no cost to the employee. This covers a wide range of treatments. In addition, all Finnish citizens are covered by the public healthcare system. In France, employees are covered by health insurance, which is compulsory. This health insurance is contracted by the employer, who passes it on to all these employees in return for a participation fee. In addition, all French people are also covered by a public health system. AUS region Australia has a universal healthcare system called Medicare, which provides access to a wide range of health services at little to no cost for Australian citizens and permanent residents. Overall, Australia's healthcare system is known for its high-quality care, accessibility, and focus on preventive health measures. Mental health services Sibanye-Stillwater’s MyWellness app provides support for the physical wellbeing of employees. It includes a platform to encourage healthy living, as well as to facilitate rehabilitation and the return to work following illness or injury. Moreover, in 2023, two additional apps, namely the ICAS HUB and LiveWell apps, were introduced to the workforce with the aim of fostering an interactive and personalised wellbeing service. The psychological wellbeing of employees in the US and SA regions, as well as Sandouville, is assessed annually through a concise self- reporting instrument known as the WHO-5 (World Health Organization-5) Well-Being Index. In the SA region, positive psychological wellbeing improved from 70.2% (2,040 out of 2,908 participants) in 2022 to 73.3% (838 out of 1,143 participants) in 2023, reflecting a 4.42% improvement. Conversely, negative psychological wellbeing decreased from 29.8% (868 out of 2,908 participants) in 2022 to 26.7% (305 out of 1,143 participants) in 2023, indicating a 10.4% reduction. In 2023, the US region saw a deterioration in psychological wellbeing scores, with positive self-reported scores declining from 63.8% (893 out of 1,399 participants) in 2022, to 61.3% (92 out of 150 participants) in 2023. It is worth noting that these observations occurred post- restructuring, which may have influenced the results. For Sandouville operations in 2023, there was also deterioration in wellbeing scores, with those on the positive scale of wellbeing declining from 77.9% (116 out of 149 participants) in 2022 to 72.2% (13 out of 18 participants) in 2023. (Note: the wellbeing findings for 2023 for the US PGM and Sandouville operations may not be broadly applicable to the entire working population, due to the small sample size.) Recognising the importance of a comprehensive evaluation, our mental health resilience assessment in 2023 included a specific focus on gauging the risk of burnout among our workforce in the SA and US regions. The assessment did not cover Sandouville due to privacy regulations. For 2023, the off-site employee assistance programme (EAP) engagement rate (using the ICAS wellness check) at our SA operations was 2.1%. High-risk cases for 2023 constituted 3.0% of the total engagement rate (including employee dependents). This compares to the high-risk rate of 2022 which was at 3.7%. The primary areas of concern in 2023 were mental health, relationship issues, financial planning and payment issues, and personal development. To address these issues, our EAP offers support (e.g., counselling) to employees and their immediate dependents. Our SA operations invested R6.7 million in our Employee wellbeing programme. Our operations in Europe, United States, and Australia also have access to EAP services. Furthermore, victims of gender based violence (GBV) have access to free and confidential psychosocial support at our SA PGM and SA gold operations through GBV reporting and referral centres. HEALTH, WELLBEING AND OCCUPATIONAL HYGIENE continued IR - 139

PERFORMANCE ––––––––––––––––––––––––––––––––––––––––––––––––––––––––––––––––––––––––––––––––––––––––––––––––––––––––––––––––––––––––––––––––––––––– SA region SA region: Chronic disease risk classification1 2023 2022 2021 1 Criteria group 2 Criteria groups 3 Criteria groups More than 3 criteria groups Total % 1 Criteria group 2 Criteria groups 3 Criteria groups More than 3 criter ia groups Total % 1 Criteria Group 2 Criteria Groups 3 Criteria Groups More than 3 Groups Grand Total % SA gold 4,072 2,694 1,644 421 8,831 23 4,387 3,171 1,955 500 10,013 27 4,708 3,857 2,268 640 11,473 30 SA PGM 7,659 5,944 3,437 1,245 18,285 37 7,219 6,020 3,384 1,188 17,811 36 7,233 6,681 3,622 1,237 18,773 38 Total 11,731 8,638 5,081 1,666 27,116 31 11,606 9,191 5,339 1,688 27,824 32 11,941 10,538 5,890 1,877 30,246 35 1 Chronic disease risk criteria categories include, amongst others, diabetes, hypertension, TB, occupational lung diseases, HIV, heart diseases, being overweight, age, kidney failure and carcinomas Tuberculosis As South Africa is one of the highest-burdened tuberculosis (TB) countries worldwide, it is a key focus for our SA operation. Since embarking on our objective to eradicate TB at our SA operations, we reduced active TB cases from 832 in 2014 to 190 in 2023 (2022: 201). At our SA PGM operations, year-on-year active cases decreased from 203 to 149. This equates to a TB rate of 5.80 per 1,000 employees at the SA gold operations and 3.14 per 1,000 employees at the SA PGM operations. To eliminate TB at our operations we have compulsory annual TB screening and case management. We have a post-employment TB programme in partnership with TEBA that manages patients on exiting the mine, ensuring laboratory follow up and dispensing of medication. Exemplar Award for Sibanye-Stillwater from Ending Workplace TB The Ending Workplace TB (EWTB) campaign was initiated by the World Economic Forum’s Centre for Health and Healthcare, in partnership with private and public organisations. The campaign encourages companies to implement workplace TB programming, and champions existing examples of excellence by way of the Exemplar Award. Companies are asked to reference their support of EWTB in their ESG reporting, demonstrating that their actions on TB align with ESG reporting requirements. In 2023, Sibanye-Stillwater met the criteria to receive EWTB’s Exemplar Award. As per the award citation, the Group showed “outstanding performance in the delivery of workplace TB programs, helping to keep workers, their families, and communities safe from the threat of TB. This award recognises the outstanding work conducted by medical teams in Sibanye-Stillwater’s operations, particularly those in South Africa.” SA region: TB rates per 1,000 employees (new and retreatment cases) 2023 2022 2021 Total PGMs Gold Total PGMs Gold Total PGMs Gold Total TB 3.78 3.14 5.80 4.95 4.37 5.72 5.12 3.99 6.61 Pulmonary TB 2.99 2.68 4.58 4.19 3.94 4.53 3.97 3.46 5.17 Extra pulmonary TB 0.79 0.49 1.22 0.76 0.43 1.20 0.86 0.53 1.43 Cardiorespiratory TB 3.68 2.85 5.01 4.61 4.16 5.21 4.66 3.70 5.92 Multidrug-resistant TB 0.05 0.06 0.03 0.07 0.06 0.09 0.08 0.04 0.13 SA region: Number of new and retreatment cases of TB 2023 2022 2021 Total PGMs Gold Total PGMs Gold Total PGMs Gold TB 339 149 190 404 203 201 446 197 249 Cardiorespiratory TB 299 135 164 376 193 183 406 183 223 New cases of drug resistant TB 10 3 7 11 4 7 11 2 9 New cases of multidrug-resistant TB 4 3 1 6 3 3 7 2 5 3.3, 3.4 HEALTH, WELLBEING AND OCCUPATIONAL HYGIENE continued IR - 140

HIV/Aids In keeping with the 2025 UNAIDS HIV targets (which aligns with our commitment to meeting the UN SDG goals related to AIDS, specifically SDG 3: ending Aids by 2030), our targets for HIV/AIDS are as follows: • 95% of people living with HIV (PLHIV) using combination prevention • 95% of PLHIV knowing their status • 95% of people who know their status initiating treatment • 95% on treatment being virally suppressed • 95% coverage of services • 95% of women having access to HIV and reproductive health services We have various initiatives to achieve these targets: • Compulsory HIV counselling and screening offered annually at all occupational health centres for all employees • Medical schemes reporting on linkages to treatment and status of viral suppression • Monitoring disease management programmes run by medical schemes, relating to highly-active antiretroviral therapy (HAART) • On average, 84% of HIV positive employees receive first line antiretroviral treatment • For those employees that exit the organisation – our HIV/HAART patients are transferred to the state programme or they remain on the medical schemes disease management programme on leaving the organisation SA region: HIV, VCT1 and HAART (highly-active antiretroviral therapy) 2023 2022 2021 Total PGMs Gold Total PGMs Gold Total PGMs Gold VCT offered 91,326 56,397 34,929 92,127 50,577 41,550 88,187 44,511 43,676 VCT conducted 25,352 20,180 5,172 28,675 23,335 5,340 29,041 23,036 6,005 VCT test-positive 429 260 169 660 393 267 803 449 354 Proportion of workforce tested2 32 41 16 0 0 0 0 0 0 New recipients of HAART3 1,693 871 822 3,844 1,712 2,132 1,845 959 886 HAART patients alive and on treatment, total employees including category 4-9 employees4 13,948 8,933 5,015 14,620 8,796 5,824 15,160 8,326 6,834 Employees who have left HAART programme5 1,485 823 662 817 577 240 142 92 50 Note: Sibanye-Stillwater recognises the right of employees not to disclose their HIV status. 1 Voluntary counselling and testing 2 VCT conducted as a percentage of total workforce (employees and contractors) 3 HAART statistics only include employees on medical aid 4 Entry-level mining employees (Category 4-9) of the SA gold operations 5 Employees who left HAART programme within 12 months of starting antiretroviral therapy (including retrenched employees with ill health and any other labour-related terminations) 3.3 OCCUPATIONAL HYGIENE AND MEDICINE ––––––––––––––––––––––––––––––––––––––––––––––––––––––––––––––––––––––––––––––––––––––––––––––––––––––––––––––––––––––––––––––––––––––– Heat-related illness Given the depth of some of our mines, thermal stress and heat-related illness are serious risks for the SA region. Our policy focuses on minimising exposure to temperatures above 31oC (wet bulb), which is 1.5oC below the legally allowed exposure of 32.5oC (wet bulb). To do so, we use underground ventilation and refrigeration systems, which are reviewed annually against planned production targets. As part of their annual refresher training, all underground employees are trained on standards and procedures regarding thermal stress, including safe declaration, withdrawal temperature limits, and stopping work without hesitation when temperatures exceed the limit. Temperature is included in the life-saving behaviours (our non-negotiable rules that address risk areas), which instruct employees to withdraw if the temperature reaches 32.5oC. We measure heat exceedances across two criteria: average stope temperatures and number of stope panels above 31oC. At both the SA gold and SA PGM operations we have achieved a significant reduction in the number of stope panels that exceed the limit. HEALTH, WELLBEING AND OCCUPATIONAL HYGIENE continued IR - 141

Our US PGM operations do not generally experience heat-related issues. D e g re e s C e lsi u s AVERAGE STOPE WET BULB TEMPERATURE SA gold SA PGM Legal Limit Action Level 2012 2013 2014 2015 2016 2017 2018 2019 2020 2021 2022 2023 0 5 10 15 20 25 30 35 Radiation exposure Radiation hazards in our mines are from naturally occurring radioactive uranium in the gold bearing reef. Our SA gold operations are regulated by the National Nuclear Regulator (NNR) which conducts audits as stipulated by the NNR Act 47 of 1999, which mandates us to have a nuclear certificate of registration (COR). All the SA operations comply with COR conditions. The graph below shows our levels of compliance as per the NNR inspection audits conducted in 2020, 2021, 2022 and 2023. All mines achieved the 80% acceptable compliance index in 2023. NNR AUDITS/INSPECTIONS* 2020 2021 2022 2023 Acceptable compliance index DRF KLF BTX Cook Ezulweni Burnstone 0 20 40 60 80 100 120 * Kloof was not audited in 2023 and Beatrix was not audited in 2021 Our SA gold operations have a Radiation protection quality management policy. This demonstrates a commitment to integrate the management of radiological exposure into our business philosophy, ensuring adequate resources for compliance to local and international requirements), and to communicate all relevant matters regarding radiation to the relevant parties. The NNR national dose register steering committee oversees the recording system of radiation exposure doses nationwide. Our SA gold operations upload their quarterly radiation exposure on to the national dose register. Our accumulated 2023 radiation exposure doses are well below the dose limit as set by regulation (R388 of April 2006, 20mSv/a for workers). In terms of radioactive contamination of waste, this is negligible at our operations. However, all hazardous waste is disposed of responsibly. In 2023, 3,909 tonnes of contaminated scrap metal were released to NNR authorised scrap dealers (2022: 4,752 tonnes). (See Minimising our environmental impact, page 206). SA region: Occupational diseases (number of cases reported and rate per 1,000 employees)2 2023 2022 2021 Total PGMs Gold Total PGMs Gold Total PGMs Gold Silicosis1 111 18 93 88 29 59 93 32 61 Silicosis rate per 1,000 employees 1.38 0.38 2.84 1.09 0.62 1.90 1.16 0.67 1.88 Chronic obstructive pulmonary disease (COPD) 35 30 5 32 26 6 30 24 6 COPD rate per 1,000 employees 0.44 0.63 0.15 0.40 0.56 0.19 0.37 0.50 0.19 Noise-induced hearing loss (NIHL) 236 83 153 264 101 163 294 122 172 NIHL rate per 1,000 employees 2.94 1.75 4.67 3.28 2.18 5.26 3.66 2.54 5.31 Cardiorespiratory TB (CRTB) 299 135 164 376 193 183 406 183 223 CRTB per 1,000 employees 3.73 2.85 5.01 4.68 4.16 5.90 5.05 3.81 6.88 1 Number of cases reported includes new and resubmission cases 2 Rates calculated based on at-risk employee population HEALTH, WELLBEING AND OCCUPATIONAL HYGIENE continued IR - 142

SA region: Occupational health management 2023 2022 2021 Total PGMs Gold Total PGMs Gold Total PGMs Gold Medical surveillance and certificate of fitness examinations – total1 224,822 123,427 101,395 171,455 106,787 64,668 169,647 97,125 72,522 Employees 172,105 92,530 79,575 123,742 73,646 50,096 125,960 69,283 56,677 Contractors 52,717 30,897 21,820 47,713 33,141 14,572 43,687 27,842 15,845 Days lost due to health-related absenteeism 925,342 572,940 352,402 892,980 586,982 305,998 1,229,355 689,941 539,414 1 Excludes heat tolerance screening (HTS) testing in 2021, post-COVID assessments and vulnerability assessments SA region: New and resubmitted cases of occupational diseases 2023 2022 2021 Silicosis 111 88 93 Gold 93 59 61 PGM 18 29 32 Chronic obstructive pulmonary disease 35 32 30 Gold 5 6 6 PGM 30 26 24 Cardiorespiratory TB 299 376 406 Gold 164 183 223 PGM 135 193 183 Noise-induced hearing loss 236 264 294 Gold 153 163 172 PGM 83 101 122 Cases and claims: Medical Bureau for Occupational Diseases, and Compensation Commissioner for Occupational Diseases 2023 2022 2021 Cases assessed by Medical Bureau for Occupational Diseases (certification) 12,059 8,706 5,848 Sibanye-Stillwater's claims processed by Commissioner for Occupational Diseases 962 789 1,247 Claims processed by Compensation Commissioner for Occupational Diseases 5,319 6,086 6,171 Total paid only to Sibanye-Stillwater beneficiaries (R million) 33 18 25 Total paid to industry beneficiaries including Sibanye-Stillwater beneficiaries (R million) 201 136 126 Noise-induced hearing loss (NIHL) Our SA region follow the MHSC (Mine Health and Safety Council) milestone of all process noise (including machinery) below 107dB(A) by 2024. We are on track to achieve this milestone. Our NIHL strategy is to reduce operational noise such that with the use of hearing protection devices employees are not exposed to noise levels above 85dB(A), which is the statutory limit. Initiatives to reduce noise at our SA region include: 1. “Buy quiet” strategy as per Minerals Council 2. Moulded hearing protection devices roll out 3. Auditing and monitoring of critical controls for noise 4. Tightened access control to areas with high noise levels 5. Monitoring hearing protection compliance in noise demarcated areas Our hearing conservation programme is aligned with the Mandatory Code of Practice (as per the Mine Health and Safety Act) for noise and includes silencing of equipment, risk assessments, monitoring and measurement, personal protective equipment, investigation of any deterioration in hearing above 5%, and medical surveillance. Non-compliance to noise levels is mainly a result of damaged (or absent) mufflers on mechanical equipment, e.g., rock drills. At our US operations, some equipment, such as jackleg drills, exceed 107dB(A) and a few ventilation main fans exceed 115dB(A). These areas are designated as “restricted access.” In the year under review the US and the EU regions had three and zero NIHL cases, respectively. Exposure to occupational noise and resultant NIHL remains a challenge across the SA region. While we welcome the downward trend in NIHL cases since 2019, we acknowledge the need for further reductions. HEALTH, WELLBEING AND OCCUPATIONAL HYGIENE continued IR - 143

In 2023 our SA PGM and SA gold operations recorded 83 and 153 NIHL cases, respectively. This compares to the 2022 figures of 163 NIHL cases at our SA PGM operations and 101 NIHL cases at our SA gold operations. We completed the rollout of moulded hearing protection for high risk and qualifying employees in the SA region. We also included noise as a pass/fail criteria during rockdrill maintenance. Another focus at our SA operations has been alignment of noise signage, demarcation of all workplaces and sources and noise mapping. Silica, dust and airborne pollutants Dust at our SA PGM operations has very low silica content and is well controlled, presenting negligible regulatory or health risks. Silicosis (an occupational lung disease caused by long-term inhalation of dust particles) is of concern at our SA gold operations. South Africa’s deep-level gold mines, where quartz concentrations are high, present a risk for silicosis and increased susceptibility to TB. At our SA operations, employees’ exposure to airborne pollutants is monitored in line with the relevant DMRE codes of practice. Early in 2022 we reduced our internal target for silica dust exposure to no more than 5.0% (from 5.6% in 2022) of samples to exceed 0.05mg/m3. South Africa’s legislated occupational exposure limit is double this (i.e. 0.1mg/m³). Our new target aligns with our long-term strategy to meet the MHSC standard of <5% samples exceeding 0.05mg/m3 by 2024 at SA gold operations. In 2023, at our SA gold operations, 6.95% samples exceeded 0.05mg/m³. In 2023, we recorded 93 silicosis cases at our SA gold operations (2022: 59 cases). For 2023, our silicosis rate at our SA operations was 1.38 per 1,000 employees (1.1 in 2022). To date, 48 real-time dust monitors have been installed. The data from these dust monitors is collated automatically and reports are distributed daily through QlikView. This information is also available on our SCADA data system. We conduct investigations for each exposure that exceeds 0.05mg/m³. Rates of certified silicosis cases had been steadily decreasing in recent years, only to spike in 2023. This is something of a statistical anomaly given that certified silicosis cases in a given year have little to do with silica dust levels during that year. Certification of silicosis happens sometime in the life of the employee and not always in the same year that they submitted a claim. We also saw a spike in certifications because of shaft closures in the SA region, which meant that an unusually high number of employees registered with government’s Compensation Fund by which they underwent silicosis testing. The 2023 year saw further progress towards achieving the MHSC milestone on Silica exposure of no more than 5% of samples above 0.05mg/m3. The levels improving from 8.35% of samples in Q2 2023 to 6.00% in Q4 2023. Based on the current trends and sustained focus at the operations, the SA gold operations should meet the MHSC Milestone target at the end of 2024. Soluble platinum salts (chloroplatinates) Chloroplatinate salts are potent skin and respiratory sensitisers that can result in the clinical syndrome of platinum salt sensitivity. This induces symptoms typical of a type I allergy, the most significant of which is asthma. Once sensitised, the concentration that elicits an adverse response is lower and the sensitised worker may need to be removed from an area where chloroplatinates are present. Several initiatives have been implemented at our SA PGM precious metals refinery (PMR) to reduce exposure and to work towards achieving the voluntary guideline value of 100 nanograms/m3 set by the International Platinum Association (IPA). These include stringent housekeeping standards, spillage management, hand washbasins in canteens, automation of sampling equipment limiting manual handling of salts, and real-time dust and ventilation monitoring. Other interventions planned as part of a five-year plan include: • Local extraction and dilution ventilation • Resin technology for PGM separation • Chemical reduction of salts • Alternative filtration technology • Gas and fume containment technology HEALTH, WELLBEING AND OCCUPATIONAL HYGIENE continued IR - 144

Dust management at SA PGM Dust at our SA PGM operations (e.g., blown off TSFs and from haul roads) is a nuisance and a potential health problem to employees and community members. It is made worse by the fact that our SA PGM operations are in dry parts of the country. Although there are no serious risks posed by dust (regulatory or otherwise) we have a five-year dust management plan (starting 2020) for our Rustenburg and Kroondal operations. The plan includes netting barriers on the side slopes of TSFs, and application of chemical dust suppressants on the crest areas of the Paardekraal and Kroondal TSFs. It also includes propagation of tamarisk to act as wind barriers. For more information see Minimising our environmental impact, page 199. Tshiamiso Trust The Tshiamiso Trust was set up to carry out the terms of a December 2019 settlement between six mining companies and claimants suffering from silicosis and work-related TB. The trust, worth R5 billion, was instituted in February 2020. Claimants can make use of numerous lodgement centres across various countries, and at medical centres carrying out medical benefit examinations. As one of the six companies involved, Sibanye- Stillwater helped in setting up the operating structures and claims system. To date (February 2024) R1.4 billion has been paid out, with claimants coming forward and claims being paid regularly. The website provides real-time statistics on appointments, registrations, claims lodged and claimants paid. See www.tshiamisotrust.com Diesel particulate matter (DPM) The use of diesel-powered equipment in underground operations poses health risks in terms of over-exposure to DPM. South Africa currently has no legislated occupational exposure limit for DPM. Our internal DPM target is 0.16mg/m3 (measured as total carbon), which is in line with US regulatory requirements. In 2023, we took 1,754 personal DPM exposure samples at our SA gold operations, 152 of which exceeded our target (in 2022 it was 125 out of 1,449). Of the 726 personal DPM exposure samples taken at our SA PGM operations in 2023, 308 exceeded our target (in 2022 it was 111 out of 359). Current controls for DPM exposure include: vehicle maintenance, the use of low-sulphur diesel, occupational hygiene monitoring, personal protective equipment (including respiratory protection), and dilution ventilation. Diesel particulate filters fitted for our SA PGM diesel fleet towards the end of 2022 were temporarily removed in 2023 following two incidents of diesel particulate filters melting due to extreme heat. Re-installation commenced in December 2023 after several controls were implemented. US REGION –––––––––––––––––––––––––––––––––––––––––––––––––––––––––––––––––– US legislation stipulates DPM must be less than 0.16mg/m3 for total carbon. To ensure compliance, each mining operation has an industrial hygienist to monitor engineering controls, administrative controls, and employee exposures. Our DPM reduction strategy has a three-pronged approach: diesel engine maintenance, provision of adequate dilution ventilation, and operational discipline such as traffic management. Clean fuel initiatives are being implemented at both mines, including filtering closed-loop systems in storage areas. Work continues at both mines to reduce emissions on the small vehicle fleet engines, including traffic management measures. We are testing battery-electric LHDs and are investing in lower or zero emissions utility vehicles to replace legacy vehicles. Routine sampling was conducted throughout 2023, and sample results continue to demonstrate improvement in DPM mitigation practices. Radiation exposure All the US operations have a radiation safety programme. A dedicated radiation safety officer monitors radiation levels by means of nuclear gauges. We comply with guidelines issued by the Nuclear Regulatory Commission. Noise-induced hearing loss A dedicated hearing conservation programme, which provides training on the effects of noise as well as the use of personal protective equipment. Annual hearing tests are conducted at our US sites on full-time employees who may be exposed to loud noise to ensure their hearing has not changed. Several forms of noise protective equipment are available at our US operations. Respirable Crystalline Silica Our US operations have very low silica dust content and is well contained, presenting negligible regulatory or health risks. Our US operations are below the new MSHA permissible exposure limit of 50mg/m3. A compulsory medical review is required for employees at the refinery, depending on their risk exposure category, and a hearing test is part of the review. EU REGION –––––––––––––––––––––––––––––––––––––––––––––––––––––––––––––––––– Sandouville Noise-induced hearing loss Several choices of protective equipment are available to employees. In addition, many of our training and awareness programmes inform employees about occupationally-related risk and what rules to apply to mitigate the risk. Dust In 2023, a new dust measurement initiative was carried out. The aim was to identify the workstations with a high risk of dust inhalation and to define actions to reduce the dust load in the working environment. To this end, 30 mobile measurements were planned (device attached to operators) and ten fixed measurements were scheduled. In 2023, we took samples of nickel and cobalt dust that could be injurious. Radiation Use of radiation equipment in France requires a permit in accordance with Decree no. 2018-437 on the protection of workers against the risks arising from ionising radiation. A radiation protection officer is trained and officially designated to manage radioactive sources and protect workers from ionising radiation. HEALTH, WELLBEING AND OCCUPATIONAL HYGIENE continued IR - 145
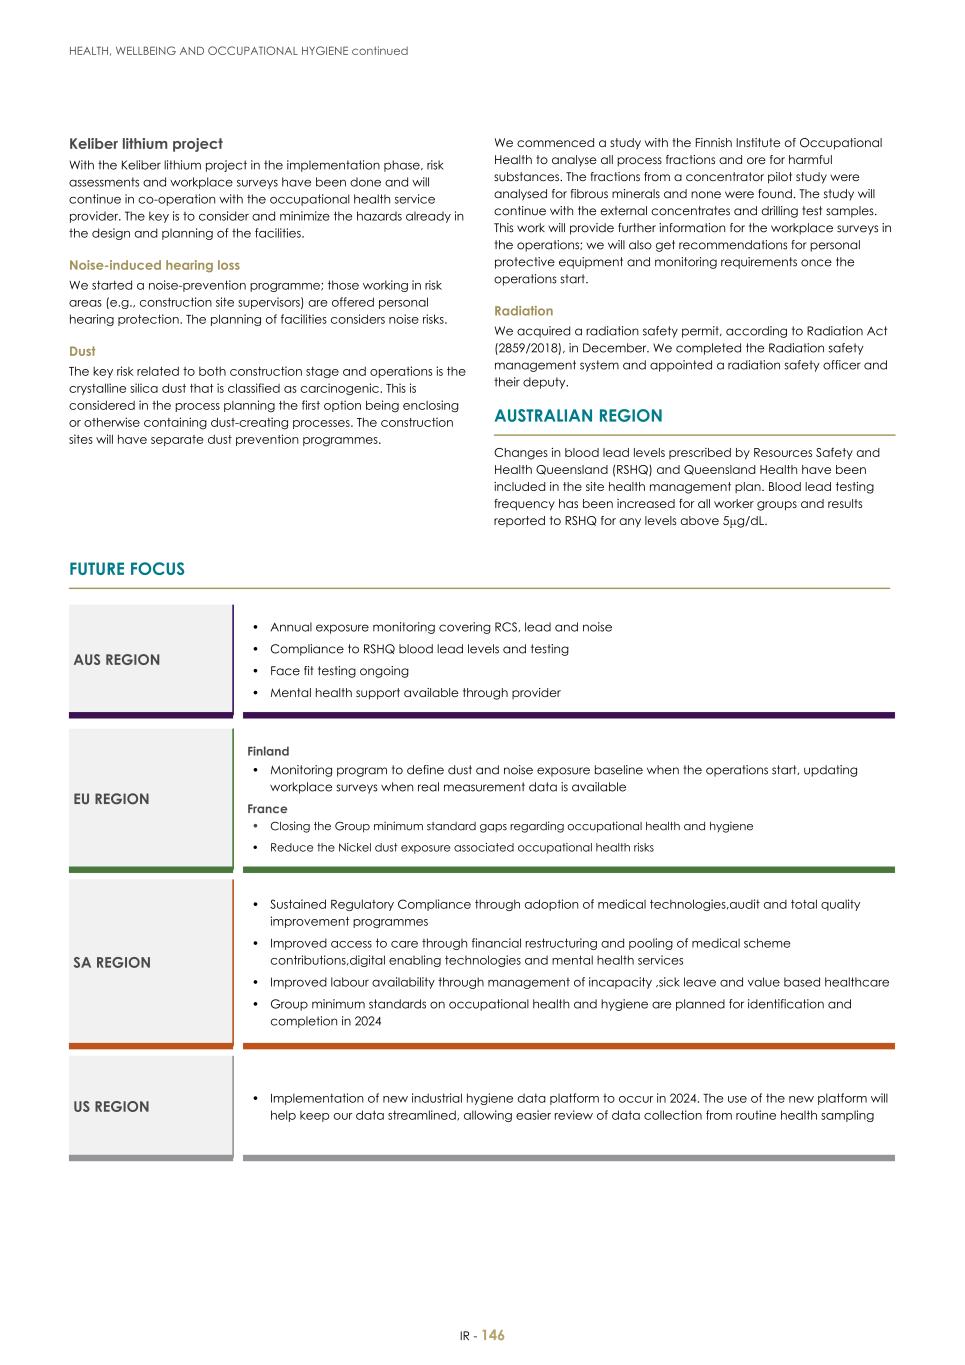
Keliber lithium project With the Keliber lithium project in the implementation phase, risk assessments and workplace surveys have been done and will continue in co-operation with the occupational health service provider. The key is to consider and minimize the hazards already in the design and planning of the facilities. Noise-induced hearing loss We started a noise-prevention programme; those working in risk areas (e.g., construction site supervisors) are offered personal hearing protection. The planning of facilities considers noise risks. Dust The key risk related to both construction stage and operations is the crystalline silica dust that is classified as carcinogenic. This is considered in the process planning the first option being enclosing or otherwise containing dust-creating processes. The construction sites will have separate dust prevention programmes. We commenced a study with the Finnish Institute of Occupational Health to analyse all process fractions and ore for harmful substances. The fractions from a concentrator pilot study were analysed for fibrous minerals and none were found. The study will continue with the external concentrates and drilling test samples. This work will provide further information for the workplace surveys in the operations; we will also get recommendations for personal protective equipment and monitoring requirements once the operations start. Radiation We acquired a radiation safety permit, according to Radiation Act (2859/2018), in December. We completed the Radiation safety management system and appointed a radiation safety officer and their deputy. AUSTRALIAN REGION –––––––––––––––––––––––––––––––––––––––––––––––––––––––––––––––––– Changes in blood lead levels prescribed by Resources Safety and Health Queensland (RSHQ) and Queensland Health have been included in the site health management plan. Blood lead testing frequency has been increased for all worker groups and results reported to RSHQ for any levels above 5μg/dL. FUTURE FOCUS ––––––––––––––––––––––––––––––––––––––––––––––––––––––––––––––––––––––––––––––––––––––––––––––––––––––––––––––––––––––––––––––––––––––– AUS REGION • Annual exposure monitoring covering RCS, lead and noise • Compliance to RSHQ blood lead levels and testing • Face fit testing ongoing • Mental health support available through provider EU REGION Finland • Monitoring program to define dust and noise exposure baseline when the operations start, updating workplace surveys when real measurement data is available France • Closing the Group minimum standard gaps regarding occupational health and hygiene • Reduce the Nickel dust exposure associated occupational health risks SA REGION • Sustained Regulatory Compliance through adoption of medical technologies,audit and total quality improvement programmes • Improved access to care through financial restructuring and pooling of medical scheme contributions,digital enabling technologies and mental health services • Improved labour availability through management of incapacity ,sick leave and value based healthcare • Group minimum standards on occupational health and hygiene are planned for identification and completion in 2024 US REGION • Implementation of new industrial hygiene data platform to occur in 2024. The use of the new platform will help keep our data streamlined, allowing easier review of data collection from routine health sampling HEALTH, WELLBEING AND OCCUPATIONAL HYGIENE continued IR - 146

IR - 147 INCLUSIVE, DIVERSE AND BIONIC

EMPOWERING OUR WORKFORCE WHAT WE DID IN 2023 SUCCESSES • Five-year wage agreement with AMCU and NUM at Kroondal • In the US, reduction of reliance on higher-cost contractor employees and where appropriate replaced with full-time employees • Total percentage of female employees increased to 17.2% (2022: 16.2%) • The restructuring engagement processes resulted in various mitigation alternatives, thereby seeing fewer employees retrenched • Achieved Standard Bank top women business in resources award for uplifting women • In the US, completion of project to provide Total value statements, a salary information sheet showing all benefits, for employees • In the US, the implementation of a Learning management system was completed CHALLENGES • Critical skills shortage in certain of our operating regions • Impact on employee morale while restructuring is ongoing and the difficulty in having to retrench employees TARGETS AND KEY OBJECTIVES Status See ALIGNMENT WITH SDGs Group 1, 3, 4, 5, 8, 9, 10, 11 The sustainability theme: Human rights and ethics inside and out, is underpinned by SDG 5. See Our Sustainability strategy: a summary See the supplementary disclosure – Progressing the UN’s SDGs www.sibanyestillwater.com/news- investors/reports/annual/ MATERIAL MATTERS M11 Culture and values M13 Talent management and core skills M14 Diversity and inclusion • For 2024, increase the overall percentage women in mining to 18% and increase women in management to 28% (base year 2023)1 New target Page 155 SA region Partially met2• As per the Mining Charter III, increased representation of historically disadvantaged persons (HDPs) and women per management and core skill levels by 2023 Page 158 • Representation of employees with disabilities to be 1.5% by 2023 Met Page 158 • Increase human resource development expenditure to 5% of total payroll by 2023 Not met S e e Page 160 US region • Implementation of new Human Capital Management System In progress Page 160 1 Refer to page 155 for an update on our women in employment targets 2 HDP representation met on three levels (middle management, junior management and core and critical skills) and HDP women representation met on three levels (Board, executive and middle management) APPROACH ––––––––––––––––––––––––––––––––––––––––––––––––––––––––––––––––– We are committed to superior productivity through engaged employees (committed to our iCARES values) who drive value creation for stakeholders. We promote the wellbeing of employees, contributing to an engaged, motivated, safe and productive workforce. Our organisational culture (underpinned by our iCARES values) is inclusive, supportive of diversity, and of sustaining jobs and facilitating community development. Our aim is to enrich every employee with the essential competencies and tools necessary for optimal performance and productivity. We have various cutting-edge initiatives to nurture the professional growth of our workforce, ensuring a reservoir of future-ready talent. It is materially important to us to attract key talent and retain core skills; we are putting extra focus on attracting those with critical mining skills. Through targeted initiatives, we promote the representation of diverse talents and a culture of inclusivity and opportunity. In line with our vision to mould world-class leaders, we offer programmes to promote global mobility and grow international leadership experience. EMPOWERING OUR WORKFORCE continued IR - 148

Our Employee value proposition EMPOWERING OUR WORKFORCE continued IR - 149 ORGANISATION STRATEGY l	Purpose, vision and values l	Operating model l	Inclusivity HR STRATEGY DIVERSITY, INCLUSION AND INCLUSIVITY AND SAFE WORK ENVIRONMENT COMPETITIVE REWARDS AND RECOGNITION REWARDING CAREER EXPERIENCE (GROWTH AND DEVELOPMENT) SOCIAL CONNECTEDNESS • Values and culture • Transformation and diversity • Work arrangement flexibility • Healthy, safe, productive and enabling environment • Enabling and engaged leadership • Sustainable future • Gender inclusivity • Appreciation and acknowledgement of performance excellence • Market-related, competitive remuneration and benefits – Pay – Incentive – Bonus – Benefits • World-class training • Talent management and succession planning for employees at all levels – Coaching and mentoring – Leadership development • Encourage and support women in mining • Corporate social responsibility • Employee volunteering (community outreach initiatives) • Employee health and financial wellness • Reputable and attractive brand EV P PI LL A RS

ACCOUNTABILITY, GOVERNANCE AND ASSURANCE GOVERNANCE ACCOUNTABILITY Board • Remuneration Committee • Audit Committee • Social, Ethics and Sustainability Committee • Safety and Health Committee • Nominating and Governance Committee Executives and C-suite • Chief People and Culture Officer which also holds the function to strategically accelerate the diversity, equity and inclusion programmes • EVP: Head of Human Resources • Transformation Committee and a Diversity, equity and inclusion Council Regional • Chief Regional Officers and operational heads are supported by SVPs for human resources and organisational development • The SA region appointed a VP transformation having the responsibility to oversee the process change to be inclusive of race, gender and economy Operational • HR Transactional service centres are decentralised • VP Transformation supports and drives transformation in SA region • Employment equity committees at each mining right area, with a centralised employment equity oversight committee • Gender-related matters progressed through various WiM committee structures within the Group; all operations have gender working groups to address gender equality s RELEVANT LEGISLATION AND REGULATIONS (list not exhaustive, only key regulations listed) • UNGC principles • International Labor Organization (ILO) Conventions on Labor Standards South Africa • Revised Broad-Based Black Socio- Economic Empowerment Charter for the South African Mining and Minerals Industry (Mining Charter III), 2018 • Labour Relations Act • Employment Equity Act • Spatial Planning and Land Use Management Act (16 of 2013) United States • Montana Human Rights Bureau • Fair Labor Standards Act • National Labor Relations Act • Civil Rights Act • Equal Pay Act • Age Discrimination in Employment Act France • Code du Travail (Labor Code) Finland • Employment Contracts Act 55/2001 • Act on Co-operation within Undertakings 334/2007 • Non-discrimination Act 1325/2014 Australia • Fair Work Act 2009 (Cth) • Work Health and Safety Act 2011 (Cth) • Modern Slavery Act 2018 (Cth) • Anti-Discrimination Act 1991 (Qld) • Anti-Discrimination Act 1998 (Tas) • State based workplace health and safety legislation (as listed in the Health, wellbeing and occupational hygiene section) ASSURANCE AND REVIEWS Sibanye-Stillwater’s HR performance is monitored and audited by several external agencies such as the Department of Employment and Labour (and in the US by the Department of Labor and Industry) and the DMRE. The South African Commission on Gender Equality, and the Human Rights Commission also externally review certain practices. Selected employment equity KPIs are externally assured (limited assurance) by KPMG (page 285). We conducted audits as per South African business policy and procedures, to create a baseline for our HR service delivery framework. As part of our comprehensive strategy to enhance diversity, equity and inclusivity, the US PGM operations report demographic workforce data, including race, ethnicity, sex and job categories, to the US Equal Employment Opportunity Commission on an annual basis. External audits are also performed against the requirements of Initiative for Responsible Mining Assurance (IRMA), International Council on Mining and Metals (ICMM) and World Gold Council (WGC) Key supporting policies Group iCARES values, Human rights policy, including our commitment to no child labour and no forced labour, Code of ethics, and Remote working policy, Diversity and inclusivity policy guideline. Our Group policies are signed by the Chief People and Culture Officer and SA region policies are signed off by the EVP for human resources. SA region* Harassment policy, Restructuring Policy, Procedure for dealing with harassment, Leave policy (includes parental leave), Overtime policy (which is aligned to the Basic Conditions of Employment Act and the Mine Health and Safety act) – the Basic Conditions of Employment Act limits employees to an average of 10 hours overtime per week. Various overtime controls (authorisations, blocking of access and disciplinary process) are built into the Human Resource system to manage excessive working hours. * Our policies have been externally reviewed and benchmarked against best practices including the international labour related standards. EMPOWERING OUR WORKFORCE continued IR - 150

CULTURE GROWTH PROGRAMME –––––––––––––––––––––––––––––––––––––––––––––––––––––––––––––––––– Our Culture growth programme is about building a values-based organisational culture and developing future ready leaders. This is to seek a competitive advantage through superior performance, collaborative teamwork, synergy, and diversity and inclusivity, in concurrence with the overarching direction and emphasis outlined in the three-tiered organisational strategy. These elements not only strengthen our capacity for innovation but also play a pivotal role in shaping our organisational identity. Culture assessments A group-wide culture assessment was introduced from 2022 to create benchmark measures. The instrument is globally benchmarked, culturally sensitive and supported by global norms. We completed the Keliber lithium project culture assessment in November 2023 (50 of 60 employees participated in the assessment), which means that we now have comparable benchmark measures across the SA region, US region, and EU region. In 2022, the following numbers of employees participated in our organisational culture assessments: in SA PGM, 291of 668 C-upper and higher bands (44%) and 649 of 6,539 of C-lower, A and B-bands (10%) participated; in SA Gold 667 of 1,369 C-upper and higher bands (49%) and 2,378 of 22,717 of C-lower, A and B-bands (10%) participated. At our US region 1,403 employees (72% of total employees at the time) participated in the assessment. At Sandouville refinery 143 employees (77% of total employees) participated. The various regions and business units have identified several initiatives to address the identified development areas, which will be ongoing in 2024 and progress measured in 2025. Integrated behavioural workshops Our integrated behavioural workshops span the three levels of employees: manager level, supervisor level, team level. We have two leadership development programmes to nurture a highly-skilled group of senior and executive-level leader: i) the Accelerated development initiative (ADI) for VP and higher levels. This programme enhances capacity for values-based decision- making, building leadership depth and capacity through self- awareness and the exploration of values, moral agency, and the role of leaders during organisational culture change. ii) The Enhanced leadership development (ELD) programme, tailored for D/E-band leaders, focuses on developing future-ready leaders that can fulfil the Group’s vision and implement its strategy through fostering collaboration, inclusivity, and teamwork. For supervisory level we offer Critical behaviour skills workshops with the following objectives: connecting to and Influencing others, diversity and inclusion, assertiveness and conflict management, take action and follow through, accountability and innovation. Supervisory management routines are incorporated into these workshops. 38 Leaders completed the ADI journey (four workshops over four months) in 2023 (157 leaders in total since 2020*). 44 leaders completed the ELD programme (three workshops over three months) in 2023 (159 leaders in total since 2021). Leaders from D-band and higher across all operating regions are identified to attend the series of ten emotional intelligence (EQ) masterclasses. The 10 masterclasses focus on leading self and others through challenging times, overcoming limiting beliefs and paradigms, communicating with impact, and building relationships. Eight leaders completed the 10 EQ masterclasses in 2023 (139 in progress) and a further 100 will initiate their journeys in 2024. To establish an in-house coaching capability at the senior and executive levels, 17 leaders completed the Crucial conversations coaching journey in 2023. 102 leaders will initiate this training in 2024. Frontline Crews In 2023, frontline crews at our SA region continued with the Team reconnect programme. The programme focuses on team cohesion (connection) and safe production. At our SA gold operations we completed the Team reconnect programme for all 793 frontline crews (100%), including auxiliary teams. The programme focused on reinforcing team values through active listening, addressing production obstacles, and identifying team purpose and goals in support of safe production. Additionally, the SA PGM operations saw 1,954 frontline crews (100%) completing phase 1 of the Team reconnect programme. SA PGM crews will initiate phase 2 of the programme during 2024. Virtual academy strategic conversations The Virtual academy is a platform for facilitating strategic conversations between C-suite and managers (supervisors and higher) across jurisdictions. The platform is also useful for leadership to address management en masse, in real-time. Sibanye-Stillwater Academy Under the tagline “Pioneering excellence in mining education and skills development” the Sibanye-Stillwater Academy offers a comprehensive suite of internal learning initiatives tailored to upskill our workforce and cultivate industry leaders for tomorrow. It is accredited by the Mine Qualifications Authority (MQA), confirming our rigorous standards in adult education and training, engineering, mining, metallurgy, and technical services. Programmes include: • Adult education and training • Leadership development • Internship and learnership programmes • Skills programmes Diversity, equity and inclusion (DEI) Sibanye-Stillwater leadership is dedicated to embracing a culture of inclusivity and to harnessing the power of diversity in all its forms. The Group values diversity and does not tolerate any form of discrimination, unequal treatment, racism, violence, exploitation of children, or forced labour. The Group is committed to the principles of equal employment opportunity in all terms, conditions, or privileges of employment and addressing, promoting and redressing imbalances of the past where applicable. Our DEI framework is an overarching guide that considers all aspects of our DEI commitments, ensuring best case practice and shared learnings across the Group. The pillars of the framework are culture and change management, diversity, learning and development, and women of Sibanye-Stillwater. EMPOWERING OUR WORKFORCE continued IR - 151

It is the aim that persons of all nationalities, races, genders, sexual preferences, political and religious affiliations and other personal distinguishing features will be recognised in the Sibanye-Stillwater ecosystem for the distinctive value that they contribute. It is against this background that the Diversity, equity and inclusion council (DEIC) was constituted in 2022, with the primary aim of driving the inclusivity agenda and giving effect to the DEI framework. The purpose of the DEIC is to promote a more inclusive environment and support initiatives that improve understanding, promote listening, and foster appreciation for broad perspectives. Each region to takes ownership of their DEI strategy; regional DEI specialists (accountable to their chief regional officer) design, operationalise and track progress on DEI, providing feedback to the DEIC. 5.1, 10.3 Leading inclusively workshops Leaders play a pivotal role in fostering an inclusive organisational culture, which is instrumental in realising our strategic differentiator: Inclusive, diverse and bionic. In 2022, the SA region launched a series of workshops (“Leading inclusively”) aimed at enhancing awareness and understanding among leaders regarding diversity (encompassing race, gender, age, and diverse perspectives). These workshops empower leaders to cultivate a psychologically safe environment where all team members, regardless of gender, age, race, or sexual orientation, feel valued and able to contribute. By embracing diversity of thought, leaders can foster innovation and instil a sense of belonging within the organisation. The workshops emphasise the importance of recognising that individuals perceive the world through diverse cultural lenses, prompting participants to identify their own mental models and acknowledge any unconscious biases or prejudices they may hold. Practical guidance and tools are provided to mitigate discriminatory behaviour. As of the end of 2023 (and starting in 2022), a total of 1,335 supervisors and higher attended these enriching two-day workshops. In the US region eight employees completed intensive DEI facilitator training, allowing them to facilitate 5 workshops during 2023. This work will continue into 2024, working with our salaried workforce. Flexible working arrangements Sibanye-Stillwater has a flexible working arrangements policy. This strategy is important for retaining high-calibre candidates and those with scarce skills. Remote working is also helpful in reducing office costs and improving productivity; a reduction in commuting is good for safety and for the environment. A small office, home office (SOHO) policy was implemented in response to the COVID-19 lockdown in 2020; it is now a permanent feature for those who can work remotely (which is about 1,125* of our SA region, 12 of our AUS region, 128 US region and 18 of our EU region employees). * 1,125 SOHO employees is based on the average number of employees who logged a work from home shift during the course of 2023 5.1, 10.3 EMPOWERING OUR WORKFORCE continued IR - 152 SOHO – ADOPTING A NEW WAY OF WORKING FOR HISTORICALLY OFFICE-BASED EMPLOYEES

OUR WORKFORCE PROFILE ––––––––––––––––––––––––––––––––––––––––––––––––––––––––––––––––––––––––––––––––––––––––––––––––––––––––––––––––––––––––––––––––––––––– The composition of our workforce is outlined below. Tough economic conditions at our SA region have required the Group to consider the reduction of its workforce. We concluded consultation processes with relevant stakeholders in terms of Section 189A of the Labour Relations Act, 66 of 1995 (LRA), regarding the restructuring at our Kloof 4 SA gold operations. Of the 2,389 (K4) employees and 581(K4) contractors that were potentially affected 575 employees could not be accommodated in the agreed available measures. We have also concluded the consultation with relevant stakeholders of four of the SA PGM operations (Rowland, Siphumelele, 4B and Simunye shaft and associated services). Of the 4,095 employees and contractors who were potentially affected only 852 people could not be accommodated. This was done in accordance with the Retrenchment avoidance measures agreement, and our Retrenchment policy in an attempt to minimise job losses and address skills shortages at our operations. The retrenchment avoidance measures included the transfers to other shafts, voluntary separation or early retirement packages. On 11 April 2024, Sibanye-Stillwater announced that it entered a Section 189 consultation process to restructure its SA region which potentially could affect 3,107 employees and 915 contractors. Workforce by operation at December 2023 2023 2022 2021 1Employees 2Contractors Total 1Employees Contractors Total 1Employees Contractors Total SA region Beatrix 5,085 1,183 6,268 6,218 1,694 7,912 6,555 1,868 8,423 Driefontein 8,190 1,624 9,814 8,373 1,557 9,930 8,481 1,690 10,171 Kloof 6,975 1,969 8,944 8,685 1,759 10,444 9,407 1,982 11,389 Burnstone 907 951 1,858 765 490 1,255 168 76 244 Cooke 485 565 1,050 480 486 966 487 428 915 SA gold operations 21,642 6,292 27,934 24,521 5,986 30,507 25,098 6,044 31,142 Kroondal (100%) 5,088 2,966 8,054 5,312 2,832 8,144 5,397 3,139 8,536 Rustenburg 12,603 3,269 15,872 12,648 2,980 15,628 12,809 3,283 16,092 Marikana 18,960 4,519 23,479 18,800 3,860 22,660 17,963 3,413 21,376 SA PGM operations 36,651 10,754 47,405 36,760 9,672 46,432 36,169 9,835 46,004 SA regional services 2,466 2,223 4,689 2593 1936 4529 2671 2164 4835 SA region – total 60,759 19,269 80,028 63,874 17,594 81,468 63,938 18,043 81,981 US region5 Stillwater 1,010 121 1,131 1,081 492 1,573 1,219 494 1,713 East Boulder 464 70 534 449 263 712 454 262 716 Columbus Metallurgical Complex 184 10 194 199 89 288 199 177 376 US regional services3 111 5 116 104 0 104 99 0 99 US region – total 1,769 206 1,975 1,833 844 2,677 1,971 933 2,904 EU region Sandouville refinery 206 60 266 200 0 200 Keliber project 63 8 71 30 0 30 EU regional services 18 1 19 5 0 5 EU region — total 287 69 356 235 0 235 AUS region Century 230 24 254 Mt Lyell 21 0 21 AUS regional services 13 0 13 AUS region — total 264 24 288 Corporate office 4 141 0 141 101 0 101 96 0 96 Group – total 63,220 19,568 82,788 66,043 18,438 84,481 66,005 18,976 84,981 1 Employees include permanent and fixed-term employees 2 Contractors exclude ‘free’ contractors (i.e. those paid for work performed as opposed to being paid per head) 3 Regional services in the US includes executive management located in the Columbus and Montana offices 4 Blue Ridge included 5 US region numbers include all contractors including “free” contractors EMPOWERING OUR WORKFORCE continued IR - 153

Workforce by age3 SA region 18<30 years 3,359 4,268 7,627 10 % 3,525 4,037 7,562 9 % 2,958 4,614 7,572 9 % 30-50 years 42,643 12,566 55,209 69 % 45,246 11,328 56,574 69 % 45,814 11,328 57,142 70 % >50 years 14,757 2,435 17,192 21 % 15,204 2,229 17,433 21 % 15,166 2,101 17,267 21 % US region2 19<30 years 241 0 241 14 % 254 0 254 14 % 311 0 311 16 % 30-50 years 1,019 0 1,019 58 % 1,040 0 1,040 59 % 1,096 0 1,096 56 % >50 years 509 0 509 29 % 539 0 539 30 % 564 0 564 29 % EU region Keliber 18<30 years 4 0 4 6 % 0 0 0 — % 30-50 years 42 2 44 62 % 18 0 18 60 % >50 years 17 6 23 32 % 12 0 12 40 % Sandouville 18<30 years 21 0 21 11 % 20 0 20 10 % 30-50 years 132 0 132 66 % 130 0 130 65 % >50 years 47 0 47 24 % 50 0 50 25 % AUS region 18<30 years 31 0 31 12 % 30-50 years 133 0 133 50 % >50 years 100 0 100 38 % Corporate Office 18<30 years 13 0 13 9 % 6 0 6 6 % 6 0 6 6 % 30-50 years 96 0 96 68 % 68 0 68 67 % 64 0 64 67 % >50 years 32 0 32 23 % 27 0 27 27 % 26 0 26 27 % 2023 2022 2021 1Employees Contractors Total % Employees Contractors Total % Employees Contractors Total % 1 Employees include permanent and fixed term employees 2 Ages of contractors at US, EU Sandouville, AUS region not available EMPLOYEE TURNOVER ––––––––––––––––––––––––––––––––––––––––––––––––––––––––––––––––––––––––––––––––––––––––––––––––––––––––––––––––––––––––––––––––––––––– The annual turnover for Sibanye-Stillwater SA region was 13.61%. Of our total turnover rate 2.40% were women. The annual turnover for management level employees at our SA region in 2023 was 1,733 (2023: 2.77%; 2022: 1.75%), including 1,330 for HDPs (2023: 2.12%) and 356 for women in management (2023: 0.57%). The total turnover for the SA region was 8,518 (2023: 13.6%), with 4,151 and 4,081 recorded at the SA gold and PGM operations respectively (2023: 18.0% and 11.1%; 2022: 9.3% and 9.2%). Annualised turnover in the US region was 16.36%, 12% were women, while the attrition rate among miners was 11.69% (2022: 18.06% and 12.97% respectively). High rates are attributed to low unemployment rate and skills shortage in the state of Montana and the country as a whole – a shortage of mining, geological and artisan skills. A strong focus on sourcing, training and retaining the required skills whilst simultaneously improving the conditions of employment are being prioritised. The Sandouville refinery turnover was 7.81%. Eight women were recruited for Sandouville and 8 women for the Europe services of which three have resigned during the reporting year. At our SA region a total of 1,690 (31.05%) women were hired out of a total 5,443 hires. The new hires age group distribution – 1,761 are below the age of 30, 3,459 are between the ages of 30 and 50 years old and 223 are over 50 years of age. The annual turnover for the AUS region was 30.25%. Factors such as the acquisition uncertainty, a tight labour market for skilled mining personal, competitive recruitment from neighbouring mines and suspension of expansion projects all contributed to employees leaving Century operations. Retention strategies have been implemented and the stability of the workforce numbers have been noticed. ABSENTEEISM ––––––––––––––––––––––––––––––––––––––––––––––––––––––––––––––––––––––––––––––––––––––––––––––––––––––––––––––––––––––––––––––––––––––– Absenteeism is monitored monthly via an attendance management programme. Employees who are struggling with personal, health or work-related issues impacting their ability to be at work can seek assistance through our Employee assistance programme (EAP). The annual average absenteeism at the Sandouville refinery was 4,08% and 1.34%1 in the AUS region. 1 Absenteeism rate = average number of employees x missed workdays/average number of employees x total workdays EMPOWERING OUR WORKFORCE continued IR - 154

SA region: Shifts not worked including absenteeism (average %) ABSENTEEISM AS AT DECEMBER YEAR-ON-YEAR BY TYPE/NON-AVAILABILITIES 1% 1% 0% 1% 1% —% 4% 5% 4% 4% 4% 4% 11% 11% 10% 11% 11% 12% Absent without permission Sick Other (include leave and training) SA Ops (Dec22) SA PGM (Dec22) SA gold (Dec22) SA Ops (Dec23) SA PGM (Dec23) SA gold (Dec23) 0% 5% 10% 15% 20% PERFORMANCE ––––––––––––––––––––––––––––––––––––––––––––––––––––––––––––––––––––––––––––––––––––––––––––––––––––––––––––––––––––––––––––––––––––––– Noting that culture transformation is handled by Organisational growth department within the Group, Human resources department focuses on operational excellence and strategic workforce planning. In 2023 our SA PGM operations spent R582m on learning and development, while our SA gold operations spent R464m. Training spend for our US region was US$3.6m. Our Keliber lithium project is in the planning phase and engaged with local vocational training institutes to commence with training when needed. The annual training spend at our Sandouville refinery and Keliber was R 0.2m. GENDER DIVERSITY AND INCLUSIVITY ––––––––––––––––––––––––––––––––––––––––––––––––––––––––––––––––––––––––––––––––––––––––––––––––––––––––––––––––––––––––––––––––––––––– We are committed to meeting ethical norms about female representation in the workplace; ensuring that women are valued and are safe in our work environment. We have numerous interventions to make Sibanye-Stillwater a welcoming work environment for women. The Group has policies and procedures to increase female representation across all levels of the organisation. Key policies focus on: (i) the attraction, retention, promotion and development of females in the Group; (ii) addressing and combating gender-based violence issues; (iii) cultural transformation within the workplace encouraging an inclusive and diverse environment across all levels within the Group. Targets are linked to management performance ratings and remuneration incentives. We reviewed our group commitment to have 30% women in our employment by 2025 as this target proved to be unrealistic. In our effort to review this target we are benchmarking with peers, considering restructuring and life of operations as well as regional context. For the short-term (2024) we have set the target to increased women in management to 28% and women in mining to 18%, from a 2023 base year. The overall female representation for the Group1 increased from 16.2% in 2022 to 17.2% in 2023. Female Board representation remained at 31%. See Board and executive leadership, page 8 for more information. SA region: Gender diversity per level in 2023 Female (number) excluding foreign employees % Female (number) including foreign employees % Board 3 23.1 4 30.8 Executive2 4 10.3 4 10.3 Senior management1 40 18.5 41 19.0 Middle management1 317 29.6 324 30.3 Junior management1 2,405 23.8 2,440 24.1 Core and critical skills3 7,417 14.1 7,665 14.5 Non-core3 2,906 35.6 2,950 36.2 1 South African operations including Corporate office 2 Two females are senior vice presidents included in the executive level 3 The definition for core and non-core to has changed to align to the Department of Employment and Labour’s definitions EMPOWERING OUR WORKFORCE continued IR - 155

Gender diversity of employees (2023) 2023 2022 2021 Female % Male % Female % Male % Female % Male % SA region1 10,553 17.4 50,206 82.6 10,412 16.3 53,462 83.7 9,253 14.5 54,685 85.5 SA gold operations 3,538 16.3 18,104 83.7 3729 15.2 20,792 84.8 3,398 13.5 21,700 86.5 SA PGM operations 6,080 16.6 30,571 83.4 5718 15.6 31,042 84.4 4,900 13.5 31,269 86.5 SA regional services 935 37.9 1,531 62.1 965 37.4 1,628 62.6 955 35.8 1,716 64.2 EU region 55 19.8 223 80.2 47 20.0 188 80.0 US region 2 181 10.2 1588 89.8 183 10.0 1,650 90.0 193 9.8 1779 90.2 AUS region 30 11.4 234 88.6 Corporate office 62 44.0 79 56.0 42 41.6 59 58.4 47 49.0 49 51.0 Group 10,881 17.2 52,330 82.8 10684 16.2 55,359 83.8 9493 14.4 56513 85.6 1 As at December 2023, we have 4,414, (24.54%) women employed at entry level (A-band) for SA region 2 Includes services and other 5.5, 10.4 Women-in-Mining (WiM) and Gender-based violence (GBV) WiM is an initiative to promote women in mining and to increase our ratio of female employees and encourage higher female representation in leadership roles. WiM aligns with the UN SDG 5 (achieve gender equality and empower all women and girls). Part of our commitment to WiM involves identifying and promoting women to join at different levels. SA region offers bursaries to any person who is not an employee of Sibanye-Stillwater to attend higher education studies subject to contractual conditions. We also have a special bursary for top grade 12 performers from disadvantaged schools in areas around our operations. As bursars complete their studies, they access our internship programmes. Currently bursars have a 32% WiM representation; interns a 39% WIM representation; and study grants have a 47% WiM representation. GBV is a widespread concern, particularly in South Africa. In 2023, we continued our anti-sexual harassment campaigns, including anti-sexual harassment training during induction. Our Harassment procedure governs how to deal with sexual harassment cases. A sexual misconduct unit of Protection services handles all reported sexual harassment cases, and counselling is provided to affected employees. In the year under review we developed a GBV toolbox talk which was implemented at the rock face. We have GBV reporting and referral centres at our SA PGM and SA gold operations (including online options); we offer online training on dealing with the scourge of GBV. In 2023 we had 33 GBV related cases, including nine sexual harassment cases, of which seven are closed and two are under investigation. See our diversity training information on page 151. For the US region in 2023 we launched Women of Sibanye-Stillwater, with feedback reported into the Diversity, equity and inclusion council (DEIC); we also launched the Business resource group (BRG) in 2023 to create a more inclusive work environment for women. The BRG focuses on three key projects: PPE for women, physical requirements of jobs and mentoring. For the US region we have a target of a 5% increase in representation of minority or historically underrepresented groups at superintendent level (E7) and above from December 2022. A 4% increase has thus far been achieved. Eight employees completed DEI facilitator training (US region), and are designated to train workforce on DEI principles. These trainers have provided DEI immersion workshops for 60% of employees. SA region: Women’s voice workshops The Women’s voice workshops are part of the WiM programme, offering women employees a supportive platform to consider more effective ways of operating and being successful in the mining environment. In 2023, 148 women attended these two-day workshops (337 since inception in 2022). Attraction, retention, promotion and development For our SA region 23.69% and Corporate office 27.27% of promotions approved in 2023 were women, and for SA operations 30.96% and Corporate office 62.50% of new recruits were women. For our US region 46 of new recruits were women and 16 of the new recruits in the EU region. EMPOWERING OUR WORKFORCE continued IR - 156

SA region: Steel Woman Programme The Steel Woman programme was launched in partnership with Henley Africa as part of the Women of Sibanye-Stillwater programme to provide leadership development opportunities for women and strengthen our leadership bench in the process. A Sibanye-Stillwater and Henley Africa panel identified successful candidates that were awarded scholarships in various courses from Higher Certificate in Management Practice up to Postgraduate Diploma in Management Practice. 40 women are currently in progress with the programme (since 2022) and 23 have successfully completed their respective qualifications. 32 Women have been selected to start the programme in 2024. US region: Women In Mining (WIM) In the US, the WIM effort was to provide a workplace welcoming for women and providing access to opportunity. Major programmes included sourcing of smaller and more female friendly personal protective equipment, launch of the Women and Allies Business Resource Group (BRG), and initiation of a project to update or create Job Safety Analyses for all positions that clearly identify physical requirements and working conditions for each position. Pay-parity We have a policy of equal pay for equal work, and have gone to some lengths to ensure that none are being discriminated against based on race, gender, or any other factors. Of our top 10% (5,975) compensated employees, 18.83% (1,125) are women (2022:15.84%). For further information see Remuneration report, page 254. Discrimination Our grievance processes allow for employees to lodge discrimination complaints formally or informally. Discrimination cases are referred to the Dispute resolution unit (DRU), which appoints an investigator. An employee can choose to lead their own grievance or ask the DRU to lead. A presiding chair makes a ruling, which management ratifies. There were four cases of discrimination in 2023 (2022: one). Two cases were closed and no evidence was found that any intimidation or discrimination occurred, the other two cases are still being investigated. Working hours and leave policies Our Leave policy for our SA region makes provision for maternal leave, paternal leave, and adoption leave. In terms of various collective agreements, the SA region gives women employees four months fully paid maternity leave. This is more favourable than what is legally required. Our Overtime policy for the SA region sets out the control mechanism to monitor overtime work and to manage excessive working hours. Monitoring includes overtime work planning, and authorisation practices of overtime, ensuring we comply with the Basic Conditions of Employment Act thresholds. Parental leave For the SA region - we have improved our leave policy, ensuring we are aligned to legislation and that employees are treated fairly; such that – for example – we allow all leave to accrue. We have considered special cases like our breast feeding and lactation policy for mothers returning from leave. We offer parental leave, which include adoption and maternal leave, for all our SA region employees. During 2023, at our SA region 474 employees (474 women and 0 men) took parental leave. Our retention rate after a 12-month period, post parental leave, is 94.94% (94.1% for 2022). For our US operations – our leave policies are in full compliance with US federal laws and with state laws in which we operate. In 2024, we will partner with an external consultant to review and assess our leave policies and how we remain competitive among our peers and better align with international standards. 3.7, 10.3, 5.1, 5.2, 8.5 TRANSFORMATION (ALIGNED WITH MINING CHARTER III) ––––––––––––––––––––––––––––––––––––––––––––––––––––––––––––––––– The Mining Charter is a regulatory instrument to encourage the participation of historically disadvantaged South Africans in the mining and minerals industry. It promotes socioeconomic inclusion across seven elements: ownership, mine community development, procurement, beneficiation, housing and living conditions, human resource development, and employment equity. The main objectives of the Mining Charter are to deracialise ownership of the industry, redress the imbalances of historical injustices, and enhance the social and economic welfare of employees and mine communities. In terms of ownership, we met the Mining Charter targets. * The definition for youth as defined within the Mining Charter is those South African citizens between the ages of 18 to 35. Employment Equity A significant feature of Mining Charter III is its focus on employment equity that includes women representation across the workforce. The Group achieved the following against the Mining Charter and employment equity targets: EMPOWERING OUR WORKFORCE continued IR - 157

SA region: Employment equity by category as at December 2023 Representation of HDP Board: 50% 46.15 % 46.15 % Executive management: 50% 35.90 % 35.90 % Senior management: 60% 49.54 % 51.02 % Middle management: 60% 62.90 % 62.88 % Junior management: 70% 77.77 % 77.30 % Core and critical skills: 60% 76.43 % 76.55 % Representation of HDP women as % of total HDPs Board: 20% 50.00 % 50.00 % Executive management: 20% 28.57 % 28.57 % Senior management: 25% 37.38 % 16.00 % Middle management: 25% 47.10 % 40.34 % Junior management: 30% 30.57 % 27.72 % Employees with disabilities Disabilities 1.5% 1.61 % 1.64 % Measure Target for 2023 1Actual % achieved SA operations 2Actual % achieve SA operations (Mining Charter III) 1 Includes Integrated Services and Corporate office 2 Excludes Integrated Services and Corporate office apart from Board and Executive Management People with disabilities The South African Mining Charter targets that 1.5% of our employees are people with disabilities. We recognise employees challenged by disability and are committed to including them in the work environment such that they can meaningfully contribute to the Group. This equity target is an opportunity to integrate those affected by illness, mental challenges, physical impairment and other non-normative conditions. 5.5 LOCAL EMPLOYMENT ––––––––––––––––––––––––––––––––––––––––––––––––––––––––––––––––––––––––––––––––––––––––––––––––––––––––––––––––––––––––––––––––––––––– Some 81.58% of our SA workforce is made up of South African citizens (2022: 81%); of these, 49.11% are from our doorstep communities. The remaining come from Southern African countries: Lesotho, Mozambique, Eswatini, Botswana and Zimbabwe. In the US, the majority of the workforce is made up of Montana residents. However, many supervisory roles and specialised positions are filled by people from other states, predominantly Nevada, Washington and Alaska. The shortage of critical skills continues to impact productivity and costs at our US operations. Therefore, strategies to widen the talent pool and create an environment in which people can thrive, are key. There are approximately 9.8 million* open jobs in the US and only 5.9 million unemployed workers. In Montana there are more than double the job openings than available workers. *Source: Visual capitalist SA region: Origin of employees (2023)1 Province Gold PGMs Services Total % Eastern Cape 6,204 10,861 316 17,381 28.5 Free State 2,603 1,374 261 4,238 7.0 Gauteng 3,179 2,147 1,199 6,525 10.7 KwaZulu-Natal 2,050 841 160 3,051 5.0 Limpopo 457 2,261 149 2,867 4.7 Mpumalanga 1,154 764 65 1,983 3.3 North West 528 12,361 292 13,181 21.6 Northern Cape 34 359 10 403 0.7 Western Cape 15 24 14 53 0.1 Non-South Africa 5,418 5,664 136 11,218 18.4 Total 21,642 36,656 2,602 60,900 100 1 Including Corporate office EMPOWERING OUR WORKFORCE continued IR - 158

SA region: Citizenship of non-South Africans (2023)1 Country Gold PGM Services Total % Australia 0 0 1 1 0 Botswana 119 15 5 139 1 Cameroon 1 0 0 1 0 Canada 0 1 0 1 0 China 0 1 0 1 0 Congo 1 2 3 6 0 Eswatini 480 66 19 565 5 Ethiopia 1 0 0 1 0 France 0 0 1 1 0 Germany 0 1 0 1 0 Ghana 1 0 0 1 0 India 0 1 1 2 0 Lesotho 2,297 1,702 56 4,055 36 Malawi 3 6 0 9 0 Mozambique 2,502 3,817 33 6,352 57 Netherlands 1 0 0 1 0 New Zealand 0 0 1 1 0 Nigeria 0 1 0 1 0 Peru 0 0 1 1 0 United Kingdom 0 1 4 5 0 Zambia 0 5 2 7 0 Zimbabwe 12 45 9 66 1 Total non-South African 5,418 5,664 136 11,218 100 1 Including Corporate office SA region: Local1 community recruitment2 2023 2022 2021 PGM Gold PGM Gold PGM Gold Appointments 3,892 1,342 3,914 1,779 2,305 2,089 Local recruits 2,634 782 2,617 1,193 787 1,072 % 68 % 58 % 67 % 67 % 34 % 51 % 1 Within a 50 kilometre radius of the mines 2 Excluding Corporate and Integrated Services % LOCAL RECRUITED WOMEN AND BY OPERATION 15 42 56 25 33 7 100 9 41 26 32 Beatrix Driefontein Kloof Rand Uranium Burnstone Kroondal Limpopo Platinum mile Marikana: EPL Rustenburg Marikana: WPL US region: Employee distribution by county (Montana) 2023 2022 2021 Stillwater 533 549 575 Yellowstone 641 661 714 Sweet Grass 119 131 140 Park 146 164 168 Carbon 154 157 170 Other locations 176 171 203 Total 1,769 1,833 1,970 EU region – Sandouville: Employee distribution by region (France) 2023 2022 Normandy (Sandouville) 199 200 Paris region 18 Total 217 EMPOWERING OUR WORKFORCE continued IR - 159

EU region – Keliber: Employee distribution by province (Finland) 2023 2022 Central Ostrobothnia 42 15 Bordering provinces 13 9 Other 8 6 Total 63 30 AUS region: Employee distribution by state 2023 New South Wales 0 Queensland 231 South Australia 1 Tasmania 21 Victoria 10 Western Australia 1 Total 264 UPSKILLING OUR WORKFORCE –––––––––––––––––––––––––––––––––––––––––––––––––––––––––––––––––– Training and development New employees undergo induction training and all employees undergo refresher training every 18 months on important policies, standards and processes. During 2023, 76% of employees completed induction/refresher training. As part of the induction/refresher training health, safety, environmental, human rights, conditions of employment and human resources policies and procedures are covered. See Continuous safe production, page 129 for more about safety-related training. Talent management and career growth SA region We aim to fill 80% of vacant positions with internal employees. In 2023, 67% of our vacant positions were filled by internal employees (2022: 64%). We encourage our employees to set career development goals, or individual development plans as we call them. In 2023, 5,299 identified successors (2022: 4,405) had IDPs for succession purposes; 1,560 successors were promoted during 2023 (2022: 1,030). Talent management helps us address the shortage of mining skills in South Africa, which is felt particularly acutely in mining, engineering and technical areas. The situation is made worse by the high demand for historically disadvantaged persons (HDPs) with engineering skills, who are often lured by competitors, negatively impacting our employment equity ratings. In 2023, we initiated senior succession talent councils, supported by divisional and operational talent councils. The Senior succession talent councils were chaired by the EVP HR and coordinated by the VP of HR and by regional SVPs of HR, with support from the talent management departments. The talent councils are tasked with boosting available talent. Our performance management process requires that employees set performance deliverables (aligned to the Group’s strategy), which are tracked quarterly. During 2023,100% of management completed their performance contracts. SA operations: talent pool 2023 2022 2021 Talent pool size (A-D band) 5,721 5,422 3,714 Successors promoted 1,560 1,030 868 US region The US operations recorded 98,571 total training hours. Training for our salaried workforce focused on leadership development as well as supervisory skills, while hourly training including mining task training as well as safety compliance training. Much of the effort in learning and development was focused on implementation of a Learning Management system, which was completed in December of 2023. This system provides e-learning capability as well as tracking and reporting for all of the US training efforts. Human resource development SA region Mining Charter III requires companies to spend 5% of their total payroll on essential skills and HR development (HRD) for employees and community members. HRD spend across the SA operations amounted to 4.4% of total payroll in 2023, (5.1% in 2022). Our education and training initiatives fall into five broad categories: • Skill development programmes (e.g. core skills and leadership development) • Adult education and training (aimed at functionally illiterate employees and community members) • Learnerships (two-year SETA accredited programme focused on core mining skills) • Internships (two-year programme for new graduates, include theory and practical) • Bursaries and study grants (Group-funded further learning opportunities) In 2023, we spent R464 million on training at our SA gold operations and R582 million at our SA PGM operations. A large number of learners who began in 2023 will continue in 2024 and as such the HRD provision for 2024 will remain above the R1 billion mark. 1.1a, 4.4, 4.6 EMPOWERING OUR WORKFORCE continued IR - 160

SA region: Human resource development R million 2023 2022 2021 Operation SLP financial provision Actual training expenditure % of Payroll SLP financial provision Actual training expenditure % of Payroll SLP financial provision Actual training expenditure % of Payroll Beatrix 76.9 131.4 7.1 % 80.0 118.0 7.5 % 126.0 136.0 6.6 % Burnstone 0.0 11.5 5.1 % 0.4 10.0 8.9 % 0.0 1.0 1.4 % Cooke 0.0 2.0 1.5 % 0.0 2.0 1.8 % 0.0 2.0 1.3 % Driefontein 67.8 137.6 5.0 % 80.2 126.0 5.7 % 121.0 131.0 5.0 % Kloof 86.4 181.2 6.2 % 90.0 153.0 6.8 % 122.0 152.0 5.4 % Total gold operations 231.2 463.6 250.6 409.0 369.0 422.0 Kroondal 59.8 90.1 3.7 % 85.0 130.0 5.2 % 74.0 86.0 4.4 % Rustenburg 126.2 247.1 4.4 % 118.0 279.0 5.3 % 233.0 229.0 5.3 % Marikana 298.4 244.3 3.1 % 87.4 259.0 3.6 % 288.0 232.0 4.2 % Total PGM operations 484.3 581.5 290.3 668.0 595 547 Total 715.5 1,045.1 4.4 % 540.9 1,077.0 5.1 % 964 969 4.3 % Total opportunities for 2023 were 603,383 (up from 472,981 in 2022). Sibanye-Stillwater has made provision for an HRD budget of R1.012 billion for 2024 to ensure outstanding commitments are achieved. 4.4 SA region: Human resource development1 Group: Human resources development 2023 Expenditure (Rm) Number of learners Female learners (%) Total training hours (number of learners x average training days per learner) Average rand/ learner 2Average hour/ learner Internships1 97 380 41 1,229,760 227,458 2016 Bursaries1 38 580 36 1,530,144 58,738 2016 AET (employees) 78 1,046 25 321,480 90,254 360 AET (community) 3 257 76 91,350 34,077 450 Engineering learnerships 148 558 22 1,882,944 109,612 2016 Mining learnerships 156 871 26 3,600,576 83,501 2016 LO A-Stream 22 73 33 165,312 273,488 2016 Portable skills (employees) 12 481 26 21,312 24,162 48 Portable skills (community) 12 391 65 42,528 60,578 96 Leadership development 40 6,393 24 218,720 6,446 40 Core skills training 396 551,849 15 35,058,432 715 64 Cadet training 8 929 49 43,328 14,745 64 Coaches/mentorship training — 844 29 3,792 6,403 8 Employee indebtedness (CARE for iMali) 3 38,727 14 337,224 117 8 Community maths and science — 0 — 0 — 0 Support and research (METF) — 0 — 0 — 0 Other 33 4 18 38,728 3,719 8 Total/ Average hour/Average Rand per learner 1,045 603,383 15 44,585,630 1,720 72 1 The numbers include new bursars and internships that are still part of the programmes from previous years as education programmes 2 The ‘2016’ average hours in several cells relate to the full year or multi-year programmes (12 months). The 2,016 is the actual hours spent during available days for training in the year, excluding weekends, public holidays and institution vacation periods In 2023, we awarded bursaries to an additional 9 top matriculants from disadvantaged schools from around our SA operations. The Group launched this bursary scheme in 2019, which provides top performers from disadvantaged schools in host communities with full scholarships to pursue tertiary education. It has benefited 56 learners (30 male and 26 female) since its inception. Also see our Impact Report 2023,www.sibanyestillwater.com/news-investors/reports/annual/. EMPOWERING OUR WORKFORCE continued IR - 161

SA region: Employees trained per gender and HDP Patterson grade % Women trained % HDP trained A Band 18 99 B Band 8 99 C Band 13 79 D Band 11 56 E Band 13 45 Non-graded learners 37 95 % of Total trained 14 95 1.1a, 4.4, 4.6 SA region: Employees per category by training type (average hour per learner) A-band B-band C-band D-band E-band F-band NG-band Internship 2,920 2,920 2,920 2,920 0 0 2,721 Bursaries 2,920 2,356 2,048 1,834 1,475 0 2,452 AET 1,239 1,413 748 0 0 0 1,413 Engineering learnerships 2,918 2,908 2,920 0 0 0 2,810 Mining learnerships 2,920 2,764 2,913 0 0 0 2,818 LO A-stream 0 0 0 0 0 0 2,920 Portable skills 102 77 51 48 0 0 129 Leadership development 71 37 48 38 17 12 84 Core skills training 23 23 15 16 12 8 33 Cadet training 606 1,337 0 0 0 0 502 Coaches/mentorship training 934 951 1,247 1,617 1,672 0 608 Employee indebtedness (Care for iMali) 8 8 8 0 0 0 8 Other 10 12 12 12 8 9 26 Portable skills Management recognises the need to prepare employees for post-employment and to offer useful skills in practical areas like construction and farming. In addition, youth from local communities are offered training opportunities in areas such as welding, plumbing, sewing, agriculture and computer skills. Adult education and training (AET) We also offer AET classes to community members who want to improve their functional literacy. AET is part of the HRD requirement of the SLPs and it also supports UN SDG 4.6, which aims to ensure that all youth and a substantial proportion of adults, both men and women, achieve literacy and numeracy by 2030. SA region: Adult education and training 2020 870 94 776 294 186 108 1,164 2021 1,295 208 1,087 463 297 166 1,758 2022 906 174 732 212 139 73 1,118 2023 1,046 186 860 255 176 79 1,301 Year Number of employees trained Gender Number of community members trained Gender Total number trained Female Male Female Male 4.6 EMPOWERING OUR WORKFORCE continued IR - 162

LABOUR RELATIONS ––––––––––––––––––––––––––––––––––––––––––––––––––––––––––––––––––––––––––––––––––––––––––––––––––––––––––––––––––––––––––––––––––––––– We endorse UN SDG 8.8 (Protect labour rights and promote safe and secure working environments of all workers, including migrant workers, particularly women migrants, and those in precarious employment.) 8.8 All employees are subject to vetting procedures, including the verification of age, criminal record, and medical fitness. We support collective bargaining and freedom of association, and we comply with all national labour legislation applicable to each region. Union representation at SA region (2023)1 Services and otherGold PGMs Total Membership 20,255 31,715 1,804 53,774 Representation (%) 94 % 87 % 69 % 88 % 1 Including Corporate office In 2023, 88% (2022: 87.9%) of the total permanent workforce at our SA operations were represented by four recognised unions: Association of mineworkers and construction union (AMCU), National union of mineworkers (NUM), Solidarity and United association of South Africa (UASA). On average 99% of our SA employees are covered by collective bargaining units (category 4–9 up to official level). Given the challenges of union rivalry – we are committed to fostering a culture of multilateralism and tolerance. At our Rustenburg and Kroondal operations, AMCU and NUM co-exist. At Marikana, AMCU is the only recognised union at 72.73%. Our recognition agreements are formal joint commitments between the Group and the majority union setting out, inter alia, relationship rights, respect for freedom of association, bargaining rights, workings of shaft and full-time stewards, industrial action procedures, and dispute procedures. Our Human rights policy also stipulates that all employees have freedom of association and of movement as well as freedom to join, or to refrain from joining, labour organisations of their choice and collective bargaining without discrimination or retaliation. Our wage agreements provide more favourable conditions than SA labour- related legislation in terms of health coverage, sick leave, and wages. We also provide additional rights to full-time shop stewards as defined in our recognition agreements. At our US region, a total of 73% (2022: 73%) of employees are members of the United Steel Workers International Union (USW). Labour relations in the US PGM operations continue to be constructive. SA region: Membership by union1 2023 2022 2021 Total Gold PGMs Services and other Total Gold PGMs Services and other Total Gold PGMs Services and other Membership AMCU 33,577 9,499 23,933 145 34,854 10,852 23,831 171 36,434 11,808 24,428 198 NUM 14,995 8,691 5,203 1,101 15,443 9,131 5,122 1,190 16,927 10,889 4,552 1,486 UASA 4,272 1,692 2,173 407 4,646 2,122 2,064 460 3,212 852 2,041 319 Solidarity 832 372 309 151 1,171 458 554 159 1,256 466 638 152 CEPPWAWU2 98 1 97 0 131 2 129 0 134 0 134 0 Non–unionised 7,126 1,387 4,941 798 7,730 1,956 5,060 714 6,071 1,083 4,376 612 Total 60,900 21,642 36,656 2,602 63,975 24,521 36,760 2,694 64,034 25,098 36,169 2,767 Membership representation (%) AMCU 55.1 43.9 65.3 5.6 54.5 44.3 64.8 6.3 56.9 47.0 67.5 7.2 NUM 24.6 40.2 14.2 42.3 24.1 37.2 13.9 44.2 26.4 43.4 12.6 53.7 UASA 7.0 7.8 5.9 15.6 7.3 8.7 5.6 17.1 5.0 3.4 5.6 11.5 Solidarity 1.4 1.7 0.8 5.8 1.8 1.9 1.5 5.9 2.0 1.9 1.8 5.5 CEPPWAWU 0.2 0.0 0.3 0.0 0.2 — 0.4 — 0.2 — 0.4 — Non–unionised 11.7 6.4 13.5 30.7 12.1 8.0 13.8 26.5 9.5 4.3 12.1 22.1 Total 100.0 100.0 100.0 100.0 100.0 100.0 100.0 100.0 100.0 100.0 100.0 100.0 1 Including Corporate 2 Chemical, energy, paper, printing, wool and allied workers union (CEPPWAWU) Union representation at US region in 2023 Total Stillwater (including Blitz) Columbus metallurgical complex East Boulder Administrative support staff United Steel Workers (USW) 1,293 799 137 357 0 Non-unionised 476 211 48 107 110 EMPOWERING OUR WORKFORCE continued IR - 163
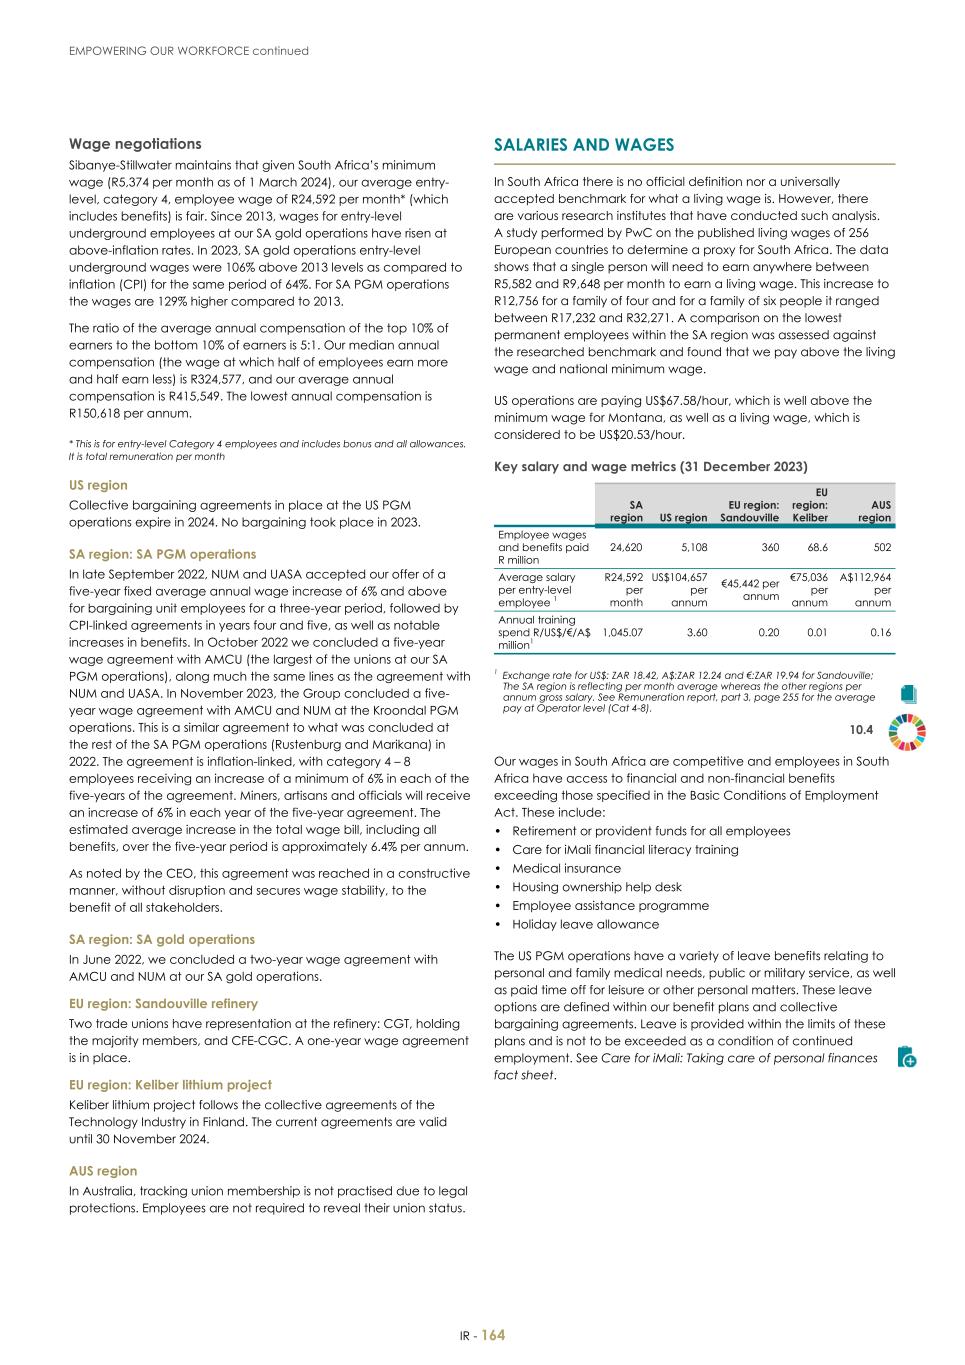
Wage negotiations Sibanye-Stillwater maintains that given South Africa’s minimum wage (R5,374 per month as of 1 March 2024), our average entry- level, category 4, employee wage of R24,592 per month* (which includes benefits) is fair. Since 2013, wages for entry-level underground employees at our SA gold operations have risen at above-inflation rates. In 2023, SA gold operations entry-level underground wages were 106% above 2013 levels as compared to inflation (CPI) for the same period of 64%. For SA PGM operations the wages are 129% higher compared to 2013. The ratio of the average annual compensation of the top 10% of earners to the bottom 10% of earners is 5:1. Our median annual compensation (the wage at which half of employees earn more and half earn less) is R324,577, and our average annual compensation is R415,549. The lowest annual compensation is R150,618 per annum. * This is for entry-level Category 4 employees and includes bonus and all allowances. It is total remuneration per month US region Collective bargaining agreements in place at the US PGM operations expire in 2024. No bargaining took place in 2023. SA region: SA PGM operations In late September 2022, NUM and UASA accepted our offer of a five-year fixed average annual wage increase of 6% and above for bargaining unit employees for a three-year period, followed by CPI-linked agreements in years four and five, as well as notable increases in benefits. In October 2022 we concluded a five-year wage agreement with AMCU (the largest of the unions at our SA PGM operations), along much the same lines as the agreement with NUM and UASA. In November 2023, the Group concluded a five- year wage agreement with AMCU and NUM at the Kroondal PGM operations. This is a similar agreement to what was concluded at the rest of the SA PGM operations (Rustenburg and Marikana) in 2022. The agreement is inflation-linked, with category 4 – 8 employees receiving an increase of a minimum of 6% in each of the five-years of the agreement. Miners, artisans and officials will receive an increase of 6% in each year of the five-year agreement. The estimated average increase in the total wage bill, including all benefits, over the five-year period is approximately 6.4% per annum. As noted by the CEO, this agreement was reached in a constructive manner, without disruption and secures wage stability, to the benefit of all stakeholders. SA region: SA gold operations In June 2022, we concluded a two-year wage agreement with AMCU and NUM at our SA gold operations. EU region: Sandouville refinery Two trade unions have representation at the refinery: CGT, holding the majority members, and CFE-CGC. A one-year wage agreement is in place. EU region: Keliber lithium project Keliber lithium project follows the collective agreements of the Technology Industry in Finland. The current agreements are valid until 30 November 2024. AUS region In Australia, tracking union membership is not practised due to legal protections. Employees are not required to reveal their union status. SALARIES AND WAGES –––––––––––––––––––––––––––––––––––––––––––––––––––––––––––––––––– In South Africa there is no official definition nor a universally accepted benchmark for what a living wage is. However, there are various research institutes that have conducted such analysis. A study performed by PwC on the published living wages of 256 European countries to determine a proxy for South Africa. The data shows that a single person will need to earn anywhere between R5,582 and R9,648 per month to earn a living wage. This increase to R12,756 for a family of four and for a family of six people it ranged between R17,232 and R32,271. A comparison on the lowest permanent employees within the SA region was assessed against the researched benchmark and found that we pay above the living wage and national minimum wage. US operations are paying US$67.58/hour, which is well above the minimum wage for Montana, as well as a living wage, which is considered to be US$20.53/hour. Key salary and wage metrics (31 December 2023) SA region US region EU region: Sandouville EU region: Keliber AUS region Employee wages and benefits paid R million 24,620 5,108 360 68.6 502 Average salary per entry-level employee 1 R24,592 per month US$104,657 per annum €45,442 per annum €75,036 per annum A$112,964 per annum Annual training spend R/US$/€/A$ million1 1,045.07 3.60 0.20 0.01 0.16 1 Exchange rate for US$: ZAR 18.42, A$:ZAR 12.24 and €:ZAR 19.94 for Sandouville; The SA region is reflecting per month average whereas the other regions per annum gross salary. See Remuneration report, part 3, page 255 for the average pay at Operator level (Cat 4-8). 10.4 Our wages in South Africa are competitive and employees in South Africa have access to financial and non-financial benefits exceeding those specified in the Basic Conditions of Employment Act. These include: • Retirement or provident funds for all employees • Care for iMali financial literacy training • Medical insurance • Housing ownership help desk • Employee assistance programme • Holiday leave allowance The US PGM operations have a variety of leave benefits relating to personal and family medical needs, public or military service, as well as paid time off for leisure or other personal matters. These leave options are defined within our benefit plans and collective bargaining agreements. Leave is provided within the limits of these plans and is not to be exceeded as a condition of continued employment. See Care for iMali: Taking care of personal finances fact sheet. EMPOWERING OUR WORKFORCE continued IR - 164

Employee share ownership programme (ESOP) The purpose of ESOPs is to create shared value for employees, in keeping with our vision to be a leader in superior shared value for all stakeholders. We have three main ESOP schemes: Lonplats ESOP, Rustenburg Mines Employee Trust, and the Thusano Share Trust. Thusano Trust The Thusano Trust is for employees at our SA gold operations. The vesting period of the Trust is 2027. Thusano holds 19,233,755 Sibanye-Stillwater shares for its 40,007 participants. In 2023, beneficiaries were paid out R27 million (R50 million in 2022). Rustenburg Mines Employee Trust When Sibanye-Stillwater acquired the Rustenburg operations in 2016, we concluded a broad-based black economic empowerment (B-BBEE) transaction whereby 26% of the Rustenburg entity is held jointly by four parties: the Rustenburg Mines Community Development Trust (24.8% share), the Rustenburg Mine Employees Trust (30.4%), Bakgatla-ba-Kgafela Investment Holdings (24.8%), and Siyanda Resources (20%). The Rustenburg Mines Employee Trust has 12,144 beneficiaries. The net dividend paid to the Trust which is distributed to all qualifying persons was R163 million (R98 million of net dividend in 2022) in total dividends in 2023. This meant that each beneficiary received R13,431 (2022: R6,460). Lonplats ESOP This ESOP was founded by Lonmin and taken over by Sibanye- Stillwater when we bought Lonmin. The scheme offers employees (mainly those at Marikana) a direct stake in the Group’s profits. In 2023 Lonplats ESOP paid out a total R121 million (2022: R689 million) to 15,727 beneficiaries. Other regions There is no share ownership programme equivalent at our US, EU and AUS regions. Employee indebtedness Financial over-indebtedness is a burden for many at our SA operations. Sibanye-Stillwater offers a financial literacy and personal debt management programme, Care for iMali, to help alleviate financial stress. See Care for iMali: Taking care of personal finances fact sheet, www.sibanyestillwater.com/news-investors/reports/annual/ HOUSING AND LIVING CONDITIONS –––––––––––––––––––––––––––––––––––––––––––––––––––––––––––––––––– This section mostly focuses on South Africa, given that employee housing and living conditions is not a major challenge at our other areas of operation. In the US region, operations provide basic housing accommodation at a minimal cost to employees who maintain primary residences beyond ordinary daily commuting distances. In the AUS region, Fly In Fly out and remote locations operations provide accommodation at no cost to employees. SA region Sibanye-Stillwater recognises that housing and living conditions within the South African mining industry plays a vital role in the overall wellbeing and dignity of our employees and forms a key cornerstone of social cohesion within the broader community. Our Housing and socioeconomic Strategy (formulated and adopted in 2022) resonates this as a key workforce enabler, but so too as a critical means to be a force for good within the host communities within which we operate across the SA region. Our housing and living conditions framework is guided by the basic rights as set out in the Constitution of South Africa, 1996 (Act No. 108 of 1996) as well as various other legislative imperatives including the Housing and Living Conditions Standards as per the Mineral and Petroleum Resources Development Act, (No. 28 of 2002). Our employee accommodation is spread across multiple provinces, districts and municipalities in South Africa and thus requires strategic alignment for us to remain in line with the various authorities and their overarching plans/objectives, especially from a spatial planning and development perspective. It is important for Sibanye-Stillwater to understand and abide by the mandate of local government and the respective authorities to enable housing and socioeconomic improvement as it informs the stakeholder engagement and potential partnership arrangements. All municipalities in the areas in which we operate are nationally prioritised for the Revitalisation of Distressed Mining Communities Intervention, also referred to as the Mining Towns in Distress Programme. Only the Rustenburg Local Municipality is an accredited housing authority, however, its accreditation is not operational. The implication is that the rightful authorities for human settlements in all areas remains with the respective provincial departments. Municipalities are therefore administrative and not adequately resource because it is not a mandated function. The same applies to the local economic development (LED) function. The LED Departments’ function on municipal level is to facilitate local economic development. They therefore do not allocate budget for local economic investment, but only to resource the facilitation function. There are Economic Development Agencies in the respective municipalities, with a role to implement key economic projects. During 2023 we continued a fine balance between sustaining our accommodation assets in SA gold with a succinct and deliberate objective of ensuring our employees gain maximum exposure to the home ownership arena, in line with our operational footprint as well as life-of-mine. At SA PGM we continued our housing and living conditions delivery aligned with our longer-life operational footprint and life-of-mine. We have a similar delivery model as SA gold (sustain and driving home ownership) with the addition of supplementary investment (opex, capex and social) to enhance the current and future living conditions for our employees and nearby host communities. EMPOWERING OUR WORKFORCE continued IR - 165

Housing footprint During 2023, the SA region owned and maintained a total of 17,914 accommodation units. These units provide accommodation for approximately 30% of our SA region’s workforce, which is in line with our employee needs (Employee housing survey, 2021) given that not all employees wish to own a home at place of work and rather prefer Sibanye-Stillwater provided accommodation. The graph below depicts an overview of the available Sibanye-Stillwater- owned accommodation as at the end of 2023. SA REGION ACCOMMODATION 7667 10247 Single accommodation Family accommodation 0 5000 10000 15000 To enable such vast capacities in Sibanye-Stillwater provided accommodation, we run a rigorous and relentless maintenance regime to ensure that our accommodation remains to the required standards. We have spent approximately R565 million (in 2023) on maintenance and ensuring we keep our accommodation assets in good condition aligned to our life-of-mine plans. From a procurement perspective, our maintenance is earmarked as a ringfenced commodity and remained mindful of employment opportunities for our local communities. Alongside decent living conditions, we recognise the role that healthy nutrition plays in enabling a productive workforce. Our total spend on nutrition was R272 million. All meals provided at our on- mine kitchens are prepared fresh every day and is in line with the recommended daily intakes as guided by a professional nutritionist. Living conditions and Home ownership Our employee housing survey (2021) has indicated that of our employees living in private accommodation, there are still some employees who live in informal conditions – some 24.7% in SA PGM and 4.2% in SA gold operations. This remains a significant risk to our employees and a focus area for future intervention. There seem to be a direct correlation between affordability and creditworthiness challenges when it comes to employee housing decisions. A previous survey done to better understand affordability and homeownership has indicated that only 29% of employees interested in home ownership (98% in affirmative) can transact. The remaining 71% seem to have either affordability or creditworthiness challenges or in some cases both. It is with this in mind that we have a considered approach in our Housing and socioeconomic strategy to assist employees to address and overcome this challenge. We have therefore formulated our future housing delivery such that we no longer invest in un-proclaimed areas, but rather seek to provide and stimulate affordable housing for our employees in areas that has value and future long-term benefit. In addition, we have considered options that enables affordability (through cross subsidisation) and creditworthiness (through our Care for iMali programme) to rehabilitate indebted employees and also assist with better financial planning and management. (See our Care for iMali: Taking care of personal finance fact sheet). Positively our housing survey (2021) indicated that around 51% of our employees own a house either by means of title deed or permission to occupy (PTO). The graph below shows the split in terms of investment at place of work vs. at place of origin. OVERVIEW OF EXISTING HOME OWNERSHIP 21% 30% Place of origin Place of work To date our home ownership programme has been substantially successful with approximately 2,083 houses sold since its inception in 2015. This equates to an average of 260 new home owners annually. Our success in this programme can largely be ascribed to the model that we deployed, being a standard 20% discount (as per the property valuation) with another 1% discount for each year of consecutive service with the firm. This programme has indeed enabled our employees not only to invest in the property market, but in so doing, derive potential future value and dignity as part of their family legacy. 11.3 For the 2023 reporting period, at SA gold our objective has been to maintain housing stock and sell properties in proclaimed areas to our employees at the mentioned discount rate. By executing the house sales strategy, 174 properties were sold during 2023 benefitting our employees. This is in line with our footprint reduction programme and closure plans in the Driefontein area. At SA PGM, we have concluded 198 successful home ownership transactions. Interest in this programme remains high and we continue to drive this programme actively across our operations and ensure we enable a seamless process via our employee home ownership help desks established to assist and facilitate the entire home ownership process. After a lengthy legal process, we have received an outcome to evict illegal occupants, in collaboration with the relevant authorities, in a responsible manner and also restore the dignity of our employees who have been eagerly awaiting an outcome in order for them to conclude their home ownership transactions and take possession of these properties as the rightful owners. Progress at Marikana Infill apartments During 2023 we have demolished three blocks, due to structural deformities at our Wonderkop infill apartments, at a cost of approximately R12 million as it was not feasible to attempt to underpin these structures. As for the remaining blocks in Wonderkop infill apartments we continue to monitor and survey to ensure that we provide decent and safe accommodation to our employees. EMPOWERING OUR WORKFORCE continued IR - 166

Partnerships We have previously reported on our intent to partner with government related to two critical projects, Marikana Ext.13 and the formalisation of Nkaneng informal settlements. Although we have had several engagements with different spheres of government, unfortunately we have not been able to conclude a formal partnership pertaining to these initiatives. That said, we continue to deliver on our commitments to provide technical support and capacity building to the regional municipalities. We have made available some 253ha land owned by us (with an approximate value of R3.8 million) in the vicinity of the proposed township establishment (Marikana Ext.13), which has not yet been formally accepted by the local authority as donation. We continue to engage and remain steadfast in our offering of available land to supplement this human settlement development without transferring any future liability to the municipality. With regards to Nkaneng, our contributions to government - towards the first phase of formalisation – is nearing completion and we have successfully tendered and adjudicated the final scope of work (upgrading of roads, additional water tanks and beautification of the main entrance road) which will conclude our overall contributions towards the formalisation process at approximately R32 million. We remain hopeful that the remaining phases of the formalisation process will be undertaken by government. Improving Living Conditions Our generation three social labour plan housing related delivery has progressed well during 2023 and we continue to deliver a host of projects benefiting our employees and local communities. These include the following: • Mooinooi municipal services upgrades (reservoir expansion, sewer, storm water, mini-subs, street lights, road repairs) at approximately R25 million • Recreational area enhancements (soccer field, bus stop, walkways, shops, community hall, crèche) at approximately R14 million • Security upgrades at residences (perimeter fencing and consolidation of entrances) at approximately R40 million • Renovation of 368 stand-alone houses at Karee residence at approximately R22 million • Additional seven 128m2 houses for the widows as part of the Marikana renewal programme approximately R8 million. Also see our leverage of land section on page 218. Strategic Approach – Future Housing Sibanye-Stillwater has set out the following aspirational vision related to our integrated housing and living conditions approach: To systematically transform Sibanye-Stillwater’s land and housing assets as enablers of a diversified sustainable economy and social improvement (force for good) around our operations. Due to the spatial distribution of the Sibanye-Stillwater operations and the complexity of the mines’ operating environment, several status quo investigations were undertaken as foundation for the strategy. The various considerations and interdependencies evaluated for the purpose of this process is illustrated below. EMPOWERING OUR WORKFORCE continued IR - 167 Factors considered to develop the housing strategy

It is critical to note from the above depiction that an integrated approach will be required to deliver on the aspirational vision as set out. None of the above considerations can be dealt with in isolation, thus the interdependent nature of our strategic interventions going forward remains important. The overall strategy can be summarised as follows: As part of the strategic principles, the following high-level considerations are put forward: • Socioeconomic improvement: Leverage available land (and existing infrastructure where applicable) for sustainable socioeconomic projects i.e., fully integrated value chain agri-projects • Incentivise home ownership: Ongoing facilitate home ownership by selling existing stock at discounted prices, subsidise new development to increase affordability and leverage housing strategically as retention mechanism • Integration: An intentional approach in deliver integrated housing solutions that includes social amenities • Decent and safe housing options: Set a standard for housing and related infrastructure that meets the government’s minimum standards, is affordable and introduces green technologies in secure complexes • Enduring value-creation: Continue to provide decent housing and living conditions for employees residing in on-mine accommodation and shift home ownership to a delivery model that eliminates or reduces “holding cost” or total cost of ownership i.e. sell off plan in new developments As for the strategic imperatives, the following high-level perspectives are being considered in our approach: • Collaboration: Seek potential and willing partnerships and leverage available land near major nodes for future housing delivery • Socioeconomic improvement: Leverage available land (and existing infrastructure where applicable) for sustainable socioeconomic improvement i.e. fully integrated value chain agri-projects. Further detail is provided on page 218. • Footprint reduction: Maintain existing on-mine accommodation in line with life-of-mine and reduce footprint where applicable with post mining in mind. Sell of housing stock as part of home ownership with minimum stock available for scarce and critical skills. • Securing assets: Secure property assets that provides accommodation for employees especially those originating from neighbouring countries and labour sending areas not interested in home ownership at place of work. • Compliance: Continue to provide decent housing and living conditions for employees residing in on-mine accommodation and shift home ownership to a delivery model that eliminates or reduces “holding cost” or total cost of ownership. • Sustainability: Eliminate any new projects in un-proclaimed areas. Leverage available bulk services as well as contribution towards bulk services and introduce subsidised housing sold of plan – affordability unlocked by subsidising bulk services, thus reducing price of top structures. These strategic principles and imperatives provide some insight into the new strategic approach and direction related to future housing. We will continue to explore ways to improve our housing and living conditions offerings to our employees as enablers and leverage available capacity capabilities. EMPOWERING OUR WORKFORCE continued IR - 168 The housing strategy for SA region To systematically transform Sibanye-Stillwater’s land and housing assets as enablers of a diversified sustainable economy and social improvement (force for good) around our operations

SA region: housing and accommodation Number of employees living in Single accommodation complexes (mine employees) 7,667 1,611 6,056 8,129 8,479 Family accommodation (houses and on-mine residence) 10,247 5,761 4,486 10,076 10,191 Private/other (balance of total workforce) 40,379 29,279 11,100 43,076 41,703 Number of company-owned houses sold Total 372 198 174 306 284 Employees 372 198 174 300 267 Private 0 0 0 6 17 Number of company-owned houses sold since programme inception (2015): cumulative total Total 2,083 558 1,525 1,711 1,405 Employees 1,735 546 1,189 1,363 1,063 Private 348 12 336 348 342 Number of houses built during the year 19 19 0 5 0 Number of houses built since programme inception (2015) 76 24 52 57 52 Spend on accommodation maintenance/renovations1 (Rm) Family 382 276 106 298 209 Single 183 87 96 181 178 Spend on accommodation maintenance/renovations (excluding labour costs) (Rm) Family 1 183 152 31 153 107 Single 70 48 22 84 84 2023 2022 2021 Total SA PGMs Gold Total SA Total SA 1 The cost of accommodation, maintenance and renovation is comprehensive (not only painting). Spend on maintenance and renovation of single accommodation has decreased year-on-year as a result of planned closure of some of the units at Beatrix 11.3 CARING FOR INJURED EMPLOYEES AND THEIR DEPENDANTS ––––––––––––––––––––––––––––––––––––––––––––––––––––––––––––––––––––––––––––––––––––––––––––––––––––––––––––––––––––––––––––––––––––––– We provide psychological and financial support to the dependants of injured and deceased employees. The Matshediso programme (SA gold operations), Lonmin Memorial Fund (SA PGM operations) and the Sixteen-Eight Memorial Trust (SA PGM Marikana operations), provide financial assistance to the families and dependants of employees who are severely disabled or fatally injured in mine accidents. Funeral assistance such as transport, accommodation and support to memorial services are provided. Matshediso programme Sibanye-Stillwater supported 137 Matshediso dependants at the SA gold operations in 2023 at a total cost of R1,599,765. In addition, 100 families of employees fatally injured or disabled. A total of 17 beneficiaries of RPM and Kroondal from the SA PGM operations benefited from the Matshediso programme, at a total cost of R190,000. Benefit 2023 2022 Host schools R12,500 (primary); R17,500 (secondary) R12,500 (primary); R17,500 (secondary) Boarding schools R30,000 R30,000 Uniform, stationery, text books and transport R2,500 (primary) and R3,500 (secondary) Primary R2,500 and secondary school R3,500 Extra classes at host schools R2,500 extra mural activities, R2,000 transport, R1,000 school trips, R2,500 career counselling, R5,550 from boarding school to home, extra classes R2,500 (primary) and R3,000 (secondary) R2,500 extra mural activities , R2,000 transport, R1,000 school trips, R2,500 career counselling, R5,500 from boarding school to home, R2,500 primary and R3,000 secondary school Christmas voucher or hamper R1,500 per family R1500 per family Total amount paid to beneficiaries R1.60 million R1.58 million Homes for disabled employees We undertake homebuilding and modification for some disabled employees injured in workplace accidents; modifications include connecting to water supply or installing water tanks if necessary, widening doorways, building ramps and pathways, making bathrooms and toilets wheelchair-friendly. EMPOWERING OUR WORKFORCE continued IR - 169

In 2023 at SA PGM, we have constructed 12 houses for nominated beneficiaries relating to colleagues that sadly passed as a result of mine fatalities. For 2024, we are planning to construct a further 8 houses for remaining beneficiaries. The houses constructed is 128m2 and is either connected to available municipal services or alternatively caters for off-grid functioning. Similarly in SA gold, we built three houses for employees killed or injured in a mine accident. The 56m² brick houses include ceramic tiling, PVC ceilings, and two 5,000l water tanks. A total of 19 widows or beneficiaries at the SA gold operations and 12 from SA PGM benefited during 2023 from the home adaptation programme; a further 28 from the SA gold and 8 from the SA PGM operations are on the list for home renovations/adaptations. Lonmin Memorial Fund Through the Lonmin Memorial Fund, Sibanye-Stillwater supported 84 dependants in 2023 at a total cost of 4.4 million. 39 of these dependants completed their final year of school in 2023 with nineteen at tertiary level. Sixteen-Eight Memorial Trust Sibanye-Stillwater, through the Sixteen-Eight Memorial Trust, continues supporting 139 beneficiaries, providing psychosocial support and educational assistance in the form of paying for school fees, uniform, stationery, textbooks, excursions, transport, tertiary tuition fees, accommodation allowances and meal allowances. As of 2023, 38 beneficiaries are at tertiary level of education, with 14 graduated and 8 have joined the company as interns in experiential training programme. See www.sibanyestillwater.com/features/marikana-commemoration 11.3 FUTURE FOCUS ––––––––––––––––––––––––––––––––––––––––––––––––––––––––––––––––––––––––––––––––––––––––––––––––––––––––––––––––––––––––––––––––––––––– AUS REGION • Focus on retention initiatives to reduce turnover and retain key people in critical roles, such as: – Review of (legacy) Employee Value Proposition to align with Group Employee value proposition – Sibanye-Stillwater Leadership programs (ADI/ELD) introduction and rollout in 2024/25 to identified leaders • Continue with the AUS region’s integration into Group: – Aligning policies and practices – Rollout of Sibanye Values to operations – Relaunch of STI Program (updated to align with Group STI approach) • Integration of Mt Lyell into AUS region and broader Group • Launch of the indigenous traineeship program at the Century operations EU REGION • Continue to embed Sibanye-Stillwater culture, values in our operations • Translate Group policies into Europe context • Complete succession plan for senior positions • Roll out leadership program aligned with Group SA REGION • Optimise labour costs through footprint reduction • Retention for key talent and critical skills • Shared value for employees through ESOP scheme • Holistic employee wellness • Amalgamation of medical schemes for SA PGM operations • Concluding the wage agreement for the SA gold operations US REGION • Increase employee interactions with at least every 90-day check-ins and increase communication to employees through push notifications and profiling of employees • Optimise workforce and talent planning • Adequate planning and conclude the collective bargaining agreements • Develop and launch a formal wellness programme • Progress the women and allies programme GROUP • Review and define HR strategy for regions aligned to operating model • Progressing diversity,equity,inclusion and belonging • Deliver value through HR service delivery model, establish HR capabilities and remeasure the group culture and values EMPOWERING OUR WORKFORCE continued IR - 170

HARNESSING INNOVATION Technology, digital and innovation are key enablers for our strategy WHAT WE DID IN 2023 SUCCESSES • Leadership taking active ownership and promoting our culture of innovation • Continued investment in research and development (R&D) and our innovation ecosystem • Scaling our digital delivery capability and realising tangible value through digital enablement • Substantial benefits through our IME pilot projects, and a 3-year roll-out plan in place • Introduction of various technology solutions to improve safety and enhance efficiency CHALLENGES • Embedding change and driving sustainable long-term impact • Challenging economic environment placing a damper on R&D spend • Focus on core business delivery leaves limited time for transformation ALIGNMENT WITH SDGs 9, 16 MATERIAL MATTER M12 Innovation and digital evolution INNOVATION, DIGITAL TRANSFORMATION, AND TECHNOLOGY DEVELOPMENT AND ADOPTION ––––––––––––––––––––––––––––––––––––––––––––––––––––––––––––––––––––––––––––––––––––––––––––––––––––––––––––––––––––––––––––––––––––––– Innovation Innovation is one of our core values, as we seek to embed an innovative culture within the Group and to adopt digital and technological advances that improve the way we operate, in terms of safety, profit and sustainability. Three portfolios, with distinct aims, report into the Chief Technical and Innovation Officer (CTIO), a C-suite role: • Innovation: embedding a Group culture of innovation • Digital transformation: deploying digital as an enabler of strategic objectives • Technology: promoting industry leading technology in support of our strategic objectives In 2023, we spent R87.8 million (US$4.8 million) (2022: R125 million/ US$7.6 million, 2021: R55 million/ US$4 million) on strategic innovation, digital transformation and technology initiatives, of which R13 million (US$0.7 million) was distributed via the BioniCCube capital allocation mechanism (R72.6 million/US$4.4 million in 2022). See www.sibanyestillwater.com/business/innovation-technology With innovation as one of our values and defined as: “We intentionally find new ways to do things better” this definition is supported by five behaviours: • We will all understand the need to innovate • We will invite everyone to innovate • We will encourage innovation • We will develop innovators • We will recognise innovation 9.5 HARNESSING INNOVATION IR - 171

Leadership promotes a culture of innovation In H1 2023, we ran an extensive process of engagement to co- develop our organisation’s innovation purpose and vision. Perspectives and opinions from our senior leaders were included in the process, which resulted in the following outcomes: • Purpose: to intentionally find new ways to enable competitiveness, ensure future relevance and growth, and sustainably improve lives • Vision: to embed a culture of innovation, in which our entire organisation is enabled and empowered to find new ways to create superior shared value • Focus: to pursue incremental and transformational innovation across the full spectrum of our three-dimensional strategy in recognition of the mutually beneficial outcomes In H2 2023 we broadened our audience and worked with our functional and regional teams to develop more specific innovation ambitions and strategies, relevant to their respective objectives and contexts. As a final step, these teams developed team challenges linked to our innovation purpose and vision. The challenges are multifaceted and designed to allow diverse contributions from all levels and disciplines within the organisation. The ambitions, strategies and challenges will be shared with the broader organisation in the next phase of our programme. The culmination of this process is a series of functional and regional innovation storylines, a base with which we can begin to create shared understanding for innovation. The primary objective of this process is to connect every employee to our broader innovation purpose, include them in our innovation journey, and ensure that all employees understand our need to innovate. Leadership is taking an active interest in and ownership of innovation (evidenced by the time and focus they are investing in the programme). In 2024, we will further embed a culture of innovation through a structured programme based on the storylines developed in 2023. We will use these storylines to create a shared understanding for the need to innovate, after which we’ll invite our organisation to participate by responding to the challenges. Concurrently, we are investigating and experimenting with effective ways to encourage innovation, to develop innovators, and to recognise innovation. Strategic innovation initiatives DigiMine, Simulacrum and MMP We continue to support multiple external research, development and innovation partnerships and programmes. We fund the Digimine initiative in partnership with the University of the Witwatersrand (Wits), and the Simulacrum initiative in partnership with the University of Johannesburg (UJ). In the nine years of partnership, both universities have established state-of-the- art facilities that allow us to research digital technologies and to train graduate professionals in the “mine of the future.” To date we have invested R120 million in these partnerships and have renewed our funding agreements for both universities for the period 2024-2026, totalling a further R25.5 million. Sibanye-Stillwater remains an active participant in the Mandela Mining Precinct (MMP), a public-private partnership involving government and several other mining companies. It is facilitated by the Minerals Council of South Africa and by the Department of Science and Industry. In 2023, the MMP initiated two new programmes at Wits (Real Time Information Management Systems, (RTIMS), and the Successful Adoption of Technology Centred Around People, (SATCAP)), and one at UJ (the Longevity of Current mining initiative). We are proud to be part of these initiatives, creating shared value through research and development. iXS initiative Innovate, accelerate and scale In 2023, as part of our iXS initiative, we continued to support innovators and entrepreneurs with novel mining-related technologies. This initiative supports startups that are developing technologies to solve mining-related challenges. We help them commercialise their offering and to apply it globally. In 2023 we established a cohort of entrepreneurs and innovators in residence who helped manage our investment programme and developed novel solutions to industry issues. The popularity of our iXS investment programme is evidenced by the fact that we saw a 480% increase in applications for funding in 2023. In the two years of operation, the iXS initiative has screened 468 opportunities, of which 57 opportunities progressed to detailed consideration, and 21 were submitted for expert review. A total of nine investment opportunities were structured and assessed in detail, of which three satisfied our investment criteria and were successfully funded. In 2024, we intend to do a comprehensive review of our innovation initiatives and partnerships with the intent to consolidate our innovation ecosystem and optimise our investments. HARNESSING INNOVATION continued IR - 172

Digital transformation In 2023 we continued executing on our model for digital transformation (see below). In 2023, significant emphasis was placed on developing and embedding the eight “digital transformation enablers” (see model above). Most of these enablers are now operational and ongoing. In the year under review we evaluated different cloud platforms and selected Amazon Web Services (AWS) as the best technology fit to enable the “intelligent core”. The “intelligent core” is aimed at unlocking value through data, analytics and artificial intelligence. We launched a number of technology architecture initiatives, focusing on: • Operational technology architecture • Industrial connectivity • Modernisation and long-term sustainability of key operations- and execution management systems During H2 2023 we launched a number of campaigns as part of “people activation” to promote digital awareness and enhance digital fluency. Strategic digital initiatives Enhanced metallurgical process management and automation The base metal refinery in the SA region experimented with machine learning to optimise process variables and improve plant effectiveness. There are various opportunities for the Group to scale the capabilities we’ve applied here across the metallurgical value chain. Load curtailment optimisation and blackout scenario modelling The SA region developed advanced analytical models and digital twins to: optimise our response to load curtailment, and mitigate the risk of flooding in the unlikely event of a national blackout. Our load curtailment optimisation model uses machine learning to provide prescriptive insights (optimal decision-making through data analysis). This resulted in a reduction in the financial impact of load curtailment to the order of R308 million during 2023 versus the 2022 period. HARNESSING INNOVATION continued IR - 173

Generative artificial intelligence (GAI) We conducted experimental work with GAI and identified opportunities to scale in 2024. The Group recognises the risks associated with AI and is committed to using it in a responsible way. Portfolio of digital opportunities As part of our broader innovation ambition, we launched the “Digital transformation challenge”, an initiative to gather and manage ideas for digital innovation. The pipeline of ideas is growing and various projects are at different stages of execution. Enterprise architecture (EA) We invested in developing our global enterprise architecture (EA) capability, aimed at both IT and operational technology(OT). EA is about finding simplicity in complexity to understand how business and technology combine, and further enables us to enhance operational efficiency, reduce costs, and elevate overall performance. Technology development and adoption Strategic technology initiatives Integrated mining enterprise A digitally integrated mining enterprise (IME) is one in which interrelated technical and non-technical aspects of mining are digitally integrated. At the outset in 2022 our IME pilot projects at Saffy (Marikana) and Thembelani (Rustenburg) shafts (SA PGM) gave line management the digital tools (accessible through the IME platform) to better manage productivity. The first phase of the process has now been completed at Marikana’s Saffy Shaft and Rustenburg’s Thembelani Shaft with substantial benefits being noted in spatial compliance of mine planning. Implementation of the first phase is ongoing at Marikana’s K3 and K4 shafts, with added emphasis on change management to address pre- and post-implementation challenges. Battery-electric and semiautonomous vehicles Remotely operated battery-electric LHD at the Bathopele operation at SA PGM The remotely operated battery electric load haul dump (LHD) has shown promising results within acceptable learning challenges. The proof of value has indicated the significant potential inherent in battery-electric vehicles by exceeding the current operational benchmarks of the diesel equivalent. We are committed to the further integration of battery electric vehicles as part of our fleet replacement strategies, and in new mines where appropriate given the numerous operational, safety and occupational hygiene benefits that have become clearly evident as we gain a deeper understanding of full life-cycle carbon emission reductions and ventilation requirements associated with battery electric vehicles. Modernised mining methods We are seeing promising results with modernised long-hole drilling solutions at our US operations. Initial benefits being realised include increased effectiveness, greater productivity per drill rig, and early indications of reduced costs for this specific mining method. Safe technology development We continue to develop and introduce new technologies across the group that will enable safer working environments. Throughout the year, considerable focus was applied to research and development aimed at further enhancing several successful technology interventions that have been implemented across the group, including: • Further development of lamproom management and personnel tag-based solutions with a focus on integrating disparate technologies to enhance functionality as well as data generation, consolidation, and analysis • Successful concept testing of a proximity detection solution for our winch signalling systems that enables automatic intervention beyond signalling if an unsafe condition arises • Several development initiatives aimed at the extraction, consolidation, and analysis of vehicle telemetry and driver behaviour data for TMMs that will enable proactive responses to adverse behaviours and events • Further development and testing of personnel tracking in the underground environment to improve our ability to understand an employee’s last known location prior to the use of personnel locating by handheld scanner • The introduction of mobile devices that optimise and improve the quality of safety audits, inspections, and reporting For more on innovation and technology as it relate to safety, please refer to page 130 of this report. Future focus In the near term: • Further embed a culture of innovation • Develop an innovation recognition framework for the Group • Review our innovation ecosystem to optimise our investment • Expand our focus from digital transformation to full realisation of our bionic ambition • Increasingly shift our digital transformation focus to value realisation • Identify further opportunities for artificial intelligence in the augmentation and optimisation of business activities • Focus on increasing the level of digital fluency throughout the organisation • Further enhance industrial connectivity throughout our operations to drive more real-time digital capabilities • Scale and further roll-out of IME across the remaining shafts, over a three-year period • Continue proof of value and pilot projects with emerging technologies HARNESSING INNOVATION continued IR - 174

INFORMATION AND COMMUNICATION TECHNOLOGY (ICT) ––––––––––––––––––––––––––––––––––––––––––––––––––––––––––––––––––––––––––––––––––––––––––––––––––––––––––––––––––––––––––––––––––––––– ICT strategy STRATEGIC PLAN Purpose Delivering secure, reliable and agile ICT services to Sibanye-Stillwater Key objectives Customer engagement Business unit delivery Innovation/hyper automation Project delivery Governance/security Ensure on-time/always-on ICT services and be the supplier of choice In support of the Group strategy and delivery, the effective deployment of ICT applications To learn and continuously innovate On-time, within cost and highly governed project delivery Management of a secure and resilient enterprise infrastructure Initiatives • Expand the Service Efficiency Centre (SEC) • Introduce chat bots to our global call centre • Central monitoring of ICT systems and applications • Adopt 24/7 operating model and implement the follow the sun strategy • Establish an agile ICT training function • Continuous optimisation • Reduce application footprint • Reduce cost baseline • Optimise licence structures • Optimise support structures globally • Ensure scalability • Establish global support operating model • ERP One consolidation for SA operations • Adopt fit-for-purpose hybrid cloud strategy • Expand datacentre footprint globally • Enable enterprise mobility • Continuously drive automation – hyper automation • Establish support structure for robotic process automation (RPA) • Introduce 5G LTE services • Introduce Starlink satellite networks • Compliance to project management framework • Project governance in all initiatives • All business ICT initiatives channelled through ICT project management office (PMO) • Introduce programme management framework • Digitise the ICT PMO function • Ensure ICT policies support strategy • Streamline ICT controls and align to business processes • Ensure high level of security architecture and control • Ensure high level of governance and compliance to regulatory requirements • ISO 27001 certification • Manage efficient data governance Key performance indicators • Customer experience • Increase productivity • Process efficiencies • Time/effort • Governance, risk and compliance • Financial management • Strategic delivery • % Increased efficiencies • % increased quality • Customer engagement • Delivery in scope/time • Financial management • Governance and compliance • Internal audit reports • Management of security control framework Update on ICT strategic projects for 2023 Data centre and footprint consolidation In 2023, we prioritised data centre consolidation for the SA region, completing the migration of Marikana and Hex River into Teraco. Similarly, we migrated the US region to the Billings Data Center (in Montana). Integration of jurisdictions Integration was an important theme for 2023. The aim is to fully integrate the Keliber lithium project and Century operations into the Group ICT operation model, which involves aligning standards, principles, and frameworks to that of the Group. Both projects are on track for completion in 2024. Office 365 We completed the rollout of Office 365, which is a key enabler to support our work-from-anywhere architecture. ISO 27001 certification In 2022, we addressed the gaps identified by PwC and implemented ISO 27001 (information security management system) for Corporate and Shared Services at our SA operations. We contracted a third party for ISO 27001 certification, in the last quarter of 2022. The formal ISO 27001 certification was obtained on 14 April 2023. The certification provides assurance around information security and the management of information security risks. Certification will be maintained and confirmed with an annual surveillance audit. In February 2024, Corporate and Shared Services at our SA operations had our inaugural surveillance audit on the ISO 27001:2013 standard an on our transition to the 2022 version. We have successfully transitioned to the ISO 27001:2022 standard and have met the requirements. We are currently assessing the benefits of implementing ISO 27001 for our regions (outside South Africa) and will forward recommendations. HARNESSING INNOVATION continued IR - 175

ERP SAP S4 Given that support for our current version of SAP enterprise resource planning (ERP) software is ending, we are on a journey to implement ERP SAP S4 by 2027. To this end, an ERP strategic roadmap was presented to the Group ICT committee. The budgeting, and the reporting and consolidation of the SAP S4 project will commence in early 2024. Service delivery In 2023, our service delivery teams managed 162,965 calls (149,000 in 2022) with a 96.53% SLA score (99.03% for 2022). In 2023, we also implemented a cloud based IT service management (ITSM) tool that covers our global footprint; with WhatsApp added as a functionality. We have an AI-driven ICT service desk, including Servicely (AI-powered service management) and Sofi (an AI chatbot). WeR1 and Ulwazi mobile app WeR1 is Sibanye-Stillwater’s digital employee engagement app. Currently 46,962 employees (57%) are registered on the platform, with 46% accessing WeAreOne via the mobile site; 44% use it through unstructured supplementary service data USSD (i.e., SMS) and the remaining 10% use it via the app. In 2023, we sent over 21 million SMS messages to keep employees aware of key updates and events across the organisation with a 2% decrease in active users from 2022. WeR1 also surpassed 0.5 million unique interactions. Ulwazi is Sibanye-Stillwater’s community engagement app that has been deployed across all SA communities within Sibanye-Stillwater’s operations. Initially, the platform was developed to deliver public participation process (PPP) requirements to ensure all stakeholders could access information and provide feedback and commentary as needed. The platform has subsequently taken on a broader community focus, bringing awareness to key topics such as community and environmental awareness (e.g., Marikana ten-year anniversary, tailings storage facility safety, public participation processes, job opportunities and vendor requirements. Members can access information at no cost via the web or USSD. The Ulwazi platform has 1,567 registered users and we can reach a total of 4,000 users through message and reach. See Empowering our workforce, page 148, Engaging with our stakeholders, page 71. SharePoint upgrade SharePoint intranet redesign: we are redesigning our intranet for enhanced communication, improved collaboration, centralised storage, customisation, robust security features, ease of access, and availability on multiple devices. There is a new European region intranet site on SharePoint. Microsoft Digital PMO platform A key focus, in the interests of improving our project management capability, was the roll out of the Microsoft Digital PMO platform during 2022, to ICT and to the wider business. This was a success and is proving most useful to the Group. AT4SS Training for AT4SS (automation technology) continues, including drop-in and lunch-break sessions. Windows 11 upgrade The objective of the upgrade is to ensure all devices are Windows 11 ready before 2025 (when Microsoft stops supporting Windows 10) and that in the process we include BitLocker (encryption technology) for additional security. Thus far 6,762 of 9,977 devices have been upgraded; and we are on track to complete the upgrade before the deadline. Wireless network capabilities and backup In Q3 2023 we commenced a wireless network solution for the SA region, to improve availability on the connectivity between shafts and major backhaul routes. Connectivity here risks interruption due to vandalism and damage to property; something a wireless solution solves. Critical telephonic infrastructure We installed a new telephone system at Marikana and at Driefontein. Digital risk and protection tool protection ICT implemented world class digital risk protection tools for combatting online scammers, be they social media impersonators, counterfeiters, trademark infringers, or online phishers. Ongoing training and development Training and development (and employee growth) is a priority. Exposure to, and training in, new software and systems (supporting employees in their certification) is critical to support our growing company. In 2022, close to 60% of ICT staff completed level one of our Digital Transformation training development programme. We also trained non-ICT staff in the Microsoft Enterprise project management platform. We continued with SharePoint business engagements and refresher training on a needs basis. Supporting IME (Integrated mining enterprise) ICT, in support of Group technology and innovation’s efforts around IME (See Harnessing innovation, page 171) is implementing MineRP’s digital enterprise software. MineRP is a world leader in technical software for mines. Cost management Our goal is to be the lowest-cost service provider in the mining sector. In 2023, our overall ICT costs for South Africa amounted to R575 million/US$30 million, for the US PGM operations, it was US$5.3 million (2023: R102 million), and for the Sandouville refinery, it was €1.1 million/R22.9 million. Risks Our top three risks are: Damage to ICT infrastructure due to theft/ sabotage or power surge/outage (which we are mitigating with wireless technology); cyber threats (for mitigation see below) and unauthorised software implemented by business (controls are in place to manage the risk). Cybersecurity Cyber Response Strategy The Group Cyber Security Strategy was successfully drafted and presented to the Audit Committee, showcasing the Group’s defences against cyber threats. This strategy reflects a proactive approach to safeguarding our digital infrastructure.Recognising the ever-evolving nature of cybersecurity challenges, our strategy incorporates robust measures to detect, respond to, and where required disclose cyber incidents. HARNESSING INNOVATION continued IR - 176

The Group’s cybersecurity strategy and approach includes: • Mitigation of risks and vulnerabilities through performance of risk assessments to identify and assess potential cyber risks. The cyber and IT risks is incorporated into the Group’s strategic risk register which forms part of the Group’s risk management process • Ensuring standards and compliance through development and implementation of comprehensive Information Security Management System policies such as the ICT Code of conduct, Information security, Vulnerability, Backup and ICT disaster recovery policies, in alignment to international standards on ICT security • Responding to cybersecurity incidents through Intrusion detection and prevention by implementation of industry best practice technologies to protect our network • Fostering a cyber awareness culture through conducting security awareness training by continuously educating and creating awareness amongst users with an equal responsibility with respect to cybersecurity • Defense-in-depth security through regular backup of critical data and testing restoration • To protect against cyber threats, the Group employs various layers of security protection which includes the human layer, perimeter, network, endpoint, application and data security layers to protect mission critical assets • The Group follows a business impact assessment process (BIA) to ensure that ICT has visibility of business critical systems which are supported by ICT • Content governance exists for document management, email, Microsoft Teams, SharePoint and OneDrive platforms Cybersecurity response plan The Group’s cybersecurity response plan is defined in 3 steps which includes internal control, external reliance, and increased audit frequency. Internal control • Employing an internal team of 4 security experts • Managing the information security management system and maintaining the ISO 27001: 2022 certification • Implemented tools with artificial intelligence capability to monitor and send alerts • Automation functionality have been scoped into multiple layers including fully automised network access control for Virtual Private Network connections for employees and 3rd parties External reliance • Using an outsourced Security Operations Centre/Security Incident and Event Monitoring (SOC/SIEM) • 24/7/365 real time monitoring the Sibanye-Stillwater network environment using the latest security technology to assist with threat detection and performance of global monitoring of all Sibanye-Stillwater regions • Network intrusion prevention services which detect threats and block access • Network intrusion detection services which monitor and analyse network and system activities for signs of malicious or unauthorized behavior HARNESSING INNOVATION continued IR - 177

Increased audit frequency: • Network vulnerability assessment and management, log management systems and managed firewall services • Security penetration testing by an independent security assessor • Independent penetration testing, the Group ICT function engages with various vetted and reputable cyber security service providers to aid with the execution of the vulnerability testing, thereby ensuring independence and quality of work performed • Internal Audit performs an annual security assessment on the control environment for assurance purposes Cyber breach incident response and process To assist with any cyber breach incidents Sibanye-Stillwater has engaged the services of an external consultant for an on-demand cyber incident response service providing technical support and expertise when required. This external consultant is experienced in incident investigation, response, containment and has access to world-leading incident response support. Sibanye-Stillwater have incorporated terms and conditions around privacy, confidentiality, integrity and availability of information into the agreements of third parties. All third parties are notified of their responsibility to report any security incidents to the Sibanye-Stillwater relationship manager. The relationship manager will then follow the internal incident and response procedure. The cyber breach internal response process: Prepare • Triage by performing an internal impact assessment and categorisation. Based on the severity and complexity, the external contracted security company might be contacted. • Contacting key individuals including but not limited to the CFO, VP Group ICT and management from the affected business area head of department (HOD) • Core response process triggered through confirmation of alert level and incident categorisation Core response • Incident management team oversee, communicate and engage support • Capture and analyse data using the contracted external security consultant • Assess materially of the of the cyber breach and potential impact with limited stakeholders • If the breach is determined to be material an assessment is then escalated to an extended team • The extended team includes VP Group ICT, Manager ICT: Infrastructure, Unit Manager Security, Manager ICT: Information Management, Senior Manager SOX Ethics and Policies, Compliance Manager, Manager Financial Reporting, Manager Risk and Insurance, VP Protection Services, VP Investor Relations and other relevant party that can add value to the process to be determined on a case by case basis • A disclosure assessment is performed using evaluation criteria in line with Sibanye-Stillwater's regulatory requirements. Relevant disclosures are prepared as required • Review solution and remediation steps considering all potentially impacted areas • Contain/Mitigate the threat by remediation through fully removing or closing the incident and confirming successful remediation or recover if required Close out and review • Close out and review the incident logged • For each incident being closed out, consider whether the cybersecurity incident has materially affected or is reasonably likely to materially affect the business strategy, operations, or financial condition and update the risk assessment and strategic register as required Management oversight of Cyber Security Risk and Incidents The Sibanye-Stillwater management team responsible for Cyber Security has extensive experience in all areas required to maintain an effective and safe ICT landscape. ICT team members responsible continuously engage in seminars, security forums and security briefs to ensure we remain up to date with industry developments. The VP group ICT reports the cyber security strategy and posture directly to the audit committee. Members of the ICT team have undergone formal training and certification of auditor on ISO27001:2013 with the 2022 version transition. Management have created cybersecurity strategy which involves leveraging several technologies, processes, skill sets, and risk mitigation products to manage the cyber risk holistically. Preventative and detective security measures are in place to reduce the risk of an incident occurring and causing business disruptions. Disaster recovery processes are in place and tested annually to ensure the continuity of business systems. Quarterly vulnerability assessments conducted by contracted specialised third parties provide Group ICT management with an independent view of the capabilities to respond to an incident and whether the appropriate controls are in place to mitigate against offensive threats. Following the assessment, the issues identified are tracked and remediated. Management then focuses on remediating the issues raised in the report. The main focus is to ensure continuous improvement and preventing reoccurrence of the same incident in the environment. The results of the independent assessments over the past financial periods have indicated a strong security posture. Management reviews cyber risks in several forums as part of the Group ICT Risk Management process. Whilst the risk of a cyber security incident event cannot be fully mitigated, Sibanye-Stillwater has taken further measures to receive technical, legal, and forensic support should a significant incident occur. Governance The Board and Audit committee oversee the ICT governance in Sibanye-Stillwater. The Board and Audit Committee delegate responsibility for the implementation of an ICT Governance framework to the Vice President Group ICT who is held accountable for the effectiveness of the cyber security program and strategy. The Audit committee is informed quarterly about any change in cybersecurity risks or upon recognition of any material cybersecurity incident which may need to be reported. Training We launched a #CyberSafe platform, designed to instil a culture of cybersecurity awareness throughout the company. We also partnered with a global company called KnowBe4, the world’s largest integrated Security Awareness Training and Simulated Phishing platform.Employee training in cyber security is compulsory, and the risk scores of employees is shared with their head of department and team leaders. We have an incident response process in place should an employee notice any cybersecurity related events. HARNESSING INNOVATION continued IR - 178

Incident disclosure For the year ended 31 December 2023, there were no incidents or risks from cyber security related threats that had, or are reasonably likely to have, a material impact on Sibanye-Stillwater. Data classification and Leakage prevention The implementation of Microsoft's content management (includes data classification and automated labelling) achieved significant milestones, including configuring the auto-labelling and classification functionalities for documents within our Office 365 environment. We enlisted third-party experts to scan our Office 365 environment to gain insights into the various types of data present, evaluate the application of data retention policies to documents, and pinpoint the location of personally identifiable information within the environment. We analysed the findings and considered our options for data loss prevention (DLP). We will enhance our DLP policies to adapt to evolving risks and emerging threats. These ongoing efforts, coupled with the utilisation of Microsoft's robust content management features and the proactive strategies of data classification and automated labelling, have led to improved content management efficiency, heightened data protection capabilities, and increased adherence to data governance policies. Mimecast Mimecast is a crucial cybersecurity partner, empowering the Group with advanced solutions for proactive threat detection, brand protection, and email data retention capabilities. Mimecast's email filtering and protection solution delivers remarkable results for Sibanye-Stillwater: 11% of all external emails received by the Group posed a threat and were identified and blocked by Mimecast. Brandshield To safeguard the brand and reputation of Sibanye-Stillwater in the public domain and internet space, including the dark web, our security team implemented Brandshield. During 2023, 338 fake job postings were removed from the internet and 5 fake websites were taken down as part of the service; and 19 social media sites were removed. See Corporate governance, page 32; Managing our risks and opportunities within the external environment, page 51. System failures There were no major failures or ICT security breaches that had a negative impact on business for either the SA, US or EU region in 2023. However, seven matters were reported to the South African Information Regulator as reportable incidents relating to POPIA which await their feedback. We had one breach reported to the Finnish Competent Authority out of abundance of caution. We also conducted our annual disaster recovery for our systems in SA and the US. Future focus – ICT Cost efficiency project Amid rapid innovation and growth over the past few years, we've accumulated a complex array of technologies and software applications, often resulting in duplications. In 2024 (under a project called Phoenix rise) we will optimise our platforms and systems, for sake of simplicity, cost savings and the efficient management of our existing assets. Project mentos In 2022, Project mentos introduced ICT Group standards to the US region. The project was successfully executed and closed. We since identified the need for a phase two of this project, with the emphasis on streamlining processes, rationalising business applications, and exploring opportunities and synergies specific to the US region. Keliber ERP project launch In 2024, we announced the launch of a comprehensive ERP project for our Keliber lithium project. This initiative involves scoping activities and crucial decision-making processes to define the landscape of Keliber's ERP system. The project's strategic focus extends beyond Keliber, aiming to integrate ERP infrastructure into the larger European region and into our broader group ERP platform. SAP consolidation The purpose of this project is to institute a consolidated system for financial budgeting, forecasting, reporting, and Group financial consolidations. This is coupled with our journey for the SA and EU regions to SAP S4 (which we plan launch in 2024). Wireless backup network (SA region) We have awarded the tender for a company to do a dedicated wireless backup network for the SA region (to mitigate against vandalism of network infrastructure and support the growth of the business). Integrations We will continue the ICT integrations (into Group systems) for the Australian region and for Keliber. In March 2024 we will integrate the ICT infrastructure for the RC plant at Waterval (for chrome recovery), as part of the Group’s take-over of this plant. Starting April 2024, we will commence with the ICT integration of Reldan. Approved capital projects for 2024 The following capital projects have been approved for 2024: • OT network replacement (SA PGM) • Continuing Windows 11 upgrade (Group) • Replace end-of-life telephony at Kloof (SA gold) • Control system OT server refresh (SA region) • General networking upgrades for 2024 (Group) • Firewall replacement projects (SA region) • Beatrix hardware refresh (SA region) • Teraco additional media agents (SA region) 16.10 HARNESSING INNOVATION continued IR - 179

IR - 180 ESG EMBEDDED AS THE WAY WE DO BUSINESS
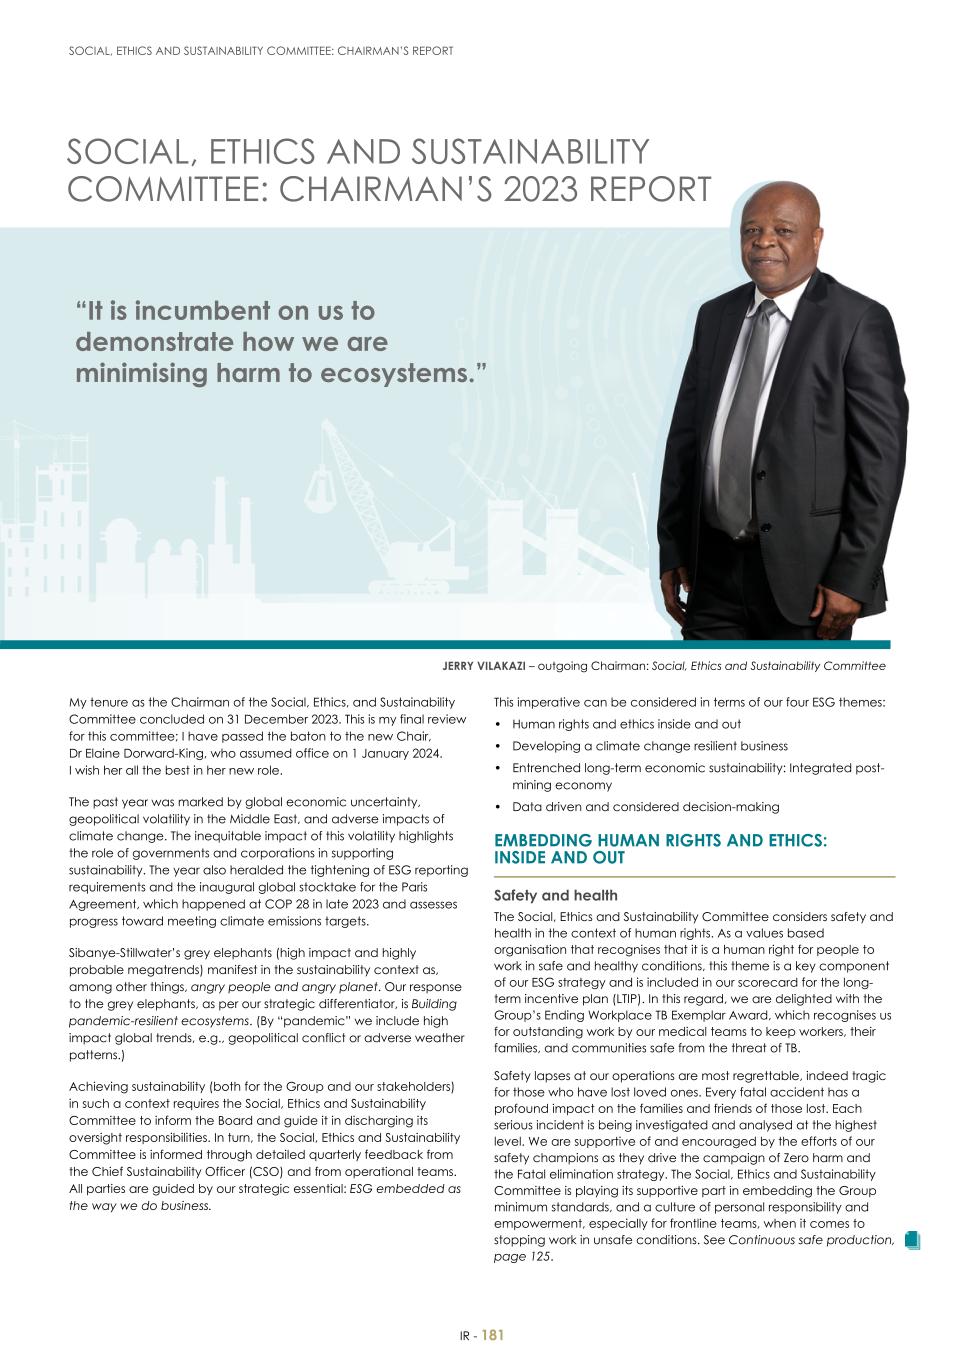
JERRY VILAKAZI – outgoing Chairman: Social, Ethics and Sustainability Committee My tenure as the Chairman of the Social, Ethics, and Sustainability Committee concluded on 31 December 2023. This is my final review for this committee; I have passed the baton to the new Chair, Dr Elaine Dorward-King, who assumed office on 1 January 2024. I wish her all the best in her new role. The past year was marked by global economic uncertainty, geopolitical volatility in the Middle East, and adverse impacts of climate change. The inequitable impact of this volatility highlights the role of governments and corporations in supporting sustainability. The year also heralded the tightening of ESG reporting requirements and the inaugural global stocktake for the Paris Agreement, which happened at COP 28 in late 2023 and assesses progress toward meeting climate emissions targets. Sibanye-Stillwater’s grey elephants (high impact and highly probable megatrends) manifest in the sustainability context as, among other things, angry people and angry planet. Our response to the grey elephants, as per our strategic differentiator, is Building pandemic-resilient ecosystems. (By “pandemic” we include high impact global trends, e.g., geopolitical conflict or adverse weather patterns.) Achieving sustainability (both for the Group and our stakeholders) in such a context requires the Social, Ethics and Sustainability Committee to inform the Board and guide it in discharging its oversight responsibilities. In turn, the Social, Ethics and Sustainability Committee is informed through detailed quarterly feedback from the Chief Sustainability Officer (CSO) and from operational teams. All parties are guided by our strategic essential: ESG embedded as the way we do business. This imperative can be considered in terms of our four ESG themes: • Human rights and ethics inside and out • Developing a climate change resilient business • Entrenched long-term economic sustainability: Integrated post- mining economy • Data driven and considered decision-making EMBEDDING HUMAN RIGHTS AND ETHICS: INSIDE AND OUT –––––––––––––––––––––––––––––––––––––––––––––––––––––––––––––––––– Safety and health The Social, Ethics and Sustainability Committee considers safety and health in the context of human rights. As a values based organisation that recognises that it is a human right for people to work in safe and healthy conditions, this theme is a key component of our ESG strategy and is included in our scorecard for the long- term incentive plan (LTIP). In this regard, we are delighted with the Group’s Ending Workplace TB Exemplar Award, which recognises us for outstanding work by our medical teams to keep workers, their families, and communities safe from the threat of TB. Safety lapses at our operations are most regrettable, indeed tragic for those who have lost loved ones. Every fatal accident has a profound impact on the families and friends of those lost. Each serious incident is being investigated and analysed at the highest level. We are supportive of and encouraged by the efforts of our safety champions as they drive the campaign of Zero harm and the Fatal elimination strategy. The Social, Ethics and Sustainability Committee is playing its supportive part in embedding the Group minimum standards, and a culture of personal responsibility and empowerment, especially for frontline teams, when it comes to stopping work in unsafe conditions. See Continuous safe production, page 125. SOCIAL, ETHICS AND SUSTAINABILITY COMMITTEE: CHAIRMAN’S REPORT IR - 181 SOCIAL, ETHICS AND SUSTAINABILITY COMMITTEE: CHAIRMAN’S 2023 REPORT “It is incumbent on us to demonstrate how we are minimising harm to ecosystems.”

Diversity and inclusion Sibanye-Stillwater’s vision for diversity, equity, inclusion and belonging (DEIB) is “to cultivate a workplace where diversity is celebrated, equity is unwavering, inclusion is the norm, and belonging is at the heart of the Group.” We are proud to have won Standard Bank’s Top Women Business in Resources, Construction and Infrastructure Development 2023 Award; this is in recognition for propelling women to prominent leadership positions and uplifting the women of Sibanye-Stillwater. Not only has diversity and inclusion been identified as a material matter for this report, but it is also seen as a differentiating opportunity especially if it is tied to effective innovation management, as per our three-dimensional strategy. The immediate commitment remains to increase women’s representation across the Group at a management-level. We have clear policy commitments, an oversight DEI council, women of Sibanye-Stillwater structures to support our women in the workplace, and we invest in training partnerships (see Empowering our workforce, page 161). In these ways, our mining seeks to contribute to reducing inequality and promoting inclusion. Our anti-sexual harassment campaigns are ongoing, and our gender-based violence (GBV) reporting and referral centres at our SA PGM and SA gold operations provide a sanctuary for women in the workplace who may be threatened. At our US region, the Women and Allies Business Resource Group initiated a project to update or create job safety analyses for all positions that identify physical requirements and working conditions for each position. Human rights due diligence The US and SA regions completed independent human rights due diligence (HRDD) assessments during the year under review. The reports highlight the need for vulnerable parties (and particularly women) to be valued, empowered, respected, and safe. The independent HRDD assessments (to be considered in tandem with our own internal assessments) suggest the need to modify our policies and practices in terms of how we can better protect our employees from harassment and discrimination in the workplace, and how we can confront the challenges posed by illegal mining while keeping to the highest standards of human rights. Sociopolitical instability Building trust with stakeholders, especially the communities where we operate, is key to our sustainability. We understand that a “licence to operate” (in the broader sense of the term) needs to be earned. It is our vision to do so: To be a leader in superior shared value for all stakeholders. In the US region the Good Neighbor Agreement (GNA) is in place, with three local organisations binding Sibanye-Stillwater to certain responsible mining commitments. It also serves as a platform to build trust. Our commitment to respect indigenous rights is underpinned through regular engagements with the Aboriginal community. The aboriginal community impacted by the operations at our Century site in northern Queensland, Australia, have the opportunity to voice their concerns through formal engagement forums. In the SA region, sociopolitical instability manifests are exacerbated by constrained economic opportunity and by weak governance from state structures. The Group strives to play a constructive and enabling role (e.g., sharing skills and resources) to bring socioeconomic relief to struggling communities in which we operate. Invariably, this involves respectful and informed dialogue with social partners. The backdrop of the history of the Marikana tragedy and the many cross-cutting sociopolitical issues in South Africa is complex and is routinely studied by international based non-governmental organisations. We will continue to engage through our formal platforms and invite all stakeholders to seek solutions, visit our programmes and help co-create a shared vision and a new legacy. We note that the SA region suffers high levels of illegal mining and theft of copper (as evidenced in the quarterly updates we receive on security related initiatives). In mid-2023, we co-established a security advisory forum in the SA region that includes the Directorate of Priority Crime Investigations and the Asset Forfeiture Unit. While at a national scale, our CEO, together with the CEO of Remgro Limited, is leading a business-government initiative against crime and corruption in South Africa. (See Engaging with our stakeholders, page 78 for more on our grievance processes.) Social impact In early 2023, the Sibanye Foundation, an non-profit company, which houses our social impact fund, was registered. The fund is endowed through donations equivalent to 1.5% of our declared dividend flows. It has received its first donations and which will be allocated to making a difference in the communities in which we operate. Other investment to create a societal benefit include: • SA region: Social and labour plans and corporate social initiatives (2023: R2,201.9m) • AUS region: Gulf communities agreement (2023: A$4.6m) • US region: Community Giving initiative (2023: US$400,000) Furthermore, to promote inclusivity in mineral benefit sharing we also have our ESOP schemes, our Thusano Trust beneficiaries have received a pay out of R27 million and through the Rustenburg Mines Employee Trust R163 million in total dividends were paid out. The Lonplats ESOP paid out a total of R121 million. Our second socioeconomic impact report (following from 2022) was published in 2023 communicating flows of value and socioeconomic impacts from all our operations. The third publication of the impact report supplement is being issued as part of this reporting suite. DEVELOPING A CLIMATE CHANGE-RESILIENT BUSINESS –––––––––––––––––––––––––––––––––––––––––––––––––––––––––––––––––– In March 2023, we saw the impact of an extreme weather event at our Century operations, highlighting again the risks of climate change. We also completed our first climate change analysis based on guidance published by TCFD, providing extensive detail for all of our operations. The results indicate the impact of physical and transitional risks, modelled against specific climate warming scenarios. Damage to property and business interruption were used as proxies for the quantification of the financial impacts of the physical risks associated with the effects of climate change. Six transitional risk scenarios were also modelled against three warming scenarios. Financial impacts were considered against four transitional risks. (See Climate change-related disclosure report.) SOCIAL, ETHICS AND SUSTAINABILITY COMMITTEE: CHAIRMAN’S REPORT continued IR - 182

The Group has climate-related targets as part of our LTIP, and we are aligned with the SBTi (updating our targets accordingly). Given how we affect natural capital (e.g., the burning of diesel, the use of coal-based electricity, and reliance on third-party water suppliers), reducing the reliance on Eskom, and reducing reliance on third- party water suppliers, remains critical. Sibanye-Stillwater accelerated its decarbonisation through three utility-scale renewable energy projects that began construction during the year: the Witberg wind energy project, the Castle wind energy project and the multi-buyer solar photovoltaic project to bring the total dedicated capacity of renewable energy projects in construction for Sibanye-Stillwater to 267MW, which is expected to fulfil 15% of our electrical energy requirements in South Africa from end-2025. Sibanye-Stillwater is aims to play a part in mitigating climate change by growing our green metals presence in North America and Europe. The Keliber lithium project is expected to have one of the lowest GHG emission intensities of Europe’s seven existing/planned lithium production facilities. Promoting low-waste circular economies is becoming an increasingly important feature of sustainability. We strive to play our part in the rise of “circularity” through the recycling of autocatalytic converters for the extraction of PGMs (platinum, palladium and rhodium), and the reclamation of tailings, which are also central to our green metals strategy. Historical tailings are reprocessed for the recovery of gold at our DRDGOLD operations; our recent acquisition of New Century Resources allows us to do the same for zinc, an important metal in the green transition. Tailings storage facilities Given the impact of TSFs on safety and the environment, the Committee notes that the Group met the August 2023 target for GISTM compliance for very high and extreme consequence TSFs; and that we are on track for full compliance by 2025, as targeted. Water management The Group is managing three water risks: quantity, quality and reputational. Risk mitigation strategies are in place which include water independence, leak detection, stakeholder collaboration and consultation, as well as the optimisation of water treatment facilities and programmes. ENTRENCHING LONG-TERM ECONOMIC SUSTAINABILITY: INTEGRATED POST-MINING ECONOMY –––––––––––––––––––––––––––––––––––––––––––––––––––––––––––––––––– Given the type of business we are in, nature and biodiversity are key sustainability concerns. It is incumbent on us to demonstrate how we are minimising harm to ecosystems. Our goal in this regard is net biodiversity gain for existing operations and no net loss for new operations upon closure. Our ambitious goal in 2023 to establish a target for net reduction in biodiversity footprint loss, was unfortunately not met. However, we continue to provide a thorough and comprehensive self-audit on our environmental impact. As a member of the ICMM we are fully committed to a “nature positive” future and will consider the latest guidance, as it becomes available, on establishing biodiversity targets. See Biodiversity management fact sheet www.sibanyestillwater.com/news-investors/reports/annual/ In terms of reducing closure liability (SA region), this year we set and achieved the target of a 3% reduction. This has been achieved through concurrent rehabilitation activities as well as demolition of surface infrastructure no longer in use. Mine closure is a complex and multi-disciplinary issue, and for which we recently developed a comprehensive social closure framework, with two of the SA gold operations in the advanced stages of planning for closure and utilising the framework. Given that the economic conditions of the operations change during the life of the mine, returning the land to its pre-mining state is neither viable nor advisable. However, the land can still be used for good and substitutive economies will be more supportive to the region. The Committee notes the progress made in leveraging our post- mining land for socioeconomic impact. This includes collaborating with relevant institutions to implement economic programmes in the areas of clean energy, agriculture and industrialisation. DATA DRIVEN AND CONSIDERED DECISION- MAKING –––––––––––––––––––––––––––––––––––––––––––––––––––––––––––––––––– Sibanye-Stillwater remain ISO 14001 and ISO 45001 certified across our business, with the exception of our Australian region and Keliber lithium project. During 2023, the US region and the SA PGM Rustenburg operations progressed IRMA and completed stage 1 audits with stage 2 planned for 2024. In 2023 our ongoing participation in the UNGC SDG accelerator programme saw Sibanye-Stillwater winning the environmental award from the South African Institute of Mining and Metallurgy. The Committee is keeping a close eye on changes to reporting regulations, with several new ESG frameworks introduced in the EU, such as the Corporate sustainability reporting directive (CSRD). The International Sustainability Standards Board (ISSB) published the IFRS Sustainability Disclosure Standards (IFRS S1 and IFRS S2), which are built on and consolidate the TCFD recommendations. Post-year- end, the GRI launched its updated mining disclosure standard and the Securities and Exchange Commission (SEC) adopted rules to enhance and standardise climate-related disclosures by public companies. Sibanye-Stillwater continues aligning with reporting requirements and will abide by the SEC rules. See supplementary information, Sustainability content index,https:// www.sibanyestillwater.com/news-investors/reports/annual/. The Committee wholeheartedly supports the positive steps towards convergence of responsible mining standards through the ICMM. Most notably, and encouragingly, the Copper Mark (Mining Association of Canada), ICMM and the WGC are working towards consolidating their standards into a single global responsible mining standard and multi-stakeholder oversight system. SOCIAL, ETHICS AND SUSTAINABILITY COMMITTEE: CHAIRMAN’S REPORT continued IR - 183

We welcome efforts by third parties to consolidated disclosures and to reduce red tape and duplication in the standards environment. This not only benefits business; more importantly it benefits the cause of ESG and sustainability. The Committee congratulates CEO, Neal Froneman on his appointment as Chair of the WGC and Chair of Business Against Crime South Africa, notable milestones for the Group and the South African mining industry. We as the Committee also welcome our new Chief Sustainability Officer, Melanie Naidoo-Vermaak, who recently joined Sibanye-Stillwater’s C-suite. Long-term incentives: ESG scorecard The Social, Ethics and Sustainability Committee, as one of its duties, recommends to the Remuneration Committee the arrangements for the measurement and assessment of ESG performance regarding the LTIP. The first ESG scorecard for the LTI plan came into effect in 2021, on a three-year cycle. The 2024 – 2026 ESG scorecard will be finalised in early 2024. For more information refer to page 264 of this report and further detail for each of the years, per indicator and per target is available in supplemental information, https:// www.sibanyestillwater.com/news-investors/reports/annual/. IN CLOSING AND APPRECIATION –––––––––––––––––––––––––––––––––––––––––––––––––––––––––––––––––– The Committee is pleased to report to all stakeholders of the Group that it has fulfilled its mandate as prescribed by the South African Companies Act and that there are no instances of material non- compliance or material ESG related fines to disclose. I would like to thank the members of the Committee and the Board for their input and support throughout the year. I am pleased to formally welcome Dr Elaine Dorward King as the new Chair of the Social, Ethics and Sustainability Committee from 1 January 2024. Her extensive experience in the field of sustainability will be of great value as Sibanye-Stillwater fulfils its strategic differentiator, to be Recognised as a force for good. On behalf of myself and the Committee, I wish Dr Elaine all the success in achieving our ambitious goals; and I wish the Committee success in its pivotal function of assisting the Board in crucial matters of ethics and sustainability. Jerry Vilakazi Chairman: Social, Ethics and Sustainability Committee 26 April 2024 SOCIAL, ETHICS AND SUSTAINABILITY COMMITTEE: CHAIRMAN’S REPORT continued IR - 184 https://www.icmm.com/en-gb/ our-principles https://www.lseg.com/en/ftse- russell/indices/ftse4good https://www.ipa-news.com/ https://responsiblemining.net/ https://unglobalcompact.org/ sdgs https://www.iso.org/home.html https://group.jse.co.za/ governance/king-iv-principles https://cyanidecode.org/ https://www.gold.org/ https://www.lbma.org.uk/ https://unglobalcompact.org/ what-is-gc https:// www.globalreporting.org/ https://www.lppm.com/ https://eiti.org/companies

OUR SUSTAINABILITY STRATEGY Sustainability and ESG (as per the guiding principles of the Group) are embedded in the way we do business. We differentiate ourselves in the industry as a Force for good, for developing a portfolio of green metals to meet the challenge of climate change, and to be inclusive, diverse and bionic in our operations. It is our aspiration to embrace the technologies of tomorrow, and indeed the ethics of tomorrow and of today. Our sustainability themes (see below) are integrated into our ESG scorecard, which forms 20% of the LTI for executives (See Rewarding delivery, page 232). Our commitment to sustainability is also evidenced by our alignment to the UN’s SDG goals. See Progressing the UN’s SDGs, www.sibanyestillwater.com/newsinvestors/reports/annual). More detail on our commitment to sustainability strategy can be found at www.sibanyestillwater.com/sustainability/reports-policies. Our sustainability strategy has four anchors of which the economic anchor was introduced in 2023. The anchors are: • Economic: Deliberate economic impact to benefit as widely as sustainability outcomes • Environment: Promoting natural resources and improving life–sustainable use through increased environmental consciousness and continual improvement, minimising environmental impacts and a measured transition to low carbon future • Social: This anchor is bringing together the socioeconomic development of host communities that enables sustainable livelihoods, stakeholder engagement as well as safety and health • Governance: Respecting human rights of stakeholders and doing business with integrity and from an ethical foundation by adherence to good governance principles and legal compliance It is in the interdependency between these anchors that the sustainability impact and value is achieved. SUSTAINABILITY THEMES GROUP PRIORITIES ESG LTI SCORECARD FOCUS AREAS 2024 Embedding human rights and ethics: Inside and out Secondary SDGs 1, 2, 3, 4, 8, 9, 10 See supplementary information, Progressing the UN’s SDGs • Responsible sourcing and value chain integrity • Diversity, equity, inclusion and belonging Increase the equity and inclusion Embedding the principle of Zero harm Developing a climate change- resilient business Secondary SDGs 1, 2, 6, 7, 9, 11 See supplementary information, Progressing the UN’s SDGs • Reduction in GHG emissions • Reduction in purchased water • Reduction in reliance for potable water • Improve water quality • Promote recycling across all of our metals • Maintain global standing on tailings storage facilities • No net loss of biodiversity as a result of our investments Reduction in GHG emissions Reduction in total water purchased Entrenching long-term economic sustainability: Integrated post- mining economy Secondary SDGs 1, 4, 6, 8, 9, 11, 12, 17 See supplementary information, Progressing the UN’s SDGs • Leveraging our assets for impact post-mining • Concurrent rehabilitation (including environmental closure) Increased the impact of shared value created in operating ecosystems Data-driven and considered decision-making Secondary SDGs 9, 12, 17 See supplementary information, Progressing the UN’s SDGs • TCFD reporting strategy and global assessment • IRMA integration across PGM business • Embed governance across all areas of operation Assurance on performance of the ESG scorecard IR - 185

MINIMISING OUR ENVIRONMENTAL IMPACT WHAT WE DID IN 2023 SUCCESSES • Financial closure and commencement of construction of 267MW of dedicated renewable energy capacity in South Africa • Formulated an updated Group Science-Based Target initiative (SBTi)-aligned target (excluding AUS region): 42% scope 1 and 2 reduction by 2030 from a 2021 base1 • Completion of Task force on climate-related financial disclosure (TCFD) reporting gap analysis as well as a modelling of physical climate risks and transition climate risks • Achieved a A- score for both our Water Security CDP and Climate Change CDP SA region • Achieved our 2023 GHG emissions (scopes 1 and 2) target by remaining within the annual emission pathway • South African Institute of Mining and Metallurgy environmental award for Bathopele mine’s decarbonisation model focused on waste reduction • Improvement in concurrent rehabilitation with a R603.7 million reduction in gross closure liability from 2022 base year US region • Achieved all-time record low annual SO2 emissions at 0.78 metric tonnes • A final environmental impact statement (EIS) was issued for the proposed Lewis Gulch TSF in November 2023; stakeholder support was overwhelming with 98% of public comments in support of the proposed expansion CHALLENGES • Target to reduce potable water purchases at SA gold and SA PGM operations not achieved • Court upheld the Environmental permit for the Rapasaari mine and Päiväneva concentrator — but referred certain permit conditions back to the permitting authority ALIGNMENT WITH SDGs 1, 2, 6, 7, 9, 11, 12, 13, 15 Our sustainability themes: Develop a climate-resilient business is anchored by UN SDG 13 Entrenching long term economic sustainability: integrated post mining economy anchored by UN SDG 15 See Progressing the UN’s SDGs, www.sibanyestillwater.comnewsinvestors/reports/annual MATERIAL MATTERS M3 Licence to operate M5 Energy supply and security M8 Climate transitional risk M9 Climate physical risk M10 Water management 1 Excluding the Century operation; approval from SBTi will be sought in 2024 IR - 186

TARGETS AND KEY OBJECTIVES Status See Annual targets • Group: zero level 4 or 5 environmental incidents Met Page 205 • Group: 10% reduction in level 3 environmental incidents year-on-year Met Page 205 Targets set for 2023 • Group: limiting GHG emissions to the 2023 normalised threshold of 6.830 MtCO2e (scope 1 and 2)2 Met Page 194 • SA region: a 2-3% reduction in electricity consumption per year against budget Met Page 194 • SA region: an 800ML reduction in purchase of potable water by SA gold operations in 2023 compared to the 2022 baseline of 5,351ML Not Met Page 199 • SA region: a 361ML reduction in the purchase of potable water by SA PGM operations in 2023 compared to the 2022 baseline of 12,051ML Not Met Page 199 • SA region: a 3% reduction of closure liability through footprint reduction initiatives and concurrent rehabilitation by 2023 Met Page 211 • SA region: international Cyanide Management Code certification Met Page 189 • Group: risk-reduction through conformance of tailings dams to the Global Industry Standard on Tailings Management (GISTM) by the ICMM deadline of 5 August 2023 for all TSFs with a Consequence Classification of ‘Extreme’ or ‘Very High’3 • Group: all other TSFs (irrespective of the Consequence Classification) to be compliant with GISTM by end December 20233 Met Page 207 • US region: complete long-term water treatment evaluation study and strategy at Stillwater mine Benbow access Met Page 201 • US region: in-situ treatment wells installed and operating at Stillwater mine - reduce groundwater nitrogen levels Met Page 201 Short to long term targets • SA region: increase in SO2 capturing and cleaning efficiency from 80% to 90% by 2027 and to 99% by 2030 at the Marikana operations In progress Page 198 • Group: SBTi-approved scope 1 and 2 carbon emissions reduction target of 27.3% by 2025 (2010 baseline)1 In progress Page 192 • Group: SBTi-aligned scope 1 and 2 carbon emissions reduction target of 42% by 2030 (2021 baseline)1 New target {Page 192 • Group: scope 3: Sibanye-Stillwater commits to screening of suppliers to establish the most relevant purchased goods and their emissions. The screening will cover our top 75 suppliers by spend and will be conducted by end 2025. New target Page 191 • Group: to reduce our total purchased water footprint against the 2023 baseline – translates into a reduction of approximately 1,400ML for 2024; for 2025 and 2026 the annual reduction value is being refined 2 New target Page 199 1 2025 SBTi target was set in 2019 and excludes Marikana, Sandouville, Keliber and Century operations which were subsequently acquired. The 2030 SBTi-aligned target includes all operation except for Century operations which is being integrated into our carbon reporting 2. Excluding AUS region and Keliber lithium project 3. EU region not applicable and AUS region conformance set for 2024 2 This target is replacing the previous targets to reduce reliance on external potable water infrastructure, in water-rich jurisdictions to 10% and in water poor jurisdictions to 40% by 2030 also replacing the water treatment plants optimised to become independent of purchased potable water by 2024 APPROACH –––––––––––––––––––––––––––––––––––––––––––––––––––––––––––––––––– Sibanye-Stillwater is dedicated to environmental protection as per regulation in our regions of operation, our environmental position statements, and the standards and guidelines of respected third- party agencies. Our environmental and climate commitments appear in the ESG scorecard of the long-term incentive programme under the theme Developing a climate change-resilient business. (See page 264) Our material matters recognise the importance of our environmental commitments in terms of our licence to operate. The relevant material matters are: Climate (physical risks), Climate (transition risks), Energy supply, and Water management. From a material matter perspective, our licence to operate is maintained through environmental legal frameworks and enforcement mechanisms for implementation in the regions. Each country where we operate has its own framework of environmental laws; depicted in the table on the next page. Our understanding of the Group’s climate-related risks has been refined with an updated scenario analysis based on TCFD requirements. (See Climate change supplement). Mitigation of the energy supply deficit at our SA region remains critical and material. We continue to mitigate the impact of load curtailment and rollout renewable projects that are expected to reduce our reliance on Eskom’s coal-intensive supply. Water management for the SA region is defined in our commitment to reduce extraction from municipal water systems means increased availability for household use. Our SA PGM operations are in a water stressed region, and therefore it is incumbent on us to free up water for sustained production and WASH (water, sanitation and hygiene) services. Our focus for the US region is to address the issue of water quality through advanced biological treatment technology. At our AUS region, the Century operation has a slurry pipeline to transport the produced concentrates 304 km to Karumba Port to be exported, thus requiring effective monitoring of the pipeline. MINIMISING OUR ENVIRONMENTAL IMPACT continued IR - 187

ACCOUNTABILITY, GOVERNANCE AND ASSURANCE GOVERNANCE ACCOUNTABILITY Board • Social, Ethics and Sustainability Committee • Risk Committee • Audit Committee C-suite and senior leadership • Chief Sustainability officer • The Environmental department reports to the executive technical officers of each region • Vice Presidents (VPs) for tailings storage facilities (TSFs) and climate change • Group Head of Energy and Decarbonisation reports to the Chief Technical and Innovation Officer (CTIO) • ESG Committee Regional Operational • Each region is supported by a dedicated segment-focused compliance team, headed by an environmental manager; the compliance teams are guided by a centralised team of environmental specialists who provide technical guidance across a range of disciplines • The regional environmental teams engage with regulators and other stakeholders to communicate and advocate for sound environmental practices • The US operations have “Operationalising ESG” teams that guide the strategy in each area of sustainability. The US operations are accountable to external stakeholders including the Good Neighbor Councils, the Boulder River Watershed Association, and the Stillwater Valley Watershed Council RELEVANT LEGISLATION AND REGULATIONS (list not exhaustive, only key regulations listed) South Africa • Constitution of the Republic of South Africa (1996) • Minerals and Petroleum Resources Development Act (2002) • National Environmental Management Act (1998) • National Environmental Management: Air Quality Act (2004) • National Environmental Management: Waste Management Act (2008) • National Water Act (1998) United States • US Clean Water Act • US Clean Air Act • Montana Metal Mines Reclamation Act • Montana Environmental Policy Act (MEPA) • Clean Air Act of Montana • Water quality laws • Montana Solid Waste Management Act • Montana Hazardous Waste Act • Various EPA (Environmental Protection Agency) directives Europe Finland • Environmental Protection Act (57/2014) • Environmental Protection Decree (713/2014) • Administrative Procedure Act (APA, 434/2003) • Water Act (587/2011) • Waste Act (646/2011 • Land Use and Building Act 132/1999 France • Environmental liability regime regulated by the Environmental Code • Charter of the Environment (supported by the French constitution) • EU Air Quality Directives (2008/50/EC) • EU’s Emission Trading System Directive (2003/87/EC) • EU Directive on the Geological Storage of CO2 (2009/31/ EC) • Green Industry Bill (Loi Industrie Verte) Australia • Environment Protection and Biodiversity Conservation Act 1999 (Cth) • Climate Change Act 2022 (Cth) • Environmental Protection Act 1994 (Qld) • Environmental Management and Pollution Control Act 1994 (Tas) • Copper Mines of Tasmania Pty Ltd (Agreement) Act 1999 (Tas) ASSURANCE AND REVIEWS • Sibanye-Stillwater’s environmental compliance to legal authorisations/permits/licences and obligations is verified by an external service provider • Regulatory inspections and external audits on licences and authorisations (environmental management plans, environmental authorisations, water-use licences, waste licences, atmospheric emissions licences and the like) are performed by the DMRE, Department of Forestry, Fisheries and the Environment, and Department of Water and Sanitation • Progress against performance indicators (e.g., Initiative for Responsible Mining Assurance (IRMA), International Council on Mining and Metals (ICMM) and World Gold Council (WGC)) audited through an external assurance process (see page 285) • ISO audits to maintain ISO 14001 certification Policies: ESG policy; Tailings stewardship Position statements: Air quality; Biodiversity; Heritage; Climate change; Land management; WCDM/Water stewardship; Energy and decarbonisation; Mineral and non-mineral waste; Water health management. See www.sibanyestillwater.com/about-us/governance Third-party protocols: ISO 14001: 2015 (environmental management standard); Biodiversity Disclosure Project; ICMM; IRMA; UN SDGs; WGC; International Cyanide Management Code; TCFD MINIMISING OUR ENVIRONMENTAL IMPACT continued IR - 188 Green Industry Bill in France In October 2023, the French parliament passed the “Green Industry Bill” (Loi Industrie Verte); to promote decarbonisation. The main topics include the creation of a public saving fund dedicated to ecological transition financing, measures to accelerate industrial permitting beneficial to the green transition, and the strengthening of environmental criteria in public orders.
ACCREDITATION AND COMPLIANCE –––––––––––––––––––––––––––––––––––––––––––––––––––––––––––––––––– All our operations, excluding Keliber and Century operations, are ISO 14001: 2015 (Environmental management systems) certified. ISO requires that we identify legal and regulatory requirements. For this, we have environmental registers that link environmental impacts to specific legal requirements. Compliance audits There were a total of 18 regulatory inspections (broadly examining compliance against authorisations) at our SA gold and SA PGM operations in 2023. Fourteen such inspections were conducted at the SA gold operations, and four inspections were relevant to the SA-PGM operations. Of the 18 inspections, incidents of regulatory non-compliance were detected in four inspections. These non-compliance examples refer to alien vegetation management plans, stormwater and waste management, and rehabilitation measures. All non-compliance incidents have mitigation plans in place. Nineteen regulatory inspections occurred at our US operations in 2023, during which one non-compliance was discovered. The non-compliance involved unauthorised travel of heavy equipment on federal forest land during the Brownlee heat exchanger project; and it has been mitigated. A total of four inspections by French regulators were conducted at Sandouville in 2023; none of these inspections resulted in formal notices of non-conformance. Australia The Century operation continues to engage with the Queensland Department of Environment, Science and Innovation in respect of the Century pipeline failure in October 2022 and the flooding events of March 2023. RISK EXPOSURE VALUES –––––––––––––––––––––––––––––––––––––––––––––––––––––––––––––––––– In the SA region, we conduct biannual (twice a year) compliance risk profiling exercises whereby we develop regulatory risk profiles, highlighting areas that require improvement. We are in the process of developing similar profiles for the EU and AUS regions. The EU region is done on a country basis due to legislative differences per country. From these profiles we derive risk exposure values (REV) for each piece of legislation, based on the potential for financial loss and reputational loss (among other risks) and the probability of these occurring. In the SA region our REVs showed general improvement; but with four REVs still exceeding our medium risk exposure threshold, if only marginally. These are: Mineral Petroleum Resources Development Act, NEMA, National Water Act, and the Climate Change Bill. CLOSURE LIABILITY –––––––––––––––––––––––––––––––––––––––––––––––––––––––––––––––––– Closure planning is a form of environmental and social risk mitigation, which, if executed properly, can reduce the financial exposure of an asset, but could also increase the risk if inadequate. Closure obligations are those environmental, engineering and social commitments which, by law, must be de-risked as and when directed to do so by the relevant regulatory authority, or as per the Group’s commitments in terms of decommissioning (See page 211). EMERGENCY PREPAREDNESS MANAGEMENT –––––––––––––––––––––––––––––––––––––––––––––––––––––––––––––––––– We manage environmental emergencies, should they occur at our operations, according to the standards of ISO14001: 2015 and the Global Industry Standard on Tailings Management (GISTM). We undertake emergency mock drills (as per the emergency drill schedule) at operations. These drills include scenarios related to significant environmental risks for e.g., tailings storage facility failures. See Continuous safe production on emergency planning, page 129. CYANIDE CODE –––––––––––––––––––––––––––––––––––––––––––––––––––––––––––––––––– The International Cyanide Management Institute (ICMI) announced on 31 August 2023 that it has accepted the application of Sibanye- Stillwater to become a Signatory to the International Cyanide Management Code (Cyanide Code) for the manufacture, transport and use of cyanide in the production of gold. The Group operates five cyanide facilities at gold mines in South Africa, and it has designated three to seek Cyanide Code certification: Kloof 2 plant, Driefontein 1 plant, and Beatrix 1 plant; the other two plants will not be included due to short mine lives. By becoming a Cyanide Code signatory, Sibanye-Stillwater commits to follow the Cyanide Code’s principles, to implement its standards of practice, and to have certification audits of the operations it has designated for certification conducted by independent third-party auditors within three years of its initial application, and every three years thereafter. The three aforementioned plants have been audited and recommended for certification. CLIMATE CHANGE RESILIENCE –––––––––––––––––––––––––––––––––––––––––––––––––––––––––––––––––– One of our four strategic differentiators is the ambition to build a Unique global portfolio of green metals and energy solutions that reverse climate change. The risk of climate change is embedded in our strategy and is an opportunity to be part of the world’s solutions for low carbon energy and mobility. We give effect to this strategy by investing in battery metals and in other metals that are key to the green transition, and by reducing our operational GHG emissions in line with the goals of the 2015 Paris Agreement (a legally binding international treaty on climate change). Climate change is further included in our material matters: Climate (physical risk) and climate (transition risk). Our Climate change position statement, (see www.sibanyestillwater.com/sustainability/reports-policies/) sets out our approach to climate change. As articulated in this policy and other strategic documents we are committed to the following: • Execute our energy and
decarbonisation strategy to achieve carbon neutrality by 2040 (scope 1 and 2) • To achieve net zero status by 2050 • Track our GHG emissions (absolute emissions) against targets approved by the Science-Based Targets initiative(SBTi) • Build operational resilience to the effects of climate change and support stakeholders affected by climate change, including host communities • Implement the recommendations of the TCFD studies and address risks and opportunities presented by climate change • Positively influence climate-related policy and decision-making through advocacy and participation in forums and stakeholder platforms • Encourage supply chain partners to adopt climate-resilience and emissions reduction approaches MINIMISING OUR ENVIRONMENTAL IMPACT continued IR - 189

Our intention to enter the battery metal space has been realised with our acquisition of a stake in lithium projects in Finland and in the US, and with our Century operations, a leading Australian tailings retreatment that produces zinc compounds by reprocessing legacy base metal tailings. The move into battery metals was preceded by the acquisition of SFA (Oxford) as a leading thought provider in both PGMs and battery metals. This has enabled us to build up our battery metal portfolio. These interests, together with our US recycling business, position the Group for the transition to a future green energy economy and to support the global energy transition. Our aspiration to be a climate change-resilient business directs our attention towards climate-resilient opportunities. As a large electricity consumer, effective energy management is the most fundamental way in which we can contribute to mitigating climate change, while also addressing electricity constraints in the SA region. Our commitment to carbon neutrality by 2040 is underpinned by our energy and decarbonisation strategy. Further, our commitment to the ICMM Climate Change Position Statement (2021) aligns us with the goal of achieving net zero by 2050, or sooner. We have also set a revised SBTi-aligned target for 2030 whereby we intend to reduce our scope 1 and 2 emissions by 42% compared to a 2021 baseline. For more on our Energy and decarbonisation strategy, see page193 and Climate change supplement, www.sibanyestillwater.com/ news-investors/reports/annual CDP During the year, we provided disclosure through our annual submissions to the CDP (formerly the Carbon Disclosure Project), across climate and water. Our climate CDP score for the 2023 reporting year was A- (from A- in 2022); and it was A- for water (2022: B). This is a pleasing result, especially on the water side and confirms our commitment to improving water stewardship going forward. Since our TCFD studies have been completed and the findings thereof are in the process of implementation, we are considering not continuing with the CDP Climate disclosure. This would avoid duplication moving forward. See 2023 Water and climate change CDP disclosure submission, www.sibanyestillwater.com/sustainability/environment; and www.cdp.net/en TCFD The TCFD is the recognised standard for climate disclosures in industries like ours. In 2023 we employed the services of a risk consultancy firm to assist us in finalising a risk analysis and a gap analysis to align us with the TCFD. The report split the risk into two aspects (physical and transitional) and applied materiality criteria relevant to the Group. There are various outcomes of the analysis, not least of all an interactive dashboard for our climate physical risks. We also have projected financial losses due to climate change, which will be embedded in our financial planning and risk management processes. For a full and detailed discussion of the TCFD and scenario analysis see Climate change supplement, www.sibanyestillwater.com/news- investors/reports/annual Climate change risk management Climate physical risk and Climate transition risk are two of our material matters. These risks (as well as other environment-related risks) have been assessed, taking into consideration different climate-related scenarios. Our models considered three climate warming scenarios for four out of the six transitional risks. These climate scenarios are: no policy (i.e., a world where governments drop all climate regulations, probably leading to 4°C global warming); stated policy (i.e., government policies stay as they are, probably leading to 2.5°C global warming); Paris Ambition (i.e., governments adopt the Paris Agreement, an international treaty to limit warming to below 2°C above pre-industrial levels.) Our models considered two physical risks climate scenarios a best- case scenario 1.5°C warming and a worse-case scenario 4°C warming. Apart from risks, climate change also provides opportunities that could be explored, such as a potential increase in demand for green and critical metals that play a significant role in the transition to a low-carbon economy. See Climate change supplement, www.sibanyestillwater.com/news-investors/reports/ annual 13.1, 1.5 South African carbon tax – a transitional risk South Africa’s Carbon Tax Act of 2019 levies a tax on GHG emissions. The effective carbon tax rate at the time of the promulgation of the Act (May 2019) was R120 per tonne of CO2e, raised to R144 per tonne for the 2022 tax year, and then to R159 per tonne for the 2023 tax year, and could potentially reach R462 per tonne of CO2e in 2030 based on Government’s pronouncements. These rates are subject to tax-free transition allowances and there is still uncertainty as to how these will be phased out towards 2030. Phase 2 of the Carbon Tax Act will come into effect in 2026. This suggests that our carbon tax liability will increase significantly from 2026 onwards but as stated there is a significant level of uncertainty around the tax free allowances. Sibanye-Stillwater participates in discussions with the Minerals Council and with National Treasury, for better understanding of phase 2 implementation of the Carbon Tax Act. During the year, we paid R1.91 million in carbon tax (R1.89 million in 2022). The carbon tax liability for the 2023 financial year is currently being calculated and verified and will be payable in July 2024. According to the findings of the scenario analysis, carbon policy is our primary transitional risk, and particularly carbon tax for the SA region. See Climate change-related disclosure report, www.sibanyestillwater.com/news-investors/reports/annual Measuring carbon emissions For determining carbon emissions, we follow the GHG Protocol, developed by the World Resources Institute (WRI) and the World Business Council for Sustainable Development (WBCSD). The GHG Protocol is the world’s most widely used GHG accounting and reporting standard. As per the GHG protocol, we consider the location based method for scope 2 (emissions from purchased electricity). We discontinued tracking our scope 2 market based emissions as data availability became a significant constraint. Our inventory covers all relevant greenhouse gases as identified in the Kyoto protocol and applies the global warming potentials (GWPs) from the Intergovernmental Panel on Climate Change Second Assessment Report to determine a carbon dioxide equivalent (CO2e) value. Our scope 1, 2 and 3 emissions, excluding AUS region, are assured (limited assurance) by KPMG (See Statement of assurance, page 285). MINIMISING OUR ENVIRONMENTAL IMPACT continued IR - 190

Sibanye-Stillwater calculates emissions for facilities under its operational control and includes all relevant materials as purchased by the Group. GHG emissions also include, within scope 3, those from facilities owned but not controlled by Sibanye-Stillwater, whereby an equity share approach is applied. Regarding our scope 3 emissions, further reviews of our supply chain and downstream users of our products are planned for 2024; we see the improvement of our scope 3 inventory as an ongoing journey. We track carbon emissions and decarbonisation performance monthly against our annual emission threshold targets, at both Group level and for individual operations. We have an online carbon inventory platform for enhanced monitoring and to increase the integrity of our data, with emission factors updated annually. In 2023, 79% of the Group’s emissions stemmed from electricity consumption (scope 2), almost exclusively (97%) attributable to South Africa’s power utility, Eskom, which derives the vast majority of its electricity from coal. In South Africa we are beholden to Eskom, which has a legislated monopoly on power generation. However, new electricity regulation in 2021 has allowed us to progress our renewable energy projects more expeditiously. Our SA operations are extensively electrified (with electricity accounting for 91% of operational emissions), which means our investment in renewables will yield rapid decarbonisation results. Direct emissions (scope 1) made up 5.3% of overall emissions, while indirect emissions related to our value chain (scope 3) contributed 16.1%. In 2023, our scope 1 emissions (including fugitive mine methane) decreased by 15.8%, largely attributable to a decrease in fugitive mine methane, which decreased by 23.2% year-on-year. This was partially offset by a net increase in the quantity of diesel consumed across the SA gold operations (71%) due to the use of diesel generators to offset Eskom load curtailment. Diesel consumption at the SA PGM operations decreased by 3.1% year-on-year. Overall, there was an increase in scope 2 emissions (0.9%), and increase in scope 3 emissions (12%). Year on year for scope 1 and 2 the emissions decreased by (21.5)Mt CO2e. In 2022, we commenced with a trial, which is ongoing, of battery- electric vehicles covering a range of applications (utility, load and haul and personnel carriers). This is in support of decarbonisation of our operations. In South Africa we have an average of 1,125 employees working from home, which reduces the transport related emissions associated with travelling to work. Total CO2e emissions: scope 1, 2 and 3 (000t CO2e)5 2023 2022 2021 4Group US region EU region AUS region6 SA region 4Group US region EU region SA region 4Group US region SA region Total PGMs PGMs Gold Total PGMs PGMs Gold Total PGMs PGMs Gold Scope 1 (excluding fugitive mine methane)1 208 51 13 Not yet reported 113 31 223 50 5 129 39 225 56 110 59 Scope 1 (fugitive mine methane)1 209 0 0 Not yet reported 0 209 272 0 0 0 272 278 0 0 278 Total scope 1 417 51 13 Not yet reported 113 240 495 50 5 129 311 503 56 110 337 Scope 2 location-based2 6,213.5 173 1.5 Not yet reported 2,932 3,107 6,157 201 1 2,994 2,961 6,799 203 2,913 3,683 Scope 3 7 1,273 53 Not yet reporte d Not yet reported 942 278 1,137 59 N/A 713 365 1,506 123 823 560 Total scope 1, 2 and scope 3 7,904 277 15 0 3,987 3,625 7,823 344 6 3,836 3,637 8,815 389 3,846 4,580 CO2e intensity (per tonne milled) for scope 1 and 23 0.14 0.17 N/A Not yet reported 0.08 0.32 0.13 0.23 N/A 0.08 0.33 0.16 0.17 0.10 0.27 1 Scope 1 emissions include fugitive mine methane, but separately shown in this table. We are reporting our fugitive mine methane emissions in the Free State province of South Africa in line with the transparency principle of the ISO 14064 GHG quantification standard 2 The location-based method reflects the average emissions intensity of the grid, based on the company’s location. This method allows companies to calculate emissions that are physically being emitted into the atmosphere, based on average energy generation emission factors for defined locations, which may include local and national boundaries 3 The ore at the US PGM operations is of a higher grade, contributing to a higher intensity rate for milling 4 Group total is inclusive of corporate-related emissions. Keliber lithium project excluded from EU and Group total as the project is still under construction 5 Excludes Mimosa and DRDGOLD as we do not have operational control (they are managed by other companies) 6 The Group is implementing the carbon inventory system in AUS region and GHG emissions for Australia will be reflected in 2024 7 Scope 3 for EU and AUS not yet reported. Limited assurance conducted on scape 3 categories 1,2,5,6,7,9 and 13 9.4 MINIMISING OUR ENVIRONMENTAL IMPACT continued IR - 191

Science-Based Target Initiative (SBTi) targets Our commitment remains to be carbon neutral by 2040 across our scope 1 and 2 emissions and carbon zero by 2050. In support of this goal we have set near-term decarbonisation targets to track and drive decarbonisation in line with the latest climate science. In 2019, the SBTi, an independent initiative to drive ambitious climate action in the private sector by enabling organisations to set science-based emissions reduction targets, approved our scope 1 and 2 emissions reduction target of 27.3% by 20251, from a 2010 base year. As this target was set before the acquisition of several operations and projects, in 2023 we formulated an updated SBTi-aligned scope 1 and 2 emissions reduction target of 42% by 20302, from a 2021 base year. SBTi approval of the 2030 target is being sought in 2024. Progress to achieve the 2025 SBTi target Scope 2025 target 2023 emissions 2022 emissions Scope 1 N/A 417,000 495,085 Scope 2 location-based N/A 6,213,500 6,156,661 Scope 1 and 2 location-based N/A 6,630,500 6,651,746 Scope 1 and 2 (excluding Marikana)3 5,676,919 5,441,1084 5,092,910 1 Excludes Marikana, Keliber lithium project, Sandouville and Century operations 2 Excludes Century operations as these are currently being integrated into our carbon reporting 3 The only emissions scope with an approved SBTi target (scope1 and 2) 4 Marikana operations were excluded from the SBTi target as it was set prior to the acquisition of Lonmin, Keliber lithium project, Sandouville and Century hence not included in this figure During 2023, our Group scope 1 and 2 carbon emissions, excluding the Marikana operations, increased by 7% compared to 2022, however the target was still comfortably met. SA region Year-on-year scope 1 emissions (including fugitive mine methane) in the SA region (SA gold and SA PGM operations) decreased by 19.7%. The decrease is largely due to a 23% reduction of fugitive mine methane at the SA gold Beatrix operation, and a 3.1% year-on-year decrease of diesel consumption across the SA PGM operations. US region Year-on-year scope 1 emissions increased by 2% at our US PGM operations; while scope 2 emissions decreased by 14%. Overall, scope 1 and 2 emissions decreased by 11% year-on-year. EU region Scope 1 and 2 GHG emissions of the Sandouville nickel refinery were incorporated into the Group carbon inventory in 2022. The operation was also the first to be loaded onto our new online carbon inventory platform. A life-cycle assessment (LCA) for the operation was conducted in 2023, in accordance with ISO 14040, and was assessed by an independent assessor. Similarly, an LCA was conducted for Keliber in 2023. These studies are important to further evaluate our carbon footprint of our specific products. MINIMISING OUR ENVIRONMENTAL IMPACT continued IR - 192

GROUP ENERGY AND DECARBONISATION STRATEGY –––––––––––––––––––––––––––––––––––––––––––––––––––––––––––––––––––––––––––––––––––––––––––––––––––––––––––––––––––––––––––––––––––– Our energy and decarbonisation strategy underpins our commitment to carbon neutrality by 2040. The strategy aims to achieve reduced GHG emissions, security of energy supply, reduced energy and carbon costs, and a just energy transition for our immediate stakeholders. It further enables us to contribute to the UN SDGs 7, 9 and 13. Our energy and decarbonisation strategy enables us to forecast our Group GHG emissions (scope 1 and 2) over the life of our mines under different scenarios, as depicted in the figure below. This enables to us to plan adequate active interventions to ensure our operations decarbonise in line with a 1.5°C pathway, achieve our near-term targets and ultimately carbon neutrality. Six levers support the achievement of our energy objectives and decarbonisation pathway: 1. Decarbonisation advocacy and just transition 2. Demand-side energy management 3. Strategic energy sourcing 4. Technology adoption 5. Scope 3 emission reduction 6. Carbon offsets Sibanye-Stillwater GHG emissions profile (Scope 1 and 2) m TC O ₂e FORECASTED GROUP GHG EMISSIONS AND DECARBONISATION PATHWAY (SCOPE 1 AND 2) Actual 1.5 degree / SBTi-aligned pathway Business-as-usual Planned Sibanye-Stillwater 2030 pathway Sibanye-Stillwater ambition pathway 2019 2020 2021 2022 2023 2024 2025 2026 2027 2028 2029 2030 2031 2032 2033 2034 2035 2036 2037 2038 2039 2040 2041 2042 0 1 2 3 4 5 6 7 8 MINIMISING OUR ENVIRONMENTAL IMPACT continued IR - 193 2030 target – 42% reduction from a 2021 base 2040 carbon neutral 1 Indicative based on 2024 life-of-mine production profiles and planned interventions, excluding Century operations. Subject to several assumptions and may change. Will be updated for material divestment, acquisitions and/or projects

Decarbonisation advocacy and just transition Sibanye-Stillwater advocates for accelerated decarbonisation and a just energy transition through engagements with national and local government, regulators and utilities in the jurisdictions where we operate. In South Africa, we are members of the Energy Intensive User Group (EIUG), the Industrial Task Team on Climate Change (ITTCC) and the Minerals Council of South Africa. Through these industry bodies we engage with government, the National Energy Regulator (NERSA) and Eskom. These engagements help bring about positive reforms and regulatory amendments to close the electricity supply deficit, mitigate the impact of load curtailment, and accelerate decarbonisation. Our membership to organisations such as the WGC and the ICMM (which publicly supports the Paris Agreement) underpin our commitment to a science-based decarbonisation pathway. One of our four sustainability themes is Entrenching long-term economic sustainability through promoting integrated post-mining economies. Our sustainability roadmap notes that the nature of these economies should be low-carbon, climate resilient and digitally transformed. In short, we are committed to supporting the communities in our areas of operation, and post-mining communities, in adapting to the risks and opportunities of climate change. Decarbonisation presents a unique opportunity to support the communities in our areas of operation through the deployment of renewable energy projects. These projects create local employment and are designed to meet the requirements of the Mining Charter and promote socioeconomic development. Climate change and climate resilience are considered in our social labour plans (SLP) (legislated commitments for socioeconomic improvement of mining communities). A key feature of our SLPs is to improve the resilience of communities post-mining. Within the SA region we have an agreement with Gift of the Givers Foundation (a disaster response NGO) to provide support should unwanted events, including those that are climate change induced, occur at our operations. Gift of the Givers Foundation is the largest disaster response non- government organisation in Africa. Demand-side energy management All our operations have five-year demand-side energy management programmes. Our demand-side energy management interventions include, amongst others, digital twinning, supervisory control and data acquisition (SCADA), automation, real-time monitoring, dynamic control initiatives, energy waste elimination, and energy awareness initiatives. Our energy consumption is accounted for through our carbon inventory, in line with the requirements of the GHG Reporting Protocol. SA region Our SA operations achieved an energy efficiency improvement of 196GWh (3.1% reduction) against our 2023 energy plan, equating to abated scope 2 emissions of 197,960 tCO2e. Although 63 load curtailment events occurred within 2023 (2022: 57), with the required load reduction ranging between 10–20% over several hours each, our operations were able to minimise production losses through a new predictive load curtailment response model, coupled with enhanced demand-side energy management interventions and operational emergency protocols. The predictive load curtailment response model was used to simulate and predict optimal load curtailment response actions, solving for the best possible operational and financial outcome for each event. These mitigation actions resulted in an estimated R308 million reduction in production impact compared to 2022. MINIMISING OUR ENVIRONMENTAL IMPACT continued IR - 194 SCIENCE-BASED DECARBONISATION PATHWAY • Paris Agreement and GHG pathway required by science • Science based target initiative targets • Nationally determined contributions • 2040 carbon neutrality commitment GROUP AND REGIONAL DECARBONISATION PATHWAY TARGETS • Forward-looking annual scope 1 and 2 emission pathway targets (in mtCO2e) that ensure balanced delivery on our 2030 and 2040 commitments • Process to be run concurrently with operational budgeting and completed in January each year following the finalisation of operational budgets and life of mine (LOM) • The annual scope 1 and 2 emission pathway targets will inform the long-term incentive target on a 5-year rolling basis, adjusted for material influencing factors LIFE OF MINE AND OPERATIONAL BUDGETS • Production profiles and associated energy requirements • Forecasted GHG emissions profile • Required decarbonisation interventions and offsets • New projects and acquisitions SCIENCE-BASED DECARBONISATION PATHWAY • Grid emission factors • Investor and customer requirements • Industry-body requirements e.g. ICMM • Government-imposed corporate carbon budgets • Technology availability • Carbon market mechanisms

SA gold operations Through our demand-side energy management interventions, our energy savings amounted to 165GWh (4.8% reduction) against our 2023 energy plan (89GWh and 2.8% in 2022). 2023 energy intensity increased to 1.08GJ/tonne milled (2022: 1.05GJ/tonne milled; 2021: 0.83GJ/tonne milled). Total energy consumption for 2023 was 11.4 petajoules (PJ) (2022:10.4 PJ), primarily in the form of electricity from Eskom (97%). SA PGM operations SA PGM operations’ 2023 electricity consumption was 3.6% above budget, although partially offset by total energy savings of 31GWh, which was 1.1% of budget (31GWh and 1.0% of budget in 2022). 2023 energy intensity increased to 0.31GJ/tonne milled (2022: 0.30GJ/tonne milled). Total energy consumption for 2023 was 11.6 petajoules (2022: 11.6PJ), primarily in the form of electricity from Eskom (90%). Notably, electricity contributes 96% of SA PGM’s scope 1 and 2 emissions, with diesel and coal contributing the vast majority of the balance. US region Energy demand at our US PGM operations remained relatively constant year-on-year at 1.8 petajoules (1.7PJ in 2022). Year-on-year energy intensity decreased to 1.33GJ/tonne milled (2022: 1.58GJ/tonne milled). Energy consumption was primarily in the form of grid-supplied electricity (76%). EU region In 2023, Sandouville consumed 0.27PJ (0.25PJ in 2022) of energy, primarily in the form of electricity (57%). The operation achieved ISO 50001: Energy management system certification in early 2023 and is currently implementing the associated energy management plan. AUS region The Australian region, including the Century operation, Karumba operation and Mt Lyell, consumed 1.00 PJ, largely in the form of electricity (83%). TOTAL ENERGY CONSUMPTION BY OPERATION (PJ) 11.36, 43.6% 11.60, 44.6% 1.80, 6.9% 0.27, 1.0% 1.00, 3.8% SA gold SA PGM US PGM EU region AUS region TOTAL ENERGY CONSUMPTION BY SOURCE (PJ) 20.3, 78.0% 2.4, 9.2% 1.1, 4.2% 1.6, 6.1% 0.04, 0.2% 0.6, 2.3% Grid-supplied electricity (Non-renewable) Grid-supplied electricity (Renewable) Grid-supplied electricity (Nuclear) Diesel Biodiesel Other A total of 9.2% of Group energy consumption is supplied by renewables and 4.2% by nuclear sources. Strategic energy sourcing and renewables Sourcing energy from low-emissions sources is our strongest lever for reducing our GHG emissions footprint, particularly for the SA region given that Eskom is responsible for 91% of Group scope 1 and 2 emissions. SA region The SA region has developed a 632MW pipeline of solar and wind projects to supplement 30% of current utility supply with low-cost, renewable energy. The region, through the respective independent power producers (IPPs), was successful in advancing 267MW of generation capacity (two wind projects and one solar project) into the construction phase. This places Sibanye-Stillwater in the top three private power procurers in South Africa. The three projects will reach commercial operation by the end of 2025, and are expected to reduce GHG emissions by c.920,000tCO2e per year (15% of Group scope 2 emissions). The balance of projects are planned to reach financial close in 2024 and commercial operation by the end of 2026. The projects are expected to deliver starting electricity tariffs at a 20-30% discount to utility tariffs, thereafter escalating at CPI. The projects further assist in mitigating future carbon tax liabilities associated with the use of fossil fuel-based electricity. These renewable projects all comply with the requirements of the Mining Charter and they have a socioeconomic development benefit, through bespoke programmes based on local needs. Sasol has given notification to our precious metals refinery (PMR) that it will no longer be in a position to provide natural gas from July 2026. Alternative sources of gas and other technology solutions are currently being assessed. The PMR is the only operation affected. 7.2 MINIMISING OUR ENVIRONMENTAL IMPACT continued IR - 195

Extensive renewable energy programme: 267MW private sector power capacity under construction MINIMISING OUR ENVIRONMENTAL IMPACT continued IR - 196 Delivery of first wind turbine components at the Port of Coega Complete wind turbine foundation Casting of a wind turbine foundation 7.2First multi-buyer renewable energy project

EU region Keliber lithium project (Finland) and Sandouville (France) are situated in countries with some of the lowest grid emission factors in the world, at 0.095tCO2e/MWh and 0.036tCO2e/MWh, respectively. Both Sandouville nickel refinery and Keliber lithium project are, or will be, using steam as a major heat vector. This steam is mainly produced with waste heat from neighbouring industrial sites or waste incineration. This is highly favourable and as a result will contribute very little to overall Group emissions. Life cycle assessment (LCA) studies have been completed for both Keliber and Sandouville, which has highlighted several decarbonisation opportunities, including energy supply. AUS region The CopperString 2032 project involves 840km of new electricity transmission line from just south of Townsville to Mount Isa to connect Queensland’s North West Minerals Province to the National Electricity Market. Approximately 200km of additional transmission line will be required to connect new renewable generators to CopperString. The construction of the project will provide the Century operation with enhanced opportunities to access renewable energy supply. Scope 3 emissions reduction Our scope 3 emissions amounted to 12.73Mt in 2023, contributing 16.1% to our total emissions; they primarily stem from third-party processing of our main products, from our investments, and from our supply chain. By-products of our mining processes are currently not included. During 2024/5 a comprehensive review of our scope 3 inventory is planned to further minimise assumptions made and to ensure that our coverage regarding all categories improves. We have adopted a target whereby we commit to a screening of suppliers to establish the most relevant purchased goods and their emissions. The screening will cover our top 75 suppliers and will be conducted by end 2025. Electricity consumption (TWh) 2023 2022 2021 SA region 5.98 5.73 6.22 SA gold 3.08 2.85 3.47 Beatrix 0.36 0.42 0.53 Cooke 0.37 0.34 0.36 Driefontein 1.22 0.97 1.18 Kloof 1.10 1.10 1.39 Burnstone 0.03 0.02 0.00 SA PGMs 2.90 2.88 2.75 Kroondal 0.33 0.35 0.37 Rustenburg 1.07 1.08 1.04 Marikana 1.43 1.38 1.28 Platinum Mile 0.07 0.07 0.00 AUS region 0.41 Century1 0.39 Mt Lyell2 0.02 EU region 0.04 0.04 Sandouville 0.04 0.04 Keliber 0.00 NA US region 0.37 0.37 0.37 Stillwater3 0.28 0.28 0.28 East Boulder 0.09 0.08 0.09 Group 6.80 6.13 6.59 1 Century was included in the 2023 calculation, following acquisition on 22 February 2023 and reflects 01 March – 31 December 2023 2 Mt. Lyell was included in the 2023 calculation, following integration from 1 December 2023 3 Includes the Columbus metallurgical complex Energy intensity (GJ/tonne milled)1 2023 2022 2021 SA region 0.45 0.45 0.52 SA gold 1.08 1.05 0.83 Beatrix 0.73 1.47 0.80 Cooke 0.25 0.24 0.22 Driefontein 2.22 2.36 1.53 Kloof 2.90 1.73 1.29 SA PGMs 0.31 0.30 0.37 Kroondal 0.27 0.25 0.23 Rustenburg 0.35 0.35 0.33 Marikana 0.50 0.53 0.49 Platinum Mile2 0.03 0.03 US region3 1.33 1.58 1.35 Stillwater4 1.38 1.67 1.51 East Boulder 0.69 0.78 0.61 Group 0.37 0.48 0.56 1 The energy intensity factor takes into consideration purchased electricity and direct fuels used, which includes petrol, diesel, aviation fuel, liquid petroleum gas, acetylene, coal, paraffin, propane, natural gas, heavy fuel oil and methane 2 Platinum Mile was included in the 2022 calculation, following management integration mid-2021 3 The ore at the US PGM operations is of a higher grade, contributing to a higher energy intensity rate 4 Includes the Columbus metallurgical complex 7.3 Carbon offsets Our carbon offset strategy identifies how offsets can help achieve carbon neutrality by 2040. We intend to reduce our absolute emissions in line with the requirements of the Paris Agreement and the latest climate science. Offsets will be used as a last resort to neutralise remnant, hard-to-abate emissions and achieve full carbon neutrality. We envision these offsets would be less than 2% of current emissions. We are actively seeking to link carbon offsets with our local agri-industrial and rehabilitation programmes; our expectation is that global harmonisation in this field will take shape over the next couple of years. MINIMISING OUR ENVIRONMENTAL IMPACT continued IR - 197

AIR QUALITY –––––––––––––––––––––––––––––––––––––––––––––––––––––––––––––––––– Our different regions of operation have different legislative conditions. Over and above complying to these, we have our own strategic objectives, as stipulated in our Air quality position statement, supported by strategic initiatives and detailed action plans. See our position statement www.sibanyestillwater.com/ sustainability/reports-policies/ SA region All of our SA operations use a standardised procedure, risk management framework and best practices to inform air quality and dust fallout management. Our point source monitoring campaigns are conducted as per approved methods, ensuring regulatory compliance. Annual external audits determine compliance to our atmospheric emission licence (AEL). All operations with AELs submit annual reports to the licensing authorities; emission inventory data for the applicable sources are reported onto South Africa’s National Atmospheric Emission Inventory System. For the 2023 reporting period, the SA gold operations achieved an AEL compliance audit of 87% (2022: 96%); and the SA PGM operations (including the smelter, assay laboratory, base metal refinery, and precious metals refinery) achieved 100% AEL compliance (2022: 100%). Various air quality management measures, including plant operational levers and abatement technologies, are in place to reduce emissions and enable sustained AEL compliance. We are on target to meet our aim of improving SO2 capturing and cleaning efficiency from 80% to 90% by 2027, and to 99% by 2030, while maintaining full compliance with our AEL. The precious metals refinery (PMR) continues with implementation of its emission reduction plan, by which we aim to surpass the standards of compliance. As part of our environmental authorisation for our SA gold operations, we monitor volatile organic compounds on a six monthly basis at Driefontein and Kloof. Stakeholder engagement Sibanye-Stillwater participates in local air quality management forums. These include, among others, air quality forums in the Highveld priority area and the Waterberg-Bojanala priority area; where, among other things, we share air quality data. We also engage with communities to identify and resolve air quality concerns. In October 2023, we received a complaint from the community about emissions from our smelter. The incident occurred during the plant start-up phase. An investigation was completed and feedback provided to the stakeholders. Recommendations being implemented include a proactive mechanism to inform key stakeholders on startup events. Nitrogen oxide and sulphur dioxide emissions (tonnes and intensity per tonne milled/treated) 2023 Emissions (in gram per tonne milled/ treated) 2023 Emissions in tonnes 2022 Emissions (in gram per tonne milled/ treated) 2022 Emissions in tonnes 2021 Emissions (in gram per tonne milled/ treated)4 2021 Emissions in tonnes Nitrogen oxides (NOx) SA region1 36.0 1,569.0 31.6 1,529 30.9 1,388.0 SA PGM operations1 34.0 1,244.0 33.6 1,294 40.2 1,198.0 SA gold operations 38.0 397.0 23.7 235.0 12.5 190.0 AUS region N/A N/A EU region N/A 10.7 US region3 90.0 357.0 331.0 418.0 344.9 530.0 Group 34.0 1,926.0 39.1 1,947.0 41.3 1,918.0 Sulphur dioxides2 (SO2) SA region 44.0 1,642.5 53.2 2,576 38.8 1,743.0 SA PGM operations 44.0 1,642.5 66.9 2,576 58.5 1,743.0 SA gold operations N/A N/A N/A N/A N/A AUS region N/A N/A EU region N/A 0.1 US region 0.6 0.8 1.2 1.5 2.5 3.8 Group 15.0 1,643.2 51.9 2,577.5 37.6 1,746.8 1 Nitrogen oxide emissions for SA are derived by the multiplication of fuels (diesel, petrol, liquid petroleum gas, coal, helicopter fuel and paraffin) by the corresponding emission factors 2 SA region: Sulphur dioxide emissions are from the Marikana PGM smelters and quantified through a combination of stack measurements and mass balance. The US region also include SO2 emissions from the Columbus metallurgical complex. SO2 emissions from the EU region were not assured. 3 The ore at the US region is of a higher grade, contributing to a higher intensity rate using tonnes milled versus ounces output 4 EU region: Keliber lithium project excluded as still in project phase Year-on-year, there was a decrease of 1.1% in absolute NOx emissions at Group level. In terms of NOx, the SA region showed a year-on-year increase of 2.6%. The US region showed a decrease of 14.6% in NOx emissions for 2023. The Group’s overall NOx intensity (grams of NOx emission emitted per tonne milled/treated) decreased year-on-year by 13.%. The Group’s overall SO2 intensity (grams of SO2 emitted per tonne milled/treated) decreased year-on-year by 71%. This is attributable to the record low emissions from the US region and year-on-year reduction in emissions from the smelter operations at Marikana, due to improved availability of abatement equipment and lower sulphur levels in fuels and raw materials being processed. MINIMISING OUR ENVIRONMENTAL IMPACT continued IR - 198

US region During the year under review our US PGM metallurgical complex emitted 0.78 tonnes of SO2, which is only 1% of the permit limit. This is a record low for the metallurgical complex, attributed to improved planned maintenance, process improvements, redundant circuits, and an overall heightened focus on the SO2 scrubbing system. The scrubber system continues to be effective in capturing and treating more than 99% of the SO2 produced. EU region Our environmental code now includes the EU air quality directives (2008/50/EC) and those relating to arsenic, cadmium, mercury, nickel and polycyclic aromatic hydrocarbons in ambient air (2004/107/EU). The directives prescribe that we set limits, and that emissions of industrial pollutants in the atmosphere are declared regularly and subject to a dedicated tax called TGAP (“Taxe Générale sur les Activités Polluantes”) which can be converted in donations to regional air quality monitoring agencies. Our emissions did not attract any extra taxes or fines in the year under review. During construction phase there is no air monitoring at the Keliber lithium project sites, but we participate in the joint air quality monitoring program of the Kokkola Industrial Park. As the operations start, there will be monitoring according to the environmental permit requirements. SA region: Dust Our SA region has a dust fallout monitoring system in place. We also have various control and mitigation measures, including canon- spraying, ridge ploughing on TSFs, application of chemical dust suppressants, use of netting, and planting of indigenous tamarisk trees. The dormant TSF and residual storage facilities are part of an ongoing closure and rehabilitation plan. During 2023, our dust fallout levels were maintained at a compliance level of 98% for our SA gold operations and 96% for our SA PGM operations. Compliance levels are measured by dust buckets, monitored according to American Society for Testing and Materials (ASTM) standards and in compliance with South African legislation, as per the National Dust Control regulations. Exceedances are investigated and reported to authorities. See Health, wellbeing and occupational hygiene, page 144 for more on dust as an occupational health concern. WATER MANAGEMENT –––––––––––––––––––––––––––––––––––––––––––––––––––––––––––––––––– We use water for primary mining activities, mineral processing, cooling, ore, waste/tailings conveyance, industrial processes and human consumption. Our position statements set out our water conservation and water demand management and water health management objectives. One of our key sustainability targets is to reduce our reliance on purchased potable water. Although we did not meet our 2023 targets for reducing our water reliance from external suppliers in the SA region, we remain focused on the projects to reduce our dependence on purchased water. Our goal is to reduce our total purchased water by approximately 7% per annum compared to a baseline of 21,343ML over the next three years with further refinement for 2025 and 2026 planned. This is a new target that encompasses various previous targets and applies to the Group excluding Australia and Keliber. This target translates into an absolute annual reduction of approximately 1,400ML, excluding previously mentioned regions and any new developments or future acquisitions. The bulk of this targeted reduction is planned for the SA region, where water scarcity is of utmost concern, especially in the regions where our PGMs are mined. The SA gold operations achieved water savings for most sites during 2023. For the SA PGM operations, due to various factors, water treatment projects at Kroondal and Marikana did not materialise, thus impacting projected potable water savings planned for 2023. The completion of the Hartebeespoort storage dam and associated pipeline in 2024 will support the SA PGM operations’ water security initiatives and will trigger the water treatment plant construction processes. Upon completion of this initiative more impacted external water will be available at the SA PGM operations. This water will be the input into our planned water treatment facilities which will reduce the Rand Water requirements. For the US PGM operations and other water positive regions, our emphasis is on water quality and preserving the natural ecosystems in the catchments where we operate. Our target to reduce potable water purchases at our SA gold operations by 800ML from the 2022 baseline of 5,351ML was not achieved. The main reason for not achieving our target was a sinkhole that developed at our Driefontein operations, which, as a result of major infrastructure damage especially to a potable water main line, prevented potable water from being conveyed from the water treatment facility to the mining operations. We did however reduce purchases by 227ML. Similarly, our target to reduce potable water purchases at our SA PGM operations by 361ML from the 2022 baseline of 12,051ML was not achieved. Our main goal of reducing potable water reliance on the stressed Integrated Vaal River System in the SA region will continue. SA region Our SA PGM operations are situated in water-stressed areas in South Africa’s North West province. Here we rely on municipal utilities for some 58% of our water needs. By contrast, our SA gold operations in the West Rand are overlain by dolomitic aquifers and are largely water-positive. Our operations require that we pump large volumes of ingress water (fissure/ extraneous water) from deep workings. This is an energy-intensive and expensive process, particularly for mines with small profit margins. Ingress water at our SA gold operations is more than double the water requirements for these operations; the surplus water is used to good effect in gradually reducing our potable water reliance on external sources, over time. All of the excess water is treated and discharged, which is generally positive for the environment/catchments and for surrounding communities. In 2023 we offset our municipal potable water demand by 22.32ML per day at the SA gold operations and by 7ML per day at the SA PGM operations, by treating impacted mine water to potable water standards and by utilising grey water. This made more potable water available in the Integrated Vaal River System, which serves communities in Mpumalanga, Free State, North West and Gauteng. Our strategic water risk mitigation Globally, overall water risks are classified into three categories: • Physical risks (quantity), e.g water stress, water security of supply, water pricing, drought, riverine flooding, coastal flooding, etc. • Physical risk (quality), e.g. poor water quality (inbound water), poor water quality (discharged water), water pollution, etc. • Regulatory and reputational risk, e.g. onerous country or catchment specific legislation, lack of water stewardship, lack of WASH services, etc. MINIMISING OUR ENVIRONMENTAL IMPACT continued IR - 199

Our approach to water risk management and mitigation is geared towards mitigating and managing these types of risks at Group and operational level. At regional level we assess our water consumption in impacts and aspects registers. This information is useful setting objectives and action plans. Also as part of our enterprise risk management framework, our risk registers (at operational and Group level) and our impact assessments and environmental management plans, water security has been identified as a top risk in the SA region. Contextual issues are considered as part of the risk management framework, such as water availability, water quality, and impact on human health. The Group uses the World Resource Institute’s tool to assess water- related risks; it is called Aqueduct and it uses open-source peer- reviewed data to map water risks such as droughts, floods and stress. (From their website, see https://www.wri.org/aqueduct) 6.1, 6.3 SA region South Africa’s potable water challenges require innovative water management strategies from big industrial users. Water supply instability, the ever-increasing costs of water, and the impacts of climate change could put the sustainability of a mining operation at risk. The strategic water risk mitigation measures are captured within our water conservation and water demand management strategy (WCWDM). The WCWDM strategy is aligned to UN SDG 6 (Clean water and sanitation) and particularly 6.2 (End open defecation and provide access to sanitation and hygiene), and 6.3 (Improve water quality, wastewater treatment and safe reuse). Our strategy is to continue to demonstrate thought leadership in WCWDM practices, while promoting business sustainability through ensuring water security and, where applicable, water independence. By doing so, we strive to play our part in promoting SDG 6, providing cleaner water for downstream users and promoting water stewardship (including water system quality, ecosystem functionality, and flow management). From 2020 to 2023, accumulated reduction of purchased potable water at our SA operations amounts to 5,834 ML; constituting a 10% reduction from the 2020 baseline. Stakeholder engagement We participate in various external stakeholder forums that include a variety of groups: industry, government, research institutions, and community organisations. These forums include, but are not limited to: • Water catchment management forums hosted by the Department of Water and Sanitation (SA Region) • Water forums hosted by the Rand Water Board (SA Region) • Water working groups hosted by the ICMM, with links to the ICMM biodiversity working group • SA Mineral’s Council engagement opportunities Integrated catchment management discussions have commenced for the West Rand and Rustenburg areas, where future projects are being determined. We have also participated in establishing several inter-company partnerships to collaborate on improving catchment management. At our US PGM operations, the GNA Councils are actively involved in water quality monitoring through an adaptive management plan (AMP). The AMP is an independent water monitoring plan and triggers appropriate responses to water quality. Monthly AMP monitoring reports are generated by GNA technical consultants, keeping GNA stakeholders informed about water quality trends. Types of engagements and contributions include expert knowledge for national policies, best practice and guidelines on water monitoring, restoration and mine closure, reaching out to South Africa’s Minister of the DWS, playing our part in resolving pollution in the Integrated Vaal River System, involvement in the Freshwater Ecosystem Network. See Social and labour plans: summary of projects in South Africa; The Good Neighbor Agreement, www.sibanyestillwater.com/news-investors/reports/annual In 2023, for the SA region we sourced 14.4ML/day from municipal and water boards (mainly Rand Water Board and Sedibeng Water Board) at the Gold Operations and 34.7 ML/day at the SA PGM operations. An additional 7 ML/day was sourced from the Rustenburg Municipal Waste Water Treatment Works effluent stream. In 2023, the SA operations spent R313.2 million on potable water purchases from external sources. In the long term our ESG scorecard goal (which is linked to LTI plan) is to reduce our total purchased water footprint by 7% per annum, from a 2023 baseline over the next 3 years (Australian region and Keliber to be included at a later date). In addition, and aligned to our long-term vision to embed water stewardship and climate resilience within our business, we will roll out water stewardship maturity assessments over the next two years (2024 - 2025) to determine firstly a baseline, and subsequently in the latter years of 2026 and beyond, to increase conformance to the ICMM’s water stewardship maturity framework. MINIMISING OUR ENVIRONMENTAL IMPACT continued IR - 200

SA gold operations In 2023, our SA gold operations required a total of 22,473ML, 61% for industrial purposes and 39% for domestic purposes. We have various projects to leverage our excess ground water and reduce dependence on external suppliers. We have a 4ML/day water treatment facility (based on a build-own-operate transfer model) at our Kloof operations. The plant met 28% of Kloof’s potable water demand, reducing our reliance on external suppliers significantly. The Driefontein water treatment facility met 89% of the mine’s 7,458 ML demand in 2023. The production at this facility was significantly impacted by sinkhole formation at the mine, without this event the facility wouldve met 98% of the mine’s water demands. The Ezulwini water treatment facility met 100% of the operational water demand. The Group approved capital expenditure for the construction of a pilot plant for the recycling of ~ 1.3 ML/day wastewater from our wastewater treatment works at Kloof. Designs were approved and orders placed for the manufacturing and delivery of equipment for the pilot plant. If successful, this type of technology will be rolled out to other sites in the SA region and elsewhere. Our SA gold operations can produce over 35ML/day of potable water, utilising three mine water treatment plants, resulting in cost savings of R152.7 million in 2023. SA PGM operations In 2023, industrial usage at our SA PGM operations accounted for most of the potable water use. These litres are precious to Rustenburg, given that the Rand Water Board struggles to meet the demands of a growing city. We have a number of initiatives to manage the impact of water restrictions imposed by them: • Investigate alternative groundwater sources • Optimise water recovery from TSFs • Integrate Marikana with the Kroondal-Rustenburg footprint, thus balancing water requirements across the footprint. Integrating Marikana allows us to transfer water from water-richer areas during the wet season to storage and to drier parts, noting that the Pandora pipeline supplies 6ML/day to our Karee operations • Continued desilting of water containment facilities SA PGM operations have 13 waste water treatment facilities to recycle water back into the process water circuits. The SA PGM waste water works currently recycles 72% of plant effluent back into the operations. The purchase of 7-8 ML/day of recycled treated effluent from the Rustenburg Local Municipality (RLM) wastewater treatment works (via the Rustenburg Water Services Trust) remains a priority. The purchase of this water has positive environmental and socioeconomic benefits, reducing our purchases of potable water and providing RLM with an economic injection for the local economy through the use of local contractors. Effective governance and continuous improvement: reducing water loss We continue to use smart monitoring across our South African operations, ensuring accurate water accounting. Since implementing this technology in 2016 we have expanded it to over 400 monitoring sites; this has helped to reduce our reliance on water in the catchments we operate in. Potable water purchased (ML) 2023 2022 2021 SA gold operations Beatrix 1,881 2,090 2,181 Cooke 156 310 397 Driefontein 805 525 241 Kloof 2,282 2,426 3,469 Gold – total 5,124 5,351 6,288 SA PGM operations Kroondal 882 1,165 1,134 Rustenburg 4,061 3,632 3,496 Marikana 7,750 7,254 7,397 PGM – total 12,693 12,051 12,027 SA region 17,817 17,402 18,315 AUS region 51 EU region1 9.6 8.5 US region 114 69 73.35 Group total 17,941 17,480 18,388.35 1 EU region total water withdrawn was in 2022 an estimated potable water in M3 and not in ML – the updated value is the actual purchased water US region Our US region is largely water independent and water positive. The greatest risk to water quality in the US is nitrogen in our mine water (from explosive residue), which we treat with a natural biological process and release the treated water back into the environment. We are focused on long-term strategies that anticipate seasonal high flows and plan for predicted increased water flows as the underground mines expand over time. At East Boulder, the capacity for biological treatment is being expanded by replacing older fixed bed bioreactors with moving bed bioreactors (MBBR). The latter afford ten times the treatment capacity of the former. One MBBR was completed at East Boulder mine in 2023 and another is planned for 2025. One of the 2023 ESG objectives specific to East Boulder water management was optimisation of the thickener and reagent automation. This project commenced in Q3 2023 and is scheduled to be completed by the end of Q2 2024. Groundwater quality is a current focus for the US PGM operations. Construction of liner systems beneath our waste rock storage facilities has been systematically accomplished over the past eight years. All new waste rock storage areas are designed with liner systems that collect “drain-down” water and send that water back to the water treatment systems. Capture and treatment of this water protects the high quality of the groundwater aquifers at the mining operations. During 2023, the Stillwater mine installed a series of in-situ treatment wells to mitigate elevated concentrations of nitrogen in groundwater near the waste rock storage area. This 2023 ESG objective was completed on schedule and the treatment wells are operational. In addition, the Stillwater mine completed a long- term evaluation and strategy for water management at the Benbow access. The US region implement adaptive management plans (AMP) as part of the GNA. The plans set more stringent requirements than the regulatory ones and trigger responses based on these strict water quality parameters. AMPs are reviewed annually and adjusted to anticipate changing conditions and changing regulation. MINIMISING OUR ENVIRONMENTAL IMPACT continued IR - 201

EU region Sandouville nickel refinery The Sandouville nickel refinery purchases industrial water collected from the Seine River. Water availability related risks have been identified. Water is mainly used for product washing. It is fully released back to the Seine River at one single point after being purified in the site’s internal wastewater treatment plant. The site’s environmental permit and the French Water Agency sets very precise limits in terms of released water quality, especially for nickel, suspended matter and flow rate. Given that the site is equipped with a single sewage network, all industrial water and rain water is drained together. In case of heavy rains, stormwater flow may increase over wastewater treatment design capacity and the plant’s production may have to be temporarily downscaled to respect released water quality limits. Keliber lithium project The Keliber lithium project water risks have been assessed as part of the environmental permitting process. The water management at the mining sites is based on keeping Syväjärvi mine site waters separated from Rapasaari-Päiväneva and generally keeping pure waters from surrounding environment and mine waters separated. All discharged contact (mine and concentrator process) waters are led to the receiving water body through the water treatment system and via a site-wise single discharge point equipped with flow measurement and sampling. Non-contaminated, clean waters from surroundings can be led directly into the ditches. During the construction phase the main risks are related to increased content of suspended solids in the waters being discharged. The newly constructed wetland treatment area did not reach its full effect in 2022 but the limit values were not exceeded during 2023. The risk is being mitigated by continuous monitoring of the water-protection structures and sampling of the discharged waters. AUS region Water is used at Century for hydraulic mining as a method of extraction, coupled with a slurry pipeline to transport the produced concentrates to market via the Port of Karumba. Our biggest risk is the failure of our water system assets. Therefore, we have a conditions monitoring and preventative maintenance strategy in place. The system is coupled with real-time and alarm monitoring. Onsite water inventory in both the evaporation dam and pit has increased significantly following 1:2000 year rainfall in early March. Ongoing monitoring and risk assessments are undertaken to ensure compliance risks are managed. Responsible water stewardship It is standard practice for all our operations to recycle water, for example: • Underground operations: once suspended solids have been removed, recycled water feeds underground operations (US) • Water recycled from tailings facilities: all our tailings facilities are designed so that tailings water is recycled for use in processing plants (US and other regions in part) • Treated sewage effluent: 90% of water at our SA PGM operations is recycled • Recycled water from the western basin: we reuse impacted water at our Cooke surface operations (SA) • At Sandouville and Keliber lithium project, part of the water is used in closed loop for steam generation and can be considered as recycled • At Century operations recycled water is maintained in a close loop system; the only water leaving the recycling loop is water utilised in the 300km pipeline carrying our concentrates to the Port of Karumba. Percentage water recycled 2023 per region 2023 2022 SA gold 72 % 70 % SA PGM 61 % 58 % EU region 12 % — % AUS region 80 % — % US region 60 % 69 % The recycling percentages differ widely across the regions as water management practices differ in combination with process configurations and water scarcity criteria. We do expect further improvements as we reduce our dependence on purchased potable water and purchased water in its totality. The average percentage recycling for the SA Region in 2023 was 66.5%. MINIMISING OUR ENVIRONMENTAL IMPACT continued IR - 202
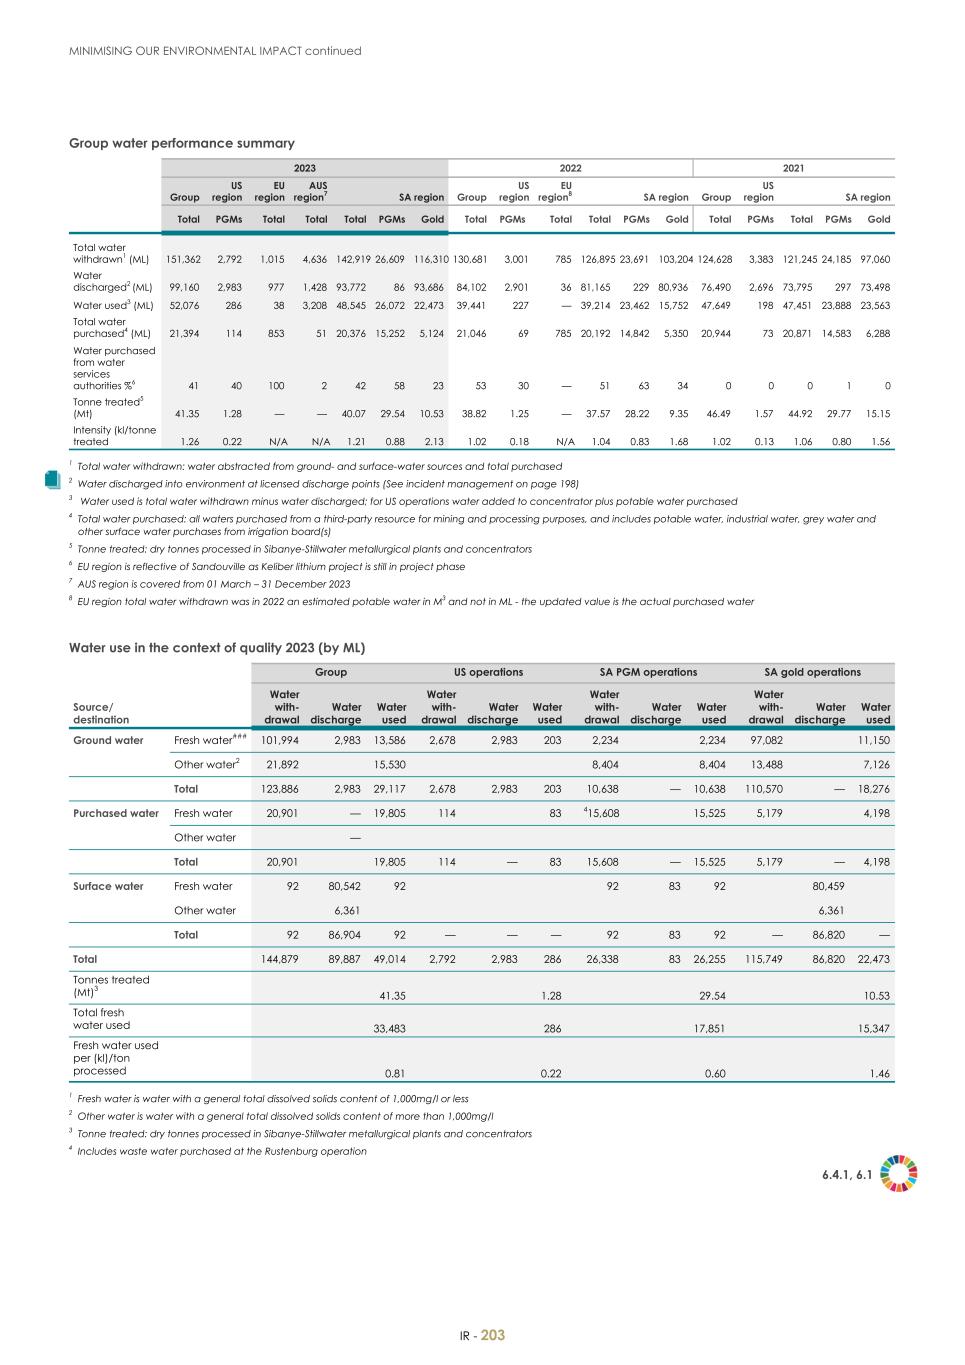
Group water performance summary Total water withdrawn1 (ML) 151,362 2,792 1,015 4,636 142,919 26,609 116,310 130,681 3,001 785 126,895 23,691 103,204 124,628 3,383 121,245 24,185 97,060 Water discharged2 (ML) 99,160 2,983 977 1,428 93,772 86 93,686 84,102 2,901 36 81,165 229 80,936 1 76,490 2,696 73,795 297 73,498 Water used3 (ML) 52,076 286 38 3,208 48,545 26,072 22,473 39,441 227 — 39,214 23,462 15,752 47,649 198 47,451 23,888 23,563 Total water purchased4 (ML) 21,394 114 853 51 20,376 15,252 5,124 21,046 69 785 20,192 14,842 5,350 20,944 73 20,871 14,583 6,288 Water purchased from water services authorities %6 41 40 100 2 42 58 23 53 30 — 51 63 34 0 0 0 1 0 Tonne treated5 (Mt) 41.35 1.28 — — 40.07 29.54 10.53 38.82 1.25 — 37.57 28.22 9.35 46.49 1.57 44.92 29.77 15.15 Intensity (kl/tonne treated 1.26 0.22 N/A N/A 1.21 0.88 2.13 1.02 0.18 N/A 1.04 0.83 1.68 1.02 0.13 1.06 0.80 1.56 2023 2022 2021 Group US region EU region AUS region7 SA region Group US region EU region8 SA region Group US region SA region Total PGMs Total Total Total PGMs Gold Total PGMs Total Total PGMs Gold Total PGMs Total PGMs Gold 1 Total water withdrawn: water abstracted from ground- and surface-water sources and total purchased 2 Water discharged into environment at licensed discharge points (See incident management on page 198) 3 Water used is total water withdrawn minus water discharged; for US operations water added to concentrator plus potable water purchased 4 Total water purchased: all waters purchased from a third-party resource for mining and processing purposes, and includes potable water, industrial water, grey water and other surface water purchases from irrigation board(s) 5 Tonne treated: dry tonnes processed in Sibanye-Stillwater metallurgical plants and concentrators 6 EU region is reflective of Sandouville as Keliber lithium project is still in project phase 7 AUS region is covered from 01 March – 31 December 2023 8 EU region total water withdrawn was in 2022 an estimated potable water in M3 and not in ML - the updated value is the actual purchased water Water use in the context of quality 2023 (by ML) Group US operations SA PGM operations SA gold operations Source/ destination Water with- drawal Water discharge Water used Water with- drawal Water discharge Water used Water with- drawal Water discharge Water used Water with- drawal Water discharge Water used Ground water Fresh water### 101,994 2,983 13,586 2,678 2,983 203 2,234 2,234 97,082 11,150 Other water2 21,892 15,530 8,404 8,404 13,488 7,126 Total 123,886 2,983 29,117 2,678 2,983 203 10,638 — 10,638 110,570 — 18,276 Purchased water Fresh water 20,901 — 19,805 114 83 415,608 15,525 5,179 4,198 Other water — Total 20,901 19,805 114 — 83 15,608 — 15,525 5,179 — 4,198 Surface water Fresh water 92 80,542 92 92 83 92 80,459 Other water 6,361 6,361 Total 92 86,904 92 — — — 92 83 92 — 86,820 — Total 144,879 89,887 49,014 2,792 2,983 286 26,338 83 26,255 115,749 86,820 22,473 Tonnes treated (Mt)3 41.35 1.28 29.54 10.53 Total fresh water used 33,483 286 17,851 15,347 Fresh water used per (kl)/ton processed 0.81 0.22 0.60 1.46 1 Fresh water is water with a general total dissolved solids content of 1,000mg/l or less 2 Other water is water with a general total dissolved solids content of more than 1,000mg/l 3 Tonne treated: dry tonnes processed in Sibanye-Stillwater metallurgical plants and concentrators 4 Includes waste water purchased at the Rustenburg operation 6.4.1, 6.1 MINIMISING OUR ENVIRONMENTAL IMPACT continued IR - 203 1

The table below represents the proportionate volumes of water we withdraw, use and discharge according to water stress categories. 2023 Water stress (ML) Ground water Extrem ely high 0 0 0 0 0 0 High 15,202 1,428 25,256 0 0 0 4,585 1,428 3,208 10,617 10,617 104,168 11,430 Mediu m to high 2,678 2,983 203 2,678 2,983 203 0 0 0 0 0 0 Low 162 162 6,401 162 162 0 0 0 0 6,401 6,401 Total 18,042 4,573 31,859 2,678 2,983 203 162 162 0 4,585 1,428 3,208 10,617 0 10,617 110,569 0 17,831 Purchased water High 15,659 0 18,906 0 0 0 51 0 0 115,608 0 15,608 3,298 3,298 Mediu m to high 114 0 83 114 0 83 0 0 0 0 0 0 Low 0 0 1,344 0 0 0 0 0 0 1,881 1,344 Total 18,332 815 20,371 114 0 83 853 815 38 51 0 0 1 15,608 0 15,608 5,179 0 4,642 Surface water High 92 83 92 0 0 0 0 0 0 0 0 0 92 83 92 60,391 Low to mediu m 0 0 0 0 0 0 0 0 0 0 0 0 32,759 Low 0 0 0 0 0 0 0 0 0 0 0 0 537 Total 92 83 92 0 0 0 0 0 0 0 0 0 92 83 92 0 93,686 0 Total 36,467 5,472 52,323 2,792 2,983 286 1,015 977 38 4,636 1,428 3,208 26,318 83 26,318 115,748 93,686 22,473 Group US region EU region AUS region2 SA PGM operations SA gold operations Source/ destination Water stress area Water with- drawal Water discha rge Water used Water with- drawal Water discha rge Water used Water with- drawal Water discha rge Water used Water with- drawal Water discha rge Water used Water with- drawal Water discha rge Water used Water with- drawal Water discha rge Water used 1 Includes waste water purchased at the Rustenburg operation 2 For 2023 AUS region data is 01 March – 31 December 2023 Water treatment SA region The South African water treatment operations demonstrate a strong focus on responsible water management. We operate four dedicated water treatment plants capable of producing 35.7 ML/ day of potable water from impacted mine water, ensuring compliance with SANS 241:2015 drinking water standards. Additionally, we manage two environmental compliance treatment facilities that treat approximately 62ML of impacted mine water daily, meeting South African environmental discharge standards. Our SA region also has 22 active wastewater treatment facilities, with a combined capacity of 50.6 ML/day, currently operating at 52.3% capacity. Our investment in water treatment benefits communities where we operate, reducing pressure on freshwater supplies within the Integrated Vaal River System. In 2023, we increased our potable water production from SA gold operations by 4.67%, equivalent to 358.86ML. Our potable water treatment technologies at the various sites: • Driefontein: nanofiltration plant and zero-liquid discharge closed- circuit ion-exchange system • Kloof and Burnstone: reverse osmosis systems • Ezulwini: zero-liquid discharge fluidized bed cold-lime softening plant Our plants achieved 100% SANS 241:2015 drinking water compliance in 2023, resulting in cost savings of R152.7 million for the Group. US PGM operations In 2023, our US PGM operations discharged 2,901ML of treated water to groundwater resources near the operations. Excess mine water is treated to drinking water standards prior to discharge. The US PGM operations employ advanced biological nutrient reduction technology to reduce soluble nitrogen compounds to nitrogen gas. In order to protect groundwater quality at our US operations, all TSFs are lined to prevent impact on groundwater. In addition, liner and leachate collection systems are installed beneath the waste rock facilities at each operation. The collected water is directed back to the water treatment systems and either recycled for use in the underground mines or discharged to the environment where it is available for downstream beneficial uses such as aquatic life, recreation, farmland irrigation and drinking water. See Group impact supplement report, www.sibanyestillwater.com/news- investors/reports/annual/ Social benefits of water production In total, our SA operations can produce 35.7ML/day. This means that our actions contribute by freeing up an extra 35.7 million litres of potable water per day into the municipal water network for domestic use by members of the community. At an average daily potable water demand of 237liter/person, and an average household size of 5 people, our water production projects equate to the potable water demand of 150,682 people or 30,126 households. This speaks to the heart of UN SDG 6. Research and development water projects In 2023 various R&D projects (with total spending of R3.01 million) contributed to improving water quality, reducing operational water- related costs, and developing sustainable water solutions for post- mining. MINIMISING OUR ENVIRONMENTAL IMPACT continued IR - 204

Nitrogen (in the form of nitrate, nitrites and ammonia) is a main contributor to eutrophication (the over-enrichment of nutrients) in South Africa’s river systems. Nitrogen components not only pose an environmental risk but also a safety risk to underground miners, should these nitrogen components become volatile. To mitigate this risk, we commissioned a nitrate/ammonia scavenging pilot facility at our Marikana Karee 3 shaft. The plant uses a unique ion exchange flow-sheet to strip nitrates and ammonia from the mine water-body. Our analysis shows that this technology removes 98% of nitrogen nutrients. Compliance Our water quality non-conformance procedure applies to all discharges but is mainly relevant to our SA gold operations, given that the SA PGM operations are zero effluent/discharge operations, but for Marikana, of which the water discharges comply with the water use licence limits. Our non-conformance procedure mandates monthly examination of downstream water quality to various limits, keeping water use licence limits as the minimum standard. Water qualities and other water-related matters are presented at catchment management forums in which diverse other water users/ stakeholders are represented. We achieved 93% average compliance to the limits during the year for all operations, excluding Rand Uranium and Ezulwini (2022: 96%), and 90% compliance including Rand Uranium and Ezulwini (2022: 93%). The SA gold operations are associated with sulphide rich rock material which poses a risk of acid mine drainage. These risks are actively monitored and mitigated. All gold sites have action plans, including interception systems, amelioration of sediments and soils, as well as removal of sources and treatment as needed. For our US PGM operations, discharge and water quality compliance is measured against the Montana Pollutant Discharge Elimination System, whose standards our operations routinely surpass. In Sandouville Nickel Refinery, water discharge quality and quantity is continuously monitored and compared to the limits stated in the sites environmental permit. Main parameters assessed are flow rate, pH, temperature, suspended particles and nickel. All of them are subject to a weekly reporting. Minor non-compliance can be observed and are communicated in due time to the local authorities. The Keliber lithium project is subject to environmental permit requirements and monitoring plans for effluent, and for ground and surface water. It is monitored by the environmental regulatory authority. During the construction phase of the project, effluent waters (at both Syväjärvi and Päiväneva – Rapasaari sites) are measured monthly for pH, conductivity, suspended solids, nitrogen, phosphorus, 12 metals, as well as some other substances. In addition effluent waters at both sites are monitored online for water flow, pH and conductivity. Water quality and level of groundwaters are monitored four times per year. Surface water is also regularly monitored. At the Kokkola site, during construction, groundwater level is monitored weekly, while groundwater quality is monitored four times per year during construction. During the year, average compliance to the limit values was 80%. The nonconformances were due to low pH value for Syväjärvi discharge water. This is probably caused by the wetland treatment area since the mine water has higher pH. See our compliance summary table compared to legal limits in our supplementary sustainability content index, www.sibanyestillwater.com/news-investors/reports/annual/ Discharge During 2023, Sibanye-Stillwater discharged 99,160.37ML into various catchments at our operations, as per our licence conditions, for which (in the SA context) we provided frequent reporting to the Department of Water and Sanitation. 6.3 INCIDENT MANAGEMENT –––––––––––––––––––––––––––––––––––––––––––––––––––––––––––––––––– All environmental incidents are classified and evaluated monthly according to our incident and non-conformance management procedure; and reported externally to regulators when required. While we consider all environmental incidents as serious, we disclose all level 3 (short-term impact), level 4 (medium-term impact), and level 5 (long-term impact) environmental incidents to the relevant authority/regulator. Our target remains the achievement of zero environmental incidents. In 2023 we had one level 3 incident at the SA PGM operations and one level 3 environmental incident at the US operations. An environmental complaint was received regarding a leakage from TD6 RWD. The stakeholder who raised the complaint from the Wonderkop Community was engaged by the CED office. The complaint is being mitigated through the capacitation of the TD8 RWD and the planned diversion of water from TD6 RWD to TD8 RWD. See Environmental incidents supplementary information www.sibanyestillwater.com/news-investors/reports/annual Ezulwini water pumping dispute Ezulwini is appointing the necessary specialists to do the required specialist studies to prepare a new closure plan and amended EMP (required in terms of the NEMA regulations) to work towards the completion of a closure application in terms of Section 43 of the MPRDA. Such a closure plan needs to put forward new alternatives for closure that would be acceptable to stakeholders, especially the regulatory authorities. Therefore a technical solution, with buy-in from immediate stakeholders (especially appellants in the previous closure application), is the most likely way to progress the closure of Ezulwini. MINIMISING OUR ENVIRONMENTAL IMPACT continued IR - 205

RESOURCE UTILISATION ––––––––––––––––––––––––––––––––––––––––––––––––––––––––––––––––––––––––––––––––––––––––––––––––––––––––––––––––––––––––––––––––––––––– Materials consumption Timber (t) 39,584 969 — — 15,633 23,951 30,358 1,334 — 21,024 8,000 85,018 324 21,443 63,251 Cyanide (t)1 1,264 N/A N/A N/A — 1,264 1,409 N/A — N/A 1,409 2,979 N/A N/A 2,979 Explosives (t) 31,393 3,606 — — 28,647 2,746 35,867 3,792 180 30,115 1,781 30,5253 4,443 22,321 3,761 Hydrochloric acid (t) 11,959 5 11,075 0.1 — 884 1,087 4 — — 1,083 1,714 5 — 1,709 Caustic soda (t) 9,789 1,111 8,344 682 — 763 10,210 2,582 6,223 — 1,405 4,308 3,195 — 1,113 Lime (t) 54,354 5,521 — — — 54,354 74,749 5,975 — — 68,774 71,438 7,426 — 64,012 Cement (t) 10,338 20,412 — — 10,227 111 39,259 21,527 — 9,959 7,773 45,768 29,245 9,648 6,875 Diesel (kl)2 33,823 8,170 472 4,285 21,650 7,416 34,985 8,310 — 22,335 4,340 34,105 10,264 20,364 3,477 Lubricating and hydraulic oil (Kl)3 3,288 692 — 30 2,542 716 8,014 736 — 6,812 466 8,476 680 6,637 1,159 Grease (t) 24 17 — 5 2 17 96 17 — 2 78 127 21 8 98 2023 2022 2021 Group US region EU region AUS region3 SA region Group US region EU region SA region Group US region SA region Total PGMs PGMs Gold Total PGMs PGM Gold Total PGMs1 PGMs Gold 1 Based on the 2023 Carbon inventory 2 Updated from previous disclosures to be the sum of the operational areas 3 AUS region also uses small volume of recycled fuel oil 739kl, copper sulphate 3,944t and 2,728t Flotonal 9955. AUS region quantities not assured. Sibanye-Stillwater is signed up to the Cyanide Code, which subjects us to independent audits setting good practices for cyanide management. Our diesel consumption decreased by 3%, and we are continuing to trial battery electric vehicles, covering a range of applications, to further reduce our diesel usage and associated emissions. WASTE MANAGEMENT –––––––––––––––––––––––––––––––––––––––––––––––––––––––––––––––––– We endeavour to maximise the segregation, recycling, and reuse of general and hazardous waste streams in alignment with circular economy principles. Our operations have an electronic waste data capturing system, which records type and quantity of waste recovery, reuse, recycling, treatment, and disposal for each operation. This database is supported by waste inventories and is used to inform targets and decision-making. We are committed to reducing non-mineral waste to landfill and promoting the development of circular economies. Our Waste position statement commits us to being a leader in the area, as we reduce environmental impact and promote local economic growth. See Waste position statement, www.sibanyestillwater.com/ sustainability/reports-policies/ Non-mineral waste (general and hazardous waste) SA region Our SA region must comply with the Waste Act (2008), and its relevant amendments, regulations and guidelines, as well as with the National Waste Management Strategy (2020). There are various norms and standards applicable to waste and waste management in South Africa (as advocated in the strategy), including waste minimisation, circular economy, waste management hierarchy, compliance, enforcement and awareness. Amongst other things, waste management regulations require that hazardous waste generators and landfill owners register with the national and regional (e.g., Gauteng) waste information systems. Our operations, where required, are registered as per the regulations. The regulations highlight the importance of accurate waste information and waste record-keeping, as is the case for the landfills we operate. For our SA region, 82.2% of general waste is recycled, refurbished or reused. Waste minimisation initiatives include: • A windrow facility at the Wonderkop waste water treatment facility (SA PGM) turns sewage sludge into compost; in 2023, we produced 86.2 tonnes of compost (2022: 86.3 tonnes) • For 2023 the SA PGM PMR diverted away from landfill and sewer disposal 25,965 kl (2022: 28,038 kl) of liquid hazardous waste (effluent) • Diverting acidic and alkaline liquid waste streams at our SA PGM PMR averts, on average, 2,164 kilolitres/month of hazardous waste from landfill; in addition, remaining solids are subjected to further tests to determine suitability for disposal to landfill and this is an opportunity to recover PGMs from our effluent • Due to our footprint reduction and progressive rehabilitation projects, the general waste recycled, reused and refurbished significantly increased, resulting in 46,868 tonnes (2022: 32,910 tonnes) of building rubble being diverted away from landfill at the SA PGM operations and 62,529 tonnes (2022: 63,538 tonnes) at the SA gold operations US region At our US region, the Environmental Protection Agency (EPA) designates Stillwater mine as a small quantity generator, East Boulder mine as a very small quantity generator, and Columbus metallurgical complex as a large-quantity generator. This last designation (large-quantity generator) is to account for lead waste generated from the fire-assay analytical lab process. Both mines generate small quantities of hazardous waste from aerosol can contents and small quantities of other waste chemicals. MINIMISING OUR ENVIRONMENTAL IMPACT continued IR - 206

The US PGM operations have a chemical review procedure for all new products, rejecting chemicals with safety and environmental risk, thus keeping hazardous waste generation low. 12.2 Waste minimisation initiatives in the US region include: • The US PGM metallurgical complex produces gypsum as a by- product of its smelting process; during 2023, 7,599 tonnes of gypsum were delivered for use as an agricultural ameliorant • General steel waste recycled, reused and refurbished was 2,112 tonnes in 2023 EU region Sandouville A solid waste recycling facility, that was planned for 2023, has not progressed as planned and is being re-evaluated. Keliber lithium project The main source of waste at the Keliber lithium project is from construction activities. The project provides waste management services for all its construction sites and its activities to ensure a high level of sorting and recycling. The amounts of different waste fractions and recycling rates are reported monthly. AUS region The main source of waste at the Century operation is regulated waste, which is disposed of into designated landfills. Steel, copper, HDPE (high density polyethylene), tyres and waste oil are segregated for recycling off-site. Stakeholder engagement In the SA region, we participate in various external stakeholder forums, such as the Rand West City Local Municipality Environmental forum, and the Bojanala Platinum District forum. We leverage waste minimisation opportunities from collaborative partnerships with Merafong Local Municipality, Rustenburg Local Municipality and Matjhabeng Local Municipality. We have participated, through the CSIR, in the Industrial Symbiosis Workshop and have collaborative discussions/initiatives with the National Cleaner Production Centre South Africa (NCPC-SA) on waste minimisation initiatives, and with Impact Catalyst on regional integrated waste minimisation solutions. Mineral waste (tailings) Sibanye-Stillwater has 39 tailings storage facilities (TSFs); 34 in the SA region, 3 in the US region and 2 in the AUS region. As part of our obligations as a member of the ICMM, we aligned our group tailings management system with the Global Industry Standard on Tailings Management (GISTM, 2020); part of which involved ensuring all TSFs in the SA and US regions are GISTM conformant. The drive for conformance for the AUS region is ongoing. Projects to upgrade certain TSFs in the SA region to further reduce risk are ongoing. Such projects include buttressing for stability and/or seepage management, detailed stability investigations, and modification of operating methodology. Aligned with our focus on GISTM conformance and our drive to enhance surveillance, we implemented Decipher (a cloud-based tailings management platform owned by K2Fly) across all SA and US operations. Decipher includes satellite deformation monitoring and geo-referenced surveillance data; it improves risk identification and mitigation across our footprint and facilitates GISTM compliance. Our tailings journey thus far includes the following milestones: • Implementation of the Group tailings management system • Finalisation of internal governance and appointments • Finalisation of external governance and appointments • Achieving GISTM conformance (SA and US regions) • Identification of impacted communities and tailings awareness training to key community members • Socialisation (i.e., communication and engagement) of emergency response plans with community members and relevant authorities Main TSF risks Tailings risk is managed by rigorous surveillance, following norms of global best practice, with third-party reviews by the Independent Tailings Review Boards (ITRB) and by respective Engineers of Record. This applies to both the SA region and the US region. The main tailings risk is rainfall in excess of design, with the potential to stop operations and to affect surrounding communities. All TSFs are managed to accommodate a 1:10,000 year flood event, as prescribed by the GISTM for extreme consequence TSFs. See Tailings management fact sheet, www.sibanyestillwater.com/ news-investors/reports/annual; also see www.sibanyestillwater.com/ sustainability/environment/tailings-management/ SA region Our SA operations have 34 upstream TSFs (19 active), of which 26 are classified (according to GISTM) as having either a very high or extreme consequence classification; our US operations have three downstream TSFs (two active), all classified as extreme consequence. All our facilities in the SA region are upstream. (Note: due to specific geological or geographic conditions certain countries have banned upstream construction, e.g., Chile due to earthquakes, and Brazil due to high rainfall). Upstream facilities do pose a higher risk, and thus require an increased level of management, as has been practised for decades in South Africa. A new TSF, the Marikana pit TSF, is in the permitting phase with commissioning scheduled for 2030. This TSF will provide sufficient capacity for the remaining life of the current PGM operations. It has been designed as an impoundment, with a centreline embankment constructed initially using overburden, in line with international best practice. Our equity interest in DRDGOLD (50.1% shareholding) gives us an opportunity to extend their successful tailings retreatment, reclamation and environmental clean-up into our SA PGM operations. MINIMISING OUR ENVIRONMENTAL IMPACT continued IR - 207

US region At our US operations, approximately 50% of tailings are re-used for backfill in underground mining operations; we continue to optimise underground backfill and minimise the volume of tailings stored in TSFs. East Boulder mine continued construction of the stage 6 TSF expansion. This is expected to increase site tailings capacity through to 2031. A final environmental impact statement (EIS) was issued for the proposed Lewis Gulch TSF in November 2023, with final regulatory approval anticipated in mid-2024. Stakeholder education and outreach resulted in over 500 EIS letters of support and no formal objections. A support letter from the entire Montana federal congressional delegation was a highlight of the public comment process. At Stillwater mine, design and permitting of a new TSF (Hertzler stage 4/5 TSF) is on track to be completed by 2026. EU region Sandouville As the Sandouville nickel refinery has no mining activities, the Sandouville site does not produce or store residues. Most nickel- containing sludge, from effluent treatment, is collected, dried, gathered in a suitable storage area and recycled back into the production process when appropriate. By the end of 2023, the quantity of nickel sludge stored on the site will have reached 6,250 tonnes. Keliber lithium project Keliber has not commenced with mining activities. Construction of the Päiväneva TSF is scheduled to start Q1 2024. AUS region Century operations The Century TSF is an upstream TSF that is being re-mined for reprocessing, with the resultant tailings being deposited in the original open pit. The capacity of the pit is sufficient and there are no requirements for additional TSFs. Once depleted, the footprint of the existing TSF is to be rehabilitated as part of mine closure. Mt Lyell Mt Lyell has one TSF, Princess Creek, a downstream TSF with an engineered earth embankment. It will be used on the re- commissioning of operations. As and when required, the embankment will be raised in accordance with the original design and permit conditions. US PGM operations: Recycling of PGMs Sibanye-Stillwater is one of the US’s largest recyclers of PGMs from spent autocatalysts, feeding 310 koz of 3E in 2023. The recycling segment is self-funded and delivers favourable free cash conversion rates. Recycled tonnes/day and ounces fed to the furnace during 2023 were 10.5 and 310,314, respectively. Also see our Group impact report supplement, https://www.sibanyestillwater.com/ news-investors/reports/annual/ To enhance the Group’s exposure to a circular economy, the recycling segment continues to investigate growth options across geographies and commodities. For further information, see the life-cycle assessment that the International Platinum Association performed using the cradle-to-gate approach for primary and secondary production. The categories considered in the life-cycle assessment was primary energy demand, global warming potential, acidification potential, eutrophication potential, phytochemical ozone creation potential and blue water consumption. (See ipa- news.com/index/platinum-group-metals/pgm-fact-sheets.html) Summary of waste streams 2023 Material (tonnes) Total 2023 US PGM EU region AUS region1 SA PGMs SA gold Total 2022 Total 2021 General waste to landfill 29,298.0 2,632.0 229.7 0.0 12,376.0 14,060.3 41,025.1 58,840.5 Hazardous waste to landfill 46,764.7 92.0 273.0 0.0 45,921.0 478.7 30,426.5 68,796.0 General and hazardous waste incinerated 437.2 1.2 423.4 0.0 8.1 4.5 25.9 50.6 General waste recycled, reused and refurbished 135,038.5 2,115.0 211.0 0.0 63,879.2 68,833.3 122,072.9 31,878.8 Hazardous waste recycled, reused and treated 45,828.7 1.9 8.0 0.0 42,966.1 2,852.7 42,454.4 31,073.9 Percentage general waste recycled, reused and refurbished 82.2 0.0 83.8 74.8 Percentage hazardous waste recycled, reused and refurbished 49.3 0.0 48.3 58.2 Material (Mega tonnes) Tailings storage facility deposition (Mt) 41.5 0.6 0.0 0.0 34.4 6.5 41.3 47.9 Tailings deposition into pits (Mt) 10.1 0.0 0.0 6.1 0.0 4.0 3.9 4.4 Waste Rock/DMS deposition (Mt) 3.1 1.1 0.0 0.0 2.0 0.0 3.4 3.7 Total mineral waste 54.7 1.7 0.0 6.1 36.4 10.5 48.7 56.1 Retreated mineral waste from waste-rock 2.5 0.0 0.0 0.0 0.0 2.5 2.9 5.6 Retreated mineral waste from tailings dams 21.8 0.0 0.0 6.1 15.7 0.0 16.0 16.4 Waste intensity (tonnes milled/total waste) 0.005 0.005 0.004 0.009 0.005 1 The Century operation is not yet tracking waste-related data other than retreated mineral waste, 01 March – 31 December 2023 12.5 MINIMISING OUR ENVIRONMENTAL IMPACT continued IR - 208

BIODIVERSITY –––––––––––––––––––––––––––––––––––––––––––––––––––––––––––––– On 19 December 2022 the Kunming-Montreal Global Biodiversity Framework was adopted as an outcome of the COP 15 UN Biodiversity Conference. The framework aligns to, and improves upon, the Biodiversity Convention (a multilateral treaty signed in 1993 to which we are aligned). The targets contained in the framework relate to halting and reversing species loss, enhancing the protection and expansion of protected areas to preserve ecosystems, and promoting the equitable and sustainable use of biological and ecological resources and services. We were already committed to these aims and we welcome their adoption as a global standard. Despite the acknowledgement of the urgent actions required to achieve these aims, there is still extensive development underway globally to arrive at industry targets, measurement and assessment criteria. For this reason Sibanye-Stillwater undertook a world-first for mining companies during 2022 when we conducted an assessment of our biodiversity footprint using the Biological Diversity Protocol (BD Protocol) as spearheaded by the Endangered Wildlife Trust (EWT). This assessment makes use of both total footprint and ecosystem health criteria to arrive at hectare equivalents. These hectare equivalents help assess and track our biodiversity impacts and opportunities. Our disclosure was based on our 2021 data. This work will form part of an important foundation to further our Nature stewardship aims, which are: net gain in existing projects (brownfields, specifically all SA operations) and no net loss for new projects. We also acknowledged in our previous disclosures that the development of a foundation or footprint is a journey and we do foresee further work being conducted over the next two to three years in this field. We did find that progress in terms of guidance and metric development was slow during 2023 to further the aims of the BD Protocol and we are actively participating in ICMM working groups where work is conducted to translate BD Protocol principles and aims into more tangible outcomes. The ICMM Nature position statement was concluded by the end of 2023, by which any BD Protocol-related work should be comparable to a 2020 baseline. Our work now focuses on redefining and realigning to a 2020 baseline. Guidance on assessing baselines will be given by the ICMM during 2024. Due to the developing standards and other limiting factors, Sibanye-Stillwater paused the BD Protocol-related footprint work during 2023. The focus during 2023 was to ensure that we comply with all legal requirements and that our concurrent/ progressive rehabilitation programmes do not fall behind schedule. We are proud of the progress made in furthering our concurrent rehabilitation aims, an important step towards improving biodiversity at and around our operations. EU region Sandouville Considering future expansions, a biodiversity study close to the plant has been undertaken. Keliber lithium project In Finland, an environmental permit imposes certain requirements on us for the monitoring and protection of stipulated species of flora and fauna found within the operational site and within the potential impact zone of our operations. To monitor and protect these species (as per the permit directives), the Keliber lithium project is implementing a biodiversity management plan, or BMP. The focus of action has been the surroundings of the Syväjärvi and Rapasaari mine sites, where mining will first commence. The BMP will in future address other mine sites as well. The lithium chemical plant in Kokkola is sited in an industrial area, and hence the biodiversity directives here are less strict. To sustain biodiversity in surrounding areas, the Keliber lithium project cooperates on monitoring programmes with other companies in the area. These monitoring programmes include monitoring of coastal waters, of air quality, and of noise monitoring in the Kokkola industrial area. The programmes also include groundwater and bioindicator survey monitoring every five years. For 2023, related biodiversity management activities at the project include monitoring endangered and protected species, and cooperating on restoring spawning ground for trout. During the road construction at the mining areas, culverts were equipped with shelves to allow otters safe passage under the road. AUS region During the relevant period, Century operation undertook routine annual weed management and monitoring. Biodiversity considerations are a component of our progressive rehabilitation closure plan; this plan is currently being finalised. SA region The SA region proceeded with Alien invasive species eradication and monitoring during 2023. At our Burnstone, Kloof, Driefontein, and Blue Ridge operations, the Alien invasive management plan was actioned. For the SA PGM operations, Kroondal, Rustenburg and Marikana, will start clearing during 2024. The Kloof and Driefontein operations have reapplied for the demarcation certificates, setting out the conditions for alien invasive species eradication, with other operations to follow in 2024. The BMP studies for Beatrix and Burnstone are underway. Biodiversity considerations are also a component of our concurrent rehabilitation plan. US region For 2023, biodiversity activities included continued rehabilitation of the Benbow project site, and the East Boulder TSF embankment and soil storage areas. Annual invasive weed management and monitoring occurred at all sites. Biomonitoring of aquatic communities in the Stillwater River and East Boulder River occurs on an annual basis. Biomonitoring and monthly water quality monitoring continue to demonstrate that our environmental management systems are protective of the wild trout populations that inhabit these rivers. During 2023, the North American wolverine was listed as threatened under the Endangered Species Act. The US PGM operations are working with federal agencies to determine whether land owned or managed by the Group includes any critical habitat for the newly listed wolverine. 15.3.1, 15.5 See Biodiversity management fact sheet, www.sibanyestillwater.com/news-investors/reports/annual MINIMISING OUR ENVIRONMENTAL IMPACT continued IR - 209

Catchment water balances Riverine ecology We implement biomonitoring across all operations to determine impacts on riverine ecology. Biomonitoring is a legal requirement in South Africa and in Montana and includes monitoring of water quality, habitat (vegetation, stones, mud, and so on) and aquatic life. Findings are submitted to the relevant authorities. Wetlands Wetland assessments involve the integration of several indicators to identify and delineate the wetland, evaluate the state of the wetland as compared to expected baseline conditions, and to determine the services provided by the wetland. Once a wetland has been delineated and its hydrogeomorphic unit determined (e.g. pan, hillslope, temporary wetland), we rate it according to present ecological status (PES), and ecological integrity and sensitivity (EIS), as per guidelines supplied by the Department of Water and Sanitation (DWS) and the Water Research Commission (South Africa). 15.3.1, 15.5 Integration with stakeholders We participate in catchment management forums and we offer support to the DWS. We have developed site-specific biodiversity action plans in collaboration with local communities. (See Biodiversity management fact sheet for more on integrated catchment initiatives with stakeholders). Further, education and awareness initiatives were driven internally as well as externally in both local and international platforms. These included, but were not limited to, information on wetlands, training on the BD Protocol, video animation on biodiversity, launch of our BD Protocol results. LAND AND HERITAGE –––––––––––––––––––––––––––––––––––––––––––––––––––––––––––––––––– Heritage Sibanye-Stillwater has 851 heritage sites across the SA and US regions, including grave sites, iron age and stone age archaeological finds, and historical mine buildings. In South Africa, heritage sites are governed by the Constitution (mainly Section 24), by the National Heritage Resource Act (NHRA), and by the South African Heritage Resource Agency, which manages heritage resources under the auspices of the NHRA. In Finland, heritage sites are governed by the Finnish National Board of Antiquities, and by the Antiquities Act (295/1963). Frameworks to which we subscribe (e.g., ICMM, the WGC, and the UNGC) promote the protection of cultural heritage. Our internal governance documentation includes a position statement on heritage, ISO-based heritage resource procedures, as well as a chance find protocol (for archaeological/heritage finds during construction/operation). SA region We have heritage site inventories for the SA region, with location mapping in our geographic information system (GIS). See www.sibanyestillwater.com/sustainability/heritage/introduction/ In 2023, we continued with actions that align us with legal and strategic requirements for heritage resource management. These include: • Monitoring the status of fencing and demarcation of heritage sites • Monitoring and maintaining the accessibility of heritage sites • Maintenance and cleaning of heritage sites (e.g., vegetation clearance) • Recording and reporting of any apparent damage to heritage sites • Compliance with chance-find protocol EU region In Finland the heritage sites and antiquities are identified as part of the Environmental impact assessment (EIA) process completed for the Syväjärvi mine, Kokkola Lithium refinery, Päiväneva concentrator and Rapasaari mine. The only antiquities identified were some ancient tar pits located at the Päiväneva concentrator and Syväjärvi mine areas. These have been considered in the area planning. AUS region Heritage sites at Century are documented within the Gulf Communities Agreement. Cultural heritage preservation measures are set out in the Gulf Communities Agreement. We have also established a site-specific cultural heritage management plan to ensure compliance to the Gulf Communities Agreement. Land management The Beatrix animal husbandry project, a pilot project to address the issue of illegal livestock on mine property, and also ensure optimal use of unused mine land at our Beatrix operations, made progress toward the end of 2023. The project obtained funding to erect farm infrastructure on the off-mine property to accommodate excess cattle of an animal husbandry project; this in addition to current infrastructure, e.g. fencing, gates, watering and stock handling structures. In addition, the decision was taken for the Group to assist Beatrix livestock owners with transportation of cattle to areas outside of Beatrix. The transportation of cattle in South Africa requires the requisite permits, and for cattle to be marked and tagged before being transported. We assisted the cattle owners in attaining the requisite documentation. Livestock will be removed off Beatrix mine property during 2024. We re-issued the 2022 management directive in Q3 2023, again appealing to all Beatrix livestock owners to remove all livestock and to participate in the animal husbandry project should they so wish. The long-term objective of the Beatrix animal husbandry project (incorporating socioeconomic closure principles such as post- mining job creation and LED), is to develop a red meat value chain in the Beatrix/Welkom area. This will include a cattle farm, a C- grade feedlot, an abattoir, and possibly a number of containerised butcheries in the local communities. Stakeholder engagement is a key part of our closure planning process; we participate in various internal and external forums, with numerous stakeholders. Our closure working groups at our SA operations focus on social, land and environmental aspects of closure planning. The working groups are developing closure and rehabilitation plans (which include supporting social closure plans) for all operations. In 2020 we established a Leveraging land for impact steering committee. Its primary objective is to make determinations on the positive socioeconomic impact of the use of land owned by Sibanye-Stillwater, by which this land contributes to sustainable development so that economic activity continues beyond our mining operations. MINIMISING OUR ENVIRONMENTAL IMPACT continued IR - 210

We also have footprint-reduction working groups, which focus on minimising liability associated with closure of operations. This includes looking at demolition projects and the potential repurposing of infrastructure; and it includes engagement with relevant internal and external stakeholders. We also discuss closure-related issues with other mining houses at forums arranged by the Minerals Council. The ICMM affords us opportunity (through their working groups) to consider different perspectives on closure management. 2.1, 2.2, 15.5 Managing our footprint and closure liability Sibanye-Stillwater (as required by legislation for e.g. the NEMA in South Africa) sets aside funds for rehabilitation of the environmental impacts of our operations. These funds are held in trusts, and the balance is in guarantees; they assure the authorities that we will fund rehabilitation, according to the closure and rehabilitation plan. Land under Sibanye-Stillwater management (2023) Total AUS US PGM EU SA PGMs SA gold Total land disturbed by waste rock and stockpiles (ha) 2,971 1,129 32 661 686 463 Total area covered by tailings (ha) 5,257 398 143 0 2,799 1,917 Total land area protected 0 0 0 0 Not applic able to SA Not applic able to SA Total land rehabilitated1 2,254 1,527 43 661 0 23 1 SA gold operations total land rehabilitated – still in care and maintenance phase SA region As of 2023, Sibanye-Stillwater owned 47,015 hectares of land around our SA gold operations and 16,876 hectares of land around our SA PGM operations. Our footprint-reduction programme to sustainably close mining is a vital component for reducing our total gross closure liability, which as at 31 December 2023 was R13.9 billion (2022: R11.2 billion). Of this, R8.5 billion (2022: R6.2 billion) was for the SA PGM operations, inclusive of the Marikana operations, and R5.4 billion (2022: R5.0 billion) for the SA gold operations. We continued with demolition of surface infrastructure. Focus areas include the complete demolition of Driefontein training centre, various selected redundant buildings at our SA gold operations, Siphumelele 2 shaft and hostel area, Khomanani 1 shaft, Central Deep shaft, Marikana 4 shaft and Khuseleka 2 shaft. The demolition of the above-mentioned infrastructure, and the revising of rehabilitation methodologies and unit rates, resulted in a reduction of R603.7 million in closure liability (2022 assessment as the baseline). Our concurrent rehabilitation initiative aims to rehabilitate disturbed land to a predetermined end-use. After completing the rehabilitation of the Middelvlei opencast pits, we began the seasonal round of rehabilitation maintenance in Q1 2023. Redundant structures at the Cooke backfill plant were removed as part of rehabilitation. The rehabilitation of these sites is based on site specific rehabilitation plans, which are aligned with each operation’s Closure and rehabilitation plan. Heritage impact assessments were concluded for the old Millsite and Lindum plant areas. The demolition of redundant structures at the Lindum plant may proceed without any mitigation measures; we await a permit for certain other measures. US region Total land under management at our US PGM operations is 1,089 hectares. In 2023, we continued a multi-year project for closure of the Nye TSF. To date, approximately 70% of the 16-hectare impoundment has been capped with waste rock; closure of the Nye TSF is scheduled for completion by 2025. Concurrent rehabilitation at Stillwater, East Boulder, and Benbow occurs annually. During 2023, this included shaping, soil placement, and revegetation activities associated with stage 6 TSF construction at East Boulder. At the Stillwater mine, 2023 rehabilitation activities included revegetation of disturbed soils, stabilisation of roadways and construction of permanent stormwater channels at the Benbow project site. Additionally, the volume of water sent to the Benbow water treatment plant was significantly reduced by routing of all Benbow mine water to the Stillwater mine primary water treatment plant. One of the focus areas of the GNA in the past year has been development of closure criteria for water quality that goes beyond the regulatory requirements for meeting state water quality standards. AUS region Century operations must submit a progressive rehabilitation closure plan by July 2024 to meet its statutory obligations. This plan sets out binding rehabilitation targets that must be achieved for the Century operation. Closure liability3 SA region Gross liability R million Cash funded R million Guarantee Funding R million SA gold operations1 5,384 3,144 2,415 SA PGM operations 8,492 733 4,970 Total SA operations 13,876 3,877 7,385 Closure liability3 US region Gross liability US$ million Cash funded US$ million Guarantee Funding US$ million US PGM operations2 73.2 0 0 Total 73.2 0 0 Closure liability3 EU region Gross liability € million Cash funded € million Guarantee funding € million Sandouville 7.0 0.0 0.0 Keliber 0.0 0.0 0.5 Total 7.0 0.0 0.5 Closure liability3 AUS region Gross liability A$ million Cash funded A$ million Guarantee Funding A$ million Century 199 0 184 Mt. Lyell 28 0 6 Total 227 0 190 1 Numbers exclude DRDGOLD 2 Our financial assurance for the liability is in the form of surety bonds held by various insurance companies. None of the assured funds are held in cash, trust funds, or other corporate guarantees 3 Represents unscheduled gross closure cost and guarantee funding excludes 2023 top-up guarantees 15.3.1 MINIMISING OUR ENVIRONMENTAL IMPACT continued IR - 211

FUTURE FOCUS ––––––––––––––––––––––––––––––––––––––––––––––––––––––––––––––––––––––––––––––––––––––––––––––––––––––––––––––––––––––––––––––––––––––– GROUP • To implement the TCFD recommendations and update our financial risk registers with findings • Review Group scope 3 inventory and onboarding acquisitions • Drive long-term water stewardship maturity at Sibanye-Stillwater by completing water stewardship maturity assessments at 4 out of 14 operations in 2024, and complete the remaining 8 operations in 2025 • Decarbonise in line with our 2030 GHG emissions reduction target AUS REGION • Complete progressive rehabilitation closure plan, and submit estimated cost regulator by July 2024, inclusive of a stakeholder engagement process with traditional owners • Support Queensland Land Court ERC appeal process to achieve favourable outcome for the business • Complete SED3 Environmental Protection Order requirements by August 2024 • Complete the waste rock dump investigation by the Department of Environment, Science and Innovation by August 2024 • Drive compliance water management rectification earthworks • Drive disturbance footprint reduction programs that can provide economic benefits to operation • Complete close-out report for TSF cover trials to inform rehabilitation strategy EU REGION • Improve water and waste management • Develop robust decarbonisation plan for all EU region sites SA REGION • Financial close and construction of a further 365MW of renewable energy projects • Completion of a surface rock dump rehabilitation strategy • Completion of site-specific rehabilitation plans for demolished areas and subsequent rehabilitation • Review and update of closure specific legal obligation documents US REGION • Closure and rehabilitation of the Nye tailings storage facility • Long-term strategy for mineral waste: permitting of new tailings and waste rock storage facilities • Reduce purchased water by developing a production groundwater well for the Columbus smelter MINIMISING OUR ENVIRONMENTAL IMPACT continued IR - 212

SOCIOECONOMIC DEVELOPMENT WHAT WE DID IN 2023 SUCCESSES • Sibanye Foundation funded the first projects in SA and EU regions • Agreement with the National Department of Cooperative Governance and Traditional Affairs (CoGTA) to enable capacity building programmes for local government • US and SA regions completed their first human rights due diligence assessments, and have started integrating human rights risks into management plans from 2024 CHALLENGES • Sociopolitical challenges exacerbating poverty and unemployment around operations in South Africa • Community safety and health Group 1, 2, 3, 4, 5, 8, 9, 12, 16, 17 Our sustainability themes: Entrenching long term economic sustainability: integrated post mining economies See Progressing the UN’s SDGs, www.sibanyestillwater.comnewsinvestors/ reports/annual MATERIAL MATTERS M3 Licence to operate M6 Sociopolitical • Equivalent of 1.5% of declared dividends to be invested in social upliftment projects In progress Page 214 SA region • Collaborated with CoGTA on capacity building programmes for our host municipalities In progress Page 218 • Mining Charter III: minimum of 70% of total mining goods procurement spend on SA-manufactured and SABS-approved goods Met Page 223 • Mining Charter III: 5% (of the 70%) of total mining goods procurement spend on women- or youth-owned or -controlled companies Not met Page 223 • Socioeconomic coalition agreement with multiple stakeholders towards the development of post mining economies In progress Page 218 TARGETS AND KEY OBJECTIVES Status See ALIGNMENT WITH SDGs IR - 213
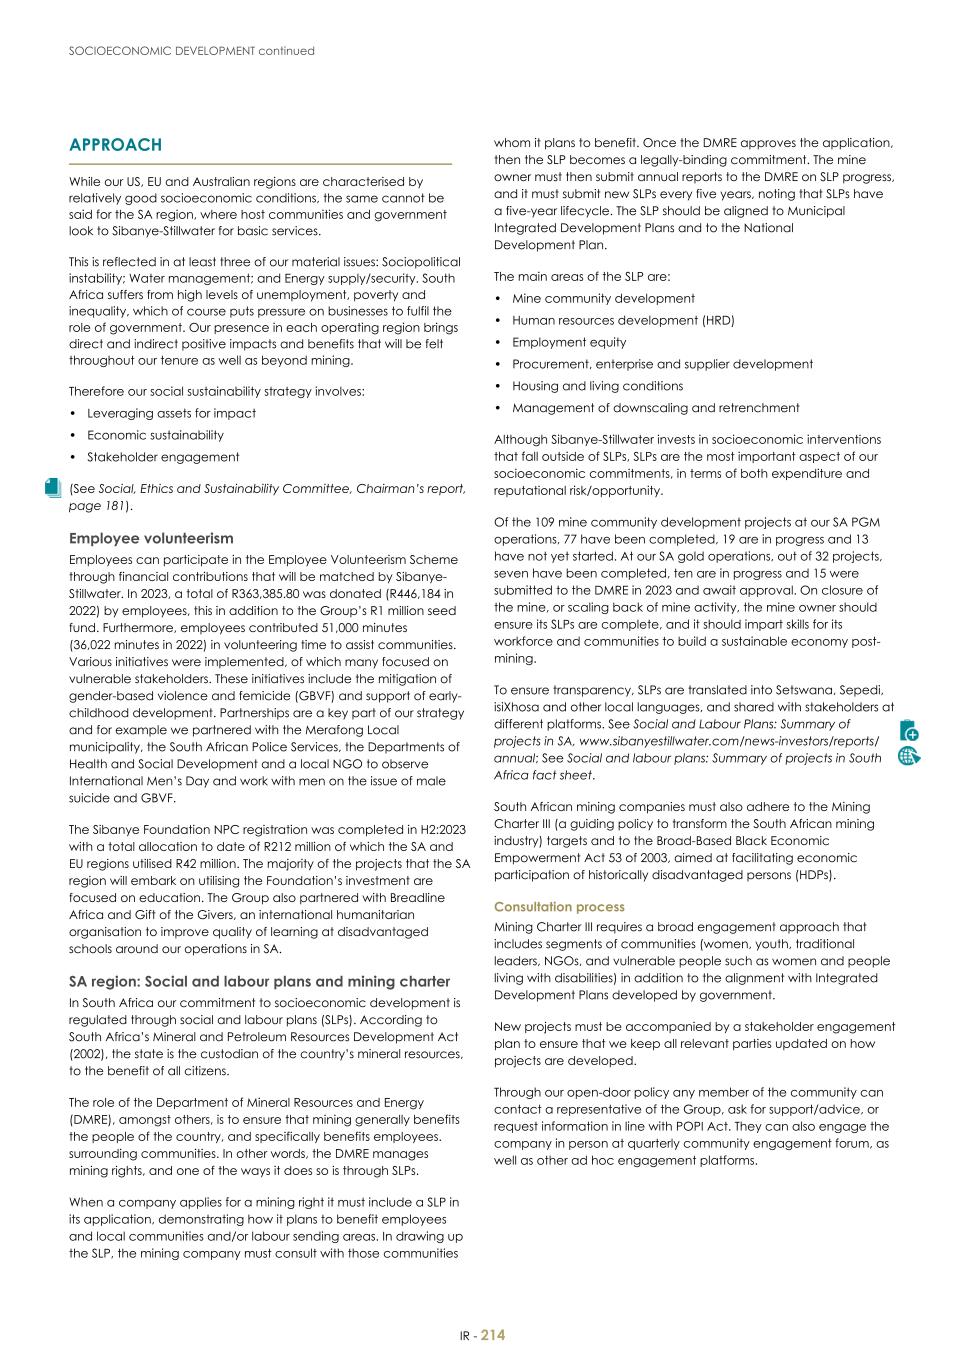
APPROACH ––––––––––––––––––––––––––––––––––––––––––––––––––––––––––––––– While our US, EU and Australian regions are characterised by relatively good socioeconomic conditions, the same cannot be said for the SA region, where host communities and government look to Sibanye-Stillwater for basic services. This is reflected in at least three of our material issues: Sociopolitical instability; Water management; and Energy supply/security. South Africa suffers from high levels of unemployment, poverty and inequality, which of course puts pressure on businesses to fulfil the role of government. Our presence in each operating region brings direct and indirect positive impacts and benefits that will be felt throughout our tenure as well as beyond mining. Therefore our social sustainability strategy involves: • Leveraging assets for impact • Economic sustainability • Stakeholder engagement (See Social, Ethics and Sustainability Committee, Chairman’s report, page 181). Employee volunteerism Employees can participate in the Employee Volunteerism Scheme through financial contributions that will be matched by Sibanye- Stillwater. In 2023, a total of R363,385.80 was donated (R446,184 in 2022) by employees, this in addition to the Group’s R1 million seed fund. Furthermore, employees contributed 51,000 minutes (36,022 minutes in 2022) in volunteering time to assist communities. Various initiatives were implemented, of which many focused on vulnerable stakeholders. These initiatives include the mitigation of gender-based violence and femicide (GBVF) and support of early- childhood development. Partnerships are a key part of our strategy and for example we partnered with the Merafong Local municipality, the South African Police Services, the Departments of Health and Social Development and a local NGO to observe International Men’s Day and work with men on the issue of male suicide and GBVF. The Sibanye Foundation NPC registration was completed in H2:2023 with a total allocation to date of R212 million of which the SA and EU regions utilised R42 million. The majority of the projects that the SA region will embark on utilising the Foundation’s investment are focused on education. The Group also partnered with Breadline Africa and Gift of the Givers, an international humanitarian organisation to improve quality of learning at disadvantaged schools around our operations in SA. SA region: Social and labour plans and mining charter In South Africa our commitment to socioeconomic development is regulated through social and labour plans (SLPs). According to South Africa’s Mineral and Petroleum Resources Development Act (2002), the state is the custodian of the country’s mineral resources, to the benefit of all citizens. The role of the Department of Mineral Resources and Energy (DMRE), amongst others, is to ensure that mining generally benefits the people of the country, and specifically benefits employees. surrounding communities. In other words, the DMRE manages mining rights, and one of the ways it does so is through SLPs. When a company applies for a mining right it must include a SLP in its application, demonstrating how it plans to benefit employees and local communities and/or labour sending areas. In drawing up the SLP, the mining company must consult with those communities whom it plans to benefit. Once the DMRE approves the application, then the SLP becomes a legally-binding commitment. The mine owner must then submit annual reports to the DMRE on SLP progress, and it must submit new SLPs every five years, noting that SLPs have a five-year lifecycle. The SLP should be aligned to Municipal Integrated Development Plans and to the National Development Plan. The main areas of the SLP are: • Mine community development • Human resources development (HRD) • Employment equity • Procurement, enterprise and supplier development • Housing and living conditions • Management of downscaling and retrenchment Although Sibanye-Stillwater invests in socioeconomic interventions that fall outside of SLPs, SLPs are the most important aspect of our socioeconomic commitments, in terms of both expenditure and reputational risk/opportunity. Of the 109 mine community development projects at our SA PGM operations, 77 have been completed, 19 are in progress and 13 have not yet started. At our SA gold operations, out of 32 projects, seven have been completed, ten are in progress and 15 were submitted to the DMRE in 2023 and await approval. On closure of the mine, or scaling back of mine activity, the mine owner should ensure its SLPs are complete, and it should impart skills for its workforce and communities to build a sustainable economy post- mining. To ensure transparency, SLPs are translated into Setswana, Sepedi, isiXhosa and other local languages, and shared with stakeholders at different platforms. See Social and Labour Plans: Summary of projects in SA, www.sibanyestillwater.com/news-investors/reports/ annual; See Social and labour plans: Summary of projects in South Africa fact sheet. South African mining companies must also adhere to the Mining Charter III (a guiding policy to transform the South African mining industry) targets and to the Broad-Based Black Economic Empowerment Act 53 of 2003, aimed at facilitating economic participation of historically disadvantaged persons (HDPs). Consultation process Mining Charter III requires a broad engagement approach that includes segments of communities (women, youth, traditional leaders, NGOs, and vulnerable people such as women and people living with disabilities) in addition to the alignment with Integrated Development Plans developed by government. New projects must be accompanied by a stakeholder engagement plan to ensure that we keep all relevant parties updated on how projects are developed. Through our open-door policy any member of the community can contact a representative of the Group, ask for support/advice, or request information in line with POPI Act. They can also engage the company in person at quarterly community engagement forum, as well as other ad hoc engagement platforms. SOCIOECONOMIC DEVELOPMENT continued IR - 214

US region: Good Neighbor Agreement In 2000, Stillwater signed the Good Neighbor Agreement (GNA) with three local organisations, the Northern Plains Resource Council, the Stillwater Protective Association, and the Cottonwood Resource Council. The GNA contractually binds Sibanye-Stillwater to certain responsible mining commitments and hold the company to a higher standard than required by federal and state regulatory process. Social upliftment is part of the US and Montana regulatory structures, and is included in permitting requirements and tax structures. Every ounce of metal we produce provides specific financial benefits to local counties. Montana’s Hard-Rock Mining Impact Act (HRMIA 1981) ensures that large-scale mineral developments do not burden local taxpayers. For further information, see The Good Neighbor Agreement fact sheet www.sibanyestillwater.com/news-investors/reports/annual AUS region: Gulf Communities Agreement Century operations is a party to the Gulf Communities Agreement (GCA). This “native title agreement” was established in 1997 in connection with the grant of the mining lease at Century operations and contains the benefits that are shared with traditional owners of the lands impacted by the mining operations. The GCA includes a requirement for the establishment of the Aboriginal Development Benefits Trust. The trust receives funding from Century operations to enhance Aboriginal economic development in the Gulf Communities. EU region: Public consultation for new industrial projects In Europe, the environmental permitting application process of most of mining and industrial projects typically includes an important phase of public consultation. Local stakeholders are asked to provide opinion and their feedback plays an important part in determining the nature of the permit. Sandouville and Keliber have successfully completed this process. SA REGION: B-BBEE VERIFICATION –––––––––––––––––––––––––––––––––––––––––––––––––––––––––––––––––– The Group supports and contributes to an inclusive economy where all have equal opportunity to decent livelihoods. The SA region completed B-BBEE verification and scored level 6 (which is an improvement from level 7 in 2022). Our priority is to continue contributing to socioeconomic development, and to improve our enhanced performance in this area, giving effect to our vision of superior shared value for all stakeholders. B-BBEE Scorecard Element Points 2023 Scoring 2022 Scoring Comment Ownership 25 19 15.73 +3.27 Management control 19 10.17 8.84 +2.03 Skills development 20+5 bonus points 10.17 10.87 -0.7 Procurement 27+2 bonus points 25.95 26.24 -0.29 Supplier development 10+1 bonus point 2.80+1 0.70+1* 2.1 Enterprise development 5+1 bonus point 0.53+1 0.70+1* -0.17 Socioeconomic development 5 5 5 0 Total 111+9 75.62 70.08 +5.54 B-BBEE level 5 6 Discounting applied Yes Yes Recognised B-BBEE level 6 7 * Indicates scores below minimum targets, see page 224 relating to our enterprise development and supplier development programme SOCIOECONOMIC DEVELOPMENT continued IR - 215

ACCOUNTABILITY, GOVERNANCE AND ASSURANCE GOVERNANCE ACCOUNTABILITY Board • Social, Ethics and Sustainability Committee • Audit Committee Executive Committee and C-suite • The Chief Sustainability Officer holds the Group accountable for social performance and reports to the CEO • Each region has an executive or VP position holding oversight responsibility for stakeholder relations and socioeconomic development programmes • The management-led Social licence to operate committee reports to management in the SA region and is responsible for monitoring the impact of Sibanye-Stillwater’s socioeconomic activities at all SA operations, in support of our social licence to operate • Internal governance of SLPs is undertaken through multi-stakeholder forums at our mining operations • Each region has an implementation structure for social commitments • Sibanye Foundation with appointed trustees RELEVANT LEGISLATION AND REGULATIONS (list not exhaustive, only key regulations listed) South Africa • Mineral and Petroleum Resources Development Act 28 of 2002 • Broad-Based Black Socio-Economic Empowerment Charter for the South African Mining and Minerals Industry (Mining Charter III), 2018 • Codes of Good Practice on Broad- Based Black Economic Empowerment (B- BBEE) United States • Montana’s Hard-Rock Mining Impact Act (1981) Europe • German Act on Corporate Due Diligence Obligations for Prevention of Human Rights Violations in Supply Chains (Lieferkettensorgfaltspflichtengesetz or “LkSG”) • European union’s Corporate Sustainable Due Diligence Directive Finland • Act on the Contractor’s Obligations and Liability when Work is Contracted Out (1233/2006) Australia • Native Title Act 1993 (Cth) • Modern Slavery Act 2018 (Cth) • Aboriginal Cultural Heritage Act 2003 (Qld) • Torres Strait Islander Cultural Heritage Act 2003 (Qld) • Aboriginal Heritage Act 1975 (Tas) ASSURANCE AND REVIEWS Group Various independent and self-assessment reviews are performed against responsible mining principles, including IRMA, ICMM and WGC. At the SA and US regions, independent third- party human rights due diligence assessments were performed. SA region Regulatory inspections are performed by the DMRE on various regulatory elements. Audits relating to specific material social performance areas are performed by Internal audit and externally assured (limited assurance) by KPMG (See Statement of assurance, page 285). The social performance advisory committee (which includes external experts) reviews the implementation of the social sustainability strategy. Key supporting policies and policy statements: • ESG policy • Position statements on partnerships for development, and on indigenous people and mining, detailing technical requirements for policy commitments. See www.sibanyestillwater.com/about-us/governance • A stakeholder engagement policy statement guides engagement supported by grievance mechanisms • SA region: social performance toolkit SOCIOECONOMIC DEVELOPMENT continued IR - 216

STRATEGY ––––––––––––––––––––––––––––––––––––––––––––––––––––––––––––––––––––––––––––––––––––––––––––––––––––––––––––––––––––––––––––––––––––––– SA region The Group’s vision is to be a leader in superior shared value for all stakeholders. In terms of our social closure commitments, this superior shared value has four pillars: 1. Modern mining towns: building and improving infrastructure that will support prosperity for communities during mining operations and after mine closure. 2. Sustainable environment: reduce negative impacts on the environment; post-closure, reverse damage done; work with local partners to rehabilitate the environment. 3. Economic development: build alternative, parallel economies that will exist beyond the life of mine. Crucial to this is the development of enterprises in adjacent and alternative industries to mining. 4. Empowered people: focus on development needs of key stakeholders that can drive sustainable transformation. PERFORMANCE –––––––––––––––––––––––––––––––––––––––––––––––––––––––––––––––––– SA region Facilitating a just transition to sustainable post-mining economies Over decades, mining – while contributing immensely to livelihoods – has created dependency, whereby mine closure leaves communities with limited economic prospects. Our vision for post-mining is shared value, which includes socioeconomic upliftment and sustainable alternative economies. We have a number of projects at different stages of implementation, which are part of a broader thrust to surpass compliance requirements around social closure, and to help diversify the economies of mining towns. The first step is to establish a baseline of the socioeconomic status of the communities and the state of the natural environment. Our socioeconomic status assessments consider population size, employment levels, migration patterns, education levels, poverty and inequality, service delivery of basic needs (water and electricity), priorities of the municipalities, as well as the land and spatial aspects of the area. This provides insight into what is required to create a feasible, substitutive economy post-mining, dovetailing with UN SDG 1 (the eradication of poverty in all forms, everywhere), and with UN SDG 1a, which calls for the mobilisation of resources for developing countries to end poverty. 1a The mine closure strategy includes a detailed roadmap to closure planning, integrating social closure. We also consider land use scenarios and the utilisation of land for alternative economies. (See Land management, page 210, page 218). SOCIOECONOMIC DEVELOPMENT continued IR - 217 GOOD NEIGHBOUR Work towards vision 2025 of behaving like and being perceived as a good neighbour in operating environments SOCIAL COMPACT Agreement with regional role players and stakeholders to work together towards meaningful development and more strategic, high-impact development initiatives in the region SOCIAL CLOSURE A state towards the end of the life of mine where alternative economic activities can replace mining-led development and the social asset base has been improved SA region: Strategic intent and roadmap

Collaboration and partnerships In addition to delivering SLPs and socioeconomic programmes, the SA region continues to pursue opportunities to collaborate with government and development partners to support institutional capacity in delivering basic services. Engagements on a broad- based municipal capacity agreement were concluded with the signing of a formal partnership agreement with the Department of Cooperative Governance and Traditional Affairs. Host municipalities and communities will benefit greatly from this programme. The SA region has also initiated programmes on gender-based violence and femicide (GBVF) and on community health, with pilot projects at Marikana and Rustenburg. In partnership with Sibanye- Stillwater through the GBV programme 86 faith-based leaders received training, who are now implementing GBV programmes to bring positive social changes within their local churches, communities, clinics, schools and other institutions. Out of these, 71 churches have been designated as GBV support centres. In addition to capacity building, we are participating in the Minerals Council led partnership with the National Prosecuting Authority Sexual Offences and Community Affairs (NPA SOCA) unit and the GBVF Response Fund. In 2023, we pledged R750,000 to the NPA SOCA in support of establishing the Thuthuzela Care Centre in Merafong Local Municipality to serve the community and mine employees. Leveraging land for impact Land Strategy Our land management strategy is focused on realising value from the land we own, both for ourselves and our stakeholders. In the SA region, we seek to leverage land to create sustainable post-mining economies while ensuring concurrent rehabilitation. To realise the objective of the land strategy, we have developed a Land Management Master Plan to accurately identify where value can most appropriately be unlocked. In 2019 we set up the Bokamoso Ba Rona (BBR) Programme, a mega agri-industrial programme aimed at creating jobs and sustainable industries in the West Rand. Partnerships with the government, private sector and funders has resulted in unlocking value through commercial agri-industrial programmes. Due to programme implementation challenges, BBR has since been restructured to facilitate more efficient decision making and project delivery. We anticipate that this restructure will provide an appropriate platform for more effective implementation of projects that create value for both ourselves and our stakeholders, as contemplated in our land management strategy. Our aim is to create sustainable economic programmes that will outlive the life of our operations and we do this through partnerships with key industry players to catalyse and grow the local economies through meaningful programmes using our land as an enabler. See also the Group impact supplement, www.sibanyestillwater.com/news-investors/reports/annual/ We continue to deal with illegal land invasions which we respond to using formal legal processes. All land claims on our properties are managed through a formal legal process. Economic development projects Solar Photovoltaic project As part of our commitment to a just energy transition and supporting Government’s efforts to achieve its renewable energy goals, we have made 1,348 hectares of land available for the development of the Merafong Local Municipality’s Solar Photovoltaic Cluster Project. This is a partnership comprising the Far West Rand Dolomitic Water Association, Sibanye-Stillwater, the Merafong Local Municipality, the Gauteng Infrastructure Finance Agency and Independent Power Producers. The project is aligned with the Gauteng Government’s Green Strategic Programme and Energy Security Strategy in that it has the potential to produce 1,034 MW and will create up to 600 employment opportunities. Agreements are currently being negotiated with the Independent Power Producers to give effect to the future construction of solar plants on our land. Training and Development In order to promote the development of emerging farmers, we will be donating 1,004 hectares of land and buildings to the University of South Africa located in the West Rand District Municipality. The land and infrastructure will be utilised for purposes of an agriculture experiential farm, including practical training programmes that will be carried out for both undergraduate and postgraduate students, using cutting-edge research and applied sciences. In addition, the farm will also be used to provide agricultural training to ex-mine workers and local schools, thereby facilitating the upskilling and empowerment of members of the local communities in preparation for a post-mining agricultural economy. This project is aligned with our land management strategy for regional economic diversification in the West Rand. Special Economic Zones Special Economic Zones (SEZ’s) within South Africa are geographic areas designated for targeted economic activities, with a view of promoting national economic growth and exports. Support measures implemented within the SEZ’s are designed to attract both domestic and foreign investments, as well as facilitate the development of technology. In 2023, we made 84 hectares available for the West Rand SEZ and assessments are currently being carried out in our PGM and Gold segments to make further land available for the establishment of additional SEZ projects. Agriculture Job creation and economic programmes are central to our strategy, and we currently have allocated and entered into lease agreements with local commercial farmers covering around 10,000 hectares to allow for agricultural activities to take place on our land. This includes agriculture programmes implemented as part of the Social and Labour Plan Marikana Agriculture Hub and Safe-Hub As part of developing an integrated agricultural cluster in Marikana, 16 hectares of land and infrastructure has been made available for the Marikana Agricultural Hub. The project comprises crop production, egg laying, recycling and a Social Employment Programme. The project was officially launched on 12 May 2023 with the aim of advancing socioeconomic development in communities through agriculture. See Group impact supplement 2023, www.sibanyestillwater.com/news-investors/reports/annual/ A further 8.8 hectares of land has been made available in Wonderkop Marikana for the establishment of a D-Lab by DBSA and Amandla aimed at providing raining and skills development for youth and the surrounding community in employment readiness, after school programmes, agriculture and business development. Beatrix animal husbandry project The primary objective of the project is to formalise informal farming activities on site with the ultimate development of commercial farming opportunities, to limit the impact of livestock at our operations and ultimately relinquishing land to beneficiaries. Up to 430 hectares of land have been made available for the first phase SOCIOECONOMIC DEVELOPMENT continued IR - 218

of the project. See Group impact supplement 2023, www.sibanyestillwater.com/news-investors/reports/annual/ Land for human settlements and social amenities There are several land portions currently in the process of being transferred as part of the donation of land to the government for the delivery of a number of socioeconomic upliftment programmes and service delivery within the Gauteng and Mpumalanga Provinces: A total of 816 hectares has been allocated for donation to local municipalities. To date, 189 hectares has been transferred and 627 hectares is in the progress of being transferred. The use of the land earmarked includes human settlements, cemeteries, sewer pump station, landfill sites, transportation facilities and farmer out grower projects. Corporate social investment (CSI) As distinct from our legislated SLP commitments, we also run CSI (sometimes referred to as “CSR”) programmes across various focus areas: welfare of vulnerable people (women, children, persons living with disabilities), education and skills, youth development, health, sports, food security. Among other projects, we supported the Department of Health, the Department of Education, and the Department of Social Development with capacity and resources. In 2023, we donated three prefabricated units to the Free State Department of Health to extend their clinic facilities in the municipalities of Matjhabeng and Masilonyana; in Rustenburg we upgraded a clinic and donated an industrial generator to lessen the effects of loadshedding. For the municipal support programme, we donated road maintenance and storm water drainage machinery and waste truck to the Rand West and Merafong municipalities to improve service delivery. Sibanye-Stillwater participated in the President’s SAFE (Sanitation Appropriate for Education) initiative, under whose auspices we built ablution facilities for Eastern Cape schools. In August 2023, new ablution facilities were handed over to the seven schools in the Eastern Cape. We believe that our R16 million contribution to SAFE will enhance the efforts to bring dignity and ensure safety at schools. In the field of ECD, we trained 72 practitioners and distributed toys and educational materials to 76 ECD centres. We further provided 144 tablets in promoting digital learning and skills development in 4IR tools. PROJECT SPEND AND IMPLEMENTATION –––––––––––––––––––––––––––––––––––––––––––––––––––––––––––––––––– In 2023 we spent R2,201.9 million on our SLPs (2022: R2,194.8 million), a figure that includes R203.6 million of our socioeconomic development spend. In 2023, we spent in the SA region R605 million on socioeconomic development (R362 million in 2022). See Social and labour plans: Summary of projects in South Africa fact sheet. As part of our socioeconomic development spend, R409.8 million went into CSI (2022: R115.7 million), which is over and above our mandatory SLP programmes. The spend benefited municipalities, educational institutions, healthcare facilities, and NPOs (e.g. faith- based organisations, schools, ECD organisations). Note: for the SA region we include CSI as part of our socioeconomic development initiatives, but not as part of our SLPs; for the US region CSI spend is over and above the social spend mandated by taxation. SOCIAL UPLIFTMENT AND COMMUNITY DEVELOPMENT –––––––––––––––––––––––––––––––––––––––––––––––––––––––––––––––––– Marikana Renewal Sibanye-Stillwater continues its renewal around its Marikana Operations aimed at building a new legacy through healing and renewal. The programme focuses on families of the deceased miners and the broader community: • SixteenEight Memorial Trust: three graduates from this programme are permanently employed at SSW, and seven are part of a 12-month experiential learning programme • 15 houses have been completed, for families that did not benefit from the AMCU programme. One house outstanding due to the beneficiary widow opting out of the standard programme. Health support for elderly parents of the deceased has been initiated. Consultations on the Memorial at the Koppie in progress • All 44 families have a replacement as part of the agreement to ensure continuation of benefits and livelihoods Regular Pitsos (Sesotho word for “traditional assembly”) continued with the principle to foster dialogue and build trust; As part of the programme faith -based leaders, critical change agents, have been empowered to facilitate interventions addressing GBV and substance abuse. See www.sibanyestillwater.com/features/marikana- commemoration 1.3, 2.4, 4.4, 5.1 17.17 Measuring performance Social return on investment Sibanye-Stillwater strives to create sustainable shared value for all stakeholders and that is measured at a local level in terms of our economic contribution to the local economy and the benefit to households in areas around our operations. The social return on investment study conducted in 2023, indicated that the SA region contributed R15.33 (a gain of R7,33 from the R8.00 benchmark we set), which means for every investment made we leave behind R4,58 income per household (household size, 3.34 as per the census of 2021). See the Group impact supplement report, available www.sibanyestillwater.com/ news-investors/reports/annual/ Measuring our social performance We commissioned independent experts to formulate a social impact index (also known as a social value index). This index measures the impact of our various socioeconomic development projects against alignment with our sustainability strategy. 67 projects, across 7 portfolios, were evaluated using the social value index, with a social value score for each. The portfolios, and the projects therein, correspond to UN SDGs: • Education (UN SDG 4: Quality Education; 6: Clean Water and Sanitation; 9: Industry, Innovation and Infrastructure) • Social development (UN SDG 1: No Poverty; 3: Good Health and Well-Being; 5: Gender Equality) • Healthcare (UN SDG 3: Good Health and Well-Being) • Municipal support • Social infrastructure • Income generation (UN SDG 1: No Poverty; 2: Zero Hunger; 4: Quality Education; 10: Reduced Inequalities) • Community resilience 1, 2, 3, 4, 5, 6, 9, 10 SOCIOECONOMIC DEVELOPMENT continued IR - 219

OUR SVI FORMULA TAKES INTO CONSIDERATION: The benefits are calculated using a standardised set of focus area/ funding portfolio specific indicators. These indicators are categorised into short terms/instant benefits and longer term/ deeper outcomes, the latter slightly weighting to reflect the increased importance of deeper impacts. The indicators source is informed by both the project feedback and the extensive indicator library compiled over the past decade. The beneficiary is based upon a combination of the “breadth” and “depth” of beneficiary or stakeholder groups. For income generation, the volumes of beneficiaries reached are also less than in other focus areas, as these projects tends to affect smaller groups in general. In many cases fewer than 10 beneficiaries formed part of the project. The one exception is the Platinum Incubator has a large number of SMMEs and interns. Vulnerability is obtained from the socioeconomic vulnerability index computed for settlements by the CSIR as part of their Green Book project. This index accounts for various demographic and poverty related dimensions. (The scores were normalised to percentages before used in the formula). Values are relative to a portfolio area and is rather an indication of the change that we are able to affect with a project than the projects overall successful delivery. Although these aspects are naturally linked. Large scale project can naturally generate more value in a community, however smaller scale projects, also have a place in a well rounded portfolio. Project with relatively high spend and lower value indicates ways in which the organization can learn and improve. The GreenBook is an online planning support tool designed to look at the factors contributing to risk in settlements and provide scientific evidence and information that can be used to better understand local risks and describes and quantify, where possible, the inherent vulnerability of people, infrastructure, services, economic activities and natural resources. Education is the portfolio with the most projects (22) evaluated. Sibanye-Stillwater makes a significant contribution in the education sector. Complete new school constructions, such as the new Majakaneng primary and JS Skenjana secondary school, were able to generate high value in the communities. Healthcare projects are relatively similar in nature and often include clinic renovations, or additional resources. Therefore this focus area also show a smaller range in values, with most SVI scores between 48 and 73, On average, these projects therefore generate great value for our host communities. The Social development portfolio, similarly to the Health projects, show high values corresponding to the size of the investment. Direct support to vulnerable communities are achieved through these projects. While our Sheep sheering sheds project created outstanding value for a labour sending community. The graph below shows distribution scores per portfolio. The lowest value was achieved with income-generating project which were historically structured as development projects rather that social enterprises. Most of them are challenged with sustainability post handover and the company has enlisted specialist support from the University of Pretoria to assist with their resuscitation and sustainability. SOCIOECONOMIC DEVELOPMENT continued IR - 220 Distribution of SVI scores per portfolio
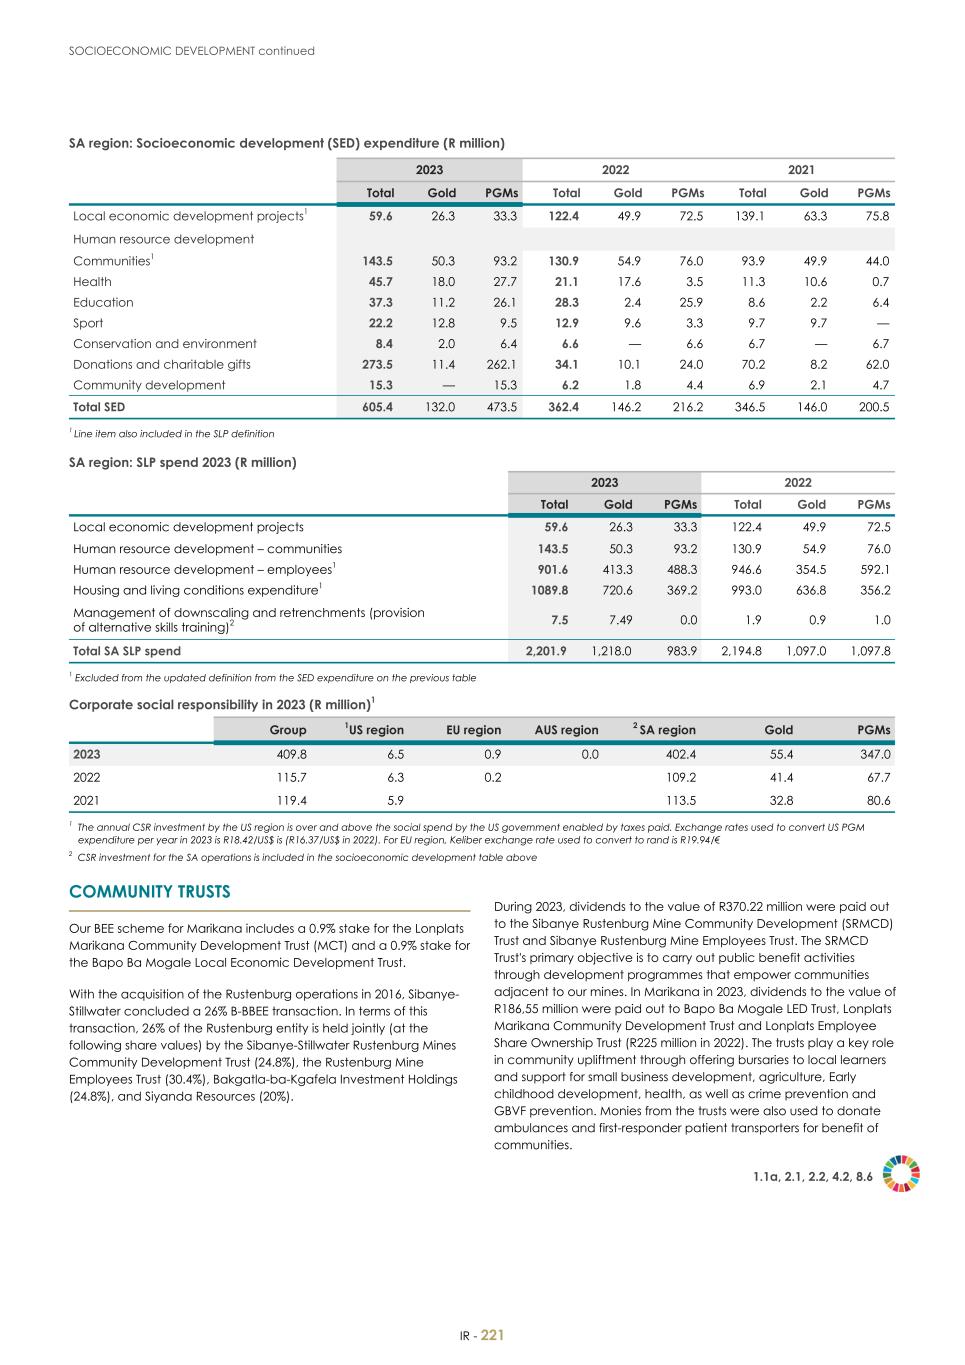
SA region: Socioeconomic development (SED) expenditure (R million) 2023 2022 2021 Total Gold PGMs Total Gold PGMs Total Gold PGMs Local economic development projects1 59.6 26.3 33.3 122.4 49.9 72.5 139.1 63.3 75.8 Human resource development Communities1 143.5 50.3 93.2 130.9 54.9 76.0 93.9 49.9 44.0 Health 45.7 18.0 27.7 21.1 17.6 3.5 11.3 10.6 0.7 Education 37.3 11.2 26.1 28.3 2.4 25.9 8.6 2.2 6.4 Sport 22.2 12.8 9.5 12.9 9.6 3.3 9.7 9.7 — Conservation and environment 8.4 2.0 6.4 6.6 — 6.6 6.7 — 6.7 Donations and charitable gifts 273.5 11.4 262.1 34.1 10.1 24.0 70.2 8.2 62.0 Community development 15.3 — 15.3 6.2 1.8 4.4 6.9 2.1 4.7 Total SED 605.4 132.0 473.5 362.4 146.2 216.2 346.5 146.0 200.5 1 Line item also included in the SLP definition SA region: SLP spend 2023 (R million) 2023 2022 Total Gold PGMs Total Gold PGMs Local economic development projects 59.6 26.3 33.3 122.4 49.9 72.5 Human resource development – communities 143.5 50.3 93.2 130.9 54.9 76.0 Human resource development – employees1 901.6 413.3 488.3 946.6 354.5 592.1 Housing and living conditions expenditure1 1089.8 720.6 369.2 993.0 636.8 356.2 Management of downscaling and retrenchments (provision of alternative skills training)2 7.5 7.49 0.0 1.9 0.9 1.0 Total SA SLP spend 2,201.9 1,218.0 983.9 2,194.8 1,097.0 1,097.8 1 Excluded from the updated definition from the SED expenditure on the previous table Corporate social responsibility in 2023 (R million)1 Group 1US region EU region AUS region 2 SA region Gold PGMs 2023 409.8 6.5 0.9 0.0 402.4 55.4 347.0 2022 115.7 6.3 0.2 109.2 41.4 67.7 2021 119.4 5.9 113.5 32.8 80.6 1 The annual CSR investment by the US region is over and above the social spend by the US government enabled by taxes paid. Exchange rates used to convert US PGM expenditure per year in 2023 is R18.42/US$ is (R16.37/US$ in 2022). For EU region, Keliber exchange rate used to convert to rand is R19.94/€ 2 CSR investment for the SA operations is included in the socioeconomic development table above COMMUNITY TRUSTS –––––––––––––––––––––––––––––––––––––––––––––––––––––––––––––––––– Our BEE scheme for Marikana includes a 0.9% stake for the Lonplats Marikana Community Development Trust (MCT) and a 0.9% stake for the Bapo Ba Mogale Local Economic Development Trust. With the acquisition of the Rustenburg operations in 2016, Sibanye- Stillwater concluded a 26% B-BBEE transaction. In terms of this transaction, 26% of the Rustenburg entity is held jointly (at the following share values) by the Sibanye-Stillwater Rustenburg Mines Community Development Trust (24.8%), the Rustenburg Mine Employees Trust (30.4%), Bakgatla-ba-Kgafela Investment Holdings (24.8%), and Siyanda Resources (20%). During 2023, dividends to the value of R370.22 million were paid out to the Sibanye Rustenburg Mine Community Development (SRMCD) Trust and Sibanye Rustenburg Mine Employees Trust. The SRMCD Trust's primary objective is to carry out public benefit activities through development programmes that empower communities adjacent to our mines. In Marikana in 2023, dividends to the value of R186,55 million were paid out to Bapo Ba Mogale LED Trust, Lonplats Marikana Community Development Trust and Lonplats Employee Share Ownership Trust (R225 million in 2022). The trusts play a key role in community upliftment through offering bursaries to local learners and support for small business development, agriculture, Early childhood development, health, as well as crime prevention and GBVF prevention. Monies from the trusts were also used to donate ambulances and first-responder patient transporters for benefit of communities. 1.1a, 2.1, 2.2, 4.2, 8.6 SOCIOECONOMIC DEVELOPMENT continued IR - 221

US region –––––––––––––––––––––––––––––––––––––––––––––––––––––––––––––––––– Social operating context Through our compliance to Montana’s Hard Rock Mining Impact Act (HRMIA) we meet infrastructure needs for schools and other public services. The US region also contributes significantly to local economic activity. An independent economic impact study by the Bureau of Business and Economic Research stated that in 2022 we created an output of US$6 billion, 5% of Montana’s economic output. The success of this study has laid the foundation to complete economic impact studies, based on the economic model followed in the US, to other regions in the Group. Our CSI initiatives include the Community Giving Team, led by charitable employees dedicated to helping those in the surrounding community. In 2023, CSI initiatives in the US region provided US$400,000 (US$388,000 in 2022) to support local non-profit organisations. We also received a further US$151,643 from our financing partner Wheaton Precious Metals (US$168,653 in 2022) for CSI. The US PGM operations focus their CSR on rural emergency and healthcare services, education, community improvement, and environmental stewardship. Our “Community giving team” meets once a month to review requests and select a "community giving spotlight" within the above four focus areas. We encourage employees to participate in local fundraisers, and to volunteer their time and talents in service to others. Our Volunteer of the Year award recognises the three standout givers. Winners are awarded funding to give to their non-profit of choice. US region: Social activities and related expenditure (US$) 2023 2022 2021 Community projects (48%) 192,000 141,010 148,000 Education (27%) 108,650 143,740 100,000 Emergency and rural healthcare services (15%) 60,800 81,500 92,000 Environmental stewardship (10%) 38,550 21,750 60,000 Total 400,000 388,000 400,000 US local procurement expenditure1 Total procurement (US$m) Local procurement spend (US$m) % of local procurement 2023 555 256 46 2022 459 212 46 2021 439 223 51 1 Local procurement spend reflects the state of Montana. The 2021 figure has been updated to reflect only the state of Montana. EU REGION –––––––––––––––––––––––––––––––––––––––––––––––––––––––––––––––––– Social operating context and stakeholder engagement Keliber lithium project In 2023, Sibanye’s Foundation donated EUR 30 000 to repair the stairs of the local Folks’ Art Center. Keliber donated in aggregate approximately EUR 10 000 to support child and youth athletics, education and culture. Sandouville In 2023, Sandouville supported the local La Havre soccer team and promoted breast cancer awareness. EU region: social activities and related expenditure (€) EU region 2023 Sandouville Keliber Community projects 49,360 9,360 40,000 EU region: local procurement (€) Total procurement (€) Local procurement spend (€) % local procurement Sandouville 5,923,300 1,074,500 18.1 SOCIOECONOMIC DEVELOPMENT continued IR - 222

AUSTRALIAN REGION –––––––––––––––––––––––––––––––––––––––––––––––––––––––––––––––––– Social operating context and stakeholder engagement Century operations The Gulf Communities Agreement establishes a suite of community and stakeholder engagement forums to address matters of particular concern and interest to the Traditional Owners of the lands and waters impacted by the Century operations. In 2023, Century operations facilitated and participated in the following formal engagements with the stakeholders in the lower gulf communities: • Aboriginal Development Benefits Trust (six meetings) • Century Environmental Committee (four meetings) • Century Employment and Training Committee (four meetings) • Century Liaison and Advisory Committee (one meeting) Among these formal engagements, Century operations maintains regular informal and semi-formal contact with other community stakeholder groups including the Burke and Carpentaria Shire Councils, local landowners, State and Federal Parliamentarians, the Queensland Government and other interested stakeholders from the lower Gulf of Carpentaria. Mt Lyell No formal engagement regime has been established at Mt Lyell however, regular ongoing engagement with stakeholders is ongoing as part of the feasibility investigations. AUS region: Gulf Communities Agreement (A$m) Century Employment and training programmes for indigenous communities 1.7 Environmental activities and engagement with indigenous communities 0.2 Economic development initiatives with indigenous communities 1.6 Land-based compensation payments to indigenous communities 1.1 Administrative payment for implementing the Gulf communities agreement 0 Stakeholder and community engagement 0 Total 4.6 AUS region: Local procurement (A$m) Total procurement (A$m) Local procurement spend (A$m) % local procurement Total AUS region 303.0 186.6 61.6 PROCUREMENT, ENTERPRISE AND SUPPLIER DEVELOPMENT –––––––––––––––––––––––––––––––––––––––––––––––––––––––––––––––––– Through the purchase of goods and services we have an opportunity to include marginalised people into the mainstream economy and to promote socioeconomic development. Procurement is managed at a local level, as we seek to procure as much as possible from doorstep communities, which forms part of our strategic differentiator to build pandemic-resilient ecosystems. SA region In South Africa, Mining Charter III calls for mining to leverage procurement in the interests of including HDPs (historically disadvantaged persons), women, and youth in the economy. With the gazetting of the third iteration of the Mining Charter in September 2018, the procurement targets, particularly as they relate to goods and services spend with women- and youth-owned companies, was considerably revised. The targets are to be achieved over a five-year period for mining goods and within a two-year period for services rendered. The five-year transitional targets include: • A minimum of 70% of mining goods procurement must be spent on South African manufactured goods, of which 70% shall be allocated as follows: – 21% allocated to South African manufactured goods produced by HDP-owned companies – 5% allocated to women- or youth-owned companies – 44% on B-BBEE-compliant companies • A minimum of 80% of services rendered must be spent by sourcing from South African-based suppliers, of which 80% shall be allocated as follows: – 50% spent on services supplied by HDP-owned companies – 15% spent on services supplied by women-owned companies – 5% spent on youth-owned companies – 10% spent on B-BBEE-compliant companies Mining Charter III targets for mining goods were achieved for the majority of our operations; while targets for services were not achieved. Achieving these procurement targets is important for regulatory compliance and to give meaning to our ESG commitments. However, suppliers who fit the criteria are not always available. Through preferential procurement of services we have improved our HDP score for black women and youth-owned companies from 48% in 2022 to 56% in 2023. Below we detail various initiatives to address the shortfall that remains. Coupa business spend management platform Our Coupa business spend management platform handles a range of functions, including procurement. Our database includes some 900 doorstep suppliers, helping to ease these entrepreneurs and small companies into our procurement process and encourage the growth of micro-, small- and medium-sized enterprises (SMMEs). In 2023, a total of R3,667 million of the procurement budget was spent through our doorstep suppliers and doorstep JVs (R2,905 million in 2022). SOCIOECONOMIC DEVELOPMENT continued IR - 223

SA region: Discretionary BEE procurement1 (%) 2023 2022 Total Mining Goods Spend Total Services Spend Valid Mining Goods Spend Valid Services Spend Mining goods Services Mining goods Services R'm R'm R'm R'm Target 70 % Target 80% Target 70% Target 80% Gold Beatrix 496 766 374 397 76 52 72 60 Cooke 1, 2 and 3 276 288 133 195 48 68 54 62 Cooke 4 194 240 147 204 76 85 66 57 Driefontein 1027 1151 790 637 77 55 74 64 Kloof 1148 1195 839 775 73 65 76 75 PGM Kroondal 944 2,193 787 1,921 83 88 86 89 Rustenburg 2,090 5,401 1,647 4,429 79 82 80 81 Marikana 2,128 4,364 1,587 2,835 75 65 79 58 Total 8,303 15,598 6,305 11,394 76 72 78 72 1 The Mining Charter’s procurement targets apply to procurement that ‘excludes non-discretionary procurement expenditure’ – this excludes expenditure that cannot be influenced, such as procurement from the public sector and state enterprises. Procurement targets therefore apply to discretionary expenditure over which Sibanye-Stillwater has influence SA region: Total empowerment spend 2023 2022 Black-owned1 (historically disadvantaged South African) businesses R million % of total spend R million % of total spend Male-owned 16,411 50 13,713 48 Women-owned 7,754 24 6,299 22 Total 24,165 74 20,012 70 1 Ownership greater than 51% SA region: Local discretionary and BEE procurement expenditure Total discretionary procurement (Rm) 1 HDP Local BEE procurement spend (Rm) % of BEE procurement 2023 R32,742 R25,018 76 2022 R28,373 R21,415 75 2021 R23,496 R16,442 70 2020 R17,649 R12,656 72 1 HDP ownership greater than 25% Supplier development The SA region assesses community suppliers to enrol them in our supplier development programme. These suppliers are monitored monthly, reviewed annually, and need to graduate within three years. The benefits we offer these suppliers include: • Support from operations • Support in onboarding • Opportunity for funding • Business training • Shorter payment terms • Assistance in submitting invoices and in pricing We have engaged a third party (Phakamani) to offer coaching and assessments in a range of areas, including financial management. In 2023, we paid for 354 people from our host community to attend their business accelerator programme (453 in 2022). In 2023, 1,059 people participated in supplier development training programmes (1,216 in 2022) and 422 loans were disbursed, totalling R101.9 million (R97.3 million in 2022),to support suppliers. Also see detailed case studies in our Group impact supplement report 2023, https://www.sibanyestillwater.com/ news-investors/reports/annual/ SOCIOECONOMIC DEVELOPMENT continued IR - 224

A local economic development initiative at Marikana (on which we spent R27 million in 2023) promotes entrepreneurs from the community. We also have a programme to develop solar apprentices, who can set up their own business and sell their services to the Group. In terms of our strategic differentiator Pandemic-resilient ecosystems, localisation of our supply chain is important. We are improving our relationships with suppliers, including large suppliers; and we are focused on how to share in some of their processes, like for example sending them our waste products, which they use in their business as inputs. We use such opportunities to improve our value chain and our market intelligence. CEO Enterprise Development Fund Our CEO Enterprise Development Fund helps local entrepreneurs join our supply chain. The fund is mainly for SMMEs who need capital to purchase assets or goods to fulfil an order. The fund is capitalised to the value of R103 million. 2023 Supply chain fund CEO Fund Total Loan target 72 — 72 Number of loans approved 405 17 422 Funds approved by investment committee R million R82 R20 R102 Number of jobs created and sustained 2,502 374 2,876 Number of SMMEs supported 126 11 137 Female entrepreneurs supported 182 11 193 Youth entrepreneurs supported 172 5 177 Enterprise development transactions 32 4 36 Total funds disbursed (Sibanye-Stillwater and IDF) R million R109 R103 R212 New venture creation (NVC) training 96 — 96 Business accelerator programme (BAP) training 1,967 — 1,967 Coupa training 883 — 883 New enterprise development supplier introduced — — — Enterprise development validation — — — Funds recovered (2023 transaction) R million R57 R5 R61 Funds recovered (total for Sibanye-Stillwater) R million R306 R62 R368 Recovery rate 0.00 % 0.00 % 94.86 % 9.3 SOCIOECONOMIC DEVELOPMENT continued IR - 225 • Project manager appointed to review non-compliant suppliers with the commodity team and supplier development • Identify contract for inclusive procurement from non-compliant suppliers • Update/Validate our doorstep supplier with missing information/old information • Confirm the existing doorstep suppliers’ capacity • Support doorstep supplier through the supplier development programme • Ring-fenced commodities for our host communities • Identify any host community supplier gaps • Engage enterprise development to assist with the gaps • Business acceleration programme – training for host community supplier individuals • Utilise our suppliers to train/incubate our host community entrepreneurs, align with inclusive procurement • Sibanye-Stillwater funding programme – R101.9 million approved loans • Supply chain fund – R81.55 million (405 approved loans) • CEO fund – R20.35 million (17 approved loans) • Overall jobs created – 2 876 • Identify further opportunities • Review suppliers across different operations • Tender opportunities identified to increase spend
Human rights and ethics: inside and out Human rights Respect for human rights is fundamental to the culture of the Group and is reflected in our iCARES values. We adhere to national legislation and our Human rights policy statement is aligned to the ICMM, to the UNGC, and to the WGC Responsible Mining Principles. Our Code of Ethics has been updated to include human rights requirements. Our harassment procedure, anti-harassment guidelines, leave policy and disciplinary procedure are examples of other human rights-related policies. These include provisions on harassment, bullying, discrimination, freedom of association, forced labour, modern slavery, human trafficking, and child labour, in alignment with UN SDG 8.7 (Eradicate forced labour, modern slavery, and human trafficking). The AUS region prepared a modern slavery statement, which is a regulatory requirement. 8.7, 16.3 The oversight responsibility for supporting and respecting internationally proclaimed human rights is the duty of the Social, Ethics and Sustainability Committee of the Board. Our learning management system has modules for ethics, fraud awareness, and human rights. Since the introduction of the modules 5,653 employees completed the training. Further to this, during 2023, 76% employees received refresher training on our Human rights policy, and on safety and health. See Empowering our workforce, page 160. Human rights due diligence Sibanye-Stillwater is committed to respecting the rights of individuals and institutions in all its operating ecosystems.It has in place policies and procedures that guide how it manages its direct and indirect impacts relative to human rights. It subscribes to human rights principles including the local instruments that guide human rights compliance on the basis of protect, respect and remedy framework. In 2023, Sibanye-Stillwater conducted a Human Rights Due Diligence analysis in the US and SA, aimed at identifying and assessing its human rights impacts and any associated risks with its operations. This assessment enabled the company to stress test its policies, practices and impacts. This process included engagement with stakeholders that could be impacted and affected by any potential human rights impacts. This is in line with the UN Guiding principles that require business to respect human rights and ensure that there are remedial measures in case of breaches. Of the 31 principles of the UN Guiding principles on business and human rights and the 30 articles of the Universal declaration on human rights assessed, five areas indicated gaps and improvement opportunities that need to be closed through policy they include: safety and security, gender, socioeconomic development, environmental and occupational safety. It is important to highlight that no material human rights violations were identified during the reporting period. Stakeholders are encouraged to report any potential violations directly to Sibanye-Stillwater, to independent complaints system or to local Human Rights authorities. The five areas were highlighted for improvement: • Safety and Security Illegal mining is a serious risk to the Group, specifically to the SA region. Sibanye-Stillwater Protection Services takes a proactive approach to crime prevention and is working with authorities to try and apprehend the crime syndicates (See our Illegal mining fact sheet, and the Safe production section, page 130). However, social impacts of illegal mining are multifaceted and create undue hardships and exacerbates criminality in mining communities. Further work is needed to deal with collusion by our own employees partaking in illegal activities. Broader spectrum of engagement on the matter is required. 16.1 • Gender Equality Sibanye-Stillwater’s dedication to equal rights, and protection of women in the workforce are underpinned through various initiatives such as the establishment of Gender-based violence protection centres, and the Women of Sibanye-Stillwater initiatives. (See Empowering our workforce, page 156). However in the workplace and surrounding communities, intimidation and harassment are still prevalent. We will continue to work diligently to address any form of intimidation and harassment in our workplace. 5.2 • Socioeconomic development Sibanye-Stillwater is a significant employer and directly and indirectly creates economic benefits. Investment in socioeconomic development programmes is made and alternative economic models are being developed as part of the post mining and closure plans. (See Socioeconomic development, page 218). Unemployment and economic disparity are key factors in the SA region’s operating context driving the need for skills development, further local procurement and employment opportunities. Further work needs to be undertaken to engage with local stakeholders and continue to invest in post-mining economies given the historical challenges around mining operations. 10.3 • Environmental We are committed to minimising environmental degradation on a broad spectrum of environmental aspects. Green metals will likely play an important role in enabling a lower carbon future. See Minimising our environmental impact, page 187). However, greater community participation and engagement is required to actively address environmental related concerns. Enhancing partnerships with host communities are crucial to integrated broader environmental management strategies. 12.2 • Occupational safety Elimination of fatal incidents remain the focus and the immediate priority in achieving our culture of care. Despite our efforts eleven fatalities still occurred at our operations in 2023. We remain dedicated to embedding an operational safety culture that enables our teams to work to standards and block the path to death and mine without fatalities. 8.8 SOCIOECONOMIC DEVELOPMENT continued IR - 226

Supply chain Our terms and conditions for suppliers require that they follow human rights legislation and adhere to our policy statements and Code of ethics. Online ethics as well as free UN Global Compact sustainability training is available to our suppliers. To date 803, suppliers completed the ethics training and 387 entries initiated via our online platform to the free UN Global Compact. Furthermore, 80% of our SA region’s suppliers responded to our ESG-related questionnaire. We continued to audit 50 suppliers a year against ESG criteria which include carbon management, water management, human rights, fair labour practices. See www.sibanyestillwater.com/suppliers/, also see Minimising our environmental impact, page 191 where we commit to screening suppliers to establish their emissions profiles, enhancing the management of our scope 3 emissions. Sibanye-Stillwater has prioritised supplier contract coverage, with having a target of 55% contract coverage of our discretionary spend with suppliers. We achieved 55.9% contract coverage. This is important as these agreements highlights the rights and responsibilities of each party. It further decrease risks such as strategic, reputational, compliance, regulatory and ESG. Sibanye- Stillwater has a stringent registration process, each supplier is screened and vetted prior to transacting. Security and human rights Sibanye-Stillwater’s Protection services (SA region), as well as the security function for our US operations are aligned to the Voluntary Principles on Security and Human Rights (a multi-stakeholder initiative to guide best practice on human rights in mining and other industries). During the contracting process, security service providers must show that they adhere to the Code of Conduct for Security Service Providers (prescribed under South Africa’s Private Security Industry Regulation Act, 2003) and that their employees are trained in human rights. They must also adhere to our Human rights policy statement and our Code of ethics (among other stipulations) which is managed within the terms and conditions agreed to between the parties. Security service providers are audited annually regarding compliance. Due to the high crime levels and illegal mining in South Africa (which often result in attacks on employees and damage to our assets) it became a necessity to improve the specialist skills of our tactical response, and first responder teams. See Combating illegal mining fact sheet, www.sibanyestillwater.com/news-investors/ reports/annual/ Security staff training on human rights 2023 2022 2021 Employees Contractors Employees Contractors Employees Contractors SA PGM 536 781 699 514 264 408 SA gold 400 799 167 259 615 194 US PGM N/A 14 N/A 26 N/A 26 Total 936 1,594 866 799 879 628 Anti-bribery, anti-corruption and whistleblowing The Group has policies for anti-bribery and corruption, anti-money laundering and counter-terrorism, and on whistleblowing. The policies confirm the Group’s zero-tolerance for illicit behaviour, including terrorist financing. The policies apply across all regions; training on them is scheduled for early 2024. We have a whistleblowing toll-free number, postal address, website and email to report unethical or undesirable behaviour. Communication is handled by an independent third party and identities are protected. We also have a Whistleblowing policy and Fraud response plans, applicable to the jurisdiction of operation. We are committed to conducting business with customers, suppliers, distributors, counterparties and agents involved in legitimate business activity and whose funds are derived from legitimate sources. Our risk assessments include screening suppliers and the investigation of anonymous bribery and corruption tip-offs. We report the outcome of these investigations. In 2023, Anonymous tip-offs hotlines were introduced for the EU and the AUS regions. Performance In all, 723 incidents (2022: 348) relating to employee dishonesty (fraud and assisting illegal mining) were reported at Sibanye- Stillwater’s gold operations in 2023, leading to 764 (2022: 368) employees, including contractors, being subject to discipline. At our SA PGM operations, 110 incidents of corruption (2022: 108) were reported, with 27 employees (2022: 69) charged and disciplined in terms of our Code of ethics. A total of 305 anonymous calls (2022: 289) were received during 2023 at the SA and US regions, with most of these relating to fraud and corruption. Many of the calls provided valuable leads, which were investigated. Those concerned were charged and disciplined in terms of our Code of ethics, as well as being subject to criminal investigation if their misdemeanour included law-breaking. Crimes are recorded on the crime incident and investigation management system, and are investigated. 16.3, 16.5 Anonymous calls in SA and US operations Area 20231 20221 Fraud 66 79 Breach of company policy 73 68 Procurement fraud 29 10 Corruption 27 16 Illegal mining 39 25 Theft of mine property 10 19 Time and attendance fraud 11 2 Industrial action 0 1 Theft of GBM 2 4 Arson 0 0 Trespassing 1 0 Human resource related issues 13 3 Theft of PGM2 2 4 Copper theft 1 17 Other 31 41 Total 305 289 1 Includes US PGM operations – five incidents: one for theft of MP, one for BOCP (breach of company policy), two are HR-related and one for assault SOCIOECONOMIC DEVELOPMENT continued IR - 227

Heritage Sibanye-Stillwater has over 851 heritage sites across our SA and US operations, including grave sites, iron age and stone age sites, historical mine buildings and structures that are over 60 years old. Our AUS region has documented the heritage sites as part of the Gulf Communities Agreement and our project in Finland have considered heritage sites in the area planning. In 2023, the rollout of the monitoring checklist continued with the rest of the operations in the SA gold and PGM operations in accordance with the Heritage management awareness plan. The checklist was incorporated into the Pivot/Synchromine system, for ease of use by the relevant internal teams when doing site inspections, but also to systemise and track non-conformances and actions emanating from such site inspections. We developed a chance find protocol for SA gold operations, which informs employees on what to do should sub-surface heritage resources be encountered during excavation, construction, rehabilitation, reclamation, mining or maintenance activities. We performed training sessions (for employees) on heritage management plans for the SA region in Q3 of 2023. In 2023, we commenced and completed the process to exhume and re-bury the human remains in 10 graves found within the catchment of the return water dam at K3. All necessary approvals and permits for the exhumation and reburial were obtained from the relevant local and national authorities, and the necessary consent was obtained from the affected families. The relocation close-out report was finalised and was submitted to the South African Heritage Resources Agency. Our measures are commensurate with the National Heritage Resources Act 25 of 1999. (See Minimising our environmental impact, page 210). Resettlements There were no resettlements of communities (or plans to resettle communities) in 2023. The Group notes that in the life of its operations it might need to resettle communities. To this end, and when resettlement cannot be avoided, the Group commits to undertake resettlement constructively and treat parties fairly. A resettlement framework is included in our SA region’s social performance toolkit. Fair labour practices 8.8 We commit to promoting the aims of UN SDG 8.8 (Protect labour rights and promote safe and secure working environments of all workers, including migrant workers, particularly women migrants, and those in precarious employment). All employees are subject to vetting procedures, including the verification of age, criminal record checks, and medical fitness assessments. We support collective bargaining and freedom of association, as per the labour legislation in the areas that we operate and as per the International Labour Organisation Protocol on decent work and working conditions. See Empowering our workforce, page 163. In Europe, both French and Finnish subsidiaries operate according to European labour rules. In France, employees are represented by a labour committee (CSE in the French abbreviation), aimed at optimising working conditions, they also have a dedicated budget allocated to training, leisure and social projects. FUTURE FOCUS ––––––––––––––––––––––––––––––––––––––––––––––––––––––––––––––––––––––––––––––––––––––––––––––––––––––––––––––––––––––––––––––––––––––– AUS REGION • Continued compliance with the requirements of the Gulf Communities Agreement at Century operations • Develop and execute progressive rehabilitation and closure plan for Century operations in accordance with Queensland legislative requirements • Investigate the restart of the Mt Lyell Copper Mine in Tasmania and the opportunities for socioeconomic contributions that it can unlock EU REGION • Complete the ICMM self-assessment of mining principles and performance expectations • Investigate socio-economic project opportunity to fund with through Sibanye-Stillwater foundation SA REGION • Complete a Group socioeconomic study, • Continue with implementation of socioeconomic programmes through partnerships US REGION • Advance rural vitality by bringing cultural experiences and connections to our rural and indigenous communities through our curated Community Giving collaborations with local non-profits, our Community Giving Team, and our generous commercial partners • Enhance human rights efforts to create inclusive workplaces and inclusive communities through business resource group work, contractor and employee training, and a focus on more flexible work arrangements • Connect employees and workplaces with communities and families through enhanced employee communications and community engagement events SOCIOECONOMIC DEVELOPMENT continued IR - 228

GOVERNANCE IN SUSTAINABILITY: OUR CONSIDERED DECISION-MAKING COMMITMENT TO ESG PERFORMANCE –––––––––––––––––––––––––––––––––––––––––––––––––––––––––––––––––– According to Section 72(4) of the Companies Act, the Social, Ethics and Sustainability Committee is obliged to oversee social and environmental contributions (or detriments). The Chief Sustainability Officer (CSO) reports directly to the CEO. ESG performance targets and measures have been included as part of our long-term incentive scheme applicable to senior management, which aims to align interests and actions across the Group. See Remuneration report, page 264. Targets included in the ESG scorecard that forms part of the long- term incentives (LTI) performance conditions, as well as all other sustainability-related targets (internal and external targets) are reviewed quarterly and reported to the Social, Ethics and Sustainability Committee. Progress is also reported publicly in the Integrated report. Our ESG commitments are verified through various third-party associations. Our ESG-related policies and position statements are developed in alignment to international standards, and in consultation with experts from inside and outside the Group. See Policies and position statements at www.sibanyestillwater.com/ sustainability/reports-policies and www.sibanyestillwater.com/ about-us/governance/; See Definitions for sustainability/ESG indicators, www.sibanyestillwater.com/news-investors/reports/ annual Training and awareness are integral to embedding ESG: our annual refresher training, in the US and SA regions, includes sustainability- related aspects such as environment, safety, health, human rights, and work-related policies. We monitor our areas of impact and respond appropriately to the changing ESG landscape, adopting leading practices as prescribed by industry bodies and adhering to voluntary codes. We use external consultants to audit and certify our sustainability credentials. The sustainability standards and codes we subscribe to are fit for purpose in the evolving context. There are currently no material sustainability compliance issues to highlight at Group level; and there were no material or repeated regulatory penalties, sanctions or fines for contraventions of, or non- compliance with, statutory obligations in 2023. ICMM (International Council on Mining and Metals) The ICMM mandates members (of which we are one) to implement its Mining Principles and Performance Expectations at asset level. It also requires that we use the Global Reporting Initiative (GRI) Sustainability Reporting Standards to publicly report on our sustainability performance. Additionally, this must be assured annually by a third party. We adhere to these requirements and our asset level disclosure against the ICMM requirements are available in a supplementary disclosure. (See Supplementary disclosure Sibanye-Stillwater’s ICMM self-assessment for 2023; www.sibanyestillwater.com/news-investors/reports/annual and see Sustainability content index, www.sibanyestillwater.com/news- investors/reports/annual) In 2023, the US PGM operations completed a self-assessment against the ICMM principles. This self-assessment was independently assured by KPMG as part of our annual sustainability assurance process. The previous gap as identified in 2022, to complete a human rights due diligence (HRDD), was concluded for the SA and US regions in 2023. Extractive Industry Transparency Initiative (EITI) Membership of the ICMM requires that we endorse the EITI. The EITI has found Sibanye-Stillwater to be aligned with its criteria, with the note that the anti-corruption and bribery policy to be concluded as at the time of the assessment was still in draft form. For disclosure against the supporting companies EITI expectations, see Sustainability content index, www.sibanyestillwater.com/news- investors/reports/annual UNGC (United Nations Global Compact) We are a participant in the UNGC. Our membership enables us to drive impact on specific sustainable development goals and to communicate our progress. The UNGC moved to a new platform to allow companies to provide their annual communication of progress against the updated UNGC requirements. The SA region participated in the South African voluntary national review process against the SDGs. Sibanye-Stillwater participated again in the SDGs Youth Innovators programme with two of our Bathopele employees focusing on SDG 13 (climate change.) We also participated in the human rights accelerator programme. Due to our participant status with the UNGC, all employees can access its online academy on sustainability matters. See Progressing the UN’s SDGs supplement. IR - 229 The Sibanye-Stillwater team from Bathopele mine that participated in the UN SDGs Youth Innovators programme saw Bathopele mine win the Southern African Institute of Mining and Metallurgy environmental award. The team from Bathopele developed a waste management project that can save the shaft R2 million in the first year. Case study: Youth innovators

World Gold Council (WGC), Responsible Gold Mining Principles (RGMP) Using the equivalency benchmark between the WGC’s RGMPs and the ICMM’s Mining Principles and Performance Expectations, Sibanye-Stillwater was assessed by a third-party assurance provider and found compliant to the RGMP. KPMG issued the Group with an unqualified limited assurance conclusion. The gap identified in the previous assessment relating to human rights assessment was addressed by the independent HRDD that was conducted for the SA region. Sibanye-Stillwater also provided information to the WGC on socioeconomic contributions made by gold companies. In 2023 Sibanye-Stillwater’s CEO was appointed as the new chairman of the WGC. See www.sibanyestillwater.com/about-us/governance/ International Platinum Group Metals Association (IPA) The IPA is a non-profit association for companies in the PGM industry. The IPA encourages that primary producers assess themselves against IRMA. Initiative for Responsible Mining Assurance (IRMA) During 2023, East Boulder and Stillwater operations (US PGM), and the Rustenburg operations (SA PGM) completed a stage 1 audit against the IRMA Standard’s requirements. The Rustenburg operations were recommended by the audit provider (ERM-CVS) for stage 2. For East Boulder and Stillwater (US region), ERM-CVS also recommended them for stage 2. The Marikana operations will complete a stage 1 audit during 2024. Stage 1 is a desk audit; stage 2 is an onsite audit publicly noticed 30 days prior to encourage community engagement. We are on track to achieve IRMA verification of all our SA PGM operations by 2025. International Organisation for Standardisation (ISO) All our South African and US operations, and Sandouville in France, remain certified as per ISO 14001 (Environmental management) and 45001 (Occupational health and safety). Group ICT achieved full ISO 27001 (information security) certification in 2023. With ISO 27001:2022 released to the market, Group ICT is working on completing the gaps from the 2013 version. Sandouville is also compliant with ISO 50000 (Energy management). Precious metals laboratory (PMR) laboratory achieves historic accreditation The PMR laboratory recently achieved a world first accreditation: the ISO/IEC 17025:2017 for the analysis of impurities in pure rhodium, ruthenium sponge and PGMs in refinery effluent. Our PMR laboratory is the first and only laboratory in the world to analyse 31 impurities in pure PGMs by SAFT (spark analysis for trace elements). Additionally, it is the only laboratory globally to have the analysis of impurities in all five pure PGMs (Pt, Pd, Rh, Ru and Ir) accredited for ISO/IEC 17025:2017. The ability to deliver trusted results in any lab is critical. ISO/IEC 17025:2017 is an important standard for laboratories across the world. Task Force on Climate-related Financial Disclosures (TCFD) In 2023, we commissioned a detailed TCFD study and risk analysis for all our operations, covering both physical and transition risk modelling. The report quantifies climate-related risks on free cash- flow forecasts and what the likely financial impacts of these risks would be. It also gives us a baseline to work off for future disclosures and other frameworks, such as the ISSB’s IFRS S2 climate-related disclosures. See Climate change supplement and the Sustainability content index www.sibanyestillwater.com/news-investors/reports/ annual, see also our CDP disclosure. 13.1 FTSE4Good We are a constituent of the FTSE4Good Index Series, which demonstrates our strong ESG practices. See www.sibanyestillwater.com/sustainability Integrated Reporting & Assurance Services (IRAS) review Sibanye-Stillwater achieved joint first place in both the metals and mining sector category, and joint first place “overall” in the 2023 sustainability data transparency index (SDTI) research report compiled by IRAS. (We came third overall in 2022.) The Group scored 90.75% for the 2023 STDI – significantly higher than the mining and metals sector’s average rating of 64.5%. The index covers various data points across 104 ESG/sustainability indicators, and it evaluates 270 JSE listed companies. Standards convergence 2023 saw rising requirements and regulations for reporting. In Q4 2023, several new tighter ESG regulatory frameworks were introduced in the EU, such as Corporate Sustainability Reporting Directive(CSRD) which is expected to increase the number of firms subjected to EU sustainability reporting requirements. The US Securities and Exchange Commission (SEC) and the newly formed International Sustainability Standards Board (ISSB) published the International Financial Reporting Standards Sustainability Disclosure Standards (IFRS S1 and IFRS S2) which build on the TCFD recommendations. Sibanye-Stillwater has, through the services of PwC, assessed alignment with the IFRS Sustainability Disclosure Standards. The biggest difference between CSRD and the IFRS Sustainability Disclosure Standards is that IFRS Sustainability Disclosure Standards requires a financial materiality concept as opposed to the double materiality approach of the CSRD. Post year-end, the GRI also launched its updated mining disclosure standard. These new rules and disclosure standards aim to enhance transparency and consistency on sustainability-related issues and mitigate the risk of misrepresentation, perceived as greenwashing, in financial markets. However, they also face criticism because of their complexity and a continuing lack of global alignment with other standards. It is welcomed that disclosure standard bodies ISSB, European Financial Reporting Advisory Group (EFRAG), and security commission, the SEC all use the TCFD framework as a reference for climate-related issues. Unfortunately, there is divergence in their specific requirements and how they treat wider sustainability issues. We note the positive step toward convergence of responsible mining standards in 2023. ICMM’s has put out draft of standards (for members commentary) that converge ICMM, MAC (Mining Association of Canada), WGC RGMPs and Coppermark. This proposed standard (due for public consultation in Q1: 2024). Unfortunately, this new standard does not include IRMA, which enjoys broad stakeholder acceptance. Through the ICMM we have participated in communicating to the International organisation for standardisation that they should not develop a responsible mining standard because a plethora of standards are already in existence. We will continue to lobby through the ICMM for more convergence of responsible mining standards and for some sort of “moratorium” on new ones that will add to the compliance burden, without necessarily improving assurance. 17.14 GOVERNANCE IN SUSTAINABILITY: OUR CONSIDERED DECISION MAKING continued IR - 230

12.6, 12.8 DUE DILIGENCE ––––––––––––––––––––––––––––––––––––––––––––––––––––––––––––––– Prior to acquiring new assets we do a comprehensive ESG due diligence that includes, among others, environmental licence to operate, usage of scarce resources, clean energy solutions, labour practices, safety and health, community and related stakeholder engagements, anti-bribery and anti-corruption practices, accounting standards, and sanctions relating to ESG. Responsible sourcing Sibanye-Stillwater has a comprehensive internal management system for supply chain due diligence in the sourcing of metals; with governance provided by the Responsible sourcing committee. The committee oversees the responsible sourcing of PGMs, nickel and gold; it reviews and assesses supply chain due diligence and approves the counterparties after discussion and appropriate risk mitigation. Our Responsible sourcing framework commits Sibanye-Stillwater to stop using suppliers of metal, if preliminary assessments indicate serious human rights abuses, money laundering, financing armed conflict, or fraudulent misrepresentation of the origin of minerals. Due diligence of metal supplying counterparties are assessed against the framework and presented at Responsible sourcing committee meetings. The scope of our Responsible sourcing policy now includes nickel and gold. In 2023 we aligned our Responsible sourcing of metals policy with the requirements of the London Metals Exchange (LME), the London Platinum and Palladium Market (LPPM) and conflict free gold standard. Note: Century operations does not require responsible sourcing assurance given that they do not use third-party metals. See www.sibanyestillwater.com/about-us/governance/ London Metals Exchange (LME) In June 2023, we submitted our responsible sourcing Red flag self- assessment questionnaire to the LME. They since confirmed that we are still listed on the approved LME brands list. Conflict free gold standards (CFGS) In May 2023, PwC finalised the first CFGS review for the period ending December 2022 (the CFGS is under the auspices of the WGC). The Group is working with a third party (aXedras) to adopt technology that gives assurance on the provenance of gold, where it came from, who sold it, all the way through to refiners and the market. London Platinum and Palladium Market (LPPM) The LPPM’s responsible sourcing programme sets standards to combat human rights abuses, conflict, corruption, money laundering, and terrorist financing. We submitted our responsible platinum, and palladium guidance 2022 assurance review to the LPPM in March 2023. In May 2023 we received a certificate and confirmation that Sibanye-Stillwater has passed the LPPM’s responsible sourcing requirements and remains listed on the good delivery list of refiners. On 14 November 2023 we began a reasonable assurance report for the LPPM, which concluded in March 2024. We remain on the London Good Delivery List of Acceptable refiners for Platinum and Palladium. See www.sibanyestillwater.com/sustainability King IV report In 2023 the internal audit's review of the controls within the King IV processes verified that the recommended principles were adequately and effectively managed. Over the last three years (2020 – 2023), the report ratings consistently remained at "Achieved," with no internal control deficiencies. This signifies adherence to King IV principles . The following represented some key and positive areas noted during the review period: • A resilient governance framework was in place, emphasising ethical leadership to cultivate an integrity driven culture • There was a defined strategic direction aligning with the Group’s mission and vision; notably, the strategic plan outlined specific initiatives, such as entering new markets and diversifying product offerings, demonstrating a comprehensive approach to achieving long-term goals • Structured internal controls were implemented, demonstrating a commitment to ensuring the integrity of financial reporting and compliance with regulations; this is crucial for maintaining trust with stakeholders • Governing structures and delegation were established to enable clear responsibility, authority, and accountability within the organisation • Governance of functional areas was implemented to ensure the presence of adequate and effective controls • Stakeholder relationship efforts were undertaken, facilitating the organisation in maintaining a positive reputation and being perceived as a legitimate and responsible corporate citizen See application of King IV principles in 2023, www.sibanyestillwater.com/news-investors/reports/annual/ Business relationships Due process is followed with regards to those business relationships where our normal management controls do not apply (e.g., Mimosa). In the case of Mimosa, a technical committee (which includes technical experts from the managing partner, from Sibanye-Stillwater, and board members from both) meets quarterly. The outcome of the technical committee sessions feeds into the quarterly Board meetings through the technical committee chair. These sessions cover safety, health, environmental, climate change, and labour-related matters. GOVERNANCE IN SUSTAINABILITY: OUR CONSIDERED DECISION MAKING continued IR - 231

Remuneration report 233 Part 1: Background statement 235 Part 2: Remuneration policy 239 Part 3: Implementation report 253 IR - 232 REWARDING DELIVERY 4

REMUNERATION REPORT REMUNERATION AT A GLANCE Our remuneration philosophy is aimed at: • Rewarding those who deliver on our purpose, strategy and targets to ensure that Sibanye-Stillwater creates value for stakeholders progressively over time • Recognising and rewarding excellent performance • Ensuring reasonable parity for comparable roles (internally and externally) and fair differentiation of pay between different levels of responsibility • Ensuring remuneration is fair while recognising the complex nuances and practicalities as to what is deemed fair Dissenting votes at the 2023 AGM on remuneration-related resolutions Remuneration policy Implementation report Non-executive directors’ fees Remuneration policy changes – 2024 The Remuneration Committee approved the following additions and changes to our remuneration policy for 2024 • Removed the personal performance ‘on-award multiple’ for long-term incentive (LTI) awards • Discontinued the allocation of Matching Share Unit awards in the Minimum Shareholding Requirements (MSR) plan for any new qualifying executives joining the Group after 1 April 2024 • Changed the short-term incentives (STI) performance measurement approach to a combined strategic and operational scorecard Summary of remuneration policy Total guaranteed pay (TGP) Short-term incentives (STI) Long-term incentives (LTI) WHY [ our aim ] Attract and retain skills Delivery on operational and personal/strategic KPAs and targets Delivery on longer-term shareholder value creation WHO [ participates ] All permanent employees All permanent employees Vice Presidents (VPs) and above WHEN [ paid/ performance period ] Monthly Annual, combined with an eighteen-month deferral Three years after the date of the award WHAT [ is measured ] Market aligned (peer benchmarking) Linked to scoring on Personal/ Strategic delivery and Operational delivery scorecards Sustainable shareholder value delivery scorecard (Performance Conditions) HOW [ paid ] Cash (base salary and benefits) Cash and share-price linked cash Share-price linked cash Range and composition of total pay scenarios for the CEO and CFO (Executive directors)* Threshold On-target Stretch Super stretch R0m R40m R80m R120m Threshold On-target Stretch Super stretch R0m R20m R40m R60m Pay mix TGP STI (cash bonus component) DSTI (deferred share price linked component of STI) LTI Percentages in stacked bars may not add up to 100% due to rounding * Share price linked remuneration (DSTI and LTI) values do not reflect possible gains or losses from share price movement IR - 233 3.5% 47.3% 17.4% 100% 28% 24% 16% 32% 16% 18% 28% 38% 15% 17% 25% 43% 100% 32% 24% 16% 29% 19% 19% 28% 34% 17% 17% 26% 39% % of TGP CEO CFO

Policy adjustments in 2023 In addition to its routine duties, the Remuneration Committee made the following policy adjustments in 2023 • Ringfenced the existing Minimum shareholding requirements (MSR) plan such that no new executives will be eligible for Matching Share Unit awards as from 1 April 2024 • Removed the on-award multiple for the LTI awards with effect from the LTI awards to be made in March 2024 onwards • Approved a remuneration Recovery policy aligned with US law for companies listed on the NYSE • Reformulated the evaluation of performance for STI purposes through a combined operational and strategic delivery scorecard Total remuneration for executive directors and prescribed officers* – aggregated (R000) Salary Pension scheme total contributions Cash bonus accrued Accrual of forfeitable share award Other cash payment Conditional share proceeds Other benefits Termination/ Separation benefits Total single figure of remuneration 2023 82,223 9,397 47,225 30,416 2,795 57,299 2,303 3,663 235,321 2022 69,214 6,957 52,976 35,318 4,805 418,261 547 0 588,078 * The same 10 executive directors and prescribed officers were in receipt of the remuneration presented in both 2023 and 2022, although there was partial service from two prescribed officers resident outside South Africa in 2022 and from one South Africa resident prescribed officer in 2023. STRUCTURE OF THE REMUNERATION REPORT ––––––––––––––––––––––––––––––––––––––––––––––––––––––––––––––––––––––––––––––––––––––––––––––––––––––––––––––––––––––––––––––––––––––– This report is presented in three parts, which accord with King IV specifications BACKGROUND STATEMENT See pages 235 – 238 REMUNERATION POLICY See pages 239 – 252 REMUNERATION IMPLEMENTATION See pages 253 – 270 Background to our workings and activities during 2023 and our approach going forward Information on our current and amended remuneration practices and how the main components of our executive pay packages will be determined for the 2024 remuneration cycle – as informed by our remuneration philosophy How we have applied our remuneration policy and practices to the payment and rewarding of executive directors and prescribed officers since last year’s report, and disclosure of the fees paid to non-executive directors REMUNERATION REPORT continued IR - 234

BACKGROUND STATEMENT Dear shareholders Following a 47% vote ‘Against’ the Remuneration implementation report by shareholders at last year’s AGM as well as a 17% vote against the Remuneration policy, we undertook extensive steps to engage with dissenting shareholders as well as with major shareholders on these matters, irrespective of how they had voted. Accordingly, following the various comments and concerns raised, the Remuneration Committee undertook a further review of our pay structures and made several adjustments to address these concerns. We are optimistic that the changes, including some further improvements to our remuneration-related disclosures will meet with our shareholders’ approval. Calibrating the link between pay and performance In particular, the Remuneration Committee reviewed the concerns raised about the perceived excessive upside LTI opportunity for executives. The main contributor to this was the practice of using an ‘on-award multiple’ for each executive by which the quantum of the LTI awards was factored up based on the executive’s personal/ strategic delivery scorecard result. This was highlighted as an area of concern by some shareholders because it could lead to unreasonably high LTI outcomes at vesting. Following a further in- depth review of market practice in this regard, the Committee determined that shareholders’ perspectives were fair and so the application of an LTI ‘on award multiple’ has now been discontinued and will no longer be applicable going forward. It was not applied to the LTI awards effective in March 2024. Furthermore, in terms of LTI award outcomes, shareholders will recall that last year we reported that we had adjusted our Remuneration policy to ensure that the share prices used in determining the issuing and the vesting of LTI awards would be fairly representative of the Group’s long-term value, and not influenced by short-term share price anomalies (i.e., shorter-term ‘spikes’ and ‘troughs’ in the price). This method of potentially moderating the applicable share price to be applied at the time of granting or vesting of share-price linked awards was aimed at mitigating against anomalous beneficial outcomes to executives when share prices are unusually high at the time of vesting or unusually low when the LTI awards are granted. We can report that this approach was applied during the year under review. An example of the effect of its application was that, although the applicable share price for the March 2023 LTI awards did not exceed the ‘cap’ or fall below the ‘floor’ price levels as calculated in terms of the revised policy, the number of share-price linked units awarded in March 2023 was 13% less than would have been awarded under the previous arrangement. This was due to the 30-day volume-weighted average price (VWAP) share price at R42.78 – applicable under the revised policy – being higher than the 3-day VWAP share price at R37.21 – which would have been applied under the previous policy. Notwithstanding these policy refinements, we are confident that our approach to performance-related pay, with our pay mix remaining somewhat more performance-geared than many peers, is appropriate for incentivising and rewarding management in pursuit of the Group’s strategy for delivering shareholder value over time. This approach intends to provide greater upside in years where operational and strategic performance aligns with shareholder value delivery, and a leaner outcome in years where shareholder value regresses due to a commodity downturn. Benchmarking The Remuneration Committee recognises that remuneration benchmarking exercises ought to be undertaken judiciously, as and when structural or market changes suggest the need for such. One of the particular challenges that the Committee faces is the most appropriate way of dealing with the various jurisdictional remuneration distinctions and practices in the respective employment markets in which Sibanye-Stillwater executives operate, or over which they have accountabilities and responsibilities. No broad-based benchmarking exercise was undertaken in 2023 but it is expected to be an area of focus during 2024. The work commissioned by the Remuneration Committee in the meantime has indicated that broadly speaking, Sibanye-Stillwater’s Remuneration policy is remains fairly competitive with the markets in the various jurisdictions where our executives are employed and are accountable though dealing with norms for pay mix that vary substantially across jurisdictions requires further consideration. We have nonetheless made remuneration adjustments in respect of some C-suite members to secure internal parity and market competitiveness recognising the evolution of their roles into a full global leadership scope as a result of the regionalised configuration adopted during 2022. Details are given in part 3 below. It is an ongoing imperative of the Remuneration Committee that our benchmarking approach does not result in inflated reference points due to any inappropriate incorporation of global comparators, and much care is being taken to ensure that the benchmarking approach we adopt results in credible and fair reference points for the various regional employment markets. This can be achieved by applying currency equivalencing that is not based on a raw exchange rate conversion between currencies, or a simplistic cost- of-living adjustment. The methodology under development ensures that reference points reflect an equitable pay level in each jurisdiction to ensure competitiveness in the respective employment markets. Aligning with shareholder interests Following feedback from our shareholders on the appropriateness of Matching share unit awards being made to the minimum shareholding requirements, the Remuneration Committee determined that the existing MSR plan will be ringfenced, and no new executives will be eligible for the matching share units allowed for under the original MSR plan as from 1 April 2024. The majority of the matching awards that may accrue to current executives have already been made limiting the potential for further awards under the existing arrangement. The Remuneration Committee is satisfied that the incentive of Matching share units to date was appropriate in order to achieve its aim of encouraging additional exposure of executives to Sibanye-Stillwater equity and given that this was a unilateral introduction of a new policy for existing executives. We are satisfied with the rate of commitment of shares by executives towards the MSR plan which is now two years into its first five-year period for attainment of the target levels of committed shares. IR - 235

Personal performance as a factor in executive pay In consideration of concerns from shareholders, relating to what they believed was inadequate disclosure of the personal scorecard performance evaluations of the executive directors and the linkage to variable pay outcomes, the Committee has committed to providing more insightful disclosure in this year’s report. We trust that this improved disclosure will better reflect the overall operational and strategic delivery used to determine the STI component of pay. Critical and technical skills retention Another focus area of the Committee during the year was securing key executive roles, including the smooth succession of Dawie Mostert’s role – which was taken over by Themba Nkosi, demonstrating the bench strength of our executive talent pool and talent mapping effectiveness. In addition, Themba’s previous role was filled by his successor within three months. Deductions to variable pay awards The Remuneration Committee determined that the environmental incident involving an overflow of excess rainwater at two evaporation dams at the Beatrix operations (which had initially been classified as a Level 3 incident in January 2022 but later reclassified at Level 4 in March 2023) should result in a 5% malus deduction being applied to all incentive payments to which ESG override or malus is applicable for the forthcoming 12 months in respect of: • members of the C-suite, and • other participants determined by management to have direct responsibility for the incident Furthermore, with regards to safety matters, despite a very much improved set of outcomes on various leading-indicator safety metrics (see the operational scorecard for details) as well as an improving trend in the fatal injury frequency rate (FIFR) when comparing 2023 to the average FIFR of the previous three years, this had nonetheless fallen short of the sought-after 20% improvement in the FIFR which we had targeted as part of our earnest quest for ‘zero harm’. Furthermore, the actual number of fatalities was higher in 2023 than in 2022 and so the Remuneration Committee applied its discretion to impose a further 30% reduction to the scoring of the operational delivery scorecard used to determine STI awards for 2023. Besides the impact of this matter on executives’ 2023 STI awards, the non-executive directors also decided that, in light of the poor financial results as well as fatality outcomes in 2023, they would not request an increase in their directorship fees for 2024. Remuneration Committee activities Summary of activities in 2023 In addition to the standard governance and approval items on the Remuneration Committee’s annual work plan, the following matters were addressed: • Approval of the remuneration package for Melanie Naidoo-Vermaak who assumed the role of CSO from 1 January 2024 • Approval of mutual separation terms for Dawie Mostert (COGO), who left the Group in August 2023 • Considered the ESG and malus deductions applicable to the STI payments and LTI award vestings pursuant to the reclassification of the Beatrix environmental incident • Considered the most appropriate remuneration benchmarking methodology for the Group’s purposes, in particular considering the challenges represented by jurisdictional anomalies, and against the context of increasing global mobility and the Group’s increasing geographic diversification and executive accountabilities • Removed the practice of offering Matching share awards under the MSR Plan for senior leadership from 1 April 2024 • Removed the on-award ‘personal performance’ multiple for LTI awards • Approved the refinement of the clawback of remuneration (Recovery policy) for executive pay, in line with US legislative requirements • Applied discretionary deductions to STI payments for executives based on the fatality outcomes in 2023 and determined not to recommend any increase in fees for non-executive directors • Further work on determining the most appropriate remuneration benchmarking methodology with a specific focus on the application of jurisdictional adjustment factors to develop a global pay scale • Update our review of possible gender pay-gaps within the organisation in order to assess whether previous actions implemented have had the desired effect and also to monitor progress • Further review of relevant market practices for the long-term incentive portion of variable pay REMUNERATION REPORT PART 1 – BACKGROUND STATEMENT continued IR - 236 FOCUS AREAS FOR 2024

Non-binding advisory votes Shareholders will once again be given the opportunity to vote on two separate non-binding advisory resolutions at the forthcoming AGM on 28 May 2024. Resolution number 12 will be in respect of the Remuneration policy report (part 2 of this Remuneration report), and Resolution number 13 will be in respect of the Remuneration implementation report (Part 3 of this Remuneration report). In the event that either or both are voted against by more than 25% of entitled voting rights exercised by shareholders, Sibanye-Stillwater commits to implement measures, including engagement with dissenting shareholders, in an attempt to address all legitimate and reasonable objections and concerns, and to disclose how these objections and concerns may be addressed in next year’s Integrated report. Addressing shareholder concerns on remuneration raised in 2023 As mentioned above, at the AGM held in May 2023, 17.36% and 47.29% of shares voted were against the Remuneration policy and Remuneration implementation reports, respectively. The table below provides an overview of the main points arising from subsequent shareholder engagements as well as points raised by proxy advisors together with a summary of our responses. Shareholder concerns and feedback 1 A query was raised as to whether the length of the STI deferral periods was appropriate and possibly too short. Deferrals are reasonable – no change made. See the STI section on vesting periods of this report Following a review, we remain of the opinion that the 9 and 18 months deferral periods are reasonable and generally consistent with local mining industry practices and remain unchanged. 2 Some shareholders requested increased disclosure around the achievements per KPA In the Personal / Strategic scorecards of the executive directors (EDs) in order to get a better assessment as to the reasonableness of the scoring for the EDs. Disclosures improved – see the updated STI disclosures in this report The extent and nature of the disclosures for the EDs have been improved and can be found in Part 3 of this Remuneration report. 3 A concern was raised that the variable pay potential for the EDs under the current incentive plan practices was too high compared to similar listed firms. Change made to ‘Max LTI’ potential – see LTI vesting limit and LTI quantum limit in this report Further market research was undertaken to ascertain how Sibanye-Stillwater’s long-term incentive allocations compared to peers with particular attention to the potential remuneration that could be achieved at ‘target’ and ‘stretch’ levels. As a result of this study, and following the Committee’s deliberations, it was determined that the ‘on-award multiple’ used in determining LTIs awards (by which the Personal scorecard score of the executive was used as a factor to adjust the size of the award) would be removed as from 2024 onwards. Further benchmarking work on both TGP and variable pay levels will also be undertaken to ensure appropriate levels of parity in the relevant jurisdictions for the relevant roles and accountabilities. 4 A query was raised as to whether the weighting of the Personal scorecard was not too high relative to the Corporate scorecard when determining the overall score for incentives. For EDs the STI is comprised of a 30% weighting of the Personal scorecard and a 70% weighting of the Corporate scorecard). Weightings will be specific to each executive in a revised combined scorecard as opposed to having two separate scorecards – see STI scorecards in this report After due consideration of this issue, the Committee determined that the respective weightings of the Personal vs Corporate scorecards were currently justifiable and not out of line with significant peers. However, it was also determined our performance contracting process could be improved by choosing to have only one ‘combined’ scorecard for use in the STI determinations which would capture the various operational, strategic and personal KPAs of each of the executives with whatever particular weightings are deemed appropriate per executive (but that for now these weights, in relation to each other, are unlikely to be much different from the current degrees of emphasis placed upon the various KPAs of the executives). 5 A caution was registered about a previous suggestion by the Committee that the weighting of the ESG element of the performance conditions (used in determining LTI vestings) might be increased beyond the current weight of 20%. Concern noted. No increase in ESG weighting envisaged – see LTI performance vesting conditions in this report The Committee reviewed this concern and decided that it was unlikely to increase the ESG element beyond the current 20% weighting. SHAREHOLDER CONCERNS/QUERIES RESPONSES CONSIDERED IMPLEMENTATION REMUNERATION REPORT PART 1 – BACKGROUND STATEMENT continued IR - 237

6 A query was raised about the need or appropriateness of the offer of matching share units for executives who made commitments of company shares under the newly introduced MSR plan where it might be assumed that some of those executives may have already acquired Group shares before the introduction of the MSR policy. Added to this was a concern that the allocation of these shares could result in what may appear as excessive remuneration pay outcomes when these awards vest when combining the value of vesting LTI share units with those of the matching share units from the MSR plan. Matching share awards no longer available to new employee and mechanism for addressing any spike in LTI vesting values addressed – see MSR change s in this report The Committee considered the offering of matching shares to be appropriate for several reasons. Firstly the MSR plan was a new unilaterally introduced policy affecting existing employees and impacting their potential liquidity on committed shares despite other shareholders not having that liquidity constraint and, secondly, to encourage a quick take up of the plan. Shareholders will recall that these matching share units are subject to the same vesting conditions as the conditional share units awarded as LTIs. Nonetheless, it was decided that the offer of matching shares had now served its purpose and so no further matching share units will be awarded to new employees from 1 April 2024. Furthermore, the Committee acknowledged that the combined vesting of both LTI and matching share-linked units may at some point seem like an anomalous spike in value (particularly in March 2025) but undertook that in such a case the Committee would make arrangements with the participants directly, to smooth receipt of the amounts involved. SHAREHOLDER CONCERNS/QUERIES RESPONSES CONSIDERED IMPLEMENTATION Remuneration consultants During the year, management and the Committee consulted with remuneration experts at Remchannel (a subsidiary business of Old Mutual) to assist with remuneration-related aspects including, among others, benchmarking of remuneration for the executive directors and non-executive directors, global benchmarking methodologies for executives and non-executives, various market research assignments, legal implementation, drafting of the Recovery policy, and remuneration reporting. The Remuneration Committee, separate from management, continues to engage with its expert remuneration advisor, Martin Hopkins: Head of Reward Advisory Services at Bowmans for additional advice. We are satisfied that these consultants are independent, objective, well-qualified, and suitably experienced for our purposes. Conclusion Based on thorough reviews conducted on an ongoing basis by the Remuneration Committee together with necessary refinements from time to time, we are confident that Sibanye-Stillwater’s remuneration philosophy and policies are appropriately suited to reward executive management fairly in respect of the value that they deliver to all stakeholders, and shareholders in particular. Appreciation Lastly, I would like to thank my Remuneration Committee colleagues for their assistance in ensuring that we devote proper attention to the key aspects of remuneration in the Group (both the development of policy and practice as well as its implementation) and that we deliver on our mandate appropriately. I also extend my thanks to the members of the management team for their hard work and dedication during another challenging year. We also acknowledge and appreciate those shareholders and proxy advisors who gave us constructive and candid feedback on our policies and practices. Tim Cumming Chairman: Remuneration Committee 26 April 2024 REMUNERATION REPORT PART 1 – BACKGROUND STATEMENT continued IR - 238

REMUNERATION POLICY In this section, we present an overview of the Remuneration policy as approved by the Remuneration Committee for the 2024 financial year. The focus of the policy is on what applies going forward, with a description of what has been changed from 2023 and the rationale for doing so. Function of the Remuneration Committee The Remuneration Committee assists the Board in discharging its responsibilities for setting and administering remuneration policies and practices in line with the Group’s strategies, objectives and long-term interests. It has a particular focus on the remuneration of executive directors and prescribed officers (CxOs), while also considering the next layers of leadership. Our prescribed officers are members of the C-suite, which serves as the Group’s Executive Committee (Group Exco), constituting what King IV refers to as ‘executive management’.The Remuneration Committee also exercises oversight over the broader remuneration philosophy and practice with particular reference to remuneration fairness and internal pay-parity. We are mandated through, and act on the basis of, the Remuneration Committee’s Terms of reference. (See www.sibanyestillwater.com/about-us/governance) These Terms of reference are fully compliant with the requirements and principles of King IV. The Remuneration Committee is responsible for • Considering and recommending the remuneration philosophy for all employment levels in the Group, with a particular focus on the remuneration of the Group Exco • Recommending to the Board the remuneration payable and conditions of employment for executive directors, and approving the remuneration payable to prescribed officers The Terms of reference did not change in any substantial manner during the year under review. The Remuneration Committee is satisfied that, throughout 2023, Sibanye-Stillwater complied with its Remuneration policy and that no material deviations were noted. Composition and operation of the Remuneration Committee • There were no changes to the committee’s membership during the year • The committee members during the 2023 year comprised Timothy Cumming (Chairman), Savannah Danson, Harry Kenyon- Slaney, Dr Vincent Maphai, Nkosemntu Nika and Keith Rayner • All members are independent non-executive directors • The committee meets formally at least four times a year; it also reviews and agrees on numerous resolutions via round robin, which are recorded at the next committee meeting • All meetings were quorate, and attendance by committee members is recorded. See Detail about Board committees, page 272 • In March 2024, Savannah Danson resigned as a non-executive director, and as a result, she is no longer a member of the Remuneration Committee • In addition to committee members, the CEO, the Chief Organisational Growth Officer, whose title changed to Chief People and Culture Officer (and who has accountability for Group leadership development, organisational culture and senior talent mobility and growth) and the CEO’s Chief of Staff (who supports the alignment of incentive remuneration with delivery of the Group’s strategic priorities and outcomes) typically attend our meetings, with the Company Secretary performing committee administration • Executive management, all of whom provide material assistance to the committee, are in attendance at committee meetings by invitation, though they are recused when their own remuneration is being discussed • Independent consultants include Martin Hopkins (Head of Reward Advisory Services at Bowmans) and remuneration specialists from RemChannel who attend meetings to provide expert advice • We agree on an annual work plan that guides our agendas and areas of focus for our four meetings over the year Remuneration philosophy vs remuneration policy Sibanye-Stillwater’s remuneration philosophy aims to underpin the development and delivery of the strategic ambitions of the Group while reinforcing the desired corporate culture, consistent with its iCARES values. As a priority, it supports the attraction and retention of talent in support of the Group’s strategic workforce plan as well to reward employees fairly and appropriately across the organisation. It remains a key objective for the Group to be regarded as an organisation that encourages, recognises and rewards high performance and delivery on our business plans and strategic focus areas; See Unpacking our three-dimensional strategy, page 48. Our pay positioning strategy strives to ensure fairness and parity across all remuneration decisions and offer employees a rewarding work environment where they can develop their careers and earn a good living. We seek at all times to make sure that our remuneration policies allow us to attract, develop, retain and motivate talented and skilled people, particularly at senior and top management levels, taking into account our multinational footprint. We want our systems to encourage value accretion, reward opportunities harnessed and recognise continuous improvement while at the same time enjoying an appropriate work-life integration. We benchmark our remuneration policies and structures regularly against relevant peer groups to ensure reasonable external parity and competitive remuneration in the context of the global market for talent. In addition, employee remuneration levels and potential are compared internally to ensure appropriate parity or differentiation. We value the insights that benchmarking provides, which we recognise offer important data points to remain IR - 239

competitive and ensure fairness in our overall remuneration structure. Sibanye-Stillwater’s remuneration philosophy is founded upon the simple recognition that various forms of capital are engaged in delivering business performance over time and that each seeks a fair return. Shareholders and creditors (financial stakeholders) have provided the financial capital which, along with the retained income from internal capital generation, is applied to acquiring and developing resources/reserves (mining assets), physical assets (plant and equipment), and human capital (employees, including executives). In addition, the countries and the communities in which the mines operate should also be seen as seeking a return on their provided capital – which is afforded to them through mining royalties, income taxes, employee taxes, property rates and other levies, and expenses paid by the Group. However, although some mining assets are clearly superior to others (in terms of the potential for extraction of value), the success of a mining business strategically depends on the skills and application of its employees to deliver financial and shared value to all stakeholders. Furthermore, in order to drive and motivate exceptional performance, the financial stakeholders believe in the principle of sharing gains achieved on a basis that is fair and competitive. The consideration of fair and responsible pay is an inherent component of Sibanye-Stillwater’s remuneration philosophy, particularly in light of the diverse demographic of employees within the various jurisdictions in which the Group operates. In applying Sibanye-Stillwater’s remuneration philosophy and principles to our design of incentives, we are cognisant that there is no ‘one size fits all’ approach and that the expected result must be contextualised to ensure that appropriate value is derived for both executives and financial stakeholders. GUIDING PRINCIPLES INFORM OUR REMUNERATION POLICY The key guiding principles that underpin our remuneration philosophy and which provide the framework for the design of our remuneration policies and practices, are: FLEXIBILITY Accommodate diverse employment market practices across a multi-regional group with remuneration reflecting evolving job requirements and, where relevant, embracing global mobility in a digital-first world of work. TRANSPARENCY Provide executives and other employees with clarity on their roles and performance expectations and ensure that they understand how the remuneration practices and structures apply to them. EXTERNAL COMPETITIVENESS Adopt appropriate pay levels and structures for comparable jobs within the employment markets where we operate, while being mindful also to take into account the multi-regional responsibilities of some executives. INTERNAL COMPARABILITY Apply remuneration practice that ensures similar jobs are paid equitably across the Group within relevant employment markets without discrimination on the basis of factors not related to the role performed. RECOGNITION Reward performance through appropriate base-pay (Total Guaranteed Pay) (TGP) progression together with variable pay comprised of Short Term incentives (STIs) and, where applicable, Long Term Incentives (LTIs). Extraordinary performance and contributions are rewarded at a level that signifies the value of the employee to the organisation and encourages retention and further commitment. REMUNERATION REPORT PART 2 – REMUNERATION POLICY continued IR - 240

Fair and responsible remuneration We remain committed to remuneration fairness across all levels of the organisation. Fairness in remuneration is a complex matter which must be considered from the perspectives of different stakeholders – employees, shareholders and the broader community in which we operate. Different groups often hold conflicting opinions on what constitutes fairness and we welcome feedback as we continually seek to balance these differences and strive to carry out our responsibilities to the Group. The two key criteria in considering what is fair are external parity and internal parity. By this, we mean: • External parity: how remuneration compares relative to other people who undertake a similar role, have similar levels of skill, experience and responsibility in comparable organisations within the applicable country or regions • Internal parity: how remuneration compares relative to other people who are also working at Sibanye-Stillwater, in the same or similar roles in terms of their respective levels of work, skills, experience and responsibilities Accordingly, through application of appropriate policy, we seek to ensure that we are fair and equitable in this regard, with no discrimination that could be attributed to differences in race, gender or any other personal factor that has no bearing on the person’s ability to perform. Sibanye-Stillwater is committed to annually assessing its Gini coefficient (initiated seven years ago), as well as analysing pay discrepancies. We also determine our Palma ratio and monitor our internal pay gap. As in previous years, this exercise included monitoring pay at the operator level (lowest level of pay) and the total rewards offered to employees to determine how to improve their holistic wellbeing. We are also aware that the new pay gap measurement likely to be required on the approval of the Companies Amendment Bill of 2023 will require disclosure of the ratio of the total remuneration paid to the top 5% relative to the bottom 5%. This is alternative to the currently disclosed Palma ratio which we will report on when required. We also recognise the need to pay attention to the challenges of unreasonable, or disproportionate, income disparity in terms of executive pay versus pay for workers at the lower end of the scale. We note nonetheless that, given the global ‘war for talent’ at senior levels as well as the fact that the Group is increasingly its international footprint, we are compelled to track and compete with the remuneration trends of global and multinational businesses in order to attract and retain key skills. Part 3 of this report provides a review of remuneration fairness across our operations, with key indicators to track our progress in terms of fair and responsible remuneration. Remuneration practices and benchmarking Sibanye-Stillwater integrates remuneration policies and practices with organisational development strategies, to ensure employee focus is aligned to the purpose and goals of the Group. At a transactional level this is achieved when employees are provided with meaningful and value-adding work, as well as developmental opportunities supported by a clear understanding of how their work contributes to business performance. Engaged employees who identify with the culture and strategic goals of the business should, through application of their discretionary efforts, deliver good performance which is a cornerstone of our vision. The Group takes care to design and implement remuneration structures which calibrate realistic performance targets with clear long-term sustainable value creation objectives that will enable earnings deferral for the senior leadership group as necessary. Superior value for our stakeholders is created through the attainment of both short- and long-term operational, financial and sustainability goals, and variable pay plans are specifically designed to avoid one being favoured over the other. Our remuneration practices prioritise the sustainability of the business, development of leaders and the management of emerging talent. Benchmarking approach The Group has evolved markedly through various acquisitions over the last few years with operations now ranging across South Africa, the USA, Europe, Canada and Australia. This requires us to alter how we benchmark our remuneration practices going forward in order to best reflect the changing size and spread of the company over time. Last year’s report disclosed the benchmarking approach that had been applied in the recent past, including the comparator group and detail of the methodology but as we have not yet undertaken a further detailed benchmarking exercise using this method we have not repeated those details in this year’s report. As mentioned in Part 1 above, given that the most recently applied benchmarking methodology no longer fully reflects how the C-suite leadership roles and responsibilities have developed, the Committee has been looking to further improve and refine its approach to benchmarking in order to achieve the most appropriate outcomes for the current stage of development of the organisation and its management. This work also takes into account concerns expressed by investors on the most appropriate approach to remuneration benchmarking. The process we are looking to apply involves a critical evaluation of the optimal methods to ensure that the resultant remuneration reference points are appropriately reflective of the company’s expanded jurisdictional footprint and the accountabilities of its management. This will be done through the use of an updated and appropriate global comparator group, with a conversion method between currencies that ensures that benchmarks are market competitive in each of the jurisdictions where our executives are employed and are accountable. This will encompass the benchmarking of both the TGP levels and Total Remuneration levels so as to also generate insights into the market comparability of variable pay across the jurisdictions in which we have operations. To this end we hope to better address the critical challenges in many conventional benchmarking approaches with the aim of developing a more robust benchmarking approach that effectively addresses the volatility in currency exposure, jurisdictional pay-mix differentiation and risk gearing. Recognition of performance Sibanye-Stillwater’s pay mix As disclosed in previous reports, Sibanye-Stillwater aims to be slightly more geared towards ‘pay for performance’ than the typical market practice by providing for more exposure on its variable pay (STI, deferred STI and LTI components) and setting the total guaranteed package (TGP) levels slightly lower. While market practice is used as a reference point, due consideration is given to jurisdiction and market differences insofar as they pertain to Sibanye-Stillwater. The Sibanye-Stillwater pay mix design aims to reward management in support of outcomes that will deliver sustainable stakeholder REMUNERATION REPORT PART 2 – REMUNERATION POLICY continued IR - 241

value. This comprises a progressive increase in incentive pay with greater weighting towards LTI at the more senior roles. This is reflective of the expected timescale and impact of roles discharged by incumbents at the respective levels. A geared approach weighted towards incentive remuneration affords employees the opportunity to earn their variable remuneration aligned to their strategic contribution based on timescale and scope of impact of the role. Consequently, the variable pay of the CEO and CxO roles has a greater weighting towards the LTI (shareholder value delivery scorecard) supported by operational EVPs who have a more balanced approach between LTI and STI, and SVP and VP roles having a greater weighting towards the STI component. Ensuring the link between strategy and remuneration Sibanye-Stillwater continues to evolve as an enterprise in commodity type, size, reach, jurisdictions and complexity and we regularly assess whether our remuneration scorecards remain properly aligned with the Group’s goals and objectives. We take care to ensure that the scorecards are appropriately structured with a reasonable set of achievable, though challenging, operational and strategic outcomes. Embedding ESG excellence in the way we conduct business is a core priority for our Group as a whole and we continue to enhance how we target, measure and reward our overall ESG performance. Values-based decision-making is also at the core of our culture and we want our incentive systems to promote this approach to leadership, management and work. In reviewing our incentive measures we reflect on what behaviours they are most likely to promote and reward and whether these support our business objectives. Safety, production quality and efficiency as well as cost reduction are key drivers. As part of this assessment we not only consider ‘what’ we measure but ‘how’ we measure, to ensure that there is always a strong link between pay and performance. Corporate strategy development and how it relates to operational planning are covered in Our purpose, vision and strategy, page 34; Unpacking our three-dimensional strategy, page 48; Managing our risks and opportunities within the external operating environment, page 51. Performance-based remuneration Sibanye-Stillwater uses two distinct scorecards to guide and measure the success of the organisation and the senior executives in delivering on business plans and on our strategy. These are the primary inputs to determining variable pay. Scorecards COMBINED OPERATIONAL AND PERSONAL/STRATEGIC DELIVERY This scorecard is used to determine the STI remuneration outcomes (cash and deferred). The operational section of the scorecard is comprised of four key operational Key Performance Areas (KPAs) for the Group, namely: Safety, Cost, Production and Readiness for future production (e.g. orebody development). These are described in more detail further down. The personal/strategic KPAs comprise a mix of various management and strategic objectives which are specific to the particular executive’s leadership and management roles deemed to be key for the pursuit and fulfilment of the corporate strategy. SUSTAINABLE SHAREHOLDER VALUE DELIVERY This scorecard encapsulates the Performance Conditions that are applied to determine the extent of vesting of LTI awards. It assesses metrics that are central to achieving value for shareholders over a rolling three-year period. The scorecard comprises the three performance conditions designed to address the key indicators of shareholder value, namely: the Group’s ESG performance, representing our social legitimacy to operate, as well as the Group’s return on invested capital (ROIC) and relative total share-price return (rTSR), representing our financial legitimacy to operate. Changes to the Remuneration policy Following deliberations during 2023, our Remuneration policy was enhanced in the following ways: • Ringfenced the existing MSR plan by removing the offer of matching share unit awards for any new executives as of 1 April 2024 • Removed the personal performance ‘on-award multiple’ for the LTI awards with effect when the LTI awards were made in March 2024 • Approved a remuneration Recovery policy as recently required by US legislation for companies listed on the NYSE • Refined the scorecards used for the evaluation of performance for STI purposes by introducing a combined operational and personal/ strategic delivery scorecard as opposed to previously having them as separate scorecards. However, the KPAs that have previously comprised each of the scorecards remain as before but weightings between operational and personal/strategic elements may vary according to what is most appropriate for the particular accountabilities and responsibilities of the executives concerned REMUNERATION REPORT PART 2 – REMUNERATION POLICY continued IR - 242

Components of Total remuneration Sibanye-Stillwater’s remuneration structure includes the following components: ALIGNMENT WITH REMUNERATION PHILOSOPHY Total guaranteed pay (TGP): Base salary and allowances including provision for medical and retirement contributions With reference to the relevant market benchmarks, as revealed from time to time in remuneration surveys. This provides the foundational element of the remuneration mix. Short-term incentives (STI): Annual portion of variable pay based on a combination of operational delivery and execution of the executives’ personal management and leadership functions and strategic delivery objectives. This is split between a cash payment and a conditional cash- settled share price linked deferred portion. This performance-based reward provides immediate recognition for performance during the year (with a portion deferred for up to 18 months) relative to the extent by which the scorecard KPAs (operational and personal/ strategic) have been met. These KPAs are selected as they are largely within management’s control (i.e., they avoid factors which are totally or largely influenced by factors beyond management’s control such as commodity prices and exchange rates. The influence of these factors is nonetheless captured in the design of the LTI’s performance conditions used to determine vesting). The conditional deferred portion of the STI is designed for retention purposes and also incorporates a limited alignment with the delivery of value to shareholders through medium-term exposure to share price movement. Long-term incentives (LTI): A longer-term portion of variable pay comprised of cash- settled share price linked awards, with the value on vesting being determined through the assessment of achievement of leading and lagging indicators of shareholder value delivery (comprised of three performance conditions) The LTI awards serve both purposes of motivation and retention, with a strong shareholder-aligned performance component that seeks to incentivise and reward sustained delivery of superior shareholder value over the longer term. This is intended to align the outcomes for management with the outcomes for shareholders – whereas the STI deliberately has a more operational delivery focus. All remuneration elements, including those that are share price linked, have been awarded on a cash-settled basis as from the 2020 remuneration cycle. Furthermore, this exposure to the fluctuations in Sibanye-Stillwater’s share price is bolstered by share price-related performance conditions on the LTI awards. In addition, the personal holdings that many of our executives and senior managers elect to hold in the Group by purchasing and holding Sibanye-Stillwater shares in open market dealings further reflect their confidence in the Group. As from March 2022, the MSR plan further ensures that executives are significantly aligned with shareholders through the additional investment they have made in Sibanye-Stillwater shares over and above their existing vested interest in the Group through their employment contracts and remuneration. REMUNERATION REPORT PART 2 – REMUNERATION POLICY continued IR - 243

Composition of total remuneration package – executive directors and management The diagrams that follow indicate the composition of total pay made up of the various elements of pay under four different scenarios for the 2024 year going forward. As mentioned above, there have been two performance mechanisms that determine the STI variable pay components of total remuneration; namely, the two scorecards referred to as the operational delivery scorecard and the personal/strategic delivery scorecard. In future, these will be combined into one single scorecard of specific relevance to each executive. The second determinant of variable pay is the shareholder value delivery scorecard (which essentially comprises the three performance conditions) and is the primary mechanism for determining the vesting percentage of any share price linked LTI awards granted to executives which will finally vest three years after they were granted. For the two STI related scorecards. setting the KPI targets used to evaluate the performance of each KPI involves identifying three progressive levels of achievement: Threshold, On-target and Maximum (or Stretch). The LTI related scorecard (containing the performance conditions) is used to determine the extent of the vesting of LTI awards. has the same three levels of targeting as the STI scorecards but has a further category entitled ‘Super stretch’. Threshold performance relates to the minimum acceptable level of performance expected. If this is not achieved for any particular KPI then that KPI carries a zero score for purposes of determining the STI or LTI score. Additionally, if in aggregate the threshold performance levels are not attained for both the STI and the LTI KPIs, then only the TGP would be paid and no STI remuneration is earned nor would any LTI awards vest. This is an unlikely scenario. On-target performance relates to where the ‘desired’ targets per KPI, as set out in the operational and personal/strategic delivery scorecards, have been met. On-target performance achieved corresponds with paying 100% of the relevant incentive award value. In terms of the Shareholder value delivery scorecard, on- target performance corresponds with a 100% vesting outcome. Maximum performance (or Stretch) relates to where stretching performance outcomes have been achieved on all three performance scorecards – an unusual and quite unlikely outcome. This results in an STI reward that is 200% of the on-target STI. Super stretch performance (only in the case of the LTI scorecard) envisages an outcome at extreme levels on the relevant performance condition and would result in a maximum score of 250% for that portion of vesting. This is also an unlikely scenario but is provided for in the interests of shareholder alignment. Notes: In the analysis demonstrated through these charts, the impact of share price appreciation between the date of to the award and the vesting date is not taken into account. It is also important to note that the maximum LTI reflected in this year’s charts is substantially reduced compared the examples shown last year due to the removal of the personal scorecard ‘on- award multiple’ in determining LTI awards – which was discontinued with effect from March 2024. Range and composition of total pay scenarios per executive Threshold On-target Stretch Super stretch R0m R40m R80m R120m Threshold On-target Stretch Super stretch R0m R20m R40m R60m Threshold On-target Stretch Super stretch R0m R10m R20m R30m R40m R50m Pay mix TGP STI (cash bonus component) STI (deferred share price linked component) LTI Percentages in stacked bars may not add up to 100% due to rounding Remuneration denominated in currencies other than R is converted at R18/USD, R22.75/GBP and R20/EUR Total guaranteed pay (TGP) TGP levels are reviewed against market benchmarks approximately every couple of years or as required. The principle for deciding when to do a comprehensive benchmarking exercise is to consider when it is warranted due to a meaningful change in the Group’s operational reach and diversity in the organisational structure of the leadership group or when there is a significant and relevant change in remuneration practices or levels in the relevant comparator companies, markets or roles. The benchmark for TGP tracks the market median as derived from independent remuneration surveys of peer mining companies, with differentiation by territory. The median is the first point of reference as a benchmark, and other factors taken into consideration include the time spent in the role and the extent to which the executive fulfils all aspects commensurate with the role. At the time of assessment, an executive’s actual remuneration may well be different to the median level, for the reasons mentioned above. REMUNERATION REPORT PART 2 – REMUNERATION POLICY continued IR - 244 100% 28% 24% 16% 32% 16% 28% 18% 38% 15% 25% 17% 43% 100% 32% 24% 16% 29% 19% 28% 19% 34% 17% 26% 17% 39% 100% 37% 24% 16% 24% 22% 29% 19% 29% 21% 27% 18% 34% % of TGP CEO CFO Average CxO

The Group makes use of a comparator peer group of companies, supplemented by data from surveys by Mercer, Hay (US PGM) and REMchannel® backed by independent advice from external consultants. Further verification is also obtained from competitor company proxy statements. This practice of benchmarking is also used extensively for sub-executive levels. Sibanye-Stillwater’s international expansion is mirrored by an increase in responsibilities for the executive director and the CxO roles. Accordingly, our benchmarking methodology has progressively taken into account the executives’ growing international responsibilities, focus of attention, and involvement. One of the particular challenges that the committee is facing is how to deal with jurisdictional distinctions in the respective employment markets in which Sibanye-Stillwater operates. The methodology under development ensures that reference points reflect an equitable pay level in each jurisdiction to ensure competitiveness in the respective employment markets. This remains an ongoing area of focus for the 2024 year. Noting our remuneration philosophy (i.e., a larger variable pay component, with TGP positioned slightly below the market median), each executive’s TGP benchmark reference point is derived by retrofitting Sibanye-Stillwater’s pay mix to a benchmark reference point for total reward. Performance-based incentive plans Short-term incentives (STI) The focus of the STI is to incentivise management to achieve safe, sustainable, and cost-effective delivery and to progress the Group’s strategic goals. While the STI component of the incentive plan rewards those elements of performance that are mostly within the control and line- of-sight of employees, the LTI is conditional on the achievement of longer-term financial hurdles that are aligned with shareholder value creation. See below for a graphic of how STI is calculated and settled. The ‘On-target STI incentive’ percentages of TGP per executive level are shown in the following table: Level On target percentage of TGP CEO 85 % CxO 75 % EVP 65 % SVP 60 % VP 50 % The Remuneration Committee determines the appropriate balance of operational and strategic delivery by executives in formulating the overall scorecard for short-term incentive determination, with a 70:30 ratio indicated as a guide. Going forward, following the decision to use a combined scorecard for the STI determinations, the relative weightings between organisational operational results versus personal management/leadership and strategic objectives will be set with specific relevance to each executive. However, it is not expected to vary much from the weightings applied recently. Operational delivery As indicated earlier, performance on operational delivery is determined by KPIs on Safety, Production, Cost, and Readiness for future production (e.g, orebody development). For 2024, the measures used will be similar to those adopted for 2023, as provided in the implementation section of this report recognising the increasing diversification of the company’s operations. The safety measures will continue to track how well leading indicators are being managed as well as monitoring key lagging safety indicators. In the case of the extremely important measure of fatalities, the Fatal Injury Frequency Rate (FIFR) is purposefully not included in the STI Operational scorecard but is rather addressed more overtly by making provision to apply meaningful deductions to the STI amounts payable in the event that meaningful reductions in fatal injuries are not realised from a credible baseline. The criterion to determine the deduction to be applied to that portion of STI attributable to operational delivery was the extent of improvement experienced in the FIFR for the year under review when compared to the average FIFR over the previous three years. Each region of operations has their record assessed individually. An improvement of 20% in the FIFR comparison in any of the regions would result in no deduction to the STI score whereas improvements that were less than the 20% target would warrant a deduction, using a sliding scale, ranging from a 20% deduction for no improvement shown down to a 0% deduction an improvement of 20% or more. Any deterioration in the past year’s FIFR compared to the FIFR for the previous three years in any region would attract a deduction of 30% off the operational scorecard result for that region. These arrangements were subject also to the discretion of the Remuneration Committee being able to impose a more severe deduction in the event of the FIFR outcomes being regarded as unacceptable. The forthcoming year’s targets (as per business plan) are used to set operational delivery targets. The Board pursues an intensive process to review and approve business plan commitments that are a fair statement of what Sibanye-Stillwater’s operations are capable of delivering. In determining the targets, consideration is given to realistically achievable performance, given the levels of operational risk that would normally be experienced, while allowing for an element of further ongoing improvement in safe production. REMUNERATION REPORT PART 2 – REMUNERATION POLICY continued IR - 245 CALCULATION OF SHORT-TERM INCENTIVE (STI) GUARANTEED REMUNERATION (R) x ON-TARGET STI INCENTIVE BY JOB GRADE (%) x STI PERFORMANCE1 (0-200%) = STI (R) 1 STI performance is a combination of operational delivery and personal / strategic delivery FOR VICE PRESIDENTS AND ABOVE 100% = 60% PAID IN CASH + 40% PAID IN CASH ON A DEFERRED SHARE PRICE LINKED BASIS2 2 Settled in two tranches at nine months and eighteen months after payment of cash STI PAYMENT OF SHORT-TERM INCENTIVE

The on-target level of operational delivery therefore represents expected performance of diligent and assiduous management. Monthly variability in operational delivery is used to determine a suitable performance range, spanning from the threshold to maximum/stretch performance levels for the year. Maximum performance reflects exemplary management of operational risks to substantially below the historical exposure. It represents the performance that can be achieved through an exceptional management effort, with monthly operating results nearing maximum potential. Bearing in mind that losses from disruptive risks tend to be more substantial than outperformance when risk is controlled, the threshold target is therefore typically positioned further from on- target than is maximum/stretch target. At the start of each performance cycle the Remuneration Committee approves the KPIs, target performance levels and KPI ranges (i.e., threshold to maximum/stretch) for the Group’s operational delivery. Overall Group operational delivery is a weighted aggregate of the performance of the major operating areas of the business. The threshold and stretch targets are set with threshold performance resulting in a 0% rating for each measure, on-target resulting in 100% and a maximum/stretch performance outcome resulting in a 200% rating for each measure. Discretion to determine and adjust performance targets The Remuneration Committee has the discretion to adjust targets during the year in response to anomalous events beyond management control, or where there are conscious value-adding (or loss-saving) operational departures from the Board-approved plan, and where these events cause material deviations from approved targets. Examples of such events may be instances of force majeure, such as unavailability of services from national utilities, or extreme weather events. We also consider that it is important to have the ability to fairly reward values-based decisions that are in the best interests of the company and its shareholders even if these result in shortfalls against the targets that were set. Any discretion that the Remuneration Committee decides to apply to adjusting any scorecard targets will be disclosed in the Remuneration Implementation report. Personal and Strategic delivery The Remuneration Committee and the Audit Committee have oversight of the Personal / Strategic delivery scorecards of the CEO and the CFO. At conclusion of each annual cycle, the Remuneration Committee reviews the performance determinations of the executive directors and the rest of the Group Exco as the basis of approving STI payments and LTI awards. The Personal / Strategic delivery scorecards are largely structured around the strategic focus areas of the company as well as their leadership responsibilities. As mentioned above, the Group uses a rating scale of 1 - 5 where on-target delivery is assigned a 3 rating, corresponding to a 100% performance outcome, with 5 resulting in a 200% outcome. Maximum STI achievable If maximum/stretch targets are achieved on both operational and strategic delivery, the maximum incentive would be double the on- target bonus level. Deferral of a portion of STI into share price-based remuneration All VPs (and above) have 40% of their overall STI awarded to them as a deferred share-linked award, which will be settled in cash in two equal tranches after 9 and 18 months from the award date. The value of the cash received will vary directly according to how much the share price appreciated or depreciated from the date of the award to the date it becomes payable. To ensure use of a share price representative of the sustainable value of the Group (without undue influence of short-term fluctuations), the revised methodology introduced in 2023 will continue to be used for determining the applicable share price for both STI and LTI awards and their vesting. The 30-day VWAP at the award or vesting date as applicable will be the price used to determine the number of share units to be awarded, as well as the cash-settled value to be paid when awards vest. Furthermore, the applicable price used to determine both the award of the share price linked units as well as the value of their vesting will be subject to an assessment as to whether the 30-day VWAP price sits above a determined ‘cap’ price or below a determined ‘floor’ price. Should the 30 day VWAP price exceed the cap or fall below the floor price then the applicable price for determining the awards will be limited to the cap or floor prices. This helps moderate any anomalous outcomes on the awards due to unusual spikes or troughs in the share price. The cap and floor prices are determined by calculating the 200-day moving average share price set at one-and-a-half standard deviations of the daily closing prices over the 200-day moving average period. This ‘cap and floor’ technique is applied in the same way as Bollinger bands are used when doing technical analysis (or ‘charting’) in portfolio management. This price moderation mechanism will also be used for MSU awards made under the MSR plan. In the event of an employee resigning or having their employment contract terminated for cause after the award has been made, the deferred portion of the incentive will be forfeited, with a pro-rata payout applicable in the case of no-fault terminations. In the case of retirement at normal retirement age, the awards will run to the scheduled date for vesting. Long-term incentives (LTI) Determining allocation quantum Annual LTI awards follow the current Sibanye-Stillwater senior management incentive plan for VP level and above. Following the removal of the personal scorecard ‘on award multiple’ effective from the 2024 awards, the value of the award is determined by multiplying the annual TGP of the executive by a set factor related to their job grade (‘on-target percentage’). These factors are shown in the table below. Level Award percentage of TGP CEO 115 % CxO 90 % EVP 65 % SVP 55 % VP 40 % The LTI awards vest on the third anniversary of the award date, subject to application of the performance conditions. The award is forfeited in the event of resignation of an executive or termination for cause. In the case of no-fault terminations, a pro- rata payout will be applicable, except in the case of retirement at normal retirement age, whereby the awards run to the scheduled date for vesting. REMUNERATION REPORT PART 2 – REMUNERATION POLICY continued IR - 246

Performance conditions for vesting The proportion of the LTI awards that vest after the three-year period depends on the extent to which Sibanye-Stillwater has performed relative to the three performance conditions over the applicable performance period. The three conditions that have been set out in LTI awards made since March 2021 to determine the extent to which LTI awards will vest are: Relative Total Shareholder Return (rTSR ), Return on Invested Capital (ROIC )and Environmental, Social and Governance factors (ESG )– which are weighted 50%, 30% and 20% respectively. These weightings apply to the 2024 award cycle but may be adjusted for future award cycles if deemed appropriate for improved strategic alignment. For the 2024 awards, the performance conditions will be evaluated over two trailing years and three prospective years as the phased introduction of a two year trailing period was completed in 2023. Relative TSR, which carries the greatest weighting, represents a ‘lagging indicator of value delivery’ and market sentiment, with ROIC (return on invested capital) and ESG providing a counterbalance, representing a set of factors that can be considered as ‘leading indicators’ of market performance. ROIC enables a more agile and simple approach to measuring performance than ROE or ROCE, which are quite common performance conditions in assessing LTI vesting. ROIC focuses on the extent to which one ‘sweats’ the assets and on generating cash and quality earnings. Good ESG performance has become widely recognised as a critical leading indicator of sustainable superior returns by many investors, and is now commonly tracked as a performance measure in both LTI as well as STI schemes. The proportion of the LTI award that will vest at the end of each award cycle ranges from 0% to 250% of the initial award amount, dependent on the evaluation of the performance conditions. Achieving the upper end of that range would be very rare and would depend on stellar outcomes on all fronts. To ensure the use of share prices representative of the Group’s sustainable value on award and on vesting, the same share price moderating mechanism as described above in the STI section has been used when determining LTI awards as from the March 2023 award cycle (i.e.: determining whether to apply a cap or floor for the applicable share price). More detail and further rationale for each of these performance conditions are set out below. Relative TSR – 50% contribution to the LTI vesting determination One of the important aspects of determining the TSR comparator group is catering for the fact that we mine gold and PGMs with increasing exposure to ‘battery metals’ while many of the constituents of a comparator group are single-commodity companies. To better reflect Sibanye-Stillwater’s commodity exposure it was decided in 2020 that for future LTI awards the TSR will be assessed against a market-cap weighted reference TSR. This is determined with a two-year trailing performance period and a three-year prospective performance period, resulting in a five-year window for assessing this performance condition. The trailing performance period has been phased in to ensure that awards are not based on performance periods which were already partly underway when this arrangement was introduced in 2021. The weighted reference TSR is constructed - for now - from two comparator groups, a PGM comparator group and a gold comparator group, as reflected in the table below. Each constituent’s associated contribution to the reference TSR is determined with reference to the market cap of the constituent company at award date relative to cumulative market cap of all constituents in the respective platinum and gold peer group, with a cap of 25% on any single company’s contribution to the index. PGMs Gold Anglo American Platinum (Amplats) AngloGold Ashanti Impala Platinum Gold Fields Northam Platinum Harmony Gold Fresnillo Kinross Gold Corporation Sibanye-Stillwater’s annualised TSR over the performance period will be evaluated against the reference TSR on the following four levels • Threshold: Performance at reference TSR or below, resulting in 0% vesting • Target: Performance at reference TSR (measured as a CAGR) + 4%, resulting in 100% vesting • Stretch: Performance at reference TSR (measured as a CAGR) + 8%, resulting in 200% vesting • Super stretch: Performance at reference TSR (measured as a CAGR) + 10%, resulting in 250% vesting REMUNERATION REPORT PART 2 – REMUNERATION POLICY continued IR - 247 SUSTAINABLE SHAREHOLDER VALUE DELIVERY ESG - 20% SOCIAL LEGITIMACY TO OPERATE + ROIC - 30% FINANCIAL LEGITIMACY TO OPERATE + rTSR - 50% AGGREGATE INVESTMENT RETURN

Where the TSR lies between these levels, the percentage will be determined on a linear proportional basis. The new basis for evaluating TSR replaced the previous version with effect from all LTI awards made from March 2021 onwards. ROIC – 30% contribution to the LTI vesting determination In 2020 it was determined that the ‘financial returns’ measure using ROCE should be reconfigured to a somewhat simpler but more appropriate measure. ROIC was considered the best option – where annualised ROIC over the performance period is determined by dividing net operating profit after tax (NOPAT), using EBIT x (1 – effective tax rate) by the invested capital in the Group, quantified as total assets – current liabilities – cash. ROIC is a capital efficiency measure which calculates how efficiently a company allocates its capital and the subsequent returns achieved thereon. It, therefore, indicates quality of earnings and risk categorisation of the company’s underlying asset portfolio. ROIC measures management’s ability to sweat operational assets; and it accounts for the outcome of investment decisions. In terms of performance period, we use the same approach for ROIC as we do for TSR (two-year trailing period and three-year prospective performance period), with performance being evaluated and scored on a linear basis between the following levels • Threshold: Performance below or equal to the (5 to 10-year SARB long bond rate + 2%) - resulting in 0% vesting • Target: Performance equal to (5 to 10-year SARB long bond rate + 4%) results in a 100% score • Stretch: Performance equal to (5 to 10-year SARB long bond rate + 6%) results in a 200% score • Super stretch: Performance equal to or above (5 to 10-year SARB long bond rate + 7%) results in 250% score Where the ROIC outcome is determined at a value between these levels, the percentage vesting will be determined on a linear proportional basis. ROIC replaced the ROCE metric with effect from all LTI awards made from March 2021 onwards. ESG scorecard – 20% contribution to the LTI vesting determination When the Remuneration Committee introduced an ESG component as a third LTI performance condition with effect from all LTI awards made from March 2021 onwards, we chose a phased approach to the implementation of the various ESG priorities. The initial ESG scorecard contained 15 indicators organised under 10 strategic thrusts, with the priority areas being water management, carbon emissions and tailings management, amongst other areas. After further review, a ‘sustainability’ scorecard was developed by grouping the array of ESG factors into four sustainability themes under which 16 indicators were deemed those most appropriate to track our priorities. Some further small refinements were made for use in 2023 and the table below sets out the four themes and the 16 indicators that are now being tracked. The assessment of each indicator along a continuum of achievement determines an outcome on a range of 0 to 250% (Again, as a reminder, an outcome at 100% represents achievement of the ‘on-target’ objective and a 250% score represents meeting the ‘super stretch’ objective). The results are aggregated on a weighted basis in order to determine the overall result for the ESG component to be used as the LTI performance condition for that particular year. This annual result is then aggregated with the two trailing-year and three prospective year results to derive an overall outcome. For the 2024 year, the selection of key performance indicators for the scorecard was informed by our sustainable development strategic thrusts and materiality. Our scorecard recognises our intent to embed human rights and ethics inside and out, building climate resilience, and promoting shared value for all. The indicators focus on GHG emissions, water, tailings, social investment and diversity, equity and inclusion(DEI) supported by appropriate key metrics. REMUNERATION REPORT PART 2 – REMUNERATION POLICY continued IR - 248 % rTSR PERFORMANCE CONDITION OUTCOME (%) Reference TSR outperformance -2 0 2 4 6 8 10 12 0 50 100 150 200 250 % ROIC PERFORMANCE CONDITION OUTCOME (%) Outperformance of SA 5 to 10-year long bond yield as reported by SARB 0 1 2 3 4 5 6 7 8 9 10 0 50 100 150 200 250

SUSTAINABILITY MEASURES: 2024 ESG ELEMENT OF PERFORMANCE CONDITION DEVELOPING A CLIMATE CHANGE-RESILIENT BUSINESS Decarbonisation of operations Reduction in Scope 1 and 2 GHG emissions GWh saved through demand side management TWh renewable energy contracted through signed Power purchase agreements Water stewardship Total water purchased Baseline water stewardship assessments completed Tailings storage facility management Reductions of risk through proactive management EMBEDDING HUMAN RIGHTS AND ETHICS: INSIDE AND OUT Safety Group total recordable injury frequency rate Percentage of stoppages of unsafe workplaces by frontline employees Diversity, equity and inclusion (DEI) Percentage of women in management Percentage women in mining across the Group ENTRENCHING LONG TERM ECONOMIC SUSTAINABILITY: INTEGRATED POST MINING ECONOMIES Investment in host communities New jobs created in alternative economies Completion of REMI model Minimum shareholding requirement plan (MSR) The Remuneration Committee has determined that there will be no further entitlements to matching share unit awards for new qualifying employees under the MSR Plan with effect from 1 April 2024, with a revised requirement to be introduced that executives build up their holdings to a target minimum number without the benefit of matching awards. Entitlements already granted by the end of March 2024 to receive matching awards as holdings are built up and holding commitments made will be honoured. The MSR plan is intended to encourage leadership to take on further exposure to the Sibanye-Stillwater share price, thereby increasing the extent of alignment with shareholder interests. The design of the MSR plan was implemented effective from March 2022. To qualify for awards of matching share units (MSUs), SVPs and above had to achieve the target minimum shareholding, as set out below, within five years from March 2022 (or from their appointment into a designated role). CEO – 200% of TGP CxO – 150% of TGP EVP – 125% of TGP SVP – 100% of TGP MSUs have been awarded on a 1:1 basis once the target minimum shareholding has been met, up to a maximum qualifying level of double the target minimum shareholding. The MSUs awarded are subject to the same terms and performance conditions as those applicable to conditional share units (CSUs) awarded under the LTI incentive plan, including the performance conditions applicable in the relevant award cycle, the three-year vesting period and the share price determination mechanism applicable on award and vesting as from the 2023 incentive cycle. Furthermore, it will be an additional vesting condition that the committed shares which formed the basis for the award are retained. Participants must commit to holding the target minimum shareholding for the duration of their employment with the Group, and may be subject to clawback provisions should they fail to meet this requirement. Malus and clawback For LTI and STI awards (both cash and deferred) in the senior management incentive plan, the Remuneration Committee has the discretion to invoke malus and clawback. Malus will be invoked where a trigger event is discovered before payment/ settlement. Clawback can be invoked up to three years after the payment/settlement date of the funds in question (provided the trigger event happened before the payment/settlement). Trigger events include: • A material misstatement of the financial results resulting in an adjustment or restatement in the audited consolidated accounts of the Group, or the audited accounts of any member of the Group • Erroneous or misleading information used to determine awards • Serious misconduct or gross negligence REMUNERATION REPORT PART 2 – REMUNERATION POLICY continued IR - 249

• Participant’s decision or actions contribute to censure of the Group by a regulatory authority, or to significant reputation damage • For malus only, an ESG event (or fatalities) can be designated as a trigger event after consultation with the Safety and Health Committee and/or the Social, Ethics and Sustainability Recovery policy is implemented in response to the updates to Section 811 “Erroneously Awarded Compensation” of the SEC, and by virtue of the Company’s status as a Foreign Private Issuer under the Securities Exchange Act of 1934, and as a trader of ADS Rights on the New York Stock Exchange • This Recovery policy will apply to all Incentive-based Compensation Received by Executive Officers on or after the Effective Date • This Recovery Policy is intended to facilitate the reasonably prompt recovery of Erroneously Awarded Compensation in the event that the Company is required to prepare an accounting restatement as described in paragraph 3.2 The Recovery Policy was implemented in compliance with the SEC requirements, by virtue of the Company’s status as a Foreign Private Issuer under the Securities Exchange Act of 1934, and as a trader of ADS Rights on the New York Stock Exchange. It applies to all Incentive-based Compensation Received by Executive Officers. The Recovery Policy is intended to facilitate the reasonably prompt recovery of so-called ‘Erroneously Awarded Compensation’ in the event that the Company is required to prepare an accounting restatement. Accordingly, some minor wording changes were introduced to the clawback arrangements for conformance with the SEC Recovery Policy requirements in the event of remuneration overpaid due to a financial restatement. As described in the section above, an additional clawback provision applies to MSUs. Non-executive director fees In terms of our Memorandum of incorporation, fees for non- executive directors (NEDs) are determined by the Group’s shareholders at AGMs, which is usually based on recommendations made by the Remuneration Committee. The appropriate level of fees and fee increases are determined through periodic benchmarking exercises in a similar manner to assessing executive remuneration. For 2024, considering the poor financial and fatalities outcomes in 2023, the Remuneration Committee is recommending no increase in NED fees. The Remuneration Committee is however recommending the introduction of a two tier fee scale to allow for a higher fee scale for the non-Africa resident NEDs, as well as the substitution of the current per diem travel fee applicable to international NEDs with a single ‘pre trip’ travel fee applicable to all NEDs who are required to travel outside of their country of residence for board meetings or on other approved company business. The Remuneration Committee considers that the South African resident non-executive directors fees remain suitably aligned following reviews done in 2019 and 2023. Nonetheless, the Board, through the Remuneration Committee, decided not to recommend any increase to the current annual retainer fees with effect from 1 June 2024 after taking into account the poor financial and fatality outcomes during 2023 for which management was also impacted with reduced variable pay. While it is proposed that the fees for South African resident NEDs remains unchanged for the coming year, a different schedule of fees is being proposed for international NEDs who are resident outside of Africa. This proposed two-tiered fee scale arises from the need for the Company to be able to attract and retain high-calibre international NEDs, especially as the Company’s operations, management and governance becomes progressively more multinational notwithstanding its current South African domicile and primary listing on the Johannesburg Stock Exchange (JSE). The Board already has two non-African resident NEDs (one in the UK and one in the USA). It is the Committee’s view that they are currently under-rewarded when comparing them to other international NEDs of comparable JSE listed companies who may or may not also have other international listings such as Sibanye- Stillwater on the NYSE. In addition, there are at least six long standing South African resident NEDs who will be retiring from the board over the next few years, and it is the Board’s intention to replace several of them with international NEDs who have the relevant experience and expertise suited to the current and developing international strategies of the Company. The applicable comparable fees for international NEDs in the various board and committee roles are typically far higher (when converted to Rand equivalents) than those fees earned by South African resident NEDs in the same roles (although this is despite the local NEDs having identical responsibilities, risks and liabilities in their roles). Accordingly, the Board recommends the introduction of this two-tier NED fee scale which is common practice among major JSE- listed companies with international exposure. Following a detailed benchmarking exercise together with advice from our remuneration consultants RemChannel, the introduction of the international NED’s fee scale, expressed in US$, is proposed to be applicable to all NEDs who are resident outside of Africa subject to shareholder approval. The schedule of NED fees also introduces a new retainer fee scale for Investment Committee members. Previously the Investment Committee was only remunerated on an ad hoc basis as and when meetings were called. However, going forward, the Investment Committee has now formally scheduled two meetings per year in the first instance and will have further meetings as and when needed. The table below shows the current and proposed annual retainer fees of NEDs resident in Africa that will be put to shareholders for consideration and approval at the AGM. These amounts are exclusive of 15% VAT, which will be added where applicable according to the circumstances of the directors involved. REMUNERATION REPORT PART 2 – REMUNERATION POLICY continued IR - 250

Annual retainer fees of non-executive directors resident in Africa 2023 Proposed 2024 % year-on- year increase 2024 fees converted to USD at ZAR18/USD Chair of the Board, who is not eligible to receive fees in respect of committee chairmanship or membership except in the event having to attend additional ad hoc Board or committee meeting for which the relevant fees will apply. R3,662,000 R3,662,000 0 % US$203,444 Lead Independent Director, who is not eligible to receive fees in respect of committee chairmanship or membership except in the event having to attend additional ad hoc Board or committee meeting for which the relevant fees will apply. R2,460,000 R2,460,000 0 % US$136,667 Members of the Board R1,212,000 R1,212,000 0 % US$67,333 Chair of the Audit Committee R439,000 R439,000 0 % US$24,389 Chair of the Remuneration Committee R309,000 R309,000 0 % US$17,167 Chair of the Investment Committee#* R166,000 US$9,222 Chairs of the Nominating and Governance Committee, Risk Committee, Social, Ethics and Sustainability Committee, and Safety and Health Committee R270,000 R270,000 0 % US$15,000 Members of the Audit Committee R228,000 R228,000 0 % US$12,667 Members of the Investment Committee#* R88,000 US$4,889 Members of the Nominating and Governance Committee, Risk Committee, Remuneration Committee, Social, Ethics and Sustainability Committee and Safety and Health Committee R171,000 R171,000 0 % US$9,500 #Based on two fixed scheduled meetings per year. 'Ad hoc' fees will apply to additional meetings. * The 2023 Ad Hoc Investment Comm fees for the Chair and for Members were R83 000 and R44 000 respectively. Foreign currency payments of directors’ fees will be converted at the relevant exchange rate at the time of payment. US$ equivalents are shown for illustrative purposes only. In the table below, proposing the international NED fees, a fee has been indicated for each category of board and committee member irrespective of whether or not international NEDs currently hold such memberships. However, this allows the Company to apply a suitable fee for any such international NEDs as and when they may be appointed into any of the various board member or committee roles. This set of fees will be put to the shareholders for their consideration and approval at the AGM. These amounts are exclusive of any VAT or equivalent taxes in the relevant jurisdiction, which will be added where applicable according to the circumstances of the directors involved. Annual retainer fees of non-executive directors resident outside of Africa Proposed 2024 2024 fees converted to ZAR at ZAR18/USD African- resident Difference to African- resident 2024 fees converted to GBP at GBP0.75/USD Chair of the Board, who is not eligible to receive fees in respect of committee chairmanship or membership except in the event having to attend additional ad hoc Board or committee meeting for which the relevant fees will apply. US$290,000 R5,220,000 R3,662,000 43 % £217,500 Lead independent director, who is not eligible to receive fees in respect of committee chairmanship or membership except in the event having to attend additional ad hoc Board or committee meeting for which the relevant fees will apply. US$196,000 R3,528,000 R2,460,000 43 % £147,000 Members of the Board US$96,600 R1,738,800 R1,212,000 43 % £72,450 Chair of the Audit Committee US$35,000 R630,000 R439,000 44 % £26,250 Chair of the Remuneration Committee US$24,600 R442,800 R309,000 43 % £18,450 Chair of the Investment Committee# US$13,200 R237,600 R166,000 43 % £9,900 Chairs of the Nominating and Governance Committee, Risk Committee, Social, Ethics and Sustainability Committee, and Safety and Health Committee US$21,500 R387,000 R270,000 43 % £16,125 Members of the Audit Committee US$18,200 R327,600 R228,000 44 % £13,650 Members of the Investment Committee# US$7,000 R126,000 R88,000 43 % £5,250 Members of the Nominating and Governance Committee, Risk Committee, Remuneration Committee, Social, Ethics and Sustainability Committee and Safety and Health Committee US$13,600 R244,800 R171,000 43 % £10,200 #Based on two fixed scheduled meetings per year. 'Ad hoc' fees will apply to additional meetings. An adjustment to the ad hoc fee scale that had previously only been applied to the Investment Committee, which had no scheduled meetings and only met as and when required, is also being recommended. It is proposed to change the arrangement to an ad hoc meeting fee that, consistent with the previous Investment Committee arrangement, is applicable to any and all board or committee meetings that are formally called and required in between the routinely scheduled board and committee meetings to address matters that are urgent or that require critical attention by the relevant NEDs. Where possible and appropriate, matters requiring attention of the Board and its committees between scheduled meetings will be dealt with through round robin that will not attract additional fees. REMUNERATION REPORT PART 2 – REMUNERATION POLICY continued IR - 251

Approval for fees applicable to additional ad hoc committee and board meetings ** Proposed 2024 African-resident NED Proposed 2024 non-African resident NED's Non-African fees converted to ZAR at ZAR18/USD Difference to African-resident 2024 fees converted to GBP at GBP0.75/USD Ad hoc meeting attendance - per meeting (Chair) R83,000 US$6,400 R115,200 39 % £4,800 Ad hoc meeting attendance - per meeting (Member) R44,000 US$3,700 R66,600 51 % £2,775 **In 2023 the Ad hoc meeting fee applied only to the Investment Committee but from 2024 it is intended to apply to any additional meetings beyond scheduled board and committee meetings when required for reasons of urgency or critical additional attention. The 2023 Ad Hoc Investment Committee fees for the Chair and for Members were R83 000 and R44 000 respectively. The Remuneration Committee will further be recommending to shareholders that, with effect from 1 June 2024, a single Travel Fee of US$3 000 (or its equivalent in the relevant currency for the particular NED) be payable to any NEDs whenever they are required to travel outside of their country of residence for the purposes of attending company meetings or travelling on any other approved company business. This is a single fee per trip and is proposed as a replacement of the current application of a ‘per diem’ Travel Fee which, over the last year amounted to a fee of R22,000 per day being paid for each day that non-SA resident non-executive directors are required to be away from their home country while on Sibanye-Stillwater business, plus one additional day for ‘travel time’. These fees are quoted exclusive of any applicable VAT or equivalent taxes in other jurisdictions which will be added if and where required.” Approval for a Travel Fee Proposed 2024 2024 fees converted to ZAR at ZAR18/ USD 2024 fees converted to GBP at GBP0.75/USD Effective date 1 June 2024 Propose a single travel fee of US$3 000 for any NED who travels to board meetings or travels on other company business outside of their home-country US$3,000 R54,000 £2,250 The proposed NED fees will be put to shareholders for approval at the AGM. Executive director contracts of employment An executive director’s employment will continue until terminated upon (i) 12-months’ notice by either party, or (ii) retirement of the relevant executive director (currently provided for at age 65 in the contract). Sibanye-Stillwater can also terminate an executive director’s employment summarily for any reason recognised by law as justifying summary termination. Except for the current two executive directors, none of the prescribed officers have employment contracts with compensation for severance in the event of a change of control. The service agreements of the two executive directors contain ‘change of control’ conditions, set out below. These conditions will be honoured until they terminate. However, any future appointments of executive directors will be made without provision for compensation for severance because of change of control. The employment contracts for the current two executive directors provide that, in the event of their employment being terminated as a result of a ‘change of control’, within 12 months of the ‘change of control’, the executive director is entitled to • Payment of an amount equal to two times TGP • Payment of an amount equal to the average of the incentive bonuses paid to the executive director during the previous two completed financial years • Payment of any annual incentive bonus he has earned during the financial year notwithstanding that the financial year is incomplete • An entitlement to awards, in terms of the Sibanye-Stillwater incentive plan, shall accelerate on the date of termination of employment and settle with the full number of shares previously awarded • Any other payments and/or benefits due under the contracts The employment contracts further provide that payments will cover any compensation or damages the executive director may have under any applicable employment legislation. Change of control in terms of the above is defined as the acquisition by a third party or concerned parties of 30% or more of Sibanye-Stillwater ordinary shares. In the event of the consummation of an acquisition, merger, consolidation, scheme of arrangement or other re-organisation, whether or not there is a change of control, if the executive director’s services are terminated, the ‘change of control’ provisions summarised above also apply. Going forward, we will not include any contractual provisions in any employment contracts or variable pay contracts that allow for accelerated vesting without the testing of performance conditions. Non-binding vote on Remuneration policy The Remuneration policy, as set out here in Part 2 of this report, will be tabled for a separate non-binding advisory vote at the AGM. REMUNERATION REPORT PART 2 – REMUNERATION POLICY continued IR - 252

IMPLEMENTATION REPORT TGP outcomes Adjustments during 2024 Our remuneration practice makes provision for annual TGP increments in March each year. Annual increases for members of the C-suite are treated as cost-of-living adjustments, with personal performance not included as a factor, although market adjustments are implemented where pay benchmarking indicates a discrepancy. The relevant base-pay increase parameters in the South African market over the last year ranged between 5.0% and 6.0% with an average expected salary increase of around 5.5% for 2024. For the USA, the corresponding figures indicated a range of between 3.8% and 4.6%, around 4.0% for the United Kingdom and between 3.4% and 6.2% for Europe (Finland). Despite CPI-linked increases to TGP being granted across all jurisdictions, some business areas sacrificed this inflationary increase for the benefit of the Company. In addition, some market adjustments were implemented in accordance with the benchmarking analysis considered at the February 2022 Remuneration Committee meeting, whereby the implementation of the target guaranteed remuneration for certain positions was proposed over a period of three years with 2024 being the third and final year of this transitional period. Richard Stewart received an additional 5% increase in TGP as the final step of phased implementation. A benchmarking review was also necessary for some specific management positions due to changes in accountability which also resulted in a realignment of pay for those few positions within our global operations. For employees below the Group Executive Committee, we remain mindful of the challenge regarding the wage gap. Generally, TGP increases are, and will be, higher for those lower in the organisation than at the top. In South Africa, the increase in total guaranteed package for middle management and supervisory level employees ranged from 5% to 6% and at operator level from 6% to 7%. In the United States, a 3% increase was granted to all salaried positions that aligned with the increases in collective bargaining agreements. An additional one time cash payment of 1% of base pay was also made in the US to cater for temporary employment market pressure on a similar basis to the arrangement agreed for employees who fall under collective bargaining. Executive 2023 cycle guaranteed remuneration (000's) Annual increase 2024 cycle guaranteed remuneration (000's) Neal Froneman R7,648 5.50 % R8,069 US$475 4.00 % US$495 Charl Keyter R8,355 5.50 % R8,815 Charles Carter US$741 2.00 % US$756 Laurent Charbonnier £528 0.00 % £528 Lerato Legong R5,483 5.50 % R5,785 Melanie Naidoo-Vermaak R5,890 5.50 % R6,214 Mika Seitovirta €471 0.00 % €471 Richard Stewart¹ R7,321 10.51 % R8,091 Robert van Niekerk R6,885 5.50 % R7,265 Themba Nkosi R5,626 5.50 % R5,936 ¹ Richard Stewart received a further 5% TGP increase above the cost-of-living adjustment as part of a parity review given his increased level and nature of CRO responsibilities. Remuneration fairness In part 2 we set out our policy and the principles for fair and responsible remuneration. Since 2013 we have implemented a programme to address income inequality, while retaining a competitive total reward construct at management levels. This, in short, involves higher salary increases for lower employee levels, as well as job enlargement and job enrichment to stimulate upward mobility and upward job re-grading. All employees across Sibanye-Stillwater (both the US and SA operations) have been included in the analysis. In performing the calculations, a cost of living adjustment (COLA) has not been applied to the dollar-based salaries, as US-based employees are employed in accordance with US laws, regulations and the market. As with the 2022 report, a calculation of both the Gini coefficient and Palma ratio was performed on total remuneration paid (including LTIs awarded to senior staff). In prior years the calculation had been done only with respect to guaranteed base-pay (TGP) so the comparable TGP based outcomes are also presented for 2020 and 2021, to preserve the integrity of the trend. Considering the higher proportion of at risk incentive pay in the remuneration mix for senior staff, it is to be expected that a less equal outcome is attained when computing remuneration disparity indicators based on total remuneration. Palma ratio The Palma ratio is considered one of the better metrics to us in assessing the differences in earnings between the ‘top’ and the ‘bottom’ of a company. It is determined by taking the aggregate amount earned by the top 10% of the group’s employees and dividing that by the aggregate amount earned by the bottom 40%. OUR BUSINESS AND LEADERSHIP WHAT DRIVES US OUR PERFORMANCE REWARDING DELIVERY ANCILLARY INFORMATION IR - 253

Continuing our focus on total remuneration rather than guaranteed base-pay (TGP), employees comprising the top 10% of the payroll were earning total remuneration, in aggregate, about 1.44 times that of the bottom 40% in 2023. As illustrated below, the Palma ratio has shown a further decrease over the prior year from 1.55 in 2022 to 1.44 in 2023. This continues the trend from last year and largely reflects lower levels of senior management long term incentive values in a deteriorating commodity price environment with share price depreciation over the vesting periods. . In terms of an external comparison, Sibanye-Stillwater compares somewhat more favourably to the REMchannel® database for the ‘mining’ and ‘nation-wide’ categories, where Palma ratios of 1.837 and 2.39 respectively are observed (compared to the 1.44 for Sibanye-Stillwater). Gini coefficient The Gini coefficient is an internationally accepted measure of the distribution of income within a society or within a group. A value of nil indicates complete equality of incomes and one indicates that one person receives all the income. The data below indicates that the Gini coefficient, based on total remuneration, decreased slightly from 0.35 in 2022 to 0.34 in 2023 representing a small improvement on this measure year on year.. By way of comparison, the Gini coefficient for the Group is significantly lower (better) than that determined from REMchannel®’s remuneration data, which indicates Gini coefficients of 0.40 for the mining industry and 0.45 for all industries nationwide. While not directly comparable, it is also interesting to note by way of contrast that South Africa’s sovereign Gini coefficient, as reported by the OECD, is 0.62, one of the most unequal in the world, although it must be borne in mind that this is primarily due to South Africa’s high levels of unemployment. As can be seen from the table and graph below, the eight-year trend of both the Palma ratio and Gini coefficient, based on TGP figures, demonstrates meaningful progress in reducing pay disparities over this time frame notwithstanding the flat line from 2022 to 2023. `A contributing factor to the limited change in 2023 was due to the pressure on employment markets in the United States together with higher inflation resulting in a slightly higher escalation in real pay levels compared to South Africa than had been the case in prior years. The weakened Rand relative to the US$ over the year was also a factor as the average level of pay earned in the USA is towards of the upper end of the Group’s overall payroll. 2023 2022 2021 2020 2019 2018 2017 2016 Palma ratio based on TGP only 1.29 1.31 1.38 1.38 1.40 1.46 1.51 1.62 based on total remuneration 1.44 1.55 1.60 1.64 1.58 Gini coefficient based on TGP only 0.31 0.31 0.33 0.33 0.34 0.34 0.35 0.36 based on total remuneration 0.34 0.35 0.37 0.37 0.36 Gender parity analysis As previously reported, a number of pay-parity audits have been performed from 2019. Targeted actions at addressing any findings were undertaken in the subsequent years, and we are now confident that there are no substantial, unjustified gender pay gaps within our organisation. We intend to continue to track our pay parity and gender pay gaps, and are committed to addressing any unfair or unjustified anomalies which we may discover. REMUNERATION REPORT PART 3 – IMPLEMENTATION REPORT continued IR - 254 REMUNERATION DIFFERENTIAL INDICATORS Palma ratio (left axis) (based on TGP only) based on total remuneration Gini coefficient (right axis) (based on TGP only) based on total remuneration 2016 2017 2018 2019 2020 2021 2022 2023 1.0 1.2 1.4 1.6 1.8 0.30 0.32 0.34 0.36 0.38 0.40

Dignified pay An income of around R250,000 per year is considered a market benchmark proxy in South Africa for a ‘dignified pay’ level. Sibanye-Stillwater has made significant progress addressing fairness in pay by progressively shifting employees over this benchmark level as illustrated by the graph below which shows how our income distribution has evolved over the past five years. It shows what percentage of all remuneration was earned within each of the five indicated remuneration bands – which range from ‘Less than R250k’ to ‘above R1.5m’. We are encouraged to see this substantial migration in the number of employees who historically earned below R250,000 per annum into the next income band of R250,000–R500,000 per annum. This is showcased in the reduction of the number of employees earning below R250,000 from 67% in 2019 to 4% in 2023 with a similar increase in the number of employees earning between R250,000 to R500,000 from 20% in 2019 to 77% in 2023. This illustrates the progress in our commitment to ensure dignified pay for all levels of employment, particularly at union level and is a manifestation to our purpose to Safeguard global sustainability through our metals. Compelling benefits for employees at lower levels Our people are our most important asset. We aim to deliver value to our people through a combination of approaches, centred around ‘empowering our workforce’, and constantly reassessing and revisiting our benefits to employees. While offering a competitive take-home pay is the foundation of these efforts, there are many other aspects which contribute to caring for our employees financially. We pride ourselves on the benefits which we offer to our on-site employees, and seek to ensure that these are fair and optimised across our operations. We also aim to assist employees in maximising their take-home pay, through financial wellness education. Furthermore, we emphasise the importance of retirement planning and retirement funding as an essential part of our employees’ long-term financial wellbeing and we provide support and retirement schemes in aid of that. We also encourage our employees to reach their full potential in their careers through the provision of career advancement opportunities as well as providing the learning and skills development resources to support their growth. Nonetheless, determining and overseeing ‘fair pay’ remains a complex issue and requires clear rules and principles, aligned to a talent strategy and supported by a policy and governance framework. We believe we have those in place but readily refine them as needs be in pursuit of ensuring equity and fairness in the business. In South Africa, each segment is subject to independent wage negotiations at pre- determined and agreed frequencies. At the Operator level (Category 4–8), the average earnings are indicated in the table below, taking into consideration guaranteed and variable pay as well as the average training cost per employee. This amounts to an annual total value of R324 000. (See further details available on page 160, reflecting effort and cost for developing and empowering employees). Average pay (in rand) at Operator level (Cat 4-8)1: 22,128 4,486 1,720 28,334 340,007 Included in the above: Basic pay Shift allowance Avg. Training cost based on all type of training intervention (learnerships, leadership, core training, Care for iMali etc.) Holiday leave allowance Stand by allowance Medical subsidy Skills allowances Living out allowance Transport allowances Retirement fund contribution Bonuses (all) Risk contributions Overtime (all) Base pay plus guaranteed benefits (per month) Variable pay (Allowances, Overtime, Bonus per month) Other benefits (Training per month) Total cost to company per month Annual cost to company REMUNERATION REPORT PART 3 – IMPLEMENTATION REPORT continued IR - 255 1 Category 4 to 8 employees represent entry level to semi-skilled employment. These employees are in Patterson A and B band. Most employees start their career in Category 4 (Patterson A4) as a General Workers, with opportunities for advancement through the categories as their skills improve. Category 8 employees are mostly semi-skilled with the bulk of employees employed as Team Leaders (Patterson B and C-Lower) INCOME DISTRIBUTION ANALYSIS (SIBANYE-STILLWATER) 2019 2020 2021 2022 2023 Up to 250,000 250,001 – 500,000 500,001 – 1,000,000 1,000,001 – 1,500,000 Above 1,500,000 —% 25% 50% 75% 100%

STI outcomes As set out in Part 2 of this report, STI payments are based on measuring and rating the performance of executives against delivery on operational measures that are included in the group’s Operational delivery scorecard together with their personal / strategic objectives that are covered in their individual Personal / Strategic scorecards. The Operational delivery scorecard results - which apply to all of the C-suite executives (as well as those below them but with differing weightings) are set out in the following tables. Although there were a few instances which might have warranted an adjustment to the operational scorecard targets in terms of the discretion allowed by the Remuneration Committee, it was decided that these were all of minor significance. Accordingly, no discretionary adjustments were made to the scorecard targets when doing the annual review for the STI. Southern Africa region (60% contribution to Group) South African gold operations (35% contribution to Southern Africa region) Safety 30% Serious Injury Frequency Rate (per million hours) 50% 3.30 3.00 2.85 2.99 106.67% Injuries with Potential for Loss of Life (IPLL) - improvement from baseline 30% 1.58 1.26 1.10 1.05 200.00% Effectiveness of management routines as a leading indicator 20% System established to measure the effectiveness of management routines Representative base through data collected over a two month period 20% improvement on the established base by year end Base established at a risk score of 1.86 over 3 month period ending in September 2023, with 20% improvement achieved to 1.49 by year end 200.00% Production 30% Gold produced (kg) 100% 22,797 25,330 25,963 20,056 0.00% Cost 20% Underground operating cost (R/underground ton milled) (ORD expensed, excluding capex and non controllables) 50% 4,472 4,066 3,964 5,026 0.00% Total operating cost (R/kg produced) (Surface and U/G kg's) (ORD expensed, excluding capex and non controllables) 50% 935,630 850,572 829,308 1,117,517 0.00% Developed state 20% Primary on reef development (m) 50% 8,530 9,478 9,715 6,164 0.00% Primary off reef development (including Capex) (m) 50% 29,808 33,120 33,948 22,594 0.00% SA gold operations overall result 46.00% South African PGM operations (65% contribution to Southern Africa region) Safety 30% Serious Injury Frequency Rate (per million hours) 50% 2.76 2.51 2.38 2.23 200.00% Injuries with Potential for Loss of Life (IPLL) - improvement from baseline 30% 1.24 0.99 0.87 0.73 200.00% Effectiveness of management routines as a leading indicator 20% System established to measure the effectiveness of management routines Representative base through data collected over a two month period 20% improvement on the established base by year end Base established at a risk score of 5.17 over 3 month period ending in September 2023, with more than 20% improvement achieved to 2.72 by year end 200.00% Production 30% Ounces produced ('000 4E oz) 100% 1,657 1,841 1,887 1,695 20.93% Cost 20% Underground operating cost (R/underground reef ton hoisted) (ORD capitalised, excluding capex and non controllables) 50% 1,807 1,642 1,601 1,804 1.76% Total operating cost (R/4E oz produced) (Surface and U/G oz's) (ORD expensed, excluding capex and non controllables) 50% 21,669 19,699 19,207 21,381 14.63% Developed state 20% Primary on reef development (m) 50% 60,477 67,196 68,876 73,878 200.00% Primary off reef development (including Capex) (m) 50% 38,947 43,275 44,356 44,219 187.27% South African PGM operations overall result 106.64% Southern Africa region overall result 85.42% KPI Weight Parameter Sub- weight Threshold On Target Maximum Performance achieved Rating0% 100% 200% REMUNERATION REPORT PART 3 – IMPLEMENTATION REPORT continued IR - 256

Americas region (30% contribution to Group) Montana operations (75% contribution to Americas Region) Safety 30% Serious Injury Frequency Rate (per million hours) 60% 3.97 3.61 3.43 5.67 0.00% Gap between Operational Standards and Group Minimum Standards (GMS) 20% Gap analysis completed on GMS, with action plans to address shortcomings defined and approved by mid year 100% of approved actions scheduled for completion during 2023 executed by year end 20% of approved actions scheduled for completion during 2024 executed by 2023 year end Gap analysis completed with 63% of approved actions scheduled for completion during 2023 executed 63.00% Effectiveness of management routines as a leading indicator 20% System established to measure the effectiveness of management routines Representative base through data collected over a two-month period 20% improvement on the established base by year end Base established at a risk score of 26,49 over 3 month period ending in September 2023, with more than 20% improvement achieved to 11.71 by year end 200.00% Production 30% Returnable 2E PGM produced ('000 oz) 100% 480.3 533.7 547.0 427.3 0.00% Cost 20% Underground operating cost ($/underground reef ton milled) (ORD capitalised, excluding capex and non controllables) 50% 247 225 219 281 0.00% Total operating cost ($/oz produced excluding recyc) (ORD expensed, excluding capex and non controllables) 50% 1,197 1,088 1,061 1,591 0.00% Developed state 20% Primary development advance (equivalent 000 ft) 40% 46.8 52.0 53.3 38.1 0.00% Secondary development advance (equivalent 000 ft) 40% 38.0 42.2 43.3 41.6 85.07% Diamond Drilling ('000 drill ft) 20% 962 1,069 1,096 918 0.00% Montana operations overall result 22.59% Recycling operations (25% contribution to Americas Region) Production 40% Recycling throughput (tonnes smelted per day) 25% 19.6 21.8 22.3 10.5 0.00% Recycling receipts (tonnes received per day) 25% 19.6 21.8 22.3 10.5 0.00% Total ounces Fed ('000 3E oz) (post 96% recovery factor) 50% 621.0 690.0 707.3 310.3 0.00% Cost 30% Net profit margin (%) 50% 4.1% 4.6% 5.0% 4.5% 89.00% Recycling EBITDA (US$ million) (subject to price normalisation to budget basket price) 50% 58.9 65.5 67.1 33.2 0.00% Developed state 30% Inventory / working capital management (tons) 100% 150 100 75 27 200.00% Recycling operations overall result 73.35% United States region overall result 35.28% KPI Weight Parameter Sub- weight Threshold On Target Maximum Performance achieved Rating0% 100% 200% REMUNERATION REPORT PART 3 – IMPLEMENTATION REPORT continued IR - 257

Europe region (10% contribution to Group) Sandouville operations (40% contribution to Europe region) Safety 30% Total Recordable Injury Frequency Rate (per million hours) 30% 9.98 9.07 8.62 5.35 200.00% Progress on fatal risk focus and fatal elimination plan implementation 70% Gap analysis conducted, critical controls defined, and system implemented to measure compliance to critical controls and life-saving behaviours on a monthly basis Fatal elimination plans approved for all areas by end Q3; ≥90% of employees signed a moral commitment to uphold critical control and behaviours by year end 80% of actions in approved fatal elimination plan executed by year end 96% of employees signed moral commitment and 86% of approved fatal elimination plan executed 200.00% Production 30% Percentage planned maintenance 50% 30% 35% 40% 44% 200.00% Nickel recovery 50% 96.5% 97.5% 98.0% 97.1% 60.00% Cost 20% EBITDA (€m), excluding losses that may result by not hedging 100% -16.50 -15.00 -14.25 -64.54 0.00% Developed state 20% Capex Milestones % of schedule achievement 25% 90% 100% 105% 99% 88.00% Capex Cost (CPI) overrun/ saving to budget 25% 10% 0% -5% 0% 100.00% Environmental incident: class 1-2 deviations 50% 5 3 1 4 50.00% Sandouville operations overall result 113.40% Keliber project (40% contribution to Europe region) Safety 30% Total Recordable Injury Frequency Rate (per million hours) 30% 9.98 9.07 8.62 7.89 200.00% Progress on fatal risk focus and fatal elimination plan implementation 70% Gap analysis conducted, critical controls defined, and system implemented to measure compliance to critical controls and life-saving behaviours on a monthly basis Fatal elimination plans approved for all areas by end Q3; ≥90% of employees signed a moral commitment to uphold critical control and behaviours by year end 80% of actions in approved fatal elimination plan executed by year end 100% of employees signed moral commitment and 85% of approved fatal elimination plan executed 200.00% Cost 25% Kokkola project cost (CPI) overrun/saving to budget 100% 10% 0% -5% 0% 100.00% Developed state 45% Kokkola project milestones (SPI) performance to schedule 60% 10% 0% -5% 14% 0.00% Diamond core metres drilled 10% 22,286 24,762 26,000 31,667 200.00% Spatial compliance to planned drilling programme 10% 85% 95% 100% 99% 180.00% Environmental incident: class 1-2 deviations 20% 5 3 1 1 200.00% Keliber project overall result 120.10% Strategic projects (20% contribution to Europe region) Cost 16% PGM recycling feasibility study overrun/saving to budget 100% 10% 0% -5% 3% 70.00% Developed state 17% PGM recycling feasibility study delivery on milestones 100% 90% 100% 105% 95% 50.00% Strategic future 67% Project EVe study delivery 100% No longer possible to evaluate directly against original objectives set up for nickel sulphate and battery recycling feasibility studies due to rescoping requiring discretionary assessment of the value created compared to original intentions Newly defined work delivering more powerful and relevant outcomes at reduced expenditure than the originally planned work 100.00% Strategic projects overall result 86.70% European region overall result 110.74% Overall group result 72.91% KPI Weight Parameter Sub- weight Threshold On Target Maximum Performance achieved Rating0% 100% 200% The performance in terms of Personal / Strategic delivery of the CEO and CFO is provided in the following summaries of their scorecards. For both executives, the scores from their Personal / Strategic scorecards carry a 30% weight towards their overall STI score with the Operational scorecard carrying a 70% weight. As indicated in part 2, the rating scale ranges from 1 to 5 where 3 represents the desired REMUNERATION REPORT PART 3 – IMPLEMENTATION REPORT continued IR - 258

Target or outcome and corresponds with a 100% score on the STI scale with 4 representing a Stretch / Above target outcome and 5 would be at Super Stretch or maximum representing a 200% score. Scores are determined linearly between the range limits. Personal / Strategic delivery – Neal Froneman – CEO Diversified green metals portfolio 20% • Feasibility studies on business opportunities in the Europe battery metals ecosystem • Concepts evaluated for repurposing Sandouville to meet need for pCAM in the European automotive battery supply chain 3.0 • Building the green metals (lithium, nickel, copper) production footprint • Keliber project capital development on track with permits obtained; Rhyolite Ridge on track through permitting stages; Mount Lyell option executed and feasibility studies in process; Disciplined capital allocation determined for further potential green metal acquisitions • Growth of the recycling business • Reldan acquisition concluded; Studies on automotive battery recycling studies concluded limited potential in Europe • Business model for growth of tailings retreatment activities • New Century integrated into Sibanye-Stillwater following 100% acquisition; Limited progress on establishing a tailings retreatment service Strategic positioning in targeted ecosystems 10% • Healthy strategic relationships with key stakeholders in all ecosystems • Secured recognition from stakeholders and political leaders in France and Finland as partners in building the Europe clean energy ecosystems 3.5 • Strategic cooperation with stakeholders supported by commitments in target ecosystems (North America, Europe and Australia) • Strategic funding commitments secured from the US Department of Energy for Rhyolite Ridge; Tasmanian government officials supportive of re-opening of Mount Lyell mine Issues affecting competitiveness in South Africa 20% • Joint B4SA/government programme addressing priority issues • Significant influence in structuring of the electricity and logistics workstreams, with co-leadership on crime and corruption; Meaningful progress on resolving challenges with scope for private sector involvement increasing 4.0 • Collaborative work programme between business and government to fight the war on crime and corruption • Involved in establishing structures for business support to government in addressing crime and corruption; BACSA reinvigorated as the coordinating structure for involvement of business Leadership to global mining associations 20% • Leadership to the ICMM and WGC strategies for future relevance • Instrumental through ICMM Council in shaping future strategic positioning; appointed as WGC Board Chairman overseeing WGC strategy from September 2023 3.5 • ICMM positioned to sustain stakeholder credibility in the evolving context • Influential in guiding evolution of the mining standards landscape to simplify and enhance credibility with stakeholders; Leadership of the ICMM's social performance agenda through the Social Performance Council Advisory Group • Traction on Gold247 to reinvent the global gold market • Cooperation across the gold value chain strengthened with signing of the responsibility declaration; Gold bar integrity platform with embedded traceability now ready for adoption Energy solutions concepts 10% • Strategic assessment of technologies and commodities for the clean energy economy • Completed assessment of clean energy economy technologies and demand implications for critical metals and minerals 3.3 • Ambition and roadmap for an energy solutions business • Energy solutions business ambition confirmed and supported by strategic roadmap with attractive areas identified for monitoring • Opportunities for leveraging the green metals portfolio and energy requirements of the mines • Further progress on potential involvement in energy solutions linked to green metals production and energy supply applications related to mining operations; Commercial market development plans on green metal applications with potential pipeline, Future ready culture leadership 20% • C suite empowered with defined accountability and role clarity • Role clarity further enhanced with Regional leadership owning regional strategies focusing on quality and sustainability of operational delivery, with the C suite providing global leadership, strategic direction and management 3.5 • Executive succession • Comprehensive executive succession plans reviewed and in place with structured programmes for developing successors • Strategic enablers (innovation; anti- fragility; and trust and transparency) and differentiators (inclusive, diverse and bionic; force for good; and pandemic resilient ecosystems) being instilled into Sibanye-Stillwater's way of conducting business • Good progress made with adoption of the enablers and differentiators into the way Sibanye-Stillwater conducts its business; Roadmaps and framework in place for tracking progress on consistent broad adoption Overall rating 3.5 Category Weight Objective Achievement Rating REMUNERATION REPORT PART 3 – IMPLEMENTATION REPORT continued IR - 259

Personal / Strategic delivery – Charl Keyter – CFO Strategic financial management 13% • Maintain liquidity within target range • Liquidity at November 2023 at R52bn/US$2.7bn representing 5.8 months Opex and Capex outflow 4.5 • Maintain structuring of corporate financing on credible terms with a robust debt maturity ladder • US$ RCF upsized from US$600 million to US$1 billion with a reduced margin. US$500 million convertible bond executed on favourable terms in tough market conditions Financial systems and structures 18% • Finalise roadmap for enhancement of financial management and reporting systems • Roadmap for SAP upgrades finalised with RFP issued. Scoping and RFP for budgeting/reporting and consolidation projects finalised with capital allocation to determine pace of execution 3.0 • Refine arrangements for cash management across the group • Refined process during the year. Recommendations developed for automated group-wide dashboard reporting and further improved design, governance and structuring of the treasury function with jurisdiction for a global treasury company optimised. Implementation planned for 2024 Risk management 18% • Renew insurance programme on similar terms with increases in line with inflation and smooth transition of broker • Smooth transition of insurance cover from Marsh to AON achieved with renewal of cover on similar terms and inflationary overall increase in premiums. Very good outcome given the tough environment. 3.7 • Develop and deliver on plans to instil an anti-fragile culture • Evidence of anti-fragility well embedded into the way key business processes are conducted with changing attitudes on the responses to disruptive events and embedded into the organisation's strategic risk management processes Innovation 18% • Develop financial innovation framework • Ambition, strategy and challenge crafted for innovation in financial management of the group with an appropriate roll- out plan complete with stage gates for 2024 3.2 • Develop a framework for sustainability- linked financing • Framework for sustainability-linked financing developed with critical ESG measures defined though still subject to further work on establishment of robust science-based carbon targets that would meet lender requirements Governance 21% • SOX controls in place across European operations • Scoping assessment for Sandouville complete with implementation postponed into Q1 2024. Controls for in scope financial processes and general IT designed and documented for Keliber with a testing pass rate of 100% achieved at year end. Additionally, work launched on establishing control environment for New Century following assumption of management control 3.5 • Close-out of significant deficiency • Improvements to manual controls combined with additional reviews are sufficient to prevent the risk of repeating a material misstatement with the external auditor supporting this judgment with audit procedures ongoing. System development in process to improve the approach further for even more robustness Capacity and succession 12% • Financial capacity and succession planning • Capacity in the financial discipline reviewed with no immediate strategic needs identified. CFO succession planning reviewed with approved personal development planning in place for potential successors 3.5 Overall rating 3.5 Category Weight Objective Achievement Rating REMUNERATION REPORT PART 3 – IMPLEMENTATION REPORT continued IR - 260

STI outcomes for executive directors and prescribed officers for 2023 The table below sets out the STI outcomes for 2023 based on the Operational and Personal / Strategic scorecard results for each executive showing the amounts of the cash portion and the deferred share price linked portion of the STI awards. The overall outcome was determined by the combined weighted score from the two scorecards applying a 70% weight for the Operational score and a 30% weight for the Personal / Strategic score. However, in determining the final STI awards, the Remuneration Committee needed also to review and determine the impact on the STI awards in relation to the fatality outcomes in 2023 and to decide on the extent to which any deductions should be made in accordance with the agreed basis of assessing the (Fatality Incidence Frequency Rate (FIFR) in 2023 against the prior three-year FIFR average. (See page 245 in Part 2 for details.) Deductions from variable pay There was certainly very good progress made in the various leading indicator safety metrics during the year as evidenced in the Operational scorecard. (Please also refer to page 14 for more details on improving trends). However, although the Group had indeed attained some meaningful improvements in the FIFRs for the various divisions during 2023 when compared to the average FIFR rate for the previous three- year period, these FIFRs had still fallen a little short of the 20% improvement that had been aimed for as a credible trajectory on the quest for zero harm. Nonetheless, when comparing the year-on-year fatality outcomes, it shows a regression given that there were 11 fatalities in 2023 compared to 5 fatalities in 2022 (albeit that 2022 was the lowest annual FIFR experienced in the Group’s history). Accordingly, despite good overall improvement on various safety metrics, the Remuneration Committee applied its discretion to cut back the STI scores beyond the agreed basis set for this metric and applied a deduction of 30% on the component of STI score derived from the Operational delivery scorecard. This was applied to all C-suite members regardless of their role and location and regardless of the particular FIFR in their respective areas of operation. In addition, the Remuneration Committee imposed a further 5% malus deduction on the full STI score in respect of the environmental incident experienced near the Beatrix mine involving an overflow of water from the evaporation dams at Wolwepan and Rietpan. This was due to excessive rain that had been experienced in that area in 2022. The incident had originally been classified as a level 3 incident but following further investigation in 2023, was then reclassified as a level 4 incident warranting attention in terms of the malus criteria. STI outcomes for 2023 Executive Operational delivery Personal/ strategic delivery Overall delivery TGP (000’s) Cash incentive after FIFR and malus deductions (000’s) Value of deferred share-based award (000’s) Neal Froneman RSA 72.9 % 125.0 % 88.5 % R7,648 R4,473 R2,982 USA US$476 US$185 US$123 Charl Keyter 72.9 % 125.0 % 88.5 % R8,355 R4,311 R2,874 Charles Carter 35.3 % 120.0 % 60.7 % US$742 US$296 US$198 Dawie Mostert 72.9 % 100.0 % 81.0 % R5,848 R1,601 — Laurent Charbonnier 72.9 % 125.0 % 88.5 % £529 £273 £182 Lerato Legong 72.9 % 110.0 % 84.0 % R5,483 R2,653 R1,769 Mika Seitovirta 110.7 % 130.0 % 116.5 % €471 €330 €220 Richard Stewart 85.4 % 135.0 % 100.3 % R7,321 R4,247 R2,831 Robert van Niekerk 72.9 % 130.0 % 90.0 % R6,886 R3,627 R2,418 Themba Nkosi 72.9 % 125.0 % 88.5 % R5,626 R2,903 R1,935 * Note: Dawie Mostert left the company on 4 August 2023 and therefore was not entitled to any deferred STI award. LTI awards and outcomes LTI awards made in March 2023 As disclosed in the 2022 Integrated report, LTI awards were made to executive directors and prescribed officers in March 2023, based on the relevant parameters and their personal performance during 2022. Details for the determination of the conditional (performance) share price linked LTI awards made to executive directors and prescribed officers on 1 March 2023 are shown in the table below. The applicable Sibanye-Stillwater share prices used to determine the number of LTI share price linked units for each executive (determined by dividing the share price into the value of the award) was R42.78 per share and US$9.68 per ADR. These are the 30 day VWAP values of the shares immediately prior to the date of the award. In addition, the Remuneration Committee determined the applicable floor and cap share prices at that time using the moderating mechanism introduced last year (and which is described in part 2 above). These were respectively R37.84 and R49.01 for the JSE listed shares (and US$8.60 and US$11.91 for the ADRs. As such, the 30 day VWAP price sat between the floor and cap price levels at this time so no moderation was required to the 30 day VWAP price used to determine the number of LTI units granted in this instance. REMUNERATION REPORT PART 3 – IMPLEMENTATION REPORT continued IR - 261

These LTI awards are subject to the performance conditions in effect at the time when vesting is due which will result in a portion or multiple of these share unit awards actually vesting, in a range between 0 and 250% of the units awarded. This will be evaluated over the performance period from the date on which the awards were made in 2023 up until the vesting date on 1 March 2026. 2023 LTI awards Executive LTI on target award % of on target award based on 2022 personal performance rating % of annual TGP awarded Value of share price linked LTI award (000's) Number of LTI share price linked units awarded Neal Froneman 115.0 % 185.7 % 214 % R16,334 381,839 US$1,016 105,026 Charl Keyter 90.0 % 171.4 % 154 % R12,890 301,338 Charles Carter 90.0 % 157.1 % 141 % US$1,048 108,386 Dawie Mostert 90.0 % 171.4 % 154 % R9,023 210,924 Laurent Charbonnier 90.0 % 164.3 % 148 % £781 398,482 Lerato Legong 90.0 % 150.0 % 135 % R6,436 150,467 Themba Nkosi 90.0 % 164.3 % 148 % R7,234 169,104 Mika Seitovirta 90.0 % 185.7 % 167 % €787 356,864 Richard Stewart 90.0 % 185.7 % 167 % R12,237 286,063 Robert van Niekerk 90.0 % 178.6 % 161 % R11,066 258,692 Note: The number of share units for US$ denominated awards refers to ADR’s, while for other non-South African currencies, The awards are made in terms of Sibanye-Stillwater shares with a R value converted from the relevant foreign currency using a representative exchange rate. LTI awards made in March 2024 The details for the determination of share price-linked, cash-settled LTI awards for executive directors and prescribed officers on 1 March 2024 are shown below. LTIs are awarded in accordance with the on-target percentages as stipulated in the senior management incentive plan approved by the Board as presented in part 2 of this report. The fair value awards presented in the table below are determined based on annual TGP post the approved March 2024 increases, and will be subject to the assessment of the performance conditions which will determine the actual number of share units vesting in March 2027 (in the range from 0 to 250%). The awards will be cash-settled after three years, taking into account the performance conditions and share price appreciation by the time of settlement. As for the LTI awards made in 2023, the basis on which these share-price linked awards are determined in March 2024 is explained in part 2 of this report. The applicable share prices used this year to determine the number of share price linked units for each executive (determined by dividing the share price into the rand value of the award) was R21.19 per share for the JSE listed shares and US$4.50 per ADR for the NYSE listed shares. These are the 30 day VWAP values of the shares immediately prior to the date of the award. In addition, the Remuneration Committee determined the applicable floor and cap share prices at that time using the moderating mechanism introduced last year (and which is described in part 2 above). These were respectively R19.76 and R34.18 for the JSE listed shares and US$4.26 and US$7.41 for the ADRs . As the 30 day VWAP falls between the floor and cap prices it was the 30 day VWAP price that was applicable and no moderation was required to the price used to determine the number of LTI units awarded in this instance. 2024 LTI awards Executive % of annual TGP awarded Value of share price linked LTI award (000's) Number of LTI share price linked units awarded Neal Froneman 115.0 % R9,279 437,823 US$569 126,415 Charl Keyter 90.0 % R7,933 374,312 Charles Carter 90.0 % US$680 151,212 Laurent Charbonnier 90.0 % £475 538,086 Lerato Legong 90.0 % R5,206 245,647 Melanie Naidoo-Vermaak 1 90.0 % R6,475 305,552 Mika Seitovirta 90.0 % €424 409,774 Richard Stewart 90.0 % R7,281 343,568 Robert van Niekerk 90.0 % R6,538 308,486 Themba Nkosi 90.0 % R5,342 252,068 1 Melanie Naidoo-Vermaak’s LTI award covers the 14 month period from January 2024 to February 2025 due to her appointment at Sibanye-Stillwater from 1 January 2024 Note: The number of share units for US$ denominated awards refers to ADR’s, while for other non-South African currencies, the awards are made in terms of Sibanye-Stillwater shares with a R value converted from the relevant foreign currency using a representative exchange rate. REMUNERATION REPORT PART 3 – IMPLEMENTATION REPORT continued IR - 262

Vesting outcomes for 2020 LTI awards that vested in March 2023 Shareholders will recall that the LTI awards made in March 2020 had different performance conditions to those that are now applicable. At that time there were only two performance conditions: Total shareholder return (TSR) and Return on capital employed (ROCE). Over the three-year performance period to March 2023, the TSR vesting percentage was reported in the 2022 remuneration report, and carried a 70% weight in the total vesting determination. Sibanye-Stillwater’s annualised TSR of 11.3% exceeded the TSR of three companies in the peer group and, based on linear interpolation between the fifth and sixth peer companies, this element of the performance condition was evaluated at 12.46%. Cumulative percentange TS R (a nn ua lis e d ) Pe rfo rm a nc e c o nd itio n Award date = 2 March 2020: Vesting date = 2 March 2023 Performance = 2 March 2020 to 15 February 2023 Performance = 12.46% Peer Group TSR (market Cap Weight) Performance Condition curve 0% 20% 40% 60% 80% 100% 0% 50% 0% 20% 40% 60% 80% 100% The ROCE over the 2020, 2021 and 2022 financial years, as also reported in the 2022 remuneration report, was determined as 39.3% which was compared against a cost of equity of 21.9%. Since this return on capital employed exceeded the cost of equity by 17.4%, the ROCE element of the performance condition – which carried a 30% weighting in the overall performance assessment – was evaluated at 100%. In applying its discretion, the Remuneration Committee concluded that no further events had taken place warranting an ESG deduction on this vesting of the conditional share units. As such, by combining the components of the TSR and ROCE using their respective weightings resulted in a vesting outcome of 38.72% of the shares awarded in March 2020 for the executive directors and prescribed officers. The values of the vesting of these 2020 LTI awards for each of the executives are displayed in the tables shown below. REMUNERATION REPORT PART 3 – IMPLEMENTATION REPORT continued IR - 263 HAR ANG NHM AMS IMP GFI ARI EXX Sibanye-Stillwater position

Vesting outcomes for 2021 LTI awards that vested in March 2024 Outcomes for each of the performance conditions rTSR performance condition Over the three-year performance period to March 2024, the rTSR (relative total shareholder return) vesting percentage was evaluated at 0.0%. This was due to the fact that Sibanye-Stillwater’s annualised TSR of -27.04% over the vesting period was lower than the average TSR of the market capitalisation weighted peer group which came in at -12.76% This factor carries a 50% weight in the total LTI vesting determination. ROIC performance condition The ROIC (return on invested capital) over the 2021, 2022 and 2023 financial years was determined at 27.05% and exceeded the ‘super stretch’ target, thereby attaining a score of 250%. As set out in part 2 above, the hurdle to attain a ‘super stretch’ score is set at exceeding the (5 to 10-year SARB long bond rate + 7%) which, in this instance, amounted to 9.84% + 7% = 16.84%. Since this hurdle is exceeded by over 10% the ROIC element of the vesting determination was evaluated at 250%. This factor carries a 30% weighting in the overall Performance condition. ESG performance condition An ESG element was introduced as a third performance condition for all LTI awards made from March 2021 onwards. It carries a weight of 20% towards the overall vesting score. With the March 2021 awards now vesting, this ESG performance condition has been applied for the first time. ESG performance was determined using the evaluation frameworks presented in our 2020, 2021 and 2022 remuneration reports. Performance was evaluated by comparing the outcomes achieved with targets that had been set objectively. Meeting the target results in a score of 100%, with a shortfall below the target resulting in a 0% outcome. Achieving a ‘stretch’ level of delivery results in a 200% performance rating and if an exceptional ‘super stretch’ target can be achieved it would translate in a 250% score for that factor. This spectrum of targets aligns with the other 0 to 250% ranges applicable for the other two LTI as detailed in part 2 above. The aggregate ESG score for the three year period came to 119.9%. This was comprised through the aggregation of the annual scores for each of the years namely; 147.5% for 2021, 116.4% for 2022 and 95.8% for 2023. The detail for each of the years, per indicator and per target is available in supplemental information, https://www.sibanyestillwater.com/ news-investors/reports/annual/. The outcomes of the scoring for the ESG scorecards are shown for each of the three years in the tables below. 2021 ESG scorecard outcome Environmental (30%) Carbon and climate Energy and fuel efficiency 100% 158.3%Land management and closure Concurrent rehabilitation 133% Tailings management 200% Water conservation and demand management Water intensity 200% Social (40%) Safety and wellness Healthcare strategy 100% 112.5% Community partnerships Social compact/GNA 150% Transformation Community development 100% 100% Diversity and inclusion 100% Human rights No human rights infringements 100% Governance (30%) Ethics Code of conduct 200% 183.3% Corporate governance Management policies, systems and disclosure 250% Compliance IT Governance, cyber security and data privacy 100% 100% Approval frameworks 0% Social and labour plans 100% Environmental 200% Overall outcome 147.5% Element Strategic thrust Indicator Performance REMUNERATION REPORT PART 3 – IMPLEMENTATION REPORT continued IR - 264

2022 ESG scorecard outcome Developing a climate change-resilient business (40%) Group reduction in GHG emissions 200% 114.5% Water intensity and quality management 125% Responsive, proactive and responsible supply chains 33% Reduction in risk presented by tailings 100% Integrated post-mining economies (30%) Increase in concurrent rehabilitation 175% 91.7%Increase in stakeholder perception matrix 0% Percentage aligned socioeconomic alternatives 100% Human rights inside and outside (25%) Increase in Human rights engagement indicators 50% 163.0% Increase in equity and inclusion indicators – WiM, pay-parity, bursaries and learnerships 150% Increase in awareness of safety as a philosophy and system to reduce fatalities 250% Increase in health resilience indicators of our employees and door-step communities 175% Governance (5%) Increase in robustness integrity of global Governance framework 50% 50.0% Overall outcome 116.4% Sustainability theme Indicators Performance 2023 ESG scorecard outcome Climate change resilient business (40%) Group reduction in GHG emissions (Scope 1 and 2) 200% 83.3% Water intensity and quality management 0% Responsive, proactive and responsible supply chains 100% Reduction in risk presented by tailings 200% Integrated post-mining economies (30%) Increase in concurrent rehabilitation 175% 137.5% Percentage aligned socioeconomic alternatives 100% Human rights inside and outside (25%) Increase in Human rights engagement indicators 100% 65.0% Increase in equity and inclusion indicators – WiM 0% Increase in awareness of safety as a philosophy and system to reduce fatalities 125% Increase in health resilience indicators of our employees and door-step communities 100% Governance (5%) Increase in robustness integrity of global Governance framework 100% 100.0% Overall outcome 95.8% Sustainability theme Indicators Performance Combined outcome for LTIs vesting in March 2024 The overall vesting result for the 2021 LTI awards, following the weighted combination of all three performance condition scores, comes to 98.98%. In accordance with the Remuneration Committee’s decision relating to the Wolwepan and Rietpan environmental incident (mentioned above) a 5% malus deduction has then been applied to the vestings for members of the C-suite. The share price at which the vesting took place was R19.70 being the three-day VWAP applicable under the rules in 2021. This represents a 72% depreciation from the price on award, which was R70.88 at that time. Combining the effect of the performance conditions, the malus deduction and the share price depreciation over the vesting period, only 26.1% of the value awarded vested to the executives in contrast to previous cycles which experienced higher performance condition scores and some very significant share price appreciation. This is not an uncommon occurrence given the cyclical nature of commodities businesses. REMUNERATION REPORT PART 3 – IMPLEMENTATION REPORT continued IR - 265

Summary of share price-linked cash-settled awards The table below sets out values of those remuneration elements comprised of share-priced linked units per executive. The Face value column reflects the total value of the award on the award date. It is determined by multiplying the number of units awarded by the share price at the date of the award. The two Expected value columns reflect the value that would be realised on vesting of each award as was estimated on the dates specified. These were calculated using a simulation that projects the rTSR performance condition, which is market related, and the share price at the scheduled vesting date using data that was available on the date of estimation. The non-market related Performance Conditions (ROIC and ESG) are set at 100%. The Expected value is determined by multiplying the number of units awarded by the projected performance condition and the share price at vesting. Executive Directors Neal Froneman Conditional Share Unit Awards CSU - 2 March 2020 02-Mar-2020 R0.00 02-Mar-2023 1,530,927 (938,152) — 592,775 — 22,127,453 53,387,099 27,189,264 — CSU - 1 March 2021 01-Mar-2021 R0.00 01-Mar-2024 348,463 — — — 348,463 — 24,699,580 28,249,895 4,338,364 CSU - 1 March 2022 01-Mar-2022 R0.00 01-Mar-2025 459,554 — — — 459,554 — 31,831,054 35,757,897 5,951,224 CSU - 1 March 2023 01-Mar-2023 R0.00 01-Mar-2026 — 801,943 — — 801,943 — 34,305,999 22,173,724 11,652,232 Matching Share Unit Awards MSU - 1 March 2022 01-Mar-2022 R0.00 01-Mar-2025 934,296 — — — 934,296 — 57,408,659 72,697,572 12,099,133 Forfeitable Share Unit Awards FSU - 1 March 2022 01-Mar-2022 R0.00 01-Sep-2023 38,170 — 1,911 36,259 — 1,035,386 2,643,849 2,862,750 — FSU - 1 March 2023 01-Mar-2023 R0.00 01-Dec-2023 — 97,887 4,893 92,994 — 2,144,141 4,187,469 3,803,889 — FSU - 1 March 2023 01-Mar-2023 R0.00 01-Sep-2024 — 97,887 — — 97,887 — 4,187,469 3,803,889 2,437,386 Total 3,311,410 59,565 6,804 722,028 2,642,143 25,306,981 212,651,177 196,538,879 36,478,340 Charl Keyter Conditional Share Unit Awards CSU - 2 March 2020 02-Mar-2020 R0.00 02-Mar-2023 681,415 (417,571) — 263,844 — 9,797,289 23,762,576 12,101,930 — CSU - 1 March 2021 01-Mar-2021 R0.00 01-Mar-24 172,214 — — — 172,214 — 12,206,787 13,961,389 2,144,064 CSU - 1 March 2022 01-Mar-2022 R0.00 01-Mar-25 198,456 — — — 198,456 — 13,746,075 15,441,861 2,570,005 CSU - 1 March 2023 01-Mar-2023 R0.00 01-Mar-2026 — 301,338 — — 301,338 — 12,890,818 8,331,996 4,378,441 Matching Share Unit Awards MSU - 1 March 2022 01-Mar-2022 R0.00 01-Mar-2025 200,000 — — — 200,000 — 12,289,180 15,562,000 2,590,000 Forfeitable Share Unit Awards FSU - 1 March 2022 01-Mar-2022 R0.00 01-Sep-2023 20,234 — 1,012 19,222 — 549,961 1,401,510 1,517,550 — FSU - 1 March 2023 01-Mar-2023 R0.00 01-Dec-2023 — 43,186 2,159 41,027 — 950,058 1,847,437 1,678,208 — FSU - 1 March 2023 01-Mar-2023 R0.00 01-Sep-2024 — 43,186 — — 43,186 — 1,847,437 1,678,208 1,075,331 Total 1,272,319 -29,861 3,171 324,093 915,194 11,297,308 79,991,819 70,273,142 12,757,842 Prescribed officers Charles Carter Conditional Share Unit Awards CSU - 1 June 2022 01-Jun-2022 R0.00 01-Jun-2025 148,732 — — — 148,732 — 7,583,384 6,457,943 2,031,679 CSU - 1 March 2023 01-Mar-2023 R0.00 01-Mar-2026 — 433,544 — — 433,544 — 18,546,405 11,987,492 6,299,394 Matching Share Unit Awards MSU - 1 June 2023 01-Jun-2023 R0.00 01-Jun-2026 — 440,000 — — 440,000 — 17,058,712 9,842,800 6,776,000 MSU - 1 September 2023 01-Sep-2023 R0.00 01-Sep-2026 — 40,000 — — 40,000 — 1,238,404 828,800 619,600 MSU 1 December 2023 01-Dec-2023 R0.00 01-Dec-2026 — 100,000 — — 100,000 — 2,326,050 2,072,000 1,549,000 Forfeitable Share Unit Awards FSU - 1 March 2023 01-Mar-2023 R0.00 01-Dec-2023 — 46,332 — 46,332 — 1,064,191 1,982,018 1,800,462 — FSU - 1 March 2023 01-Mar-2023 R0.00 01-Sep-2024 — 46,336 — — 46,336 — 1,982,189 1,800,617 1,153,766 Total 148,732 1,106,212 — 46,332 1,208,612 1,064,191 50,717,162 34,790,114 18,429,440 Dawie Mostert Conditional Share Unit Awards CSU - 2 March 2020 02-Mar-2020 R0.00 02-Mar-2023 378,255 (231,795) — 146,460 — 5,438,497 13,190,660 6,717,809 — CSU - 1 March 2021 01-Mar-2021 R0.00 01-Mar-2024 84,220 — 84,220 — — — 5,969,640 6,827,715 — CSU - 1 March 2022 01-Mar-2022 R0.00 01-Mar-2025 115,571 — 115,571 — — — 8,005,037 8,992,580 — CSU - 1 March 2023 01-Mar-2023 R0.00 01-Mar-2026 — 210,924 210,924 — — — 9,023,033 5,832,049 — Matching Share Unit Awards MSU - 1 September 2022 01-Sep-2022 R0.00 01-Sep-2025 134,500 — 134,500 — — — 8,264,474 3,698,750 — Forfeitable Share Unit Awards FSU - 1 March 2022 01-Mar-2022 R0.00 01-Sep-2023 12,464 — 623 11,841 — 338,783 863,320 934,800 — FSU - 1 March 2023 01-Mar-2023 R0.00 01-Dec-2023 — 29,523 1,476 28,047 — 649,482 1,262,953 1,147,264 — FSU - 1 March 2023 01-Mar-2023 R0.00 01-Sep-2024 — 29,523 29,523 — — — 1,262,953 1,147,264 — Total 725 010 38 175 576 837 186 348 — 6 426 762 47 842 069 35 298 230 — Award Award date Award price Vesting date Share unit awards at 31 December 2022 Number of share units awarded during 2023 including application of performance conditions Number of share units vesting forfeited during the year Number of share units vested during 2023 Unvested share unit awards at 31 December 2023 Cash Flow Face value at award date Expected value at award date Expected value at 31 December 2023 REMUNERATION REPORT PART 3 – IMPLEMENTATION REPORT continued IR - 266

Laurent Charbonnier Conditional Share Unit Awards CSU - 1 December 2020 01-Dec-2020 R0.00 01-Dec-2023 68,962 (48,273) — — 20,689 — 3,577,431 1,999,208 432,814 CSU - 1 March 2021 01-Mar-2021 R0.00 01-Mar-2024 83,251 — — — 83,251 — 5,900,956 6,749,159 1,036,475 CSU - 1 September 2021 01-Sep-2021 R0.00 01-Sep-2024 26,878 — — — 26,878 — 1,589,777 1,546,291 351,295 CSU - 1 March 2022 01-Mar-2022 R0.00 01-Mar-2025 249,596 — — — 249,596 — 17,288,292 19,421,065 3,232,268 CSU - 1 March 2023 01-Mar-2023 R0.00 01-Mar-2026 — 398,482 — — 398,482 — 17,046,502 11,018,027 5,789,943 Retention Share Unit Awards RSU - 16 November 2020 16-Nov-2020 R0.00 16-Nov-2023 17,955 — — 17,955 — 433,271 428,239 727,178 — Forfeitable Share Unit Awards FSU - 1 March 2022 01-Mar-2022 R0.00 01-Sep-2023 23,688 — 1,184 22,504 — 622,809 1,640,752 1,776,600 — FSU - 1 March 2023 01-Mar-2023 R0.00 01-Dec-2023 — 58,912 2,946 55,966 — 1,260,595 2,520,173 2,289,320 — FSU - 1 March 2023 01-Mar-2023 R0.00 01-Sep-2024 — 58,913 — — 58,913 — 2,520,194 2,289,340 1,466,921 Total 470,330 468,034 4,130 96,425 837,809 2,316,674 52,512,316 47,816,188 12,309,717 Lerato Legong Conditional Share Unit Awards CSU - 1 June 2020 01-Jun-2020 R0.00 01-Jun-2023 131,253 (93,846) — 37,407 — 1,305,961 4,289,991 2,361,241 — CSU - 1 September 2020 01-Sep-2020 R0.00 01-Sep-2023 17,109 (11,976) — — 5,133 — 877,471 521,482 142,287 CSU - 1 March 2021 01-Mar-2021 R0.00 01-Mar-2024 53,926 — — — 53,926 — 3,822,356 4,371,781 671,379 CSU - 1 September 2021 01-Sep-2021 R0.00 01-Sep-2024 497 — — — 497 — 29,397 28,592 6,496 CSU - 1 March 2022 01-Mar-2022 R0.00 01-Mar-2025 96,474 — — — 96,474 — 6,682,281 7,506,642 1,249,338 CSU - 1 March 2023 01-Mar-2023 R0.00 01-Mar-2026 — 150,467 — — 150,467 — 6,436,768 4,160,413 2,186,286 Forfeitable Share Unit Awards FSU - 1 March 2022 01-Mar-2022 R0.00 01-Sep-2023 10,548 — 527 10,021 — 286,711 730,608 791,100 — FSU - 1 March 2023 01-Mar-2023 R0.00 01-Dec-2023 — 23,456 1,173 22,283 — 516,005 1,003,415 911,500 — FSU - 1 March 2023 01-Mar-2023 R0.00 01-Sep-2024 — 23,456 — — 23,456 — 1,003,415 911,500 584,054 Total 309,807 91,557 1,700 69,711 329,953 2,108,677 24,875,701 21,564,252 4,839,839 Mika Seitovirta Conditional Share Unit Awards CSU - 1 September 2022 01-Sep-2022 R0.00 01-Sep-2025 116,231 — — — 116,231 — 4,558,336 3,196,353 1,608,637 CSU - 1 March 2023 01-Mar-2023 R0.00 01-Mar-2026 — 356,864 — — 356,864 — 15,266,142 9,867,290 5,185,234 Forfeitable Share Unit Awards FSU - 1 March 2023 01-Mar-2023 R0.00 01-Dec-2023 — 31,017 — 31,017 — 708,282 1,326,864 1,205,321 — FSU - 1 March 2023 01-Mar-2023 R0.00 01-Sep-2024 — 31,017 — — 31,017 — 1,326,864 1,205,321 772,323 Total 116,231 418,898 — 31,017 504,112 708,282 22,478,206 15,474,283 7,566,194 Richard Stewart Conditional Share Unit Awards CSU - 2 March 2020 02-Mar-2020 R0.00 02-Mar-2023 380,925 (233,431) — 147,494 — 5,476,886 13,283,769 6,765,228 — CSU - 1 March 2021 01-Mar-2021 R0.00 01-Mar-2024 131,277 — — — 131,277 — 9,305,111 10,642,626 1,634,399 CSU - 1 March 2022 01-Mar-2022 R0.00 01-Mar-2025 170,932 — — — 170,932 — 11,839,622 13,300,219 2,213,569 CSU - 1 March 2023 01-Mar-2023 R0.00 01-Mar-2026 — 286,063 — — 286,063 — 12,237,375 7,909,642 4,156,495 Matching Share Unit Awards MSU - 1 September 2022 01-Sep-2022 R0.00 01-Sep-2025 321,140 — — — 321,140 — 19,732,736 8,831,350 4,444,578 Forfeitable Share Unit Awards FSU - 1 March 2022 01-Mar-2022 R0.00 01-Sep-2023 15,645 — 782 14,863 — 425,245 1,083,652 1,173,375 — FSU - 1 March 2023 01-Mar-2023 R0.00 01-Dec-2023 — 36,642 1,832 34,810 — 806,092 1,567,493 1,423,908 — FSU - 1 March 2023 01-Mar-2023 R0.00 01-Sep-2024 — 36,643 — — 36,643 — 1,567,515 1,423,928 912,398 Total 1,019,919 125,917 2,614 197,167 946,055 6,708,223 70,617,273 51,470,276 13,361,439 Robert van Niekerk Conditional Share Unit Awards CSU - 2 March 2020 02-Mar-2020 R0.00 02-Mar-2023 611,519 (374,739) — 236,780 — 8,792,334 21,325,135 10,860,577 — CSU - 1 March 2021 01-Mar-2021 R0.00 01-Mar-2024 135,230 — — — 135,230 — 9,585,305 10,963,096 1,683,614 CSU - 1 March 2022 01-Mar-2022 R0.00 01-Mar-2025 157,498 — — — 157,498 — 10,909,115 12,254,919 2,039,599 CSU - 1 March 2023 01-Mar-2023 R0.00 01-Mar-2026 — 258,692 — — 258,692 — 11,066,482 7,152,834 3,758,795 Matching Share Unit Awards MSU - 1 September 2022 01-Sep-2022 R0.00 01-Sep-2025 200,000 — — — 200,000 — 12,289,180 5,500,000 2,768,000 Forfeitable Share Unit Awards FSU - 1 March 2022 01-Mar-2022 R0.00 01-Sep-2023 15,661 — 783 14,878 — 425,674 1,084,761 1,174,575 — FSU - 1 March 2023 01-Mar-2023 R0.00 01-Dec-2023 — 36,163 1,808 34,355 — 795,555 1,547,003 1,405,294 — FSU - 1 March 2023 01-Mar-2023 R0.00 01-Sep-2024 — 36,164 — — 36,164 — 1,547,024 1,405,314 900,471 Total 1,119,908 (43,720) 2,591 286,013 787,584 10,013,564 69,354,004 50,716,610 11,150,479 Award Award date Award price Vesting date Share unit awards at 31 December 2022 Number of share units awarded during 2023 including application of performance conditions Number of share units vesting forfeited during the year Number of share units vested during 2023 Unvested share unit awards at 31 December 2023 Cash Flow Face value at award date Expected value at award date Expected value at 31 December 2023 REMUNERATION REPORT PART 3 – IMPLEMENTATION REPORT continued IR - 267

Themba Nkosi Conditional Share Unit Awards CSU - 2 March 2020 02-Mar-2020 R0.00 02-Mar-2023 303,330 (185,881) — 117,449 — 4,361,236 10,577,845 5,387,141 — CSU - 1 March 2021 01-Mar-2021 R0.00 01-Mar-2024 64,724 — — — 64,724 — 4,587,734 5,247,175 805,814 CSU - 1 March 2022 01-Mar-2022 R0.00 01-Mar-2025 103,299 — — — 103,299 — 7,155,016 8,037,695 1,337,722 CSU - 1 March 2023 01-Mar-2023 R0.00 01-Mar-2026 — 169,104 — — 169,104 — 7,234,032 4,675,726 2,457,081 Matching Share Unit Awards MSU - 1 June 2022 01-Jun-2022 R0.00 01-Jun-2025 131,000 — — — 131,000 — 8,049,413 5,688,020 1,789,460 MSU 1 December 2023 01-Dec-2023 R0.00 01-Dec-2026 — 95,420 — — 95,420 — 2,219,517 1,977,102 1,478,056 Forfeitable Share Unit Awards FSU - 1 March 2022 01-Mar-2022 R0.00 01-Sep-2023 11,444 — 572 10,872 — 311,059 792,670 858,300 — FSU - 1 March 2023 01-Mar-2023 R0.00 01-Dec-2023 — 24,882 1,244 23,638 — 547,383 1,064,417 966,915 — FSU - 1 March 2023 01-Mar-2023 R0.00 01-Sep-2024 — 24,882 — — 24,882 — 1,064,417 966,915 619,562 Total 613,797 128,407 1,816 151,959 588,429 5,219,678 42,745,061 33,804,988 8,487,695 Award Award date Award price Vesting date Share unit awards at 31 December 2022 Number of share units awarded during 2023 including application of performance conditions Number of share units vesting forfeited during the year Number of share units vested during 2023 Unvested share unit awards at 31 December 2023 Cash Flow Face value at award date Expected value at award date Expected value at 31 December 2023 Minimum Shareholder requirements policy The table below provides a summary of progress with implementation of the MSR plan. In cases where the holdings are denominated in ADR’s, the equivalent numbers in Sibanye-Stillwater shares listed on the JSE are quoted at the issue ratio of 4 Sibanye-Stillwater shares per ADR. Executive Target Minimum Shareholding Maximum Qualifying Shareholding Shares committed MSU's awarded Neal Froneman 467,148 934,296 934,296 934,296 Charl Keyter 193,330 386,660 200,000 200,000 Charles Carter 316,308 632,616 580,000 580,000 Laurent Charbonnier 253,708 507,416 — — Lerato Legong 110,326 220,652 — — Mika Seitovirta 250,142 500,284 — — Richard Stewart 160,570 321,140 321,140 321,140 Robert van Niekerk 159,331 318,662 200,000 200,000 Themba Nkosi 113,210 226,420 226,420 226,420 Note: MSUs refers to Matching Share Unit awards which were offered at the introduction of the MSR plan. This opportunity will no longer be applicable for new employees from 1 April 2024. Executive directors’ and prescribed officers’ single figure of remuneration The tables below provide an aggregated view of the outcome of all the remuneration elements for the executive directors and prescribed officers for 2023. The outcomes for 2022 are also included for comparison and were shown in the report for 2022. Two perspectives are provided, the first is a single total figure of remuneration that reflects earnings attributable during the relevant cycle; the second, total cash remuneration, reflects earnings received by each executive director and prescribed officer during the cycle. This should be considered in conjunction with the table of unvested awards, which provides a view of the in-flight LTI share-based awards for each executive during the cycle. In this report, both the cash portion of the STI and the deferred portion of the STI, (which are in proportion to the cash incentive with deferred vesting), are reported on an accrued basis in the single total figure of remuneration. The LTI awards (made in Conditional share units), are reported at vesting. To determine cash earnings in the cycle, amounts of shares accrued in 2023 but not settled are subtracted, while shares accrued in previous years and which were settled in 2023 are added back in. Finally, adjustments are included to take account of market movements on shares that were settled in 2023. REMUNERATION REPORT PART 3 – IMPLEMENTATION REPORT continued IR - 268

Remuneration paid to Sibanye-Stillwater executive directors and prescribed officers for the year ended 31 December 2023 2023 (R000) Salary Pension scheme total contributions Cash bonus accrued Accrual of forfeitable share award Other cash payment Conditional share proceeds Other benefits Termination /Separation benefits Total single figure of remuneration Less: Amount accrued not settled in 2023 Plus: Amount of previous accruals settled in 2023 Adjustment s for market movements on accruals settled Total cash remuneration Executive directors Neal Froneman 1 Paid in SA 6,817 757 4,473 2,982 260 12,503 265 — 28,057 (7,455) 9,465 (1,943) 28,124 Paid in US 8,723 747 5,126 3,417 250 9,625 389 — 28,277 (8,543) 9,221 (1,497) 27,458 Total 15,540 1,504 9,599 6,399 510 22,128 654 — 56,334 (15,998) 18,686 (3,440) 55,582 Charl Keyter 7,248 1,035 4,311 2,874 237 9,797 199 — 25,701 (7,185) 8,791 (1,749) 25,558 Prescribed officers Charles Carter ² 13,594 1,213 5,459 3,640 47 — 369 — 24,322 (9,099) 7,340 (771) 21,792 Dawie Mostert ³ 2,994 676 1,601 — 141 5,438 — 3,663 14,513 (1,601) 5,915 (1,138) 17,689 Laurent Charbonnier 4 11,932 92 6,254 4,169 1,101 — — — 23,548 (10,423) 10,950 (2,072) 22,003 Lerato Legong 4,324 581 2,653 1,769 127 1,306 — — 10,760 (4,422) 4,744 (931) 10,151 Mika Seitovirta 5 9,377 2,452 6,571 4,381 109 — 1,081 — 23,971 (10,952) 4,709 (469) 17,259 Richard Stewart 6,478 720 4,247 2,831 194 5,477 — — 19,947 (7,078) 7,354 (1,420) 18,803 Robert van Niekerk 6,143 683 3,627 2,418 193 8,792 — — 21,856 (6,045) 7,273 (1,411) 21,673 Themba Nkosi 4,593 441 2,903 1,935 136 4,361 — — 14,369 (4,838) 5,050 (999) 13,582 Total 82,223 9,397 47,225 30,416 2,795 57,299 2,303 3,663 235,321 (77,641) 80,812 (14,400) 224,092 1 Dual service contract entered into with effect 1 May 2018. Remuneration paid in US$ was converted at the average exchange rate of R18.42/US$ applicable for the 12-month period ending 31 December 2023 2 Remuneration paid in US$ has been converted in this table using the average exchange rate of R18.42/US$ applicable for the 12-month period ending 31 December 2023 3 Left the company on 4 August 2023. Remuneration settled in connection with Dawie’s separation was in accordance with the terms of a mutual separation agreement 4 Remuneration paid in GBP was converted at the average exchange rate of R22.93/GBP applicable for the 12-month period ending 31 December 2023 5 Remuneration paid in Euro was converted at the average exchange rate of R19.94/€ applicable for the 12-month period ending 31 December 2023 Remuneration paid to Sibanye-Stillwater executive directors and prescribed officers for the year ended 31 December 2022 2022 (R000) Salary Pension scheme total contributions Cash bonus accrued Accrual of forfeitable share award Other cash payment Conditional share proceeds Other benefits Termination /Separation benefits Total single figure of remuneration Less: Amount accrued not settled in 2022 Plus: Amount of previous accruals settled in 2022 Adjustments for market movements on accruals settled Total cash remuneration Executive directors Neal Froneman 1 Paid in SA 6,621 736 5,875 3,916 143 102,171 — — 119,462 (9,791) 9,069 (1,686) 117,054 Paid in US 7,203 532 6,191 4,128 99 60,133 284 — 78,570 (10,319) 5,619 (1,177) 72,693 Total 13,824 1,268 12,066 8,044 242 162,304 284 — 198,032 (20,110) 14,688 (2,863) 189,747 Charl Keyter 6,875 982 5,542 3,695 123 70,265 — — 87,482 (9,237) 7,781 (1,445) 84,581 Prescribed officers Charles Carter ² 7,160 511 5,505 3,670 — — 162 — 17,008 (9,175) — — 7,833 Dawie Mostert 4,728 645 3,789 2,526 73 39,004 — — 50,765 (6,315) 4,673 (835) 48,288 Laurent Charbonnier ³ 10,067 81 6,995 4,663 2,296 — — — 24,102 (11,658) 6,751 (628) 18,567 Lerato Legong 3,947 538 3,010 2,007 51 — — — 9,553 (5,017) 3,555 (524) 7,567 Mika Seitovirta 4 6,896 1,242 3,532 2,355 1,773 — 101 — 15,899 (5,887) — — 10,012 Richard Stewart 5,734 644 4,703 3,135 83 45,826 — — 60,125 (7,838) 5,557 (907) 56,937 Robert van Niekerk 5,784 643 4,641 3,094 99 64,371 — — 78,632 (7,735) 6,168 (1,185) 75,880 Themba Nkosi 4,199 403 3,193 2,129 65 36,491 — — 46,480 (5,322) 4,230 (739) 44,649 Total 69,214 6,957 52,976 35,318 4,805 418,261 547 — 588,078 (88,294) 53,403 (9,126) 544,061 1 Dual service contract entered into with effect 1 May 2018. Remuneration paid in US$ was converted at the average exchange rate of R16.37/US$ applicable for the 12-month period ending 31 December 2022 2 Assumed a prescribed officer role on 23 May 2022, remuneration paid in US$ converted at the average exchange rate of R16.37/US$ applicable for the 12-month period ending 31 December 2022 3 Remuneration paid in GBP was converted at the average exchange rate of R20.18/GBP applicable for the 12-month period ending 31 December 2022 4 Remuneration paid in Euro was converted at the average exchange rate of R17.20/€ applicable for the 12-month period ending 31 December 2022 Pay relative to shareholder value creation The analysis below illustrates how the variable remuneration outcomes for the CEO over the past six years compare to the three-year rolling TSR performance for the Group (measured over a March to February vesting period) relative to the JSE All Share index and the JSE Resource index. The variable pay elements are shown in the bar chart in three portions: ‘Cash portion of STI’; ‘Accrual of deferred STI value’ and ‘LTI proceeds’. The graphs below clearly indicate that there is a fundamental and appropriate correlation between Sibanye-Stillwater’s variable pay and shareholder value delivery. They also highlight that Sibanye-Stillwater’s three-year rolling TSR performance, measured from March to February for alignment with the respective vesting periods, significantly outpaces the performance of the JSE All Share and JSE Resource indices from 2020 to 2022 (Sibanye-Stillwater’s TSR is c.11.4 times and c.3 times greater than that of the respective indices at the peak of the Group’s performance in 2021). This significant TSR outperformance meant that a substantial component of LTI vesting proceeds were attributable to Sibanye-Stillwater’s share price growth outcomes - which is in line with the intention to align the outcomes for the executives with those of the shareholder via the LTI awards. REMUNERATION REPORT PART 3 – IMPLEMENTATION REPORT continued IR - 269

For the current year, where Sibanye-Stillwater’s TSR is below the market performance outcomes, a substantial reduction in variable pay is observed sustaining the strong correlation between shareholder value creation (TSR performance) and the CEO pay outcomes. The next graph illustrates the split in the total value of the LTI proceeds for the CEO between the value at the time of the grant adjusted for actual performance outcomes and the value that was added due to share price performance over the three-year period until vesting. Non-executive director fees Fees and reimbursements paid in respect of non-executive directors’ 2023 Board and committee duties are presented in the table below reflecting the total amount paid to each non-executive director (exclusive of 15% VAT where applicable), as approved by shareholders. R000’s Non-executive director Directors’ fees Committee fees Expenses reimbursed Total Timothy Cumming 1,186 1,118 231 2,535 Savannah Danson 1,186 938 105 2,229 Richard Menell 2,407 484 719 3,610 Nkosemntu Nika 1,186 725 16 1,927 Keith Rayner 1,186 1,357 112 2,655 Susan van der Merwe 1,186 725 126 2,037 Jeremiah Vilakazi 1,186 689 119 1,994 Dr Vincent Maphai 3,582 — 132 3,714 Harry Kenyon-Slaney 1,364 1,219 788 3,371 Dr Elaine Dorward-King 1,364 531 904 2,799 Sindiswa Zilwa 1,186 813 147 2,146 Total 17,019 8,599 3,399 29,017 REMUNERATION REPORT PART 3 – IMPLEMENTATION REPORT continued IR - 270 LINKING PAY WITH THE DELIVERY OF LONG-TERM SHAREHOLDER VALUE -14.89% -23.07% 24.96% 86.40% 73.29% 12.05% 3.00% 22.37% 14.45% 29.01% 29.92% 22.87% 6.0 % 7.35% 3.15% 7.57% 14.80% 19.46% JSE All Share 3 year CAGR @ March to Feb JSE Basic Materials 3 year CAGR @ March to Feb Sibanye-Stillwater TSR 3 year CAGR @ Feb LTI proceeds Accrual of deferred STI Cash portion of STI 2018 2019 2020 2021 2022 2023 0 100,000 200,000 300,000 -30% 0% 30% 60% 90% R '0 00 CSU PROCEEDS SPLIT: GRANT DATE RELATIVE TO SHARE PRICE IMPACT Grant date value of vested shares (performance-adjusted) Change in value due to share price movement 2018 2019 2020 2021 2022 2023 -50,000 0 50,000 100,000 150,000 200,000 250,000

Detail on Board committees 272 Four-year statistical review 277 Statement of assurance 285 Our material matters – determination, definitions and references 287 Our shared value in numbers 290 Shareholder information 291 Forward-looking statements 294 Administrative and corporate information 295 IR - 271 ANCILLARY INFORMATION 5

DETAIL ON BOARD COMMITTEES OUR BOARD AND ITS COMMITTEES BOARD Has ultimate responsibility for providing ethical leadership and strategic guidance, ensuring that the principles of good corporate governance are observed in delivering on our strategy. Chairman: Dr Vincent Maphai Members: eleven independent non-executive directors and two executive directors Number of meetings annually: four and two strategy sessions Number of meetings in 2023: six meetings and two training sessions. One training session was a deep dive on climate change reporting requirements. Another, a refresher on the overview of and changes to the JSE Listings Requirements and the NYSE Listed Company requirements. All members attended all meetings in 2023 AUDIT COMMITTEE Ensures financial sustainability of the Group by monitoring and reviewing financial controls and procedures, as well as the effectiveness and integrity of internal audit and control systems. Appoints independent, external auditor. Oversees regulatory and legislative compliance. Chairman: Keith Rayner Members: Timothy Cumming, Savannah Danson, Richard Menell, Nkosemntu Nika, Susan van der Merwe and Sindiswa Zilwa Number of meetings annually: six Number of meetings in 2023: six All members attended all meetings in 2023, except Ms Savannah Danson who missed one meeting for the year. INVESTMENT COMMITTEE Established in February 2021 to discharge a pivotal role in guiding and overseeing the allocation of capital and to oversee the Group’s investment activities. Chairman: Richard Menell (until 31 December 2023) Members: Timothy Cumming, Harry Kenyon-Slaney, Keith Rayner, Jeremiah Vilakazi, Savannah Danson and Sindiswa Zilwa Meets on an ad hoc basis Number of meetings in 2023: six All members attended all meetings in 2023, except Ms Sindiswa Zilwa and Ms Savannah Danson who each missed one separate meeting for the year. NOMINATING AND GOVERNANCE COMMITTEE Develops our approach to matters relating to corporate governance and makes recommendations to the Board on all such matters, while keeping abreast of best practice. Monitors and evaluates effectiveness and composition of the Board and for director and senior executive succession planning. Chairman: Dr Vincent Maphai Members: Richard Menell, Nkosemntu Nika, Keith Rayner, Jeremiah Vilakazi, Susan van der Merwe and Harry Kenyon-Slaney (appointed on 11 March 2024) Number of meetings annually: four Number of meetings in 2023: four All members attended all meetings in 2023 REMUNERATION COMMITTEE Ensures payment of fair rewards to attract, retain and motivate executive management with the skills and experience necessary to support and sustain the company and its strategy, and evaluates performance in relation to reward. Chairman: Timothy Cumming Members: Savannah Danson, Harry Kenyon-Slaney, Dr Vincent Maphai, Nkosemntu Nika and Keith Rayner Number of meetings annually: four Number of meetings in 2023: four All members attended all meetings in 2023, except Ms Savannah Danson who missed one meeting for the year. RISK COMMITTEE Ensures Group sustainability by evaluating and overseeing implementation of efficient risk management processes and controls to identify, monitor and mitigate risks and to act on opportunities identified. Chairman: Richard Menell (until 31 December 2023) Members: Timothy Cumming, Savannah Danson, Dr Elaine Dorward-King, Neal Froneman, Sindiswa Zilwa, Harry Kenyon-Slaney, Keith Rayner and Susan van der Merwe Number of meetings annually: four Number of meetings in 2023: four All members attended all meetings in 2023, except Ms Savannah Danson who missed one meeting for the year. SAFETY AND HEALTH COMMITTEE Ensures adherence to occupational health and safety laws, regulations and external standards, reviews relevant policy and monitors performance of related key indicators so as to minimise mining-related accidents and their impacts. The Safety and Health Committee analyses safety incidents to understand the root causes and to evaluate action plans to prevent future occurrences. Chairman: Harry Kenyon-Slaney (until 31 December 2023)) Members: Savannah Danson, Dr Elaine Dorward-King, Neal Froneman, Dr Vincent Maphai, Sindiswa Zilwa, Richard Menell and Susan van der Merwe Number of meetings annually: eight Number of meetings in 2023: eight All members attended all meetings in 2023, except Ms Savannah Danson who missed one meeting for the year. SOCIAL ETHICS AND SUSTAINABILITY COMMITTEE Supports and assists the Board in ensuring compliance with best practice recommendations relating to the ethical conduct of our stakeholder engagement together with transformation and inclusive economy targets. Oversees and monitors anti-corruption policy and performance, the Group’s standing as a responsible corporate citizen, particularly in relation to the Code of ethics. Monitors compliance in terms of the UNGC principles. Chairman: Jeremiah Vilakazi (until 31 December 2023)) Members: Timothy Cumming, Dr Elaine Dorward-King, Harry Kenyon- Slaney, Dr Vincent Maphai, Richard Menell, Nkosemntu Nika and Keith Rayner Number of meetings annually: four Number of meetings in 2023: four All members attended all meetings in 2023 except Ms Savannah Danson who missed one meeting for the year. IR - 272

BOARD COMMITTEES ––––––––––––––––––––––––––––––––––––––––––––––––––––––––––––––––––––––––––––––––––––––––––––––––––––––––––––––––––––––––––––––––––––––– Audit Committee Member Appointed to Committee 2023 Meeting attendance Keith Rayner (Chair) 24 February 2020 6/6 Timothy Cumming 24 February 2020 6/6 Savannah Danson (resigned 11 March 2024) 24 February 2020 5/6 Richard Menell 24 February 2020 6/6 Nkosemntu Nika 24 February 2020 6/6 Susan van der Merwe 24 February 2020 6/6 Sindiswa Zilwa 16 February 2021 5/6 2023: Contribution to value creation 2024: Planned areas of focus Capital allocation • Allocation of funds organically, inorganically and as dividends to be monitored each quarter • Quarterly solvency and liquidity review to support planned capital allocation ICT projects • Implementation of various ICT projects throughout the Group IFRS Accounting Standards • Ensure implementation of new and revised International Financial Reporting Standards Accounting Standards throughout the business Internal controls and SOX • Group internal controls were monitored quarterly from Internal audit and SOX quarterly reports to ensure Group controls are effective See – Annual financial report - Report of the Audit Committee for more detail. Continued monitoring of: • Solvency and liquidity review to be performed quarterly to support planned capital allocation • Internal controls and SOX • ICT governance and cybersecurity • New legislation pertaining to financial reporting • Financial risks • Succession planning for committee composition For the Audit Committee’s Terms of reference, see www.sibanyestillwater.com/about-us/corporate-governance ––––––––––––––––––––––––––––––––––––––––––––––––––––––––––––––––––––––––––––––––––––––––––––––––––––––––––––––––––––––––––––––––––––––– Risk Committee Member Appointed to the Committee 2023 Meeting attendance Richard Menell (Chair until 31 December 2023) 24 February 2020 4/4 Harry Kenyon-Slaney (Chair from 1 January 2024) 24 February 2020 4/4 Neal Froneman 24 February 2020 4/4 Timothy Cumming 24 February 2020 4/4 Keith Rayner 24 February 2020 4/4 Savannah Danson (resigned 11 March 2024) 24 February 2020 3/4 Susan van der Merwe 24 February 2020 4/4 Sindiswa Zilwa 16 February 2021 4/4 Elaine Dorward-King 26 May 2023 4/4 2023: Contribution to value creation 2024: Planned areas of focus • Annual review of Enterprise risk management (ERM) framework • Annual review of Group risk tolerance and risk appetite statements • Annual review of ERM process assurance • Strategic risk register (review) • Corporate compliance reports (review) • Insurance renewal • Segment strategic risk registers (review and approval) • Risk-related disclosures for the IR (approval) • Continued monitoring: ERM process assurance and maturity (review) • Annual review of Group risk tolerance and risk appetite statements • Group strategic risk register (review) • Corporate compliance reports (review) • Insurance renewal • Regional risk registers (review) • New segment risk registers (review and approval) • Succession planning for committee composition For the Risk Committee’s Terms of reference see www.sibanyestillwater.com/about-us/corporate-governance DETAIL ON BOARD COMMITTEES continued IR - 273

––––––––––––––––––––––––––––––––––––––––––––––––––––––––––––––––––––––––––––––––––––––––––––––––––––––––––––––––––––––––––––––––––––––– Nominating and Governance Committee Vincent Maphai (Chair) 24 February 2020 4/4 Richard Menell 24 February 2020 4/4 Nkosemntu Nika 24 February 2020 4/4 Jeremiah Vilakazi 24 February 2020 4/4 Susan van der Merwe 24 February 2020 4/4 Keith Rayner 16 February 2021 4/4 Harry Kenyon-Slaney 11 March 2024 N/A Member Appointed to the Committee 2023 Meeting attendance 2023: Contribution to value creation 2024: Planned areas of focus • Directors’ and officers’ insurance (review and approval) • Implementation of the external board evaluators’ recommendations • Embedding succession planning for Chairman, CEO and the C-suite • Corporate governance and key legislation updates • Embedding Board evolution principles and appointment of new directors • Succession planning for CEO and committee chairs • Succession planning for committee composition The Nominating and Governance Committee Terms of reference are available at www.sibanyestillwater.com/about-us/corporate-governance ––––––––––––––––––––––––––––––––––––––––––––––––––––––––––––––––––––––––––––––––––––––––––––––––––––––––––––––––––––––––––––––––––––––– Remuneration Committee Member Appointed to the Committee 2023 Meeting attendance Timothy Cumming (Chair) 24 February 2020 4/4 Harry Kenyon-Slaney 24 February 2020 4/4 Savannah Danson (resigned 11 March 2024) 24 February 2020 3/4 Vincent Maphai 24 February 2020 4/4 Nkosemntu Nika 24 February 2020 4/4 Keith Rayner 24 February 2020 4/4 2023: Contribution to value creation 2024: Planned areas of focus • Remuneration benchmarking in the context of increasing global mobility and the Group’s increased geographic diversification (review) • Focus on appropriateness and extent of ESG as a factor in incentive determinations See Remuneration report for more detail. • Further work on determining the most appropriate remuneration benchmarking methodology with a specific focus on the application of jurisdictional adjustment factors to develop a global pay scale • Update our review of possible gender pay-gaps within the organisation in order to assess whether previous actions implemented have had the desired effect and also to monitor progress • Further review of relevant market practices for the long- term incentive portion of variable pay The Remuneration Committee’s Terms of reference are available at www.sibanyestillwater.com/about-us/corporate-governance DETAIL ON BOARD COMMITTEES continued IR - 274

––––––––––––––––––––––––––––––––––––––––––––––––––––––––––––––––––––––––––––––––––––––––––––––––––––––––––––––––––––––––––––––––––––––– Safety and Health Committee Member Appointed to the Committee 2023 Meeting attendance Jeremiah Vilakazi (Chair from 1 January 2024) N / A 1 January 2024 N/A Harry Kenyon-Slaney (Chair until 31 December 2023 ) 24 February 2020 8/8 Savannah Danson (resigned 11 March 2024) 24 February 2020 7/8 Neal Froneman 24 February 2020 8/8 Richard Menell 24 February 2020 8/8 Vincent Maphai 24 February 2020 8/8 Susan van der Merwe 24 February 2020 8/8 Sindiswa Zilwa 16 February 2021 7/8 Elaine Dorward-King 27 March 2020 8/8 2023: Contribution to value creation 2024: Planned areas of focus • Converting cultural and leadership transformation work into improved health and safety outcomes • Establishment of a post-incident review process to ensure actions and lessons from incident investigation are implemented • Overseeing the development and successful implementation of the Group's fatal elimination strategy • Continuing to drive the development and implementation of the Group's new set of global safety standards and guidelines • Monitoring the creation of the desired Zero harm safety culture and ensuring its practical conversion into the way all staff think, act and behave in the workplace • Ensuring rigorous investigations are conducted into all serious incidents and that the lessons learned are applied swiftly and universally across the Group • Encouraging the use of technological innovation to reduce risk, to distance people from machinery where possible and to advance the ability to identify areas at high risk of geotechnical failure • Continued implementation of the Noise-induced hearing loss (NIHL) and Diesel particulate matter (DPM) strategy • Continued monitoring of the cultural and leadership transformation work into improved health and safety outcomes • Continued oversight of the fatal elimination strategy • Encouraging the use of technological innovation to reduce risk • Continue to strive to make the safety and health systems and processes as efficient, effective, clear and usable and the implementation of the visualisation of the risk strategy • Succession planning for committee composition The Safety and Health Committee’s Terms of reference are available at: www.sibanyestillwater.com/about-us/corporate-governance DETAIL ON BOARD COMMITTEES continued IR - 275

––––––––––––––––––––––––––––––––––––––––––––––––––––––––––––––––––––––––––––––––––––––––––––––––––––––––––––––––––––––––––––––––––––––– Social, Ethics and Sustainability Committee Member Appointed to the Committee 2023 Meeting attendance Elaine Dorward-King (Chair from 1 January 2024) 27 March 2020 4/4 Jeremiah Vilakazi (Chair until 31 December 2023) 24 February 2020 4/4 Timothy Cumming 24 February 2020 4/4 Harry Kenyon-Slaney 24 February 2020 4/4 Richard Menell 24 February 2020 4/4 Vincent Maphai 24 February 2020 4/4 Nkosemntu Nika 24 February 2020 4/4 Keith Rayner 24 February 2020 4/4 2023: Contribution to value creation 2024: Planned areas of focus • Continued monitoring of the journey towards carbon neutrality by 2040 and Developing a climate change-resilient business • Embedded regionalised business model reporting • Continued focus on diversity, equity, and inclusion across all regions • Supporting host communities in becoming self-sustaining • Repositioning the business to be nature positive See Social, Ethics and Sustainability Committee: Chairman’s report for more detail • Continued focus on the four sustainability themes • Continued promotion of an inclusive economy • Focus on tailings management and TCFD • Embedding human rights due diligence results • Succession planning for committee composition The Social, Ethics and Sustainability Committee’s Terms of reference are available at: www.sibanyestillwater.com/about-us/corporate-governance ––––––––––––––––––––––––––––––––––––––––––––––––––––––––––––––––––––––––––––––––––––––––––––––––––––––––––––––––––––––––––––––––––––––– Investment Committee Members Appointed to Committee 2023 Meeting attendance Richard Menell (chair) 16 February 2021 6/6 Timothy Cumming 16 February 2021 6/6 Harry Kenyon-Slaney 16 February 2021 6/6 Savannah Danson (resigned 11 March 2024) 16 February 2021 5/6 Keith Rayner (Chair from 1 January 2024) 16 February 2021 6/6 Jeremiah Vilakazi 16 February 2021 6/6 Sindiswa Zilwa 16 February 2021 5/6 2023: Contribution to value creation 2024: Planned areas of focus Conclusion of the following investments: • New Century Resources Limited • Mopani transaction • Investment in Verkor • Investment in Glint • Increased investment in Keliber lithium project • Review of investments • Post-investment analysis • Succession planning for committee composition For the Investment Committee’s Terms of reference, see www.sibanyestillwater.com/about-us/corporate-governance DETAIL ON BOARD COMMITTEES continued IR - 276
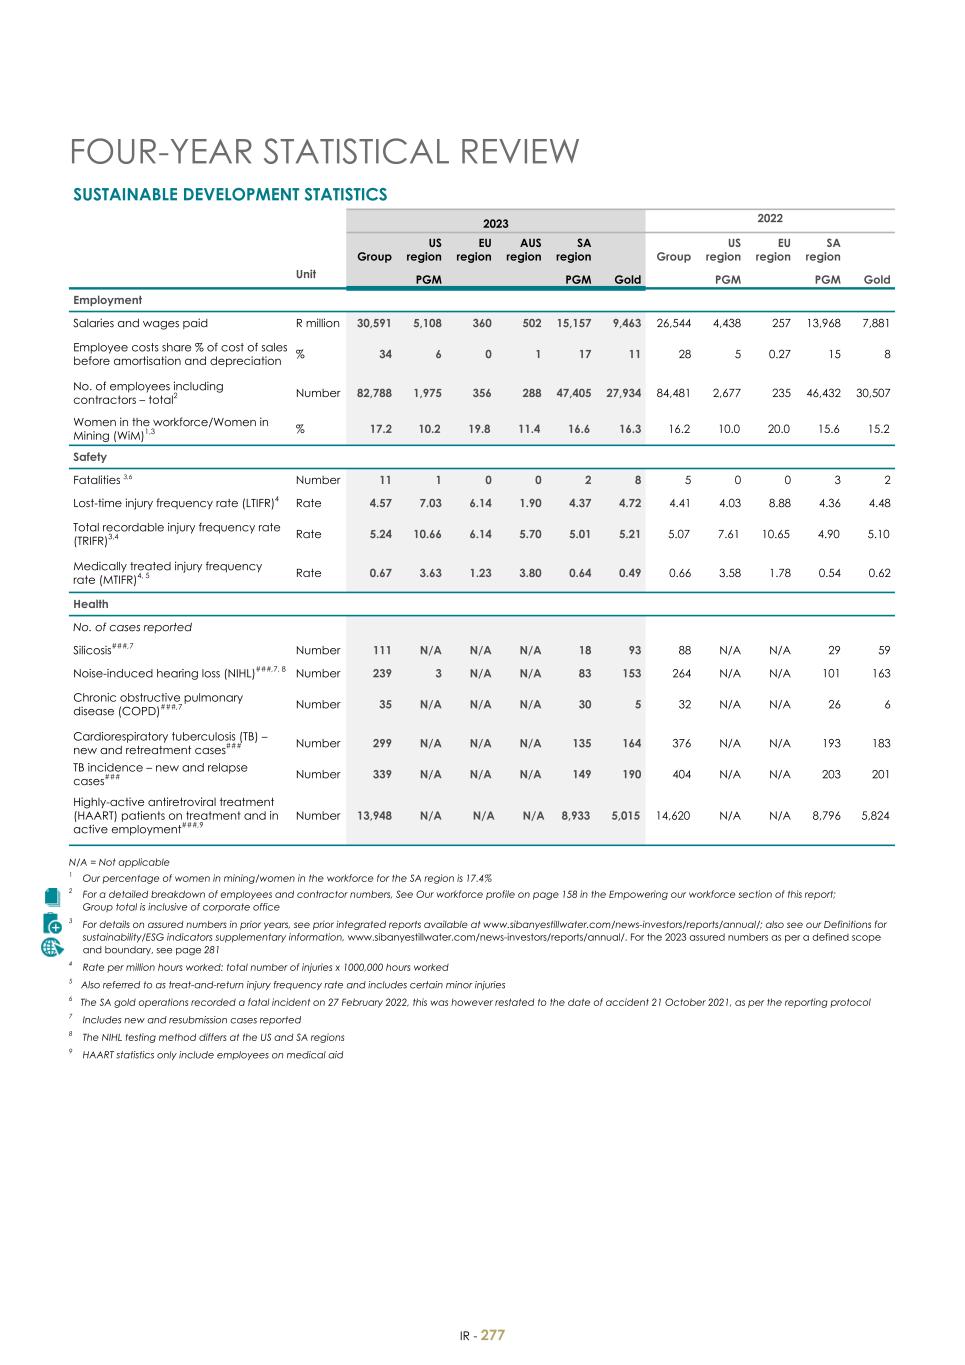
FOUR-YEAR STATISTICAL REVIEW SUSTAINABLE DEVELOPMENT STATISTICS 2023 2022 Group US region EU region AUS region SA region Group US region EU region SA region Unit PGM PGM Gold PGM PGM Gold Employment Salaries and wages paid R million 30,591 5,108 360 502 15,157 9,463 26,544 4,438 257 13,968 7,881 Employee costs share % of cost of sales before amortisation and depreciation % 34 6 0 1 17 11 28 5 0.27 15 8 No. of employees including contractors – total2 Number 82,788 1,975 356 288 47,405 27,934 84,481 2,677 235 46,432 30,507 Women in the workforce/Women in Mining (WiM)1,3 % 17.2 10.2 19.8 11.4 16.6 16.3 16.2 10.0 20.0 15.6 15.2 Safety Fatalities 3,6 Number 11 1 0 0 2 8 5 0 0 3 2 Lost-time injury frequency rate (LTIFR)4 Rate 4.57 7.03 6.14 1.90 4.37 4.72 4.41 4.03 8.88 4.36 4.48 Total recordable injury frequency rate (TRIFR)3,4 Rate 5.24 10.66 6.14 5.70 5.01 5.21 5.07 7.61 10.65 4.90 5.10 Medically treated injury frequency rate (MTIFR)4, 5 Rate 0.67 3.63 1.23 3.80 0.64 0.49 0.66 3.58 1.78 0.54 0.62 Health No. of cases reported Silicosis###,7 Number 111 N/A N/A N/A 18 93 88 N/A N/A 29 59 Noise-induced hearing loss (NIHL)###,7, 8 Number 239 3 N/A N/A 83 153 264 N/A N/A 101 163 Chronic obstructive pulmonary disease (COPD)###,7 Number 35 N/A N/A N/A 30 5 32 N/A N/A 26 6 Cardiorespiratory tuberculosis (TB) – new and retreatment cases### Number 299 N/A N/A N/A 135 164 376 N/A N/A 193 183 TB incidence – new and relapse cases### Number 339 N/A N/A N/A 149 190 404 N/A N/A 203 201 Highly-active antiretroviral treatment (HAART) patients on treatment and in active employment###,9 Number 13,948 N/A N/A N/A 8,933 5,015 14,620 N/A N/A 8,796 5,824 N/A = Not applicable 1 Our percentage of women in mining/women in the workforce for the SA region is 17.4% 2 For a detailed breakdown of employees and contractor numbers, See Our workforce profile on page 158 in the Empowering our workforce section of this report; Group total is inclusive of corporate office 3 For details on assured numbers in prior years, see prior integrated reports available at www.sibanyestillwater.com/news-investors/reports/annual/; also see our Definitions for sustainability/ESG indicators supplementary information, www.sibanyestillwater.com/news-investors/reports/annual/. For the 2023 assured numbers as per a defined scope and boundary, see page 281 4 Rate per million hours worked: total number of injuries x 1000,000 hours worked 5 Also referred to as treat-and-return injury frequency rate and includes certain minor injuries 6 The SA gold operations recorded a fatal incident on 27 February 2022, this was however restated to the date of accident 21 October 2021, as per the reporting protocol 7 Includes new and resubmission cases reported 8 The NIHL testing method differs at the US and SA regions 9 HAART statistics only include employees on medical aid IR - 277

Employment Salaries and wages paid R million 26,214 3,691 13,259 9,264 23,851 3,991 11,773 8,087 Employee costs share % of cost of sales before amortisation and depreciation % 26 4 13 9 31 5 15 11 No. of employees including contractors – total2 Number 84,981 2,904 46,004 31,142 84,775 2,842 46,385 30,943 Women in the workforce / Women in Mining (WiM)### % 14.4 9.8 13.5 13.5 13.3 9.3 12.0 12.0 Safety Fatalities 3,6 Number 21 2 6 13 9 0 5 4 Lost-time injury frequency rate (LTIFR)4 Rate 6.02 6.77 6.21 5.72 5.56 7.98 5.37 5.65 Total recordable injury frequency rate (TRIFR)###,4 Rate 7.10 10.48 7.09 6.88 6.69 12.67 6.30 6.81 Medically treated injury frequency rate (MTIFR)5, ### Rate 1.08 3.71 0.88 1.16 2.95 4.69 4.13 1.35 Health No. of cases reported Silicosis###,7 Number 93 N/A 32 61 139 N/A 66 73 Noise-induced hearing loss (NIHL)###,7, 8 Number 294 0 122 172 231 0 138 93 Chronic obstructive pulmonary disease###,7 Number 30 N/A 24 6 39 N/A 34 5 Cardiorespiratory tuberculosis (TB) – new and retreatment cases Number 406 N/A 183 223 427 N/A 225 202 TB incidence – new and relapse cases### Number 446 N/A 197 249 494 N/A 257 237 Highly-active antiretroviral treatment (HAART) patients on treatment and in active employment###,9 Number 15,160 N/A 8,326 6,834 15,163 N/A 7,960 7,203 2021 2020 Group US region SA region Group US region SA region Unit PGM PGM Gold PGM PGM Gold FOUR-YEAR STATISTICAL REVIEW continued IR - 278

Environment Cyanide consumption tonne 1,264 N/A N/A N/A 0 1,264 1,409 N/A 0 N/A 1,409 Total CO2e emissions: Scope 1 and 2###,10 000t 6,631 224 15 Not yet reported 3,045 3,347 6,686 285 6 3,123 3,272 Total CO2e emissions: Scope 3 ###,### 000t 1,273 53 Not yet report ed Not yet reported 942 278 1,137 59 N/A 713 365 Emissions intensity12 tCO2e/t milled 0.14 0.17 N/A Not yet reported 0.08 0.32 0.13 0.23 N/A 0.08 0.33 GHG Emissions intensity (Scope 1 and 2)12 tCO2e/oz 2.07 0.3 N/A Not yet reported 1.73 5.19 2.0 0.29 N/A 1.70 7.40 SO2 emissions###,13 tonnes 1,643.2 0.78 0.145 N/A 1,642.46 N/A 2,578 1.5 N/A 2,576 N/A Electricity consumed### TWh 6.80 0.37 0.04 0.41 2.90 3.08 6.13 0.37 0.04 2.88 2.85 Diesel energy### TJ 1,320 242 0.59 158 802 275 1,302 286 0 851 166 Total water withdrawn### 000ML 151.4 2.79 1.01 4.64 26.61 116.31 130.7 3.0 0.8 23.7 103.2 Water used14 000ML 52.08 0.29 0 3 26.07 22.47 39.44 0.23 0 23.46 15.75 Water use intensity15 kl/t treated 1.26 0.22 N/A N/A 0.88 2.13 1.02 0.18 N/A 0.83 1.68 Environmental incidents: level 3 and higher3 Number 2 1 0 0 1 0 2 1 0 0 1 Gross rehabilitation liabilities R billion 18.15 1.35 0.14 2.78 8.49 5.38 12.42 1.18 0.00 6.23 5.01 Representation (HDP South Africans)17 Top management (Board) ### % 46.2 N/A N/A N/A 46.2 46.2 46.2 N/A N/A 46.2 46.2 Executive management ### % 35.9 N/A N/A N/A 35.9 35.9 42.4 N/A N/A 42.4 42.4 Senior management ### % 49.5 N/A N/A N/A 48.1 63.2 46.0 N/A N/A 44.3 47.1 Middle management ### % 62.9 N/A N/A N/A 64.8 58.1 60.3 N/A N/A 63.4 53.3 Junior management ### % 77.8 N/A N/A N/A 81.2 69.1 76.5 N/A N/A 79.8 68.8 Social and procurement spend Total socioeconomic development (SED)### R million 612.9 6.5 0.9 0.0 473.5 132.0 368.9 6.3 0.2 216.2 146.2 Social and labour plan (SLP) projects### R million 2,202 N/A N/A N/A 984 1,218 2,195 N/A N/A 1,098 1,097 Total BEE procurement spend###,16 R million 25,018 N/A N/A N/A 13,676 11,341 21,415 N/A N/A 12,684 8,731 Services16 % 73 N/A N/A N/A 77 82 73 N/A N/A 75 70 Mining goods16 % 80 N/A N/A N/A 78 66 78 N/A N/A 81 77 % of total procurement16 % 76 N/A N/A N/A 77 75 75 N/A N/A 77 74 Other Current tax and royalties31 R million 4,230 (343) 80 133 3,886 443 11,106 655 0 10,145 302 Research and development R million 87.8 125.1 2023 2022 Group US region EU region AUS region SA region Group US operations EU region SA region Unit PGM PGM Gold PGM PGM Gold 1 Our percentage of women in mining/women in the workforce for the SA region is 17.4% 2 For a detailed breakdown of employees and contractor numbers, See Our workforce profile on page 158 in the Empowering our workforce section of this report; Group total is inclusive of corporate office 3 For details on assured numbers in prior years, see prior integrated reports available at www.sibanyestillwater.com; also see our Definitions for sustainability/ESG indicators supplementary information, www.sibanyestillwater.com/news-investors/reports/annual/. For the 2023 assured numbers as per a defined scope and boundary, see page 281 4 Rate per million hours worked: total number of injuries x 1000,000 hours worked 5 Also referred to as treat-and-return injury frequency rate and includes certain minor injuries 6 The SA gold operations recorded a fatal incident on 27 February 2022, this was however restated to the date of accident 21 October 2021, as per the reporting protocol 7 Includes new and resubmission cases reported 8 The NIHL testing method differs at the US and SA regions 9 HAART statistics only include employees on medical aid 10 Scope 1 and 2 emissions include fugitive mine methane. We have chosen to report our scope 1 and scope 2 emissions separately from our scope 3 emissions as scope 1 and 2 emissions are under our direct control while scope 3 emissions represent the effect of our business activities across the supply chain. Although it is not a mandatory Intergovernmental Panel on Climate Change reporting category, we are also reporting our fugitive mine methane emissions in the Free State province of South Africa in line with the transparency principle of the ISO 14064 greenhouse gas quantification standard. Scope 2 emissions are representative of the location-based method. EU emissions exclude Keliber lithium project as the project is still under construction ### The following scope 3 categories are included, also see supplementary report, Climate change-related disclosure: Category 1: Purchased goods and services;Category 2: Capital goods; Category 3: Fuel- and energy-related activities;Category 4: Upstream transportation and distribution; Category 5: Waste generated in operations;Category 6: Business travel;Category 7: Employee commuting;Category 8: Upstream leased assets;Category 9: Downstream transportation and distribution;Category 10: Processing of sold products Category 11: Use of sold products; Category 12: End-of-life treatment of sold products;Category 13: Downstream leased assets;Category 14: Franchises; Category 15: Investments FOUR-YEAR STATISTICAL REVIEW continued IR - 279

Environment Cyanide consumption 000t 2,979 N/A N/A 2,979 2,244 N/A N/A 2,244 Total CO2e emissions Scope 1 and 23,10 000t 7,302 259 3,023 4,020 6,695 259 2,601 3,835 Scope 33,### 000t 1,506 123 823 560 1,245 124 692 429 Emissions intensity3,12 tCO2e/t milled 0.16 0.17 0.10 0.27 0.17 0.17 0.1 0.19 GHG Emissions intensity (Scope 1 and 2)12 tCO2e/oz 1.4 0.08 0.97 4.51 1.8 0.14 1.49 4.91 SO2 emissions3,13 tonnes 1,747 3.83 1,743 N/A 2,314 4.14 2,310 N/A Electricity consumed3 TWh 6.59 0.37 2.75 3.47 6.19 0.37 2.42 3.39 Diesel3 TJ 1,281 372 775 134 1,108 367 623 117 Total water withdrawn3 000ML 124.6 3.4 24.2 97.1 125.2 3.46 23.3 98.5 Water used14 000ML 47.65 0.20 23.89 23.56 49.30 0.37 23.00 25.90 Water use intensity15, kl/t treated 1.02 0.13 0.80 1.56 1.18 0.21 0.90 1.78 Environmental incidents level 3 and higher3 Number 5 1 2 2 5 1 2 2 Gross rehabilitation liabilities R billion 11.15 0.99 5.51 4.65 10.76 0.76 5.50 4.50 Representation (HDP South Africans)17 Top management (Board)3 % 46.2 N/A 46.2 46.2 42.0 N/A 42.0 40.0 Executive management3 % 37.8 N/A 37.8 37.8 N/A Senior management3 % 40.5 N/A 40.5 40.5 41.0 N/A 41.0 41.0 Middle management3 % 47.2 N/A 49.3 27.8 48.0 N/A 49.0 33.0 Junior management3 % 57.1 N/A 60.1 48.7 54.0 N/A 56.0 47.0 Social and procurement spend Total socioeconomic development (SED)3 R million 352.4 5.9 200.5 146.0 201.7 6.6 116.4 78.6 Social and labour plan (SLP) projects3,16 R million 2,085 N/A 934 1,151 1,734 N/A 773 962 Total BEE procurement spend3,16 R million 16,442 N/A 10,637 5,805 12,656 N/A 8,211 4,444 Services16 % 65 N/A 62 71 75 N/A 79 59 Consumables16 % 78 N/A 82 71 70 N/A 81 82 % of total procurement16 % 70 N/A 69 71 72 N/A 75 67 Other Current tax and royalties31 R million 16,220 1,422 14,291 437 7,139 976 5,483 635 Research and development R million 55 52 2021 2020 Group US operations SA Operations Group US operations SA operations Unit PGM PGM Gold ### PGM PGM Gold 12 Emissions intensity (t CO2e per tonne milled or oz produced) is the intensity ratio of total scope 1 and 2 emissions to tonnes milled or ounces produced at the operations under our operational control. The ore at the US PGM operations is of a higher grade, contributing to a higher intensity rate using tonnes milled versus ounces output 13 SA region: Sulphur dioxide (SO2) emissions are from the Marikana PGM smelters and quantified through a combination of stack measurements and mass balance. The US region also include the emissions from the Columbus metallurgical complex. 14 2020 water discharged for SA gold operations was restated due to measurement correction 15 Water use intensity in the US operations is low due to higher grade ores being processed 16 The BEE proportion of total procurement applies to procurement spend in South Africa only. The spend reflected for the SA gold operations includes Shared Service department spend 17 HDP in management includes management classified as designated groups and employed at management levels (excluding foreign nationals and white males) as at financial year-end 2020 and 2021. In previous years, the senior management and executive level of management representations of designated groups were combined as one figure; however, this has been split from 2021 and historical data has been adjusted to make provision for the management split per level. The definition of the DMRE categorisation has changed to align to DOEL categories FOUR-YEAR STATISTICAL REVIEW continued IR - 280

SELECTED KEY SUSTAINABILITY PERFORMANCE INDICATORS, ASSURED, FOR THE 2023 YEAR The table below contains the selected key performance indicators (KPIs) which have been selected for the 2023 year and which KPMG has provided limited assurance on. For the Assurance report, please refer to page 285 of this Integrated report: Selected KPI Boundary Unit of measure Number assured for the 2023 year based on the boundary Environment 1 Total CO2e emissions: Scope 1 and 2 Group excluding the AUS region ’000 tCO2e 6,631 2 Total CO2e emissions: Scope 31 Group excluding the AUS region ’000 tCO2e 1,273 3 GHG emissions intensity (Scope 1 and 2) Group excluding the AUS region tCO2e/oz 2.07 4 Electricity consumed Group excluding the AUS region TWh 6.39 5 Diesel energy Group excluding the AUS region TJ 1,320 6 Number of environmental incidents: Level 3 and higher Group excluding the AUS region Number 2 7 Total water withdrawn Group excluding the AUS region ’000 ML 146.78 8 SO2 emissions US and SA PGM operations Tonnes SO2 1,643.2 Health 9 Number of new and resubmitted silicosis cases reported SA region Number of cases 111 10 Number of new and resubmitted noise induced hearing loss (NIHL) cases reported Group excluding the AUS region Number of cases 239 11 Number of new and resubmitted chronic obstructive pulmonary diseases (COPD) cases reported SA region Number of cases 35 12 Number of new and retreatment cardiorespiratory tuberculosis (TB) cases reported SA region Number of cases 299 13 Number of new and relapsed tuberculosis (TB) incidence cases reported SA region Number of cases 339 14 Highly-active antiretroviral treatment (HAART) patients on treatment and in active employment2 SA region Number of patients 13,948 Safety 15 Total recordable injury frequency rate (TRIFR)3 Group excluding the AUS region Rate 5.24 16 Number of fatalities Group excluding the AUS region Number 11 Social 17 Total socioeconomic development (SED) spend Group excluding the AUS region R million 612.9 18 Total approved social and labour plan (SLP) project spend SA region R million 2,201.9 19 HDP representation in SA region • top management (Board) % 46.2 • executive management % 35.9 • senior management % 49.5 • middle management % 62.9 • junior management % 77.8 20 Total BEE procurement spend SA region R million 25,018 21 Women in the workforce/ Women in Mining (WiM) Group excluding the AUS region % 17.2 1Scope 3 categories included for assurance: Category 1 (Purchased Goods and Services), Category 2 (Capital Goods), Category 5 (Waste Generated in Operations), Category 6 (Business Travel), Category 7 (Employee Commuting), Category 9 (Downstream Transportation and Distribution), Category 13 (Downstream Leased Assets) 2 HAART statistics only include employees on medical aid 3 Rate per million hours worked: total number of injuries x 1000,000 hours worked FOUR-YEAR STATISTICAL REVIEW continued IR - 281
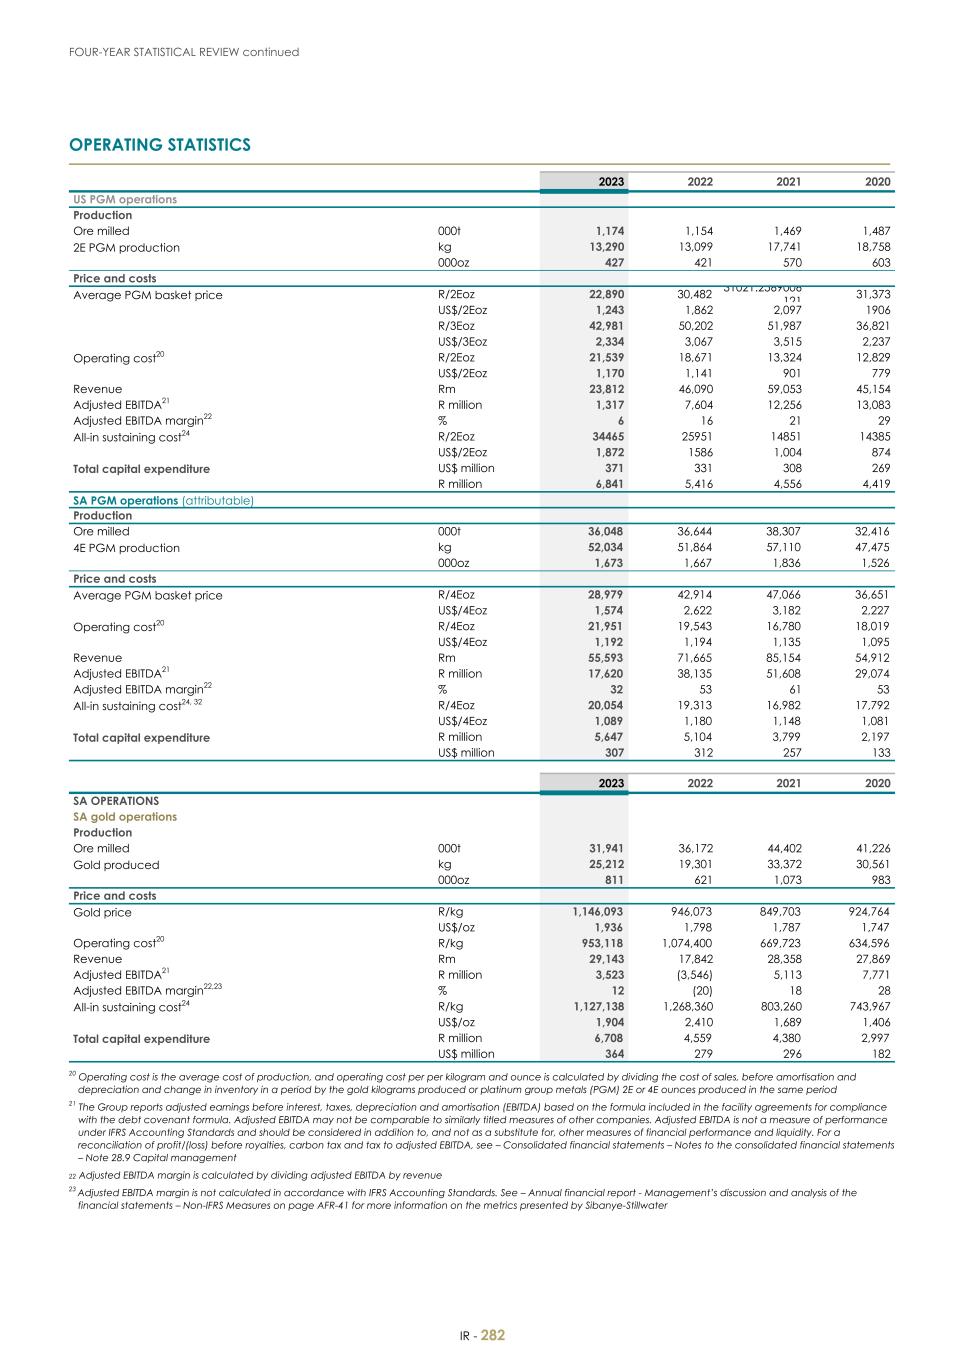
OPERATING STATISTICS ––––––––––––––––––––––––––––––––––––––––––––––––––––––––––––––––––––––––––––––––––––––––––––––––––––––––––––––––––––––––––––––––––––––– 2023 2022 2021 2020 US PGM operations Production Ore milled 000t 1,174 1,154 1,469 1,487 2E PGM production kg 13,290 13,099 17,741 18,758 000oz 427 421 570 603 Price and costs Average PGM basket price R/2Eoz 22,890 30,482 31021.2569006 121 31,373 US$/2Eoz 1,243 1,862 2,097 1906 R/3Eoz 42,981 50,202 51,987 36,821 US$/3Eoz 2,334 3,067 3,515 2,237 Operating cost20 R/2Eoz 21,539 18,671 13,324 12,829 US$/2Eoz 1,170 1,141 901 779 Revenue Rm 23,812 46,090 59,053 45,154 Adjusted EBITDA21 R million 1,317 7,604 12,256 13,083 Adjusted EBITDA margin22 % 6 16 21 29 All-in sustaining cost24 R/2Eoz 34465 25951 14851 14385 US$/2Eoz 1,872 1586 1,004 874 Total capital expenditure US$ million 371 331 308 269 R million 6,841 5,416 4,556 4,419 SA PGM operations (attributable) Production Ore milled 000t 36,048 36,644 38,307 32,416 4E PGM production kg 52,034 51,864 57,110 47,475 000oz 1,673 1,667 1,836 1,526 Price and costs Average PGM basket price R/4Eoz 28,979 42,914 47,066 36,651 US$/4Eoz 1,574 2,622 3,182 2,227 Operating cost20 R/4Eoz 21,951 19,543 16,780 18,019 US$/4Eoz 1,192 1,194 1,135 1,095 Revenue Rm 55,593 71,665 85,154 54,912 Adjusted EBITDA21 R million 17,620 38,135 51,608 29,074 Adjusted EBITDA margin22 % 32 53 61 53 All-in sustaining cost24, 32 R/4Eoz 20,054 19,313 16,982 17,792 US$/4Eoz 1,089 1,180 1,148 1,081 Total capital expenditure R million 5,647 5,104 3,799 2,197 US$ million 307 312 257 133 SA gold operations Production Ore milled 000t 31,941 36,172 44,402 41,226 Gold produced kg 25,212 19,301 33,372 30,561 000oz 811 621 1,073 983 Price and costs Gold price R/kg 1,146,093 946,073 849,703 924,764 US$/oz 1,936 1,798 1,787 1,747 Operating cost20 R/kg 953,118 1,074,400 669,723 634,596 Revenue Rm 29,143 17,842 28,358 27,869 Adjusted EBITDA21 R million 3,523 (3,546) 5,113 7,771 Adjusted EBITDA margin22,23 % 12 (20) 18 28 All-in sustaining cost24 R/kg 1,127,138 1,268,360 803,260 743,967 US$/oz 1,904 2,410 1,689 1,406 Total capital expenditure R million 6,708 4,559 4,380 2,997 US$ million 364 279 296 182 2023 2022 2021 2020 SA OPERATIONS 20 Operating cost is the average cost of production, and operating cost per per kilogram and ounce is calculated by dividing the cost of sales, before amortisation and depreciation and change in inventory in a period by the gold kilograms produced or platinum group metals (PGM) 2E or 4E ounces produced in the same period 21 The Group reports adjusted earnings before interest, taxes, depreciation and amortisation (EBITDA) based on the formula included in the facility agreements for compliance with the debt covenant formula. Adjusted EBITDA may not be comparable to similarly titled measures of other companies. Adjusted EBITDA is not a measure of performance under IFRS Accounting Standards and should be considered in addition to, and not as a substitute for, other measures of financial performance and liquidity. For a reconciliation of profit/(loss) before royalties, carbon tax and tax to adjusted EBITDA, see – Consolidated financial statements – Notes to the consolidated financial statements – Note 28.9 Capital management 22 Adjusted EBITDA margin is calculated by dividing adjusted EBITDA by revenue 23 Adjusted EBITDA margin is not calculated in accordance with IFRS Accounting Standards. See – Annual financial report - Management’s discussion and analysis of the financial statements – Non-IFRS Measures on page AFR-41 for more information on the metrics presented by Sibanye-Stillwater FOUR-YEAR STATISTICAL REVIEW continued IR - 282

2023 2022 EUROPEAN OPERATIONS Sandouville nickel refinery33 Volumes produced Nickel Salts34 tonnes 1,411 2,003 Nickel Metal tonnes 5,714 4,839 Total Nickel production tNi 7,125 6,842 Nickel Cakes35 tonnes 320 284 Cobalt Chloride (CoCl2) 36 tonnes 127 153 Ferric Chloride (FeCl3) 36 tonnes 1,214 1,399 Volumes sales Nickel Salts34 tonnes 1,134 1,860 Nickel Metal tonnes 5,721 4,987 Total Nickel sold tNi 6,855 6,847 Nickel Cakes35 tonnes 21 — Cobalt Chloride (CoCl2) 36 tonnes 116 164 Ferric Chloride (FeCl3) 36 tonnes 1,214 1,399 Price and costs Nickel equivalent average basket price37 R/tNi 441,138 458,595 US$/tNi 23,955 28,019 Revenue Rm 3,024 3,140 Adjusted EBITDA21 Rm (1,328) (492) Adjusted EBITDA margin22,23 % (44) (16) Nickel equivalent sustaining cost24 R/tNi 653,246 527,676 US$/tNi 35,474 32,239 Total Capital expenditure Rm 248 90 US$m 13 5 24 Sibanye-Stillwater presents the financial measures “All-in sustaining costs”, “All-in costs”, “All-in sustaining cost per kilogram”, “All-in sustaining cost per ounce”, “All-in sustaining cost per tonne”, “All-in cost per kilogram”, “All-in cost per ounce” and “All-in cost per tonne”, which were introduced during the year ended 31 December 2013 by the World Gold Council (the Council). The Council is a non-profit association of the world’s leading gold mining companies established in 1987 to promote the use of gold from industry, consumers and investors and is not a regulatory organisation. The Council has worked with its member companies to develop a metric that expands on IFRS Accounting Standards measures such as cost of goods sold and currently accepted non-IFRS measures to provide relevant information to investors, governments, local communities and other stakeholders in understanding the economics of gold mining operations related to expenditures, operating performance and the ability to generate cash flow from operations. This is especially true with reference to capital expenditure associated with developing and maintaining gold mines, which has increased significantly in recent years and is reflected in this metric All-in sustaining costs, All-in costs, All-in sustaining cost per kilogram, All-in sustaining cost per ounce, All-in sustaining cost per tonne, All-in cost per kilogram, All-in cost per ounce and All-in cost per tonne metrics are intended to provide additional information only, do not have any standardised meaning prescribed by IFRS Accounting Standards, and should not be considered in isolation or as alternatives to cost of sales, profit before tax, profit for the year, cash from operating activities or any other measure of financial performance presented in accordance with IFRS Accounting Standards. All-in sustaining costs, All-in costs, All-in sustaining cost per kilogram, All-in sustaining cost per ounce, All-in sustaining cost per tonne, All-in cost per kilogram, All-in cost per ounce and All-in cost per tonne as presented in this document may not be comparable to other similarly titled measures of performance of other companies. Other companies may calculate these measures differently as a result of differences in the underlying accounting principles, policies applied and accounting frameworks such as in US GAAP. Differences may also arise related to definitional differences of sustaining versus development capital activities based upon each company’s internal policies All-in costs excludes income tax, costs associated with merger and acquisition activities, working capital, impairments, financing costs, one-time severance charges and items needed to normalise earnings All-in costs is made up of All-in sustaining costs, being the cost to sustain current operations, given as a sub-total in the All-in costs calculation, together with corporate and major capital expenditure growth For a reconciliation of cost of sales, before amortisation and depreciation to All-in costs, see - Overview -Management’s discussion and analysis of the financial statements - 2023 financial performance compared with 2022 - Cost of sales–All-in costs The Nickel equivalent sustaining cost, being the cost to sustain current operations. Nickel equivalent sustaining cost per tonne nickel is calculated by dividing the Nickel equivalent sustaining cost in a period by the total nickel products sold over the same period. Nickel equivalent sustaining cost and Nickel equivalent sustaining costs per tonne are intended to provide additional information only, do not have any standardised meaning prescribed by IFRS Accounting Standards and should not be considered in isolation or as alternatives to cost of sales, profit before tax, profit for the year, cash from operating activities or any other measure of financial performance presented in accordance with IFRS Accounting Standards. Nickel equivalent sustaining cost and Nickel equivalent sustaining costs per tonne as presented in this document may not be comparable to other similarly titled measures of performance of other companies. Other companies may calculate these measures differently as a result of differences in the underlying accounting principles, policies applied and accounting frameworks such as in US GAAP. Differences may also arise related to definitional differences of sustaining versus development capital activities based upon each company’s internal policies. For a reconciliation of cost of sales, before amortisation and depreciation to Nickel equivalent sustaining cost, see - Overview - Management’s discussion and analysis of the financial statements - 2023 financial performance compared with 2022 - Cost of sales - All-in sustaining cost, All-in cost and Nickel equivalent sustaining cost 2023 AUSTRALIAN OPERATIONS Century zinc retreatment operation38 Production Ore mined and processed kt 6,097 Zinc metal produced (payable)39 kt 76 Zinc sold (payable)40 kt 77 Price and costs Average equivalent zinc concentrate price41 R/tZn 31,815 US$/tZn 1,728 Revenue Rm 2,251 Adjusted EBITDA21 Rm (285) Adjusted EBITDA margin22 % (13) All-in sustaining cost24 R/tZn 36,361 US$/tZn 1,975 Total Capital expenditure Rm 165 US$m 9 FOUR-YEAR STATISTICAL REVIEW continued IR - 283

Revenue R million 113,684 138,288 172,194 127,392 (Loss)/profit for the year R million (37,430) 18,980 33,796 30,622 Earnings per share cents (1,334) 651 1,140 1,074 Headline earnings per share cents 63 652 1,272 1,068 Number of shares in issue at end of period 000 2,830,567 2,830,370 2,808,406 2,923,571 Statement of financial position (extract) Cash and cash equivalents R million 25,560 26,076 30,292 20,240 Total assets R million 142,941 166,631 152,994 134,103 Borrowings25 R million 36,618 22,728 20,298 18,383 Total liabilities R million 91,334 75,627 71,649 63,387 Statement of cash flows (extract) Net (decrease)/increase in cash and cash equivalents R million (1,967) (5,328) 9,344 14,969 Other financial data Adjusted EBITDA21 R million 20,556 41,111 68,606 49,385 Net debt/(cash)26 R million 11,918 (5,850) (11,466) (3,087) Net debt/(cash) to adjusted EBITDA ratio 0.58 (0.14) (0.17) (0.06) Net asset value per share R 18.23 32.15 28.96 24.19 Debt to equity27 ratio 1.77 0.83 0.88 0.90 Dividends declared per share ZAR cents 53 260 479 371 Dividend yield28 % 2.1 5.8 9.8 6.2 Average exchange rate29 R/US$ 18.42 16.37 14.79 16.46 Closing exchange rate30 R/US$ 18.57 17.03 15.94 14.69 Share data Market capitalisation at year-end R billion 70.5 126.6 137.9 175.4 US$ billion 3.8 7.5 8.8 11.6 Average daily volume of shares traded ’000 13,533 12,162 14,175 19,488 Ordinary share price – high R/share 51.68 75.40 74.67 60.4 Ordinary share price – low R/share 18.7 35.74 45.58 16.53 Ordinary share price at year end R/share 24.90 44.72 49.1 60 GROUP FINANCIAL STATISTICS Income statement (extract) 2023 2022 2021 2020 25 This represents total borrowings as per the consolidated financial statements. See the Consolidated financial statements – Notes to the consolidated financial statements – Note 28: Borrowings 26 Net (cash)/debt represents borrowings and bank overdraft less cash and cash equivalents. Borrowings are only those borrowings that have recourse to Sibanye-Stillwater, and, therefore, exclude the Burnstone Debt. Net (cash)/debt excludes cash of Burnstone 27 The debt to equity ratio is a debt ratio used to measure the Group’s financial leverage and is calculated by dividing total liabilities by equity 28 The dividend yield is a financial ratio that indicates how much a company pays out in dividends each year relative to its share price. Dividend yield is represented as a percentage and is calculated by dividing the dividends per share declared in a given year by the ordinary share price at the end of the year 29 The average exchange rate during the relevant period as reported by IRESS. Based on the average share price of R48.83 for the year ended 31 December 2022 30 The closing exchange rate at period end. The closing exchange rate on 14 April 2023, as reported by IRESS, was R18.08/US$. Fluctuations in the exchange rate between the rand and the US dollar will affect the US dollar equivalent of the price of the ordinary shares on the JSE, which may affect the market price of the American Depositary Receipts (ADRs) on the NYSE. These fluctuations will also affect the US dollar amounts received by owners of ADRs on the conversion of any dividends paid in rand on the ordinary shares 31 Current tax and royalties for the Group includes current tax on Group Corporate and Reconciling items of R34 million (2022: R4 million, 2021: R70 million, 2020: R45 million and 2019: Rnil) 32 The SA PGM operations excludes the production and costs associated with purchase of concentrate (PoC) from third parties at the Marikana operations from 1 January 2020 33 Amounts included since effective date of the acquisition on 4 February 2022 34 Nickel salts consist of anhydrous nickel, nickel chloride low sodium, nickel chloride standard, nickel carbonate and nickel chloride solution 35 Nickel cakes occur during the processing of nickel matte and are recycled back into the nickel refining process 36 Cobalt chloride and ferric chloride are obtained from nickel matte through a different refining process on an order basis 37 The Nickel equivalent average basket price per tonne is the total nickel revenue adjusted for other income - non-product sales divided by the total nickel equivalent tonnes sold 38 Century is a leading tailings management and rehabilitation company that currently owns and operates the Century zinc tailings retreatment operation in Queensland, Australia. Century was acquired by the Group on 22 February 2023 39 Zinc metal produced (payable) is the payable quantity of zinc metal produced after applying smelter content deductions 40 Zinc sold (payable) is the payable quantity of zinc metal sold after applying smelter content deductions 41 Average equivalent zinc concentrate price is the total zinc sales revenue recognised at the price expected to be received excluding the fair value adjustments divided by the payable zinc metal sold FOUR-YEAR STATISTICAL REVIEW continued IR - 284

STATEMENT OF ASSURANCE INDEPENDENT ASSURANCE PRACTITIONER’S LIMITED ASSURANCE REPORT ON SELECTED KEY PERFORMANCE INDICATORS ––––––––––––––––––––––––––––––––––––––––––––––––––––––––––––––––––––––––––––––––––––––––––––––––––––––––––––––––––––––––––––––––––––––– To the Directors of Sibanye-Stillwater Limited We have undertaken a limited assurance engagement on selected key performance indicators (KPIs) , as described below, and presented in the Sibanye-Stillwater Limited (“Sibanye-Stillwater” or “the Group”) Integrated Report 2023 for the year ended 31 December 2023 (“the Report”). This engagement was conducted by a multidisciplinary team including health, safety, social, environmental and assurance specialists with relevant experience in sustainability reporting. SUBJECT MATTER ––––––––––––––––––––––––––––––––––––––––––––––––––––––––––––––––––––––––––––––––––––––––––––––––––––––––––––––––––––––––––––––––––––––– We have been engaged to provide a limited assurance conclusion in our report on the following selected KPIs, listed on page 281 of the Report. The selected KPIs described below have been prepared in accordance with the Sibanye-Stillwater’s reporting criteria included in the Sustainability Content Index supplementary disclosure document referred to in the Reporting Frameworks and Guidance section on page 2 of the Report (“the Reporting Criteria”). Selected KPI Unit of measure Boundary Environment Total CO2e emissions: Scope 1 and 2 ’000 tCO2e Group excluding the Australian (AUS) region Total CO2e emissions: Scope 31 ’000 tCO2e Group excluding the AUS region GHG emissions intensity (Scope 1 and 2) tCO2e/oz Group excluding the AUS region Electricity consumed TWh Group excluding the AUS region Diesel energy TJ Group excluding the AUS region Number of environmental incidents: Level 3 and higher Number Group excluding the AUS region Total water withdrawn ’000 ML Group excluding the AUS region SO2 emissions Tonnes SO2 United States of America (US) region and South African (SA) PGM operations Health Number of new and resubmitted silicosis cases reported Number of cases SA region Number of new and resubmitted noise induced hearing loss (NIHL) cases reported Number of cases Group excluding the AUS region Number of new and resubmitted chronic obstructive pulmonary diseases (COPD) cases reported Number of cases SA region Number of new and retreatment cardiorespiratory tuberculosis (TB) cases reported Number of cases SA region Number of new and relapsed tuberculosis (TB) incidence cases reported Number of cases SA region Highly-active antiretroviral treatment (HAART) patients on treatment and in active employment2 Number of patients SA region Safety Total recordable injury frequency rate (TRIFR)3 Rate Group excluding the AUS region Number of fatalities Number Group excluding the AUS region Social Total socioeconomic development (SED) spend R million Group excluding the AUS region Total approved social and labour plan (SLP) project spend R million SA region Historically disadvantaged persons (HDP) representation in SA region • top management (Board) % • executive management % • senior management % • middle management % • junior management % Total Black Economic Empowerment procurement spend R million SA region Women in the workforce/ Women in Mining (WiM) % Group excluding the AUS region 1Scope 3 categories included for assurance: Category 1 (Purchased Goods and Services), Category 2 (Capital Goods), Category 5 (Waste Generated in Operations), Category 6 (Business Travel), Category 7 (Employee Commuting), Category 9 (Downstream Transportation and Distribution), Category 13 (Downstream Leased Assets) 2 HAART statistics only include employees on medical aid 3 Rate per million hours worked: total number of injuries x 1000,000 hours worked DIRECTORS RESPONSIBILITIES –––––––––––––––––––––––––––––––––––––––––––––––––––––––––––––––––– The Directors are responsible for the selection, preparation and presentation of the selected KPIs in accordance with the Sibanye- Stillwater reporting criteria. This responsibility includes: • the identification of stakeholders and stakeholder requirements, material matters, commitments with respect to sustainability performance • the design, implementation and maintenance of internal controls relevant to the preparation of the Report that is free from material misstatement, whether due to fraud or error The Directors are also responsible for determining the appropriateness of the measurement and reporting criteria in view of the intended users of the selected KPIs and for ensuring that those criteria are publicly available to the Report users. IR - 285

INHERENT LIMITATIONS –––––––––––––––––––––––––––––––––––––––––––––––––––––––––––––––––– The Greenhouse Gas (GHG) emission quantification is subject to inherent uncertainty because of incomplete scientific knowledge used to determine emissions factors and the values needed to combine emissions of different gases. OUR INDEPENDENCE AND QUALITY MANAGEMENT –––––––––––––––––––––––––––––––––––––––––––––––––––––––––––––––––– We have complied with the independence and other ethical requirements of the Code of Professional Conduct for Registered Auditors issued by the Independent Regulatory Board for Auditors (IRBA Code), which is founded on fundamental principles of integrity, objectivity, professional competence and due care, confidentiality and professional behaviour. The IRBA Code is consistent with the corresponding sections of the International Ethics Standards Board for Accountants’ International Code of Ethics for Professional Accountants (including International Independence Standards). KPMG Inc. applies the International Standard on Quality Management 1, which requires the firm to design, implement and operate a system of quality management including policies or procedures regarding compliance with ethical requirements, professional standards and applicable legal and regulatory requirements. PRACTITIONER’S RESPONSIBILITY –––––––––––––––––––––––––––––––––––––––––––––––––––––––––––––––––– Our responsibility is to express a limited assurance conclusion on the selected KPIs as set out in the Subject Matter paragraph, based on the procedures we have performed and the evidence we have obtained. We conducted our assurance engagement in accordance with the International Standard on Assurance Engagements (ISAE) 3000 (Revised), Assurance Engagements other than Audits or Reviews of Historical Financial Information, and in respect to the greenhouse gas emissions, in accordance with the International Standard on Assurance Engagements 3410 (ISAE 3410), Assurance Engagements on Greenhouse Gas Statements, issued by the International Auditing and Assurance Standards Board. These Standards require that we plan and perform our engagement to obtain limited assurance about whether the selected KPIs are free from material misstatement. A limited assurance engagement undertaken in accordance with ISAE 3000 (Revised) and ISAE 3410 involves assessing the suitability in the circumstances of Sibanye-Stillwater’s use of its reporting criteria as the basis of preparation for the selected KPIs, assessing the risks of material misstatement of the selected KPIs whether due to fraud or error, responding to the assessed risks as necessary in the circumstances, and evaluating the overall presentation of the selected KPIs. A limited assurance engagement is substantially less in scope than a reasonable assurance engagement in relation to both risk assessment procedures, including an understanding of internal control, and the procedures performed in response to the assessed risks. The procedures we performed were based on our professional judgement and included inquiries, observation of processes followed, inspection of documents, analytical procedures, evaluating the appropriateness of quantification methods and reporting policies, and agreeing or reconciling with underlying records. Given the circumstances of the engagement, in performing the procedures listed above we: • Interviewed management and senior executives to obtain an understanding of the internal control environment, risk assessment process and information systems relevant to the sustainability reporting process; • Inspected documentation to corroborate the statements of management and senior executives in our interviews; • Tested the processes and systems to generate, collate, aggregate, monitor and report the selected KPIs; • Inspected supporting documentation on a sample basis and performed analytical procedures to evaluate the data generation and reporting processes against the Reporting Criteria; • Evaluated the reasonableness and appropriateness of significant estimates and judgements made by the Directors in the preparation of the selected KPIs; • Evaluated whether the selected KPIs presented in the Report is consistent with our overall knowledge and experience of sustainability management and performance at Sibanye- Stillwater. The procedures performed in a limited assurance engagement vary in nature and timing, and are less in extent than for a reasonable assurance engagement. As a result, the level of assurance obtained in a limited assurance engagement is substantially lower than the assurance that would have been obtained had we performed a reasonable assurance engagement. Accordingly, we do not express a reasonable assurance opinion about whether the Sibanye-Stillwater’s selected KPIs have been prepared, in all material respects, in accordance with the accompanying Reporting Criteria. LIMITED ASSURANCE CONCLUSION –––––––––––––––––––––––––––––––––––––––––––––––––––––––––––––––––– Based on the procedures we have performed and the evidence we have obtained, and subject to the inherent limitations outlined elsewhere in this report, nothing has come to our attention that causes us to believe that the selected KPIs as set out in the Subject Matter paragraph above for the year ended 31 December 2023 are not prepared, in all material respects, in accordance with the Sibanye-Stillwater Reporting Criteria. OTHER MATTERS –––––––––––––––––––––––––––––––––––––––––––––––––––––––––––––––––– Assurance procedures were not performed by KPMG on the selected KPIs included in the previous Integrated Report. The selected KPIs relating to prior reporting periods have been subject to assurance by a different assurance provider.s. The maintenance and integrity of Sibanye-Stillwater’s website is the responsibility of Sibanye-Stillwater’s management. Our procedures did not involve consideration of these matters and accordingly we accept no responsibility for any changes to either the information in the Report or our independent assurance report that may have
occurred since the initial date of presentation on Sibanye- Stillwater’s website. RESTRICTION OF LIABILITY –––––––––––––––––––––––––––––––––––––––––––––––––––––––––––––––––– Our work has been undertaken to enable us to express a limited assurance conclusion on the selected KPIs to the Directors of the Sibanye-Stillwater in accordance with the terms of our engagement, and for no other purpose. We do not accept or assume liability to any party other than Sibanye-Stillwater, for our work, for this report, or for the conclusion we have reached. /s/ KPMG Inc. Registered Auditor Per Coenie Basson Chartered Accountant (SA) Registered Auditor Director 26 April 2024 STATEMENT OF ASSURANCE continued IR - 286 KPMG Crescent 85 Empire Road Parktown Johannesburg 2193

OUR MATERIAL MATTERS – DETERMINATION, DEFINITIONS AND REFERENCES OUR PROCESS OF DETERMINING MATERIAL ISSUES ––––––––––––––––––––––––––––––––––––––––––––––––––––––––––––––––––––––––––––––––––––––––––––––––––––––––––––––––––––––––––––––––––––––– In support of the disclosure on page 3 about Materiality and our material matters for this Integrated report, please see the process followed in determining the material matters, followed by the more detailed description of each element of the process: OUR PROCESS OF DETERMINING MATERIAL ISSUES STRATEGIC FOCUS The starting point to our workshop is reflecting on our purpose, vision, values, and strategy. We considered materiality against our three-dimensional strategy, following the changing context of business, stakeholders’ feedback and emerging trends on the global front. DEFINING MATERIALITY The double materiality lens was adopted during the workshop. Materiality relevance from the Group’s financial materiality level was adopted for the financial materiality considerations, as per the IFRS S1 Practice Statement 2 (see Annual financial report, note 1.2, available at www.sibanyestillwater.com/news-investors/reports/annual). The global macro-economic environment, the sector and the various ecosystems making up the value-chain of economies were discussed. The enterprise value lens was applied in considering the positive and negative impacts of the Group on the economy, society and the environment. STAKEHOLDERS External stakeholder perspectives and peer group analysis were used as validation processes to material matters. ESG analysts’ reviews, the external media analysis, analysts’ research notes and investor feedback were also considered. The workshop also considered the ongoing engagement by key internal individuals (represented in the workshops that Sibanye-Stillwater has throughout the year) with multiple stakeholders inclusive of customers, and host communities. RISKS CONSIDERATION The Group and regional risk registers and risk movements from the previous year were discussed in the context of material matters. The Group’s risk management thresholds were considered as part of the review of the material matters. VALUE DRIVER ALIGNMENT AND RANKING The value drivers and the business model were considered as the assessment of the material matters were refined. Relevant internal representatives, who liaise with all stakeholders on a regular basis participated in the workshop and scoring. They include representatives from the Group and the regions in the form of the C-suite, senior executives, and operational and functional specialists. The material matters were listed and scored according to their expected financial impact on Sibanye-Stillwater and also by the expected external impact by Sibanye-Stillwater on the economies of the countries in which we operate, as well as the societal and environmental impacts. IR - 287

MATERIAL ISSUES – DESCRIPTION AND REFERENCES WITHIN THE REPORT AND SUITE OF REPORTS 1 Profitability The global macro-economic environment remains challenging. We continue to assess the positioning of our operations for optimal performance and sustainability through the cycle. We are mindful of the commercial environment, where necessary restructuring has been considered and right-sizing of high cost and underperforming operations will ensure we remain sustainable at current precious metal prices. The profitability of the Group and achievement our long-term vision are affected by various factors: inflationary pressures, rising expectations from stakeholders, as well as the external macroeconomic grey elephants. See Chief Financial Officer’s report, pages 90, 91 and 93. Also see the Group Annual Financial report www.sibanyestillwater.co m/news-investors/reports/ annual/ Strategic essential: Maintaining a profitable business and optimising capital allocation 2 Safety and health Underground mining involves the management of serious risk to life and health: falling ground, large vehicles, dangerous equipment, and the like. It is crucial that we focus on real risk reduction and blocking the path to death. The Zero harm framework has a risk approach that includes institutionalising our controls, behaviours and management routines. Part of having safety as a material matter is creating a psychologically safe working environment, with due consideration being given to mental health, and to occupational health and wellbeing. Indicators assured: number of fatalities; total recordable injury frequency rate, page 285. See Continuous Safe production, page 125 and Health, wellbeing and occupational hygiene, page 136 Our strategic foundation Strategic essential: Ensuring safety and wellbeing 3 Licence to operate Without a licence to operate, we cannot undertake our business activities as a multinational mining Group. This material matter refers to regulatory compliance with frameworks (and other regulatory obligations) as well as our social licence. We operate within complex regulatory environments across geographies, and we must keep abreast of dynamic social concerns and changes in the regulatory landscape. Indicators assured: total approved social and labour plan project spend, total B-BBEE procurement spend, page 285. See Corporate governance page 32, see accountability, governance and assurance information on pages 126, 137, 150, 188, and 213 Strategic essential: Prospering in every region in which we operate 4 Capital allocation Our capital allocation framework remains our guide for growth and diversification opportunities. Maintaining our capital discipline in weaker market conditions requires us to be prudent with capital investments. Sound financial decision-making structures and mechanisms are essential for the Group to manage costs and ensure long-term sustainability. See Chief Financial Officer’s report, page 92 and 94 Strategic essential: Maintaining a profitable business and optimising capital allocation 5 Energy supply and security Our dependence on energy poses a risk to the sustainability of our daily operations. In South Africa, our reliance on Eskom and their carbon intensive electricity is a growing risk. In 2023, Sibanye-Stillwater continued to invest in renewable projects, fulfilling 45% of our long-term renewable energy requirements in South Africa. Self-generating options are being investigated in other regions. Indicators assured: electricity consumed, diesel energy, total water withdrawn, page 285. See Minimising our environmental impact, page 193 and Managing our risks and opportunities within an external environment pages 58 Strategic essential: ESG embedded as the way we do business 6 Sociopolitical instability With Sibanye-Stillwater’s growing global footprint, we are increasingly exposed to sociopolitical risks, some of which are caused by geopolitical tensions. Prolonged poor economic performance and poor service delivery exacerbate instability in South Africa. The reconfiguration of France’s political scene has seen political instability. The United States will spend the coming months focused on another divisive election, with political turmoil being the possible result. Sibanye-Stillwater has a positive role to play (articulated in our vision as shared value), whereby we are dedicated to being part of the solution, by contributing to industrial growth and socioeconomic recovery that is fair and just for society and for the environment. Indicators assured: total socioeconomic development (SED) spend, total approved social and labour plan project spend, total B-BBEE procurement spend, page 285. See Socioeconomic development, page 214, External environment for our business and operations, page 40, Managing our risks and opportunities within the external environment, page 58 and page 61 Strategic essential: Prospering in every region in which we operate 7 Macroeconomic and geopolitical volatility We are part of a complex value-chain that spans geographies (e.g. geopolitical volatility in Eastern Europe leads to fluctuations in commodity prices.) We are also vulnerable to interruptions in our supply chain, perhaps caused by geopolitical ructions. Demand for PGMs is dependent on industry growth and automotive manufacturing. Therefore, it is important to build resilience across our operations, our communities, and our supply chains. See External environment for our business and operations page 38 Strategic differentiator: Building a pandemic resilient ecosystem Material issue For more information Strategic essentials and differentiators MATERIAL MATTERS – DETERMINATION, DEFINITIONS AND REFERENCES continued IR - 288

8 Climate transitional risk In 2023, we commissioned, and cooperated fully with, a study to analyse our climate transition risks and to quantify the business impacts associated with the transition to a lower carbon economy. Six transitional risk scenarios were evaluated: liability, technology, quantity demanded, investors, carbon policy and pricing impacts. The transition may entail higher borrowing costs, due to Sibanye-Stillwater being seen as belonging to a high- emitting industry. Carbon emissions related costs, e.g. carbon tax, are our most significant transitional costs. See Minimising our environmental impact, page 190 and Managing our risks and opportunities within the external environment, page 60 Strategic essential: ESG embedded as the way we do business 9 Climate physical risk Our study on climate physical risk involved modelling of climate-related impacts, as per seven perils: coastal flood, freeze, riverine flood, temperate windstorm, tropical wind storm, drought and heatwave. All operational assets were assessed against climate scenarios. For the SA gold operations temperate windstorm is the main risk driver of property damage and cost increases. For the SA PGM operations, drought is the main driver of the risk of increases in business interruption, with significant contributions from heatwave and riverine flood. For the US operations, freeze is the main risk driver of property and business interruption, although it decreases over time. The impacts of riverine flooding and temperate windstorm increase over time for our European operations. For the Australian operations, drought and heatwaves are the main drivers of business interruption, increasing over time. The Australian and US operations experienced flooding events before which evidences the increasing volatility of unexpected climate change events. The US operation's risk driver of Freeze risk which is a precursor to flood events. See Minimising our environmental impact, page 190 and Managing our risks and opportunities within the external environment, page 59 Strategic essential: ESG embedded as the way we do business 10 Water management Water is a precious shared resource. With the effects of climate change increasing, the frequency and severity of droughts and floods will impact water as a resource. Water management is performed at operational level, where the different water footprints and risks at each region require their own unique approach and mitigation measures. Our SA PGM operations are located in a water stress region, and our SA gold operations in a water rich location. The US and EU operations are also in water-rich locations, with water quality the primary factor. Indicators assured: electricity consumed, diesel energy, total water withdrawn, page 285. See Minimising our environmental impact, page 199 Strategic essential: ESG embedded as the way we do business 11 Culture and values A values-based culture is one in which rules and standards apply to all, and wherein individuals feel bound to act in the interests of the organisation and its vision of shared value. Achieving a values-based culture through aligned leadership and trust has various knock-on benefits: enhanced compliance in safety and risk; retaining top talent; better alignment to the growing demands of ESG; and the like. See Empowering our workforce, page151 Our strategic foundation 12 Innovation and digital evolution As a digital-first organisation, Sibanye-Stillwater aims to uphold global best practice in digital technology adoption, while mitigating against ICT risks. This material matter is about the need to stay competitive and to reshape the way we work if needs be, as reflected in the strategic differentiator Inclusive, diverse and bionic. Research and development remains a priority. See Harnessing innovation, page 171 Our strategic foundation 13 Talent management and core skills The deficiency of high-end mining skills impacts our ability to optimise efficiency. Talent management is no longer just about enablement, it, it is a value driver. Our growth strategy is constrained by a highly competitive market for technical skills and by the difficulty of attracting and retaining key talent. Given that our mines are mostly in remote locations makes it harder to attract talent. Further, young people are not always drawn to our industry. Indicators assured: total SED spend (including HRD), page 285. See Empowering our workforce, page 154 and 160 Strategic differentiator: Prospering in every region in which we operate 14 Diversity and inclusion Diversity goes beyond gender and race; it is also about attitudes, beliefs and experiences. Political and cultural shifts across the world challenges us to be more comfortable and tolerant about difference. Women remain underrepresented as employees for Sibanye- Stillwater; we have various programmes to address this issue. Our strategic differentiator Inclusive, diverse and bionic, expresses our commitment to embrace a culture of inclusivity and diversity in all its forms. Indicators assured: HDP representation: top, executive, senior, middle and junior management, and women in mining, page 285. See Empowering our workforce, pages 148 and 155 Strategic differentiator: Inclusive, diverse and bionic Material issue For more information Strategic essentials and differentiators Also refer to the Chairman and Chief Executive Officer’s review, page 13 and the Social, ethics and sustainability committee: Chairman’s 2023 report, page 181 MATERIAL MATTERS – DETERMINATION, DEFINITIONS AND REFERENCES continued IR - 289

OUR SHARED VALUE IN NUMBERS Leaves of the Umdoni tree Fruits of the Umdoni tree Represents all our stakeholders Signifying the shared value to our stakeholders Unit 2013 2022 2023 2023 vs 2022 % change 2023 vs 2013 % change Cumulative (11 years) Employees and organised labour Employees including contractors Number 36,274 84,481 82,788 (2) % 128 % 82,788 Salaries and benefits Rbn 6.2 26.5 30.6 15 % 397 % 188.8 US$bn 0.6 1.6 1.7 2 % 159 % 12.8 Average salaries and benefits per employee R 169,708 314,201 369,504 18 % 118 % US$ 17,678 19,194 20,060 5 % 13 % Communities Invested in socioeconomic development and CSI Rbn 1.0 2.4 2.7 12 % 156 % 16.9 US$bn 0.1 0.1 0.1 — % 33 % 1.2 Government and regulators Taxes and royalties paid1 Rbn 0.6 10.7 4.1 (61) % 646 % 47.8 US$bn 0.1 0.7 0.2 (66) % 289 % 3.2 Shareholders Dividends and share buybacks Rbn 0.3 9.2 5.0 (46) % 1,722 % 46.0 US$bn 0.03 0.6 0.3 (52) % 849 % 3.0 Suppliers Black economic empowerment (BEE) procurement - specific to SA region Rbn 2.9 21.4 25.0 17 % 775 % 131.4 US$bn 0.30 1.3 1.4 4 % 356 % 8.8 Customers Green revenue factor % — 77 68 (12) % 100 % 68 % Environment Water used (from 2015 to 2023) 000Ml 42.0 39.4 52.1 32 % 24 % 436.3 Water use intensity (from 2015 to 2023) kl/t treated 2.09 1.02 1.26 24 % (40) % Company Total capital expenditure/investment Rbn 2.9 15.9 22.1 39 % 661 % 94.9 US$bn 0.3 1.0 1.2 23 % 297 % 6.3 Exchange rate* R/US$ 9.60 16.37 18.42 13 % 92 % 1 Taxes and royalties paid as per the consolidated statement of cash flows in the Group Annual financial report IR - 290 36,274 employees incl. contractors R6.16 billion paid in salaries and benefits R1.05 billion invested in socioeconomic development and CSI R554 million taxes and royalties1 R316 million invested in training and development 82,788 employees incl. contractors R30.6 billion paid in salaries and benefits R2.7 billion invested in socioeconomic development and CSI R4.1 billion taxes and royalties1 R1 billion invested in training and development ~R1.1 billion paid over the last two years (2022 & 2023) to over 65,000 beneficiaries in the form of dividends and other employee share option scheme payments 20232013

SHAREHOLDER INFORMATION SHARE INFORMATION Sector Resources Issued share capital at 31 December 2023 2,830,567,264 at 31 December 2022 2,830,370,251 at 31 December 2021 2,808,406,269 JSE Ticker: SSW Market capitalisation at 31 March 2024 R61.4 billion at 31 December 2023 R70.5 billion at 31 December 2022 R126.6 billion at 31 December 2021 R137.9 billion 12-month average daily share trading volumes year ended 31 December 2023 14,030,137 year ended 31 December 2022 12,055,276 year ended 31 December 2021 14,175,442 Share price statistics 12-month low and high for 2023 Low: R18.70 High: R51.68 12-month low and high for 2022 Low: R35.74 High: R75.40 12-month low and high for 2021 Low: R45.58 High: R74.67 closing price as at 31 December 2023 R24.90 closing price as at 31 December 2022 R44.72 closing price as at 31 December 2021 R49.10 NYSE Ticker: SBSW Market capitalisation at 31 March 2024 US$3.3 billion at 31 December 2023 US$3.8 billion at 31 December 2022 US$7.5 billion at 31 December 2021 US$8.8 billion 12-month average daily share trading volumes on the NYSE and other US platforms year ended 31 December 2023 4,454,107 year ended 31 December 2022 3,690,141 year ended 31 December 2021 2,848,586 Share price statistics 12-month low and high for 2023 Low US$4.27 High US$12.31 12-month low and high for 2022 Low US$8.16 High US$20.32 12-month low and high for 2021 Low: US$11.51 High: US$20.56 closing price as at 31 December 2023 US$5.43 closing price as at 31 December 2022 US$10.66 closing price as at 31 December 2021 US$12.54 Free float1 100% ADS ratio 1 ADS:4 ordinary shares ADSs outstanding 31 December 2023 808,627,726 31 December 2022 529,817,698 31 December 2021 395,607,358 1 Excluding directors, prescribed officers and their relations, as well as the employee share trust IR - 291

Ownership summary at 31 December 2023 – top 10 shareholders Rank Investor Current combined holding of shares in issue % of shares in issue 1 Public Investment Corporation (PIC)1 488,960,260 17.27 2 Allan Gray Proprietary Limited1 181,546,600 6.41 3 Lingotto Investment Management, LLP1 157,104,510 5.55 4 BlackRock Inc 132,257,343 4.67 5 The Vanguard Group Inc 116,255,464 4.11 6 Barrow Hanley Mewhinney & Strauss LLC 56,126,106 1.98 7 State Street Global Advisors Ltd 55,458,376 1.96 8 Dimensional Fund Advisors 52,501,434 1.85 9 GIC Asset Management Pte Ltd 48,984,417 1.73 10 Grantham Mayo Van Otterloo & Co LLC 31,142,149 1.10 1 These are major shareholders in line with the JSE listings requirements 8.63(e) Registered shareholder spread at 31 December 2023 Number of holders % of total shareholders Number of shares2 % of shares in issue1,3 1-1,000 shares 41,412 74.23 7,861,549 0.28 1,001-10,000 shares 11,419 20.47 36,335,999 1.28 10,001-100,000 shares 2,169 3.89 63,806,307 2.25 100,001-1,000,000 shares 618 1.11 196,112,499 6.93 1,000,001 shares and above 166 0.30 2,526,450,910 89.26 Total 55,784 100.00 2,830,567,264 100.00 1 Figures may not add due to rounding 2 As of 28 March 2024, the issued share capital of Sibanye-Stillwater consisted of 2,830,567,264 ordinary shares 3 To our knowledge: (1) Sibanye-Stillwater is not directly or indirectly owned or controlled (a) by another entity or (b) by any foreign government; and (2) there are no arrangements the operation of which may at a subsequent date result in a change in control of Sibanye-Stillwater. To the knowledge of Sibanye-Stillwater’s management, there is no controlling shareholder of Sibanye-Stillwater Public and non-public shareholdings at 31 December 2023 Shareholder type Number of holders % of total shareholders Number of shares % of shares in issue Non-public shareholders 21 0.04 26,927,419 0.95 Directors and associates 10 0.02 5,431,869 0.19 Prescribed Officers and associates 5 0.01 2,261,795 0.08 Share trust1 6 0.01 19,233,755 0.68 Public shareholders 55,763 99.96 2,803,639,845 99.05 Total 55,784 100.00 2,830,567,264 100 1 Included in the number of non-public shareholders for the Share trust are trustees who are beneficiaries of this trust Foreign custodian holdings of 5% or more at 31 December 2023 Number of shares % of shares in issue Bank of New York Mellon (ADS programme sponsor) 808,627,726 28.57 State Street Bank & Trust Co. 249,987,825 8.83 JPMorgan Chase & Co. 180,933,255 6.39 SHAREHOLDER INFORMATION continued IR - 292
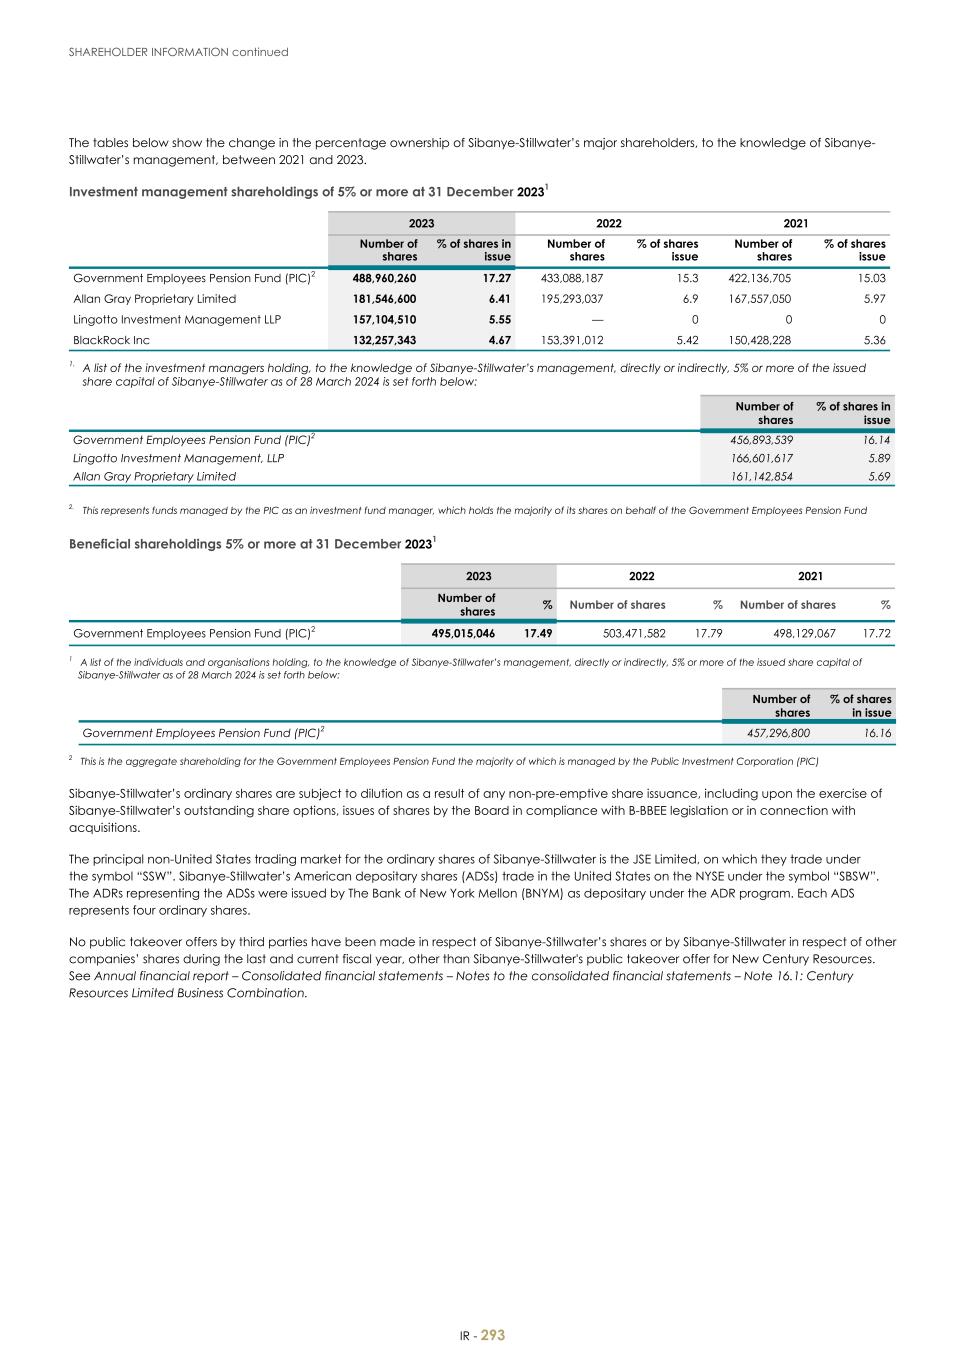
The tables below show the change in the percentage ownership of Sibanye-Stillwater’s major shareholders, to the knowledge of Sibanye- Stillwater’s management, between 2021 and 2023. Investment management shareholdings of 5% or more at 31 December 20231 Government Employees Pension Fund (PIC)2 488,960,260 17.27 433,088,187 15.3 422,136,705 15.03 Allan Gray Proprietary Limited 181,546,600 6.41 195,293,037 6.9 167,557,050 5.97 Lingotto Investment Management LLP 157,104,510 5.55 — 0 0 0 BlackRock Inc 132,257,343 4.67 153,391,012 5.42 150,428,228 5.36 2023 2022 2021 Number of shares % of shares in issue Number of shares % of shares issue Number of shares % of shares issue 1. A list of the investment managers holding, to the knowledge of Sibanye-Stillwater’s management, directly or indirectly, 5% or more of the issued share capital of Sibanye-Stillwater as of 28 March 2024 is set forth below: Number of shares % of shares in issue Government Employees Pension Fund (PIC)2 456,893,539 16.14 Lingotto Investment Management, LLP 166,601,617 5.89 Allan Gray Proprietary Limited 161,142,854 5.69 2. This represents funds managed by the PIC as an investment fund manager, which holds the majority of its shares on behalf of the Government Employees Pension Fund Beneficial shareholdings 5% or more at 31 December 20231 2023 2022 2021 Number of shares % Number of shares % Number of shares % Government Employees Pension Fund (PIC)2 495,015,046 17.49 503,471,582 17.79 498,129,067 17.72 1 A list of the individuals and organisations holding, to the knowledge of Sibanye-Stillwater’s management, directly or indirectly, 5% or more of the issued share capital of Sibanye-Stillwater as of 28 March 2024 is set forth below: Number of shares % of shares in issue Government Employees Pension Fund (PIC)2 457,296,800 16.16 2 This is the aggregate shareholding for the Government Employees Pension Fund the majority of which is managed by the Public Investment Corporation (PIC) Sibanye-Stillwater’s ordinary shares are subject to dilution as a result of any non-pre-emptive share issuance, including upon the exercise of Sibanye-Stillwater’s outstanding share options, issues of shares by the Board in compliance with B-BBEE legislation or in connection with acquisitions. The principal non-United States trading market for the ordinary shares of Sibanye-Stillwater is the JSE Limited, on which they trade under the symbol “SSW”. Sibanye-Stillwater’s American depositary shares (ADSs) trade in the United States on the NYSE under the symbol “SBSW”. The ADRs representing the ADSs were issued by The Bank of New York Mellon (BNYM) as depositary under the ADR program. Each ADS represents four ordinary shares. No public takeover offers by third parties have been made in respect of Sibanye-Stillwater’s shares or by Sibanye-Stillwater in respect of other companies’ shares during the last and current fiscal year, other than Sibanye-Stillwater's public takeover offer for New Century Resources. See Annual financial report – Consolidated financial statements – Notes to the consolidated financial statements – Note 16.1: Century Resources Limited Business Combination. SHAREHOLDER INFORMATION continued IR - 293
DISCLAIMER Forward-looking statements The information in this report may contain forward-looking statements within the meaning of the “safe harbour” provisions of the United States Private Securities Litigation Reform Act of 1995. These forward-looking statements, including, among others, those relating to Sibanye Stillwater Limited’s (Sibanye-Stillwater or the Group) financial positions, business strategies, plans and objectives of management for future operations, are necessarily estimates reflecting the best judgment of the senior management and directors of Sibanye-Stillwater and involve a number of risks and uncertainties that could cause actual results to differ materially from those suggested by the forward-looking statements. As a consequence, these forward-looking statements should be considered in light of various important factors, including those set forth in this report. All statements other than statements of historical facts included in this report may be forward-looking statements. Forward-looking statements also often use words such as “will”, “would”, “expect”, “forecast”, “potential”, “may”, “could”, “believe”, “aim”, “anticipate”, “target”, “estimate” and words of similar meaning. By their nature, forward-looking statements involve risk and uncertainty because they relate to future events and circumstances and should be considered in light of various important factors, including those set forth in this disclaimer. Readers are cautioned not to place undue reliance on such statements. The important factors that could cause Sibanye-Stillwater’s actual results, performance or achievements to differ materially from estimates or projections contained in the forward-looking statements include, without limitation, Sibanye-Stillwater’s future financial position, plans, strategies, objectives, capital expenditures, projected costs and anticipated cost savings, financing plans, debt position and ability to reduce debt leverage; economic, business, political and social conditions in South Africa, Zimbabwe, the United States, Europe and elsewhere; plans and objectives of management for future operations; Sibanye- Stillwater’s ability to obtain the benefits of any streaming arrangements or pipeline financing; the ability of Sibanye-Stillwater to comply with loan and other covenants and restrictions and difficulties in obtaining additional financing or refinancing; Sibanye-Stillwater’s ability to service its bond instruments; changes in assumptions underlying Sibanye-Stillwater’s estimation of its Mineral Resources and Mineral Reserves; any failure of a tailings storage facility; the ability to achieve anticipated efficiencies and other cost savings in connection with, and the ability to successfully integrate, past, ongoing and future acquisitions, as well as at existing operations; the ability of Sibanye-Stillwater to complete any ongoing or future acquisitions; the success of Sibanye-Stillwater’s business strategy and exploration and development activities, including any proposed, anticipated or planned expansions into the battery metals or adjacent sectors and estimations or expectations of enterprise value (including the Rhyolite Ridge project); the ability of Sibanye-Stillwater to comply with requirements that it operate in ways that provide progressive benefits to affected communities; changes in the market price of gold, PGMs, battery metals (e.g., nickel, lithium, copper and zinc) and the cost of power, petroleum fuels, and oil, among other commodities and supply requirements; the occurrence of hazards associated with underground and surface mining; any further downgrade of South Africa’s credit rating; the impact of South Africa's greylisting; a challenge regarding the title to any of Sibanye-Stillwater’s properties by claimants to land under restitution and other legislation; Sibanye-Stillwater’s ability to implement its strategy and any changes thereto; the outcome of legal challenges to the Group’s mining or other land use rights; the outcome of any disputes or litigation; the occurrence of labour disputes, disruptions and industrial actions; the availability, terms and deployment of capital or credit; changes in the imposition of industry standards, regulatory costs and relevant government regulations, particularly environmental, sustainability, tax, health and safety regulations and new legislation affecting water, mining, mineral rights and business ownership, including any interpretation thereof which may be subject to dispute; the outcome and consequence of any potential or pending litigation or regulatory proceedings, including in relation to any environmental, health or safety issues; failure to meet ethical standards, including actual or alleged instances of fraud, bribery or corruption; the effect of climate change or other extreme weather events on Sibanye-Stillwater’s business; the concentration of all final refining activity and a large portion of Sibanye-Stillwater’s PGM sales from mine production in the United States with one entity; the identification of a material weakness in disclosure and internal controls over financial reporting; the effect of US tax reform legislation on Sibanye-Stillwater and its subsidiaries; the effect of South African Exchange Control Regulations on Sibanye-Stillwater’s financial flexibility; operating in new geographies and regulatory environments where Sibanye- Stillwater has no previous experience; power disruptions, constraints and cost increases; supply chain disruptions and shortages and increases in the price of production inputs; the regional concentration of Sibanye-Stillwater’s operations; fluctuations in exchange rates, currency devaluations, inflation and other macro- economic monetary policies; the occurrence of temporary stoppages or precautionary suspension of operations at its mines for safety or environmental incidents (including natural disasters) and unplanned maintenance; Sibanye-Stillwater’s ability to hire and retain senior management and employees with sufficient technical and/or production skills across its global operations necessary to meet its labour recruitment and retention goals, as well as its ability to achieve sufficient representation of historically disadvantaged South Africans in its management positions; failure of Sibanye-Stillwater’s information technology, communications and systems; the adequacy of Sibanye-Stillwater’s insurance coverage; social unrest, sickness or natural or man-made disaster at informal settlements in the vicinity of some of Sibanye-Stillwater’s South African-based operations; and the impact of HIV, tuberculosis and the spread of other contagious diseases, such as the coronavirus disease (COVID-19). Further details of potential risks and uncertainties affecting Sibanye-Stillwater are described in Sibanye-Stillwater’s filings with the Johannesburg Stock Exchange and the United States Securities and Exchange Commission, including the 2023 Integrated Report and the Annual Financial Report for the fiscal year ended 31 December 2023 on Form 20-F filed with the United States Securities and Exchange Commission on 26 April 2024 (SEC File no. 333-234096). These forward-looking statements speak only as of the date of the content. Sibanye-Stillwater expressly disclaims any obligation or undertaking to update or revise any forward-looking statement (except to the extent legally required). These forward-looking statements have not been reviewed or reported on by the Group’s external auditors. Non-IFRS1 measures The information contained in this report may contain certain non-IFRS measures, including, among others, adjusted EBITDA, adjusted EBITDA margin, adjusted free cash flow, AISC, AIC, Nickel equivalent sustaining cost and normalised earnings. These measures may not be comparable to similarly-titled measures used by other companies and are not measures of Sibanye-Stillwater’s financial performance under IFRS Accounting Standards. These measures should not be considered in isolation or as a substitute for measures of performance prepared in accordance with IFRS Accounting Standards. Sibanye-Stillwater is not providing a reconciliation of the forecast non-IFRS financial information presented in this report because it is unable to provide this reconciliation without unreasonable effort. These forecast non-IFRS financial information presented have not been reviewed or reported on by the Group’s external auditors. 1
IFRS refers to International Financial Reporting Standards Accounting Standards (IFRS Accounting Standards) as issued by the International Accounting Standards Board (IASB) Mineral Resources and Mineral Reserves Sibanye-Stillwater’s Mineral Resources and Mineral Reserves are estimates at a particular date, and are affected by fluctuations in mineral prices, the exchange rates, operating costs, mining permits, changes in legislation and operating factors. Sibanye-Stillwater reports its Mineral Resources and Mineral Reserves in accordance with the rules and regulations promulgated by each of the United States Securities and Exchange Commission (SEC) and the JSE at all managed operations, development, and exploration properties. Websites References in this document to information on websites (and/or social media sites) are included as an aid to their location and such information is not incorporated in, and does not form part of, this report. IR - 294

ADMINISTRATIVE AND CORPORATE INFORMATION SIBANYE STILLWATER LIMITED (SIBANYE-STILLWATER) Incorporated in the Republic of South Africa Registration number 2014/243852/06 Share code: SSW and SBSW Issuer code: SSW ISIN: ZAE000259701 LISTINGS JSE: SSW NYSE: SBSW WEBSITE www.sibanyestillwater.com REGISTERED AND CORPORATE OFFICE Constantia Office Park Bridgeview House, Building 11, Ground floor Cnr 14th Avenue & Hendrik Potgieter Road Weltevreden Park 1709 South Africa Private Bag X5 Westonaria 1780 South Africa Tel: +27 11 278 9600 Fax: +27 11 278 9863 COMPANY SECRETARY Lerato Matlosa Email: lerato.matlosa@sibanyestillwater.com DIRECTORS Dr Vincent Maphai* (Chairman) Neal Froneman (CEO) Charl Keyter (CFO) Dr Elaine Dorward-King* Harry Kenyon-Slaney* ^ Jeremiah Vilakazi* Keith Rayner* Nkosemntu Nika* Philippe Boisseau** Richard Menell*# Sindiswa Zilwa* Susan van der Merwe* Timothy Cumming* * Independent non-executive ^ Appointed as lead independent director 1 January 2024 # Resigned as lead independent director 1 January 2024 ** Appointed as independent non-executive director 8 April 2024 INVESTOR ENQUIRIES James Wellsted Executive Vice President: Investor Relations and Corporate Affairs Mobile: +27 83 453 4014 Email: james.wellsted@sibanyestillwater.com or ir@sibanyestillwater.com JSE SPONSOR JP Morgan Equities South Africa Proprietary Limited Registration number 1995/011815/07 1 Fricker Road, Illovo Johannesburg 2196 South Africa Private Bag X9936 Sandton 2146 South Africa AUDITORS Ernst & Young Inc (EY) 102 Rivonia Road Sandton 2196 South Africa Private Bag X14 Sandton 2146 South Africa Tel: +27 11 772 3000 AMERICAN DEPOSITARY RECEIPTS TRANSFER AGENT BNY Mellon Shareowner Correspondence (ADSs) Mailing address of agent: Computershare PO Box 43078 Providence, RI 02940-3078 Overnight/certified/registered delivery: Computershare 150 Royall Street, Suite 101 Canton, MA 02021 US toll free: + 1 888 269 2377 Tel: +1 201 680 6825 Email: shrrelations@cpushareownerservices.com Tatyana Vesselovskaya Relationship Manager - BNY Mellon Depositary Receipts Email: tatyana.vesselovskaya@bnymellon.com TRANSFER SECRETARIES SOUTH AFRICA Computershare Investor Services Proprietary Limited Rosebank Towers 15 Biermann Avenue Rosebank 2196 PO Box 61051 Marshalltown 2107 South Africa Tel: +27 11 370 5000 Fax: +27 11 688 5248 IR - 295


ABOUT OUR FULL SUITE OF REPORTS 2023 OVERVIEW US PGM: 87.8Moz (+4.4%) of 2E Mineral Resources & 26.3Moz (Unchanged) 2E Mineral Reserves SA PGM: 182.8Moz (+3.1%) of Mineral Resources & 28.1Moz (-10.4%) 4E Mineral Reserves SA Gold Operations: 41.2Moz (-23%) Mineral Resources & 10.9Moz (-15.7%) Mineral Reserves Stable long-term outlook at our US PGM operations, with only minor Mineral Resource definition drilling additions. Ongoing restructuring to reduce operating and capital costs to ensure sustainability through a lower palladium price environment. Primarily driven by the inclusion of the Schaapkraal prospecting right at Marikana (+ 8.97Moz 4E Mineral Resources), and the exclusion of the North Hill feasibility study at the 50% owned Mimosa (-1.5Moz Mineral Reserves). Primarily impacted by the closure of Kloof No. 4 shaft (-6.1Moz Mineral Resources and -1.6Moz Mineral Reserves). Lithium: 702kt (+55%) of LCE Mineral Resources & 182kt (-6%) LCE Mineral Reserves Uranium: 59.2Mlb (-11.1%) U3O8 Mineral Resources. Zinc: 3,002 (+257%) Mlb Mineral Resources & 1,726 (+287%) Mlb Mineral Reserves; and Copper: 8,163 (-39.4%) Mlb Mineral Resources Driven by successful exploration at the Keliber project in Finland (+105kt LCE), and an updated Mineral Resource estimate at the Rhyolite Ridge project in Nevada (+145kt LCE). The Cooke dump and the Beisa project at Beatrix are strategic assets providing near-term development options at a time of renewed interest in uranium. Zinc driven by the full acquisition of New Century Resources. The exercise of the Mt Lyell option in Tasmania added 1,609Mlb of contained copper, whilst Aldebaran Resources Ltd. earned 60% into the Altar project, impacting copper Mineral Resources. OUR 2023 REPORTS These reports cover the financial year from 1 January to 31 December 2023* INTEGRATED REPORT NOTICE OF ANNUAL GENERAL MEETING AND SUMMARISED FINANCIALS GROUP ANNUAL FINANCIAL REPORT COMPANY FINANCIAL STATEMENTS MINERAL RESOURCES AND MINERAL RESERVES REPORT About our cover designs: Our strategic differentiator Inclusive, diverse and bionic, is depicted in the cover as a fingerprint, with small markings that signify computer code. As technology becomes ever more capable and powerful, the fear exists of the possible loss of human individuality, the loss of our independent spirit. The design reminds us what this strategic differentiator points to, the potential for humanity to be enhanced through using technology (“bionic”), and the potential for uniqueness and diverse individual identity to find its expression in service to our vision and purpose. We value the contributions of our employees (each having left their unique “fingerprint” on our business) and we honour their commitment to our values, which ripples out, amplifying the Group’s capacity to innovate and evolve. SUPPORTING FACT SHEETS AND SUPPLEMENTARY INFORMATION AVAILABLE ONLINE –––––––––––––––––––––––––––––––––––––––––––––––––––––––––––––––––––––––––––––––––––––––––––––––––––––––––––––––––––––––––––––––––––––– • Group Impact supplement 2023 • Progressing the UN’s SDGs • Environmental incidents in 2023 • Biodiversity management • Social and labour plans (SLPs): Summary of projects • Climate change supplement • Sustainability content index • Tailings management • Care for iMali: Taking care of personal finance • Combating illegal mining • Sibanye-Stillwater’s ICMM self-assessment for 2023 • The Good Neighbor Agreement • Definitions for sustainability/ESG indicators • Application of King IV Principles in 2023 • ESG scorecard for the long term incentive (LTI) awards * This report encompasses data pertaining to the financial year ending on 31 December 2023. As necessary or where pertinent, certain information has been incorporated subsequent to the year’s end

CONTENTS OUR BUSINESS Introduction 3 Corporate governance and regulatory compliance 4 Location of our operations and projects 5 Fundamental notes 7 Group summary of mining properties 8 Auditing and risk 15 Mineral title 16 Exploration 16 Annual planning process 16 Commodity price assumptions 17 Competent persons’ declaration and consent 18 AMERICAS LOCATION 22 US PGM OPERATIONS 23 Stillwater and East Boulder 23 PGM EXPLORATION 31 Marathon 31 BATTERY METALS EXPLORATION 33 LITHIUM 33 Rhyolite Ridge 33 COPPER 35 Altar 35 SOUTHERN AFRICA LOCATION 37 PGM OPERATIONS 38 Marikana 43 Rustenburg 48 Kroondal 52 Mimosa 56 PGM EXPLORATION 59 Akanani 59 Limpopo 60 GOLD OPERATIONS 61 Kloof 63 Driefontein 69 Beatrix 74 Cooke 78 DRDGOLD 81 GOLD DEVELOPMENT 84 Burnstone 84 GOLD EXPLORATION 86 Southern Free State (SOFS) 86 EUROPE LOCATION 88 BATTERY METALS DEVELOPMENT 89 LITHIUM 89 Keliber 89 AUSTRALIA LOCATION 95 ZINC OPERATION 96 Century 96 COPPER EXPLORATION 99 Mt Lyell 99 ANCILLARY INFORMATION Professional Organisations 102 SAMREC Code definitions 103 Glossary of terms 104 Abbreviations 105 Disclaimer 107 Administration and company information 108 RSA Generic Mining Permit Conditions 109 DISCLOSURE PURSUANT TO SK-1300 Summary property disclosure pursuant to Item 1303 under SK-1300 4 Individual property disclosure pursuant to Item 1304 under SK-1300 Stillwater and East Boulder (US PGM) 23 Marikana 43 Rustenburg 48 Kroondal 52 Kloof 63 Driefontein 69 Keliber 89 Internal controls disclosure pursuant to Item 1305 under SK-1300 Americas 25 Southern Africa PGM 40 Southern Africa Gold 62 Europe 90 R&R - 1 1 2 3 4 5 6 Your feedback and suggestions are welcome. Please direct them to James Wellsted, Head of Investor Relations and Corporate Affairs: ir@sibanyestillwater.com www.sibanyestillwater.com

Introduction 3 Corporate governance and regulatory compliance 4 Location of our operations and projects 5 Fundamental notes 7 Group summary of mining properties 8 Auditing and risk 15 Mineral title 16 Exploration 16 Annual planning process 16 Commodity price assumptions 17 Competent persons’ declaration and consent 18 R&R - 2 1 OUR BUSINESS

R&R - 3 INTRODUCTION Sibanye-Stillwater is a multinational mining and metals processing group with a diverse portfolio of operations, projects and investments across five continents. The Group is also one of the foremost global recyclers of PGM autocatalysts and has interests in leading mine tailings retreatment operations. Sibanye-Stillwater is one of the world’s largest primary producers of platinum, palladium, and rhodium and is a top tier gold producer. It also produces and refines iridium and ruthenium, nickel, chrome, copper and cobalt. The Group has recently begun to diversify its asset portfolio into battery metals mining and processing and increase its presence in the circular economy by growing its recycling and tailings reprocessing exposure globally. For more information, see www.sibanyestillwater.com. Our fundamental strategic goal is to ensure that we consistently deliver on our purpose to “safeguard global sustainability through our metals and energy solutions”, while strengthening our position as a leading international mining Group, and ensuring we are true to our vision To be a leader in superior shared value for all stakeholders. Everything we do is driven by our iCARES values of innovation, commitment, accountability, respect, enabling and safety. CASTLE WIND FARM: 89MW RENEWABLE PROJECT UNDER CONSTRUCTION

CORPORATE GOVERNANCE AND REGULATORY COMPLIANCE Sibanye-Stillwater is listed on the JSE and the NYSE and is required to comply with section 12.13 of the JSE Listings Requirements and the requirements of Subpart 1300 of Regulation S-K of the U.S. Securities Act (SK-1300). For the SA region, the managed operations, development and exploration properties, as well as for the non-managed assets (DRDGOLD and Mimosa), the Mineral Resources and Mineral Reserves, and the mineral asset valuations supporting the Mineral Reserve estimates, have been prepared in compliance with the South African Code for Reporting of the Exploration Results, Mineral Resources and Mineral Reserves (SAMREC 2016 edition, including Table 1 and Appendices) and the South African Code for the Reporting of Mineral Asset Valuation (SAMVAL 2016 edition), and all requirements thereof have been complied with. This disclosure is also compliant with JSE Listings Requirements, section 12.13. For the international, non-managed Marathon and Altar exploration properties (all non-material assets), the original estimates were prepared in compliance with the Canadian NI43-101; and for the Century, Rhyolite Ridge and Keliber (Mineral Reserves only) properties in compliance with the Australian JORC Code, which are both Committee for Mineral Reserves International Reporting Standards (CRIRSCO) sister codes of SAMREC and SAMVAL. The Group has verified them for alignment to SAMREC/SAMVAL and SK-1300, and believe that the final estimates would be similar (barring reporting methodology), and that the estimates can be considered current. In complying with the requirements of SK-1300, this document serves to satisfy both the summary disclosure requirements set out under Item 1303 of SK-1300 (Item 1303) and individual material property disclosure requirements set out under Item 1304 of SK-1300 (Item 1304). Section 1 contains all summary disclosure related information set out under Item 1303, while sections 2, 3, 4 and 5 contain individual material property disclosure information required under Item 1304 of SK-1300 for material properties. To ensure alignment and continuity with past disclosures, the Group is also disclosing additional and relevant information on non-material properties in sections 2-5. This report also complies with the internal controls disclosure requirements set out under Item 1305 of SK-1300 (Item 1305). Disclosure pursuant to Item 1305 can be found in sections 2, 3, 4 and 5. MATERIAL PROPERTIES ––––––––––––––––––––––––––––––––––––––––––––––––––––––––––––––– A comprehensive materiality assessment has been conducted on the Group’s mineral properties, which led to the identification of seven material properties which are the key drivers of the Groups’ Mineral Reserves, revenue, profits and strategy. The properties considered material for the purpose of SK-1300 are listed below. PGM ––––––––––––––––––––––––––––––––––––––––––––––––––––––––––––––– • Americas: the US PGM operations consisting of the East Boulder and Stillwater mines • Southern Africa: the Marikana, Rustenburg (SRPM), and Kroondal operations GOLD ––––––––––––––––––––––––––––––––––––––––––––––––––––––––––––––– • Southern Africa: the Kloof and Driefontein operations BATTERY METALS ––––––––––––––––––––––––––––––––––––––––––––––––––––––––––––––– • Finland: the Keliber lithium project In support of the material property disclosure for the 2023 reporting period, updated TRS’s were filed for the US PGM, Kloof, Kroondal and Keliber properties. These filings with the United States Securities and Exchange Commission (SEC) on Form 6-K, were incorporated by reference as exhibits to the 2023 annual report on Form 20-F and can be accessed via EDGAR. Notably, for the Keliber lithium project, Sibanye-Stillwater has filed an updated Technical Report Summary in support of materially increased Mineral Resources assessed in 2023. Sibanye-Stillwater is currently undertaking an assessment of its reported Mineral Reserves at Keliber, and will file a further updated Technical Report Summary as required to support the disclosure of updated Mineral Reserves. The Mineral Reserve estimates contained herein are based on the Technical Report Summary of the Keliber lithium project for the year ended 31 December 2022 (as filed with the SEC on 14 December 2023). R&R - 4 SUNSET OVER THE CENTURY ZINC PROCESSING FACILITY IN NORTH QUEENSLAND

R&R - 5 LOCATION OF OUR OPERATIONS AND PROJECTS A UNIQUE, GREEN PORTFOLIO OF GEOGRAPHICALLY DIVERSIFIED ASSETS AND COMMODITIES AMERICAS ASSETS US PGM OPERATIONS Stillwater (100%)** East Boulder (100%)** PGM EXPLORATION Marathon (13.9%)* LITHIUM EXPLORATION Rhyolite-Ridge (6.91%)* COPPER EXPLORATION Altar (48.61%)* SOUTHERN AFRICAN ASSETS SA PGM OPERATIONS Marikana (80.64%)** Rustenburg (74%)** Kroondal (87%)** Mimosa (50%)* SA PGM EXPLORATION Akanani (80.13%) Limpopo: Voorspoed and Doornvlei (80.64%), and Dwaalkop (40.32%) SA GOLD OPERATIONS Kloof (100%)** Driefontein (100%)** Beatrix (100%) Cooke (76%) DRDGOLD (50.28%)* EUROPEAN ASSETS LITHIUM DEVELOPMENT Keliber (79.82%)** AUSTRALIAN ASSETS ZINC OPERATIONS Century (100%) COPPER EXPLORATION Mount Lyell (100%) SA GOLD DEVELOPMENT Burnstone (100%) SA GOLD EXPLORATION SOFS (Southern Free State project) (100%) SA URANIUM EXPLORATION Beisa (100%) Cooke (76%) CIRCULAR ECONOMY OPERATIONS BATTERY METALS GREEN METALS * Non-managed ** Material property under SK-1300 PGM = platinum group metals, Au = gold, Cu = copper, LCE = lithium carbonate equivalent, Zn = zinc, U3O8 = uranium 1. Verkor’s headquarter is located in Grenoble, but planned plant is to be located in Dunkirk (just north of Sandouville). 2. Mt Lyell is a copper asset in Tasmania which is currently on care and maintenance. A feasibility study, which considers the re-establishment of the operation, is underway.

AMERICAS ––––––––––––––––––––––––––––––––––––––––––––––––––––––––––––––– PGMs Sibanye-Stillwater wholly owns and operates PGM mining, processing and recycling operations located in Montana, US. These assets include the Stillwater mine (inclusive of the Stillwater East mine), the East Boulder mine, two concentrator plants, and PGM mining claims located near the town of Nye. In addition, the Group owns and operates a metallurgical smelter and base metals refinery complex situated in the town of Columbus, Montana, which also serves as the base for our PGM recycling business, which recovers PGMs from used catalytic converters. (Together known as the US PGM operations.) The Group also has a 13.90% equity holding in Generation Mining Ltd., the owners and operator of the Marathon PGM project in Canada. Battery metals The Group holds a 6.91% interest in ioneer Limited, the owner and operator of the Rhyolite Ridge lithium and boron project in Nevada, with an agreement to enter into a 50:50 JV on the project, subject to the fulfilment of certain conditions. The project has entered the final permitting phase, with the final record of decision (ROD) expected in H2 2024. The Group also holds a 40%, non-managed interest in the Altar copper-gold porphyry exploration project in Argentina. SOUTHERN AFRICA ––––––––––––––––––––––––––––––––––––––––––––––––––––––––––––––– PGMs The SA PGM operations are comprised of three managed underground operations (Marikana, Rustenburg and Kroondal). In addition, the PGM segment has a 50% attributable interest in a non-managed, underground operation (Mimosa) in Zimbabwe. The Rustenburg (74% attributable) and Kroondal (87% attributable) operations produce concentrate which is processed in terms of a toll-treatment (Rustenburg) and purchase of concentrate (POC) (Kroondal) agreement by Rustenburg Platinum Mines Pty Ltd, a division of Anglo American Platinum Ltd. The Marikana operation (80.64% attributable) processes its own as well as third-party concentrate via a metallurgical smelter and base metals refinery situated at the operations, and a precious metals refinery complex located in Brakpan, to the east of Johannesburg. Apart from the primary mining operations, significant tailings treatment operations exist: • The Platinum Mile tailings retreatment facility (100% owned and managed) recovers PGMs from historic Rustenburg TSFs as well as live tailings streams from the Rustenburg (Waterval and Retrofit) concentrator plants • The Western Limb tailings retreatment (WLTR) plant recovers PGMs from historic TSFs at the Rustenburg operation • The Bulk tailings treatment (BTT) facility recovers chrome and PGMs from the ETD1 TSF at the Marikana operation • The Eastern tailings treatment project (ETTP) facility recovers chrome and PGMs from live tailings material from the EPL concentrator at the Marikana operation • At the Rustenburg, Kroondal and Marikana operations, chrome concentrate is recovered as a by-product from the UG2 tailings streams The Akanani exploration project (80.13% attributable) is an exploration asset on the northern limb of the Bushveld Igneous Complex (BIC) near the town of Mokopane. The Limpopo exploration project, located approximately 50km southeast of Mokopane, consists of the care and maintenance Baobab operation (80.64% attributable), the Dwaalkop mining right (50:50 JV area with Northam, 40.32% attributable), and the Doornvlei mining right (80.64% attributable). Gold The SA gold operations are made up of four managed, producing, underground and surface operations in South Africa, namely the Kloof (100% attributable), Driefontein (100% attributable) and Cooke (76% attributable) operations in the West Wits region, and Beatrix (100% attributable) operation in the Free State province. Burnstone (100% attributable) is a development project in the Mpumalanga province. In addition, and in support of its gold mining activities, Sibanye-Stillwater owns and manages six metallurgical processing facilities where gold-bearing ore is processed, and gold extracted. Wholly-owned and managed projects in study phase include Bloemhoek and De Bron Merriespruit, which form part of the Southern Free State (SOFS) exploration project. The Group also reports Mineral Resources and Mineral Reserves on an attributable basis for DRDGOLD Limited (DRDGOLD) due to its 50.28% equity interest. DRDGOLD operates the Far West Gold Recoveries (FWGR) and the ERGO Gold Recoveries operations. Green metals Significant quantities of uranium are present in the historic TSFs of the Cooke operation, as well as the Beisa project area, a combined gold and uranium deposit at the Beatrix operation. These are considered exploration projects, even though they occur within existing operational mining right areas. EUROPE ––––––––––––––––––––––––––––––––––––––––––––––––––––––––––––––– Battery metals The Group owns (79.82% attributable) and is developing the Keliber lithium project in Finland. During 2023, construction of the lithium- hydroxide refinery in Kokkola was progressed, and the construction of the concentrator plant near Kaustinen was approved and commenced. Significant exploration activities are also ongoing at the extensive mineral title holdings. AUSTRALIA ––––––––––––––––––––––––––––––––––––––––––––––––––––––––––––––– Green metals During 2023, the Group acquired 100% of New Century Resources Limited (Century, 2022: 19.89% attributable), which operates the largest tailings retreatment operation in Australia, the Century zinc operation in Queensland. With the acquisition of Century, the group also obtained an option to acquire Mt Lyell (under care and maintenance) copper operation in Tasmania from Vedanta Zinc International. a division of Vedanta Resources Ltd. The option was exercised in November 2023, and is currently subject of a feasibility regarding re-opening the operation. LOCATION OF OUR OPERATIONS AND PROJECTS continued R&R - 6

FUNDAMENTAL NOTES 1 This Mineral Resources and Mineral Reserves Report for Sibanye-Stillwater covers a full description of all of the Group’s mineral property assets, as at 31 December 2023. 2 The Mineral Resources and Mineral Reserves year-on-year reconciliation may be impacted by variations in commodity prices, currency exchange rates, legislation, permitting changes, costs and operating performance. 3 All stated Mineral Resource and Mineral Reserve estimates are net of 12 month’s production depletion since 31 December 2022. The depletion applied to the managed operations includes the actual measured depletion up until end of September 2023, while the remaining depletion is estimated up to 31 December 2023. 4 Mineral Resource and Mineral Reserve price assumptions for non-managed properties may vary from those used for the managed operations. In those cases, the reader is directed to the notes provided below the classification tables for detailed information. 5 SA PGM operations Mineral Resource and Mineral Reserve reporting accounts for four elements (4E) of the basket of PGMs (platinum, palladium, rhodium and gold), while the US PGM operations Mineral Resource and Mineral Reserve reporting accounts for two elements (2E) of PGMs ( palladium and platinum). Other associated precious metals – such as iridium, ruthenium (SA PGM), gold and silver (US PGM) – are generally not material to the estimations or calculations. The base metals (copper, nickel, cobalt and chromium) are also extracted as by-products in conjunction with these PGMs. These are not reported on individually, but their average concentrations in the various ores are provided as guidelines. Mineral Resource and Mineral Reserve economic calculations are based on a basket price, taking into consideration all metals extracted and recovered. 6 In line with industry practice, lithium (Li) and lithium oxide (Li2O) Mineral Resources and Mineral Reserves total metal content is quoted in lithium carbonate (Li2CO3) equivalent (LCE), which is one of the final products produced in the lithium mining value chain. LCE is derived from in-situ Li content by multiplying by a factor of 5.323, and from Li2O by multiplying by a factor of 2.473. Lithium Hydroxide Monohydrate (LiOH.H2O) can be derived from LCE by dividing by a factor of 0.88. 7 No inferred Mineral Resources have been included in any of the economic studies for the reporting of Mineral Reserves. 8 Mineral Resources are reported in-situ, incorporating provision for geological losses; and takes due consideration of the reasonable prospect for economic extraction (RPEE), based on our Mineral Resource metal price assumptions. 9 Detailed financial models are used to estimate the Mineral Reserves. All modifying factors applied are all-inclusive from mine to mill. Mineral Reserves are reported as tonnes and contained metal reporting to the mill, with the exception of lithium and boron, where equivalent final produced product is included as well. 10 Attributable Mineral Resources and Mineral Reserves are reported on a legal, equity interest basis, considering both direct (project level) and indirect (holding entity level) interests, and also include indirect holdings via subsidiaries and treasury shares. In addition, the full (100% basis) Mineral Resources and Mineral Reserves for each property are also provided for full transparency. 11 Rounding-off of figures in this report may result in minor computational discrepancies. Where this occurs, it is not deemed significant and reflects the level of accuracy of the estimate. 12 All references to tonnes (t) are in metric units. R&R - 7

GROUP SUMMARY OF MINING PROPERTIES Group material mineral property summary Commodity Region Stage Property name Area (ha) Attributable ownership Ownership type Mine type Operator Mineralisation style PGM Americas Production Stillwater and East Boulder 9,749 100% Fully owned private subsidiary Underground Sibanye Stillwater Ltd Magmatic PGM Southern Africa Production Marikana 26,223 80.64% Majority owned private subsidiary Underground Sibanye Stillwater Ltd Magmatic PGM Southern Africa Production Rustenburg 15,898 74/86.35%* Majority owned private subsidiary Underground Sibanye Stillwater Ltd Magmatic PGM Southern Africa Production Kroondal 8,122 87 % Majority owned private subsidiary Underground Sibanye Stillwater Ltd Magmatic Gold Southern Africa Production Kloof 20,087 100% Fully owned private subsidiary Underground Sibanye Stillwater Ltd Paleoplacer Gold Southern Africa Production Driefontein 8,561 100% Fully owned private subsidiary Underground Sibanye Stillwater Ltd Paleoplacer Lithium Europe Development Keliber 3,038 79.82% Majority owned private subsidiary Underground & open pit Sibanye Stillwater Ltd Magmatic *86.35% applicable to the Hoedspruit prospecting right area. Group non-material mineral property summary Commodity Region Stage Property name Area (ha) Attributable ownership Ownership type Mine type Operator Mineralisation style PGM Americas Exploration Marathon* 19,625 13.90% Equity in listed entity Open pit Generation Mining Magmatic PGM Southern Africa Production Mimosa* 6,594 50% Joint Venture Underground Mimosa Mining Pty Ltd Magmatic PGM Southern Africa Exploration Akanani 4,095 80.13% Majority owned private subsidiary Underground Sibanye Stillwater Ltd Magmatic PGM Southern Africa Exploration Limpopo 5,706 40.32**/ 80.64% Majority owned private subsidiary & Joint Venture via majority owned subsidiary Underground Sibanye Stillwater Ltd Magmatic Gold Southern Africa Production Beatrix 16,821 100% Sibanye Stillwater Ltd Underground Sibanye Stillwater Ltd Paleoplacer Gold Southern Africa Production Cooke 14,724 76% Majority owned private subsidiary Re-treatment Sibanye Stillwater Ltd Tailings Gold Southern Africa Production DRDGOLD* 31,566 50.28 % Equity in listed entity Re-treatment DRDGOLD Ltd Tailings Gold Southern Africa Development Burnstone 13,136 100% Fully owned private subsidiary Underground Sibanye Stillwater Ltd Paleoplacer Gold Southern Africa Exploration SOFS 17,022 100% Fully owned private subsidiary Underground Sibanye Stillwater Ltd Paleoplacer Uranium Southern Africa Exploration Cooke (TSF's) 8,119 76% Majority owned private subsidiary Re-treatment Sibanye Stillwater Ltd Tailings Lithium Americas Exploration Rhyolite Ridge* 3,160 6.91% Equity in listed entity Open pit ioneer Ltd Sedimentary Copper Americas Exploration Altar* 8,440 48.61 % Minority project level shareholding & equity holding in listed entity Underground & open pit Aldebaran Resources Ltd Magmatic Zinc Australia Production Century 75,784 100 % Fully owned private subsidiary Re-treatment New Century Resources Pty Ltd Tailings Copper Australia Exploration Mt Lyell 4,648 100 % Fully owned private subsidiary Underground New Century Resources Pty Ltd Volcanogenic * Non-Managed **40.32% applicable to the Dwaalkop JV. Group production summary Year ended 31 December Region 2023 2022 2021 Milled Yield Produced Milled Yield Produced Milled Yield Produced kt g/t 2E/4E/AU koz kt g/t 2E/4E/AU koz kt g/t 2E/4E/AU koz US PGM 1,174 11.3 427 1,154 11.3 421 1,469 12.1 570 SA PGM 36,048 1.4 1,673 36,644 1.4 1,668 38,307 1.5 1,836 SA Gold 31,941 0.8 811 36,172 0.5 621 44,402 0.8 1,073 Encumbrances There are no Group significant or material encumbrances in the mineral properties licensing tenure that would restrict our planned mining activities. R&R - 8

MINERAL RESOURCE AND MINERAL RESERVE ESTIMATES AT 31 DECEMBER 2023 Mineral Resources Exclusive of Mineral Reserves 31 Dec 2023 31 Dec 2022 Attributable 100 % Attributable 100 % PGM OPERATIONS Tonnes Grade PGM PGM Tonnes Grade PGM PGM (Mt) (g/t) (Moz) (Moz) (Mt) (g/t) (Moz) (Moz) Americas¹ Stillwater and Measured 21.1 11.5 7.8 7.8 19.3 10.4 6.4 6.4 East Boulder** Indicated 19.3 9.2 5.7 5.7 19.1 7.9 4.8 4.8 Measured + Indicated 40.4 10.4 13.5 13.5 38.3 9.1 11.3 11.3 Inferred 113.8 11.9 43.7 43.7 114.0 12.2 44.8 44.8 Southern Africa² Marikana** Measured 44.9 3.9 5.6 6.9 53.0 4.0 6.8 8.4 Indicated 436.2 3.9 54.9 68.1 379.4 3.9 47.3 58.7 Measured + Indicated 481.1 3.9 60.5 75.0 432.5 3.9 54.1 67.1 Inferred 200.3 4.4 28.6 35.4 172.4 4.4 24.2 30.0 Rustenburg** Measured 174.9 5.1 28.6 38.7 178.2 5.1 29.1 39.3 Indicated 85.0 5.3 14.6 19.5 107.3 5.4 18.6 24.3 Measured + Indicated 259.8 5.2 43.2 58.2 285.5 5.2 47.7 63.6 Inferred 26.1 5.7 4.8 5.9 14.9 5.6 2.7 3.5 Kroondal** Measured 25.3 3.3 2.7 3.1 15.5 3.4 1.7 3.4 Indicated 4.8 3.3 0.5 0.6 4.7 3.8 0.6 1.2 Measured + Indicated 30.2 3.3 3.2 3.7 20.3 3.5 2.3 4.5 Inferred — — — — 2.5 2.9 0.2 0.5 Mimosa Measured 16.9 3.4 1.9 3.7 16.0 3.4 1.8 3.5 Indicated 8.3 3.6 1.0 1.9 8.4 3.5 1.0 1.9 Measured + Indicated 25.3 3.5 2.8 5.6 24.4 3.5 2.7 5.4 Inferred 14.4 3.4 1.6 3.2 15.5 3.4 1.7 3.4 OPERATIONS Total Measured + Indicated 836.7 4.6 123.3 156.1 801.0 4.6 118.0 151.9 OPERATIONS – Grand total 1,191.4 5.3 201.9 244.3 1,120.2 5.3 191.6 234.1 PGM EXPLORATION Americas Marathon Measured 22.1 0.8 0.6 4.1 18.8 0.8 0.5 2.8 Indicated 10.0 0.6 0.2 1.3 21.5 0.6 0.4 2.3 Measured + Indicated 32.1 0.7 0.7 5.4 40.3 0.7 0.9 5.1 Inferred 4.0 0.5 0.1 0.4 5.0 0.5 0.1 0.4 Southern Africa Akanani Measured — — — — — — — — Indicated 164.5 4.2 22.0 27.5 164.5 4.2 22.0 27.5 Measured + Indicated 164.5 4.2 22.0 27.5 164.5 4.2 22.0 27.5 Inferred 87.9 3.4 9.6 12.0 87.9 3.4 9.6 12.0 Limpopo Measured 1.8 4.2 0.2 0.3 1.8 4.2 0.2 0.3 Indicated 80.0 4.1 10.5 17.6 80.0 4.1 10.5 17.6 Measured + Indicated 81.7 4.1 10.7 17.9 81.7 4.1 10.7 17.9 Inferred 70.9 4.0 9.2 14.2 70.9 4.0 9.2 14.2 Blue Ridge Measured — — — — — — — — Indicated — — — — 9.2 3.2 1.0 1.9 Measured + Indicated — — — — 9.2 3.2 1.0 1.9 Inferred — — — — 6.7 3.0 0.6 1.3 EXPLORATION Total Measured + Indicated 278.3 3.7 33.5 50.8 295.7 3.6 34.6 52.4 EXPLORATION - Grand Total 441.1 3.7 52.3 77.4 466.1 3.6 54.1 80.3 PGM TOTAL Measured + Indicated 1,115.0 4.4 156.7 206.9 1,096.7 4.3 152.6 204.3 PGM TOTAL 1,632.5 4.8 254.2 321.7 1,586.4 4.8 245.7 314.4 Note: ** Material property under SK-1300 GROUP SUMMARY OF MINING PROPERTIES continued R&R - 9

Mineral Reserves 31 Dec 2023 31 Dec 2022 Attributable 100 % Attributable 100 % PGM OPERATIONS Tonnes Grade PGM PGM Tonnes Grade PGM PGM (Mt) (g/t) (Moz) (Moz) (Mt) (g/t) (Moz) (Moz) Americas¹ Stillwater and Proved 10.9 13.5 4.8 4.8 10.0 13.5 4.3 4.3 East Boulder** Probable 49.5 13.6 21.5 21.5 50.3 13.6 22.0 22.0 Proved + Probable 60.4 13.5 26.3 26.3 60.2 13.6 26.3 26.3 Southern Africa² Marikana** Proved 19.8 3.9 2.5 3.1 21.5 3.9 2.7 3.4 Probable 111.5 3.9 14.0 17.4 117.9 3.9 14.7 18.2 Proved + Probable 131.4 3.9 16.5 20.4 139.4 3.9 17.4 21.6 Rustenburg** Proved 72.9 3.6 8.4 11.4 79.3 3.5 9.0 12.2 Probable 17.9 1.6 0.9 1.2 24.7 1.4 1.1 1.5 Proved + Probable 90.9 3.2 9.3 12.6 103.9 3.0 10.2 13.7 Kroondal** Proved 9.1 2.5 0.7 0.8 8.0 2.6 0.7 1.3 Probable — — — — — — — — Proved + Probable 9.1 2.5 0.7 0.8 8.0 2.6 0.7 1.3 Mimosa Proved 11.3 3.5 1.3 2.6 20.1 3.5 2.2 4.5 Probable 3.3 3.3 0.4 0.7 8.6 3.4 1.0 1.9 Proved + Probable 14.6 3.5 1.6 3.3 28.7 3.5 3.2 6.4 PGM TOTAL Proved + Probable 306.4 5.5 54.5 63.4 340.3 5.3 57.7 69.3 Notes: Mineral Resources and Mineral Reserves are reported on a legal ownership attributable basis, and metal content is additionally stated on a 100% basis 1 For the US PGM operations, PGM is represented by the 2E (Pt and Pd) 2 For the SA PGM operations, PGM is represented by the 4E (Pt, Pd, Rh and Au) ** Material property under SK-1300 GROUP SUMMARY OF MINING PROPERTIES continued R&R - 10 SAFFY SHAFT, MARIKANA OPERATION, WITH TAILINGS MINING IN THE FOREGROUND

Mineral Resources Exclusive of Mineral Reserves 31 Dec 2023 31 Dec 2022 Attributable 100 % Attributable 100 % GOLD OPERATIONS Tonnes Grade Gold Gold Tonnes Grade Gold Gold (Mt) (g/t) (Moz) (Moz) (Mt) (g/t) (Moz) (Moz) Southern Africa Kloof** Measured 26.7 9.6 8.2 8.2 24.9 11.2 9.0 9.0 Indicated 24.5 5.5 4.3 4.3 33.3 6.6 7.1 7.1 Measured + Indicated 51.2 7.6 12.5 12.5 58.2 8.6 16.1 16.1 Inferred 7.0 4.5 1.0 1.0 21.7 8.7 6.1 6.1 Driefontein** Measured 15.6 9.1 4.6 4.6 16.7 9.4 5.0 5.0 Indicated 10.3 7.6 2.5 2.5 9.9 8.2 2.6 2.6 Measured + Indicated 25.9 8.5 7.1 7.1 26.6 8.9 7.7 7.7 Inferred 4.5 5.0 0.7 0.7 1.3 4.8 0.2 0.2 Beatrix Measured 16.2 5.3 2.8 2.8 20.6 6.4 4.2 4.2 Indicated 23.8 5.0 3.8 3.8 24.7 5.3 4.2 4.2 Measured + Indicated 40.0 5.1 6.6 6.6 45.2 5.8 8.4 8.4 Inferred 0.5 4.0 0.1 0.1 1.6 4.4 0.2 0.2 Cooke Measured 150.8 0.3 1.2 1.6 154.4 0.3 1.3 1.7 Indicated 40.1 0.3 0.4 0.5 41.3 0.3 0.4 0.5 Measured + Indicated 191.0 0.3 1.6 2.2 195.7 0.3 1.7 2.2 Inferred — — — — — — — — DRDGOLD Measured 33.4 0.3 0.3 0.6 33.2 0.3 0.3 0.6 Indicated 188.2 0.2 1.5 3.0 188.7 0.2 1.5 3.0 Measured + Indicated 221.6 0.3 1.8 3.6 222.0 0.3 1.8 3.6 Inferred 10.7 0.2 0.1 0.2 10.7 0.2 0.1 0.2 OPERATIONS Total Measured + Indicated 529.7 1.7 29.6 31.9 547.7 2.0 35.6 37.9 OPERATIONS - Grand total 552.4 1.8 31.5 33.9 583.2 2.2 42.2 44.6 GOLD DEVELOPMENT Southern Africa Burnstone Measured 0.4 4.4 0.1 0.1 0.3 13.4 0.1 0.1 Indicated 10.9 4.4 1.6 1.6 5.8 11.1 2.1 2.1 Measured + Indicated 11.4 4.4 1.6 1.6 6.0 11.2 2.2 2.2 Inferred 29.3 4.3 4.1 4.1 31.5 4.2 4.3 4.3 DEVELOPMENT Total Measured + Indicated 11.4 4.4 1.6 1.6 6.0 11.2 2.2 2.2 DEVELOPMENT - Grand Total 40.7 4.3 5.7 5.7 37.6 5.3 6.5 6.5 GOLD EXPLORATION Southern Africa SOFS Measured — — — — — — — — Indicated 44.1 4.5 6.4 6.4 44.1 4.5 6.4 6.4 Measured + Indicated 44.1 4.5 6.4 6.4 44.1 4.5 6.4 6.4 Inferred 4.0 3.6 0.5 0.5 4.0 3.6 0.5 0.5 Australia Mt Lyell Measured 3.7 0.2 0.03 0.03 — — — — Indicated 51.4 0.3 0.4 0.4 — — — — Measured + Indicated 55.1 0.2 0.4 0.4 — — — — Inferred 24.3 0.1 0.1 0.1 — — — — Americas Altar Measured 310.1 0.1 1.2 2.4 637.9 0.1 2.4 2.4 Indicated 282.1 0.1 0.7 1.5 580.3 0.1 1.5 1.5 Measured + Indicated 592.2 0.1 1.9 3.9 1,218.2 0.1 3.9 3.9 Inferred 92.6 0.1 0.2 0.4 190.4 0.1 0.4 0.4 Rio Grande Measured — — — — — — — — Indicated — — — — 12.5 0.4 0.1 0.8 Measured + Indicated — — — — 12.5 0.4 0.1 0.8 Inferred — — — — 7.2 0.3 0.1 0.4 Marathon Measured 22.1 0.1 0.05 0.4 18.8 0.1 0.04 0.2 Indicated 10.0 0.1 0.02 0.1 21.5 0.1 0.04 0.2 Measured + Indicated 32.1 0.1 0.07 0.5 40.3 0.1 0.08 0.4 Inferred 4.0 0.05 0.01 0.04 5.0 0.03 0.01 0.03 EXPLORATION Total Measured + Indicated 723.4 0.4 8.8 11.3 1,315.0 0.2 10.6 11.6 EXPLORATION - Grand Total 848.3 0.4 9.6 12.3 1,521.7 0.2 11.5 12.9 GOLD TOTAL Measured + Indicated 1,264.5 1.0 40.0 44.8 1,868.8 0.8 48.3 51.7 GOLD TOTAL 1,441.3 1.0 46.7 51.8 2,142.4 0.9 60.1 63.9 Note: ** Material property under SK-1300 GROUP SUMMARY OF MINING PROPERTIES continued R&R - 11

Mineral Reserves 31 Dec 2023 31 Dec 2022 Attributable 100 % Attributable 100 % GOLD OPERATIONS Tonnes Grade Gold Gold Tonnes Grade Gold Gold (Mt) (g/t) (Moz) (Moz) (Mt) (g/t) (Moz) (Moz) Southern Africa Kloof** Proved 7.6 5.1 1.3 1.3 11.0 6.1 2.1 2.1 Probable 3.2 5.6 0.6 0.6 7.5 5.4 1.3 1.3 Proved + Probable 10.8 5.3 1.8 1.8 18.6 5.8 3.4 3.4 Driefontein** Proved 5.6 8.7 1.6 1.6 5.8 8.4 1.6 1.6 Probable 6.0 7.1 1.4 1.4 5.6 7.9 1.4 1.4 Proved + Probable 11.6 7.9 2.9 2.9 11.4 8.1 3.0 3.0 Beatrix Proved 4.7 3.5 0.5 0.5 5.9 3.8 0.7 0.7 Probable 1.2 3.5 0.1 0.1 0.7 3.1 0.1 0.1 Proved + Probable 5.9 3.5 0.7 0.7 6.7 3.7 0.8 0.8 Cooke Proved — — — — — — — — Probable 8.8 0.3 0.1 0.1 7.3 0.3 0.1 0.1 Proved + Probable 8.8 0.3 0.1 0.1 7.3 0.3 0.1 0.1 DRDGOLD Proved 193.8 0.3 2.0 4.0 205.0 0.3 2.2 4.3 Probable 105.1 0.3 0.9 1.7 103.5 0.2 0.8 1.6 Proved + Probable 298.9 0.3 2.9 5.7 308.5 0.3 3.0 5.9 OPERATIONS Total Proved + Probable 336.0 0.8 8.4 11.2 352.4 0.9 10.3 13.2 GOLD DEVELOPMENT Southern Africa Burnstone Proved — — — — — — — — Probable 19.8 4.0 2.5 2.5 20.5 4.0 2.7 2.7 Proved + Probable 19.8 4.0 2.5 2.5 20.5 4.0 2.7 2.7 DEVELOPMENT Total Proved + Probable 19.8 4.0 2.5 2.5 20.5 4.0 2.7 2.7 GOLD TOTAL Proved + Probable 355.8 1.0 10.9 13.7 373.0 1.1 12.9 15.9 Notes: 3 For the lithium Mineral Resources, LCE content was calculated by multiplying the Li (%) content by a factor of 5.323. Lithium hydroxide monohydrate (LiOH.H2O) can be derived from LCE by dividing by a factor of 0.88. ⁴ Rhyolite Ridge HBO3 Mineral Resources (a planned by-product) are excluded here , but is reported in full under the individual property disclosure. ** Material property under SK-1300 Mineral Resources Exclusive of Mineral Reserves 31 Dec 2023 31 Dec 2022 Attributable 100 % Attributable 100 % LITHIUM DEVELOPMENT Tonnes Li Li₂O LCE LCE Tonnes Li Li₂O LCE LCE (Mt) (%) (%) (kt) (kt) (Mt) (%) (%) (kt) (kt) Europe³ Keliber** Measured 0.4 0.58 1.25 12 15 0.5 0.47 1.02 13 16 Indicated 3.5 0.56 1.20 103 129 3.3 0.48 1.04 86 101 Measured + Indicated 3.9 0.56 1.20 115 144 3.9 0.48 1.04 100 117 Inferred 3.6 0.50 1.07 94 118 2.8 0.38 0.82 57 67 DEVELOPMENT - Grand Total 7.4 0.53 1.14 209 262 6.7 0.44 0.94 157 184 LITHIUM EXPLORATION Americas³,⁴ Rhyolite Ridge Measured 3.0 0.17 0.37 28 403 2.7 0.17 0.37 25 357 Indicated 17.3 0.17 0.37 160 2,317 6.1 0.16 0.33 50 725 Measured + Indicated 20.4 0.17 0.37 188 2,720 8.8 0.16 0.35 75 1,082 Inferred 4.5 0.18 0.39 44 630 1.4 0.16 0.35 12 167 EXPLORATION - Grand Total 24.9 0.17 0.38 232 3,350 10.2 0.16 0.35 87 1,249 LITHIUM TOTAL Measured + Indicated 24.2 0.24 0.51 303 2,864 12.7 0.26 0.56 175 1,199 LITHIUM TOTAL 32.3 0.26 0.55 440 3,612 16.9 0.27 0.58 244 1,433 GROUP SUMMARY OF MINING PROPERTIES continued R&R - 12

Mineral Reserves 31 Dec 2023 31 Dec 2022 Attributable 100 % Attributable 100 % LITHIUM DEVELOPMENT Tonnes Li Li₂O LCE LCE Tonnes Li Li₂O LCE LCE (Mt) (%) (%) (kt) (kt) (Mt) (%) (%) (kt) (kt) Europe³ Keliber** Proved 3.1 0.48 1.04 80 101 3.3 0.48 1.04 85 101 Probable 4.6 0.42 0.90 102 127 4.9 0.42 0.90 108 127 LITHIUM TOTAL Proved + Probable 7.7 0.44 0.96 182 228 8.2 0.44 0.96 194 228 Mineral Resources 31 Dec 2023 31 Dec 2022 Attributable 100 % Attributable 100 % COPPER EXPLORATION Tonnes Grade Copper Copper Tonnes Grade Copper Copper (Mt) (%) (Mlb) (Mlb) (Mt) (%) (Mlb) (Mlb) Australia Mt Lyell Measured 3.7 0.89 73 73 — — — — Indicated 51.4 0.91 1,036 1,036 — — — — Measured + Indicated 55.1 0.91 1,108 1,108 — — — — Inferred 24.3 0.94 501 501 — — — — Americas Marathon Measured 22.1 0.20 99 712 18.8 0.20 84 463 Indicated 10.0 0.22 49 350 21.5 0.21 102 559 Measured + Indicated 32.1 0.21 148 1,062 40.3 0.21 186 1,022 Inferred 4.0 0.23 20 143 5.0 0.23 25 140 Altar Measured 310.1 0.43 2,963 6,095 637.9 0.43 6,095 6,095 Indicated 282.1 0.41 2,573 5,293 580.3 0.41 5,293 5,293 Measured + Indicated 592.2 0.42 5,536 11,388 1,218.2 0.42 11,388 11,388 Inferred 92.6 0.42 851 1,750 190.4 0.42 1,750 1,750 Rio Grande Measured — — — — — — — — Indicated — — — — 12.5 0.30 82 469 Measured + Indicated — — — — 12.5 0.30 82 469 Inferred — — — — 7.2 0.23 37 208 COPPER TOTAL Measured + Indicated 679.3 0.45 6,792 13,558 1,270.9 0.42 11,656 12,879 COPPER TOTAL 800.2 0.46 8,163 15,952 1,473.6 0.41 13,468 14,977 3 For the Lithium Mineral Resources, LCE content was calculated by multiplying the Li (%) content by a factor of 5.323. Lithium Hydroxide Monohydrate (LiOH.H2O) can be derived from LCE by dividing by a factor of 0.88. ⁴ Rhyolite Ridge H3BO3 Mineral Resources are excluded here, but reported under the individual property disclosure. ** Material property under SK-1300 Mineral Resources 31 Dec 2023 31 Dec 2022 Attributable 100 % Attributable 100 % URANIUM EXPLORATION Tonnes Grade U₃O₈ U₃O₈ Tonnes Grade U₃O₈ U₃O₈ (Mt) (kg/t) (Mlb) (Mlb) (Mt) (kg/t) (Mlb) (Mlb) Southern Africa Beatrix (Beisa) Measured 3.6 1.09 8.5 8.5 3.6 1.09 8.5 8.5 Indicated 7.8 1.07 18.3 18.3 7.8 1.07 18.3 18.3 Measured + Indicated 11.4 1.07 26.9 26.9 11.4 1.07 26.9 26.9 Inferred 0.04 1.10 0.1 0.1 0.04 1.10 0.1 0.1 Cooke Measured 60.3 0.19 24.7 32.5 154.4 0.09 31.9 42.0 Indicated 39.7 0.09 7.6 9.9 41.3 0.09 7.8 10.2 Measured + Indicated 100.0 0.15 32.2 42.4 195.7 0.09 39.6 52.2 Inferred — — — — — — — — URANIUM TOTAL Measured + Indicated 111.4 0.24 59.1 69.3 207.0 0.15 66.5 79.0 URANIUM TOTAL 111.4 0.24 59.2 69.4 207.1 0.15 66.6 79.1 GROUP SUMMARY OF MINING PROPERTIES continued R&R - 13

Mineral Resources Exclusive of Mineral Reserves 31 Dec 2023 31 Dec 2022 Attributable 100 % Attributable 100 % ZINC EXPLORATION = Tonnes Grade Zinc Zinc Tonnes Grade Zinc Zinc (Mt) (%) (Mlb) (Mlb) (Mt) (%) (Mlb) (Mlb) Australia Century Measured 1.0 4.8 106 106 0.2 4.8 21 106 Indicated 8.9 5.7 1,111 1,111 1.8 5.7 221 1,111 Measured + Indicated 9.9 5.6 1,217 1,217 2.0 5.6 242 1,217 Inferred 0.6 2.7 35 35 0.5 6.5 66 331 ZINC EXPLORATION - Grand Total 10.5 5.4 1,252 1,252 2.4 5.8 308 1,548 Mineral Reserves 31 Dec 2023 31 Dec 2022 Attributable 100 % Attributable 100 % ZINC OPERATIONS = Tonnes Grade Zinc Zinc Tonnes Grade Zinc Zinc (Mt) (%) (Mlb) (Mlb) (Mt) (%) (Mlb) (Mlb) Australia Century Proved 26.1 3.0 1,726 1,726 6.8 3.0 446 2,240 Probable — — — — — — — — ZINC TOTAL Proved + Probable 26.1 3.0 1,726 1,726 6.8 3.0 446 2,240 R&R - 14

AUDITING AND RISK Sibanye-Stillwater manages risk to protect the Group’s assets, stakeholders, environment, and reputation and to ensure achievement of the business objectives. The Group maintains sound risk management practices and systems that are consistent with international best practice and in line with the following three risk management frameworks and guidelines: 1 Committee of Sponsoring Organizations of the Treadway Commission (COSO) 2 ISO 31000:2009 Risk Management: Principles and Guidelines 3 The King IV Report on Corporate GovernanceTM for South Africa, 2016 Group-wide risk is addressed in detail in the Integrated Annual Report 2023, the form 20-F, and the Annual Financial Report 2023. These reports cover the remedial or preventative actions to mitigate and/or manage any identified risks. These documents can be accessed in the investor section of our corporate website: www.sibanyestillwater.com/news-investors/news/news-releases In addition to this, the process followed in producing the Group’s Mineral Resources and Mineral Reserves declaration is in alignment with the guiding principles of the Sarbanes-Oxley Act of 2002 (SOX); there are internal controls in place for financial reporting that cover the Group’s Mineral Resource management function as applicable. The Group internal audit function provides assurance as to the effectiveness of Sibanye-Stillwater’s governance, risk management and control processes. Both internal and external audits are regularly conducted to ensure that corporate governance best practices are being followed. External technical audits take place biennially, with the last audit conducted during 2022. Risk registers are kept for each operation, covering key risks pertaining to, but not limited to, technical, environmental, social, health, safety, economic and political aspects. Mitigation measures are put in place to address the material risks at each operation. Risks to the various properties’s estimates are summarised and discussed within section 2 of this document, which deals with the individual property disclosures. R&R - 15 THE M.V. WUNMA TRANSHIPMENT VESSEL OFF-LOADING ZINC CONCENTRATE IN THE GULF OF CARPENTARIA

MINERAL TITLE With the exception of Akanani Mining Pty Ltd (and as described later in this document) Sibanye-Stillwater has legal entitlement to all the properties and minerals being reported on. For the managed production properties, all the required operating permits have been obtained and are in good standing with the regulators. In certain cases, where licenses and permits have expired, but are the subject of renewal or conversion applications, there are reasonable grounds to believe that those will be granted, and hence the Mineral Resources and Mineral Reserves continue to be reported. For all non-managed properties, the Group has confirmed that the mineral titles being reported on are in good standing. The directors of the Group confirm that there are no other material legal proceedings or other material conditions that will impact on the Group’s ability to continue its mining or exploration activities. More detailed information on the various properties can be found under the “license status and holdings” section of the individual property disclosures. EXPLORATION The majority of the Group’s managed exploration activities are aimed at the ongoing delineation of Mineral Resources at our existing operations, for ultimate conversion to Mineral Reserves. This is made up of a combination of drilling for ore-body extensions, as underground development progresses, and infill drilling in known areas of mineralisation where additional ore-body definition is required to facilitate mining. The majority of this drilling is conducted from underground. Surface drilling activities for 2023 were limited to our SA PGM operations and the Keliber lithium development project in Finland, whilst a surface vibro-seismic survey was conducted at our Burnstone development project to help mitigate the risk associated with geological structure. At Keliber, ongoing exploration success, combined with an updated Mineral Resource estimation methodology, has led to a 28.6% increase to 471Kt LCE. A high-level Group summary of all drilling conducted is provided below. Detail on quantities, annual spend and material results are provided within the individual property disclosures in sections 2 and 3 of this report. Group drilling summary Region Area Meters Costs (Rm) US PGM Underground 279,853 266.6 SA PGM Surface 15,896 23.4 SA PGM Underground 19,557 27.0 SA Gold Underground 36,020 51.1 Europe Surface 31,670 88.9 Grand Total 382,996 457.1 ANNUAL PLANNING PROCESS For the managed mining operations (production properties), the reported Mineral Resources and Mineral Reserves are derived through a comprehensive annual operational planning process. The annual planning process is cyclical, starting in January and running through to December. It begins with a review of the previous LoM plans and the development of strategic plans based on that portion of the Mineral Resource for which technical and economic studies have demonstrated justified extraction at the time of disclosure, to a minimum pre-feasibility study (PFS) level. Strategic plan directives, parameters and factors are issued to guide the operations. The analysis of historical performance is done to assist with the development of realistic productivity and cost parameters and modifying factors. All operations document the guidelines and then focus on producing a business plan. All mine design and planning is based on the latest geological and Mineral Resource models, which are updated prior to the commencement of the process. Mineral Resource classification categories guide and constrain the mining layouts. Measured and Indicated Mineral Resources typically become Proved and Probable Mineral Reserves respectively, but additional mining risk can be factored in and used to downgrade Mineral Reserve confidence. The operational plan is based on detailed monthly scheduling and zero-based costing. All underground mine design, sequencing, scheduling and evaluation is done in an appropriate 3D software package. Once detailed 12 month production profiles, operating and capital cost estimates, and the required stay-in-business capital estimates to sustain the business have been prepared, these are extended to five-year and LoM production schedules. Multi-disciplinary review processes are conducted at stage-gate intervals during the planning process. During these reviews mining, support and technical departments are involved in the verification of the inputs and the modifying factors that are incorporated into the business plan. Ultimately, all business plans and LoM plans are approved by both the relevant regional management team, as well as the Group executives. Technical economic modelling is undertaken using the discounted cash-flow approach. The detailed one-year operating budget is used to determine cost drivers, down to shaft level, which are then applied to the remainder of the LoM plan. Sensitivities are calculated based on a range of commodity prices, and operating and capital costs to assess the robustness of the plan. The financial and technical assumptions underlying the Mineral Resources and Mineral Reserves estimations contained in this report are current as at 31 December 2023. Such assumptions rely on various factors that may change after the reporting period, including as a result of operational reviews which Sibanye-Stillwater undertakes from time to time and when necessary. R&R - 16 3D VIBRO-SEISMIC SURVEY CONDUCTED AT THE BURNSTONE DEVELOPMENT PROJECT

COMMODITY PRICE ASSUMPTIONS The Group reports in accordance with both the JSE and the US Securities and Exchange Commission (SEC) guidelines on commodity prices used for the estimation of Mineral Resources and Mineral Reserves at all managed operations, development, and exploration properties. Forward looking prices, based on market research that reflect “through the cycle” pricing, is considered in Mineral Resources and Mineral Reserves estimations. Mineral Resources price assumptions, which focus on longer timeframes, are based on moderately higher prices than for Mineral Reserves to reflect the ore-body flexibility. For the PGM mineral properties, the US$ based, forward looking commodity prices used for the 2023 life of mine process has largely been retained from 2022, with the only change relating to rhodium, where prices have been adjusted downwards to US$6,000/oz from US$8,000/oz. The longer term outlook of US$1,250/oz for platinum and palladium are maintained based on our evaluation of sustainable, through the cycle, price assumptions. At our South African gold operations, the most recent (at the time of estimation) bank consensus forward looking prices for Mineral Reserves has been considered. This recognizes an increase in spot gold prices, while still maintaining a conservative longer term outlook. As it relates to base metals, adjustments to our longer-term outlooks for chrome ore and uranium have been made. Over the past year a 42% increase in lumpy chrome ore prices have been sustained - well above our previous assumptions of US$150-US$165/tonne, with current spot at approximately US$280/tonne. Over the past year, there has been an acceleration of a structural shift in the long-term fundamentals for uranium, underpinned by the recognition of uranium as a potential source of green energy, and a crucial contributor to the global decarbonization requirements going forward. This has resulted in the U3O8 spot price recently breaching US$100/lb and long term consensus prices breaching US$ 60/lb U3O8. As a result, the adjustments in the long term contract price to US$60/lb is deemed reasonable and reflects a price that is sustainable in the foreseeable future. The commodity prices used in the estimation of Mineral Resources and Mineral Reserves at non-managed entities are provided in the notes to the relevant tables. At the Keliber lithium project, the estimates still reflect the Keliber lithium project Competent Persons (CP's) review, prior to the company taking majority ownership and were conducted at a Li price varying between US$13,450/t and US$16,500/t LiOH.H2O. The exchange rates used for the Mineral Resources and Mineral Reserves Declaration as at 31 December 2023 is R17.00:US$ (up from R16.00:US$ at end 2022, reflecting the continuing deteriorating long- term Rand:US$ outlook), US$1.12:EUR, R19:EUR and US$0.75:AUD. Forward looking price assumptions as at 31 December 2023 (Excluding SA Gold Mineral Reserves) 31 December 2023 31 December 2022 MINERAL RESOURCES MINERAL RESERVES MINERAL RESERVES Precious metals US$/oz R/oz R/kg US$/oz R/oz R/kg US$/oz R/oz R/kg Gold 1,800 30,600 983,812 1,650 28,050 901,828 1,650 26,400 850,000 Platinum 1,500 25,500 819,843 1,250 21,250 683,203 1,250 20,000 643,014 Palladium 1,500 25,500 819,843 1,250 21,250 683,203 1,250 20,000 643,014 Rhodium 8,000 136,000 4,372,498 6,000 102,000 3,279,374 8,000 128,000 4,115,292 Iridium 3,000 51,000 1,639,687 2,500 42,500 1,366,406 2,500 40,000 1,286,029 Ruthenium 350 5,950 191,297 300 5,100 163,969 300 4,800 154,323 Base metals US$/lb US$/tonne R/tonne US$/lb US$/tonne R/tonne US$/lb US$/tonne R/tonne Nickel 7.94 17,500 297,500 7.35 16,200 275,400 7.35 16,200 259,200 Copper 4.54 10,000 170,000 4.06 8,950 152,150 4.06 8,950 143,200 Cobalt 25 55,116 936,964 22 48,502 824,528 22 48,502 776,026 Zinc 1.30 2,866 48,722 1.15 2,535 43,100 N/A N/A N/A Uranium oxide (U3O8)¹ 60 132,277 2,248,712 50 110,231 1,873,927 50 110,231 1,763,696 Chromium oxide (Cr₂O₃), (42% concentrate)¹ 0.10 220 3,740 0.09 200 3,400 0.06 150 2,400 Lithium carbonate 14.97 33,000 561,000 13.61 30,000 510,000 N/A N/A N/A Lithium hydroxide 15.88 35,000 595,000 14.51 32,000 544,000 N/A N/A N/A 1 Long-term contract prices Forward looking price assumptions as at 31 December 2023 (SA Gold Mineral Reserves) 2024 2025 2026 2027 Long Term (US$/oz) 1,984 1,875 1,750 1,700 1,600 (R/kg) 1,179,872 1,091,092 975,333 934,075 941,374 R&R - 17

COMPETENT PERSONS’ DECLARATION AND CONSENT The Mineral Resources and Mineral Reserves are estimated by teams of appointed competent/qualified persons (CP or QP), who have sufficient experience relative to the type and style of the mineral deposits under consideration. In addition, corporate governance on the overall compliance of the Group’s figures and responsibility for the generation of a Group consolidated statement has been overseen by the Group lead CP/QP, included in the list below. For non-managed properties, where the company holds a minority stake in a project or company and reports an attributable proportion of the asset’s Mineral Resources and Mineral Reserves, the Group has reviewed those estimates (or had them reviewed externally), and verified the estimates as compliant to the SAMREC code and SK-1300. The Group has the written confirmation of the CPs/QPs listed below that the information disclosed in this report may be published in the form and context for which it was intended. The Group lead CP/QP also confirms that the information disclosed in this report is compliant with the relevant security exchanges’ requirements (Section 12 of the JSE Listings Requirements, SAMREC Table 1 and the US SEC regulation SK-1300). The names, qualifications, job titles, relationship with the Group, professional registrations, work address, area of competency, and years of relevant experience, are defined in the table below. SIBANYE-STILLWATER GROUP Group Lead Competent Persons Stephan Stander B.Sc. Hons – Geochemistry, B.Com, MBL, GDE, Dipl.PM. Senior Vice President – Mineral Resource Managment Full-time employee SACNASP 400089/96 Constantia Office Park Bridgeview House, Building 11, Ground floor, Cnr 14th Avenue & Hendrik Potgieter Road Weltevreden Park 1709, RSA Sibanye- Stillwater Group Mineral Resources 31 Tom Van Den Berg B.Tech (Mining Eng.), MBL, EDP. Senior Vice President – Group Mining Technical Services Full-time employee SAIMM (Fellow) 70097 Constantia Office Park Bridgeview House, Building 11, Ground floor, Cnr 14th Avenue & Hendrik Potgieter Road Weltevreden Park 1709, RSA Sibanye- Stillwater Group Mineral Reserves 32 AMERICAS PGM OPERATIONS Lead Competent Person Jeff Hughs BSc (Geology) Technical Services Manager – Geology Montana Mines Full-time employee AIPG CPG 11792 Sibanye-Stillwater, US PGM Operations 242 S Diamond St PO Box 1330, Columbus MT 59019, USA Stillwater and East Boulder Operations Mineral Resources 19 Team of Competent Persons Jennifer Evans BSc (Geology) Senior Geologist Full-time employee AIPG CPG 11669 Sibanye-Stillwater, US PGM Operations 242 S Diamond St PO Box 1330, Columbus MT 59019, USA East Boulder Operation Geology Mineral Resources 19 Matt Ladvala BSc (Geology) Senior Geologist Full-time employee AIPG CPG 11941 Sibanye-Stillwater, US PGM Operations 242 S Diamond St PO Box 1330, Columbus MT 59019, USA Stillwater Operation Geology Mineral Resources 16 Kevin Butak MSc (Geology) Senior Geologist Full-time employee AIPG CPG 12012 Sibanye-Stillwater, US PGM Operations 242 S Diamond St PO Box 1330, Columbus MT 59019, USA Stillwater Operation Geology Mineral Resources 16 Annette McFarland BSc (Geological Engineering) Chief Engineer Full-time employee PE NV 023215 Sibanye-Stillwater, US PGM Operations 242 S Diamond St PO Box 1330, Columbus MT 59019, USA Stillwater Operation Engineering Mineral Reserves 28 Pat Hansen BSc (Mining Engineering) Senior Engineer Full-time employee PE MT 75419 Sibanye-Stillwater, US PGM Operations 242 S Diamond St PO Box 1330, Columbus MT 59019, USA East Boulder Operation Engineering Mineral Reserves 8 Name Relationship with Group Professional registrations Work address Area of responsibility Competency/ specialisation Years of relevant experience R&R - 18

AMERICAS PGM EXPLORATION Competent Persons Mauro Bassotti B.Sc. Hons - Geology Vice President Geology – Generation Mining External – Full time employee and of Generation Mining PGO 2893 First Canadian Place Suite 7010 – 100 King Street West PO Box 70, Toronto, ON, Canada M5X 1B1 Marathon Mineral Resources 25 AMERICAS BATTERY METALS EXPLORATION Competent Persons Antonio Umpire P. Engineer BSc (Hon) Geology (Hon) Internation MBA BA (Hon) Professional IT GDE (Conditional Simulation) Unit Manager Group Resource Estimation & Reporting Full-time employee SACNASP 400372/12 GASA 12104 GSSA 967709 CIP 91856 Constantia Office Park Bridgeview House, Building 11, Ground floor, Cnr 14th Avenue & Hendrik Potgieter Road Weltevreden Park 1709, RSA Rhyolite Ridge Mineral Resources 28 Stanford Foy BSc (Geological Engineering) Vice President: Project Development – Aldebaran Resources External – Full time employee of Aldebaran Resources AIPG CPG-10946 SME 4140727 38 Bannock Cir 1449, Red Lodge, MT 59068 USA Altar Mineral Resources 29 SOUTHERN AFRICA PGM OPERATIONS & EXPLORATION Lead Competent Person Manie Keyser MEng (Mining Engineering) Vice President: Mine Technical Services Full-time employee SACNASP 400284/06 Sibanye-Stillwater Hex River Complex Old Mine Road, Rustenburg Bleskop, 0292 SA PGM operations Mineral Resources and Mineral Reserves 30 Team of Competent Persons Nicole Wansbury MSc (Geology) Unit Manager: Geology Full-time employee SACNASP 400060/11 Sibanye-Stillwater Hex River Complex Old Mine Road, Rustenburg Bleskop, 0292 SA PGM operations Mineral Resources 18 Leon Koorsse GDE (Mining Engineering) Unit Manager: Survey Full-time employee SAGC GPr MS 0134 Sibanye-Stillwater Hex River Complex Old Mine Road, Rustenburg Bleskop, 0292 SA PGM operations Mineral Reserves 38 Brian Smith MEng MRM Unit Manager: Survey Full-time employee SAGC GPr MS 0218 Sibanye-Stillwater Hex River Complex Old Mine Road, Rustenburg Bleskop, 0292 SA PGM operations Mineral Reserves 36 Leonard Changara MSc (Geology); MBA Unit Manager: Geology Full-time employee SACNASP 400089/08 Sibanye-Stillwater Hex River Complex Old Mine Road, Rustenburg Bleskop, 0292 SA PGM operations Geology and exploration 24 SOUTHERN AFRICA GOLD OPERATIONS, DEVELOPMENT & EXPLORATION Lead Competent Person Charl Labuschagne BSc (Hons) Geology, MSc Environmental Management, GDE Mining Engineering Vice President: Mine Technical Services Full-time employee SACNASP 400237/08 Constantia Office Park Bridgeview House, Building 11, Ground floor, Cnr 14th Avenue & Hendrik Potgieter Road Weltevreden Park 1709, RSA SA Gold operations Mineral Resources and Reserves 21 Team of Competent Persons Renier van Vuuren BSc (Hons) Geology Unit Manager Mineral Resources Full-time employee SACNASP 153249 Constantia Office Park Bridgeview House, Building 11, Ground floor, Cnr 14th Avenue & Hendrik Potgieter Road Weltevreden Park 1709, RSA SA Gold operations Mineral Resources 14 Steven Wild GDE Mining Engineering, NHD MRM Unit Manager Mine Planning Full-time employee SAIMM 706556 Constantia Office Park Bridgeview House, Building 11, Ground floor, Cnr 14th Avenue & Hendrik Potgieter Road Weltevreden Park 1709, RSA SA Gold operations Mineral Reserves 28 Lindelani Mudimeli BSc (Hons) GDE Mining Engineering Unit Manager Geology Full-time employee SACNASP 013678 Constantia Office Park Bridgeview House, Building 11, Ground floor, Cnr 14th Avenue & Hendrik Potgieter Road Weltevreden Park 1709, RSA SA Gold operations Geology and exploration 16 Mpfariseni Mudau BSc (Hons) Geology, MSc (Mining Engineering) Director of the RVN Group Proprietary Limited External – Independent consultant to DRDGOLD SACNASP 400305/12 Willowbrook Villas 21, Van Hoof St, Roodepoort, 1724, Gauteng, South Africa DRD Mineral Resources 17 Prof. Steven Rupprecht BSc (Mining Engineering), PhD (Mechanical Engineering) Associate Principal Mining Engineer of the RVN Group External – Independent consultant to DRDGOLD FSAIMM 701013 Willowbrook Villas 21, Van Hoof St, Roodepoort, 1724, Gauteng, South Africa DRD Mineral Reserves 36 Name Relationship with Group Professional registrations Work address Area of responsibility Competency/ specialisation Years of relevant experience COMPETENT PERSONS’ DECLARATION AND CONSENT continued R&R - 19

Diana van Buren BSc (Hons.) Geology Partner of Sound Mining Solution Proprietary Limited External – Independent consultant to DRDGOLD SACNASP 400107/14 Sound Mining House, 2A Fifth Avenue, Rivonia, 2128, Gauteng, South Africa DRD Mineral Resources 17 Vaughn Duke BSc (Hons.) Mining Engineering, MBA Partner of Sound Mining Solution Proprietary Limited External – Independent consultant to DRDGOLD FSAIMM 37179 ECSA 940314 Sound Mining House, 2A Fifth Avenue, Rivonia, 2128, Gauteng, South Africa DRD Mineral Reserves and Mineral Resources 38 EUROPE BATTERY METALS DEVELOPMENT Competent Persons Sifiso Siwela BSc Hons Geology, GDE Principal Consultant and Africa Manager at CSA Global (an ERM Group Company) External – Full-time employee of CSA Global (an ERM Group Company) SACNASP 400124/10 Ground Floor, Building 27 The Woodlands Office Park Woodlands Drive Woodmead 2148, RSA Keliber – Rapasaari, Syvajarvi, Tuoreetsaaret, Lantta, Emmes, Outovesi & Leviakangas deposits Mineral Resources 19 Ville-Matti Seppä M.Sc. (Geology) Department Manager of Geology & Mine Design Department, AFRY Finland Oy External – Full-time employee of AFRY Finland Oy EurGeol 1286 Jaakonkatu 3 FI-01621 Vantaa Finland Keliber – Rapasaari, Syvajarvi, Lantta & Outovesi deposits Mineral Reserves 14 AUSTRALIA GREEN METALS OPERATIONS Competent Persons Nicolas Spanswick BSc Geology Geology Superintendent Full-time employee of Century Mining Ltd MAIG 6050 L26, 360 Collins St, Melbourne, VIC 3000 AUSTRALIA Century Silver King East Fault Block South Block Mineral Resource 29 Brad Evans BEng (Mining) VP Technical Services Fulltime employee of Sibanye Stillwater FAusIMM 112822 L26, 360 Collins St, Melbourne, VIC 3000 AUSTRALIA Century Mineral Reserve 26 AUSTRALIA GREEN METALS EXPLORATION Competent Persons Nicolas Spanswick BSc Geology Geology Superintendent Full-time employee of Century Mining Ltd MAIG 6050 L26, 360 Collins St, Melbourne, VIC 3000 AUSTRALIA Mt Lyell - Prince Lyell, Western Tharsis & Copper Chert deposits Mineral Resource 29 Name Relationship with Group Professional registrations Work address Area of responsibility Competency/ specialisation Years of relevant experience COMPETENT PERSONS’ DECLARATION AND CONSENT continued R&R - 20 GEOPHYSICAL SURVEYING

LOCATION 22 US PGM OPERATIONS 23 Stillwater and East Boulder 23 PGM EXPLORATION 31 Marathon 31 BATTERY METALS EXPLORATION 33 LITHIUM 33 Rhyolite Ridge 33 COPPER 35 Altar 35 R&R - 21 AMERICAS 2

LOCATION

US PGM OPERATIONS STILLWATER AND EAST BOULDER ––––––––––––––––––––––––––––––––––––––––––––––––––––––––––––––––––––––––––––––––––––––––––––––––––––––––––––––––––––––––––––––––––––––– Property description The Stillwater (including Stillwater west and east) and East Boulder mines are underground mining operations, located near the towns of Nye and McLeod in Montana, US respectively. The mines are located on the front range of the Beartooth Mountains, with elevations exceeding 2,700m above mean sea level (amsl). The two operations are located within the Custer Gallatin National Forest. The mines both target the J-M Reef zone, predominantly via selective mechanised ramp and fill mining methods. As discussed in section 1, the Group considers the Stillwater and East Boulder mines, (together, the US PGM operations) material for the purpose of SK-1300. Ore from the operation is milled and treated at integrated concentrator complexes located at each operation. Concentrate smelting and refining takes place at the Columbus smelter complex, situated in the town of Columbus, Montana. The Stillwater mine currently produces approximately 260-300 koz 2E per annum of platinum and palladium in concentrate. The Stillwater mine has two principal mining sections: the Stillwater west section, which has been in operation since 1986, and the Stillwater east section, which is still in a build-up phase. The western section of the operation is accessed by a 580m deep shaft and five surface portals, while Stillwater East is accessed via three portal drives. The East Boulder mine has been in operation since 2002, and currently produces approximately 160-200 koz 2E per annum of platinum and palladium in concentrate. The East Boulder mine is accessed via twin 5,800m long tunnel bored portal drives. Mineral title Sibanye-Stillwater holds or leases 1,712 patented and unpatented lode, placer, tunnel or mill site claims in the Stillwater, Sweet Grass and Park counties of south-central Montana, encompassing 97.49km². These claims cover the entirety of the known J-M reef apex, as well as areas to the north of the northward dipping reef. The 1,712 claims are in good standing and have no expiration date. Of the 1,712 claims, 1,506 unpatented claims must be renewed annually with the Bureau of Land Management (BLM) and county offices, and an annual maintenance fee per claim is paid to the BLM to keep these claims valid. For operations involving more than 5 acres (~0.2km²), a detailed plan of operations must be filed with the appropriate BLM field office. Sibanye-Stillwater has a plan of operations for Stillwater and East Boulder mines approved by the US Forest Service and the Montana Department of Environmental Quality. The 13.96km² of permitted operating areas are in good standing. Infrastructure and equipment Stillwater mine Key infrastructure includes the mining operations and ancillary buildings that contain the concentrator, surface workshop, warehouse, changing facilities, headframe, hoist house, sand and paste plants, water treatment, storage facilities, and offices. The original concentrator plant was built in 1986. A new concentrate handling system was added in 2021 as part of a new plant construction. The balance of the new processing facility was commissioned in 2023. The Stillwater mine book value is US$900.8 million. R&R - 23

East Boulder mine Key infrastructure includes the mining operations and ancillary buildings that contain the concentrator, workshop, warehouse, changing facilities, twin tunnels to access mine, sand plant, water treatment, storage facilities and offices. The East Boulder mine book value is US$263.3 million. The Columbus metallurgical complex Key infrastructure includes the smelting, base metal refining, laboratory and recycling facilities. The plants were constructed in the early to mid-1990s, with improvements made as recently as the past two years. The book value of the metallurgical complex and associated recycling infrastructure is US$94.3 million. HOISTING AND PRODUCTION CAPACITIES Operating shaft Operating hoisting or rail capacity (ktpm) 5-year planned production (ktpm)* Stillwater shaft 135 118 Stillwater east rail 95 67 East Boulder rail 110 87 * Planned production is five-year hoisted average from 2024 onwards MINERAL PROCESSING AND CAPACITY Plant name Type Design capacity (ktpm) Operational capacity (ktpm) Average recovery factor (%) Stillwater Flotation 104 77 92.2 East Boulder Flotation 69 58 90.8 Mineralisation characteristics • The J-M Reef is a magmatic deposit defined as a palladium- platinum rich stratigraphic interval, mainly occurring within a troctolite (OB-I zone) of the Lower Banded Series • Palladium and platinum are the main PGMs exploited/present, together constituting between 7g/t to 40g/t over a variable economic mineralised thickness ranging from 0.9m – 2.7m and averaging 1.8m • Ratios of palladium to platinum in metallurgical concentrate are known to range from 3.4:1 (in situ 3.5:1) at Stillwater to 3.5:1 (in situ 3.6:1) at East Boulder US PGM OPERATIONS STILLWATER AND EAST BOULDER continued R&R - 24 COLUMBUS METALLURGICAL COMPLEX STILLWATER MINE
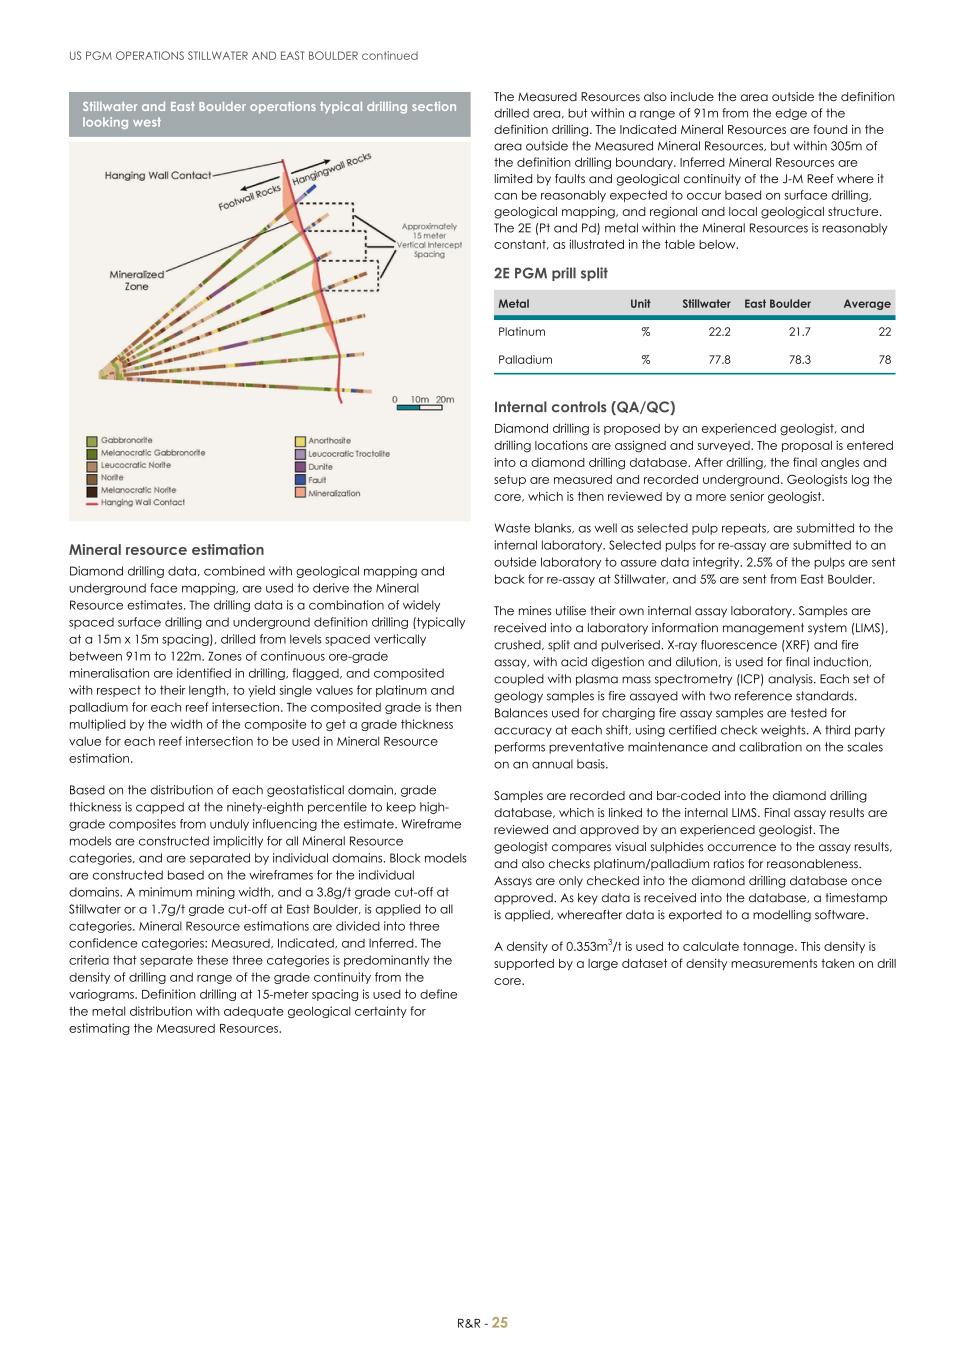
Stillwater and East Boulder operations typical drilling section looking west Mineral resource estimation Diamond drilling data, combined with geological mapping and underground face mapping, are used to derive the Mineral Resource estimates. The drilling data is a combination of widely spaced surface drilling and underground definition drilling (typically at a 15m x 15m spacing), drilled from levels spaced vertically between 91m to 122m. Zones of continuous ore-grade mineralisation are identified in drilling, flagged, and composited with respect to their length, to yield single values for platinum and palladium for each reef intersection. The composited grade is then multiplied by the width of the composite to get a grade thickness value for each reef intersection to be used in Mineral Resource estimation. Based on the distribution of each geostatistical domain, grade thickness is capped at the ninety-eighth percentile to keep high- grade composites from unduly influencing the estimate. Wireframe models are constructed implicitly for all Mineral Resource categories, and are separated by individual domains. Block models are constructed based on the wireframes for the individual domains. A minimum mining width, and a 3.8g/t grade cut-off at Stillwater or a 1.7g/t grade cut-off at East Boulder, is applied to all categories. Mineral Resource estimations are divided into three confidence categories: Measured, Indicated, and Inferred. The criteria that separate these three categories is predominantly the density of drilling and range of the grade continuity from the variograms. Definition drilling at 15-meter spacing is used to define the metal distribution with adequate geological certainty for estimating the Measured Resources. The Measured Resources also include the area outside the definition drilled area, but within a range of 91m from the edge of the definition drilling. The Indicated Mineral Resources are found in the area outside the Measured Mineral Resources, but within 305m of the definition drilling boundary. Inferred Mineral Resources are limited by faults and geological continuity of the J-M Reef where it can be reasonably expected to occur based on surface drilling, geological mapping, and regional and local geological structure. The 2E (Pt and Pd) metal within the Mineral Resources is reasonably constant, as illustrated in the table below. 2E PGM prill split Metal Unit Stillwater East Boulder Average Platinum % 22.2 21.7 22 Palladium % 77.8 78.3 78 Internal controls (QA/QC) Diamond drilling is proposed by an experienced geologist, and drilling locations are assigned and surveyed. The proposal is entered into a diamond drilling database. After drilling, the final angles and setup are measured and recorded underground. Geologists log the core, which is then reviewed by a more senior geologist. Waste blanks, as well as selected pulp repeats, are submitted to the internal laboratory. Selected pulps for re-assay are submitted to an outside laboratory to assure data integrity. 2.5% of the pulps are sent back for re-assay at Stillwater, and 5% are sent from East Boulder. The mines utilise their own internal assay laboratory. Samples are received into a laboratory information management system (LIMS), crushed, split and pulverised. X-ray fluorescence (XRF) and fire assay, with acid digestion and dilution, is used for final induction, coupled with plasma mass spectrometry (ICP) analysis. Each set of geology samples is fire assayed with two reference standards. Balances used for charging fire assay samples are tested for accuracy at each shift, using certified check weights. A third party performs preventative maintenance and calibration on the scales on an annual basis. Samples are recorded and bar-coded into the diamond drilling database, which is linked to the internal LIMS. Final assay results are reviewed and approved by an experienced geologist. The geologist compares visual sulphides occurrence to the assay results, and also checks platinum/palladium ratios for reasonableness. Assays are only checked into the diamond drilling database once approved. As key data is received into the database, a timestamp is applied, whereafter data is exported to a modelling software. A density of 0.353m3/t is used to calculate tonnage. This density is supported by a large dataset of density measurements taken on drill core. US PGM OPERATIONS STILLWATER AND EAST BOULDER continued R&R - 25

Grade control and Mineral Resource definition drilling summary Planned 2024 Actual 2023 Actual 2022 Operation Drilled (m) Expenditure (Rm) Drilled (m) Expenditure (Rm) Drilled (m) Expenditure (Rm) Stillwater 191,382 113.5 237,611 234.1 231,930 216.3 East Boulder 52,758 38.6 42,242 32.6 35,670 23.4 2PGE Mineral Resource estimate at 31 December 2023 Mineral Resources Exclusive of Mineral Reserves 31 Dec 2023 31 Dec 2022 PGM Americas Tonnes Grade PGM Tonnes Grade PGM Stillwater and East Boulder (Mt) (g/t) (Moz) (Mt) (g/t) (Moz) Operations Stillwater Underground Measured 14.6 11.8 5.5 13.2 10.6 4.5 Indicated 10.4 9.0 3.0 10.8 7.7 2.7 Measured + Indicated 24.9 10.6 8.5 24.0 9.3 7.2 Inferred 58.0 12.0 22.4 57.9 12.3 22.9 East Boulder Underground Measured 6.5 11.0 2.3 6.1 10.0 1.9 Indicated 8.9 9.5 2.7 8.3 8.1 2.2 Measured + Indicated 15.4 10.2 5.0 14.3 8.9 4.1 Inferred 55.8 11.9 21.3 56.1 12.1 21.9 Total Measured + Indicated 40.4 10.4 13.5 38.3 9.1 11.3 Grand total 154.2 11.5 57.2 152.3 11.4 56.0 Notes: Cut-off grade Stillwater 3.8g/t, East Boulder 1.7g/t. For assumed Metallurgical recoveries refer to page 24. For commodity price assumptions refer to page 17 Section 1. On a Mineral Resources exclusive of Mineral Reserves basis, the year-on-year change is +2.1%, mainly attributed to the continued improvement and refinement of the Mineral Resource estimation methodology. US PGM OPERATIONS STILLWATER AND EAST BOULDER continued R&R - 26 3D DIGITAL SCANNING AND MAPPING OF HEADINGS AT THE STILLWATER MINE

Stillwater mine Mineral Resource classification: Section looking north East Boulder mine Mineral Resource classification: Section looking north Cut-off grade (g/t) Combined Stillwater and East Boulder Mineral Resource grade tonnage curve Tonnage (Mt) Resource Grade (g/t) 0 4 8 12 16 20 24 28 32 0 50 100 Mineral Reserves estimation Mineral Reserves are derived from detailed operational planning exercises. Annual operation design, production and development schedules are completed utilising various software programmes. Mine planning utilises and takes into consideration historical technical parameters achieved. In addition, Mineral Resource to Mineral Reserve modifying factors – such as overbreak, ore loss (deletion) and minimum mining widths associated with different mining methods – are employed during planning and scheduling. Initially, the design and scheduling includes all secondary development to access the potential stope (ore) blocks identified in the detailed drilled-out portion of the Measured Resource category. This informs the Proved Mineral Reserves. Probable Mineral Reserves are derived from the area outside the definition-drilled area, but within the Measured and Indicated Mineral Resources envelope. Within each domain, thickness in the blocks are estimated using simple kriging, which uses the available drilling data but relies heavily on the global mean for the areas further from drilling data. A mining mix is applied to the Probable Reserves to account for the percentages of different mining methods to be used. A domain specific mineability block factor, the grades from the mineability calculations, and modifying factors are then applied to reach the final Probable Mineral Reserves estimate. Mineability is defined as the proportion of mineable ore in stope blocks to total ore within each domain’s definition drilled area at current economic conditions. Each stope block is subjected to an economic test, which results in the determination of a net profit and, a net present value (NPV) of the planned stope, and a payback period. An economic viability test is completed for the LoM plans of both the mines. Mining method The two principal mining methods are: • Mechanised ramp and fill (both overhand and underhand) (80% – 90%) • Sub-level extraction (SLE) by long hole, open stoping with hydraulic backfilling (10% – 20%) US PGM OPERATIONS STILLWATER AND EAST BOULDER continued R&R - 27

Modifying factors applied in converting Mineral Resources to Mineral Reserves Stillwater East Boulder Parameter Unit 2023 2022 2023 2022 Mineral Reserve cut-off grade g/t 6.8 6.8 1.7 1.7 Mineability factor % 57 57 70 72 Sub-level extraction loss factor % 25 25 25 25 Ramp and fill stoping proportion % 93 93 80 80 Sub-level stoping proportion % 7 7 20 20 Overbreak factor (average) % 15.0 15.0 8.0 0.0 Deletion factor (average) % 15.5 9.0 6.6 3.0 Minimum mining width cm 229 229 229 229 Concentrator recovery % 92 92 91 91 Smelter/base metal refinery recovery % 99 99 99 99 2PGE Mineral Reserve estimate at 31 December 2023 Mineral Reserves 31 Dec 2023 31 Dec 2022 PGM Americas Tonnes Grade PGM Tonnes Grade PGM Stillwater and East Boulder (Mt) (g/t) (Moz) (Mt) (g/t) (Moz) Operations Stillwater Underground Proved 6.8 15.1 3.3 6.0 14.6 2.8 Probable 25.0 15.5 12.4 26.0 14.8 12.4 Proved + Probable 31.7 15.4 15.7 32.1 14.8 15.3 East Boulder Underground Proved 4.2 11.0 1.5 4.0 11.9 1.5 Probable 24.5 11.6 9.1 24.2 12.2 9.5 Proved + Probable 28.7 11.5 10.6 28.2 12.2 11.0 Grand total Proved + Probable 60.4 13.5 26.3 60.2 13.6 26.3 Notes: For commodity price assumptions refer to page 17 Section 1. Please refer to the modifying factor table above for cut-off grades and metallurgical recoveries. Stillwater mine Mineral Reserve classification: Section looking north East Boulder mine Mineral Reserve classification: Section looking north US PGM OPERATIONS STILLWATER AND EAST BOULDER continued R&R - 28

M o z Combined Stillwater and East Boulder 2E PGM Mineral Reserve reconciliation 26.3 -0.5 0.2 2.2 -1.9 26.3 20 22 R es er ve s D ep le tio n In cl us io n/ ex cl us io n Es tim at io n M od ify in g fa ct or s 20 23 R es er ve s 0 10 20 30 Notes: The unchanged year-on-year Mineral Reserves are principally attributed to the improvement and refinement in Mineral Resource estimation methodology, and changes to the Mineral Reserve modifying factors. This led to the following changes: – an increase of 0.2Moz due to additions from new drilling in the Proved Reserves – an increase of of 2.2Moz,due to the removal of the high yield limit in the Resource estimation, which is a more geostatistically sound use of the data. – a decrease of 1.9Moz attributed to an adjustment of the modifying factors PGM basket price variation (M o z) N PV U S$ b illio n 2E PGM Mineral Reserve price sensitivity and undiscounted NPV 15.7 15.7 15.7 15.7 15.7 15.7 15.7 7.2 10.6 10.6 10.6 10.6 10.6 0.8 4.1 5.9 7.2 8.6 10.0 14.2 Stillwater East Boulder Undiscounted NPV of Proved and Probable Mineral Reserves (US$ billion) -25% -10% -5% 0% 5% 10% 25% 0.0 10.0 20.0 30.0 0.0 5.0 10.0 15.0 Life of mine The Stillwater mine It is estimated that current Mineral Reserves will sustain the Stillwater mine until 2053. At the Stillwater East section of the mine, there is potential to significantly expand the Mineral Reserves beyond 2053. East Boulder It is estimated that the current Mineral Reserves will sustain East Boulder until 2068. Estimation risks Geological: The grade distribution is generally variable, and in areas where drilling density is low, localised estimation might be inaccurate. Globally though, mineralised trends tend to be more consistent, decreasing the risk over the LoM. To mitigate this risk, definition drilling density in the Proved Reserve areas are typically high (15m spacing). Geohydrological: Although mining operations at Stillwater and East Boulder have not experienced material interruptions due to groundwater problems, a significant amount of groundwater was encountered at the Stillwater East project during the development of the main access adits and the Benbow decline. The Stillwater mine has initiated a multi-pronged approach to mitigating this risk. Geotechnical: Ground conditions can be challenging in certain parts of the mine. Areas of poor ground conditions can impact mining productivity. Both mines have accumulated an extensive geotechnical database and developed ground classifications and support measures that are suited to the rock mass. The support systems and standards in place at both mines are sufficient to minimise the potential impact of any geotechnical risk. Execution gap on LoM plans: Slower than planned production build- ups, underestimating manpower requirements, regulatory changes, grade and tonnage underestimation and unknown geological conditions can all contribute to a gap between planned and achieved production rates, which could impact the execution of LoM plans. Short interval controls are in place to enable the implementation of timeous interventions and, therefore, correction of deviations to the plans. Skilled labour: The operations have experienced a shortage of skilled personnel, due to high attrition rates and an industry-wide labour scarcity. This has contributed to lower than planned production rates, which could impact the execution of LoM plans. The operations have put in place retention and improvement initiatives, and have instituted training programs to hire local people to fill critical roles, e.g. mechanics. Cost escalation: The previously mentioned factors, compounded by operational constraints relating to the COVID-19 pandemic and various production disruptions, have resulted in significantly; higher unit costs . Operational restructuring undertaken in 2022 and 2023 included measures to improve site cost efficacy and are supplemented by ongoing improvement initiatives to further contain cost escalation and help mitigate this risk. Tailings storage capacity: TSFs at Stillwater and East Boulder mines have adequate storage capacity for the medium term (seven to ten-year period). Permitting for the construction of a new TSF may require a period of up to five years, and is in process. It is unlikely that the operations will run out of TSF capacity before approvals for the construction of new TSFs, or the upgrading of the existing TSFs are received. Tailings deposition and capacity Stillwater Currently 44% (2023) of all concentrator tailings are returned underground for backfill. The remaining 56% is sent via pipeline to the Hertzler TSF, situated 11km north of Stillwater mine. The current storage facility has 3,900kt of storage remaining, with expansion planned to add an additional 10,200kt of storage in the early 2030s. The Hertzler storage facility, with the planned expansion, will have adequate storage for current Proved and Probable Mineral Reserves. US PGM OPERATIONS STILLWATER AND EAST BOULDER continued R&R - 29

East Boulder Currently 48% (2023) of all concentrator tailings are returned underground for backfill, with the remaining 52% sent via pipeline to a TSF adjacent to the mine site. The current storage facility has 768kt of storage remaining in stage 4 of the expansion; with 3,000kt of storage under construction in stages 5 & 6 of the expansion. In addition, a future expansion is planned to add an additional 5,500kt of storage in the early 2030s at the Lewis Gulch facility. These expansions will accommodate tailing storage through to approximately 2044. Additional tailings storage capacity to handle the remaining Reserves is included in the LoM financials, and detailed designs will be completed in the coming years. Key developments and brownfields projects During 2023, the US PGM operations continued its drive to protect margins and to ensure long-term value, implementing a restructuring to reduce operating and capital cost structures and ensure sustainability through a lower palladium price environment. The restructuring is not expected to significantly impact current 2E mine production or recycling production, but will result in lower costs and capital. The proposed 2022 build-up in the production profile will however be delayed until such time as market conditions warrants it. Operational statistics and history Annual development results Category Unit 2023 2022 Stillwater Primary off-reef development (declines, inclines, haulage, crosscuts) m 4,899 5,738 Footwall lateral m 4,841 5,136 Secondary off reef development (stope access and stope ramps) m 8,064 7,689 Total m 17,803 18,563 East Boulder Primary off-reef development (declines, inclines, haulage, crosscuts) m 696 1,373 Footwall lateral m 1,180 1,441 Secondary off reef development (stope access and stope ramps) m 4,609 3,925 Total m 6,486 6,739 Operational statistics 2021 2022 2023 Underground tonnes milled (kt) 1,469 1,154 1,174 Underground yield (g/t) 11.96 11.31 11.37 Total Annual 2E production (koz) 570 421 427 Operating cost underground (R/t) 5,174 6,811 7,837 Total capital expenditure (Rm) 4,556 5,416 6,841 AISC (R/oz) 14,851 25,951 34,465 AISC (US$/oz) 1,004 1,586 1,872 Note: AISC calculated based on produced Oz • The J-M Reef was discovered in 1974 by Johns-Manville Corporation, and was developed by Manville, Chevron and LAC Minerals Ltd. with production commencing in 1986 • By 1990 the smelter was commissioned and in 1994 the Stillwater Mining Company (SMC) was listed • In 1996, the vertical shaft at the Stillwater mine was completed • In 2000, the Hertzler tailings impoundment was constructed • The East Boulder mine was established in 2002 • On 23 June 2003, SMC completed a stock purchase transaction with MMC Norilsk Nickel (Norilsk Nickel), whereby a subsidiary of Norilsk Nickel became a majority stockholder of the company. In December 2010, Norilsk Nickel disposed of its entire ownership interest in SMC through a secondary offering of the SMC shares in the public market • From 2010, SMC operated as a NYSE listed company until May 2017, when it was delisted following its acquisition by Sibanye Gold Limited • The PGM recycling business was established in 2010 • Sibanye-Stillwater acquired SMC in 2017, the year which also saw first production from the Stillwater East project US PGM OPERATIONS STILLWATER AND EAST BOULDER continued R&R - 30

PGM EXPLORATION MARATHON –––––––––––––––––––––––––––––––––––––––––––––––––––––––––––––––––– Property description The Marathon project is an advanced stage PGM-gold-copper exploration project, located approximately 10km north of the town of Marathon, Ontario, Canada, situated adjacent to the Trans- Canada Highway No 17 on the north-east shore of Lake Superior. The project is at FS level. Exploration for copper and nickel deposits in the greater Marathon area started in the 1920s and continued until the 1940s with the discovery of several titaniferous magnetite and disseminated chalcopyrite occurrences. During the past four decades, the Marathon PGM-copper project has undergone several phases of exploration and economic evaluation, including geophysical surveys, prospecting, trenching, a diamond drilling programme, geological studies, resource estimates, metallurgical studies, mining studies and economic analyses. As at 31 December 2023, Sibanye-Stillwater owned an effective attributable share of 13.9%, via its equity interest in Generation Mining Ltd. Mineral title Generation Mining’s land position includes 46 leases covering 66.03 km², and 924 mining claims covering 196.25km². The expiry dates of the leases vary between 2031 and 2041, while the mining claims expires between 2025 and 2028. The claims are registered in the name of Generation PGM Inc, a subsidiary of Generation Mining. All exploration activities are required to follow Schedule 1 of Ontario Regulations 308/12 and applicable Provincial Standards for Early Exploration. All claims have been renewed to their respective anniversary dates. Assessment reporting and transfer of work credits are required for claims to keep them in good standing. To renew leases is via an application, along with a fee and a written report of past activities justifying the need for renewal. This is required to be completed three months before the respective expiry dates. Mineralisation characteristics The Marathon deposit consists of several large, thick, and continuous zones of disseminated sulphide mineralisation hosted within the Two Duck Lake Gabbro. The mineralised zones occur as shallow, dipping, sub-parallel lenses that follow the basal gabbro contact, and are labelled as footwall zone, main zone, hanging wall zone, and W-horizon. The main zone is the thickest and most continuous zone. For 516 drill hole intersections, with intervals greater than 4m thick, the average thickness is 35m and the maximum is 183m. The Marathon PGM-copper deposit, formed by sulphide accumulation in basins and troughs of the magma conduit, underwent significant upgrading of copper and PGM content by the process of multistage dissolution upgrading. The Geordie deposit is hosted by the Geordie Lake Gabbro, which has a north trending strike length of 2.5km, and varies in thickness from 50m to 600m. Mineralisation consists primarily of disseminated chalcopyrite and bornite, and occurs within a thick continuous basal zone that dips 45° to 60° west, and can be traced over a strike length of 1.7km. The Sally deposit is situated on the north-eastern margin of the complex, and strikes east-southeast, dips 45° to 50° south, extends over a 1.2km strike length, and is open in all directions. Drilling has identified four main mineralised zones at Sally. The second and third mineralised zones are typically 40m to 50m thick, and are hosted by the Two Duck Lake Gabbro, which is the same host rock as at the Marathon deposit. Key developments On March 31, 2023, Generation Mining released the results of a feasibility study update. The planned mine is expected to produce an average of 166,000 ounces of payable palladium and 41 million pounds of payable copper per year over a 13-year LoM. Over the LoM, the Marathon project is anticipated to produce 2,122,000 ounces of palladium, 517 million lbs of copper, 485,000 ounces of platinum, 158,000 ounces of gold, and 3,156,000 ounces of silver in payable metals. Other key milestones achieved during the year include: • Finalised an offtake term sheet for the treatment of copper concentrate from the project. • Advanced project financing, by executing a mandate letter to arrange a senior secured project finance facility of up to US$400 million, to fund the construction and development of its Marathon palladium-copper project • Advanced project permitting activities, with all outstanding permits expected to be obtained during 2024 (See https://genmining.com/projects/feasibility-study/) Generation Mining has published Mineral Reserves for the project on the back of the FS outcome. Sibanye-Stillwater is only publishing attributable Mineral Resources until such stage as the project has been fully permitted, funded and approved for construction. R&R - 31

Marathon Mineral Resource estimate at 31 December 2023 Mineral Resources 31 Dec 2023 PGM Americas Tonnes PGM PGM Copper Copper Silver Silver Gold Gold Exploration (Mt) (g/t) (Moz) (%) (Mlb) (g/t) (Moz) (g/t) (Moz) Marathon Measured 22.1 0.8 0.6 0.20 99 1.8 1.2 0.07 0.05 Indicated 10.0 0.6 0.2 0.22 49 1.5 0.5 0.06 0.02 Measured + Indicated 32.1 0.7 0.7 0.21 148 1.7 1.7 0.07 0.07 Inferred 4.0 0.5 0.1 0.23 20 1.4 0.2 0.05 0.01 Grand total 36.0 0.7 0.8 0.21 167 1.7 1.9 0.06 0.08 Marathon Mineral Resource estimate at 31 December 2022 Mineral Resources 31 Dec 2022 PGM Americas Tonnes PGM PGM Copper Copper Silver Silver Gold Gold Exploration (Mt) (g/t) (Moz) (%) (Mlb) (g/t) (Moz) (g/t) (Moz) Marathon Measured 18.8 0.8 0.5 0.20 84 1.5 0.9 0.07 0.04 Indicated 21.5 0.6 0.4 0.21 102 1.7 1.1 0.05 0.04 Measured + Indicated 40.3 0.7 0.9 0.21 186 1.6 2.0 0.06 0.08 Inferred 5.0 0.5 0.1 0.23 25 1.5 0.2 0.03 0.01 Grand total 45.3 0.7 1.0 0.21 211 1.6 2.3 0.06 0.09 Notes: • PGM = Pt+Pd • The attributable Marathon Mineral Resources changed from 2022 to 2023 due to a change in attributable interest to 13.90% (2022: 18.19%) • The estimate includes the main Marathon and the satellite Geordie and Sally deposits • The Marathon deposit Mineral Resources are reported within an optimised pit shell at a cut-off NSR value of C$13/t, and Geordie and Sally at C$15/t • The Mineral Resource estimate was based on US$ metal prices of US$1,100/oz for palladium, US$900/oz for platinum, US$3/lb for copper, US$1,300/oz for gold and US$16/oz for silver and the US$:C$ exchange rate used was 0.77 • The net smelter royalties (NSR) estimates for the project use flotation recoveries of 93% for copper, 82% for palladium, 80% for platinum, 80% for gold, 75% for silver and smelter payables of 96% for copper, 93% for palladium, 88% for platinum, 90% for gold and 90% for silver • The open-pit optimisation used a mining cost of C$2/t, combined processing, general and administration and off-site concentrate costs of C$15/t and pit slopes of 50º PGM EXPLORATION MARATHON continued R&R - 32

BATTERY METALS EXPLORATION LITHIUM RHYOLITE RIDGE ––––––––––––––––––––––––––––––––––––––––––––––––––––––––––––––––– Property description Rhyolite Ridge is an advanced stage exploration project located in Esmeralda County, Nevada, US. Rhyolite Ridge aims to extract a large, shallow lithium-boron deposit, located close to existing infrastructure, and located between Las Vegas and Reno, Nevada and aims to be one of the first large-scale US lithium project to enter production. The future 50:50 JV agreement between Sibanye-Stillwater and ioneer Limited, whereby ioneer would maintain the operational management responsibility, is subject to the satisfaction of certain conditions precedent before Sibanye-Stillwater will commit funding to the project. Until such time as the conditions are met, the attributable disclosure is based on Sibanye-Stillwater's current 6.91% equity stake in ioneer Limited. Mineral title In relation to its mine plan of operations (MPO) ioneer holds 386 unpatented relevant mining claims, located on US federal land administered by the Bureau of Land Management (BLM), totalling 31.6 km². For the permitting of the mining operation, ioneer has acquired two of the four major/critical permits and authorisations: 1. The Nevada Division of Environmental Protection (NDEP) – Bureau of Mining Regulation and Reclamation (NDEP-BMRR) Water Pollution Control Permit (WPCP) was issued on July 1, 2021 2. The NDEP – Bureau of Air Pollution Control (BAPC) Class II Air Quality Operating Permit, was issued on June 14, 2021 During 2022, ioneer submitted a revised MPO application for stage 1 mining, for review by the BLM. The BLM published a notice of intent in the Federal Register during November 2022, which marked the commencement of work on the environmental impact statement (EIS) and public engagement process in accordance with the requirements of the National Environmental Policy Act (NEPA). The NEPA process culminates in the BLM’s Record of Decision (ROD), which will allow the company to commence construction of the Rhyolite Ridge Project. R&R - 33 LANDSCAPE AT THE LOCATION OF THE RHYOLITE RIDGE PROJECT IN NEVADA

Mineralisation characteristics Rhyolite Ridge is a sediment hosted lithium-boron deposit. The mineralisation is hosted within carbonate-rich, fine-grained sediments (marl) of tertiary age, that were deposited in a shallow lake environment. The tenements cover two sedimentary basins (north and south) containing thick, shallow, flat-lying zones of lithium-boron-potassium mineralisation. The lithium occurs within mixed illite-smectite layers, while the boron occurs in the mineral searlesite. The mineralised layers vary in thickness from 13m to 40m, outcrops towards the west, is relatively flat dipping, and is typically overlain by ~21m thick overburden. The current defined Mineral Resource is restricted to the South basin, where the majority of ioneer's work has focused due to higher lithium and boron grades present. The north basin is considered highly prospective due to the sheer size of the deposit and the thick (>100m) and consistent grades present from surface. Historic wide spaced drilling by US Borax (part of Rio Tinto) during the 1980s and 1990s show very thick (100m-260m) zones of lithium-boron mineralisation at very shallow depths (<30m) over an area of >5 km², with individual 3m intervals up to 3,890ppm Li. Key developments A feasibility study was completed by Fluor in April 2020. The study was based on a mining rate of 2.5Mtpa mined, over a 26y LoM, producing more than 20ktpa of Li2CO3 (y1-3) or LiOH.H2O (y4 onwards), and Boric Acid of 174,400 Tonnes (y1-26). During January 2023, the U.S. Department of Energy offered a conditional commitment for a loan of up to US$700 million for the Rhyolite Ridge project. Financial closure of the loan is conditional on several achievements, including a positive ROD and a final investment decision. Effective March 31, 2023, ioneer announced an updated and materially increased Mineral Resource estimate for the South basin, which now incorporates additional mineralised types and layers within the same aerial footprint, which now totals 360.2Mt grading 1,750ppm Li and 6.5% B, for a contained 3,350kt of LCE. Towards amending and updating the FS to take into account developments relating to protecting the endangered Thiems Buckwheat, ioneer has completed a successful geotechnical drilling program that covers the southern and southeastern sections of the South basin. Work continues on updates for Mineral Resources and Mineral Reserves, capital and operating cost estimates and the financial model. A final, updated FS is expected during Q3 2024. A key permitting milestone was recently (January 2024) achieved with the completion by the BLM of the administrative draft EIS. A final ROD is expected by H2 2024. Rhyolite Ridge Mineral Resource estimate at 31 December 2023 Mineral Resources 31 Dec 2023 31 Dec 2022 LITHIUM Americas Tonnes Li LCE H₃BO₃ H₃BO₃ Tonnes Li LCE H₃BO₃ H₃BO₃ (Mt) (%) (kt) (%) (kt) (Mt) (%) (kt) (%) (kt) Exploration Rhyolite Ridge Measured 3.0 0.17 28 8.2 248 2.7 0.17 25 8.3 225 Indicated 17.3 0.17 160 3.4 595 6.1 0.16 50 8.1 494 Measured + Indicated 20.4 0.17 188 4.1 843 8.8 0.16 75 8.2 720 Inferred 4.5 0.18 44 2.8 128 1.4 0.16 12 7.9 106 Grand total 24.9 0.17 232 3.9 971 10.2 0.16 87 8.1 826 Notes: • The reported Mineral Resources has been adjusted to reflect Sibanye-Stillwater’s 6.91% interest in ioneer Ltd. • Mineral Resources are constrained to an optimised open-pit shell making use of a co-product cut-off grade of 5,000ppm boron • For the lithium Mineral Resources, LCE content was calculated by multiplying the Li (%) content by a factor of 5.323. Lithium hydroxide monohydrate (LiOH.H2O)) can be derived from LCE by dividing by a factor of 0.88 BATTERY METALS EXPLORATION LITHIUM: RHYOLITE RIDGE continued R&R - 34 DRILL CORE OF HIGH-GRADE LITHIUM-BORON MINERALISATION OUTCROP OF LI-BEARING SEARLESITE MINERALISATION

COPPER ALTAR ––––––––––––––––––––––––––––––––––––––––––––––––––––––––––––––– Property description The Altar project is a large, shallow to intermediate depth, copper- gold porphyry deposit located in San Juan province, Argentina. The Altar deposit was discovered in the mid-1990s and early-phase exploration continued until 1999. Project evaluation work to date has primarily focused on assessing the feasibility of an open-pit and/ or underground operation. Sibanye-Stillwater acquired the Altar project in 2017 as part of the Stillwater acquisition. Aldebaran Resources Ltd. (Aldebaran) entered into an arrangement agreement with Sibanye-Stillwater in 2018 to acquire a 60%, and eventually 80%, interest in the Altar project, subject to funding certain exploration expenditures. Aldebaran also assumed management of the project. Mineral title The property and mineral concessions are held by Peregrine Metals Ltd., which includes the Argentine subsidiary Minera Peregrine Argentina. The Altar project consists of nine mining concessions and nine land easements comprising rights of way or occupancy. It also includes an option on the five adjacent Rio Cenicero concessions, four of which are adjacent to the Altar property and one located to the south-west. The Altar concessions and exploration permits collectively cover about 84.4km², and the Rio Cenicero concessions cover an additional 37.2ha. In addition, permits to open and service the camp, as well as access water for exploration purposes, are maintained annually. All legal aspects and tenure are in order. Mineralisation characteristics The two main ore zones within the Altar area of the deposit are the Altar central and the Altar east zones. The Quebrada de la Mina (QDM) Mineral Resource (inclusive of the Altar project) is located 3km west of the main Altar deposit and is a near-surface gold Mineral Resource hosted in pyrite within a dacite porphyry. Mineralisation at the Altar deposits is closely associated with the different porphyry stocks and related hydrothermal breccias, but is also found in rhyolites, andesites and volcanic breccias. The well- developed copper mineralisation shows a strong relationship to the distribution and intensity of sericitic and potassic alteration. The copper mineralisation associated with the potassic alteration, mainly porphyry style chalcopyrite–bornite mineralisation, was reconstituted as hypogene assemblages of pyrite, chalcocite and bornite within the sericitic alteration zone. Key developments During 2023, Aldebaran completed the US$30 million in expenditure required to earn a 60% interest in the Altar copper-gold project pursuant to its joint venture agreement with Sibanye-Stillwater. Additionally, Sibanye-Stillwater has received notice that Aldebaran intends to proceed with the second option to spend US$25 million over a three-year period to acquire an additional 20% interest in the Altar project. During 2023, 19,591 meters in 18 exploration drill holes were completed. The main goal of the drill campaign was to follow up on targets generated from the results of geophysical surveys. Aldebaran released the results of a number of material intersections from the drill campaign. (See https://aldebaranresources.com/ news-releases/2023/.) No Mineral Resource estimation update took place during 2023, and the estimates reported are considered current, but reflects work dated 2021. Altar Mineral Resource estimate as at 31 December 2023 Mineral Resources 31 Dec 2023 31 Dec 2022 COPPER Americas Tonnes Copper Copper Gold Gold Tonnes Copper Copper Gold Gold Exploration (Mt) (%) (Mlb) (g/t) (Moz) (Mt) (%) (Mlb) (g/t) (Moz) Altar Measured 310.1 0.43 2,963 0.1 1.2 637.9 0.43 6,095 0.1 2.4 Indicated 282.1 0.41 2,573 0.1 0.7 580.3 0.41 5,293 0.1 1.5 Measured + Indicated 592.2 0.42 5,536 0.1 1.9 1,218.2 0.42 11,388 0.1 3.9 Inferred 92.6 0.42 851 0.1 0.2 190.4 0.42 1,750 0.1 0.4 Grand total 684.7 0.42 6,386 0.1 2.1 1,408.6 0.42 13,138 0.1 4.3 Notes: • Combined estimate for the deposits of Altar Central, Altar east and QDM • Copper reflects the estimated grade of copper that could be processed by sulphide flotation • The Mineral Resources for Altar Central, east, and QDM have “reasonable prospects of economic extraction” based on a conceptual open-pit design. • Mineral Resource cut-off grades of 0.30% EqCu = $13.99 NSR • The 2021 Mineral Resource metal price assumptions were: copper US$3.00/lb, gold US$1,500.00/troy ounce and silver US$20.00/troy ounce R&R - 35

SOUTHERN AFRICA LOCATION 37 GOLD OPERATIONS 61 PGM OPERATIONS 38 Kloof 63 Marikana 43 Driefontein 69 Rustenburg 48 Beatrix 74 Kroondal 52 Cooke 78 Mimosa 56 DRDGOLD 81 PGM EXPLORATION 59 GOLD DEVELOPMENT 84 Akanani 59 Burnstone 84 Limpopo 60 GOLD EXPLORATION 86 Southern Free State (SOFS) 86 R&R - 36 3

LOCATION

PGM OPERATIONS GEOLOGICAL SETTING –––––––––––––––––––––––––––––––––––––––––––––––––––––––––––––––––– South African operations The Bushveld Igneous Complex (BIC) is the world’s largest known mafic igneous layered intrusion, and contains more than 85% of the world’s known Mineral Resources of PGMs. The mineralised Merensky and UG2 reefs are host to the PGMs at the Rustenburg, Kroondal and Marikana operations, and are contained within the Rustenburg layered suite (RLS) of ultramafic to mafic rocks. These reefs are laterally continuous and extensive. The BIC occurs geographically as discrete compartments categorised as limbs. Sibanye-Stillwater’s PGM operations (Marikana, Rustenburg and Kroondal) are located on the Western Limb, south-east of the Pilanesberg Complex, while the PGM exploration projects are located on the eastern and northern limbs of the BIC. The Merensky Reef typically consists of a pegmatoidal feldspathic pyroxenite layer, bounded on the top and bottom by thin chromitite layers (stringers) dipping approximately 9º to 12º in a north-easterly direction. The Merensky Reef transitions across the Sibanye-Stillwater operations, from a thin pegmatoidal reef to a thick non- pegmatoidal reef, with a major transition at the Marikana operation. The Merensky Reef contains economically significant base metal sulphide and PGM mineralisation. The UG2 Reef is rich in chromitite, but with lower gold, copper and nickel values, as compared to that of the Merensky Reef. The main UG2 layer (main seam) has an average thickness varying between 55cm and 75cm. The top of the UG2 Reef consists of a thin layer of chromitite, averaging 20cm in thickness generally referred to as the leader seam, separated from the main seam by a non-mineralised pyroxenite layer of variable thickness of 5cm to 6m. Across the PGM operations, the UG2 Reef occurs vertically between 90m and 180m below the Merensky Reef. The Merensky and the UG2 Reefs are affected by structural and other geological features, including potholes and iron-rich ultramafic pegmatoids (IRUPs), which result in geological losses and have an impact on mining. Zimbabwean operation The Mimosa mine is located on the Wedza sub-chamber of the southern portion of the Great Dyke in Zimbabwe, approximately 32km from the town of Zvishavane. The Great Dyke is divided vertically into a lower ultramafic sequence, and an upper mafic unit. Economic PGM mineralisation occurs within the main sulphide zone (MSZ). The MSZ is typically 2m to 3m thick, but can reach up to 20m thick locally, resulting in a marked decrease in grade with thickening of the zone. Although mineralisation is very consistent, localised disruption to the reef due to pegmatoids and washout channels have been encountered in some areas of the operation. Unlike the BIC, the reef is not in contact with or within chromitite seams. The MSZ has definitive metal profiles that are consistent. Simplified stratigraphy of the Rustenburg layered suite (after Smith et al. 2004) R&R - 38 UG2 REEF UNDERGROUND EXPOSURE

Mineral Resource estimation (managed operations) The Mineral Resource estimates are based on data generated from underground and surface diamond drilling, underground channel sampling, geological mapping, 3D surface seismic surveys, and aerial magnetic surveys. Mineral Resource estimation is carried out using advanced geological software. The Merensky and UG2 reefs are subdivided into a number of geozones, which are used as separate geostatistical domains for estimation. Detailed exploratory data analysis are carried out on individual domains. No interpolation takes place across significant geological structures. Modelling at the Rustenburg, Kroondal and Marikana operation is completed using 2D block models. The main interpolation methodology utilised is ordinary kriging. The block widths in the Mineral Resources are compiled over a minimum practical mining cut for both Merensky and UG2 Reefs. It includes additional varying thickness overbreak material to a minimum mining width. At the Rustenburg operation, for both the Merensky and UG2 reef, a minimum 105cm mining width was adopted. At the Kroondal operation, a minimum 200cm mining width was modelled for all areas where a trackless mining method is applied. At the Marikana operation, for both the Merensky and UG2 reef, a minimum 110cm mining width was modelled based on a combination of the reef width and rock engineering considerations. Geological losses are split into known and unknown (anticipated) losses, and determined for each structural domain and per shaft. All Mineral Resources reported are exclusive of geological losses. The final Mineral Resource quantities are determined by projecting the 2D estimated parameters onto the 3D structural polygons, exclusive of the geological losses, and reporting them on a 4E and 6E composite grade basis. Due to the persistent grade distribution across the operations and no mining selectivity, typical cut-off grades are not applied. On a regional scale, more than 99.9% of Mineral Resource blocks meets reasonable prospect for eventual economic extraction (RPEEE) criteria; those blocks that don’t meet this prospect would have to be extracted to reach the balance. Areas that are deemed unmineable due to aspects such as IRUP, structural complexity and facies, are excluded. Resource classifications are based on the scoring and rating of five statistical parameters (kriging variance, kriging efficiency, slopes of regression, search volume, and number of samples) and seven non- statistical parameters: aeromagnetic survey, seismic interpretation, structural model, facies interpretation, geological loss estimates, historical data (mining history), and quality assurance/quality control (QA/QC) reports. Prill splits The 4E PGMs (platinum, palladium, rhodium and gold) at the SA PGM operations occur together with other PGMs, including ruthenium and iridium and metals such as copper, nickel, cobalt and chromium. The table below details the ratio of occurrence of the elements in the various ore types, also called the “prill split”, on a 4E and 6E basis. 4E PGM prill split 4E Prill split (SA PGM operations) Unit Marikana Rustenburg Kroondal Mimosa MER UG2 MER UG2 UG2 MSZ Platinum % 61.6 59.3 63.6 54.5 58.1 49.4 Palladium % 27.9 29.0 27.5 34.4 31.1 38.4 Rhodium % 3.4 11.1 4.0 10.2 10.2 4.0 Gold % 7.1 0.6 5.0 0.9 0.7 8.2 6E PGM prill split and base metal concentrations Marikana Rustenburg Kroondal Mimosa Metal Unit MER UG2 MER UG2 UG2 MSZ Prill Split Platinum % 56.84 48.16 58.32 45.92 48.85 46.30 Palladium % 25.77 23.55 25.24 29.01 26.15 36.10 Rhodium % 3.09 9.05 3.62 8.60 8.57 3.80 Gold % 6.59 0.48 4.54 0.76 0.57 7.60 Iridium % 1.23 3.67 1.78 3.15 3.34 2.20 Ruthenium % 6.47 15.09 6.50 12.56 12.52 4.00 Base metal concentrations Copper % 0.09 0.07 0.10 0.01 0.01 0.11 Nickel % 0.16 0.28 0.21 0.12 0.10 0.14 Cobalt % — — — 0.06 0.08 0.05 Chromium oxide (Cr2O₃) % — 16.82 1.04 24.10 13.90 — PGM OPERATIONS continued R&R - 39

Internal controls (QAQC) (managed operations) Quality assurance/quality control (QA/QC) is a key component of the Mineral Resource estimation process, spanning from data sources to the final assay data accepted for modelling. All data is acquired through standard acceptable procedures, with built-in QA/QC protocols. Certified reference material (CRM) and blanks are inserted into each batch sent to the laboratory, and makes up approximately 5% of total sample numbers. The CRMs are prepared specifically for UG2 and Merensky reefs, with different PGM grade ranges. In depth QA/QC analysis is performed in preparation for Mineral Resource modelling, using a relational SQL databases for the evaluation of assay results. All current samples from both the Rustenburg and Kroondal operations are analysed at Quality Laboratory Services (Pty) Ltd (Rustenburg), Reg No. 2008/004664/07, which is fully accredited with the South African National Accreditation System (SANAS), Ref No T0487 for Chemical and Microbiological Analysis, reference ISO/IEC 17025:2005. All underground channel samples at the Marikana operation are analysed at the on-site laboratory, which received full accreditation in March 2021 with the South African National Accreditation System (SANAS), Ref No T0930 for Chemical Analysis, reference ISO/IEC 17025:2017. All surface drilling samples are sent to appropriately accredited external laboratories. Mineral reserve estimation (managed operations) Mineral Reserves are estimated via the detailed operational planning process explained in section 1. Due to the high level of continuity and consistent grade distribution of the two ore-bodies across the operations, with moderate grade changes typically only occurring regionally, typical cut-off grades are not applicable. Mineral Reserves are assessed for economic feasibility on a shaft by shaft basis, based on total volumes planned, and ore is not mined selectively. Normal Mineral Resource to Mineral Reserve modifying factors are applied based on the type of mining method, which varies from shaft to shaft. Typically, the shallow UG2 operations are accessed via decline shafts and mined using the low profile mechanised bord-and-pillar method, while deeper ore, both Merensky and UG2, is accessed via vertical shafts and conventionally mined using breast and down-dip methods. Mineral Resource to Mineral Reserve modifying factors applied include provision for off-reef mining due to geological disturbances, dilution to mining widths to cater for historical realistically achievable widths, waste scalping in the case of mechanised mining, and a mine call factor to make provision for unaccounted for but realised metal losses. Estimation risks (Managed operations) There are no deemed material risks to the Mineral Resource Estimation. The key operational risks that could impact the Mineral Reserves are listed below. Commodity prices and exchange rate assumptions: Sibanye- Stillwater has adopted forward-looking price assumptions. Any material deviations from these assumptions could impact the Mineral Reserves, especially at marginal operations. The assumed PGM prices are higher than current spot prices, implying a degree of short-term risk should these prices persist and the longer term forecast not realise. Eskom electricity supply: Loadshedding and load curtailment due to unreliable and erratic electricity supply from the national service provider has started to impact productivity at the operations. Even though Sibanye-Stillwater is actively working towards becoming less reliant on Eskom, with various renewable energy projects in construction phase, it will still be exposed to this risk in the short to medium term. Cost escalation: Cost escalation assumptions relating to factors such as wages, utilities (including electricity) and other operational consumables are aligned with Group estimates. Continuous improvement initiatives adopted to contain cost escalation are in place to mitigate this risk. Operational performance: Operational underperformance and slower than planned production build-up at projects may result in variations between planned and achieved production rates. Short interval controls are in place to enable the implementation of timeous interventions and, therefore, correction of deviations to plans. Environmental and social factors: From an environmental perspective, the region experiences significant pressure on potable and fresh water supply. The adoption of the PGM water stewardship, and the GHG and footprint reduction strategy during 2022, will enable these operations to meet the requirements defined by the ESG commitments made. The SA PGM operations are situated in close proximity to large communities with high unemployment rates. As such, they are exposed to potential social unrest. From a social and governance perspective, Sibanye-Stillwater has implemented appropriate actions to address this risk. PGM OPERATIONS continued R&R - 40

UG2 Mineral Resource classification map for the combined South African PGM operations Merensky Mineral Resource classification map for the combined South African PGM operations PGM OPERATIONS continued R&R - 41

UG2 Mineral Reserve classification map for the combined South African PGM operations Merensky Mineral Reserve classification map for the combined South African PGM operations PGM OPERATIONS continued R&R - 42

MARIKANA ––––––––––––––––––––––––––––––––––––––––––––––––––––––––––––––––––––––––––––––––––––––––––––––––––––––––––––––––––––––––––––––––––––––– Property description The Marikana operations (Western Platinum Limited and Eastern Platinum Limited) are located in the Marikana district, 40km to the east of the town of Rustenburg in the North West province of South Africa. The lease area covers approximately 214km² and extends in excess of 30km from east to west and 15km from north to south. As discussed in section 1, the Group considers the Marikana operation as material for the purpose of SK-1300. The Marikana operation currently has six operating shafts: 4 Belt (4B), K3, K4, Rowland, Saffy, and E3. The Merensky and the UG2 reefs are mined simultaneously at an average depth of 500m and are accessed via infrastructure consisting of shallow incline and deeper vertical shafts. The 4B shallow incline – and the K3, K4 and Rowland vertical shafts – target both the Merensky Reef and UG2 reef horizons, while the E3 shallow incline and the Saffy vertical shaft target only the UG2 reef. The vertical shaft complexes account for the largest portion of the Mineral Reserves. The Mineral Reserves are mined using conventional underground mining methods. The 4B and E3 shallow incline shafts extend to depths of approximately 400m below surface; the K3, Rowland and Saffy vertical shafts extend to approximately 900m below surface, and the K4 vertical shaft to 1,130m. 42%, or 46.1Moz, of the total Mineral Resources are above shaft bottom infrastructure (AI), and 58%, or 64.7Moz, are below shaft bottom infrastructure (BI). The ore mined is processed through four of the eight concentrators on site (of which two are on care and maintenance and two are treating tailings material), with a combined ore milling capacity of approximately 600,000t per month. The concentrate is dispatched to the smelter where a sulphide-rich matte is produced for further processing at the base metal refinery (BMR). At the BMR, base metals (nickel and copper) are extracted and the resulting PGM- rich product is sent to the precious metal refinery (PMR) in Brakpan for final treatment. The PMR produces the final refined precious metal products. In addition to the underground operations, there are also two tailings retreatment operations: • The re-mining of eastern tailings dam 1 (ETD1) occurs by hydraulic mining with high pressure water guns, and the tailings are retreated at the bulk tailings treatment (BTT) plant • Tailings from the EPL concentrator, post the chrome recovery unit, are pumped to the ETTP plant, where a portion of the remaining PGMs are recovered Mineral title The mineral title for the Marikana operation comprises several mining rights and are divided between WPL and EPL. WPL is the holder of four mining rights under the following DMRE reference numbers: NW30/5/1/2/2/107MR (29.3 km², expires 03 September 2037), NW30/5/1/2/2/106MR (101.7 km², expires 03 September 2037), NW30/5/1/2/2/161MR (1.8 km², expires 20 December 2036) and NW30/5/1/2/2/190MR (0.3 km², expires 20 December 2036). EPL is the holder of five mining rights under the following DMRE reference numbers: NW30/5/1/2/2/109MR (38.2 km², expires 03 September 2037), NW30/5/1/2/2/110MR (0.6 km², expires 03 September 2037), NW30/5/1/2/2/111MR (1.7 km², expires 03 September 2037), NW30/5/1/2/2/292MR (46.2km², expires 22 January 2044) and NW30/5/1/2/2/433MR (42.9 km², expires 22 January 2044). The ETD1 is located within the area covered by the mining right held under DMRE reference number: NW30/5/1/2/2/109 MR on the farm Turffontein 462JQ. The Schaapkraal prospecting right (held under DMRE reference number: NW30/5/1/1/2/12331PR, 41.74Km²), which covers the western down-dip extension at Marikana, expired in August 2022. A prospecting right renewal was submitted timeously which was renewed on 28 November 2023 for a further period of three years (under DMRE reference number: NW30/5/1/1/2/13438PR). Due to this, Mineral Resources have now been declared for Schaapkraal. PGM OPERATIONS continued R&R - 43

Infrastructure and equipment The Marikana operation is a large, established shallow to moderate depth PGM mining complex that is accessed from surface through numerous incline and vertical shaft systems. All facilities are in good condition. All the permanent infrastructure required to access and mine the LoM plan is already established and in use. Major infrastructure consists of: • Five vertical shafts, of which four are in production and one on care and maintenance • Five incline shafts of which two are in operation and the remainder are on care and maintenance • Eight PGM concentrator plants • A smelter plant with five furnaces, a base metal refinery plant, and a precious metal refinery plant • Three hospitals/ medical centres • Workshops, office blocks, a laboratory, and equipment stores • Accommodation quarters and hostels • Water treatment plants The mining complex has been in operation since 1987, and the age and modernisation of these assets varies greatly. The equipment used is extensive. The vertical and incline shafts predominantly make use of conventional handheld mining equipment, combined with rail-bound equipment for logistical movement of ore, people and material. The smelter has five furnaces. The two larger furnaces (furnace 1 and 2) are usually in operation, with the three smaller Pyromet furnaces being utilised as back-up or spare capacity. The BMR, which was commissioned in 1985, extracts base metals (nickel and copper) and the resulting PGM-rich product is refined at the PMR in Brakpan. The PMR produces the final precious metal products. The equipment at all operations, including the plants, is subject to detailed planned maintenance programmes and SIB capital provisions are made on an annual basis to cater for repairs and replacements as needed. The property, plant and equipment book value (100%) of all the mine’s assets as at 31 December 2023, was R8.64 billion (US$465m). HOISTING AND PRODUCTION CAPACITIES Operating shaft Operating hoisting Five-year planned capacity (ktpm) production (ktpm) K4 225 108 K3 290 211 4B 160 52 Rowland 200 116 Saffy 200 176 E3 80 60 Planned production is five-year hoisted average from 2023 onwards. MINERAL PROCESSING AND CAPACITY Concentrator plant Design Current operational capacity (ktpm) Average recovery factor (%) Material capacity (ktpm) treated Karee A 140 143 88.44 MER underground Karee B 120 123 87.3 UG2 underground K4 125 100 86.58 MER and UG2 underground EPL 180 230 80.48 UG2 underground 1 Shaft BTT 300 300 25.65 Historic tailings ETTP 274 227 30.67 Current arising tailings Chrome processing Concentrator plant Design Current operational capacity (ktpm) Average recovery factor (%) Material capacity (ktpm) treated Glencore (EPL) 300 227 51 EP UG2 tailings Arxo (K3 B) 120 126 35 WP UG2 tailings Glencore (K4) 130 124 24 WP UG2 tailings Chrometech (BTT) 300 300 12 EP UG2 tailings PGM OPERATIONS MARIKANA continued R&R - 44 ROWLAND SHAFT – MARIKANA OPERATION

PGM and Base Metal processing Refinery Planned feed capacity (t/m) Achieved operational capacity (t/m) Average three-year recovery factor (%) Material treated Smelter1 13,133 11,689 104 Concentrate and filter cake from various internal and external plants BMR 416 370 99 Smelter converter matte PMR 4 3 100 BMR PGM concentrate 1 Smelter recovery over 100% is due to historical material processed during year-end plant clean-up Grade control and Mineral Resource definition drilling summary Planned 2024 Actual 2023 Actual 2022 Drilled Expenditure Drilled Expenditure Drilled Expenditure (m) (Rm) (m) (Rm) (m) (Rm) Marikana surface 16,048 39.30 5,250 4.20 3,571 2.80 Marikana underground 8,100 7.20 17,394 37.10 3,362 6.90 Total 24,148 46.50 22,643 41.30 6,933 9.70 4E PGM Mineral Resource estimate at 31 December 2023 Mineral Resources Exclusive of Mineral Reserves 31 Dec 2023 31 Dec 2022 PGM Southern Africa Tonnes Grade PGM Tonnes Grade PGM Marikana (Mt) (g/t) (Moz) (Mt) (g/t) (Moz) Operations Underground Measured 44.9 3.9 5.6 53.0 4.0 6.8 Indicated 436.2 3.9 54.9 379.4 3.9 47.3 Measured + Indicated 481.1 3.9 60.5 432.5 3.9 54.1 Inferred 200.3 4.4 28.6 172.4 4.4 24.2 Grand total 681.4 4.1 89.0 604.9 4.0 78.3 Notes: Reported at a zero cut-off grade. For commodity price assumptions refer to page 17 Section 1. For metallurgical recoveries, please refer to page 44. On a Mineral Resources exclusive of Mineral Reserves basis, the year-on-year change is +13.6%. The main impacts relates to the inclusion of the Schaapkraal prospecting right (+8.97Moz), changes in geology and estimation, and depletion (-0.8Moz). Mining method • Vertical shafts: conventional up-dip and down-dip mining with a limited amount of conventional breast mining • Shallow inclines: mechanised primary development, combined with conventional on-reef breast mining and a limited amount of conventional up-dip and down-dip mining • TSF: hydraulic (Hydrojet) PGM OPERATIONS MARIKANA continued R&R - 45 EXPLORATION DRILLING AT THE MARIKANA OPERATION

Modifying factors (underground) in converting Mineral Resources to Mineral Reserves Parameter Unit 2023 2022 Off-reef % 1.5 1.1 Dilution cm 20 41 Stoping width cm 135 138 Mine call factor % 99.8 96 4E PGM Mineral Reserves estimate as at 31 December 2023 Mineral Reserves 31 Dec 2023 31 Dec 2022 PGM Southern Africa Tonnes Grade PGM Tonnes Grade PGM Marikana (Mt) (g/t) (Moz) (Mt) (g/t) (Moz) Operations Underground Proved 19.8 3.9 2.5 21.5 3.9 2.7 Probable 106.6 4.0 13.9 110.0 4.1 14.4 Proved + Probable 126.4 4.0 16.3 131.5 4.1 17.2 TSF Surface Proved — — — — — — Probable 5.0 0.9 0.1 7.9 0.9 0.2 Proved + Probable 5.0 0.9 0.1 7.9 0.9 0.2 Grand total Proved + Probable 131.4 3.9 16.5 139.4 3.9 17.4 Notes: Reported at a 0 cut-off grade. Refer to the processing section, page 44, for metallurgical recoveries. For commodity price assumptions refer to page 17 Section 1. 4E P G M ( M o z) Marikana operation 4E PGM Mineral Reserve reconciliation 17.4 -0.7 -0.08 -0.16 16.5 20 22 R es er ve s D ep le tio n Es tim at io n Ec on om ic s 20 23 R es er ve s 0 5 10 15 20 Notes: The -5.3% change year-on-year in the stated Mineral Reserves is attributed to: – -0.7Moz in depletions – -0.1Moz associated with a change in geostatistical evaluation – -0.2Moz due to LoM losses associated with tail cut economics Key developments and brownfield projects The K4 project build-up phase continues with a focus on infrastructure completion and primary development. Steady state is envisioned by 2030, with planned mining production at 2.3Mtpa, yielding approximately 250Koz 4E PGMs per annum. The E3 UG2 inclined shaft deepening and extension project is a brownfields expansion of the current E3 mine, down-dip to current workings, and will serve as replacement ore for E3. The target is for the implementation of a mechanised mining section as an extension of the existing conventional mine. Further geo-technical drilling in the area is underway in order to support the feasibility study that is planned for 2025. Similarly, the E4 area (also historically called Pandora) requires further geo-technical drilling prior to the commencement of a feasibility study. The other brownfields study that will be advanced during 2024 is Saffy deeps (UG2). The possibility of increasing the re-treating rate of tailings at Marikana will also be further investigated during 2024. Life of mine • It is estimated that the current Mineral Reserves will sustain the individual operations for periods varying up to 2025 (TSF material), 2025 (4B), 2030 (K3), 2033 (Rowland), 2035 (E3), 2041 (Saffy) and 2071 (K4) Tailings deposition and capacity Tailings deposition is managed in an integrated manner across the TSFs detailed below: • Karee tailings dam 2 – fed from K3 UG2 plant at 101ktpm (life of TSF until 2025 at current deposition rate) • Karee tailings dam 3 – fed from K3 Mix plant at 147ktpm (life of TSF until 2024 at current deposition rate) • Karee tailings dam 4 – fed from K4 plant at 116ktpm (life of TSF until 2044 at current deposition rate) • Eastern tailings dam 2 – fed from EPL and ETTP plants at 160ktpm (life of TSF until 2028 at current deposition rate) • Western Platinum tailings dam 6 – fed from BTT plant at 270ktpm (life of TSF until 2030 at current deposition rate) The Marikana TSFs have a remaining capacity of 70Mt. The LoM requires 210Mt TSF capacity, resulting in a shortfall of 140Mt. The current capacity constraints will be mitigated through the integrated consolidated surface operations strategy, which addresses tailings deposition at the SA PGM segment, across all three operations. Due to the synergistic nature of the operations, the short- to medium-term approach will therefore be to divert tailings to other existing Group facilities within the SA PGM operations. A new TSF, the Marikana pit TSF, is currently under permitting by the authorities. The TSF has been designed to accommodate the LoM tailings production for the PGM operations. As the various TSFs reach their end of life, the tailings stream will then be diverted to the Marikana pit TSF, which has a total capacity of 290Mt. The planned commissioning date is 2030. PGM OPERATIONS MARIKANA continued R&R - 46

Operational statistics and history Annual development results Category Unit 2023 2022 Primary waste development (capital, declines, haulages, crosscuts, ore passes, travelling ways) m 31,884 27,284 Primary reef development (raise, winzes, wide raises) m 51,371 50,461 Operational statistics 2021 2022 2023 Underground tonnes milled (kt) 6,802 6,315 6,253 Underground yield (g/t) 3.37 3.19 3.14 Surface tonnes milled (kt) 3,869 3,698 3,626 Surface yield (g/t) 0.23 0.22 0.24 Annual 4E PGM production - Underground (koz) 737 647 632 Annual 4E PGM production - surface (koz) 28 26 28 Total Annual 4E PGM production (koz) 765 673 660 Operating cost underground (R/t) 1,571 1,642 1,862 Total capital expenditure (Rm) 2,254 2,432 3,872 AISC (R/oz) 19,664 22,076 22,907 AISC (US$/oz) 1,330 1,349 1,244 Operating cost (R/t) excluding 3rd party purchase of concentrate (PoC) 1,273 1,369 1,583 AISC (R/oz) excluding (PoC) 17,394 20,500 22,742 AISC (US$/oz) excluding (PoC) 1,176 1,253 1,235 Notes: AISC calculated based on produced Oz • In 1987, the London and Rhodesian Mining and Land Company Limited (Lonhro) commissioned the sinking of the Rowland shaft • By 1989 the Karee mine shafts were operational • In 1998, Lonhro PLC split and Lonhro Africa PLC was formed • In 1999, Lonhro PLC was renamed to Lonmin PLC • In 2000, Lonmin PLC sold off all non-PGM assets and became a primary PGM producer • In 2001, the eastern declines were sunk, Saffy shaft was commissioned and Lonmin entered into a JV with Anglo American Platinum for the Pandora property • By 2003, the Hossy shaft was commissioned, with the K4 Shaft commissioned in 2006 • In 2011, the K3 Shaft decline was sunk • in 2012, the K4 Shaft was placed on care and maintenance • In 2016, Saffy shaft began to produce at full capacity • In 2018, Lonmin acquired 100% of the Pandora JV from Anglo American Platinum • In 2019, Sibanye-Stillwater acquired Lonmin Plc • In 2021, the resumption of the K4 project was approved PGM OPERATIONS MARIKANA continued R&R - 47

RUSTENBURG ––––––––––––––––––––––––––––––––––––––––––––––––––––––––––––––––––––––––––––––––––––––––––––––––––––––––––––––––––––––––––––––––––––––– Property description The Rustenburg operation is located in the North West province, north-east of the towns of Rustenburg and Kroondal, 123km west of Pretoria and 126km north-west of Johannesburg. The lease area covers approximately 130km² and is in excess of 20km from east to west, and 15km from north to south. As discussed in section 1, the Group considers the Rustenburg operation as material for the purpose of SK-1300. The Rustenburg operation consists of three intermediate depth vertical shafts that utilise a conventional mining method – Siphumelele 1, Khuseleka 1, and Thembelani 1 – and the Bathopele inclined shafts, which utilises a shallow bord-and-pillar mining method. The Mineral Resource is accessed to 34 level (the lowest working level) at Siphumelele 1 shaft, approximately 1,350m below surface, to 28 level (the lowest working level) at Khuseleka 1 shaft, approximately 950m below surface, and 29 level (the lowest working level) at Thembelani 1 shaft, approximately 1,030m below surface. The Mineral Resource at Bathopele shaft is accessed via two decline clusters to a depth of approximately 500m below surface. 67% (42.4Moz) of the total Mineral Resources are above infrastructure and 33% (20.9Moz) are below infrastructure. The vertical shafts mine both Merensky Reef and UG2 Reef horizons, while the shallow, mechanised Bathopele shaft only mines UG2 Reef. The underground ore is treated at the Waterval UG2 and Waterval retrofit concentrators, with the concentrate processed in terms of a toll agreement by Anglo American Platinum. The Waterval UG2 concentrator has an integrated chrome recovery circuit, which recovers a chrome concentrate from the ore. In addition to the underground operations, there are also two tailings retreatment operations • Western Limb tailings retreatment plant (WLTRP) treats tailings from the old Waterval TSF, which is hydro mined • Tailings from the Waterval TSFs and live tailings from Waterval UG2 and retrofit concentrators are retreated at the Platinum Mile plant Mineral title Sibanye Rustenburg Platinum Mines (Pty) Ltd (SRPM) is the holder of a converted mining right under DMRE reference number NW30/5/1/2/2/82MR (SRPM MR) measuring 153 km² in extent and valid from 29 July 2010 to 28 July 2040. The SRPM MR was registered in the Mineral and Petroleum Titles Registration Office (MPTRO) on 3 October 2011 under Ref No 67/2011. Also included into the Rustenburg operation is the Hoedspruit prospecting right area, which forms a natural north-east extension to the Siphumelele 1 shaft Mineral Resource. Infrastructure and equipment Key infrastructure consists of: • Eleven vertical shafts, of which three are in production and the rest on care and maintenance • Two incline shafts (at Bathopele), mined on a bord-and-pillar system with mechanised equipment • Four PGM concentrator plants, with two of the concentrators treating underground material and two of the concentrators treating surface or tailings material • One hospital/medical centre • Workshops, office blocks and equipment stores • Accommodation and hostels • Water treatment plants The Rustenburg mining complex has been in operation since the 1940s and the age and modernisation of these assets vary. PGM OPERATIONS continued R&R - 48

The vertical shafts make use of conventional handheld equipment, combined with rail-bound equipment for logistical movement of ore, men and material, while the inclined shaft operation makes use of tyred, low-profile, mechanised equipment. The equipment at all operations, including the plants, are subject to a detailed planned maintenance programs; SIB capital provisions are made on an annual basis to cater for both repairs and replacements as needed. The property, plant and equipment book value (100%) for the assets of Rustenburg (Including PlatMile)as at 31 December 2023 was R5.70 billion (US$307m). HOISTING AND PRODUCTION CAPACITIES Operating Operating hoisting Five-year planned shaft capacity (ktpm) production (ktpm) Siphumelele 41 38 Khuseleka 154 141 Thembelani 131 123 Bathopele 257 181 Planned production is five-year hoisted average from 2024 onwards Mineral processing and capacity Concentrator plant Design Current operational capacity (ktpm) Average recovery factor (%) Material capacity (ktpm) treated Waterval UG2 concentrator 450 475 86 UG2 Waterval retrofit concentrator 620 130 86 MER and UG2 CRP¹ 440 440 30-35 Fresh UG2 tailings WLTR plant 450 450 32 Historic tailings Platinum Mile 1000 940 16 Fresh and historic tailings ¹ Chrome retreatment plant (CRP) treats UG2 rougher middlings to recover a saleable chromite concentrate Grade control and Mineral Resource definition drilling summary Planned 2024 Actual 2023 Actual 2022 Drilled Expenditure Drilled Expenditure Drilled Expenditure (m) (Rm) (m) (Rm) (m) (Rm) Rustenburg surface 662 2.20 2,264 5.60 Rustenburg underground 11,118 11.70 9,517 10.30 7,118 6.78 Total 11,780 13.90 11,781 15.90 7,118 6.78 PGM OPERATIONS RUSTENBURG continued R&R - 49 RUSTENBURG OPERATION – BATHOPELE MINE

4E PGM Mineral Resource estimate as at 31 December 2023 Mineral Resources Exclusive of Mineral Reserves 31 Dec 2023 31 Dec 2022 PGM Southern Africa Tonnes Grade PGM Tonnes Grade PGM Rustenburg (Mt) (g/t) (Moz) (Mt) (g/t) (Moz) Operations Rustenburg Underground Measured 174.6 5.1 28.6 178.2 5.1 29.1 Indicated 79.3 5.4 13.6 83.0 5.4 14.3 Measured + Indicated 253.8 5.2 42.2 261.2 5.2 43.4 Inferred 11.0 5.6 2.0 11.0 5.6 2.0 Hoedspruit Underground Measured 0.3 5.3 0.1 — — — Indicated 5.7 5.1 0.9 24.2 5.5 4.3 Measured + Indicated 6.0 5.2 1.0 24.2 5.5 4.3 Inferred 15.1 5.8 2.8 3.9 5.6 0.7 Total Measured + Indicated 259.8 5.2 43.2 285.5 5.2 47.7 Grand total 286.0 5.2 48.0 300.4 5.2 50.4 Notes: Reported at a zero cut-off grade. For commodity price assumptions refer to page 17 Section 1. For metallurgical recoveries, please refer to page 49. On a Mineral Resources exclusive of Mineral Reserves basis, the year-on-year change is -5%. The biggest impact on the change relates to an area exchange between Marikana operations K3 shaft and Siphumelele shaft (-1.3Moz), with changes in geological losses and interpretation, and depletion (-0.7Moz) having lessor impacts. Modifying factors in converting Mineral Resources to Mineral Reserves Parameter Unit 2023 2022 Off-reef % 3.80 0 Dilution cm 11.3 12 Stoping width cm 147 133 Scalping % 1.8 1 Mine call factor % 96.4 99 4E PGM Mineral Reserve estimate as at 31 December 2023 Mineral Reserves 31 Dec 2023 31 Dec 2022 PGM Southern Africa Tonnes Grade PGM Tonnes Grade PGM Rustenburg (Mt) (g/t) (Moz) (Mt) (g/t) (Moz) Operations Underground Proved 72.9 3.6 8.4 79.3 3.5 9.0 Probable 3.3 4.0 0.4 3.4 4.0 0.4 Proved + Probable 76.3 3.6 8.8 82.7 3.6 9.5 TSF Surface Proved — — — — — — Probable 14.6 1.0 0.5 21.2 1.0 0.7 Proved + Probable 14.6 1.0 0.5 21.2 1.0 0.7 Grand total Proved + Probable 90.9 3.2 9.3 103.9 3.0 10.2 Notes: Reported at a 0 cut-off grade. Refer to the processing section, page 49, for metallurgical recoveries.For commodity price assumptions refer to page 17 Section 1. PGM OPERATIONS RUSTENBURG continued R&R - 50

4E P G M ( M O z) Rustenburg operation 4E PGM Mineral Reserve reconciliation 10.2 -0.8 0.06 9.3 20 22 R es er ve s D ep le tio n Ec on om ic s 20 23 R es er ve s 0 5 10 Notes: The -8.4% change year-on-year in the stated Mineral Reserves is attributed to: – -0.8Moz in depletions – +0.1Moz due to LoM gains associated with tail end optimisation Life of mine • It is estimated that the current Mineral Reserves will sustain the individual operations for periods up to 2025 (TSF material), 2029 (Bathopele), 2030 (Siphumelele), 2045 (Khuseleka) and 2051 (Thembelani). Tailings deposition and capacity Tailings deposition is managed across the below TSFs: • Paardekraal TSF (PK4 & PK5) – fed from Waterval UG2 and Waterval retrofit plants after PGM extraction at Platinum Mile, at 750ktpm (life of TSF until 2069, with activation of PK5 dormant area) • Paardekraal TSF (PK Central) – fed from Waterval UG2 and Waterval retrofit plants after PGM extraction at Platinum Mile, at 250ktpm (life of TSF until 2026) • Hoedspruit TSF – fed from WLTRP plants at 480ktpm (life of TSF until 2044) The Rustenburg TSFs have a remaining capacity of 225Mt. The LoM requires 120.7Mt, resulting in a surplus of 104.3Mt. The current capacity can be increased further through the activation of the PK5 dormant area. This surplus feeds into the integrated SA PGM tailings management strategy and will alleviate shortages elsewhere. Key developments and brownfield projects A feasibility study into the Siphumelele UG2 project is ongoing and is expected to be completed during 2024. The Merensky Reef mining at Siphumelele 1 shaft is nearing completion and the study considers replacing Merensky production with UG2, while optimising the boundary between Siphumelele and the Kroondal shafts. As a natural down-dip extension of current mining operations, funded via SIB (Stay in business) capital, UG2 Reef “ore replacement” is being executed at Thembelani shaft, and will target eight levels below the current mining operations. Operational statistics and history Annual development results Category Unit 2023 2022 Primary waste development (capital, declines, haulages, crosscuts, ore passes, travelling ways) m 11,714 12,146 Primary reef development (raise, winzes, wide raises) m 11,383 10,019 Operational statistics 2021 2022 2023 Underground tonnes milled (kt) 6,341 6,037 6,073 Underground yield (g/t) 2.96 2.85 2.94 Surface tonnes milled (kt) 5,712 5,610 5,486 Surface yield (g/t) 0.37 0.42 0.48 Annual 4E PGM production - Underground (koz) 604 554 574 Annual 4E PGM production - surface (koz) 68 75 84 Total Annual 4E PGM production (koz) 672 629 658 Operating cost underground (R/t) 1,643 1,869 2,075 Operating cost surface (R/t) 195 240 247 Total capital expenditure (Rm) 1,248 1,377 1,313 AISC (R/oz) 18,460 19,914 18,204 AISC (US$/oz) 1,248 1,217 989 Note: AISC calculated based on produced Oz • In 1925, exploration on the eastern limb of the BIC started • In 1929, the first vertical shaft at Rustenburg section was sunk at what was to become Rustenburg Platinum Mines Ltd • In 1935, the Waterfall vertical shaft was constructed, while the Central Deep Shaft and the Siphumelele 3 Shaft were constructed in 1951 and 1953, respectively • Johannesburg Consolidated Investments (JCI) acquired a controlling interest in Rustenburg Platinum Mines and eventually the principal shareholder of JCI was Anglo American, which acquired a controlling interest in JCI in 1960 • The control ultimately passed on from JCI when Anglo American Platinum came into being in 1995, and JCI was unbundled • In 2016, Sibanye-Stillwater acquired Rustenburg Platinum operations from Anglo American Platinum PGM OPERATIONS RUSTENBURG continued R&R - 51

KROONDAL ––––––––––––––––––––––––––––––––––––––––––––––––––––––––––––––––––––––––––––––––––––––––––––––––––––––––––––––––––––––––––––––––––––––– Property description The Kroondal operation is situated in the magisterial district of Rustenburg, approximately 120km north-west of Johannesburg and about 120km west of Pretoria (Tshwane) in the North West province of South Africa. As discussed in section 1, the Group considers the Kroondal operation as material for the purpose of SK-1300. The Kroondal operation consists of four operational shallow, mechanised shafts in the western limb of the BIC. The UG2 Reef is accessed from surface using decline systems; underground mining takes place at depths of between 250m and 550m below surface. Ore is treated in two concentrator plants (K1 and K2). The concentrate is sold to a wholly-owned subsidiary of Anglo American Platinum, under a purchase of concentrate (PoC) off-take agreement. On 1 November 2023, Sibanye Rustenburg Platinum Mines Limited (SRPM) acquired Rustenburg Platinum Mine’s (a subsidiary of Anglo American Platinum) 50% share in the Kroondal pool and share agreement. This acquisition allows SRPM’s Mineral Resources to be mined from the low-cost Kroondal infrastructure, bringing forward value, and extending the life of the Kroondal decline operations by up to 10 years. The increase in attributable Mineral Reserves relating to the anticipated extension of the Kroondal operations into the SRPM mining right (mainly at Kopaneng and Bambanani), totalling 0.995Moz, are reflected under the Rustenburg mining right. Due to the Groups 74% effective ownership of SRPM, the acquisition of Anglo American Platinum’s 50% ownership has resulted in the Group’s attributable interest in Kroondal increasing from 50% to 87%. Mineral title Apart from the principal mining right (held under DMRE reference number: NW30/5/1/2/2/80MR by SRPM, 32.1 km², expiring 28 July 2040), Kroondal Operations (Pty) Ltd is the holder of a converted mining right under DMRE reference number: NW30/5/1/2/2/104MR (Kroondal MR), in respect of a mining area totalling approximately 17.0 km², as well as a further mining right under DMRE reference number: NW30/5/1/2/2/113MR, in respect of a mining area totalling approximately 25.1 km², both valid from 17 October 2006 to 16 October 2022. Renewal applications in respect of these rights were submitted during 2022, within the official administrative window, and a successful outcome is expected. In the meantime, it is within the Group’s legal right to continue mining while the applications are being assessed. PGM OPERATIONS continued R&R - 52 UG2 REEF EXPOSURE IN KLIPFONTEIN OPEN PIT

Infrastructure and equipment All the permanent infrastructure required to access and mine the LoM plan is already established and in use. Major infrastructure consists of: • Four producing decline shafts, mined on a bord-and-pillar system with mechanised equipment (Simunye shaft is on care and maintenance) • Two PGM concentrator plants treating the underground and open-pit material • Dense media separation plants at both concentrators that remove ±35% of the total volume delivered, which is principally waste material (pyroxenite); this process enhances the feed grade of the ore received by the concentrators, and also assists in minimising the tailings depositional requirements • Workshops, office blocks, and equipment stores • Water treatment plants The Kroondal mining complex has been in operation since early 2000 and the age and modernisation of these assets vary. The equipment used for mining consists predominantly of mechanised drilling equipment, and loading and hauling equipment underground. The ore is transported to the surface via conveyor belt systems and trammed to the concentrators by rail and truck. The equipment at all shafts, including the plants, are subject to a detailed planned maintenance programs; and SIB capital provisions are made on an annual basis to cater for repairs and replacements as needed. The property, plant and equipment book value (100% basis) for the assets of Kroondal, as at 31 December 2023, was R1.87 billion (US$98.9m). HOISTING AND PRODUCTION CAPACITIES Operating shaft Operating hoisting Five-year planned capacity (ktpm) production (ktpm) Kwezi 72 57 K6 135 87 Kopaneng 136 99 Bambanani 108 102 Planned production is five-year hoisted average from 2023 onwards MINERAL PROCESSING AND CAPACITY Concentrator Plant Design Current operational capacity (ktpm) Average recovery factor (%) Material capacity (ktpm) treated K1 concentrator 290 148 82 UG2 K2 concentrator 300 255 80 UG2 K1 CRP 167 107 20 UG2 K2 CRP 167 165 12 UG2 Glencore (K150) 144 43 12 UG2 Glencore (K250) 192 66 7 UG2 · Ore from Kwezi, Bambanani and K6 shaft is processed at the K2 plant · Ore from K6, Kopaneng and Simunye shaft is processed at the K1 plant PGM OPERATIONS KROONDAL continued R&R - 53 K1 CONCENTRATOR PLANT

4E PGM Mineral Resource estimate at 31 December 2023 Mineral Resources Exclusive of Mineral Reserves 31 Dec 2023 31 Dec 2022 PGM Southern Africa Tonnes Grade PGM Tonnes Grade PGM Kroondal (Mt) (g/t) (Moz) (Mt) (g/t) (Moz) Operations Kroondal Underground Measured 25.3 3.3 2.7 15.5 3.4 1.7 Indicated 4.8 3.3 0.5 4.7 3.8 0.6 Measured + Indicated 30.2 3.3 3.2 20.3 3.5 2.3 Inferred — — — 2.5 2.9 0.2 Grand total 30.2 3.3 3.2 22.7 3.4 2.5 Notes: Reported at a zero cut-off grade. For commodity price assumptions refer to page 17 Section 1. For metallurgical recoveries, please refer to page 53. On a Mineral Resources exclusive of Mineral Reserves basis, the year-on-year change is +28%. The biggest drivers of the change related to the acquisition of Anglo American Ltd’s 50% in the JV (+2.5Moz), as well as the exclusion of 1Moz relating to the sterilisation as a result of the planned Marikana operations TSF. Depletion of -0.4Moz and geology and estimation aspects play’d lessor roles. Grade control and ore definition drilling summary Planned 2024 Actual 2023 Actual 2022 Drilled Expenditure Drilled Expenditure Drilled Expenditure (m) (Rm) (m) (Rm) (m) (Rm) Kroondal surface 4,096 10.40 2,763 6.70 16,195 19.90 Kroondal underground 6,079 6.10 4,429 4.60 2,047 2.30 Total 10,175 16.50 7,191 11.30 18,242 22.20 Mining method Bord-and-pillar Modifying factors (underground) in converting Mineral Resources to Mineral Reserves Parameter Unit 2023 2022 Off-reef % 6 11 Dilution planned cm 15.0 0.0 Stoping width cm 219 217 Scalping % 4 2 Mine call factor % 95 94 4E PGM Mineral Reserve estimate at 31 December 2023 Mineral Reserves 31 Dec 2023 31 Dec 2022 PGM Southern Africa Tonnes Grade PGM Tonnes Grade PGM Kroondal (Mt) (g/t) (Moz) (Mt) (g/t) (Moz) Operations Kroondal Underground Proved 9.1 2.5 0.73 7.4 2.5 0.60 Probable — — — — — — Proved + Probable 9.1 2.5 0.73 7.4 2.5 0.60 Klipfontein Opencast Surface Proved — — — 0.5 3.4 0.06 Probable — — — — — — Proved + Probable — — — 0.5 3.4 0.06 Grand total Proved + Probable 9.1 2.5 0.73 8.0 2.6 0.65 Notes: Reported at a 0 cut-off grade. Refer to the processing section, page 53, for metallurgical recoveries.For commodity price assumptions refer to page 17 Section 1. PGM OPERATIONS KROONDAL continued R&R - 54

4E P G M ( M o z) Kroondal operation 4E PGM Mineral Reserve reconciliation 0.66 -0.26 -0.04 -0.06 0.03 -0.07 0.48 0.73 2 02 2 Re se rv es D ep le tio n G eo lo gy Es tim at io n In cl us io n/ ex cl us io n M od ify in g fa ct or s A ttr % fr om 5 0% to 8 7% 20 23 R es er ve s 0 0.5 1 Notes: The +11.6% change year-on-year in the stated Mineral Reserves is principally attributed to depletion of -0.3Moz, off-set by the change in attributable ownership to 87% (+0.5Moz). Life of mine • It is estimated that the current Mineral Reserves will sustain the individual operations for periods up to 2027 (Kwezi), 2027 (K6), 2028 (Kopaneng) and 2037 (Bambanani). These timeframes includes the natural depth extensions of the Kopaneng and Bambanani shafts into the Rustenburg mining right which form part of the LoM extensions realised through the transaction with AAP. The Mineral Reserves relating to these extensions (0.95Moz) are included in the Rustenburg operations totals. Tailings deposition and capacity TSFs are detailed below: • K1 TSF is fed from K1 plant at 28ktpm (life of TSF until 2026 at current deposition rate) • K150 TSF is fed from K1 plant at 86ktpm (life of TSF until 2026 at current deposition rate) • K2 TSF is fed from K1 (80%) and K2 (20%) plants at 86ktpm (life of TSF until 2026 at current deposition rate) • Marikana TSF is fed from K2 plant at 200ktpm (life of TSF until 2030 at current deposition rate) The Kroondal TSF’s have a remaining capacity of 18.4Mt. The LoM requires 23.3Mt TSF capacity, resulting in a shortfall of 4.9Mt. The current capacity constraints will be mitigated through the integrated consolidated surface operations strategy, which addresses tailings deposition at the SA PGM segment, across all three operations. Due to the synergistic nature of the operations, the short- to medium-term approach will therefore be to divert tailings to other existing Group facilities within the SA PGM operations. A new TSF, the Marikana pit TSF, is currently under permitting by the authorities. The TSF has been designed to accommodate the LoM tailings production for the PGM operations. As the various TSFs reach their end of life, the tailings stream will then be diverted to the Marikana pit TSF, which has a total capacity of 290Mt. The planned commissioning date is 2030. Key developments and brownfield projects The acquisition of Anglo American’s 50% shareholding in the Kroondal PSA will allow for further mining across the boundary between the Rustenburg operation and Kroondal operation which unlocks significant value. The optimisation studies into the down-dip extensions at Bambanani and Kopaneng shafts are ongoing and will explore synergies with the Siphumelele UG2 project at the Rustenburg operation. History and operational statistics Annual development results Category Unit 2023 2022 Primary waste development (capital, declines, haulages, crosscuts, ore passes, travelling ways) m 621 620 Primary reef development (raise, winzes, wide raises) m 11,123 8,736 Operational statistics 2021 2022 2023 Underground tonnes milled (kt) 3,525 3,251 3,068 Underground yield (g/t) 2 1.93 1.89 Surface tonnes milled (kt) — 573 0 Surface yield (g/t) N/A 2.15 N/A Annual 4E PGM production - underground (koz) 227 202 186 Annual 4E PGM production - surface (koz) N/A 40 N/A Total Annual 4E PGM production (koz) 227 242 186 Operating cost underground (R/t) 896 1,049 1,282 Operating cost surface (R/t) N/A 682 N/A Total capital expenditure (Rm) 268 273 307 AISC (R/oz) 12,943 15,514 19,441 AISC (US$/oz) 875 948 1,056 Note: AISC calculated based on produced Oz • In 1996, a PFS on the Kroondal platinum project, in which Aquarius Platinum Ltd (Aquarius) had a 45% stake, was completed • Mine development began in 1998 and an initial off-take agreement was signed with Impala Platinum Ltd that continued until 2008 • Mining via two decline shafts began in March 1999 • In 2000, Aquarius increased its stake in Kroondal to 100% • Between 2001 and 2003, Aquarius entered into JV (50:50) agreements with RPM, a subsidiary of Anglo American Platinum (AAP), to extract Mineral Reserves located on adjacent Anglo American Platinum mining rights. This included the construction of a second concentrator plant and enabled doubling of production. This agreement included a PoC off-take agreement with AAP • By 2005, the second concentrator plant was commissioned and by 2011, five decline shafts were in production • In 2013, the extent of the Mineral Resource included in the PSA was extended, prolonging Kroondal’s LoM • Sibanye-Stillwater acquired a 50% stake in Kroondal in 2016, via the acquisition of Aquarius in 2016 • In 2021 agreements with AAP were concluded allowing Kroondal to mine into the Rustenburg (SRPM) mining right • During 2022, the Group reached an agreement with AAP to take full ownership of Kroondal, and all contractual obligations were fulfilled during 2023 PGM OPERATIONS KROONDAL continued R&R - 55

MIMOSA –––––––––––––––––––––––––––––––––––––––––––––––––––––––––––––––––– Mineral Resource classification map for Mimosa Property description Mimosa is a shallow, mechanised PGM and base metal mining operation located in the Wedza sub-chamber of the Great Dyke of Zimbabwe, some 32km west of Zvishavane, a major mining centre situated 340km south-west of Harare, the capital city of Zimbabwe. Mimosa Mining Company is jointly owned by Impala Platinum and Sibanye-Stillwater in terms of a 50:50 JV shareholding. The Mimosa property has four mineralised areas, separated by major faults and erosional surfaces: North Hill, South Hill, Far South Hill and the Mtshingwe Block. The Mimosa mine is an underground operation on the South Hill ore deposit, consisting of two shafts, namely the Blore shaft and the Wedza shaft. Mineral title The Mimosa mining right covers a mining lease for 65.94km². The mining lease, Lease No 24, was granted to Mimosa Mines (Pvt) Ltd on 5 September 1996, giving it the exclusive mining rights for PGMs and base metals within the vertical limits of its boundary. As per Zimbabwean law, the mining right does not expire so long as annual renewal fees are up to date. In addition to the mining lease, Mimosa holds the following valid claims: 50 KV platinum claims (4.84km², referred to as the Wedza West); 37 SR platinum claims (3.70km²); 7 chrome claims (1.75km²); a 0.30km² block pegged in 2020 over the Mtshingwe Fault block; special grant 7880 (0.38km²); special grant 9369 (0.52km²); and special grant 9379 (0.14km²). Infrastructure and equipment Mimosa is an established, mechanised, bord-and-pillar mining operation, with all the facilities and equipment to mine and produce precious and base metals concentrate. There are two decline shafts, and a small vertical shaft at 26 level south, which is equipped for hoisting people to surface in case of an emergency. Underground infrastructure includes an ore bunker, main and satellite workshops, pump stations, strike and dip conveyors, as well as the main conveyor in Blore shaft. Blore shaft has an operational capacity of 280ktpm. There is a fleet of mining machinery to enable the mechanised bord-and-pillar operation. The fleet of TMM equipment is serviced and repaired in the main underground workshop, which is adequately equipped for the purpose. Surface Infrastructure includes an ore stockpile. concentrator plant, garage, workshops, dirty water settling ponds, service and potable water storage tanks, a clinic and housing for selected essential staff. The Mimosa concentrator has an operational capacity of ~233 ktpm. Concentrates are transported by road to South Africa for smelting and refining at the Impala Platinum facilities. PGM OPERATIONS continued R&R - 56 Ore stacking via conveyor belt at the Mimosa Operation ORE STACKING AT MIMOSA OPERATIONS

4E PGM Mineral Resource estimate at 31 December 2023 Mineral Resources Exclusive of Mineral Reserves 31 Dec 2023 31 Dec 2022 PGM Southern Africa Tonnes Grade PGM Tonnes Grade PGM Mimosa (Mt) (g/t) (Moz) (Mt) (g/t) (Moz) Operations Underground Measured 16.9 3.4 1.9 16.0 3.4 1.8 Indicated 8.3 3.6 1.0 8.4 3.5 1.0 Measured + Indicated 25.3 3.5 2.8 24.4 3.5 2.7 Inferred 14.4 3.4 1.6 15.5 3.4 1.7 Grand total 39.7 3.5 4.4 39.9 3.4 4.4 Note: Mining is non-selective on a regional scale, and cut off grades have not been applied, but mineralised cuts are optimised for economic metal extraction On a Mineral Resources exclusive of Mineral Reserves basis there is no change year-on-year, with depletions off-set by gains. 4E PGM Mineral Reserves estimate at 31 December 2023 Mineral Reserves 31/Dec/2023 31/Dec/2022 PGM Southern Africa Tonnes Grade PGM Tonnes Grade PGM Mimosa (Mt) (g/t) (Moz) (Mt) (g/t) (Moz) Operations Underground Proved 11.3 3.5 1.3 20.1 3.5 2.2 Probable 3.3 3.3 0.4 8.6 3.4 1.0 Grand total Proved + Probable 14.6 3.5 1.6 28.7 3.5 3.2 Notes: Based on a commodity price (US$/oz) assumption of Platinum 920; Palladium 1,763; Rhodium 19,275; Ruthenium 278 and an exchange rate R/US$ of 16.00 PGM OPERATIONS MIMOSA continued R&R - 57

Mineral Reserves classification map for Mimosa 4E P G M ( M o z) Mimosa operation 4E PGM Mineral Reserve reconciliation 3.2 -0.2 -0.02 -0.01 0.04 -1.4 1.6 20 22 R es er ve s D ep le tio n In cl us io ns /e xc lu sio ns G eo lo gy Es tim at io n Ec on om ic s 20 23 R es er ve s 0 2 Notes: The -48.6% change year-on-year in the stated Mineral Reserves is attributed to: – -0.2Moz in depletions – -0.1Moz decrease due to geology related and technical factors – -1.4Moz due to the exclusion of the North Hill Project Mineral Reserves Tailings deposition and capacity The TSFs in use: • Mimosa TSF3 is fed from Mimosa plant at 229ktpm (life of TSF until 2024 at current deposition rate) • Mimosa TSF4 is currently under construction (life of TSF until 2044 at 233ktpm deposition rate) The Mimosa TSF3 has a remaining capacity of 3.4Mt. The LoM requires 28.2Mt TSF capacity, resulting in a shortfall of 24.7Mt. This will be mitigated through the elevating of pen-stocks to run TSF3 until decommissioning and until TSF4 construction is complete. TSF4 will provide additional capacity of 55.0Mt, a surplus capacity of 31Mt. Key developments and brownfield projects The North Hill Project FS was completed and presented to the JV Board for a final investment decision. Approval was not granted due to depressed PGM metal prices, as well as the significant capital requirements. The JV partners agreed that it would also be inappropriate to embark on the project under the prevailing fiscal environment and therefore the North Hill Mineral Reserves have been excluded. Surface exploration drilling is being carried out on the South Hill deposit at Mtshingwe and Wedza West sections, to convert Indicated to Measured Mineral Resources and eventually to Proved Mineral Reserves. Operational statistics 2021 2022 2023 Underground tonnes milled (kt) 1,422 1,387 1,392 Underground yield (g/t) 2.61 2.59 2.6 Total Annual 4E PGM production (koz) 119 116 116 Operating cost underground (R/t) 1,122 1,385 1,723 Total capital expenditure (Rm) 499 864 1,057 AISC (R/oz) 14,549 18,817 24,255 AISC (US$/oz) 984 1,150 1,317 Note: AISC calculated based on produced Oz PGM OPERATIONS MIMOSA continued R&R - 58 MINE WORKERS AT THE MIMOSA OPERATION

PGM EXPLORATION AKANANI –––––––––––––––––––––––––––––––––––––––––––––––––––––––––––––––––– Property description Akanani is an exploration project located on the northern limb of the BIC, in the Limpopo province of South Africa, 30km north-east of the town of Mokopane (Akanani Project Area). Extensive exploration drilling has been conducted on the south- eastern portion of the property, confirming significant Mineral Resources which offers the potential for a long-life, low-cost operation. The wide orebody (>20m thick for the P2 unit) would enable a mechanised, long-hole, open-stope mining operation. Mineral title Akanani Mining (Propriety) Limited (Akanani) was the holder of a converted prospecting right (Akanani PR) held under DMRE reference number LP 30/5/1/1/2/806 PR, registered in the MPTRO under reference MPT No. 249/2006 for platinum group metals, gold, silver, nickel, copper and cobalt on the farms Moordkopje and Zwartfontein which covered 40.95km². The Akanani PR was renewed under the same DMRE reference number and ultimately expired on 3 April 2021. An application for a mining right over the Akanani Project Area was submitted by Sibanye-Stillwater in March 2021, prior to expiry of the renewed Akanani PR. Based on what Sibanye- Stillwater believes is an incorrect interpretation of the prevailing legislation and case law, the DMRE granted a prospecting right to a third-party applicant over the Akanani Project Area and rejected the Akanani mining right application. Mineralisation characteristics The Mineral Resource is contained within the Platreef Pyroxenite unit that is considered to represent the Upper Critical Zone in this area and starts at approximately 750m below surface, with an economically depth cut-off of 2,000m applied. The Platreef Pyroxenite, which can be hundreds of metres thick, contains zones of PGM mineralisation, associated with various lithological units. The higher grade mineralisation is generally well constrained within a geological unit towards the top of the Platreef known as the P2 Unit that has an average thickness of approximately 20m. Mineralisation in the P1 unit occurs over a wider interval (30m) and appears to be less continuous than that of the P2 unit. The P1 unit is generally of lower grade than the P2 unit. Potholes and IRUP intrusions, such as those that occur on the Merensky and UG2 reefs, have not been recognised on the Platreef at the Akanani project. Losses in the Mineral Resource area are anticipated to occur as a result of dykes and veins, faults and localised alteration, particularly calc-silicate alteration. Such alteration is rare in the P2 unit and more common in the P1 unit. Major discontinuities, such as faults and dykes, have been identified throughout the deposit, via the interpretation of magnetic survey and diamond drilling information. A unique feature of the Platreef mineralisation is the ratio of platinum:palladium, which is close to 1:1, as well as the high concentration in base metal by-products, with nickel and copper grading 0.24% and 0.13% respectively, making for a very attractive and diversified metal mix. Key developments Sibanye-Stillwater is contesting the award of a prospecting right to a third party over the Akanani Project Area and the matter will be heard by way of a review Application in the High Court in the next 12 to 18 months. Sibanye-Stillwater’s expectation is that the court will rule in its favour and set aside the granting of the prospecting right to a third party, and award the mining right over the Akanani Project Area to Sibanye-Stillwater. 4E PGM Mineral Resource estimate at 31 December 2023 Mineral Resources 31 Dec 2023 31 Dec 2022 PGM Southern Africa Tonnes Grade PGM Tonnes Grade PGM Akanani (Mt) (g/t) (Moz) (Mt) (g/t) (Moz) Exploration Underground Measured — — — — — — Indicated 164.5 4.2 22.0 164.5 4.2 22.0 Measured + Indicated 164.5 4.2 22.0 164.5 4.2 22.0 Inferred 87.9 3.4 9.6 87.9 3.4 9.6 Grand total 252.4 3.9 31.6 252.4 3.9 31.6 Notes: • The Mineral Resource estimates includes both the P2 and P1 Units • 10% geological losses were applied to the P2 model and 20% geological losses were applied to the P1 model R&R - 59

LIMPOPO ––––––––––––––––––––––––––––––––––––––––––––––––––––––––––––––––––––––––––––––––––––––––––––––––––––––––––––––––––––––––––––––––––––––– Property description The Limpopo project is located on the northern sector of the eastern limb of the BIC in the Limpopo province, approximately 50km south of the city of Polokwane. The project area consists of three mineral title areas, Voorspoed (Including the Baobab mining right and the Voorspoed prospecting area), and the Dwaalkop and Doornvlei mining right areas. The Baobab property has the full surface and underground infrastructure to support a mining rate of 90ktpm. It has a vertical shaft to a depth of 450m. There is a 90,000tpm concentrator on the property. The Limpopo Baobab property was a producing operation that reached a maximum extraction rate of 75,000tpm, before being placed on care and maintenance in early 2009. The concentrator plant is currently being leased to Anglo American Platinum. The Dwaalkop Project is a 50:50 JV with Northam Platinum (via Mvelaphanda Resources). Doornvlei is an undeveloped property. Mineral title Messina Platinum Mines (Proprietary) Limited (MPML)) holds a converted mining right (Voorspoed MR) under DMRE reference number: LP30/5/1/2/2/77MR in respect of the Baobab mining area, covering an area of 6.024km², expiring on 25 February 2044. MPML further holds a converted mining right (Doornvlei MR) under DMRE reference number: LP30/5/1/2/2/140MR. The Doornvlei MR expires on 25 February 2044. WPL was granted a Mining Right (Dwaalkop MR) under DMRE reference number: LP30/5/1/2/2/99MR by the DMRE during 2021, which is currently awaiting execution. MPML is also the holder of a converted prospecting right, the Voorspoed PR under DMRE reference number: LP 30/5/1/1/2/873 PR, covering an area of 29km². The Voorspoed PR expired on 28 November 2009 and a renewal application was submitted in September 2009. The renewal application remains pending at the DMRE. Mineralisation characteristics The UG2 and Merensky reefs are developed approximately 130m apart. The average width of the UG2 Reef for each property varies between approximately 1.90m and 3.05m, and the average width of the Merensky Reef for each property varies between approximately 0.90m and 2.25m. The reef dip is relatively steep in this area, with the dip in the Baobab and Dwaalkop-Doornvlei blocks being approximately 60° to the south. The Mineral Resources occur over a strike length of approximately 15km and are dislocated by several large faults, which form the lateral boundaries of the delineated Mineral Resource blocks of Baobab, Baobab East, Dwaalkop and Doornvlei. The UG2 Reef Mineral Resources in the northern sector of the Eastern Limb differ from other areas in the BIC in that the concentrations of both copper and nickel are elevated. These base metals form an important by-product of PGM mining. Key developments Due to the steep dip of the UG2 and Merensky reefs, the project remains an attractive mechanisation option, which fits well with Sibanye-Stillwater’s strategic goals. During 2023, the Group completed a concept level study into the re-opening of the Baobab shaft. Development of the project remains subject to Group capital expenditure ranking. 4E PGM Mineral Resource estimate as at 31 December 2023 Mineral Resources 31 Dec 2023 31 Dec 2022 PGM Southern Africa Tonnes Grade PGM Tonnes Grade PGM Limpopo (Mt) (g/t) (Moz) (Mt) (g/t) (Moz) Exploration Underground Measured 1.8 4.2 0.2 1.8 4.2 0.2 Indicated 80.0 4.1 10.5 80.0 4.1 10.5 Measured + Indicated 81.7 4.1 10.7 81.7 4.1 10.7 Inferred 70.9 4.0 9.2 70.9 4.0 9.2 Grand total 152.6 4.1 19.9 152.6 4.1 19.9 Notes: Mineral Resource estimates are based on a practical mining cut of not less than 90cm and may include some diluting material The Mineral Resources at Dwaalkop and Doornvlei occur from surface to a maximum depth of 800m beyond the last line of surface drill holes PGM EXPLORATION continued R&R - 60

GOLD OPERATIONS OVERVIEW ––––––––––––––––––––––––––––––––––––––––––––––––––––––––––––––– Geological setting Gold occurs in quartz-pebble conglomeritic units (or reefs) in a thick succession of metamorphosed sediments in the Witwatersrand Basin. The basin is geographically located in the central-north to north-eastern part of South Africa and extends from Johannesburg in the north to some 40km south of Welkom and covers an area of approximately 70,000km². More than 150 mines have operated in the basin since gold was first discovered in 1886, primarily producing gold. Uranium has been intermittently produced, often as a by-product, since the early 1950s. The reefs, which are generally less than 2m thick, are widely considered to represent extensive alluvial fan deposits within structurally controlled basin edges. The gold is considered to have been syngenetically deposited with the conglomerates. Although the gold generally occurs in native form and is usually associated with pyrite, carbon and uranium, most of it has been subsequently modified and remobilised during secondary hydrothermal alteration. This is the generally accepted model for the origin of gold and uranium mineralisation of the Witwatersrand Basin. The most fundamental control to the gold distribution remains the association with mature quartz-pebble conglomerates on intra- basinal unconformity surfaces. The reefs are typically laterally continuous, as a consequence of the regional nature of the erosional surfaces. Consequently, the identification and modelling of erosional/sedimentary features are the key to in-situ Mineral Resource estimation. Simplified stratigraphic column of the Witwatersrand Basin, highlighting the reefs mined at our operations Mineral resource estimation (managed operations) Diamond drillhole and underground chip sample data forms the bulk of the analytical data used in the estimation. The data used in the Mineral Resource estimation is stored in a relational SQL database and becomes available after QA/QC validation processes are completed. Geological facies and 3D structural modelling are completed, based on data gathered from drillholes, chip sampling and underground mapping. Geological facies interpretation is considered in the statistical analysis and estimation process. The resulting statistical domains may be further sub-divided or combined to ensure homogeneity of data and are used as hard boundaries in the estimation for the block sizes of 10m by 10m; 25m by 25m and 100m by 100m. Detailed exploratory data analysis is carried out on data within individual domains. The main interpolation methodology utilised is ordinary kriging for the 10m by 10m, and 25m by 25m blocks. Simple kriging is only used for 100m by 100m blocks. Mineral Resource tonnages and grades are estimated in-situ over an estimated minimum mining width, and may include mineralisation below the selected cut-off grade to ensure that the Mineral Resources comprise practical mining blocks of adequate size and continuity. Mineral Resource estimations are depleted within defined 2D structurally modelled blocks, and dip corrections are applied to reflect true tonnages. The Mineral Resources are reported using an economic cm.g/t (grade x thickness) cut-off, based on our long term Mineral Resource price outlook, Mineral Resource classification is based on the robustness of various data sources available including the confidence in the geological interpretation, variography and other estimation parameters. A Measured Resource classification is based on slope of regression on average greater than 95% in the first range of variograms for the block models of 10m by 10m and 25m by 25m. An Indicated Resource classification is based on the first and/or second search ellipse ranges and the number of samples averaging seventeen within the 100m by 100m block models. The areas in the third range of the variograms on the block size of 100m by 100m are classified as Inferred R&R - 61

Internal controls (QA/QC) (managed operations) The gold operations follow industry best practice in data acquisition, ensuring data reliability, and utilise accredited analytical laboratories, which are frequently audited, both internally and externally. QA/QC procedures are followed on all drilling and sampling programmes (including underground chip sampling). The database system in use at Sibanye-Stillwater is a relational SQL database. This has various levels of security and is managed by an onsite database administrator and audited by external service providers. Analytical QA/QC is maintained and enforced through the submission of blanks and certified reference material; on average at least one QA/QC sample is inserted in every batch of 100 samples. This approximates to 1% of the total sampling database. Analysis of the QA/QC samples consists of checks on the certified reference materials’ expected values, and analysis of blank material. An internal procedure to check the deviation from the expected value for the reference materials of samples are accepted within three standard deviations. Laboratory reporting of underground sampling results is not split into separate gold and silver assays. A combined grade is reported. For chip sampling, a “bullion” factor is then generated by the laboratory and released periodically to the operations to account for the silver content in the analysis. The laboratory is required to participate in various round robin exercises as part of maintaining their accreditation status. Internal audits of the laboratories are conducted every three months by the Mineral Resource department. The laboratory currently in use at the Sibanye-Stillwater gold operations, i.e. the Driefontein laboratory (Reg No 2002/031431/07) is SANAS (South African National Accreditation System) accredited with accreditation No T0379. GOLD PRICE VARIATION M in e ra l R e se rv e s (M o z) Gold Mineral Reserves price sensitivity 10.3 10.5 10.9 11.2 11.4 0.6 0.7 0.7 0.7 0.7 0.1 0.1 0.1 2.8 2.9 2.9 3.0 3.1 1.7 1.7 1.8 1.9 1.9 2.2 2.4 2.5 2.6 2.8 2.9 2.9 2.9 2.9 2.9 Beatrix Cooke Driefontein Kloof Burnstone DRDGOLD -10% -5% 0% 5% 10% 0 2.5 5 7.5 10 12.5 Mineral Reserve Estimation (managed operations) The calculation of the Mineral Reserves from the Mineral Resource estimate includes the application of cut-off grades to ensure an average mining value that is above the pay limit. The pay limit is defined as the average value at which an orebody can be mined, at an all-in costs break-even, based on the planned mining volumes, updated modifying factors, and the estimated working cost. The cut-off grades, which are the absolute minimum mining grades that can be mined in order to maintain a average Mineral Reserve value aligned with the pay limit, are calculated using the latest pay limits and costs per mining area. Mining area selection is based on the cut-off grades, structural models, and pillar requirements, together with other practical mining considerations. Plans are developed with an approach that encourages the production team’s input into the process with guidance from all technical departments at multiple points in the planning process. The sensitivities of gold Mineral Reserve ounces at all operations are shown in the accompanying chart at -10%, -5%, base (R850,000/kg), +5% and +10%, and are derived from a factored application of the base-case scheduled Mineral Reserves, reflecting the impact of a changing gold price on the prevailing cut-offs. The Mineral Reserve sensitivities are not based on detailed depletion schedules and should be considered on a relative and indicative basis only. Estimation risks Given the extensive mining history and well-understood nature of the orebodies, there are no deemed material risks to the Mineral Resource Estimation. The key operational risks that could impact the Mineral Reserves are listed below. Ageing infrastructure: All the operating mines were developed between the 1960s and 1980s, and most of the original infrastructure needs regular maintenance, without which frequent break-downs and mining interruptions could occur. All major installations are continuously reviewed and a comprehensive planned maintenance system is in place Seismic risk: Mining at depth and the extraction of high-stressed areas makes the mines prone to mining-induced seismic events, which could result in interruptions, loss of mineable areas and serious injury. All mine plans are reviewed and approved by qualified rock engineers, a comprehensive seismic monitoring system is in place, and seismic response to production is monitored daily. Power supply interruptions and cost increases: Loadshedding and load curtailment due to unreliable and erratic electricity supply from the national service provider has started to impact productivity at the operations. Even though Sibanye-Stillwater is actively working towards becoming less reliant on Eskom, with various renewable energy projects in construction phase, it will still be exposed to this risk in the short to medium term. Illegal mining: Mining activities are occasionally disrupted by illegal miners who gain access to the underground workings and operating footprint. These issues pose threats to the safety of our employees and to our operations, and contribute to increasing security-related costs. All shafts are completely fenced off, with strict access control; all operating areas are monitored via CCTV, and are patrolled by security personnel. Operational performance: Operational underperformance and a slower than planned production build-up at projects may result in variations between planned and achieved production rates. Short interval controls are in place to enable the implementation of timeous interventions and, therefore, correction of deviations to plans. GOLD OPERATIONS continued R&R - 62

KLOOF –––––––––––––––––––––––––––––––––––––––––––––––––––––––––––––––––– Property description The Kloof operation is an intermediate to ultra-deep level gold mining complex, situated in the West Wits Line of the Witwatersrand Basin, near the towns of Randfontein and Westonaria, approximately 60km west of Johannesburg, in the Gauteng province of South Africa. As discussed in section 1, the Group considers the Kloof operation as material for the purpose of SK-1300. The Kloof operation consists of three producing vertical shafts, namely No.1 shaft, No. 7 shaft and No. 8 shaft. The reef horizon is accessed the deepest (40 level is currently the deepest working level) at No. 7 shaft, approximately 3,200m below surface. Fresh ore is processed at the No. 2 plant, which is situated near No. 7 shaft and will, later in the the LoM, transition to Driefontein No. 1 plant as part of infrastructure optimisation. In addition, selected Kloof surface rock dump (SRD) material is treated at the Ezulwini processing plant and at the Driefontein No.1 plant. MINERAL TITLE The Kloof operation is operated in terms of a converted mining right, held by Sibanye Gold (Pty) Ltd under DMRE reference number GP30/5/1/2/2(66) MR (Kloof MR), valid from 30 January 2007 to 29 January 2027, for gold ore and associated minerals, in respect of a mining area totalling 200.87km². Based on the current LoM, Kloof will need to request an extension of the period of validity of the MR through a renewal application in terms of the provisions of the MPRDA from 2027. Infrastructure and equipment The Kloof operation is a mature, established mine, making use of conventional breast mining techniques, with all the permanent infrastructure required to access and mine the underground ore over the currently estimated 10 year LoM. In addition, all the surface infrastructure required to process the material and produce doré is in place. Additional to the three producing shaft systems, one shaft is used for pumping, and one is on care-and-maintenance. There is one mineral processing plant which is slated for closure in 2024. Underground development is extensive, as can be expected of a mature mine of this size. Underground infrastructure includes access infrastructure (to convey personnel, materials and equipment to and from the working areas) and associated services to support mining operations. Horizontal infrastructure includes crosscuts, return airway drives, footwall haulage levels, and declines/inclines. Infrastructure required for ore flow and services include ore and waste passes, conveyor belts, battery powered rail conveyances, ore bins, loading stations, water dams, dewatering pump stations, secondary ventilation and workshops. Electrical, compressed air, and water reticulation are also part of the installed underground infrastructure All equipment required to operate is already in place and in use. SIB capital provisions are made in the LoM technical-economic model for all major equipment upgrades, replacements and maintenance to support the LoM. The property, plant and equipment book value (100%) of all the mine’s assets as at 31 December 2023, was R2.66 billion (US$143.3m). The infrastructure on these mines is maintained using sophisticated computerised maintenance management systems, and critical spares are maintained and shared where necessary. Despite the age of the general infrastructure, all surface and underground infrastructure is reasonably well maintained and equipped. A project to optimise surface and underground infrastructure is in process to reduce fixed overhead costs and capital. GOLD OPERATIONS continued R&R - 63 KLOOF 8 SHAFT (MASIMTHEMBE)

HOISTING AND PRODUCTION CAPACITIES Operating shaft (No) Operating hoisting capacity (ktpm) 5-year planned production (ktpm) No. 1 Shaft 115 81 No. 7* Shaft 63 10 No. 8 Shaft 40 25 * To close end 2025 MINERAL PROCESSING AND CAPACITY Plant Design capacity (ktpm) Operational capacity (ktpm) Type Average recovery factor (%) Material treated Kloof No.2* Plant 167 167 CIP 98 UG Driefontein No. 1 Plant 240 240 CIP 97.4 UG *Planned for closure in 2024 Mineralisation characteristics The Kloof ore bodies comprise four gold-bearing reefs, namely the Ventersdorp contact reef (VCR), the Middelvlei reef (MVR), the Kloof reef (KR), and the Libanon reef (LR). The VCR, located at the top of the Central Rand Group, is the main exploited reef, accounting for 51% of ore mined at Kloof, while the KR, MVR, and LR account for 29%, 17% and 3%, respectively. The average dip of the reefs is 25 to 35 degrees to the south-east and the strike is approximately north-east south-west. The reefs are generally less than two metres thick. Approximately 1% of the total planned gold production comes from low-grade SRDs, which is primarily constituted of development waste rock, and does not form part of the official Mineral Resources or Mineral Reserves. Grade control and ore definition drilling summary Planned 2024 Actual 2023 Actual 2022 Drilled (m) Expenditure (Rm) Drilled (m) Expenditure (Rm) Drilled (m) Expenditure (Rm) Grade control and ore definition 16,100 23.00 14,600 25.00 12,714 18.40 Gold Mineral Resource estimate at 31 December 2023 Mineral Resources Exclusive of Mineral Reserves 31 Dec 2023 31 Dec 2022 GOLD Southern Africa Tonnes Grade Gold Tonnes Grade Gold Kloof (Mt) (g/t) (Moz) (Mt) (g/t) (Moz) Operations Underground Measured 26.7 9.6 8.2 24.9 11.2 9.0 Indicated 24.5 5.5 4.3 33.3 6.6 7.1 Measured + Indicated 51.2 7.6 12.5 58.2 8.6 16.1 Inferred 7.0 4.5 1.0 21.7 8.7 6.1 Grand total 58.2 7.2 13.5 80.0 8.6 22.1 Notes: Weighted average cut-off grade of 563 cm.g/t. For commodity price assumptions refer to page 17 Section 1. For metallurgical recoveries, please refer to the Mineral Processing and recoveries table on page 64. On a Mineral Resources exclusive of Mineral Reserves basis, the year-on-year change is -38.9%, driven primarily by the closure of Kloof 4 shaft (-10.4Moz), with further lessor changes relating to depletion (-0.3Moz) and economic considerations (-0.8Moz) and minor changes in geology and estimation. GOLD OPERATIONS KLOOF continued R&R - 64

Mineral Resource classification maps for Kloof operation GOLD OPERATIONS KLOOF continued R&R - 65

Cut-off value (cm.g/t) To n n e s (M t) c m .g /t Kloof Mineral Resource grade tonnage curve Tonnage (Mt) Resource Grade (cm.g/t) 0 200 400 600 800 1000 1200 1400 1600 1800 2000 2200 2400 0 25 50 75 0 2000 4000 Modifying factors (Underground) in converting Mineral Resources to Mineral Reserves Parameter Unit 2023 2022 Average Mined Value (over LoM) (cm.g/t) 1444 1559 Off-reef Mining % 2.2 2.4 Mine Call Factor % 84.2 84.7 Plant Recovery Factor % 98 98 Development to Mill % 8.1 11.4 Survey Discrepancy % 17.4 10.7 Resource Channel Width cm 111 118 Average Stoping Width cm 166 173 Average Weighted Reserve Cut-off (cm.g/t) 640 590 Mineral Reserves Pay Limit (Year 1) (cm.g/t) 1650 1640 Gold Mineral Reserve estimate at 31 December 2023 Mineral Reserves 31 Dec 2023 31 Dec 2022 GOLD Southern Africa Tonnes Grade Gold Tonnes Grade Gold Kloof (Mt) (g/t) (Moz) (Mt) (g/t) (Moz) Operations Underground Proved 7.6 5.1 1.3 11.0 6.1 2.1 Probable 3.2 5.6 0.6 7.5 5.4 1.3 Grand total Proved + Probable 10.8 5.3 1.8 18.6 5.8 3.4 Notes: For commodity price assumptions refer to page 17 Section 1. For cut-off grades and metallurgical recoveries, please refer to the modifying factors table above. GOLD OPERATIONS KLOOF continued R&R - 66

Mineral Reserve classification map for Kloof operation M o z Kloof operation gold Mineral Reserve reconciliation 3.4 -0.2 0.1 0.1 -1.5 1.8 20 22 R es er ve s D ep le tio n In cl us io ns /e xc lu sio ns G eo lo gy Ec on om ic s ( N o. 4 S ha ft) 20 23 R es er ve s 0 1 2 3 4 Notes: The -47% change year-on-year in the stated Mineral Reserves is attributed to: – -0.2Moz in depletions – -1.5Moz due to the closure of No. 4 Shaft – +0.1Moz due to changes in the underlying geological model at No. 1 Shaft; additions on the VCR at No. 1 and 7 Shafts; and secondary reef exclusions affecting No. 8 Shaft. Tailings deposition and capacity There is one active TSF, the Leeudoorn TSF, which has a capacity of 38.8Mt and is fed to the Kloof No. 2 plant. The LoM requirements for this TSF is only 0.7Mt, resulting in a surplus capacity of 38.1Mt. The remainder of the tailings will be deposited on the Driefontein TSFs as the bulk of the Kloof material will be processed at the Driefontein No. 1 Plant post 2024. (see Driefontein tailings section). Key developments and brownfield projects The long-term decline in productivity at No. 4 shaft, including the the impact of seismicity and loss of mineable face length, was compounded by a significant shaft incident in 2023 and has resulted in early shaft closure and the removal of all Mineral Resources and Mineral Reserves below 41 level. This accounts for the bulk of the changes year-on-year to both the Mineral Resource and the Mineral Reserve at Kloof. The Kloof integration project, which aims to optimise and rationalise the infrastructure between No. 1 shaft and No. 3 shaft, is continuing as planned. This has allowed for the phased closure of No. 3 shaft’s sub-vertical shaft, with the final closure of the main shaft-barrel planned for 2024. The final phase, which is in execution, entails the re-opening of old development areas between No. 1 shaft and No. 3 shaft, which will allow the mining of the remaining VCR and other secondary reefs at No. 3 shaft, from No. 1 shaft. The Kloof operation has several secondary reefs, including the MVR, the KR and the LR. Secondary reefs represent additional gold- bearing formations within the mine beyond the primary reef structures. These secondary reefs can contain economically viable concentrations of gold and are targeted for exploration and extraction to extend the lifespan of the mine and increase overall productivity. Operational statistics and history Annual development results Category Unit 2023 2022 Primary waste development (capital, declines, haulages, crosscuts,boxholes, travelling ways) m 6,879 5,268 Primary reef development (raise, winzes, wide raises) m 2,435 1,684 GOLD OPERATIONS KLOOF continued R&R - 67

Operational statistics 2021 2022 2023 Underground tonnes milled (kt) 1,861 992 1,399 Underground yield (g/t) 5.13 4.34 4.85 Surface tonnes milled (kt) 4,141 1,954 1,565 Surface yield (g/t) 0.33 0.32 0.42 Annual Au production - Underground (koz) 307 138 218 Annual Au production - surface (koz) 44 20 21 Total Annual Au production (koz) 352 158 239 Operating cost underground (R/t) 3,769 6,045 5,276 Total capital expenditure (Rm) 1,616 1,285 1,450 AISC (R/kg) 858,316 1,592,030 1,242,735 AISC (US$/oz) 1,805 3,025 2,099 Note: AISC calculated based on Oz sold • In 1887, Gold Fields of South Africa Limited was established • In 1892, Gold Fields of South Africa Limited was renamed Consolidated Gold Fields of South Africa to mine the deep-level gold deposit of the Witwatersrand • Geophysical prospecting work conducted in the1930s led to the drilling and subsequent sinking of Venterspost shaft in 1934, with first gold poured in 1939 • In 1964, Kloof’s main twin-shaft complex was initiated and the mine was officially opened in 1968 • In 2000, the formation of the Kloof Gold Mine in its present form commenced with the amalgamation of the Venterspost, Libanon, Kloof and Leeudoorn gold mines • In 2012, the conventional South African assets of Gold Fields Limited were unbundled into Sibanye Gold Limited • The No. 4 shaft drop-down project feasibility study was completed in 2015, and in 2017, the project commenced, while the integration project for the optimisation of infrastructure was approved in 2018 • Production returned to normalised levels following protracted industrial action, which saw limited production taking place between December 2018 and May 2019 • The COVID-19 pandemic and the associated national lockdown halted all production from April to the middle of May 2020, at which point a gradual build-up in production was initiated • Industrial action by all unions resulted in a production stoppage between March 2022 and June 2022 • During 2023 Kloof 4 shaft was closed due to economic and safety considerations GOLD OPERATIONS KLOOF continued R&R - 68

DRIEFONTEIN –––––––––––––––––––––––––––––––––––––––––––––––––––––––––––––––––– Property description The Driefontein operation is a mature, intermediate to ultra-deep level gold mine, located near Carletonville, approximately 70km west of Johannesburg, in the Gauteng province of South Africa. It consists of four vertical operating shafts, No. 1 shaft, No. 4 shaft, No. 5 shaft and No. 8 shaft, extending down to 50 level (the lowest working level) at No. 5 shaft, approximately 3,300m below surface. As discussed in section 1, the Group considers the Driefontein operation as material for the purpose of SK-1300. Ore from all the shafts is processed at the Driefontein No. 1 plant. The production from No. 4 shaft and No. 5 shaft is conveyed underground to No. 2 shaft on 22 and 24 levels for hoisting. The Driefontein operation has three fissure water pumping shafts: No. 8 shaft, No. 10 shaft, and North shaft (next to No. 8 shaft), of which only No. 8 shaft is still producing. North shaft pumps bulk fissure water for treatment to potable water standards for own use. Driefontein No. 10 shaft has been placed on care and maintenance and is only maintained to pump fissure water. These shafts combined pump approximately 100ML/day to prevent the operations from flooding. Mineral title The Driefontein operation is operated in terms of a converted mining right held by Sibanye Gold (Pty) Ltd under DMRE reference number GP30/5/1/2/2(51) MR (Driefontein MR), valid from 30 January 2007 to 29 January 2037, for gold and associated minerals, in respect of a mining area totalling 85.61km². Infrastructure and equipment The Driefontein operation has been in production since the 1950s, with the last shafts being commissioned in the late 1990s. It includes all the permanent infrastructure required to access and mine the underground areas. All the mineral processing infrastructure is also well established and in use. The shafts are well maintained and will support mining operations over the estimated 11 year LoM. The underground development is extensive, as can be expected of a mature mine of this size. All footwall access development is mined using mechanical rail-bound methods that are well understood. All stoping is completed using conventional, narrow tabular methods and as such is relatively labour intensive. Provision is made in the LoM and technical-economic model for all major equipment upgrades, replacements and maintenance to support the LoM. The property, plant and equipment book value (100%) of all the mine’s assets as at 31 December 2023, was R4.23 billion (US$228m). HOISTING AND PRODUCTION CAPACITIES Operating shaft (No) Operating hoisting capacity (ktpm) 5-year planned production (ktpm) No. 1 Shaft 36 25 No. 2* Shaft 90 58 No. 4 Shaft 26 23 No. 5 Shaft 106 35 No. 8 Shaft 32 24 * Includes No. 4 and No. 5 shafts’ production MINERAL PROCESSING AND CAPACITY Plant Design capacity (ktpm) Operational capacity (ktpm) Type Average recovery factor (%) Material treated No.1 Plant 240 240 CIP 97 UG Mineralisation characteristics The Driefontein operation exploits three primary reefs, namely the Ventersdorp contact reef (VCR) located at the top of the Central Rand Group, the Carbon leader reef (CLR) near the base of the group, and the Middelvlei reef (MVR), which stratigraphically occurs some 50 to 75 metres above the CLR. The VCR strikes east-north-east and has a regional dip of about 21° to the south-southeast. CLR strikes west-south-west and dips to the south at approximately 25°; MVR strikes west-south-west, with a regional dip of approximately 22° to the south-southeast. The reefs are generally less than two metres thick, and are widely considered to represent extensive fluvial fans, and as such they are laterally continuous with clear patterns of mineralisation governed by sedimentary characteristics. Most of the mining takes place on the VCR, which constitutes 59% of the Mineral Reserves, the CLR 33%, and MVR the remaining 8%. GOLD OPERATIONS continued R&R - 69 DRIEFONTEIN 1 SHAFT - MASAKHANE

Grade control and definition drilling summary Planned 2024 Actual 2023 Actual 2022 Drilled (m) Expenditure (Rm) Drilled (m) Expenditure (Rm) Drilled (m) Expenditure (Rm) Grade control and ore definition 23,419 30.04 16,947 22.47 13,280 16.99 Gold Mineral Resource estimate at 31 December 2023 Mineral Resources Exclusive of Mineral Reserves 31 Dec 2023 31 Dec 2022 GOLD Southern Africa Tonnes Grade Gold Tonnes Grade Gold Driefontein (Mt) (g/t) (Moz) (Mt) (g/t) (Moz) Operations Underground Measured 15.6 9.1 4.6 16.7 9.4 5.0 Indicated 10.3 7.6 2.5 9.9 8.2 2.6 Measured + Indicated 25.9 8.5 7.1 26.6 8.9 7.7 Inferred 4.5 5.0 0.7 1.3 4.8 0.2 Grand total 30.4 8.0 7.8 28.0 8.7 7.9 Notes: Weighted average cut-off grade of 566 cm.g/t. For commodity price assumptions refer to page 17 Section 1. For metallurgical recoveries, please refer to the Mineral Processing and recoveries table on page 69. On a Mineral Resources exclusive of Mineral Reserves basis, the year-on-year change is -0.7%, driven primarily by enhanced mineral economics (+1.2Moz) and boundary adjustments (+0.4Moz), off-set by depletion (-0.3Moz) and changes relating to geology and estimation (-0.6Moz). Cut-off value (cm.g/t) To n n e s (M t) c m .g /t Driefontein Mineral Resource grade tonnage curve Tonnage (Mt) Resource Grade (cm.g/t) 0 200 400 600 800 1000 1200 1400 1600 1800 2000 2200 2400 0 25 50 0 2000 4000 GOLD OPERATIONS DRIEFONTEIN continued R&R - 70

Mineral Resource classification maps for Driefontein operation Modifying factors (underground) in converting Mineral Resources to Mineral Reserves Parameter Unit 2023 2022 Average Mined Value (over LoM) (cm.g/t) 1929 1964 Off-reef Mining % 5.5 6 Mine Call Factor % 84.1 83 Plant Recovery Factor % 97 97 Development to Mill % 9.5 9 Survey Discrepancy % 12.1 11 Resource Channel Width cm 71 72 Average Stoping Width cm 154 152 Average Weighted Reserve Cut-off (cm.g/t) 550 560 Mineral Reserves Pay Limit (Year 1) (cm.g/t) 1970 1900 GOLD OPERATIONS DRIEFONTEIN continued R&R - 71

Gold Mineral Reserve estimate at 31 December 2023 Mineral Reserves 31 Dec 2023 31 Dec 2022 GOLD Southern Africa Tonnes Grade Gold Tonnes Grade Gold Driefontein (Mt) (g/t) (Moz) (Mt) (g/t) (Moz) Operations Underground Proved 5.6 8.7 1.6 5.8 8.4 1.6 Probable 6.0 7.1 1.4 5.6 7.9 1.4 Grand total Proved + Probable 11.6 7.9 2.9 11.4 8.1 3.0 Notes: For commodity price assumptions refer to page 17 Section 1. For cut-off grades and metallurgical recoveries, please refer to the modifying factors table on page 69. Mineral Reserve classification map for the Driefontein operation M o z Driefontein operation gold Mineral Reserve reconciliation 3.0 -0.2 0.2 2.9 2022 Reserves Depletion Geology 2023 Reserves 0 1 2 3 Notes: The -1% change year-on-year in the stated Mineral Reserves is attributed mainly to depletion (-0.2Moz) offset by evaluation model changes on the CL at No. 5 Shaft. Tailings deposition and capacity There are two active TSFs, Driefontein TSF 1 and Driefontein TSF 2, both being fed with fresh underground tailings: • Driefontein TSF 1 has available capacity of 11.9Mt, with an estimated LoM depositional requirement of 10.8Mt, resulting in surplus capacity of 1.0Mt • Driefontein TSF 2 has available capacity of 11.8Mt, with an estimated LoM depositional requirement of 10.8Mt, resulting in surplus capacity of 0.9Mt The LoM depositional requirement includes tailings from the processing of the Kloof underground material, as from 2025, over the life of the operation. Key developments and brownfield projects The No. 4 shaft pillar extraction project is in progress, with wide raise development and selected stoping being done on the perimeter, making up one third of the total Mineral Reserves for No. 4 shaft. Final extraction has been sequenced to coincide with the extraction of the remaining Mineral Reserves on the lower levels. The exploration of the secondary VCR at No. 1 and No. 5 shafts has yielded exceptional results, with the contribution from the VCR increasing year-on-year and by over 300% in the last 5 years. The Driefontein LoM has in turn been extended by 6 years when compared to the status 5 years ago. Continuous exploration drilling of the VCR at No. 1 Shaft and No. 5 Shaft is likely to continue playing a critical role in securing LoM extensions at these shafts. GOLD OPERATIONS DRIEFONTEIN continued R&R - 72

Operational statistics and history Annual development results Category Unit 2023 2022 Primary waste development (capital, declines, haulages, crosscuts,boxholes, travelling ways) m 7,398 4,418 Primary reef development (raise, winzes, wide raises) m 1,249 1,060 Operational statistics 2021 2022 2023 Underground tonnes milled (kt) 1,474 840 1,237 Underground yield (g/t) 6.11 5.45 5.76 Surface tonnes milled (kt) 563 694 258 Surface yield (g/t) 0.45 0.46 0.52 Annual Au production - Underground (koz) 290 147 229 Annual Au production - surface (koz) 8 10 4 Total Annual Au production (koz) 298 157 233 Operating cost underground (R/t) 3,778 6,289 5,267 Total capital expenditure (Rm) 1,499 1,152 1,951 AISC (R/kg) 793,000 1,378,868 1,187,292 AISC (US$/oz) 1,668 2,620 2,005 Note: AISC calculated based on Oz sold • Exploration activities from 1933 to 1939 culminated in the registration of West Driefontein Mining Company in 1945 • West Driefontein started milling ore in 1952 following shaft sinking • Further exploration lead to the adjoining East Driefontein Gold Mining Company Limited in 1968, with first production in 1972 • In 1981 East Driefontein Gold Mining Company Ltd became a wholly-owned subsidiary of Driefontein Consolidated Ltd • In 1999, Gold Fields Limited obtained full control of Driefontein Gold Mine by buying AngloGold Ashanti Limited’s 21.5% shareholding • In 2012, the conventional South African assets of Gold Fields Limited were unbundled into Sibanye Gold Limited • In 2014, Sibanye-Stillwater completed the PFS of the Driefontein No. 5 Shaft Drop-down Project and drop-down development commenced. This decline project was deferred in 2018 • In 2019 the No. 4 shaft pillar extraction project commenced • The COVID-19 pandemic and the associated national lockdown halted all production from April to the middle of May 2020, at which point a gradual build-up in production was initiated • In 2021, successful exploration of the secondary VCR at No.1 Shaft and No. 5 shaft increased Mineral Reserves by >0.3Moz. Ongoing success has resulted in an extension of LoM to 2034 GOLD OPERATIONS DRIEFONTEIN continued R&R - 73

BEATRIX –––––––––––––––––––––––––––––––––––––––––––––––––––––––––––––––––– Property description The Beatrix operation is a mature, shallow to intermediate level underground gold operation. It is located near the towns of Welkom and Virginia, approximately 280km south-west of Johannesburg, in the Free State province of South Africa. The Beatrix operation is a conventional mining operation, consisting of two operating shafts: No. 1 shaft and No. 3 shaft. The ore-body is accessed using a vertical shaft system, down to 26 level (the lowest working level at No. 3 shaft), approximately 1,350m below surface. Mining predominantly takes place from No. 3 shaft. The No. 1 shaft remains open as a secondary escape way for No. 3 shaft. Beatrix. 4 shaft was closed in early 2023 and is being placed on care and maintenance. Mineral title The Beatrix operation is operated under a converted mining right held by Sibanye Gold (Pty) Ltd under DMRE reference number: FS30/5/1/2/2/10047 (Beatrix MR) in respect of gold and associated minerals over a mining area totalling 168.21km². The Beatrix MR is valid until 6 February 2030. Mineralisation characteristics The Beatrix operation exploits the VS5/Beatrix reefs (VS5/BXR) at the base of the Eldorado Formation. In general, the composite reefs range between 130cm and 350cm in width. The orebody is shallow, dipping at 10º to 15º. Grade control and definition drilling summary Planned 2024 Actual 2023 Actual 2022 Operation - Beatrix Drilled (m) Expenditure (Rm) Drilled (m) Expenditure (Rm) Drilled (m) Expenditure (Rm) Grade control and ore definition 1,650 1.46 2,780 2.44 2,350 2.28 GOLD OPERATIONS continued R&R - 74 3 SHAFT – BEATRIX OPERATION

Gold Mineral Resource estimate at 31 December 2023 Mineral Resources Exclusive of Mineral Reserves 31 Dec 2023 31 Dec 2022 GOLD Southern Africa Tonnes Grade Gold Tonnes Grade Gold Beatrix (Mt) (g/t) (Moz) (Mt) (g/t) (Moz) Operations Beatrix Underground Measured 12.6 5.9 2.4 17.0 7.0 3.8 Indicated 16.0 5.8 3.0 16.9 6.2 3.4 Measured + Indicated 28.6 5.8 5.4 33.9 6.6 7.2 Inferred 0.5 4.1 0.1 1.6 4.5 0.2 Beisa Underground Measured 3.6 3.2 0.4 3.6 3.2 0.4 Indicated 7.8 3.3 0.8 7.8 3.3 0.8 Measured + Indicated 11.4 3.3 1.2 11.4 3.3 1.2 Inferred 0.04 3.3 0.004 0.04 3.3 0.004 Total Measured + Indicated 40.0 5.1 6.6 45.2 5.8 8.4 Grand total 40.5 5.1 6.6 46.9 5.7 8.6 Notes: Weighted average cut-off grade of 455 cm.g/t. For commodity price assumptions refer to page 17 Section 1. Metallurgical recoveries of 94.5%. Mineral Resource classification map for the Beatrix operation On a Mineral Resources exclusive of Mineral Reserves basis, the year-on-year change is -23.2%. Modifying factors (underground) in converting Mineral Resources to Mineral Reserves Parameter Unit 2023 2022 Average Mined Value (over LoM) (cm.g/t) 1,097 1,085 Off-reef Mining % 2.8 2.9 Mine Call Factor % 65.8 70 Plant Recovery Factor % 94.5 94.5 Development to Mill % 2.7 3.6 Survey Discrepancy % 5.5 3.8 Resource Channel Width cm 144 147 Average Stoping Width cm 184 184 Average Weighted Reserve Cut-off (cm.g/t) 440 420 Mineral Reserves Pay Limit (Year 1) (cm.g/t) 1,030 1,110 GOLD OPERATIONS BEATRIX continued R&R - 75

Gold Mineral Reserves estimate at 31 December 2023 Mineral Reserves 31 Dec 2023 31 Dec 2022 GOLD Southern Africa Tonnes Grade Gold Tonnes Grade Gold Beatrix (Mt) (g/t) (Moz) (Mt) (g/t) (Moz) Operations Underground Proved 4.7 3.5 0.5 5.9 3.8 0.7 Probable 1.2 3.5 0.1 0.7 3.1 0.1 Grand total Proved + Probable 5.9 3.5 0.7 6.7 3.7 0.8 Notes: For commodity price assumptions refer to page 17 Section 1. For cut-off grades and metallurgical recoveries, please refer to the modifying factors table above. Beatrix Mineral Reserve classification map M o z Beatrix operation gold Mineral Reserve reconciliation 0.8 -0.1 0.1 0.01 -0.1 -0.02 0.7 20 22 R ese rv es Deple tio n Inclusio ns/e xc lusio ns G eolo gy Ec onom ic s ( No. 1 Sh aft) M odify ing fa cto rs 20 23 R ese rv es 0.0 0.5 1.0 Notes: The -17% change year-on-year in the stated Mineral Reserves is attributed to: – -0.1Moz in depletions – +0.1Moz in additions based on the extension of No. 3 Shaft – -0.1Moz due to economic considerations at No. 1 Shaft Tailings deposition and capacity There is one active TSF, the Beatrix TSF; and one dormant TSF, the No. 4 shaft TSF. The Beatrix TSF has remaining capacity of 15.4Mt, with expected LoM deposition of 5.9Mt, which is 9.5Mt surplus. Key developments and brownfield projects The operation is at a mature stage, with the current LoM ending in 2027. Life extension opportunities are limited, but No. 1 shaft is being kept open on an incremental value contribution basis, and is not included in the official LoM plan. At No. 3 shaft, previously unmined (white) areas have been included in the Mineral Reserves, extending the LOM by 1 year over previous estimates; remaining areas will continuously be assessed for viability. GOLD OPERATIONS BEATRIX continued R&R - 76

Operational statistics Annual development results Category Unit 2023 2022 Primary waste development (capital, declines, haulages, crosscuts,boxholes, travelling ways) m 5,018 3,677 Primary reef development (raise, winzes, wide raises) m 2,480 1,479 Total m 7,497 5,156 Operational statistics 2021 2022 2023 Underground tonnes milled (kt) 1,826 929 1,420 Underground yield (g/t) 3.37 3.08 2.93 Surface tonnes milled (kt) 650 124 366 Surface yield (g/t) 0.36 0.41 0.22 Annual Au production - Underground (koz) 198 92 134 Annual Au production - surface (koz) 7 2 3 Total Annual Au production (koz) 205 94 136 Operating cost underground (R/t) 2,464 4,277 2,822 Operating cost surface (R/t) 182 557 262 Total capital expenditure (Rm) 668 375 438 AISC (R/kg) 857,256 1,573,006 1,100,668 AISC (US$/oz) 1,803 2,989 1,859 Note: AISC calculated based on oz sold Uranium at Beatrix The Beisa uranium Mineral Resource is contained in the Beisa reef, that occurs in the western portion (No. 4 shaft) of the Beatrix operation’s mining right. A pre-feasibility study was concluded in 2023 into the option of re-starting gold and uranium co-production by accessing the Beisa reef from Beatrix 4 shaft. The economic and technical feasibility of this project is being monitored on an ongoing basis, and it remains an important strategic uranium development opportunity under favourable market conditions. Uranium (U3O8) Mineral Resource estimate at 31 December 2023 Mineral Resources 31 Dec 2023 31 Dec 2022 URANIUM Southern Africa Tonnes Grade U₃O₈ Tonnes Grade U₃O₈ BEATRIX (Mt) (kg/t) (Mlb) (Mt) (kg/t) (Mlb) Exploration Beisa Underground Measured 3.6 1.1 8.5 3.6 1.09 8.5 Indicated 7.8 1.1 18.3 7.8 1.07 18.3 Measured + Indicated 11.4 1.1 26.9 11.4 1.07 26.9 Inferred 0.04 1.1 0.1 0.04 1.10 0.1 Total Measured + Indicated 11.4 1.1 26.9 11.4 1.07 26.9 Grand total 11.4 1.1 27.0 11.4 1.07 27.0 GOLD OPERATIONS BEATRIX continued R&R - 77 BEATRIX PLANT – FREE STATE

COOKE –––––––––––––––––––––––––––––––––––––––––––––––––––––––––––––––––– Property description The Cooke operation is situated in the West Wits Line of the Witwatersrand Basin, near the town of Randfontein, approximately 35km south-west of Johannesburg, in the Gauteng province of South Africa. It was previously a large underground mining complex, consisting of four vertical production shafts, but the final underground workings were placed on care and maintenance during 2017. Current operations comprise the Randfontein surface operation (RSO), which mines and re-treats historic tailings through the Cooke gold plant. In addition,the Ezulwini gold plant (at No. 4 shaft) is used as a toll treatment facility, catering to both external and internal operations. Mineral title Rand Uranium (Pty) Ltd (a subsidiary of Sibanye Gold (Pty) Ltd) holds a converted mining right over the operations known as Cooke No. 1, No. 2 and No. 3 in terms of the MPRDA, under DMRE reference number: GP30/5/1/2/2/07 MR (Cooke 123 MR), valid from 18 December 2007 to 17 December 2037 and covering a total area of 78.75km². Rand Uranium (Pty) Ltd also holds a converted mining right over the operation known as Randfontein Surface Operation in terms of the MPRDA, under DMRE reference number: GP30/5/1/2/2/173 MR (RSO MR) valid from 7 May 2009 to 6 May 2039, with a total area of 31.30km². Ezulwini Mining Company (Pty) Ltd (a subsidiary of Sibanye Gold (Pty) Ltd) holds a converted mining right over the operation known as Cooke No. 4 (Ezulwini), under DMRE reference number: GP30/5/1/2/2/38 MR (Ezulwini MR), valid from 20 November 2006 to 19 November 2036 and covering a total area of 37.18km². Infrastructure and equipment The RSO is a mature, established and ongoing reprocessing operation. All the permanent infrastructure required to mine and process the surface Mineral Reserves declared in support of the LoM plan, is already established and in use. The mining method is via monitored high-pressure water jets. The Cooke plant has a design capacity of 400ktpa, while the Ezulwini plant can process 200ktpa. Mineralisation characteristics The mineral assets are historical gold plant tailings material from the mining of auriferous and uraniferous quartz conglomerate ore from the Witwatersrand Basin. GOLD OPERATIONS continued R&R - 78 MILLSITE TSF COOKE PLANT

Gold Mineral Resource estimate at 31 December 2023 Mineral Resources Exclusive of Mineral Reserves 31 Dec 2023 31 Dec 2022 GOLD Southern Africa Tonnes Grade Gold Tonnes Grade Gold Cooke (Mt) (g/t) (Moz) (Mt) (g/t) (Moz) Operations Cooke TSF Surface Measured 60.3 0.3 0.5 60.3 0.3 0.5 Indicated 5.3 0.4 0.1 5.3 0.4 0.1 Measured + Indicated 65.6 0.3 0.6 65.6 0.3 0.6 Inferred — — — — — — RSO-Millsite TSF Surface Measured 90.6 0.2 0.7 94.1 0.2 0.7 Indicated 0.4 0.2 0.003 1.5 0.3 0.01 Measured + Indicated 91.0 0.2 0.7 95.7 0.2 0.8 Inferred — — — — — — Cooke 4 TSF Surface Measured — — — — — — Indicated 34.4 0.3 0.3 34.4 0.3 0.3 Measured + Indicated 34.4 0.3 0.3 34.4 0.3 0.3 Inferred — — — — — — Total Measured + Indicated 191.0 0.3 1.6 195.7 0.3 1.7 Grand total 191.0 0.3 1.6 195.7 0.3 1.7 Notes: Reported at a zero cut-off grade. For commodity price assumptions refer to page 17 Section 1. M o z Cooke operation gold Mineral Reserve reconciliation 0.07 -0.03 0.04 0.08 2022 Reserves Depletion Inclusions/exclusions 2023 Reserves 0.00 0.05 0.10 Gold Mineral Reserve estimate at 31 December 2023 Mineral Reserves 31 Dec 2023 31 Dec 2022 GOLD Southern Africa Tonnes Grade Gold Tonnes Grade Gold Cooke (Mt) (g/t) (Moz) (Mt) (g/t) (Moz) Operations TSF Surface Proved — — — — — — Probable 8.8 0.3 0.1 7.3 0.3 0.1 Grand total Proved + Probable 8.8 0.3 0.1 7.3 0.3 0.1 Notes: For commodity price assumptions refer to page 17 Section 1. GOLD OPERATIONS COOKE continued R&R - 79

Mineral Reserve classification map for the RSO (Millsite) Tailings deposition and capacity Tailings from Cooke plant are deposited into historic, unrehabilitated, open pits connected to the old underground workings of the historic Randfontein Estates Gold Mine as part of the approved environmental management programme report (EMPR). The volumetric depositional capacity available in these pits, which assumes there is no further storage capacity in the connected underground workings, is used to constrain the current three year LoM. Longer term, the exploitation of the remaining surface Mineral Resources are dependent on the establishment of a new regional TSF, which is being pursued via DRDGOLD. Key developments and brownfield projects Since the Mineral Reserves are limited by the availability of tailings storage in the old pits, a focus for the operation is to secure additional tailings depositional capacity that could support an increase in the reported three years LoM. The Millsite TSF complex, which is currently being exploited, and represents the bulk of the reported Mineral Resources, contains a total of approximately 100Mt of attributable Mineral Resources, potentially supporting a 20y LoM. Operational statistics Operational statistics 2021 2022 2023 Surface tonnes milled (kt) 4,642 4,074 4,289 Surface yield (g/t) 0.25 0.25 0.28 Total Annual Au production (koz) 37 32 38 Operating cost surface (R/t) 174 210 294 AISC (R/kg) 742,979 907,407 1,117,309 AISC (US$/oz) 1,562 1,724 1,887 Note: AISC calculated based on Oz sold Uranium at Cooke The Cooke uranium Mineral Resources are contained within two historic TSFs situated on the Cooke mineral rights. They are classified as “moveable assets” and as such the right to mine is not tied to the mining right. The uranium Mineral Resources are a byproducts of gold mining at the historic Cooke operations. These surface uranium Mineral Resources represent a key strategic opportunity due to the proximity of the existing Cooke (gold only) and Ezulwini (gold and uranium) processing plants. Various development options are currently being traded off to establish the optimum path to production from these assets, especially in light of the recent surge in uranium prices and the increasing sentiment towards uranium and nuclear as a key part of the world’s energy solution. Uranium Mineral Resource estimate at 31 December 2023 Mineral Resources 31 Dec 2023 31 Dec 2022 URANIUM Southern Africa Tonnes Grade U₃O₈ Tonnes Grade U₃O₈ COOKE (Mt) (kg/t) (Mlb) (Mt) (kg/t) (Mlb) Exploration Cooke TSF Surface Measured 60.3 0.19 24.7 60.3 0.19 24.7 Indicated 5.3 0.12 1.4 5.3 0.12 1.4 Measured + Indicated 65.6 0.18 26.1 65.6 0.18 26.1 Inferred — — — — — — Cooke 4 TSF Surface Measured — — — — — — Indicated 34.4 0.08 6.2 34.4 0.08 6.2 Measured + Indicated 34.4 0.08 6.2 34.4 0.08 6.2 Inferred — — — — — — RSO-Millsite TSF Surface Measured — — — 94.1 0.03 7.2 Indicated — — — 1.5 0.06 0.2 Measured + Indicated — — — 95.7 0.04 7.4 Inferred — — — — — — Total Measured + Indicated 100.0 0.15 32.2 195.7 0.09 39.6 Grand total 100.0 0.15 32.2 195.7 0.09 39.6 GOLD OPERATIONS COOKE continued R&R - 80

DRDGOLD ––––––––––––––––––––––––––––––––––––––––––––––––––––––––––––––––––––––––––––––––––––––––––––––––––––––––––––––––––––––––––––––––––––––– Property description DRDGOLD is a JSE and NYSE-listed company that operates the Ergo and Far West Gold Recoveries (FWGR) operations, recovering gold from the retreatment of historic gold TSFs: • The Ergo metallurgical plant, and its associated TSFs, are located 70km east of Johannesburg in the Gauteng province • The Knights plant, located 25km east of Johannesburg, off the R29 Main Reef road, previously operated as a metallurgical plant and has been reconfigured to operate as a milling and pump station which feeds material to the Ergo plant • City Deep is a milling plant which operates as a pump/milling station feeding the Ergo and Knights metallurgical plants The FWGR assets, acquired in 2018 from Sibanye-Stillwater, are situated in the West Rand of the Gauteng province, 30km south- west of Johannesburg. The FWGR operation includes historical TSFs, with a total area of 4.1km², and includes the Driefontein No. 2 metallurgical plant. Mineral title DRDGOLD and its subsidiaries own the rights to some of the properties where the Mineral Resources are located. In other cases, agreements are in place with the landowners to mine the dump material and rehabilitate the land for other uses. The necessary agreements are in place for all properties in the LoM plan. Mineral Resources and Mineral Reserves held by Ergo include ownership through common law, verified contractual arrangements, prospecting rights, and various mineral rights as well as the required environmental permitting. Ergo has submitted an application to renew and consolidate all these mining rights into a single mining right. This application is receiving attention from the DMRE. Renewal applications have been submitted to the DMRE for each expired mining right. Ergo has applied to extend the consolidated mining right for 30 years, which is the maximum allowable period as detailed in the MPRDA. Mining rights are held at Ergo Mining Pty. Ltd. level, and their current status are listed below: • CMR GP, 30/5/1/2/2/10024 MR, 6,16km², expired on 20/06/2014. Renewal application submitted. Awaiting grant • Crown GP, 30/5/1/2/2/10022 MR, 11,25km², expired on 20/06/2014. Renewal application submitted. Awaiting grant • City Deep GP, 30/5/1/2/2/10023 MR, 5.7km², expired on 17/01/2014. Renewal application submitted. Awaiting grant • Knights GP, 30/5/1/2/2/10067 MR, 5.76km², expired on 20/06/2018. Renewal application submitted. Awaiting grant • Ergo GP, MR 30/5/1/2/2/10097, 33,58km², expired on 27/10/2021. Renewal application submitted. Awaiting grant. GOLD OPERATIONS continued R&R - 81 FAR WEST GOLD RECOVERIES – TSF RECLAMATION

These rights are enforceable until such stage as the DMRE has accepted or rejected the mining renewal applications as per the MPRDA. There are impediments on the right to mine at the Grootvlei complex and Marievale TSFs. Please refer to the DRDGOLD Annual Integrated Report 2023 for details (page 89). At the FWGR operation, the TSFs were acquired from Sibanye- Stillwater in a transaction in which common-law ownership was established over the various TSFs. A use and access agreement articulates the various rights, permits and licenses held by Sibanye- Stillwater in terms of which FWGR operates, pending the transfer to FWGR of those that are transferable. Infrastructure and equipment The Ergo assets include multiple TSFs, a 50km pipeline, and tailings deposition facilities including the significant Brakpan/Withok TSF. The Ergo plant (1.8Mtpm capacity) currently treats around 1.7Mtpm of material. Material treated at the Ergo plant is deposited onto the Brakpan/ Withok TSF. At FWGR, the upgraded Driefontein No. 2 plant currently treats around 0.5Mtpm of material from Driefontein No. 3 TSF. At Ergo, sandy material is reclaimed using mechanical front-end loaders, re-pulped with water and pumped to the plant. At both operations, fine tailings are reclaimed hydraulically using high- pressure water monitoring guns. The re-pulped slime is pumped to the plant and the reclaimed material is treated using screens, cyclones, ball mills, and carbon-in-leach (CIL) technology to extract the gold. Ergo LoM is estimated at 19 years (until 2042). At the FWGR operations there is a smelting agreement in place with Sibanye-Stillwater, for the Driefontein No. 2 plant (600ktpm capacity), whereby Sibanye-Stillwater receives a fee based on the smelting costs, plus 10% of the smelting costs. FWGR has sufficient Mineral Reserves to allow processing of an eventual 1.2Mtpm for approximately 18 years (until 2041). Mineralisation characteristics DRDGOLD’s reprocesses surface tailings deposits from legacy underground mines in the regions it operates which were residue of the processing of gold and uranium ores of the gold bearing late Archaean (2.7Ga to 3.2Ga) Witwatersrand sedimentary basin. Gold Mineral Resource estimate at 31 December 2023 Mineral Resources Exclusive of Mineral Reserves 31 Dec 2023 31 Dec 2022 GOLD Southern Africa Tonnes Grade Gold Tonnes Grade Gold DRDGOLD (Mt) (g/t) (Moz) (Mt) (g/t) (Moz) Operations ERGO TSF Surface Measured 33.4 0.3 0.3 33.2 0.3 0.3 Indicated 188.2 0.2 1.5 188.7 0.2 1.5 Measured + Indicated 221.6 0.3 1.8 222.0 0.3 1.8 Inferred 10.7 0.2 0.1 10.7 0.2 0.1 Grand total 232.3 0.3 1.9 232.7 0.3 1.9 Modifying factors in converting Mineral Resources to Mineral Reserves Parameter Unit 2023 2022 Mineral Reserve Pay Limit (ERGO) g/t 0.23 0.24 Mineral Reserve Pay Limit (FWGR) g/t 0.17 0.15 Plant Recovery Factor (ERGO) % 41 41 Plant Recovery Factor (FWGR) % 53 54 GOLD OPERATIONS DRDGOLD continued R&R - 82 FAR WEST GOLD RECOVERIES – DRIEFONTEIN 4 TSF

Gold Mineral Reserves estimate as at 31 December 2023 Mineral Reserves 31 Dec 2023 31 Dec 2022 GOLD Southern Africa Tonnes Grade Gold Tonnes Grade Gold DRDGOLD (Mt) (g/t) (Moz) (Mt) (g/t) (Moz) Operations ERGO TSF Surface Proved 90.2 0.3 0.9 97.6 0.3 1.0 Probable 98.6 0.3 0.8 97.0 0.2 0.7 Proved + Probable 188.9 0.3 1.7 194.6 0.3 1.8 FWGR TSF Surface Proved 103.6 0.3 1.1 107.5 0.3 1.1 Probable 6.5 0.3 0.1 6.5 0.3 0.1 Proved + Probable 110.0 0.3 1.2 113.9 0.3 1.2 Grand total Proved + Probable 298.9 0.3 2.9 308.5 0.3 3.0 The main material difference in the Mineral Resource and Mineral Reserve from year to year is depletion. Tailings deposition and capacity Ergo currently deposits tailings on the Brakpan/Withok TSF. The last regulatory requirements will be obtained for the final life design of the Brakpan/Withok TSF to support Ergo's current LoM of 19 years. Despite the Daggafontein TSF being classified as a Mineral Reserve, the TSF has been evaluated for its capacity to accept tailings and remains an option as an additional TSF if required. FWGR phase one production tailings are currently deposited on Driefontein 4 TSF. From 2026, depositioning is scheduled to reduce as the TSF is expected to reach full capacity. To fully exploit the larger FWGR Mineral Resources, feasibility studies have been conducted into the construction of a large, centralised, regional deposition facility, and permitting is being pursued. Key developments and brownfield projects DRDGOLD plans to develop the FWGR assets into a large scale (1.2Mtpm), long life (18 years) operation through a phased approach. Phase one, involving the retreatment of the Driefontein No. 5 TSF through the Driefontein No. 2 plant and deposition on the Driefontein No. 4 TSF, is underway. Phase two involves the construction of a regional storage facility for retreatment of the remaining historical TSFs. Operational statistics Operational statistics 2021 2022 2023 Surface tonnes milled (kt) 29,244 26,565 21,408 Surface yield (g/t) 0.19 0.21 0.24 Total Annual Au production (koz) 181 179 164 Operating cost surface (R/t) 115 142 192 AISC (R/kg) 665,065 804,297 888,321 AISC (US$/oz) 1,399 1,528 1,500 Note: AISC calculated based on Oz sold GOLD OPERATIONS DRDGOLD continued R&R - 83

GOLD DEVELOPMENT BURNSTONE –––––––––––––––––––––––––––––––––––––––––––––––––––––––––––––––––– Property description The Burnstone project is a shallow gold development project, situated near Balfour in the Mpumalanga province, South Africa, 80km south-east of Johannesburg. The Burnstone project intends mining the UK9A Kimberley reef to produce approximately 140kozpa over a 23-year LoM and was scheduled for steady state production by 2031. Sibanye-Stillwater acquired the Burnstone project through the acquisition of WitsGold Ltd. in 2014 and has proceeded with development and infrastructure upgrades since 2016. Following an updated feasibility study, the Sibanye-Stillwater Board gave approval for the continuation of the construction of the Burnstone project in early 2021. Consistent with the requirements of the Group’s capital allocation framework, the Burnstone project (included in the SA gold corporate and reconciling items reportable segment) will be deferred. Mineral title Sibanye Gold Eastern Operations (Pty) Ltd. is the holder of a mining right in respect of the Burnstone project under DMRE reference number: MP30/5/1/2/2/(248)MR (Burnstone MR). The Burnstone MR is valid from 17 February 2009 to 16 February 2027 in respect of an area totalling 131.36km², and is located in the Dipaleseng District Municipality (Balfour) in the Mpumalanga Province of South Africa. INFRASTRUCTURE AND EQUIPMENT The Burnstone project is planned as a shallow trackless/ conventional hybrid project and was significantly pre-developed by previous owners. The mining layout was revised by Sibanye-Stillwater to incorporate both trackless development and conventional stoping, with the aim of being able to negotiate the complex geological structure. The Burnstone project has two established access points into the underground workings: a three-legged decline shaft and a vertical shaft (165ktpm capacity), as well as an established metallurgical processing facility. All surface infrastructure to support the underground mining is either in place or has been planned in the LoM, with an appropriate capital estimate. A mineral processing plant (125ktpm capacity, upgradeable to 175ktpm with the addition of another mill) is situated next to the vertical shaft, where the bulk of the tonnage will be hoisted. It is currently on care and maintenance and will be restarted after a suitable ore stockpile has been established. Mineralisation characteristics The targetted UK9A reef is a thin (less than 1 metre), highly channelised and shallow dipping (<10°) conglomerate orebody. Tailings deposition and capacity There is an existing TSF with a capacity of 24.1Mt, which is a surplus of 4.3Mt over LoM requirements. Operational statistics Operational statistics 2021 2022 2023 Total capital expenditure (Rm) 186 934 1,517 R&R - 84 BURNSTONE VERTICAL SHAFT UK9A REEF

Gold Mineral Resource estimate at 31 December 2023 Mineral Resources Exclusive of Mineral Reserves 31 Dec 2023 31 Dec 2022 GOLD Southern Africa Tonnes Grade Gold Tonnes Grade Gold Burnstone (Mt) (g/t) (Moz) (Mt) (g/t) (Moz) Development Underground Measured 0.4 4.4 0.1 0.3 13.4 0.1 Indicated 10.9 4.4 1.6 5.8 11.1 2.1 Measured + Indicated 11.4 4.4 1.6 6.0 11.2 2.2 Inferred 29.3 4.3 4.1 31.5 4.2 4.3 Grand total 40.7 4.3 5.7 37.6 5.3 6.5 On a Mineral Resources exclusive of Mineral Reserves basis, the year-on-year change is -12.0%. Mineral Reserve classification map for Burnstone Gold Mineral Reserve estimate at 31 December 2023 Mineral Reserves 31 Dec 2023 31 Dec 2022 GOLD Southern Africa Tonnes Grade Gold Tonnes Grade Gold Burnstone (Mt) (g/t) (Moz) (Mt) (g/t) (Moz) Development Underground Proved — — — — — — Probable 19.8 4.0 2.5 20.5 4.0 2.7 Grand total Proved + Probable 19.8 4.0 2.5 20.5 4.0 2.7 Notes: The -5% change year-on-year in the stated Mineral Reserves is attributed to -0.1Moz in area exclusions following a revised build-up profile with a slower start-up. GOLD DEVELOPMENT BURNSTONE continued R&R - 85

GOLD EXPLORATION SOUTHERN FREE STATE (SOFS) –––––––––––––––––––––––––––––––––––––––––––––––––––––––––––––––––– Property description SOFS is an advanced stage exploration project, including the Bloemhoek, De Bron-Merriespruit (DBM), Robijn and Hakkies areas, situated close to the town of Virginia in the Free State province of South Africa, adjacent and contiguous to the Beatrix operation. Mineral title A subsidiary of Sibanye Stillwater Limited, Witwatersrand Consolidated Gold Resources (Pty) Ltd (WitsGold) holds a mining right under DMRE reference number: FS30/5/1/2/2/10005 MR (SOFS MR) to extract gold, silver and uranium from a 170.22km² mining area. The SOFS MR was granted on 25 February 2014, executed on 14 June 2017 and is valid until 13 June 2040. An application was submitted in terms of Section 102 of the MPRDA on 30 November 2018 for Ministerial consent to amend the SOFS MR to include various properties, including the Merriespruit area, into the SOFS MR area. The relevant Section 102 application is yet to be finalised. Given the inactive status of the project, Sibanye-Stillwater submitted an application in terms of Section 25(2)(b) of the MPRDA to the DMRE in the name of WitsGold for Ministerial consent to extend the period by when mining operations at the SOFS MR should commence. This application has not yet been finally decided. Mineralisation characteristics Four primary reef horizons containing gold and uranium are present on well-defined regional unconformities in the SOFS area. These include the Beatrix/VS5, Aandenk, B, and Leader reefs, all of which have been mined extensively in the southern Free State goldfields. The four reefs are developed within a 20m to 40m stratigraphic interval on the DBM property and are present at depths of between 500m and 1,200m below surface. The Beatrix/VS5 and Aandenk reefs constitute the principal economic orebodies, while the less extensive leader and B reefs are regarded as secondary. The reefs are generally characterised by shallow dips of between 10° and 25° and a thickness of 60cm to 210cm. Key developments The SOFS project is currently inactive, with no change year-on-year in the reported Mineral Resources. Gold Mineral Resource estimate at 31 December 2023 Mineral Resources 31 Dec 2023 31 Dec 2022 GOLD Southern Africa Tonnes Grade Gold Tonnes Grade Gold SOFS (Mt) (g/t) (Moz) (Mt) (g/t) (Moz) Exploration Bloemhoek Underground Measured — — — — — — Indicated 27.4 4.7 4.2 27.4 4.7 4.2 Measured + Indicated 27.4 4.7 4.2 27.4 4.7 4.2 Inferred 0.9 4.9 0.1 0.9 4.9 0.1 De Bron Underground Measured — — — — — — Merriespruit Indicated 16.7 4.2 2.3 16.7 4.2 2.3 Measured + Indicated 16.7 4.2 2.3 16.7 4.2 2.3 Inferred 3.1 3.2 0.3 3.1 3.2 0.3 Total Measured + Indicated 44.1 4.5 6.4 44.1 4.5 6.4 Grand total 48.1 4.4 6.9 48.1 4.4 6.9 R&R - 86
EUROPE LOCATION 88 BATTERY METALS DEVELOPMENT 89 LITHIUM 89 Keliber 89 R&R - 87 4

LOCATION

BATTERY METALS DEVELOPMENT LITHIUM KELIBER ––––––––––––––––––––––––––––––––––––––––––––––––––––––––––––––––––––––––––––––––––––––––––––––––––––––––––––––––––––––––––––––––––––––– Property description The Keliber lithium project is a development stage project, located in the Central Ostrobothnian area; Kaustinen, Kokkola and Kruunupyy municipalities, western Finland. As discussed in section 1, the Group considers the Keliber lithium project as material for the purpose of SK-1300. The Keliber lithium project will consist of open-pit mining operations from four deposits (Syvajarvi, Rapasaari, Lantta and Outovesi), with a mineral processing plant (Päiväneva concentrator) at Kaustinen and a lithium hydroxide refinery at Kokkola. The Sibanye-Stillwater Board approved the project, beginning with the construction of the Keliber lithium hydroxide refinery (the Keliber refinery) during late 2022, followed by the Päiväneva concentrator during late 2023. Open-pit mining is scheduled to commence during 2025. Mineral title The Keliber lithium project has three mining permits (7.12km²) and eight exploration permit areas covering a total area of 13.55km², with a further 39.15km2 under reservation, for the element lithium. The Päiväneva concentrator and the Rapasaari open pit received their environmental permits during 2022, but are currently the subjects of appeals and are therefore not legally valid yet. In addition there are a further twenty nine exploration permits (80.17km²) under application. The expiry date for the exploration permits varies between 2024-2027. Renewal is, however, possible under standard conditions under the Finnish Mining Act. Infrastructure and equipment Apart from the Päiväneva concentrator and the Kokkola refinery, the major infrastructure will comprise of access roads, power transmission lines, main electrical substations, security, weighbridges, offices, laboratories, workshops, crushing units, access roads and internal roads. The property has a current book value of R4.95 billion (100% basis) (US$266m). R&R - 89 CONSTRUCTION OF THE KOKKOLA LITHIUM HYDROXIDE REFINERY

Mineralisation characteristics Lithium mineralisations in the region is hosted within spodumene bearing pegmatite dyke intrusions. Mineral Resources have been delineated in seven deposits, all within 25km of the village of Kaustinen. The spodumene-rich pegmatite veins vary in thickness between 1m and 30m. Pegmatites in this region have been classified into the albite-spodumene subgroup of the Li, Cs, Ta pegmatite family, and are typically coarse-grained, light-coloured and mineralogically similar. At most of the deposits, no weathering is observed. At the Rapasaari deposit, however, partial weathering or fracture oxidation occurs to a depth of 20m to 30m. At each deposit, bedrock is covered by sandy till and peat with a mean thickness of about 5m. The spodumene pegmatites have intruded into supracrustal rocks in different orientations. At the Syvajarvi deposit, the main dyke intrusion cuts the host rocks, forming a thick elliptic body plunging gently to the north-northeast. The massive body has some narrow subparallel veins on both sides and in the western area it bends downwards to a more strata- bound orientation. The thickest drilled pegmatite intercepts are 20-30m (true thickness). Mineral Resource estimation All modelling and estimation work was conducted making use of industry standard software. Lithological modelling was conducted for overburden, pegmatite and country rock, with pegmatite further subdivided into spodumene and muscovite bearing pegmatite. Any volumetric outputs less than 5,000m3 were discarded. Analytical results were composited to 2m lengths. Grades were estimated using ordinary kriging for the larger domains, and inverse distance weighting (power of 2) for the smaller composite datasets. The quality and quantity of data, geological understanding and continuity, along with grade continuity, were considered in the Mineral Resource classification. Inferred Mineral Resources were classified up to 30m beyond drilling data, Indicated Mineral Resource up to 20m beyond drilling data (supported by a 40m x 40m drilling spacing) and Measured Mineral Resources up to 15m beyond drilling data (supported by a 30 m x 30 drilling spacing). An RPEE assessment was done making use of Group long-term price assumptions and conceptual open-pit mining parameters and processing costs. As a result, the Mineral Resource is reported at a 0.5% Li2O cut-off grade. Internal controls (QA/QC) The Keliber lithium project is following well-defined logging, sampling and analytical procedures. The sampling and core storage facility in Kaustinen is secure, and the preparation and analytical methodologies appropriate for the commodity being evaluated (lithium). All samples analysed on the project were sourced from split diamond drill core. To ensure confidence in the results, Keliber have since 2013 employed a quality assurance and quality control (QA/QC) standard operating procedure. This includes the insertion of CRMs, blanks and duplicates into the sampling stream at a frequency of one in every 20 samples (5%). All sample preparation and analyses were completed by Labtium’s and Eurofins’ laboratory facilities in Kuopio and Oulu, Finland, which also submitted regular check samples to ALS Ltd. Drilling summary Planned 2024 Actual 2023 Actual 2022 Drilled (m) Expenditure (Rm) Drilled (m) Expenditure (Rm) Drilled (m) Expenditure (Rm) Ore definition 20,800 58.60 31,670 88.89 12,898 25.33 BATTERY METALS DEVELOPMENT KELIBER continued R&R - 90 SPODUMENE PEGMATITE SAMPLE, SPODUMENE CONCENTRATE (INTERIM PRODUCT) LITHIUM HYDROXIDE (FINAL PRODUCT)

Lithium Mineral Resource estimate as at 31 December 2023 Mineral Resources Exclusive of Mineral Reserves 31 Dec 2023 31 Dec 2022 Lithium Europe Tonnes Li Li₂O LCE Tonnes Li Li₂O LCE Keliber (Mt) (%) (%) (kt) (Mt) (%) (%) (kt) Development Rapasaari Opencast Surface Measured 0.2 0.61 1.31 6 0.3 0.48 1.03 7 Indicated 1.5 0.55 1.17 42 1.1 0.42 0.90 25 Measured + Indicated 1.6 0.55 1.19 48 1.4 0.43 0.92 33 Inferred 0.8 0.58 1.26 25 1.3 0.42 0.91 29 Syvajarvi Opencast Surface Measured 0.1 0.55 1.19 3 — 0.51 1.09 1 Indicated 0.3 0.60 1.29 9 0.4 0.46 1.00 11 Measured + Indicated 0.4 0.59 1.27 12 0.5 0.47 1.01 12 Inferred 0.2 0.56 1.20 5 0.1 0.37 0.79 2 Tuoreetsaaret Opencast Surface Measured — — — — — — — — Indicated 0.3 0.43 0.94 8 — — — — Measured + Indicated 0.3 0.43 0.94 8 — — — — Inferred 1.4 0.40 0.87 29 1.2 0.33 0.70 21 Lantta Opencast Surface Measured 0.1 0.56 1.21 4 0.2 0.46 0.99 5 Indicated 0.4 0.54 1.17 13 0.7 0.48 1.02 17 Measured + Indicated 0.6 0.55 1.18 16 0.9 0.47 1.02 22 Inferred 0.3 0.54 1.16 8 — — — — Emmes Underground Measured — — — — — — — — Indicated 0.7 0.62 1.33 22 0.9 0.57 1.22 28 Measured + Indicated 0.7 0.62 1.33 22 0.9 0.57 1.22 28 Inferred 0.3 0.61 1.31 9 — — — — Outovesi Opencast Surface Measured — — — — — — — — Indicated 0.1 0.64 1.38 4 — 0.68 1.46 1 Measured + Indicated 0.1 0.64 1.38 4 — 0.68 1.46 1 Inferred 0.1 0.67 1.44 3 — — — — Leviakangas Opencast Surface Measured — — — — — — — — Indicated 0.2 0.55 1.19 6 0.2 0.53 1.14 5 Measured + Indicated 0.2 0.55 1.19 6 0.2 0.53 1.14 5 Inferred 0.5 0.47 1.00 14 0.2 0.42 0.90 5 Total Measured + Indicated 3.9 0.56 1.20 115 3.9 0.48 1.04 100 Grand total 7.4 0.53 1.14 209 6.7 0.44 0.94 157 Notes: • Cut-off grade 0.4 to 0.5% Li2O. Commodity price assumptions $8,000/t LiOH.H2O and global lithium processing yield of 74.3%-74.5%. • Li has been derived from the original Li2O based estimate by multiplying by a factor of 0.464. • For the lithium Mineral Resources, LCE content was calculated by multiplying the Li (%) content by a factor of 5.323. Lithium hydroxide monohydrate (LiOH.H2O)) can be derived from LCE by dividing by a factor of 0.88 On a Mineral Resources exclusive of Mineral Reserves basis, the year-on-year change is +33.2%, primarily driven by an enhancement in estimation methodology, as well as the incorporation of new and additional exploration data. BATTERY METALS DEVELOPMENT KELIBER continued R&R - 91
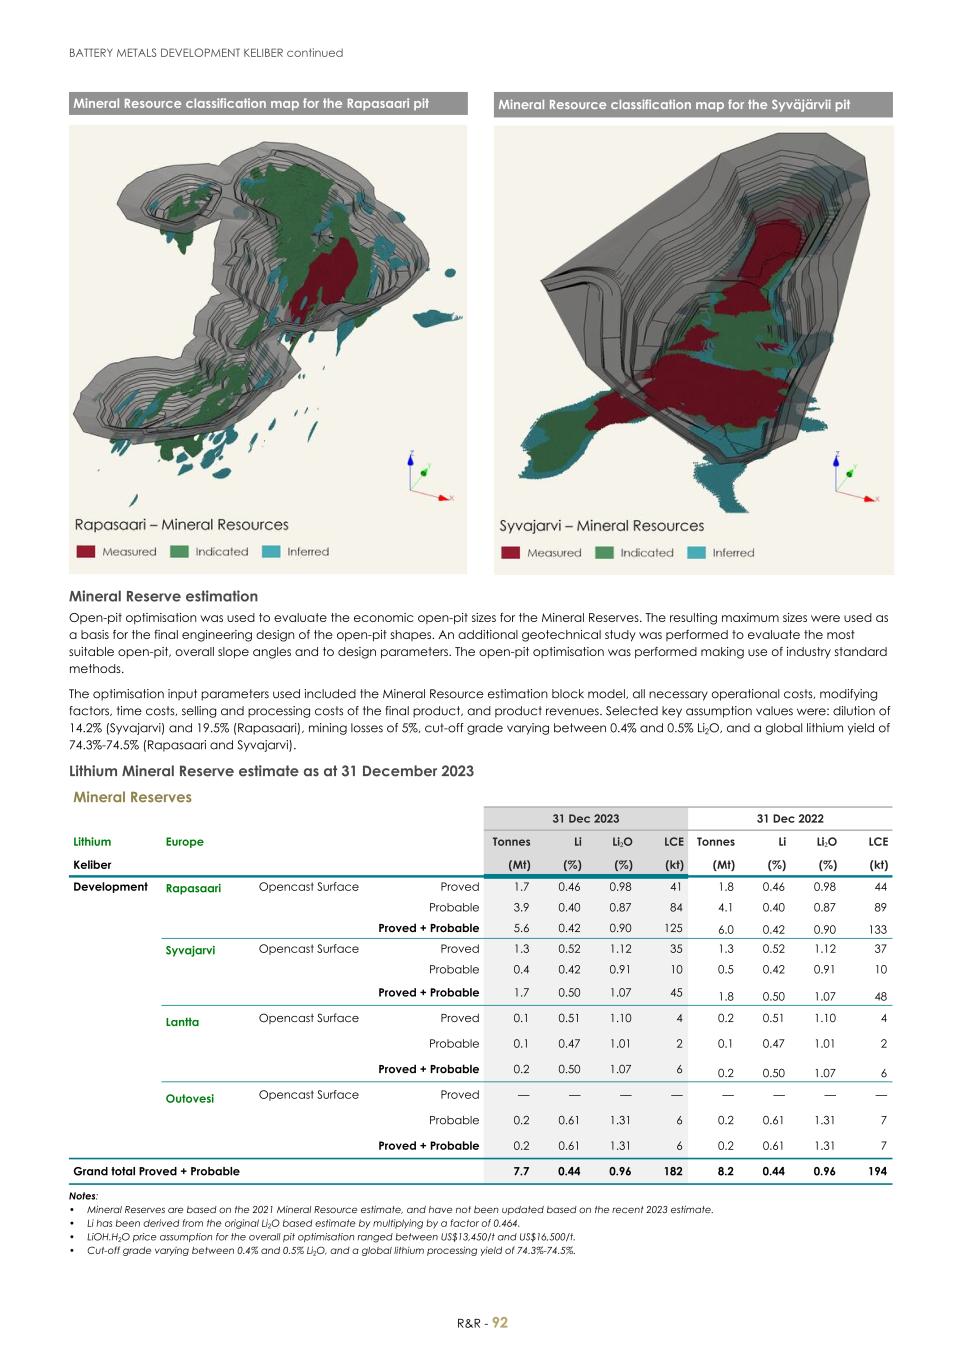
Mineral Resource classification map for the Rapasaari pit Mineral Resource classification map for the Syväjärvii pit Mineral Reserve estimation Open-pit optimisation was used to evaluate the economic open-pit sizes for the Mineral Reserves. The resulting maximum sizes were used as a basis for the final engineering design of the open-pit shapes. An additional geotechnical study was performed to evaluate the most suitable open-pit, overall slope angles and to design parameters. The open-pit optimisation was performed making use of industry standard methods. The optimisation input parameters used included the Mineral Resource estimation block model, all necessary operational costs, modifying factors, time costs, selling and processing costs of the final product, and product revenues. Selected key assumption values were: dilution of 14.2% (Syvajarvi) and 19.5% (Rapasaari), mining losses of 5%, cut-off grade varying between 0.4% and 0.5% Li2O, and a global lithium yield of 74.3%-74.5% (Rapasaari and Syvajarvi). Lithium Mineral Reserve estimate as at 31 December 2023 Mineral Reserves 31 Dec 2023 31 Dec 2022 Lithium Europe Tonnes Li Li₂O LCE Tonnes Li Li₂O LCE Keliber (Mt) (%) (%) (kt) (Mt) (%) (%) (kt) Development Rapasaari Opencast Surface Proved 1.7 0.46 0.98 41 1.8 0.46 0.98 44 Probable 3.9 0.40 0.87 84 4.1 0.40 0.87 89 Proved + Probable 5.6 0.42 0.90 125 6.0 0.42 0.90 133 Syvajarvi Opencast Surface Proved 1.3 0.52 1.12 35 1.3 0.52 1.12 37 Probable 0.4 0.42 0.91 10 0.5 0.42 0.91 10 Proved + Probable 1.7 0.50 1.07 45 1.8 0.50 1.07 48 Lantta Opencast Surface Proved 0.1 0.51 1.10 4 0.2 0.51 1.10 4 Probable 0.1 0.47 1.01 2 0.1 0.47 1.01 2 Proved + Probable 0.2 0.50 1.07 6 0.2 0.50 1.07 6 Outovesi Opencast Surface Proved — — — — — — — — Probable 0.2 0.61 1.31 6 0.2 0.61 1.31 7 Proved + Probable 0.2 0.61 1.31 6 0.2 0.61 1.31 7 Grand total Proved + Probable 7.7 0.44 0.96 182 8.2 0.44 0.96 194 Notes: • Mineral Reserves are based on the 2021 Mineral Resource estimate, and have not been updated based on the recent 2023 estimate. • Li has been derived from the original Li2O based estimate by multiplying by a factor of 0.464. • LiOH.H2O price assumption for the overall pit optimisation ranged between US$13,450/t and US$16,500/t. • Cut-off grade varying between 0.4% and 0.5% Li2O, and a global lithium processing yield of 74.3%-74.5%. BATTERY METALS DEVELOPMENT KELIBER continued R&R - 92

Estimation risks There are no deemed material risks to the Mineral Resource Estimation. The key operational risks that could impact the Mineral Reserves are listed below. Commodity prices and exchange rate assumptions: Sibanye- Stillwater has adopted forward-looking price assumptions. Any material deviations from these assumptions could impact the Mineral Reserves. The assumed prices are marginally below current spot prices, implying a degree of short-term risk should these prices persist and the longer term forecast not realise. Permitting: Although several of the required operating permits have been obtained, potential timing delays due to public objection and appeals could impact construction timelines. Environmental permit conditions could also be strenuous, impacting or delaying planned mining operations. Processing: The effectiveness of ore sorting, to screen out 73% of waste, could impact plant feed grades once applied to full-scale mining volumes. Human capital: A significant amount of skilled personnel will be required to develop and work at the operations. Labour availability could impact planned production and build-ups. Tailings deposition and capacity: The new TSF and ancillary dams have been designed according to the Finnish Dam Safety Guide (2018) and the Swedish Guide for Mine Dams (2010), and will be constructed in stages. Any delays in the building or permitting of the dams could impact production build-up and profitably, potentially impacting the Mineral Reserves. History • The mineral rights to the Lantta, Emmes and Syvajarvi deposits were first owned by Suomen Mineraali Oy and then by Paraisten Kalkkivuori Oy (Later Partek Oy). These rights expired in 1992 and the areas were unclaimed until 1999. • In 1999, Olle Siren, together with private partners, claimed the Lantta deposit and later the Emmes deposit • From 2003 to 2012, the Geological Survey of Finland (GTK) held the mineral rights of the Syvajarvi and Rapasaari deposits • From 2012 to 2018, the Finnish State’s shareholding at Keliber was managed by the Finnish Industry Investment Ltd. • The Finnish Minerals Group (FMG), which manages the Finnish State’s mining industry shareholdings, became the significant shareholder in 2018. • In 2021 Sibanye-Stillwater acquired an initial 26.4% interest in Keliber Oy • During 2022, Sibanye-Stillwater increased its stake to 84.96%, becoming the majority owner of Keliber Oy and the Keliber lithium project. This was subsequently reduced during to 79.82% during 2023, with the Finish Mineral Group increasing their share to 20%. • Keliber is in development and does not have any associated historical operating statistics, but some waste material was been mined during 2022 and 2023 for construction purposes. Key developments The planned operation, which first targets the Syväjärvi and Rapasaari deposits, aims to produce battery-grade lithium hydroxide monohydrate (LiOH.H2O). Over the open-pit LoM a total of 12.5Mt of ore is expected to be mined at a stripping ratio of 5.8:1, and at an average mill feed grade of 0.91% Li2O. Steady state production of ~700ktpa of ore will result in the production of ~15,000tpa of battery-grade lithium hydroxide. First ore production is scheduled for the fourth quarter of 2025, with the Päiväneva concentrator commissioning and ramp up starting during the first quarter of 2026. Over the LoM, the maximum processing feed is 83.7 ktpm. It is planned to eventually supplement open-pit mining production with underground mining. The underground studies are currently at scoping study level and have not been included in the Mineral Reserves at this stage. The construction of the Keliber lithium hydroxide refinery commenced during March 2023, and is making good progress, while construction for the Päiväneva concentrator started late in 2023. The mining permit for the Rapasaari mine became legally valid in December 2023 as the Vaasa Administrative Court rejected the appeal lodged against the permit. On 23 February 2024, the Vaasa Administrative Court (Court) issued a ruling on three appeals, including Sibanye-Stillwater’s appeal of certain emission-related permit conditions in connection with the environmental permit for the Rapasaari mine and the Päiväneva concentrator issued in December 2022 (Environmental Permit). The Court upheld and partially amended the Environmental Permit as requested by Sibanye-Stillwater, while referring certain permit conditions back to the Permitting Authority (Regional State Administrative Agency for Western and Inland Finland) for further review. These conditions pertain to the placement of Rapasaari mine’s waste rock and certain waste fractions from the concentrator, the aftercare plan for the extractive waste areas and the associated financial guarantees. As the Environmental Permit was otherwise affirmed, the permit remains in effect despite the Court’s ruling, allowing the construction work at the Päiväneva concentrator to continue in all material respects in accordance with existing plans. Sibanye- Stillwater expects concentrator operations to commence as planned, subject to Permitting Authority review and issuance of enforceable permit decisions. The full impact of the Court’s ruling on the Rapasaari mine related permit conditions has not yet been determined. Based on preliminary analyses, Sibanye-Stillwater expects the process to obtain the required permit decision from the Permitting Authority will delay commencement of the Rapasaari mine operations. Sibanye- Stillwater is in the process of assessing the overall impact, if any, to timing of the Sibanye-Stillwater’s Keliber lithium project. A key focus remains on achieving full permitting. On the technical front, detailed front-end engineering design work was completed, with optimisation work conducted on the open pit design, surface lay-out, logistics management and grade control design, in anticipation of the commencement of mining at Syväjärvi during early 2025. Operational readiness work will continue during 2024. Successful exploration drilling on the highly prospective tenement package was ongoing. During 2023, the Mineral Resource estimates for all the deposits were fully updated with all new drilling information; the estimates also incorporated revised methodology to better distinguish between ore and waste rock lithologies/ inclusions. This resulted in a significant increase in both tonnage and grade of the reported Mineral Resource. A key focus for 2024 will be to update the Mineral Reserves based on the new Resource model. Sibanye-Stillwater has filed an updated Technical Report Summary in support of materially increased Mineral Resources assessed in 2023. Sibanye-Stillwater is currently undertaking an assessment of its reported Mineral Reserves at Keliber, and will file a further updated Technical Report Summary as required to support the disclosure of updated Mineral Reserves. The Mineral Reserve estimates contained herein are based on the Technical Report Summary of the Keliber lithium project for the year ended 31 December 2022 (as filed with the SEC on 14 December 2023). BATTERY METALS DEVELOPMENT KELIBER continued R&R - 93

AUSTRALIA LOCATION 95 ZINC OPERATION 96 Century 96 COPPER EXPLORATION 99 Mt Lyell 99 R&R - 94 5

LOCATION

ZINC OPERATION CENTURY –––––––––––––––––––––––––––––––––––––––––––––––––––––––––––––––––– Property description The Century zinc operation is a mine tailings mining and re- processing operation located at Lawn Hill, 250km north-west of Mount Isa in the Lower Gulf of Carpentaria, Queensland, Australia. The original Century zinc mining operation began open-pit production in 1999 and was one of the largest zinc mines in the world. Following the depletion of the original Mineral Reserves, the mine was put on care and maintenance in 2016. New Century Resources Ltd. acquired the operation in 2017 from MMG Ltd, focusing on processing the historic mine tailings. Integrated with the mine is a 304km, wholly owned and fully permitted, underground pipeline to Century’s port facility at Karumba, from where the transfer vessel, the M.V. Wunma, transfers concentrate to export ships anchored in the Gulf of Carpentaria. In October 2021, Sibanye-Stillwater acquired a 19.99% shareholding in New Century Resources Ltd., aiming to expand it’s exposure to the circular economy and green battery metal production. This was increased to100% during 2023, whereafter the company was delisted from the Australian stock exchange.. Mineral title The Century TSF lies within the mining lease ML90045, which is owned by Century Mining (Pty) Ltd., a wholly owned subsidiary of New Century Resources Ltd. There are also one further mining lease and one exploration permit granted: • ML90045, Century Mine, granted 19/09/1997, expiring on 18/09/2037, for 146.88 km² • ML90058, Century Mine, granted 19/09/1997, expiring on 18/09/2037, for 84.96 km² • EPM10544, Lawn Hill, granted 23/06/1995, expiring on 31/12/2025, for 368 km² Infrastructure and equipment TSF -reclamation takes place via hydraulic mining, and the company has a fleet of six remotely operated hydro-mining rigs. The current LoM is 3.5 years, up to 2027, when the tailings Mineral Resource will be depleted. Key processing infrastructure (12Mtpa capacity) includes: primary crushing facilities, and grinding facilities consisting of one SAG mill and two balls mills; fifteen ultrafine sand mills; a conventional froth flotation circuit; full site laboratory capable of handling all exploration and plant samples; equipment workshops and stores for all mobile and fixed plant maintenance. The existing, historical Century mine open-pit workings has been licensed as a TSF to deposit the reprocessed tailings. Sufficient capacity exists for the LoM. The concentrate is transferred in slurry form via a 304km, wholly owned and fully permitted, underground pipeline to Century’s port facility at Karumba. Century’s transfer vessel, the M.V. Wunma, is custom-built for the shallow waters of the Norman River channel, and is used to transfer concentrate to export ships anchored in the Gulf of Carpentaria. Mineralisation characteristics The tailings deposit at the Century mine was generated from 16 years of large-scale operations at the Century open-pit zinc mine. The remaining in-situ portion of the Century deposit consists of sediment hosted stratiform Zn-Pb-Ag mineralisation hosted within a sequence of shale, siltstone and sandstone marine sediments. The deposit is dislocated by faulting; and is unconformably overlain by up to 100m of Cambrian limestones in the north. The remaining South Block mineralization is an elongated tabular body that is approximately 1km in length, between 80m and 150m wide, approximately 30m thick, and ranges from 20m to 218m deep. The East Fault Block is a small remnant located 35m below the surface of the run-of-mine stockpile area at the mine site and extends to a depth of 112m. Discovered in 1897, the adjacent Silver King deposit consists of a series of moderate to steep dipping quartz-galena-sphalerite- siderite veins associated with a north-east trending dextral strike-slip fault. R&R - 96

Zinc Mineral Resource estimate at 31 December 2022 Mineral Resources Exclusive of Mineral Reserves 31 Dec 2023 31 Dec 2022 Australia Tonnes Zinc Zinc Lead Lead Tonnes Zinc Zinc Lead Lead Century (Mt) (%) (Mlb) (%) (Mlb) (Mt) (%) (Mlb) (%) (Mlb) Exploration Silver King Open Pit Measured 1.00 4.8 106 5.40 119 0.2 4.8 21 5.4 24 Indicated — — — — — — — — — — Measured + Indicated 1.00 4.8 106 5.40 119 0.2 4.8 21 5.4 24 Inferred — — — — — — — — — — Underground Measured — — — — — — — — — — Indicated 2.1 5.0 234 5.3 245 0.4 5.0 46 5.3 49 Measured + Indicated 2.1 5.0 234 5.3 245 0.4 5.0 46 5.3 49 Inferred 0.6 2.7 35 6.2 82 0.1 2.7 7 6.2 16 East Fault Block Open Pit Measured — — — — — — — — — — Indicated 0.6 10.5 139 1.2 15 0.1 10.5 28 1.2 3 Measured + Indicated 0.6 10.5 139 1.2 15 0.1 10.5 28 1.2 3 Inferred — — — — — — — — — — South Block Underground Measured — — — — — — — — — — Indicated 6.2 5.4 739 1.5 205 1.2 5.4 147 1.5 41 Measured + Indicated 6.2 5.4 739 1.5 205 1.2 5.4 147 1.5 41 Inferred — — — — — — — — — — Watson's Lode Underground Measured — — — — — — — — — — Indicated — — — — — — — — — — Measured + Indicated — — — — — — — — — — Inferred — — — — — 0.3 7.9 59 2.1 15 Total Measured + Indicated 9.9 5.6 1,217 2.7 584 2.0 5.6 242 2.7 116 Grand total 10.5 5.4 1,252 2.8 666 2.4 5.8 308 2.8 148 Notes: • The year-on-year change was entirely driven by mining depletion • No cut-off grades have been applied to the TSF Mineral Resources, as it will all be depleted as part of the site reclamation and rehabilitation • TSF Mineral Resource constrained within a boundary string defining the dam walls and excluding outflow areas • Silver King Mineral Resource has been reported above a cut-off grade of Pb+Zn >4% • East Fault Block and South Block Mineral Resources have been reported at a nominal 3.0% zinc equivalence (ZnEq) cut-off grade ZINC OPERATION CENTURY continued R&R - 97 CENTURY METALLURGICAL PLANT

Zinc Mineral Reserve estimate at 31 December 2023 Mineral Reserves 31 Dec 2023 31 Dec 2022 Australia Tonnes Zinc Zinc Tonnes Zinc Zinc Century (Mt) (%) (Mlb) (Mt) (%) (Mlb) Operations Century Tailings TSF Surface Proved 26.1 3.0 1,726.2 6.8 3.0 445.5 Probable — — — — — — Grand total Proved + Probable 26.1 3.0 1,726.2 6.8 3.0 445.5 Notes: • Assumed metallurgical recoveries of Zn 49.7% and Ag 33.6% • For commodity price assumptions refer to page 17 Section 1. Key developments and brownfield projects The economic feasibility of the remaining in-situ Silver King and remnant East Fault Block and South Block deposits continue to be assessed for their potential as stand-alone life extension projects post the depletion of the TSF, or as co-production with the TSF reprocessing. ZINC OPERATION CENTURY continued R&R - 98

COPPER EXPLORATION MT LYELL ––––––––––––––––––––––––––––––––––––––––––––––––––––––––––––––––––––––––––––––––––––––––––––––––––––––––––––––––––––––––––––––––––––––– Property description With the acquisition of New Century Resources Ltd during 2023, the Group acquired the option to the historic (care and maintenance) Mt Lyell copper project in Tasmania, Australia. The property is located near the west coast of Tasmania, near the township of Queenstown, 170 km north-west of Hobart. The option was exercised during November 2023, and the property is currently the subject of a feasibility study into the re-opening of the mine. The Mt Lyell copper mine, where first mining took place in 1883, was closed and placed on care and maintenance during 2014, after over 100 years of production from both open-pit and underground mining areas. The current underground workings have most recently been mined using a sub-level caving (SLC) mining method. Open- pit and sub-level open stoping mining methods were historically employed prior to 1999. Mineral title There are four main leases related to mining activities at the Mt Lyell copper project, and four leases for supporting infrastructure. The leases predominantly cover unallocated crown land. The leases adjoin parts of the township, the Mt Dundas Regional Reserve and the public reserve allocated for the town’s aerodrome. The main leases are as follows: – 9M/2013 (2,237 ha) – Main mining lease covering Prince Lyell, Western Tharsis, Copper Chert and the Princess Creek TSF – 10M/2013 (55 ha) – West Queen Dams – 25M/1995 (56 ha) – Lynchford limestone quarry – EL13/2016 (2,300ha) – exploration lease to the north of the main mining lease R&R - 99

Mineralisation characteristics The regional geology consists of cambrian volcano sedimentary rocks of the Mount Read volcanics, which are locally intensely hydrothermally altered, and mineralised. Known mineralisation is dominantly syngenetic to epigenetic disseminated chalcopyrite and bornite, with varying amounts of pyrite and localised high grade vein mineralisation. Copper grades typically average 1% to 1.5% copper, with significant gold and silver credits. Five significant (figure 3) and many smaller orebodies have been exploited during more than a century of mining, producing in excess of 1.7 million tonnes of copper metal, 1,000 tonnes of silver and 60 tonnes of gold. The mineralised mine sequence is overlain by palaeozoic sedimentary sequences and locally cut by tertiary intrusives. Key developments The project study, which is currently at AACE Engineering class 3 level, targets mining extraction from three underground deposits (Prince Lyell, Western Tharsis and Copper Chert), via sub-level caving and open stoping mining methods. It anticipates the construction of a new concentrator plant, as well as the refurbishing of the historic vertical shaft. The study has confirmed the RPEEE of the three deposits at our current Mineral Resource price deck. Mineral Resource classification cross section at Mt Lyell Mineral Resources 31 Dec 2023 COPPER Australia Tonnes Grade Copper Grade Gold Mt Lyell (Mt) (%) (Mlb) (g/t) (Moz) Exploration Prince Lyell Underground Measured 3.7 0.89 73 0.2 — Indicated 41.8 0.83 765 0.2 0.3 Measured + Indicated 45.5 0.83 837 0.2 0.3 Inferred 10.8 0.70 167 0.2 0.1 Western Tharsis Underground Measured — — — — — Indicated 6.4 1.07 151 0.3 0.1 Measured + Indicated 6.4 1.07 151 0.3 0.1 Inferred 12.6 1.11 308 — — Copper Chert Underground Measured — — — — — Indicated 3.2 1.70 120 0.8 0.1 Measured + Indicated 3.2 1.70 120 0.8 0.1 Inferred 0.9 1.31 26 0.9 — Total Measured + Indicated 55.1 0.91 1,108 0.2 0.4 Grand total 79.4 0.92 1,609 0.2 0.5 Notes: • The Mineral Resource Estimates are based on work conducted by SRK Consulting during 2020 (Western Tharsis and Copper Chert) and 2023 (Prince Lyell), and was initially reported under the JORC code. • Western Tharsis and copper Chert reported at a 0.6% Cu cut-off grade, based on a copper price of US$6,800/lb, and a gold price of US$1,900/lb • Prince Lyell reported at a 0.5% Cu cut-off grade, based on a conceptual mine design and a copper price of US$9,301/lb • The AACE class 3 feasibility study conducted by the Group during 2023 has confirmed the economical potential of the three deposits, at our assumed Group Mineral Resource price deck, validating the historic estimates and their RPEEE. COPPER EXPLORATION MT LYELL continued R&R - 100 PRINCE LYELL SHAFT

ANCILLARY INFORMATION Professional Organisations 102 SAMREC Code definitions 103 Glossary of terms 104 Abbreviations 105 Disclaimer 107 Administration and company information 108 RSA Generic Mining Permit Conditions 109 R&R - 101 6

PROFESSIONAL ORGANISATIONS GEOLOGICAL SOCIETY OF SOUTH AFRICA (GSSA) Building 10, Thornhill Office Park, 94 Bekker Street, Vorna Valley, Midrand, 1686 Johannesburg, South Africa Tel: +27 10 143 2096 Email: info@gssa.org.za Website: www.gssa.org.za SOCIETY FOR MINING METALLURGY AND EXPLORATION (SME) 12999 E. Adam Aircraft Circle Englewood, CO 80112 United States Tel: +1 303 948 4200 / +1 720 738 4085 Email: cs@smenet.org Website: www.smenet.org THE ASSOCIATION OF PROFESSIONAL ENGINEERS AND GEOSCIENTISTS OF ALBERTA (APEGA) 1500 Tower One 10060 Jasper Avenue NW Edmonton, Alberta T5J 4A2 Canada Tel: 780 426 3990 Website: www.apega.ca SOUTH AFRICAN COUNCIL FOR NATURAL SCIENTIFIC PROFESSIONS (SACNASP) Innovation Hub, Enterprise Building Suite L4, Mark Shuttleworth Street, Pretoria, South Africa Tel: +27 12 748 6500 Email: sacnasp@sacnasp.org.za Website: www.sacnasp.org.za ENGINEERING COUNCIL OF SOUTH AFRICA (ECSA) 1st Floor, Waterview Corner Building, 2 Ernest Oppenheimer Avenue Bruma Lake Office Park, Bruma, Johannesburg, 2198, South Africa Tel: +27 86 122 5555 Fax: +27 11 607 9556 Email: engineer@ecsa.co.za Website: www.ecsa.co.za PROFESSIONAL GEOSCIENTIST ONTARIO (PGO) One Yonge St Suite 704, Toronto, ON M5E 1E5, Canada Tel: +1-416-203-2746 Email: info@pgo.ca Website: www.pgo.ca AMERICAN INSTITUTE OF PROFESSIONAL GEOLOGISTS (AIPG) 1333 W. 120th Avenue, Suite 211 Westminster, Colorado 80234-2710 United States Tel: +1 404 303 412 6205 Email: aipg@aipg.org Website: www.aipg.org SOUTHERN AFRICAN INSTITUTE OF MINING AND METALLURGY (SAIMM) The Minerals Council South Africa 7th Floor, Rosebank Towers , 19 Biermann Avenue, Rosebank, 2196 Johannesburg, South Africa Tel: +27 11 538 0231 Email: naomi@saimm.co.za Website: www.saimm.co.za PERUVIAN ENGINEERS ASSOCIATION (CIP) Av. Arequipa Nº 4947, Miraflores, Lima, Peru Tel: +51 1 445 6540 Email: mesadepartes.cn@cip.org.pe Website: www.cip.org.pe SOUTH AFRICAN GEOMATICS COUNCIL (SAGC) Unit 3, Building 2 Bruma Boulevard Office Park 20 Zulberg Close Bruma, Johannesburg South Africa Tel: +27 11 626 1040 Email: admin@sagc.org.za Website: www.sagc.org.za AUSTRALASIAN INSTITUTE OF MINING AND METALLURGY (AusIMM) Ground Floor, 204 Lygon St, Carlton VIC 3053 Melbourne, Australia Tel: +61 3 9658 6100 Website: www.ausimm.com R&R - 102

SAMREC CODE DEFINITIONS Competency The public report is based on work that is the responsibility of suitably qualified and experienced persons who are subject to an enforceable professional code of ethics. Competent Person A Competent Person is a person who is registered with SACNASP, the Engineering Council of South Africa, or is a member or fellow of the Southern African Institute of Mining and Metallurgy (SAIMM), the Geological Society of South Africa (GSSA) or a Recognised Professional Organisation (RPO). The Competent Person must comply with the provisions of the relevant promulgated acts, have a minimum of five years experience relevant to the style of mineralisation and type of deposit or class of deposit under consideration and to the activity he or she is undertaking. Persons being called upon to sign as a Competent Person must be clearly satisfied in their own minds that they are able to face their peers and demonstrate competence in the commodity, type of deposit and the situation under consideration. Deposit A concentration (or occurrence) of material of possible economic interest, in or on the earth crust, that may include mineralised material that cannot be estimated with sufficient confidence to be classified in the Inferred category. Portions of a deposit that do not have reasonable and realistic prospects for eventual economic extraction are not included in a Mineral Resource. Materiality A public report contains all the relevant information that investors and their professional advisors would reasonably require, and expect to find, for the purpose of making a reasoned and balanced judgement regarding the exploration results, Mineral Resources and Mineral Reserves reported on. Mineral Resource A concentration or occurrence of material of economic interest in or on the earth’s crust in such form, quality and quantity that there are reasonable and realistic prospects for eventual economic extraction. The location, quantity, grade, continuity and other geological characteristics of a Mineral Resource are known, or estimated from specific geological evidence, sampling and knowledge interpreted from an appropriately constrained and portrayed geological model. Mineral Resources are subdivided, and must be so reported, in order of increasing confidence in respect of geoscientific evidence, into Inferred, Indicated and Measured categories. Measured Mineral Resource That part of a Mineral Resource for which tonnage, densities, shape, physical characteristics, grade and mineral content can be estimated with a high level of confidence. It is based on detailed and reliable information from exploration, sampling and testing of material from locations such as outcrops, trenches, pits, workings and drillholes. The locations are spaced closely enough to confirm geological and grade continuity. Indicated Mineral Resource That part of a Mineral Resource for which tonnage, densities, shape, physical characteristics, grade and mineral content can be estimated with a reasonable level of confidence. It is based on information from exploration, sampling and testing of material gathered from locations such as outcrops, trenches, pits, workings and drillholes. The locations are too widely or inappropriately spaced to confirm geological and/or grade continuity but are spaced closely enough for continuity to be assumed. Inferred Mineral Resource That part of a Mineral Resource for which tonnage, grade and mineral content can be estimated with a low level of confidence. It is inferred from geological evidence and sampling, and assumed but not verified geologically or through analysis of grade continuity. It is based on information gathered through appropriate techniques from locations such as outcrops, trenches, pits, workings and drillholes that may be limited or of uncertain quality and reliability. Mineral Reserve The economically mineable material derived from a Measured and/or Indicated Mineral Resource. It is inclusive of diluting and contaminating materials and allows for losses that are expected to occur when the material is mined. Appropriate assessments to a minimum of a PFS for a project and a LoM plan for an operation must have been completed, including consideration of, and modification by, realistically assumed mining, metallurgical, economic, marketing, legal, environmental, social and governmental factors (the modifying factors). Such modifying factors must be disclosed. Proved Mineral Reserve Economically mineable material derived from a Measured Mineral Resource. It is estimated with a high level of confidence. It includes diluting and contaminating materials and allows for losses that are expected to occur when the material is mined. Appropriate assessments to a minimum of a PFS for a project or a LoM plan for an operation must have been carried out, including consideration of, and modification by, realistic assumed mining, metallurgical, economic, marketing, legal, environmental, social and governmental factors. Such modifying factors must be disclosed. Probable Mineral Reserve Economically mineable material derived from a Measured or Indicated Mineral Resource or both. It is estimated with a lower level of confidence than a Proved Mineral Reserve. It includes diluting and contaminating materials and allows for losses that are expected to occur when the material is mined. Appropriate assessments to a minimum of a PFS for a project or a LoM plan for an operation must have been carried out, including consideration of, and modification by, realistic assumed mining, metallurgical, economic, marketing, legal, environmental, social and governmental factors. Such modifying factors must be disclosed. Transparency The reader of a public report must be provided with sufficient information, the presentation of which is clear and unambiguous, to understand the report and not to be misled. TERM DEFINITION R&R - 103

GLOSSARY OF TERMS TERM DEFINITION Above infrastructure (AI) That part of the Mineral Resources and/or Mineral Reserves, which are above the lowest mining level and can be accessed via the current mine infrastructure (shafts and underground haulages). Below infrastructure (BI) That part of the Mineral Resources and/or Mineral Reserves which are below the lowest mining level and that can only be accessed following approved capital expenditure. Brownfield A mineral deposit, not yet exploited but conceptualised as an extractable orebody. Bushveld Igneous Complex World’s largest known layered mafic-ultramafic intrusive complex, covering an area of approximately 67,000km², containing more than 80% of all known PGM resource. Carbon-in-leach (CIL) Gold is leached from a gold ore slurry with cyanide in agitation tanks and absorbed onto carbon granules in the same circuit. The carbon granules are separated from the slurry and treated in an elution circuit to extract the gold. Carbon-in-pulp (CIP) Gold is leached conventionally from a gold ore slurry with cyanide in agitation tanks. The leached slurry then passes into the CIP circuit where carbon granules are mixed with the slurry and gold is absorbed onto the carbon. The carbon granules are separated from the slurry and treated in an elution circuit to extract the gold. Concept study A study of the viability of options to determine the potential value of the opportunity and confirm alignment with the business strategy. The study details the required work to fully define the opportunity, and outlines the economic potential of that being studied. Cut-off grade The grade of ore that would result in direct mining costs to be covered. Depletion The decrease in the quantity of ore in a deposit or property (mining right) resulting from extraction or production. Dilution Waste or material below the cut-off grade that contaminates the ore during the course of mining operations and thereby reduces the average grade mined. Feasibility study (FS) A comprehensive design and costing study of a project. Appropriate assessments have been made of realistically assumed geological, mining, metallurgical, economic, marketing, legal, environmental, social, governmental, engineering, operational and all other modifying factors, which are considered in sufficient detail to demonstrate at the time of reporting that extraction is reasonably justified (economically mineable) and the factors reasonably serve as the basis for a final decision by a proponent or financial institution to proceed with, or finance, the development of the project. The overall confidence of the study should be stated. Life of mine (LoM) Number of years that an operation is currently planning to mine and treat ore and is derived from the current mining plan. Mine call factor (MCF) The ratio expressed as a percentage in which the specific product accounted for in “recovery plus residue” bears the corresponding product “called for” by the mine’s measuring and evaluation methods. Pay limit The average mining grade for a mine that would result in all direct and indirect costs being covered. Pillars Pillars comprise of: • Dip and strike stability pillars • Water and ventilation pillars • Regional stability pillars as defined by rock engineering • Bracket pillars adjacent to seismically active areas or large structures • Boundary and remnant pillars • Abandoned pillars Inter alia, some pillars may become available to mine once appropriate investigations and rehabilitation have taken place. Plant recovery factor The ratio expressed as a percentage of the mass of the specific mineral product actually recovered from ore treated at the plant to its total specific mineral content before treatment. Post depletion 2020 Mineral Resources and Mineral Reserves, as at December 2020, minus 2019 mined-out areas. Prefeasibility study (PFS) A comprehensive study of the viability of options for a mineral project that has advanced to a stage at which the preferred mining method in the case of underground mining or the pit configuration in the case of an open pit has been established. Additionally, an effective method of mineral processing has been determined. It includes a financial analysis based on realistic assumptions of technical, engineering, operating, economic factors and the evaluation of other relevant factors that are sufficient for a Competent Person, acting reasonably, to determine if all or part of the Mineral Resource may be classified as a Mineral Reserve. The overall confidence of the study should be stated. A PFS is at a lower confidence level than a FS. Prill Split The ratio of co-occurring precious metals present in ore expressed as a percentage. Reef A geological horizon or stratigraphic horizon that may contain economic levels of mineralisation. Stope Underground excavation where the orebody is extracted. Survey shortfall Difference between the tonnage hoisted as ore and that accounted for by the plant measuring methods. Discrepancy is referred to as a shortfall when the calculated tonnage is less than the tonnage accounted for by the plant, or an excess when the opposite occurs. Unconformity An erosional marker surface indicating a lapse in time between two differing aged stratigraphic units. White areas Areas that were excluded from previous LoM plans that have since been proven to have realistic expectation of safe economic extraction, with the required investigations, rock engineering modelling and detail mining plan to support it. White areas include open ground, areas that were excluded due to economics or lack of information and pillars. R&R - 104

ABBREVIATIONS TERM DEFINITION 2D Two dimensional 2E PGM Platinum, palladium 3D Three dimensional 4E PGM Platinum, palladium, rhodium, gold 6E PGM Platinum, palladium, rhodium, gold, ruthenium, iridium AAP Anglo American Platinum AAR Aandenk Reef Ag Silver AI Above infrastructure AIPG American Institute of Professional Geologists AISC All-in sustaining costs Amsl Above mean sea level Aquarius Aquarius Platinum Ltd Au Gold BI Below infrastructure BIC Bushveld Igneous Complex BR Beatrix Reef BTTP Bulk Tailing Treatment Project C$ Canadian dollar C&F Cut and fill C2022 BP 2022 Business Plan CCTV Closed Circuit Television CDP Community Development Programme CEO Chief Executive Officer CIL Carbon-in-leach CIM Canadian Institute of Mining, Metallurgy and Petroleum CIM NI 43-101 Canadian Institute of Mining – National Instrument 43-101 CIP Carbon-in-pulp cm Centimetre cm.g/t Centimetre gramme per tonne COVID-19 Coronavirus Disease CP/QP Competent Person/Qualified Person CPG Certified Professional Geologists for the AIPG CPG Certified Professional Geologist CPR Competent Persons Report Cr2O3 Chromium oxide CRIRSCO Committee for Mineral Reserves International Reporting Standards CRM Certified reference materials CRP Chrome retreatment plant Cs Caesium Cu Copper CW Channel width DBM De Bron Merriespruit DFS Definitive feasibility study DMRE Department of Mineral Resources and Energy DRDGOLD DRDGOLD Limited DWS Department of Water and Sanitation EDGAR Electronic data gathering, analysis, and retrieval system EIA Environmental Impact Assessment EIS Environmental impact statement EL Exploration License EMC Ezulwini Mining Company TERM DEFINITION EPL Eastern Platinum Limited EqCu Copper Equivalent ESG Environmental Social and Governance ETTP Eastern Tailings Treatment Plant ETD1 Eastern Tailings Dam One FS Feasibility study FWGR Far West Gold Recoveries g Gramme g/t Grammes per tonne Ga (Giga-annum) billion years GBG Great Basin Gold GDE Graduate Diploma Engineering GHG Green House Gas GISTM Global Industry Standard on Tailings Management GSSA Geological Society of South Africa GTC Grade tonnage curve Guide 7 SEC Industry Guide 7 ha Hectare ICMM International Council on Mining and Metals ICP Induction Coupled Plasma Mass Spectrometry IOCG Iron-oxide copper-gold Ir Iridium IRUP Iron-rich ultramafic pegmatoids ISO/IEC International standard on how to manage information security JCI Johannesburg Consolidated Investments JM Johns Manville (a manufacturer) JSE Johannesburg Stock Exchange Limited JV Joint venture kg Kilogramme kg/t Kilogrammes per tonne KKR Kalkoenkrans Reef km Kilometre Km² Square kilometres koz Thousand ounces KPM Kroondal Platinum Mines KR Kloof Reef kt Thousand tonnes Ktpm Thousand tonnes per month lb Pounds LCE Lithium Carbonate Equivalent LHD Load haul dump truck Li Lithium LIMS Lab Information Management System LoM Life of mine LR Libanon Reef m Metre m² Square metre Ma (Mega annum) million years MBA Master of Business Administration MBCCR Multiband Carbon Leader Reef MCF Mine call factor MER Merensky Reef R&R - 105

Mlb Million pounds mm Millimetre MMSA Mining and Metallurgical Society of America Moz Million ounces MPO Mine Plan of Operations MPRDA Minerals and Petroleum Resources Development Act MPTRO Mineral and Petroleum Titles Registration Office MR Mining right MRM Mineral Resource Management MSCC Mine Surveyor Certificate of Competency MSZ Main Sulphide Zone Mt Million tonnes Mtpa Million tonnes per annum MVR Middelvlei Reef MWP Mine Works Programme NDEP Nevada Division of Environmental Protection NDEP- BMRR Nevada Bureau of Mining Regulation and Reclamation NDT Non-destructive testing NEPA National Environmental Protection Authority Ni Nickel NPV Net present value NSR Net Smelter Royalty NYSE New York Stock Exchange OB-I Olivine occurrence Opt Ounces per tonne ORET Ore reserves economic test Os Osmium oz Ounces (troy) P&SA Pool and Share Agreement Pb Lead Pd Palladium PdEq Paladium equivalent PEA Preliminary economic assessment PFS Prefeasibility study PGM Platinum Group Metals PGO Professional Geoscientist Ontario POC Purchase of concentrate PR Prospecting right Pr.Sci.Nat Professional Natural Scientist Pt Platinum QA/QC Quality assurance / quality control QDM Quebrada de la Mina QEMSCAN Quantitative evaluation of minerals by scanning electron microscopy R South African Rand R/kg South African Rand per kilogramme REGM Randfontein Estates Gold Mine Rh Rhodium RLS Rustenburg Layered Suite ROM Run-of-mine RPA Roscoe Postle Associates Inc RPEEE Reasonable prospects for eventual economic extraction TERM DEFINITION RPM Rustenburg Platinum Mines RPO Recognised Professional Organisation RSO Randfontein Surface Operation Ru Ruthenium SACNASP South African Council for Natural Scientific Professions SAGC South African Geomatics Council SAIMM Southern African Institute of Mining and Metallurgy SAMREC CODE The South African Code for the Reporting of Exploration Results, Mineral Resources and Mineral Reserves SAMVAL CODE The South African Code for the Reporting of Mineral Asset Valuation SANAS South African National Accreditation System SCI Stillwater Canada Incorporated SDG’s Sustainable development goals SEC The United States Securities and Exchange Commission SIB Stay in business SIC Stillwater Igneous Complex SK-1300 Subpart 1300 of Regulation S-K under the US Securities Act of 1993 SLE Sub-level extraction SLP Social and labour plan SMC Stillwater Mining Company SME Society for Mining Metallurgy and Exploration SMU Selective mining unit SOFS Southern Free State projects SOX Sarbanes-Oxley Act of 2002 SRD Surface rock dump SRPM Sibanye Rustenburg Platinum Mine SV Sub-vertical SW Stoping width SWE Stillwater East t Metric tonne Ta Tantalum TCFD Task force on climate-related financial disclosures TMM Trackless Mining Machinery tpm Tonnes per month TSF Tailings storage facility U Uranium U3O8 Uranium oxide UG Underground UG2 Upper group two chromium layer US United States US$ United States dollar US$/oz United States dollar per ounce VCR Ventersdorp Contact Reef VS5 VS5 Reef of the Eldorado Formation WCWDM Water conservation and water demand management Wits Gold Witwatersrand Consolidated Gold Resources Limited WLTRP Western Limb Tailings Retreatment Project WPL Western Platinum Limited WRTRP West Rand Tailings Retreatment Project XRF X-ray fluorescence Zn Zinc TERM DEFINITION ABBREVIATIONS continued R&R - 106

DISCLAIMER Forward-looking statements The information in this document may contain forward-looking statements within the meaning of the “safe harbour” provisions of the United States Private Securities Litigation Reform Act of 1995 with respect to Sibanye Stillwater Limited’s (Sibanye-Stillwater or the Group) financial condition, results of operations, business strategies, operating efficiencies, competitive position, growth opportunities for existing services, plans and objectives of management for future operations, markets for stock and other matters. These forward-looking statements, including, among others, those relating to Sibanye-Stillwater’s future business prospects, revenues and income, ESG-related targets and metrics, the potential benefits of past and future acquisitions (including statements regarding growth, cost savings, benefits from and access to international financing and financial re-ratings), gold, PGM, nickel and lithium pricing expectations, levels of output, supply and demand, information relating to Sibanye-Stillwater’s new or ongoing development projects, any proposed, anticipated or planned expansions into the battery metals or adjacent sectors and estimations or expectations of enterprise value, adjusted EBITDA and net asset, are necessarily estimates reflecting the best judgment of the senior management and directors of Sibanye-Stillwater and involve a number of risks and uncertainties that could cause actual results to differ materially from those suggested by the forward-looking statements. As a consequence, these forward-looking statements should be considered in light of various important factors, including those set forth in this document. All statements other than statements of historical facts included in this document may be forward-looking statements. Forward-looking statements also often use words such as “will”, “would”, “expect”, “forecast”, “goal”, “vision”, “potential”, “may”, “could”, “believe”, “aim”, “anticipate”, “target”, “estimate” and words of similar meaning. By their nature, forward-looking statements involve risk and uncertainty because they relate to future events and circumstances and should be considered in light of various important factors, including those set forth in this disclaimer. Readers are cautioned not to place undue reliance on such statements. The important factors that could cause Sibanye-Stillwater’s actual results, performance or achievements to differ materially from estimates or projections contained in the forward-looking statements include, without limitation, Sibanye-Stillwater’s future financial position, plans, strategies, objectives, capital expenditures, projected costs and anticipated cost savings, financing plans, position and ability to reduce debt leverage; economic, business, political and social conditions in South Africa, Zimbabwe, the United States, Europe and elsewhere; plans and objectives of management for future operations; Sibanye-Stillwater’s ability to obtain the benefits of any streaming arrangements or pipeline financing; the ability of Sibanye-Stillwater to comply with loan and other covenants and restrictions and difficulties in obtaining additional financing or refinancing; Sibanye- Stillwater’s ability to service its bond instruments; changes in assumptions underlying Sibanye-Stillwater’s estimation of its Mineral Resources and Mineral Reserves; any failure of a tailings storage facility; the ability to achieve anticipated efficiencies and other cost savings in connection with, and the ability to successfully integrate, past, ongoing and future acquisitions, as well as at existing operations; the ability of Sibanye-Stillwater to complete any ongoing or future acquisitions; the success of Sibanye-Stillwater’s business strategy and exploration and development activities, including any proposed, anticipated or planned expansions into the battery metals or adjacent sectors and estimations or expectations of enterprise value (including the Rhyolite Ridge project); the ability of Sibanye-Stillwater to comply with requirements that it operate in ways that provide progressive benefits to affected communities; changes in the market price of gold, PGMs, battery metals (e.g., nickel, lithium, copper and zinc) and the cost of power, petroleum fuels, and oil, among other commodities and supply requirements; the occurrence of hazards associated with underground and surface mining; any further downgrade of South Africa’s credit rating; the impact of South Africa's greylisting; a challenge regarding the title to any of Sibanye-Stillwater’s properties by claimants to land under restitution and other legislation; Sibanye-Stillwater’s ability to implement its strategy and any changes thereto; the outcome of legal challenges to the Group’s mining or other land use rights; the occurrence of labour disputes, disruptions and industrial actions; the availability, terms and deployment of capital or credit; changes in the imposition of industry standards, regulatory costs and relevant government regulations, particularly environmental, sustainability, tax, health and safety regulations and new legislation affecting water, mining, mineral rights and business ownership, including any interpretation thereof which may be subject to dispute; increasing regulation of environmental and sustainability matters such as greenhouse gas emissions and climate change; being subject to, and the outcome and consequence of, any potential or pending litigation or regulatory proceedings, including in relation to any environmental, health or safety issues; the ability of Sibanye-Stillwater to meet its decarbonisation targets, including by diversifying its energy mix with renewable energy projects; failure to meet ethical standards, including actual or alleged instances of fraud, bribery or corruption; the effect of climate change or other extreme weather events on Sibanye-Stillwater’s business; the concentration of all final refining activity and a large portion of Sibanye-Stillwater’s PGM sales from mine production in the United States with one entity; the identification of a material weakness in disclosure and internal controls over financial reporting; the effect of US tax reform legislation on Sibanye-Stillwater and its subsidiaries; the effect of South African Exchange Control Regulations on Sibanye- Stillwater’s financial flexibility; operating in new geographies and regulatory environments where Sibanye-Stillwater has no previous experience; power disruptions, constraints and cost increases; supply chain disruptions and shortages and increases in the price of production inputs; the regional concentration of Sibanye-Stillwater’s operations; fluctuations in exchange rates, currency devaluations, inflation and other macro-economic monetary policies; the occurrence of temporary stoppages or precautionary suspension of operations at its mines for safety or environmental incidents (including natural disasters) and unplanned maintenance; Sibanye-Stillwater’s ability to hire and retain senior management and employees with sufficient technical and/or production skills across its global operations necessary to meet its labour recruitment and retention goals, as well as its ability to achieve sufficient representation of historically disadvantaged South Africans in its management positions; failure of Sibanye-Stillwater’s information technology, communications and systems; the adequacy of Sibanye-Stillwater’s insurance coverage; social unrest, sickness or natural or man-made disaster at informal settlements in the vicinity of some of Sibanye-Stillwater’s South African-based operations; and the impact of HIV, tuberculosis and the spread of other contagious diseases, including global pandemics. Further details of potential risks and uncertainties affecting Sibanye-Stillwater are described in Sibanye-Stillwater’s filings with the Johannesburg Stock Exchange and the United States Securities and Exchange Commission, including the 2022 Integrated Report and the Annual Financial Report for the fiscal year ended 31 December 2022 on Form 20-F filed with the United States Securities and Exchange Commission on 24 April 2023 (SEC File no. 333-234096). These forward-looking statements speak only as of the date of the content. Sibanye-Stillwater expressly disclaims any obligation or undertaking to update or revise any forward-looking statement (except to the extent legally required). These forward-looking
statements have not been reviewed or reported on by the Group’s external auditors. Non-IFRS1 measures The information contained in this document may contain certain non-IFRS measures, including, among others, adjusted EBITDA, AISC, AIC, sustaining capital, Nickel equivalent sustaining cost and average equivalent zinc concentrate price. These measures may not be comparable to similarly-titled measures used by other companies and are not measures of Sibanye-Stillwater’s financial performance under IFRS Accounting Standards. These measures should not be considered in isolation or as a substitute for measures of performance prepared in accordance with IFRS Accounting Standards. Sibanye-Stillwater is not providing a reconciliation of the forecast non-IFRS financial information presented in this document because it is unable to provide this reconciliation without unreasonable effort. These forecast non-IFRS financial information presented have not been reviewed or reported on by the Group’s external auditors. 1 IFRS refers to International Financial Reporting Standards Accounting Standards (IFRS Accounting Standards) as issued by the International Accounting Standards Board (IASB) Mineral Resources and Mineral Reserves Sibanye-Stillwater’s Mineral Resources and Mineral Reserves are estimates at a particular date, and are affected by fluctuations in mineral prices, the exchange rates, operating costs, mining permits, changes in legislation and operating factors. Sibanye-Stillwater reports its Mineral Resources and Mineral Reserves in accordance with the rules and regulations promulgated by each of the United States Securities and Exchange Commission (SEC) and the JSE at all managed operations, development, and exploration properties. Websites References in this document to information on websites (and/or social media sites) are included as an aid to their location and such information is not incorporated in, and does not form part of, this document. R&R - 107

ADMINISTRATION AND CORPORATE INFORMATION SIBANYE STILLWATER LIMITED (SIBANYE-STILLWATER) Incorporated in the Republic of South Africa Registration number 2014/243852/06 Share code: SSW and SBSW Issuer code: SSW ISIN: ZAE000259701 LISTINGS JSE: SSW NYSE: SBSW WEBSITE www.sibanyestillwater.com REGISTERED AND CORPORATE OFFICE Constantia Office Park Bridgeview House, Building 11, Ground floor, Cnr 14th Avenue & Hendrik Potgieter Road Weltevreden Park 1709 South Africa Private Bag X5 Westonaria 1780 South Africa Tel: +27 11 278 9600 Fax: +27 11 278 9863 COMPANY SECRETARY Lerato Matlosa Email: lerato.matlosa@sibanyestillwater.com DIRECTORS Dr Vincent Maphai* (Chairman) Neal Froneman (CEO) Charl Keyter (CFO) Dr Elaine Dorward-King* Harry Kenyon-Slaney*^ Jeremiah Vilakazi* Keith Rayner* Nkosemntu Nika* Philippe Boisseau** Richard Menell*# Sindiswa Zilwa* Susan van der Merwe* Timothy Cumming* * Independent non-executive ^ Appointed as lead independent director 1 January 2024 # Resigned as lead independent director 1 January 2024 ** Appointed as independent non-executive director 8 April 2024 INVESTOR ENQUIRIES James Wellsted Executive Vice President: Investor Relations and Corporate Affairs Mobile: +27 83 453 4014 Email: james.wellsted@sibanyestillwater.com or ir@sibanyestillwater.com JSE SPONSOR JP Morgan Equities South Africa Proprietary Limited Registration number 1995/011815/07 1 Fricker Road Illovo Johannesburg 2196 South Africa Private Bag X9936 Sandton 2146 South Africa AUDITORS Ernst & Young Inc. (EY) 102 Rivonia Road Sandton 2196 South Africa Private Bag X14 Sandton 2146 South Africa Tel: +27 11 772 3000 AMERICAN DEPOSITARY RECEIPTS TRANSFER AGENT BNY Mellon Shareowner Correspondence (ADSs) Mailing address of agent: Computershare PO Box 43078 Providence, RI 02940-3078 Overnight/certified/registered delivery: Computershare 150 Royall Street, Suite 101 Canton, MA 02021 US toll free: + 1 888 269 2377 Tel: +1 201 680 6825 Email: shrrelations@cpushareownerservices.com Tatyana Vesselovskaya Relationship Manager - BNY Mellon Depositary Receipts Email: tatyana.vesselovskaya@bnymellon.com TRANSFER SECRETARIES SOUTH AFRICA Computershare Investor Services Proprietary Limited Rosebank Towers 15 Biermann Avenue Rosebank 2196 PO Box 61051 Marshalltown 2107 South Africa Tel: +27 11 370 5000 Fax: +27 11 688 5248 R&R - 108

RSA GENERIC MINING PERMIT CONDITIONS The following is an extract of the key, generic Mining Permit conditions, as applicable to the South African operations. 1. Mining right renewal applications are to be submitted 60 working days prior to the date of expiry of the right 2. The holder of a MR must continue with mining operations, failing which the right may be suspended or cancelled 3. The terms of the right may not be varied or amended without the consent of the Minister of Mineral Resources and Energy 4. The Holder shall be entitled to abandon or relinquish the right of the area covered by the right entirely or in part. Upon abandonment or relinquishment the Holder must: a. Furnish the Regional Manager with all prospecting and/or mining results and/or information, as well as the general evaluation of the geological, geophysical and borehole data in respect of such abandoned area; and b. Apply for a closure certificate in terms of section 43(3) of the MPRDA 5. The holder shall pay royalties to the State in accordance with section 25(2)g of the MPRDA throughout the duration of the mining right 6. The holder shall pay royalties to the State in accordance with section 25(2)g of the MPRDA throughout the duration of the mining right 7. Mining operations must be conducted in accordance with the Mining Work Programme (MWP) and any amendment to the MWP and an approved Environmental Management Plan (EMP) 8. The holder shall not trespass or enter into any homestead, house or its curtilage, nor interfere with or prejudice the interests of the occupiers and/or owners of the surface of the mining right area except to the extent to which such interference or prejudice is necessary for the purposes of enabling the holder to properly exercise the holder’s rights under the mining right 9. The holder must dispose of all minerals derived from mining at competitive market prices which shall mean in all cases, non- discriminatory prices or non-export parity prices 10. A shareholding, an equity, an interest or participation in the mining right or joint venture, or a controlling interest in a company/JV may not be encumbered, ceded, transferred, mortgaged, let, sublet, assigned, alienated or otherwise disposed of without the written consent of the Minister, except in the case of a change of controlling interest in listed companies 11. All boreholes, shafts, adits, excavations and openings created by the holder shall be sealed, closed, fenced and made safe in accordance with the approved EMP and the Mine Health and Safety Act 12. The holder of the mining right, while carrying out mining operations, should safeguard and protect the environment, the mining area and any person using or entitled to use the surface of the mining area from possible damage or injury 13. The Minister or a person authorised by the Minister shall be entitled to inspect the mining area and the execution of the approved mining right conditions 14. A mining right may be cancelled or suspended subject to Section 47 of the MPRDA if the holder: a. Submits inaccurate, incorrect and/or misleading information in connection with any matter required to be submitted under this act b. Fails to honour or carry out any agreement, arrangement or undertaking, including the undertaking made by the holder in terms of the Broad Based Socio Economic Empowerment Charter and Social and Labour Plan c. Breaches any material term and condition of the mining right d. Conducts mining in contravention of the MPRDA e. Contravenes the requirements of the approved EMP f. Contravenes any provisions of this act in any other manner 15. The Holder shall submit monthly returns contemplated in Section 28 (2) of the MPRDA no later than the 15th of every month, and maintain all such books, plans and records in regard to mining of the mining area as may be required by the act 16. The holder shall, at the end of each year, following commencement of this mining right, inform the Regional Manager in writing of any new developments and of the future mining activities planned in connection with the exploitation/ mining of the minerals in the mining area 17. Provisions relating to Section 2(d) and Section 2(f) of the MPRDA, relating to the Broad Based Socio Economic Empowerment Charter differs in each mining right 18. The mining right does not exempt the holder from complying with the MHSA or any act in South Africa 19. The holder shall, annually, no later than three months before financial year end, submit a detailed implementation plan to give effect to Regulation 46(e)(i), (ii) and (iii) in line with the Social and Labour Plan 20. The holder shall, annually, no later than three months after finalization of its audited annual report, submit a detailed report on the implementation of the previous year’s SLP SLP COMPLIANCE REQUIREMENTS 1. A new Social and Labour Plan is to be submitted and reviewed every 5 years 2. Social and Labour Plan implementation plans must be submitted annually 3. A Social and Labour Plan report is to be submitted annually ENVIRONMENTAL MANAGEMENT COMPLIANCE REQUIREMENTS 1. A performance assessment relating to the EMP is to be conducted biannually 2. A performance assessment relating to the Water Use License is to be conducted annually 3. A performance assessment relating to the Atmospheric Emission License is to be conducted annually R&R - 109

RISK FACTORS
In addition to the other information included in this annual report, the considerations listed below could have a material adverse effect on Sibanye-Stillwater’s business, operating results and financial condition, resulting in a decline in the trading price of Sibanye-Stillwater’s ordinary shares or American Depositary Shares (ADSs). The risks set forth below comprise all material risks currently known to us. These factors should be considered carefully, together with the information and financial data set forth in this document.
Risk Factors Summary
The risks which could have a material effect on Sibanye-Stillwater have been classified into six categories. The following is an outline of the key risks within these categories:
Risks related to environmental, social and corporate governance (ESG)
•Mining is inherently hazardous and the related events that cause disruptions to Sibanye-Stillwater’s mining operations could result in increased production costs, financial and regulatory liabilities and reputational damage
•Sibanye-Stillwater’s operations are subject to extensive environmental, social and health and safety regulations, which could impose additional costs and compliance requirements, and Sibanye-Stillwater has faced, and may face further, claims and liability for breaches, or alleged breaches, of such regulations and other applicable laws
•The failure of a tailings storage facility could negatively impact Sibanye-Stillwater’s business, reputation, operating results and financial condition
•Social unrest, including the risk of service delivery protests, sickness or natural or man-made disasters at informal settlements in the vicinity of some of Sibanye-Stillwater’s South African-based operations may disrupt its business or may lead to greater social or regulatory impositions on Sibanye-Stillwater
•The failure of Sibanye-Stillwater’s information, communication or technology platforms or application systems, or the failure to protect sensitive commercial or personal data, could significantly impact Sibanye-Stillwater’s operations and business
•The physical impacts of climate change may adversely affect Sibanye-Stillwater’s mining operations, workforce and supply chain, and impose significant costs and burdens
Legal, regulatory and compliance risks
•If Sibanye-Stillwater is unable to implement and maintain an effective system of internal control over financial reporting, it may be unable to accurately report its results of operations, meet its reporting obligations or prevent fraud
•Sibanye-Stillwater’s mining rights are subject to legislation, which could impose significant costs and burdens and which impose certain ownership requirements, the interpretation of which may be the subject of dispute
•Title to Sibanye-Stillwater’s properties may be subject to challenge
•If Sibanye-Stillwater loses senior or regional management or is unable to hire and/or retain sufficient technically skilled employees or sufficient HDSA representation in management positions in South Africa, Sibanye-Stillwater’s business may be materially adversely affected
•Sibanye-Stillwater is subject to risks associated with litigation and regulatory proceedings
Risks Related to Production Delivery from Operations
•Energy shortages, load curtailment (including the risk of a total blackout) and usage constraints may force Sibanye-Stillwater to reduce or halt operations
•Economic, political or social factors affecting the regions where Sibanye-Stillwater operates may have a material adverse effect on Sibanye-Stillwater’s operations and profits
•Due to the mature infrastructure at Sibanye-Stillwater’s mining operations, unplanned breakdowns, statutory mandated modifications and stoppages may result in production delays, increased costs and industrial accidents
•Sibanye-Stillwater’s operations and profits have been and may be adversely affected by labour unrest and union activity
•Actual and potential supply chain shortages and increases in the prices of production inputs may have a material adverse effect on Sibanye-Stillwater’s operations and profit
Risks Related to Earnings Delivery
•Sibanye-Stillwater has a large amount of indebtedness. Failure to comply with its debt covenants or difficulties in obtaining necessary financing could have a material adverse effect on its business, operating results and financial condition
•Depressed commodity prices may impact Sibanye-Stillwater’s ability to implement its business strategy, fund capital expenditures and obtain financing
•Changes in the market price for gold, PGMs, nickel, zinc and lithium and related by-products may affect the profitability of Sibanye-Stillwater’s major capital projects, recycling, mining and refining operations and the cash flows generated by those operations
•Because gold and PGMs are generally sold in US dollars, while the majority of Sibanye-Stillwater’s gold production and a substantial amount of Sibanye-Stillwater’s PGM production costs are denominated in rand, Sibanye-Stillwater’s operating results and financial condition will be materially affected if there is a material change in the value of the rand
Strategic Risks
•Sibanye-Stillwater’s pursuit of value accretive acquisitions and joint ventures may not deliver anticipated outcomes in the timeframe anticipated or at all
// 1
•Acquisitions, business combinations, development projects and joint ventures, including Sibanye-Stillwater’s green metals projects, may expose Sibanye-Stillwater to new or increased regulatory oversight or requirements, including in geographies in which it is unfamiliar
•To the extent that Sibanye-Stillwater seeks to further expand its existing mining operations, it may experience problems associated with mineral exploration or development of mining projects
Risks related to Sibanye-Stillwater’s shares and ADSs
•Sibanye-Stillwater’s non-South African shareholders may face additional investment risk from currency exchange rate fluctuations since any dividends will be paid in rand
•Sibanye-Stillwater may not pay dividends or make similar payments to its shareholders in the future due to various factors and any dividend payments made may be subject to withholding tax
Risks related to ESG
Mining is inherently hazardous and the related events that cause disruptions to Sibanye-Stillwater’s mining operations could result in increased production costs, financial and regulatory liabilities and reputational damage
Mining by its nature involves significant risks and hazards, including environmental hazards, as well as industrial and mining accidents. These include, for example, seismic events, heat, unusual or unexpected rock formations affecting ore or rock characteristics, ground or slope failures, rock bursts, sink holes, fires, falls of ground and blockages, flooding, discharges of gasses and toxic substances, contamination of water, air or soil resources, radioactivity and other accidents or conditions resulting from mining activities including, among other things, shaft accidents, machinery related incidents, unplanned detonation of explosives, blasting and the transport, loading, storage and handling of hazardous and other materials.
Sibanye-Stillwater has experienced and continues to remain at risk of experiencing such events, which have and may continue to result in work stoppages, the precautionary suspension of operations, serious injury and loss of life, including as a result of unauthorised access to its properties and illegal mining. Sibanye-Stillwater is more susceptible than other mining operations, particularly at its South African operations, to certain of these risks due to mining at depth. In 2023, Sibanye-Stillwater recorded several safety incidents, including 10 fatalities at its South African operations and 1 fatality at its United States operations, following which certain of its operations were temporarily suspended. Any future such incidents could have a material adverse effect on Sibanye-Stillwater’s business, operating results and financial condition.
Seismic activity is of particular concern in the underground mining environment, particularly in South Africa, as a consequence of the extent and depth of mining. Seismic events have previously caused death and injury to employees and contractors and can result in safety-related stoppages and impact production. For example, seismicity reduced the mineable area at Driefontein and Kloof in 2023, resulting in reduced production. Seismic activity has also caused a loss of mining equipment, damage to and destruction of mineral properties and production facilities, monetary losses, environmental damage and potential legal liabilities.
Mining activity may also result in heat-related incidents, which has and could continue to lead to employee injuries or fatalities, the suspension of operations and mine closures. For example, in 2021, three employees died following prolonged heat exposure at the Kloof operations.
In addition, Sibanye-Stillwater enters into joint venture and other arrangements wherein it does not control or participate in the day-to-day operations of certain mines in which it has an interest. If these third parties experience material safety incidents, disruptions and/or fail to meet rigorous safety requirements, Sibanye-Stillwater’s reputation, business, operating results and financial condition may be materially and adversely effected.
Furthermore, there are risks that relevant regulators, such as the Department of Mineral Resources and Energy (DMRE) in South Africa and the Mine Safety and Health Administration (MSHA) or the US Occupational Safety and Health Administration (OSHA) in the United States, may impose fines and work stoppages (known as section 54 stoppages in South Africa (Section 54) and “k-orders” in the United States). This could reduce or halt production, increase production costs and result in financial and regulatory liability for Sibanye-Stillwater, which could have a material adverse effect on its business, operating results and financial condition. For example, Sibanye-Stillwater operated at reduced capacity under a k-order following a fatal incident in November 2023. See also – Sibanye-Stillwater’s operations are subject to extensive environmental, health and safety regulations, which could impose additional costs and compliance requirements, and Sibanye-Stillwater has faced, and may face further, claims and liability for breaches, or alleged breaches, of such regulations and other applicable laws.
Sibanye-Stillwater’s operations are subject to extensive environmental, social and health and safety regulations, which could impose additional costs and compliance requirements, and Sibanye-Stillwater has faced, and may face further, claims and liability for breaches, or alleged breaches, of such regulations and other applicable laws
Sibanye-Stillwater’s operations are subject to extensive environmental, social and health and safety laws, regulations, permitting requirements and standards in the jurisdictions in which it operates. These regulations oversee, among other things, the protection of the environment, pollution, water management, waste disposal, occupational health and safety, including mine safety, toxic substances, the management and sustainable closure of operations, and protection of endangered and other special status species.
The principal legislative frameworks that govern such matters include the National Environmental Management Act, 1998 (Act No. 107 of 1998) (NEMA), the National Water Act, 1998 (Act No. 36 of 1998) (NWA), the National Environmental Management Laws Amendment Act, 2022 (Act No. 2 of 2022) (NEMLAA), the National Environmental Management: Air Quality Act, 2004 (Act No. 39 of 2004) (Air Quality Act), the National Environmental Management: Waste Act, 2008 (Act No. 59 of 2008) (Waste Act), the National Heritage Resources Act (Act No. 25 of 1999) (National Heritage Resources Act), the National Environmental Management: Biodiversity Act (Act No. 10 of 2004) (the Biodiversity Act) and the National Nuclear Regulatory Act (Act No 47 of 1999) (NNR Act), amongst others, in South Africa, as well as the Clean Air Act (Clean Air Act), the Federal Water Pollution Control Act (Clean Water Act), the Resource Conservation and Recovery Act (RCRA), the Emergency Planning and Community Right-to-Know Act (EPCRA), the Endangered Species Act (Endangered Species Act), the National Environmental
2
Policy Act (NEPA), the Comprehensive Environmental Response, Metals Mines Reclamation Act, the Compensation and Liability Act (CERCLA) and analogous state laws in the United States as well as numerous permit stipulations across all of the jurisdictions where Sibanye-Stillwater operates, including Finland, France and Australia. For further details, see – Environmental and Regulatory Matters.
Sibanye-Stillwater may also be subject to new rules, regulations and frameworks with respect to ESG-related disclosures, such as the proposed Corporate Sustainability Due Diligence Directive (CSDDD) and the Corporate Sustainability Reporting Directive (CSRD) in the EU and the SEC’s recently adopted climate change disclosure rules, as well as increasing investor expectations with respect to ESG-related disclosures. Complying with such requirements and/or market expectations may require Sibanye-Stillwater to expend significant time and resources, and may subject it to heightened exposure to claims of “greenwashing”, i.e., claims that certain of its ESG disclosures are misleading or overstate potential ESG benefits. This may also result in increased litigation risk from private parties and governmental authorities related to its emissions reduction or other ESG efforts.
In addition to laws and regulatory requirements, Sibanye-Stillwater is party to environmental and social collaborations with local communities and interest groups, such as the Good Neighbour Agreement (GNA) in the United States, and the Gulf Communities Agreement (GCA) at Sibanye-Stillwater’s Century operations in Australia, which legally bind Sibanye-Stillwater and hold it to higher standards than regulations require.
In addition to compliance with local laws and regulations, Sibanye-Stillwater’s operations are also increasingly subject to stakeholder expectations concerning the application of stringent internationally recognised environmental, health and safety and social standards and benchmarks. Such standards include the World Gold Council’s Responsible Gold Mining Principles, IFC Performance Standards, the International Council on Mining and Metals (ICMM) Principles, Extractive Industry Transparency Initiative and other World Bank guidelines.
The environmental and health and safety laws and regulations applicable to Sibanye-Stillwater impose significant compliance costs and may open Sibanye-Stillwater to enforcement actions and potential litigation.
Compliance costs
Sibanye-Stillwater has incurred and may in the future incur significant costs to comply with environmental, health and safety requirements imposed under existing or new legislation, regulations or permit requirements, or to comply with changes in existing laws and regulations or the manner in which they are applied. For example, under a number of aforementioned existing or upcoming legislative frameworks, Sibanye-Stillwater may be required to take specific anti-pollution measures, remove or remediate previously disposed wastes (including wastes disposed of or released by prior owners or operators, or wastes disposed of by Sibanye-Stillwater’s operations in compliance with laws in effect in the past that have been subsequently amended), to clean up contaminated property (including contaminated soil and groundwater), to perform remedial operations to prevent future contamination or to demolish mine infrastructure and rehabilitate it to set standards.
Existing South African legislation requires Sibanye-Stillwater to fund its closure liabilities and obligations, environmental rehabilitation and remediation costs, which may be significant. Under NEMA (as amended by NEMLAA), there is a risk that Sibanye-Stillwater may be unable to fully extinguish its environmental liability in respect of its mining operations if the regulator is unwilling to issue closure certificates. This would result in Sibanye-Stillwater incurring additional costs relating to prolonged care and maintenance and other related costs. Further, under the Financial Provision Regulations, 2015 (as amended) (Financial Provisioning Regulations), Sibanye-Stillwater is required to update its financial provisions for annual environmental rehabilitation and remediation costs, decommissioning and closure activities and latent or residual environmental impacts (including the pumping and treatment of polluted or extraneous water), which mining companies have not fully quantified or provided for in the past. These regulations, once effective, will also require annual rehabilitation to be funded through an operational budget, which could lead to double provisioning (where funds have already been set aside in a rehabilitation trust fund for annual rehabilitation). Generally, these regulations are strongly opposed by the mining industry, and there has been industry-wide concern about their ambiguity and implementation. In the United States, Sibanye-Stillwater is required to post and maintain surety bonds for its reclamation obligations, which are substantial. As at 31 December 2023, Sibanye-Stillwater had US$94 million (R1.7 billion) of outstanding environmental surety bonds in the United States. In Queensland, Australia, the Mineral and Energy Resources Financial Provisioning Act, 2018 (the MERFP Act), provides for financial provisioning, including the requirement for progressive rehabilitation and site closure plans. Such reclamation obligations generally increase over time as costs rise and the physical extent of mining operations expands. Failure to secure and maintain adequate surety coverage could result in the operating permits of such mines being revoked and mining operations terminated.
Enforcement actions
Regulators are increasingly focusing on the enforcement of applicable environmental, health and safety laws and regulations and permitting requirements, including in South Africa, the United States and other jurisdictions where Sibanye-Stillwater operates. Enforcement actions may cause Sibanye-Stillwater’s operations to cease or to be suspended, and may include corrective measures requiring capital expenditures, installation of additional equipment or remedial actions. Non-renewal of permits, the inability to secure new permits, or the imposition of additional conditions could eliminate or severely restrict Sibanye-Stillwater’s ability to conduct its operations. Adverse permitting decisions may cause significant delays in the completion of planned development projects and require the Group to incur additional costs to appeal and/or modify its development plans.
Regulators, such as the DMRE in South Africa, can and do issue, in the ordinary course of operations, directives and/or instructions, such as Section 54 work stoppages, after routine visits or following safety incidents or accidents to partially or completely halt operations at affected mines until corrective measures are agreed and implemented. In 2023, Sibanye-Stillwater’s South African gold operations experienced 40 Section 54 work stoppages (2022: 25; 2021: 37) and 39 Section 54 work stoppages at the South African PGM operations (2022: 77; 2021: 42). In the United States, underground mines, including the Stillwater and East Boulder Operations, are continuously inspected by the MSHA, which can lead to notices of violation. Any of Sibanye-Stillwater’s US mines could be subject to a temporary or extended shut down because of a violation alleged by the MSHA, known as “k-orders”. In 2023, the United States PGM operations had four “k-orders” issued (2022: 2; 2021: 1).
3
In addition, there can be no assurance that unions will not take industrial action in response to such accidents, which could lead to losses in Sibanye-Stillwater’s production. Any additional stoppages in production as a result of regulatory enforcement or union actions may negatively affect Sibanye-Stillwater’s reputation with regulators and stakeholders.
Sibanye-Stillwater’s mining operations in the United States are located adjacent to the Absaroka-Beartooth Wilderness Area and are situated approximately 30 miles from the northern boundary of Yellowstone National Park. While Sibanye-Stillwater works closely and cooperatively with local environmental organisations, the Montana Department of Environmental Quality and the United States Forest Services, there can be no assurance that future political or regulatory actions will not further restrict or seek to terminate Sibanye-Stillwater’s operations in this sensitive area.
Litigation
Sibanye-Stillwater has been, and may in the future also be, subject to litigation and other costs as well as actions by authorities relating to environmental, climate change, health and safety matters, including mine closures, the suspension of operations, legal representation during accident inquiries, investigations and/or inquests and prosecution for mining accidents as well as significant penalties and fines for noncompliance. South African legislation grants legal standing to a wide range of interest groups to institute legal proceedings to enforce their environmental rights, which are enforceable against private entities. In the future, Sibanye-Stillwater may also be subject to litigation in South Africa brought by members of the community affected by environmental-related impacts, as well as non-governmental organisations (NGOs) and public bodies. In this regard, recent case law in South Africa has provided a precedent for private prosecution by environmental NGOs for environmental infringements and noncompliance with key environmental legislation. South African legislation also provides for potential director, shareholder and lender liability for environmental damage in certain circumstances. Further, contravention of environmental and health and safety laws and regulations may also constitute a criminal offence and result in a fine or imprisonment, or both in addition to administrative penalties.
Some of the principal health risks associated with Sibanye-Stillwater’s mining operations arise from occupational exposure and community environmental exposure to silica dust, noise and certain hazardous substances, including toxic gases and radioactive particulates. The most significant occupational diseases affecting Sibanye-Stillwater’s workforce include lung diseases (such as silicosis, TB, a combination of the two and chronic obstructive airways disease (COAD)) as well as noise induced hearing loss (NIHL). Employees have sought and may continue to seek, compensation for certain illnesses, such as silicosis, from Sibanye-Stillwater.
In 2019, Sibanye-Stillwater entered into a R1.4 billion guarantee facility (reduced to R992 million in 2023) with Nedbank Limited in relation to its obligations under a settlement agreement between several South African mining companies, including Sibanye-Stillwater (collectively, the Gold Working Group), to compensate all eligible workers (or their surviving relatives) who worked at the Gold Working Group companies’ mines from 12 March 1965 to the effective date of the settlement agreement who suffered from silicosis. The payment of compensation for the claims may have an adverse financial impact on Sibanye-Stillwater. For further information, see – Annual Financial Report – Consolidated financial statements – Notes to the consolidated financial statements – Note 31: Occupational healthcare obligation.
As environmental, health and safety laws and regulations are becoming more complex and stringent, Sibanye-Stillwater may face increased regulatory and stakeholder scrutiny, which may lead to increased capital expenditures and subject Sibanye-Stillwater to potential enforcement actions and litigation proceedings. Any significant cost increases, potential enforcement actions or litigation relating to environmental, health and safety laws and regulations could have a material adverse effect on Sibanye-Stillwater’s business, results of operations and financial condition.
The failure of a tailings storage facility could negatively impact Sibanye-Stillwater’s business, reputation, operating results and financial condition
Mining companies face inherent risks in their operation of tailings storage facilities. Tailings storage facilities are engineered structures built for the containment of the uneconomical milled ore residue and water, known as tailings. The use of tailings storage facilities exposes Sibanye-Stillwater to certain risks, including the failure of a tailings dam due to events such as earthquakes, high rainfall, snow melt, overtopping, piping, mud slides or seepage failures. The potential occurrence of a tailings storage failure at one of Sibanye-Stillwater’s facilities could lead to the loss of human life and/or extensive property and environmental damage.
Sibanye-Stillwater maintains a Group-wide tailings management system to manage its dams’ safety, which aligns to the Global Industry Standard on Tailings Management (GISTM) and international best practice. Although Sibanye-Stillwater has a tailings storage facility management system, the effectiveness of its designs, construction quality or regular monitoring cannot be guaranteed throughout its operations and it cannot be guaranteed that these measures will prevent the failure of one or more of its tailings storage facilities or that such potential failure will be detected in advance. Sibanye-Stillwater may also be required to undertake remedial work to reinforce its dams if a vulnerability is discovered, which may require it to reduce or suspend operations while remediation takes place. For example, in 2021, Sibanye-Stillwater temporarily suspended processing operations at Beatrix to allow for completion of rehabilitation work on the Beatrix tailing storage facility.
In addition, although Sibanye-Stillwater generally requires its partners to maintain such systems, it cannot guarantee that its partners maintain similar safety precautions or monitoring systems on their tailings storage facilities. There is no assurance that any safety measures implemented will prevent the failure of any tailings storage facility.
The failure of a tailings storage facility will lead to multiple legal proceedings and investigations, which could include securities class actions, criminal proceedings and public civil actions (against Sibanye-Stillwater or individuals) for significant amounts of damages. Furthermore, the elimination of the “conventional” practice of storing wet tailings (e.g. by alternatively filtering, “dry” stacking and compacting the tailings) could require the research and development of new technologies, which could lead to additional large expenditures. Following tailings storage facility failures in South Africa in 2022, Brazil in 2015 and 2019 and Canada in 2014 (none of which were associated with Sibanye-Stillwater) and other tailing storage facility failures, additional environmental and health and safety laws and regulations are being considered globally, including in jurisdictions where Sibanye-Stillwater operates. In addition, changes in laws and regulations may impose more stringent conditions in connection with the construction of tailings storage facilities, particularly with respect to upstream tailings
4
storage facilities, the licensing process of projects and operations, the ability to procure appropriate insurance coverage with respect to tailings facilities and increased criminal and civil liability for companies, officers and contractors. For example, in 2020, the ICMM, the United Nations Environment Programme (UNEP) and the Principles for Responsible Investment (PRI) established an international tailings standard, the GISTM. ICMM members, including Sibanye-Stillwater, have committed to conform by August 2025 for all of their facilities. Sibanye-Stillwater may incur significant costs to comply with such standards or may be unable to comply by committed timeframes.
Furthermore, the unexpected failure of a tailings storage facility could lead to the need for a large expenditure on contingencies and on recovering the regions and people affected, extensive and permanent environmental damage and the payment of penalties, fines or other money damages or civil claims.
The occurrence of any of such risks could have a material adverse effect on Sibanye-Stillwater’s business, operating results and financial condition.
Sibanye-Stillwater’s operations are subject to water use and wastewater regulations, which could impose significant costs and burden
Sibanye-Stillwater’s operations are subject to regulatory controls on their usage and disposal of water and waste. Under South African and US law, mining operations are subject to water use licences and/or authorisations that govern each operation’s water usage and that require, among other things, mining operations to achieve and maintain certain water quality limits regarding all water discharges. All of Sibanye-Stillwater’s operations hold the required water-related permits, although at certain operations in South Africa (Driefontein, Beatrix, Burnstone, Kloof, Rand Uranium, Ezulwini, Marikana, Rustenburg and Kroondal), the water use licences issued under the NWA, are currently subject to review and amendment by the Department of Water and Sanitation (DWS) for final issuance.
In addition, the DWS intends to roll-out a waste discharge charge system by 2025 for all waste-related activities that may impact on water resources, which may have significant cost implications for Sibanye-Stillwater’s operations in South Africa.
Sibanye-Stillwater’s operations are heavily dependent on external water sources to facilitate the functioning of its mines. Any loss of the Group’s water use licencing, or a substantial decrease in the capacity of the local government or water boards to provide fresh water to these operations, may cause it to cease operations until such services are reinstated. As a result, Sibanye-Stillwater expects to incur significant expenditure to achieve and maintain compliance with the licence requirements at each of its operations. Any failure on Sibanye-Stillwater’s part to achieve or maintain compliance with the requirements of these licences could result in Sibanye-Stillwater being subject to remedial actions, substantial claims, penalties, fees and expenses, significant delays in operations, criminal proceedings or the revocation of the relevant water use licence, which could curtail or halt production at the affected operation. Any of the above, and any significant constraints to availability of water, particularly at Sibanye-Stillwater’s South African PGM operations, could have a material adverse effect on Sibanye-Stillwater’s business, operating results and financial condition.
Sibanye-Stillwater has identified a risk of potential long-term acid mine drainage (AMD) issues. AMD relates to the acidification and contamination of naturally occurring water resources by pyrite-bearing ore contained in underground mines and in rock dumps, tailings dams and pits on the surface. Should Sibanye-Stillwater’s current preventative and active AMD and water management measures be unsuccessful, the Group may fail to comply with its water use licence requirements and expose Sibanye-Stillwater to liabilities and unforeseen costs associated with the pumping and treatment of polluted or extraneous water whether during operation or in the post-closure context.
Social unrest, including the risk of service delivery protests, sickness or natural or man-made disasters at informal settlements in the vicinity of some of Sibanye-Stillwater’s South African-based operations may disrupt its business or may lead to greater social or regulatory impositions on Sibanye-Stillwater
There are a number of informal settlements located in the vicinity of some of Sibanye-Stillwater’s South African-based operations. These settlements are populated by mining company employees (including Sibanye-Stillwater employees), the families of mining company employees and others. As at 31 December 2023, approximately 43% (2022: 58%; 2021: 57%) of Sibanye-Stillwater’s South African-based workforce opted to receive a “living out allowance” and management expects that a number of these individuals reside in informal settlements. In recent years, the size of these settlements has grown substantially. Poor living conditions in these settlements may lead to the spread of disease or other health hazards, which may increase absences or affect the productivity of employees. The population of such settlements or the surrounding communities may also demand jobs, improved delivery of social services or infrastructure from the local mining operations, including Sibanye-Stillwater. Any such demands or other demands from these communities may lead to increased costs or regulatory burdens on Sibanye-Stillwater. Such demands may also lead to protests, including service delivery protests related to poor service delivery in such communities, or other actions that may hinder Sibanye-Stillwater’s ability to operate, including incurring expenses to defend its rights through initiating or defending against litigation proceedings.
In addition, in December 2019, the Minister of the DMRE (DMRE Minister) published the Housing and Living Conditions Standard for implementation, requiring miners, including Sibanye-Stillwater, to revise its current housing and living condition plans under the Group’s social and labour plans (SLPs). The Housing and Living Conditions Standards were submitted to the DMRE and are being implemented, including applications by Sibanye-Stillwater for the eviction of illegally occupied houses earmarked for employee ownership. Sibanye-Stillwater estimates spend on its Housing and Living Conditions Plans for the South African PGM and gold segments to amount to R5.3 billion (US$284 million) and R1.5 billion (US$81 million), respectively, over the next five years. If actual spend exceeds the amounts estimated, it could have a material adverse effect on Sibanye-Stillwater’s business, operating results and financial conditions.
The failure of Sibanye-Stillwater’s information, communication or technology platforms or application systems, or the failure to protect sensitive commercial or personal data, could significantly impact Sibanye-Stillwater’s operations and business
Sibanye-Stillwater utilises and is reliant on various internal and external information, communication and technology platforms or application systems, such as SAP, Microsoft, mine technical and other applications, to support its business activities. Damage or interruption of Sibanye-Stillwater’s information, communication or technology platforms or application systems (including systems of third party vendors that it relies on), whether due to accidents, old or obsolete information technology platforms or application systems and equipment, human error,
5
natural events or malicious acts, may lead to important data, including commercially or personally sensitive information, being irretrievably lost, exposed or damaged, thereby adversely affecting Sibanye-Stillwater’s business, operating results and financial condition.
Information technology systems that Sibanye-Stillwater utilises (including systems operated by third party vendors) store voluminous personal information related to employees, as well as sensitive information relating to suppliers and customers. The information security management system protecting Sibanye-Stillwater’s information, communication and technology infrastructure and network may be subject to security breaches (e.g. cybercrime or activists) or other incidents that can result in misappropriation of funds, increased health and safety risks to people, disruption to its operations, environmental damage, loss of intellectual property, disclosure of commercially or personally sensitive information, legal or regulatory breaches and liability, other costs and reputational damage. While no material losses related to cybersecurity breaches have been discovered, given the increasing sophistication and evolving nature of this threat, the possibility of them occurring in the future cannot be ruled out. Sibanye-Stillwater performs periodic safety testing and annual disaster recovery testing which includes reviews of recovery procedures and security controls, and all identified critical applications have been replicated at alternative data centres throughout Sibanye-Stillwater’s operations. Despite these measures, there is still a risk of inadequate or failed disaster recovery. An extended failure of critical system components, caused by accidental actions, such as failed hardware or failed network infrastructure, or malicious actions, including those resulting from a cybersecurity attack, could result in a significant environmental incident, commercial loss or interruption to operations. Sibanye-Stillwater may also incur significant costs to protect against or repair damage caused by disruptions or security breaches in the future, such as rebuilding internal systems, implementing additional threat protection measures, defending against litigation, responding to regulatory inquiries, or taking remedial steps with respect to third parties, among others. In addition, Sibanye-Stillwater complies with legislation relating to cybersecurity breaches, such as the South African Cybercrimes Act, as well as the SEC’s final rules on cybersecurity risk management, strategy, governance, and incident disclosure.
In addition, the interpretation and application of consumer, privacy and data protection laws in South Africa, the United States, the EU, Australia and elsewhere are uncertain and evolving. It is possible that regulators may interpret and apply these laws in a manner that is inconsistent with Sibanye-Stillwater’s data processes and practices. Complying with these various laws is difficult and could cause Sibanye-Stillwater to incur significant costs or require it to change its business practices. This includes, among other things, compliance with South Africa’s data privacy legislation, the Protection of Personal Information Act, 2013 (POPIA) and the EU’s General Data Protection Regulation (GDPR). Confidentiality breaches have historically been a significant risk for the mining sector, and failure to comply with such applicable legislation may also lead to reputational damage, substantial penalties, fines and/or imprisonment, depending on the severity of the infraction. Sibanye-Stillwater may also have insufficient insurance coverage for any data protection breaches. See – Sibanye-Stillwater’s insurance coverage may not adequately satisfy all potential claims and exposures.
Sibanye-Stillwater’s business may be harmed if it fails to adapt to technological advances in a timely and cost-effective manner
The industry in which Sibanye-Stillwater operates is characterised by rapid technological advancements, including industry-wide digitalisation, robotic process automation (RPA), machine-learning and advances in artificial intelligence. Sibanye-Stillwater’s ability to compete effectively and in a cost-effective manner depends, in part, on its ability to adapt to, and adequately invest in, new technology and related personnel. Insufficient or untimely investment in new technology or personnel may require prolonged use of labour-intensive modes of work or require it to retain legacy infrastructure that cannot be easily or cost-effectively serviced or upgraded. In addition, the Group may need to undertake certain technological upgrades in response to heightened safety, environmental or security requirements, and failure to adopt these improvements may delay or increase the cost of compliance.
Adapting to new technologies may also pose integration-related risks. For example, Sibanye-Stillwater has implemented a hybrid cloud strategy to leverage advanced cloud-based solutions. Under this approach, centrally hosted data centres will house the primary business systems in each operational region. The integration and transition to cloud-based solutions could be susceptible to delays or disruptions, which could result in failing network infrastructure, network outages and a breach of privacy. Cloud-based solutions may also increase Sibanye-Stillwater’s exposure to cyber-related threats.
Any of the foregoing may impact Sibanye-Stillwater’s ability to deliver on its strategic objectives, including sustainability, safety and cost optimisation targets, and have a material adverse effect on Sibanye-Stillwater’s business, operating results and financial condition.
Mining companies are required to operate in ways that provide benefits to affected communities. Failure to comply with these requirements can result in legal suits, additional operational costs, investor divestment and loss of “social licence to operate”, which could adversely impact Sibanye-Stillwater’s business, operating results and financial condition
Mining companies face increasing pressure over their “social licence to operate”, which can be interpreted as the acceptance of the activities of these companies by stakeholders. While formal permission to operate is ultimately granted by host governments, many mining activities require social permission from host communities and influential stakeholders to carry out operations effectively and profitably.
Mining companies are under pressure to demonstrate that, while they seek a satisfactory return on investment for shareholders, the environment, human rights and other key sustainability issues are responsibly managed and stakeholders, such as employees, host communities and the governments of the countries in which they operate, also benefit from their commercial activities. The potential consequences of these pressures and the adverse publicity in cases where companies are believed to be creating insufficient social and economic benefit or are perceived to not be responsibly managing other sustainability issues may result in additional operating costs, higher capital expenditures, reputational damage, active community opposition (possibly resulting in delays, disruptions and stoppages), allegations of human rights abuses, legal suits, regulatory intervention and investor withdrawal.
In order to maintain its social licence to operate, Sibanye-Stillwater may need to design or redesign parts of its mining operations to minimise their adverse impact on such communities and the environment, either by changing mining plans to avoid such adverse impact, by modifying operations, by changing planned capital expenditures or by relocating the affected people to an agreed location. In South Africa, anti-mining sentiment in some of the communities in which Sibanye-Stillwater operates has been exacerbated by forced resettlement of residents, pervasive misinformation related to Sibanye-Stillwater or the industry in general, environmental incidents, blasting, injuries and fatalities sustained on Sibanye-Stillwater’s mining properties, including as a result of unauthorised access and illegal mining, violent crime
6
rates and high levels of unemployment. For example, the official unemployment rate in South Africa was 32.6% in the second quarter of fiscal 2023 mainly due to slow economic growth, poor infrastructure and increased power outages. There is no assurance that a prolonged economic downturn will not result in an extended period of high unemployment, further exacerbating anti-mining sentiment in South Africa. Furthermore, the rise of ESG factors in investment decisions may result in divestments of certain parts of the mining sector or increased difficulties with access to finance, or access to affordable finance.
Responsive measures may require Sibanye-Stillwater to take costly and time-consuming remedial measures, including the full restoration of livelihoods of those impacted, and remediation of the environment. In addition, Sibanye-Stillwater is obliged to comply with the terms and conditions of all the mining rights it holds in South Africa. In this regard, the SLP provisions of Sibanye-Stillwater’s mining rights must make provision for local economic development, among other obligations. See – Sibanye-Stillwater’s mining rights are subject to legislation, which could impose significant costs and burdens and which impose certain ownership requirements, the interpretation of which may be the subject of dispute. In addition, Sibanye-Stillwater has several joint venture arrangements and associated investments, and the companies which Sibanye-Stillwater partners with may apply different corporate governance standards and responsible citizen procedures. As Sibanye-Stillwater has a long history of mining operations in certain regions or has purchased operations that have a long history, issues may arise regarding historical as well as potential future environmental or health impacts in those areas.
Delays in projects attributable to a lack of community support or other community-related disruptions or delays can translate directly into a decrease in the value of a project or into an inability to bring the project to, or maintain, production. The cost of measures and other issues relating to the sustainable development of mining operations has placed significant demands on Sibanye-Stillwater’s resources and could increase capital and operating costs and have a material adverse effect on Sibanye-Stillwater’s reputation, business, operating results and financial condition.
An actual or alleged breach or breaches in governance processes, or fraud, bribery and corruption may lead to public and private censure, regulatory penalties and loss of licences or permits and may impact negatively upon Sibanye-Stillwater’s empowerment status and may damage Sibanye-Stillwater’s reputation
The legal and regulatory framework in which Sibanye-Stillwater operates is complex, and its governance and compliance policies and processes may not prevent potential breaches of law or accounting or other governance practices. Sibanye-Stillwater’s code of ethics, compliance policies and operating codes, and other applicable standards and guidance, may not prevent instances of fraudulent behaviour and dishonesty, nor guarantee compliance with legal and regulatory requirements.
To the extent that Sibanye-Stillwater suffers from any actual or alleged breach or breaches of relevant anti-money laundering, anti-bribery or counter-terrorism laws (including legislation in South Africa, the United States, such as the US Foreign Corrupt Practices Act of 1977, the EU and elsewhere) under any circumstances, they may lead to regulatory, civil or criminal fines, litigation, public and private censure and loss of operating licences or permits and may impact negatively upon Sibanye-Stillwater’s empowerment status and may damage its reputation. The occurrence of any of these events could have a material adverse effect on Sibanye-Stillwater’s business, operating results and financial condition.
Regulation of greenhouse gas (GHG) emissions may materially adversely affect Sibanye-Stillwater’s operations
Energy is a significant production input and input cost to Sibanye-Stillwater’s mining and processing operations, with its principal energy sources being electricity, purchased petroleum products, coal, propane and natural gas. A number of governments or governmental bodies, including the United Nations Framework Convention on Climate Change (UNFCCC), have introduced or are contemplating regulatory changes in response to the impact of climate change, including restricting GHG emissions in jurisdictions in which Sibanye-Stillwater operates. Such regulation may impact Sibanye-Stillwater’s operating costs, limit or modify its operations and impact the competitiveness of the commodities it produces.
For example, the South African government introduced a carbon tax under the Carbon Tax Act with effect from 1 June 2019, imposing a tax on emissions which exceed applicable tax-free allowances. As a result of these tax-free allowances, Sibanye Stillwater’s effective carbon tax rates is much lower than the statutory carbon tax rates: 2023 (statutory rate: R159 per tonne, effective rate: R8 to 63 per tonne); 2022 (statutory rate: R144 per tonne, effective rate: R7 to R58 per tonne) and 2021 (statutory rate: R134, effective rate: R7 to R54). However, it is expected that the gradual phasing out of the tax-free allowances will result in higher effective carbon tax rates over time. In addition, as Eskom begins to pay carbon tax following Phase 1 of the Carbon Tax Act (extended to 31 December 2025), it is anticipated that it will pass on such costs in the form of higher electricity tariffs, which it will charge to Sibanye-Stillwater.
To prepare South Africa for the structural and sustainable transition to a climate‐resilient and low carbon economy, in 2022, the Carbon Tax Act was amended to include progressive increases in the carbon tax rate, set to increase from R159 for fiscal 2023 to R462 in fiscal 2030, with further increases to be announced thereafter.
A carbon fuel levy was also introduced under the Customs and Excise Act, 1964 as part of the current South African fuel levy regime. The carbon fuel levy applies to stationary and non-stationary mobile emissions resulting from the use of liquid fuels, primarily petrol and diesel. The 9c/litre carbon fuel levy on diesel, which came into effect on 5 June 2019, was increased to 11c/litre on 5 April 2023, as a result of the increase in the carbon tax rate.
In addition, South Africa’s National Assembly voted to pass the Climate Change Bill, 2022 (Climate Change Bill) in February 2022, which imposes “carbon budgets” on entities in certain high-emitting industries, such as mining. The carbon budgets are intended to operate as statutory limits for CO2e emissions, which in the case of exceedances may lead to a fine, or other punitive measures. It is expected that the Carbon Tax Act will be aligned with the Climate Change Bill, such that companies will be required to pay R640 per tonne of gross CO2e emissions exceeding the applicable carbon budget. Further, once the Climate Change Bill is enacted, it is expected that the South African government will phase out the current carbon budget allowance of 5% provided for under the Carbon Tax Act. Sibanye-Stillwater’s costs under the existing and proposed legislation will be impacted by the finalisation of the GHG reporting regulations and the extent to which it is
7
able to make use of the allowances that are built into the carbon tax design. Sibanye-Stillwater had a net carbon tax expense for the year ended 31 December 2023 of R2 million (2022: R10 million credit; 2021: R4 million expense).
A number of other regulatory initiatives are underway in countries in which Sibanye-Stillwater operates that seek to reduce or limit industrial GHG emissions. These regulatory initiatives will be either voluntary or mandatory and are likely to impact Sibanye-Stillwater’s operations directly or indirectly by affecting the cost of doing business, for example by increasing the costs of its suppliers or customers. Inconsistency of regulations particularly between developed and developing countries may affect both Sibanye-Stillwater’s decision to pursue opportunities in certain countries and its cost of operations.
Sibanye-Stillwater’s reliance on fossil fuel-based electricity from Eskom may give rise to additional costs in the future should any of the countries into which it exports its products introduce carbon border adjustment mechanisms. For example, South African carbon taxpayers who reduce the South African carbon tax liabilities through permissible allowances and deductions may then pay a higher import carbon tax when their goods are imported into other countries with carbon border adjustment mechanisms (subject to the specific terms of those mechanisms).
In the United States, Sibanye-Stillwater is also subject to legislative and regulatory initiatives that are underway to limit GHG emissions. The US Congress has considered legislation that would control GHG emissions through a “cap and trade” programme and several US states have already implemented programmes to reduce GHG emissions. The US Environmental Protection Agency’s (the EPA) “Tailoring Rule” makes certain large stationary sources and modification projects subject to permitting requirements for GHG emissions under the Clean Air Act. New or modified sources subject to permitting for conventional pollutants will be required to comply with Best Available Control Technologies (BACT) for GHGs if the new source or the modification will result in an annual increase of 75,000 tons per year of CO2e. In 2022, the US Supreme Court limited the EPA’s authority under provisions of the Clean Air Act to regulate greenhouse gas emissions without clear authorisation from the US Congress. It is unclear the full extent to which this may impact the EPA’s ability to impose additional regulations.
Sibanye-Stillwater is also subject to GHG reporting requirements for specified large GHG emission sources in the United States. Sibanye-Stillwater’s United States PGM operations hold a Title V Major Air Quality Permit, which requires Sibanye-Stillwater to annually calculate its GHG emissions and compare these amounts against reporting thresholds. Because current levels are below reporting thresholds, the United States PGM operations are not currently required to report GHG emissions. Additionally, the assessment of GHG emissions is becoming an increasingly important part of NEPA assessments and in early 2023, the White House Council on Environmental Quality issued interim guidance on how agencies should consider GHG emissions in NEPA assessments. While such guidance has yet to be finalised, Sibanye-Stillwater may be required to mitigate its GHG emissions in connection with any future NEPA review.
In 2021, the Biden administration issued an executive order directing all federal agencies to review and take action to address any federal regulations, orders, guidance documents, policies and any similar agency actions promulgated during the prior administration that may be inconsistent with the administration’s policies. As a result, it is unclear the extent to which certain recent regulatory developments may be modified or rescinded. The executive order also established the Inter-agency Working Group on the Social Cost of Greenhouse Gases, which is called on to, among other things, develop methodologies for calculating the “social cost of carbon,” “social cost of nitrous oxide” and “social cost of methane”. As the debate surrounding GHG regulation in the United States continues to ensue, further regulatory, legislative and judicial developments are difficult to predict. Due to the uncertainties surrounding the regulation of and other risks associated with GHG emissions, Sibanye-Stillwater cannot predict the financial impact of future United States GHG regulations and related developments on its United States PGM operations.
Sibanye-Stillwater is also subject to GHG emission regulations in other jurisdictions in which it operates, such as Finland and France, which impose obligations based on those from the UNFCCC and EU regulations, such as the EU’s Emission Trading System Directive (2003/87/EC) and the EU Directive on the Geological Storage of CO2 (2009/31/EC). There can be no assurance that Sibanye-Stillwater will be able to meet its voluntary targets relating to GHG emissions or comply with targets that may be imposed upon the mining industry by external regulators. Furthermore, additional, new and/or different regulations in this area, such as the imposition of stricter limits than those currently contemplated, could be enacted, all of which could have a material adverse effect on Sibanye-Stillwater’s business, financial condition, results of operations and prospects.
Regulation of GHG emissions in the jurisdictions of Sibanye-Stillwater’s end-user customers and value chain participants could also have an adverse effect on the demand for certain of its products, which may in turn, have a material adverse effect on Sibanye-Stillwater’s production levels, business, operating results and financial condition.
Sibanye-Stillwater may not meet its decarbonisation targets in the timeframe anticipated, or at all
As a commercial consumer of power, Sibanye-Stillwater’s ability to reduce its GHG emissions is impacted by its mix of energy suppliers, including Sibanye-Stillwater’s ability to reduce its dependence on Eskom, which accounted for approximately 90% of its total Scope 1 and Scope 2 GHG emissions for the year ended 31 December 2023. See – Regulation of greenhouse gas (GHG) emissions may materially adversely affect Sibanye-Stillwater’s operations. To reduce its emissions, Sibanye-Stillwater aims to diversify its energy mix with renewable projects. For example, in 2023, Sibanye-Stillwater entered into power purchase agreements to obtain energy from wind and solar photovoltaic projects in South Africa. However, there is no guarantee that these projects will be successfully completed in the time frame or to the standard anticipated, or that the energy produced from these projects will be sufficient to reduce Sibanye-Stillwater’s reliance on Eskom and other non-renewable sources of energy. See also Sibanye-Stillwater’s pursuit of value accretive acquisitions and joint ventures, may not deliver anticipated outcomes in the timeframe anticipated or at all. In addition, Sibanye-Stillwater’s ability to diversify its energy mix may also be impacted by government policies or actions, including the liberalisation of the electricity supply industry and technological innovations, including electrification. However, there is no guarantee that such market enhancement will develop as expected, or at all.
In certain aspects of Sibanye-Stillwater’s operations, its ability to reduce GHG emissions depends on the actions of third parties and technological solutions and innovation. For example, diesel-fuelled haul trucks are a significant contributor to GHG emissions at Sibanye-Stillwater’s United States PGM operations, but reduction of emissions from transportation equipment will depend in part upon the development and availability of commercially viable alternative-fuelled mining vehicles by Sibanye-Stillwater’s third-party suppliers.
8
The Group expects to incur additional costs in its efforts to decarbonise, the totality of which cannot currently be estimated with accuracy.
Failure by Sibanye-Stillwater to achieve or maintain its ESG performance targets and credentials may result in significant reputational damage, make it harder to obtain or maintain third-party contracts or financing or result in regulatory enforcement and fines, which may materially affect its business, operating results and financial condition.
The physical impacts of climate change may adversely affect Sibanye-Stillwater’s mining operations, workforce and supply chain, and impose significant costs and burdens
Sibanye-Stillwater’s operations, workforce and supply chain may be exposed to climate change, particularly changes in the frequency, intensity and/or duration of intense storms, drought, flooding, wildfire, and other extreme weather events and patterns. For example, in April 2022, nickel sulphide from Sibanye-Stillwater’s Marikana operations that was stored in a warehouse awaiting shipment was contaminated due to a flooding event. Additionally, flooding in Montana prevented access via public transit routes and led to a suspension of the Group’s United States PGM operations for seven weeks in mid-June 2022, which resulted in lower production levels as compared to the previous year. Operations were similarly suspended at the Century operations following record levels of rainfall in March 2023.
Such potential physical impacts of climate change on Sibanye-Stillwater’s operations are highly uncertain, and would vary by operation based on particular geographic circumstances. As a result, Sibanye-Stillwater may face production interruptions, increased operational costs associated with power and supply chain disruption, project delays and increased production pricing. In addition, the potential for overall decreases in precipitation could affect the availability of water needed for Sibanye-Stillwater’s operations, leading to increased operating costs, or in extreme cases, disruptions to mining operations.
In addition, as part of Sibanye-Stillwater’s commitment to implementing the GISTM, it may be required to undertake additional measures to mitigate the environmental impact at its tailings facilities, including physical impacts arising from climate change. Any such obligations could increase operational expenses or required capital investments.
Legal, regulatory and compliance risks
If Sibanye-Stillwater is unable to implement and maintain an effective system of internal control over financial reporting, it may be unable to accurately report its results of operations, meet its reporting obligations or prevent fraud
Pursuant to Section 404 of the Sarbanes-Oxley Act of 2002, US reporting companies, including Sibanye-Stillwater, are required to include a management report on its internal control over financial reporting in its annual report, including management’s assessment of the effectiveness of its internal control over financial reporting. In addition, an independent registered public accounting firm must attest to and report on the effectiveness of the Company’s internal control over financial reporting. In connection with the preparation of its consolidated financial statements for the year ended 31 December 2023, Sibanye-Stillwater identified a material weakness in its internal control over financial reporting due to design and operating deficiencies which resulted from insufficient evidence of management review and performance of control procedures, including the level of precision in the execution of controls and procedures to ascertain completeness and accuracy of information produced by the company (IPC). These deficiencies impacted cash and cash equivalents in the South African region and platinum group metals inventory in process at the smelter at Western Platinum Proprietary Limited and Stillwater Mining Company.
Management has initiated remedial measures to further enhance its processes and controls over financial reporting and is actively engaged to formulate a comprehensive plan for remediation of the material weakness. This plan may include the development of review procedures over IPC, enhancing the precision of management review documentation and designing, implementing and maintaining appropriate IT general controls. The material weakness will not be considered remediated until the remediation plan has been fully implemented and there has been appropriate time for the management to conclude, through testing, that the controls are designed, implemented and operating effectively. Management will continue to monitor the effectiveness of the remedial measures in their future assessments of the effectiveness of internal control over financial reporting and disclosure controls and procedures, and will make necessary changes to the design of the remedial plan and take other actions that is deemed appropriate given the circumstances.
There can be no assurance, however, that the measures Sibanye-Stillwater has taken to date, and actions it may take in the future, will be sufficient to remediate the control deficiencies that led to the material weakness in its internal control over financial reporting, or prevent or avoid potential future material weaknesses. In addition, current controls and any new controls that Sibanye-Stillwater develops may become inadequate because of changes in conditions in its business.
Sibanye-Stillwater’s mining rights are subject to legislation, which could impose significant costs and burdens and which impose certain ownership requirements, the interpretation of which may be the subject of dispute
Sibanye-Stillwater’s right to own and exploit mineral deposits is governed by the laws and regulations of the jurisdictions in which the mineral properties are located. Sibanye-Stillwater’s mineral resources and mineral reserves are located in countries where mining rights could be suspended or cancelled should it breach its obligations in respect of the acquisition and exploitation of these rights.
In all of the countries where Sibanye-Stillwater operates, the formulation or implementation of governmental policies on certain issues may be unpredictable. This may include changes in laws relating to mineral rights and ownership of mining assets and the right to prospect and mine, and, in extreme cases, nationalisation, expropriation or nullification of existing rights, concessions, licences, permits, agreements and contracts.
Our operations in South Africa are subject to legislation regulating the exploitation of mineral resources through the granting of rights required to prospect and mine for minerals, which includes the Mineral and Petroleum Resources Development Act, 2002 (MPRDA) as well as Broad-Based Socio-Economic Empowerment Charter contemplated in section 100(2)(1) of the MPRDA designed to effect the entry and participation of historically disadvantaged South Africans (HDSAs) into the mining industry and increase their participation in the South African economy.
9
The MPRDA, requires, among other things, that mining companies submit SLPs to the DMRE, which set out their commitments relating to human resource development, labour planning and socio-economic development planning. In addition to significant reputational damage, companies that fail to comply with such commitments may be sanctioned, required to undertake remedial action and ultimately, may have their mining licences revoked.
South Africa’s changing black economic empowerment (BEE) policies may adversely affect Sibanye-Stillwater’s mining rights and its ability to conduct operations. Maintenance of mining rights is linked to compliance with various empowerment obligations, including the B-BBEE Charter for the South African Mining and Minerals Industry, 2018 (2018 Mining Charter) as read with the Implementation Guidelines for the 2018 Mining Charter (Implementation Guidelines). It is widely considered that the 2018 Mining Charter did not bring about the legal certainty in the South African mining industry that it sought to create. See – Environmental and Regulatory Matters – South Africa – Mining Rights. It is uncertain how the MPRDA will be applied and interpreted by the DMRE and the courts in the future, and what changes, if any, Sibanye-Stillwater will be required to make in order to comply with this legislation.
Any adjustment to the ownership structure of Sibanye-Stillwater’s mining assets in order to meet B-BBEE requirements could have a material adverse effect on the value of Sibanye-Stillwater’s securities. Further, Sibanye-Stillwater may in the future incur significant costs or have to issue additional shares as a result of changes in the interpretation of existing laws and guidelines or the imposition of new laws relating to HDSA ownership requirements, which may have a material adverse effect on Sibanye-Stillwater’s business, operating results and financial condition.
Under section 47 of the MPRDA, the DMRE Minister may suspend or cancel the existing mining rights or, under section 23(3) of the MPRDA, refuse to grant applications for new mining rights by mining companies, including Sibanye-Stillwater, should such holders of mining rights be deemed not to be in compliance with the requirements of the MPRDA as read with South Africa’s mining industry empowerment requirements. If the DMRE Minister were to determine that Sibanye-Stillwater is not in compliance with the requirements of the MPRDA and its empowerment requirements, Sibanye-Stillwater may be required to engage in remedial steps, including changes to management and actions that require shareholder approval.
If the DMRE were to determine that Sibanye-Stillwater is not in compliance with the MPRDA, for any reason, including HDSA ownership, Sibanye-Stillwater may challenge such a decision in court which may be costly and unsuccessful.
There is no guarantee that any steps Sibanye-Stillwater has already taken or might take in the future will ensure the retention of its existing mining rights, the successful renewal of its existing mining rights, the granting of applications for new mining rights or that the terms of renewals of its mining rights would not be significantly less favourable than the terms of its current mining rights. For example, in March 2021, Sibanye-Stillwater submitted an application for conversion of its mining right at Akanani prior to expiry of its converted prospecting right. However, the DMRE granted a prospecting right to a third-party applicant based on what Sibanye-Stillwater believes is an incorrect interpretation of the prevailing legislation and case law. In 2024, Sibanye-Stillwater referred the dispute to the High Court for review, however, the outcome of the dispute remains uncertain. Failure by Sibanye-Stillwater to comply with mineral rights legislation or to renew mining leases in any of the jurisdictions in which it operates may cause it to lose the right to mine, fail to acquire new rights to mine and may have a material adverse effect on Sibanye-Stillwater’s business, operating results and financial condition.
Title to Sibanye-Stillwater’s properties may be subject to challenge
Certain of Sibanye-Stillwater’s properties may be subject to the rights or the asserted rights of various occupants or claimants to land under restitution and other legislation, which could have an impact on Sibanye-Stillwater’s ability to develop or operate its mining interests. For example, in South Africa, the Extension of Security of Tenure Act (1997), the Restitution of Land Rights Act (1994) and the Prevention of Illegal Eviction from and Unlawful Occupation of Land Act (1998) and the Labour Tenants Act (1996) protect various rights to claim and/or occupy land, provided certain conditions and requirements are met. Such legislation is complex and sets out the requirements as to how landowners are to deal with certain rights. There is no assurance that Sibanye-Stillwater will be able to successfully predict when these landowner rights will be challenged, which could therefore negatively affect the business results of new or existing projects. Where consultation with occupants or claimants to land is statutorily or otherwise mandated, disputes may lead to reduced access to properties, delays in operations or financial loss and such disputes may be time-consuming and costly to resolve. For example, in 2018, Sibanye-Stillwater lodged an eviction application against certain former contractors of Aquarius Platinum Limited (Aquarius), who remained on the premises following a protracted labour dispute with Aquarius. Sibanye-Stillwater was initially unsuccessful in the Land Claims Court, and in 2018, the South African Supreme Court of Appeals ruled that termination notices under Section 8 of Extension of Security of Tenure Act, 1997 (ESTA) must be served on the occupants. In 2022, Section 8 and Section 9 notices were served, and Sibanye-Stillwater launched a new application in the Land Claims Court, which has yet to be set for a hearing.
Title to Sibanye-Stillwater’s properties, particularly undeveloped ones, may also be subject to challenge. Title review does not necessarily preclude third parties from contesting ownership. Sibanye-Stillwater’s US properties in Montana include a number of unpatented mining and mill site claims. The validity of unpatented mining claims on public lands is often uncertain, and possessory rights of claimants may be subject to challenge.
In addition, Sibanye-Stillwater pays annual maintenance fees and has obtained mineral title reports and legal opinions for some of the unpatented mining claims or mill sites making up portions of its US properties, in accordance with applicable laws and what Sibanye-Stillwater believes is standard industry practice. However, Sibanye-Stillwater cannot be certain that applicable laws will not be changed nor that Sibanye-Stillwater’s possessory rights to any of its unpatented claims may not be deemed defective and challenged.
As a result, any such legislation could change the cost of holding unpatented mining claims and could significantly affect Sibanye-Stillwater’s ability to develop ore reserves located on unpatented mining claims. All of the foregoing could adversely affect the economic and financial viability of future mining operations at such mines.
If Sibanye-Stillwater loses senior or regional management or is unable to hire and/or retain sufficient technically skilled employees or sufficient HDSA representation in management positions in South Africa, Sibanye-Stillwater’s business may be materially adversely affected
10
Sibanye-Stillwater’s ability to operate or expand effectively depends largely on the experience, skills and performance of its senior and regional management teams and technically skilled employees. However, the global mining industry, including Sibanye-Stillwater, continues to experience a shortage of qualified management and technically skilled employees. In particular, Sibanye-Stillwater has experienced a significant shortage of technically skilled employees and high turnover at its United States PGM operations, which affected productivity and unit costs in 2023.
Additionally, as a condition of Sibanye-Stillwater’s mining rights in South Africa, it must ensure sufficient HDSA participation in its management and core and critical skills and failure to do so could result in fines or the loss or suspension of its mining rights. See – Sibanye-Stillwater’s mining rights are subject to legislation, which could impose significant costs and burdens and which impose certain ownership requirements, the interpretation of which may be the subject of dispute. Sibanye-Stillwater is also legislatively required to take proactive steps to achieve an equitable representation of HDSAs at all occupational levels and to report on the extent to which its plan is being achieved. If Sibanye-Stillwater is unable to hire or retain appropriate management and technically skilled personnel or is unable to obtain sufficient HDSA representation in management positions, or if there are not sufficient succession plans in place, this could have a material adverse effect on Sibanye-Stillwater’s business, result in the imposition of fines and have a negative effect on production levels, operating results and financial position.
Further, Sibanye-Stillwater will be required to comply with sectoral targets to be set by the Minister of Employment and Labour, in terms of the Employment Equity Amendment Act (EEAA) once promulgated into effect. Failing to do so may result in it being fined and not being issued with a certificate of compliance with the EEAA.
Sibanye-Stillwater is subject to risks associated with litigation and regulatory proceedings
As with most large corporations, Sibanye-Stillwater is, from time to time, involved as a party in litigation, arbitration, regulatory proceedings and other disputes. Litigation, arbitration, regulatory proceedings and other types of disputes involve inherent uncertainties and, as a result, Sibanye-Stillwater faces risks associated with adverse judgments or outcomes in such cases. Even where Sibanye-Stillwater may ultimately prevail on the merits of any such dispute, Sibanye-Stillwater may face significant costs defending its rights, lose certain rights or benefits during the pendency of any such litigation, arbitration, regulatory proceeding or other dispute, or suffer negative publicity or reputational damage as a result of its involvement. Sibanye-Stillwater is currently engaged in a number of legal and regulatory proceedings, including as described in Annual Financial Report-Directors’ report-Litigation, the outcome of which remains uncertain. For example, in May 2022, Appian Capital Advisory (Appian) commenced proceedings in the High Court of England & Wales in relation to Sibanye-Stillwater’s decision to exercise its termination rights in respect of the proposed acquisition of two Brazilian mining assets owned by Appian. The trial has been set for June 2024 and Sibanye-Stillwater will vigorously defend its position. There can be no assurance as to the outcome of any litigation, arbitration, regulatory proceeding or other dispute, and the adverse determination of material litigation could have a materially adverse effect on Sibanye-Stillwater’s business, operating results and financial condition.
Sibanye-Stillwater’s financial flexibility could be constrained by South African Exchange Control Regulations
South Africa’s Exchange Control Regulations restrict the export of capital from South Africa. Transactions between South African residents (including companies) and non-residents (excluding residents of the Republic of Namibia and the Kingdoms of Lesotho and Eswatini, known collectively as the Common Monetary Area (CMA)) are subject to exchange controls enforced by the South African Reserve Bank (SARB). While South African exchange controls have been relaxed in recent years, South African companies remain subject to restrictions on their ability to deploy capital outside of the CMA. As a result, Sibanye-Stillwater’s ability to raise and deploy capital outside the CMA is restricted. These restrictions could hinder Sibanye-Stillwater’s financial and strategic flexibility, particularly its ability to borrow funds from non-South African sources, including the repayment of such borrowings and, in some cases, its ability to guarantee the obligations of subsidiaries. These restrictions may affect the manner in which Sibanye-Stillwater finances its transactions outside South Africa and the geographic distribution of its debt.
Social, political and economic uncertainty and instability in Zimbabwe and targeted sanctions against certain Zimbabwean entities may affect future foreign investment in the country
One of Sibanye-Stillwater’s joint ventures, Mimosa, is a shallow underground PGM and base metal mining and processing operation located in Zimbabwe. The joint venture is held by Sibanye-Stillwater and Impala Platinum Holding Limited (Implats) on a 50:50 basis. Zimbabwe’s social, political and economic climate is currently highly uncertain, with the economy having been in decline for many years.
Zimbabwe as well as certain Zimbabwean nationals, have also been the subject of targeted sanctions by the United States, EU and the United Kingdom. The sanctions are limited in scope, targeting only designated individuals and entities, including certain members of the government, who are deemed to be undermining democratic institutions and processes in Zimbabwe.
Under the Minerals Marketing Corporation Act, 1983 (MMCZ Act), the Mineral Marketing Corporation of Zimbabwe (MMCZ) is the sole legal exporter of all minerals mined in Zimbabwe and is entitled to a commission in relation to all sales, as an agent to the mining companies, which is stipulated by the MMCZ Act. The MMCZ is an entity specifically sanctioned by the US Office of Foreign Assets Control and listed on its Specially Designated Nationals list. Under the sanctions, MMCZ’s assets are blocked and US persons are prohibited from dealing with the entity. There is no requirement, legal or otherwise, for MMCZ to be involved in Mimosa’s operations or management, and Sibanye-Stillwater has no contractual or other relationship with MMCZ outside of the MMCZ Act requirements. Mimosa has historically paid a commission to MMCZ as required under the MMCZ Act (fiscal 2021: US$5 million paid), but recently Mimosa was provided with an exemption from having to comply with the MMCZ Act from 4 August 2021 until further notice. Although Mimosa has not made any payments to MMCZ since August 2021, there can be no guarantee that the existing exemption will not be revoked and that Mimosa will not be required to make such payments to the MMCZ in the future.
In 2020, the Zimbabwean Government introduced a 5% export tax on semi-processed platinum group metal concentrates to provide an incentive for the development of processing facilities in Zimbabwe. Subsequently the tax was deferred until January 2024. A consortium of platinum miners, including Mimosa, supported by the Zimbabwe’s Chamber of Mines, have requested a further deferment until 2025,
11
pending the completion of smelters and the refurbishment of a refinery. Further, the Zimbabwean Government have also recently introduced a 7% royalty on platinum group metals, which the consortium has appealed to reduce to around 3%, with the royalty reviewed in line with movements in platinum prices, up to a maximum of 5%. It is uncertain if the Zimbabwe Government will grant the further deferment until 2025 or reduce the royalty on the basis appealed for and if both requests are not granted, they may adversely impact on the financial viability of projects in Zimbabwe.
Continued economic and political uncertainty in Zimbabwe and targeted sanctions against certain Zimbabwean entities may affect future foreign investment in the country and may lead to the imposition of further exchange controls, restrictions on the ownership of Sibanye-Stillwater’s assets and its ability to raise funds for or operate its business and export minerals and metals from Zimbabwe. Should such events occur, they may have an adverse effect on Sibanye-Stillwater’s business and operations in Zimbabwe as well as its financial condition.
Risks Related to Production Delivery from Operations
Energy shortages, load curtailment (including the risk of a total blackout) and usage constraints may force Sibanye-Stillwater to reduce or halt operations
In recent years, major geopolitical events have significantly impacted the availability of energy sources globally. As a result of the ongoing war in Ukraine, embargoes were placed on Russian gas and European countries sought to reduce their reliance on Russian energy supplies. This in turn led to increased volatility in global energy costs across oil and gas, increased commodity prices and demand for renewable energy components and, in certain jurisdictions, risk of energy supply constraints. While Sibanye-Stillwater has implemented alternative and emergency power supplies, there is no guarantee they will be sufficient to prevent material production losses in the future.
In South Africa, Sibanye-Stillwater’s operations depend on electrical power generated by the South African state utility, Eskom, which generates and supplies the bulk of electricity in the South African market. Electricity supply in South Africa has been constrained over the past decade as a result of various factors, including poor management, adverse weather events, civil unrest, continued poor generation performance and reliability, diesel shortages and the slow connection of new generation capacity and regulatory hurdles in relation to the generation of electricity by independent power producers. These supply constraints have led to the emergency reduction of national electricity demand through the implementation of load shedding and load curtailment.
Under load curtailment, Sibanye-Stillwater’s South African operations are required to reduce power demand which can result in production losses. In 2023, Sibanye-Stillwater lost 26,000 ounces of platinum group metals (PGMs), as a result of higher and longer power curtailments imposed by Eskom. In 2023, the levels and duration of load curtailments hit record highs, affecting approximately 1.4% of total production output at Sibanye-Stillwater’s South African PGM operations. While the South African Gold operations were able to mitigate production losses, it incurred higher operational costs through the use of diesel generators to partially offset load curtailment imposed by Eskom. There can be no guarantee that Sibanye-Stillwater will be able to comply with future curtailment requirements without incurring material production losses in the future.
Eskom’s inability to fully meet the country’s demand has led, and may continue to lead, to further load shedding, load curtailment, rolling blackouts and possibly a total blackout due to a collapse of the grid. There is no assurance that Eskom’s efforts to protect the national electricity grid will prevent a partial or complete national blackout, which would have a material adverse effect on Sibanye-Stillwater’s business, operations, operating results and financial condition, including permanent loss or damage to mining infrastructure due to flooding.
In addition to supply constraints, severe weather events and labour unrest in South Africa has disrupted, and may in the future disrupt, the supply of coal to power stations operated by Eskom or may incapacitate the power stations directly, resulting in curtailed supply. For example, in November 2023, a heat wave across South Africa resulted in higher power station efficiency losses and higher national demand. This, combined with unplanned power station outages, resulted in significant national load shedding and load curtailment at Sibanye-Stillwater’s SA operations. Eskom may also face regulatory enforcement action that may disrupt its supply of electricity. For example, in 2021, Eskom received unfavourable decisions from the Department of Forestry, Fisheries and the Environment (DFFE) for multiple power generation facilities in response to its applications for the postponement of air quality Minimum Emission Standards set out in terms of the Air Quality Act. If implemented, the decisions will result in Eskom having to shut down 16,000MW of installed coal fired capacity. Eskom has appealed against the adverse decision and the issue remains unresolved. Energy shortages may also occur as a result of copper cable theft (and other non-ferrous metals) at its SA operations. For example, theft of metal resulted in the collapse of a pylon in February 2022, which cut power supply to Sibanye-Stillwater’s Cooke shafts. See also – Theft of gold, PGM and production inputs, cable theft, as well as illegal mining, may occur on some of Sibanye-Stillwater’s properties. These activities are difficult to control, can disrupt Sibanye-Stillwater’s business and can expose Sibanye-Stillwater to liability.
In addition, power fluctuations and/or energy constraints leading to curtailment have occurred and do occur at Sibanye-Stillwater’s operations in Europe, the United States and Zimbabwe, which can cause operational outages, production losses and/or additional production costs.
Further disruptions or constraints in electricity or other energy supply to Sibanye-Stillwater’s operations could have a material adverse effect on its business, operating results and financial condition.
Economic, political or social factors affecting the regions where Sibanye-Stillwater operates may have a material adverse effect on Sibanye-Stillwater’s operations and profits
Sibanye-Stillwater principal operations are in southern Africa and the United States, with its domicile and a majority of its operations located within South Africa. Changes to or increased instability in the economic, political or social environment in these regions, particularly in South Africa or surrounding countries, could create uncertainty, which discourages investment in the region and may affect an investment in Sibanye-Stillwater. In addition, socio-political instability and unrest may also disrupt Sibanye-Stillwater’s business and operations, compromise safety and security, increase costs, affect employee morale, impact Sibanye-Stillwater’s ability to deliver on its operational plans, create uncertainty regarding mining licences and cause reputational damage, any of which could have a material adverse effect on Sibanye-
12
Stillwater’s business, operating results and financial condition. The impacts of such social factors may be more acute in the mining sector. For example, in the context of increased inflation and unemployment, there has been a rise in attempts to use illegal methods, including extortion, threats and force, to obtain lucrative procurement contracts.
Civil unrest, high levels of unemployment, particularly among the youth, and a shortage of critical skills in South Africa, despite increased government expenditure on education and training, remain issues and deterrents to foreign investment. The volatile and uncertain labour environment, which severely impacts on the local economy and investor confidence, has also been a factor in the country’s downgrade in national credit ratings to non-investment grade, making investment more expensive and difficult to secure. See risk factors entitled – Sibanye-Stillwater’s operations and profits have been and may be adversely affected by labour unrest and union activity and – The continued status of South Africa’s credit rating as non-investment grade, as well as the greylisting of South Africa by the Financial Action Task Force, may have an adverse effect on Sibanye-Stillwater’s ability to secure financing or could result in any such financing being available only at greater cost. This may restrict Sibanye-Stillwater’s future access to international financing and could have a material adverse effect on Sibanye-Stillwater’s business, operating results and financial condition.
In 2019, the President of South Africa announced that South Africa will proceed with nationalising the SARB, and this position was reaffirmed by the ANC at its 2022 National Elective Conference. While the SARB’s independence is constitutionally guaranteed, any economic or political instability caused by a nationalisation process, may create complications relating to the movement of funds into or out of South Africa and impact the general business environment in South Africa, including for companies such as Sibanye-Stillwater. Any such negative impact on the South African economy may adversely affect Sibanye-Stillwater’s business, operating results and financial condition.
While the South African government has stated that it does not intend to nationalise mining assets or mining companies, certain political parties favour a policy of nationalisation. See – Sibanye-Stillwater’s operations and financial condition could also be adversely affected by policies and legislation related to greater state intervention in the mining and potentially the expropriation of mining assets without compensation. Any potential, or actual proceedings, to nationalise any of Sibanye-Stillwater’s assets could halt or curtail operations, resulting in a material adverse effect on Sibanye-Stillwater’s business, operating results and financial condition and could cause the value of Sibanye-Stillwater’s securities to decline rapidly and dramatically, possibly causing investors to lose the entirety of their respective investments.
In addition, economic and political instability in regions outside jurisdictions where Sibanye-Stillwater operates, including in surrounding countries or geopolitical events, such as ongoing war in Ukraine, may result in unavoidable uncertainties and events that could negatively affect costs of business or availability of supplies, cause volatility in currency exchange rates, commodity prices, interest rates and worldwide political, regulatory, economic or market conditions and contribute to instability in political institutions, regulatory agencies and financial markets any of which could have a material adverse effect on Sibanye-Stillwater’s business, operating results and financial condition.
Due to the mature infrastructure at Sibanye-Stillwater’s mining operations, unplanned breakdowns, statutory mandated modifications and stoppages may result in production delays, increased costs and industrial accidents
Nearly all of Sibanye-Stillwater’s operating shafts and processing plants at its gold and PGM operations, as well as the recently acquired Sandouville hydrometallurgical nickel processing facility and Century retreatment operations, are relatively mature. Ageing infrastructure and recurring maintenance issues also significantly impact Sibanye-Stillwater’s Sandouville nickel processing facility. Maintaining this infrastructure requires skilled people, capital allocation, management and regular, planned maintenance. Once a shaft or a processing plant has reached the end of its intended lifespan or needs modification to comply with the applicable regulatory standards and to continue operating reliably, more than normal maintenance, care and remediation is required. In addition, the breakdown of certain critical infrastructure and components, including as a result of operating errors, may temporarily halt production. Although Sibanye-Stillwater has comprehensive inspection and maintenance strategies in place, incidents resulting in production delays, increased costs or industrial accidents may occur. There is also a risk that delays in procuring critical spares for major repairs may result in disruptions to production. Such incidents may have a material adverse effect on Sibanye-Stillwater’s business, operating results and financial condition.
Sibanye-Stillwater’s operations and profits have been and may be adversely affected by labour unrest and union activity
Sibanye-Stillwater’s workforce is unionised across all its operations, with a total of approximately 88% unionised employees (excluding DRDGOLD, Keliber, Sandouville and Century) as of 31 December 2023. Organised labour dynamics in the mining sector, particularly in South Africa, are volatile and uncertain and, as such, they have had, and may in the future have, a material adverse impact on Sibanye-Stillwater’s operations, production and financial performance. Union activity and labour unrest in South Africa has resulted in more frequent industrial disputes and extended negotiations that have, along with other factors, negatively affected South Africa’s sovereign debt rating and subsequently the credit ratings of the country’s leading mining companies. Sibanye-Stillwater has in the past, and may in future, experience strikes and work stoppages, including both protected and unprotected industrial action. For example, in March 2022, AMCU and NUM announced a strike action at Sibanye-Stillwater’s gold mines that commenced on 9 March 2022 and concluded on 13 June 2022, during which time the vast majority of gold production ceased. Wage negotiations at the SA gold operations will commence in May 2024 and are expected to be concluded by July 2024. Wage disputes, and any resulting industrial actions, are difficult to control and can lead to significant disruptions at Sibanye-Stillwater’s operations, expose it to liability and materially and adversely affect its business, operating results and financial condition. In addition, rivalries between unions, such as AMCU and the NUM, may also destabilise labour relations in the mining sector. For example, in October 2023, sit-in protests were initiated by workers affiliated with an unrecognised rival union at two gold mines in South Africa (neither of which was operated by Sibanye-Stillwater) resulting in hundreds of workers being trapped underground for several days. Although such incidents are not related to Sibanye-Stillwater’s normal operations, they may impact ongoing labour relations at Sibanye-Stillwater and in South Africa, in general.
From time to time, Sibanye-Stillwater undertakes Section 189A of the Labour Relations Act, 1995 (LRA) processes (Section 189A Processes), which may result in retrenchment of employees and may impact production levels at affected operations. Factors that influence the decision to undertake such Section 189A Processes include, among other things, the cost structure of an operation, commodity prices and currency exchange rates. A low rand commodity price environment may increase the likelihood that Sibanye-Stillwater will determine that undertaking Section 189A Processes at one or more of its operations is advisable. For example, in November 2022, Sibanye-Stillwater entered
13
into consultation regarding the possible restructuring of its gold operations following ongoing losses experienced at the Beatrix 4 shaft and the impact of depleting mineral reserves to the Kloof 1 plant, resulting in the internal transfer of 1,136 employees to other operations in the SA region, with 552 employees being granted voluntary separation or early retirement packages. In September 2023, Sibanye-Stillwater announced a Section 189A consultation regarding a further restructuring of its South African gold operations pursuant to ongoing losses over an extended period and operational constraints at the Kloof 4 shaft, which resulted in the internal transfer of 1,057 employees to other operations in the SA region, 550 employees being granted voluntary separation or early retirement packages and the retrenchment of 575 employees. Moreover, in October 2023, Sibanye-Stillwater further notified stakeholders that it was entering a Section 189A consultation regarding the possible restructuring at four shafts of its South African PGM operations, resulting in the internal transfer of 351 employees, 1,281 employees being granted voluntary separation or early retirement packages and the retrenchment of 47 employees.
Section 189A processes initiated in connection with Sibanye-Stillwater’s business plan may also coincide with acquisitions or business combinations it pursues. Any future Section 189A Process may lead to labour unrest, reduced production levels and reputational harm to Sibanye-Stillwater, which could have a material adverse effect on Sibanye-Stillwater’s business, operating results and financial condition. There is no guarantee that any such Section 189A Process will provide the cost savings or other benefits anticipated by management whether due to labour unrest, reduced production or other factors.
In the United States, Sibanye-Stillwater’s employees located at the Sibanye-Stillwater United States PGM operations and the Metallurgical Processing facilities are covered by a five-year collective bargaining agreement with the United Steel Workers Local 11-001 (USW Local 11-0001) expiring in July 2024. Sibanye-Stillwater is subject to a risk of strikes and other labour disputes at its US operations, and its ability to alter labour costs is restricted by the fact that unionised employees are party to collective bargaining agreements.
In France, it is mandatory to hold an annual meeting with employees covering compensation and working hours, through a process called “Négociation Annuelle Obligatoire” (NAO). The NAO ends with either a signed agreement or disagreement, which may in turn result in industrial action. In France, Sibanye-Stillwater has also experienced business interruptions as a result of nationwide industrial action, such as in the first half of 2023, when widespread strikes contributed to downtime of 28 production days at Sandouville.
In the event that further industrial relations-related interruptions were to occur at any of Sibanye-Stillwater’s operations, other mines’ operations or in other industries that impact its operations, or that increased employment-related costs were to occur due to union or employee activity, such as wage negotiations, these may have a material adverse effect on its business, production levels, production targets, results of operations, financial condition, reputation and future prospects. In addition, lower levels of mining activity can have a longer-term impact on production levels and operating costs, which may affect operating life. Mining conditions can deteriorate during extended periods without production and Sibanye-Stillwater will not recommence mining until health and safety conditions are considered appropriate to do so.
Because Sibanye-Stillwater’s operations are regionally concentrated, disruptions in these regions could have a material adverse impact on the operations
Sibanye-Stillwater’s South African PGM operations (Marikana, Rustenburg, Kroondal and Platinum Mile) are located between the two towns of Rustenburg and Brits and the majority of its gold mining operations are located in the north western and south western margins of the Witwatersrand Basin in South Africa. While Sibanye-Stillwater has recently diversified its operations into a number of new jurisdictions, including Finland, France and Australia and new metals, there is no guarantee that this diversification will reduce its reliance on existing production. As a result, any adverse economic, political or social conditions affecting these regions or surrounding regions, as well as natural disasters or coordinated strikes or other work stoppages, could have a material adverse effect on Sibanye-Stillwater’s business, operating results and financial condition.
HIV/AIDS, TB and other contagious diseases, such as global pandemics, pose risks to Sibanye-Stillwater in terms of lost productivity and increased costs
The prevalence of HIV/AIDS in South Africa poses risks to Sibanye-Stillwater in terms of potentially reduced productivity and increased medical and other costs. Compounding this are the concomitant infections, such as TB, that can accompany HIV illness, particularly during the later stages, and cause additional healthcare-related costs. Further, certain underlying health conditions including conditions which compromise the immune system, such as HIV/AIDS, have worsened the outcomes among the individuals infected by contagious diseases (such as COVID-19).
Sibanye-Stillwater’s operations have been and may in future be impacted by global pandemics. For example, a resurgence of COVID-19 could result in serious illness (including incapacity) or death, or quarantine of Sibanye-Stillwater’s employees and contractors. Further, employee or contractor absences due to such illnesses could lead to labour shortages or instability and disruptions to Sibanye-Stillwater’s production (including potential temporary cessation) and increased operational costs. Any actions taken by governments or regulators in response to such outbreaks, including travel-related restrictions, could result in the inability of Sibanye-Stillwater’s suppliers to deliver components or raw materials on a timely basis and may limit or prevent Sibanye-Stillwater’s management and employees and other important third-parties from travelling to, or visiting, Sibanye-Stillwater’s operations.
Additionally, the spread of contagious diseases such as respiratory diseases may be exacerbated by communal housing and close quarters. The spread of such diseases could impact employees’ productivity, treatment costs and, therefore, operational costs.
If there is a significant increase in the incidence of HIV/AIDS infection and related diseases, or global pandemics, such as COVID-19, among the workforce may have a material adverse effect on Sibanye-Stillwater’s business, operating results and financial condition.
Sibanye-Stillwater’s mineral reserves and mineral resources are estimates based on a number of assumptions, which, if changed, may require Sibanye-Stillwater to lower estimated mineral reserves
14
The mineral reserves and mineral resources of Sibanye-Stillwater are estimates based on assumptions regarding, among other things, Sibanye-Stillwater’s costs, expenditures, commodity prices, currency exchange rates, metallurgical and mining recovery assumptions, which may prove inaccurate due to a number of factors, many of which are beyond its control. Mineral reserves are classified as proved or probable, to reflect the level of confidence in both the underlying techno-economic and mineral resources. The mineral resource estimates that feed into the mineral reserves depend on statistical inferences drawn from drilling and face samples, which may prove to be unreliable or unrepresentative due to the inherent variability of an orebody. Although mineral resource classifications take cognisance of the inherent uncertainty, sometimes unexpected geologic conditions, such as faulting, dykes, “potholes” or poor ground conditions can be encountered as mining proceeds. The effect of these can result in additional area loss, increased costs and additional dilution of ore grade during mining operations. In the event that Sibanye-Stillwater adversely revises any of the techno-economic assumptions that underlie its mineral reserves, this may result in a revision of mining plans and/or mineral reserves.
In addition, commodity price assumptions, including the market price for gold, PGMs, nickel, zinc and lithium, are subject to considerable uncertainty. Declines in the market prices of such metals may render mineral reserves and mineral resources containing relatively lower grades of mineralisation uneconomic to exploit, and Sibanye-Stillwater may be required to reduce mineral reserve and mineral resource estimates, discontinue development at one or more of its properties or write down assets as impaired.
Any downward revision in Sibanye-Stillwater’s mineral reserves and mineral resources and, over the longer term, any failure to replace reserve ounces as they are mined may lead to an impairment or write down of assets, and may have a material adverse effect on its business, operating results, life of operations and financial condition.
Risks Related to Earnings Delivery
Changes in the market price for gold, PGMs, nickel, zinc and lithium and may affect the profitability of Sibanye-Stillwater’s major capital projects, recycling, mining and refining operations and the cash flows generated by those operations
Sibanye-Stillwater’s revenue from its mining and other operations is primarily derived from the sale of the commodities that it produces. Sibanye-Stillwater does not generally enter into commodity derivatives or other hedging arrangements in order to establish a price in advance of the sale of its commodities, however it has in the past, and may in the future, utilise commodity derivative or other hedging products to protect cash flows at times of significant capital expenditure, financing projects or to safeguard the viability of higher cost operations. As a result, it is generally exposed to changes in the gold and PGM prices, which could lead to reduced revenue should the gold or PGM basket price decline. For example, during the year ended 31 December 2023, the gold price fluctuated between US$1,804/oz and US$2,135/oz, the platinum price fluctuated between US$839/oz and US$1,132/oz, the palladium price fluctuated between US$920/oz and US$1,840/oz and the rhodium price fluctuated between US$4,000/oz and US$12,400/oz. In its US recycling business, Sibanye-Stillwater regularly enters into fixed forward sales contracts for metal produced from catalyst recycling, normally making these commitments at the time the catalyst material is purchased to achieve price matching between process feedstock and product. For Sibanye-Stillwater’s fixed forward sales related to recycling of catalysts, Sibanye-Stillwater is subject to the customers’ compliance with the terms of the agreements, their ability to terminate or suspend the agreements and their willingness and ability to pay.
The market price for gold has historically been volatile and is affected by numerous factors over which Sibanye-Stillwater has no control, such as general supply and demand, speculative trading activity and global economic drivers. For example, gold has historically been used as a hedge against unstable or lower economic performance, thus improved economic performance, particularly in the United States, may have a negative impact on the price for gold.
The market price for PGMs has been similarly volatile, and in recent years, has declined precipitously. The historic volatility continued into 2023, primarily as a result of global macroeconomic conditions. As of 31 December 2023, the prices of gold, platinum, palladium and rhodium prices were US$2,062/oz, US$987/oz, US$1,098/oz and US$4,425/oz, respectively.
Should the gold or PGM price decline below Sibanye-Stillwater’s production costs, it may experience losses and, should this situation remain for an extended period, Sibanye-Stillwater may be forced to curtail or suspend some or all of its projects, operations and/or reduce operational capital expenditures. Sibanye-Stillwater might not be able to recover any losses incurred during, or after, such events. For example, in 2023, Sibanye-Stillwater initiated 189A restructuring processes at four shafts of the South African PGM operations, partly attributable to a decline in PGM prices making two of the shafts unprofitable, and two others reaching end of life,
A sustained period of significant gold or PGM price volatility may also adversely affect Sibanye-Stillwater’s ability to undertake new capital projects or to make other long-term strategic decisions.
In addition, changes in demand drivers for PGMs may cause the prices of PGMs to fall over the short or long-term. For example, PGM prices are linked to demand for catalytic converters in automobiles, among other things. In 2023, continued macroeconomic uncertainty, together with recessionary concerns and higher interest rates, led to decreased consumer demand for new vehicles, with vehicles remaining in service for extended periods and fewer vehicles being scrapped. Such decreased demand contributed to a decline in PGM prices during the first half of 2023. Any economic downturn or other event that reduces the sale of automobiles will also likely impact the price of PGMs. In addition, high PGM prices may cause demand destruction, which would cause the price of such PGMs to fall. In addition, the increase in the number of electric cars in the future may reduce the price for PGMs by reducing demand for catalytic converters (which require PGMs) used in gasoline and diesel powered vehicles.
Sibanye-Stillwater is also impacted by fluctuations in other core metals and by-products. For example, in recent years the market prices for nickel, zinc and lithium have fluctuated widely. During the year ended 31 December 2023, the price of nickel, zinc and lithium hydroxide monohydrate fluctuated between US$15,721/tonne and US$30,958/tonne, US$2,045/tonne and US$2,885/tonne and US$12,744/tonne and US$74,450/tonne, respectively. Such fluctuations may affect the profitability of the Group’s operations and the viability of its major capital investment projects.
Any of the above could have a material adverse effect on Sibanye-Stillwater’s business, operating results and financial condition.
15
Because gold and PGMs are generally sold in US dollars, while the majority of Sibanye-Stillwater’s gold production and a substantial amount of Sibanye-Stillwater’s PGM production costs are denominated in rand, Sibanye-Stillwater’s operating results and financial condition will be materially affected if there is a material change in the value of the rand
Gold and PGMs are principally sold throughout the world in US dollars, but Sibanye-Stillwater’s costs of production at its operations in South Africa are primarily incurred in rand. Recent volatility in the rand has made Sibanye-Stillwater’s costs and results of operations less predictable than when currency exchange rates are more stable. On 27 March 2020, following Moody’s downgrade of South Africa’s sovereign credit rating to non-investment grade, the value of the rand devalued to R17.62/US$, followed by a gradual strengthening to R14.69/US$ as at 31 December 2020. Since the end of 2020, the rand has continued to weaken against the dollar, falling to R15.94/US$ as at 31 December 2021 and R17.03/US$ as at 31 December 2022. During 2023, the rand weakened by 9% to R18.57 as at 31 December 2023. See – The continued status of South Africa’s credit rating as non-investment grade, as well as the greylisting of South Africa by the Financial Action Task Force, may have an adverse effect on Sibanye-Stillwater’s ability to secure financing or could result in any such financing being available only at greater cost. Any significant appreciation of the rand against the US dollar would increase Sibanye-Stillwater’s operating costs in US dollar terms, and reduce revenue in rand terms, which could materially adversely affect its operating results and financial condition from the South African operations. Conversely, a weakening of the rand may result in higher inflation in South Africa, which would increase the prices Sibanye-Stillwater pays for products and services. In light of these factors and the likely impact on cash flow, management regularly re-evaluates its current growth capital expenditure plans. Certain projects may be deferred or placed on care and maintenance until confidence that commodity prices and/or currency exchange rate volatility supports the financial viability of the project. Should a strong rand/US dollar exchange rate persist without a corresponding gain in commodity prices, Sibanye-Stillwater may consider adjusting mine plans, reducing capital expenditure or selling assets and, if necessary, options to increase funding flexibility. Also see – Sibanye-Stillwater has a large amount of indebtedness. Failure to comply with its debt covenants or difficulties in obtaining necessary financing could have a material adverse effect on its business, operating results and financial condition. All of the above could have a material adverse effect on Sibanye-Stillwater’s business, operating results and financial condition.
Sibanye-Stillwater has a large amount of indebtedness. Failure to comply with its debt covenants or difficulties in obtaining necessary financing could have a material adverse effect on its business, operating results and financial condition
As at 31 December 2023, Sibanye-Stillwater had R37.4 billion (US$2.0 billion) principal amount of indebtedness outstanding (excluding the Burnstone Debt), in addition to committed undrawn debt facilities of R20.8 billion (US$1.1 billion). Sibanye-Stillwater’s borrowings and credit facilities contain financial and/or other covenants and restrictions. Such covenants may include restrictions on Sibanye-Stillwater incurring additional financial indebtedness and obligations to maintain certain financial covenant ratios for as long as any amount is outstanding under such facilities. Specifically, Sibanye-Stillwater’s borrowing facilities permit a maximum leverage ratio (net cash/debt to adjusted EBITDA) of 2.5:1, calculated on a quarterly basis. The significant decline in commodity prices over the course of 2023 coupled with operational and production challenges resulted in a deterioration of the leverage ratio from a net cash to adjusted EBITDA of 0.14:1 as at 31 December 2022 to a net debt to adjusted EBITDA ratio of 0.58:1 at 31 December 2023. Sibanye-Stillwater’s overall liquidity position, including its ability to maintain its leverage ratio, may be impacted by a further decline in commodity prices, prolonged period at current depressed prices or a decline in production, including as a result of industrial action, shaft incidents, natural events and other operational incidents that constrain production at Sibanye-Stillwater’s operations. See – Depressed commodity prices may impact Sibanye-Stillwater’s ability to implement its business strategy, fund necessary and strategic capital expenditures and obtain financing and -Sibanye-Stillwater’s operations and profits have been and may be adversely affected by labour unrest and union activity.
Sibanye-Stillwater intends to incur additional indebtedness to develop its projects in furtherance of its green metals strategy. This includes the €588 million (US$616 million; R10,780 million) investment to advance the Keliber lithium project approved by the Board in 2022, of which €388 million (US$406 million or R7,105 million) is expected to be financed through debt. In addition to targeted borrowings to fund its green metals strategy, in the near-term, Sibanye-Stillwater expects to manage its liquidity needs from cash generated by its operations, cash on hand, the committed and unutilised debt facilities, as well as additional funding mechanisms. Sibanye-Stillwater, if necessary, in order to manage its covenants, may also consider options to increase funding flexibility which may include, among others, streaming facilities, prepayment facilities, facility restructuring, or in the event that other options are not deemed preferable by the Board, an equity capital raise. However, there can be no assurance that funding will be available to Sibanye-Stillwater on acceptable terms, if at all, and that any of the measures which Sibanye-Stillwater may undertake to increase liquidity or actively manage its covenants would be successful.
If Sibanye-Stillwater’s cost of debt were to increase or if it were to encounter other difficulties in obtaining financing, its sources of funding may not match its financing needs, which could have a material adverse effect on Sibanye-Stillwater’s business, operating results and financial condition.
Depressed commodity prices may impact Sibanye-Stillwater’s ability to implement its business strategy, fund capital expenditures and obtain financing
Commodity prices significantly influence the Group’s revenue, profitability, access to capital and future rate of growth. Lower commodity prices may reduce Sibanye-Stillwater’s cash flows and borrowing ability and make it more difficult to execute its business strategy, including strategic acquisitions, capital intensive projects and achieve sustainability plans and targets. For example, in 2023, continued macroeconomic uncertainty, together with recessionary concerns and higher interest rates, led to a marked decline in PGM prices. As a result of this decline in PGM prices, certain shafts of Sibanye-Stillwater’s South African and United States PGM operations have become unprofitable and the Group is undertaking targeted restructuring consultations in respect of such operations. A continued decline in PGM or other commodity prices impacting the Group’s revenue may cause the Group to suspend or restructure certain of its operations, reduce capital expenditure and materially impact its profitability and ability to execute its strategy.
Reduced commodity prices or prolonged lower commodity market conditions may also make it harder for Sibanye-Stillwater to allocate capital or obtain financing on satisfactory terms, which could impact its ability to develop future reserves and lead to a decline in Sibanye-Stillwater’s earnings potential. Lower long term commodity prices may also impact the economic viability of Sibanye-Stillwater’s mineral reserves, resulting in a reclassification or reduction in proven reserves and/or resources at affected operations. Any of the foregoing may
16
materially and adversely affect Sibanye-Stillwater’s future business, operating results, financial condition, as well as its operations, liquidity, or ability to finance planned capital expenditures.
The continued status of South Africa’s credit rating as non-investment grade, as well as the greylisting of South Africa by the Financial Action Task Force, may have an adverse effect on Sibanye-Stillwater’s ability to secure financing or could result in any such financing being available only at greater cost
On 1 April 2022, Moody’s revised South Africa’s sovereign credit rating to Ba2 with a stable outlook. On 9 March 2023, Standard & Poor’s downgraded its outlook to stable from positive, but reaffirmed South Africa’s sovereign credit rating of BB-, warning however that it could lower them if the government’s ongoing reforms to address the power crisis do not progress as planned. On 17 July 2023, Fitch Ratings affirmed South Africa’s sovereign credit rating of BB- and maintained a stable outlook.
The continued status of South Africa’s sovereign credit rating as non-investment grade by Standard & Poor’s, Moody’s or Fitch Ratings may impact the ability of the private sector to raise capital, making it more difficult for Sibanye-Stillwater to obtain external financing or could result in any such financing being available only at greater cost or on more restrictive terms than might otherwise be available. The recent downgrades of South Africa’s sovereign credit rating could also have a material adverse effect on the South African economy as many pension funds and other large investors are required by internal rules to sell bonds once two separate agencies rate them as non-investment grade. Additionally, in February 2023, South Africa was “greylisted” by the Financial Action Task Force, which subjects it to increased monitoring and may have a negative impact on South Africa’s financial growth and discourage foreign investment. Any such negative impact on the South African economy may adversely affect Sibanye-Stillwater’s business, operating results and financial condition.
Energy cost increases may adversely affect Sibanye-Stillwater’s results of operations
Sibanye-Stillwater’s mining operations in South Africa largely depend upon electrical power generated by the state-owned power supply utility, Eskom. Eskom, which supplied approximately 90-95% of the country’s electricity needs during 2023, has historically experienced financial difficulties that have been caused by several factors. Some factors include inadequate maintenance and replacement strategy of aging generation units, the inability for the national transmission grid is to accommodate new renewable energy generation, over expenditure on capital projects, under recovery of revenues from defaulting customers, high levels of indebtedness, inadequate maintenance and high primary energy costs. More recently, during certain periods of supply-constraint, Eskom has utilised significant amounts of diesel to run its gas turbines while concurrently losing electricity sales as a result of load shedding or curtailment, which has contributed to above inflation tariff applications. See – Energy shortages, load curtailment (including the risk of a total blackout) and usage constraints may force Sibanye-Stillwater to reduce or halt operations.
The electricity supply industry in South Africa, including Eskom tariffs, is regulated by the National Energy Regulator of South Africa (NERSA). Eskom tariffs are determined through a consultative multi-year price determination (MYPD) process, with recoveries of prudently incurred over-expenditure in prior years recoverable through supplementary levies under the regulatory clear account (RCA) mechanism. In January 2023, NERSA approved an 18.65% increase for 1 April 2023 and a 12.74% increase for 1 April 2024. These increases were informed by NERSA’s assessment of Eskom MYPD 5 application, historic RCA amounts and the South African government’s equity injection that was previously deducted from revenue and reinstated through a court order. In 2023, Eskom applied to NERSA for a R24 billion revenue and cost recovery from its customers through the MYPD RCA mechanism. The allowable amount has not yet been determined. Concurrently, both Eskom and NERSA have submitted separate papers requesting the restructuring of regulated electricity tariffs in South Africa, with a high degree of misalignment between the suggested frameworks.
Combined, these outcomes create uncertainty as to the tariff structure and rates that will ultimately be applicable to Sibanye-Stillwater, and in the event that existing conditions persist or are exacerbated, the electricity tariff will continue to increase significantly in coming years.
In February 2019, the President of South Africa announced the vertical unbundling of Eskom. While full state ownership will be maintained, the unbundling is expected to result in the separation of Eskom’s generation, transmission and distribution functions into separate entities, which may require legislative and/or policy reform. The unbundling is currently underway and the agreements related to the legal separation of the transmission function were concluded in December 2021. It is expected that the conditions precedent to these agreements will be fulfilled in 2024. The agreements related to the legal separation of the distribution function are expected to be concluded in 2024, with a further 12 to 18 months expected for the fulfilment of the conditions precedent. Poor reliability of the supply of electricity and instability in prices through the unbundling process is expected to continue. Should Sibanye-Stillwater experience further power tariff increases, its business operating results and financial condition may be adversely impacted.
In the United States, changes in the US energy market, including a potential movement away from coal power, may increase the operating cost of Sibanye-Stillwater’s US operations, which could have a material adverse effect on its business, operating results and financial condition.
Ongoing war in Ukraine continued to significantly impact the availability of energy sources globally in 2023. As a result of the war, embargoes have been placed on Russian gas and European countries have sought to reduce their reliance on Russian energy supplies. This in turn led to increased volatility in global energy costs across oil and gas, increased commodity prices and demand for renewable energy components and, in certain jurisdictions, risk of energy supply constraints. This has impacted the availability and cost of energy for Sibanye-Stillwater’s operations and projects in Europe and elsewhere. For example, significant increases in energy costs contributed to losses at Sandouville in fiscal year 2022 and 2023. Further disruptions to global energy value chains may affect operation continuity and increase the operating cost of Sibanye-Stillwater’s European operations, which could have a material adverse effect on its business, operating results and financial condition.
If any of Sibanye-Stillwater’s operations do not perform in line with expectations, Sibanye-Stillwater may be required to write down the carrying value of its long-term assets, which could affect Sibanye-Stillwater’s profitability and financial condition
17
Under IFRS Accounting Standards, Sibanye-Stillwater is required to annually test for impairment the carrying value of long-term assets, or cash-generating units, including allocated goodwill. The Group must perform this test more frequently if it has reason to believe that the expected recoverable amount of long-term assets, or cash-generating units with allocated goodwill, may be lower than the carrying value (which are indications for impairment). If the results of operations and cash flows generated by Sibanye-Stillwater’s gold, PGM, nickel and lithium operations are not in line with its expectations, it may be required to write down the carrying value of its assets or investment to the recoverable amount. Any write down could materially affect Sibanye-Stillwater’s profits and financial condition.
Our business is subject to high fixed costs which may impact its profitability
The mining industry, particularly the gold and PGM mining industry, is characterised by high fixed costs. The majority of operating costs of each mining operation is fixed and does not vary significantly with the production rate and, therefore, a relatively small change in productivity as a result of, for example, strikes or other work stoppages could have a disproportionate effect on operating and financial results. Costs are generally more stable than revenues, the latter being driven by commodity price and currency exchange rates, which can be volatile. Accordingly, changes in revenue due to commodity price or currency exchange rate movements could have a material adverse effect on Sibanye-Stillwater’s growth or financial performance. Above-inflation increases in fixed costs such as labour or electricity costs may cause parts of Sibanye-Stillwater’s resources to become uneconomical to mine and lead to the closure of marginal shafts or other areas at its operations. This would impact on planned production levels and declared reserves and could have a material adverse effect on Sibanye-Stillwater’s business, operating results and financial condition. See – Annual Financial Report – Management’s discussion and analysis of the financial statements – Factors affecting Sibanye-Stillwater’s performance – Costs.
Theft of gold, PGM and production inputs, cable theft, as well as illegal mining, may occur on some of Sibanye-Stillwater’s properties. These activities are difficult to control, can disrupt Sibanye-Stillwater’s business and can expose Sibanye-Stillwater to liability
Sibanye-Stillwater has experienced and will continue to experience illegal mining activities and theft of precious metal bearing materials (which may be by employees or third parties) at its South African-based properties. The South African government has called for increased security at all mines following an explosion that resulted in several fatalities and trapped illegal miners underground at a mine in Middleburg, South Africa, that is not associated with Sibanye-Stillwater. Incidences of illegal mining and theft remain concerning as a result of deteriorating social and economic conditions. As a result, in 2023, Sibanye-Stillwater experienced 459 incidents of illegal mining and assisting illegal miners at its underground operations (2022: 511), resulting in the arrests of 1,239 illegal miners and 483 employees for assisting illegal mining activities. During the same period, there has been 623 incidents of illegal mining at Sibanye-Stillwater’s surface operations (2022: 811), which resulted in the arrests of 283 illegal miners.
Sibanye-Stillwater has also experienced an increase in copper cable theft (and other non-ferrous metals) at its SA operations, including from organised crime syndicates. In 2023, Sibanye-Stillwater experienced 2,010 incidents of non-ferrous metals theft at its South African gold and PGM operations, an increase from 1,653 incidents in 2022. Theft of metal resulted in the collapse of a pylon in February 2022, which cut power supply to Sibanye-Stillwater’s Cooke shafts. About 20 employees conducting maintenance at the shaft were stranded underground for about three hours.
Rising gold, PGM and non-ferrous metal prices have been known to result in increased metals theft, expected to be principally at its South African-based mines. It is possible that mine owners may be held responsible for the actions of such illegal miners or for any damages, injuries or fatalities that occur due to their actions. The activities of illegal miners could also lead to a reduction of mineral reserves, potentially affecting the economic viability of mining certain areas and shortening the lives of the operations. In addition, these may also cause possible operational disruption, project delays, and pollution or damage to property for which Sibanye-Stillwater could potentially be held responsible and lead to fines or other costs. Disputes with illegal miners may also adversely affect Sibanye-Stillwater’s relationships with local communities. The Artisanal and Small-Scale Mining Policy published on 30 March 2022 by the South African Minister of the DMRE aims to create a formalised, sustainable, artisanal and small-scale mining industry in South Africa, to eliminate illegal mining operations and promote job creation. The intention in adopting this policy aims to formalise artisanal and small-scale mining and provide for the co-existence of artisanal and small-scale miners and large mining operations. The occurrence of any of these events could have a material adverse effect on Sibanye-Stillwater’s business, operating results and financial condition.
Sibanye-Stillwater’s operations and financial condition could also be adversely affected by policies and legislation related to greater state intervention in the mining and potentially the expropriation of mining assets without compensation
In recent years, governments, communities, NGOs and trade unions in several jurisdictions have sought and, in some cases, have implemented greater cost imposts on the mining industry, including through the imposition of additional taxes and royalties. Such resource nationalism, whether in the form of cost imposts, interference in project management, mandatory social investment requirements, local content requirements or creeping expropriation could impact the global mining industry and Sibanye-Stillwater’s business, operating results and financial condition.
In October 2020, the Expropriation Bill, 2020 (Expropriation Bill) was introduced in the National Assembly, which would allow the state to expropriate land without compensation where doing so would be for a public purpose or in the public interest. Public hearings on the Expropriation Bill were held during March and September 2021, and it remains under consideration by the National Assembly.
Section 5(3) of the MPRDA provides a statutory right of access for the mining right holder to the mining area for the purposes of conducting mining operations and does not require the holder to own the land on which it conducts operations.
In South Africa, the ANC has adopted two recommended approaches to interacting with the mining industry. While the ANC has rejected the possibility of mine nationalisation for now, the first approach contemplates, among other things, greater state intervention in the mining industry, including the revision of existing royalties and the imposition of new taxes. For example, Sibanye-Stillwater is engaged in disputes with South African municipalities regarding the valuation of certain property for the purposes of property-related taxes calculations. The second approach contemplates the South African government taking a more active role in the mining sector, including through the introduction of a state mining company to be involved in new projects either through partnerships or individually.
18
The adopted policies may impose additional restrictions, obligations, operational costs, taxes or royalty payments on mining companies, including Sibanye-Stillwater, any of which could have a material adverse effect on Sibanye-Stillwater’s business, operating results and financial condition.
In 2020, the South African National Treasury published for public comment the 2020 Draft Taxation Laws Amendments Bill which proposed, amongst others, amendments to disallow contract miners from benefitting from the accelerated capital expenditure allowance and the elimination of the Minister of Finance’s discretion to uplift the ring-fencing of capital expenditure per mine. Various stakeholders raised issues with the draft bill during the public consultation period. Consequently, in October 2020, the South African National Treasury decided to postpone the adoption of the amendments until the 2021 legislative cycle as it continues to review the comments raised. No proposed amendments were introduced in the 2021 legislative cycle, or to date. It is not clear whether any further proposals will be made in this regard in future.
Any of the above could have a material adverse effect on Sibanye-Stillwater’s business, operating results and financial condition.
Actual and potential supply chain shortages and increases in the prices of production inputs may have a material adverse effect on Sibanye-Stillwater’s operations and profits
Sibanye-Stillwater’s results of operations may be affected by general cost increases due to the availability and pricing of critical spares, raw materials and other essential production inputs, including, for example, gas, diesel, electricity, explosives, fuel, steel products, cyanide and other reagents required at its mining and processing operations. The price and quality of raw materials may be substantially affected by changes in global supply and demand, along with weather conditions, governmental controls and other relevant factors. In recent years, global markets have been adversely impacted by various credit crises and significant fluctuations in fuel and energy costs and metals prices, including as a result of the COVID-19 pandemic and due to significant fluctuations in commodity prices as a result of the continuance of the war in Ukraine and the economic sanctions imposed on Russia in connection therewith. For example, the Group experienced impacted margins at Sandouville, in part, because of energy and other production costs, as well as delays in the development of some of its projects due to delays in the delivery of critical parts from Europe. A sustained interruption in the supply of any of these materials could require Sibanye-Stillwater to find acceptable substitute suppliers and could require Sibanye-Stillwater to pay higher prices for such materials. Sibanye-Stillwater may also be required to increase investments in critical spare inventory to compensate for increased delivery lead times or potential unavailability of items, which may impact its working capital requirements.
The prices of certain of Sibanye-Stillwater’s production inputs are impacted by, among other things, the prices of oil and steel, which may be volatile. For example, in fiscal year 2023, the price of oil fluctuated between US$64 and US$92 (2022: US$75 and US$137) per barrel of Brent Crude. This volatility has and is expected to continue given the continuation of sanctions and embargoes on natural gas and oil resulting from the ongoing war in Ukraine. As at 31 March 2024, the price of oil was US$83 per barrel of Brent Crude. During fiscal 2023, the Group also experienced above inflation increases on imported spares, steel related products, ammonia-based products, fuel, oil and electricity.
Any significant increase in the prices of these materials will increase Sibanye-Stillwater’s operating costs and affect production considerations.
Sibanye-Stillwater’s insurance coverage may not adequately satisfy all potential claims and exposures
Sibanye-Stillwater has an insurance programme, including partial self-insurance. However, Sibanye-Stillwater may become subject to liability (including that which arises out of class-action or other litigation) against which it has not been insured, cannot insure or is insufficiently insured, including those relating to past mining activities, tailing disasters, data protection and cybersecurity breaches. In addition, Sibanye-Stillwater’s existing property and business interruption insurance and liability may not cover a particular event at all or be sufficient to fully cover Sibanye-Stillwater’s losses, including, without limitation, as a result of natural disasters and other events that could disrupt Sibanye-Stillwater’s operations, such as public health emergencies, pandemics, COVID-19, climate change-related incidents and losses related to grid collapse and unplanned load curtailments by Eskom. Sibanye-Stillwater’s existing property and liability insurance contains specific exclusions and limitations on coverage. For example, should Sibanye-Stillwater be subject to any regulation or criminal fines or penalties, these amounts would not be covered under its insurance programme. Should Sibanye-Stillwater suffer a major loss, which is insufficiently covered, future earnings could be affected. In addition, certain classes of insurance may not continue to be available at economically acceptable premiums. As a result, in the future, Sibanye-Stillwater’s insurance coverage may not fully cover the extent of claims against it or any cross-claims made.
Sibanye-Stillwater’s US recycling business relies on supply of auto catalysts from third-party suppliers
In the United States, Sibanye-Stillwater sources automotive and industrial catalyst materials from third-parties through both purchase and tolling arrangements. Sibanye-Stillwater has entered into sourcing arrangements for spent autocatalytic materials with various suppliers, and it depends on those suppliers to source and provide catalyst and other industrial sources for recycling in a responsible manner. Sibanye-Stillwater’s suppliers are contractually subject to compliance with responsible sourcing terms and Sibanye-Stillwater may terminate or suspend contracts with suppliers in the event they don’t adhere to such terms. Should one or more of these sourcing arrangements be terminated (for non-compliance or otherwise), or if there is a reduction or slowdown in the global number of vehicles being scrapped Sibanye-Stillwater might be unable to source replacement recyclable materials on terms that are acceptable to Sibanye-Stillwater. If Sibanye-Stillwater is unable to source sufficient quantities of recycled materials, the US recycling business would become less profitable, and this loss could negatively affect Sibanye-Stillwater’s business and results of operations. For example, autocatalyst recycling was negatively impacted in 2022 due to a combination of war in Ukraine, rising inflation, tightening financing conditions and the availability of new vehicles globally following the global chip shortage and supply chain constraints and in 2023 by a general slowdown in automotive scrapping. This resulted in used vehicles remaining in circulation with a reduction in recycle volumes. This led to significantly lower production in the US recycling business, which fell by 48% in fiscal year 2023. Any constraint on the suppliers’ ability to source material could reduce the profitability of Sibanye-Stillwater’s US recycling business.
19
In its US recycling business, Sibanye-Stillwater regularly enters into fixed forward sales contracts for metal produced from catalyst recycling, normally making these commitments at the time the catalyst material is purchased. For Sibanye-Stillwater’s fixed forward sales related to recycling of catalysts, Sibanye-Stillwater is subject to the customers’ compliance with the terms of the agreements, their ability to terminate or suspend the agreements and their willingness and ability to pay. The loss of any of these agreements or failure of a counterparty to perform could require Sibanye-Stillwater to sell or purchase the contracted metal in the open market, potentially at a significant loss. Sibanye-Stillwater’s revenues for the year ended 31 December 2023, included 12% from recycling sales and tolling fees in the United States.
Should it become necessary at any point to reduce or suspend primary mining operations, the proportion of costs allocated to the recycling segment would increase substantially. Further, the ability to operate the smelter and refinery without significant volumes of primary mine concentrates is likely to require modification to the processing facilities. There is no assurance that the recycling facilities can operate profitably in the absence of significant primary mine concentrates, or that capital would be available to complete necessary modifications to the processing facilities.
For its PGMs mined in the United States, Sibanye-Stillwater’s sales arrangements concentrate all its final refining activity and a large portion of its PGM sales from mine production with one entity
Sibanye-Stillwater utilises a single company for all of its precious metals refining services for its United States PGM mining operations, and, with the exception of certain pre-existing platinum sales commitments, all of Sibanye-Stillwater’s current mined palladium and platinum in the United States is committed for sale to such company. In addition, this company has the right to bid on any recycling PGM ounces Sibanye-Stillwater has available in the United States.
This significant concentration of business with a single company could leave Sibanye-Stillwater without precious metal refining services in the United States should such company experience significant financial or operating difficulties during the contract period. Under such circumstances, it is not clear that sufficient alternate processing capacity would be available to cover Sibanye-Stillwater’s volumes and requirements, nor that the terms of any such alternative processing arrangements as might be available would be financially acceptable to Sibanye-Stillwater. Any such disruption in refining services could have a negative effect on Sibanye-Stillwater’s ability to generate revenues, profits and cash flows.
Value chain standards are becoming more stringent and may result in increased capital and operating expenditures and decreased production
In addition to rapidly evolving legal and regulatory requirements in the jurisdictions in which it operates, Sibanye-Stillwater is also subject to evolving industry and value chain standards, including increasingly stringent offtaker and supply chain requirements. As environmental, health and safety regulations become stricter globally and there is increased regulation on supply chain transparency and traceability, the value chains in which Sibanye-Stillwater participates have increasingly adopted heightened requirements. For example, downstream users of PGMs such as automobile manufacturers are starting to insist on stringent accreditation of all commodities to the extent of specifying Initiative for Responsible Mining Assurance (IRMA) as the required standard to demonstrate site-level ESG performance. In extreme cases, there is a risk that costs could exceed the production value in certain of the markets in which the Group participates or is expanding, such as in respect of its green metals projects.
Sibanye-Stillwater is also subject to responsible sourcing standards for procurement of feedstock from third party suppliers. The Group’s nickel refinery and autocatalyst recycling operations source all feedstock from third party suppliers and the South African gold and PGM operations supplement their mined material with additional feedstock. This procurement from third parties presents a reputational risk if the Group unintentionally sources illicit material, particularly if it is related to support for armed conflict, organised crime or human rights abuses. For example, in 2022 Sibanye-Stillwater indefinitely suspended a third party supplier of spent autocatalysts at its recycling operation in the United States after it emerged that this supplier was being investigated.
To the extent that Sibanye-Stillwater is unable to conform with such standards or incurs significant capital expenditures or investments to do so, its business, operating results and financial condition may be materially impacted.
The effect of enacted and proposed US tax reform legislation on Sibanye-Stillwater and its subsidiaries is uncertain
In August 2022, US President Biden signed the Inflation Reduction Act (IRA) into law. The IRA amended US tax legislation by, among other things, supporting US-based EV supply chain and identified 50 “critical minerals”, including lithium, palladium and nickel, for such support. As revised by the IRA, Section 30D of the US Internal Revenue Code provides a maximum US$7,500 tax credit for EV owners, US$3,750 of which is available only if an “applicable percentage” of the critical mineral in the EV’s battery is either: (i) extracted or processed in the United States or in any country with which the United States has a free trade agreement in effect; or (ii) recycled in North America (the Critical Minerals Requirement). The applicable percentage begins at 40% for certain EVs placed in service prior to 2024 and increases yearly, reaching 80% for EVs placed in service from 2027 onwards.
In March 2023, the US Internal Revenue Service (IRS) proposed regulations on Section 30D that contain guidance on the Critical Minerals Requirement (the Proposed Section 30D Regulations). The Proposed Section 30D Regulations provide criteria for whether a country is considered to have a free trade agreement with the United States (FTA Country). Currently, of the jurisdictions outside the United States in which Sibanye-Stillwater operates, only Australia is deemed to be an FTA Country. Additionally, in order for a critical mineral to qualify as extracted or processed in the United States or in an FTA Country under the Critical Minerals Requirement, at least 50% of the value added to the applicable critical mineral by extraction or processing must be derived from extraction or processing (as applicable) that occurred in the United States or an FTA Country. Similarly, in order for a critical mineral to qualify as recycled in North America under the Critical Minerals Requirement, at least 50% of the value added to the applicable critical mineral by recycling must be derived from recycling that occurred in North America. The Proposed Regulations further anticipate that the 50% value added test will become more stringent for EVs placed in service after 2024. The Proposed Regulations, if finalised, may have a significant impact on non-US manufacturers and miners of critical minerals and thus could have a material adverse effect on Sibanye-Stillwater’s business, operating results and financial condition.
20
Also in March 2023, US President Biden’s Budget for Fiscal Year 2024 was released, which seeks to reform the existing US tax legislation by, among other things, increasing the corporate tax rate in the United States from 21% to 28% and eliminating the percentage depletion deduction (a tax deduction which has reduced Sibanye-Stillwater’s taxable income in recent years) for oil and natural gas wells and hard mineral fossil fuels. While the budget does not specifically refer to percentage depletion outside of the fossil fuel industry, it may suggest that the President Biden administration may be open to eliminating the percentage depletion deduction for the mining industry in general. Such proposals in the budget echo statements in the Made in America Tax Plan issued by the US Treasury Department in April 2021, which, in addition to supporting a corporate tax increase to 28% and the elimination of tax preferences for fossil fuel producers, also proposed legislation to limit the ability of multinational corporations to deduct expenses paid to foreign related parties. While the tax proposals outlined above remain subject to an extensive legislative process, they could be adopted in some form that may reflect the current proposals or other changes to the existing US tax regime. The future enactment of these proposed tax measures may have a significant impact on future US cash taxes and may require a remeasurement of future deferred tax assets and liabilities in the period of enactment, which in turn could have a material adverse effect on Sibanye-Stillwater’s business, operating results and financial condition.
Strategic Risks
Sibanye-Stillwater’s pursuit of value accretive acquisitions and joint ventures may not deliver anticipated outcomes in the timeframe anticipated or at all
As part of its growth strategy, Sibanye-Stillwater pursues, from time to time, growth opportunities through acquisitions and business combination transactions, in order to deliver more effectively on its purpose, consolidate operations, diversify its minerals portfolio, increase its exposure to businesses adjacent to primary mining, expand into new markets, increase scale, reduce its risk profile and implement best practices across operations. For example, between 2021 and 2023, Sibanye-Stillwater made a number of strategic acquisition and investments, including investment in the Keliber lithium project and ioneer Ltd (ioneer), the acquisitions of the Sandouville nickel processing facility and Century tailings operations and purchase of the remaining 50% stake in Kroondal joint venture.
The acquisition of operating assets for commodities other than gold or PGMs, including for example, the Sandouville nickel processing facility in France, Keliber lithium project in Finland and Century zinc tailings retreatment operations in Australia, expose Sibanye-Stillwater to the risk of operating in an environment and market where its senior management has less experience. As a result, it needs to rely on regionalised management and technical teams. In addition, to the extent Sibanye-Stillwater participates in the development of a project through a joint venture or any other multi-party commercial structure, there could be disagreements, legal or otherwise, or divergent interests or goals among the parties, which could jeopardise the success of the project. For example, Sibanye-Stillwater entered into a partnership with Heraeus to develop and commercialise novel electrolyser catalysts for the production of green hydrogen, the results of which cannot be guaranteed. There can be no assurance that any acquisition, business combination or joint venture, or the acquisition of any new mining assets or operations, will achieve the results intended or in the timeframe anticipated, and, as such, could have a material adverse effect on Sibanye-Stillwater’s business, operating results and financial condition.
Sibanye-Stillwater may face challenges in the integration of acquired assets, such as higher levels of capital expenditure or lower production levels than expected, which could disrupt its current operations or result in higher costs or worse overall performance than anticipated. For example, the integration of the Sandouville nickel processing facility into the Group faced various operational and logistical issues during 2022, including solvent supply constraints, and engineering failures in July 2022, which temporarily took 40% of its capacity offline and have required higher levels of capital expenditure to improve the facility. Despite the improved operational performance in 2023, Sandouville refinery remained loss making, due to a pre-existing onerous supply contract, continued inflationary cost pressures (leading to higher fixed and variable costs), elevated maintenance costs, low installed capacity leading to higher fixed costs per production unit and a further decline in the average nickel price and nickel cathode premiums.
If Sibanye-Stillwater is unable to successfully integrate its acquired assets in a timely and cost-effective manner, the potential benefits of the acquisition, including the estimated revenue and cost synergies Sibanye-Stillwater expects to achieve, may not be realised. Additionally, the integration of any acquired assets requires management capacity. There can be no assurance that Sibanye-Stillwater’s current management team will have sufficient capacity to successfully integrate existing or future assets and operations into Sibanye-Stillwater.
Sibanye-Stillwater faces intense competition for the acquisition of attractive mining properties. The decision to acquire these properties may be based on a variety of factors, including historical operating results, estimates and assumptions regarding the extent of the ore reserve, cash and other operating costs, mineral prices, projected economic returns and evaluations of existing or potential liabilities (including environment liabilities) associated with the relevant property and its operations and how these factors may change in the future. Other than historical operating results, these factors are uncertain and could have an impact on revenue, cash and other operating costs, as well as the process used to estimate the ore reserve. In addition, although Sibanye-Stillwater typically receives representations, warranties and indemnities and conducts general due diligence with respect to its acquisitions, there can be no assurance that Sibanye-Stillwater identified all the liabilities of, and risks associated with, its acquisitions or that it will not be subject to unknown liabilities of, and risks associated with, the entities acquired, including liabilities and risks that may become evident only after Sibanye-Stillwater has been involved in the operational management of the relevant entities.
Any of the foregoing may impact Sibanye-Stillwater’s ability to realise the anticipated benefits of its acquisitions and its business, operating results and financial condition may be materially impacted.
Acquisitions, business combinations, development projects and joint ventures, including Sibanye-Stillwater’s green metals projects, may expose Sibanye-Stillwater to new or increased regulatory oversight or requirements, including in geographies in which it is unfamiliar
Sibanye-Stillwater has in the past, and may in the future, pursue opportunities for expansion into new geographies or markets where it has limited to no prior experience, and which may subject it to new or increased regulatory oversight or requirements. For example, the acquisition of Stillwater expanded Sibanye-Stillwater’s operations into the United States, wherein Sibanye-Stillwater was subject to new regulatory and reporting requirements. At a corporate level, Sibanye-Stillwater has historically had limited experience with the MSHA, which oversees and enforces regulations pertaining to the health and safety of workers at Sibanye-Stillwater’s US operations. Between 2022 and
21
2023, Sibanye-Stillwater initiated direct operations in France, Finland and Australia, where the Group had no prior operational experience. Such expansions may lead to increased costs related to ensuring governance, regulatory, legal and accounting compliance across multiple regions. In addition, future acquisitions, business combinations or joint ventures may change the scale of Sibanye-Stillwater’s business and operations and may expose it to new geographical, geological, commodity, political, social, labour, operational, financial, legal, regulatory and contractual risks.
To the extent that Sibanye-Stillwater seeks to further expand its existing mining operations, it may experience problems associated with mineral exploration or development of mining projects
Sibanye-Stillwater aims to expand its operations and mineral reserve base through targeted acquisitions, joint ventures and development projects as well as organically, through its existing exploration programmes and investigations. However, such projects may be capital intensive, have a long lead time and are subject to risks relating to the location of economic ore bodies, the development of appropriate extractive processes, cost overruns and delays. Such projects may also be impacted by delay in the receipt of necessary governmental permits and regulatory approvals and the extension of mining and processing facilities at the mining site. For example, Sibanye-Stillwater requires, from time to time, new or amended permits to expand water, rock and tailing storage facilities in respect of its Stillwater operations. If it is unable to obtain such permits, or do so in a timely manner, its operations would be significantly impacted.
Sibanye-Stillwater is continuing to investigate the exploitation of mineralisation below and adjacent to the current mining areas and infrastructure limits at its operations, This includes brownfields exploration drilling at selected operations in South Africa as well as at Stillwater and at Keliber,to further refine mineral resources that can be converted to mineral reserves in the future. At Keliber, exploratory percussion drilling is ongoing as part of its regional lithium exploration. Sibanye-Stillwater has also been undertaking exploration activities in conjunction with its joint venture partner, Regulus Resources Ltd (Regulus), at the Altar project, a large porphyry-style copper-gold deposit in Argentina. There can be no assurance that any exploration or expansion projects will be successful, partially or at all, and the failure of Sibanye-Stillwater to expand its mineral reserves through such projects could have a material adverse effect on its business, operating results and financial condition.
Sibanye-Stillwater’s green metals strategy is subject to certain risks, and Sibanye-Stillwater may never develop minerals in sufficient grade or quantities to justify commercial operations
As part of its green metals strategy, Sibanye-Stillwater has made, and may continue to make, strategic investments in green metals development projects to enhance its positioning in the future green economy. Recent examples of such investments include shareholdings in Keliber and ioneer (which includes an option to acquire a 50% interest in a joint venture to develop Rhyolite Ridge) in 2021 and its acquisition of the Mt. Lyell copper mine in 2023. Mineral resource exploration, development, and operations are complex and are characterised by a number of significant risks, including, among other things, unprofitable efforts resulting not only from the failure to discover mineral resources, and from finding mineral resources which, though present, are insufficient in quantity and quality to return a profit from production. Once mineralisation is discovered, it may take a number of years from the initial exploration phases before production is possible, during which time the potential feasibility of the project may change adversely. For example, the novel soda pressure leaching technology utilised at Keliber may fail to perform at the expected level as the process is not yet in industrial use and therefore may result in lower mineral quality and/or higher costs.
Sibanye-Stillwater’s direct investment in ioneer and proposed joint venture in respect of development at the Rhyolite Ridge is expected to be one of the first large scale US lithium projects to enter production. However, no assurance can be given that minerals will be discovered in sufficient grade or quantities to justify commercial operations. Whether an exploration property will be commercially viable depends on a number of factors, including: the particular attributes of the deposit, such as size, grade and proximity to infrastructure; metal prices, which are highly cyclical; availability of and effectiveness of technology to recover, trans-ship, transport and process modules; availability of required personnel, third-party partners and contractors, any required financing; commercial demand in the marketplace for such metals and government regulations and approvals, including regulations relating to prices, taxes, royalties, land tenure, land use, and environmental protection. For example, an endangered species of buckwheat is native to parts of the Rhyolite Ridge. As a result, permitting is subject to an alternative mine plan and schedule that avoids all buckwheat, which is currently underway. Although Sibanye-Stillwater’s investment is conditional upon the receipt of an operating permit at the site, compliance with these regulatory requirements may be expensive and significantly lengthens the time needed to develop the site.
The precise impact of these factors cannot accurately be predicted, but the combination of these factors may result in a delay or the inability of Sibanye-Stillwater’s strategic investments to operate or generate an adequate return on invested capital. In addition, value chain requirements are rapidly evolving in such markets, which may require Sibanye-Stillwater to expend significant time and resources to conform with, as a result of which the profitability of such investments may decline. See – Value chain standards are becoming more stringent and may result in increased capital and operating expenditures and decreased production.
The prevailing market prices of nickel, lithium, copper and other commodities will have a material impact on the commercial success of Sibanye-Stillwater’s green metals strategy
The profitability of Sibanye-Stillwater’s green metals strategy will be significantly affected by changes in the market price of green metals (e.g., nickel, lithium and copper) and the cost of power, petroleum fuels, and oil, among other commodities and supply requirements. Prices of such metals are affected by numerous factors beyond Sibanye-Stillwater’s control, including: prevailing interest rates and returns on other asset classes; expectations regarding inflation, monetary policy and currency values; speculation; governmental and exchange decisions regarding the disposal of metal stockpiles; political and economic conditions; available supplies of green metals from mine production, inventories and recycled metal; sales by holders and producers of green metals; and demand for products containing nickel, lithium and copper. The price of such green metals and other minerals and oil has fluctuated widely in recent years, and if prices decline or are lower than expected, this could have a material adverse impact on Sibanye-Stillwater’s strategy, and as a result, its business, operating results and financial condition.
The success of Sibanye-Stillwater’s green metals strategy may be impacted if the electric vehicles sector does not develop as anticipated
22
Demand for the minerals Sibanye-Stillwater intends to mine and/or process as part of its expansion into the green metals sector, including lithium, nickel and copper, is contemplated to be significantly linked to growing demand for these metals in batteries for EVs as well as the broader development of a clean energy economy. As a result, the success of Sibanye-Stillwater’s green metals strategy is partially dependent upon the adoption by consumers of EVs. While it has been projected that demand for such EVs will surge over time, if the market for EVs does not develop as expected, or develops more slowly than expected, Sibanye-Stillwater’s green metals strategy, along with the climate change resiliency of its business, may be impacted. Factors that may influence the adoption of alternative fuel vehicles, and specifically EVs, and the level of nickel and cobalt used, include:
•rate of cost reductions of EVs, including as a result of delays in the battery technology advancements and the inability to achieve lower unit costs
•the availability of adequate and reliable charging infrastructure needed to support mass adoption of EVs, including the grid capacity necessary to support EV charging
•uncertainty in the regulatory timelines associated with the ban on combustion engine vehicles, especially in Europe and North America
•removal of economic incentives (such as favourable tax treatment) and government regulation promoting lower emissions, fuel efficiency and alternate forms of energy
•the availability of alternative fuel vehicles, including plug-in hybrids, which may delay the volume requirements for green metals (owing to smaller battery pack sizes)
•perceived safety of EVs, which may be negatively impacted by incidents such as battery fires
•greater shift to the lithium-iron phosphate cathode chemistry will lower nickel (and cobalt) demand requirements
To the extent that the EV sector does not develop as anticipated, Sibanye-Stillwater’s green metals strategy, including demand for its mineral portfolio may be adversely affected, which may in turn materially impact its business, operating results and financial condition.
Risks Related to Sibanye-Stillwater’s Shares and ADSs
Sibanye-Stillwater’s non-South African shareholders may face additional investment risk from currency exchange rate fluctuations since any dividends will be paid in rand
Dividends or distributions with respect to Sibanye-Stillwater’s shares have historically been paid in rand. The US dollar or other currency equivalent of future dividends or distributions with respect to Sibanye-Stillwater’s shares, if any, will be adversely affected by potential future reductions in the value of the rand against the US dollar or other currencies. For example, dividends or distributions with respect to Sibanye-Stillwater’s ADSs are paid in rand to the ADS depositary, who converts such dividend or distribution into US dollar for payment to the relevant ADS holder. If the exchange rate fluctuates between the time at which the dividend or distribution was declared and conversion and payment to the ADS holder, the ADS holders may lose some or all of the value of the distribution. In addition, while South African Exchange Control Regulations have been relaxed in recent years, in the future, it is possible that there will be further changes in South African exchange controls, such that dividends paid out of trading profits will not be freely transferable outside South Africa to shareholders who are not residents of the CMA. See – South African Exchange Control Limitations Affecting Security Holders.
Sibanye-Stillwater may not pay dividends or make similar payments to its shareholders in the future due to various factors and any dividend payments made may be subject to withholding tax
Sibanye-Stillwater’s current dividend policy is to return at least 25% to 35% of normalised earnings to shareholders. Sibanye-Stillwater may pay cash dividends only if funds are available for that purpose. Whether funds are available depends on a variety of factors, including the amount of cash available and Sibanye-Stillwater’s capital expenditures on both existing infrastructure, as well as on exploration and other projects and other cash requirements existing at the time. Under South African law, Sibanye-Stillwater will be entitled to pay a dividend or similar payment to its shareholders only if it meets the solvency and liquidity tests as defined in the Companies Act, and is permitted to do so in terms of the Memorandum of Incorporation. Given these factors and the Sibanye-Stillwater Board’s discretion to declare cash dividends or other similar payments, dividends may not be paid in the future. It should be noted that a 20% withholding tax is required to be withheld on dividends paid by, among others, certain South African resident companies (including Sibanye-Stillwater) to any person, unless an exemption from or a reduction in the withholding tax is applicable.
The withholding tax on dividends is subject to domestic exemptions or relief in terms of an applicable double taxation treaty. The application of such domestic exemptions or relief in terms of an applicable double taxation treaty is subject to the making of certain declarations and undertakings by the beneficial owner of the dividends and providing the same to Sibanye-Stillwater or regulated intermediary making payment of the dividend. In terms of the US-South Africa Treaty, the dividends tax rate is reduced to 5% of the gross amount of the dividends if a corporate US holder holds directly at least 10% of the voting stock of a South African company, or alternatively reduced to 15% of the gross amount of the dividend in all other cases. Based on current legislation, the declaration and undertaking entitling the holder to a reduced dividend tax must be renewed at least every five years, subject to certain exemptions. See – Taxation – Certain South African tax considerations-Withholding tax on dividends and Financial information-Dividend Policy and Dividend Distributions.
Sibanye-Stillwater’s shares are subject to dilution, which could adversely affect their trading price
Shareholders’ equity interests in Sibanye-Stillwater will be diluted to the extent of future exercises or issuances, including upon conversion of the Group’s outstanding Convertible Bonds or any additional rights. Sibanye-Stillwater shares are also subject to dilution in the event that the Sibanye-Stillwater Board issues new shares in compliance with applicable B-BBEE legislation. See – Sibanye-Stillwater’s mining rights are subject to legislation, which could impose significant costs and burdens and which impose certain ownership requirements, the interpretation of which may be the subject of dispute.
In 2023, Stillwater Mining Company issued convertible bonds in the aggregate principal amount of USD$500 million. Subject to approval by a general meeting of the shareholders of the Group, the bonds will be convertible into shares of Sibanye-Stillwater. Upon conversion, Sibanye-Stillwater’s existing shareholders will experience immediate dilution of voting rights and its share price may decline. Furthermore, the
23
perception that such dilution could occur may cause the Group’s share price to decline. In the event that shareholder approval is not obtained, the convertible bonds will be cash settled. See – Sibanye-Stillwater has a large amount of indebtedness. Failure to comply with its debt covenants or difficulties in obtaining necessary financing could have a material adverse effect on its business, operating results and financial condition.
The Sibanye-Stillwater Board has the authority to authorise certain offers and sales of the securities without the vote of, or prior notice to, Sibanye-Stillwater shareholders. Such additional issuances may involve the issuance of a significant number of ordinary no par value shares at prices less than the current market price.
Issues of substantial amounts of securities, or the availability of the securities for sale, could adversely affect the prevailing market prices for the securities and dilute investors’ earnings per share. Further, the issuance of shares in connection with any acquisition of assets (including another company) subject to compliance with Section 9 and 10 of the JSE Listings Requirements or an amalgamation or merger or scheme of arrangement in terms of the Companies Act (whether in the form of consideration or otherwise) may result in dilution to existing shareholders.
A large volume of sales of Sibanye-Stillwater’s shares all at once or in tranches, could decrease the prevailing market price of Sibanye-Stillwater’s shares and could impair Sibanye-Stillwater’s ability to raise capital through the sale of equity securities in the future. Additionally, even if substantial sales are not affected, the mere perception of the possibility of these sales could decrease the market price of Sibanye-Stillwater’s shares and could have a negative effect on Sibanye-Stillwater’s ability to raise capital in the future. Further, anticipated downward pressure on Sibanye-Stillwater’s ordinary share price due to actual or anticipated sales of shares could cause some institutions or individuals to engage in short sales of Sibanye-Stillwater’s shares, which may itself cause the price of the shares to decline.
Shareholders outside South Africa may not be able to participate in future issues of securities (including ordinary shares) carried out by or on behalf of Sibanye-Stillwater
Securities laws of certain jurisdictions may restrict Sibanye-Stillwater’s ability to allow participation by certain shareholders in future issues of securities (including ordinary shares) carried out by or on behalf of Sibanye-Stillwater. In particular, holders of Sibanye-Stillwater securities who are located in the United States (including those who hold Sibanye-Stillwater Shares or Sibanye-Stillwater ADSs) may not be able to participate in securities offerings by or on behalf of Sibanye-Stillwater unless a registration statement under the Securities Act is effective with respect to such securities or an exemption from the registration requirements of the Securities Act is available thereunder.
Securities laws of certain other jurisdictions may also restrict Sibanye-Stillwater’s ability to allow the participation of all holders in such jurisdictions in future issues of securities carried out by Sibanye-Stillwater. Holders who have a registered address or are resident in, or who are citizens of, countries other than South Africa should consult their professional advisers as to whether they require any governmental or other consent or approvals or need to observe any other formalities to enable them to participate in any offering of Sibanye-Stillwater securities.
Investors in the United States and other jurisdictions outside South Africa may have difficulty bringing actions, and enforcing judgments, against Sibanye-Stillwater, the directors and the executive officers based on the civil liabilities provisions of the federal securities laws or other laws of the United States or any state thereof or under the laws of other jurisdictions outside South Africa
Sibanye-Stillwater is incorporated in South Africa. Most of the directors and executive officers reside outside of the United States and substantially all of the assets of these persons and approximately 72% of the assets of Sibanye-Stillwater are located outside the United States. As a result, it may be difficult for investors to enforce against these persons or Sibanye-Stillwater a judgment obtained in a US court predicated upon the civil liabilities provisions of the federal securities or other laws of the United States or any state thereof. In addition, investors in other jurisdictions outside South Africa may face similar difficulties.
Investors should be aware that, as a matter of South African law, courts may only award compensation for the loss or damage actually sustained by the person to whom the compensation is awarded. Awards of punitive damages are unknown to the South African legal system, and are regarded as being contrary to public policy. Whether a judgment is contrary to public policy will depend on the facts of each case. Exorbitant, unconscionable or excessive awards may be contrary to public policy and contractually stipulated penalties are subject to and limited by the provisions of the Conventional Penalties Act, 1962. In instances where a party seeks to have a foreign judgment recognised and enforced in South Africa, South African courts will not enter into the merits of a foreign judgment and cannot act as a court of appeal or review over the foreign court. South African courts will usually implement their own procedural laws in relation to recognition of foreign judgments before enforcing and, where an action based on an international contract is brought before a South African court, the capacity of the parties to the contract will usually be determined in accordance with South African law. Where a party relies on a foreign law, the content of that foreign law must be proved to the South African court’s satisfaction and the court may, in certain circumstances, require expert evidence in that regard. It is doubtful whether an original action based on US federal securities laws or the laws of other jurisdictions outside South Africa may be brought before South African courts. Further, a plaintiff who is not resident in South Africa may be required to provide security for costs in the event of proceedings being initiated in South Africa. In addition, the Rules of the High Court of South Africa require that documents executed outside South Africa must be authenticated for the purpose of use in South Africa.
Investors should also be aware that a foreign judgment is not directly enforceable in South Africa, but only constitutes a cause of action. Such a judgment will be enforced by South African courts only if certain conditions are met.
24
DIRECTORS AND EXECUTIVE MANAGEMENT
Chairman and Independent Non-Executive Director
Thabane Vincent Maphai (72)
BA (Hons), BPhil (cum laude), MPhil, Catholic University of Leuven; PhD, University of Natal; Advanced Management Programme (Finance for Senior Executives), Harvard University
Vincent Maphai was appointed a director of Sibanye-Stillwater on 1 June 2019, and became the non-executive Chairman of Sibanye-Stillwater, effective 30 September 2019. He is also a non-executive director and chairman of the board of Stadio Holdings Limited. He has accumulated over 20 years’ experience in the academic profession, and 19 years as a senior executive in the private sector. He has served on the boards of various companies as non-executive chairperson and recently retired as chairman and non-executive director of Discovery Limited. Vincent has also held a two-year academic position at Williams College in Massachusetts.
Executive Directors
Neal John Froneman (64)
Chief Executive Officer
BSc Mech Eng (Ind Opt), University of the Witwatersrand; BCompt, University of South Africa; PrEng
Neal Froneman was appointed executive director and CEO of Sibanye-Stillwater on 1 January 2013. Over the past ten years he has led the transformation of Sibanye-Stillwater from a 1.5Moz South Africa-based gold miner into a leading diversified metals producer with an international operating footprint. The company now ranks as the world’s top primary producer of PGM metals with a leading position in the PGM recycling industry. Under Neal’s leadership, Sibanye-Stillwater has begun building an international portfolio of battery metal operations along with growing involvement in the circular economy and tailings reprocessing businesses. Neal’s career spans nearly 40 years during which time he worked at Gold Fields Limited (Gold Fields), Harmony Gold Mining Company Limited (Harmony) and JCI Limited. In April 2003, Neal was appointed CEO of Aflease Gold Limited (Aflease Gold), which, through a series of reverse take-overs, became Gold One International Limited (Gold One) in May 2009. He was primarily responsible for the creation of Uranium One Incorporated (Uranium One) from the Aflease Gold uranium assets. During this period, he was CEO of Aflease Gold and Uranium One until his resignation from Uranium One in February 2008. He held the CEO position at Gold One until his appointment at Sibanye-Stillwater. Since 2021, he has been appointed as a member of the Wits Foundation Board of Governors. He also serves on the councils of international mining bodies including the ICMM and the World Gold Council. Neal was appointed as chairman of the World Gold Council during 2023 and currently serves as both a director and Chairman of Business Against Crime SA, a non-profit organisation.
Charl Keyter (50)
Chief Financial Officer
BCom (Accounting), University of Johannesburg; MBA, North-West University; ACMA and CGMA
Charl Keyter was appointed a director of Sibanye-Stillwater on 9 November 2012, and executive director and CFO on 1 January 2013. He led the deleveraging of the Group, following the significant growth of Sibanye-Stillwater into a leading diversified metals producer with an international operating footprint ranking among the world’s top three PGM producers and more recently contributed towards the development of the Group’s 3D strategy and the issue of the US$500 million convertible bonds. His career spans more than 29 years in mining and he previously worked 18 years at Gold Fields in various senior positions, having begun his career in February 1995 as a post-graduate trainee.
Independent Non-Executive Directors
Richard Peter Menell (68)
MA (Natural Sciences, Geology), Trinity College, University of Cambridge; MSc (Mineral Exploration and Management), Stanford University; FGS, FSAIMM and FAusIMM
Richard (Rick) Menell is a Sibanye-Stillwater independent non-executive director and was appointed on 1 January 2013. He has over 43 years’ experience in the mining industry. Previously, he occupied the positions of President of the Minerals Council, President and CEO of TEAL Exploration & Mining Inc., chairman of Anglovaal Mining Limited and of Avgold Limited, chairman of Bateman Engineering Limited, non-executive director and chairman of Credit Suisse Securities Johannesburg Proprietary Limited, deputy chairman of Harmony and of African Rainbow Minerals Limited. He has also been a director of Telkom SA SOC Limited, Standard Bank of South Africa Limited, Weir Group PLC, Mutual and Federal Insurance Company Limited and Deputy chairman and non-executive director of Gold Fields. He recently retired as Senior Advisor to the Credit Suisse Group AG (Credit Suisse Group). Rick is a trustee of the Carrick Foundation and of the Claude Leon Foundation. He is co-chairman of the City Year South Africa Youth Service Organisation, and co-chairman and trustee of the Paleontological Scientific Trust. He serves as a Trustee of the University of the Western Cape Foundation.
Timothy John Cumming (66)
BSc (Hons) (Engineering), University of Cape Town; MA (PPE), Oxford University
Timothy (Tim) Cumming is a Sibanye-Stillwater independent non-executive director and was appointed on 21 February 2013. He is the founder and executive director of Scatterlinks Proprietary Limited, a South African-based company providing leadership development services to senior business executives as well as strategic advisory services. He has a wealth of experience in financial services, including periods as an executive at Old Mutual Limited, HSBC Bank PLC (HSBC Bank) and Allan Gray Limited. He is currently also the non-executive chairman of DRDGOLD Limited, an independent non-executive director of Nedgroup Investments Limited and non-executive chairman of RisCura Holdings Proprietary Limited. Tim started his career as an engineer at Anglo American Corporation of South Africa Limited (Anglo American Corporation). He worked on a number of gold mines and diamond mines in Southern Africa. He is also the chairman of the Woodside Endowment Trust and of the Investment Committee of the Mandela Rhodes Foundation.
// 25
Elaine Jay Dorward-King (66)
BSc (Chemistry), Maryville College; PhD (Analytical Chemistry), Colorado State University
Elaine Dorward-King is a Sibanye-Stillwater independent non-executive director and was appointed on 27 March 2020. She is a retired executive with over 32 years of leadership experience in developing and implementing sustainable development, safety, health and environmental strategies and programmes in the mining, chemical and engineering consulting sectors. From 2013 to June 2019, Elaine served as the executive vice president of sustainability and external relations for Newmont Mining Corporation (Newmont), where she led the development and implementation of strategy, policy and standards across the company in environmental, social responsibility, community relations, external affairs, government relations and communications areas. She was a member of the Newmont’s executive leadership team (ELT) and was one of four ELT members on the company’s investment committee. From June 2019 until January 2020, Elaine was executive vice president of ESG strategy for Newmont. Prior to joining Newmont, Elaine spent 20 years at Rio Tinto PLC (Rio Tinto), where she held a variety of leadership roles including two years as managing director of Richards Bay Minerals Proprietary Limited (Richards Bay Minerals), one of the world’s largest producers of mineral sands products, including titanium dioxide feedstock, zircon, rutile and high-grade iron. She also served as the global head of health, safety and environment for Rio Tinto, a role she held for eight years following other roles of increasing responsibility. Prior to that, Elaine worked for an engineering consulting firm, EBASCO Environmental, and for Monsanto Chemical Company, in the agricultural products division. Since retiring from Newmont, Elaine has joined the boards of Nevada Copper Corp, Kenmare Resources PLC, a leading producer of titanium minerals and zircon and NOVAGOLD Resources Inc., a North American gold exploration and development company. In August 2023, Elaine stepped down from the Board of Great Lakes Dredge and Dock Company, an American company providing construction services in dredging and land reclamation.
Harry James Rodolph Kenyon-Slaney (63)
BSc (Hons) (Geology), Southampton University; International Executive Programme, INSEAD (France)
Harry Kenyon-Slaney is the lead independent non-executive director of Sibanye-Stillwater and was appointed on 16 January 2019. He is currently Chairman of Gem Diamonds Limited, the senior independent director WE Soda Ltd, a member of the Advisory Board of Phoenix Copper Limited and a senior advisor to McKinsey & Co., in which roles he uses his wide experience to support operational, health and safety and business transformation programmes. Harry, who has more than 41 years of experience in the mining industry, principally with Rio Tinto PLC, is a geologist by training and his experience spans operations, marketing, projects and business development. Until 2015 and as a member of Rio Tinto’s Group Executive committee, he held the roles of Chief Executive – Energy, and before that, Chief Executive – Diamonds and Minerals. Prior to this, he led Rio Tinto’s global titanium dioxide business, was chief executive of Rio Tinto’s listed subsidiary, Energy Resources of Australia Limited, and General Manager Operations at Phalaborwa Mining Company Limited in South Africa, and he has held senior marketing roles in copper, uranium and industrial minerals. He was previously member of the Advisory Board of Schenck Process Holding GmbH until it was sold in 2023. He began his career as an underground production geologist on the gold mines in South Africa where he has lived and worked for more than 15 years.
Nkosemntu Gladman Nika (66)
BCom, University of Fort Hare; BCompt (Hons), University of South Africa; Advanced Management Programme, INSEAD (France); CA (SA)
Nkosemntu Nika is a Sibanye-Stillwater independent non-executive director and was appointed on 21 February 2013. He is currently an independent non-executive director and chairman of Grinding Media South Africa Proprietary Limited and chairman of the Audit and Risk Committee of Foskor Proprietary Limited. He also serves as an independent non-executive director of Trollope Mining Services 6000 Proprietary Limited, Engen Limited and Coega Dairy Holdings Limited. He was previously CFO and Finance Director of PetroSA (SOC) Limited and Executive Manager: Finance at the Development Bank of Southern Africa. He has held various internal auditing positions at Eskom Holdings (SOC) Limited, Shell Company of South Africa Limited and Anglo American Corporation. He was also a non-executive board member of the Industrial Development Corporation of South Africa Limited, and previously chaired its Audit and Risk Committee and Governance and Ethics Committee.
Keith Alfred Rayner (67)
BCom, Rhodes University; CTA; CA (SA)
Keith Rayner is a Sibanye-Stillwater independent non-executive director and was appointed on 1 January 2013. Keith is CEO of KA Rayner Presentations CC, an advisory and presentation corporation specialising in corporate finance and regulatory advice. He is an independent non-executive director of Telkom SA SOC Limited. He is a non-executive director of Nexus Intertrade Proprietary Limited, Sabi Gold Proprietary Limited (dormant), Keidav Properties Proprietary Limited (dormant) and Appropriate Process Technologies Proprietary Limited. He is a member of the JSE Limited’s Issuer Regulation Advisory Committee and is a member of the Investment Analysts Society. He was previously a director of Afristrat Investment Holdings Limited and 2 Quins Engineered Business Information Proprietary Limited.
In compliance with the Sarbanes-Oxley Act, the Board has identified Keith Rayner as the Audit Committee’s financial expert.
Susan Comber van der Merwe (69)
BA, University of Cape Town
Susan (Sue) van der Merwe is a Sibanye-Stillwater independent non-executive director and was appointed on 21 February 2013. She served as a member of Parliament for 18 years until October 2013, and held various positions, including Deputy Minister of Foreign Affairs from 2004 to 2010 and previously served as a trustee and Chair of the Kay Mason Foundation, which is a non-profit organisation assisting disadvantaged scholars in Cape Town. She has participated in various civil society organisations and since 2014, has been a member of the National Council of the South African Institute of International Affairs, a non-governmental research institute focused on South Africa’s and Africa’s international relations.
26
Jeremiah Skhulumi Vilakazi (63)
BA, University of South Africa; MA, Thames Valley University; MA, University of London; MBA, California Coast University
Jeremiah (Jerry) Vilakazi is a Sibanye-Stillwater independent non-executive director and was appointed on 1 January 2013. Jerry was recently appointed Adjunct Professor by Unisa in the Department of Business Management. He is currently a non-executive director of Blue Label Telecoms Limited, Cell C Limited and Palama Industrial Proprietary Limited. He previously held the position of Chairman of Netcare Limited and directorships of Pretoria Portland Cement Company Limited, Goliath Gold Limited, SANPARKS and Computershare Limited. He is a past CEO of Business Unity South Africa NPC and Managing Director of the Black Management Forum NPC. He has served on the King Committee on Corporate Governance charged with reforming corporate governance in South Africa for an extended period of close to a decade. Jerry served as Chief Director of the Department of Home Affairs prior to being appointed Public Service Commissioner in 1999 and later serving on the National Planning Commission and the Presidential Broad-based Black Economic Empowerment Advisory Council. He has also served as Chairman of the Mpumalanga Economic Growth Agency, Mpumalanga Gambling Board and of the State Information Technology Agency (SOC) Proprietary Limited.
Sindiswa Victoria Zilwa (56)
BCompt (Hons), University of South Africa; CTA; CA (SA); CD(SA); Advanced Taxation Certificate, University of South Africa; Advanced Diploma in Financial Planning, University of the Free State; Advanced Diploma in Banking, University of Johannesburg; Harvard VPAL Cybersecurity Certificate Programme: Managing Risk in the Information Age, Harvard University
Sindiswa (Sindi) Zilwa is a Sibanye-Stillwater independent non-executive director and was appointed on 1 January 2021. A chartered accountant by profession, Sindi is an expert in the areas of accounting, auditing, governance, transformation and business management. Sindi is also a chartered director (SA) and has vast experience as a director in the public and private sectors, currently serving as a non-executive director of Cell C Limited, Delta Property Fund Limited, Gijima Group Limited, Mercedes-Benz South Africa Limited, Metrofile Limited and Tourvest Group Proprietary Limited. She is an author of “The ACE Model-Winning Formula for Audit Committees”, formerly used by the Institute of Directors to train audit committee members in South Africa, and the author of “Creating Board and Committee Effectiveness”. She is a member of the South African Institute of Chartered Accountants and Institute of Directors. Sindi was the co-founder and retired Chief Executive Officer of Nkonki Incorporated, having held the position from 1993 to 2016. Her other former non-executive directorships over the past five years included AngloGold Ashanti Limited (AngloGold), Aspen Pharmacare Holdings Limited, Consol Holdings Proprietary Limited, Consol Glass Proprietary Limited, Discovery Limited, Massmart Limited and Redefine Properties Limited. In 2023, Sindi completed a cybersecurity certificate programme at Harvard University online, entitled “Cybersecurity: Managing Risk in the Information Age”.
Philippe François Marie-Joseph Boisseau (62)
MSc (Theoretical Physics), École Polytechnic
Philippe brings over 25 years of executive leadership experience. He is the former CEO of Compañía Española de Petróleos, S.A. (CEPSA), a Spanish multinational oil and gas, chemicals, and renewable energy business, from 2019 to 2021. He also acted as Senior Advisor to the CEO and the Board of CEPSA in 2022. Before joining CEPSA, he was a Senior Advisor to Carlyle International Energy Partners.
Previously, he worked at TotalEnergies SA (Total) for over two decades. His career at Total spans oil, gas and power value chains and all geographies. Distinctively well-rounded, he has headed up refining and upstream businesses, has been responsible for Total’s business in the Middle East and the Gas and Power global Division. He was instrumental in establishing and leading Total’s New Energies division from 2007 to 2016. With a very large international experience, including expatriations in the US and Argentina, Philippe has been a member of Total’s Executive Committee for 5 years, leading the Retail and Marketing and the New Energies Global Divisions.
His functional experience encompasses a broad spectrum, from operations, sales and marketing to building partnerships, mergers and acquisitions, restructuring, integrating, developing and investing in major projects. He is a global energy leader with a profound strategic and operational understanding of technology, markets, investors, consumers and regulations.
Philippe is a non-executive director of Centrica PLC and serves as a member of the Audit and Risk Committee, the Nominations Committee and the Safety, Environment and Sustainability Committee. Philippe was a board member at I-Pulse Inc. from 2017 to 2021. Philippe served as a Senior Advisor to Sibanye-Stillwater in 2023 to refine the company’s strategic approach towards prioritising metals and energy investments. His advisory role with Sibanye-Stillwater ended before his appointment on the board.
Rotation of directors
In accordance with Sibanye-Stillwater’s Memorandum of Incorporation (MOI), one third of the directors shall retire from office at each AGM. The first to retire are those directors appointed as additional members of the Board, followed by the longest-serving members. The Board, assisted by the Nominating and Governance Committee, can recommend the eligibility of retiring directors (subject to availability and their contribution to the business) for re-appointment. Retiring directors can be immediately re-elected by the shareholders at the AGM. The Directors retiring in terms of the Company’s MOI are Richard Menell, Jeremiah Vilakazi, Dr Elaine Dorward-King and Sindiswa Zilwa. All these directors are eligible and offer themselves for re-election. Philippe Boisseau was appointed to the Board on 8 April 2024 is eligible and available for election at the AGM.
Director changes
The following Director appointment, resignation and retirements have been announced since 31 December 2023:
•Philippe Boisseau was appointed to the Board on 8 April 2024
•Nkosemntu Nika and Susan van der Merwe will retire from the Board at the next AGM and are not available for re-election
•Savannah Danson resigned from the Board on 11 March 2024 due to external commitments and will not be seeking re-election
We thank Nkosemntu, Susan and Savannah for their service.
27
C-Suite Management
Richard Andrew Stewart (48)
Chief Regional Officer: Southern Africa
BSc (Hons), PhD (Geology), University of the Witwatersrand; MBA, Warwick Business School (UK); PrSciNat
Richard Stewart has held the position of Chief Regional Officer: Southern Africa from 31 May 2022, subsequent to being the Group Chief Operating Officer (COO) from 1 December 2020. Prior to being COO, Richard was the Executive Vice President: Business Development at Sibanye-Stillwater. Richard has more than 24 years’ experience in South Africa’s geological and mining industries and is a Fellow of the Geological Society of South Africa and a Registered Natural Scientist. He joined the Group in 2014, and has contributed significantly to a successful and value-accretive acquisition and growth strategy. Prior to joining Sibanye-Stillwater, he served on the Gold One Executive Committee from 2009, where his last appointment was Executive Vice President: Technical Services. Prior to this Richard served as CEO of Goliath Gold Limited, held management positions at the Council for Scientific and Industrial Research (CSIR) Mining Technology division, Dunrose Trading 186 Proprietary Limited trading as Shango Solutions and Uranium One, and was an investment consultant for African Global Capital Proprietary Limited.
Robert van Niekerk (59)
Chief Technical and Innovation Officer
National Higher Diploma (Metalliferous Mining), Technikon Witwatersrand; BSc (Mining Engineering), University of the Witwatersrand; South African Mine Manager’s Certificate of Competency
Robert van Niekerk was appointed as Chief Technical and Innovation Officer for the Group from 31 May 2022 expanding his previous role as Chief Technical Officer. Previously he served as the Executive Vice President: Group Technical Services (from April 2020), Executive Vice President: SA PGM operations (from July 2017 to April 2020), Divisional CEO: Platinum and Executive Vice President: Organisational Effectiveness. Prior to joining Sibanye-Stillwater (in February 2013), he was the Senior Vice President and Group Technical Head of Mining at Gold Fields. He previously occupied several senior operational and executive management positions at Harmony, Anglo American Platinum Limited (Anglo American Platinum), Uranium One and Gold One. Robert began his mining career in 1982 as a Learner Official and progressed through the ranks at a number of underground and surface mining operations locally and outside of South Africa.
Themba George Nkosi (51)
Chief People and Culture Officer
BA Hons (Employment Relations), University of Johannesburg; BTech (Human Resources), Peninsula Technikon; Human Resources Executive Programme, University of Michigan; Business Sustainability Management course, University of Cambridge (Institute for Sustainability Leadership)
Themba Nkosi is the Chief People and Culture Officer at Sibanye-Stillwater from October 2023, transitioning from being the Chief Sustainability Officer of the Group since May 2022 when his role broadened from being Chief Social Performance Officer with a primary focus on South Africa to Group leadership for ESG and sustainability as part of the C-Suite. Themba joined the Group in July 2016 as Executive Vice President: Human Capital for the Group and has more than 27 years’ experience across various industries in human resources, corporate affairs, communication, stakeholder management, ESG and sustainability. Prior to joining Sibanye-Stillwater, he was Head: Human Resources, Transformation and Corporate Communications at ArcelorMittal South Africa Limited (ArcelorMittal) from June 2009. He previously occupied several senior management positions at ArcelorMittal and Human Resources Director for sub-Saharan Africa at the PepsiCo Incorporated.
Mika Seitovirta (62)
Chief Regional Officer: Europe
MSc (Econ), University of Vaasa, Finland
Mika Seitovirta was appointed Chief Regional Officer: Europe on 14 December 2021. Mika has gained extensive international experience through his senior leadership roles in global companies across a wide range of industries. He has previously served as CEO of Outokumpu Oyj and Glaston Corporation, as Managing Director of Hartwall Oyj/Scottish & Newcastle PLC and as Executive Chairman of Ferrovan Oy. In addition to his current roles as Executive Chairman of Keliber Oy, and Chairman of Metroauto Oy and K. Hartwall Oy Ab, Mika has also served as a Senior Advisor and Executive Coach for the Boston Consulting Group Inc. Mika’s significant experience in the European automobile industry, including various positions held for more than a decade at Volvo and in the European ferroalloys industry, proves invaluable to the growth of Sibanye-Stillwater’s battery metals business in Europe.
Lerato Legong (45)
Chief Legal Officer
LLB, University of Pretoria
Lerato Legong is the Chief Legal Officer of Sibanye-Stillwater. He has over 21 years’ experience and has served both in South African and international private practice and as in-house counsel in the mining industry. Prior to joining Sibanye-Stillwater on 16 March 2020, he held management positions at South32 Limited and served as head of legal at the Minerals Council South Africa. He has also held legal positions at Mintails Limited, Anglo Operations Limited and Sasol Oil Proprietary Limited.
28
Laurent Charbonnier (49)
Chief Commercial and Development Officer
École Centrale Paris, Institut d’Etudes Politiques de Paris
Laurent Charbonnier is the Chief Commercial and Development Officer at Sibanye-Stillwater. He has over 20 years’ experience in investment banking and was appointed on 16 November 2020. Prior to joining Sibanye-Stillwater, Laurent worked at UBS Group AG, Credit Suisse Group and HSBC Bank, where he was Managing Director and Global Head for Metals and Mining. Laurent has been involved in numerous large merger and acquisitions, initial public offerings, rights issues, bonds and other structured financings for the metals and mining sector. In particular, he was the lead advisor to Sibanye-Stillwater on the acquisitions and related financings (bridge financing, rights issue and bonds) of Aquarius, Rustenburg, Stillwater and Lonmin.
Charles Carter (61)
Chief Regional Officer: Americas
BA (Hons), University of Cape Town; D.Phil, Oxford University
Charles Carter joined the Group on 1 June 2022 as Chief Regional Officer: Americas. He has held executive roles in gold exploration, mining and refining in South Africa, Colombia and the United States during a 25 year career at AngloGold prior to joining Sibanye-Stillwater. He is a past chairman of the Denver Gold Group Inc. and has been a director of Rand Refinery Proprietary Limited. Executive accountabilities at AngloGold included Group Strategy, Corporate Finance and Business Development, Investor Relations and Communications, Global HR, and executive lead for the Colombia business. Charles began his career at Anglo American Corporation and has also worked for RFC Corporate Finance Limited. In addition to his graduate studies, he has also completed management development programmes at the Colorado School of Mines, Kellogg School of Management at Northwestern University and Harvard University.
Melanie Naidoo-Vermaak (49)
Chief Sustainability Officer
BSc, BSc (Hons), University of KwaZulu Natal; MSc (Sustainable Development), University of Johannesburg; MBA, University of Southern Queensland
Melanie Naidoo-Vermaak was appointed as the Chief Sustainability Officer on 1 January 2024. Her expertise in sustainable development has been built over 20 years in the private mining and public sectors in South Africa as well as in international environmental management exposure gained in the United Kingdom, Australia, Papua New Guinea, Fiji and in Africa. Before joining Sibanye-Stillwater, she worked at leading international mining companies, including Harmony, De Beers Consolidated Mines Limited, BHP Billiton Limited and Anglo American PLC. Melanie is a member of the Minerals Council South Africa’s environmental policy committee. Melanie held various directorships in her capacity as Senior Executive and Prescribed Officer at Harmony. These included Chemwes Proprietary Limited, Covalent Water Company Proprietary Limited, First Uranium Proprietary Limited, Nuclear Fuels Association of South Africa Proprietary Limited, Tswelopele Beneficiation Operation Proprietary Limited, Platistone Kalgold Proprietary Limited, Golden Core Trade and Invest Proprietary Limited, Harmony Moab Khotsong Operations Proprietary Limited, Mine Waste Solutions Proprietary Limited, Margaret Water Company Non-Profit Company, Virginia Jewellery School Non-Profit Company, Virginia Sports Academy Non-Profit Company, Harmony Community Trust, Harmony Environmental Trust, Harmony Social Trust and Wonderfontein Trust.
Former Directors and C-Suite Management
Former directors
Savannah Nonhlanhla Danson (56)
BA (Hons) (Communication Science and Finance), Bridgewater University, United States; MBA (Strategic Planning and Finance), DeMontford University
Savannah Danson served as a Sibanye-Stillwater independent non-executive director from 23 May 2017 until her resignation on 11 March 2024. As the founder and executive chairperson of Bunengi Investment Group, Savannah has a wealth of experience from the finance, mining, infrastructure and media sectors. Savannah is also the chairperson of WSP Group Africa, a Canadian-listed engineering group.
Jacob Dawid Mostert (54)
Chief Organisational Growth Officer
Diploma in Labour Relations; MDP (Adv Labour Law); MBA, University of South Africa
Jacob Dawid (Dawie) Mostert was the Chief Organisational Growth Officer of Sibanye-Stillwater until his resignation in August 2023. He has more than 26 years’ experience in the mining industry and was appointed on 1 January 2013 as Senior Vice President: Organisational Effectiveness, focused on introducing new operating and business models in support and directing the turnaround at Sibanye-Stillwater post the unbundling from Gold Fields. With Sibanye-Stillwater adopting value creation as its strategic intent and consequently entering the PGM mining sector, he was appointed and accepted the position and role as Executive Vice President: Commercial Services in 2019, and as Executive Vice President: Organisational Growth in 2020, focused primarily on leading the organisational culture development strategy and development of business systems that enable the development of top and senior management, senior talent and succession management culminating in future ready leaders. In 2021, Dawie was appointed as Chief Organisation Growth Officer to focus on ensuring that Group’s management structure has been regionalised and optimised in order to deliver on the Group’s growth strategy. Prior to joining Sibanye-Stillwater, he served as Vice President: Commercial Services at Gold One in 2012 and Vice President: Human Capital at Great Basin Gold Limited (Great Basin Gold) from 2006 to 2012. Prior to joining Great Basin Gold in 2006, he was Executive: Organisational Development and Employee Relations at Harmony from 2002 to 2006. Dawie joined Harmony in 1996 as part of the merger and acquisition transformational team playing a leading organisational integration role. During 2001 to 2002 he was appointed Mine Manager at the then Elandsrand mine leading a management team post the integration phase.
29
ENVIRONMENTAL AND REGULATORY MATTERS
South Africa
Environmental
Overview
Sibanye-Stillwater’s operations in South Africa are subject to various laws and regulations relating to the protection of the environment. In particular, the Constitution of South Africa, 1996 (South African Constitution) grants the right to an environment that is not harmful to human health or wellbeing, and to the protection of that environment for the benefit of present and future generations through reasonable legislation and other measures that secure ecologically sustainable development. In addition, the South African Constitution and various environmental legislation enacted and implemented since 1996, grant legal standing to a wide range of interest groups to enforce their environmental rights against private entities as well as the South African government.
South African environmental legislation requires companies with activities that are reasonably expected to have environmental impacts to obtain authorisations, permits, licences and other approvals to ensure such companies assess the extent of such impacts and put reasonable and practicable measures in place to manage and mitigate these impacts.
The most critical and applicable environmental legislation for the mining industry in South Africa are the MPRDA, the NEMA and the NWA. Under the One Environmental System (OES), the DMRE Minister (and thus by delegation, the prescribed officials of the DMRE) is the Competent Authority for all environmental issues within the mining industry, including the approval or rejection of environmental authorisations (EAs) under the NEMA framework for listed activities pertaining to prospecting and mining operations. The Minister of the DFFE is the Appeal Authority for any applications/authorisations approved or rejected by the DMRE Minister. Under the transitional arrangements between the MPRDA and the NEMA, all Environmental Management Programmes (EMPRs) previously approved under the MPRDA are deemed to be approved under NEMA.
NEMA contains the following four key provisions: (i) company directors, in their personal capacity, may be held liable for any environmental degradation and/or the remediation thereof; (ii) every holder of a mining right will remain responsible for any environmental liability, pollution or ecological degradation, the pumping and treatment of polluted or extraneous water and the management and sustainable closure thereof, notwithstanding the issuance of a closure certificate; (iii) the DMRE Minister is obliged to appoint environmental mineral resource inspectors to monitor the compliance of mining companies, as well as the enforcement of provisions insofar as it relates to prospecting, exploration, mining or production; and (iv) a duty of care to the environment is imposed on all persons to take reasonable measures to prevent pollution and environmental degradation.
Financial Provisioning Regulations
The Financial Provisioning Regulations require mining companies to make financial provision for degradation and rehabilitation available prior to the commencement of mining activities to ensure adequate funding upon mine closure. Various vehicles may be utilised, including rehabilitation guarantees, insurance policies and rehabilitation trust funds. Mining companies are also required to undertake progressive rehabilitation on an ongoing basis in respect of environmental rehabilitation. Compliance with Financial Provision Regulations was temporarily suspended in February 2024, until publication in the Government Gazette. Sibanye-Stillwater will continue to assess the quantum of its financial provision in line with the updated methodologies stipulated by the Financial Provisioning Regulations.
Carbon Tax
Energy is a significant input and cost to Sibanye-Stillwater’s mining and processing operations, with its principal energy sources being electricity and purchased petroleum products. A number of governments or governmental bodies, including the United Nations Framework Convention on Climate Change (UNFCCC), have introduced or are contemplating regulatory changes in response to the potential impact of climate change, including in jurisdictions in which Sibanye-Stillwater operates.
Final carbon tax liability is calculated as gross GHG emission, less allowances that are built into the carbon tax design. Net GHG emission is then multiplied by the applicable carbon tax rate to determine carbon tax liability. During the initial transition phase, tax-free thresholds, allowances and carbon offsets were introduced to ease the impacts of initial implementation of the tax. These allowances range from 60% to 75% of emissions across sectors, with additional allowances and offsets of up to 95% for the mining sector. The Carbon Offset Regulations, 2019 (Carbon Offset Regulation) outline the eligibility criteria for offset projects (which includes certain types of renewable energy, energy efficiency and onsite cogeneration projects) and the procedures for claiming offset allowances. Companies are allowed to use such projects to offset up to a maximum of 5% to 10% of their total GHG emissions to reduce their tax liability.
It is expected that Sibanye-Stillwater’s carbon tax liability will increase with Phase 2 of the carbon tax implementation (planned for 2026), during which the carbon tax rates will increase and some or all of the Phase 1 carbon tax allowances are anticipated to gradually fall away. The Carbon Offset Regulations also propose a higher carbon tax rate of R640/tCO2e will apply to the portion of GHG emissions which exceed the mandatory carbon budget to be allocated to companies under the Climate Change Bill.
The Climate Change Bill, passed by the South Africa’s National Assembly in October 2023 and pending finalisation, is also expected to update the GHG reporting regime applicable to Sibanye-Stillwater. Existing reporting requirements under the Air Quality Act, and various regulations promulgated thereunder, will remain in force and effect until these regulations are amended, replaced or repealed by the Climate Change Bill.
The implementation and roll-out of Sibanye-Stillwater’s Energy and Decarbonisation Strategy, which includes the introduction of renewable energy in the form of solar and wind into Sibanye-Stillwater's energy mix, is expected to reduce its Scope 2 emissions, which in turn is anticipated to reduce the financial impact of its indirect exposure to carbon tax in its supply chain. For further information regarding Carbon Tax and other risks related to Sibanye-Stillwater’s GHG emissions, see – Risk Factors – Regulation of greenhouse gas emissions may materially adversely affect Sibanye-Stillwater’s operations.
30
Air Quality Act
Under the Air Quality Act, the South African government has established minimum emission standards for certain activities that result in air emissions and for which atmospheric emission licences (AELs) must be held. Noncompliance with the conditions of an AEL as well as the minimum emissions standards under the Air Quality Act, is an offence. Emissions are reported to the regulator in accordance with the AEL conditions. Air dispersion modelling is conducted as part of air quality impact assessments. This is used to predict air quality concentrations at receptor locations in nearby communities. The AEL reports, which include results of stack emissions, are in place to demonstrate levels of conformance.
Waste Act
The Waste Act regulates, among other things, the identification, investigation, remediation, rehabilitation and inventorying of contaminated land. The Waste Act requires that waste management licences (WMLs) are obtained for activities relating to the establishment and reclamation of residue deposits and residue stockpiles.
The Waste Act also provides for waste licensing requirements for general and hazardous waste for listed activities ranging from storage of waste salvage yards and wastewater treatment plants through to disposal by landfill. Sibanye-Stillwater currently has a number of licenced waste management facilities, such as its Beatrix operations, Rustenburg Operations, Marikana Operations and Precious Metals Refinery. These facilities are managed in compliance with the Waste Act. In addition, the waste management activities at some of Sibanye-Stillwater’s facilities are regulated by and managed through the existing approved EMPRs, in accordance with the transitional provisions contained in the Waste Act and its regulations.
The Waste Act, pursuant to further regulations, also provides for registration with the DFFE of all operations generating hazardous waste or operating waste disposal facilities; quarterly reporting by disposal facilities of quantities of waste received for disposal; classification of waste and landfills which determines the disposal obligations and other requirements according to the waste classification regulations. Detailed waste classifications and associated safety data sheets have been developed for all of Sibanye-Stillwater’s hazardous wastes where relevant (e.g. the PGM operations, and waste disposed to landfills have been assessed and are directed to the relevant class of landfill).
The Waste Act further defines the requirements and risk-based assessment process to be undertaken to have waste streams excluded from the definition of waste, provided there is a defined beneficial use for this waste. Sibanye-Stillwater has identified waste ash as a waste stream that falls within the parameters of these regulations, with submission to be made to obtain approval on exclusions.
In 2023, NEMLAA introduced key changes to the regulation of management of residue deposits and stockpiles, such that residue stockpiles and residue deposits no longer qualify as waste, or require an WML under the Waste Act. Instead, residue stockpiles and deposits will be regulated under NEMA once the relevant NEMLAA sections come into effect.
Water Use
Under South African law, mining operations are subject to water use licences (WULs) and general authorisations that govern each operation’s water usage and that require, among other things, mining operations to achieve and maintain certain water quality limits regarding all water discharges. The NWA provides for the management of all surface and groundwater resources, including the protection of the water systems for ecological requirements. The NWA, as well as the associated notices published thereunder provide for conditions that must be adhered to and dictate the requirements for water use authorisation for various water uses that contain activity specific requirements based on the specialist information submitted by means of the application process. All of Sibanye-Stillwater’s operations hold the necessary water-related permits. Certain WULs held by Sibanye-Stillwater are currently being reviewed and amended by the DWS for final issuance. In FY2024 or FY2025, the DWS intends to roll-out a discharge charge for all waste-related activities that may impact on water resources. This charge may have significant cost implications for Sibanye-Stillwater’s operations in South Africa. See – Risk Factors – Risks related to ESG – Sibanye-Stillwater’s operations are subject to water use and wastewater regulations, which could impose significant costs and burdens.
Biodiversity Act
The Biodiversity Act aims to protect the natural diversity within South Africa, particularly threatened and endangered species, as well as the protection of essential ecosystems and the associated services. The Biodiversity Act necessitates certain management requirements and permits for any restricted activity involving a specimen of a listed threatened or protected species.
National Nuclear Regulator Act
Sibanye-Stillwater undertakes activities which are regulated by the NNR Act. The NNR Act requires Sibanye-Stillwater to obtain authorisation from the National Nuclear Regulator and undertake activities in accordance with the conditions of such authorisations. Each of Sibanye-Stillwater’s South Africa gold operations possesses and maintains a Certificate of Registration as required by the NNR Act.
NEMLAA
NEMLAA came into effect on 30 June 2023. NEMLAA has made certain changes to NEMA, the Waste Act, the Air Quality Act, the Biodiversity Act and a number of other specific environmental laws. Notable amendments include:
•NEMA amended to expressly provide for “progressive rehabilitation”, expanding vehicles that may be utilised for financial provision (which includes a rehabilitation trust fund) and to enable drawdowns of financial provision up to ten years before the final decommissioning and closure;
•regulation of residue stockpiles and deposits shifted from the Waste Act to NEMA; and
•requiring applicants for rectification under 24G of NEMA to undertake certain measures, including suspending, investigating, assessing and/or remediating the adverse impacts of certain activities and increasing the maximum administrative fine to R10 million.
31
Enforcement of Environmental Laws
The NEMA (for the mining industry enforced by the DMRE), the MPRDA (enforced by the DMRE) and the NWA (enforced by the DWS) all contain provisions for the appointment of environmental management inspectors, which have sweeping authority and mandates to enforce environmental legislation. There are certain new environmental laws and regulations, such as NEMLAA and the Financial Provisioning Regulation, which were viewed as having a negative impact on the growth and development of the mining industry. To date, Sibanye-Stillwater’s approach has been to work with the South African government and the Minerals Council to positively influence new and emerging legislation as far as possible in the interest of the industry as well as in the interest of the environment.
NHRA
The NHRA aims to protect and conserve national and provincial heritage sites and resources, requiring permits if such sites or resources are to be affected. The NHRA is administered by the South African Heritage Resources Agency (SAHRA) at a national level, and by various provincial heritage resources authorities as a provincial level. Non-compliance with the NHRA is an offence and may result in significant fines or imprisonment.
Health and Safety
Mining health and safety performance is regulated by the South African Mine Health and Safety Act, 1996 (MHSA). The MHSA, among others, requires the employer to ensure, as far as reasonably practicable, that operating mines provide and maintain a safe and healthy working environment. For non-operating mines where no closure certificate has been issued, the employer must take reasonable steps to continuously prevent injuries, ill health, loss of life or damage of any kind. Employees have the right to refuse to perform hazardous work or enter into an unsafe working place. The MHSA describes the powers and functions of the Mine Health and Safety Inspectorate (MHSI), within the jurisdiction of the DMRE, as part of the process of enforcement.
As legally required, all employees are represented in formal joint management/worker health and safety committees, through their representatives, to help monitor and advise on occupational health and safety programmes.
In terms of the MHSA, an employer is obligated, among others, to ensure, as far as reasonably practicable, that mines are designed, constructed and equipped to provide conditions for safe operation and a healthy working environment, and the mines are commissioned, operated, maintained and decommissioned in such a way that employees can perform their work without endangering their health and safety or that of any other person. Every employer must ensure, as far as reasonably practicable, that people who are not employees, but who may be directly affected by the activities at a mine, are not exposed to any health and safety hazards. If there is reason to believe that any occurrence, practice or condition at a mine endangers or may endanger the health or safety of any person, the MHSA authorises MHSI inspectors to restrict or stop, partially or wholly, operations at any mine or a workplace, and require an employer to take steps to rectify the occurrence, practice or condition before such restriction or stoppage can be lifted. The principal safety risks associated with mining operations in South Africa include technical complexity, depth of operations, intensity of labour, the narrow nature of ore body and maturity of mines.
The principal health risks arise from occupational exposure to silica dust, noise, heat and certain hazardous chemicals. The most significant occupational diseases affecting Sibanye-Stillwater's workforce include lung diseases such as silicosis, TB, a combination of both, and COAD, as well as NIHL.
The Occupational Diseases in Mines and Works Act, 1973 (ODMWA) governs compensation paid to mining employees who contract certain occupational illnesses, such as silicosis. The South African Constitutional Court has ruled that a claim for compensation under ODMWA does not prevent an employee from seeking compensation from an employer in a civil action under common law (either as individuals or as a class). In 2018, the Gold Working Group, including Sibanye-Stillwater, agreed to the Settlement Agreement, which was approved by the Gauteng High Court in Johannesburg, to compensate all eligible workers (or their surviving relatives) suffering from silicosis who worked in the Gold Working Group companies’ mines from 12 March 1965 to the date of the Settlement Agreement. The terms of the Settlement Agreement are confidential. See – Annual Financial Report – Consolidated financial statements – Notes to the consolidated financial statements – Note 31: Occupational healthcare obligation.
A failure to comply with MHSA is a criminal offence for which an employer, or any responsible person, may be charged and, if successfully prosecuted, be fined or imprisoned, or both. The MHSI also has the power to impose administrative fines upon an employer in the event of a breach of the MHSA. The maximum administrative fine that may be imposed is R1 million per transgression.
Mining Rights
The MPRDA
Under the MPRDA, which came into effect in 2004, prospecting rights may be granted for an initial maximum period of five years and can be renewed once upon application for a further period not exceeding three years. Mining rights are valid for a maximum period of 30 years, and can be renewed upon application for further periods, each of which may not exceed 30 years. A wide range of factors and principles will be considered by the DMRE Minister when exercising his discretion whether to grant or renew these rights. A prospecting or mining right can be suspended or cancelled if the holder conducts prospecting or mining operations in breach of the MPRDA, a term or condition of the right or an environmental management plan, programme or environmental authorisation (as may be applicable), or if the holder of the right submits false, incorrect or misleading information to the DMRE. The MPRDA sets out a process which must be followed before the DMRE Minister is entitled to suspend or cancel the prospecting or mining right.
The MPRDA also empowers the DMRE Minister to develop a Broad-Based Socio-Economic Empowerment Charter for the South African Mining Industry to set the framework, targets and timetable for effecting entry of HDSAs into the mining industry and to allow such South Africans to benefit from the exploitation of the country’s mineral resources.
The MPRDA requires mining companies to submit annual reports on HDSA ownership and implementation of the approved SLP applicable to the mining right in question, setting out their commitments, among other things, to human resource and local economic development.
32
Under the MPRDA, mining companies must undertake “meaningful consultations” with interested or affected parties in applying for mining rights, including providing a reasonable opportunity for affected parties to comment on the impact of such prospecting or mining activities on their right of use of the land. The definition of interested and affected parties includes host communities, landowners (traditional and title deed owners); traditional authority; land claimants; lawful land occupier; holders of informal land rights; the Department of Agriculture, Land Reform and Rural Development; any other person (including on adjacent and non-adjacent properties) whose socio-economic conditions may be directly affected by the proposed prospecting or mining operation; the local municipality and the relevant Government Departments, agencies and institutions responsible for the various aspects of the environment and for infrastructure which may be affected by the proposed project.
Mining right holders are furthermore required to prepare closure reports in accordance with the provisions of NEMA and the EIA Regulations. The MPRDA, as amended, sets out the procedure for the lodgement of internal appeals in terms of section 96 of the MPRDA, which overhauls the appeal procedure previously provided for in the MPRDA.
Geoscience Regulations
On 30 March 2022, the DMRE Minister published the Geoscience Act Regulations 2022 (Geoscience Regulations) to manage and promote mineral exploration, knowledge and investment in South Africa. The Geoscience Regulations establish the Council for Geoscience (CGS), to which it is mandatory for mining and exploration companies to submit certain geoscience data related to their prospecting and reconnaissance activities, as applicable. It also places an obligation on owners of onshore and offshore geoscience data, and information not related to prospecting and reconnaissance, to submit geoscience data and information to the CGS. The interpretation of the Geoscience Regulations may be subject to dispute in future and could impose significant costs and burdens on Sibanye Stillwater’s business if found to be applicable to mining operations held under its mining rights in South Africa. It may also impact Sibanye-Stillwater’s business given the proprietary nature of the data and information.
2018 Mining Charter
On 27 September 2018, the Broad-Based Socio-Economic Empowerment Charter for the Mining and Minerals Industry, 2018 (2018 Mining Charter) was published and came into effect on the same day. In September 2021, the High Court of South Africa held that the 2018 Mining Charter is a policy document and does not, per se, bind holders of mining titles, unless its terms have been lawfully incorporated into such mining titles. The High Court also set aside various provisions of the 2018 Mining Charter. Following the judgment, the 2018 Mining Charter recognises the “once empowered, always empowered” principle in relation to existing rights and requires that all applications for new mining rights, excluding renewal applications, must have a minimum of 30% HDSA ownership.
For further information on the 2018 Mining Charter see – Sibanye-Stillwater’s mining rights are subject to legislation, which could impose significant costs and burdens and which impose certain ownership requirements, the interpretation of which is the subject of dispute.
While the constitutional and legislative processes required for the amendments to the MPRDA may be lengthy, to the extent necessary to comply with legislative changes, Sibanye-Stillwater may in the future be required to adjust the ownership structure of the company’s mining assets in order to meet B-BBEE requirements, which may be prescribed by law at such time. Sibanye-Stillwater may also incur significant costs or have to issue additional shares as a result of changes in the interpretation of existing laws and guidelines or the imposition of new laws relating to HDSA ownership requirements, which may have a material adverse effect on Sibanye-Stillwater’s business, operating results and financial condition.
The Broad-Based Black Economic Empowerment Act, 2003 (B-BBEE Act) and the Broad-Based Black Economic Empowerment Amendment Act, 2013 (B-BBEE Amendment Act)
The B-BBEE Act establishes a national policy on broad-based black economic empowerment with the objective of increasing the participation of HDSAs in the economy. The B-BBEE Act provides for various measures to promote B-BBEE, including empowering the Minister of Trade, Industry and Competition to issue the Codes of Good Practice for Broad-based Black Economic Empowerment (B-BBEE Codes), with which organs of state and public entities and parties interacting with them or obtaining rights and licences from them would be required to comply. The B-BBEE Act and the B-BBEE Codes do not require the DMRE to apply the B-BBEE Codes when determining the qualification criteria for the issuing of mining rights, nor do they require that the DMRE apply the B-BBEE Codes as a requirement for the retention of existing mining rights. The B-BBEE Codes will nevertheless apply to mining companies if they wish to be scored for the purpose of contracting with state institutions. B-BBEE also has a cascading effect, even where a particular company does not interact with the South African government or the public sector. In order to score highly on the procurement element of the scorecard, companies need to ensure that as many of their service providers as possible also score highly on the scorecard and will, therefore, give preference to service providers who have good B-BBEE credentials. Whilst compliance with the B-BBEE Codes is more often a commercial imperative as opposed to a legal one, a public company listed on the JSE must annually submit a compliance report (in terms of section 13G(2) of the B-BBEE Act) to the B-BBEE Commission in the prescribed form.
In 2014, the B-BBEE Amendment Act, 2013 (B-BBEE Amendment Act) was brought into operation. Under the B-BBEE Amendment Act, the B-BBEE Act overrides the provisions of any other law in South Africa that conflict with the B-BBEE Act, provided any such conflicting laws were in force immediately prior to the effective date of the B-BBEE Amendment Act. This provision came into effect on 24 October 2015 and, on 27 October 2015, the Minister for Trade, Industry and Competition published a government gazette notice declaring an exemption in favour of the DMRE from applying the requirements contained in section 10(1) of the B-BBEE Act for a period of 12 months. The exemption can be read as confirmation that the Department of Trade, Industry and Competition sees the B-BBEE Codes as “applicable” to the Mining Industry after the exemption was lifted on 27 October 2016.
33
This raises the question of whether the B-BBEE Act and the B-BBEE Codes may overrule the Mining Charter (which for the purposes of comparison with the B-BBEE Act, would include later iterations of the Mining Charter) in the future. There is no clarity on this point at this stage. The revised Broad-Based Black Economic Empowerment Codes of Good Practice (the Revised BEE Codes) became effective on 1 May 2015. Both the B-BBEE Amendment Act and the Revised BEE Codes expressly stipulate that where an economic sector in South Africa has a sector code in place for BEE purposes, companies in that sector must comply with the Sector Code. For purposes of the B-BBEE Act, the Mining Charter (as amended) is not a Sector Code. It is not clear at this stage how the Mining Charter and Revised BEE Codes relate to each other. On 17 February 2016, the Minister of Trade, Industry and Competition published a gazette notice which repealed and confirmed the validity of a number of Sector Codes. The omission of the Mining Charter from the notice can be interpreted as confirmation that the Mining Charter is not contemplated as a Sector Code. This supports the interpretation that the B-BBEE Act was not intended to trump the Mining Charter. While it remains to be seen how this will be interpreted, it appears that the B-BBEE Act and the B-BBEE Codes will not overrule the Mining Charter in the future. However, this remains undetermined in law and may be resolved through either government clarification or judicial intervention.
Housing and Living Conditions Standard
The Housing and Living Conditions Standard (Housing Standard) was published by the DMRE Minister in December 2019. Among other things, the Housing Standard provides that:
•an existing mining right holder must, within a period of twelve months from the date of publication of the Housing Standard, submit a detailed Housing and Living Conditions Plan
•a new mining right holder must, within a period of 12 months from the date of granting of the mining right, consult with organised labour, the relevant municipality and the Department of Human Settlements regarding its mine employee housing and living conditions needs
•a mining right holder who intends developing accommodation for its mine employees shall, after consultation with relevant stakeholders, where feasible, acquire land within close proximity of the mine operations and plan housing needs in support of compact, integrated and mixed land use environment
•a mining right holder must offer employees a range of housing options, which includes amongst others rental accommodation, private home ownership, government subsidised home ownership and living out allowance
Under South African case law, the Housing Standard (as with the Mining Charter) does not have the status of law, as would be the case with legislation and regulations. As such, the MPRDA does not entitle the DMRE to cancel or suspend a mining right in terms of section 47 of the MPRDA on the basis of a failure to comply with the Housing Standard. Furthermore, section 93 of the MPRDA does not authorise the DMRE to issue directives for failures to comply with the Housing Standard. However, in practice the DMRE may issue directives in the absence of the requisite statutory authority. In this instance, the mining right holder would be entitled to challenge that exercise of public power by the DMRE.
Mine Community Resettlement Guidelines, 2019
The DMRE Minister published Mine Community Resettlement Guidelines, 2022 (Guidelines) on 30 March 2022. Some of the key provisions of the Guidelines are as follows:
•the Guidelines apply to both applicants and existing holders of mining rights, prospecting rights and mining permits in terms of the MPRDA where prospecting or mining activities will have the effect of displacement or resettlement of the affected parties
•the Guidelines require applicants and holders to make provision for development of a Resettlement Plan, Resettlement Action Plan and Resettlement Agreement. Furthermore, the Guidelines provide that no mining activity shall commence until a Resettlement Agreement is reached on the appropriate amount of compensation as a result of resettlement of the affected parties. An applicant or holder, where feasible, must provide financial assistance to affected parties. The Guidelines also envisage a “party to party dispute resolution process” that must be invoked prior to embarking on the regional manager-led process in section 54 of the MPRDA
Employment Equity Amendment Act, 2022
In April 2023, President Cyril Ramaphosa signed into law the Employment Equity Amendment Act, 2022 (EEAA). The EEAA, which has not yet come into force, amends the existing Employment Equity Act, 1998 with new measures to promote diversity and equality in the workplace. The key aspects of the EEAA includes the introduction of sectoral numerical targets, as set by the South African Minister of Employment and Labour, the purpose which is to ensure the equitable representation of people from designated groups (historically disadvantaged groups of people based on race, gender and disability) at all occupational levels in the workforce. Sibanye-Stillwater will be required to comply with any sectoral targets set by the South African Minister of Employment and Labour as well as the EEAA more broadly, and will be subject to penalties for noncompliance. In May 2023, the Minister of Employment and Labour published the draft employment equity regulations, which contain the sectoral targets, for comment. Members of the public were invited to comment until 11 June 2023. The Minister has not yet published the final employment equity regulations.
The Royalty Act
The Mineral and Petroleum Resources Royalty Act, 2008 (Royalty Act) imposes a royalty on refined and unrefined minerals payable to the South African government.
The royalty in respect of refined minerals (which include gold and PGMs, where PGMs are refined and smelted to a 99.9% purity) is calculated by multiplying the gross sales of the refined mineral during the year of assessment by the percentage determined by dividing EBIT by the product of 12.5 times gross sales, plus an additional 0.5%. EBIT refers to taxable mining income (with certain exceptions such as no deduction for interest payable and foreign exchange losses) before assessed losses but after capital expenditure. A maximum royalty of 5% of revenue is applicable in respect of refined minerals.
The royalty in respect of unrefined minerals (including PGMs) is calculated by multiplying the gross sales of the unrefined mineral during the year of assessment by the percentage determined by dividing EBIT by the product of 9 times gross sales, plus an additional 0.5%. EBIT refers to taxable mining income (with certain exceptions such as no deduction for interest payable and foreign exchange losses) before assessed losses but after capital expenditure. A maximum royalty of 7% of revenue is applicable in respect of unrefined minerals.
34
Sibanye-Stillwater currently pays a royalty based on the refined and unrefined minerals royalty calculation as applied to its gross sales.
The South African Minister of Finance appointed the Davis Tax Committee to investigate and review the current mining tax regime. The committee’s first interim report on mining, which was released for public comment on 13 August 2015, proposed no changes to the royalty regime but recommended the discontinuation of the upfront capital expenditure write-off regime in favour of an accelerated capital expenditure depreciation regime. In addition, the report recommended retaining the so called “gold formula” for existing gold mines only, as new gold mines would be unlikely to be established in circumstances where profits are marginal or where gold mines would conduct mining of the type intended to be encouraged by the formula. The committee also recommended the phasing out of additional capital allowances available to gold mines in order to bring the gold mining corporate income tax regime in line with the tax system applicable to all taxpayers. In November 2017, following a period of public comment, the Davis Tax Committee issued its final report which largely reaffirmed its initial recommendations. The South African National Treasury will continue to consider the Davis Tax Committee’s final recommendations. It is not clear at this stage which, if any, of the recommendations will be adopted as legislation in the future (following an aborted attempt to implement changes to the capital allowance regime in 2020). For further information regarding the Davis Tax Committee’s final recommendations, see – Sibanye-Stillwater is subject to the imposition of various regulatory costs, such as income taxes and royalties, changes to which may have a material adverse effect on Sibanye-Stillwater’s operations and profits.
Exchange Controls
South African law provides for Exchange Control Regulations which, among other things, restrict the outward flow of capital from South Africa to countries not forming part of the Common Monetary Area (CMA), the latter consisting of South Africa, Namibia, Lesotho and Eswatini. The Exchange Control Regulations, which are administered by the Financial Surveillance Department of the SARB, regulate international transactions involving South African residents, including companies.
SARB approval is therefore required for Sibanye-Stillwater and its South African subsidiaries to incur and/or repay loans from or to non-South African residents, including non-South African Group companies. Similarly, Sibanye-Stillwater and its South African subsidiaries would require SARB approval in order to guarantee obligations of any of Sibanye-Stillwater’s subsidiaries with regard to commitments towards or funds obtained from non-residents of the CMA.
Transfers of funds from South Africa for the purchase of offshore assets or shares in offshore entities or for the creation or expansion of business ventures offshore also require SARB approval. A SARB appointed authorised dealer may approve such investment if the investment is a new outward foreign direct investment (minimum 10% interest) where the total cost does not exceed R5 billion per company per calendar year.
Sibanye-Stillwater must also obtain approval from the SARB for any fundraising involving a currency other than rand. It is possible that the SARB may impose conditions on Sibanye-Stillwater’s use of the proceeds of any such capital raising, such as limits on Sibanye-Stillwater’s ability to retain the proceeds of the fundraising outside South Africa or requirements that Sibanye-Stillwater seeks further SARB approval prior to applying any such funds to a specific use.
Historically, so called “loop structures”, where non-South African subsidiaries invest in South African entities, have also been prohibited. A loop structure could occur where a South African exchange control resident (such as Sibanye-Stillwater, or one of its South African subsidiaries) sets up an offshore structure which reinvests into the CMA by acquiring shares or other interests (e.g. loans) in a CMA company or CMA asset. The full loop structure restriction has been lifted with effect from 1 January 2021, on the conditions that an existing loop structure be placed on record with the SARB, or any new loop structure similarly be placed on record subsequent to the finalisation of the transaction and that, where South African assets are acquired through the loop structure, that this takes place on an arm’s length basis.
United States
Environmental
Overview
In the United States, Sibanye-Stillwater’s US PGM operations are subject to extensive federal, state and local government controls and regulations, including regulation of mining and exploration activities which could involve the discharge of materials and contaminants into the environment, the investigation and clean-up of such discharges, disturbance of land, reclamation of disturbed lands, associated potential impacts to threatened or endangered species, management of waste materials, and other environmental concerns.
In particular, statutes including, but not limited to, the Clean Air Act, the Clean Water Act, the RCRA, the EPCRA, the Endangered Species Act, the NEPA and CERCLA impose permit requirements, effluent standards, air emission standards, waste handling and disposal restrictions and other design and operational requirements, as well as record keeping and reporting requirements, upon various aspects of mineral exploration, extraction and processing. In addition, the existing mining operations may become subject to additional environmental control and mitigation requirements if applicable federal, state and local laws and regulations governing environmental protection, land use and species protection are amended or become more stringent in the future.
In addition, the federal regulation under the RCRA governing the manner in which secondary materials and byproducts of mineral extraction and beneficiation are handled, stored and reclaimed or reused is subject to frequent review by regulatory agencies.
Generally, compliance with the applicable environmental rules and regulations in the United States requires Sibanye-Stillwater US PGM operations to obtain permits issued by federal, state and local regulatory agencies and to file various reports that track operational monitoring, compliance, performance, records maintenance activities and measure its operational effect on the environment. Certain permits require periodic renewal or review of their conditions.
35
Climate Change and GHG Emissions Regulations
In the United States, Sibanye-Stillwater is subject to legislative and regulatory initiatives that are underway to limit GHG emissions. The US Congress has considered legislation that would control GHG emissions through a “cap and trade” program and several US states have already implemented programs to reduce GHG emissions. In addition, the US Supreme Court determined in a 2007 ruling that GHG emissions are “air pollutants” within the meaning of the federal Clean Air Act. In response, the EPA promulgated an endangerment finding paving the way for regulation of GHG emissions under the Clean Air Act. In 2010, the EPA issued a final rule, known as the “Tailoring Rule”, which makes certain large stationary sources and modification projects subject to permitting requirements for GHG emissions under the Clean Air Act. In June 2014, the US Supreme Court invalidated portions of the federal Tailoring Rule, but the ruling upheld the EPA’s authority to require new or modified facilities that are already subject to permitting requirements for conventional pollutants to comply with BACT for GHGs, as well. New or modified sources subject to permitting for conventional pollutants will be required to access BACT for GHG if the new source or the modification will result in an annual increase of 75,000 tons per year of CO2e.
Sibanye-Stillwater is also subject to GHG reporting requirements for specified large GHG emission sources in the United States. Portions of Sibanye-Stillwater’s US PGM operations hold a Title V Major Air Quality Permit, which requires Sibanye-Stillwater to annually calculate the GHG emissions from the US PGM operations and compare these amounts against reporting thresholds. Because current levels are well below reporting thresholds, the Sibanye-Stillwater’s US PGM operations are not currently required to report GHG emissions. Additionally, the assessment of GHG emissions is becoming an increasingly important part of NEPA assessments, particularly with the restoration of previously modified NEPA regulations in April 2022, and as a result, Sibanye-Stillwater may be required to mitigate its GHG emissions in connection with any future NEPA review.
President Biden has made climate change a central focus of his administration. In addition to re-entering the Paris Agreement on 20 January 2021, the Biden administration issued an executive order directing all federal agencies to review and take action to address any federal regulations, orders, guidance documents, policies and any similar agency actions promulgated during the prior administration that may be inconsistent with the administration’s policies. As a result, it is unclear the full extent to which certain recent regulatory developments may be modified or rescinded. The executive order also established the inter-agency working group, which is called on to, among other things, develop methodologies for calculating the “social cost of carbon,” “social cost of nitrous oxide” and “social cost of methane”.
In March 2024, the SEC published final rules which will require SEC registrants, including Sibanye-Stillwater, to significantly expand its climate-related disclosures, including, providing detailed climate-related risks, mitigation, oversight and goals disclosures, disclosing the impact of climate change-related events in the notes to its financial statements, publishing Scope 1 and 2 GHG emissions data and obtaining third-party assurance of such data, among other requirements. Required disclosure will be phased-in beginning in fiscal year 2026, with certain requirements set for longer compliance periods, such as the requirement for assurance of GHG emissions data, set to become effective in fiscal years 2030 (limited assurance) and 2034 (reasonable assurance), respectively.
Clean Air Act
In the United States, Sibanye-Stillwater’s US PGM operations are subject to the federal Clean Air Act and comparable state and local laws and regulations. These laws and regulations regulate emissions of air pollutants from various industrial sources, including ventilation exhaust, rock crushing activities, and mill processing used at Sibanye-Stillwater’s US PGM operations’ mines as well as smelting and refining stack emissions from its processing operations, and also imposes various monitoring and reporting requirements. For example, the smelting and refining operations are subject to particulate matter, carbon monoxide and nitrogen oxide limits under the federal New Source Performance Standards (NSPS), in addition to stringent sulphur dioxide (SO2) limits at the Sibanye-Stillwater’s US PGM smelting operations.
Additionally, as mines continue to grow and expand, ventilation demands, and associated emissions continue to escalate resulting in increases in ventilation exhaust emissions. Air quality laws and regulations may require that Sibanye-Stillwater’s US PGM operations obtain pre-approval for the construction or modification of certain projects or facilities expected to produce or significantly increase air emissions, obtain and strictly comply with air permits containing various emission and operational limitations and utilise specific emission control technologies to limit emissions.
Hazardous Substances and Waste
In the United States, Sibanye-Stillwater’s US PGM operations are subject to environmental laws and regulations relating to the management and release of hazardous substances, solid wastes and hazardous wastes. These laws generally regulate the generation, storage, treatment, transportation and disposal of solid and hazardous wastes and may impose strict joint and several liability for the investigation and remediation of affected areas where hazardous substances may have been released or disposed. For instance, the CERCLA, and comparable state laws impose liability, without regard to fault or the legality of the original conduct, on certain classes of persons that contributed to the release of a hazardous substance into the environment.
While some of the industrial wastes generated by the Sibanye-Stillwater’s US PGM operations are excluded from hazardous wastes regulations, it also generates industrial wastes that are subject to the requirements of the RCRA, and comparable state statutes.
Sibanye-Stillwater’s US PGM operations annually reports to the EPA, the United States Forest Service (USFS), and the Montana Department of Environmental Quality (Montana DEQ) in relation to releases of hazardous or toxic substances to the extent they exceed certain federal and state thresholds.
Water Discharges
In the United States, Sibanye-Stillwater’s US PGM operations are subject to the federal Clean Water Act and analogous state laws that impose restrictions and strict controls on the discharge of pollutants into waters, and construction activities in waters and wetlands. The scope of these regulated waters has been subject to controversy in recent years, culminating in the issuance of a revised definition of “waters of the United States” by the EPA in December 2022, which exerts federal jurisdiction under the Clean Water Act over traditional navigable waters, the territorial seas, interstate waters, as well as upstream water resources that significantly affect those waters. In addition, certain state regulations and the general permits issued under the Federal National Pollutant Discharge Elimination System program prohibit
36
the discharge of pollutants and chemicals. Spill prevention, control and countermeasure requirements of federal laws require appropriate containment berms and similar structures to help prevent the contamination of regulated waters in the event of a tank spill, rupture or leak.
In addition, the Clean Water Act and analogous state laws require individual permits or coverage under general permits for discharges of storm water runoff from certain types of facilities. These permits may require Sibanye- Stillwater’s US PGM operations to monitor and sample the storm water runoff from certain of its facilities. Federal and state regulatory agencies can impose administrative, civil and criminal penalties for non-compliance with discharge permits or other requirements of the Clean Water Act and analogous state laws and regulations.
During 2015, Sibanye-Stillwater’s US PGM operations completed renewal of water discharge permits at both its Stillwater and East Boulder mines. These permits were renewed in 2023. These renewed permits include more stringent water quality discharge limits including a compliance schedule for Sibanye-Stillwater’s US PGM operations to meet compliance with the new permits, due to some nuances and uncertainties in Montana’s regulatory scheme for nutrients.
Endangered Species Act
The Endangered Species Act was established to protect endangered and threatened species. Pursuant to that act, if a species is listed as threatened or endangered, restrictions may be imposed on activities that would harm the species or that would adversely affect that species’ habitat. Similar protections are offered to migratory birds under the Migratory Bird Treaty Act. The US Fish and Wildlife Service designates the species’ protected habitat as part of the effort to protect the species. A protected habitat designation or the mere presence of threatened or endangered species could result in material restrictions to use of land.
Diesel Particulate Matter
In an effort to protect the health of employees Sibanye-Stillwater’s US PGM operations employs various measures to comply with the MSHA’s limits on diesel particulate matter (DPM) exposure for underground miners. These measures include using catalytic converters, diesel particulate filters, and enhanced ventilation regimens, modifying certain mining practices underground that tend to create concentrations of DPM, and utilising various blends of biodiesel fuel.
Permitting and Reclamation
Operating Permits 00118 and 00149 issued by Montana DEQ encompass approximately 2,414 acres at the Stillwater Mine located in Stillwater County, Montana and 1631 acres at the East Boulder Mine located in Sweet Grass County, Montana. The permits delineate lands that may be subject to surface disturbance. Sibanye-Stillwater’s US PGM operations employs concurrent reclamation wherever feasible.
Reclamation regulations affecting Sibanye-Stillwater’s US PGM operations are promulgated and enforced jointly by the Montana DEQ and the USFS. For regulatory purposes, reclamation means returning the post-mining land to a state which has stability and utility comparable to adjacent, undisturbed areas. Major reclamation requirements include stabilisation and re-vegetation of disturbed lands, controlling storm water and drainage from portals and waste rock dumps, removal of roads and structures, the treatment and elimination of process solutions, the reclamation of major tailings storage facilities and the treatment and management of mine water prior to discharge in compliance with standards and visual mitigation.
Permits governing air and water quality are issued to Sibanye-Stillwater’s US PGM operations by the Montana DEQ, which has been delegated such authority by the federal government. Operating permits issued to the Company by the Montana DEQ and the USFS do not have an expiration date but are subject to periodic reviews. The reviews evaluate bonding levels, monitor reclamation progress, and assess compliance with all applicable permit requirements, mitigation measures and state and federal environmental standards. Closure and reclamation obligations are reviewed and reassessed by the agencies on a five-year rotating schedule. Bonding and financial guarantees are posted with the agencies to cover final reclamation costs at the end of the reconciliation and reassessment process.
Health and Safety
Sibanye-Stillwater’s US PGM operations are subject to regulation by the MSHA under the Federal Mine Safety and Health Act (FMSH Act). MSHA inspects Sibanye-Stillwater’s US PGM mine operations on a regular basis and issues various citations and orders when it believes a violation has occurred under the FMSH Act.
Under the Dodd-Frank Wall Street Reform and Consumer Protection Act (Dodd-Frank Act), each operator of a coal or other mine is required to include certain mine safety results within its periodic reports filed with the SEC. In accordance with the reporting requirements included in Section 1503(a) of the Dodd-Frank Act and Item 104 of Regulation S-K (17 CFR 229.104), the required mine safety results regarding certain mining safety and health matters for each of Sibanye-Stillwater’s mine locations that are covered under the scope of the Dodd-Frank Act are included in Exhibit 16 Mine Safety Disclosures of this Annual Report on Form 20-F.
Europe
Finland
Environmental
The national environmental protection legislation in Finland is strongly linked to EU legislation. In general, the EU Regulations are binding legislative acts. While EU directives set out goals that all EU members must achieve, it is up to individual countries to enact local laws to reach these goals.
The central governing environmental regulation in Finland is the Environmental Protection Act (57/2014), which requires an environmental permit for activities that pose a risk of pollution. There are also various permit, notification and registration procedures to ensure regulated activities are carried out in an environmentally sustainable manner.
Land use and nature conservation are outside of the scope of the Environmental Protection Act and regulated separately. The Water Act (587/2011) governs the use of water and the Waste Act (646/2011) guides waste management and the recovery of waste.
37
In addition to environmental legislation, the prevention of accidents and other polluting incidents is regulated by chemicals legislation. Parties are liable to restore the environment if damage occurs, however, a supervisory authority may initiate measures to restore the polluted environment. Compensations for damage, as well as the costs of restoration work, is governed by the Act on Compensation for Environmental Damage (737/1994). Additionally, there is a statutory environmental damage insurance used to compensate damages. The EU Environmental liability Directive (2004/35/EC) is effected through the Act on the Remediation of Certain Environmental Damages (383/2009), amendments to the Nature Conservation Act (1096/1996) and the Water Act.
Environmental Impact Assessment and Environmental Permitting
Environmental Impact Assessments (EIA) in Finland are regulated through the Act on Environmental Impact Assessment Procedure (252/2017, as amended) and the Decree on Environmental Impact Assessment Procedure (277/2017, as amended). Large-scale projects with potentially significant environmental impacts require an EIA, requiring impacts of a project to be assessed at the preparation stage. The planned Keliber mining operations, concentrator and chemical plant require EIAs before the environmental and/or water permit can be applied for and issued. There is one EIA outstanding, relating to the storage of Analcime Sand as a contingency plan, which is in progress.
The acquisition of a valid environmental permit may take between four and five years, depending on the length of any related appeals processes. Legally valid environmental permits were acquired for the Syväjärvi Mine and the Kokkola Lithium refinery in 2021 and 2022, respectively. Joint permitting was obtained for the Rapasaari Mine and Päiväneva concentrator in 2022, however certain of the permitting conditions were subsequently appealed. In February 2024, Keliber’s environmental permit was partially upheld and amended, with certain permit conditions referred back to the Permitting Authority (Regional State Administrative Agency for Western and Inland Finland) for further review. As the environmental permit was otherwise affirmed, it remains in effect, allowing the construction work at the Päiväneva concentrator to continue in all material respects in accordance with existing plans. Commencement of the Rapasaari Mine and concentrator operations remains subject to Permitting Authority review and issuance of enforceable permit decisions.
Air pollution control
The Finnish national legislation for air pollution control covers both ambient air quality limits and air pollutant emission limits. The limits and targets for ambient air quality are based on the Air Quality Directive (2008/50/EC) and Directive relating to arsenic, cadmium, mercury, nickel and polycyclic aromatic hydrocarbons in ambient air (2004/107/EU) that have been implemented by a Government Decree (113/2017). Emission reduction is based on EU Directives that are primarily implemented by the Environmental Protection Act and emission limits for operations are defined in environmental permits.
Nature Conservation and Biodiversity
The Finnish Constitution states that the protection of its nature, biodiversity, environment and national heritage is a common, national responsibility. The Nature Conservation Act (1096/1996) governs Finnish conservation requirements and establishes the Natura 2000 Network, a network of protected areas in the European Union that aims to ensure the survival of Europe’s most valuable and threatened species and habitats. In Finland, environmental permits impose requirements for the monitoring and protection of directive species of flora and fauna at operational sites within and surroundings potential impact zones.
Where necessary, Natura assessments are included in the EIAs. The Vionneva Natura site (code FI1000019) is close to the Rapasaari Mine and a separate Natura assessment has been made for it. At Kokkola, the Rummelön-Harrbådan Natura area (code FI1000003) is located over 2 kilometres from the Lithium Hydroxide Chemical Refinery and no separate assessment was needed.
Land Use Planning
The Finnish land use planning system has three levels: the regional plan, the general master plan/partial general master plan and the local detailed plan. Regional plans set out the principles of land use and community structure in a region based on national and local land use goals. The Ostrobothnia provincial plan is currently being updated, however the status of the plan is not expected to impact the project.
A general master plan or partial general master plan indicates the general principles of land use in the municipality and steers the drawing up of local detailed plans based on the Land Use and Building Act 132/1999. A partial general master plan was required for Syväjärvi, Rapasaari, Outovesi and Länttä with three different municipalities (Kokkola, Kaustinen, Kruunupyy). These partial general master plans are now legally valid in all areas.
A local detailed plan provides a comprehensive description of what, and on what principles, will be built in a particular area and how the area will otherwise be used. A local detailed plan will be needed when a building is erected. The local detailed plan for Päiväneva and Rapasaari area became legally valid in 2022.
Waste Management and Circular Economy
The Finnish national legislation governing waste management consists of Waste Act (646/2011), Environmental Protection Act (86/2000) and Government Decrees enacted under them: the Government Decree on Extractive Waste (190/2013) and the Waste Decree (179/2012). In addition to these, Finland has prepared a Strategic Programme for Circular Economy that sets out objectives and indicators for the use of natural resources. The programme includes economic incentives such as increased tax for landfilled waste and a tax for extracting minerals, but also financing for circular economy solutions.
Keliber has waste management plans for each site as part of environmental permit applications. The plan indicates the types of waste fractions and estimated amounts of waste generated during operations. The plan sets out ways to recycle waste and operators who handle different waste fractions. The waste management plan will be updated before commencing operations and reviewed annually during operation. Waste management includes record keeping of all waste generated. It must be annually reported to the supervising authority through an electronic log system.
38
Climate Change Legislation
Climate change legislation is mainly based on the obligations from the UN’s Climate Convention and EU regulations such as the EU’s Emission Trading System Directive (2003/87/EC), EU Directive on the Geological Storage of CO2 (2009/31/EC). The Climate Change Act (423/2922) governs climate change policy planning and related monitoring setting also the national climate objectives.
Following adoption of the CSRD in the EU, Finnish companies will be progressively required to assess their Carbon footprint on Scope 1, 2, 3 emissions and make relevant disclosures in their annual integrated report. Following EU Taxonomy regulation, Finnish companies will be progressively required to declare the proportion and their activity deemed environmentally sustainable according to a common framework.
Keliber has started assessing the life cycle impact of its products and operations. Climate change scenarios are also considered in the planning of the operations.
Health and Safety
Dam Safety
The Dam Safety Act (494/2009) aims to ensure dam safety during its life cycle and covers planning, construction, maintenance, and operation phases. The Kainuu Centre for Economic Development, Transport, and the Environment (ELY) officially supervises dam safety, except emergency and rescue procedures which are supervised by rescue authorities. A statement regarding dam safety from the supervising authority (Kainuu ELY) is required as part of the environmental permit application if the project contains dams covered by this legislation.
The waste and tailings ponds at Päiväneva concentrator area are covered by dam safety legislation and the statement from the supervising authority was included in the environmental permit application.
Chemical Safety
The legislation concerning chemicals is mainly regulated at the EU level. The Seveso III Directive (2012/18/EU) covers major accident hazards involving dangerous substances. The REACH regulation (1272/2008 EC) governs the chemicals market and production, registration, evaluation, authorisation and restriction. The CLP Regulation (1272/2008) covers the classification, labelling and packaging of chemicals. The Seveso III Directive is implemented in Finnish legislation through the Act on the Safe Handling and Storage of Dangerous Chemicals and Explosives (390/2005). The CLP and REACH regulations are covered in the Chemicals Act (599/2013). Large scale chemical storage and handling operations need a permit granted by the Finnish Safety and Chemicals Agency.
The Päiväneva concentrator and Kokkola Lithium Hydroxide Refinery will need an operating permit to handle and store dangerous chemicals. The products and byproducts that are not classified as waste will need to be registered according to the REACH regulation.
Fire Safety
The Rescue Act (379/2011) imposes the duties on various parties to prevent, prepare for and limit the consequences of fires and accidents. All Keliber workplaces in Finland have a rescue plan as required. The requirements for constructions, such as emergency exits and access roads, civil defence shelters and alarms are implemented in the construction permit.
Occupational Safety
The Occupational Safety Act (738/2002) applies to all work carried out in an employment contract and leased labour. It also applies to contractors. The Government Decree on the Safety of Construction Work (2005/2009) enacted under this Act sets further requirements for construction projects. The Act on the Contractor’s Obligations and Liability when Work is Contracted Out (1233/2006) aims to ensure observance of the terms of employment and imposes an obligation on the client to ensure the contracting partner’s compliance.
Mining Rights
Mining and exploration permitting
The Mining Act (621/2011) governs the exploration and exploitation of a deposit, gold panning in state-owned area, termination of related operations and the proceedings for establishing the mining area. The objective of the Mining Act is to promote mining and ensure that social, economic, and ecological sustainability is considered in operations. Finnish Safety and Chemicals Agency (TUKES) acts as the mining authority referred to in the Mining Act and monitors compliance with it. All mines in Finland require a mining permit and a mining safety permit from TUKES. The proceedings establishing a mining area give the holder of a mining permit (or the holder of a redemption permit for a mining area) use of the mining area for mining operations. The National Land Survey of Finland (NLS) initiates the proceedings to establish a mining area once TUKES has granted a mining permit. The compensations for landowners are defined in this process.
If the handling and storing of dangerous chemicals and explosives on site is considered large scale, a separate permit for handling and storing chemicals from TUKES is also needed. Exploration activities need a permit from TUKES if activities are conducted on land owned by another landowner and when the activities are outside of the scope of prospecting work defined in the Mining Act. The exploration permit does not authorise exploitation, but the permit holder has a priority for the mining permit.
Keliber holds legally valid mining permits for the Syväjärvi and Länttä mines and a mining safety permit for the Syväjärvi mine. The Rapasaari mining permit has been granted and became legal after the Vaasa Administrative Court ruled in December 2023.
39
France
Environmental
The Environmental Code provides a statutory framework for environmental protection in France.
Environmental liability (responsabilité environnementale) is regulated under the Environmental Code. Under the environmental liability regime, an operator causing specific damage to the environment (including, for example, contamination of soil, contamination of water, impact on protected species) is responsible for remediation, even in the absence of fault or negligence. If the remediation measures are not carried out, administrative sanctions (such as consignment, compulsory execution, suspension, administrative fine, penalty payment) and criminal sanctions (fines up to EUR 500,000 for companies) may be imposed.
The environmental harm regime (préjudice écologique) is a tortious liability regime under the Civil Code. Under the environmental harm regime, any person responsible for an environmental harm is under an obligation to repair it, even in the absence of fault or negligence. The sanctions may consist of preventive measures and compensation. Compensation is primarily in kind. If compensation-in-kind measures are impossible or insufficient, the judge may order the person responsible for the environmental harm to pay damages).
Environmental authorisation
The operation of the Sandouville hydrometallurgical plant is subject to an environmental authorisation. Under the environmental authorisation regime provided for in the Environmental Code, a single environmental authorisation covers several authorisations such as the authorisation related to the safeguarding of water (known as a water law authorisation or IOTA) and the ICPE authorisation. Sandouville’s environmental authorisations are renewed every five years conditioned on the performance of a hazard study to assess ongoing environmental impact. Its next renewal is due by 1 September 2024.
Pursuant to the Environmental Code, the operation of facilities that present significant risks of pollution or accident is subject to the establishment of financial guarantees, intended to ensure, according to the nature of the dangers or inconveniences of each category of facility, the monitoring of the site and the maintenance of the safety of the facility, including possible interventions in the event of an accident before or after closure, and the rehabilitation after closure. These financial guarantees do not cover compensation owed by the operator to third parties who may suffer harm as a result of pollution or accidents caused by the facility.
The ICPE regulation also sets remediation obligations for the last operator of the site at the end of the site's operation. The parent company may be found liable if its subsidiary operating the site is bankrupt or in case of gross negligence. Alternatively, liability of the landowner may be sought, but only in case of negligence or if it has caused the pollution.
Air pollution control
The EU Air Quality Directives (2008/50/EC) and Directive relating to arsenic, cadmium, mercury, nickel and polycyclic aromatic hydrocarbons in ambient air (2004/107/EU) have been transposed in the Environmental Code, which provides that such limits are set in the environmental authorisation. Emissions of industrial pollutants in the atmosphere are declared on a regular basis and subjected to a dedicated tax (TGAP “Taxe Générale sur les Activités Polluantes”).
Water pollution control
The French “water law” (Loi sur l’Eau) applied since 1964 aims at improving water repartition and limit water pollution. All water intensive industries consuming and releasing water in the natural environment are subject to limits in terms of quantity and quality set in the environmental authorisation. Emissions of industrial pollutants in natural water are declared on a regular basis and subject a dedicated tax (“Redevance Pollution de l’Eau”) aiming at financing the work of regional water agencies.
Carbon emissions
French emissions legislation is based on the obligations from the UN’s Climate Convention and EU regulations such as the EU’s Emission Trading System Directive (2003/87/EC) and the EU Directive on the Geological Storage of CO2 (2009/31/EC).
The French Multi-Annual Energy Plan (MAEP) establishes priorities for government action regarding energy policy for Metropolitan France in the next decade, Every 5 years the Multi-Annual Energy Plan is updated; the second 5-year period is revised and a subsequent 5-year period is added. The MAEP is governed by the Energy Code, amended by the law of 17 August 2015 on the energy transition for green growth. It most notably covers aspects relating to improvement of energy efficiency and reductions in primary energy consumption, especially fossil fuel consumption and promotion of the use of renewable and recovered energies. Following adoption of CSRD, French companies will be required to progressively assess their carbon footprint on Scope 1, 2, 3 emissions and will be required to make relevant disclosures in their annual integrated report. EU Taxonomy regulation will also require French companies to progressively declare the proportion of activities deemed environmentally sustainable according to a common framework.
Sandouville Nickel refinery is in the process of assessing its environmental footprint and life cycle analysis of all its products.
Waste Management and Circular Economy
National legislation governing waste management in France is located in the Environmental Code. In addition, objectives related to circular economy and indicators for the use of natural resources are included in the Environmental Code.
Pursuant to the waste management regime, an administrative liability is set on the producer of waste or on the holder of waste.
Sandouville hydro-metallurgical plant produces hazardous waste, which must be handled pursuant to the provisions of the Environmental Code.
40
Health and Safety
Chemical Safety
Chemical safety in France is mainly regulated at EU level. The Seveso III Directive (2012/18/EU) is to control major accident hazards involving dangerous substances. The REACH Regulation (1272/2008 EC) governs the chemicals market and production: the registration, evaluation, authorisation, and restriction. The CLP Regulation (1272/2008) covers the classification, labelling and packaging of chemicals. The Seveso III Directive is implemented in France in the Environmental Code.
In addition, Law of 30 July 2003 on the prevention of technological and natural risks and the repair of damages (known as Risks Law) has introduced technological risk prevention plans (PPRT), a tool for controlling urban development in areas where there are high-risk industrial sites, which correspond to the Seveso “high threshold" regime.
Sandouville hydrometallurgical plant is subject to a “high threshold" classification and is thus subject to specific requirements. The operator is required to prepare a written document defining its major accident prevention policy.
Fire Safety
Fire safety requirements for construction and maintaining buildings are set out in the National Code regarding construction and prevention of major incidental scenarios, the National Labour Code and in applicable operating permits, including with respect to emergency planning, interconnection of response with neighbouring activities and protection against major incidents. Occupational Safety
The Labour Code imposes on employers a general obligation to ensure the safety and protect the health of employees. An occupational risk assessment document (DUERP) is compulsory in all companies as soon as the first employee is hired. In the DUERP, the employer must record the results of the assessment of the health and safety risks to which employees may be exposed.
Australia
Environmental
Sibanye-Stillwater’s operations in Australia are primarily subject to the environmental laws and regulations of the State of Queensland which require, among other things, that Sibanye-Stillwater’s obtains necessary environmental approvals, environmental licences, works approvals and mining approvals to implement and carry out its mining operations.
The Environmental Protection Act 1994 (Qld) (EP Act) is Queensland's key piece of environmental legislation. The object of the EP Act is to protect the Queensland environment alongside ecologically sustainable development. The act requires authority for certain environmentally relevant activities, including mining, and makes certain adverse impacts to the environment unlawful unless the impacts are authorised by an environmental authority or other approval.
Environmental authorities have been granted to Sibanye-Stillwater for the following activities:
•mining at the Century operation, and activities ancillary to mining, such as waste disposal, mineral processing and fuel burning
•port operations at the Port of Karumba, including bulk material handling
These environmental authorities contain conditions that must be complied with in carrying out the relevant activities. Port operations are also regulated by a development approval issued under Queensland's planning framework. The New Century to Karumba underground pipeline is operated in accordance with a corridor licence and an operational licence under the Transport Infrastructure Act 1994 (Qld). The operational licence requires compliance with an Environmental Management Plan attached to the licence.
The Federal Environment Protection and Biodiversity Conservation Act 1999 (Cth) (EPBC Act) also applies to activities in Queensland. The EPBC Act regulates impacts to specific "matters of national environmental significance" including listed threatened species, migratory species and World Heritage places.
Health and Safety
State law fundamentally regulates work health and safety in Australia. In respect of the Queensland operations, the following laws apply:
•The Mining and Quarrying (Safety and Health) Act 1999 (Qld) regulates metalliferous mines in Queensland, including the Century operations. Mine operators and the site senior executives have primary obligations to ensure that the risk to workers and other persons arising from operations at the mine is at an "acceptable level", being as low as reasonably achievable and within acceptable limits. To that end, they must develop and implement an appropriate safety and health management system for the mine. Mine workers must be consulted in the development of that system. Contracting businesses performing work at mines have a primary obligation to ensure the safety and health of persons is not adversely affected by the way the contractor undertakes work at the mine, including by ensuring they comply with the safety and health management system.
•The Work Health and Safety Act 2011 (Qld) is the general safety law that regulates work and workplaces in Queensland (but it does not apply to mines). However, this legislation applies to the pipeline that carries mining slurry (outside the boundary of the mine) to the Karumba Port. It places a primary duty on all persons conducting a business or undertaking (including corporations) to, so far as is reasonably practicable, ensure the work health and safety of their workers, and that the safety and health of other persons is not adversely affected by the conduct of the business or undertaking. Workers must be consulted in the identification of hazards, risks and controls to ensure that risk is eliminated or minimised to the extent reasonably practicable.
The safety laws referred to above each place an additional obligation on the officers of corporations to exercise due diligence to ensure the corporation complies with its obligations under the relevant safety laws. They also contain "industrial manslaughter" offences that apply to corporations and their officers.
41
Additionally, particular maritime safety laws apply to the operation of ships and other vessels in State and Commonwealth territorial waters (including those involved in the transfer and transportation of product from Queensland ports).
Mineral Rights
In Australia, the ownership of land is separate from the ownership of most minerals, which are the property of the State in which they are located and are thus regulated by the State governments. The mining tenure required for the Century operations was granted under the Century Zinc Project Act 1997 (Qld). The mining tenure is administered under the Mineral Resources Act 1989 (Qld) (MR Act) and the Mineral and Energy Resources (Common Provisions) Act 2014 (Qld) (MERCP Act).
The MR Act regulates the grant and conditions for resource authorities, provision of security to the State, application processes, payment of royalties to the State and offences. The MERCP Act largely deals with the registration of dealings such as caveats and mortgages, land access, and provides an overlapping resource authority regime.
Land Claims/Heritage
Native Title
Native title is regulated by the Native Title Act 1993 (Cth) (NTA). The object of the NTA is to provide for the recognition and protection of native title, and establishes ways in which future dealings affecting native title may proceed. Where native title exists, any dealings in the land must comply with the NTA. Resource activities may affect native title rights, in which case the native title party may seek compensation.
Century Mining Pty Ltd (CML), the State of Queensland and the Waanyi, Mingginda and Gkuthaarn and Kukatj Native Title Groups, together with the Registered Native Title Claimants for the relevant claims, are the parties to the Gulf Communities Agreement (GCA). The GCA was entered into to provide native title consent for the grant of the mining leases and other associated tenures required for the Century operation. It is a ‘right to negotiate’ agreement for the purposes of the NTA. CML is also a party to a number of other agreements with native title parties in relation to the Century operation.
Cultural Heritage
Aboriginal cultural heritage is a separate and distinct concept to native title. Cultural heritage may exist in relation to all areas regardless of the native title status of the land. In Queensland, Aboriginal cultural heritage is regulated by the Aboriginal Cultural Heritage Act 2003 (Qld) (ACHA). The object of the ACHA is to provide recognition, protection and conservation of Aboriginal cultural heritage.
The GCA contains commitments and processes with respect to Aboriginal cultural heritage in the area of the Century mining leases. As the GCA was entered into before the ACHA commenced, it is treated as an ‘existing agreement’ under the ACHA.
Mt Lyell Copper Mine, Tasmania
Sibanye-Stillwater recently acquired Copper Mines of Tasmania Pty Ltd, which operates the Mt Lyell Copper Mine in Tasmania, Australia. It is currently in care and maintenance and a feasibility study, which considers the reestablishment of the operation, is underway. Sibanye-Stillwater will review its options upon completion of the feasibility study. A similar regime as described above for Queensland applies under Tasmanian law.
42
DIVIDEND POLICY AND DIVIDEND DISTRIBUTION
Sibanye-Stillwater may make distributions from time to time, provided that any such distribution is pursuant to an existing legal obligation of Sibanye-Stillwater or a court order or has been authorised by resolution of the Board in respect of cash dividends paid out of retained income, capitalisation issues or scrip dividends incorporating an election to receive either capitalisation shares or cash (save in the case of a pro rata distribution to all shareholders which results in shareholders holding shares in an unlisted entity which requires the sanction of an ordinary resolution), and provided further that:
•dividends be paid to shareholders registered as at a date subsequent to the date of declaration or date of confirmation of the dividend, whichever is the later;
•it reasonably appears that Sibanye-Stillwater will satisfy the ‘solvency and liquidity’ test as set out in the Companies Act immediately after completing the proposed distribution; and
•no obligation is imposed by Sibanye-Stillwater, if it is a distribution of capital, that such capital be used to subscribe for shares in Sibanye-Stillwater.
Sibanye-Stillwater must complete any such distribution fully within 120 business days after the Board acknowledges that the ‘solvency and liquidity’ test has been applied as aforesaid, failing which it must again comply with the above.
Sibanye-Stillwater must hold all unclaimed distributions due to the shareholders of Sibanye-Stillwater in trust subject to the laws of prescription, and accordingly may release any distributions once the prescriptive period of three years in relation to those dividends has expired.
Sibanye-Stillwater’s dividend policy is to return at least 25% to 35% of normalised earnings to shareholders and after due consideration of future requirements the dividend may be increased beyond these levels. The Board, therefore, considers normalised earnings in determining what value will be distributed to shareholders. The Board believes normalised earnings provides useful information to investors regarding the extent to which results of operations may affect shareholder returns. Normalised earnings is defined as earnings attributable to the owners of Sibanye-Stillwater excluding gains and losses on financial instruments and foreign exchange differences, impairments, gain/loss on disposal of property, plant and equipment, occupational healthcare expenses, restructuring costs, transaction costs, share-based payment expenses on B-BBEE transactions, gain on acquisitions, net other business development costs, share of results of equity-accounted investees, all after tax and the impact of non-controlling interest and changes in estimated deferred tax rate. For a reconciliation of profit attributable to the owners of Sibanye-Stillwater to normalised earnings, see – Annual Financial Report – Consolidated financial statements – Notes to the consolidated financial statements – Note 13: Dividends.
In line with Sibanye-Stillwater’s Dividend policy and its Capital Allocation Framework, the Board resolved not to declare a final dividend for the year ended 31 December 2023 (2022: 122 SA cents per share). With the interim dividend of 53 (2022: 138) SA cents per share, which was declared and paid, this brings the total dividend for the year ended 31 December 2023 to 53 (2022: 260) SA cents per share. The interim dividend amounted to a payout of 35% of normalised earnings for the six months ended 30 June 2023 (2022: 35% of normalised earnings for the year ended 31 December 2022).
Under South African law, Sibanye-Stillwater will be entitled to pay a dividend or similar payment to its shareholders only if it meets the solvency and liquidity tests set out in the Companies Act, and it is permitted to do so in terms of the Memorandum of Incorporation.
There is no arrangement under which future dividends are waived or agreed to be waived.
43
THE LISTING
Sibanye-Stillwater’s ordinary shares trade on the JSE under the trading symbol “SSW”. Sibanye-Stillwater’s ADSs trade on the NYSE under the trading symbol “SBSW”.
44
MEMORANDUM OF INCORPORATION
General
Sibanye-Stillwater is a public company registered in South Africa under the Companies Act, which limits the liability of Sibanye-Stillwater shareholders, and is governed by the Sibanye-Stillwater Memorandum of Incorporation (MOI). Sibanye-Stillwater was registered as a public company in South Africa on 6 July 2018. Sibanye-Stillwater’s registration number is 2014/243852/06.
The Sibanye-Stillwater MOI is not required to include, and does not include, the details of the objects and purposes of Sibanye-Stillwater.
Dividends and payments to Sibanye-Stillwater Shareholders
Sibanye-Stillwater may make payments (including the payment of dividends) to its shareholders from time to time in accordance with provisions of the Companies Act, the JSE Listing Requirements and the Sibanye-Stillwater MOI. As read together, these prohibit any payment (including the payment of any dividend) to a company’s shareholders if there are reasonable grounds for believing that:
•the company is, or would be, after the payment, unable to pay its debts as they become due in the ordinary course of business for a period of 12 months after the date of making such payment; or
•the consolidated assets of the company and the group fairly valued would, after the payment, be less than the consolidated liabilities of the company and the group, fairly valued.
Subject to the above requirements, and, in certain circumstances, approval of Sibanye-Stillwater Shareholders by way of an ordinary resolution, the Sibanye-Stillwater Board may from time to time declare a payment to be made to Sibanye-Stillwater Shareholders and to the holders of share warrants (if any) in proportion to the number of the Sibanye-Stillwater Shares held by them.
Sibanye-Stillwater must hold all unclaimed dividends due to the shareholders in trust, subject to the laws of prescription, and accordingly may release any dividends once the prescriptive period in relation to those dividends has prescribed. Sibanye-Stillwater shall be entitled at any time to delegate its obligations in respect of unclaimed dividends or other unclaimed distributions, to any one of its bankers from time to time.
Sibanye-Stillwater Directors may resolve that any return of capital made to all or any shareholders whose registered addresses are outside South Africa will, subject to any exchange control regulations then in force, be paid in such other currencies as may be stipulated by the Sibanye-Stillwater Directors. The Sibanye-Stillwater Directors may also stipulate the date for converting Rand to those currencies and the provisional rate of exchange, provided that the date for conversion must be within a period of thirty days prior to the date of payment.
Voting rights
Every Sibanye-Stillwater Shareholder, or representative of a Sibanye-Stillwater Shareholder, who is present at a Sibanye-Stillwater Shareholders’ meeting has one vote on a show of hands or on a poll, regardless of the number of Sibanye-Stillwater Shares he or she holds or represents or, in the case of a proxy, the number of Sibanye-Stillwater Shareholders he or she represents, unless a poll is demanded. Every Sibanye-Stillwater Shareholder is, on a poll, entitled to one vote per Sibanye-Stillwater Share held. A poll may be demanded by: (i) not less than five persons having the right to vote on that matter; or (ii) a person or persons entitled to exercise not less than one-tenth of the total voting rights entitled to vote on that matter; or (iii) the chairperson of the meeting. Neither the Companies Act nor the Sibanye-Stillwater MOI provide for cumulative voting.
A Sibanye-Stillwater Shareholder is entitled to appoint a proxy to attend, speak and vote at any meeting on his or her behalf. The proxy need not be a Sibanye-Stillwater Shareholder. There are limitations on the proxy’s powers namely that the proxy cannot delegate the authority granted to him as a proxy.
To the knowledge of management, none of the beneficial shareholders listed in the Shareholder Information section hold voting rights which are different from those held by other Sibanye-Stillwater shareholders. See – Annual Financial Report – Shareholder information.
Issue of additional shares and pre-emptive rights
Sibanye-Stillwater Shareholder approval is required for any issuance of additional Sibanye-Stillwater Shares, other than if Sibanye-Stillwater Shares are issued pursuant to a pro rata rights offer to all Sibanye-Stillwater Shareholders, provided that the Sibanye-Stillwater Shares subject to the offer are less than 30% of Sibanye-Stillwater’s issued share capital.
Sibanye-Stillwater Shareholders, by ordinary or special resolution passed by a 75% majority, which requires an independent vote in the case of specific authority, may either convey a general or specific authority to the Sibanye-Stillwater Board to issue Sibanye-Stillwater Shares for cash. Such authority is valid for the period provided in the applicable resolution, but may be revoked by ordinary or special resolution, as the case may be, at any time. General authority may only be valid until the earlier of the next annual general meeting and 15 months after the authority was granted.
The JSE Listings Requirements as read with the Sibanye-Stillwater MOI require that any new issue of equity shares by Sibanye-Stillwater must first be offered to existing Sibanye-Stillwater Shareholders in proportion to their shareholding in Sibanye-Stillwater unless, among other things, the issuance to new Sibanye-Stillwater Shareholders is:
•pursuant to a Sibanye-Stillwater Shareholder approved employee share incentive scheme;
•to raise cash through a general issuance at the discretion of the Sibanye-Stillwater Board to the general public of up to 30% of the issued share capital in any one fiscal year at an issue price with a discount not exceeding 10% of the 30 business day weighted average trading price prior to the date that the application is made to the JSE to list the shares, provided that a 75% majority of the votes cast by Sibanye-Stillwater Shareholders at a general meeting or annual general meeting must approve the granting of such authority to the Sibanye-Stillwater Board;
45
•to raise cash through a specific issuance of Sibanye-Stillwater Shares for cash, provided that 75% of majority of votes cast by Sibanye-Stillwater Shareholder, other than parties and their associates participating in the specific issue for cash, vote in favour of the resolution to issue the shares;
•a capitalisation issue;
•an issue for an acquisition of assets (including another company) subject to compliance with Section 9 and 10 of the JSE Listings Requirements or a fundamental transaction, an amalgamation or merger in terms of the Companies Act; or
•in terms of option rights or conversion rights.
In terms of the Companies Act, an issue of equity shares by Sibanye-Stillwater must be approved by a special resolution of Sibanye-Stillwater Shareholders if the Sibanye-Stillwater Shares are issued, among other things, to approve the issue to:
•a Sibanye-Stillwater Director, future director, prescribed officer or future prescribed officer of Sibanye-Stillwater; or
•a person related or inter-related to Sibanye-Stillwater, or to a Sibanye-Stillwater Director or prescribed officer of Sibanye-Stillwater;
unless the issue of Sibanye-Stillwater Shares is, among other things:
•under an agreement underwriting the Sibanye-Stillwater Shares;
•in proportion to existing holdings, and on the same terms and conditions that have been offered to all the Sibanye-Stillwater Shareholders;
•pursuant to an employee share scheme that satisfies the requirements of section 97 of the Companies Act; or
•pursuant to an offer to the public as defined in section 95(1)(h), read with section 96 of the Companies Act.
Furthermore, in terms of the Companies Act, an issue of shares requires approval of the shareholders by special resolution if the voting power of the class of shares that are issued or issuable as a result of the transaction will be equal to or exceed 30% of the voting power of all the shares of that class held by shareholders immediately before the transaction.
Transfer of Sibanye-Stillwater Shares
The transfer of any Sibanye-Stillwater certificated share will be implemented in accordance with the provisions of the Companies Act using the then common form of transfer. Dematerialised Sibanye-Stillwater Shares which have been traded on the JSE are transferred on the STRATE system and delivered three business days after each trade. The transferor of any Sibanye-Stillwater Share is deemed to remain the holder of that share until the name of the transferee is entered in Sibanye-Stillwater’s Register for that Sibanye-Stillwater Share. Since Sibanye-Stillwater Shares are traded through STRATE, only shares which have been Dematerialised may be traded on the JSE. Accordingly, Sibanye-Stillwater Shareholders who hold shares in certificated form will need to Dematerialise their Sibanye-Stillwater Shares in order to trade on the JSE.
General meetings of Sibanye-Stillwater Shareholders
The Sibanye-Stillwater Board may convene general meetings of Sibanye-Stillwater Shareholders and a general meeting may also be convened on a requisition by Sibanye-Stillwater Shareholders made pursuant to the Companies Act. Sibanye-Stillwater is obligated to hold an annual general meeting once in every calendar year, but no more than 15 months after the date of the previous annual general meeting.
All general meetings require 15 business days’ notice in writing of, among other things, the place, day and time of the meeting to Sibanye-Stillwater Shareholders.
Business may be transacted at any meeting of Sibanye-Stillwater Shareholders only while a quorum of Sibanye-Stillwater Shareholders is present. Sibanye-Stillwater Shareholders representing at least 25% of the voting rights which are entitled to be exercised in respect of at least one matter to be decided at that Sibanye-Stillwater Shareholder’s meeting present personally or by representative and entitled to vote constitute a quorum for a general meeting and an annual general meeting. However, a shareholder’s meeting may not begin unless there are three Sibanye-Stillwater Shareholders present at a meeting in person or by proxy.
The annual general meeting deals with and disposes of all matters prescribed by the MOI and the Companies Act, including, among other things:
•the re-appointment of auditors and designated individual partner;
•the election of audit committee members;
•general approval in respect of Section 44 and Section 45 of the Companies Act;
•general authority to issue a predetermined number of unissued authorised Shares;
•general authority to issue Shares for cash in terms of the JSE Listings Requirements;
•general authority to repurchase Shares in terms of the JSE Listings Requirements and Companies Act;
•approval of non-executive directors' fees in terms Section 66(9) of the Companies Act;
•advisory endorsement of the Company's Remuneration policy in terms of the JSE Listings Requirements;
•advisory endorsement of the Company's Remuneration implementation report in terms of the JSE Listings Requirements;
•the presentation of the consolidated and company audited annual financial statements (annual financial statements) and report of the independent external auditors; and
•the election of new and rotating Sibanye-Stillwater Directors.
46
Annual report and accounts
Sibanye-Stillwater is required to keep the accounting records and books of accounts up to date as is necessary to present the state of affairs of Sibanye-Stillwater and to explain the financial position of Sibanye-Stillwater as prescribed by the Companies Act. Apart from the Sibanye-Stillwater Shareholders and holders of a beneficial interest in Sibanye-Stillwater, no person has the right to inspect any account, book or document of Sibanye-Stillwater (other than the share register), except as conferred by the Companies Act, the Promotion of Access to Information Act, 2000 or authorised by Sibanye-Stillwater Directors.
The Sibanye-Stillwater Directors will cause to be prepared and published company and consolidated annual financial statements, an annual report and notice of annual general meeting as required by the Companies Act and the JSE Listings Requirements within four months of the fiscal year end. Sibanye-Stillwater will notify the shareholders and the holders of beneficial interests of the publication of any annual financial statements and make the same available to every shareholder who so requests a copy of the annual report and annual financial statements. Not later than three months after the first six months of its fiscal year, Sibanye-Stillwater will make available to every Sibanye-Stillwater Shareholder an interim report for the previous six-month period.
Changes in capital or objects and powers of Sibanye-Stillwater
The Sibanye-Stillwater Shareholders may, by the passing of a special resolution, among other things:
•increase Sibanye-Stillwater’s authorised share capital;
•consolidate and reduce the number of the issued no par value Sibanye-Stillwater Shares, if any;
•subdivide all or any portion of Sibanye-Stillwater Shares into shares of a smaller amount than is fixed by the Sibanye-Stillwater MOI;
•reduce Sibanye-Stillwater’s authorised share capital and, if required by law, its issued share capital;
•alter the provisions of the Sibanye-Stillwater MOI with respect to the objects and powers of Sibanye-Stillwater, if any are stated therein; and
•subject to the provisions of the Companies Act or any other South African law governing companies and the JSE Listings Requirements and any other stock exchange upon which the shares of Sibanye-Stillwater may be quoted or listed from time to time, allow Sibanye-Stillwater to acquire shares issued by itself or in any subsidiary of Sibanye-Stillwater from time to time.
Variation of rights
All or any of the rights, privileges or conditions attached to Sibanye-Stillwater Shares may be varied by a special resolution of Sibanye-Stillwater Shareholders passed in accordance with the provisions of the Companies Act; provided that, in circumstances where a Sibanye-Stillwater Shareholder dissents to such variation which materially and adversely affects his rights, that Sibanye-Stillwater Shareholder shall be entitled to be paid the fair value for his or her shares in accordance with the provisions of section 37(8) of the Companies Act as read with the appraisal rights provided for in section 164 of the Companies Act.
Distribution of assets on liquidation
In the event of a voluntary or compulsory liquidation, dissolution or winding-up, the assets remaining after payment of all the debts and liabilities of Sibanye-Stillwater, including the cost of liquidation, shall be dealt with by a liquidator who may, among other things, divide among the Sibanye-Stillwater Shareholders any part of the assets of Sibanye-Stillwater, and may vest any part of the assets of Sibanye-Stillwater as instructed at a meeting of Sibanye-Stillwater Shareholders in an inter vivos trust for the benefit of Sibanye-Stillwater Shareholders. If so resolved at a meeting of Sibanye-Stillwater Shareholders, the division of assets is not required to be done in accordance with the legal rights of Sibanye-Stillwater Shareholders in their capacities as shareholders of Sibanye-Stillwater.
Purchase of shares
The Companies Act and the JSE Listings Requirements permit the establishment of share incentive schemes for the purpose of purchasing shares of a company for the benefit of its employees, including salaried directors. These share incentive schemes are permitted to extend loans to company employees, other than non-salaried Sibanye-Stillwater Directors, for the purpose of purchasing or subscribing for Sibanye-Stillwater Shares.
Sibanye-Stillwater or any subsidiary or subsidiaries may, if authorised by special resolution, acquire its own shares; provided that there are no reasonable grounds for believing that Sibanye-Stillwater is or would be, after the payment, unable to pay its debts or that Sibanye-Stillwater’s consolidated assets would, after the payment, be less than its consolidated liabilities. The procedure for acquisition of shares by Sibanye-Stillwater is regulated by the Sibanye-Stillwater MOI, the Companies Act and the JSE Listings Requirements.
Directors
The minimum number of Sibanye-Stillwater Directors shall be four and the maximum shall be 15. However, the failure by Sibanye-Stillwater to have the prescribed number of Sibanye-Stillwater Directors shall not invalidate anything done by the Sibanye-Stillwater Board. If the number of Sibanye-Stillwater Directors falls below the minimum in the MOI, the remaining Sibanye-Stillwater Directors shall not act after a period of three months from the date the deficiency in the minimum number of Sibanye-Stillwater Directors arose, except for the purpose of filling such vacancy or for the purpose of calling a meeting of Sibanye-Stillwater Shareholders in order to fill such vacancy. One-third of the Sibanye-Stillwater Board shall be required to retire from office at the annual general meeting held each year. The retiring Sibanye-Stillwater Director shall be eligible for re-election.
There are no qualifications prescribed by Sibanye-Stillwater for a person to serve as a Sibanye-Stillwater Director or alternate director, other than the requirements stipulated in the Companies Act.
Sibanye-Stillwater Directors may be paid their travelling and other expenses which are necessarily incurred by them in connection with the business of Sibanye-Stillwater, and in attending the meetings of Sibanye-Stillwater Directors or of committees thereof, and if any Sibanye-Stillwater Director shall be required to perform extra services, to go or to reside abroad or otherwise, or be specially occupied about
47
Sibanye-Stillwater’s business, such Sibanye-Stillwater Director shall be entitled to receive remuneration as approved by a special resolution by Sibanye-Stillwater’s Shareholders.
If a Sibanye-Stillwater Director has a personal financial interest in a matter to be considered by the Sibanye-Stillwater Board, the Sibanye-Stillwater Director must disclose such personal financial interest before the matter is considered at the meeting and must, inter alia, disclose any information relating to the matter, and known to the Sibanye-Stillwater Director, disclose any insights and not take part in the decision to execute any documents on behalf of Sibanye-Stillwater in relation to the matter. However, a decision by the Sibanye-Stillwater Board or a transaction/agreement approved by the Sibanye-Stillwater Board will be valid despite any personal financial interest of a Sibanye-Stillwater Director or a person related to a director if it was ratified or approved by ordinary resolution of the Sibanye-Stillwater Shareholders or declared valid by a court of law.
Borrowing powers
The Sibanye-Stillwater Board may exercise all the powers of Sibanye-Stillwater to borrow money and to give all or any part of its property as security whether outright or as security for any debt, liability or obligation of Sibanye-Stillwater or of any third party. Sibanye-Stillwater has unlimited borrowing powers. Furthermore, the Sibanye-Stillwater Board may create and issue debt instruments, as contemplated in section 43(1)(a) of the Companies Act, on such terms and conditions and in such manner as the Sibanye-Stillwater Board may from time to time determine, in accordance with the requirements of section 43 of the Companies Act, provided that, for so long as Sibanye-Stillwater is listed on the JSE, a debt instrument issued by Sibanye-Stillwater may not grant special privileges regarding attending and voting at general meetings and the appointment of Sibanye-Stillwater Directors, as contemplated in the JSE Listings Requirements.
The Sibanye-Stillwater Board’s borrowing powers may only be changed by special resolution of the Sibanye-Stillwater Shareholders amending the Sibanye-Stillwater MOI.
Non-South African shareholders
There are no limitations imposed by South African law or by the Sibanye-Stillwater MOI on the rights of non-South African shareholders to hold or vote Sibanye-Stillwater Shares.
Rights of minority shareholders and directors’ duties
Majority shareholders of South African companies have no fiduciary obligations under South African common law to non-controlling shareholders. However, under the Companies Act, a shareholder may, under certain circumstances, seek relief from the court if he or she has been unfairly prejudiced by the company. There may also be common law personal actions available to a shareholder of a company.
In South Africa, the common law and the Companies Act impose on directors duties to, among other things, act with care, skill and diligence, act in good faith and for a proper purpose and to conduct the company’s affairs honestly and in the best interests of the company.
Disclosure of beneficial interest in and ownership of Sibanye-Stillwater Shares
Disclosure by Sibanye-Stillwater Shareholders
Under South African law, a registered holder of Sibanye-Stillwater Shares who is not the holder of the beneficial interest in such shares is required to disclose the identity of the person on whose behalf that security is held and the identity of each person with a beneficial interest in the securities so held, the number and class of securities held for each such person with a beneficial interest, and the extent of each such person with a beneficial interest. This information must be disclosed in writing to Sibanye-Stillwater within five business days after the end of every month during which a change has occurred in the information or more promptly or frequently to the extent so provided by the requirements of a central securities depository or otherwise be provided on payment of a prescribed fee charged by the registered holder of securities. Moreover, Sibanye-Stillwater may, by notice in writing, require a person who is a registered Sibanye-Stillwater Shareholder, or whom Sibanye-Stillwater knows or has reasonable cause to believe has a beneficial interest in Sibanye-Stillwater Shares, to confirm or deny whether or not such person holds the Sibanye-Stillwater Shares or beneficial interest and, if the Sibanye-Stillwater Shares are held for another person, to disclose to Sibanye-Stillwater the identity of the person on whose behalf the Sibanye-Stillwater Shares are held. Sibanye-Stillwater may also require the person to give particulars of the extent of the beneficial interest held during the three years preceding the date of the notice.
Under the Companies Act, “beneficial interest” generally means the right to: (i) receive or participate in any distribution in respect of the company’s securities; (ii) exercise or cause to be exercised, in the ordinary course, any or all of the rights attaching to the company’s securities; or (iii) dispose or direct the disposition of the company’s securities, or any part of a distribution in respect of the securities.
Under section 122 of the Companies Act, a shareholder is required to notify Sibanye-Stillwater within three business days if it acquires or disposes of a beneficial interest in Sibanye-Stillwater Shares such that its shareholding amounts to or ceases to amount to a 5% multiple when measured against the issued shares at that time.
Disclosure by Sibanye-Stillwater
Under the JSE Listings Requirements and the Companies Act, as the case may be, and pursuant to the General Laws (Anti Money Laundering and Combatting the Financing of Terrorism) Amendment Act, 2022 (GLAA), as a public company listed on the JSE, Sibanye-Stillwater is obligated to:
•establish and maintain a register of the beneficial interest disclosures described above, including, in particular, a register of persons who hold a beneficial interest equal to or in excess of 5% of the total number of securities issued by the company (BI Register);
•publish in its annual financial statements a list of the persons who hold a beneficial interest equal to or in excess of 5% of the total number of ordinary shares issued by Sibanye-Stillwater, together with the extent of those beneficial interests;
48
•disclose to the South African Takeover Regulation Panel and deliver to the Sibanye-Stillwater Shareholders by means of a SENS announcement, every notification received from the Sibanye-Stillwater Shareholders in terms of section 122 of the Companies Act, unless it relates to the disposal of any beneficial interest of less than 1% of the issued Sibanye-Stillwater Shares at that time; and
•file with the Companies and Intellectual Property Commission (CIPC), together with its annual returns, a copy of its securities register and BI Register (except to the extent there is an applicable CIPC exemption).
The BI Register is to be updated within ten business days of notification by the Sibanye-Stillwater Shareholders. Sibanye-Stillwater will be obliged to submit a copy of the notification, applicable CoR Form and BI register to the CIPC, whom will maintain a register of the notices pursuant to section 122 of the Companies Act.
Periodic and beneficial ownership reporting under US securities laws
Under the Exchange Act, for so long as Sibanye-Stillwater continues to qualify as a “foreign private issuer”, Sibanye-Stillwater is required to publicly file with the SEC annual reports on Form 20-F within four months of the end of the financial year covered by the report. As a foreign private issuer, Sibanye-Stillwater is also required to publicly file with the SEC on Form 6-K material information that it makes or is required to make public pursuant to South African law, files or is required to file with any stock exchange on which the Sibanye-Stillwater Shares trade and which was made public by that exchange, or is otherwise distributed or required to be distributed to Sibanye-Stillwater Shareholders.
Any person who acquires more than 5% of Sibanye-Stillwater Shares (whether in the form of Sibanye-Stillwater Shares or Sibanye-Stillwater ADSs) is subject to an obligation to file reports of beneficial ownership with the SEC, the NYSE and Sibanye-Stillwater. Generally, these reports are filed on a Schedule 13D. However, a short form, Schedule 13G, may be filed in lieu of Schedule 13D in certain circumstances. Following amendments to Regulation 13D-G adopted by the SEC in October 2023, a Schedule 13D must be filed within five days after an acquisition of securities that brings the acquirer above the 5% level, and must be amended within two days of a material change in the facts disclosed in the filing. A Schedule 13G must be filed (by the shareholder, as it is the individual responsibility of each beneficial owner of more than 5% of company shares to make the filing and not Sibanye-Stillwater’s responsibility) within 45 calendar days of the end of each calendar year, although shareholders who did not acquire the securities with the purpose or effect of changing or influencing control of the issuer (a “passive investor”), and who is a beneficial owner of 20% or less of a relevant class of equity securities, must file within ten days of the acquisition of securities that triggers the obligation. Effective 30 September 2024, a Schedule 13G must be filed within 45 calendar days of the end of each quarter in which beneficial ownership exceeds 5%, except with respect to passive investors with 20% or less of a relevant class of equity securities, who must file within five days of the relevant triggering event. “Beneficial owner”, a technical term defined in Rule 13d-3 under the Exchange Act, generally encompasses not only the record owner of securities, but also any person who has the power to either direct the investment of, or exercise the power to vote, such securities. In addition, a person is deemed to be a beneficial owner of a security if he or she has the right to acquire beneficial ownership of the security, including through the exercise of an option, within 60 days.
49
MATERIAL CONTRACTS
The following are material contracts not entered into in the ordinary course of business that were entered into, novated or amended by Sibanye-Stillwater in the period under review.
2026 and 2029 Notes
On 16 November 2021 Stillwater Mining Company (Stillwater), as a subsidiary of Sibanye-Stillwater, issued at face value US$1.2 billion of senior notes (the 2021 Senior Notes) to an indenture dated 16 November 2021 among Sibanye-Stillwater, The Bank of New York Mellon and certain guarantors. The 2021 Senior Notes offering comprises of two tranches, US$675 million 4.000% senior notes due 2026, which bear interest at a rate of 4.000% per annum (the 2026 Notes) and US$525 million 4.500% senior notes due 2029, which bear interest at a rate of 4.500% per annum (the 2029 Notes) (together the 2026 and 2029 Notes). The 2026 and 2029 Notes are denominated in US Dollars, mature and become due and payable on 16 May 2026 and 16 November 2026, respectively. Interest is paid semi-annually in arrears. The 2026 and 2029 Notes are fully and unconditionally guaranteed, jointly and severally by Sibanye Stillwater Limited, Kroondal Operations Proprietary Limited, Sibanye Rustenburg Platinum Mines Proprietary Limited, Sibanye Gold Proprietary Limited and Western Platinum Proprietary Limited. On 14 June 2023, Eastern Platinum Proprietary Limited and Sibanye Stillwater Sandouville Refinery acceded to the 2021 Senior Notes as additional guarantors. The guarantees rank equally in right of payment to all existing and future senior debt of the guarantors.
At any time on or after 16 November 2023, in the case of the 2026 Notes, or 16 November 2025, in the case of the 2029 Notes, Stillwater may redeem all or part of the 2026 Notes or 2029 Notes by paying the relevant price (expressed as a percentage of the principal amount of the 2026 Notes or 2029 Notes plus an applicable premium) plus accrued and unpaid interest on the 2026 Notes or 2029 Notes. In addition, prior to 16 November 2023, Stillwater may redeem up to 35% of the original aggregate principal amount of the 2026 Notes or 2029 Notes with the net proceeds from certain equity offerings. If Sibanye-Stillwater undergoes a change of control, Sibanye-Stillwater or Stillwater will be required to make an offer to purchase each of the 2026 Notes and 2029 Notes at a purchase price equal to 101% of the principal amount of each of the Notes, plus accrued and unpaid interest to the date of purchase. In the event of certain developments affecting taxation, Stillwater may redeem all, but not less than all, of the 2026 and 2029 Notes.
Sibanye-Stillwater used the proceeds of the 2026 and 2029 Notes to redeem the 2025 Notes (as described below), as well as general corporate purposes, including advancing Sibanye-Stillwater’s battery metals strategy through, among other things, investments and accretive acquisitions and improving earnings diversification. For information on Sibanye-Stillwater’s 2026 and 2029 Notes, see – Annual Financial Report – Consolidated financial statements – Notes to the consolidated financial statements-Note 28.4: 2026 and 2029 Notes.
2022 and 2025 Notes
On 27 June 2017, Stillwater, as a subsidiary of Sibanye-Stillwater, issued US$1.05 billion of senior notes (the 2017 Senior Notes) pursuant to an indenture dated 16 March 2017 among Sibanye, The Bank of New York Mellon and certain guarantors. The 2017 Senior Notes offering comprises of two tranches, US$500 million 6.125% senior notes due 2022, which bear interest at a rate of 6.125% per annum (the 2022 Notes) and US$550 million 7.125% senior notes due 2025, which bear interest at a rate of 7.125% per annum (the 2025 Notes) (together the 2022 and 2025 Notes). The 2022 and 2025 Notes were fully and unconditionally guaranteed, jointly and severally by Kroondal Operations Proprietary Limited, Sibanye Rustenburg Platinum Mines Proprietary Limited and Sibanye Gold Limited. Sibanye-Stillwater used the proceeds of the 2022 and 2025 Notes for the partial repayment of the US$350 million Bridge Facility Agreement between Sibanye Gold Limited, Citibank NA and HSBC Bank plc, dated 5 October 2015, raised for the acquisition of Stillwater.
On 19 September 2018, Sibanye-Stillwater completed its offer to purchase the 2022 Notes and 2025 Notes, in which it repurchased a principal amount of US$146.3 million of the 2022 Notes and US$231.1 million of the 2025 Notes.
Following the completion of the Lonmin Acquisition, on 8 January 2020, Western Platinum Proprietary Limited acceded to the 2017 Senior Notes as an additional guarantor. Following completion of the Scheme, on 24 February 2020 Sibanye-Stillwater acceded to the 2017 Senior Notes as an additional guarantor.
Given Sibanye-Stillwater’s surplus liquidity and in line with its capital allocation framework, Sibanye-Stillwater elected to early redeem the 2022 Notes on 2 August 2021 (the Redemption Date). The redemption price was the principal amount of the 2022 Notes, plus accrued and unpaid interest on the 2022 Notes up to, but excluding, the Redemption Date, amounting to US$355.8 million (with a nominal value of US$353.7 million) and was settled on 2 August 2021. On 6 December 2021, Stillwater early redeemed the 2025 Notes, with a nominal value of US$346.9 million, accrued interest of US$10.9 million and a redemption premium of US$12.4 million, were redeemed in full using the proceeds of the 2021 Senior Notes.
US$1 billion revolving credit facility
In April 2023, Sibanye-Stillwater announced the refinancing of its US dollar revolving credit facility (USD RCF). The USD RCF was upsized from US$600 million to US$1 billion, with options for Sibanye-Stillwater to: (i) increase the facility size by a further US$200 million; and (ii) have EUR as an optional currency. The key terms of the USD RCF, which involved a syndicate of ten international banks, include maintaining the existing financial covenants of net debt to EBITDA covenant 2.5x and EBITDA to Net Finance Charges of 4x. The USD RCF matures on 6 April 2027 following approval of the first of two potential one year extensions available on request from Sibanye-Stillwater. The facility is guaranteed, jointly and severally by Sibanye Stillwater Limited, Kroondal Operations Proprietary Limited, Sibanye Rustenburg Platinum Mines Proprietary Limited, Sibanye Gold Proprietary Limited, Stillwater Mining Company Inc., Western Platinum Proprietary Limited, Eastern Platinum Proprietary Limited and Sibanye Stillwater Sandouville Refinery. See – Annual Financial Report – Consolidated Financial Statements – Notes to the Consolidated Financial Statements-Note 28.2 US$1 billion RCF.
R5.5 billion revolving credit facility
In November 2019, a new R5.5 billion revolving credit facility was entered into by Sibanye-Stillwater on similar terms to the maturing R6.0 billion revolving credit facility. The facility includes two one-year maturity extension options at the discretion of the lenders. All facility lenders
50
approved the first and second one-year extension options with the loan facility now set to mature on 11 November 2024. The facility is guaranteed, jointly and severally by Sibanye Stillwater Limited, Kroondal Operations Proprietary Limited, Sibanye Rustenburg Platinum Mines Proprietary Limited, Sibanye Gold Proprietary Limited, Stillwater Mining Company Inc., Western Platinum Proprietary Limited and Eastern Platinum Proprietary Limited. See – Annual Financial Report – Consolidated financial statements – Notes to the consolidated financial statements – Note 28.3: R5.5 billion RCF.
US$500 million convertible bond
On 28 November 2023, Stillwater Mining Company Inc., as a subsidiary of Sibanye-Stillwater, issued US$500m convertible bonds due November 2028 (the convertible bonds) pursuant to a Trust Deed dated 28 November 2023 among Sibanye Mining Company Inc., The Bank of New York Mellon and certain guarantors. The convertible bonds bear interest at a rate of 4.250% per annum, and are convertible into new and/or existing shares of Sibanye-Stillwater (Convertible Bonds) subject to Shareholder approval. Prior to, and/or absent of such approval, holders of the Convertible Bonds will, on conversion, receive a cash amount equal to the value of the underlying ordinary shares. The convertible bonds are fully and unconditionally guaranteed, jointly and severally by Sibanye Stillwater Limited, Kroondal Operations Proprietary Limited, Sibanye Rustenburg Platinum Mines Proprietary Limited, Sibanye Gold Proprietary Limited, Western Platinum Proprietary Limited and Eastern Platinum Proprietary Limited. The proceeds of the convertible bond will be applied to the advancement of the Group’s growth strategy including funding future acquisitions, including the Reldan acquisition, whilst preserving the current balance sheet for funding existing operations and projects through a lower commodity price environment. See – Annual Financial Report– Consolidated financial statements – Notes to the consolidated financial statements – Note 28.5: US$ Convertible Bond
Deposit agreement
In connection with the establishment of an ADS facility in respect of Sibanye-Stillwater Shares, Sibanye-Stillwater entered into the Sibanye-Stillwater Deposit Agreement with the ADS Depositary among Sibanye-Stillwater, the ADS Depositary, you, as a Sibanye-Stillwater ADS Holder, and all owners and holders from time to time of ADSs issued thereunder (the Sibanye-Stillwater Deposit Agreement). The Sibanye-Stillwater Deposit Agreement sets out Sibanye-Stillwater ADS Holders’ rights, as well as the rights and obligations of the ADS Depositary. New York law governs the Sibanye-Stillwater Deposit Agreement and the Sibanye-Stillwater ADSs. See – Exhibits – 2.4 Description of securities registered under Section 12 of the Exchange Act.
Fees and expenses
The Depositary will charge any party depositing or withdrawing ordinary shares or any party surrendering ADSs or to whom ADSs are issued:
| Persons depositing or withdrawing shares or ADS holders must pay | For | |||||||
| US$5.00 (or less) per 100 Sibanye-Stillwater ADSs (or portion of 100 Sibanye-Stillwater ADSs) | Issuance of Sibanye-Stillwater ADSs, including issuances resulting from a distribution of ordinary shares or rights or other property or cancellation of Sibanye-Stillwater ADSs for the purpose of withdrawal, including if the deposit agreement terminates | |||||||
| US$.05 (or less) per ADS (or a portion thereof) | Any cash distribution pursuant to the Deposit Agreement | |||||||
| A fee equivalent to the fee that would be payable if securities distributed to you had been ordinary shares and those ordinary shares had been deposited for issuance of ADSs | Distribution of securities distributed to holders of deposited securities which are distributed by the Depositary to Sibanye-Stillwater’s ADS holders | |||||||
| US$.05 (or less) per ADSs per calendar year | Depositary services | |||||||
| Registration or transfer fees | Transfer and registration of shares on Sibanye-Stillwater’s share register to or from the name of the Depositary or its agent when you deposit or withdraw ordinary shares | |||||||
| Expenses of the Depositary | Cable, telex and facsimile transmissions (when expressly provided in the deposit agreement) converting foreign currency to US dollars | |||||||
| Taxes and other governmental charges the Depositary or the custodian have to pay on any ADS or share underlying an ADS, for example, stock transfer taxes, stamp duty or withholding taxes | As necessary | |||||||
| Any charges incurred by the Depositary or its agents for servicing the deposited securities | As necessary | |||||||
The Depositary collects its fees for delivery and surrender of ADSs directly from investors depositing shares or surrendering ADSs for the purpose of withdrawal or from intermediaries acting for them. The Depositary collects fees for making distributions to investors by deducting those fees from the amounts distributed or by selling a portion of distributable property to pay the fees. The Depositary may collect its annual fee for depositary services by deduction from cash distributions or by directly billing investors or by charging the book-entry system accounts of participants acting for them. The Depositary may generally refuse to provide fee-attracting services until its fees for those services are paid.
From time to time, the Depositary may make payments to Sibanye-Stillwater to reimburse and/or share revenue from the fees collected from ADS holders, or waive fees and expenses for services provided, generally relating to costs and expenses arising out of establishment and maintenance of the ADS program. In performing its duties under the Deposit Agreement, the Depositary may use brokers, dealers or other service providers that are affiliates of the Depositary and that may earn or share fees or commissions.
51
The Depositary may convert currency itself or through any of its affiliates and, in those cases, acts as principal for its own account and not as agent, adviser, broker or fiduciary on behalf of any other person and earns revenue, including, without limitation, transaction spreads, that it will retain for its own account. The revenue is based on, among other things, the difference between the exchange rate assigned to the currency conversion made under the Deposit Agreement and the rate that the Depositary or its affiliate receives when buying or selling foreign currency for its own account. The Depositary makes no representation that the exchange rate used or obtained in any currency conversion under the Deposit Agreement will be the most favourable rate that could be obtained at the time or that the method by which that rate will be determined will be the most favourable to ADS holders, subject to the Depositary’s obligations under the Deposit Agreement. The methodology used to determine exchange rates used in currency conversions is available upon request.
In fiscal 2023, BNYM paid US$1.4 million to Sibanye-Stillwater as reimbursement for costs incurred over the year in connection with the ADS program.
Payment of taxes
You will be responsible for any taxes or other governmental charges payable on your ADSs or on the deposited securities underlying your ADSs. The Depositary may deduct the amount of any taxes owed from any payments to you. It may also restrict or refuse the transfer of your Sibanye-Stillwater ADSs or restrict or refuse the withdrawal of your underlying deposited securities until you pay any taxes owed on your Sibanye-Stillwater ADSs or underlying securities. It may also sell deposited securities to pay any taxes owed.
You will remain liable if the proceeds of the sale are not enough to pay the taxes. If the Depositary sells deposited securities, it will, if appropriate, reduce the number of Sibanye-Stillwater ADSs held by you to reflect the sale and pay to you any proceeds, or send to you any property, remaining after it has paid the taxes.
US Holders
As of 31 March 2024, 923 record holders of Sibanye-Stillwater’s ordinary shares, holding an aggregate of 221,867,893 ordinary shares 7.8%, including shares underlying Sibanye-Stillwater’s ADSs, were listed as having addresses in the United States.
52
TAXATION
Certain South African tax considerations
The discussion in this section sets out the material South African tax consequences of the purchase, ownership and disposition of Sibanye-Stillwater’s ordinary shares or ADSs under current South African law. Changes in the law may alter the tax treatment of Sibanye-Stillwater’s ordinary shares or ADSs, possibly on a retroactive basis.
The following summary is not a comprehensive description of all of the tax considerations that may be relevant to a decision to purchase, own or dispose of Sibanye-Stillwater’s ordinary shares or ADSs and does not cover tax consequences that depend upon your particular tax circumstances. In particular, the following summary addresses tax consequences for holders of ordinary shares or ADSs who are not residents of, or who do not carry on business in, South Africa and who hold ordinary shares or ADSs as capital assets (that is, for investment purposes). For the purposes of the income tax treaty between South Africa and the United States and South African tax law, a United States resident that owns Sibanye-Stillwater ADSs will be treated as the owner of the Sibanye-Stillwater ordinary shares represented by such ADSs. Sibanye-Stillwater recommends that you consult your own tax adviser about the consequences of holding Sibanye-Stillwater’s ordinary shares or ADSs, as applicable, in your particular situation.
Withholding tax on dividends
It should be noted that the withholding tax on dividends declared by South African resident companies to shareholders, including non-resident shareholders or non-resident ADS holders, was introduced with effect from 1 April 2012 and the percentage was increased on 22 February 2017 from 15% to 20%. Generally, under the terms of the double tax treaty entered into between South Africa and the United States (the Treaty) the withholding tax on dividends may be reduced to 5% of the gross amount of the dividends if the beneficial owner of the shares, being a resident of the United States, is a company holding directly at least 10% of the voting stock of the company paying the dividends and to 15% of the gross amount of the dividends in all other cases, provided certain requirements in terms of the Treaty are met. The reduction of the rate of the withholding tax on dividends in terms of the Treaty is subject to the beneficial owner of the dividends making certain declarations and undertakings and providing same to the company or regulated intermediary making payment of the dividend.
Income tax and capital gains tax
Non-resident holders of ordinary shares or ADSs should not be subject to capital gains tax in South Africa with respect to the disposal of those ordinary shares or ADSs unless (i) that non-resident shareholder (together with connected persons) holds 20% or more of the equity shares in a company that derives 80% or more of its value from immovable property, which includes mining and prospecting rights, situated in South Africa; or (ii) the shares are effectively connected with a permanent establishment of that non-resident shareholder in South Africa.
The effective tax rate at which capital gains tax is levied depends on the nature of the taxpayer and applies to the capital gain realised on disposal. For example, a company’s effective rate will be 21.6% for years of assessment ending on or after 31 March 2023 (22.4% prior to that date). Where the non-resident shareholder is subject to capital gains tax in South Africa as envisaged above and disposes of the shares, the purchaser of the ordinary shares or ADSs will be obliged to withhold a percentage (between 7.5% and 15%, depending on the nature of the seller) of the purchase consideration for the ordinary shares or ADSs payable to the non-resident shareholders and pay such amount over to the South African Revenue Service within 14 days where the purchaser is a South African resident or within 28 days where the purchaser is a non-resident. Where a double tax treaty applies, this could potentially reduce the South African capital gains tax, or deny South Africa the taxing rights, on such income, depending on the wording of the relevant double tax treaty. If the statutory amount to be withheld proves to be excessive as compared to the amount of capital gains tax which will arise, the non-resident seller can request a directive from the South African Revenue Service to have a lower amount withheld.
Securities transfer tax
No Securities Transfer Tax (STT) is payable in South Africa with respect to the issue of a security.
STT is charged at a rate of 0.25% upon the transfer of securities issued by a company or a close corporation incorporated in South Africa, and the transfer of securities listed on an exchange in South Africa which are issued by a company incorporated outside South Africa, subject to certain exemptions.
A “transfer” is broadly defined and includes the transfer, sale, assignment or cession or disposal in any other manner of a security. The cancellation or redemption of a security is also regarded as a transfer unless the company is being liquidated. However, the transfer of a security that does not result in a change in beneficial ownership of such security is not regarded as a transfer.
In respect of the transfer of a listed security, STT is levied on the amount of the consideration for that security declared by the person who acquires that security, or if no amount of consideration is declared, or if the amount so declared is less than the lowest price of the security, the closing price of that security. With regard to the transfer of an unlisted security, STT is levied on the greater of the consideration given for the acquisition of the security or the market value of an unlisted security. In the case of a transfer of a listed security, either the member, the participant or the person to whom the security is transferred is liable for the tax. The tax must be paid by the 14th day of the month following the transfer in the case of a listed security, and within two months from the end of the month in which the transfer took place in the case of an unlisted security.
Interest withholding tax
Interest withholding tax was introduced into the South African tax regime with effect from 1 March 2015. Although not specifically applicable to non-resident shareholders or non-resident ADS holders, interest withholding tax will be levied at a rate of 15% on any interest paid for the benefit of any foreign person to the extent that the interest is regarded as being from a source within South Africa. There is, however, a specific exemption from interest withholding tax on any interest incurred on a listed debt (i.e. debt listed on a recognised exchange). In addition, where interest withholding tax is levied, such interest withholding tax may be reduced by an applicable Double Taxation Treaty.
53
South African Exchange Control Limitations Affecting Security Holders
The discussion below relates to exchange controls in force as of the date of this annual report. These controls are subject to change at any time without notice. It is not possible to predict whether existing exchange controls will be abolished, continued or amended by the South African government in the future. Investors are urged to consult a professional adviser as to the exchange control implications of their particular investments.
South African law provides for Exchange Control Regulations which, among other things, restrict the outward flow of capital from South Africa (other than to countries which fall within the Common Monetary Area (CMA) consisting of South Africa, Namibia, Lesotho and Eswatini). The Exchange Control Regulations, which are administered by the Financial Surveillance Department of the SARB, regulate international transactions involving South African residents, including companies.
There are no exchange control restrictions on the remittance, in full, of cash dividends declared out of trading profits to non-residents of the CMA by Sibanye-Stillwater, provided the share certificates held by non-resident Sibanye-Stillwater shareholders have been endorsed with the words “non-resident” or, where dematerialised, the residential status of the electronic record is flagged accordingly (i.e. non-resident or emigrant) by the various participants in the central depository. The same endorsement requirement, however, will not be applicable to non-resident holders of ADSs. Pre-approval by the SARB is required where dividends in specie are declared by Sibanye-Stillwater.
ADSs representing ordinary shares of Sibanye-Stillwater are freely transferable outside South Africa between persons who are not residents of the CMA. The proceeds from the sale of ordinary shares on the JSE by shareholders who are not residents of the CMA are freely remittable to such shareholders, provided that the shares are flagged as non-resident held (the shares on the JSE have been dematerialised). Additionally, where ordinary shares are sold on the JSE on behalf of shareholders of Sibanye-Stillwater who are not residents of the CMA, the proceeds of such sales will be freely exchangeable into foreign currency and remittable to them. In such case, no share certificates need to be endorsed as the shares on the JSE have been dematerialised.
Acquisitions of Sibanye-Stillwater's ordinary shares held by South African residents by non-South African purchasers solely for a cash consideration equal to the fair value of the ordinary shares is generally permissible. Such acquisitions would require SARB pre-approval in certain circumstances, such as if the consideration for the acquisition is shares in a non-South African company or if the acquisition is financed by a loan from a South African lender. If SARB denies approval of an acquisition of assets of a South African company, this may result in an inability to complete the acquisition. Subject to this limitation, there are no restrictions on equity investments in South African companies and a foreign investor may invest freely in the ordinary shares and ADSs of Sibanye-Stillwater.
US federal income tax considerations
The following discussion summarises the material US federal income tax consequences of the acquisition, ownership and disposition of ordinary shares and ADSs by a US Holder. As used herein, the term “US Holder” means a beneficial owner of ordinary shares or ADSs that is for US federal income tax purposes:
•citizen or resident of the United States;
•a corporation created or organised under the laws of the United States, any state thereof or the District of Columbia;
•an estate the income of which is subject to US federal income tax without regard to its source; or
•a trust if a court within the United States is able to exercise primary supervision over the administration of the trust and one or more US persons have the authority to control all substantial decisions of the trust, or the trust has validly elected to be treated as a domestic trust for US federal income tax purposes.
The US federal income tax treatment of a partner in an entity or arrangement treated as a partnership for US federal income tax purposes that holds ordinary shares or ADSs will depend upon the status of the partner and the activities of the partnership. If you are an entity or arrangement treated as a partnership for US federal income tax purposes, you should consult your tax adviser concerning the US federal income tax consequences to you and your partners of the acquisition, ownership and disposition of ordinary shares or ADSs by you.
This summary only applies to US Holders that hold ordinary shares or ADSs as capital assets. This summary is based upon:
•the current federal income tax laws of the United States, including the Internal Revenue Code of 1986, as amended (the Code), its legislative history, and existing and proposed regulations promulgated thereunder;
•current IRS practice and applicable US court decisions; and
•the income tax treaty between the United States and South Africa (the Treaty) all as of the date hereof and all subject to change at any time, possibly with retroactive effect.
This summary assumes that the obligations of the Depositary under the Deposit Agreement and any related agreements will be performed in accordance with their terms.
This summary is of a general nature and does not address all US federal income tax consequences that may be relevant to you in light of your particular situation (including consequences under the alternative minimum tax or the net investment income tax), and does not address state, local, non-US or other tax laws (such as estate and gift tax laws). For example, this summary does not apply to:
•investors that own (directly, indirectly, or by attribution) 5% or more of Sibanye-Stillwater’s stock (by vote or value);
•financial institutions;
•insurance companies;
•individual retirement accounts and other tax-deferred accounts;
•tax-exempt organisations;
•dealers in securities or currencies;
54
•investors that hold ordinary shares or ADSs as part of straddles, hedging transactions or conversion transactions for US federal income tax purposes;
•persons that have ceased to be US citizens or lawful permanent residents of the United States;
•investors that hold ordinary shares or ADSs in connection with a trade or business conducted outside the United States;
•US citizens or lawful permanent residents living abroad; or
•investors whose functional currency is not the US dollar.
Sibanye-Stillwater does not believe that it was a passive foreign investment company (PFIC) for US federal income tax purposes for its most recent taxable year, and does not expect to be a PFIC for its current taxable year or in the foreseeable future. However, Sibanye-Stillwater’s possible status as a PFIC must be determined annually and therefore may be subject to change. If Sibanye-Stillwater were to be treated as a PFIC, US Holders of ordinary shares or ADSs would be required (i) to pay a special US addition to tax on certain distributions and gains on sale and (ii) to pay tax on any gain from the sale of ordinary shares or ADSs at ordinary income (rather than capital gains) rates in addition to paying the special addition to tax on this gain. Additionally, dividends paid by Sibanye-Stillwater would not be eligible for the reduced rate of tax described below under “Taxation of Dividends”, and additional reporting requirements could apply. The remainder of this discussion assumes that Sibanye-Stillwater is not a PFIC for US federal income tax purposes. You should consult your own tax advisers regarding the potential application of the PFIC regime.
The summary of US federal income tax consequences set out below is for general information only. You are urged to consult your tax advisers as to the particular tax consequences to you of acquiring, owning and disposing of the ordinary shares or ADSs, including your eligibility for the benefits of the Treaty and the applicability and effect of state, local, non-US and other tax laws and possible changes in tax law.
US Holders of ADSs
For US federal income tax purposes, a US Holder of ADSs generally will be treated as the owner of the corresponding number of underlying ordinary shares held by the Depositary for the ADSs, and references to ordinary shares in the following discussion refer also to ADSs representing the ordinary shares.
Deposits and withdrawals of ordinary shares by US Holders in exchange for ADSs will not result in the realisation of gain or loss for US federal income tax purposes. Your tax basis in withdrawn ordinary shares will be the same as your tax basis in the ADSs surrendered, and your holding period for the ordinary shares will include the holding period of the ADSs.
Taxation of dividends
Distributions paid out of Sibanye-Stillwater’s current or accumulated earnings and profits (as determined for US federal income tax purposes), before reduction for any South African withholding tax paid by Sibanye-Stillwater with respect thereto, will generally be taxable to you as dividend income, and will not be eligible for the dividends received deduction allowed to corporations. Distributions that exceed Sibanye-Stillwater’s current and accumulated earnings and profits will be treated as a non-taxable return of capital to the extent of your basis in the ordinary shares and thereafter as capital gain. However, we do not maintain calculations of our earnings and profits in accordance with US federal income tax accounting principles. You should therefore assume that any distribution by us with respect to the shares will be reported as ordinary dividend income. You should consult your own tax advisers with respect to the appropriate US federal income tax treatment of any distribution received from us.
Dividends paid by Sibanye-Stillwater generally will be taxable to non-corporate US Holders at the reduced rate normally applicable to long-term capital gains, provided that either (i) Sibanye-Stillwater qualifies for the benefits of the Treaty, or (ii) with respect to dividends paid on the ADSs, the ADSs are considered to be “readily tradable” on the NYSE. You will be eligible for this reduced rate only if you are an individual, and have held the ordinary shares or ADSs for more than 60 days during the 121-day period beginning 60 days before the ex-dividend date.
For US federal income tax purposes, the amount of any dividend paid in Rand will be included in income in a US dollar amount calculated by reference to the exchange rate in effect on the date the dividends are received by you or the Depositary (in the case of ADSs), regardless of whether they are converted into US dollars at that time. If you or the Depositary, as the case may be, convert dividends received in Rand into US dollars on the day they are received, you generally will not be required to recognise foreign currency gain or loss in respect of this dividend income.
Effect of South African withholding taxes
A US Holder may generally be entitled, subject to certain limitations, to a foreign tax credit against its US federal income tax liability, or a deduction in computing its US federal taxable income, for South African income taxes withheld by Sibanye-Stillwater (at a rate not exceeding any applicable treaty rate). The rules governing foreign tax credits are complex and recently issued final U.S. Treasury Regulations (the Final FTC Regulations) have imposed additional requirements that must be met for a foreign tax to be creditable and Sibanye-Stillwater does not intend to determine whether such requirements will be met in the case that non-U.S. taxes are withheld (if any). However, recent notices from the IRS (the Notices) indicate that the U.S. Treasury and the IRS are considering proposing amendments to the Final FTC Regulations and allow taxpayers, subject to certain conditions, to defer the application of many aspects of the Final FTC Regulations until the date when a notice or other guidance withdrawing or modifying this temporary relief is issued (or any later date specified in such notice or other guidance). The rules governing foreign tax credits are complex. You should consult your tax adviser concerning the applicability of the foreign tax credit, deductibility and source of income rules to any South African tax withheld, including the impact of the Treaty.
Taxation of a sale or other disposition
Upon a sale or other disposition of ordinary shares or ADSs, other than an exchange of ADSs for ordinary shares and vice versa, you will generally recognise US source capital gain or loss for US federal income tax purposes equal to the difference between the amount realised
55
and your adjusted tax basis in the ordinary shares or ADSs, in each case as determined in US dollars. This capital gain or loss will be long-term capital gain or loss if your holding period in the ordinary shares or ADSs exceeds one year. The deductibility of capital losses is subject to significant limitations. You should consult your tax adviser about how to account for proceeds received on the sale or other disposition of ordinary shares or ADSs that are not paid in US dollars.
To the extent you incur Securities Transfer Tax in connection with a transfer or withdrawal of ordinary shares as described under-Certain South African Tax Considerations-Securities Transfer Tax above, such securities transfer tax will not be a creditable tax for US foreign tax credit purposes. You should consult your tax adviser regarding the proper U.S. federal income tax treatment of any Securities Transfer Tax in your particular circumstances.
Backup withholding and information reporting
Payments of dividends and other proceeds with respect to ordinary shares or ADSs by US persons will be reported to you and to the IRS as may be required under applicable US Treasury Regulations. Backup withholding may apply to these payments if you fail to provide an accurate taxpayer identification number or certification of exempt status or fail to comply with applicable certification requirements. Some holders are not subject to backup withholding. You should consult your tax adviser about these rules and any other reporting obligations that may apply to the ownership or disposition of ordinary shares or ADSs, including requirements related to the holding of certain “specified foreign financial assets”.
56
DOCUMENTS ON DISPLAY
Sibanye-Stillwater will also file annual and special reports and other information with the SEC. You may read and copy any reports or other information on file at the SEC’s public reference room at the following location:
100 F Street, N.E.
Washington, D.C. 20549
Washington, D.C. 20549
Please call the SEC at 1-800-SEC-0330 for further information on the public reference room. The SEC filings are also available to the public from commercial document retrieval services. Sibanye-Stillwater’s SEC filings may also be obtained electronically via the EDGAR system on the website maintained by the SEC at http://www.sec.gov.
The above information may also be obtained at the registered office of Sibanye-Stillwater and on its website accessible at http://www.sibanyestillwater.com/news-investors/reports/annual
57
REFINING AND MARKETING
Sibanye-Stillwater has appointed Rand Refinery Proprietary Limited (Rand Refinery) to refine all of Sibanye-Stillwater’s South African-produced gold. Rand Refinery is a private company in which Sibanye-Stillwater together with its subsidiary DRDGOLD Limited holds an effective 44.4% interest, with the remaining interests held by other South African gold producers. Treasury, then sells the gold at a price benchmarked against the London morning or afternoon fixing price. Two business days after the sale of gold, Sibanye-Stillwater receives an amount in US dollars equal to the value of the gold at the London afternoon fixing price, Rand Refinery invoices Sibanye-Stillwater for the refining charges. For details on the transactions and balances between Sibanye-Stillwater and Rand Refinery for the fiscal years ended 31 December 2023, 2022 and 2021, see – Annual Financial Report – Consolidated financial statements – Notes to the consolidated financial statements – Note 39 Related-party transactions. For the period between 1 January 2024 and 31 March 2024, the following are the transactions and balances between Sibanye-Stillwater and Rand Refinery: Sibanye-Stillwater did not receive any dividends or interest income, Sibanye-Stillwater had R190 million sales of gold and Sibanye-Stillwater incurred R8 million in refining fees. As of 31 March 2024, Sibanye-Stillwater had R8 million of trade payables relating to Rand Refinery.
Sibanye-Stillwater’s US PGM operations and recycling segment make use of a single company for all of its precious metals refining services, and all of the US PGM operations’ current mined palladium and platinum is committed for sale to such company.
This significant concentration of business with a single company could leave the US PGM operations without precious metal refining services should such company experience significant financial or operating difficulties during the contract period. Under such circumstances, it is not clear that sufficient alternative processing capacity would be available to cover the US PGM operations’ requirements, nor that the terms of any such alternate processing arrangements as might be available would be financially acceptable to the US PGM operations. See – Risk Factors – Risks related to Earnings Delivery – For its PGMs mined in the United States, Sibanye-Stillwater’s sales arrangements concentrate all its final refining activity and a large portion of its PGM sales from mine production with one entity.
Concentrate from the Kroondal and Platinum mile PGM operations are purchased by Anglo American Platinum. 4E PGMs from the Rustenburg operations are toll refined by Anglo American Platinum and returned to Sibanye-Stillwater for sale. Refined PGMs are sold directly to customers (4E from Rustenburg and 6E from Marikana) with Incoterms varying based on specific customer requirements. Payments are received in US dollars, and payment terms vary depending on the nature of the sale and a customer’s credit rating and range from pre-payment up to four days from delivery.
Historically, Sibanye-Stillwater’s Sandouville refinery sold the majority of its nickel metal to a third party international mining company. From fiscal 2023, the nickel metal processed at the Sandouville refinery is being sold to end user customers, including catalyst producers and plating product distributors.
Zinc concentrate from Century is sold either through traders or directly to smelters in Australia, Korea and China for treatment into a refined 99.995% zinc metal, ready for sale to end users. The main sources of demand for zinc are for use as a coating to protect iron and steel from corrosion (galvanized metal), as alloying metal to make bronze and brass, as zinc-based die casting alloy and as rolled zinc.
58
JSE CORPORATE GOVERNANCE PRACTICES COMPARED WITH NYSE LISTING STANDARDS
Sibanye-Stillwater’s corporate governance practices are regulated by the JSE Listings Requirements. The following is a summary of the significant ways in which South Africa’s corporate governance standards and Sibanye-Stillwater’s corporate governance practices differ from those followed by domestic companies under the NYSE Listing Standards.
The NYSE Listing Standards require that the non-management directors of US-listed companies meet at regularly scheduled executive sessions without management. The JSE Listings Requirements do not require such meetings of listed company non-executive directors. Sibanye-Stillwater’s non-management directors meet regularly without management.
The NYSE Listing Standards require US-listed companies to have a nominating/corporate governance committee composed entirely of independent directors. The JSE Listings Requirements do not require the appointment of such a committee. Sibanye-Stillwater has a Nominating and Governance Committee, which is currently comprised of seven non-executive directors, all of whom are independent under the JSE Listings Requirements and NYSE Listing Standards. The Nominating and Governance Committee is chaired by the Chairman of the Sibanye-Stillwater Board.
The NYSE Listing Standards require US-listed companies to have a compensation committee composed entirely of independent directors. The JSE Listings Requirements require compliance with the King IV Governance Code, which states that the remuneration committee should comprise solely of non-executive members, with the majority of such members being independent. Sibanye-Stillwater has appointed a Remuneration Committee, currently comprised of five Board members, all of whom are independent under the King IV Governance Code and JSE Listings Requirements.
The NYSE Listings Standards require US-listed companies to have an audit committee composed entirely of independent directors. The Companies Act requires that the Audit Committee be approved by shareholders on an annual basis at a company’s annual general meeting. The Companies Act and the JSE Listings Requirements also require an audit committee composed entirely of independent directors. Sibanye-Stillwater has appointed an Audit Committee, currently comprised of six Board members, all of whom are independent non-executive, as defined under the Companies Act and the JSE Listings Requirements.
The Companies Act and the JSE Listings Requirements require the appointment of a Social and Ethics Committee. Sibanye-Stillwater has appointed a Social Ethics and Sustainability Committee, currently comprised of eight independent non-executive directors.
59
ITEM 15: CONTROLS AND PROCEDURES
a.Evaluation of Disclosure Controls and Procedures
Sibanye-Stillwater has carried out an evaluation, under the supervision and with the participation of management, including the CEO and CFO of Sibanye-Stillwater, of the effectiveness of the design and operation of Sibanye-Stillwater’s disclosure controls and procedures (as defined in Exchange Act Rule 13a - 15(e)) as of the end of the period covered by this annual report.
The term “disclosure controls and procedures”, as defined in Rules 13a-15(e) and 15d-15(e) under the Exchange Act, means controls and other procedures of a company that are designed to ensure that information required to be disclosed in the reports that it files or submits under the Exchange Act are recorded, processed, summarised and reported, within the time periods specified in the SEC’s rules and forms. Disclosure controls and procedures include, without limitation, controls and procedures designed to ensure that information required to be disclosed by a company in the reports that it files or submits under the Exchange Act is accumulated and communicated to the company’s management, including its principal executive officer and principal financial officer, as appropriate to allow timely decisions regarding required disclosure. In designing and evaluating the disclosure controls and procedures, management recognises that any controls and procedures, no matter how well designed and operated, can provide only reasonable assurance of achieving the desired control objectives.
Based upon that evaluation, Sibanye-Stillwater’s CEO and CFO concluded that, as of 31 December 2023, considering the material weakness in internal control over financial reporting described below under Item 15(b), Sibanye-Stillwater’s disclosure controls and procedures were not effective.
The material weakness did however not result in a misstatement in respect of the consolidated financial statements included in this Annual Report on Form 20-F.
Notwithstanding such material weakness in internal control over financial reporting, our management, including our CEO and CFO, has concluded that our consolidated financial statements present fairly, in all material respects, our financial position, results of our operations and our cash flows for the periods presented in this Annual Report, in conformity with International Financial Reporting Standards Accounting Standards (IFRS Accounting Standards) as issued by the International Accounting Standards Board (IASB).
b.Management’s Report on Internal Control over Financial Reporting
Sibanye-Stillwater’s management is responsible for establishing and maintaining adequate internal control over financial reporting. The Exchange Act defines internal control over financial reporting in Rule 13a - 15(f) and 15d - 15(f) as a process designed by, or under the supervision of, the Company’s principal executive and principal financial officers and effected by the Company’s board of directors, management and other personnel, to provide reasonable assurance regarding the reliability of financial reporting and the preparation of financial statements for external purposes in accordance with IFRS Accounting Standards, as issued by the IASB, and includes those policies and procedures that:
•pertain to the maintenance of records that in reasonable detail accurately and fairly reflect the transactions and dispositions of the assets of the Company;
•provide reasonable assurance that transactions are recorded as necessary to permit preparation of financial statements in accordance with IFRS Accounting Standards, as issued by the IASB, and that receipts and expenditures of the Company are being made only in accordance with authorisations of management and directors of the Company; and
•provide reasonable assurance regarding prevention or timely detection of unauthorised acquisition, use or disposition of the Company’s assets that could have a material effect on the consolidated financial statements.
Because of its inherent limitations, internal control over financial reporting may not prevent or detect misstatements. Also, projections of any evaluation of effectiveness to future periods are subject to risk that controls may become inadequate because of changes in conditions, or that the degree of compliance with the policies or procedures may deteriorate.
Sibanye-Stillwater acquired New Century Resources Limited (Century) and Copper Mines of Tasmania Proprietary Limited (CMT) during February 2023 and November 2023, respectively. Management has excluded from its assessment of internal control over financial reporting as of 31 December 2023, Century’s and CMT’s internal control over financial reporting associated with approximately 1.6% and -4.4% of consolidated total and net assets, respectively and 2.0% and 12.6% of consolidated revenues and loss for the year, respectively, included in the consolidated financial statements as of and for the year ended 31 December 2023.
A material weakness is a deficiency, or a combination of deficiencies, in internal control over financial reporting, such that there is a reasonable possibility that a material misstatement of the Company’s annual or interim financial statements will not be prevented or detected on a timely basis.
Sibanye-Stillwater’s management, under the supervision and with the participation of its CEO and CFO, assessed the effectiveness of its internal control over financial reporting as of 31 December 2023. In making this assessment, Sibanye-Stillwater’s management used the criteria set forth in Internal Control - Integrated Framework (2013) issued by the Committee of Sponsoring Organisations of the Treadway Commission (COSO). Based upon this assessment, and using those criteria, considering the material weakness described below, Sibanye-Stillwater’s management has concluded that the Company’s internal control over financial reporting was not effective as of 31 December 2023.
60
Material weakness
Management has identified a material weakness in internal control over financial reporting due to design and operating deficiencies which resulted from insufficient evidence of management review and performance of control procedures, including the level of precision in the execution of controls and procedures to ascertain completeness and accuracy of information produced by the company (IPC). These deficiencies impacted cash and cash equivalents in the South African region and platinum group metals inventory in process at the smelter at Western Platinum Proprietary Limited and Stillwater Mining Company.
The material weakness did not result in a misstatement in respect of the consolidated financial statements included in this Annual Report on Form 20-F.
The material weakness created a reasonable possibility that a material misstatement to the consolidated financial statements would not be prevented or detected on a timely basis, and therefore management concluded that the deficiencies represent a material weakness in the Company’s internal control over financial reporting in the current fiscal year and our internal control over financial reporting is not effective as of 31 December 2023.
c.Attestation Report of the Registered Public Accounting Firm
Ernst & Young Incorporated (EY Inc.), an independent registered public accounting firm that audited the consolidated financial statements included in this annual report on Form 20-F, has issued an adverse opinion on the effectiveness of Sibanye-Stillwater’s internal control over financial reporting as of 31 December 2023.
See – Annual Financial Report – Report of independent registered public accounting firm.
d.Changes in Internal Control Over Financial Reporting
Except for the material weakness identified as discussed above, there has been no changes in Sibanye-Stillwater's internal control over financial reporting (as such term is defined in Rules 13a-15(f) and 15d-15(f) under the Exchange Act) that occurred during fiscal 2023 that has materially affected, or is reasonably likely to materially affect, Sibanye-Stillwater's internal control over financial reporting.
e.Remediation
Management has initiated remedial measures to further enhance its processes and controls over financial reporting and is actively engaged to formulate a comprehensive plan for remediation of the material weakness. This plan may include the development of review procedures over IPC, enhancing the precision of management review documentation and designing, implementing and maintaining appropriate IT general controls. The material weakness will not be considered remediated until the remediation plan has been fully implemented and there has been appropriate time for the management to conclude, through testing, that the controls are designed, implemented and operating effectively. Management will continue to monitor the effectiveness of the remedial measures in their future assessments of the effectiveness of internal control over financial reporting and disclosure controls and procedures, and will make necessary changes to the design of the remedial plan and take other actions that is deemed appropriate given the circumstances.
61
EXHIBITS
The following instruments and documents are included as Exhibits to this annual report.
62
| No. | Exhibit | |||||||
| 101.INS | XBRL Instance Document | |||||||
| 101.SCH | XBRL Taxonomy Extension Scheme Linkbase Document | |||||||
| 101.CAL | XBRL Taxonomy Extension Calculation Linkbase Document | |||||||
| 101.DEF | XBRL Taxonomy Extension Definition Linkbase Document | |||||||
| 101.LAB | XBRL Taxonomy Extension Label Linkbase Document | |||||||
| 101.PRE | XBRL Taxonomy Extension Presentation Linkbase Document | |||||||
63
SIGNATURES
The registrant hereby certifies that it meets all of the requirements for filing on Form 20-F and that it has duly caused and authorised the undersigned to sign this annual report on its behalf.
| SIBANYE STILLWATER LIMITED | |||||||||||
| /s/ Charl Keyter | |||||||||||
| Name: | Charl Keyter | ||||||||||
| Title: | Chief Financial Officer | ||||||||||
| Date: | 26 April 2024 | ||||||||||
64