UNITED STATES
SECURITIES AND EXCHANGE COMMISSION
Washington, D.C. 20549
__________________________________________
FORM 10-K
__________________________________________
(Mark One)
| ANNUAL REPORT PURSUANT TO SECTION 13 OR 15(d) OF THE SECURITIES EXCHANGE ACT OF 1934 | |||||
For the fiscal year ended December 31 , 2023
OR
TRANSITION REPORT PURSUANT TO SECTION 13 OR 15(d) OF THE SECURITIES EXCHANGE ACT OF 1934 | |||||
For the transition period from _________ to _________ | |||||
Commission file number 001-41591
(Exact name of registrant as specified in its charter)
(State or other jurisdiction of incorporation or organization) | (I.R.S. Employer Identification No.) | ||||
(Address of Principal Executive Offices) | (Zip Code) | ||||
Registrant's telephone number, including area code
Securities registered pursuant to Section 12(b) of the Act:
| Title of each class | Trading Symbol(s) | Name of each exchange on which registered | ||||||
Securities registered pursuant to section 12(g) of the Act: None
Indicate by check mark if the registrant is a well-known seasoned issuer, as defined in Rule 405 of the Securities Act. Yes o No ☒
Indicate by check mark if the registrant is not required to file reports pursuant to Section 13 or Section 15(d) of the Act. Yes o No ☒
Indicate by check mark whether the registrant: (1) has filed all reports required to be filed by Section 13 or 15(d) of the Securities Exchange Act of 1934 during the preceding 12 months (or for such shorter period that the registrant was required to file such reports); and (2) has been subject to such filing requirements for the past 90 days. Yes o No ☒
Indicate by check mark whether the registrant has submitted electronically every Interactive Data File required to be submitted pursuant to Rule 405 of Regulation S-T (§232.405 of this chapter) during the preceding 12 months (or for such shorter period that the registrant was required to submit such files). Yes ☒ No o
Indicate by check mark whether the registrant is a large accelerated filer, an accelerated filer, a non-accelerated filer, a smaller reporting company, or an emerging growth company. See the definitions of “large accelerated filer,” “accelerated filer”, “smaller reporting company” and “emerging growth company” in Rule 12b-2 of the Exchange Act.
| Large accelerated filer | o | Accelerated filer | o | ||||||||
☒ | Smaller reporting company | ||||||||||
Emerging growth company | |||||||||||
If an emerging growth company, indicate by check mark if the registrant has elected not to use the extended transition period for complying with any new or revised financial accounting standards provided pursuant to Section 13(a) of the Exchange Act.o
Indicate by check mark whether the registrant has filed a report on and attestation to its management’s assessment of the effectiveness of its internal control over financial reporting under Section 404(b) of the Sarbanes-Oxley Act (15 U.S.C. 7262(b)) by the registered public accounting firm that prepared or issued its audit report. o
If securities are registered pursuant to Section 12(b) of the Act, indicate by check mark whether the financial statements of the registrant included in the filing reflect the correction of an error to previously issued financial statements. o
Indicate by check mark whether any of those error corrections are restatements that required a recovery analysis of incentive-based compensation received by any of the registrant’s executive officers during the relevant recovery period pursuant to §240.10D-1(b). o
Indicate by check mark whether the registrant is a shell company (as defined in Rule 12b-2 of the Act). Yes o No ☒
Number of shares of the registrant’s common stock outstanding at March 27, 2024: 39,995,027
DOCUMENTS INCORPORATED BY REFERENCE
Portions of the Registrant’s Proxy Statement relating to the 2024 annual meeting of stockholders (the “2024 Proxy Statement”), which will be filed within 120 days of December 31, 2023, are incorporated by reference into Part III of this Form 10-K.
TABLE OF CONTENTS
| Form 10-K | Item and Description | Page | ||||||
Item 6. [Reserved] | ||||||||
Forward-Looking Statements
All statements, other than statements of historical facts, included in this Annual Report on Form 10-K of Skyward Specialty Insurance Group, Inc. (“Skyward Specialty” or “SKWD”) for the fiscal year ended December 31, 2023 (this “Form 10-K”), or incorporated herein by reference, including, without limitation, statements regarding Skyward Specialty’s future financial position, business strategy, budgets, projected costs, goals and plans and objectives of management for future operations, are forward-looking statements within the meaning of the Private Securities Litigation Reform Act of 1995. Forward-looking statements generally can be identified by the use of forward-looking terminology such as “may,” “will,” “expect,” “intend,” “estimate,” “anticipate,” “project,” “believe” or “continue” or the negative thereof or variations thereon or similar terminology. Forward-looking statements speak only as the date the statements were made. Although Skyward Specialty believes that the expectations reflected in forward-looking statements have a reasonable basis, it can give no assurance that these expectations will prove to be correct. Forward-looking statements are subject to risks and uncertainties that could cause actual events or results to differ materially from those expressed in or implied by the statements. For a discussion of the most significant risks and uncertainties that could cause Skyward Specialty’s actual results to differ materially from those projected, see “Risk Factors” in Item 1A of this Form 10-K. Except to the limited extent required by applicable law, Skyward Specialty undertakes no obligation to update or revise any forward-looking statements, whether as a result of new information, future events or otherwise.
Select Insurance and Financial Terms
Gross written premiums
Gross written premiums are the amounts received, or to be received, for insurance policies written or assumed by us during a specific period of time without reduction for policy acquisition costs, reinsurance costs or other deductions. The volume of our gross written premiums in any given period is generally influenced by new business submissions, binding of new business submissions into policies, renewals of existing policies, and average size and premium rate of bound policies.
Ceded written premiums
Ceded written premiums are the amount of gross written premiums ceded to reinsurers. We enter into reinsurance contracts to limit our exposure to potential large losses. Ceded written premiums are earned over the reinsurance contract period in proportion to the period of risk covered. The volume of our ceded written premiums is impacted by the level of our gross written premiums and any decision we make to increase or decrease retention levels, policy limits and co-participation.
Net written premiums
Net written premiums are gross written premiums less ceded written premiums.
Net earned premiums
Net earned premiums represent the earned portion of our net written premiums. Our insurance policies generally have a term of one year and premiums are earned pro rata over the term of the policy.
Commission and fee income
Commission and fee income consists of commissions and fees earned on policies placed with third party insurance companies. In certain instances, the fee income relates to placement of business which is part of our packaged solutions. We recognize commission and fee income on the effective date of the policies.
Net investment gains (losses)
Net investments gains (losses) represent the increase or decrease in the fair value of equity securities and loans still held as investments during the period.
Net realized investment gains (losses)
Net realized investment gains (losses) are a function of the difference between the amount received by us on the sale of a security and the security’s cost basis, mark-to-market adjustments, as well as any credit impairments recognized in earnings.
Losses and LAE
Losses and loss adjustment expenses (“LAE”) represent the costs incurred for insured losses, such as losses under a policy, whether paid or unpaid, as well as expenses of settling claims, including settlements, attorneys’ fees, investigation, appraisal, adjustment, defense costs, and the portion of general expenses allocated to claim resolution. Losses and LAE include a provision for claims that have occurred but have not yet been reported to the insurer. These expenses are a function of the amount and type of insurance contracts we write, and the loss experience associated with the underlying coverage. In general, our losses and LAE are affected by:
•the occurrence, frequency and severity of claims associated with the particular types of insurance contracts that we write;
•the reinsurance agreements we have in place at the time of a loss;
•the mix of business written by us;
•changes in the legal or regulatory environment related to the business we write;
•trends in legal defense costs; and
•inflation in the cost of claims including inflation related to wages, medical costs, building materials and automobile repairs.
Losses and LAE are based on actual paid losses and expenses, as well as an actuarial analysis of the estimated losses, including losses incurred during the period and changes in estimates from prior periods. Losses and LAE may be paid out over a period of years.
Catastrophe losses
We generally define catastrophe losses as any single loss, or group of losses, related to a single Property Claim Services (“PCS” a Verisk company) designated catastrophe event. PCS has defined catastrophes in the United States, Puerto Rico, and the U.S. Virgin Islands as events that cause $25.0 million or more in direct insured losses to property and affect a significant number of policyholders and insurers.
Underwriting, acquisition and insurance expenses
Underwriting, acquisition and insurance expenses include policy acquisition costs and other underwriting and insurance expenses. Policy acquisition costs consist of commissions we pay retail agents and brokers, program administrators, captive managers and third-party administrators, net of ceding commissions we receive from reinsurers on business ceded under certain of our reinsurance contracts. In addition, acquisition expenses include premium-related taxes and other fees. Our policy acquisition costs vary with, and are directly related to, the successful production of new or renewal business. Acquisition expenses related to each policy we write are deferred and amortized to expense in proportion to the premium earned over the term of the policy. Other underwriting and insurance expenses represent the general and administrative expenses of our insurance operations including employee compensation and benefits, and corporate functions such as technology costs, office rent, depreciation and professional service fees including legal, accounting, and actuarial.
Impairment charges
Impairment charges represent reductions in the carrying value of goodwill and intangible assets.
Key Operating and Financial Metrics
We discuss certain key metrics, described below, which provide useful information about our business and the operational factors underlying our financial performance. These metrics are generally standard among insurance companies and help to provide comparability with our peers.
Net retention, expressed as a percentage, is the ratio of net written premiums to gross written premiums.
Underwriting income (loss) is a non-GAAP financial measure defined as income (loss) before income taxes excluding net investment income, net realized and unrealized gains and losses on investments, impairment charges, interest expense, amortization expense and other income and expenses.
Loss and LAE ratio, expressed as a percentage, is the ratio of losses and LAE to net earned premiums.
Expense ratio, expressed as a percentage, is the ratio of underwriting, acquisition and insurance expenses less commission and fee income to net earned premiums.
Combined ratio is the sum of loss ratio and expense ratio. A combined ratio under 100% indicates an underwriting profit. A combined ratio over 100% indicates an underwriting loss.
Adjusted loss and LAE ratio, expressed as a percentage, is a non-GAAP financial measure defined as the ratio of losses and LAE, excluding losses and LAE related to the loss portfolio transfer (“LPT”) and all development on reserves fully or partially covered by the LPT, to net earned premiums.
Adjusted combined ratio is a non-GAAP financial measure defined as the sum of the adjusted loss ratio and the expense ratio.
Adjusted operating income (loss) is a non-GAAP financial measure defined as net income excluding the net impact of the LPT, net realized and unrealized gains or losses on investments, goodwill impairment charges and other income and expenses.
Return on equity is net income as a percentage of average beginning and ending stockholders’ equity.
Adjusted return on equity is a non-GAAP financial measure defined as adjusted operating income as a percentage of average beginning and ending stockholders’ equity.
Tangible stockholders’ equity is a non-GAAP financial measure defined as stockholders’ equity less goodwill and intangible assets.
Return on tangible equity is a non-GAAP financial measure defined as net income as a percentage of average beginning and ending tangible stockholders’ equity during the applicable period.
Adjusted return on tangible equity is a non-GAAP financial measure defined as adjusted operating income as a percentage of average beginning and ending tangible stockholders’ equity during the applicable period.
PART I
Item 1. Business
Who We Are
Skyward Specialty was formed as a Delaware corporation on January 3, 2006 as an insurance holding company. We operated under the name Houston International Insurance Group, Ltd. until we re-branded as Skyward Specialty in November 2020. References to “the Company,” “we,” “our,” “us” or like terms refer to the business of Skyward Specialty Insurance Group, Inc. and its subsidiaries.
We are a growing specialty insurance company delivering commercial property and casualty (P&C) products and solutions on a non-admitted (or E&S) and admitted basis, predominantly in the United States. We focus our business on markets that are underserved, dislocated and/or for which standard insurance coverages are insufficient or inadequate to meet the needs of businesses, including our customers and prospective customers operating in these markets. Our customers typically require highly specialized, customized underwriting solutions and claims capabilities. As such, we develop and deliver tailored insurance products and services to address each of the niche markets we serve.
Our portfolio of insured risks is highly diversified—we insure customers operating in a wide variety of industries; we distribute through multiple channels; we write multiple lines of business, including general liability, excess liability, professional liability (including cyber insurance), commercial auto, group accident and health, property, agriculture, surety and workers’ compensation; we insure both short and medium duration liabilities; and our business mix is balanced between E&S and admitted markets. All of these factors enable us to respond to market opportunities and dislocations by deploying capital where we believe we can consistently earn attractive risk-adjusted returns. We believe this diversification, combined with our underwriting and claims expertise, will produce strong growth and consistent profitability across P&C insurance pricing cycles.
We are led by an entrepreneurial executive management team with decades of insurance leadership experience spanning multiple aspects of the global P&C industry. Our leadership is supported by an experienced team with a broad skill set and aligned around our strategy. We believe our high-quality leadership and underwriting and claims teams, technology DNA, advanced analytics capabilities, diversified book of business, and strong competitive position in each of our chosen market niches position us to continue to profitably grow our business. We aim to deliver long-term value for our shareholders by generating best-in-class underwriting profitability and book value per share growth across P&C market cycles.
All of our insurance company subsidiaries are group rated and have financial strength ratings of “A-” (Excellent) from the A.M. Best Company (“A.M. Best”) with positive outlook.
Our Business and Our Strategy
We have one reportable segment through which we offer a broad array of insurance coverages to a number of market niches. Each of our eight distinct underwriting divisions, or “continuing business,” has dedicated underwriting leadership supported by high-quality technical staff with deep experience in their respective niches. We believe this structure and expertise allow us to serve the needs of our customers effectively and be a value-add partner to our distributors, while earning attractive risk-adjusted returns. For the year ended December 31, 2023, 43% of our gross written premiums were written on an admitted basis and 57% were non-admitted. The year ended 2023 marked a significant underwriting achievement for us as each of our eight underwriting divisions wrote over $100.0 million in gross written premiums.
Our Underwriting Divisions
Accident & Health: Our Accident & Health (“A&H”) underwriting division provides a medical stop loss solution targeting organizations with less than 2,500 employees, as well as group and single-employer captive solutions. Our approach for managing medical costs, combined with our claims oversight, enables us to partner with select distribution partners. We target and serve a segment of the small and medium sized enterprise market that is actively seeking to take control of their healthcare costs by self-insuring a portion of their healthcare insurance. We write these products on an admitted basis and distribute primarily through retail brokers and wholesale broker partners.
Captives: Our Captives underwriting division provides group captive solutions by drawing on our underwriting and claims expertise from other underwriting divisions to create group captives for companies seeking to self-insure. By leveraging our underwriting, claims, technology, and analytical expertise across our Company, we are able to broaden our market reach and write additional profitable business with limited additional expense. Our Captive underwriting division writes group A&H, property, general liability, commercial auto, excess liability, and workers’ compensation lines of business on an E&S and an admitted basis. We often administer this business through partnerships with third-party captive managers.
1
Global Property and Agriculture: Our Global Property underwriting unit provides property-only solutions to large multi-jurisdictional entities with complex property exposures. The business is written entirely on an E&S basis. We distribute this product through retail brokers and select wholesale brokers. Our book and position with our customers and distribution partners has been curated over more than ten years, and we have become an important partner to the brokers that place this business and an equally important part of our insureds’ risk transfer program. Our Global Agriculture underwriting unit provides secondary and reinsurance solutions for crop, livestock and other renewable resources.
Industry Solutions: Our Industry Solutions underwriting division includes three underwriting units that each provide multiple coverages to the businesses they serve: Construction, Energy and Specialty Trucking. Our Construction and Energy underwriting units provide general liability, excess liability, commercial auto, workers’ compensation, and inland marine solutions, written principally on an admitted basis, to a broad range of middle market construction and energy production and servicing customers. Our Specialty Trucking unit writes on an E&S basis commercial auto and general liability solutions to mid-sized intermodal trucking companies. The industry segments we seek to underwrite often have high severity exposures that our teams of skilled and experienced underwriters and claims professionals are able to address quickly and creatively, frequently with multi-line solutions. We distribute these products through retail agents and brokers and a select network of wholesalers.
Professional Lines: Our Professional Lines underwriting division includes three underwriting units: Management Liability, Professional Liability (which includes cyber insurance), and Allied Health. Professional Liability and Allied Health provide E&S primary and excess claims-made liability products distributed exclusively through wholesale brokers, while our Management Liability unit provides both E&S and admitted products distributed through both wholesale and retail brokers.
Programs: Our Programs underwriting division partners with program administrators focused on certain markets that align with our expertise and strategy. We believe partnering with a program administrator in certain circumstances is the optimal way for us to participate profitably or extend our reach in certain markets. Typically, the program administrators possess a competitive advantage (owing to their scale in a particular market niche and/or proprietary technology) that we believe would be difficult for us to replicate on our own. For example, certain of our program administrator partners have developed proprietary technology to optimize risk selection and pricing in specific markets. We believe the combination of our underwriting and claims expertise with their scale and/or technology creates a more powerful partnership than either party could present to the market on its own. Our Programs underwriting division writes property, general liability, commercial auto liability, excess liability, and workers’ compensation lines of business on an E&S and an admitted basis.
Surety: Our Surety underwriting division provides contract, commercial and transactional surety solutions to a range of trade and services organizations requiring bonding. We principally focus on small to medium sized enterprises with aggregate bond programs up to approximately $50.0 million for contract and $75.0 million for commercial and transactional. Our underwriting and claims professionals differentiate themselves through their technical capabilities and decision making speed. We write this business on an admitted basis and distribute through retail agents and brokers.
Transactional E&S: Our Transactional E&S underwriting division provides primary and excess non-catastrophe prone property and general liability solutions, with particular emphasis on risks that are considered hard to place because of the complexity of the underlying exposure, loss history, and/or limited operating history (i.e., start up and newer businesses). Success in our target market is determined by technical underwriting, thoughtful coverage provisions and pricing, and high-quality broker service. We access the market in this division exclusively through wholesale brokers.
In addition to our continuing business, there are business units and lines of business that we previously exited and placed into run-off. We refer to these lines and businesses as our “exited business.”
Our Strategy
We seek to lead in our chosen market niches and establish sustainable competitive positions in these markets. The following key elements underpin our strategy and approach to our business:
1.Providing differentiated products, services and solutions that meet the unique needs of our target markets;
2.Attracting and retaining exceptional underwriting and claims talent and incentivizing our professionals in a manner that aligns with our organization and corporate goals;
3.Amplifying the expertise of our people with advanced technology and analytics that enable superior risk selection, pricing and claims management;
4.Empowering our underwriting and claims teams with considerable authority to make decisions and apply their expertise; and
5.Fostering a culture that promotes nimbleness and responsiveness to market opportunities and dislocation.
2
We refer to this strategy as “Rule Our Niche” and it forms the basis of our approach to building a strong defensible market position, creating a competitive moat, and winning in our chosen markets. We believe that the principles underlying our strategy are key to achieving and sustaining best-in-class underwriting results through P&C insurance pricing cycles. We consistently strive for excellence in risk selection, pricing, and claims outcomes, and to amplify these critical functions with the use of advanced technology and analytics.
Our Competitive Strengths
We believe that our competitive strengths include:
Focus on profitable niches of the market that require technical underwriting and claims management as barriers to entry.
We believe that the niche areas of the commercial lines P&C markets we have selected are a highly attractive subset of the P&C insurance market and present an opportunity to generate attractive risk-adjusted returns. We actively target markets that are underserved, dislocated or for which standard, commoditized products are insufficient or inadequate to meet the needs of our customers. The unique characteristics of the risks within our core markets require each account to be efficiently and individually underwritten, in order for us to generate an acceptable, sustainable underwriting profit. Many carriers have chosen to reject businesses that they deem to be too complex, or that requires thoughtful individual underwriting; or, alternatively, have focused on simple account risks for which more automated underwriting can be effective. Instead, we have chosen to build our underwriting divisions around deeply experienced underwriters who we empower with appropriate authority to make underwriting decisions. This structure enables us to offer innovative and unique products and solutions to our distribution partners and customers, regardless of how challenging or complex a risk may be. Further, we augment our underwriters’ experience with data and predictive analytics that are intended to differentiate risk selection and pricing decision-making while enhancing efficiency.
Highly skilled underwriters.
We focus on hiring underwriting and technical staff who help differentiate our company through their expertise and experience. Our underwriting teams are knowledgeable, experienced, and empowered — characteristics which are critical to operate successfully in the markets we serve, especially since many of the risks we underwrite are particularly difficult to automate. We do not impose strict underwriting rules (i.e., we are not “box” underwriters), but rather allow our professionals the freedom to use their expertise and judgment when evaluating and pricing risks. Simply put, we give our people the tools and appropriate authority to make decisions and do what they do best — profitably underwrite complex risks.
Superior Claims Staff and Operations.
We have cultivated a best-in-class and highly specialized team of claims professionals who are highly knowledgeable about the niches we serve and the lines of business we write. Our claims professionals systematically address first party claims with fair and equitable solutions and third-party claims with holistic and comprehensive responses, in each case seeking to ensure consistent and early loss recognition of indemnity and loss adjustment expenses (“LAE”).
We respond quickly when a claim is submitted with specialized adjusters, who are armed with expertise, advanced technology and analytics, to assist them in the claims resolution process. We embed technology deeply into our claims process and leverage our technology-enabled platform and tools from first notice of loss to investigation to settlement. Our analytics capabilities used by our senior leadership and claims teams include real-time, detailed information on open claims and benchmarks against closed claims. We believe that our industry expertise, nimble culture, and technology-embedded claims processes enables us to reach fair and appropriate claims outcomes for our customers.
Superior business intelligence platform.
SkyBI, our business intelligence platform, focuses on providing our senior leadership, as well as our technical teams, with real-time intelligence to drive superior decision making. SkyBI reflects the best practices our management team has learned from its extensive experience across the P&C insurance and technology sectors. We developed SkyBI, our single, comprehensive enterprise-wide data repository, as our foundation for reporting, business intelligence, analytics, and other advanced data capabilities. It provides our organization information and performance metrics across the Company in an easy-to-consume visualized format. The data can be filtered by many categories, including distributor, customer segment, line of business, specific industry, individual underwriter, and specific risk feature among others. SkyBI aids in establishing clear line of sight to objectives as well as facilitating our decision-making processes.
Advanced technology and new risk data for underwriting and claims.
We fundamentally believe that every underwriting and claims decision can be augmented with the use of new types of risk data and advanced technology. While our underwriting decisions are backed by reliable historical data and in-depth
3
evaluation of risks resulting from intentional investment in data collection and processing capabilities, we amplify our underwriting and claims prowess by combining this data with new forms of risk data and predictive analytics.
Diversified business that allows us to respond to, and capitalize on, changes in market conditions across P&C cycles.
We have been successful in building a diversified group of underwriting divisions spanning multiple product lines, industries, geographies and distribution channels. We aim to evolve with, and adapt to, the market growing certain lines of business when market conditions are favorable and limiting our exposure to certain markets when conditions are less favorable. We believe the diversity of our book allows us to respond to, and capitalize on, market opportunities and dislocations across P&C insurance market and pricing cycles resulting in a durable insurance franchise.
Attractive and winning culture.
As evidenced by our internal surveys, public information such as that available on Glassdoor and LinkedIn, and our selection as a “Best Places to Work in Insurance,” we have built a distinctive winning culture. Key to our culture and operating approach is a flat structure of communication and decision-making. We trust our staff to make decisions that produce or exceed our desired financial results, and we support our staff with a clear system of measurement to gauge performance. We have chosen to adopt a hybrid work schedule which provides our employees with the flexibility for remote working. We pride ourselves on maintaining an entrepreneurial environment that encourages and rewards a proactive approach to capitalize on market disruption. This environment is not only consistent with our identity as a specialty insurer but also a foundation for our success in attracting great talent and our objective of delivering best-in-class results.
High-quality, experienced leadership team that is aligned with our shareholders.
Led by our CEO, Andrew Robinson, we have an experienced, innovative and entrepreneurial executive leadership team with a track record of success in senior management roles at industry leading property and casualty companies as well as in starting and building new businesses in our industry.
Our entire senior leadership’s compensation is directly aligned with our shareholders. Each of our leaders have a material portion of their compensation in the form of long-term and short-term incentives tied to delivering sustainable, best-in-class underwriting returns. Our executive leadership team have additional long-term incentive targets tied directly to growth in book value per share.
Our Strategy in Action
With everything we do, from recruiting to marketing to underwriting to loss adjusting and claims resolution, we seek to follow the core tenets of our “Rule Our Niche” strategy, as described above. We believe our “Rule Our Niche” strategy will help us achieve our goal of generating best-in-class underwriting profitability for our niches while creating superior long-term shareholder value through growth in book value per share. The core tenets of our “Rule Our Niche” strategy include:
Attract and retain blue-chip underwriting and claims talent to expand and enhance our market position.
We seek to hire the most talented technical underwriting professionals who have long-standing industry relationships with distribution partners and claims professionals with expertise in the niches we write. These relationships are key to getting steady access to our preferred business. We believe that we have become a company of choice for the best talent in our industry and, as such, we will continue to grow our market position by bringing on world-class talent in our chosen markets.
Leverage our technology DNA to further distance ourselves from the competition.
We have demonstrated a differentiated ability to utilize new forms of risk data and advanced technology within the more complex, higher severity risk categories of the specialty P&C insurance market. SkyBI gives us the ability to promptly sense and quickly respond to market changes, while our core operating platforms allow us to move into new markets efficiently and without the complexity of burdensome systems. We believe our technological advantage positions us for profitable growth and expansion into additional specialty market niches where we can establish a strong and defensible market position.
Profitably grow existing lines of business and expand with new underwriting divisions.
We believe we are well-positioned to take advantage of several trends impacting our customers in the United States and globally. One such trend is the continued rise in demand for specialized insurance solutions because of increasing risks, as well as the complexity of risks, due to climate change/increased frequency of severe weather events, supply chain uncertainty, financial inflation risk, cyber risk, emergence of novel health risks, increased level of litigation, attorney involvement and jury awards, and healthcare delivery and cost. Another such noticeable market trend is the emergence of
4
“micro cycles and micro dislocations” where different pockets of the P&C insurance market experience hardening and softening at different times. We have demonstrated our ability to react quickly in response to these trends by launching new underwriting units, entering underserved markets, partnering with others with advanced technology, and launching new captive solutions. We believe our gross written premium growth and profitability is indicative of our momentum and provides a powerful reference for the positioning of our Company to continue to expand and grow in the markets we seek to serve.
Differentiate on daily excellence to drive best-in-class underwriting performance.
We believe that our ability to meet our long-term goals, including achieving best-in-class underwriting returns and growth in book value per share, relies on how well we execute our day-to-day operations across all of our functional departments, including but not limited to underwriting, product management, and claims management. SkyBI provides the foundation by which our senior management can monitor our performance, whether it is renewal rates, new business pricing and portfolio performance for an individual underwriter, or claims aging and reserving practices and outcomes by claims adjusters. Our focus on the fundamentals that drive underwriting excellence is at the center of our strategy. Furthermore, our cross functional collaboration ensures that our underwriting, claims, actuarial and product management teams regularly review performance and trends so that portfolio, pricing and coverage changes can be implemented quickly.
Use our balance sheet to capture a larger part of the market we serve.
We are committed to establishing and maintaining a strong balance sheet, starting with conservative loss reserves and strong capitalization ratios. We believe this is imperative to maintain the confidence of customers, distribution partners, reinsurers, regulators, rating agencies and shareholders. We have strengthened our claims case reserves practices with the aim to reserve to the expected ultimate loss within 90 days of the first notice of loss. In addition, we increase the level of IBNR reserves held above our claims case reserves. We believe our conservative reserve philosophy positions us well for consistently strong underwriting profitability in the future.
Marketing and Distribution
Our approach to marketing and distribution mirrors our approach to underwriting and is a key facet of our “Rule Our Niche” strategy. Our underwriting teams, as well as the Company as a whole, have strong and well-established relationships with our distribution partners and equally strong reputations that provide a foundation to establish affiliations with new distribution partners. We believe we win with distribution partners because of our deep expertise in niche markets, high caliber underwriters, culture of innovation, thoughtful product line-up and product design, and speed and quality of responsiveness, among other factors. All of our underwriting divisions invest meaningful time and effort into sustaining and expanding distribution partner loyalty and long-term relationships.
Just as we tailor underwriting to the individual needs of the insureds, we tailor our choice of distribution partners to access the particular business we seek to write. Accordingly, we distribute our products, through retail agents, wholesale brokers, select program administrators, and captive managers. This approach allows us to access the business we target effectively and efficiently based on the needs and dynamics of a particular market niche.
Underwriting
Our approach to underwriting is deeply embedded in our “Rule Our Niche” strategy and is core to how we win in the market. Within the eight divisions, we further specialize underwriting teams with a focus on specific niches within the markets the eight divisions serve. Kirby Hill, our President of Industry Solutions, Captives and Programs underwriting divisions, has more than 30 years of experience spanning multiple facets of the insurance business, John Burkhart, our President of Specialty Lines overseeing the Professional Lines, Surety, Transactional E&S and A&H underwriting divisions, has approximately 30 years of underwriting experience, and Doug Davies, our Senior Vice President of the Global Property and Agriculture Underwriting Division, has approximately 20 years of underwriting experience.
Our underwriting approach is underpinned by hiring highly experienced, best-in-class and diverse teams of technical underwriters with established track records in specific specialty niche markets. We then amplify our underwriters’ skill sets with advanced technology and data analytics and empower them with appropriate authority to make decisions. We believe this approach is key to superior risk selection and pricing, and producing sustainable best-in-class underwriting results across market cycles.
We strive to augment the capabilities and experience of our underwriting professionals using new forms of data and analytics for risk selection and pricing. Our underwriting data is captured in our business intelligence platform, SkyBI. This comprehensive data repository forms the foundation of our reporting, analytics, and other data capabilities and is a key tool for our senior management team and business leaders. See the section entitled “Technology” below for more information on SkyBI.
5
We are highly selective in the policies we choose to bind. If our underwriters cannot reasonably expect to bind coverage at the combination of premium and coverage terms that meets our standard, we encourage them to move on quickly to other prospective opportunities.
When accepting risks, we are careful to establish terms and price that are suited to the underlying exposure. When writing in the admitted market, we endeavor to ensure that our approved forms and filed rates are appropriate and adequate for the risks we are accepting while also allowing us the flexibility to address specific and/or unique exposures. When writing in the E&S market, we use our freedom of rate and form to ensure risk and coverage are appropriate to the unique needs and exposure that are presented in this market. We endeavor to craft policies that offer affordable and appropriate protection to address our insureds’ exposures while also constructing coverage such that potential losses are more predictable and claims cost can be best managed.
Underwriting teams are supported by active engagement and collaboration with our Claims, Actuarial, Product Management, Legal and Compliance and Finance departments so that trends in the business, legal and tort developments, and competitor and regulatory actions are analyzed, shared, and acted upon in a timely manner. We view our underwriters as the center of our company and all support functions are incented and measured to support the achievement of our underwriting profitability targets. This structure serves to surface both opportunities and issues early and forms a key part of our nimbleness and ability to take advantage of market disruptions. Finally, our underwriting controls and procedures are regularly reviewed to ensure our underwriters are acting with clear line of sight to profitably underwrite each of the markets we serve.
Claims Management
Skyward’s claims department is guided by the following principles: (1) prompt and comprehensive claim investigations, considering all aspects of each loss, and using advanced analytics and technology to improve efficiency, accuracy and speed of response; (2) providing our customers with quality claims handling service while engaging customers through the entire claims resolution process; (3) promptly establishing reserves reflective of our best estimate of ultimate loss; (4) effectively pursuing contribution and subrogation where appropriate and warranted; (5) detecting and preventing fraud activity throughout the claims handling process using a variety of tools; and (6) disciplined litigation management to provide our customers with a superior legal defense while closely monitoring legal costs. To this end, we provide continuous training to our claim staff on claim evaluation, strategy, litigation management, good-faith claims handling and best practices. Our ultimate goal is to achieve timely and optimal claim outcomes.
We handle the majority of our claims in-house. In certain instances, we utilize Third Party Administrators (TPAs), to handle claims on Skyward’s behalf, when needed. Specifically, we may utilize TPAs for programs, captives, occupational accident, workers compensation and Loss Portfolio Transfer (LPT) runoff claims. We actively manage and oversee our TPAs and monitor their individual claims-handling activities, to be in accordance with our claims handling and reserving guidelines and general best practices. We regularly audit our TPAs to ensure compliance with these guidelines and practices.
When the retention of counsel is warranted for a liability claim made against an insured, we retain independent legal counsel to defend and represent an insured. We select defense counsel based on their geographical location and expertise to ensure that they have the requisite experience and legal knowledge to defend our insureds effectively and efficiently. We have developed carefully crafted litigation guidelines for both our claims professionals and our outside counsel to follow. Adherence to these guidelines ensures that counsel is providing the appropriate defense to our insureds. Finally, to ensure that legal costs are reasonable, and customary within the respective defense counsel’s geography and practice area, we employ a legal spend management solution to analyze legal invoices for adherence to case handling and billing practice standards.
We are leveraging technology to gain efficiencies in the claims-handling process. For example, we launched a technology solution to speed up the process of creating claims correspondence and to automate routine tasks behind the scenes, such as vendor payments. Similarly, we are piloting the use of artificial intelligence to route claims to the best-suited claims handler based on likely severity. We are also developing a Large Language Model to identify claims with early indicators for potential severity, unusual types of exposures or the propensity for legal representation by third party claimants.
Additionally, we are always looking for opportunities to resolve our claims as efficiently and effectively as possible. For example, for commercial auto, we have implemented a “quick strike” program to respond to claim reports. This program involves deploying experienced investigators and other appropriate vendors to the scene of a reported auto accident, ideally within two hours of the accident, regardless of the location. This quick response assists us in evaluating the facts and circumstances of the accident to begin our investigation as quickly as possible. If appropriate, our program aids us in resolving any third-party claims as quickly as possible.
6
Finally, our claims handlers and managers are organized by line of business to ensure that the right expertise is brought to bear in handling claims. The managers and adjusters work very closely with their underwriting partners to keep them apprised of legal trends and emerging claims issues of note. The goal is to educate our underwriters on emerging areas of loss experience to assist them in their risk selection processes.
Technology
Our technology is at the heart of everything we do and every decision we make, helping us to win over the long-term. We deploy technology across our organization to drive competitive advantages in three primary functional ways:
1.Superior Business Intelligence Platform. SkyBI, our business intelligence platform, focuses on providing our senior leadership, as well as our technical teams, with real-time intelligence to drive superior decision making. SkyBI reflects the best practices our management team has learned from its extensive experience across the P&C insurance and technology sectors. We developed SkyBI, our single, comprehensive enterprise-wide data repository, as our foundation for reporting, business intelligence, analytics, and other advanced data capabilities. It provides our organization information and performance metrics across the Company in an easy-to-consume visualized format. The data can be filtered by many categories, including distributor, customer segment, line of business, specific industry, individual underwriter, and specific risk feature among others. SkyBI aids in establishing clear line of sight to objectives as well as facilitating our decision-making process.
2.Predictive Analytics Technology. We strive to augment the capabilities of our employees daily using new forms of risk data and the use of predictive analytics including artificial intelligence for risk selection, pricing and claims handling. Within every underwriting division, our actions are intentional to “Rule Our Niche.” We aim to innovate constantly, and our actions are specific to each of the divisions/markets we serve.
3.Core Transactional Platforms. Our core operating platforms, including our policy administration, billing and claims systems, are intentionally designed to enable nimble scaling and expansion of our business. We generally use, third-party vendor developed core operating applications that we have customized for our company. Our core platform organization is used for all business except for Accident & Health, Global Property and Surety as the unique features of these underwriting divisions require select dedicated core processing components. Data gathered from our core operating platforms from all divisions flows to our SkyBI platform with comparable data quality and granularity regardless of underwriting division.
Our use of advanced technology for underwriting and claims, SkyBI and core operating platforms provide our business with a flywheel effect allowing our underwriters to better select risk, our claims professionals to better adjudicate claims, our unit leaders to better communicate with reinsurance and third-party partners, and our senior leadership team to better evaluate trends in our business. These tools also have the added advantage of allowing us to communicate with our distribution partners, reinsurers, and other third-party partners more accurately, effectively, and efficiently.
Like other companies, we face external threats to our information technology systems, including the possibility of system failure, attempts to steal our customer data, and ransomware attacks. We designed our technology infrastructure to function through almost any major disruption. We replicate our data in real time to a third-party cloud disaster recovery site for use in the event of a major system failure. We also back-up our data daily for system restoration if needed. Additional actions we take to prevent disruptions to our systems and data include: actively monitoring Cybersecurity and Infrastructure Security Agency’s (CISA) cybersecurity directives, taking immediate action on any vulnerability identified in a directive; conducting monthly vulnerability scans on all network attached devices, at all locations, with patching applied whenever needed; requiring two-factor authentication for access to any of our systems; conducting monthly security training for all employees; implementing endpoint detection agents for threat detection and response; performing desktop scenarios to practice responses to breaches involving our cybersecurity insurance partners and retained security consultants; and performing annual penetration testing. We constantly review our security breach posture and regularly implement updated processes, best practices and tools.
Reinsurance
We strategically purchase reinsurance from third parties which enhances our business by protecting capital from severity events (either large single event losses or catastrophes) and reducing volatility in our earnings. Our reinsurance contracts are predominantly one year in length and renew annually throughout the year, primarily in January and June. At each annual renewal, we consider several factors that influence any changes to our reinsurance purchases, including any plans to change the underlying insurance coverage we offer, updated loss activity, the level of our capital and surplus, changes in our risk appetite and the cost and availability of reinsurance treaties.
7
We purchase quota share reinsurance, excess of loss reinsurance, and facultative reinsurance coverage to limit our exposure from losses on any one occurrence. The mix of reinsurance purchased considers efficiency, cost, our risk appetite and specific factors of the underlying risks we underwrite.
•Quota share reinsurance refers to a reinsurance contract whereby the reinsurer agrees to assume a specified percentage of the ceding company’s losses arising out of a defined class of business in exchange for a corresponding percentage of premiums, net of a ceding commission.
•Excess of loss reinsurance refers to a reinsurance contract whereby the reinsurer agrees to assume all or a portion of the ceding company’s losses for an individual claim or an event in excess of a specified amount in exchange for a premium payable amount negotiated between the parties, which includes our catastrophe reinsurance program.
•Facultative coverage refers to a reinsurance contract on individual risks as opposed to a group or class of business. It is used for a variety of reasons, including supplementing the limits provided by the treaty coverage or covering risks or perils excluded from treaty reinsurance.
The following is a summary of our reinsurance programs as of December 31, 2023:
| Line of Business | Maximum Company Retention | |||||||
| Accident & Health | $0.88 million per occurrence | |||||||
Commercial Auto(1) | $1.0 million per occurrence | |||||||
| Cyber | $2.69 million per occurrence | |||||||
Excess Casualty(1)(2) | $1.24 million per occurrence | |||||||
General Liability(1) | $1.25 million per occurrence | |||||||
Professional Lines(2) | $2.7 million per occurrence | |||||||
Property(3) | $2.8 million per occurrence | |||||||
| Representation and Warranty | $2.5 million per occurrence | |||||||
Surety(2) | $3.0 million per occurrence | |||||||
Workers’ Compensation(2) | $2.33 million per occurrence | |||||||
(1) Legal defense expenses can force exposure above the maximum company retention for Excess Casualty, Commercial Auto and General Liability. | ||||||||
(2) Reinsurance is subject to a loss ratio cap or aggregate level of loss cover that exceeds a modeled 1:250-year PML event. | ||||||||
(3) Catastrophe loss protection is purchased up to $28.0 million in excess of $12.0 million retention, which provides cover for a 1:250-year PML event. | ||||||||
For the year ended December 31, 2023, property insurance represented 27% of our gross written premiums. We actively manage and continuously monitor our aggregation of property writings by geographic area to limit our potential for aggregation of loss resulting from severe events such as hurricanes, convective storms, and earthquakes. We buy catastrophe reinsurance to further mitigate an aggregation of property losses due to a single event or series of events. To inform our purchase of catastrophe reinsurance, we use third-party stochastic and our own deterministic models to analyze the risk of aggregation of losses from such events. These models provide a quantitative view of PML events, which is an estimate of the level of loss we would expect to experience once in a given number of years (referred to as the return period). Based upon our modeling, it would take an event beyond our 1 in 250-year PML to exhaust our $28.0 million property catastrophe coverage. Additionally, we seek to expose no more than 3.0% of our stockholders’ equity to a catastrophic loss that is less than a 1 in 250-year event. We believe our current reinsurance program provides coverage well in excess of our theoretical losses from any recorded historical event.
In addition to our reinsurance programs for our continuing business, during 2020, we entered into a LPT retroactive reinsurance agreement with a third-party reinsurer domiciled in Bermuda for liabilities (including claim payments, allocated losses and LAE reserves and certain extra-contractual obligations) related to certain policies issued or assumed for policy years 2017 and prior so as to limit the volatility associated with the business written during those years. For additional information about the LPT, see Item 7 of this Form 10-K, “Management’s Discussion and Analysis of Financial Condition and Results of Operations - Results of Operations - Losses and LAE.”
We seek to purchase reinsurance from reinsurers that are rated at least “A-” (“Excellent”) or better by A.M. Best. As of December 31, 2023, 99% of our reinsurance recoverables were either derived from reinsurers rated “A-” (Excellent) by A.M. Best, or better, or were collateralized for our reinsurance recoverable by the reinsurer. While we only select reinsurers whom we believe to have acceptable credit and A.M. Best ratings, if our reinsurers are unable to pay the claims for which they are responsible, we ultimately retain primary liability to our policyholders. Hence, failure of the reinsurer to honor its obligations could result in losses to us, and therefore, we establish allowances for amounts considered uncollectible. At December 31, 2023 and 2022, our allowance for uncollectible reinsurance was $2.3 million and $0.0 million, respectively.
8
The following table sets forth our most significant reinsurers by amount of reinsurance recoverables, as well as the reinsurers A.M. Best rating, if applicable, as of December 31, 2023:
| ($ in thousands) | ||||||||||||||
| Reinsurer | Reinsurance Recoverables | AM Best Rating | ||||||||||||
| Everest Reinsurance Co. | $ | 121,832 | A+ | |||||||||||
eCaptive PC1-IC (and PC2-IC), Inc(1) | 121,805 | Unrated | ||||||||||||
| RGA Reinsurance Company | 37,070 | A+ | ||||||||||||
| Partner Reinsurance Co. of the US | 23,381 | A+ | ||||||||||||
| Swiss Reinsurance America Corp | 22,334 | A+ | ||||||||||||
| General Reinsurance Corp | 21,548 | A++ | ||||||||||||
Randall & Quilter (R&Q Bermuda (SAC) Ltd)(2) | 20,859 | Unrated | ||||||||||||
| ACE (Chubb Property & Casualty Insurance Company) | 16,003 | A+ | ||||||||||||
| Aspen Insurance UK Limited | 14,822 | A | ||||||||||||
| Munich Reinsurance America Inc. | 14,817 | A+ | ||||||||||||
| Top 10 Total | 414,471 | |||||||||||||
| All Others | 181,863 | |||||||||||||
| Total | $ | 596,334 | ||||||||||||
(1) This reinsurer facilitates our eMaxx captive; we hold collateral in a statutory trust of $150.8 million on our reinsurance recoverables | ||||||||||||||
(2) This reinsurer facilitates our LPT reinsurance agreement; we maintain the right of offset of our recoverables for premiums we owe to the reinsurer, we held collateral in a statutory trust of $23.0 million on our net reinsurance recoverables. | ||||||||||||||
Enterprise Risk Management
Our enterprise risk management (“ERM”) is embedded in nearly every aspect of our company and guides our day-to-day activities. At the highest level, our approach to ERM is to ensure we achieve an acceptable risk adjusted return for our shareholders; as such we are intentional in our underwriting and asset portfolio construction. As an example, we aim to balance liability duration of our underwriting portfolio, and we use reinsurance to manage volatility from a single loss and for cumulative losses tied to a single event or series of events. Our investment strategy is similarly set out to have a diversified target portfolio that balances portfolio yield, liquidity, volatility, and potential for principal loss.
Our Chief Risk Officer oversees several critical ERM processes as well as chairing our cross-functional corporate ERM Committee. We formalize our own view of risk and solvency in terms of potential economic loss using our Economic Capital Model (“ECM”). We use the output of our ECM to measure potential earnings and capital loss for a range of scenarios. These outputs are measured against risk tolerances that are set out and updated annually by the ERM Committee and discussed with the Risk Committee of our Board. More specifically, our ECM provides a probabilistic modeled view of earnings and capital loss that brings together the potential loss from catastrophes, reserving, underwriting, market, credit risk, strategic and operational risks.
Aside from maintaining our ECM and overseeing our risk tolerance framework, our Chief Risk Officer works with our ERM Committee to review and maintain a comprehensive risk register with accountabilities to ensure appropriate mitigations are in place and are monitored for any change. The top 10 risks are further identified and quantified by the Chief Risk Officer and the ERM Committee and reviewed every quarter. The Chief Risk Officer and the ERM Committee submit these reports to the Risk Committee on a regular basis.
We construct our operational processes and controls with a view to identify, assess and manage key risks on an ongoing basis. For example, our Underwriting Committee is responsible for overseeing changes in risk appetite, and product line and division expansion. Within Claims, we diligently monitor our claims handling practices against guidelines through regular internal audits, conduct monthly large loss reviews, and maintain and monitor a watchlist of potential high severity claims. Within Actuarial, we perform quarterly reserve studies, and our Reserve Committee meets each quarter to review and respond to trends in loss emergence. Any key observations are subsequently discussed with the CEO. Monthly and quarterly our underwriting divisions assess rate change and retention on existing business, new business quality and pricing adequacy, and loss emergence as compared to expected. Our SkyBI platform provides real-time portfolio, underwriting, claims and actuarial analytics which is critical to ensuring that the above processes achieve the desired outcome.
Altogether, our ERM is at the center of our decision making and our day-to-day activities. It is a central component to our strategy to achieve market leading risk adjusted returns for our shareholders.
9
Reserves
We maintain reserves for specific claims incurred and reported, IBNR reserves and reserves for uncollectible reinsurance when appropriate. Our ultimate liability may be greater or less than the current reserves. In the insurance industry, there is always the risk that reserves may prove inadequate. We continually monitor reserves using new information on reported claims and a variety of statistical analyses. Anticipated inflation is reflected implicitly in the reserving process through analysis of cost trends and the review of historical development. We do not discount our reserves for losses and LAE to reflect estimated present value.
When a claim is reported, we establish a case reserve for the estimated amount of the ultimate payment after an appropriate assessment of coverage, damages and other investigation as applicable. The estimate is based on our reserving practices and on the claims adjuster’s experience and knowledge of the nature and value of the specific type of claim. Case reserves are revised periodically based on subsequent developments associated with each claim. See the section entitled “Claims Management” included in this Item 1 for more information.
We establish IBNR reserves in accordance with industry practice to provide for (i) the estimated amount of future loss payments on incurred claims not yet reported, and (ii) potential development on reported claims. IBNR reserves are estimated based on generally accepted actuarial reserving techniques that take into account quantitative loss experience data and, where appropriate, qualitative factors.
We regularly review our loss reserves using a variety of actuarial techniques. We also update the reserve estimates as historical loss experience develops, additional claims are reported and/or settled and new information becomes available. A reserve can be increased or decreased over time as claims move towards settlement, which can impact earnings in the form of either adverse development or reserve releases. For additional information regarding our loss reserves, see Item 7 of this Form 10-K, “Management’s Discussion and Analysis of Financial Condition and Results of Operations - “Results of Operations - Losses and LAE” and “Critical Accounting Policies.”
Investments
We seek to maintain a balanced investment portfolio predominantly composed of investments that generate predictable and stable returns, augmented by select strategic investments that generate attractive risk-adjusted returns. Our investment allocation strategy utilizes an Enterprise Based Asset Allocation model. This model, which is embedded in our Economic Capital Model (see ERM discussion included in this Item 1), allows us to understand the impact of our investment allocation decisions on our capital, liquidity and risk profile across a range of market scenarios.
We actively manage and monitor our investment risk to balance the goals of stable growth and liquidity with our need to comply with the insurance regulatory and rating agency frameworks within which we operate. Our portfolio is mainly comprised of cash and cash equivalents and investment-grade fixed-maturity securities, supplemented by additional investments that fit our risk appetite.
The Investment Committee of our Board of Directors reviews and approves our investment policy and strategy. This committee meets on a regular basis to review and consider investment activities, tactics, and new investment opportunities as they arise. The portfolio is directed internally and includes both self-managed investments and portfolios managed by select third-party investment management firms.
Our opportunistic fixed income portfolio is managed by Arena Investors, LP (“Arena”), which is affiliated with The Westaim Corporation (“Westaim”), the Company’s largest shareholder.
For additional discussion regarding our investments, including the market risks related to our investment portfolio, see Item 7 of this Form 10-K, “Management’s Discussion and Analysis of Financial Condition and Results of Operations—Investments.”
Competition
The specialty lines property & casualty insurance market consists of many markets and sub-markets. Each market is characterized by distinct customer needs and product and services to meet those needs, and specific economic and structural features. We face competition in our underwriting divisions from other specialty and standard insurers as well as program administrators. Competition is based on many factors including pricing of coverage, the general reputation and perceived financial strength of the company, relationships with brokers, terms and conditions of products offered, ratings assigned by independent rating agencies, speed of claims payment and reputation, and the experience and reputation of the members of the underwriting and claims teams. Given the diversity of our underwriting divisions, our competition is broad and certain competitors may be specific to only a subset of our divisions. Some of our notable competitors include: Markel Corporation; W.R. Berkley Corporation; American Financial Group Inc.; Tokio Marine Holdings, Inc.; CNA Financial
10
Corporation; Hiscox, Ltd.; RLI Corp.; Intact Finance Corporation; Kinsale Capital Group, Inc.; and James River Group Holdings, Ltd.
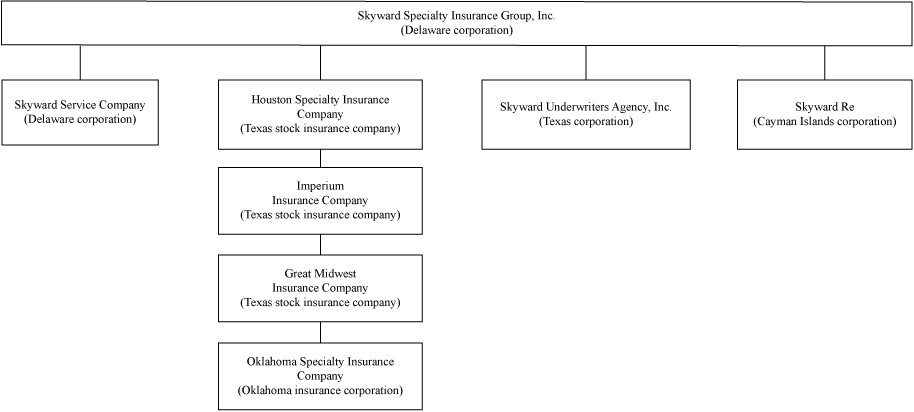
Our Structure
We conduct our operations principally through four insurance companies: Houston Specialty Insurance Company (“HSIC”), our largest insurance subsidiary, underwrites multiple lines of insurance on a surplus lines basis in 50 states, the District of Columbia and select foreign countries. Imperium Insurance Company (“IIC”), a subsidiary of HSIC, underwrites on an admitted basis in all 50 states and the District of Columbia. Great Midwest Insurance Company (“GMIC”), a subsidiary of IIC underwrites multiple lines of insurance on an admitted basis in all 50 states, the District of Columbia and is a certified surety bond company listed with the Department of the Treasury. Oklahoma Specialty Insurance Company (“OSIC”), a subsidiary of GMIC, is an approved surplus lines company in 49 states and the District of Columbia.
The following table sets forth the geographic distribution of our gross written premiums for the year ended December 31, 2023:
| 2023 | ||||||||
| Texas | 11.4 | % | ||||||
| California | 9.0 | |||||||
| New York | 8.7 | |||||||
| Louisiana | 8.0 | |||||||
| Florida | 7.3 | |||||||
| Pennsylvania | 3.4 | |||||||
| New Jersey | 3.4 | |||||||
| Georgia | 3.3 | |||||||
| Illinois | 3.2 | |||||||
| Massachusetts | 2.4 | |||||||
| All other states | 39.9 | |||||||
| Total | 100.0 | % | ||||||
In addition to our primary insurance companies, we also own Skyward Re, a wholly-owned captive reinsurance company domiciled in the Cayman Islands that was incorporated on January 7, 2020. Skyward Re was established to facilitate the LPT. For additional information about the LPT, see Item 7 of this Form 10-K, “Management’s Discussion and Analysis of Financial Condition and Results of Operations - Results of Operations - Loss and LAE.” We also operate two non-insurance companies: Skyward Underwriters Agency, Inc., a licensed agent, managing general agent and reinsurance broker, and Skyward Service Company, which provides various administrative services to our subsidiaries.
11
Our organizational structure is set forth below. Each entity is wholly-owned by its immediate parent:
Ratings
Our insurance group, Skyward Specialty Insurance Group, Inc. currently has a rating of “A-” (Excellent) with positive outlook from A.M. Best, which rates insurance companies based on factors of concern to policyholders. A.M. Best currently assigns 16 ratings to insurance companies, which currently range from “A++” (Superior) to “F” (In Liquidation). The “A-” (Excellent) rating is the fourth highest rating. In evaluating a company’s financial and operating performance, A.M. Best reviews a company’s profitability, leverage, and liquidity, as well as its book of business, the adequacy and soundness of its reinsurance, the quality and estimated market value of its assets, the adequacy of its losses and loss expense reserves, the adequacy of its surplus, its capital structure, the experience and competence of its management and its market presence. A.M. Best’s ratings reflect its opinion of an insurance company’s financial strength, operating performance, and ability to meet its obligations to policyholders. These ratings are based on factors relevant to policyholders, agents, insurance brokers and intermediaries and are not specifically related to securities issued by the company.
Regulation
Insurance Regulation
We are regulated by insurance regulatory authorities in the states in which we conduct business. State insurance laws and regulations generally are designed to protect the interests of policyholders, consumers and claimants rather than stockholders or other investors. The nature and extent of state regulation varies by jurisdiction, and state insurance regulators generally have broad administrative power relating to, among other matters, setting capital and surplus requirements, licensing of insurers and insurance producers, review and approval of product forms and rates, establishing standards for reserve adequacy, prescribing statutory accounting methods and the form and content of statutory financial reports, regulating certain transactions with affiliates and prescribing types and amounts of investments.
Regulation of insurance companies constantly changes as governmental agencies and legislatures react to real or perceived issues. In recent years, the state insurance regulatory framework has come under increased federal scrutiny, and some state legislatures have considered or enacted laws that alter and, in many cases, increase, state authority to regulate insurance companies and insurance holding company systems. Further, the National Association of Insurance Commissioners (“NAIC”) and some state insurance regulators are re-examining existing laws and regulations specifically focusing on issues relating to the solvency of insurance companies, interpretations of existing laws and the development of new laws. Although the federal government does not directly regulate the business of insurance, federal initiatives often affect the insurance industry in a variety of ways. In addition, the Federal Insurance Office (the “FIO”) was established within the U.S. Department of the Treasury by the Dodd-Frank Wall Street Reform and Consumer Protection Act (the “Dodd-Frank Act”) in July 2010. The FIO monitors all aspects of the insurance industry, including identifying issues or gaps in the regulation of insurers that could contribute to a systemic crisis in the insurance industry or the U.S. financial system, although the FIO has no express regulatory authority over insurance companies or other insurance industry participants.
12
Insurance Holding Company Regulation
We operate as an insurance holding company system and are subject to the insurance holding company laws of the State of Texas, the state in which our primary insurance companies are domiciled, as well as those of Oklahoma. These statutes require that each insurance company in the system register with the insurance department of its state of domicile and furnish information concerning the operations of companies within the holding company system that may materially affect the operations, management or financial condition of the insurers within the system and domiciled in that state. These statutes also provide that all transactions among members of a holding company system must be fair and reasonable. Transactions between insurance subsidiaries and their parents and affiliates generally must be disclosed to the state regulators, and notice to or prior approval of the applicable state insurance regulator generally is required for any material or extraordinary transaction.
Intellectual Property
We have applied for various trademark registrations in the United States at both federal and state levels. We will pursue additional trademark registrations and other intellectual property protection to the extent we believe it would be beneficial and cost effective.
In addition, we monitor our trademarks and service marks and protect them from unauthorized use as necessary.
Employees and Human Capital
As of December 31, 2023, we had approximately 515 employees. Our employees are not subject to any collective bargaining agreement, and we are not aware of any current efforts to implement such an agreement. We believe we have good working relations with our employees. We aim to be an employer of choice, and not just for insurance. As such, we strive to create a culture committed to fostering a rich diversity of thought, background and perspective.
Diversity, Equity and Inclusion
We embrace diversity, equity and inclusion initiatives as a way to improve workplace culture and demonstrate the importance of valuing our employees as people, not just as workers. We strive to cultivate an exceptional workforce to perpetuate our ownership culture and continue to achieve superior business results. Our goal is to attract, develop and retain the best talent from diverse backgrounds, while promoting a culture where different viewpoints are valued and individuals feel respected, are treated fairly and have an opportunity to excel in their chosen careers.
Compensation and Benefits
We offer and maintain a competitive benefits package designed to support the well-being of our employees, including, but not limited to, medical, dental and vision insurance, a 401(k) plan, paid time off, family leave, employee assistance programs as well as an employee stock purchase plan available to all employees. We also emphasize the training and development of our employees and provide opportunities to further their education and professional development. We know that we cannot win at our business unless we first win with our people.
Item 1A. Risk Factors
Investing in our common stock involves a high degree of risk. You should carefully consider the risks and uncertainties described below, together with all of the other information in this report, including our consolidated financial statements and related notes, as well as in our other filings with the SEC, in evaluating our business and before investing in our common stock. The risks and uncertainties described below are not the only ones we face. Additional risks and uncertainties that are not expressly stated, that we are unaware of, or that we currently believe are not material, may also become important factors that affect us. If any of the following risks occur, our business, operating results, financial condition and prospects could be materially harmed. In that event, the price of our common stock could decline, and you could lose part or all of your investment.
Summary of Material Risk Factors
Our business is subject to numerous risks and uncertainties of which you should be aware. Among others, these risks relate to:
•our financial condition and results of operations could be materially adversely affected if we do not accurately assess our underwriting risk;
•competition for business in our industry is intense;
•because our business depends on insurance retail agents and brokers, wholesalers and program administrators, we are exposed to certain risks arising out of our reliance on these distribution channels that could adversely affect our results;
13
•we may be unable to purchase third-party reinsurance in amounts we desire on commercially acceptable terms or on terms that adequately protect us, and this inability may materially adversely affect our business, financial condition and results of operations;
•our losses and loss expense reserves may be inadequate to cover our actual losses, which could have a material adverse effect on our financial condition, results of operations and cash flows;
•a decline in our financial strength rating may adversely affect the amount of business we write;
•unexpected changes in the interpretation of our coverage or provisions, including loss limitations and exclusions, in our policies could have a material adverse effect on our financial condition and results of operations;
•our reinsurers may not reimburse us for claims on a timely basis, or at all, which may materially adversely affect our business, financial condition and results of operations;
•our failure to accurately and timely pay claims could materially and adversely affect our business, financial condition, results of operations, and prospects;
•adverse economic factors, including recession, inflation, periods of high unemployment or lower economic activity could result in the sale of fewer policies than expected or an increase in the frequency of claims and premium defaults, and even the falsification of claims, or a combination of these effects, which, in turn, could affect our growth and profitability;
•the insurance business is historically cyclical in nature, which may affect our financial performance and cause our operating results to vary from quarter to quarter and may not be indicative of future performance;
•we are subject to extensive regulation, which may adversely affect our ability to achieve our business objectives; failure to comply with these regulations could subject us to penalties, including fines and suspensions, which may adversely affect our financial condition and results of operations;
•we could be adversely affected by the loss of one or more key personnel or by an inability to attract and retain qualified personnel;
•if we fail to achieve and maintain effective internal controls, our operating results and financial condition could be impacted and the market price of our common stock may be negatively affected; and
•our costs will increase significantly as a result of operating as a public company, and our management will be required to devote substantial time to complying with public company regulations.
Risks Related to Our Business and Industry
Our financial condition and results of operations could be materially adversely affected if we do not accurately assess our underwriting risk.
Our underwriting success is dependent on our ability to accurately assess the risks associated with the business we write and retain. We rely on the experience of our underwriting staff in assessing those risks. If we misunderstand the nature or extent of the risks, we may fail to establish appropriate premium rates which could adversely affect our financial results. In addition, our employees, including members of management and underwriters, make decisions and choices in the ordinary course of business that involve exposing us to risk.
Competition for business in our industry is intense.
We face competition from other specialty insurance companies, standard insurance companies and underwriting agencies. In particular, competition in the insurance industry is based on many factors, including price of coverage, the general reputation and perceived financial strength of the company, relationships with distribution partners, terms and conditions of products offered, ratings assigned by independent rating agencies, speed of claims payment and reputation, and the experience and reputation of the members of our underwriting team in the particular lines of insurance and reinsurance we seek to underwrite. In recent years, the insurance industry has undergone increasing consolidation, which may further increase competition. In addition, some of our competitors are larger and have greater financial, marketing, and other resources than we do, in addition to being able to absorb large losses more easily. Other competitors have longer operating history and more market recognition than we do in certain lines of business.
A number of new, proposed or potential industry or legislative developments could further increase competition in our industry. For example, there has been an increase in capital-raising by companies with whom we compete, which could result in new entrants to our markets and an excess of capital in the industry. Additionally, the possibility of federal regulatory reform of the insurance industry could increase competition from standard carriers.
14
We may not be able to continue to compete successfully in the insurance markets. Increased competition in these markets could result in a change in the supply and demand for insurance, affect our ability to price our products at risk-adequate rates and retain existing business, or underwrite new business on favorable terms. If this increased competition so limits our ability to transact business, our operating results could be adversely affected.
Because our business depends on insurance retail agents, brokers, wholesalers and program administrators, we are exposed to certain risks arising out of our reliance on these distribution channels that could adversely affect our results.
Substantially all of our products are ultimately distributed through independent retail agents and brokers who have the principal relationships with policyholders. Retail agents and brokers generally own the “renewal rights,” and thus our business model is dependent on our relationships with, and the success of, the retail agents and brokers with whom we do business. Further, we are also dependent on the relationships our wholesalers and program administrators maintain with the agents and brokers from whom they source their business.
Our relationship with our retail agents, brokers, wholesalers and program administrators may be discontinued at any time. Even if the relationships do continue, they may not be on terms that are profitable for us. For example, as insurance distribution firms continue to consolidate, their ability to influence commission rates may increase as may the concentration of business we have with a particular broker. Further, certain premiums from policyholders, where the business is produced by brokers, are collected directly by the brokers and remitted to us. In certain jurisdictions, when the insured pays its policy premium to its broker for payment on behalf of our insurance subsidiary, the premium might be considered to have been paid under applicable insurance laws and regulations. Accordingly, the insured would no longer be liable to us for those amounts, whether or not we have actually received the premium from that broker. Consequently, we assume a degree of credit risk associated with the brokers with which we work. Although the failure by any of our brokers to remit premiums to us has not been material to date, there may be instances where our brokers collect premiums but do not remit them to us and we may be required under applicable law to provide the coverage set forth in the policy despite the related premiums not being paid to us. Similarly, if we are limited in our ability to cancel policies for non-payment, our underwriting profits may decline and our financial condition and results of operations could be materially and adversely affected.
We review the financial condition of potential new brokers before we agree to transact business with them, and we periodically review the agencies, brokers, wholesalers and program administrators with whom we do business to identify those that do not meet our profitability standards or are not aligned with our business objectives. Following these periodic reviews, we may restrict such distributors’ access to certain types of products or terminate our relationship with them, subject to applicable contractual and regulatory requirements that limit our ability to terminate agents or require us to renew policies. Even through the utilization of these measures, we may not achieve the desired results.
Because we rely on these distributors as our sales channel, any deterioration in the relationships with our distributors or failure to provide competitive compensation could lead our distributors to place more premium with other carriers and less premium with us. In addition, we could be adversely affected if the distributors with whom we do business exceed their granted authority, fail to transfer collected premium to us or breach the obligations that they owe to us. Although we routinely monitor our distribution relationships, such actions could expose us to liability.
Also, if insurance distribution firm consolidation continues at its current pace or increases in the future, our sales channels could be materially affected in a number of ways, including loss of market access or market share in certain geographic areas. Specifically, we could be negatively affected due to loss of talent as the people most knowledgeable about our products and with whom we have developed strong working relationships exit the business following an acquisition, or, increases in our commission costs as larger distributors acquire more negotiating leverage over their fees. Any such disruption that materially affects our sales channel could have a negative impact on our results of operations and financial condition.
As the speed of digitization accelerates, we are subject to risks associated with both our distributors and their ability to keep pace. In an increasingly digital world, distributors who cannot provide a digital or technology-driven experience risk losing customers who demand such an experience, and such customers may choose to utilize more technology-driven distributors.
We may be unable to purchase third-party reinsurance in amounts we desire on commercially acceptable terms or on terms that adequately protect us, and this inability may materially adversely affect our business, financial condition and results of operations.
We strategically purchase reinsurance from third parties which enhances our business by protecting capital from severity events (either large single event losses or catastrophes) and reducing volatility in our earnings. Reinsurance involves transferring, or ceding, a portion of our risk exposure on policies that we write to another insurer, the reinsurer, in exchange for a cost. If we are unable to renew our expiring contracts, enter into new reinsurance arrangements on
15
acceptable terms or expand our coverage, our loss exposure could increase, which would increase our potential losses related to loss events. If we are unwilling to bear an increase in loss exposure, we may need to reduce the level of our underwriting commitments, both of which could materially adversely affect our business, financial condition and results of operations.
There are situations in which reinsurers may exclude certain coverages from, or alter terms in, the reinsurance contracts we enter into with them. As a result, we, like other insurance companies, could write insurance policies which to some extent do not have the benefit of reinsurance protection. These gaps in reinsurance protection expose us to greater risk and greater potential losses.
Our losses and loss expense reserves may be inadequate to cover our actual losses, which could have a material adverse effect on our financial condition, results of operations and cash flows.
Our success depends on our ability to accurately assess the risks related to the businesses and people that we insure. We establish losses and LAE reserves for the best estimate of the ultimate payment of all claims that have been incurred, or could be incurred in the future, and the related costs of adjusting those claims, as of the date of our financial statements. Reserves do not represent an exact calculation of liability. Rather, reserves represent an estimate of what we expect the ultimate settlement and administration of claims will cost us, and our ultimate liability may be greater or less than our estimate.
As part of the reserving process, we review historical data and consider the impact of such factors as:
•claims inflation, which is the sustained increase in cost of raw materials, labor, medical services and other components of claims cost;
•claims development patterns by line of business, as well as frequency and severity trends;
•pricing for our products;
•legislative activity;
•social and economic patterns; and
•litigation, judicial and regulatory trends.
These variables are affected by both internal and external events that could increase our exposure to losses, and we continually monitor our loss reserves using new information on reported claims and a variety of statistical techniques and modeling simulations. This process assumes that past experience, adjusted for the effects of current developments, anticipated trends and market conditions, is an appropriate basis for predicting future events. There is, however, no precise method for evaluating the impact of any specific factor on the adequacy of loss reserves, and actual results may deviate, perhaps substantially, from our reserve estimates. For instance, the following uncertainties may have an impact on the adequacy of our reserves:
•When a claim is received, it may take considerable time to appreciate fully the extent of the covered loss suffered by the insured and, consequently, estimates of loss associated with specific claims can increase over time. Consequently, estimates of loss associated with specified claims can change as new information emerges, which could cause the reserves for the claim to become inadequate.
•New theories of liability are enforced retroactively from time to time by courts. The failure of any of the loss limitations or exclusions we employ, or changes in other claims or coverage issues, could have a material adverse effect on our financial condition or results of operations.
•Volatility in the financial markets, economic events and other external factors may result in an increase in the number of claims and/or severity of the claims reported. In addition, elevated inflationary conditions would, among other things, cause loss costs to increase. Adverse economic factors, including recession, inflation, periods of high unemployment or lower economic activity could result in the sale of fewer policies than expected or an increase in frequency or severity of claims and premium defaults or both, which, in turn, could affect our growth and profitability.
•Increased cost due to “social inflation,” including continued increase of medical costs, more costly technology in vehicles, supply chain disruptions, more involvement of attorneys in claims matters, third-party financing of litigation, lawsuit abuse and other factors, all of which could increase the frequency and severity of claims and affect the adequacy of our loss reserves.
•If claims were to become more frequent, even if we had no liability for those claims, the cost of evaluating such potential claims could escalate beyond the amount of the reserves we have established. As we enter new lines of
16
business, or as a result of new theories of claims, we may encounter an increase in claims frequency and greater claims handling costs than we had anticipated.
If any of our reserves should prove to be inadequate, we will be required to increase our reserves resulting in a reduction in our net income and stockholders’ equity in the period in which the deficiency is identified.
Future loss experience substantially in excess of established reserves could also have a material adverse effect on our future earnings and liquidity and our financial rating.
A decline in our financial strength rating may adversely affect the amount of business we write.
Participants in the insurance industry use ratings from independent ratings agencies, such as A.M. Best, as an important means of assessing the financial strength and quality of insurers. In setting its ratings, A.M. Best performs quantitative and qualitative analysis of a company’s balance sheet strength, operating performance and business profile. A.M. Best financial strength ratings range from “A++” (Superior) to “F” for insurance companies that have been publicly placed in liquidation. As of the date of this filing, A.M. Best has assigned a financial strength rating of “A-” (Excellent) with positive outlook to us. A.M. Best assigns ratings that are intended to provide an independent opinion of an insurance company’s ability to meet its obligations to policyholders and is not an evaluation directed to investors and is not a recommendation to buy, sell or hold our common stock or any other securities we may issue. A.M. Best’s analysis includes comparisons to peers and industry standards as well as assessments of operating plans, philosophy and management. A.M. Best periodically reviews our financial strength rating and may revise it downward at their discretion based primarily on its analyses of our balance sheet strength, operating performance and business profile. There are specific building blocks A.M. Best reviews, including capital adequacy, operating performance, operating profile and ERM, as well as other factors that could affect their analyses such as:
•if we change our business practices from our organizational business plan in a manner that no longer supports A.M. Best’s rating;
•if unfavorable financial, regulatory or market trends affect us, including excess market capacity;
•if our losses exceed our loss reserves;
•if we have unresolved issues with government regulators;
•if we are unable to retain our senior management or other key personnel;
•if our investment portfolio incurs significant losses or our liquidity is limited; or
•if A.M. Best alters its capital adequacy assessment methodology in a manner that would adversely affect our rating.
These and other factors could result in a downgrade of our financial strength rating. A downgrade or withdrawal of our rating could result in any of the following consequences, among others:
•causing our current and future distribution partners and insureds to choose other, more highly-rated competitors;
•increasing the cost or reducing the availability of reinsurance to us; or
•severely limiting or preventing us from writing new and renewal insurance contracts.
In addition, in view of the earnings and capital pressures experienced by many financial institutions, including insurance companies, it is possible that rating organizations will heighten the level of scrutiny that they apply to such institutions, will increase the frequency and scope of their credit reviews, will request additional information from the companies that they rate or will increase the capital and other requirements employed in the rating organizations’ models for maintenance of certain ratings levels. We can offer no assurance that our rating will remain at its current level. It is possible that such reviews of us may result in adverse ratings consequences, which could have a material adverse effect on our financial condition and results of operations.
Unexpected changes in the interpretation of our coverage or provisions, including loss limitations and exclusions, in our policies could have a material adverse effect on our financial condition and results of operations.
There can be no assurances that loss limitations or exclusions in our policies will be enforceable in the manner we intend. As industry practices and legal, judicial, social, and other conditions change, unexpected and unintended issues related to claims and coverage may emerge. For example, many of our policies limit the period during which a policyholder may bring a claim, which may be shorter than the statutory period under which such claims can be brought against our policyholders. While these limitations and exclusions help us assess and mitigate our loss exposure, it is possible that a court or regulatory authority could nullify or void a limitation or exclusion or legislation could be enacted
17
modifying or barring the use of such limitations or exclusions. These types of governmental actions could result in higher than anticipated losses and LAE, which could have a material adverse effect on our financial condition or results of operations. In addition, court decisions, such as the 1995 Montrose decision in California could read policy exclusions narrowly so as to expand coverage, thereby requiring insurers to create and write new exclusions.
These issues may adversely affect our business by either broadening coverage beyond our underwriting intent or by increasing the frequency or severity of claims. In some instances, these changes may not become apparent until sometime after we have issued insurance contracts that are affected by the changes. As a result, the full extent of liability under our insurance contracts may not be known for many years after a contract is issued.
Our reinsurers may not reimburse us for claims on a timely basis, or at all, which may materially adversely affect our business, financial condition and results of operations.
The reinsurance contracts that we enter into to help manage our risks require us to pay premiums to the reinsurance carriers who will in turn reimburse us for a portion of covered policy claims. In many cases, a reinsurer will be called upon to reimburse us for policy claims many years after we paid insurance premiums to the insurer. Although reinsurance makes the reinsurer liable to us to the extent the risk is transferred or ceded to the reinsurer, it does not relieve us (the ceding insurer) of our primary liability to our policyholders. Our current reinsurance program is designed to limit our financial risk. However, our reinsurers may not pay claims we incur on a timely basis, or they may not pay some or all of these claims. For example, reinsurers may default in their financial obligations to us as the result of insolvency, lack of liquidity, operational failure, political and/or regulatory prohibitions, fraud, asserted defenses based on agreement wordings or the principle of utmost good faith, asserted deficiencies in the documentation of agreements or other reasons. Any disputes with reinsurers regarding coverage under reinsurance contracts could be time consuming, costly, and uncertain of success. These risks could cause us to incur increased net losses, and, therefore, adversely affect our financial condition. As of December 31, 2023, we had $596.3 million of aggregate reinsurance recoverables.
Our failure to accurately and timely pay claims could materially and adversely affect our business, financial condition, results of operations, and prospects.
We must accurately and timely evaluate and pay claims that are made under our policies. Many factors affect our ability to pay claims accurately and timely, including the training and experience of our claims representatives, including our TPAs, the effectiveness of our management, and our ability to develop or select and implement appropriate procedures and systems to support our claims functions and other factors. Our failure to pay claims accurately and timely could lead to regulatory and administrative actions or material litigation, undermine our reputation in the marketplace and materially and adversely affect our business, financial condition, results of operations, and prospects.
In addition, if we do not manage our TPAs effectively, or if our TPAs are unable to effectively handle our volume of claims, our ability to handle an increasing workload could be adversely affected. In addition to potentially requiring that growth be slowed in the affected markets, our business could suffer from decreased quality of claims work which, in turn, could adversely affect our operating margins.
Severe weather conditions, including the effects of climate change, catastrophes, pandemic, as well as man-made event events may adversely affect our business, results of operations and financial condition.
Our business is exposed to the risk of severe weather conditions, earthquakes and man-made catastrophes. Catastrophes can be caused by various events, including natural events such as severe winter weather, severe convective storms/tornadoes, windstorms, earthquakes, hailstorms, severe thunderstorms and fires, or man-made events such as explosions, war, terrorist attacks and riots. Over the past several years, changing weather patterns and climatic conditions, such as global warming, have added to the unpredictability and frequency of natural disasters in certain parts of the world, including the markets in which we operate. Climate change may increase the frequency and severity of extreme weather events. This effect has led to conditions in the ocean and atmosphere, including warmer-than-average sea-surface temperatures and low wind shear that increase hurricane activity. The occurrence of a natural disaster or other catastrophe loss could materially adversely affect our business, financial condition, and results of operations. Additionally, any increased frequency and severity of such weather events, including hurricanes, could have a material adverse effect on our ability to predict, quantify, reinsure and manage catastrophe risk and may materially increase our losses resulting from such catastrophe events.
The extent of losses from catastrophes is a function of both the frequency and severity of the insured events and the total amount of insured exposure in the areas affected. The incidence and severity of catastrophes and severe weather conditions are inherently unpredictable. We manage our exposure to losses by analyzing the probability and severity of the occurrence of loss events and the impact of such events on our overall underwriting and investment portfolio. In addition, our inability to obtain reinsurance coverage at reasonable rates and in amounts adequate to mitigate the risks associated
18
with severe weather conditions and other catastrophes could have a material adverse effect on our business and results of operations.
Our business is also exposed to the risk of pandemics, outbreaks, public health crises, and geopolitical and social events, and their related effects. While policy terms and conditions in the lines of business written by us would be expected to preclude coverage for virus-related claims, like the COVID-19 pandemic, court decisions and governmental actions may challenge the validity of any exclusions or our interpretation of how such terms and conditions operate.
Because we provide our program administrators with specific quoting and binding authority, if any of them fail to comply with pre-established guidelines, our results of operations could be adversely affected.
We market and distribute certain of our insurance products through program administrators that have limited quoting and binding authority, and they in turn, sell our insurance products to insureds through retail agents and brokers. These program administrators can bind certain risks without our initial approval. If any of these program administrators fail to comply with our underwriting guidelines and the terms of their appointments, we could be bound on a particular risk or number of risks that were not anticipated when we developed the insurance products or estimated losses and LAE. Such actions could adversely affect our results of operations.
If actual renewals of our existing contracts do not meet expectations, our written premium in future years and our future results of operations could be materially adversely affected.
Most of our contracts are written for a one-year term. In our financial forecasting process, we make assumptions about the rates of renewal of our prior year’s contracts. The insurance and reinsurance industries have historically been cyclical businesses with intense competition, often based on price. If actual renewals do not meet expectations or if we choose not to write renewals because of pricing conditions, our written premium in future years and our future operations would be materially adversely affected.
Increased public attention to environmental, social and governance matters may expose us to negative public perception, cause reputational harm, impose additional costs on our business or impact our stock price.
Recently, more attention is being directed towards publicly traded companies regarding environmental, social and governance (“ESG”) matters. A failure, or perceived failure, to respond to investor or customer expectations related to ESG concerns could cause harm to our business and reputation. For example, our insureds include a wide variety of industries, including potentially controversial industries. Damage to our reputation as a result of our provision of policies to certain insureds could result in decreased demand for our insurance products and could have a material adverse effect on our business, operational results and financial results, as well as require additional resources to rebuild our reputation, competitive position and brand strength.
Changes in accounting practices and future pronouncements may materially affect our reported financial results.
Developments in accounting practices may require us to incur considerable additional expenses to comply, particularly if we are required to prepare information relating to prior periods for comparative purposes or to apply the new requirements retroactively. The impact of changes in current accounting practices and future pronouncements cannot be predicted but may affect the calculation of net income, shareholder’s equity and other relevant financial statement line items.
Our insurance subsidiaries are required to comply with statutory accounting principles, or SAP. SAP and various components of SAP are subject to constant review by the NAIC and its task forces and committees, as well as state insurance departments, in an effort to address emerging issues and otherwise improve financial reporting. Various proposals are pending before committees and task forces of the NAIC, some of which, if enacted and adopted on a state level, could have negative effects on insurance industry participants. The NAIC continuously examines existing laws and regulations. We cannot predict whether or in what form such reforms will be enacted and, if so, whether the enacted reforms will positively or negatively affect us.
Risks Related to the Market and Economic Conditions
Adverse economic factors, including recession, inflation, periods of high unemployment or lower economic activity could result in the sale of fewer policies than expected or an increase in the frequency of claims and premium defaults, and even the falsification of claims, or a combination of these effects, which, in turn, could affect our growth and profitability.
Factors, such as business revenue, economic conditions, the volatility and strength of the capital markets, and inflation can affect the business and economic environment. These same factors affect our ability to generate revenue and profits. In an economic downturn that is characterized by higher unemployment, declining spending, and reduced corporate revenue, the demand for insurance products is generally adversely affected, which directly affects our premium levels and
19
profitability. Negative economic factors may also affect our ability to receive the appropriate rate for the risk we insure with our policyholders and may adversely affect the number of policies we can write, and our opportunities to underwrite profitable business. In an economic downturn, our customers may have less need for insurance coverage, cancel existing insurance policies, modify their coverage or not renew the policies they hold with us. Existing policyholders may exaggerate or even falsify claims to obtain higher claims payments. In addition, if certain segments of the economy, such as the construction or energy production and servicing segments (which would affect several of our underwriting divisions at one time) were to significantly collapse, it could adversely affect our results. These outcomes would reduce our underwriting profit to the extent these factors are not reflected in the rates we charge.
The insurance business is historically cyclical in nature, which may affect our financial performance and cause our operating results to vary from quarter to quarter and may not be indicative of future performance.
Historically, insurance carriers have experienced significant fluctuations in operating results due to competition, frequency and severity of catastrophic events, levels of capacity, adverse litigation trends, regulatory constraints, general economic conditions, and other factors. The supply of insurance is related to prevailing prices, the level of insured losses and the level of capital available to the industry that, in turn, may fluctuate in response to changes in rates of return on investments being earned in the insurance industry. As a result, the insurance business historically has been a cyclical industry characterized by periods of intense price competition due to excessive underwriting capacity (soft market cycle) as well as periods when shortages of capacity increased premium levels (hard market cycle). Demand for insurance depends on numerous factors, including the frequency and severity of catastrophic events, levels of capacity, the introduction of new capital providers and general economic conditions. All of these factors fluctuate and may contribute to price declines generally in the insurance industry.
Although an individual insurance company’s financial performance depends on its own specific business characteristics, the profitability of most P&C insurance companies tends to follow this cyclical market pattern with higher gross written premium growth and improved profitability during hard market cycles. Further, this cyclical market pattern can be more pronounced in the E&S market than in the standard insurance market. When the standard insurance market hardens, the E&S market typically hardens, and growth in the E&S market can be significantly more rapid than growth in the standard insurance market. Similarly, when conditions begin to soften, many customers that were previously driven into the E&S market may return to the admitted market, exacerbating the effects of rate decreases on our financial results. At present, we believe we are experiencing a relatively hard market cycle, however, we cannot predict the timing or duration of changes in the market cycle because the cyclicality is due in large part to the actions of our competitors and general economic factors. As a result, our operating results are subject to fluctuation and have historically varied from quarter to quarter. We expect our quarterly results will continue to fluctuate in the future due to a number of factors, including the general economic conditions in the markets where we operate, the frequency of occurrence or severity of catastrophe or other insured events, fluctuating interest rates, claims exceeding our loss reserves, competition in our industry, deviations from expected premium retention rates of our existing policies and contracts, adverse investment performance, and the cost of reinsurance coverage.
Performance of our investment portfolio is subject to a variety of investment risks that may adversely affect our financial results.
Our results of operations depend, in part, on the performance of our investment portfolio. We seek to hold a diversified portfolio of investments that is managed by professional investment advisory management firms in accordance with our investment policy and routinely reviewed by our Investment Committee. However, our investments are subject to general economic conditions and market risks as well as risks inherent to specific securities. Our primary market risk exposures are to changes in interest rates and equity prices. See the section entitled “Management’s Discussion and Analysis of Financial Condition and Results of Operations - Investments - Market Risk.”
A significant amount of our investment portfolio is invested in fixed maturity securities, or separately managed accounts and limited partnerships invested primarily in fixed maturity securities. Interest rates rose materially during 2022 and 2023. Should the recent rate increases decline, including as a result of steps taken by the federal government to slow inflation, such as the passage of the Inflation Reduction Act of 2022, a low interest rate environment would place pressure on our net investment income, particularly as it relates to these securities and short-term investments, which, in turn, may adversely affect our operating results. Recent and future increases in interest rates could cause the values of our fixed income securities portfolios to decline, with the magnitude of the decline depending on the duration of securities included in our portfolio and the amount by which interest rates increase. Some fixed income securities have call or prepayment options, which create possible reinvestment risk in declining rate environments. Other fixed income securities, such as mortgage-backed and other asset-backed securities, carry prepayment risk or, in a rising interest rate environment, may not prepay as quickly as expected.
20
All of our fixed maturity securities, including those held in separately managed accounts and limited partnerships, are subject to credit risk. Credit risk is the risk that certain investments may default or become impaired due to deterioration in the financial condition of one or more issuers of the securities we hold, or due to deterioration in the financial condition of an insurer that guarantees an issuer’s payments on such investments. Downgrades in the credit ratings of fixed maturity securities (where rated) could also have a significant negative effect on the market valuation of such securities.
We also invest in marketable preferred and common equity securities and exchange traded funds. These securities are carried on the balance sheet at fair market value and are subject to potential losses and declines in market value.
The above market and credit risks could reduce our net investment income and result in realized investment losses. Our investment portfolio is subject to increased valuation uncertainties when investment markets are illiquid, as is the case with our fixed maturity securities held to maturity, separately managed accounts, and limited partnership investments. The valuation of investments is more subjective when markets are illiquid, thereby increasing the risk that the estimated fair value (i.e., the carrying amount) of the securities we hold in our portfolio do not reflect prices at which actual transactions would occur.
Risks for all types of securities are managed through the application of our investment policy, which establishes investment parameters that include but are not limited to, maximum percentages of investment in certain types of securities and minimum levels of credit quality, which we believe are within applicable guidelines established by the NAIC, the Texas Department of Insurance, and the Oklahoma Department of Insurance. In addition, our Investment Committee periodically reviews our Enterprise Based Asset Allocation models to assist in overall risk management.
Although we seek to preserve our capital, we cannot be certain that our investment objectives will be achieved, and results may vary substantially over time. In addition, although we seek to employ investment strategies that are not correlated with our insurance and reinsurance exposures, losses in our investment portfolio may occur at the same time as underwriting losses and, therefore, exacerbate the adverse effect of the losses on us.
We could be forced to sell investments to meet our liquidity requirements.
We invest the premiums we receive from our insureds until they are needed to pay policyholder claims. Consequently, we seek to manage the duration of our investment portfolio based on the duration of our losses and LAE reserves to provide sufficient liquidity and avoid having to liquidate investments to fund claims. Risks such as inadequate losses and LAE reserves or unfavorable trends in litigation could potentially result in the need to sell investments to fund these liabilities. We may not be able to sell our investments at favorable prices or at all. Sales could result in significant realized losses depending on the conditions of the general market, interest rates and credit issues with individual securities.
Risks Related to the Regulatory Environment
We are subject to extensive regulation, which may adversely affect our ability to achieve our business objectives. In addition, if we fail to comply with these regulations, we may be subject to penalties, including fines and suspensions, which may adversely affect our financial condition and results of operations.
Our primary insurance subsidiaries, HSIC, IIC, and GMIC, are subject to extensive regulation in Texas, their state of domicile, and to a lesser degree, the other states in which they operate. Most insurance regulations are designed to protect the interests of insurance policyholders, as opposed to the interests of investors or stockholders. These regulations generally are administered by a department of insurance in each state and relate to, among other things, capital and surplus requirements, investment and underwriting limitations, affiliate transactions, dividend limitations, changes in control, solvency and a variety of other financial and non-financial aspects of our business. Significant changes in these laws and regulations could further limit our discretion or make it more expensive to conduct our business. State insurance regulators also conduct periodic examinations of the affairs of insurance and reinsurance companies and require the filing of annual and other reports relating to financial condition, holding company issues and other matters. These regulatory requirements may impose timing and expense constraints that could adversely affect our ability to achieve some or all of our business objectives.
Our insurance subsidiaries are part of an “insurance holding company system” within the meaning of applicable Texas statutes and regulations. As a result of such status, certain transactions between our insurance subsidiaries and one or more of their affiliates may not be effected unless the insurer has provided notice of that transaction to the Texas Department of Insurance. These prior notification requirements may result in business delays and additional business expenses. If our insurance subsidiaries fail to file a required notification or fail to comply with other applicable insurance regulations in Texas, we may be subject to significant fines and penalties and our working relationship with the Texas Department of Insurance may be impaired.
In addition, state insurance regulators have broad discretion to deny or revoke licenses for various reasons, including the violation of regulations. In some instances, where there is uncertainty as to applicability, we follow practices based on
21
our interpretations of regulations or practices that we believe generally to be followed by the industry. These practices may turn out to be different from the interpretations of regulatory authorities. If we do not have the requisite licenses and approvals or do not comply with applicable regulatory requirements, state insurance regulators could preclude or temporarily suspend us from carrying on some or all of our activities in their state or could otherwise penalize us. This could adversely affect our ability to operate our business. Further, changes in the level of regulation of the insurance industry or changes in laws or regulations themselves or interpretations by regulatory authorities could interfere with our operations and require us to bear additional costs of compliance, which could adversely affect our ability to operate our business.
Our insurance subsidiaries are subject to risk-based capital requirements, based upon the “risk based capital model” adopted by the NAIC, and other minimum capital and surplus restrictions imposed under Texas law. These requirements establish the minimum amount of risk-based capital necessary for a company to support its overall business operations. It identifies property and casualty insurers that may be inadequately capitalized by looking at certain inherent risks of each insurer’s assets and liabilities and its mix of net written premium. Insurers falling below a calculated threshold may be subject to varying degrees of regulatory action, including supervision, rehabilitation or liquidation. Failure to maintain our risk-based capital at the required levels could adversely affect the ability of our insurance subsidiary to maintain regulatory authority to conduct our business and our A.M. Best Rating.
We may become subject to additional government or market regulation, which may have a material adverse impact on our business.
Our business could be adversely affected by changes in state laws, including those relating to asset and reserve valuation requirements, surplus requirements, limitations on investments and dividends, enterprise risk and risk-based capital requirements, and, at the federal level, by laws and regulations that may affect certain aspects of the insurance industry, including proposals for preemptive federal regulation. The U.S. federal government generally has not directly regulated the insurance industry except for certain areas of the market, such as insurance for flood, nuclear and terrorism risks. However, the federal government has undertaken initiatives or considered legislation in several areas that may affect the insurance industry, including tort reform, corporate governance and the taxation of reinsurance companies.
Additionally, we currently derive revenues from customers in the cannabis industry. As such, any risks related to the cannabis industry, including but not limited to cannabis being deemed a controlled substance under federal laws, may adversely impact our clients, and potential clients, which may in turn, impact our services. The legality of cannabis could be reversed in one or more states, which might force businesses, including our customers, to cease operations in one or more states entirely. A change in the legal status of, or the enforcement of federal laws related to, the cannabis industry could negatively impact us and lead to a decrease in our revenue through the loss of current and potential customers.
Our ability to utilize our net operating loss carryforwards and certain other tax attributes may be limited.
As of December 31, 2023, we had gross federal income tax net operating losses, or NOLs, of approximately $49.4 million available to offset our future taxable income, if any, prior to consideration of annual limitations that may be imposed under Section 382 of the Internal Revenue Code of 1986, as amended, or the Code, or otherwise. These NOLs are set to expire beginning in 2030.
Under Section 382 of the Code, if a corporation undergoes an “ownership change” (very generally defined as a greater than 50% change, by value, in the corporation’s equity ownership by certain stockholders or groups of stockholders over a rolling three-year period), the corporation’s ability to use its pre-ownership change NOLs to offset its post-ownership change income may be limited. We may experience ownership changes in the future as a result of subsequent shifts in our stock ownership, some of which may be outside of our control. Future regulatory changes could also limit our ability to utilize our NOLs. To the extent we are not able to offset future taxable income with our NOLs, our net income and cash flows may be adversely affected.
Because we are a holding company and substantially all of our operations are conducted by our insurance subsidiaries, our ability to achieve liquidity at the holding company, including the ability to pay dividends and service our debt obligations, depends on our ability to obtain cash dividends or other permitted payments from our insurance subsidiaries.
The continued operation and growth of our business will require substantial capital. Accordingly, we do not intend to declare and pay cash dividends on shares of our common stock in the foreseeable future. Because we are a holding company with no business operations of our own, our ability to pay dividends to stockholders and meet our debt payment obligations largely depends on dividends and other distributions from our primary insurance subsidiaries, HSIC, IIC and GMIC. State insurance laws, including the laws of Texas restrict the ability of HSIC, IIC and GMIC to determine how we declare stockholder dividends. State insurance regulators require insurance companies to maintain specified levels of statutory capital and surplus. Dividend payments are further limited to that part of available policyholder surplus that is
22
derived from net profits on our business. State insurance regulators have broad powers to prevent the reduction of statutory surplus to inadequate levels, and there is no assurance that dividends up to the maximum amounts calculated under any applicable formula would be permitted. Moreover, state insurance regulators that have jurisdiction over the payment of dividends by our insurance subsidiaries may in the future adopt statutory provisions more restrictive than those currently in effect.
Any determination to pay dividends in the future will be at the discretion of our Board of Directors and will depend upon results of operations, financial condition, contractual restrictions pursuant to our debt agreements, our indebtedness, restrictions imposed by applicable law and other factors our Board of Directors deems relevant. Consequently, investors may need to sell all or part of their holdings of our common stock after price appreciation, which may never occur, as the only way to realize any future gains on their investment. Investors seeking immediate cash dividends should not purchase our common stock.
Applicable insurance laws may make it difficult to effect a change of control.
Under applicable Texas insurance laws and regulations, no person may acquire control of a domestic insurer until written approval is obtained from the state insurance commissioner on the proposed acquisition. Such approval would be contingent upon the state insurance commissioner’s consideration of a number of factors including, among others, the financial strength of the proposed acquiror, the acquiror’s plans for the future operations of the domestic insurer and any anti-competitive results that may arise from the consummation of the acquisition of control. Texas insurance laws and regulations pertaining to changes of control apply to both the direct and indirect acquisition of ten percent or more of the voting stock of a Texas-domiciled insurer. Accordingly, the acquisition of ten percent or more of our common stock would be considered an indirect change of control of Skyward Specialty and would trigger the applicable change of control filing requirements under Texas insurance laws and regulations, absent a disclaimer of control filing and its acceptance by the Texas Insurance Department. These requirements may discourage potential acquisition proposals and may delay, deter or prevent a change of control of Skyward Specialty, including through transactions that some or all of the stockholders of Skyward Specialty might consider to be desirable.
Risks Related to Our Liquidity and Access to Capital
We may require additional capital in the future, which may not be available or may only be available on unfavorable terms.
Our future capital requirements depend on many factors, including our ability to write new business successfully and to establish premium rates and reserves at levels sufficient to cover losses. To the extent that cash flows generated by our operations are insufficient to fund future operating requirements and cover claim losses, or that our capital position is adversely impacted by a decline in the fair value of our investment portfolio, losses from catastrophe events or otherwise, we may need to raise additional funds through financings or curtail our growth. Many factors will affect the amount and timing of our capital needs, including our growth rate and profitability, our claims experience, and the availability of reinsurance, market disruptions, and other unforeseeable developments. If we need to raise additional capital, equity or debt financing may not be available at all or may be available only on terms that are not favorable to us. In the case of equity financings, dilution to our stockholders could result. In the case of debt financings, we may be subject to covenants that restrict our ability to freely operate our business. In any case, such securities may have rights, preferences and privileges that are senior to those of the shares of common stock offered hereby. If we cannot obtain adequate capital on favorable terms or at all, we may not have sufficient funds to implement our operating plans and our business, financial condition or results of operations could be materially adversely affected.
Risks Related to Our Operations
We could be adversely affected by the loss of one or more key personnel or by an inability to attract and retain qualified personnel.
We depend on our ability to attract and retain experienced and seasoned personnel who are knowledgeable about our business. The pool of talent from which we actively recruit is limited and may fluctuate based on market dynamics specific to our industry and independent of overall economic conditions. As such, higher demand for employees having the desired skills and expertise could lead to increased compensation expectations for existing and prospective personnel, making it difficult for us to retain and recruit key personnel and maintain labor costs at desired levels. Should any of our key personnel terminate their employment with us, or if we are unable to retain and attract talented personnel, we may be unable to maintain our current competitive position in the specialized markets in which we operate, which could adversely affect our results of operations.
23
Security breaches, loss of data, cyberattacks, and other information technology failures could disrupt our operations, damage our reputation, and adversely affect our business, operations, and financial results.
Our business is highly dependent upon our information technology and telecommunications systems, including our underwriting systems. We rely on these systems to interact with brokers and insureds, to underwrite business, to prepare policies and process premiums, to perform actuarial and other modeling functions, to process claims and make claims payments, and to prepare internal and external financial statements. Some of these systems may include or rely on third-party systems not located on our premises or under our control. Events such as natural catastrophes, terrorist attacks, industrial accidents, computer viruses and other cyber-attacks may cause our systems to fail or be inaccessible for extended periods of time. While we have implemented business contingency plans and other reasonable plans to protect our systems, whether housed internally or through third-party cloud services, sustained or repeated system failures or service denials could severely limit our ability to write and process new and renewal business, provide customer service, pay claims in a timely manner or otherwise operate in the ordinary course of business.
Computer viruses, hackers, employee misconduct, and other external hazards could expose our systems to security breaches, cyber-attacks or other disruptions. While we have implemented security measures designed to protect against breaches of security and other interference with our systems and networks, our systems and networks may be subject to breaches or interference and we, and our third-party service providers, will likely continue to experience cybersecurity incidents of varying degrees. Any such event may result in operational disruptions as well as unauthorized access to, the disclosure of, or loss of our proprietary information or our customers’ data and information, which in turn may result in legal claims, regulatory scrutiny and liability, reputational damage, the incurrence of costs to eliminate or mitigate further exposure, the loss of customers or affiliated advisors, or other damage to our business. In addition, the trend toward general public notification of such incidents could exacerbate the harm to our business, financial condition and results of operations. Even if we successfully protect our technology infrastructure and the confidentiality of sensitive data, we could suffer harm to our business and reputation if attempted security breaches are publicized. We cannot be certain that advances in criminal capabilities, discovery of new vulnerabilities, attempts to exploit vulnerabilities in our systems, data thefts, physical system or network break-ins or inappropriate access, or other developments will not compromise or breach the technology or other security measures protecting the networks and systems used in connection with our business.
Third parties to whom we outsource certain of our functions are also subject to these risks. While we review and assess our third-party providers’ cybersecurity controls, as appropriate, and make changes to our business processes to manage these risks, we cannot ensure that our attempts to keep such information confidential will always be successful. Moreover, our increased use of third-party services (e.g. cloud technology and software as a service) can make it more difficult to identify and respond to cyberattacks in any of the above situations due to the dynamic nature of these technologies. These risks could increase as vendors adopt and use more cloud-based software services rather than software services which can be run within our data centers.
We may not be able to manage our growth effectively.
We intend to grow our business in the future, which could require additional capital, systems development and skilled personnel. However, we must be able to meet our capital needs, expand our systems and our internal controls effectively, allocate our human resources optimally, identify, hire, train and develop qualified employees and effectively incorporate the components of any business we may acquire in our effort to achieve growth. The failure to manage our growth effectively could have a material adverse effect on our business, financial condition and results of operations.
The effects of litigation on our business are uncertain and could have an adverse effect on our business.
As is typical in our industry, we continually face risks associated with litigation of various types, including disputes relating to insurance claims under our policies as well as other general commercial and corporate litigation. Although we are not currently involved in any out-of-the-ordinary litigation with our customers, other members of the insurance industry are the target of class action lawsuits and other types of litigation, some of which involve claims for substantial or indeterminate amounts, and the outcomes of which are unpredictable. This litigation is based on a variety of issues, including insurance and claim settlement practices. We cannot predict with any certainty whether we will be involved in such litigation in the future or what impact such litigation would have on our business.
Loss of key vendor relationships or failure of a vendor to protect our data, confidential and proprietary information could affect our operations.
We rely on services and products provided by many vendors in the United States and abroad. These include, for example, vendors of computer hardware and software, and vendors and/or outsourcing of services such as claim adjustment services, human resource benefits management services and investment management services. In the event that any vendor suffers a bankruptcy or otherwise becomes unable to continue to provide products or services, or fails to protect our confidential, proprietary, and other information, we may suffer operational impairments and financial losses. In addition,
24
while we generally monitor vendor risk, including the security and stability of our critical vendors, we may fail to properly assess and understand the risks and costs involved in the third-party relationships, and our financial condition and results of operations could be materially and adversely affected.
We anticipate that we will continue to rely on third-party software in the future. Although we believe that there are commercially reasonable alternatives to the third-party software we currently license, this may not always be the case, or it may be difficult or costly to replace. In addition, integration of new third-party software may require significant work and require substantial investment of our time and resources. Our use of additional or alternative third-party software would require us to enter into license agreements with third parties, which may not be available on commercially reasonable terms or at all. Many of the risks associated with the use of third-party software cannot be eliminated, and these risks could negatively affect our business.
We may fail or be unable to protect our intellectual property rights for our proprietary technology platform and brand, or we may be sued by third parties for alleged infringement of their proprietary rights.
Our success and ability to compete depend in part on our intellectual property, which includes our rights in our brand and our proprietary technology used in certain of our product lines. We primarily rely on copyright and trade secret laws, and confidentiality agreements with our employees, customers, service providers, partners and others to protect our intellectual property rights. However, the steps we take to protect our intellectual property may be inadequate. Our efforts to enforce our intellectual property rights may be met with defenses, counterclaims and countersuits attacking the validity and enforceability and scope of our intellectual property rights. Our failure to secure, protect and enforce our intellectual property rights could adversely affect our brand and adversely impact our business.
Our success depends also in part on our not infringing on the intellectual property rights of others. Our competitors, as well as a number of other entities and individuals, may own or claim to own intellectual property relating to our industry or the Company. In the future, third parties may claim that we are infringing on their intellectual property rights, and we may be found to be infringing on such rights. Any claims or litigation could cause us to incur significant expenses and, if successfully asserted against us, could require that we pay substantial damages or ongoing royalty payments, prevent us from offering our services, or require that we comply with other unfavorable terms. Even if we were to prevail in such a dispute, any litigation could be costly and time-consuming and divert the attention of our management and key personnel from our business operations.
Risks Related to Ownership of Our Common Stock
We have and expect to continue to incur increased costs as a result of operating as a public company, and our management devotes substantial time to compliance initiatives. We are subject to financial reporting and other requirements for which our accounting and other management systems and resources may not be adequately prepared.
As a public company, and particularly after we are no longer an emerging growth company, we have incurred and will continue to incur significant legal, accounting and other expenses. In addition, the federal securities laws, including the Sarbanes-Oxley Act, the Dodd-Frank Act, and rules and regulations subsequently implemented by the SEC and Nasdaq have imposed various requirements on public companies, including requirements to file annual, quarterly and event-driven reports with respect to our business and financial condition, and to establish and maintain effective disclosure and financial controls and corporate governance practices. These rules and regulations will increase our legal and financial compliance costs, make certain activities more time-consuming and costly, and require our management and other personnel to devote a substantial amount of time to compliance initiatives. Despite our best efforts, we may not be able to produce reliable financial statements or file such financial statements as part of a periodic report in a timely manner with the SEC or comply with Nasdaq listing requirements. We also expect that these rules and regulations may make it more difficult and more expensive for us to obtain director and officer liability insurance.
Pursuant to Section 404 of the Sarbanes-Oxley Act, we will be required to furnish a report by our management on our internal control over financial reporting, including an attestation report on internal control over financial reporting issued by our independent registered public accounting firm, beginning January 18, 2024. However, while we remain an emerging growth company, we will not be required to include an attestation report on internal control over financial reporting issued by our independent registered public accounting firm. To achieve compliance with Section 404 of the Sarbanes-Oxley Act, we will be engaged in a process to document and evaluate our internal control over financial reporting, which is both costly and challenging. We will need to continue to dedicate internal resources, engage outside consultants, adopt a detailed work plan to assess and document the adequacy of internal control over financial reporting, continue steps to improve control processes as appropriate, validate through testing that controls are functioning as documented and implement a continuous reporting and improvement process for internal control over financial reporting. Despite our efforts, there is a risk that neither we nor our independent registered public accounting firm will be able to conclude within the prescribed timeframe that our internal control over financial reporting is effective as required by
25
Section 404 of the Sarbanes-Oxley Act. This could result in an adverse reaction in the financial markets due to a loss of confidence in the reliability of our financial statements. We could also become subject to investigations by the SEC or other regulatory authorities, which could require additional financial and management resources.
As a public company, we are also required to maintain disclosure controls and procedures. Disclosure controls and procedures means our controls and other procedures that are designed to ensure that information required to be disclosed by us in the reports that we file or submit under the Exchange Act is recorded, processed, summarized and reported, within the time periods specified in the rules and forms of the SEC. We do not expect that our disclosure controls and procedures or our internal control over financial reporting will prevent or detect all errors and all fraud. We believe a control system, no matter how well-designed and operated, can provide only reasonable, not absolute, assurance that the control system’s objectives will be met. Due to the inherent limitations in all control systems, no evaluation of controls can provide absolute assurance that misstatements due to error or fraud will not occur or that all control issues and instances of fraud, if any, have been detected. The design of any system of controls is based in part on certain assumptions about the likelihood of future events, and any design may not succeed in achieving its stated goals under all potential future conditions. Over time, controls may become inadequate because of changes in conditions or deterioration in the degree of compliance with policies or procedures. Accordingly, because of the inherent limitations in our control system, misstatements due to error or fraud may occur and not be detected.
We are required by Section 404 of the Sarbanes‑Oxley Act to evaluate the effectiveness of our internal control over financial reporting. If we are unable to achieve and maintain effective internal controls, our operating results and financial condition could be harmed and the market price of our common stock may be negatively affected.
As a public company with SEC reporting obligations, we are required to document and test our internal control procedures to satisfy the requirements of Section 404(a) of the Sarbanes-Oxley Act, which requires annual assessments by management of the effectiveness of our internal control over financial reporting. We are an emerging growth company, and thus we are exempt from the auditor attestation requirement of Section 404(b) of Sarbanes-Oxley until such time as we no longer qualify as an emerging growth company.
We qualify as an emerging growth company, and any decision on our part to comply with reduced reporting and disclosure requirements applicable to emerging growth companies could make our common stock less attractive to investors.
We are an “emerging growth company,” and, for as long as we continue to be an emerging growth company, we currently intend to take advantage of exemptions from various reporting requirements applicable to other public companies but not to “emerging growth companies,” including, but not limited to, not being required to have our independent registered public accounting firm audit our internal control over financial reporting under Section 404 of the Sarbanes-Oxley Act, reduced disclosure obligations regarding executive compensation in our registration statements, periodic reports and proxy statements and exemptions from the requirements of holding a nonbinding advisory vote on executive compensation and stockholder approval of any golden parachute payments not previously approved. We will cease to be an emerging growth company upon the earliest of: (i) the last day of the fiscal year in which we have total annual gross revenues of $1.235 billion or more; (ii) the last day of our fiscal year following the fifth anniversary of the date of the IPO; (iii) the date on which we have issued more than $1 billion in nonconvertible debt during the previous three years; and (iv) the date on which we are deemed to be a large accelerated filer under the rules of the SEC.
We cannot predict whether investors will find our common stock less attractive if we choose to rely on these exemptions while we are an emerging growth company. If some investors find our common stock less attractive as a result of any choices to reduce future disclosure, there may be a less active trading market for our common stock and the price of our common stock may be more volatile.
Under the JOBS Act, emerging growth companies can also delay adopting new or revised accounting standards until such time as those standards apply to private companies. We have elected to avail ourselves of this extended transition period and, as a result, we will not be required to adopt new or revised accounting standards on the relevant dates on which adoption of such standards is required for other public companies.
Our operating results and stock price may be volatile, or may decline regardless of our operating performance, and you could lose all or part of your investment.
As a public company the market price of our common stock has been and is likely to continue to be highly volatile and may fluctuate substantially due to many factors, many of which are beyond our control. In addition, securities markets worldwide have experienced, and are likely to continue to experience, significant price and volume fluctuations. This market volatility, as well as general economic, market or political conditions, could subject the market price of our shares to wide price fluctuations regardless of our operating performance. You should consider an investment in our common stock to be risky, and you should invest in our common stock only if you can withstand a significant loss and wide
26
fluctuation in the market value of your investment. The market price of our common stock could be subject to significant fluctuations in response to the factors described in this “Risk Factors” section and other factors, many of which are beyond our control. Among the factors that could affect our stock price are:
•market conditions in the broader stock market;
•actual or anticipated fluctuations in our quarterly financial and operating results;
•introduction of new products or services by us or our competitors;
•issuance of new or changed securities analysts’ reports or recommendations;
•results of operations that vary from expectations of securities analysts and investors;
•short sales, hedging and other derivative transactions in our common stock;
•guidance, if any, that we provide to the public, any changes in this guidance or our failure to meet this guidance;
•strategic actions by us or our competitors;
•announcement by us, our competitors or our acquisition targets;
•sales, or anticipated sales, of large blocks of our stock, including by our directors, executive officers and principal stockholders;
•additions or departures in our Board or Directors, senior management or other key personnel;
•regulatory, legal or political developments;
•public response to press releases or other public announcements by us or third parties, including our filings with the SEC;
•litigation and governmental investigations;
•changing economic conditions, including social inflation;
•changes in accounting principles;
•any indebtedness we may incur or securities we may issue in the future;
•default under agreements governing our indebtedness;
•exposure to capital and credit market risks that adversely affect our investment portfolio or our capital resources;
•changes in our credit ratings; and
•other events or factors, including those from natural disasters, war, actors of terrorism or responses to these events.
The securities markets have from time to time experienced extreme price and volume fluctuations that often have been unrelated or disproportionate to the operating performance of particular companies. As a result of these factors, investors in our common stock may not be able to resell their shares at or above the their purchase price. These broad market fluctuations, as well as general market, economic and political conditions, such as recessions, loss of investor confidence or interest rate changes, may negatively affect the market price of our common stock.
In addition, the stock markets, including Nasdaq, have experienced extreme price and volume fluctuations that have affected and continue to affect the market prices of equity securities of many companies. If any of the foregoing occurs, it could cause our stock price to fall and may expose us to securities class action litigation that, even if unsuccessful, could be costly to defend, divert management’s attention and resources or harm our business.
Substantial future sales of shares of our common stock by existing stockholders, or the perception that those sales may occur, could cause the market price of our common stock to decline.
Sales of a substantial number of shares of our common stock in the public market, or the perception that these sales might occur, could depress the market price of our common stock and could impair our ability to raise capital through the sale of additional equity securities. We are unable to predict the effect that such sales may have on the prevailing market price of our common stock.
We may change our underwriting guidelines or our strategy without stockholder approval.
Our management has the authority to change our underwriting guidelines or our strategy without notice to our stockholders and without stockholder approval. As a result, we may make fundamental changes to our operations without
27
stockholder approval, which could result in our pursuing a strategy or implementing underwriting guidelines that may be materially different from the strategy or underwriting guidelines described in the section entitled “Business” or elsewhere in this filing.
Anti-takeover provisions in our organizational documents could delay a change in management and limit our share price.
Provisions of our certificate of incorporation and bylaws could make it more difficult for a third party to acquire control of us even if such a change in control would increase the value of our common stock and prevent attempts by our stockholders to replace or remove our current Board of Directors or management. Therefore, these provisions could adversely affect the price of our common stock. Among other things, our charter documents:
•permit the Board of Directors to establish the number of directors and fill any vacancies and newly created directorships;
•provide that our Board of Directors will be classified into three classes with staggered, three-year terms and that directors may only be removed for cause;
•require super-majority voting to amend provisions in our certificate of incorporation and bylaws;
•include blank-check preferred stock, the preference rights and other terms of which may be set by the Board of Directors and could delay or prevent a transaction or a change in control that might involve a premium price for our common stock or otherwise benefit our stockholders;
•eliminate the ability of our stockholders to call special meetings of stockholders;
•specify that special meetings of our stockholders can be called only by our Board of Directors, the chairman of our Board of Directors, or our chief executive officer;
•prohibit stockholder consent action by other than unanimous written consent;
•provide that vacancies on our Board of Directors may be filled only by a majority of directors then in office, even though less than a quorum;
•prohibit cumulative voting in the election of directors; and
•establish advance notice requirements for nominations for election to our Board of Directors or for proposing matters that can be acted upon by stockholders at annual stockholder meetings.
In addition, as a Delaware corporation, we are subject to Section 203 of the Delaware General Corporation Law. These provisions may prohibit large stockholders, in particular those owning 15% or more of our outstanding voting stock, from merging or combining with us for a period of time.
Our certificate of incorporation and bylaws provide that the Court of Chancery of the State of Delaware will be the exclusive forum for substantially all disputes between us and our stockholders, which could limit our stockholders’ ability to obtain a favorable judicial forum for disputes with us or our directors, officers or employees.
Our certificate of incorporation and bylaws provide that the Court of Chancery of the State of Delaware is the exclusive forum for the following civil actions:
•any derivative action or proceeding brought on our behalf;
•any action asserting a claim of breach of a fiduciary duty by any of our directors, officers, employees or agents or our stockholders;
•any action asserting a claim arising pursuant to any provision of the DGCL or our certificate of incorporation or bylaws or as to which the DGCL confers jurisdiction on the Court of Chancery of the State of Delaware;
•any action to interpret, apply, enforce or determine the validity of our certificate of incorporation or our bylaws; or
•any action asserting a claim governed by the internal affairs doctrine.
Our certificate of incorporation and bylaws further provide that, unless we consent in writing to the selection of an alternative forum, the federal district courts of the United States of America shall, to the fullest extent permitted by law, be the sole and exclusive forum for the resolutions of any complaint asserting a cause of action arising under the Securities Act. Furthermore, this application to Securities Act claims and Section 22 of the Securities Act create concurrent jurisdiction for federal and state courts over all suits brought to enforce any duty or liability created by the Securities Act or the rules and regulations thereunder. Accordingly, there is uncertainty as to whether a court would enforce such provision, and our stockholders will not be deemed to have waived our compliance with the federal securities laws and the rules and
28
regulations thereunder. However, this exclusive forum provision would not apply to suits brought to enforce a duty or liability created by the Exchange Act or any other claim for which the federal courts have exclusive jurisdiction. This choice of forum provision, if enforced, may limit a stockholder’s ability to bring a claim in a judicial forum that it finds favorable for disputes with us or our directors, officers or other employees, which may discourage such lawsuits against us and our directors, officers and other employees, although our stockholders will not be deemed to have waived our compliance with federal securities laws and the rules and regulations thereunder. Alternatively, if a court were to find the choice of forum provision contained in our certificate of incorporation and bylaws to be inapplicable or unenforceable in an action, we may incur additional costs associated with resolving such action in other jurisdictions, which could have a material adverse effect on our business, financial condition or results of operations.
Item 1B. Unresolved Staff Comments - None.
Item 1C. Cybersecurity
Our information technology systems (“IT Systems”) play a central role in running nearly all aspects of our business operations. Our IT Systems are used for a variety of critical business functions including, but not limited to, internal and external communications, managing our documents and records, and providing shared work environments across various business functions. Therefore, responding efficiently and effectively to cybersecurity incidents and threats is an important component of our overall ERM strategy. In order to respond to such incidents and threats, we have implemented a carefully designed Crisis Response Plan (“CRP”).
Cybersecurity Risk Management and Strategy
Our management and information technology personnel have implemented processes and procedures for assessing, identifying, managing and escalating material risks from cybersecurity threats. These processes and procedures have been integrated into our overall risk management processes. For example, cybersecurity related risks are included in the risk universe that our enterprise risk management committee evaluates on an annual basis. To the extent the ERM process identifies a heightened cybersecurity related risk, risk owners are assigned to develop risk mitigation plans, which are then tracked to completion. Further, security events and data incidents are evaluated, ranked by severity and prioritized for response and remediation. Incidents are evaluated to determine materiality as well as operational and business impact and reviewed for privacy impact.
Our cybersecurity risk management program leverages the National Institute of Standards and Technology framework, which organizes cybersecurity risks into five categories: identify, protect, detect, respond and recover. In addition, we have a set of Company-wide policies and procedures concerning cybersecurity matters, such as policies related to encryption standards, antivirus protection, remote access, multifactor authentication, confidential information and the use of the internet, social media and email. In the event of an incident, we intend to follow our detailed crisis response playbook.
Further, we have continued to expand investments in IT security, including additional end-user training, using layered defenses, identifying and protecting critical assets, strengthening monitoring and alerting, and engaging experts. We regularly test defenses by performing simulations and drills at both a technical level (including through penetration tests) and by reviewing our operational policies and procedures with third-party experts. At the management level, our IT security team regularly monitors alerts and meets to discuss threat levels, trends and remediation. The team also prepares a monthly cyber scorecard, regularly collects data on cybersecurity threats and risk areas and conducts an annual risk assessment. Further, we conduct periodic external penetration tests, red team testing and maturity testing to assess our processes and procedures and the threat landscape. These tests and assessments are useful tools for maintaining a robust cybersecurity program to protect our investors, customers, employees, vendors, and intellectual property. In the event of an incident, we have outside cybersecurity legal counsel who would consult and coordinate with other third parties in the, including communication and notification to third-parties as required; cybersecurity vendors that would perform various investigation services as well as assisting with the recovery and restoration of any impacted IT System services; cybersecurity experts who would assist with validation of the incident and assist with ransomware demands; and cybersecurity insurance providers.
In addition, we have also implemented processes to oversee and identify risks from cybersecurity threats associated with our use of key third-party service providers, including requiring third-party service providers to provide provisions of their SOC-1 or SOC-2 report and their cybersecurity/disaster recovery plans.
Cybersecurity Governance
Our cybersecurity risk management and strategy processes are overseen by leaders from our Information Security Team with assistance from our Compliance and Legal teams. Such individuals have decades of experience in various roles involving information technology, including security, auditing, compliance, systems and programming. These individuals are informed about, and monitor the prevention, mitigation, detection and remediation of cybersecurity incidents through
29
their management of, and participation in, the cybersecurity risk management and strategy processes described above, including the operation of our crisis response plan, and report to the Risk Committee on any appropriate items.
Under its committee charter, the Risk Committee of our Board of Directors oversees our cybersecurity strategy, reviews our cybersecurity and other information technology risks, controls and procedures, and receives periodic updates from management regarding the adequacy and effectiveness of our cybersecurity measures. Included in this review is a thorough discussion of the risks from cybersecurity threats including the potential impact to our operations of such threats.
We have also instituted a separate process for communicating with the Risk Committee in the event we are the target of a specific cybersecurity incident. As part of our response to such an incident, members of the Crisis Management Team would provide an initial awareness communication of the incident to our Chief Executive Officer/Chair of the Board who would in turn inform the Chair of the Risk Committee. Following an initial assessment of the incident by senior management and IT Systems personnel, we would provide a follow-up communication to the CEO and Risk Committee Chair and determine whether further escalation to the full Board is warranted.
Although the risks from cybersecurity threats have not materially affected our business strategy, results of operations or financial condition, it is possible that a cybersecurity incident resulting in a serious compromise of our IT Systems or a demand for payment to restore our IT Systems, could have a material adverse effect on us by negatively impacting our ability to operate our business effectively and by diverting the attention of our management and other resources, including financial resources, to address the cybersecurity incident.
Item 2. Properties
We lease our primary executive offices and insurance operations in Houston, Texas, and occupy approximately 20,000 square feet of office space. The lease for this space expires in 2029. We lease additional office space where appropriate. Management considers our office facilities suitable and adequate for our current levels of operations.
Item 3. Legal Proceedings
We are periodically party to legal proceedings which arise in the ordinary course of business. Currently, we are not involved in any legal proceedings which we believe could have a material adverse effect on our business or results of operation.
Item 4. Mine Safety Disclosures - Not applicable.
30
Part II
Item 5. Market for Registrant's Common Equity, Related Stockholder Matters and Issuer Purchases of Equity Securities
Our common shares began trading on the NASDAQ Global Select Market under the symbol “SKWD” on January 13, 2023. Prior to that time, there was no public market for our common shares. As of March 27, 2024, there were approximately 15 holders of record of our common stock. Because many of our shares of common stock are held by brokers and other institutions on behalf of our stockholders, this number is not representative of the total number of stockholders represented by these stockholders of record.
Securities Authorized for Issuance Under Equity Compensation Plans
Information about our equity compensation plans will be included in our definitive proxy statement to be filed with the SEC with respect to our 2024 Annual Meeting of Stockholders (“2024 Proxy Statement”) and is incorporated herein by reference.
Recent Sales of Unregistered Equity Securities
Set forth below is information regarding securities issued or granted by us during the period covered by this Annual Report on Form 10-K that were not registered under the Securities Act. The information presented in this Item 5 gives effect to a 4-for-1 reverse stock split, which became effective on January 3, 2023.
Issuance of Class A Common Stock upon Conversion of Preferred Stock and Class B Common Stock
Immediately prior to completing the IPO, all preferred stock converted into 16,305,113 shares of common stock. The issuance of such common shares was exempt from the registration requirements of the Securities Act, pursuant to Section 3(a)(9) of the Securities Act, involving an exchange of securities exchanged by the issuer with its existing security holders exclusively where no commission or other remuneration was paid or given directly or indirectly for soliciting such exchange. No underwriters were involved in this issuance of shares.
Grants of Stock Awards and Issuance of Shares
During the period covered by this Annual Report on Form 10-K, pursuant to the Company’s 2020 Long-Term Incentive Plan, we granted 1,101,856 shares of restricted stock restricted stock units at a weighted average price of $16.07 per share and 759,990 stock options with a strike price of $15.00 to certain employees and directors. During the period covered by this Annual Report on Form 10-K, no shares of common stock were issued upon the exercise of stock options.
No underwriters were involved in the foregoing issuance of securities. The issuances of the securities described above were deemed to be exempt from registration pursuant to Section 4(a)(2) of the Securities Act or Rule 701 promulgated under the Securities Act as transactions pursuant to compensatory benefit plans. The shares of common stock issued upon the exercise of stock options or warrants are deemed to be restricted securities. All recipients either received adequate information about us or had access, through employment or other relationships, to such information.
Use of Proceeds from Initial Public Offering
On January 18, 2023, we closed our IPO, in which we issued and sold 4,750,000 shares of common stock and the selling stockholders sold 4,202,383 shares. The underwriters also exercised in full their option to purchase 1,342,857 additional shares of common stock from the selling stockholders. The offer and sale of all of the shares in the IPO were registered under the Securities Act pursuant to a registration statement on Form S-1 (File No. 333-265326), which was declared effective by the SEC on January 12, 2023. Barclays Capital Inc. and Keefe, Bruyette & Woods, Inc. acted as the representatives of the underwriters. The public offering price of the shares sold in the offering was $15.00 per share. The net proceeds to the Company were approximately $62.3 million, after deducting underwriting discounts and specific incremental expenses directly attributable to the IPO. All the proceeds from the IPO have been distributed to the Company’s insurance company subsidiaries.
Issuer Purchases of Equity Securities
We did not purchase any of our equity securities during the period covered by this Annual Report on Form 10-K.
31
Dividends
We do not currently intend to pay any cash dividends on our common stock in the foreseeable future. Any determination to pay dividends in the future will be at the discretion of our Board of Directors and will depend upon results of operations, financial condition, restrictions imposed by applicable law and other factors our Board of Directors deems relevant. Consequently, investors may need to sell all or part of their holdings of our common stock after price appreciation, which may never occur, as the only way to realize any future gains on their investment. Investors seeking immediate cash dividends should not purchase our common stock.
Performance Graph
The following performance graph compares the cumulative total shareholder return of an investment in (1) our common stock, (2) the cumulative total returns to the Nasdaq Composite Index and (3) the cumulative total returns to the Nasdaq Insurance Index, for the period beginning January 13, 2023 (the date our common stock began trading on Nasdaq) through December 31, 2023.
The graph assumes an initial investment of $100. Such returns are based on historical results and are not indicative of future performance.
This graph shall not be deemed “soliciting material” or be deemed “filed” for purposes of Section 18 of the Exchange Act, or otherwise subject to the liabilities under that Section, and shall not be deemed to be incorporated by reference into any of our filings under the Securities Act.
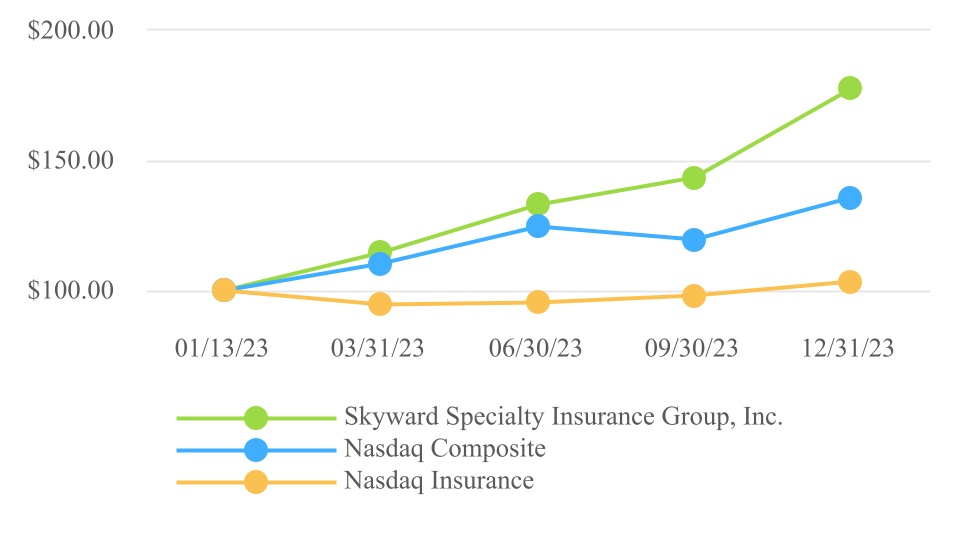
| January 13, 2023 | December 31, 2023 | ||||||||||
| Skyward Specialty Insurance Group, Inc. | $ | 100.00 | $ | 177.38 | |||||||
| Nasdaq Composite Index | $ | 100.00 | $ | 135.49 | |||||||
| Nasdaq Insurance Index | $ | 100.00 | $ | 103.37 | |||||||
Item 6. [Reserved] - Not applicable.
Item 7. Management's Discussion and Analysis of Financial Condition and Results of Operations
Overview
We are a growing specialty insurance company delivering commercial P&C products and solutions on a non-admitted (or E&S) and admitted basis, predominantly in the United States. We focus our business on markets that are underserved, dislocated and/or for which standard insurance coverages are insufficient or inadequate to meet the needs of businesses, including our customers and prospective customers operating in these markets. Our customers typically require highly specialized, customized underwriting solutions and claims capabilities. As such, we develop and deliver tailored insurance products and services to address each of the niche markets we serve.
Our portfolio of insured risks is highly diversified — we insure customers operating in a wide variety of industries; we distribute through multiple channels; we write multiple lines of business, including general liability, excess liability, professional liability (which includes cyber insurance), commercial auto, group accident and health, property, agriculture, surety and workers’ compensation; we insure both short and medium duration liabilities; and our business mix is balanced between E&S and admitted markets. All of these factors enable us to respond to market opportunities and
32
dislocations by deploying capital with attractive risk-adjusted returns. We believe this diversification, combined with our underwriting and claims expertise, will produce strong growth and consistent profitability across P&C insurance pricing cycles.
We seek to lead in our chosen market niches and establish sustainable competitive positions in these markets. We refer to this strategy as “Rule Our Niche” and it forms the basis of our approach to building a strong defensible market position, creating a competitive moat, and winning our chosen markets. We believe that the principles underlying our strategy are key to achieving and sustaining best-in-class underwriting results through P&C insurance pricing cycles. We consistently strive for excellence in risk selection, pricing, and claims outcomes, and to amplify these critical functions with the use of advanced technology and analytics.
Results of Operations
The following table summarizes our results for the years ended December 31, 2023 and 2022:
| ($ in thousands) | 2023 | 2022 | ||||||||||||
| Gross written premiums | $ | 1,459,829 | $ | 1,143,952 | ||||||||||
| Ceded written premiums | (549,138) | (468,409) | ||||||||||||
| Net written premiums | $ | 910,691 | $ | 675,543 | ||||||||||
| Net earned premiums | $ | 829,143 | $ | 615,994 | ||||||||||
| Commission and fee income | 6,064 | 5,199 | ||||||||||||
| Losses and LAE | 515,237 | 402,512 | ||||||||||||
| Underwriting, acquisition and insurance expenses | 243,444 | 182,171 | ||||||||||||
Underwriting income(1) | $ | 76,526 | $ | 36,510 | ||||||||||
| Net investment income | $ | 40,322 | $ | 36,931 | ||||||||||
| Net investment gains (losses) | $ | 11,072 | $ | (15,705) | ||||||||||
| Income before income taxes | $ | 110,102 | $ | 49,783 | ||||||||||
| Net income | $ | 85,984 | $ | 39,396 | ||||||||||
Adjusted operating income(1) | $ | 80,847 | $ | 58,574 | ||||||||||
| Loss and LAE ratio | 62.1 | % | 65.3 | % | ||||||||||
| Expense ratio | 28.6 | % | 28.7 | % | ||||||||||
| Combined ratio | 90.7 | % | 94.0 | % | ||||||||||
Adjusted loss and LAE ratio(1) | 62.3 | % | 63.9 | % | ||||||||||
| Expense ratio | 28.6 | % | 28.7 | % | ||||||||||
Adjusted combined ratio(1) | 90.9 | % | 92.6 | % | ||||||||||
| Return on equity | 15.9 | % | 9.3 | % | ||||||||||
Return on tangible equity(1) | 19.0 | % | 11.8 | % | ||||||||||
Adjusted return on equity(1) | 14.9 | % | 13.8 | % | ||||||||||
Adjusted return on tangible equity(1) | 17.9 | % | 17.6 | % | ||||||||||
(1) See “Reconciliation of Non-GAAP Financial Measures” in this Item 7 | ||||||||||||||
33
Reconciliation of Non-GAAP Financial Measures
Adjusted Operating Income
The following table provides a reconciliation of adjusted operating income to net income for the years ended December 31, 2023 and 2022:
| 2023 | 2022 | |||||||||||||||||||||||||
| ($ in thousands) | Before Income Taxes | After Income Taxes | Before Income Taxes | After Income Taxes | ||||||||||||||||||||||
| Income as reported | $ | 110,102 | $ | 85,984 | $ | 49,783 | $ | 39,396 | ||||||||||||||||||
| Less (Add): | ||||||||||||||||||||||||||
| Net impact of LPT | 1,427 | 1,127 | (8,572) | (6,772) | ||||||||||||||||||||||
| Net investment gains (losses) | 11,072 | 8,747 | (15,705) | (12,407) | ||||||||||||||||||||||
| Other (loss) income | (632) | (499) | 1 | 1 | ||||||||||||||||||||||
| Other expenses | (5,364) | (4,238) | — | — | ||||||||||||||||||||||
| Adjusted operating income | $ | 103,599 | $ | 80,847 | $ | 74,059 | $ | 58,574 | ||||||||||||||||||
Underwriting income (loss)
The following table provides a reconciliation of underwriting income to income before federal income tax for the years ended December 31, 2023 and 2022:
| ($ in thousands) | 2023 | 2022 | ||||||||||||
| Income before federal income tax | $ | 110,102 | $ | 49,783 | ||||||||||
| Add: | ||||||||||||||
| Interest expense | 10,024 | 6,407 | ||||||||||||
| Amortization expense | 1,798 | 1,547 | ||||||||||||
| Other expenses | 5,364 | — | ||||||||||||
| Less (Add): | ||||||||||||||
| Net investment income | 40,322 | 36,931 | ||||||||||||
| Net investment gains (losses) | 11,072 | (15,705) | ||||||||||||
| Other (loss) income | (632) | 1 | ||||||||||||
| Underwriting income | $ | 76,526 | $ | 36,510 | ||||||||||
34
Adjusted Loss Ratio / Adjusted Combined Ratio
The following table provides a reconciliation of the adjusted loss and LAE ratio and adjusted combined ratio to the loss and LAE ratio and combined ratio for the years ended December 31, 2023 and 2022:
| ($ in thousands) | 2023 | 2022 | ||||||||||||
| Net earned premiums | $ | 829,143 | $ | 615,994 | ||||||||||
| Losses and LAE | 515,237 | 402,512 | ||||||||||||
| Pre-tax net impact of loss portfolio transfer | (1,427) | 8,572 | ||||||||||||
| Adjusted losses and LAE | $ | 516,664 | $ | 393,940 | ||||||||||
| Loss ratio | 62.1 | % | 65.3 | % | ||||||||||
| Net impact of LPT | (0.2) | % | 1.4 | % | ||||||||||
| Adjusted loss ratio | 62.3 | % | 63.9 | % | ||||||||||
| Combined ratio | 90.7 | % | 94.0 | % | ||||||||||
| Net impact of LPT | (0.2) | % | 1.4 | % | ||||||||||
| Adjusted combined ratio | 90.9 | % | 92.6 | % | ||||||||||
Tangible Stockholders’ Equity
The following table provides a reconciliation of tangible stockholders’ equity to stockholders’ equity as of December 31, 2023 and 2022:
| ($ in thousands) | 2023 | 2022 | ||||||||||||
| Stockholders’ equity | $ | 661,031 | $ | 421,662 | ||||||||||
| Less: goodwill and intangible assets | 88,435 | 89,870 | ||||||||||||
| Tangible stockholders’ equity | $ | 572,596 | $ | 331,792 | ||||||||||
Adjusted Return on Equity
The following table provides a reconciliation of adjusted return on equity to return on equity for the years ended December 31, 2023 and 2022:
| ($ in thousands) | 2023 | 2022 | ||||||||||||
| Numerator: adjusted operating income | $ | 80,847 | $ | 58,574 | ||||||||||
| Denominator: average stockholders’ equity | $ | 541,347 | $ | 423,871 | ||||||||||
Adjusted return on equity | 14.9 | % | 13.8 | % | ||||||||||
Return on Tangible Equity
Return on tangible equity for the years ended December 31, 2023 and 2022 reconciles to return on equity as follows:
| ($ in thousands) | 2023 | 2022 | ||||||||||||
| Numerator: net income | $ | 85,984 | $ | 39,396 | ||||||||||
| Denominator: average tangible stockholders’ equity | $ | 452,194 | $ | 333,268 | ||||||||||
Return on tangible equity | 19.0 | % | 11.8 | % | ||||||||||
35
Adjusted Return on Tangible Equity
Adjusted return on tangible equity for the years ended December 31, 2023 and 2022 reconciles to return on equity as follows:
| ($ in thousands) | 2023 | 2022 | ||||||||||||
| Numerator: adjusted operating income | $ | 80,847 | $ | 58,574 | ||||||||||
| Denominator: average tangible stockholders’ equity | $ | 452,194 | $ | 333,268 | ||||||||||
Adjusted return on tangible equity | 17.9 | % | 17.6 | % | ||||||||||
Underwriting Results
Premiums
The following table presents gross written premiums by underwriting division for the years ended December 31, 2023 and 2022:
| ($ in thousands) | 2023 | 2022 | % Change | |||||||||||||||||
| Industry Solutions | $ | 305,476 | $ | 267,628 | 14.1 | % | ||||||||||||||
| Global Property & Agriculture | 273,191 | 205,081 | 33.2 | % | ||||||||||||||||
| Programs | 178,726 | 163,653 | 9.2 | % | ||||||||||||||||
| Captives | 167,624 | 124,286 | 34.9 | % | ||||||||||||||||
| Professional Lines | 154,565 | 93,011 | 66.2 | % | ||||||||||||||||
| Accident & Health | 151,701 | 130,808 | 16.0 | % | ||||||||||||||||
| Transactional E&S | 122,508 | 75,098 | 63.1 | % | ||||||||||||||||
| Surety | 106,056 | 79,062 | 34.1 | % | ||||||||||||||||
| Total continuing business | $ | 1,459,847 | $ | 1,138,627 | 28.2 | % | ||||||||||||||
| Exited business | (18) | 5,325 | (100.3) | % | ||||||||||||||||
| Total gross written premiums | $ | 1,459,829 | $ | 1,143,952 | 27.6 | % | ||||||||||||||
The year over year increase in gross written premiums, when compared to 2022, was driven by double-digit premium growth in nearly all of our underwriting divisions, five of which grew over 30%. The gross written premium increases were primarily driven by (i) new business, (ii) rate increases, and (iii) retention. During 2023 we broadened our business portfolio, including (i) entry into inland marine and global agriculture, (ii) added an occupational accident offering in our industry solutions division, (iii) expanded our surety division to serve the SBA market and to provide judicial and fiduciary bonds, and (iv) expanded our accident & health coverages to include individual providers. In addition to the expanded portfolio offerings, growth was also impacted by the addition of new underwriting teams and new tech-enabled partnerships.
Net earned premiums were $829.1 million for the year ended December 31, 2023, compared to $616.0 million for the same 2022 period, an increase of $213.1 million or 34.6%. The increase in net earned premiums was primarily driven by the same reasons that drove the increase in gross written premiums discussed above. For additional information regarding our reinsurance programs, see the discussion included in “Item 1 Business - Reinsurance”.
36
Losses and LAE
The following table sets forth the components of the loss and LAE ratio and adjusted loss and LAE ratio for the years ended December 31, 2023 and 2022:
| 2023 | 2022 | |||||||||||||||||||||||||
| ($ in thousands) | Losses and LAE | % of Net Earned Premiums | Losses and LAE | % of Net Earned Premiums | ||||||||||||||||||||||
| Losses and LAE: | ||||||||||||||||||||||||||
Non-cat loss and LAE(1) | $ | 504,664 | 60.9 | % | $ | 387,440 | 62.8 | % | ||||||||||||||||||
Cat loss and LAE(1) | 12,000 | 1.4 | % | 6,500 | 1.1 | % | ||||||||||||||||||||
Prior accident year development - LPT | (1,427) | (0.2) | % | 8,572 | 1.4% | |||||||||||||||||||||
| Total losses and LAE | $ | 515,237 | 62.1 | % | $ | 402,512 | 65.3 | % | ||||||||||||||||||
Adjusted losses and LAE(2): | ||||||||||||||||||||||||||
Non-cat loss and LAE(1) | $ | 504,664 | 60.9 | % | $ | 387,440 | 62.8 | % | ||||||||||||||||||
Cat loss and LAE(1) | 12,000 | 1.4 | % | 6,500 | 1.1 | % | ||||||||||||||||||||
Total adjusted losses and LAE(2) | $ | 516,664 | 62.3 | % | $ | 393,940 | 63.9 | % | ||||||||||||||||||
(1) Current accident year | ||||||||||||||||||||||||||
(2) See "Reconciliation of Non-GAAP Financial Measures" included in this Item 7 | ||||||||||||||||||||||||||
The loss ratio for the year ended 2023 improved 3.2 points when compared to the same 2022 period. The non-cat loss and LAE ratio improved 1.9 points when compared to the same 2022 period, driven by the shift in the mix of business and continued run-off of exited business. Catastrophe losses from second and third quarter convective storms and first quarter wind and hail events, including tornadoes, added 1.4 points to the loss ratio compared to 2022, which was impacted by 1.1 points of catastrophe losses from Hurricane Ian and Winter Storm Elliott. The loss ratio for the year ended 2022 included 1.4 points from the net impact of LPT reserve strengthening. Additional information regarding the LPT can be found in the “Loss Portfolio Transfer” discussion included in this Item 7.
Losses and LAE Development
The following table sets forth the presentation of the development of the ultimate liability by accident year for the years ended December 31, 2023 and 2022:
| ($ in thousands) | Development | |||||||||||||
| (Favorable) Adverse | ||||||||||||||
| Accident Year | 2023 | 2022 | ||||||||||||
| Prior | $ | 10,132 | $ | 30,141 | ||||||||||
| 2020 | 7,903 | (6,756) | ||||||||||||
| 2021 | (27,312) | (9,000) | ||||||||||||
| 2022 | 9,277 | — | ||||||||||||
| Total | $ | — | $ | 14,385 | ||||||||||
| Reserve development on losses subject to LPT | $ | — | $ | 14,385 | ||||||||||
| Reserve development on losses excluding losses subject to LPT | $ | — | $ | — | ||||||||||
For the year ended December 31, 2023, the Company recognized favorable development related to prior years’ loss and loss expense reserves of $9.2 million in short tail/monoline specialty lines and adverse development of $11.9 million in multi-line solutions, respectively. The favorable development in short tail/monoline specialty lines was driven by property lines of business from the 2021 accident year. The adverse development in multi-line solutions was driven by higher than expected severity in general and auto liability lines of business primarily from the 2019 accident year.
During the year ended December 31, 2022, net incurred losses for accident years 2021 and prior developed adversely by $14.4 million which was related to losses subject to the LPT.
Within exited lines, adverse development of $14.5 million was from the 2019 accident year primarily driven by increased frequency and severity in general and professional liability. The remaining $8.4 million of net adverse development was from other accident years.
37
Within multi-line solutions, favorable development of $10.8 million was from the 2020 through 2021 accident years and was driven by a reduction in frequency of claims in commercial auto and general liability. The remaining $2.3 million of net adverse development was from various other accident years.
Loss Portfolio Transfer
On April 1, 2020 (“Inception Date”), with a valuation date of June 30, 2019 (“Valuation Date”), we entered into a LPT retroactive reinsurance agreement with R&Q Bermuda (SAC) Limited, a third party reinsurer domiciled in Bermuda that specializes in assuming legacy blocks of insurance business and running them off. The LPT covers liabilities (including claim payments, allocated LAE and certain extra-contractual obligations) related to certain policies issued or assumed for policy years 2017 and prior. The LPT agreement covers the majority of our exited business. We believe purchasing this coverage reduces the volatility associated with the covered business produced in 2017 and prior, and has allowed our management team to focus on the continuing business which we believe provides the best path for continued profitable growth.
As of the Valuation Date, we agreed to cede $153.1 million of Net LPT Reserves for certain lines of business, primarily related to 2017 and prior policy years, subject to an aggregate cash deductible of $105 million which was withheld from the reinsurer. Subsequent to the Valuation Date but prior to the Inception Date, we strengthened the Net LPT Reserves by $5.5 million. This development resulted in an increase in the Net LPT Reserves of $5.5 million to $158.6 million. Consequently, at the Inception Date, the cash remitted to the third party reinsurer for the cession of the Net LPT reserves was $53.6 million (reflecting the $158.6 million of Net LPT Reserves less the $105.0 million cash deductible).
As of the Inception Date, the LPT provided reinsurance protection of approximately $127.4 million above the Net LPT Reserves, subject to co-participations at specified amounts, detailed below. We paid $43.5 million in premium to the reinsurer for this reinsurance protection. This premium payment of $43.5 million combined with the $53.6 million remitted to the reinsurer resulted in a total cash transfer of $97.1 million on the Inception Date.
The LPT is structured into two distinct sections with separate and independent reinsurance structures. Section A (representing $22.2 million of ceded net reserves at inception of the LPT) is the smaller section of the LPT covering claims from exited workers’ compensation and general liability lines of business primarily related to business written in policy years 2011 and prior. Section B (representing $130.9 million of ceded net reserves at inception of the LPT) is a substantially larger section, covering claims from other exited business and certain continuing business related to policies written in years 2017 and prior, principally comprised of general liability and commercial auto lines.
As of December 31, 2023, our net loss reserves subject to the LPT were $44.8 million compared to $68.6 million as of December 31, 2022. During 2022 we materially strengthened our reserves subject to the LPT. Since the inception of the LPT, as of December 31, 2023 we have reduced the number of open claims by 79.5%.
Section A
Based on the reserves on the Valuation Date, we ceded $22.2 million of net reserves related to Section A, subject to the aggregate cash deductible. The LPT provides 100% reinsurance coverage on the first $2.8 million of incurred losses and LAE above the ceded net reserves for Section A. Above the $2.8 million coverage layer is a further $5.0 million of reinsurance coverage for which we retain 50% of the incurred losses and LAE.
As of December 31, 2023, total incurred losses and LAE (including claims paid, case reserves and IBNR) were $38.2 million, which is $8.2 million in excess of our reinsurance coverage under Section A of the LPT. As a result, should new claims arise or existing claims develop adversely such that we need to increase our incurred losses and LAE on business covered by Section A, there would be no further reinsurance coverage on these policies subject to the LPT.
As of December 31, 2023, paid losses and LAE on policies subject to Section A of the LPT were $24.9 million, which is $5.1 million below our total reinsurance coverage under Section A. We believe the ratio of paid losses and LAE to total incurred losses and LAE of 65.1% as of December 31, 2023, on policies covered under Section A of the LPT, in combination with the age of the policies (primarily policy years 2011 and prior) and the declining number of open claims (Section A open claims have been reduced by 68.9% since the Valuation Date), underscores the strength of our reserve position on Section A.
The following chart sets forth the Section A reinsurance structure, the paid and incurred losses and LAE positions within the structure as of December 31, 2023, and the reduction in open claims from the Valuation Date through December 31, 2023.
38

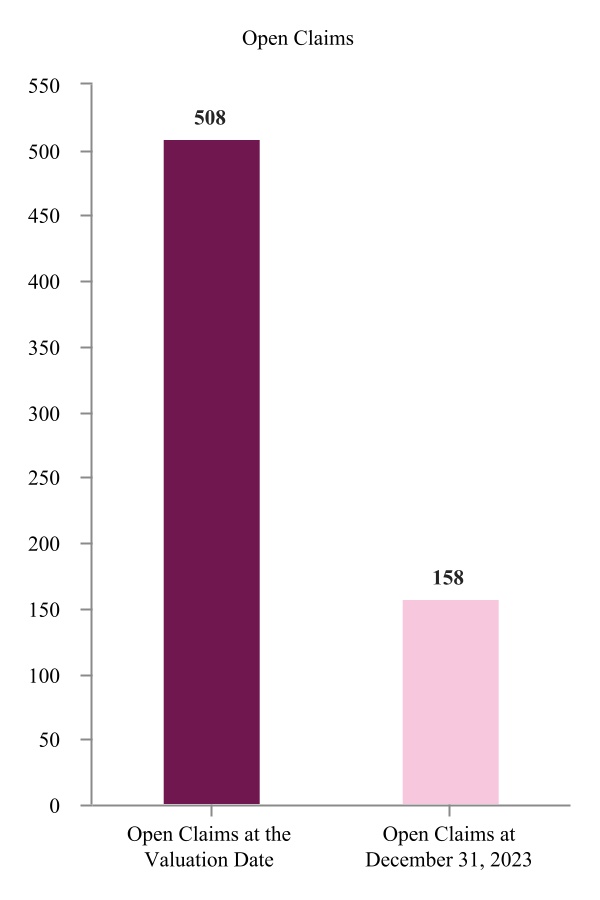
Section B
Based on the reserves on the Valuation Date, we ceded $130.9 million of net reserves related to Section B, subject to the aggregate cash deductible. The LPT provides 100% reinsurance coverage on the first $19.1 million of incurred losses and LAE above the ceded net reserves for Section B. Above the $19.1 million layer, a further $70.0 million of reinsurance coverage is provided, for which we have a 50% co-participation on the incurred losses and LAE in the layer. There is a further $36.0 million of reinsurance that provides 100% coverage above the $70.0 million layer.
As of December 31, 2023, total incurred losses and LAE (including claims paid, case reserves and IBNR) were $220.0 million with the entire $36.0 million of 100% coverage layer available should new claims arise or existing claims develop adversely. As of December 31, 2023, paid losses and LAE on policies subject to Section B were $188.5 million, which is $67.5 million below our total reinsurance coverage under Section B, which includes the co-participation amounts. As with Section A, we believe that the Section B ratio of paid losses and LAE to total incurred losses and LAE of 85.7% as of December 31, 2023 in combination with and the rapidly declining number of open claims (reduced by 81.9%) since the Valuation Date underscores the strength of our reserve position on Section B.
The following chart sets forth the Section B reinsurance structure, the paid and incurred losses and LAE positions within the structure as of December 31, 2023, and the reduction in open claims from the Valuation Date through December 31, 2023:
39

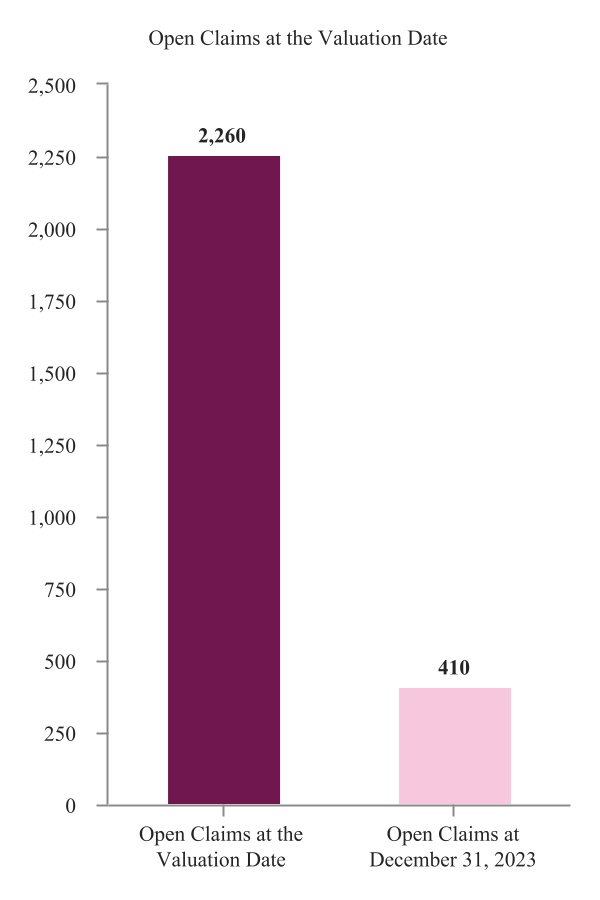
Expense Ratio
The following table sets forth the components of the expense ratio for the years ended December 31, 2023 and 2022:
| 2023 | 2022 | |||||||||||||||||||||||||
| ($ in thousands) | Expenses | % of Net Earned Premiums | Expenses | % of Net Earned Premiums | ||||||||||||||||||||||
| Net policy acquisition expenses | $ | 108,514 | 13.0 | % | $ | 65,695 | 10.6 | % | ||||||||||||||||||
| Other operating and general expenses | 134,930 | 16.3 | % | 116,476 | 18.9 | % | ||||||||||||||||||||
| Underwriting, acquisition and insurance expenses | 243,444 | 29.3 | % | 182,171 | 29.5 | % | ||||||||||||||||||||
| Less: commission and fee income | (6,064) | (0.7) | % | (5,199) | (0.8) | % | ||||||||||||||||||||
| Total net expenses | $ | 237,380 | 28.6 | % | $ | 176,972 | 28.7 | % | ||||||||||||||||||
The expense ratio was flat when compared to the same 2022 period. The increase in the net policy and acquisition expense ratio, when compared to the same 2022 period, was primarily driven by the shift in our mix of business offset by an improved other operating and general expense ratio, when compared to the same 2022 period, due to the increase in earned premiums.
40
Investment Results
The following table sets forth the components of net investment income and net investment (losses) gains for the years ended December 31, 2023 and 2022:
| ($ in thousands) | 2023 | 2022 | ||||||||||||
Cash and short-term investments(1) | $ | 11,353 | $ | 1,427 | ||||||||||
| Core fixed income | 32,572 | 16,544 | ||||||||||||
| Opportunistic fixed income | (6,844) | 16,784 | ||||||||||||
| Equities | 2,682 | 2,160 | ||||||||||||
Net investment income(1) | $ | 39,763 | $ | 36,915 | ||||||||||
| Net unrealized gains (losses) on securities still held | $ | 11,130 | $ | (15,058) | ||||||||||
| Net realized losses | (58) | (647) | ||||||||||||
| Net investment gains (losses) | $ | 11,072 | $ | (15,705) | ||||||||||
(1) excludes income from operating cash for the years ended December, 31, 2023 and 2022. | ||||||||||||||
The increase in income from our core fixed income portfolio for the year ended 2023, when compared to the same 2022 period, was due to (i) a larger asset base as we continued to increase our allocation to this part of our investment portfolio and (ii) a higher book yield of 4.5% at December 31, 2023 compared to 3.7% at December 31, 2022. The increase in income from short-term and money market investments for the year ended 2023, when compared to the same 2022 period, was due to a larger asset base and higher investment yields when compared to the same 2022 period. The opportunistic fixed income portfolio continued to be impacted by a decline in the fair value of limited partnership investments for the year ended 2023 when compared to the same 2022 period.
Investments
Composition of Investment Portfolio
The following table sets forth the components of our investment portfolio at carrying value at December 31, 2023 and 2022:
| 2023 | 2022 | |||||||||||||||||||||||||
| ($ in thousands) | Fair Value | % of Total | Fair Value | % of Total | ||||||||||||||||||||||
| Short-term and money market investments | $ | 270,259 | 16.7 | % | $ | 121,268 | 11.2 | % | ||||||||||||||||||
| Core fixed income | 1,017,651 | 63.1 | % | 607,572 | 56.1 | % | ||||||||||||||||||||
| Opportunistic fixed income | 172,645 | 10.7 | % | 196,021 | 18.1 | % | ||||||||||||||||||||
| Equities | 153,132 | 9.5 | % | 157,506 | 14.6 | % | ||||||||||||||||||||
| Total investment portfolio | $ | 1,613,687 | 100.0 | % | $ | 1,082,367 | 100.0 | % | ||||||||||||||||||
Our fixed maturity securities, comprised of both core fixed income and opportunistic fixed income, comprised 73.8% and 74.2% of our total investment portfolio as of December 31, 2023 and 2022, respectively, and had a weighted average effective duration of 3.2 years and 3.1 years as of December 31, 2023 and 2022, respectively, and an average core fixed income credit rating of “AA-” and “AA” (Standard & Poor’s) as of December 31, 2023 and 2022, respectively.
Core fixed income
The core fixed income portfolio consists primarily of investment grade fixed income securities which are predominantly highly-rated and liquid bonds. Our objective is to earn attractive risk-adjusted returns with a low risk of loss of principal. The portfolio is managed by third party managers. The average duration of the portfolio was approximately 4.4 years and 4.3 years, respectively, as of December 31, 2023 and 2022.
41
The following table sets forth the components of our core fixed income portfolio at December 31, 2023 and 2022:
| 2023 | 2022 | |||||||||||||||||||||||||
| ($ in thousands) | Fair Value | % of Total Fair Value | Fair Value | % of Total Fair Value | ||||||||||||||||||||||
| U.S. government securities | $ | 44,166 | 4.3 | % | $ | 48,541 | 8.0 | % | ||||||||||||||||||
| Corporate securities and miscellaneous | 383,420 | 37.7 | % | 235,129 | 38.7 | % | ||||||||||||||||||||
| Municipal securities | 92,778 | 9.1 | % | 57,727 | 9.5 | % | ||||||||||||||||||||
| Residential mortgage-backed securities | 281,626 | 27.7 | % | 119,856 | 19.7 | % | ||||||||||||||||||||
| Commercial mortgage-backed securities | 29,934 | 2.9 | % | 36,495 | 6.0 | % | ||||||||||||||||||||
| Other asset-backed securities | 185,727 | 18.3 | % | 109,824 | 18.1 | % | ||||||||||||||||||||
| Core fixed income securities, available for sale | $ | 1,017,651 | 100.0 | % | $ | 607,572 | 100.0 | % | ||||||||||||||||||
The weighted average credit rating of the portfolio was “AA-” by Standard & Poor’s Financial Services, LLC (“Standard & Poor’s”) at December 31, 2023 and “AA” by Standard & Poor’s at December 31, 2022. The following table sets forth the credit quality of our core fixed income portfolio at December 31, 2023 and 2022, as rated by Standard & Poor’s or equivalent designation:
| 2023 | 2022 | |||||||||||||||||||||||||
| ($ in thousands) | Fair Value | % of Total | Fair Value | % of Total | ||||||||||||||||||||||
| AAA | $ | 493,252 | 48.6 | % | $ | 283,733 | 46.7 | % | ||||||||||||||||||
| AA | 105,906 | 10.4 | % | 74,604 | 12.3 | % | ||||||||||||||||||||
| A | 233,487 | 22.9 | % | 134,175 | 22.1 | % | ||||||||||||||||||||
| BBB | 154,096 | 15.1 | % | 88,369 | 14.5 | % | ||||||||||||||||||||
| BB and Lower | 30,910 | 3.0 | % | 26,691 | 4.4 | % | ||||||||||||||||||||
| Total core fixed income | $ | 1,017,651 | 100.0 | % | $ | 607,572 | 100.0 | % | ||||||||||||||||||
Opportunistic fixed income
The opportunistic fixed income portfolio is managed by Arena which is affiliated with Westaim, our largest shareholder. The opportunistic fixed income portfolio consists of separately managed accounts, limited partnerships, promissory notes and equity interests. The underlying securities are primarily floating rate senior secured loans, comprised of short duration, collateralized, asset-oriented credit investments designed to generate attractive risk-adjusted returns. Investments contain strong covenants and are backed by a significant amount of collateral with a weighted average loan-to-value of 74%. The limited partnerships are subject to future increases or decreases in asset value and may exhibit volatile results as asset values are monetized and the resultant income is distributed. As of December 31, 2023, the opportunistic fixed income portfolio consisted of three components: diversified asset based lending (55.1%), commercial mortgage loans (29.0%) and cash and cash equivalents (15.9%). The diversified asset based lending portfolio includes floating rate senior secured asset-based loans with significant amounts of collateral and strong covenants.
42
The following table sets forth the components of our opportunistic fixed income portfolio by industry sector at December 31, 2023 and 2022:
| 2023 | 2022 | |||||||||||||||||||||||||
| ($ in thousands) | Fair Value | % of Total | Fair Value | % of Total | ||||||||||||||||||||||
| Real Estate | $ | 88,964 | 51.5 | % | $ | 90,370 | 46.1 | % | ||||||||||||||||||
| Oil & Gas | 15,991 | 9.3 | % | 20,725 | 10.6 | % | ||||||||||||||||||||
| Banking, Finance & Insurance | 11,425 | 6.6 | % | 13,870 | 7.1 | % | ||||||||||||||||||||
Other sectors(1) | 28,747 | 16.7 | % | 34,072 | 17.4 | % | ||||||||||||||||||||
Cash and cash equivalents(2) | 27,518 | 15.9 | % | 36,984 | 18.8 | % | ||||||||||||||||||||
| Opportunistic fixed income | $ | 172,645 | 100.0 | % | $ | 196,021 | 100.0 | % | ||||||||||||||||||
(1) Other sectors primarily includes Aerospace & Defense, Business Services, Retail, Commercial & Industrial and Environmental. | ||||||||||||||||||||||||||
(2) Includes cash on settlements that have not yet been redeployed. | ||||||||||||||||||||||||||
The average duration of the portfolio is approximately 1.3 years and 1.4 years as of December 31, 2023 and 2022, respectively.
Equities
The equities portfolio primarily consists of domestic preferred stocks, common equities, exchange traded funds, limited partnerships, limited liability corporations and other types of equity interests, 77.2% of which are publicly traded. During 2021, we initiated a tail-risk management strategy that is designed to provide some protection for the equity portfolio if there is a significant decline in the S&P 500 within a 30 day period. We continued this strategy in 2023 and as of December 31, 2023, the annual cost of the strategy was approximately $1.0 million. The portfolio is directed internally and includes both self-managed investments and portfolios managed by third-party investment management firms.
The following table sets forth the components of our equities portfolio by security type at December 31, 2023 and 2022:
| 2023 | 2022 | |||||||||||||||||||||||||
| ($ in thousands) | Fair Value | % of Total Fair Value | Fair Value | % of Total Fair Value | ||||||||||||||||||||||
| Domestic common equities | $ | 71,502 | 46.7 | % | $ | 76,929 | 48.8 | % | ||||||||||||||||||
| International common equities | 39,389 | 25.7 | % | 34,468 | 21.9 | % | ||||||||||||||||||||
| Preferred stock | 7,358 | 4.8 | % | 8,772 | 5.6 | % | ||||||||||||||||||||
Other(1) | 34,883 | 22.8 | % | 37,337 | 23.7 | % | ||||||||||||||||||||
| Equities | $ | 153,132 | 100.0 | % | $ | 157,506 | 100.0 | % | ||||||||||||||||||
(1) Other includes limited partnerships, limited liability companies and other equity interests | ||||||||||||||||||||||||||
Market Risk
Market risk is the risk of economic losses due to adverse changes in the estimated fair value of a financial instrument as the result of changes in interest rates, equity prices, foreign currency exchange rates and commodity prices. The primary components of market risk affecting us are credit risk and interest rate risk. We do not have significant exposure to foreign currency exchange rate risk or commodity risk.
Credit risk
Credit risk is the potential loss resulting from adverse changes in an issuer’s ability to repay its debt obligations. We have exposure to credit risk as a holder of debt instruments in our core fixed income and opportunistic fixed income portfolios. Our risk management strategy and investment policy is to invest primarily in debt instruments of high credit quality issuers and to limit the amount of credit exposure with respect to particular ratings categories and any one issuer. At December 31, 2023, our core fixed income portfolio had an average rating of “AA-,” with approximately 82% of securities in that portfolio rated “A” or better by at least one nationally recognized rating organization. Our policy is to invest in investment grade fixed income securities which are high quality and liquid, providing a stable income stream, supplemented by opportunistic fixed income and equity securities, with the objective of further enhancing the portfolio’s diversification and risk-adjusted returns. At December 31, 2023, approximately 3.0% of our core fixed income portfolio
43
was unrated or rated below investment-grade. Through our investment managers, we monitor the financial condition of all of the issuers of securities in our portfolio.
In addition, we are subject to credit risk with respect to our third-party reinsurers. Although our third-party reinsurers are obligated to reimburse us to the extent we cede risk to them, we are ultimately liable to our policyholders on all risks we have ceded. As a result, reinsurance contracts do not limit our ultimate obligations to pay claims covered under the insurance policies we issue, and we might not collect amounts recoverable from our reinsurers. We address this credit risk by seeking to purchase reinsurance from reinsurers that are rated at least “A-” (Excellent) or better by A.M. Best. We also perform, along with our reinsurance broker, periodic credit reviews of our reinsurers. At December 31, 2023, 99% of our reinsurance recoverables were either derived from reinsurers rated “A-” (Excellent) by A.M. Best, or better, or were collateralized through funds held, trusts and letters of credit by the reinsurer. If one of our reinsurers suffers a credit downgrade, we may consider various options to lessen the risk of asset impairment, including commutation, novation and letters of credit.
Interest rate risk
Interest rate risk is the risk that we will incur economic losses due to adverse changes in interest rates. The primary market risk to our investment portfolio is interest rate risk associated with investments in fixed income securities. Fluctuations in interest rates have a direct effect on the market valuation of these securities. When market interest rates rise, the fair value of our securities decreases. Conversely, as interest rates fall, the fair value of our securities increases. We manage this interest rate risk by investing in securities with varied maturity dates and by managing the duration of our investment portfolio in directional relation to the duration of our reserves. Expressed in years, duration is the weighted average payment period of cash flows, where the weighting is based on the present value of the cash flows. We set duration targets for our core fixed income investment portfolio after consideration of the estimated duration of our liabilities and other factors. Our fixed maturity securities had a weighted average effective duration of 3.2 years as of December 31, 2023.
We had fixed income securities that were subject to interest rate risk with a fair value of $1,017.7 million at December 31, 2023. Our opportunistic fixed income securities are excluded from our interest rate sensitivity analysis as they are primarily floating rate and treated as held to maturity securities.
The following table sets forth what changes might occur in the value of our core fixed income portfolio given hypothetical changes in interest rates as of December 31, 2023:
| ($ in thousands) | Estimated Fair Value | Estimated Change in Fair Value | Estimated % Increase (Decrease) in Fair Value | |||||||||||||||||
| 300 basis point increase | $ | 887,124 | $ | (130,527) | (12.8) | % | ||||||||||||||
| 200 basis point increase | $ | 929,996 | $ | (87,655) | (8.6) | % | ||||||||||||||
| 100 basis point increase | $ | 973,505 | $ | (44,146) | (4.3) | % | ||||||||||||||
| No change | $ | 1,017,651 | $ | — | 0.0 | % | ||||||||||||||
| 100 basis point decrease | $ | 1,062,433 | $ | 44,782 | 4.4 | % | ||||||||||||||
| 200 basis point decrease | $ | 1,107,852 | $ | 90,201 | 8.9 | % | ||||||||||||||
| 300 basis point decrease | $ | 1,153,908 | $ | 136,257 | 13.4 | % | ||||||||||||||
Changes in interest rates will have an immediate effect on comprehensive income and stockholders’ equity but will not ordinarily have an immediate effect on net income. Actual results may differ from the hypothetical change in market rates assumed in the table above. This sensitivity analysis does not reflect the results of any action that we may take to mitigate such hypothetical losses in fair value.
Equity price risk
Equity price risk represents the potential economic losses due to adverse changes in equity security prices. At December 31, 2023, approximately 11.4% of the fair value of our investment portfolio (excluding cash and cash equivalents and short-term investments) was invested in equity securities. We manage equity price risk through portfolio diversification and maintain a tail-risk management strategy that is designed to provide some protection for the equity portfolio if there is a significant decline in the S&P 500 within a 30 day period.
44
Other Items
Income Taxes
Income tax expense was $24.1 million for the year ended December 31, 2023 compared to $10.4 million for the year ended December 31, 2022. Our effective tax rate was 21.9% for the year ended December 31, 2023, compared to 20.9% for the year ended December 31, 2022. The change in our effective tax rate in 2023, when compared to 2022, was primarily due to the relationship of taxable to non-taxable income. The Company’s provision for income taxes generally does not deviate substantially from the statutory tax rate. The effective tax rate may vary slightly from the statutory rate due to tax adjustments for tax-exempt income and dividends-received deduction.
See Note 13, “Income Taxes” to our consolidated financial statements included in Item 8 of this Form 10-K for a reconciliation between our actual federal income tax expense and the amount computed at the indicated statutory rate for the years ended December 31, 2023 and 2022.
Liquidity and Capital Resources
Sources and Uses of Funds
We are organized as a holding company with our operations primarily conducted by our wholly-owned insurance subsidiaries, HSIC, IIC, and GMIC, which are domiciled in Texas, and OSIC, which is domiciled in Oklahoma. Accordingly, the holding company may receive cash through (1) corporate service fees from our operating subsidiaries, (2) payments pursuant to our consolidated tax allocation agreement, (3) dividends from our subsidiaries, subject to certain limitations discussed below regarding dividends from our insurance subsidiaries, (4) loans from banks, (5) draws on a revolving loan agreement, and (6) issuance of equity and debt securities. We also may use the proceeds from these sources to contribute funds to insurance subsidiaries in order to support premium growth, pay dividends and taxes and for other business purposes.
Skyward Service Company receives corporate service fees from the operating subsidiaries to reimburse it for most of the operating expenses that it incurs. Reimbursement of expenses through corporate service fees is based on the actual costs that we expect to incur with no mark-up above our expected costs.
We file a consolidated U.S. federal income tax return with our subsidiaries, and under our corporate tax allocation agreement, each participant is charged or refunded taxes according to the amount that the participant would have paid or received had it filed on a separate return basis with the Internal Revenue Service (the “IRS”).
Applicable state insurance laws restrict the ability of the insurance subsidiaries to declare stockholder dividends without prior regulatory approval. Applicable state insurance regulators require insurance companies to maintain specified levels of statutory capital and surplus. Dividend payments are further limited to that part of available policyholder surplus which is derived from net profits on an insurer’s business.
Insurance regulators have broad powers to prevent reduction of statutory surplus to inadequate levels, and there is no assurance that dividends of the maximum amounts calculated under any applicable formula would be permitted. State insurance regulatory authorities that have jurisdiction over the payment of dividends by our insurance subsidiaries may in the future adopt statutory provisions more restrictive than those currently in effect. Our insurance subsidiaries did not pay dividends to us for the years ended December 31, 2023 or 2022. See Note 23, “Statutory Accounting Principles and Regulatory Matters” to our consolidated financial statements included in Item 8 of this Form 10-K for additional information regarding our insurance companies.
At December 31, 2023, our holding company had $3.0 million in cash and investments compared to $8.9 million at December 31, 2022.
We believe that we have sufficient liquidity available to meet our operating cash needs and obligations and committed capital expenditures for the next 12 months.
Cash Flows
Our most significant source of cash is from premiums received from our insureds, which, for most policies, we receive at the beginning of the coverage period, net of the related commission amount for the policies. Our most significant cash outflow is for claims that arise when a policyholder incurs an insured loss. Because the payment of claims occurs after the receipt of the premium, often years later, we invest the cash in various investment securities that generally earn interest and dividends. We also use cash to pay for operating expenses such as salaries, rent and taxes and capital expenditures such as technology systems. We use reinsurance to manage the risk that we take on our policies. We cede, or pay out, part of the premiums we receive to our reinsurers and collect cash back when losses subject to our reinsurance coverage are paid.
45
The timing of our cash flows from operating activities can vary among periods due to the timing by which payments are made or received. Some of our payments and receipts, including loss settlements and subsequent reinsurance receipts, can be significant, and as a result their timing can influence cash flows from operating activities in any given period. Management believes that cash receipts from premiums and proceeds from investment income are sufficient to cover cash outflows in the foreseeable future.
The following table sets forth our cash flows for the years ended December 31, 2023 and 2022:
| ($ in thousands) | 2023 | 2022 | ||||||||||||
| Cash and cash equivalents provided by (used in): | ||||||||||||||
| Operating activities | $ | 338,187 | $ | 208,938 | ||||||||||
| Investing activities | (493,809) | (193,381) | ||||||||||||
| Financing activities | 130,947 | 2,180 | ||||||||||||
| Change in cash and cash equivalents | $ | (24,675) | $ | 17,737 | ||||||||||
The increase in cash provided by operating activities in 2023 and 2022 was primarily due to the growth of the business, timing of premium receipts, claim payments and reinsurance activity. Cash flows from operations in each of the past two years were used primarily to fund investing activities.
The change in net cash used in investing activities from 2023 to 2022 was primarily driven by an increase in the purchases of fixed maturity securities and short-term investments.
The change in net cash provided by financing activities from 2023 to 2022 was primarily driven by proceeds received from the IPO and the November follow-on offering. See note 12, “Stockholders’ Equity”, to our consolidated financial statements included in Item 8 of this Form 10-K for additional information regarding the IPO and November follow-on offering.
Credit Agreements
Revolving Credit Facility
On March 29, 2023, we entered into an unsecured revolving credit facility (the “Revolving Credit Facility”) with a syndicate of participating banks. The Revolving Credit Facility provides us with up to a $150.0 million revolving credit facility, with an accordion that can increase the capacity by $50.0 million, and a letter of credit sub-facility of up to $30.0 million.
During the year ended December 31, 2023, we drew $50.0 million on the Revolving Credit Facility and used the proceeds to pay off the principal on our Term Loan (defined below). We subsequently terminated the Term loan and the Revolver (defined below).
Interest on the Revolving Credit Facility is payable quarterly. The interest rate on the Revolving Credit Facility is the Secured Overnight Financing Rate (“SOFR”) plus a margin of between 150 and 190 basis points based on the ratio of debt to total capital and a credit spread adjustment of 10 basis points. At December 31, 2023, the six-month SOFR on the Revolving Credit Facility was 5.47%, plus a margin of 1.60%.
We are subject to covenants on the Revolving Credit Facility based on minimum net worth, maximum debt to capital ratio, minimum A.M. Best Rating and minimum liquidity. As of December 31, 2023, we are in compliance with all covenants.
On March 14, 2024, we drew $50.0 million on the Revolving Credit Facility and used the proceeds and existing cash to fund the redemption of the Debentures (see “Debentures” below for additional information regarding the redemption). After the draw, we had $100.0 million outstanding under the Revolving Credit Facility with another $50.0 million of undrawn capacity.
Debentures
In August 2006, we received $58.0 million of proceeds from a debenture offering through a statutory trust, Delos Capital Trust (the “Trust”). The sole asset of the Trust consists of Fixed/Floating Rate Junior Subordinated Deferrable Interest Debentures (the “Debentures”) with a principal amount of $59.8 million issued by us and cash of $1.8 million from the issuance of Trust common shares purchased by us equal to 3% of the Trust capitalization. The Debentures are an unsecured obligation, are redeemable, and have a maturity date of September 15, 2036. Interest on the Trust Preferred is payable quarterly at an annual rate based on the three-month LIBOR (5.59% and 4.77% at December 31, 2023 and 2022,
46
respectively), plus 3.4%. On March 15, 2024, the Company redeemed the Debentures and paid $1.4 million of accrued interest.
Subordinated Debt
In May 2019, we issued unsecured subordinated notes (the “Notes”) with an aggregate principal amount of $20.0 million. Interest on the subordinated notes is 7.25% fixed for the first 8 years and 8.25% fixed thereafter. Early retirement of the debt ahead of the eight (8) year commitment requires all interest payments to be paid in full, as well as the return of all capital. Principal payment is due at maturity on May 24, 2039 and interest is payable quarterly.
Term Loan
On December 11, 2019, we entered into a credit agreement with Prosperity Bank which provided us with a $50.0 million term loan (the “Term Loan”) and a $50.0 million revolving line of credit (the “Revolver”) with additional capacity up to $75.0 million.
At December 31, 2022, the interest rate on the Term Loan was the one-month LIBOR (4.39% on December 31, 2022) plus the “Applicable Margin,” which was defined as 1.65%. In connection with our entry into the Revolving Credit Facility, we terminated the existing term loan and revolving line of credit.
At December 31, 2023 the ratio of total debt outstanding, including the Revolving Credit Facility, the Trust Preferred and the Notes, to total capitalization (defined as total debt plus stockholders’ equity) was 16.3% and at December 31, 2022, the ratio of total debt outstanding, including the Term Loan, the Revolver, the Trust Preferred and the Notes, to total capitalization was 23.4%. At March 15, 2024, capitalization remained unchanged as a result of the draw on the Revolving Credit Facility and subsequent redemption of the Debentures.
Contractual Obligations and Commitments
The following table sets forth our contractual obligations and commercial commitments by due date as of December 31, 2023:
| Payments due by period | ||||||||||||||||||||
| ($ in thousands) | Total | Less Than One Year | One Year or More | |||||||||||||||||
| Reserves for losses and LAE | $ | 1,314,501 | $ | 579,852 | $ | 734,649 | ||||||||||||||
| Long-term debt | 129,794 | 59,794 | 70,000 | |||||||||||||||||
| Interest on debt obligations | 109,196 | 10,408 | 98,788 | |||||||||||||||||
| Operating lease obligations | 5,784 | 1,671 | 4,113 | |||||||||||||||||
| Total | $ | 1,559,275 | $ | 651,725 | $ | 907,550 | ||||||||||||||
Reserves for losses and LAE represent our best estimate of the ultimate cost of settling reported and unreported claims and related expenses. Estimating reserves for losses and LAE is based on various complex and subjective judgments. Actual losses and settlement expenses paid may deviate, perhaps substantially, from the reserve estimates reflected in our financial statements. Similarly, the timing for payment of our estimated losses is not fixed and is not determinable on an individual or aggregate basis. The assumptions used in estimating the payments due by period are based on our own, industry and peer group claims payment experience. Due to the uncertainty inherent in the process of estimating the timing of such payments, there is a risk that the amounts paid in any period will be significantly different than the amounts disclosed above. Amounts disclosed above are gross of anticipated amounts recoverable from reinsurers. Reinsurance balances recoverable on reserves for losses and LAE are reported separately as assets, instead of being netted with the related liabilities, since reinsurance does not discharge us of our liability to policyholders. Reinsurance balances recoverable on reserves for paid and unpaid losses and LAE totaled $596.3 million and $581.4 million at December 31, 2023 and December 31, 2022, respectively.
Critical Accounting Policies
We identified the accounting estimates below as critical to the understanding of our financial position and results of operations. Critical accounting estimates are defined as those estimates that are both important to the portrayal of our financial condition and results of operations and require us to exercise significant judgment. We use significant judgment concerning future results and developments in applying these critical accounting estimates and in preparing our consolidated financial statements. These judgments and estimates affect our reported amounts of assets, liabilities, revenues and expenses and the disclosure of our material contingent assets and liabilities. Actual results may differ materially from the estimates and assumptions used in preparing the consolidated financial statements. We evaluate our estimates regularly
47
using information that we believe to be relevant. For a detailed discussion of our accounting policies, see Note 2, “Summary of Significant Accounting Policies” to our consolidated financial statements included in Item 8 of this Form 10-K.
Reserves for unpaid losses and LAE
The reserves for unpaid losses and LAE is the largest and most complex estimate in our consolidated balance sheet. The reserves for unpaid losses and LAE represent our estimated ultimate cost of all unreported and reported but unpaid insured claims and the cost to adjust these losses that have occurred as of or before the balance sheet date. We do not discount our reserves for losses and LAE to reflect estimated present value. We estimate the reserves using individual case-basis valuations of reported claims and statistical analyses and various actuarial procedures. Those estimates are based on our historical information, industry and peer group information and our estimates of future trends in variable factors such as loss severity, loss frequency and other factors such as inflation. We regularly review our estimates and adjust them as necessary as experience develops or as new information becomes known to us. Additionally, during the loss settlement period, it often becomes necessary to refine and adjust the estimates of liability on a claim either upward or downward. Even after such adjustments, the ultimate liability may exceed or be less than the revised estimates. Accordingly, the ultimate settlement of losses and the related LAE may vary significantly from the estimate included in our financial statements.
We categorize our reserves for unpaid losses and LAE into two types: case reserves and IBNR.
The following table sets forth our gross and net reserves for unpaid losses and LAE at December 31, 2023 and 2022:
| 2023 | 2022 | |||||||||||||||||||||||||||||||||||||||||||||||||
| ($ in thousands) | Gross | % of Total | Net | % of Total | Gross | % of Total | Net | % of Total | ||||||||||||||||||||||||||||||||||||||||||
| Case reserves | $ | 561,474 | 42.7 | % | $ | 318,863 | 37.1 | % | $ | 485,143 | 42.5 | % | $ | 269,273 | 38.2 | % | ||||||||||||||||||||||||||||||||||
| IBNR | 753,027 | 57.3 | % | 540,154 | 62.9 | % | 656,614 | 57.5 | % | 436,498 | 61.8 | % | ||||||||||||||||||||||||||||||||||||||
| Total | $ | 1,314,501 | 100.0 | % | $ | 859,017 | 100.0 | % | $ | 1,141,757 | 100.0 | % | $ | 705,771 | 100.0 | % | ||||||||||||||||||||||||||||||||||
Case reserves are established for individual claims that have been reported to us. We are notified of losses by our insureds or their agents or our brokers. Based on the information provided, we establish case reserves by estimating the ultimate losses from the claim, including defense costs associated with the ultimate settlement of the claim. Our claims department personnel use their knowledge of the specific claim along with advice from internal and external experts, including underwriters and legal counsel, to estimate the expected ultimate losses. In limited circumstances, we utilize the services of TPAs to assist in the adjustment of claims. Our internal claims managers oversee TPA activities and monitor their individual claim handling activities to our prescribed standards.
Our IBNR reserves are developed in accordance with Actuarial Standards of Practice promulgated by the American Academy of Actuaries. Our reserve review is performed by our Reserve Committee that utilizes several accepted loss reserving methods to arrive at our best estimate of loss reserves. We give consideration to the relative strengths and weaknesses of each of the methods in deriving our actuarial best estimate of the liabilities. Where we have limited years of loss experience compared to the period over which we expect losses to be reported, we use industry and/or peer-group data in addition to our own data as a basis for selecting the parameters underlying our reserving methods. We monitor loss emergence daily. We carefully consider other internal or external factors such as underwriting, claims handling, economic, or environmental changes that could adversely affect the accuracy of the assumptions underlying our standard actuarial methods and when necessary we will adjust these assumptions, methods, and/or procedures to ensure that they appropriately reflect these changing conditions. The duration of loss reserves was 2.3 years as of December 31, 2023.
Our Reserve Committee includes our Chief Actuary, Chief Risk Officer, Chief Financial Officer and Chief Claims Officer. The Reserve Committee meets quarterly to review the actuarial reserving recommendations made by the Chief Actuary and uses their best judgment to determine the best estimate to be recorded for the reserve for losses and LAE on our balance sheet. In establishing the quarterly actuarial recommendation for the reserves for losses and LAE, our actuary estimates an initial expected ultimate loss ratio for each of our underwriting divisions. Input from our underwriting and claims departments, including premium pricing assumptions and historical experience, is considered by our actuary in estimating the initial expected loss ratios. Multiple actuarial methods are used to estimate the reserve for losses and LAE. These methods utilize, to varying degrees, the initial expected loss ratio, detailed statistical analysis of past claims reporting
48
and payment patterns, claims frequency and severity, paid loss experience, industry loss experience, and changes in market conditions, policy forms, exclusions, and exposures. The actuarial methods used to estimate losses and LAE reserves are:
•Reported and/or Paid Loss Development Methods — Ultimate losses are estimated based on historical reported and/or paid loss reporting patterns. Reported losses are the sum of paid and case losses. Industry development patterns are substituted for historical development patterns when sufficient historical data is not available.
•Reported Bornhuetter-Ferguson Methods — Ultimate losses are estimated as the sum of cumulative reported losses and estimated IBNR losses. IBNR losses are estimated based on historical development patterns and one or more of the following: expected average severity and estimated ultimate claims counts, expected pure premium, and expected loss ratios underlying our loss cost multipliers.
•Paid Bornhuetter-Ferguson Method — Under this method, ultimate losses are estimated as the sum of cumulative paid losses and estimated unpaid losses. Unpaid losses are estimated based on the expected loss ratios underlying our loss cost multipliers, and selected industry development patterns of paid losses.
We utilize each of these methods in our comprehensive review of reserves. When evaluating reserves related to less mature policy years, we utilize the Bornhuetter-Ferguson Method as the primary method for our ultimate loss indications. As we move to more mature policy years, we transition to the Reported and/or Paid Loss Development Methods. We primarily rely on reported methods where case reserving is consistently applied across policy years, however, when there is a change in reserving philosophy we will blend both reported and paid methods in our evaluation of ultimate loss indications.
Our reserves are driven by several important factors, including litigation and regulatory trends, legislative activity, climate change, social and economic patterns and claims inflation assumptions. Our reserve estimates reflect current inflation in legal claims’ settlements and assume we will not be subject to losses from significant new legal liability theories. Our reserve estimates assume that there will not be significant changes in the regulatory and legislative environment. The impact of potential changes in the regulatory or legislative environment is difficult to quantify in the absence of specific, significant new regulation or legislation. In the event of significant new regulation or legislation, we will attempt to quantify its impact on our business, but no assurance can be given that our attempt to quantify such inputs will be accurate or successful.
Although we believe that our reserve estimates are reasonable, it is possible that our actual loss experience may not conform to our assumptions. Specifically, our actual ultimate loss ratio could differ from our initial expected loss ratio or our actual reporting and payment patterns could differ from our expected reporting and payment patterns, which are based on our own data and industry data. Accordingly, the ultimate settlement of losses and the related LAE may vary significantly from the estimates included in our financial statements. We regularly review our estimates and adjust them as necessary as experience develops or as new information becomes known to us. Such adjustments are included in the results of current operations.
The amount by which estimated losses differ from those originally reported for a period is known as “development.” Development is unfavorable when the losses ultimately settle for more than the amount reserved or subsequent estimates indicate a basis for reserve increases on unresolved claims. Development is favorable when losses ultimately settle for less than the amount reserved or subsequent estimates indicate a basis for reducing loss reserves on unresolved claims. We reflect favorable or unfavorable development of loss reserves in the results of operations in the period the estimates are changed.
A 5% change in net IBNR would result in a $27.0 million change in our reserves for losses and LAE and a $21.3 million change in net income and stockholders’ equity.
Recent Accounting Pronouncements
We currently qualify as an “emerging growth company” under the Jumpstart Our Business Startups Act of 2012, or the JOBS Act. Accordingly, we are provided the option to adopt new or revised accounting guidance either (i) within the same periods as those otherwise applicable to non-emerging growth companies or (ii) within the same time periods as private companies. We have elected to avail ourselves of this extended transition period and, as a result, we will not be required to adopt new or revised accounting standards on the relevant dates on which adoption of such standards is required for other public companies.
We will remain an emerging growth company until the earliest of (i) the last day of the fiscal year in which we have total annual gross revenues of $1.235 billion or more; (ii) the last day of our fiscal year following the fifth anniversary of the date of the completion of this offering; (iii) the date on which we have issued more than $1 billion in nonconvertible debt during the previous three years; and (iv) the date on which we are deemed to be a large accelerated filer under the rules of the SEC.
49
In June 2016, the FASB issued ASU 2016-13, Measurement of Credit Losses on Financial Instruments (Topic 326). ASU 2016-13 requires organizations to estimate credit losses on certain types of financial instruments, including receivables and available-for-sale debt securities, by introducing an approach based on expected losses. The expected loss approach will require entities to incorporate considerations of historical information, current information, and reasonable and supportable forecasts. The Company adopted ASU 2016-13 effective January 1, 2023 using the modified retrospective approach, by which a cumulative-effect adjustment was made to retained earnings as of the date of adoption. In connection with the adoption of ASU 2016-13, the Company elected the fair value option in accounting for mortgage loans effective January 1, 2023 as targeted transition relief. The adoption of ASU 2016-13 resulted in the Company recognizing an increase in the allowance for uncollectible reinsurance of $2.3 million and an increase, net of tax, in accumulated deficit of $2.3 million.
In November 2023, the FASB issued ASU 2023-07, Improvements to Reportable Segment Disclosures (Topic 280). ASU 2023-07 requires segment disclosures for (i) significant segment expenses that are regularly provided to the chief operating decision maker (“CODM”), (ii) how the CODM uses the reported measure(s) of segment profitability in assessing segment performance and resource allocation and (iii) the title and position of the CODM. This update states that entities with a single reportable segment are required to provide full segment disclosures. The guidance is effective for fiscal years beginning after December 15, 2023, and interim periods within fiscal years beginning after December 15, 2024. This update is applied retrospectively to all prior periods presented. We are evaluating the effect of the amendments on our consolidated financial statements.
In December 2023, the FASB issued ASU 2023-09, Improvements to Income Tax Disclosures (Topic 740). ASU 2023-09 requires public companies, on an annual basis, provide enhanced rate reconciliation disclosures, including disclosures of specific categories and additional information that meet a quantitative threshold. This update also requires public companies to, among other things, disaggregate income taxes paid by federal, state and foreign taxes. The guidance is effective for fiscal years beginning after December 15, 2024. The Company is evaluating the effect of the amendments on its consolidated financial statements.
Item 7A. Quantitative and Qualitative Disclosures About Market Risk
Qualitative and Quantitative Disclosures about Market Risk are included in Item 7 of this Form 10-K under “Investments—Market Risk.”
50
Item 8. Financial Statements
Report of Independent Registered Public Accounting Firm
To the Stockholders and the Board of Directors of Skyward Specialty Insurance Group, Inc.
Opinion on the Financial Statements
We have audited the accompanying consolidated balance sheets of Skyward Specialty Insurance Group, Inc. and subsidiaries (the Company) as of December 31, 2023 and 2022, the related consolidated statements of operations and comprehensive income (loss), stockholders’ equity and cash flows for each of the two years in the period ended December 31, 2023, and the related notes and financial statement schedules listed in the Index at Item 15 (collectively referred to as the “consolidated financial statements”). In our opinion, the consolidated financial statements present fairly, in all material respects, the financial position of the Company at December 31, 2023 and 2022, and the results of its operations and its cash flows for each of the two years in the period ended December 31, 2023, in conformity with U.S. generally accepted accounting principles.
Basis for Opinion
These financial statements are the responsibility of the Company's management. Our responsibility is to express an opinion on the Company’s financial statements based on our audits. We are a public accounting firm registered with the Public Company Accounting Oversight Board (United States) (PCAOB) and are required to be independent with respect to the Company in accordance with the U.S. federal securities laws and the applicable rules and regulations of the Securities and Exchange Commission and the PCAOB.
We conducted our audits in accordance with the standards of the PCAOB. Those standards require that we plan and perform the audit to obtain reasonable assurance about whether the financial statements are free of material misstatement, whether due to error or fraud. The Company is not required to have, nor were we engaged to perform, an audit of its internal control over financial reporting. As part of our audits we are required to obtain an understanding of internal control over financial reporting but not for the purpose of expressing an opinion on the effectiveness of the Company’s internal control over financial reporting. Accordingly, we express no such opinion.
Our audits included performing procedures to assess the risks of material misstatement of the financial statements, whether due to error or fraud, and performing procedures that respond to those risks. Such procedures included examining, on a test basis, evidence regarding the amounts and disclosures in the financial statements. Our audits also included evaluating the accounting principles used and significant estimates made by management, as well as evaluating the overall presentation of the financial statements. We believe that our audits provide a reasonable basis for our opinion.
| /s/ Ernst & Young LLP | ||
| We have served as the Company’s auditor since 2021. | ||
| Houston, Texas | ||
April 1, 2024 | ||
51
SKYWARD SPECIALTY INSURANCE GROUP, INC. AND SUBSIDIARIES
CONSOLIDATED BALANCE SHEETS
| December 31, | ||||||||||||||
| ($ in thousands, except share and per share amounts) | 2023 | 2022 | ||||||||||||
| Assets | ||||||||||||||
| Investments: | ||||||||||||||
Fixed maturity securities, available-for-sale, at fair value (amortized cost of $ | $ | $ | ||||||||||||
Fixed maturity securities, held-to-maturity, at amortized cost (net of allowance for credit losses of $ | ||||||||||||||
| Equity securities, at fair value | ||||||||||||||
Mortgage loans (at fair value as of December 31, 2023; at amortized cost as of December 31, 2022) | ||||||||||||||
| Other long-term investments | ||||||||||||||
| Short-term investments, at fair value | ||||||||||||||
| Total investments | ||||||||||||||
| Cash and cash equivalents | ||||||||||||||
| Restricted cash | ||||||||||||||
| Premiums receivable, net | ||||||||||||||
| Reinsurance recoverables, net | ||||||||||||||
| Ceded unearned premium | ||||||||||||||
| Deferred policy acquisition costs | ||||||||||||||
| Deferred income taxes, net | ||||||||||||||
| Goodwill and intangible assets, net | ||||||||||||||
| Other assets | ||||||||||||||
| Total assets | $ | $ | ||||||||||||
| Liabilities and stockholders’ equity | ||||||||||||||
| Liabilities: | ||||||||||||||
| Reserves for losses and loss adjustment expenses | $ | $ | ||||||||||||
| Unearned premiums | ||||||||||||||
| Deferred ceding commission | ||||||||||||||
| Reinsurance and premium payables | ||||||||||||||
| Funds held for others | ||||||||||||||
| Accounts payable and accrued liabilities | ||||||||||||||
| Notes payable | ||||||||||||||
| Subordinated debt, net of debt issuance costs | ||||||||||||||
| Total liabilities | ||||||||||||||
| Stockholders’ equity: | ||||||||||||||
Series A preferred stock, $ | ||||||||||||||
Common stock, $ | ||||||||||||||
Treasury stock, $ | ( | |||||||||||||
| Additional paid-in capital | ||||||||||||||
| Stock notes receivable | ( | ( | ||||||||||||
| Accumulated other comprehensive loss | ( | ( | ||||||||||||
| Accumulated deficit | ( | ( | ||||||||||||
| Total stockholders’ equity | ||||||||||||||
| Total liabilities and stockholders’ equity | $ | $ | ||||||||||||
The accompanying notes are an integral part of these consolidated financial statements.
52
SKYWARD SPECIALTY INSURANCE GROUP, INC. AND SUBSIDIARIES
CONSOLIDATED STATEMENTS OF OPERATIONS AND COMPREHENSIVE INCOME (LOSS)
| Years Ended December 31, | ||||||||||||||
| 2023 | 2022 | |||||||||||||
| ($ in thousands, except share and per share amounts) | ||||||||||||||
| Revenues: | ||||||||||||||
| Net earned premiums | $ | $ | ||||||||||||
| Commission and fee income | ||||||||||||||
| Net investment income | ||||||||||||||
| Net investment gains (losses) | ( | |||||||||||||
| Other (loss) income | ( | |||||||||||||
| Total revenues | ||||||||||||||
| Expenses: | ||||||||||||||
| Losses and loss adjustment expenses | ||||||||||||||
| Underwriting, acquisition and insurance expenses | ||||||||||||||
| Interest expense | ||||||||||||||
| Amortization expense | ||||||||||||||
| Other expenses | ||||||||||||||
| Total expenses | ||||||||||||||
| Income before income taxes | ||||||||||||||
| Income tax expense | ||||||||||||||
| Net income | ||||||||||||||
| Net income attributable to participating securities | ||||||||||||||
| Net income attributable to common shareholders | $ | $ | ||||||||||||
| Comprehensive income: | ||||||||||||||
| Net income | $ | $ | ||||||||||||
| Other comprehensive income (loss): | ||||||||||||||
| Unrealized gains and losses on investments: | ||||||||||||||
| Net change in unrealized gains (losses) on investments, net of tax | ( | |||||||||||||
| Reclassification adjustment for (losses) gains on securities no longer held, net of tax | ( | |||||||||||||
| Total other comprehensive income (loss) | ( | |||||||||||||
| Comprehensive income (loss) | $ | $ | ( | |||||||||||
| Per share data: | ||||||||||||||
| Basic earnings per share | $ | $ | ||||||||||||
| Diluted earnings per share | $ | $ | ||||||||||||
| Weighted-average common shares outstanding | ||||||||||||||
| Basic | ||||||||||||||
| Diluted | ||||||||||||||
The accompanying notes are an integral part of these consolidated financial statements.
53
SKYWARD SPECIALTY INSURANCE GROUP, INC. AND SUBSIDIARIES
CONSOLIDATED STATEMENTS OF STOCKHOLDERS’ EQUITY
| ($ in thousands) | 2023 | 2022 | ||||||||||||
| Preferred Stock: | ||||||||||||||
| Balance at beginning of year | $ | $ | ||||||||||||
| Preferred stock conversion to common shares | ( | |||||||||||||
| Balance at end of year | $ | $ | ||||||||||||
| Common Stock: | ||||||||||||||
| Balance at beginning of year | $ | $ | ||||||||||||
| Issuance of common stock | ||||||||||||||
| Preferred stock conversion to common shares | ||||||||||||||
| Proceeds from equity offerings, net | ||||||||||||||
| Balance at end of year | $ | $ | ||||||||||||
| Treasury Stock: | ||||||||||||||
| Balance at beginning of year | $ | ( | $ | ( | ||||||||||
| Preferred stock conversion to common shares | ||||||||||||||
| Balance at end of year | $ | $ | ( | |||||||||||
| Additional Paid-In Capital: | ||||||||||||||
| Balance at beginning of year | $ | $ | ||||||||||||
| Issuance of common stock | ||||||||||||||
| Preferred stock conversion to common shares | ( | |||||||||||||
| Proceeds from equity offerings, net | ||||||||||||||
| Balance at end of year | $ | $ | ||||||||||||
| Stock Notes Receivable: | ||||||||||||||
| Balance at beginning of year | $ | ( | $ | ( | ||||||||||
| Employee equity transactions | ||||||||||||||
| Balance at end of year | $ | ( | $ | ( | ||||||||||
| Accumulated Other Comprehensive Loss: | ||||||||||||||
| Balance at beginning of year | $ | ( | $ | |||||||||||
| Other comprehensive income (loss), net of tax | ( | |||||||||||||
| Balance at end of year | $ | ( | $ | ( | ||||||||||
| Accumulated Deficit: | ||||||||||||||
| Balance at beginning of year | $ | ( | $ | ( | ||||||||||
| ( | ||||||||||||||
| Net income | ||||||||||||||
| Balance at end of year | $ | ( | $ | ( | ||||||||||
| Total Stockholders’ Equity | $ | $ | ||||||||||||
The accompanying notes are an integral part of these consolidated financial statements.
54
SKYWARD SPECIALTY INSURANCE GROUP, INC. AND SUBSIDIARIES
CONSOLIDATED STATEMENTS OF CASH FLOWS
| Years Ended December 31, | ||||||||||||||
| ($ in thousands) | 2023 | 2022 | ||||||||||||
| Cash flows from operating activities: | ||||||||||||||
| Net income | $ | $ | ||||||||||||
| Adjustments to reconcile net income to net cash provided by (used in) operating activities: | ||||||||||||||
| Net investment (gains) losses | ( | |||||||||||||
| Depreciation and amortization expense | ||||||||||||||
| Stock-based compensation expense | ||||||||||||||
| Undistributed loss (earnings) from long-term investments | ( | |||||||||||||
| Deferred income tax, net | ||||||||||||||
| Changes in operating assets and liabilities: | ||||||||||||||
| Premiums receivable, net | ( | ( | ||||||||||||
| Reinsurance recoverables, net | ( | ( | ||||||||||||
| Ceded unearned premium | ( | ( | ||||||||||||
| Deferred policy acquisition costs | ( | ( | ||||||||||||
| Federal income taxes | ( | |||||||||||||
| Losses and loss adjustment expenses | ||||||||||||||
| Unearned premiums | ||||||||||||||
| Deferred ceding commission | ( | |||||||||||||
| Reinsurance and premium payables | ( | |||||||||||||
| Funds held for others | ||||||||||||||
| Accounts payable and accrued liabilities | ||||||||||||||
| Other, net | ( | |||||||||||||
| Net cash provided by operating activities | ||||||||||||||
| Cash flows from investing activities: | ||||||||||||||
| Purchase of fixed maturity securities, available-for-sale | ( | ( | ||||||||||||
| Purchase of illiquid investments | ( | ( | ||||||||||||
| Purchase of equity securities | ( | ( | ||||||||||||
| Purchase of intangible assets | ( | |||||||||||||
| Investment in direct and indirect loans | ( | |||||||||||||
| Purchase of property and equipment | ( | ( | ||||||||||||
| Sales and maturities of investment securities | ||||||||||||||
| Sales of and distributions from unconsolidated subsidiaries | ||||||||||||||
| Change in short-term investments | ( | |||||||||||||
| Payable for securities sold | ||||||||||||||
| Cash provided by deposit accounting | ||||||||||||||
| Net cash used in investing activities | ( | ( | ||||||||||||
| Cash flows from financing activities: | ||||||||||||||
| Employee share purchases | ||||||||||||||
| Draw on revolving line of credit | ||||||||||||||
| Repayment of term loan | ( | |||||||||||||
| Proceeds from equity offerings | ||||||||||||||
| Proceeds from employee stock purchase plan | ||||||||||||||
| Net cash provided by financing activities | ||||||||||||||
| Net (decrease) increase in cash and cash equivalents and restricted cash | ( | |||||||||||||
| Cash and cash equivalents and restricted cash at beginning of year* | ||||||||||||||
| Cash and cash equivalents and restricted cash at end of year* | $ | $ | ||||||||||||
| Supplemental disclosure of cash flow information: | ||||||||||||||
| Cash paid for interest | $ | $ | ||||||||||||
| Cash paid for federal income taxes | $ | $ | ||||||||||||
| *the sum of cash and cash equivalents and restricted cash from the consolidated balance sheets | ||||||||||||||
The accompanying notes are an integral part of these consolidated financial statements.
55
SKYWARD SPECIALTY INSURANCE GROUP, INC. AND SUBSIDIARIES
NOTES TO CONSOLIDATED FINANCIAL STATEMENTS
1. Summary of Significant Accounting Policies
A.Description of Business
Skyward Specialty Insurance Group, Inc. (the “Company”), an insurance holding company, is a Delaware corporation that was organized in 2006. It is a specialty insurance company operating in one segment delivering commercial property and casualty products insurance coverages through its underwriting divisions.
The Company has four wholly owned insurance company subsidiaries based in the United States:
•Houston Specialty Insurance Company (“HSIC”) underwrites insurance on a non-admitted basis.
•Imperium Insurance Company (“IIC”), a subsidiary of HSIC, underwrites insurance on an admitted basis
•Great Midwest Insurance Company (“GMIC”), a subsidiary of IIC, underwrites insurance on an admitted basis and is a certified surety bond company listed with the U.S. Department of the Treasury.
•Oklahoma Specialty Insurance Company (“OSIC”), a subsidiary of GMIC, underwrites insurance on a non-admitted basis.
The Company has a wholly owned captive reinsurance company subsidiary, Skyward Re, that is domiciled in the Cayman Islands and assumes net reserves for certain divisions, related to a retroactive reinsurance contract, from the Company’s insurance companies and retrocedes the net reserves to a third-party reinsurer.
The Company has two non-risk bearing wholly owned subsidiaries, (i) Skyward Underwriters Agency, Inc. (“SUA”) is a managing general insurance agent and reinsurance broker for property and casualty risks in specialty niche markets, and (ii) Skyward Service Company provides various administrative services to the Company’s subsidiaries.
B. Basis of Presentation
The Company’s consolidated financial statements have been prepared in accordance with generally accepted accounting principles in the United States of America (“GAAP”), which differ in some respects from those followed in reports to insurance regulatory authorities. The consolidated financial statements includes the accounts of the holding company and its subsidiaries. All intercompany transactions and balances have been eliminated in consolidation.
The preparation of the consolidated financial statements in conformity with GAAP requires the Company to make estimates and assumptions that affect amounts reported in the consolidated financial statements and accompanying notes. The Company’s actual results could differ from those estimates.
C. Cash and Cash Equivalents
Cash and cash equivalents include cash on hand and fixed maturity securities with original maturities of three months or less. The carrying value of the Company’s cash and cash equivalents approximates fair value.
D. Restricted Cash
Cash with a legal restriction on withdrawal or use by the consolidated group is recorded as restricted cash. The carrying value of the Company’s restricted cash approximates fair value.
SUA collects premiums from clients, and after deducting commissions and any applicable fees, remits these premiums to the Company’s insurance companies, or to third-party insurance companies. SUA holds unremitted insurance premiums in a fiduciary capacity to third-party insurance companies, as restricted cash.
The Company is required by state regulations to maintain assets on deposit with certain states and hold cash as collateral for certain reinsurance balances. Cash held in a depository account for others, or restricted by a state, is recorded as restricted cash.
E. Investments
Available for Sale
Investments in fixed maturities that are classified as available-for-sale are carried at fair value. For available-for-sale fixed maturities in an unrealized loss position, the Company first determines whether there is an intent to sell the security or if it is more likely than not that the Company will be required to sell the security before maturity or recovery of its cost basis. If either of these criteria were met, the amortized cost of the security is written down to fair value with the losses
56
SKYWARD SPECIALTY INSURANCE GROUP, INC. AND SUBSIDIARIES
NOTES TO CONSOLIDATED FINANCIAL STATEMENTS
recognized in net investment gains on the consolidated statements of operations. If neither of the these criteria were met, the Company determines whether unrealized losses are due to credit-related factors. If the unrealized losses are due to credit-related factors, an allowance for credit losses is determined using a present value of cash flows compared to the amortized cost of the security.
The allowance for credit losses is limited to the amount by which fair value is below amortized cost. Changes in the allowance for credit losses are recognized in net investment income on the consolidated statements of operations. Credit losses that are limited by the fair value of the security are recognized in stockholders’ equity, net of taxes, as a component of accumulated other comprehensive loss. Unrealized losses that are not credit-related continue to be recognized in stockholders’ equity, net of taxes, as a component of accumulated other comprehensive loss.
Held to maturity
Investments in fixed maturity securities that are held-to-maturity are carried at amortized cost net of an allowance for credit losses. The allowance for credit losses represents the current estimate of expected credit losses. The Company develops a historical loss rate from Moody’s multi-year cumulative loss rates for asset backed securities. The historical loss rate is adjusted for current conditions and reasonable and supportable forecasts. Changes in the allowance for credit losses are recognized in net investment income on the consolidated statements of operations.
Other-than-Temporary Impairments
Prior to the adoption of ASU 2016-13, Measurement of Credit Losses on Financial Instruments (Topic 326), on January 1, 2023, the Company evaluated declines in the market value of invested assets below amortized cost, for other-than-temporary impairment losses, on a quarterly basis. Impairment losses for declines in the value of its fixed maturity securities below amortized cost attributable to issuer-specific events were based on all relevant facts and circumstances for each investment and were recognized when appropriate. For all investments with unrealized losses due to market conditions or industry-related events where the Company did not had intent to sell the security and it had the ability to hold the investment for either a period of time sufficient to allow a market recovery or to maturity, declines in value below cost were not assumed to be other-than-temporary. When the Company considered the impairment of the value of an investment to be other-than-temporary, it reported the decrease in value in net income within the consolidated statements of operations and a corresponding reduction in carrying value on the consolidated balance sheet.
Equity securities with a readily determinable fair value
Equity securities consists of common stock or preferred stock. Mutual funds, including those that invest mostly in debt securities, are classified as equity securities. Investments in equity securities with a readily determinable fair value are carried on the balance sheet at fair value using quoted market prices. Changes in the carrying value of equity securities are included in net investment gains (losses) within the consolidated statements of operations.
Mortgage loans
Investments in mortgage loans are classified as held for investment and carried on the balance sheet at cost adjusted for unamortized premiums, discounts and loan fees. When an amount is determined to be uncollectible, the Company writes off the uncollectible amount in the period it was determined to be uncollectible. Interest on the loans is recognized as interest receivable which the Company includes in other assets on the consolidated balance sheet.
The Company elected the fair value option in accounting for mortgage loans effective January 1, 2023 as targeted transition relief from the adoption of ASU 2016-13. Under the fair value option, mortgage loans are measured at fair value, and changes in unrealized gains and losses on mortgage loans are reported in net investment gains (losses) on the condensed consolidated statements of operations. Interest income and amortization continue to be recognized in net investment income on the consolidated statements of operations.
Other long-term investments
Other long-term investments include investments in equity and equity securities of non-public entities and indirect investments in loans and loan collateral.
The Company has equity investments in certain limited partnerships and corporations where it has significant influence but not control. The analysis of entities that are variable interest entities indicated the Company is not the primary
57
SKYWARD SPECIALTY INSURANCE GROUP, INC. AND SUBSIDIARIES
NOTES TO CONSOLIDATED FINANCIAL STATEMENTS
beneficiary, and would not have to consolidate these entities. Equity method is used to account for these investments in unconsolidated subsidiaries. Under the equity method, initial investment is recorded at cost and is subsequently adjusted based on its proportionate share of distributions and net income or loss of the equity method investee. The difference between the cost of an investment and its proportionate share of the underlying equity in net assets recorded on the investee’s books is a component of investment income. The Company amortizes the difference as an adjustment to its pro-rata share of equity method income over the useful life which is based on the underlying asset.
The Company does not have significant influence in its investments in equity securities of non-public entities. When these securities do not have a readily determinable fair value, the Company carries these investments at cost, minus impairment, if any, and changes resulting from observable price changes in orderly transactions for identical or similar investments of the same issuer.
Investments in indirect collateralized loans and loan collateral are held through and accounted for as an ownership interest in an unconsolidated subsidiary. The Company’s ownership interests in unconsolidated subsidiaries consists of investments in entities such as partnerships, joint ventures, and special purpose investment vehicles. The Company has significant influence, but not control of these unconsolidated subsidiaries and uses the equity method to account for these investments.
Short-Term Investments
Short-term investments consist primarily of money market funds and are carried at cost which approximates fair value.
Net Investment Income and Net Realized Gains and Losses
Net investment income consists of interest, dividends and equity in earnings (losses) of unconsolidated subsidiaries net of investment expenses such as investment management expenses. Interest income is recognized on the accrual basis, and dividends as earned at the ex-dividend date. Interest income on mortgage-backed and other asset-backed securities is recognized using the effective-yield method based on estimated principal repayments. Included in interest income is the amortization of premium and accretion of discounts on debt securities.
Net realized gains and losses on investments are recognized in net income based upon the specific identification method.
F. Reinsurance
Reinsurance Accounting
In the normal course of business, the Company purchases prospective reinsurance for certain lines of business on a proportional, excess of loss and facultative basis. Proportional reinsurance requires the Company to share the losses and expenses with the reinsurer in exchange for a share of the premiums. Excess of loss reinsurance shares losses, either a proportion of or in its entirety, above a certain dollar threshold, in exchange for a negotiated cost. Facultative reinsurance covers specific risks and/or policies on either a proportional or excess of loss basis.
Ceded unearned premium and reinsurance balances recoverable—on paid and unpaid losses and settlement expenses—are reported separately as assets, instead of netting them with the related liabilities, since reinsurance does not relieve the Company of its legal liability to its policyholders. Reinsurance on unpaid losses and settlement expenses represent estimates of the portion of the liabilities recoverable from reinsurers. On the Consolidated Statements of Operations, net earned premiums, losses and loss adjustment expenses, net and underwriting, acquisition and insurance expenses are presented net of reinsurance ceded.
The Company purchases retroactive reinsurance on certain lines of business in the form of loss portfolio transfers (“LPT”) and adverse development covers. These contracts provide indemnification of losses related to past loss events where the reinsurer shares losses, either a proportion of or in its entirety, depending on certain dollar thresholds. Income generated from retroactive reinsurance contracts is deferred and amortized into net income over the settlement period and losses are charged to net income immediately. Subsequent changes in the measurement of the retroactive reinsurance contract are accounted for under a full retrospective method.
58
SKYWARD SPECIALTY INSURANCE GROUP, INC. AND SUBSIDIARIES
NOTES TO CONSOLIDATED FINANCIAL STATEMENTS
Deposit Accounting
Certain ceded reinsurance contracts, which management determines do not transfer significant insurance risk, are accounted for using the deposit method of accounting. The evaluation of the transfer of significant insurance risk involves an assessment of both timing risk and underwriting risk. Management may determine that a reinsurance contract does not transfer significant insurance risk if either underwriting risk or timing risk or both are not deemed to have been transferred. For those contracts that transfer only significant timing risk and do not transfer sufficient underwriting risk, a deposit asset is recorded equal to the initial cash outflow under the contract, which will then be offset by cash inflows received from the reinsurers. To the extent cash outflows are expected to differ from expected cash inflows, an accretion rate is established at inception of the contract based on actuarial estimates whereby the deposit accounting asset is increased/decreased to the estimated amount receivable over the contract term. The accretion of the deposit is based on the expected rate of return implied from the estimated cash inflows and outflows under the contract.
Periodically, the Company reassesses the estimated ultimate receivable and the related expected rate of return on the deposit asset. The accretion of the deposit asset, including any changes in accretion resulting from changes in estimated cash flows, are reflected as part of investment income in the Company’s results of operations. Several reinsurance contracts require deposit accounting treatment due to not transferring sufficient underwriting risk. There were no reinsurance contracts that require deposit accounting treatment due to not transferring sufficient timing risk.
Reinsurance Recoverables
Reinsurance recoverables are carried net of an allowance for credit losses. The allowance for credit losses represents the current estimate of expected credit losses. The Company develops a historical loss rate using the A.M. Best impairment rate and rating transition study which provides historical loss data of similarly rated reinsurance companies based on the expected duration of the receivables. The historical loss rate is adjusted for current conditions, reasonable and supportable forecasts and consideration of current economic conditions. Changes in the allowance for credit losses are recognized in underwriting, acquisition and insurance expenses on the consolidated statements of operations.
Reinsurance does not relieve the Company of its legal liability to its policyholders. The Company continuously monitors the financial condition of its reinsurers. As part of its monitoring efforts, the Company reviews the reinsurers’ annual financial statements. The Company also reviews insurance industry developments that may impact the financial condition of its reinsurers.
The Company analyzes the credit risk associated with its reinsurance recoverables by monitoring the financial strength rating of its reinsurers from A.M. Best. It also assesses the adequacy of collateral obtained, where applicable. Should its reinsurers fail to fulfill their obligations, the Company has access to collateral from various reinsurers. As of December 31, 2023 and 2022, reinsurance collateral from reinsurers was $257.5 million and $253.9 million, respectively.
Reinsurance recoverables present potential exposures to individual reinsurers. Everest Reinsurance Co represented 20.4 % and 28.2 % of the Company’s reinsurance recoverable balances at December 31, 2023 and 2022, respectively, and was the only reinsurer that represented 10% or more of the Company’s reinsurance recoverable balances. Its financial strength rating from A.M. Best was A+ at December 31, 2023 and 2022.
G. Concentration of Credit Risk
Other than reinsurance recoverables, financial instruments that potentially subject us to concentrations of credit risk are primarily cash and cash equivalents, restricted cash, investments and premiums receivable.
Cash equivalents and short-term investments include U.S. government securities and money market funds. Investments are diversified throughout many industries and geographic regions. The Company limits the amount of credit exposure with any one financial institution or issuer and believes no significant concentration of credit risk exists with respect to cash and investments. As of December 31, 2023 and 2022, outstanding premiums receivable are generally diversified due to the large number of entities comprising the Company’s customer base and their dispersion across many different lines of business and geographic regions. Failure by distribution sources to remit premiums could result in premium write-offs and a corresponding loss of income.
59
SKYWARD SPECIALTY INSURANCE GROUP, INC. AND SUBSIDIARIES
NOTES TO CONSOLIDATED FINANCIAL STATEMENTS
H. Deferred Policy Acquisition Costs
Policy acquisition costs consist of commissions and premium taxes that vary with and are directly related to the successful production of new or renewal business. The Company defers policy acquisition costs and related ceding commissions and charge or credit them to earnings in proportion with the premium earned over the life of the policy.
A premium deficiency is recognized if the sum of expected losses, loss adjustment expenses, and unamortized acquisition costs exceed its related unearned premiums. The Company first recognizes a premium deficiency by charging any unamortized acquisition costs to expense to the extent required to eliminate the deficiency. If its premium deficiency is greater than unamortized acquisition costs, it accrues a liability for the excess deficiency. Anticipated investment income is considered in the determination of premium deficiencies. Management performed an analysis and determined no premium deficiency existed as of December 31, 2023 and 2022.
I. Goodwill and Intangible Assets
Goodwill and intangible assets are recorded as a result of a business combination. Goodwill represents the excess of the purchase price over the fair value of the assets acquired and liabilities assumed. The Company reviews its purchase price allocation up to one year subsequent to an acquisition and may make adjustments within the one-year period. The Company amortizes identifiable intangible assets with a finite useful life over the period that the intangible asset is expected to contribute directly or indirectly to its future cash flows; however, it does not amortize indefinite lived intangible assets.
The Company reviews goodwill and identifiable intangible assets for recoverability annually in the fourth quarter or on an interim basis should events or changes in circumstances indicate that a carrying amount may not be recoverable. Based upon this review, the Company did not have any goodwill impairment for the years ended December 31, 2023 and 2022.
J. Property and Equipment
Property and equipment, which is included in other assets on the consolidated balance sheets, is recorded at cost less accumulated depreciation. Depreciation expense is recognized on a straight-line basis for financial statement purposes over periods ranging from to seven years .
K. Leases
Right-of-use (ROU) assets are included in other assets and lease liabilities are included in accounts payable and accrued liabilities on the consolidated balance sheets. For operating leases, the Company determines if a contract contains a lease at inception and recognizes the operating lease ROU assets and lease liabilities based on the present value of the future minimum lease payments at the commencement date. As the Company does not have the interest rate implicit in its leases, it uses its incremental borrowing rate based on the information available at the commencement date in determining the present value of future payments.
Lease agreements may include options to extend or terminate. The options are exercised at the Company’s discretion and are included in operating lease liabilities if it is reasonably certain the option will be exercised. Lease agreements have lease and non-lease components, which are accounted for as a single lease component. Operating lease cost for future minimum lease payments is recognized on a straight-line basis over the lease term. Sublease income is recognized on a straight-line basis over the sublease term.
L. Reserves for Losses and Loss Adjustment Expenses
Reserves for losses and loss adjustment expenses (“LAE”) represent the Company’s best estimate of the ultimate net cost of all reported and unreported losses that are unpaid as of the balance sheet dates. The estimates are based on certain actuarial and other assumptions related to the ultimate cost to settle such claims. Such assumptions are subject to occasional changes due to evolving economic, social and political conditions. Because of the nature of business the Company has historically written, management believes that it has limited exposure to environmental and other toxic tort type claim liabilities. All estimates are periodically reviewed and, as experience develops and new information becomes known, the reserves are adjusted as necessary. Such adjustments are reflected in the results of operations in the period in which they are determined. Due to the inherent uncertainty in estimating reserves for losses and settlement expenses, there can be no assurance that the ultimate liability will not exceed recorded amounts. If actual liabilities do exceed recorded
60
SKYWARD SPECIALTY INSURANCE GROUP, INC. AND SUBSIDIARIES
NOTES TO CONSOLIDATED FINANCIAL STATEMENTS
M. Premiums
The Company earns and recognizes property and casualty and surety premiums on a pro-rata basis over the terms of the policies. The Company earns accident and health premiums as billed, based on census data. Gross premiums written are reduced by ceded premiums from proportional, facultative and excess of loss reinsurance costs for prospective reinsurance. Its premiums receivable includes deferred premiums, which represent installment payments the Company is due from insureds under the payment terms of their policies.
Premiums receivable are carried net of an allowance for credit losses. The allowance for credit losses represents the current estimate of expected credit losses. The Company develops a historical loss rate using historical write-offs and aging of receivables. This historical loss rate is adjusted for current conditions, reasonable and supportable forecasts and our ability to cancel coverage on a policy after premium is considered past due. Changes in the allowance for credit losses are recognized in underwriting, acquisition and insurance expenses on the consolidated statements of operations.
Unearned premiums represent the portion of gross premiums written which is applicable to the unexpired terms of insurance policies or reinsurance contracts in force. Ceded unearned premiums represent the portion of ceded premiums written which is applicable to the unexpired terms of insurance policies or reinsurance contracts in force. These unearned premiums are calculated on a pro-rata basis over the terms of the policies for direct and ceded amounts.
N. Commission and Fee Income
SUA commission revenue
SUA commission revenue is generated from the placement of insurance policies on reinsurance programs through a reinsurance broker which represents the Company’s single performance obligation. Its transaction price is fixed at contract inception and based on a percentage of premiums placed. The Company recognizes 100% of the transaction price as the associated performance obligation is satisfied at the point in time a policy is placed as it has no constraints on revenue.
SUA fee income
SUA fee income is generated from the placement of insurance policies with a third-party insurance company. The Company’s single performance obligation consists of the placement of the policy. Its transaction price is variable at contract inception and based on a percentage of premium based on risk factors that vary every month such as employee census data and worker roles. The Company estimates its transaction price over the life of the policy using the expected value method and recognizes revenue at the point in time the policy is placed. When there are changes in the estimate of variable consideration, it recognizes those changes in the month they occur.
O. Income Taxes
Income tax expense is accrued for the tax effects of transactions reported on the consolidated financial statements, and this provision for income taxes consists of taxes currently due plus deferred taxes resulting from temporary differences between amounts reported for financial statement and income tax purposes. A valuation allowance is established for any deferred tax asset not expected to be realized.
Deferred tax assets and liabilities are measured using enacted tax rates expected to apply to taxable income in the years in which temporary differences are expected to be recovered or settled. The effect on deferred tax assets and liabilities from a change in tax rates is recognized in income in the period that includes the enactment date.
A liability for uncertain tax positions is recorded where it is more likely-than-not that the tax position will not be sustained upon examination by the appropriate tax authority. Changes in the liability for uncertain tax positions are reflected in income tax expense in the period when a new uncertain tax position arises, judgment changes about the likelihood of an uncertainty, the tax issue is settled, or the statute of limitation expires. Any potential net interest income or expense and penalties related to uncertain tax positions are recorded on the Consolidated Statements of Operations.
The Company files a consolidated federal income tax return in the United States and certain other state tax returns. Its admitted insurance subsidiaries pay premium taxes on gross written premiums in lieu of most state income or franchise
61
SKYWARD SPECIALTY INSURANCE GROUP, INC. AND SUBSIDIARIES
NOTES TO CONSOLIDATED FINANCIAL STATEMENTS
taxes. Premium tax expense is recognized within underwriting, acquisition and insurance expense on the Consolidated Statements of Operations.
P. Fair Value of Financial Instruments
Fair value is estimated for each class of financial instrument based on the framework established in the fair value accounting guidance. This guidance requires an entity to maximize the use of observable inputs and minimize the use of unobservable inputs when measuring fair value. Fair value hierarchy disclosures are based on the quality of inputs used to measure fair value. The hierarchy gives the highest priority to unadjusted quoted prices in active markets for identical assets or liabilities (Level 1 measurements) and the lowest priority to unobservable inputs (Level 3 measurements).
As a part of management’s process to determine fair value, the Company utilizes widely recognized, third-party pricing sources to determine the Company’s fair values of financial instruments. The Company has obtained an understanding of the third-party pricing sources’ valuation methodologies and inputs.
See Note 6 for further details regarding fair value disclosures.
Q. Stock-Based Compensation
We expense the estimated fair value of employee stock options and similar awards. We measure compensation cost for awards of equity instruments to employees based on the grant-date fair value of those awards and recognize compensation expense over the service period that the awards are expected to vest. The tax effects related to share-based payments are made through net earnings. See note 18 for further discussion and related disclosures regarding stock-based compensation.
Employee Stock Purchase Plan
R. Earnings Per Share
Basic earnings per share is calculated using the two-class method. Undistributed earnings are allocated to participating securities based on the extent to which each class may share in earnings as if all the earnings for the period have been distributed. Basic earnings per share is calculated by dividing net income attributable to common shareholders by the weighted-average number of common shares outstanding for the period. Common shares, when contingencies, such as vesting requirements, exist and have not been satisfied, are excluded from basic earnings per share.
The Company’s preferred shares participate in dividends and distributions with common stock on an as-converted basis and represent a participating security. Instruments awarded to employees that provide the holder the right to purchase common stock at a fixed price were included as potential common shares, weighted for the portion of the period they were granted, if dilutive.
The Company’s common and preferred shares financed by stock notes are contingently issuable instruments where the holder must return, all or part of, the shares if the stock notes are not paid off. These instruments are excluded from basic and diluted earnings per share when the specified conditions are not met presuming the end of the period is the end of the contingency period. The impact of the contingently issuable instruments on diluted earnings per share was calculated using the treasury stock method and included in the reconciliation of the denominator of the basic and diluted earnings per share computations for the years ended December 31, 2023 and 2022.
Instruments that are convertible into common shares are included in diluted weighted-average common shares outstanding on an if-converted basis based on the legal conversion rate for the respective period, if dilutive. Share-based awards to employees with only service conditions are included as potential common shares, weighted for the portion of the period they are unvested, if dilutive. Share-based awards to employees with performance and service or market conditions are included as potential common shares presuming the end of the period is the end of the contingency period, if dilutive.
When inclusion of common share adjustments increases the earnings per share or reduces the loss per share, the effect on earnings is anti-dilutive, and the diluted net earnings or net loss per share is computed excluding these common share equivalents.
62
SKYWARD SPECIALTY INSURANCE GROUP, INC. AND SUBSIDIARIES
NOTES TO CONSOLIDATED FINANCIAL STATEMENTS
S. Recent Accounting Pronouncements
The Company currently qualifies as an “emerging growth company” under the Jumpstart Our Business Startups Act of 2012, or the JOBS Act. Accordingly, the Company is provided the option to adopt new or revised accounting guidance either (i) within the same periods as those otherwise applicable to non-emerging growth companies or (ii) within the same time periods as private companies.
The Company may elect to adopt new or revised accounting guidance within the same time period as private companies, unless, as indicated below, management determines it is preferable to take advantage of early adoption provisions offered within the applicable guidance.
Recent Accounting Standards Adopted
In June 2016, the FASB issued ASU 2016-13, Measurement of Credit Losses on Financial Instruments (Topic 326). ASU 2016-13 requires organizations to estimate credit losses on certain types of financial instruments, including receivables and available-for-sale debt securities, by introducing an approach based on expected losses. The expected loss approach will require entities to incorporate considerations of historical information, current information, and reasonable and supportable forecasts. The Company adopted ASU 2016-13 effective January 1, 2023 using the modified retrospective approach, by which a cumulative-effect adjustment was made to retained earnings as of the date of adoption. In connection with the adoption of ASU 2016-13, the Company elected the fair value option in accounting for mortgage loans effective January 1, 2023 as targeted transition relief. The adoption of ASU 2016-13 resulted in the Company recognizing an increase in the allowance for uncollectible reinsurance of $2.3 million and an increase, net of tax, in accumulated deficit of $2.3 million.
Recent Accounting Standards Not Yet Adopted
In November 2023, the FASB issued ASU 2023-07, Improvements to Reportable Segment Disclosures (Topic 280). ASU 2023-07 requires segment disclosures for (i) significant segment expenses that are regularly provided to the chief operating decision maker (“CODM”), (ii) how the CODM uses the reported measure(s) of segment profitability in assessing segment performance and resource allocation and (iii) the title and position of the CODM. This update states that entities with a single reportable segment are required to provide full segment disclosures. The guidance is effective for fiscal years beginning after December 15, 2023, and interim periods within fiscal years beginning after December 15, 2024. This update is applied retrospectively to all prior periods presented. The Copmany is evaluating the effect of the amendments on its consolidated financial statements.
In December 2023, the FASB issued ASU 2023-09, Improvements to Income Tax Disclosures (Topic 740). ASU 2023-09 requires public companies, on an annual basis, provide enhanced rate reconciliation disclosures, including disclosures of specific categories and additional information that meet a quantitative threshold. This update also requires public companies to, among other things, disaggregate income taxes paid by federal, state and foreign taxes. The guidance is effective for fiscal years beginning after December 15, 2024. The Company is evaluating the effect of the amendments on its consolidated financial statements.
63
SKYWARD SPECIALTY INSURANCE GROUP, INC. AND SUBSIDIARIES
NOTES TO CONSOLIDATED FINANCIAL STATEMENTS
2. Goodwill and Intangible Assets
The following tables set forth the carrying amount and changes in the balance of goodwill by reporting unit at December 31, 2023 and 2022:
| ($ in thousands) | Accident and Health | Surety | Industry Solutions | Other | Total | |||||||||||||||||||||||||||
| Goodwill | ||||||||||||||||||||||||||||||||
| Gross balance at December 31, 2022 | $ | $ | $ | $ | $ | |||||||||||||||||||||||||||
| Accumulated impairment at December 31, 2022 | ( | ( | ( | |||||||||||||||||||||||||||||
| Net balance at December 31, 2023 | $ | $ | $ | $ | $ | |||||||||||||||||||||||||||
| ($ in thousands) | Accident and Health | Surety | Industry Solutions | Other | Total | |||||||||||||||||||||||||||
| Goodwill | ||||||||||||||||||||||||||||||||
| Gross balance at December 31, 2021 | $ | $ | $ | $ | $ | |||||||||||||||||||||||||||
| Accumulated impairment at December 31, 2021 | ( | ( | ( | |||||||||||||||||||||||||||||
| Net balance at December 31, 2022 | $ | $ | $ | $ | $ | |||||||||||||||||||||||||||
The following tables set forth the carrying amount and changes in the balance of other intangible assets at December 31, 2023 and 2022:
| ($ in thousands) | Agent Relationships | Non-competes | Trademarks | Licenses | Total | |||||||||||||||||||||||||||
| Other Intangible Assets | ||||||||||||||||||||||||||||||||
| Gross balance at December 31, 2022 | $ | $ | $ | $ | $ | |||||||||||||||||||||||||||
| Accumulated amortization at December 31, 2022 | ( | ( | — | — | ( | |||||||||||||||||||||||||||
| Additions | ||||||||||||||||||||||||||||||||
| Amortization | ( | ( | — | ( | ||||||||||||||||||||||||||||
| Net balance at December 31, 2023 | $ | $ | $ | $ | $ | |||||||||||||||||||||||||||
| ($ in thousands) | Agent Relationships | Non-competes | Trademarks | Licenses | Total | |||||||||||||||||||||||||||
| Other Intangible Assets | ||||||||||||||||||||||||||||||||
| Gross balance at December 31, 2021 | $ | $ | $ | $ | $ | |||||||||||||||||||||||||||
| Accumulated amortization at December 31, 2021 | ( | ( | — | — | ( | |||||||||||||||||||||||||||
| Amortization | ( | ( | — | — | ( | |||||||||||||||||||||||||||
| Net balance at December 31, 2022 | $ | $ | $ | $ | $ | |||||||||||||||||||||||||||
The Company’s indefinite lived intangible assets relate to insurance licenses and trademarks. Its finite lived intangible assets, which relate to policy renewals, agency relationships, within agent relationships, and non-compete/exclusivity agreements, within non-competes, have a weighted average useful life of approximately 15 years as of December 31, 2023.
64
SKYWARD SPECIALTY INSURANCE GROUP, INC. AND SUBSIDIARIES
NOTES TO CONSOLIDATED FINANCIAL STATEMENTS
The Company recognized $1.5 million in amortization expense for the years ended December 31, 2023 and 2022. The following table sets forth the estimated future net amortization expense of intangible assets:
| ($ in thousands) | ||||||||
Years Ending December 31, | Amount | |||||||
| 2024 | $ | |||||||
| 2025 | ||||||||
| 2026 | ||||||||
| 2027 | ||||||||
| 2028 | ||||||||
3. Investments
The following tables set forth the amortized cost and the fair value of investments at December 31, 2023 and 2022:
| ($ in thousands) | Gross Amortized Cost | Gross Unrealized Gains | Gross Unrealized Losses | Allowance for Credit Losses | Fair Value | |||||||||||||||||||||||||||
| December 31, 2023 | ||||||||||||||||||||||||||||||||
| Fixed maturity securities, available-for-sale: | ||||||||||||||||||||||||||||||||
| U.S. government securities | $ | $ | $ | ( | $ | $ | ||||||||||||||||||||||||||
| Corporate securities and miscellaneous | ( | |||||||||||||||||||||||||||||||
| Municipal securities | ( | |||||||||||||||||||||||||||||||
| Residential mortgage-backed securities | ( | |||||||||||||||||||||||||||||||
| Commercial mortgage-backed securities | ( | |||||||||||||||||||||||||||||||
| Other asset-backed securities | ( | |||||||||||||||||||||||||||||||
| Total fixed maturity securities, available-for-sale | $ | $ | $ | ( | $ | $ | ||||||||||||||||||||||||||
| Fixed maturity securities, held-to-maturity: | ||||||||||||||||||||||||||||||||
| Other asset-backed securities | $ | $ | $ | ( | $ | ( | $ | |||||||||||||||||||||||||
| Total fixed maturity securities, held-to-maturity | $ | $ | $ | ( | $ | ( | $ | |||||||||||||||||||||||||
| ($ in thousands) | Gross Amortized Cost | Gross Unrealized Gains | Gross Unrealized Losses | Fair Value | ||||||||||||||||||||||
| December 31, 2022 | ||||||||||||||||||||||||||
| Fixed maturity securities, available-for-sale: | ||||||||||||||||||||||||||
| U.S. government securities | $ | $ | $ | ( | $ | |||||||||||||||||||||
| Corporate securities and miscellaneous | ( | |||||||||||||||||||||||||
| Municipal securities | ( | |||||||||||||||||||||||||
| Residential mortgage-backed securities | ( | |||||||||||||||||||||||||
| Commercial mortgage-backed securities | ( | |||||||||||||||||||||||||
| Other asset-backed securities | ( | |||||||||||||||||||||||||
| Total fixed maturity securities, available-for-sale | $ | $ | $ | ( | $ | |||||||||||||||||||||
| Fixed maturity securities, held-to-maturity: | ||||||||||||||||||||||||||
| Other asset-backed securities | $ | $ | $ | ( | $ | |||||||||||||||||||||
| Total fixed maturity securities, held-to-maturity | $ | $ | $ | ( | $ | |||||||||||||||||||||
65
SKYWARD SPECIALTY INSURANCE GROUP, INC. AND SUBSIDIARIES
NOTES TO CONSOLIDATED FINANCIAL STATEMENTS
The amortized cost and estimated fair value of fixed maturity securities, available for sale, at December 31, 2023 by contractual maturity are shown below. Expected maturities may differ from contractual maturities because borrowers have the right to call or prepay obligations with or without call or prepayment penalties. Also, changing interest rates, tax considerations or other factors may result in portfolio sales prior to maturity.
| ($ in thousands) | Amortized Cost | Fair Value | ||||||||||||
| Due in less than one year | $ | $ | ||||||||||||
| Due after one year through five years | ||||||||||||||
| Due after five years through ten years | ||||||||||||||
| Due after ten years | ||||||||||||||
| Mortgage-backed securities | ||||||||||||||
| Other asset-backed securities | ||||||||||||||
| Total | $ | $ | ||||||||||||
The Company’s fixed maturity securities, held to maturity, at December 31, 2023 consist entirely of asset backed securities that are not due at a single maturity date.
The following tables summarize gross unrealized losses and the corresponding fair values of investments, aggregated by length of time that individual securities have been in a continuous unrealized loss position:
| Less than 12 Months | 12 Months or More | Total | ||||||||||||||||||||||||||||||||||||
| ($ in thousands) | Fair Value | Gross Unrealized Losses | Fair Value | Gross Unrealized Losses | Fair Value | Gross Unrealized Losses | ||||||||||||||||||||||||||||||||
| December 31, 2023 | ||||||||||||||||||||||||||||||||||||||
| Fixed maturity securities, available-for-sale: | ||||||||||||||||||||||||||||||||||||||
| U.S. government securities | $ | $ | ( | $ | $ | ( | $ | $ | ( | |||||||||||||||||||||||||||||
| Corporate securities and miscellaneous | ( | ( | ( | |||||||||||||||||||||||||||||||||||
| Municipal securities | ( | ( | ( | |||||||||||||||||||||||||||||||||||
| Residential mortgage-backed securities | ( | ( | ( | |||||||||||||||||||||||||||||||||||
| Commercial mortgage-backed securities | ( | ( | ( | |||||||||||||||||||||||||||||||||||
| Other asset-backed securities | ( | ( | ( | |||||||||||||||||||||||||||||||||||
| Total fixed maturity securities, available-for-sale | ( | ( | ( | |||||||||||||||||||||||||||||||||||
| Fixed maturity securities, held-to-maturity: | ||||||||||||||||||||||||||||||||||||||
| Other asset-backed securities | ( | ( | ||||||||||||||||||||||||||||||||||||
| Total fixed maturity securities, held-to-maturity | ( | ( | ||||||||||||||||||||||||||||||||||||
| Total | $ | $ | ( | $ | $ | ( | $ | $ | ( | |||||||||||||||||||||||||||||
66
SKYWARD SPECIALTY INSURANCE GROUP, INC. AND SUBSIDIARIES
NOTES TO CONSOLIDATED FINANCIAL STATEMENTS
| Less than 12 Months | 12 Months or More | Total | ||||||||||||||||||||||||||||||||||||
| ($ in thousands) | Fair Value | Gross Unrealized Losses | Fair Value | Gross Unrealized Losses | Fair Value | Gross Unrealized Losses | ||||||||||||||||||||||||||||||||
| December 31, 2022 | ||||||||||||||||||||||||||||||||||||||
| Fixed maturity securities, available-for-sale: | ||||||||||||||||||||||||||||||||||||||
| U.S. government securities | $ | $ | ( | $ | $ | ( | $ | $ | ( | |||||||||||||||||||||||||||||
| Corporate securities and miscellaneous | ( | ( | ( | |||||||||||||||||||||||||||||||||||
| Municipal securities | ( | ( | ( | |||||||||||||||||||||||||||||||||||
| Residential mortgage-backed securities | ( | ( | ( | |||||||||||||||||||||||||||||||||||
| Commercial mortgage-backed securities | ( | ( | ( | |||||||||||||||||||||||||||||||||||
| Other asset-backed securities | ( | ( | ( | |||||||||||||||||||||||||||||||||||
| Total fixed maturity securities, available-for-sale | $ | $ | ( | $ | $ | ( | $ | $ | ( | |||||||||||||||||||||||||||||
| Fixed maturity securities, held-to-maturity: | ||||||||||||||||||||||||||||||||||||||
| Other asset-backed securities | $ | $ | ( | $ | $ | $ | $ | ( | ||||||||||||||||||||||||||||||
| Total fixed maturity securities, held-to-maturity | $ | $ | ( | $ | $ | $ | $ | ( | ||||||||||||||||||||||||||||||
| Total | $ | $ | ( | $ | $ | ( | $ | $ | ( | |||||||||||||||||||||||||||||
The Company regularly monitors its available-for-sale fixed maturity securities that have fair values less than cost or amortized cost for signs of impairment, an assessment that requires significant management judgment regarding the evidence known. Such judgments could change in the future as more information becomes known, which could negatively impact the amounts reported. Among the factors that management considers for fixed maturity securities are the financial condition of the issuer including receipt of scheduled principal and interest cash flows, and intent to sell, including if it is more likely than not that the Company will be required to sell the investments before recovery.
As of December 31, 2023, the Company has 584 lots of fixed maturity securities in an unrealized loss position. The Company does not have an intent to sell these securities and it is not more likely than not that the Company will be required to sell these securities before maturity or recovery of its cost basis. The Company determined that no credit impairment existed in the gross unrealized holding losses because the credit ratings of these securities were consistent with the credit ratings when purchased and/or at origination, there were no adverse changes in financial condition of the issuer and no adverse credit quality events in underlying assets. The Company attributed the unrealized losses to the changes in interest rates.
67
SKYWARD SPECIALTY INSURANCE GROUP, INC. AND SUBSIDIARIES
NOTES TO CONSOLIDATED FINANCIAL STATEMENTS
The following table sets forth the components of net investment gains (losses) for the years ended December 31, 2023 and 2022:
| ($ in thousands) | 2023 | 2022 | ||||||||||||
| Gross realized gains | ||||||||||||||
| Fixed maturity securities, available-for-sale | $ | $ | ||||||||||||
| Equity securities | ||||||||||||||
| Other | ||||||||||||||
| Total | ||||||||||||||
| Gross realized losses | ||||||||||||||
| Fixed maturity securities, available-for-sale | ( | ( | ||||||||||||
| Equity securities | ( | ( | ||||||||||||
| Other | ( | ( | ||||||||||||
| Total | ( | ( | ||||||||||||
| Net unrealized gains (losses) on investments | ||||||||||||||
| Equity securities | ( | |||||||||||||
| Mortgage loans | ( | |||||||||||||
| Net investment gains (losses) | $ | $ | ( | |||||||||||
The following table sets forth the proceeds from sales of debt and equity securities for the years ended December 31, 2023 and 2022:
| ($ in thousands) | 2023 | 2022 | ||||||||||||
| Fixed maturity securities, available-for-sale | $ | $ | ||||||||||||
| Equity securities | ||||||||||||||
The following table sets forth the components of net investment income for the years ended December 31, 2023 and 2022:
| ($ in thousands) | 2023 | 2022 | ||||||||||||
| Income: | ||||||||||||||
| Fixed maturity securities, available-for-sale | $ | $ | ||||||||||||
| Fixed maturity securities, held-to-maturity | ||||||||||||||
| Equity securities | ||||||||||||||
| Equity method investments | ( | |||||||||||||
| Mortgage loans | ||||||||||||||
| Indirect loans | ( | |||||||||||||
| Short-term investments | ||||||||||||||
| Other | ( | |||||||||||||
| Investment income | ||||||||||||||
| Investment expenses | ( | ( | ||||||||||||
| Net investment income | $ | $ | ||||||||||||
68
SKYWARD SPECIALTY INSURANCE GROUP, INC. AND SUBSIDIARIES
NOTES TO CONSOLIDATED FINANCIAL STATEMENTS
The following table sets forth the change in net unrealized gains (losses) on the Company’s investment portfolio, net of deferred income taxes, included in other comprehensive income (loss) for the years ended December 31, 2023 and 2022:
| ($ in thousands) | 2023 | 2022 | ||||||||||||
| Fixed maturity securities | $ | $ | ( | |||||||||||
| Deferred income taxes | ( | |||||||||||||
| Total | $ | $ | ( | |||||||||||
Various state regulations require the Company to maintain cash, investment securities or letters of credit on deposit with the states in a depository account. At December 31, 2023 and 2022, cash and investment securities on deposit had fair values of approximately $62.3 million and $60.2 million, respectively.
4. Fair Value Measurements
The Company’s financial instruments include assets and liabilities carried at fair value, as well as assets and liabilities carried at cost or amortized cost but disclosed at fair value in its consolidated financial statements. In determining fair value, the market approach is generally applied, which uses prices and other relevant data based on market transactions involving identical or comparable assets and liabilities.
The Company uses data primarily provided by third-party investment managers or pricing vendors to determine the fair value of its investments. Periodic analyses are performed on prices received from third parties to determine whether the prices are reasonable estimates of fair value. The analyses include a review of month-to-month price fluctuations and, as needed, a comparison of pricing services’ valuations to other pricing services’ valuations for the identical security.
The Company classifies its financial instruments into the following three-level hierarchy:
Level 1 - Inputs are unadjusted, quoted prices for identical assets or liabilities in active markets at the measurement
date.
Level 2 - Inputs are other than quoted prices included in Level 1 that are observable for the asset or liability through
corroboration with market data at the measurement date.
Level 3 - Unobservable inputs that reflect management’s best estimate of what market participants would use in
pricing the asset or liability at the measurement date.
The following methods and assumptions were used in estimating the fair value disclosures for financial instruments in the accompanying consolidated financial statements and in these notes:
U.S. government securities, mutual funds and common stock
The Company uses unadjusted quoted prices for identical instruments in an active exchange to measure fair value which represent Level 1 inputs.
Preferred stocks, municipal securities, corporate securities and miscellaneous
The Company uses a pricing model that utilizes market-based inputs such as trades in an illiquid market for a particular security or trades in active markets for securities with similar characteristics. The model considers other inputs such as benchmark yields, issuer spreads, security terms and conditions, and other market data. These represent Level 2 fair value inputs.
Commercial mortgage-backed securities, residential mortgage-backed securities and other asset-backed securities
The Company uses a pricing model that utilizes market-based inputs that may include dealer quotes, market spreads, and yield curves. It may evaluate individual tranches in a security by determining cash flows using the security’s terms and conditions, collateral performance, credit information benchmark yields and estimated prepayments. These represent Level 2 fair value inputs.
69
SKYWARD SPECIALTY INSURANCE GROUP, INC. AND SUBSIDIARIES
NOTES TO CONSOLIDATED FINANCIAL STATEMENTS
Mortgage loans
Mortgage loans have variable interest rates and are collateralized by real property. The Company determines fair value of mortgage loans using the income approach utilizing inputs that are observable and unobservable (Level 3). The unobservable input consists of the spread applied to a prime rate used to discount cash flows. The spread represents the incremental cost of capital based on the borrower’s ability to make future payments and the value of the collateral relative to the loan balance and is subject to judgement and uncertainty.
The following table sets forth the range and weighted average, weighted by relative fair value, of the spread as of December 31, 2023:
| December 31, 2023 | ||||||||
| High | % | |||||||
| Low | % | |||||||
| Weighted average | % | |||||||
70
SKYWARD SPECIALTY INSURANCE GROUP, INC. AND SUBSIDIARIES
NOTES TO CONSOLIDATED FINANCIAL STATEMENTS
The following tables set forth the Company’s investments within the fair value hierarchy at December 31, 2023 and December 31, 2022:
| December 31, 2023 | ||||||||||||||||||||||||||
| ($ in thousands) | Level 1 | Level 2 | Level 3 | Total | ||||||||||||||||||||||
| Fixed maturity securities, available-for-sale: | ||||||||||||||||||||||||||
| U.S. government securities | $ | $ | $ | $ | ||||||||||||||||||||||
| Corporate securities and miscellaneous | ||||||||||||||||||||||||||
| Municipal securities | ||||||||||||||||||||||||||
| Residential mortgage-backed securities | ||||||||||||||||||||||||||
| Commercial mortgage-backed securities | ||||||||||||||||||||||||||
| Other asset-backed securities | ||||||||||||||||||||||||||
| Total fixed maturity securities, available-for-sale | ||||||||||||||||||||||||||
| Fixed maturity securities, held-to-maturity: | ||||||||||||||||||||||||||
| Other asset-backed securities | ||||||||||||||||||||||||||
| Total fixed maturity securities, held-to-maturity | ||||||||||||||||||||||||||
| Common stocks: | ||||||||||||||||||||||||||
| Consumer discretionary | ||||||||||||||||||||||||||
| Consumer staples | ||||||||||||||||||||||||||
| Energy | ||||||||||||||||||||||||||
| Finance | ||||||||||||||||||||||||||
| Industrial | ||||||||||||||||||||||||||
| Information technology | ||||||||||||||||||||||||||
| Materials | ||||||||||||||||||||||||||
| Other | ||||||||||||||||||||||||||
| Total common stocks | ||||||||||||||||||||||||||
| Preferred stocks: | ||||||||||||||||||||||||||
| Consumer staples | ||||||||||||||||||||||||||
| Finance | ||||||||||||||||||||||||||
| Industrial | ||||||||||||||||||||||||||
| Other | ||||||||||||||||||||||||||
| Total preferred stocks | ||||||||||||||||||||||||||
| Mutual funds: | ||||||||||||||||||||||||||
| Fixed income | ||||||||||||||||||||||||||
| Equity | ||||||||||||||||||||||||||
| Commodity | ||||||||||||||||||||||||||
| Total mutual funds | ||||||||||||||||||||||||||
| Total equity securities | ||||||||||||||||||||||||||
| Mortgage loans | ||||||||||||||||||||||||||
| Short-term investments | ||||||||||||||||||||||||||
| Total investments | $ | $ | $ | $ | ||||||||||||||||||||||
71
SKYWARD SPECIALTY INSURANCE GROUP, INC. AND SUBSIDIARIES
NOTES TO CONSOLIDATED FINANCIAL STATEMENTS
| December 31, 2022 | ||||||||||||||||||||||||||
| ($ in thousands) | Level 1 | Level 2 | Level 3 | Total | ||||||||||||||||||||||
| Fixed maturity securities, available-for-sale: | ||||||||||||||||||||||||||
| U.S. government securities | $ | $ | $ | $ | ||||||||||||||||||||||
| Corporate securities and miscellaneous | ||||||||||||||||||||||||||
| Municipal securities | ||||||||||||||||||||||||||
| Residential mortgage-backed securities | ||||||||||||||||||||||||||
| Commercial mortgage-backed securities | ||||||||||||||||||||||||||
| Other asset-backed securities | ||||||||||||||||||||||||||
| Total fixed maturity securities, available-for-sale | ||||||||||||||||||||||||||
| Fixed maturity securities, held-to-maturity: | ||||||||||||||||||||||||||
| Other asset-backed securities | ||||||||||||||||||||||||||
| Total fixed maturity securities, held-to-maturity | ||||||||||||||||||||||||||
| Common stocks: | ||||||||||||||||||||||||||
| Consumer discretionary | ||||||||||||||||||||||||||
| Consumer staples | ||||||||||||||||||||||||||
| Energy | ||||||||||||||||||||||||||
| Finance | ||||||||||||||||||||||||||
| Industrial | ||||||||||||||||||||||||||
| Information technology | ||||||||||||||||||||||||||
| Materials | ||||||||||||||||||||||||||
| Other | ||||||||||||||||||||||||||
| Total common stocks | ||||||||||||||||||||||||||
| Preferred stocks: | ||||||||||||||||||||||||||
| Consumer staples | ||||||||||||||||||||||||||
| Finance | ||||||||||||||||||||||||||
| Industrial | ||||||||||||||||||||||||||
| Other | ||||||||||||||||||||||||||
| Total preferred stocks | ||||||||||||||||||||||||||
| Mutual funds: | ||||||||||||||||||||||||||
| Fixed income | ||||||||||||||||||||||||||
| Equity | ||||||||||||||||||||||||||
| Commodity | ||||||||||||||||||||||||||
| Total mutual funds | ||||||||||||||||||||||||||
| Total equity securities | ||||||||||||||||||||||||||
| Mortgage loans | ||||||||||||||||||||||||||
| Short-term investments | ||||||||||||||||||||||||||
| Total investments | $ | $ | $ | $ | ||||||||||||||||||||||
72
SKYWARD SPECIALTY INSURANCE GROUP, INC. AND SUBSIDIARIES
NOTES TO CONSOLIDATED FINANCIAL STATEMENTS
The following table sets forth the changes in the fair value of instruments carried at fair value with a Level 3 measurement during the year ended December 31, 2023:
| ($ in thousands) | Mortgage Loans | |||||||
| Balance at December 31, 2022 | $ | |||||||
| Total losses for the period recognized in net investment gains (losses) | ( | |||||||
| Issuances | ||||||||
| Settlements | ( | |||||||
| Balance at December 31, 2023 | $ | |||||||
| Total losses for the period recognized in net investment gains (losses) attributable to the change in unrealized gains or losses relating to assets held as of period end | $ | ( | ||||||
The Company measures certain assets, including investments in indirect loans and loan collateral, equity method investments and other invested assets, at fair value on a nonrecurring basis only when they are deemed to be impaired.
In addition to the preceding disclosures on assets and liabilities recorded at fair value in the consolidated balance sheets, the Company is also required to disclose the fair values of certain other financial instruments for which it is practicable to estimate fair value. Estimated fair value amounts, defined as the quoted market price of a financial instrument, have been determined using available market information and other appropriate valuation methodologies. However, considerable judgements are required in developing the estimates of fair value where quoted market prices are not available. Accordingly, these estimates are not necessarily indicative of the amounts that could be realized in a current market exchange. The use of different market assumptions or estimating methodologies may have an effect on the estimated fair value amounts.
The following methods and assumptions were used in estimating the fair value disclosures of other financial instruments:
Fixed maturity securities, held-to-maturity: Fixed maturity securities, held-to-maturity consists of senior and junior notes with target rates of return. As of December 31, 2023, the Company determined the fair value of these instruments using the income approach utilizing inputs that are unobservable (Level 3).
Notes payable: The carrying value approximates the estimated fair value for notes payable as the notes payable accrue interest at current market rates plus a spread. The Company determines fair value using the income approach utilizing inputs that are observable (Level 2).
73
SKYWARD SPECIALTY INSURANCE GROUP, INC. AND SUBSIDIARIES
NOTES TO CONSOLIDATED FINANCIAL STATEMENTS
The following table sets forth the Company’s carrying and fair values of notes payable and subordinated debt as of December 31, 2023 and December 31, 2022:
| December 31, 2023 | December 31, 2022 | |||||||||||||||||||||||||
| ($ in thousands) | Carrying Value | Fair Value | Carrying Value | Fair Value | ||||||||||||||||||||||
| Notes payable | ||||||||||||||||||||||||||
| Term loan | $ | $ | $ | $ | ||||||||||||||||||||||
| Revolving credit facility | ||||||||||||||||||||||||||
| Notes payable | $ | $ | $ | $ | ||||||||||||||||||||||
| Subordinated debt | ||||||||||||||||||||||||||
| Junior subordinated interest debentures | $ | $ | $ | $ | ||||||||||||||||||||||
| Unsecured subordinated notes | ||||||||||||||||||||||||||
| Subordinated debt, net of debt issuance costs | $ | $ | $ | $ | ||||||||||||||||||||||
5. Mortgage Loans
The Company has invested in Separately Managed Accounts (“SMA1” and “SMA2”), managed by Arena Investors, LP (“Arena”), which is affiliated with The Westaim Corporation (“Westaim”) who is the Company’s largest stockholder. As of December 31, 2023 and 2022, the Company held direct investments in mortgage loans from various creditors through SMA1 and SMA2.
The Company’s mortgage loan portfolios are primarily senior loans on real estate across the U.S. The loans earn interest at a fixed spread above a prime rate, mature in approximately 1 to 3 years from loan origination and the principal amounts of the loans range between 61 % to 90 % of the property’s appraised value at the time the loans were made. Mortgage loan participations are carried at fair value as of December 31, 2023 and cost adjusted for unamortized premiums, discounts, and loan fees as of December 31, 2022.
The carrying value of the Company’s mortgage loans as of December 31, 2023 and 2022 were as follows:
| ($ in thousands) | 2023 | 2022 | ||||||||||||
| Retail | $ | $ | ||||||||||||
| Commercial | ||||||||||||||
| Industrial | ||||||||||||||
| Multi-family | ||||||||||||||
| Office | ||||||||||||||
| Hospitality | ||||||||||||||
| $ | $ | |||||||||||||
74
SKYWARD SPECIALTY INSURANCE GROUP, INC. AND SUBSIDIARIES
NOTES TO CONSOLIDATED FINANCIAL STATEMENTS
The Company’s gross investment income for the years ended December 31, 2023 and 2022 is as follows:
| Years Ended December 31, | ||||||||||||||
| ($ in thousands) | 2023 | 2022 | ||||||||||||
| Retail | $ | $ | ||||||||||||
| Commercial | ||||||||||||||
| Industrial | ||||||||||||||
| Multi-family | ||||||||||||||
| Office | ||||||||||||||
| Hospitality | ||||||||||||||
| $ | $ | |||||||||||||
The uncollectible amounts on loans, on an individual loan basis, are determined based upon consultations and advice from the Company’s specialized investment manager and consideration of any adverse situations that could affect the borrower’s ability to repay, the estimated value of underlying collateral, and other relevant factors. The Company writes off the uncollectible amount in the period it was determined to be uncollectible. There was no write-off for uncollectible amounts for the years ended December 31, 2023 and 2022.
As of December 31, 2023 and 2022, approximately $7.1 million and $6.4 million of mortgage loans, respectively, were in the process of foreclosure. As of December 31, 2023, $6.8 million of mortgage loans were not producing income for the previous 12 months.
6. Other Long-Term Investments
Unconsolidated Subsidiaries - Equity Method Investments
The Company’s ownership interests in most of its equity method investments range from approximately 3% to less than 50% where the Company has significant influence but not control.
The Company owns investment products issued by Arena Special Opportunities Partners (Feeder) I, LP (“Arena SOP”), managed by Arena, which is affiliated with Westaim. The investment products include senior and junior notes issued by the Arena SOP to raise capital from limited partners to fund purchases of investments. The return on the investments is used to pay interest on the senior and junior notes based on target returns of each class. The senior and junior notes are debt securities classified as held to maturity and presented on the balance sheet within fixed maturity securities, held to maturity. Income in excess of return targets on the senior and junior notes is allocated to the investment in Arena SOP.
During the year ended December 31, 2022, the Company entered into an agreement for limited partnership interests in Brewer Lane Ventures Fund II, L.P. During the years ended December 31, 2023 and 2022, the Company invested $0.4 million and $0.2 million, respectively, in Brewer Lane Ventures Fund II, L.P. and $0.9 million and $1.3 million, respectively, in Hudson Ventures Fund 2, LP.
75
SKYWARD SPECIALTY INSURANCE GROUP, INC. AND SUBSIDIARIES
NOTES TO CONSOLIDATED FINANCIAL STATEMENTS
The carrying value of equity method investments at December 31, 2023 and 2022 is as follows:
| ($ in thousands) | 2023 | 2022 | ||||||||||||
| Arena SOP LP units | $ | $ | ||||||||||||
| Arena Special Opportunities Fund, LP units | ||||||||||||||
| Brewer Lane Ventures Fund II LP units | ||||||||||||||
| Dowling Capital Partners LP units | ||||||||||||||
| Hudson Ventures Fund 2 LP units | ||||||||||||||
| JVM Funds LLC units | ||||||||||||||
| RISCOM | ||||||||||||||
| Universa Black Swan LP units | ||||||||||||||
| $ | $ | |||||||||||||
Equity in (loss) income from unconsolidated subsidiaries for the years ended December 31, 2023 and 2022 is summarized as follows:
| ($ in thousands) | 2023 | 2022 | ||||||||||||
| Arena SOP LP units | $ | ( | $ | |||||||||||
| Arena Special Opportunities Fund, LP units | ( | |||||||||||||
| Dowling Capital Partners LP units | ||||||||||||||
| Hudson Ventures Fund 2 LP units | ||||||||||||||
| JVM Funds LLC | ( | ( | ||||||||||||
| RISCOM | ||||||||||||||
| Brewer Lane Ventures Fund II LP | ( | |||||||||||||
| Universa Black Swan LP units | ( | ( | ||||||||||||
| $ | ( | $ | ||||||||||||
The unfunded commitment of equity method investments at December 31, 2023 and 2022 is as follows:
| ($ in thousands) | 2023 | 2022 | ||||||||||||
| Brewer Lane Ventures Fund II LP units | $ | $ | ||||||||||||
| Dowling Capital Partners LP units | ||||||||||||||
| Hudson Ventures Fund 2 LP units | ||||||||||||||
| $ | $ | |||||||||||||
The difference between the cost of an investment and its proportionate share of the underlying equity in net assets is allocated to the various assets and liabilities of the equity method investment. The Company amortizes the difference in net assets over the same useful life of a similar asset as the underlying equity method investment. For investment in RISCOM, a similar asset would be agent relationships which is amortized over a 15 -year useful life.
The following table summarizes the Company’s recorded investment in RISCOM compared to its share of underlying equity as of December 31, 2023 and 2022:
| ($ in thousands) | 2023 | 2022 | ||||||||||||
| Investment in RISCOM: | ||||||||||||||
| Underlying equity | $ | $ | ||||||||||||
| Difference | ||||||||||||||
| Recorded investment balance | $ | $ | ||||||||||||
76
SKYWARD SPECIALTY INSURANCE GROUP, INC. AND SUBSIDIARIES
NOTES TO CONSOLIDATED FINANCIAL STATEMENTS
The Company amortizes the difference in net assets in JVM Funds LLC over the 7 -year estimated useful life of the investment in rental properties.
The following table summarizes the Company’s recorded investment in JVM Funds LLC compared to its share of underlying equity as of December 31, 2023 and 2022:
| ($ in thousands) | 2023 | 2022 | ||||||||||||
| Investment in JVM Funds LLC: | ||||||||||||||
| Underlying equity | $ | $ | ||||||||||||
| Difference | ||||||||||||||
| Recorded investment balance | $ | $ | ||||||||||||
Unconsolidated Subsidiaries - Investment in Bank Holding Companies
The Company carries a $2.0 million investment in Captex Bancshares, a Texas bank holding company, at cost, less impairment or observable changes in price. The Company does not have significant influence over the investee. The Company reviews these investments for impairment or observable changes in price during each reporting period. There was no impairment or observable change in price during the years ended December 31, 2023 and 2022.
Unconsolidated Subsidiaries - Investment in Indirect Loans and Loan Collateral
As of December 31, 2023 and 2022, the Company held indirect investments in collateralized loans and loan collateral through SMA1 and SMA2.
The carrying value of the SMA1 and SMA2 as of December 31, 2023 and 2022 are as follows:
| ($ in thousands) | 2023 | 2022 | ||||||||||||
| SMA1 | $ | $ | ||||||||||||
| SMA2 | ||||||||||||||
| Investment in indirect loans and loan collateral | $ | $ | ||||||||||||
Unconsolidated Subsidiaries - Investment in Trust
The Company carries its investment in the common stock of the Delos Capital Trust n/k/a HIIG Capital Trust I (“Trust”) at cost. The Company does not have significant influence over the investee. There was no impairment or observable change in price during the years ended ended December 31, 2023 and 2022.
See Note 10 for further information on the Trust.
77
SKYWARD SPECIALTY INSURANCE GROUP, INC. AND SUBSIDIARIES
NOTES TO CONSOLIDATED FINANCIAL STATEMENTS
7. Allowance for Credit Losses
Premiums Receivable
The following table sets forth the changes in the allowance for expected credit losses on premiums receivable for the year ended ended December 31, 2023.
| ($ in thousands) | Premiums Receivable, Net | Allowance for Estimated Uncollectible Premiums | ||||||||||||
| Balance at December 31, 2022 | $ | $ | ||||||||||||
| Cumulative effect of adoption of ASU 2016-13 at January 1, 2023 | ||||||||||||||
| Current period change for estimated uncollectible premiums | ||||||||||||||
| Write-offs of uncollectible premiums receivable | ( | |||||||||||||
| Recoveries of amounts previously written off | ||||||||||||||
| Balance at December 31, 2023 | $ | $ | ||||||||||||
Reinsurance Recoverables
The Company analyzes the credit risk associated with its reinsurance recoverables by monitoring the financial strength rating of its reinsurers from A.M. Best, a widely recognized rating agency with an exclusive insurance industry focus. The Company assesses the financial strength rating annually and throughout the year as A.M. Best provides updates on ratings and outlooks. The Company assesses the adequacy of various forms of credit enhancements such as reinsurance payables, letters of credit and funds held. The following table sets forth the Company’s reinsurance recoverables net of credit enhancements by A.M. Best as of December 31, 2023:
| A.M. Best Rating | December 31, 2023 | |||||||
| A- and above | % | |||||||
| B++ to B+ | ||||||||
| B to B - | ||||||||
| Not rated | ||||||||
The Company considers reinsurance balances to be past due when they are 90 days past due. The following table sets forth the changes in the allowance for estimated uncollectible reinsurance for the year ended ended December 31, 2023:
| ($ in thousands) | Reinsurance Recoverables, Net | Allowance for Estimated Uncollectible Reinsurance | ||||||||||||
| Balance at December 31, 2022 | $ | $ | ||||||||||||
| Cumulative effect of adoption of ASU 2016-13 at January 1, 2023 | ||||||||||||||
| Current period change for estimated uncollectible reinsurance | ||||||||||||||
| Write-offs of uncollectible reinsurance recoverables | ||||||||||||||
| Balance at December 31, 2023 | $ | $ | ||||||||||||
78
SKYWARD SPECIALTY INSURANCE GROUP, INC. AND SUBSIDIARIES
NOTES TO CONSOLIDATED FINANCIAL STATEMENTS
8. Property and Equipment
The following table presents the components of property and equipment as of December 31, 2023 and 2022, which are included within other assets on the consolidated balance sheets.
| ($ in thousands) | 2023 | 2022 | ||||||||||||
| Leasehold improvements | $ | $ | ||||||||||||
| Equipment | ||||||||||||||
| Software | ||||||||||||||
| Other | ||||||||||||||
| Accumulated depreciation | ( | ( | ||||||||||||
| Total | $ | $ | ||||||||||||
Depreciation expense related to property and equipment was $3.2 million and $3.6 million for the years ended December 31, 2023 and 2022, respectively.
9. Leases
The Company determines if a contract contains a lease at inception and recognizes a right-of-use asset, within other assets, and lease liability, within accounts payable and accrued liabilities, based on the present value of future lease payments. In cases where its leases do not provide an implicit interest rate, the Company uses its incremental borrowing rate based on the information available on the inception date to determine the lease liability.
The Company’s leases are primarily for office facilities which have been classified as operating leases. Its leases have remaining lease terms ranging from 1 to 6 years, some of which include options to extend the leases. Lease expense for the years ended December 31, 2023 and 2022 was $2.8 million and $2.6 million, respectively.
The following tables provide information regarding the Company’s leases as of and for the years ended December 31, 2023 and 2022:
| ($ in thousands) | 2023 | 2022 | ||||||||||||
| $ | $ | |||||||||||||
| Operating lease weighted-average remaining lease term | ||||||||||||||
| Operating lease weighted-average discount rate | % | % | ||||||||||||
| ($ in thousands) | 2023 | 2022 | ||||||||||||
| Operating lease expense | $ | $ | ||||||||||||
| Short-term lease expense | ||||||||||||||
| Total lease expense | $ | $ | ||||||||||||
| Operating cash outflows from operating leases | $ | $ | ||||||||||||
79
SKYWARD SPECIALTY INSURANCE GROUP, INC. AND SUBSIDIARIES
NOTES TO CONSOLIDATED FINANCIAL STATEMENTS
The following table sets forth the future minimum lease payment obligations of the Company’s operating leases at December 31, 2023:
| ($ in thousands) | 2023 | |||||||
| 2024 | $ | |||||||
| 2025 | ||||||||
| 2026 | ||||||||
| 2027 | ||||||||
| 2028 | ||||||||
| Thereafter | ||||||||
| Total future minimum operating lease payments | $ | |||||||
| Less imputed interest | ( | |||||||
| Total operating lease liability | $ | |||||||
10. Subordinated Debt
The following table summarizes the Company’s subordinated debt as of December 31, 2023 and 2022:
| ($ in thousands) | 2023 | 2022 | ||||||||||||
| Junior subordinated interest debentures, due September 15, 2036, payable quarterly | ||||||||||||||
| Principal | $ | $ | ||||||||||||
| Less: Debt issuance costs | ( | ( | ||||||||||||
| Unsecured subordinated notes, due May 24, 2039, interest payable quarterly | ||||||||||||||
| Principal | ||||||||||||||
| Less: Debt issuance costs | ( | ( | ||||||||||||
| Subordinated debt, net of debt issuance costs | $ | $ | ||||||||||||
In May 2019, the Company entered into an agreement to issue unsecured subordinated notes (the “Notes”) with an aggregate principal amount of $20.0 million. Interest on the Notes is fixed at 7.25 % for the first 8 years and fixed at 8.25 % thereafter. Early retirement of the debt ahead of 8 year commitment requires all interest payments to be paid in full as well as the return of outstanding principal. Principal is due at maturity on May 24, 2039 and interest is payable quarterly. The Notes have junior priority to all previously issued debt. The Company reports debt related to the Notes in its December 31, 2023 and 2022 consolidated balance sheets, net of debt issuance costs of approximately $0.5
On August 2, 2006, the Trust issued $58.0 million of fixed/floating rate capital securities guaranteed by us. The Trust also issued us $1.8 million of common stock, classified within other long-term investments. The Company has not consolidated the Trust as it does not meet the criteria for consolidation and the Company does not have significant influence over the investee. The Company carries its investment in the common stock of the Trust at cost. There was no impairment or observable change in price during the year ended December 31, 2023.
The sole asset of the Trust consists of Fixed/Floating Rate Junior Subordinated Deferrable Interest Debentures (the “Debentures”) with a principal amount of $59.8 million issued by the Company. The Debentures are an unsecured obligation that are currently redeemable, and have a maturity date of September 15, 2036. Interest on the Debentures is payable quarterly at an annual rate based on the three-month LIBOR (5.59 % and 4.77 % at December 31, 2023 and 2022, respectively) plus 3.4 %. The Company reflects debt related to the Debentures in its December 31, 2023 and 2022 consolidated balance sheets, net of debt issuance costs of approximately $0.6 million and $0.7 million, respectively. These deferred financing costs are presented as a direct deduction from the carrying amount of the subordinated debt.
11. Notes Payable
The Company entered into an agreement to obtain a new unsecured revolving credit facility (the “Revolving Credit Facility”) with a syndicate of participating banks during the first quarter of 2023. The Revolving Credit Facility provided
80
SKYWARD SPECIALTY INSURANCE GROUP, INC. AND SUBSIDIARIES
NOTES TO CONSOLIDATED FINANCIAL STATEMENTS
the Company with up to $150.0 million, with an accordion that can increase the capacity by $50.0 million, and a letter of credit sub-facility of up to $30.0 million.
During the year ended December 31, 2023, the Company drew $50.0 million on the Revolving Credit Facility and used the proceeds to pay off the principal on its existing term loan. The Company subsequently terminated the existing term loan and revolving line of credit.
Interest on the Revolving Credit Facility is payable quarterly. The interest rate on the Revolving Credit Facility is the Secured Overnight Financing Rate (“SOFR”) plus a margin of between 150 and 190 basis points, based on the ratio of debt to total capital, and a credit spread adjustment of 10 basis points. At December 31, 2023, the six-month SOFR on the Revolving Credit Facility was 5.47 %, plus a margin of 1.60 %.
The interest rate on the term loan was the one-month LIBOR (4.39 % on December 31, 2022) plus the “Applicable Margin,” which was defined as 1.65 %. The revolving line of credit included a fee of 0.25 % on the unused portion.
The following table sets forth the interest payments on the Company’s notes payable during the years ended December 31, 2023 and 2022:
| ($ in thousands) | 2023 | 2022 | ||||||||||||
| Interest payments on terminated term loan | $ | $ | ||||||||||||
| Interest payments on revolving credit facility | ||||||||||||||
12. Stockholders’ Equity
Reverse Stock Split
On September 23, 2022, the Board of Directors approved a 4-for-1 reverse stock split of the Company’s common stock. The reverse stock split became effective January 3, 2023. All share and per share information included in the accompanying consolidated financial statements and notes to the consolidated financial statements have been retroactively adjusted to reflect the reverse stock split of common stock for all periods presented.
Initial Public Offering
The Company completed its initial public offering (“IPO”) on January 18, 2023 with 4,750,000 shares offered by the Company at a price of $15.00 per share. The Company’s net proceeds from the IPO were approximately $62.0 million, after deducting underwriting discounts and specific incremental expenses directly attributable to the IPO.
Upon the closing of its IPO, the Company filed an amended and restated certificate of incorporation which, among other things, increased the number of authorized shares consisting of 500,000,000 shares of common stock, par value $0.01 per share, and 10,000,000 shares of preferred stock, par value $0.01 per share.
Preferred Shares Conversion
The Preferred Shares had preference in liquidation over common stock in the amount of the face value of $50.00 per share and any declared but unpaid dividends to related common shares at the applicable conversion rate. The Preferred Shares provided the holder the option at any time to convert the Preferred Shares into common stock based on the Option Conversion Rate.
The Preferred Shares were subject to mandatory conversion upon the closing of an IPO at the Mandatory Conversion Rate. At December 31, 2022, the Mandatory Conversion Rate allowed the holder of the Preferred Shares the right to convert into common stock based on a conversion price equal to $6.04 per common share. On January 18, 2023, 1,969,660 Preferred Shares converted to 16,305,113 shares of common stock upon the Company’s closing of its IPO.
81
SKYWARD SPECIALTY INSURANCE GROUP, INC. AND SUBSIDIARIES
NOTES TO CONSOLIDATED FINANCIAL STATEMENTS
Follow-On Offering
On November 20, 2023, the Company completed its follow-on offering with 2,150,000 shares sold by the Company at a price of $30.50 per share. The Company’s net proceeds were approximately $62.5 million, after deducting underwriting discounts and specific incremental expenses directly attributable to the offering.
13. Income Taxes
The following table sets forth the components of the Company’s income tax expense for the years ended December 31, 2023 and 2022:
| ($ in thousands) | 2023 | 2022 | ||||||||||||
| Current income tax expense | $ | $ | ||||||||||||
| Deferred tax expense | ||||||||||||||
| Income tax expense | $ | $ | ||||||||||||
The Company’s provision for income taxes generally does not deviate substantially from the statutory tax rate. The effective tax rate may vary slightly from the statutory rate due to tax adjustments for tax-exempt income, dividends-received deduction and non-deductible expenses.
The following table sets forth the differences between income taxes expected at the federal statutory income tax rate of 21% and the reported income tax expense for the years ended December 31, 2023 and 2022.
| 2023 | 2022 | |||||||||||||||||||||||||
| ($ in thousands) | Amount | Percentage | Amount | Percentage | ||||||||||||||||||||||
| Income tax expense at federal statutory rate | $ | % | $ | % | ||||||||||||||||||||||
| Tax advantaged investments | ( | ( | ( | ( | ||||||||||||||||||||||
| Other | ||||||||||||||||||||||||||
| Total income tax expense | $ | % | $ | % | ||||||||||||||||||||||
82
SKYWARD SPECIALTY INSURANCE GROUP, INC. AND SUBSIDIARIES
NOTES TO CONSOLIDATED FINANCIAL STATEMENTS
The following table sets forth the tax effects of temporary differences that give rise to significant portions of the deferred tax assets and deferred tax liabilities at December 31, 2023 and 2022:
| ($ in thousands) | 2023 | 2022 | ||||||||||||
| Deferred tax assets: | ||||||||||||||
| Net operating losses | $ | $ | ||||||||||||
| Losses and loss adjustment expenses | ||||||||||||||
| Unearned premiums | ||||||||||||||
| Unrealized losses on fixed maturity securities, available-for-sale | ||||||||||||||
| Stock options/awards | ||||||||||||||
| Other | ||||||||||||||
| Total deferred tax assets | ||||||||||||||
| Less valuation allowance | ( | ( | ||||||||||||
| Total deferred tax assets after valuation allowance | ||||||||||||||
| Deferred tax liabilities: | ||||||||||||||
| Deferred policy acquisition costs | ||||||||||||||
| Other long-term investments | ||||||||||||||
| Section 481(a) adjustment | ||||||||||||||
| Unrealized gains on equity securities | ||||||||||||||
| Depreciation | ||||||||||||||
| Other | ||||||||||||||
| Total deferred tax liabilities | ||||||||||||||
| Deferred income taxes | $ | $ | ||||||||||||
The Company paid $15.8 million in federal income taxes during the year ended December 31, 2023. The Company’s federal income tax returns for tax years 2020 to 2022 are subject to examination by the Internal Revenue Service. The Company has no current U.S. federal or state and local income tax examinations on-going at this time.
At December 31, 2023, the Company carried no balance for uncertain tax positions. The Company had no accrual for the payment of interest and penalties at December 31, 2023 or 2022.
The Company has federal net operating loss carryforwards of approximately $49.4 million. These net operating losses are set to expire beginning in 2030. The Company is limited on the utilization of $49.3 million of the net operating losses under Internal Revenue Code Section 382 (“Sec 382”) which imposes limitations on a corporation’s ability to utilize tax attributes if the corporation experiences an “ownership change” which occurred during 2014. The Sec 382 limitation is expected to result in an expiration of $2.8 million ($0.6 million tax effected) of net operating losses. A valuation allowance was established against the balance that is expected to expire without utilization.
The Company generated a capital loss carryforward in 2022, resulting in a deferred tax asset of $0.7 million as of December 31, 2023. No valuation allowance is recorded against this deferred tax asset as the Company expects to utilize this carryforward before it expires in 2027.
14. Reserves for Losses and Loss Adjustment Expenses
The Company presents its loss development on a consolidated basis; however, it evaluates net ultimate loss and LAE under three sub-categories: multiline solutions, short tail/monoline specialty lines and exited lines. The Company determined that these disaggregated groupings have more homogeneous risk characteristics with similar development patterns and are generally subject to similar trends.
83
SKYWARD SPECIALTY INSURANCE GROUP, INC. AND SUBSIDIARIES
NOTES TO CONSOLIDATED FINANCIAL STATEMENTS
Short tail/monoline specialty lines
Short tail/monoline specialty lines includes the Company’s global property & agriculture, accident & health, surety, and professional lines underwriting divisions. These are market niches for which the Company serves with monoline solutions which generally have shorter durations for losses to fully develop. Losses for these lines are generally reported within a short period of time from the date of loss, and in most instances, claims are settled and paid within a relatively short timeframe. Short tail/monoline specialty can be impacted by larger losses which can be more complex due to factors such as difficulty determining actual damages, legal and regulatory impediments potentially extending the period of time it takes to settle and pay claims.
Multi-line Solutions
Multi-line solutions includes the Company’s industry solutions, programs, captives and transactional E&S underwriting divisions. These are market niches for which the Company provides multiple products most frequently as an integrated solution. The multi-line solution subcategory is made up predominantly of occurrence liability including general liability, excess liability, and commercial auto. Multi-line solutions have a longer duration for losses to fully develop compared to short-tail/monoline specialty lines. Due to the unique claim characteristics of each product and the longer-tail nature of the multi-line solutions, this introduces more uncertainty as over time the claims can be impacted by changes in regulation, inflation and other unforeseen factors.
Exited lines
Exited lines includes all underwriting units that the Company placed in run-off and are presented separately from on-going lines of business.
The following table sets forth the reconciliation of unpaid losses and loss adjustment expenses for the years ended December 31, 2023 and 2022:
| ($ in thousands) | 2023 | 2022 | ||||||||||||
| Reserves for losses and LAE, beginning of period | $ | $ | ||||||||||||
| Less: reinsurance recoverable on unpaid claims, beginning of period | ( | ( | ||||||||||||
| Reserves for losses and LAE, beginning of period, net of reinsurance | ||||||||||||||
| Incurred, net of reinsurance, related to: | ||||||||||||||
| Current period | ||||||||||||||
| Prior years | ||||||||||||||
| Total incurred, net of reinsurance | ||||||||||||||
| Paid, net of reinsurance, related to: | ||||||||||||||
| Current period | ||||||||||||||
| Prior years | ||||||||||||||
| Total paid | ||||||||||||||
| Net reserves for losses and LAE, end of period | ||||||||||||||
| Plus: reinsurance recoverable on unpaid claims, end of period | ||||||||||||||
| Reserves for losses and LAE, end of period | $ | $ | ||||||||||||
For the year ended December 31, 2023, the Company recognized favorable development related to prior years’ loss and loss expense reserves of $9.2 million in short tail/monoline specialty lines and adverse development of $11.9 million in multi-line solutions, respectively. The favorable development in short tail/monoline specialty lines was driven by property lines of business from the 2021 accident year. The adverse development in multi-line solutions was driven by higher than expected severity in general and auto liability lines of business primarily from the 2019 accident year.
During the year ended December 31, 2022, the Company’s net incurred losses for accident years 2021 and prior developed adversely by $14.4 million which was related to losses subject to the LPT.
84
SKYWARD SPECIALTY INSURANCE GROUP, INC. AND SUBSIDIARIES
NOTES TO CONSOLIDATED FINANCIAL STATEMENTS
Within exited lines, adverse development of $14.5 million was from the 2019 accident year primarily driven by increased in frequency and severity in general and professional liability. The remaining $8.4 million of net adverse development was from other accident years.
Within multi-line solutions, favorable development of $10.8 million was from the 2020 through 2021 accident years and was driven by reduction in frequency of claims in commercial auto and general liability. The remaining $2.3 million of net adverse development was from various other accident years.
Short Duration Contract Disclosures
Losses and LAE reserves represent the Company’s best estimate of the ultimate net cost of all reported and unreported losses that are unpaid as of the balance sheet dates. The Company’s estimated reserves for losses and LAE include the accumulation of estimates for claims reported and unpaid prior to the balance sheet dates, estimates (based on projections of relevant historical data) of increases in claims costs for claims already reported, of claims incurred but not reported, and estimates of expenses for investigating and adjusting all incurred and unpaid claims.
In determining the cumulative number of reported claims, the Company measures claim counts by incident. The claim counts include all claims reported, even if the Company does not establish a liability for the claim (i.e. reserve for loss and loss adjustment expenses).
Short Tail/Monoline Specialty
| ($ in thousands except number of claims) | |||||||||||||||||||||||||||||||||||||||||||||||
| Incurred Losses and LAE, Net of Reinsurance | As of December 31, 2023 | ||||||||||||||||||||||||||||||||||||||||||||||
| Years Ended December 31, | Reported Claims | ||||||||||||||||||||||||||||||||||||||||||||||
| Accident Year | 2019* | 2020* | 2021* | 2022* | 2023 | IBNR | |||||||||||||||||||||||||||||||||||||||||
| 2019 | $ | $ | $ | $ | $ | $ | |||||||||||||||||||||||||||||||||||||||||
| 2020 | |||||||||||||||||||||||||||||||||||||||||||||||
| 2021 | |||||||||||||||||||||||||||||||||||||||||||||||
| 2022 | |||||||||||||||||||||||||||||||||||||||||||||||
| 2023 | |||||||||||||||||||||||||||||||||||||||||||||||
| Total | $ | ||||||||||||||||||||||||||||||||||||||||||||||
| Cumulative net paid loss and LAE from the table below | ( | ||||||||||||||||||||||||||||||||||||||||||||||
| Net reserves for loss and LAE before 2019 | |||||||||||||||||||||||||||||||||||||||||||||||
| Total net reserves for loss and LAE | $ | ||||||||||||||||||||||||||||||||||||||||||||||
| *Supplementary information and unaudited | |||||||||||||||||||||||||||||||||||||||||||||||
| ($ in thousands) | ||||||||||||||||||||||||||||||||
| Cumulative Paid Losses and LAE, Net of Reinsurance ($ in thousands) | ||||||||||||||||||||||||||||||||
| Years Ended December 31, | ||||||||||||||||||||||||||||||||
| Accident Year | 2019* | 2020* | 2021* | 2022* | 2023 | |||||||||||||||||||||||||||
| 2019 | $ | $ | $ | $ | $ | |||||||||||||||||||||||||||
| 2020 | ||||||||||||||||||||||||||||||||
| 2021 | ||||||||||||||||||||||||||||||||
| 2022 | ||||||||||||||||||||||||||||||||
| 2023 | ||||||||||||||||||||||||||||||||
| Total | $ | |||||||||||||||||||||||||||||||
| *Supplementary information and unaudited | ||||||||||||||||||||||||||||||||
85
SKYWARD SPECIALTY INSURANCE GROUP, INC. AND SUBSIDIARIES
NOTES TO CONSOLIDATED FINANCIAL STATEMENTS
Multi-line Solutions
| ($ in thousands except number of claims) | ||||||||||||||||||||||||||||||||||||||||||||||||||||||||||||||||||||||||||
| Incurred Losses and LAE, Net of Reinsurance ($ in thousands) | As of December 31, 2023 | |||||||||||||||||||||||||||||||||||||||||||||||||||||||||||||||||||||||||
| Accident Year | Years Ended December 31, | Reported Claims | ||||||||||||||||||||||||||||||||||||||||||||||||||||||||||||||||||||||||
| 2014* | 2015* | 2016* | 2017* | 2018* | 2019* | 2020* | 2021* | 2022* | 2023 | IBNR | ||||||||||||||||||||||||||||||||||||||||||||||||||||||||||||||||
| 2014 | $ | $ | $ | $ | $ | $ | $ | $ | $ | $ | $ | |||||||||||||||||||||||||||||||||||||||||||||||||||||||||||||||
| 2015 | ||||||||||||||||||||||||||||||||||||||||||||||||||||||||||||||||||||||||||
| 2016 | ||||||||||||||||||||||||||||||||||||||||||||||||||||||||||||||||||||||||||
| 2017 | ||||||||||||||||||||||||||||||||||||||||||||||||||||||||||||||||||||||||||
| 2018 | ||||||||||||||||||||||||||||||||||||||||||||||||||||||||||||||||||||||||||
| 2019 | ||||||||||||||||||||||||||||||||||||||||||||||||||||||||||||||||||||||||||
| 2020 | ||||||||||||||||||||||||||||||||||||||||||||||||||||||||||||||||||||||||||
| 2021 | ||||||||||||||||||||||||||||||||||||||||||||||||||||||||||||||||||||||||||
| 2022 | ||||||||||||||||||||||||||||||||||||||||||||||||||||||||||||||||||||||||||
| 2023 | ||||||||||||||||||||||||||||||||||||||||||||||||||||||||||||||||||||||||||
| Total | $ | |||||||||||||||||||||||||||||||||||||||||||||||||||||||||||||||||||||||||
| Cumulative net paid loss and LAE from the table below | ( | |||||||||||||||||||||||||||||||||||||||||||||||||||||||||||||||||||||||||
| Net reserves for loss and LAE before 2014 | ( | |||||||||||||||||||||||||||||||||||||||||||||||||||||||||||||||||||||||||
| Total net reserves for loss and LAE | $ | |||||||||||||||||||||||||||||||||||||||||||||||||||||||||||||||||||||||||
| *Supplementary information and unaudited | ||||||||||||||||||||||||||||||||||||||||||||||||||||||||||||||||||||||||||
| ($ in thousands) | ||||||||||||||||||||||||||||||||||||||||||||||||||||||||||||||
| Cumulative Paid Losses and LAE, Net of Reinsurance ($ in thousands) | ||||||||||||||||||||||||||||||||||||||||||||||||||||||||||||||
| Years Ended December 31, | ||||||||||||||||||||||||||||||||||||||||||||||||||||||||||||||
| Accident Year | 2014* | 2015* | 2016* | 2017* | 2018* | 2019* | 2020* | 2021* | 2022* | 2023 | ||||||||||||||||||||||||||||||||||||||||||||||||||||
| 2014 | $ | $ | $ | $ | $ | $ | $ | $ | $ | $ | ||||||||||||||||||||||||||||||||||||||||||||||||||||
| 2015 | ||||||||||||||||||||||||||||||||||||||||||||||||||||||||||||||
| 2016 | ||||||||||||||||||||||||||||||||||||||||||||||||||||||||||||||
| 2017 | ||||||||||||||||||||||||||||||||||||||||||||||||||||||||||||||
| 2018 | ||||||||||||||||||||||||||||||||||||||||||||||||||||||||||||||
| 2019 | ||||||||||||||||||||||||||||||||||||||||||||||||||||||||||||||
| 2020 | ||||||||||||||||||||||||||||||||||||||||||||||||||||||||||||||
| 2021 | ||||||||||||||||||||||||||||||||||||||||||||||||||||||||||||||
| 2022 | ||||||||||||||||||||||||||||||||||||||||||||||||||||||||||||||
| 2023 | ||||||||||||||||||||||||||||||||||||||||||||||||||||||||||||||
| Total | $ | |||||||||||||||||||||||||||||||||||||||||||||||||||||||||||||
| *Supplementary information and unaudited | ||||||||||||||||||||||||||||||||||||||||||||||||||||||||||||||
86
SKYWARD SPECIALTY INSURANCE GROUP, INC. AND SUBSIDIARIES
NOTES TO CONSOLIDATED FINANCIAL STATEMENTS
Exited Lines — all lines in runoff
| ($ in thousands except number of claims) | ||||||||||||||||||||||||||||||||||||||||||||||||||||||||||||||||||||||||||
| Incurred Losses and LAE, Net of Reinsurance ($ in thousands) | As of December 31, 2023 | |||||||||||||||||||||||||||||||||||||||||||||||||||||||||||||||||||||||||
| Years Ended December 31, | Reported Claims | |||||||||||||||||||||||||||||||||||||||||||||||||||||||||||||||||||||||||
| Accident Year | 2014* | 2015* | 2016* | 2017* | 2018* | 2019* | 2020* | 2021* | 2022* | 2023 | IBNR | |||||||||||||||||||||||||||||||||||||||||||||||||||||||||||||||
| 2014 | $ | $ | $ | $ | $ | $ | $ | $ | $ | $ | $ | |||||||||||||||||||||||||||||||||||||||||||||||||||||||||||||||
| 2015 | ||||||||||||||||||||||||||||||||||||||||||||||||||||||||||||||||||||||||||
| 2016 | ||||||||||||||||||||||||||||||||||||||||||||||||||||||||||||||||||||||||||
| 2017 | ||||||||||||||||||||||||||||||||||||||||||||||||||||||||||||||||||||||||||
| 2018 | ||||||||||||||||||||||||||||||||||||||||||||||||||||||||||||||||||||||||||
| 2019 | ||||||||||||||||||||||||||||||||||||||||||||||||||||||||||||||||||||||||||
| 2020 | ||||||||||||||||||||||||||||||||||||||||||||||||||||||||||||||||||||||||||
| 2021 | ||||||||||||||||||||||||||||||||||||||||||||||||||||||||||||||||||||||||||
| 2022 | ||||||||||||||||||||||||||||||||||||||||||||||||||||||||||||||||||||||||||
| 2023 | ||||||||||||||||||||||||||||||||||||||||||||||||||||||||||||||||||||||||||
| Total | $ | |||||||||||||||||||||||||||||||||||||||||||||||||||||||||||||||||||||||||
| Cumulative net paid loss and LAE from the table below | ( | |||||||||||||||||||||||||||||||||||||||||||||||||||||||||||||||||||||||||
| Net reserves for loss and LAE before 2014 | ||||||||||||||||||||||||||||||||||||||||||||||||||||||||||||||||||||||||||
| Total net reserves for loss and LAE | $ | |||||||||||||||||||||||||||||||||||||||||||||||||||||||||||||||||||||||||
| *Supplementary information and unaudited | ||||||||||||||||||||||||||||||||||||||||||||||||||||||||||||||||||||||||||
| ($ in thousands) | ||||||||||||||||||||||||||||||||||||||||||||||||||||||||||||||
| Cumulative Paid Losses and LAE, Net of Reinsurance ($ in thousands) | ||||||||||||||||||||||||||||||||||||||||||||||||||||||||||||||
| Years Ended December 31, | ||||||||||||||||||||||||||||||||||||||||||||||||||||||||||||||
| Accident Year | 2014* | 2015* | 2016* | 2017* | 2018* | 2019* | 2020* | 2021* | 2022* | 2023 | ||||||||||||||||||||||||||||||||||||||||||||||||||||
| 2014 | $ | $ | $ | $ | $ | $ | $ | $ | $ | $ | ||||||||||||||||||||||||||||||||||||||||||||||||||||
| 2015 | ||||||||||||||||||||||||||||||||||||||||||||||||||||||||||||||
| 2016 | ||||||||||||||||||||||||||||||||||||||||||||||||||||||||||||||
| 2017 | ||||||||||||||||||||||||||||||||||||||||||||||||||||||||||||||
| 2018 | ||||||||||||||||||||||||||||||||||||||||||||||||||||||||||||||
| 2019 | ||||||||||||||||||||||||||||||||||||||||||||||||||||||||||||||
| 2020 | ||||||||||||||||||||||||||||||||||||||||||||||||||||||||||||||
| 2021 | ||||||||||||||||||||||||||||||||||||||||||||||||||||||||||||||
| 2022 | ||||||||||||||||||||||||||||||||||||||||||||||||||||||||||||||
| 2023 | ||||||||||||||||||||||||||||||||||||||||||||||||||||||||||||||
| Total | $ | |||||||||||||||||||||||||||||||||||||||||||||||||||||||||||||
| *Supplementary information and unaudited | ||||||||||||||||||||||||||||||||||||||||||||||||||||||||||||||
87
SKYWARD SPECIALTY INSURANCE GROUP, INC. AND SUBSIDIARIES
NOTES TO CONSOLIDATED FINANCIAL STATEMENTS
The table below presents the reconciliation of the net incurred and paid loss development tables to the balance sheet reserves for losses and loss adjustment expenses at December 31, 2023 and 2022:
| ($ in thousands) | 2023 | |||||||
| Net reserves for losses and LAE: | ||||||||
| Short Tail/Monoline Specialty | $ | |||||||
| Multi-line Solutions | ||||||||
| Exited Lines | ||||||||
| Reserves for losses and LAE, net of reinsurance | ||||||||
| Reinsurance recoverable on unpaid claims: | ||||||||
| Short Tail/Monoline Specialty | ||||||||
| Multi-line Solutions | ||||||||
| Exited Lines | ||||||||
| Total reinsurance recoverable on unpaid claims | ||||||||
| Reserves for losses and LAE at end of year | $ | |||||||
The following table sets forth the historical average annual payout of incurred losses and allocated loss adjustment expenses (claims duration) for short-duration contracts, based on the disaggregated information in the paid loss development tables, net of reinsurance:
| Average Annual Percentage Payout of Incurred Claims by Age, Net of Reinsurance | ||||||||||||||||||||||||||||||||||||||||||||||||||||||||||||||
| Years | ||||||||||||||||||||||||||||||||||||||||||||||||||||||||||||||
| 1* | 2* | 3* | 4* | 5* | 6* | 7* | 8* | 9* | 10* | |||||||||||||||||||||||||||||||||||||||||||||||||||||
| Short Tail/Monoline Specialty | % | % | % | % | % | % | % | % | % | % | ||||||||||||||||||||||||||||||||||||||||||||||||||||
| Multi-line Solutions | % | % | % | % | % | % | % | % | % | % | ||||||||||||||||||||||||||||||||||||||||||||||||||||
| Exited Lines | % | % | % | % | % | % | % | % | % | % | ||||||||||||||||||||||||||||||||||||||||||||||||||||
| *Supplementary information and unaudited | ||||||||||||||||||||||||||||||||||||||||||||||||||||||||||||||
15. Commission and Fee Income
The following table sets forth the Company’s disaggregated revenues from contracts with customers for the years ended December 31, 2023 and 2022:
| ($ in thousands) | 2023 | 2022 | ||||||||||||
| SUA commission revenue | $ | $ | ||||||||||||
| SUA fee income | ||||||||||||||
| Other | ||||||||||||||
| Total commission and fee income | $ | $ | ||||||||||||
The following table sets forth the Company’s opening and closing balances of contract assets from commission and fee income for the years ended December 31, 2023 and 2022:
| ($ in thousands) | Contract Assets | |||||||
| Balance at December 31, 2021 | $ | |||||||
| Balance at December 31, 2022 | ||||||||
| Balance at December 31, 2023 | ||||||||
88
SKYWARD SPECIALTY INSURANCE GROUP, INC. AND SUBSIDIARIES
NOTES TO CONSOLIDATED FINANCIAL STATEMENTS
16. Underwriting, Acquisition and Insurance Expenses
The following table sets forth the components of underwriting, acquisition and insurance expenses for the years ended December 31, 2023 and 2022:
| ($ in thousands) | 2023 | 2022 | ||||||||||||
| Amortization of policy acquisition costs | $ | $ | ||||||||||||
| Other operating and general expenses | ||||||||||||||
| Total underwriting, acquisition and insurance expenses | $ | $ | ||||||||||||
17. Reinsurance
Certain premiums and benefits are assumed from and ceded to other insurance companies under various reinsurance agreements. The reinsurance agreements provide the Company with increased capacity to write larger risks and maintain its exposure to loss within its capital resources. The Company remains obligated for amounts ceded if reinsurers do not meet their obligations.
The following table sets forth the effects of reinsurance on premiums written and earned for years ended December 31, 2023 and 2022:
| 2023 | 2022 | |||||||||||||||||||||||||
| ($ in thousands) | Written | Earned | Written | Earned | ||||||||||||||||||||||
| Direct premiums | $ | $ | $ | $ | ||||||||||||||||||||||
| Assumed premiums | ||||||||||||||||||||||||||
| Ceded premiums | ( | ( | ( | ( | ||||||||||||||||||||||
| Net premiums | $ | $ | $ | $ | ||||||||||||||||||||||
| Ceded losses and LAE incurred | $ | $ | ||||||||||||||||||||||||
The following table sets forth the components of reinsurance recoverables and ceded unearned premium at December 31, 2023 and 2022:
| ($ in thousands) | 2023 | 2022 | ||||||||||||
| Ceded unpaid losses and LAE | $ | $ | ||||||||||||
| Ceded paid losses and LAE | ||||||||||||||
| Loss portfolio transfer | ||||||||||||||
| Allowance for credit losses | ( | |||||||||||||
| Reinsurance recoverables | $ | $ | ||||||||||||
| Ceded unearned premium | $ | $ | ||||||||||||
The Company entered into agreements with several of its reinsurers, whereby the reinsurer established funded trust accounts with the Company as the sole beneficiary. These trust accounts provide the Company additional security to collect claim recoverables under reinsurance contracts; the Company does not carry these on the balance sheet as it will only have custody over these accounts upon the failure of the reinsurer to pay amounts due. At December 31, 2023, the market value of these accounts was approximately $158.1 million. The agreements provide that, as was customary in the past, the reinsurer will continue claim payment reimbursements without disturbing the trust balances. The trust amount will be adjusted periodically, by mutual agreement, based on loss reserve recoverables.
During the first quarter of 2020, the Company entered into an LPT retroactive reinsurance agreement. Under the LPT, the Company received reinsurance protection of approximately $127.4 million above the ceded losses and LAE reserves and is subject to co-participations at specified amounts. During the year ended December 31, 2022, the Company strengthened reserves for certain divisions covered by the LPT by $14.4 million, resulting in an increase in the amount ceded under this agreement. The increase in the amount ceded during the year ended December 31, 2022 were partially offset by $5.8 million of recognized gain.
89
SKYWARD SPECIALTY INSURANCE GROUP, INC. AND SUBSIDIARIES
NOTES TO CONSOLIDATED FINANCIAL STATEMENTS
The following table presents the impact of the LPT on the consolidated statements of operations for the years ended December 31, 2023 and 2022:
| ($ in thousands) | 2023 | 2022 | ||||||||||||
| Strengthening of reserves subject to the LPT | $ | $ | ( | |||||||||||
| Reinsurance recoveries under the LPT | ||||||||||||||
| Pretax net impact of the LPT | $ | $ | ( | |||||||||||
Certain ceded reinsurance contracts that transfer only significant timing risk and do not transfer sufficient underwriting risk are accounted for using the deposit method of accounting. The Company’s deposit asset was included in other assets on the consolidated balance sheets.
The Company’s deposit assets as of December 31, 2023 and 2022 were $29.9 million and $41.8 million, respectively.
18. Stock-Based Compensation
On September 23, 2022, the Compensation Committee of the Company’s Board of Directors (“Compensation Committee”) approved the Company’s 2022 Long-Term Incentive Plan (the “2022 Plan”), which became effective on January 12, 2023. The 2022 Plan provides for the granting of restricted stock, restricted stock units, performance stock units, stock options as well as cash-based performance awards, to select employees and non-employee directors of the Company. The 2022 Plan stated that 3,200,656 shares of common stock were available for issuance.
In December 2020, the Compensation Committee approved a Long Term Incentive Plan (the “2021 Plan”). The 2021 Plan provides for the granting of restricted stock, restricted stock units and performance stock units (collectively “restricted stock units” or “stock units”), as well as cash-based performance awards, to select employees and non-employee directors of the Company.
The Compensation Committee granted 1,101,856 and 198,842 shares of restricted stock and restricted stock units during the years ended December 31, 2023 and 2022, under the 2022 Plan and 2021 Plan, respectively. Members of the Board of Directors were granted 23,482 and 15,196 shares of restricted stock during the years ended December 31, 2023 and 2022, respectively, with a service period of one year . The fair value of restricted stock and restricted stock units under the 2022 Plan for awards granted at the time of the Company’s IPO were granted at the IPO price of $15.00 per share. The fair value of subsequent grants were equal to the closing stock price on the date the restricted stock units were granted. The expense for these equity-based incentives is based on their fair value at the date of grant and amortized over their vesting period.
The Compensation Committee granted 759,990 stock options during the year ended December 31, 2023. The grant date fair value of the options under the 2022 Plan was determined using the Black-Scholes model where the term was the contractual term of 10 years less the weighted average service period. The volatility was determined based on the historical volatility of comparable publicly traded insurance companies.
The restricted stock and restricted stock units granted to employees and the Board of Directors during the years ended December 31, 2023 and 2022 were valued at approximately $17.7 million and $2.6 million, respectively, based on the grant date fair value. The stock options granted to employees during the year ended December 31, 2023 were valued at approximately $4.4 million based on the grant date fair value.
90
SKYWARD SPECIALTY INSURANCE GROUP, INC. AND SUBSIDIARIES
NOTES TO CONSOLIDATED FINANCIAL STATEMENTS
The following table sets forth the Company’s equity awards, target payout ranges and authorized target restricted stock and stock units for the years ended December 31, 2023 and 2022:
| Award Payout Range | Requisite Service Period | Authorized Target Common Shares | ||||||||||||||||||
| Year ended December 31, 2023 | ||||||||||||||||||||
| Market condition awards | ||||||||||||||||||||
| Performance condition awards | ||||||||||||||||||||
| Service condition awards | N/A | |||||||||||||||||||
| Stock options | N/A | |||||||||||||||||||
| Year ended December 31, 2022 | ||||||||||||||||||||
| Market condition awards | ||||||||||||||||||||
| Performance condition awards | ||||||||||||||||||||
| Restricted stock unit awards | N/A | |||||||||||||||||||
The following table sets forth option activity for the year ended December 31, 2023:
| Weighted-Average Exercise Price | Stock | ||||||||||
| Outstanding at January 1, 2023 | |||||||||||
| Granted | $ | ||||||||||
| Outstanding at December 31, 2023 | |||||||||||
The intrinsic value of each option is determined based on the difference between the fair value of the underlying share and the exercise price of the underlying option. The aggregate intrinsic value of options outstanding at December 31, 2023 was $14.3 million. The weighted-average remaining contractual life of the options outstanding at December 31, 2023 was 9.0 years.
91
SKYWARD SPECIALTY INSURANCE GROUP, INC. AND SUBSIDIARIES
NOTES TO CONSOLIDATED FINANCIAL STATEMENTS
The following table sets forth the Company’s restricted stock and restricted stock units activity for the years ended December 31, 2023 and 2022:
| Weighted-Average Grant-Date Fair Value | Stock and Stock Units | |||||||||||||
| Non-vested at January 1, 2023 | $ | |||||||||||||
| Granted | ||||||||||||||
| Vested | ( | |||||||||||||
| Forfeited | ( | |||||||||||||
| Non-vested at December 31, 2023 | $ | |||||||||||||
| Non-vested at January 1, 2022 | $ | |||||||||||||
| Granted | ||||||||||||||
| Vested | ( | |||||||||||||
| Forfeited | ( | |||||||||||||
| Non-vested at December 31, 2022 | $ | |||||||||||||
The total fair value of shares vested at December 31, 2023 and 2022 were $0.5 million and $2.2 million, respectively.
As of December 31, 2023 the total unrecognized compensation cost related to non-vested, share-based compensation awards was $15.9 million and the weighted average period over which that cost is expected to be recognized is 1.5 years. The Company recognized $8.5 million and $2.3 million of stock-based compensation expense for the years ended December 31, 2023 and 2022, respectively.
Employee Stock Purchase Plan
On September 23, 2022, the Compensation Committee approved the Company’s 2022 Employee Stock Purchase Plan (the “ESPP”), which became effective on May 15, 2023. Under the ESPP, all employees of the Company may choose, at two different specified time intervals each year, to have a percentage of their annual base earnings withheld to purchase the Company’s common stock. The purchase price of the common stock is 85 % of the lower of its beginning-of-period or end-of-period market price. The company has reserved 376,548 common shares under this plan.
The grant date fair value of options under the ESPP was determined using the Black-Scholes model where the term was the length of time between the grant date and the date the options are exercisable of 6 months. The volatility was determined based on the historical volatility of comparable publicly traded insurance companies.
As of December 31, 2023, a total of 35,430 shares had been purchased under this plan. The Company recognized $0.2 million of expense for the year ended December 31, 2023. As of December 31, 2023, the fair value of unrecognized expense was $0.3 million.
Stock Notes Receivable
92
SKYWARD SPECIALTY INSURANCE GROUP, INC. AND SUBSIDIARIES
NOTES TO CONSOLIDATED FINANCIAL STATEMENTS
19. Earnings Per Share
The following table sets forth the compilation of basic and diluted net earnings per share for the years ended December 31, 2023 and 2022:
| ($ in thousands, except for share and per share amounts) | 2023 | 2022 | ||||||||||||
| Numerator | ||||||||||||||
| Net income | $ | $ | ||||||||||||
| Less: Undistributed income allocated to participating securities | ( | ( | ||||||||||||
| Net income attributable to common shareholders (numerator for basic earnings per share) | ||||||||||||||
| Add back: Undistributed income allocated to participating securities | ||||||||||||||
| Net income (numerator for diluted earnings per share under the two-class method) | $ | $ | ||||||||||||
| Denominator | ||||||||||||||
| Basic weighted-average common shares | ||||||||||||||
| Dilutive effect of preferred shares | ||||||||||||||
| Dilutive effect of stock notes | ||||||||||||||
| Dilutive effect of awarded stock units | ||||||||||||||
| Dilutive effect of awarded options | ||||||||||||||
| Diluted weighted-average common share equivalents | ||||||||||||||
| Basic earnings per share | $ | $ | ||||||||||||
| Diluted earnings per share | $ | $ | ||||||||||||
The following table presents anti-dilutive instruments that were excluded from the calculation of diluted weighted-average common share equivalents during the years ended December 31, 2023 and 2022:
| 2023 | 2022 | |||||||||||||
| Stock notes | ||||||||||||||
| Awarded stock units | ||||||||||||||
| Awarded options | ||||||||||||||
| 2023 | 2022 | |||||||||||||
| Common shares | ||||||||||||||
| Preferred shares, if converted | ||||||||||||||
| Total | ||||||||||||||
20. Employee Benefit Plans
The Company sponsors the 401(k) Plan (the “Plan”). The Plan, available to substantially all its employees, is subject to provisions of the Employee Retirement Income Security Act of 1974. The Company matches employee contributions on a discretionary basis. During the years ended December 31, 2023 and 2022, the Company contributed $2.9 million and $2.4 million in matching contributions to the Plan, respectively.
93
SKYWARD SPECIALTY INSURANCE GROUP, INC. AND SUBSIDIARIES
NOTES TO CONSOLIDATED FINANCIAL STATEMENTS
21. Related Party Transactions
Westaim
In 2014 and continuing through 2015, Westaim HIIG LP acquired a majority of the Company’s common stock. In July 2023, Westaim dissolved Westaim HIIG LP and obtained direct ownership of the Company’s common stock held by the partnership. As of December 31, 2023, Westaim owned 17.5 % of the Company’s common stock. As of December 31, 2022, Westaim, including shares beneficially owned through Westaim HIIG LP, owned 44.5 % of the Company’s common stock. The changes in Westaim HIIG LP’s ownership percentage were primarily due to equity offerings, conversion of preferred common stock, and distribution of shares controlled by Westaim through a limited partnership.
In 2015, the Company purchased 3,076,924 shares of Westaim common stock for $8.4 million. The Company’s investment in Westaim is included in equity securities on the consolidated balance sheets. The Company had an unrealized gain on this investment of $0.5 million at December 31, 2023, and an unrealized loss of $2.3 million at December 31, 2022.
Prior to the closing of the IPO, Westaim performed consulting and certain other services for the Company pursuant to a Management Services Agreement. The agreement terminated pursuant to its terms upon the closing of the IPO.
RISCOM
RISCOM provides the Company with wholesale brokerage services. RISCOM and the Company also have a managing general agency agreement. The Company holds a 20 % ownership interest in RISCOM. Net earned premium and gross written commissions related to these agreements for the years ended December 31, 2023 and 2022 is summarized as follows:
| ($ in thousands) | 2023 | 2022 | ||||||||||||
| Net earned premium | $ | $ | ||||||||||||
| Gross written commissions | ||||||||||||||
Premiums receivable from RISCOM as of December 31, 2023 and 2022 were $10.6 and $9.9 million, respectively.
Reinsurance
The Company has reinsurance agreements with Everest Re, an affiliate of Mt. Whitney Securities, LLC, which was a limited partner of Westaim HIIG LP through November 30, 2022, and a holder of preferred shares. During the year ended December 31, 2023, Mt. Whitney Securities divested their entire ownership of the Company’s equity securities. Reinsurance premiums ceded during the year ended December 31, 2022 related to the agreement was $59.6 million. Reinsurance recoverable from Everest Re, net of premium payables at December 31, 2022 was $177.5 million.
Other
Advisory and professional services fees and expense reimbursements paid to various affiliated stockholders and directors for the years ended December 31, 2023 and 2022 were $3.6 million and $3.4 million, respectively.
See Notes 5, 6 and 10 for investments involving affiliated companies and additional related party transactions.
See Note 12 for related party transactions related to the Company’s common and preferred shares.
22. Commitments and Contingencies
Litigation
The Company is named as a defendant in various legal actions arising from claims made under insurance policies and contracts. Those actions are considered by the Company in estimating the losses and loss adjustment expense reserves. Also, from time to time, the Company is a defendant in various legal actions that relate to bad faith claims, disputes with third parties or that involve alleged errors and omissions. The Company records accruals for these items to the extent the losses are probable and reasonably estimable. Although the ultimate outcome of these matters cannot be determined at this time, based on present information, the availability of insurance coverage and advice received from outside legal counsel, the Company’s management believes the resolution of any such matters will not, individually or in the aggregate, have a
94
SKYWARD SPECIALTY INSURANCE GROUP, INC. AND SUBSIDIARIES
NOTES TO CONSOLIDATED FINANCIAL STATEMENTS
material adverse effect on the Company’s consolidated balance sheets, consolidated statements of operations or consolidated statements of cash flows. During the years ended December 31, 2023 and 2022, the Company recorded no
Indemnification
In conjunction with the sale of business assets and subsidiaries, the Company has provided indemnifications to certain of the buyers. Certain indemnifications cover typical representations and warranties related to the responsibilities to perform under the sales contracts. The amount of potential exposure covered by the indemnifications is difficult to determine because the indemnifications cover a variety of matters, operations and scenarios. Certain of these indemnifications have no time limit. As of December 31, 2023, the Company does not have reason to believe any such significant claims exist.
Contingent Consideration Related to Acquisitions
23. Statutory Accounting Principles and Regulatory Matters
The following table sets forth statutory net income and statutory capital and surplus for the Company for the years ended and as of December 31, 2023 and 2022:
| ($ in thousands) | 2023 | 2022 | ||||||||||||
| Statutory net income | $ | $ | ||||||||||||
| Statutory capital and surplus | ||||||||||||||
Dividend payments to the Company from HSIC are restricted by Texas state law as to the amount that may be paid without the approval of regulatory authorities. The maximum amount of dividends which can be paid by HSIC without prior approval is subject to restrictions relating to policyholder surplus, net income, and dividends declared or distributed during the preceding 12 months. As of December 31, 2023, HSIC is not restricted to paying ordinary dividends. HSIC did not declare or pay any dividend during the years ended December 31, 2023 and 2022.
Property and casualty insurance companies are subject to certain Risk Based Capital (“RBC”) requirements as specified by the National Association of Insurance Commissioners (“NAIC”). Under those requirements, the amount of capital and surplus maintained by a property and casualty insurance company is to be determined based on the various risk factors related to it. As of December 31, 2023 and 2022, HSIC’s statutory capital and surplus substantially exceeded the regulatory requirements.
24. Subsequent Events
95
Item 9. Changes in and Disagreements With Accountants on Accounting and Financial Disclosures
Item 9A. Controls and Procedures
Evaluation of Disclosure Controls and Procedures
Our management, with the participation of our principal executive officer and our principal financial officer, evaluated, as of the end of the period covered by this Annual Report on Form 10-K, the effectiveness of our disclosure controls and procedures (as defined in Rules 13a-15(e) and 15d-15(e) under the Securities Exchange Act of 1934, as amended, or the Exchange Act). Based on that evaluation, our principal executive officer and principal financial officer have concluded that as of December 31, 2023, our disclosure controls and procedures were effective at the reasonable assurance level. Management recognizes that any controls and procedures, no matter how well designed and operated, can provide only reasonable assurance of achieving their objectives and our management necessarily applies its judgment in evaluating the cost-benefit relationship of possible controls and procedures.
Management’s Report on Internal Control over Financial Reporting
Our management is responsible for establishing and maintaining adequate internal control over financial reporting as defined in Rules 13a-15(f) and 15d-15(f) under the Securities Exchange Act of 1934, as amended. Our internal control over financial reporting is designed to provide reasonable assurance regarding the reliability of financial reporting and the preparation of financial statements for external purposes in accordance with generally accepted accounting principles in the United States of America. Our internal control over financial reporting includes those policies and procedures that:
(i) Pertain to the maintenance of records that, in reasonable detail, accurately and fairly reflect the transactions and dispositions of our assets;
(ii) Provide reasonable assurance that transactions are recorded as necessary to permit preparation of financial statements in accordance with generally accepted accounting principles, and that our receipts and expenditures are being made only in accordance with authorizations of our management and directors; and
(iii) Provide reasonable assurance regarding prevention or timely detection of unauthorized acquisition, use or disposition of our assets that could have a material effect on the financial statements.
Because of its inherent limitations, internal control over financial reporting may not prevent or detect misstatements. Also, projections of any evaluation of effectiveness to future periods are subject to the risk that controls may become inadequate because of changes in conditions, or that the degree of compliance with the policies or procedures may deteriorate.
Management assessed the effectiveness of our internal control over financial reporting as of December 31, 2023. In making this assessment, management used the framework in Internal Control-Integrated Framework (2013) issued by the Committee of Sponsoring Organizations of the Treadway Commission. Management’s assessment included an evaluation of the design of our internal control over financial reporting and testing of the operational effectiveness of its internal control over financial reporting. Management reviewed the results of its assessment with the audit committee of our board of directors.
Based on that assessment under the framework in Internal Control-Integrated Framework (2013), management concluded that the company’s internal control over financial reporting was effective as of December 31, 2023.
This annual report on Form 10-K does not include an attestation report of our company’s registered public accounting firm regarding internal control over financial reporting as we are an emerging growth company as of December 31, 2023, as defined in the JOBS Act.
Changes in Internal Control over Financial Reporting
There was no change in our internal control over financial reporting identified in connection with the evaluation required by Rule 13a-15(d) and 15d-15(d) of the Exchange Act that occurred during the year ended December 31, 2023 that have materially affected, or are reasonably likely to materially affect, our internal control over financial reporting.
Item 9B. Other Information
Item 9C. Disclosure Regarding Foreign Jurisdictions that Prevent Inspections - Not applicable.
96
Part III
Item 10. Directors, Executive Officers and Corporate Governance
The information required by this Item 10 of Form 10-K will be included in our 2024 Proxy Statement and is incorporated herein by reference.
Item 11. Executive Compensation
The information required by this Item 11 of Form 10-K will be included in our 2024 Proxy Statement and is incorporated herein by reference.
Item 12. Security Ownership of Certain Beneficial Owner and Management and Related Stockholder Matters
The information required by this Item 12 of Form 10-K will be included in our 2024 Proxy Statement and is incorporated herein by reference.
Item 13. Certain Relationships and Related Transactions, and Director Independence
The information required by this Item 13 of Form 10-K will be included in our 2024 Proxy Statement and is incorporated herein by reference.
Item 14. Principal Accounting Fees and Services
Our independent registered public accounting firm is Ernst & Young LLP , Houston, Texas . Auditor Firm ID: 42
The information required by this Item 14 of Form 10-K will be included in our 2024 Proxy Statement and is incorporated herein by reference.
97
Part IV
Item 15. Exhibits, Financial Statement Schedules.
(a)(1) LISTING OF FINANCIAL STATEMENTS
The following consolidated financials statements of the Company are filed as part of this Form 10-K and are included in Item 8:
Report of Independent Registered Public Accounting Firm
Consolidated Balance Sheets as of December 31, 2023 and 2022
Consolidated Statements of Operations and Comprehensive Income (loss) for the two years in the period ended December 31, 2023 and 2022
Consolidated Statements of Stockholders’ Equity for the two years in the period ended December 31, 2023 and 2022
Consolidated Statements of Cash Flows for the two years in the period ended December 31, 2023 and 2022
(a)(2)
| Schedule Number | Schedule Description | Page | ||||||||||||
| I. | ||||||||||||||
| II. | ||||||||||||||
| IV. | ||||||||||||||
| V. | ||||||||||||||
| VI. | ||||||||||||||
(a)(3) LISTING OF EXHIBITS
| Exhibit Number | Exhibit Description | |||||||
| 3.1 | ||||||||
| 3.2 | ||||||||
| 4.1 | ||||||||
| 4.2 | Description of Capital Stock (incorporated by reference to Exhibit 4.2 to the Company’s Annual Report on Form 10-K, filed with the SEC on March 28, 2023). | |||||||
| 10.1+ | ||||||||
| 10.2+ | ||||||||
| 10.3+ | ||||||||
| 10.4+ | ||||||||
| 10.5+ | ||||||||
98
| Exhibit Number | Exhibit Description | |||||||
| 10.6+ | ||||||||
| 10.7+ | ||||||||
| 10.8+ | ||||||||
| 10.9+ | ||||||||
| 10.10+ | Form of Performance-Based Restricted Stock Units Agreement under the Company’s 2022 Long-Term Incentive Plan (incorporated by reference to Exhibit 10.10 to the Company’s Annual Report on Form 10-K, filed with the SEC on March 28, 2023). | |||||||
| 10.11+ | Performance-Based Restricted Stock Units Agreement under the Company’s 2022 Long-Term Incentive Plan (incorporated by reference to Exhibit 10.11 to the Company’s Annual Report on Form 10-K, filed with the SEC on March 28, 2023). | |||||||
| 10.12+ | Performance Unit Agreement under the Company’s 2022 Long-Term Incentive Plan (incorporated by reference to Exhibit 10.12 to the Company’s Annual Report on Form 10-K, filed with the SEC on March 28, 2023). | |||||||
| 10.13+ | ||||||||
| 10.14+ | ||||||||
| 10.15+ | ||||||||
| 10.16+ | ||||||||
| 10.17+ | ||||||||
| 10.18+ | ||||||||
| 10.19+ | ||||||||
| 10.20+ | ||||||||
| 10.21+ | ||||||||
| 10.22+ | ||||||||
| 10.23 | ||||||||
| 10.24* | ||||||||
99
| Exhibit Number | Exhibit Description | |||||||
| 10.25* | ||||||||
| 10.26 | ||||||||
| 10.27 | ||||||||
| 10.28 | ||||||||
| 10.29 | ||||||||
| 21.1 | ||||||||
| 23.1 | ||||||||
| 31.1 | ||||||||
| 31.2 | ||||||||
| 32.1 | ||||||||
| 97 | Policy for Recovery of Erroneously Awarded Incentive Compensation (“Clawback Policy”) adopted November 9, 2023. | |||||||
| 101.INS | Inline XBRL Instance Document – the instance document does not appear in the Interactive Data File because XBRL tags are embedded within the Inline XBRL document. | |||||||
| 101.SCH | Inline XBRL Taxonomy Extension Schema With Embedded Linkbase Documents | |||||||
| 104 | Cover Page Interactive Date File (embedded within the Inline XBRL document) | |||||||
____________________
* To be filed by amendment.
+ Management contract or compensatory plan or arrangement.
† Portions of this exhibit have been omitted for confidentiality purposes.
100
SKYWARD SPECIALTY INSURANCE GROUP, INC. AND SUBSIDIARIES
SCHEDULE I — SUMMARY OF INVESTMENTS — OTHER THAN IN RELATED PARTIES
| ($ in thousands) | Cost | Fair Value (if applicable) | Amount on Balance Sheet | |||||||||||||||||
| December 31, 2023 | ||||||||||||||||||||
| Fixed maturity securities, available for sale: | ||||||||||||||||||||
| U.S. government securities | $ | $ | $ | |||||||||||||||||
| Corporate securities and miscellaneous | ||||||||||||||||||||
| Municipal securities | ||||||||||||||||||||
| Residential mortgage-backed securities | ||||||||||||||||||||
| Commercial mortgage-backed securities | ||||||||||||||||||||
| Other asset-backed securities | ||||||||||||||||||||
| Total fixed maturity securities, available for sale | ||||||||||||||||||||
| Fixed maturity securities, held to maturity: | ||||||||||||||||||||
| Other asset-backed securities | ||||||||||||||||||||
| Total fixed maturity securities, held to maturity | ||||||||||||||||||||
| Equity securities: | ||||||||||||||||||||
| Common stocks | ||||||||||||||||||||
| Preferred stocks | ||||||||||||||||||||
| Mutual funds | ||||||||||||||||||||
| Total equity securities | ||||||||||||||||||||
| Mortgage loans | ||||||||||||||||||||
| Other long-term investments | ||||||||||||||||||||
| Short-term investments | ||||||||||||||||||||
| Total | $ | $ | $ | |||||||||||||||||
101
SKYWARD SPECIALTY INSURANCE GROUP, INC. AND SUBSIDIARIES
SCHEDULE II — CONDENSED FINANCIAL INFORMATION OF REGISTRANT
BALANCE SHEETS (PARENT COMPANY)
| December 31, | ||||||||||||||
| ($ in thousands) | 2023 | 2022 | ||||||||||||
| Assets | ||||||||||||||
| Investments: | ||||||||||||||
| Investment in subsidiaries | $ | $ | ||||||||||||
| Short-term investments, at fair value | ||||||||||||||
| Total investments | ||||||||||||||
| Cash and cash equivalents | ||||||||||||||
| Deferred income taxes | ||||||||||||||
| Goodwill and intangible assets, net | ||||||||||||||
| Other assets | ||||||||||||||
| Total assets | $ | $ | ||||||||||||
| Liabilities and Stockholders’ Equity | ||||||||||||||
| Liabilities: | ||||||||||||||
| Accounts payable and accrued liabilities | $ | $ | ||||||||||||
| Notes payable | ||||||||||||||
| Subordinated debt, net of debt issuance costs | ||||||||||||||
| Total liabilities | ||||||||||||||
| Stockholders’ Equity: | ||||||||||||||
| Stockholders’ equity | ||||||||||||||
| Total liabilities and stockholders’ equity | $ | $ | ||||||||||||
102
SKYWARD SPECIALTY INSURANCE GROUP, INC. AND SUBSIDIARIES
SCHEDULE II — CONDENSED STATEMENTS OF OPERATIONS
(PARENT COMPANY)
| Years Ended December 31, | ||||||||||||||
| ($ in thousands) | 2023 | 2022 | ||||||||||||
| Revenues: | ||||||||||||||
| Net investment income | $ | $ | ||||||||||||
| Net investment losses | ( | ( | ||||||||||||
| Other losses | ( | |||||||||||||
| Total revenues | ||||||||||||||
| Expenses | ||||||||||||||
| Interest expense | ||||||||||||||
| Amortization expense | ||||||||||||||
| Other expenses | ||||||||||||||
| Total expenses | ||||||||||||||
| Loss before income tax expense | ( | ( | ||||||||||||
| Income tax expense (benefit) | ( | |||||||||||||
| Net loss before equity in earnings of subsidiaries | ( | ( | ||||||||||||
| Equity in undistributed earnings of subsidiaries | ||||||||||||||
| Net income | $ | $ | ||||||||||||
103
SKYWARD SPECIALTY INSURANCE GROUP, INC. AND SUBSIDIARIES
SCHEDULE II — CONDENSED STATEMENTS OF CASH FLOWS (PARENT COMPANY)
| Years Ended December 31, | ||||||||||||||
| ($ in thousands) | 2023 | 2022 | ||||||||||||
| Cash flows from operating activities: | ||||||||||||||
| Net income | $ | $ | ||||||||||||
| Adjustments to reconcile net income to net cash used in operating activities | ( | ( | ||||||||||||
| Net cash provided by operating activities | ( | ( | ||||||||||||
| Cash flows from investing activities: | ||||||||||||||
| Capital contributions to subsidiaries | ( | |||||||||||||
| Distributions from investment in subsidiaries | ||||||||||||||
| Change in short-term investments | ( | |||||||||||||
| Net cash (used in) provided by investing activities | ( | |||||||||||||
| Cash flows from financing activities: | ||||||||||||||
| Employee share purchases | ||||||||||||||
| Draw on revolving line of credit | ||||||||||||||
| Repayment of term loan | ( | |||||||||||||
| Proceeds from equity offerings | ||||||||||||||
| Proceeds from employee stock purchase plan | ||||||||||||||
| Net cash provided by financing activities | ||||||||||||||
| Net (decrease) increase in cash and cash equivalents and restricted cash | ( | |||||||||||||
| Cash and cash equivalents and restricted cash at beginning of year | ||||||||||||||
| Cash and cash equivalents and restricted cash at end of year | $ | $ | ||||||||||||
| Supplemental disclosure of cash flow information: | ||||||||||||||
| Cash paid for interest | $ | $ | ||||||||||||
| Cash paid for federal income taxes | ||||||||||||||
104
SKYWARD SPECIALTY INSURANCE GROUP, INC. AND SUBSIDIARIES
SCHEDULE IV — REINSURANCE
| Years Ended December 31, | ||||||||||||||||||||||||||
| 2023 | 2022 | |||||||||||||||||||||||||
| ($ in thousands) | Accident & Health | Property & Casualty | Accident & Health | Property & Casualty | ||||||||||||||||||||||
| Gross amount | $ | $ | $ | $ | ||||||||||||||||||||||
| Ceded to other companies | ( | ( | ( | ( | ||||||||||||||||||||||
| Assumed from other companies | ||||||||||||||||||||||||||
| Net amount | $ | $ | $ | $ | ||||||||||||||||||||||
| Percentage of amount assumed to net | % | % | % | % | ||||||||||||||||||||||
105
SKYWARD SPECIALTY INSURANCE GROUP, INC. AND SUBSIDIARIES
SCHEDULE V — VALUATION AND QUALIFYING ACCOUNTS
| ($ in thousands) | Valuation Allowance For Deferred Tax Assets | Allowance for Uncollectible Reinsurance Recoverable | Allowance for Uncollectible Premiums Receivable | |||||||||||||||||
| Balance at January 1, 2022 | $ | $ | $ | |||||||||||||||||
| Charged to costs and expenses | ||||||||||||||||||||
| Amounts written off | ( | |||||||||||||||||||
| Balance at December 31, 2022 | ||||||||||||||||||||
| Charged to costs and expenses | ||||||||||||||||||||
| Amounts written off | ( | |||||||||||||||||||
| Recoveries of amounts previously written off | ||||||||||||||||||||
| Balance at December 31, 2023 | $ | $ | $ | |||||||||||||||||
106
SKYWARD SPECIALTY INSURANCE GROUP, INC. AND SUBSIDIARIES
SCHEDULE VI — SUPPLEMENTAL INFORMATION CONCERNING PROPERTY-CASUALTY
INSURANCE OPERATIONS
| As of and Years Ended December 31, | ||||||||||||||
| ($ in thousands) | 2023 | 2022 | ||||||||||||
| Deferred policy acquisition costs | $ | $ | ||||||||||||
| Reserve for losses and loss adjustment expenses | ||||||||||||||
| Unearned premiums | ||||||||||||||
Net earned premium(1) | ||||||||||||||
| Net investment income | ||||||||||||||
Losses and loss adjustment expenses (current year)(1) | ||||||||||||||
Losses and loss adjustment expenses (prior years)(1)(2) | ||||||||||||||
Amortization of policy acquisition costs(1) | ||||||||||||||
Paid claims and claim adjustment expenses(1) | ||||||||||||||
Net premiums written(1) | ||||||||||||||
| Ceded unearned premium | ||||||||||||||
| Deferred ceding commission | ||||||||||||||
(1) Amount is presented net of reinsurance | ||||||||||||||
(2) Amount does not include gain on retroactive reinsurance which is included in losses and loss adjustment expenses presented on the Consolidated Statements of Operations | ||||||||||||||
107
SIGNATURES
Pursuant to the requirements of Section 13 or 15(d) of the Securities Exchange Act of 1934, the registrant has duly caused this report to be signed on its behalf by the undersigned, thereunto duly authorized.
| Skyward Specialty Insurance Group, Inc. | ||||||||
Dated: April 1, 2024 | /s/ Andrew Robinson | |||||||
| Andrew Robinson Chairman and Chief Executive Officer | ||||||||
Pursuant to the requirements of the Securities Exchange Act of 1934, this report has been signed by the following persons on behalf of the Registrant and in the capacities and on the dates indicated.
| Signature | Title | Date | ||||||||||||
| /s/ Andrew Robinson | Chairman and Chief Executive Officer | April 1, 2024 | ||||||||||||
| Andrew Robinson | (Principal Executive Officer) | |||||||||||||
| /s/ Mark Haushill | Chief Financial Officer | April 1, 2024 | ||||||||||||
| Mark Haushill | (Principal Financial and Accounting Officer) | |||||||||||||
| /s/ Gena Ashe | Director | April 1, 2024 | ||||||||||||
| Gena Ashe | ||||||||||||||
| /s/ Robert Creager | Director | April 1, 2024 | ||||||||||||
| Robert Creager | ||||||||||||||
| /s/ Marcia Dall | Director | April 1, 2024 | ||||||||||||
| Marcia Dall | ||||||||||||||
| /s/ James Hays | Director | April 1, 2024 | ||||||||||||
| James Hays | ||||||||||||||
| /s/ Anthony J. Kuczinski | Director | April 1, 2024 | ||||||||||||
| Anthony J. Kuczinski | ||||||||||||||
| /s/ Michael Morrissey | Director | April 1, 2024 | ||||||||||||
| Michael Morrissey | ||||||||||||||
| /s/ Katharine Terry | Director | April 1, 2024 | ||||||||||||
| Katharine Terry | ||||||||||||||
108