UNITED STATES
SECURITIES AND EXCHANGE COMMISSION
Washington, D.C. 20549
FORM 10-K
(Mark One)
ANNUAL REPORT PURSUANT TO SECTION 13 OR 15(d) OF THE SECURITIES EXCHANGE ACT OF 1934 | |||||
For the annual period ended December 29 , 2023
OR
TRANSITION REPORT PURSUANT TO SECTION 13 OR 15(d) OF THE SECURITIES EXCHANGE ACT OF 1934 | |||||
For the transition period from _____ to _____
Commission file number 001-40683
(Exact name of registrant as specified in its charter)
(State or other jurisdiction of incorporation or organization)
(Address of principal executive offices)
(I.R.S. Employer Identification No.)
(Zip Code)
(704 ) 927-7620
Registrant's telephone number, including area code
Securities registered pursuant to Section 12(b) of the Act:
| Title of each class | Trading Symbol(s) | Name of each exchange on which registered | ||||||
Indicate by check mark if the registrant is a well-known seasoned issuer, as defined in Rule 405 of the Securities Act. Yes ☐ No ☒
Indicate by check mark if the registrant is not required to file reports pursuant to Section 13 or Section 15(d) of the Act. Yes ☐ No ☒
Indicate by check mark whether the registrant: (1) has filed all reports required to be filed by Section 13 or 15(d) of the Securities Exchange Act of 1934 during the preceding 12 months (or for such shorter period that the registrant was required to file such reports); and (2) has been subject to such filing requirements for the past 90 days. Yes ☒ No ☐
Indicate by check mark whether the registrant has submitted electronically every Interactive Data File required to be submitted and posted pursuant to Rule 405 of Regulation S-T (§232.405 of this chapter) during the preceding 12 months (or for such shorter period that the registrant was required to submit and post such files). Yes ☒ No ☐
Indicate by check mark whether the registrant is a large accelerated filer, an accelerated filer, a non-accelerated filer, a smaller reporting company, or an emerging growth company. See the definitions of “large accelerated filer,” “accelerated filer,” “smaller reporting company” and “emerging growth company” in Rule 12b-2 of the Exchange Act.
| Large accelerated filer | ☐ | ☒ | |||||||||
Non-accelerated filer | ☐ | Smaller reporting company | |||||||||
Emerging growth company | |||||||||||
If an emerging growth company, indicate by check mark if the registrant has elected not to use the extended transition period for complying with any new or revised financial accounting standards provided pursuant to Section 13(a) of the Exchange Act. ☐
Indicate by check mark whether the registrant has filed a report on and attestation to its management’s assessment of the effectiveness of its internal control over financial reporting under Section 404(b) of the Sarbanes-Oxley Act (15 U.S.C. 7262(b)) by the registered public accounting firms that prepared or issued its audit report. ☐
If securities are registered pursuant to Section 12(b) of the Act, indicate by check mark whether the financial statements of the registrant included in the filing reflect the correction of an error to previously issued financial statements. ☐
Indicate by check mark whether any of those error corrections are restatements that required a recovery analysis of incentive-based compensation received by any of the registrant's executive officers during the relevant recovery period pursuant to §240.10D-1(b) ☐
Indicate by check mark whether the registrant is a shell company (as defined in Rule 12b-2 of the Act). Yes ☐ No ☒
The aggregate market value of the voting and non-voting common equity held by non-affiliates of the registrant as of June 30, 2023 was $216,722,038 , based on a closing price of $11.65 per share of the registrant's common stock as reported on The Nasdaq Global Select Market (“Nasdaq”). For purposes of this computation, all officers, directors, and beneficial owners of 10% or more of the registrant’s outstanding common stock of the registrant are deemed to be affiliates. Such determination should not be deemed to be an admission that such persons are, in fact affiliates of the registrant.
The registrant had outstanding 76,403,097 shares of common stock as of March 4, 2024.
Documents Incorporated by Reference: Portions of Part III will be incorporated by reference to the registrant’s definitive Proxy Statement, in accordance with Instruction G(3) to Form 10-K, to be filed with the Securities and Exchange Commission no later than 120 days after the end of the registrant’s fiscal year ended December 29, 2023.
1
Table of Contents
| Page No. | ||||||||
2
Unless otherwise indicated, references to the “Company,” “Snap One,” “we,” “us,” and “our” in this Annual Report refer to Snap One Holdings Corp. and its consolidated subsidiaries. References to the “Former Parent Entity” means Crackle Holdings, L.P., the entity that, until the completion of our initial public offering, held all of our outstanding equity.
SPECIAL NOTE REGARDING FORWARD-LOOKING STATEMENTS AND RISK FACTOR SUMMARY
This Annual Report on Form 10-K (“Annual Report”) contains forward-looking statements within the meaning of Section 27A of the Securities Act of 1933, as amended (“Securities Act”), and Section 21E of the Securities Exchange Act of 1934, as amended (“Exchange Act”). Statements made in this Annual Report that are not statements of historical fact, including statements about our beliefs and expectations, including without limitation statements regarding product plans; future growth; market opportunities; strategic initiatives; industry positioning; customer acquisition and retention; and changes in revenue, cost, income, or losses; are forward-looking statements, and should be evaluated as such. The preceding list is not intended to be an exhaustive list of all our forward-looking statements. Forward-looking statements include information concerning possible or assumed future results of operations, including descriptions of our business plan and strategies. These statements often include words such as “anticipate,” “expect,” “suggest,” “plan,” “believe,” “intend,” “project,” “forecast,” “estimates,” “targets,” “projections,” “should,” “could,” “would,” “may,” “might,” “will,” and other similar expressions. These forward-looking statements are contained throughout this Annual Report.
We base these forward-looking statements on our current expectations, plans and assumptions, which we have made in light of our experience in the industry, as well as our perceptions of historical trends, current conditions, expected future developments and other factors we believe are appropriate under the circumstances. As you read and consider this Annual Report, you should understand these statements are not guarantees of performance. The forward-looking statements contained herein are subject to and involve risks, uncertainties, and assumptions, and therefore you should not place undue reliance on them. Although we believe these forward-looking statements are based on reasonable assumptions at the time they are made, you should be aware that many factors could affect our actual operational and financial results, and therefore actual results might differ materially from those expressed in the forward-looking statements. Factors that might materially affect such forward-looking statements include those described under the headings “Risk Factors” and “Management’s Discussion and Analysis of Financial Condition and Results of Operations” in this Annual Report or as described in other subsequent reports we file with the U.S. Securities and Exchange Commission (“SEC”). We encourage you to read this Annual Report and our other filings with the SEC carefully.
The forward-looking statements are based on our beliefs, assumptions, and expectations of future performance, taking into account the information currently available to us. These statements are only predictions based upon our current expectations about future events. There are important factors that could cause our actual results, level of activity, performance, or achievements to differ materially from the results, level of activity, performance, or achievements expressed or implied by the forward-looking statements. Moreover, we operate in a very competitive and rapidly changing environment. New risks emerge from time to time, and it is not possible for our management to predict all risks, nor can we assess the impact of all factors on our business or the extent to which any factor, or combination of factors, may cause actual results to differ materially from those contained in any of our forward-looking statements.
You should not rely upon forward-looking statements as predictions of future events. Although we believe the expectations reflected in the forward-looking statements are reasonable, we cannot guarantee that the future results, levels of activity, performance and events, and circumstances reflected in the forward-looking statements will be achieved or occur. Except as required by law, we undertake no obligation to update publicly any forward-looking statements for any reason after the date of this Annual Report to conform these statements to actual results or to changes in our expectations.
Risk Factor Summary
We are providing a risk factor summary to enhance the readability and accessibility of our risk factor disclosures. We encourage you to carefully review the risk factors in their entirety for additional information. Some factors, risks, and
3
uncertainties that might materially affect our forward-looking statements and may make an investment in our securities speculative or risky include, but are not limited to, the following:
Risks Related to Our Business and Industry
•Our quarterly results of operations have fluctuated and may continue to fluctuate. As a result, we may fail to meet or exceed the expectations of investors or securities analysts, which could cause our stock price to decline.
•If we are unable to manage our business growth and complex operations, our market reputation and ability to generate net sales from new or existing integrators and end consumers may be harmed.
•Markets in which we participate are highly competitive and many companies, including large technology companies, retailers, electronics distributors, broadband and security service providers, and other managed-service providers, are actively targeting our markets. Our failure to differentiate ourselves and compete would make it difficult to add and retain customers, and our sales and profitability could be adversely affected.
•If we are unable to develop new solutions, sell our solutions into new markets or further penetrate our existing markets, or if we fail to make optimal strategic investment decisions, our net sales may not grow as expected or may decline.
•End consumers may choose products with discrete functionality or DIY (as defined below) solutions rather than adopt our professionally installed solutions. If we are unable to increase market acceptance of our professionally installed solutions, our net sales may stagnate or decline.
•We have limited visibility regarding end consumers who ultimately purchase our products, and often rely on information from third-party integrators. If we are unable to obtain timely or accurate information, our ability to quickly react to market changes and effectively manage our business may be harmed.
•Our growth strategy includes pursuing acquisitions, and our potential inability to identify good opportunities and to integrate newly acquired technologies, assets, businesses, or personnel may harm our financial results and ability to grow.
•We have entered into strategic arrangements and intend to pursue additional future opportunities. If the intended benefits from our strategic relationships are not realized, our results of operations may be harmed.
Risks Related to Our Products, Cybersecurity and Privacy, and Intellectual Property
•If we are unable to adapt to change and implement technological and aesthetic enhancements to our products, this could impair our ability to remain competitive.
•Product quality issues and a higher-than-expected number of warranty claims or returns could harm our business and operating results.
•Cyberattacks and security breaches affecting us, our business partners or our end consumers could result in unauthorized use of our products or associated confidential information — leading to harm in our reputation or brand, legal or regulatory enforcement actions, and lawsuits. These actions may have a material adverse effect on our business, results of operations, and financial condition.
•If we fail to protect our intellectual property rights, are unable to maintain our third-party licenses, or are unable to effectively defend against third-party infringement allegations, our business could be harmed. Further, the open-source software in our solutions may expose us to additional risks.
Risks Related to Our Manufacturing and Supply Chain, and International Operations
•We currently rely on contract manufacturers to manufacture our products and on component vendors to supply parts used in our products. We also distribute products manufactured by other companies. Any disruption in our
4
supply chain, including the global supply chain issues affecting shipping, or our failure to successfully manage our relationships with our suppliers or logistics partners or existing tariff rates and other import/export regulations could harm our business.
•Potential political instability and tensions in China, Taiwan, and Southeast Asia, where the concentration of our suppliers and manufacturing facilities are located, could expose us to supply disruptions, cost increases, and regulatory changes. The supply and shipping of our products could also be negatively affected by conflicts related to Russia/Ukraine and Israel/Hamas and the Red Sea.
•We could be harmed by violations of various international trade and export laws in jurisdictions in which we operate, including the U.S. Foreign Corrupt Practices Act, the U.K. Bribery Act or similar anti-corruption laws.
Risks Related to Our Indebtedness and Financial Statements
•Our substantial indebtedness could materially adversely affect our financial condition and ability to operate our business, react to changes in the economy or industry or pay our debts and meet our debt obligations, and could divert our cash flow from operations for debt payments.
•We may be required to make payments under our contingent value rights agreement with certain former stockholders.
Risks Related to Our Common Stock
•We are controlled by Hellman & Friedman, LLC (“H&F”), whose interests may be different from the interests of other holders of our securities.
•As we realize the benefit of net operating losses and certain other tax benefits that arose prior to or in connection with our IPO, we are required to pay the Tax Receivable Agreement (“TRA”) Participants and make a cash distribution to certain pre-IPO owners that are not TRA Participants, equal to a significant portion of the benefit, which amounts could be material.
•Our management team identified a material weakness in our internal controls over financial reporting, which, if not remediated appropriately or timely, could result in the loss of investor confidence and could negatively impact our stock price and financial condition.
5
Part I
Item 1. Business
Our Vision
Bringing together people, integrators, and products to deliver joy, connectivity, and security in our users’ everyday lives.
Our Company
Snap One powers smart-living by enabling professional integrators to deliver seamless experiences in the connected homes and businesses where people live, work, and play. We offer an end-to-end product ecosystem delivered through our powerful distribution network and further bolstered by our value-added services and workflow solutions. Collectively, we leverage this compelling value proposition to deliver a differentiated experience to our loyal and growing network of approximately 20,000 professional do-it-for-me (“DIFM”) integrators. We believe that our value proposition is embedded into integrators’ workflow throughout the project lifecycle, which creates re-occurring spending patterns that strengthen our integrator relationships, and enhance our revenue visibility across our integrator base.
We are vertically integrated, with the majority of our net sales and income from operations coming from our proprietary-branded, internally developed products. These proprietary products are manufactured on an asset-light basis through our network of contract manufacturing and joint development suppliers located primarily in Asia. We have complemented our proprietary product portfolio with a curated set of leading third-party product brands to deliver an end-to-end product ecosystem that provides professional integrators with a “one-stop shop” experience at Snap One.
Our proprietary software solutions enhance the interoperability of our products and enable our emerging portfolio of value-added, subscription-based services. As we advance our penetration of connected homes and businesses, we continue to invest in the expansion of existing and development of new subscription-based services, and we have developed technology and services that make integrators more effective and efficient while improving the experience of the end consumer. We believe our recent introduction of Control4 Connect and Control4 Assist represents a significant development in our effort to grow our service offerings, providing us with enhanced opportunities to generate recurring revenue. We further believe our leadership position and expanding presence in the home and business uniquely positions us to develop and continue to bring to market new high margin, software-driven services that enhance our product suite. We expect to continue to develop these technologies, which we view as critical to delivering the best experiences for our integrators and end consumers.
We support our integrators with a comprehensive suite of software and support solutions, and we engage with our integrators on an omni-channel basis, blending the benefits of our comprehensive e-commerce portal with the convenience of our local branch network for same-day product availability. We support our integrators throughout the entire project lifecycle from pre-sale product research and system design to post-installation end-consumer support via our proprietary OvrC software, which enables integrators to remotely manage, configure, and troubleshoot devices in the field. Our OvrC software platform also powers our remote support services that generate operational efficiency for our integrators by reducing the customer service workload, and our Parasol and Control4 Assist solutions allow our integrators to offload additional customer care responsibilities to us. We believe our solutions make it easier for professional integrators to drive customer satisfaction and profitably grow their businesses, contributing to increased retention and wallet share growth with us over time.
Our Market Opportunity
The growing global residential and commercial technology market is comprised of Do-It-Yourself (“DIY”) and Do-It-For-Me (“DIFM”) solutions. The DIFM sub-market we serve is distinct from the DIY sub-market, and it is characterized by consumers with higher service expectations, more complicated projects, higher income, and increased reliance on service professionals in other parts of their lives. DIFM consumers typically spend $10,000 to $20,000 for professional integrators to design, select the best products, and install and configure these systems. Each of these projects represents an opportunity for Snap One to provide the products integrators need to service their customers.
6
We transact with approximately 20,000 active domestic DIFM integrators across the home technology, security, and commercial markets, and we have additionally identified approximately 35,000 highly relevant prospective partners in our network. More broadly, there are over 100,000 domestic professionals in adjacent functions such as HVAC, electrical, pool automation, and irrigation that are incremental to our network but within our directly addressable market because their end consumer’s needs often overlap with the solutions that we offer. Consumers’ increasing desire to have an integrated, easy-to-use system is expected to drive continued demand for DIFM solutions across the home technology, security, and commercial markets. In addition, we believe the market for continued geographic expansion represents a significant opportunity for Snap One given our modest presence outside the United States today.
Our Differentiated Solution
We believe our integrated platform of products, software, and support solutions that are embedded into the integrator’s workflow is unmatched in the industry. We simplify the challenges associated with designing a smart-living system and enable our integrators to create optimal solutions that are cohesive, functional, and efficient. Every decision we make is through the lens of empowering integrators to run their businesses more efficiently while delivering immersive smart-living experiences. This results in a long-term partnership in our shared mission to bring joy, connectivity, and security into end consumers’ everyday lives.
Our End-to-End Product Ecosystem
Our product and service offerings encompass all of the design elements required by integrators to build exceptional integrated smart-living systems that are easy to install and simple to manage, serving the needs of both integrators and end consumers. Our deep relationships with our individual integrators provide us the real-time feedback that allows us to continuously improve our offerings.
•Proprietary Products and Software. We have developed a broad range of proprietary products that encompass the spectrum of solutions needed to deliver integrated smart-living systems. These products and software are sold under our proprietary brands such as Araknis, Control4, Luma, and Wattbox with confidential wholesale prices that allow integrators to maintain their profitability. Our products, software, and service offerings are designed to meet the unique needs of both the integrator and the DIFM end consumer. We do this by delivering a high quality and reliable cross-category integrated solution that connects easily to our proprietary solutions and third-party products. In addition, many of our solutions include firmware to allow for a high degree of configurability with useful management tools, making it easy for integrators and our support teams to provide mission critical post-installation support. Through our proprietary software platforms, Control4 OS3 and OvrC, we allow integration with thousands of products manufactured by hundreds of third-party manufacturers, and our products are compatible with connected devices from leading brands such as Alphabet, Amazon, Apple, Samsung, Sony, Sonos, and Yamaha, allowing end consumers to enjoy and control their integrated system with the products and devices they know and love.
•Third-Party Products. In addition to our proprietary solutions, we distribute a curated set of leading third-party products from brands such as Alphabet, Amazon, KEF, Klipsch, Lutron, Samsung, Sony, Sonos, Ubiquiti, and Yamaha, which provide our integrators a one-stop shop for their product needs. We believe this increases the value we deliver to our integrators, expands the application of our workflow solutions, and drives integrator retention and growth. Our third-party product offerings also deliver significant value to our third-party partners. We provide these partners with enhanced access to our expansive network of integrators through our omni-channel model, providing software solutions which enable these third-party products to be more easily integrated into a system, and supported after installation.
Our Software and Services Solutions
Our technology and software tools are designed to support the integrator throughout the project lifecycle, enhancing their operations and helping them to profitably grow their businesses. We believe our suite of embedded solutions is unique, further differentiating Snap One from the rest of the smart-living market and driving stickiness and wallet-share growth with our integrators.
7
▪Integrator Project Lifecycle Service and Support. We provide comprehensive certification and award-winning training and support services, enabling integrators’ ongoing success and business efficiency. Our comprehensive services are delivered through multiple channels, including through our cloud software, on our e-commerce portal, and at our local branches. Our services encompass the integrator project lifecycle from research and training through post-installation support. Additionally, we have a dedicated team of technical experts who help integrators with product awareness, product training, and on-the-job troubleshooting support to ensure the best solutions are delivered to end consumers using best practices. We believe the 14 CE Pro Quest for Quality Awards we won in 2023 are a testament to the value of our service and support programs for integrators.
▪Cloud-Based Software. We have developed a suite of proprietary cloud-based software solutions that are embedded in the integrator’s workflow through the project lifecycle and enable remote management and monitoring of connected devices after installation, significantly increasing efficiency by reducing the need for time-consuming and costly onsite service calls. Our Control4 Composer tool provides an easy-to-use interface that helps integrators configure highly customized control systems for end consumers. OvrC is a cloud-based software, which enables integrators to remotely monitor, troubleshoot, and manage connected devices on a system. While basic OvrC functionality is generally available to most integrators, OvrC provides a foundation for our premium and subscription-based end-consumer support services described below. Together our cloud-based software solutions provide the necessary tools to allow integrators to ensure that their customers’ mission-critical systems are installed properly and supported thereafter, resulting in consistent, highly personalized, and immersive experiences.
•End-Consumer Support Services. In January of 2024, we announced the release of two innovative, subscription-based support services: Control4 Connect and Control4 Assist. Control4 Connect is an essential software service that will be required with all future installations of Control4 systems. The subscriptive services provides continuous access to the latest security and software updates, enables monthly system insight reports, improves the system handoff experience for both the integrator and the end user, and offers a wide array of in-app education, a feature previously requested by many of our end consumers. Control4 Assist is a robust remote support plan that offers direct access to a qualified team of Control4 professionals employed by Snap One. Control4 Assist provides remote troubleshooting capabilities, proactive system monitoring, and live, one-on-one video assistance. Along with our existing Parasol and 4Sight offerings, we believe that Control4 Connect and Control4 Assist provide a meaningful growth opportunity for the Company and integrators while significantly improving the long-term satisfaction of the end consumer. We believe these new offerings provide a platform that will enable us to offer additional services in the future that will further enhance the functionality and value of our systems to end consumers.
▪Omni-Channel Model. We provide a comprehensive e-commerce portal for smart-living, which is tailored to allow integrators to research products, design projects, receive training and certifications, order products, and solicit ongoing support. It provides targeted content and compelling narratives to drive meaningful interactions with integrators who typically visit the portal an average of ten times to research, train, design, and build an estimate for each purchase. We supplement our e-commerce portal with a growing footprint of 45 North American branch locations as of December 29, 2023. These local branches are key to supporting our growth strategy and delivering additional value to integrators by ensuring they can receive critical products on a same-day basis to support project requirements, while attending in-person trainings and using local demonstration rooms to test new products.
The integration of our end-to-end product and software ecosystem and support workflow drives industry-leading efficiency for our integrators. We believe we set the industry standard for ease of use for integrators, which drives loyalty and increased use of our platform over time.
Our Integrated Platform and Services
Our end-to-end product, software, and services create an integrated platform of leading offerings, which drives significant value for our integrators and personalized, immersive experiences for end consumers.
8
Our Products
We sell products under our proprietary brands, as well as leading third-party products, to provide our end consumers with personalized smart-living solutions. Our products are designed to meet the needs of professional integrators and the distinct consumer segment they serve by delivering reliability, configurability, and useful management tools, which provide experiences that delight consumers and enable seamless post-installation support. Our comprehensive proprietary and third-party product portfolio provides a one-stop shop experience for our integrators, with particular strength in home technology and demonstrated success in commercial applications. Over the years, integrators have come to us knowing they can benefit from our superior-value proposition through access to our leading proprietary products, as well as a selection of premium-quality third-party products in the marketplace. We believe our mutually beneficial relationships with third-party partners differentiate us from others in the industry.
Our product portfolio extends across the Connected, Entertainment, and Infrastructure product categories:
•Connected. We provide technology products that connect to the network and directly enable the personalized experiences that our end consumers desire, and our Connected portfolio is enhanced by our proprietary software offerings that enable the integration and remote management of installed systems. End consumers directly interface with these connected solutions via touch panels, remotes, and lighting keypads. Our Connected product portfolio includes networking, control and lighting, surveillance, and power.
•Entertainment. We provide a range of high-quality Entertainment products for indoor and outdoor solutions to deliver immersive experiences for end consumers. Our Entertainment products are designed to deliver on the desired end-consumer expectations while also providing ease of use and installation efficiency for our integrators. Our outdoor Entertainment products contain specialized features, including weatherization, to enrich backyard experiences for our end consumers. Our Entertainment product portfolio includes audio and video products and media distribution.
•Infrastructure. Our Infrastructure products are foundational to every installation. These products are typically behind-the-wall or less visible to the end consumer than the rest of our product portfolio. Accordingly, our Infrastructure products are often an integrator-preference item, so we engineer our solutions with reliability, ease of installation, and integrator workflow in mind. Our Infrastructure product portfolio includes structured wiring and cables, racks, and mounts.
Our Software Solutions
Our software solutions enable our integrators to provide personalized connected systems for end consumers. Our proprietary OvrC system provides integrators with a cloud-based remote-management and monitoring solution that enables integrators to troubleshoot connected devices and systems remotely. Integrators can now efficiently support and update installed systems without making an on-site visit. This saves the integrator time and money and enables a timelier resolution improving end consumers’ satisfaction.
Additionally, our Control4 OS3 system is our leading product for command and control of smart-living systems. We have expanded our control platform capabilities and meaningfully enhanced the end-consumer experience through the integration of audio, video, lighting, temperature, security, communications, voice, and other functionalities throughout the home.
Our OvrC and Control4 OS3 software provide the foundation supporting the pillars of our growth strategy, which we have built upon to launch and monetize value-added services for end consumers. Control4 Connect and Control4 Assist leverage our existing software to create unique subscription-based solutions that generate recurring revenue, while greatly enhancing the end-consumer experience. These new services significantly enhance our software platform and will enable us to build future service innovations and offerings, and we believe our efforts will establish us as a leader in the industry’s expansion of recurring, subscription-based service models.
9
Our Services Support the Entire Integrator Project Lifecycle
•Research and Learn. Integrators utilize our e-commerce portal for research and learning. We offer extensive product descriptions, specifications, education, videos, supporting documents, and solutions-based merchandising to allow integrators to research different options for their projects. We further leverage our local branch footprint to host training events and product demonstrations in certain geographic markets.
•System Design and Quote. Our design tools give integrators access to technical drawings and computer-aided design files to ensure they are selecting the right products for the application. These tools enhance integrator efficiency and provide continuity for integrators to convert quotes to product orders under our confidential integrator pricing that protects their profitability.
•Order and Fulfillment. We provide our integrators with the convenience to order and receive products on an omni-channel basis. Our nationwide distribution network allows us to efficiently serve integrators through reliable delivery, while our local branch network provides integrators with same-day product availability to keep projects on track.
•Install, Set-Up, and Program. We have award-winning support services available through our online portal. In addition to our robust catalog of online content, our product support technicians serve as an outsourced technical team that supports our integrators’ success. In addition, our Control4 Composer software tool provides an intuitive interface that enables integrators to efficiently configure systems during installation.
•Business Administration. Integrators can use our platform to access invoices, track orders, view customer order history, and manage returns. Through these various points of interaction with our integrators, we have a robust data set, which we analyze to target promotions, and identify cross-selling and up-selling opportunities.
•Ongoing Support. We provide our integrators with on-going monitoring capabilities so they can deliver superior service to their customers. Our OvrC and subscription-based offerings, such as Parasol and Control4 Assist, create increased efficiency, enabling us and our integrators to monitor systems and fix issues remotely, reducing the need for inefficient service calls.
Our Software and Product Development
We have a robust Research and Development (“R&D”) organization that focuses on the development of new products, software, and technology-driven workflow solutions as well as the enhancement of our existing solutions. Our product and software development process fosters an innovation feedback loop whereby we leverage end-consumer and integrator feedback to continually enhance existing solutions. We partner with manufacturers to reliably and rapidly bring new product technology to market and reduce R&D investment risk. We focus our internal product development efforts on the application of these leading technologies to the specific challenges faced by integrators and their customers. Our strategy of “fast following” major technology standards while investing in differentiation for the integrator allows us to maintain market-leading products with an efficient, innovative, and capital-light organization. We believe our products are the best-of-breed in their respective categories, and we expect to continue to invest substantial resources in R&D to expand our integrated platform of products, software, and workflow solutions.
Omni-Channel Distribution and Manufacturing
Our nationwide distribution network allows us to service integrators through reliable delivery and local fulfillment. Our proprietary products are received at one of our four strategically located U.S. distribution centers, along with a selection of third-party products, which allows our integrators to bundle their purchases for an entire job with one partner either through our leading e-commerce site or for local purchase and/or pickup at one of our 45 North American local branches. These local branches are key to delivering additional value to our integrators, as we can in many cases provide same-day delivery of products that integrators may require for projects. Same-day delivery can be mission critical for integrators as the lack of any one component can stall a project. Our local branches are more than fulfillment centers as they also provide value-added services to integrators throughout the project lifecycle.
10
In addition to our internal capabilities, we partner with a network of contract manufacturing and joint-development suppliers to produce our proprietary products. Our supply chain teams, both in the United States and internationally, partner closely with our suppliers through design, sourcing, quality validation, and logistics to ensure high-quality, high-availability products for our integrators. Most of our proprietary product production costs are with Asia-based suppliers. We maintain contractual and operational safeguards designed to align with our suppliers and ensure high standards of quality. In addition to the work we do with our supplier partners, we perform full custom manufacturing of our Triad speaker line in Portland, Oregon along with light assembly of certain products at our distribution locations.
Sales and Marketing
Our e-commerce portals are the heart of our marketing and sales strategy. Our strategy is to make these portals the primary place for integrators to research products, design projects, receive training and certifications, order products, and receive ongoing support. We drive engagement with integrators via digital marketing campaigns, a multi-faceted integrator rewards program, high-quality content, and digital tools for training, research, management, and other integrator needs.
To supplement these portals, we have invested in a multi-faceted sales and marketing organization that allocates effort across our channel based on the opportunity size of the integrator. We operate our sales effort through a combination of local branch sales personnel, outside sales representatives, and in-house sales development resources. In addition, our strong integrator rewards program allows us to drive new integrator additions and increase integrator spend by providing spending and loyalty-based rewards such as free shipping, discounted pricing, advanced replacements, and quarterly rebates.
We are active participants at global industry conferences and maintain a significant presence at Custom Electronics Design and Installation Association (“CEDIA”) trade shows.
Our Competition
The smart-living market is fragmented, highly competitive and continually evolving. We compete against smart-living and point-product companies such as Alarm.com, Alphabet, Amazon, Apple, Crestron, Lutron, Savant, Sonos, and Ubiquiti. Many of these companies have significant market share, diversified product and service lines, well-established supply and distribution systems, strong worldwide brand recognition, loyal customer bases, and significant financial, marketing, research, development, and other resources. Their presence in the market has increased consumer awareness for smart-living solutions and has helped contribute to the robust growth of the entire market and demand for our integrated solutions. In a number of cases, our competitors are also our partners within our third-party product ecosystem, and their products are purchased by integrators through Snap One. We also compete with distributors in local markets who distribute similar products to professional integrators.
We expect to encounter new competitors as we enter new markets as well as increased competition, both domestically and internationally, from other established and emerging smart-living-focused businesses. Our current and potential competitors may also establish cooperative relationships among themselves or with third parties and rapidly acquire significant market share. In particular, we may compete with large technology companies that offer control capabilities among their products, applications, and services, and have ongoing development efforts to address the broader smart-living market. Such companies may have longer operating histories, significantly greater financial, technical, marketing, distribution or other resources, and greater name recognition. In some instances, we may have commercial arrangements with technology or services providers in the connected home market with whom we may otherwise compete and our relationships with both our competitors and partners may change over time.
We believe the principal competitive factors in the smart-living market include the following:
•Simplicity and ease of use for both the integrator and end consumer;
•Ability to offer a broad suite of products and comprehensive solutions;
•Ability to provide efficient and timely distribution on an omni-channel basis;
•Ability to provide secure access to wireless networks;
•Ability to offer persistent awareness, control, and intelligent automation;
•Ability to provide quality product services and support;
•Flexibility of the solutions and ability to customize for the end consumer;
11
•Interoperability with a wide range of third-party devices;
•Pricing, affordability, and accessibility;
•Network of integrators with local installation capabilities; and
•Brand awareness and reputation.
We believe we compete favorably with respect to these factors. In addition, we believe our integrated platform of products and technology-enabled workflow solutions help to set us apart from our competitors.
Our Intellectual Property
Our success and ability to compete effectively depends, in part, on our ability to protect our proprietary technology and to establish and adequately protect our intellectual property rights. To establish and protect our proprietary rights, we rely upon a combination of patent, copyright, trade secret and trademark laws, and contractual restrictions such as confidentiality agreements, licenses, and intellectual property assignment agreements. We maintain a policy requiring our employees, contractors, consultants, and other third parties to enter into confidentiality and proprietary rights agreements to control access to our proprietary information. These laws, procedures, and restrictions provide only limited protection, and any of our intellectual property rights may be challenged, invalidated, circumvented, infringed, or misappropriated. Furthermore, the laws of certain countries do not protect proprietary rights to the same extent as the laws of the United States, and we therefore may be unable to protect our proprietary technology in certain jurisdictions.
As of December 29, 2023, domestically we had over 100 active patent grants and pending patent applications, and over 100 registered trademarks and pending trademark applications. We continue to review our product development and efforts to assess the existence and patentability of new intellectual property. We also enter into commercial arrangements with our third-party product partners to provide integration with our ecosystem and sell their products through our e-commerce portal and local branch network.
Human Capital
Our employees are central to our vision of “bringing together people, integrators, and products to deliver joy, connectivity, and security in our everyday lives.” Everything we do begins with our people, and recruiting, developing, and investing in top talent is critical to our success.
As of December 29, 2023, we had 1,610 full-time employees, including 369 in product development, 446 in sales and marketing, 593 in operations, and 202 in general and administrative. Of the 369 employees on our product development team, 198 were software engineers. Of our full-time employees, 1,359 were in the United States and 251 were in our international locations. None of our employees are represented by a labor union and/or covered by a collective bargaining agreement. We have not experienced any work stoppages.
We strive to foster a positive, collaborative, and inclusive working environment that enables our people to thrive and our integrators to succeed. That is why we ask every person who joins Snap One to embrace our four company tenets:
•Be an Owner.
•Obsess over Customers.
•Be the Best Place to Work.
•Learn Every Day.
Consistent with our tenets, Snap One values diversity and belonging. Our solutions integrate thousands of unique products into smart homes and businesses, and similarly we believe that a truly innovative workforce should integrate employees with varied knowledge, experience, and backgrounds to best promote innovation and growth. We rely on the differences in who we are, how we think, and what we have experienced to create a greater sense of community. For example, employees in our Company-sponsored inclusion groups support and promote mutual objectives of both the employees and the Company, such as inclusion, diversity, and employees’ professional development. Our Diversity, Equity, and Inclusion Council also promotes our shared vision of equality and belonging. Our emphasis on treating people well creates an attractive culture for our employees and enables us to create exceptional experiences for our customers.
12
We strive to provide our employees with career-development opportunities and resources that enable them to grow professionally. This helps us attract and retain a talented and diverse workforce by deepening employee engagement and enhancing the skills of our people. We use skills matrices in which employees’ demonstration of our Company tenets is assessed against the expectations for their responsibility level within the Company and potential future roles. Employees and managers use the assessment results to evaluate employees’ readiness for additional responsibility, create and communicate individual development plans for employees, and identify opportunities that will position them for future professional growth. We supplement our rigorous criteria for assessing employees’ promotion readiness with input from a variety of sources, and we seek to create growth opportunities that go beyond promotions.
Our Focus on Sustainability
Attention to environmental, social, and governance issues is integral to our culture and business strategy to create sustainable growth. We believe being a good environmental and social citizen is not only the right thing to do as a responsible member of our communities, but it also drives long-term value creation. Our mission to make lives more enjoyable, connected, and secure is powered by a commitment to people, privacy, and the planet. Our cross-functional Sustainability Committee, with representation from our People, Product, Supply Chain, Finance, Legal, and IT teams, assists in establishing and implementing our sustainability strategy and drives alignment of our business and sustainability objectives. The strategic focus areas we believe offer the greatest opportunity to drive meaningful impacts and create value are organized under four cornerstone principles: Governance, People, Product, and Planet. Our commitment to these principles is driven by the following high-level goals:
•Ethical Company: Commit to governance practices and policies that promote high ethical standards and maximize the long-term interests of our stakeholders (Principled Governance).
•Employer of Choice: Create safer environments and more equitable and inclusive employee experiences (People).
•Engaged Leader: Create solutions that enable resource efficiency and enhance data security and privacy for end consumers and partners (Product).
•Environmental Steward: Meaningfully reduce our impact on the environment by minimizing our carbon footprint and improving sustainability of operations (Planet).
With leadership from our Board of Directors (the “Board”) and Sustainability Committee, our Company will continue to assess any potential sustainability risks, and develop and adapt our sustainability and business strategies to align with our goals.
Available Information
We file annual, quarterly, and current reports, proxy statements and other information with the SEC. Our SEC filings are available to the public at the SEC’s website at www.sec.gov. Our SEC filings are also available free of charge under the Investor Relations section of our website at www.snapone.com as soon as reasonably practicable after they are filed with or furnished to the SEC. We may use our website as a distribution channel of material Company information, including financial and other important information. Our website and the information therein is not incorporated by reference into this Annual Report.
13
Item 1A. Risk Factors
RISK FACTORS
You should carefully consider the risks and uncertainties described below, as well as the other information in this Annual Report, including our consolidated financial statements and the related notes, and the section titled “Management’s Discussion and Analysis of Financial Condition and Results of Operations,” in evaluating our Company. The occurrence of any of the events or developments described below could materially and adversely affect our business, financial condition, results of operations, and growth prospects.
Additional risks and uncertainties not currently known to us or that we currently believe are not material may also impair our business, financial condition, results of operations, and growth prospects.
Risks Related to Our Business and Industry
Our quarterly results of operations have fluctuated and may continue to fluctuate. As a result, we may fail to meet or exceed the expectations of investors or securities analysts, which could cause our stock price to decline.
Our quarterly net sales and results of operations have fluctuated and may continue to fluctuate as a result of a variety of factors, many of which are outside our control. If our quarterly net sales, results of operations, or profitability fall below the consensus expectations of investors or securities analysts, our common stock price could decline, perhaps substantially.
Fluctuations in our results of operations may be due to a number of factors, including but not limited to:
•Demand for and market acceptance of our solutions;
•Our ability to develop and maintain relationships with productive independent integrators and incentivize them to continue to market, sell, install, and support our solutions;
•The ability of our contract manufacturers to continue to manufacture high-quality products and to supply sufficient products to meet our demand;
•The timing and success of future acquisitions, new product and service releases or upgrades by us, or our competitors;
•The strength of regional, national, and global economies;
•The strength of the U.S. dollar relative to other currencies and the impact this has on both our margins and the margins of our integrators and distributors and their ability to competitively sell our solutions to end consumers;
•The impact of harsh seasonal weather, natural disasters, or man made problems such as war or terrorism;
•Changes in our business and pricing policies, or those of our competitors;
•Competition, including entry into the industry by new competitors and new offerings by existing competitors;
•Macroeconomic conditions adversely affecting integrators’ businesses;
•The impact of seasonality on our business and/or the business of integrators;
•A systemic impairment or failure of one or more of our solutions that erodes investor, integrator, and/or end-consumer confidence;
•Changes in applicable tax and tariff rates;
•Changes in interest rates;
•Inflationary pressures on costs and customer demand;
•Political or regulatory changes in the markets in which we operate, particularly current political tensions in Asia, Eastern Europe, and the Middle East;
•The cost and availability of raw materials or component parts used in our solutions;
•The cost and availability of third-party products that we distribute but do not manufacture;
•Aggressive business tactics by our competitors, including: selling at a discount, offering products on a bundled basis at no charge, extensive marketing efforts, and providing financing incentives;
•The amount and timing of expenditures, including those related to expanding our operations, increasing research and development, introducing new solutions or costs related to disputes and litigation;
•Temporary discounts or permanent changes in the price or payment terms for our solutions; and
14
•Our ability to retain key people given the decline in our stock price.
Due to the foregoing factors and other risks discussed herein, you should not rely on quarter-to-quarter comparisons of our results of operations as an indication of our future performance, nor should you consider any net sales growth or results of operations in any quarter to be indicative of our future performance.
If we are unable to manage our business growth and diverse and complex operations, our reputation in the market and our ability to generate net sales from new or existing integrators and end consumers may be harmed.
Because our operations are geographically diverse and complex, our personnel resources and infrastructure could become strained and our reputation in the market and our ability to successfully implement our business plan may be harmed. The growth in the size, complexity, and diverse nature of our business and the expansion of our product lines and customer base, including through additional acquisitions, have placed increased demands on our management and operations, and further growth, if any, may place additional strains on our resources. Our ability to effectively compete and to manage our operations may depend on, among other things:
•Maintaining institutional knowledge by retaining and expanding the core competencies critical to our operations in our senior management and key personnel;
•Increasing the productivity and efficiency of our existing employees and attracting new talent;
•Maintaining existing productive relationships and developing new productive relationships with independent contract manufacturers, integrators, and third-party products suppliers;
•Improving our operational, financial, and management controls; and
•Improving our information reporting systems and procedures.
If we do not manage the size, complexity, and diverse nature of our business effectively, we could experience delayed product releases and longer response times by our integrators in assisting our end consumers in implementing our solutions, and could lack adequate resources to support end consumers on an ongoing basis, any of which could harm our reputation in the market, our ability to successfully implement our business plan, and our ability to generate net sales from new or existing end consumers.
The markets in which we participate are highly competitive and many companies, including large technology companies, retailers, electronics distributors, broadband and security service providers, as well as other managed service providers, are actively targeting our markets. Our failure to differentiate ourselves and compete successfully against these companies would make it difficult for us to add and retain end consumers, and our sales and profitability could be adversely affected.
The markets for our solutions are highly competitive and continually evolving. We face direct competition from companies that sell technology solutions to professional integrators, such as ADI, Crestron, and Savant. In addition, a number of technology companies, including industry leaders such as Amazon, Apple, Alphabet, Honeywell, Lutron, Sonos, and Samsung, offer devices with capabilities similar to many of our products and services and are engaged in ongoing development efforts to address even broader segments of various markets, including our core professionally installed electronics markets. These large technology companies already have broad customer awareness and sell a variety of devices for home and business, and end consumers may choose their offerings instead of ours, even if we offer differentiating features such as broader interoperability or remote management and control services, as well as superior products and services. Additionally, these and other companies may further expand into our industry by developing additional solutions or by acquiring other providers. Similarly, many managed service providers, such as cable TV, telephone and security companies, are offering products and services that may compete directly with our solutions, including remote management, automation, and control features. For example, Vivint and ADT have made significant efforts to market smart-home services that incorporate these companies’ traditional security offerings. These managed service providers have the advantage of leveraging their existing customer base, network of installation and support technicians, and name recognition to gain traction in our core markets. In addition, end consumers may prefer the monthly service fee with little to no upfront cost offered by some of these managed service providers over a larger upfront cost with little to no monthly service fees.
We expect increased competition from these large technology companies, retailers, managed service providers, and other companies. This increased competition could result in pricing pressure, reduced sales, lower margins, or the failure of
15
our solutions to achieve or maintain broad market acceptance. To remain competitive and maintain our position as a leading provider of professionally installed electronics solutions for connected homes and businesses, we will need to invest continuously in product and platform development, marketing, integrator service and support, and product-delivery infrastructure. We may not have sufficient resources to continue to make the investments in all areas needed to maintain our competitive position. In addition, many of our competitors have longer operating histories, greater name recognition, larger customer bases and significantly greater financial, technical, sales, marketing, and other resources than us, which may provide them with an advantage in developing, marketing or servicing new solutions. Increased competition could reduce our market share, net sales, and operating margins, increase our operating costs, harm our competitive position, or otherwise harm our business and results of operations.
In addition, we believe it is likely that some of our existing competitors will consolidate or be acquired. Some competitors may enter into new alliances with each other or may establish or strengthen cooperative relationships with systems integrators, distributors, third-party consulting firms, or other parties. Additional consolidations, acquisitions, alliances, or cooperative relationships, or new product introductions, could lead to pricing pressure, reduce our market share or result in a competitor with greater financial, technical, marketing, service, and other resources than ours, all of which may have a material adverse effect on our business, results of operations, and financial condition.
If we are unable to develop new solutions, sell our solutions into new markets or further penetrate our existing markets, or if we fail to make optimal strategic investment decisions, our net sales may not grow as expected or may decline.
Our ability to increase sales will largely depend on our ability to enhance and improve our solutions in response to evolving customer needs and emerging technological trends, to introduce new solutions in a timely manner, to sell into new markets, and to further penetrate existing markets. The success of any new or enhanced solution depends on several factors, including the timely completion, introduction, and market acceptance of enhanced or new solutions; the ability to attract, retain, and effectively train product development, sales, and marketing personnel (among others); the ability to retain and expand our offered third-party solutions; the ability to develop relationships with independent integrators; and the effectiveness of our marketing programs. Any new or enhanced solution we develop, distribute, or acquire may not be introduced in a timely or cost-effective manner and may not achieve the broad-market acceptance necessary to generate significant net sales. Any new markets into which we attempt to sell our solutions, including new vertical markets, new local distribution locations, and new countries or regions, may not be receptive. Our ability to further penetrate our existing markets depends on the quality of our solutions and our ability to design solutions to meet customer demand. Moreover, we are frequently required to enhance and update our solutions as a result of changing standards and technological developments, which makes it difficult to recover development costs and forces us to continually qualify new solutions with our end consumers and may render our solutions obsolete. In addition, we expect to derive an increasing portion of our net sales in the future from subscription-based solutions. This subscription model may give rise to risks that could harm our business. For example, we may be unable to predict subscription uptake, renewal or upgrade rates and the impact these rates may have on our future net sales and operating results. If we are unable to successfully develop, distribute, or acquire new solutions, or to enhance our existing solutions to meet customer requirements in a timely manner, our net sales may not grow as expected or may decline. Further, if we are unable to sell solutions into new markets or sell our solutions to additional end consumers in our existing markets, or to make optimal strategic decisions in selecting and executing on our acquisition opportunities, our net sales may not grow as expected or may decline.
End consumers may choose to adopt products that provide discrete functionality or Do-It-Yourself (“DIY”) solutions rather than adopt our professionally installed Do-It-For-Me (“DIFM”) solutions. If we are unable to increase market acceptance of the benefits of our professionally installed DIFM solutions, our net sales may stagnate or decline.
Many vendors have emerged, and may continue to emerge, to provide point products with advanced functionality for use in home and commercial applications, such as thermostats, lighting, power distribution units, doorbells, or surveillance systems that can be controlled by an application on a smartphone or control panel. We expect more consumer electronics and appliance products to be network aware and connected — each likely to have its own smart device (phone or tablet) application. Examples of DIY solutions include, but are not limited to, networking, remote monitoring, and audio and audiovisual distribution products that do not require professional assistance to deploy. End consumers may be attracted to the relatively low costs and ease of installation of these DIY products and the ability to expand solutions over time with minimal upfront costs, despite the disadvantages of this approach. While we have built our solutions to be flexible and in many cases support integration of third-party DIY products in our solutions, the adoption of these products may reduce the revenue we receive for each installation. It is therefore important that we provide attractive top-quality solutions in many
16
areas, such as networking, lighting, audio, video, thermostats, surveillance, security, power, and remote monitoring and management, and establish broad market awareness and acceptance of these DIFM solutions as well as the advantages of integrating them in a unified solution supported by a professional integrator. If a significant number of end consumers in our target markets choose to rely solely on the functionality included in DIY solutions rather than acquiring our unified solutions, then our business, financial condition, and results of operations may be harmed, and we may not be able to achieve sustained growth or our business may decline.
We have limited visibility regarding the end consumers who ultimately purchase our solutions, and we often rely on information from third-party distributors and integrators to help us manage our business. If we are unable to obtain timely or accurate information, our ability to quickly react to market changes and effectively manage our business may be harmed.
We sell our solutions primarily through independent businesses, including integrators, distributors, and other commercial partners (collectively “integrators”). These integrators work with end consumers to design, install, update, and maintain their systems. While we are able to track orders from integrators and have access to certain information about the configurations of our systems they install that we receive through our subscription and platform services such as OvrC and Control4, we also rely on these integrators to provide us with information about customer behavior, product and system feedback, customer demographics, buying patterns, and information about our competitors. We use this channel sell-through data, along with other metrics, to assess customer demand for our solutions, develop new solutions, adjust pricing, and make other strategic business decisions. Our channel sell-through data is subject to limitations due to collection methods and the third-party nature of the data and thus may not be complete or accurate. In addition, from time to time we collect information directly from end consumers through surveys and other methods, but the end consumers who choose to participate self-select and vary by geographic region and from period to period, which may impact the usefulness of the results. Customer information is further limited in certain of our business models where a large portion of solutions we sell may not be installed with our platforms and thus further limit our visibility into end consumer behavior, including local distribution and third-party products sales. If we do not receive customer information on a timely or accurate basis, or if we do not properly interpret this information, our ability to quickly react to market changes and effectively manage our business may be harmed.
In addition, because the production of certain of our products requires long lead times, we enter into agreements for the manufacture and purchase of certain of our products well in advance of the time in which those products will be sold. These contracts are based on our best estimates of our near-term product needs. If we underestimate customer demand, we may forego revenue opportunities, lose market share, and damage our relationships. Conversely, if we overestimate customer demand, we may purchase more inventory than we are able to sell at any given time, or at all. If we fail to accurately estimate demand for our solutions, we could have excess or obsolete inventory, resulting in a decline in the value of our inventory, which would increase our costs of net sales and reduce our liquidity. Our failure to accurately manage inventory relative to demand would adversely affect our results of operations.
Our growth strategy includes pursuing acquisitions, and our potential inability to identify good opportunities and to successfully integrate newly acquired technologies, assets, businesses, or personnel may harm our financial results and ability to grow.
We believe part of our growth will be driven by additional acquisitions of other companies or their technologies, assets and businesses, but we may not be able to acquire the targeted technologies, assets and businesses we identify as desirable for a price we consider to be reasonable or at all. Recent acquisitions include Staub Electronics, LTD (“Staub”), Clare Controls, LLC (“Clare”), and Remote Maintenance Systems LP, doing business as Parasol (“Parasol”) in 2022; ANLA, LLC. (“Access Networks”) in 2021; and Control4 Corporation (“Control4”), Custom Plus Distributing, and MRI Premium Distributing Services in 2019. These acquisitions and any future acquisitions we evaluate and complete will give rise to risks, including:
•Incurring higher-than-anticipated capital expenditures and operating expenses;
•Failing to assimilate the operations and personnel, or failing to retain key personnel of the acquired company or business;
•Failing to integrate the acquired technologies into our solutions, or incurring significant expense to do so;
•Disrupting our ongoing business;
•Dissipating or diverting our management resources;
17
•Failing to maintain uniform standards, controls, and policies;
•Incurring significant costs and accounting charges;
•Impairing relationships with employees, integrators, distributors, partners, or end consumers;
•Finding that the acquired technology, assets or business does not further our business strategy, that we overpaid for the technology, assets or business, or that we may be required to write off acquired assets or investments partially or entirely;
•Failing to realize the expected synergies of the transaction;
•Being exposed to unforeseen liabilities and contingencies that were not identified and mitigated during diligence conducted prior to acquiring the company, including but not limited to the risk that the products or services of the acquired company violate third-party intellectual property rights or regulatory standards or contain other vulnerabilities;
•Requiring us to use equity capital or obtain additional debt to finance the acquisition, which may not be available on advantageous terms;
•To the extent that we pursue acquisitions in non-U.S. markets, becoming subject to new regulatory regimes in which we have limited experience;
•Being unable to generate sufficient net sales from acquisitions to offset the associated acquisition costs;
•Fully integrating acquired technology, assets, business, or personnel into our operations may take a significant amount of time and resources; and
•Acquisitions could include significant goodwill and intangible assets. The amortization of such intangible assets would reduce our profitability and there may be future impairment charges that would reduce our stated earnings.
In addition, we may pursue business opportunities that diverge from our current business model, including expanding our solutions into lines of business with which we have minimal experience, investing in new and unproven technologies, and expanding our existing sales channels or adding new sales channels. We can offer no assurance that any such new business opportunities will prove to be successful. Among other negative effects, our pursuit of such business opportunities could reduce operating margins and require more working capital, or may have a material adverse effect on our business, results of operations, and financial condition. Acquisitions also could impact our financial position and capital needs, or cause fluctuations in our quarterly and annual results of operations. To the extent we do not successfully avoid or overcome the risks or problems related to any such acquisitions, our results of operations and financial condition could be harmed.
Additionally, in recent years, a substantial number of special purpose acquisition companies (“SPACs”) have been formed. These SPACs may increase the competition for potential targets and as a result fewer attractive targets may be available at any given time, and it may require more time, effort and resources to identify suitable targets and consummate acquisitions.
We have entered into several strategic arrangements and intend to pursue additional strategic opportunities in the future. If the intended benefits from our strategic relationships are not realized, our results of operations may be harmed.
We are working to develop relationships with strategic partners to increase awareness of our solutions, offer products not currently included in our product portfolio, and attempt to reach markets we cannot currently address in a cost-effective manner. If these relationships do not develop in the manner we intend, our future growth could be impacted. Any loss of a major partner, distribution channel or other channel disruption could harm our results of operations and make us more dependent on alternate channels; damage our reputation; increase pricing and promotional pressures from other partners and distribution channels; increase our marketing costs; or harm buying and inventory patterns, payment terms, or other contractual terms.
Growth of our business may depend on market awareness and a strong brand, and any failure to develop, broaden, protect, and enhance market awareness of our solutions could hurt our ability to retain or attract integrators and/or end consumers.
Because of the competitive nature of the professionally installed electronics market, and other markets where we operate, we believe building and maintaining market awareness, brand recognition and goodwill is key to our success. Doing so will depend largely on our ability to continue to provide high-quality solutions, and we may not be able to do so effectively. We may choose to engage in broader marketing campaigns to further promote our brand, but this effort may not be successful. Our efforts in developing our brand may be affected by marketing efforts of our competitors, negative
18
publicity and social media commentary, and by our reliance on our independent integrators, distributors, and strategic partners to install our solutions and promote our brand effectively. In addition, these marketing efforts may not yield the results we anticipate and may prove more expensive than we currently anticipate, and our net sales may not increase sufficiently to offset these higher expenses. If we are unable to maintain and increase positive awareness of our brand in a cost-effective manner, it may have a material adverse effect on our business, results of operations, and financial condition.
We operate in an emerging and evolving market, which may develop more slowly or differently than we expect. If our core market does not grow as we expect, or if we cannot expand our solutions to meet the demands of this market, our net sales may suffer, we may incur operating losses, and our results of operations may be harmed.
The market for professionally installed electronics is evolving, and it is uncertain whether our solutions will achieve and sustain high levels of demand and market acceptance. Some integrators and/or end consumers may be reluctant to use our solutions for a number of reasons, including satisfaction with other solutions, cost concerns, and lack of awareness. Unified solutions such as ours have traditionally been luxury purchases for the high-end residential market, and are also popular in commercial markets, and while our solutions target luxury residential and commercial markets, we also have solutions that target middle- and entry-level homeowners and those who live in or operate multi-dwelling units. Our ability to expand the sales of our solutions to a broader customer base depends on several factors, including market awareness of our solutions; the timely completion, introduction and market acceptance of our solutions; our ability to respond effectively to trends in end consumer preferences and changing technology, the ability to attract, retain, and effectively train sales and marketing personnel; the effectiveness of our marketing programs; the ability to develop effective relationships with independent integrators and other strategic partners; the cost and functionality of our solutions; and the success of our competitors. If we are unsuccessful in developing and marketing our home-automation solutions to integrators and/or end consumers, or if they do not perceive or value the benefits of our solutions, the market for our solutions might not develop or might develop more slowly than we expect, either of which would harm our net sales and growth prospects.
Downturns in general economic and market conditions, including but not limited to downturns in housing and commercial real estate markets and reductions in consumer spending, may reduce demand for our solutions, which could harm our net sales, results of operations, financial condition, and cash flows.
Our net sales, results of operations, and cash flows depend on the overall demand for our solutions and the willingness of our sales channel to invest in marketing our solutions, both of which can be significantly reduced in economic environments characterized by market and interest rate volatility, decreased consumer confidence, high unemployment, declines in residential remodeling and housing starts, decreased demand for commercial real estate and associated renovations, fluctuating exchange rates, and diminished growth expectations in the U.S. economy and abroad. During periods of weak or unstable economic and market conditions, providers of discretionary products and services, such as our home automation and audiovisual solutions, are typically disproportionately affected. In addition, the number of independent integrators may decline, which may have a corresponding impact on our growth prospects. Moreover, many of our integrators are small and mid-size businesses that are more likely to be negatively impacted by downturns in general economic and market conditions. For example, during challenging economic times, end consumers and integrators may face issues in gaining timely access to sufficient credit, which could impair their ability to make timely payments. There is also an increased risk that an increased percentage of our integrators will file for bankruptcy protection or otherwise become insolvent, which may harm our reputation, net sales, profitability, and results of operations. We cannot predict the timing, strength, duration, or impact on our business of any economic slowdown, instability, or recovery, generally or within any geography or industry. Any downturns in the general economic conditions of the geographies and industries in which we operate, or any other factors negatively impacting housing markets or consumer spending, may have a material adverse effect on our business, results of operations, and financial condition.
We have credit exposure to our integrators.
Any adverse trends in our integrators’ businesses could cause us to suffer credit losses. As is customary in our industry, we extend credit to our integrators. Many of our integrators rely on us to provide their businesses with credit and to carry specified inventory to support their operations. We may be unable to collect on receivables if our integrators experience decreased demand for their products and services, do not manage their businesses adequately, or otherwise become less able to pay due to adverse economic conditions or refinancing events. While we evaluate our integrators’ qualifications for credit and monitor our extensions of credit, these efforts cannot prevent all credit losses, and increased credit losses would negatively impact our performance and financial position. In addition, for financial reporting purposes,
19
we establish reserves based on our historical experience of credit losses. To the extent that our credit losses exceed those reserves, our financial performance will be negatively impacted. If there is deterioration in the collectability of our receivables, or we fail to take other actions to adequately mitigate this credit risk, our earnings and cash flows could deteriorate. In addition, if we are unable or unwilling to extend credit to integrators, we may experience loss of contracts or business.
Extending credit to international integrators involves additional risks. It is more difficult to evaluate an integrator’s credit or obtain credit protections in our international operations. Also, credit cycles and collection periods are typically longer in our international operations. We are also subject to credit risk associated with integrator concentration. If one or more of our largest international integrators were to become bankrupt or insolvent, or otherwise were unable to pay for our solutions, due to conflict, financial sanctions or otherwise (such as the instability caused by the Russia/Ukraine or Israel/Hamas and Red Sea conflicts), we may incur significant write-offs of accounts that may have a material adverse effect on our business, financial condition, results of operations, and cash flows. As a result of these factors and other challenges in extending credit to international integrators, we generally face greater credit risk from sales internationally compared to domestic sales.
Our failure to raise additional capital or generate cash flows necessary to expand our operations, invest in new technologies and otherwise respond to business opportunities or unforeseen circumstances in the future could reduce our ability to compete successfully and harm our results of operations.
While we believe our existing cash and cash equivalents will be sufficient to meet our anticipated cash requirements for at least the next 12 months, at some point we may need to raise additional funds, and may not be able to obtain additional debt or equity financing on favorable terms, if at all. If we raise additional equity financing, our security holders may experience significant dilution of their ownership interests and the value of shares of our common stock could decline. If we engage in debt financing, we may be required to accept terms that restrict our ability to incur additional indebtedness, force us to maintain specified liquidity or other ratios or restrict our ability to pay dividends or make acquisitions. In addition, we may be subject to additional interest rate risk to the extent any new debt is subject to variable interest rates. If we need additional capital and cannot raise it on acceptable terms, we may not be able to, among other things:
•Develop and enhance our solutions;
•Expand our research and development, sales, and marketing organizations;
•Hire, train and retain employees;
•Respond to competitive pressures or unanticipated working capital requirements; or
•Pursue acquisition opportunities.
Our inability to do any of the foregoing could reduce our ability to compete successfully and harm our results of operations.
Risks Related to Our Manufacturing and Supply Chain
We currently rely on contract manufacturers to manufacture our products and on component vendors to supply parts used in our products. We also distribute products manufactured by other companies. Any disruption in our supply chain, or our failure to successfully manage our relationships with our suppliers or logistics partners, or existing tariff rates and other import/export regulations could harm our business.
Our reliance on contract manufacturers to produce many of our products reduces our control over the assembly process, exposing us to risks, including reduced control over quality assurance, production costs, and product supply. These risks are heightened because a significant portion of our net sales comes from proprietary products. While we aim to maintain redundancy throughout our supply chain, we rely on a limited number of contract manufacturers to manufacture most of our products and components, and in many cases one of these manufacturers is our only source for a particular product or product family. We also do business with a number of component vendors, and the parts they supply may not perform as expected. We also distribute products supplied by other companies. Most of our contract manufacturers and component vendors, and some of our distributed product suppliers, are located outside of the United States and may be subject to political, economic, social, regulatory, and legal uncertainties that may harm our relationships with them. In particular, potential political instability and tension in China, Taiwan, and Southeast Asia, where a concentration of our suppliers and manufacturing facilities are located, could expose us to supply disruptions, cost increases, and regulatory
20
changes. If we fail to manage our relationships with our suppliers or logistics partners effectively, or if our suppliers or logistics partners experience delays, disruptions, capacity constraints, shortage of raw materials or components, or quality control problems in their operations, our ability to ship products may be impaired and our competitive position and reputation could be harmed. In addition, any adverse change in our suppliers or logistics partners’ financial or business condition could disrupt our ability to supply quality products to our integrators and distributors. Such reliance increases our risks of various supply chain disruptions. For example, most of our United States shipping is supported by a single logistics partner. If we are required to change or replace suppliers or logistics partners, we may lose net sales, incur increased costs, or damage our relationships; or we might be unable to find a new contract manufacturer, component vendor, or supplier of similar distributed products on acceptable terms, or at all. In addition, qualifying a new supplier or logistics provider could be an expensive and lengthy process. If we experience increased demand that our suppliers are unable to fulfill, or if they are unable to provide us with adequate supplies of high-quality products for any reason, we could experience a delay in our order fulfillment, and it may have a material adverse effect on our business, results of operations, and financial condition.
Furthermore, we expect our suppliers, service providers, and other business partners to comply with all legal requirements relating to health and safety, labor relations, the environment, supply chain ethics, and transparency. If any of our suppliers engages in or is perceived to have engaged in legal or ethics violations, we may be unable to continue our relationship with that supplier. If we are required to find alternative sources of supply, qualification of alternative suppliers and the establishment of reliable supplies could result in delays and a possible loss of sales, which may have a material adverse effect on our business, results of operations, and financial condition. Furthermore, the actions of our suppliers could, in certain instances, result in reputational damage to us.
Even when we effectively manage our suppliers and logistics partners, forces outside our control may still disrupt our supply chain. Such factors may include catastrophic events such as the COVID-19 pandemic or semiconductor and chipset factory fires, raw material shortages and price volatility; and sanctions, war, or other geopolitical conflict. These types of events may cause global shortages of various raw materials or components, such as semiconductors, necessary to build our products and may disrupt our ability to fulfill demand for our products. For example, the conflict between Russia and Ukraine strains global production of neon and other inputs used in components of our products, and the conflict between Israel and Hamas could expand and impact oil prices or semiconductor supply. Metal price increases may impact the availability and cost of products containing a high percentage of metal content such as bulk wire, cables, racks, and mounts. In addition, due to recent shipping disruptions in the Red Sea and surrounding waterways caused by attacks on shipping vessels in response to the Israel/Hamas war, we have taken preventative measures to avoid this route for any transportation activity. These alternative routes have not yet affected any of our lead-times or costs but may do so in the future. Further, the earthquake affecting the western region of Japan has interrupted some passive and active component manufacturing locations. These manufacturing locations are now operational, however there may be some continued delays in component inventory shipments from the factory in this region.
Furthermore, there is currently significant uncertainty about the future political relationship between the United States and various other countries, including, but not limited to, China, the European Union, Canada, Vietnam, Russia, and Mexico, with respect to trade policies, treaties, import/export regulations and restrictions, trade embargoes, tariffs and customs duties, and taxes. In 2019, the U.S. administration imposed significant changes to U.S. trade policy with respect to China. Tariffs have subjected certain of our products manufactured overseas to additional import duties of up to 25%, and these tariffs may further increase in the future. The amount of the import tariff and the number and types of products subject to tariffs, trade embargoes and import/export regulations and restrictions have changed numerous times based on action by the U.S. administration, and may change again to our detriment depending on political shifts in the U.S. administration, and to the extent these changes increase our cost structure and we are not able to mitigate such cost increases, such changes may have a material adverse effect on our business, results of operations, and financial condition.
Separately, the U.S. Federal Communications Commission (“FCC”) and Congress have recently enacted restrictions regarding the authorization of new products from certain manufacturers of telecommunications, surveillance, and security products. We continue to address the risks related to these imposed and announced tariffs, as well as other regulations and restrictions which have affected, or have the potential to affect, at least some of our imports. To the extent additional regulations or restrictions are imposed on us, or prior authorizations for existing products are revoked for manufacturers that we use-- for example the manufacturer of our legacy surveillance solutions or any of our current surveillance manufacturers-- and we are unable to shift our production or otherwise reduce the impact before the imposition of any applicable restrictions or regulatory changes, our business, financial condition, cash flows, and results of operations could be adversely affected.
21
After Russia invaded Ukraine in February 2022, the United States and other countries imposed sanctions on Russia and we stopped selling products to our distributor in Russia.
Potential future changes to tariff and duty rates, trade embargoes, and import/export regulations and restrictions could similarly adversely affect our business. Potential future changes to tariff and duty rates, trade embargoes, and import/export regulations and restrictions could similarly adversely affect our business.
Risks Related to Our Products and Services
If we are unable to adapt to technological change and implement technological and aesthetic enhancements to our solutions, this could impair our ability to remain competitive.
The market for professionally installed electronics is characterized by rapid technological change, frequent introductions of new solutions, and evolving industry standards. We must continue to develop new products and services and enhance existing products and services to meet evolving customer needs, and respond to emerging technological trends, including Artificial Intelligence (“AI”). However, product development often requires significant lead-time and upfront investment and our ability to attract new consumers and increase net sales from existing consumers will depend in significant part on our ability to accurately anticipate changes in industry standards and to continue to appropriately fund development or acquisition efforts to introduce or enhance solutions in a timely basis to keep pace with technological developments. This is particularly important with respect to our user interface and other direct customer-interface products including touch screens, remotes, keypads, and televisions. Similarly, if any of our competitors implement new technologies, they may be able to provide more effective or lower-cost products, which could impact sales and decrease our market share. Any delay or failure in the introduction of new or enhanced solutions may have a material adverse effect on our business, results of operations, and financial condition.
Product quality issues and a higher-than-expected number of warranty claims or returns could harm our business and operating results.
Products we sell could contain defects in design or manufacturing. Defects could also occur in the products or components supplied to us. There can be no assurance we can detect and remedy all hardware and software defects, which could result in product recalls, product redesign efforts, loss of net sales, reputational damage, and significant warranty and other remediation expenses. There are several potential examples of product quality issues that could occur. Similar to other electronics, our products have a risk of overheating and causing fire in the course of usage or upon malfunction. We sell power-distribution products that may allow damage to connected devices upon malfunction. We sell a range of racks, mounts, brackets, and other products that support large amounts of weight, over 2,000 pounds in some instances, which may fail to support weight upon malfunction. Any of these defects could result in harm to property or personal injury, which could subject us to liability. If we determine a product does not meet product quality standards or may contain a defect, the launch of such product could be delayed. The costs associated with any protracted delay necessary to remedy a quality issue or defect could be substantial.
We provide warranties on our products ranging from one-year to lifetime. In certain countries we may lengthen product warranties due to local laws and regulations. Material defects in our products could expose us to liability for damages and warranty claims in excess of our current reserves, and we could incur significant costs to correct any defects, warranty claims or other problems. In addition, if any of our product designs are defective or alleged to be defective, we may be required to participate in a recall campaign incurring unplanned expenses. Any negative publicity related to products’ perceived quality could affect our brand image and decrease customer confidence and demand, which could adversely affect our operating results and financial condition. Further, accidental damage coverage and extended warranties are regulated in the United States at the state level and are treated differently within each state. Additionally, outside the United States, regulations for extended warranties and accidental damage vary by country. Failure to correctly interpret regulations concerning extended warranties and accidental damage coverage or implement conformant policies may cause us to incur additional costs, fines, or subject us to additional regulatory requirements.
In addition to failures due to product defects, because our solutions are installed by independent integrators, if integrators do not install or maintain our solutions correctly or if the underlying network or infrastructure in a home or business is not sufficiently robust, our solutions may not function properly. Our end consumers generally judge our
22
performance through their interactions with our integrators and distributors, as well as their day-to-day interactions with the product and the mobile application. If the improper installation or maintenance of our solutions leads to service failures of a product or solution, we could experience harm to our branded reputation, claims by our end consumers, integrators, strategic partners, or developers and we may incur increased expense to remedy the problem, any of which may have a material adverse effect on our business, results of operations, and financial condition.
The performance of and demand for our solutions are impacted by factors outside of our sole control including compatibility and ease of integration with third-party products and services, as well as enabling technology, connectivity, software, and intellectual property that we do not own or control.
Our solutions are designed to interoperate with a wide range of other third-party products, including products in the areas of audio, video, lighting, temperature, power, networking, and security, and we benefit from our relationships with partners that allow our platforms, including OvrC and Control4, to integrate with, and provide features such as control and remote management to, thousands of third-party devices and services. If we do not support the continued integration of our solutions with third-party products and applications, including new and additional products, demand for our solutions could decline and we could lose sales. In addition, companies that provide certain point solutions have eliminated or restricted, and may in the future eliminate or restrict, our ability to integrate with, control, remotely manage, and otherwise be compatible with these products. As a result, we may not be successful in making our solutions compatible with these third-party products and applications or lose functionality in existing systems to the extent that they depend on the ability to integrate with third-party products, which could reduce demand for our solutions. In addition, if prospective consumers require customized features or functions that we do not or cannot offer, then the market for our solutions may be harmed.
Our solutions are deployed in many different locations and user environments. The ability of our solutions to operate effectively can be negatively impacted by many different elements unrelated to our solutions including the performance of enabling technology, integration services, intellectual property that we do not own or control, and the performance of integrators. For example, a user’s experience may suffer from an incorrectly deployed network or other key infrastructure such as cabling or wires. Such perceptions, even if incorrect, could harm our business and reputation.
The prices and costs of the products we manufacture or purchase may be subject to large and significant price fluctuations. We might not be able to pass cost increases through to our end consumers, and we may experience losses in a rising price environment. In addition, we might have to lower our prices in a declining price environment, which could also lead to losses.
We purchase and sell a wide variety of products, the price and availability of which may fluctuate, and which may be subject to large and significant price increases. Our business is exposed to these fluctuations, as well as to fluctuations in our costs for transportation and distribution. Changes in prices for the products that we purchase affect our net sales and cost of goods sold, as well as our working capital requirements, levels of debt, and financing costs. We might not always be able to reflect cost increases in our own pricing. Any inability to pass cost increases on to end consumers may adversely affect our business, financial condition, and results of operations. In addition, if market prices for the products we sell decline, we may realize reduced profitability levels from selling such products and lower revenues from sales of existing inventory stocks of such products.
If we fail to meet our service-level agreement commitments, we could be obligated to provide refunds of prepaid amounts or other credits, which would lower our revenue and harm our business, financial condition, and results of operations.
Certain of our products include service-level agreement commitments. If we are unable to meet the stated service-level commitments, including failure to meet the uptime and response time requirements under our customer agreements due to system failures, or other unforeseeable reasons, we could face terminations with refunds of prepaid amounts or other credits, which could significantly affect both our current and future revenue. Any service-level failures could also damage our reputation, which could also adversely affect our business, financial condition, and results of operations.
23
If we fail to successfully transform our operations to support the sale of software service solutions and to continue to develop competitive software service solutions, our business and prospects could be adversely affected.
Transforming our business to offer and support additional software service solutions requires considerable investment in our organization. Whether we will be successful and will accomplish our business and financial objectives is subject to risks and uncertainties, including but not limited to: customer demand, renewal rates, our ability to further develop and scale infrastructure, our ability to include functionality and usability in such offerings that address customer requirements, our ability and the ability of our partners to transition existing customer implementations and subscriptions to software services, and our costs. If we are unable to successfully establish these new offerings and navigate our business evolution, our business could be adversely affected.
Risks Related to Our Distribution Channels
We rely on our independent integrators to sell our solutions, and if our integrators fail to perform and grow their businesses, our ability to sell and distribute our solutions will be limited, and our results of operations may be harmed.
Most of our net sales are generated through the sales of our solutions by our authorized integrators. We have approximately 20,000 active integrators authorized to sell our solutions. Our integrators are independent businesses that voluntarily sell both our solutions and other companies’ products to end consumers. We provide our integrators with specific training programs to assist them in selling, installing, supporting, and servicing our solutions and the third-party solutions we distribute. We have observed, and expect to continue to observe, high volatility in the monthly, quarterly, and annual sales performance of individual integrators. Although we can make estimated forecasts of cumulative sales of large numbers of integrators, we cannot assure their accuracy collectively or individually. Accordingly, if our actual sales fall short of our expectations, we may not be able to reduce or slow our spending quickly enough to protect margins. In addition, we expect that our net sales, results of operations, and cash flows may continue to fluctuate on a quarterly basis. Therefore, period-to-period comparisons of our net sales, results of operations, and cash flows should not be relied upon as an indication of future performance.
Our independent integrators may be unsuccessful in marketing, selling, installing, and supporting our solutions. If we are unable to provide high-quality products in a timely manner at competitive prices and to develop and maintain effective sales incentive programs for our integrators, we may not be able to incentivize them to sell our solutions or the third-party solutions we distribute. Our integrators may also market, sell, and support products and services that are competitive with ours, and may devote more resources to the marketing, sales, and support of such competitive products. Our integrators may have incentives to promote our competitors’ products to the detriment of our own, or may cease selling our solutions altogether. Our agreements with our integrators typically do not specify how much product will be ordered on an ongoing basis and may generally be terminated without penalty for any reason by either party with advance notice. We cannot assure that we will retain agreements with these integrators, or that we will be able to secure additional or replacement integrators.
In addition, while we take certain steps to protect ourselves from liability for the actions of independent integrators, such as including contractual provisions limiting our liability with both end consumers and integrators, end consumers may seek recovery from us for damages caused by integrators in connection with product installations or servicing, or the failure of products to perform properly due to incorrect installations by integrators. In the event of litigation with respect to these matters, we cannot guarantee that our contractual protections will be enforced or that integrators will have the financial wherewithal or maintain insurance to meet their contractual obligations. Furthermore, integrators may initiate claims against us related to any failure or perceived failure to operate our business in accordance with our contracts and the law. Integrators may engage in wrongdoing, including unethical or illegal acts and may use our name and brand in ways we do not authorize. Any such improper integrator behavior may harm our reputation or expose us to liability for their actions. If our sales partners engage in marketing practices that are not in compliance with local laws and regulations, we may be in breach of such laws and regulations, which may result in regulatory proceedings and potential penalties that could have a material adverse effect on our business. In addition, unauthorized activities in connection with sales efforts by our sales partners, including calling end consumers in violation of applicable regulations and fraudulent misrepresentations, could subject us to governmental investigations and class action lawsuits for, among others, false advertising and deceptive trade practice damage claims, against which we will be required to defend. Such defense efforts would be costly and time-consuming, and there can be no assurance that such defense efforts would be successful, all of which could negatively impact our business, results of operations, and financial condition.
24
Moreover, in order to continue our growth and expand our business, it is important that we continue to attract and add new integrators and ensure that most of our existing relationships remain productive. We must also work to expand our network of integrators to ensure we have sufficient geographic coverage and technical expertise to address new markets and technologies. If we are unable to attract, train, and retain integrators, if we saturate the available integrator pool, or if market or other forces cause the available pool of integrators to decline, it may be increasingly difficult to grow our business. It is important that we enhance our integrator footprint by broadening the expertise of our integrators, providing tools and training that enable our integrators to be more effective, and expanding our line of solutions that our integrators offer. If we are unable to expand our network of independent integrators, or maintain the relationships with our existing integrators, our business could be harmed.
Finally, we are dependent on a finite number of integrators, many of which are small businesses, to meet demand for our solutions. If our and their operations, infrastructure, and business processes fail to keep pace with our business and customer requirements, end consumers may experience disruptions in service or support or we may not scale the business efficiently, which could adversely affect our reputation and our net sales. There is no guarantee that we and our integrators will be able to continue to develop and expand our infrastructure and business processes at the pace necessary to scale the business, and our failure to do so may have an adverse effect on our business and brand identity.
Because we distribute a portion of our solutions through e-commerce platforms, our operations may be materially adversely affected by technological problems and failure to improve our platforms to meet customer needs.
A significant portion of our sales are transacted through e-commerce platforms including our website. Our integrators rely upon these sales platforms to conduct vital business activities including purchasing products, obtaining technical support and training, and learning about new products and services. Any failure of these platforms to operate reliably and meet customer needs may impact our business performance. For example, technological failures, both caused by us and those outside of our control, may result in platform downtime, and result in lost sales and customer loyalty. Additionally, if we do not continue to improve our e-commerce platforms to meet customer needs, we may also lose sales and customer loyalty. As we continue to improve customer experience and engage in strategic acquisitions, we have consolidated e-commerce platforms. Such platform consolidation presents risks for both technological disruptions and failure to meet customer needs, which may adversely affect our operations.
Because we distribute a portion of our solutions through highly dispersed brick-and-mortar locations across the United States and Canada, our operations may be materially adversely affected by inconsistent practices, and the operating results of individual branches may vary.
We operate a portion of our product-distribution business through a network of highly dispersed locations throughout the United States and Canada, supported by leadership located in central offices, with local branch management retaining responsibility for day-to-day operations and adherence to applicable local laws. Our operating structure could make it difficult for us to coordinate procedures across our operations. We may have difficulty attracting and retaining qualified local personnel. In addition, our branches may require significant oversight and coordination from headquarters to support their growth. Inconsistent implementation of corporate strategy and policies at the local level could materially and adversely affect our overall profitability, prospects, business, results of operations, financial condition, and cash flows. In addition, the operating results of an individual branch may differ from those of another branch for a variety of reasons, including market size, management practices, competitive landscape, regulatory requirements, and local economic conditions. As a result, certain of our branches may experience higher or lower levels of growth than other branches.
Risks Related to Laws and Regulations
Failure to comply with laws and regulations could harm our business.
We conduct our business in the United States and in various other countries. We are subject to regulation by various federal, state, local, and foreign governmental agencies, including, but not limited to, agencies and regulatory bodies, or authorities responsible for monitoring and enforcing product safety and consumer protection laws, data privacy and security laws and regulations, employment and labor laws, workplace safety laws and regulations, environmental laws and regulations, antitrust laws, federal securities laws, and tax laws and regulations.
25
Our global operations require us to import from and export to several countries, which increases the number of jurisdictions’ laws with which we must comply. We are also subject to anti-money-laundering laws such as the USA PATRIOT Act and may be subject to similar laws in other jurisdictions. Our platforms and solutions are subject to various export control and import laws and regulations, including the U.S. Export Administration Regulations, U.S. Customs’ regulations, and various economic and trade sanctions regulations administered by the U.S. Treasury Department’s Office of Foreign Assets Control, in part because our software contains encryption technologies. Exports of our platforms and solutions must be made in compliance with these laws and regulations. We may also be subject to import/export laws and regulations in other jurisdictions in which we conduct business. If we fail to comply with these laws and regulations, we and certain of our employees could be subject to substantial civil or criminal penalties, including the possible loss of export or import privileges; fines, which may be imposed on us and responsible employees or managers; and, in extreme cases, the incarceration of responsible employees or managers. As a result, our access to technologies needed to improve our platforms and solutions may be impaired and the demand for our platforms and solutions outside of the United States may be limited. Any penalties, costs, and restrictions on export or import privileges could harm our results of operations. We maintain policies and procedures reasonably designed to ensure compliance with applicable trade accounting requirements, laws, and restrictions, including prohibiting the export, re-export or transfer of technology to companies on the Entity List maintained by the U.S. Department of Commerce’s Bureau of Industry and Security, as well as prohibiting the sale of our products in certain countries. However, due to the size of our global operations, we cannot ensure that our policies and procedures, including related safeguards, will effectively prevent violations, including the unauthorized diversion of products to countries or persons that are the target of Office of Foreign Assets Control sanctions; the export, re-export, or transfer of technology to companies on the Entity List; failure to comply with accounting rules related to import and export of products; appropriate import product classifications; or other trade accounting requirements, laws, and restrictions.
Moreover, if our service provider partners fail to obtain appropriate import, export, or re-export licenses or authorizations, we may also be adversely affected through reputational harm and penalties. Obtaining the necessary authorizations, including any required license, for a particular component or sale may be time-consuming, is not guaranteed and may result in the delay or loss of sales opportunities. In addition, changes in our platforms or solutions or changes in applicable export or import laws and regulations may create delays in the introduction and sale of our platforms and solutions in the United States and international markets, prevent our service provider partners from deploying our platforms and solutions, prevent us from importing or exporting components of some of our solutions, or, in some cases, prevent the export or import of our platforms and solutions to and from the United States and certain other countries, governments, or persons altogether.
Our integrators are required to abide by various national, state, and local regulatory requirements, including obtaining certifications and licenses in order to install and maintain certain products and technologies. For example, certain lighting products may only be installed by certified electricians. Home security and life safety products and services may require local and state licensure to distribute, install, and monitor; and local building codes may require such products to comply with an increasing and complex breadth of regulatory certifications. Other products, such as certain low-voltage products, may not require certifications or licenses in certain jurisdictions. National, state, or local regulatory requirements may change and require our integrators to obtain additional licenses, permits, and certifications to install our products. Such regulatory changes may make it more difficult and expensive for our integrators to install our products and therefore make it more difficult for us to sell our products. Additionally, the rapid evolution and increased adoption of AI technologies and our obligations to comply with emerging laws and regulations may require us to develop additional AI-specific governance programs.
Changes in applicable laws could result in increased regulatory requirements and compliance costs or the inability to import or export products or components from or to certain markets; which could harm our business, financial condition, cash flows, and results of operations. In certain jurisdictions, regulatory requirements may be more stringent than in the United States. Noncompliance with applicable regulations or requirements could subject us to whistleblower complaints, investigations, sanctions, settlements, mandatory product recalls, enforcement actions, disgorgement of profits, fines, damages, civil and criminal penalties or injunctions, suspension or debarment from contracting with certain governments or other end consumers, the loss of export privileges, reputational harm, and other collateral consequences. In addition, responding to any action will likely result in a materially significant diversion of management’s attention and resources, and an increase in defense costs and other professional fees.
Pursuant to the Dodd-Frank Wall Street Reform and Consumer Protection Act (the “Dodd-Frank Act”), we are required to adhere to certain reporting and other requirements regarding the use of certain minerals and derivative metals
26
(referred to as “conflict minerals,” regardless of their actual country of origin) in our products. Some of these metals are commonly used in electronic equipment and devices, including our products. These requirements require that we investigate, disclose, and report whether any such metals in our products originated from the Democratic Republic of Congo or adjoining countries. In addition, in June 2022, the import restrictions contained in the Uyghur Forced Labor Prevention Act (“UFLPA”) became effective. The UFLPA creates a rebuttable presumption that any goods mined, produced, or manufactured, wholly or in part in China’s Xinjiang Uyghur Autonomous Region (“XUAR”), or produced by a listed entity, were made with forced labor and would therefore not be entitled to entry at any U.S. port. Importers are required to present clear and convincing evidence that such goods are not made with forced labor. While we do not directly source any of our own raw conflict minerals or source any items from the XUAR or from listed parties, we have a complex supply chain, with numerous suppliers for the components and parts used in our products. As a result, we incur costs to comply with the diligence and disclosure requirements of the Dodd-Frank Act and the UFPLA. In addition, because our supply chain is so complex, we may not be able to sufficiently verify the origin of all relevant metals or other components and parts used in our products through our due diligence procedures. We may incur reputational damage if we determine that any of our products contain parts made with forced labor or minerals or derivative metals that are not conflict-free or if we are unable to sufficiently verify the source for all components and conflict minerals used in our products through the procedures we may implement. Furthermore, key components and parts that can be shown to be “conflict-free” and not sourced from XUAR or listed parties may not be available to us in sufficient quantity, or at all, or may only be available at significantly higher cost. If we are not able to meet customer requirements, end consumers may choose to disqualify us as a supplier. Any of these outcomes may negatively impact our business, results of operations, and financial condition.
Risks Related to Cybersecurity and Privacy
Failure to maintain the security of our information and technology networks, including information relating to our integrators, distributors, vendors, partners, end consumers, and employees, could adversely affect our business. In addition, if security breaches in connection with our products and services allow unauthorized third parties to obtain access to end consumers’ networks or appliances, our reputation, business, results of operations, and financial condition could be harmed.
The legal, regulatory, and contractual environment surrounding information security, privacy, and internet fraud is constantly evolving and companies that collect and retain information are under increasing attack by cyber criminals around the world. We are dependent on information technology networks and systems, including the Internet, to process, transmit, and store electronic information, and, in the normal course of our business, we collect and retain certain information, including financial and personally identifiable information, from and pertaining to our integrators, distributors, partners, end consumers, and employees. Data protection is important to us, and we devote significant resources addressing security vulnerabilities in our products and systems, and regularly engage with security experts to conduct penetration testing to help us uncover vulnerabilities. However, the policies and security measures we implement could prove to be inadequate and cannot guarantee our systems will be secure; and our information technology infrastructure may be vulnerable to cyberattacks, data security incidents, or other vulnerabilities. Cyberattacks are increasingly sophisticated, and often go undetected until after an attack. We may fail to identify new methods of attack or fail to invest sufficient resources in security measures. We have previously experienced non-material cyberattacks, and will certainly experience cyberattacks in the future, and we cannot be certain that advances in our cybersecurity capabilities or other developments will prevent compromises of the networks that access our products and services and data repositories.
Further, we have acquired companies over the years and may continue to do so in the future. While we make significant efforts to address any information technology security issues with respect to our acquisitions, we may still inherit such risks when we integrate acquired products and systems.
In addition, end consumers can use our tools for authorized, remote access to their systems, and certain of our employees and independent integrators can be provided access to monitor and update certain of our products and services remotely. Security breaches by third parties or by one of our integrators or employees, that allow unauthorized access to or control over our end consumers’ appliances or data through our products could harm our reputation, business, results of operations, and financial condition.
27
Any failure or perceived failure to maintain performance, reliability, security, and availability of systems or the actual or potential theft, loss, unauthorized use of our products or associated confidential information, including personally identifiable data of an integrator, distributor, partner, end consumer, and employee, could result in:
•Harm to our reputation or brand, which could lead some end consumers to stop using our products or services, reduce or delay future purchases of our products or services, use competing products or services, or adversely affect the overall market perception of the security of our services and home automation products generally;
•Individual and/or class action lawsuits, which could result in financial settlements or judgments against us and would cause us to incur legal costs;
•Legal or regulatory enforcement action, which could result in fines and/or penalties and would cause us to incur legal costs; and/or
•Additional costs associated with responding to the interruption or security breach, such as investigative and remediation costs, costs of providing notice to individuals and/or data owners, legal fees, costs of additional fraud-detection activities, or costs of prolonged system disruptions or shutdowns.
Any of these actions may have a material adverse effect on our business, results of operations, and financial condition.
Because we store, process, and use data, including personal information, we are subject to complex and evolving federal, state, and foreign laws and regulations regarding privacy, data protection and other matters. Many of these laws and regulations are subject to change and uncertain interpretation, and could result in investigations, claims, changes to our business practices, increased cost of operations, and declines in user growth, retention, or engagement, any of which could seriously harm our business.
Our products and services rely heavily on the collection, processing and use of information, including personal information. Because we store, process, and use certain types of data, we are subject to complex and evolving federal, state, and foreign laws and regulations regarding privacy and data protection. Both in the United States and abroad, these laws and regulations are constantly evolving. In the United States, in addition to certain regulations at the federal level, each state has its own statutory approach to privacy regulation. These laws are continuously changing, and the application and interpretation of these regulations are often uncertain, particularly in our rapidly evolving industry. Continually implementing up-to-date data security tools and procedures and maintaining privacy standards compliant with ever-changing privacy regulations in multiple jurisdictions is challenging. If we are found to have breached any consumer protection regulations, we may be subject to enforcement actions that require us to change our business practices in a manner which may negatively impact our net sales, as well as expose ourselves to litigation, investigation, fines, civil and/or criminal penalties, and adverse publicity that could cause our end consumers to lose trust in us, negatively impacting our reputation and business in a manner that harms our financial position.
There is increased attention to and regulation of data protection and data privacy across the globe, including the Federal Trade Commission’s (“FTC”) active approach to enforcing data privacy in the United States, as well as the enactment of international privacy regulations such as the European Union’s General Data Protection Regulation (“GDPR”), the United Kingdom’s transposition of GDPR into its domestic laws following its withdrawal from the European Union, and China’s Personal Information Protection Law. In addition, many states have or will enact state-specific privacy regulations such as the California Consumer Privacy Act (“CCPA”) and the expanded California Privacy Rights Act (“CPRA”). In Europe, the GDPR introduced stringent requirements (which will continue to be interpreted in coming years), including how data may be transferred outside of the European Economic Area (“EEA”). Recent legal developments in Europe have created complexity and uncertainty regarding transfers of personal data from the EEA to the United States. For example, in July 2020, the European Court of Justice struck down a permitted personal data transfer mechanism between the EEA and the United States, invalidating the use of the EU-U.S. Privacy Shield Framework and amended the requirements of its standard contractual clauses (“SCCs”). SCCs remain a valid mechanism to transfer data from the EEA to the United States, and the EU in 2021 issued modernized standard contractual clauses and required entities subject to GDPR to adopt revised SCCs to remain compliant with GDPR. In 2023, European Commission adopted its adequacy decision for the EU-U.S. Data Privacy Framework. The adequacy decision concludes that the United States ensures an adequate level of protection for personal data transferred from the EU to U.S. companies participating in the EU-U.S. Data Privacy Framework. With all these changes, uncertainty remains as to what, if any, additional steps may be required to remain in compliance with the GDPR. These changes may lead to additional costs and increase our overall risk exposure. Penalties for non-compliance with either or both the GDPR or the U.K. GDPR are potentially significant and could harm our financial position.
28
We publicly post our privacy policies and practices concerning our processing, use, and disclosure of personal information. Statements we publish provide assurances about privacy and security that could subject us to regulatory action or other liabilities if: (a) such statements are found to be deceptive or misrepresentative of our practices, (b) we fail to take adequate measures to ensure that we adhere to applicable regulations, or (c) our third-party data processors fail to adequately protect personal information that they process on our behalf. While we select our third-party data processors carefully, we do not control their actions. Any problems experienced by these third parties, including those resulting from breakdowns or other disruptions in the services provided by such parties or cyberattacks and security breaches, could adversely affect our ability to conduct our business.
Risks Related to Intellectual Property
If we fail to protect our intellectual property and proprietary rights adequately, our business could be harmed.
We believe proprietary technology is essential to establishing and maintaining our leadership position. We seek to protect our intellectual property through our confidentiality, non-compete, non-solicitation, and nondisclosure agreements to maintain the confidentiality of our trade secrets, and by registering numerous patents, trademarks, and domain names in various justifications, as well as other measures, some of which may afford only limited protection. We rely on a combination of patent, trademark, trade secret, copyright, and other similar laws to protect our intellectual property. Our means of protecting our proprietary rights may not be adequate or our competitors may independently develop similar or superior technology, or design around our intellectual property. If we are unable to maintain the proprietary nature of our technologies, our business could be materially adversely affected.
As we rely in part on brand names and trademark protection to enforce our intellectual property rights, efforts by third parties to limit use of our brand names or trademarks, and barriers to the registration of brand names and trademarks in various countries, may restrict our ability to promote and maintain a cohesive brand throughout our key markets. There can also be no assurance that pending or future U.S. or foreign trademark applications will be approved in a timely manner or at all, or that such registrations will effectively protect our brand names and trademarks. In addition, we have not registered all our trademarks in all jurisdictions. Third parties may also oppose our trademark applications, or otherwise challenge our use of trademarks, or use our trademarks without permission and cause brand confusion in various markets. If our trademarks are successfully challenged, or we are not able to successfully enjoin others from using our trademarks, we could be forced to rebrand, which could result in loss of brand recognition and would require us to devote resources to advertising and marketing new brands.
In addition, the laws of some foreign countries do not protect our proprietary rights as extensively as the United States. Intellectual property protections may also be unavailable, limited, or difficult to obtain and enforce in some countries, which could make it easier for competitors to capture market share. For example, many foreign countries limit the enforceability of patents against certain third parties, including government agencies or government contractors. In these countries, patents may provide limited or no benefit. Effective trade secret protection may also not be available in every country in which our products are available or where we have employees or independent contractors. In addition, any changes in, or unexpected interpretations of, the trade secret, intellectual property, or employment laws in any country in which we operate may compromise our ability to enforce our trade secret and other intellectual property rights.
To prevent substantial unauthorized use of our intellectual property rights, it may be necessary to prosecute actions for infringement and/or misappropriation of our proprietary rights against third parties. For example, we recently sued Josh.AI Inc. and AVA Inc. because we believe their products violated certain of our patents and they misappropriated certain trade secrets. This action, and other such actions could result in significant costs and diversion of our resources and management’s attention, and we cannot assure that we will be successful. Furthermore, many of our competitors can dedicate greater resources to enforce their intellectual property rights or contest infringement claims than we can. Accordingly, despite our efforts, we may not be able to prevent third parties from knowingly or unknowingly infringing upon or misappropriating our intellectual property rights. If we are unable to protect our intellectual property rights, including aspects of our software and platform protected other than by patent rights, we will find ourselves at a competitive disadvantage to others who need not incur the additional expense, time, and effort required to create our platform and other innovative products that have made us successful.
29
Assertions by third parties that we are infringing their intellectual property could, regardless of merit, subject us to costly and time-consuming litigation and could further lead to expensive licenses or significant liabilities in the event of an adverse judgment.
Our industry is characterized by the existence of many patents, copyrights, trademarks, and trade secrets, and by frequent litigation based on infringement allegations or other violations of intellectual property rights. There may be third-party intellectual property rights, including issued or pending patents, that cover significant aspects of our technologies or business methods. As we face increasing competition and our public profile increases, the possibility of intellectual property rights claims against us may increase. We have been subject to intellectual property litigation in the past and may be subject to similar litigation in the future. Given that some of our core product lines are, or integrate with, network-aware products, and because of the litigious environment for connectivity technologies, the risk that our solutions may be subject to these allegations may be exacerbated. Further, we may face exposure to third-party intellectual property infringement, misappropriation, or violation actions if we engage software engineers or other personnel who were previously engaged by competitors or other third parties and those personnel inadvertently or deliberately incorporate third-party proprietary technology into our products. A loss of key personnel or their work product in connection with such actions could hamper or prevent our ability to develop, market, and support potential products or enhancements, which could harm our business. Any intellectual property claims, with or without merit, could be time-consuming and expensive to settle or litigate.
We might not prevail in any intellectual property infringement litigation given the complex legal and technical issues and inherent uncertainties. Defending such claims, regardless of merit, could be time-consuming and distracting to management, result in costly litigation or settlement, cause development delays, or require us to enter into royalty or licensing agreements. In addition, we currently have a limited portfolio of issued patents compared to some competitors, and therefore may not be able to effectively utilize our intellectual property portfolio to assert defenses or counterclaims, or to negotiate cross-licenses in response to patent-infringement claims or litigation. Further, litigation may involve patent-holding companies or other adverse patent owners who have no relevant products or revenues and against which our potential patents provide no deterrence, and many other potential litigants have the capability to dedicate greater resources to enforce their intellectual property rights and defend claims. If our solutions exceed the scope of in-bound licenses or violate any third-party proprietary rights, we could be required to withdraw those solutions from the market, re-develop those solutions, or seek to obtain licenses from third parties, which might not be available on reasonable terms or at all. Any efforts to re-develop our solutions, obtain licenses from third parties on favorable terms or license a substitute technology might not be successful and, in any case, might substantially increase our costs and harm our business, financial condition, and results of operations. If we were compelled to withdraw any of our solutions from the market, it may have a material adverse effect on our business, results of operations, and financial condition. In the past, we have entered into settlement agreements relating to contractual claims and alleged patent infringements, which have included future royalty payments on certain products, the payment of a lump sum amount for alleged past damages, and/or the payment of a fixed amount in exchange for a covenant not to sue, and we may be required to do so again.
We have agreed to indemnify our independent integrators and other partners for certain intellectual property infringement claims regarding our products and other materials we provide them. As a result, in the case of infringement claims against these partners, we could be required to indemnify them for losses. We expect some of our partners may seek indemnification from us in connection with infringement claims. We evaluate each such request on a case-by-case basis, and may not succeed in refuting any such claim we believe to be unjustified. If a partner elects to invest resources in enforcing a claim for indemnification against us that we believe is unjustified, we could incur significant costs in disputing it. If we do not succeed in disputing it, we could face substantial liability.
The use of open-source software in our solutions may expose us to additional risks and harm our intellectual property.
Some of our solutions use or incorporate software subject to one or more open-source licenses. If we combine or link our proprietary software with certain open-source software and distribute or make available such software to third parties, we could, under the terms of the applicable open-source licenses, be required to disclose part or all of our proprietary software source code publicly, or to allow further modification and redistribution of such software on potentially unfavorable terms or at no cost. This could provide an advantage to our competitors or other entrants to the market, allow them to create similar products with lower development effort and time, and ultimately result in a loss of sales for us. We may also be required to spend time and effort to remediate such uses of open-source software. Open-source compliance problems can also result in damage to reputation, and challenges in recruitment or retention of engineering personnel.
30
The terms of many open-source licenses to which we are subject have not been interpreted by U.S. or foreign courts, and there is a risk those licenses could be construed in a manner that imposes unanticipated restrictions on our ability to commercialize our solutions. We could be required to seek licenses from third parties to continue offering our solutions, to redevelop our solutions, to discontinue sales of our solutions or to release our proprietary software code under the terms of an open-source license; any of which could harm our business. We may be subject to suits by parties claiming ownership of what we believe to be open-source software, or claiming non-compliance with the applicable open-source licensing terms. Any litigation could be costly for us to defend; have a material adverse effect on our business, results of operations, and financial condition; or require us to devote additional research and development resources to change our solutions.
We rely on the availability of third-party licenses and our inability to maintain those licenses could harm our business and results of operations.
We rely on third-party licensed technology, which we have incorporated into our products. Some of our agreements with our licensors may be terminated by them for convenience, or otherwise provide for a limited-term license. In addition, we may need to seek additional licenses for existing or new products, which may not be available on acceptable terms, or at all. The inability to obtain certain licenses or other rights, or to obtain them on favorable terms, or the need to engage in litigation regarding these matters, could result in our inability to include certain features in our products or delays in product releases, force us to acquire or develop alternative technology, which we may be unable to do in a commercially feasible manner or at all, and require us to use alternative technology of lower quality or performance standards. Any of the foregoing would disrupt the distribution and sale of our products and harm our business, results of operations, and financial condition.
Any errors or defects in third-party software could also result in errors or a failure of products. Moreover, the inclusion in our products of intellectual property licensed from third parties on a nonexclusive basis could limit our ability to protect our proprietary rights in our products. We cannot be certain our licensors will not infringe on third-party intellectual property rights or that our licensors will have sufficient rights to the licensed intellectual property in all jurisdictions in which we may sell our products, or that our remedies against our third-party software licensors in the event of such infringement will be sufficient.
Risks Related to Our International Operations
We are subject to a number of risks associated with international sales and operations.
International net sales accounted for 12.8% of our total net sales for fiscal year 2023, and that percentage may grow in the future. As a result, we must hire and train experienced personnel to staff and manage our foreign operations. To the extent that we experience difficulties in recruiting, training, managing, and retaining international integrators, distributors, and international staff, and specifically staff related to sales management and sales personnel, we may experience difficulties in productivity in foreign markets.
If we are not able to increase the sales of our solutions to consumers located outside of the United States, our results of operations or net sales growth may be harmed. In addition, in connection with our expansion into foreign markets, we receive currencies other than the U.S. dollar. Accordingly, changes in exchange rates, and particularly a strengthening of the U.S. dollar, will negatively affect our net sales as expressed in U.S. dollars. There is also a risk when we adjust local currency product pricing due to volatility or changes in foreign currency exchange rates that demand for our products will decrease, harming our ability to compete for customers in these geographies.
Conducting and launching operations on an international scale requires close coordination of activities across multiple jurisdictions and time zones and consumes significant management resources. Conducting international operations subjects us to risks that, generally, we do not face in the United States either at all or with the same degree of severity, including:
•Fluctuations in currency exchange rates;
•Changes in foreign regulatory requirements;
•Longer accounts receivable payment cycles and difficulties in collecting accounts receivable;
•Difficulties in managing and staffing international operations, which may result in higher personnel-related liabilities and expenses;
31
•Potentially adverse tax consequences, including the complexities of foreign value-added tax systems and restrictions on the repatriation of earnings;
•Localization of our solutions and other materials, including translation into foreign languages and associated expenses;
•Localization of applicable agreements under applicable foreign law and differing legal standards and risks;
•Burdens of complying with a wide variety of foreign laws and different legal standards, including laws and regulations related to import/export, privacy, the transfer of personal information across borders, data security, labor, and limitations on liability;
•Increased financial accounting and reporting burdens and complexities;
•Political, social, and economic instability abroad, war, terrorist attacks, and security concerns in general, including crime and cyber security; and
•Reduced or varied protection for intellectual property rights in some countries.
The impact of any one of these could harm our international business and, consequently, our results of operations generally. Moreover, operating in international markets also requires significant management attention and financial resources. We cannot be certain the investment and additional resources required in establishing, acquiring, or integrating operations and personnel in other countries will produce desired levels of net sales or profitability; and if we decide to open new international markets or change our go-to-markets structures, we will incur additional expenses with no guarantee the investment will be profitable.
Due to the global nature of our business, we could be harmed by violations of the U.S. Foreign Corrupt Practices Act, the U.K. Bribery Act or similar anti-corruption laws in other jurisdictions in which we operate, or various international trade and export laws.
The global nature of our business creates various domestic and local regulatory challenges, including compliance with applicable anti-corruption laws and regulations. Where they apply, the U.S. Foreign Corrupt Practices Act (“FCPA”), the U.K. Bribery Act 2010 (“U.K. Bribery Act”), and similar anti-corruption laws in other jurisdictions generally prohibit companies and their directors, officers, employees, and intermediaries from making improper payments to foreign government officials for the purpose of obtaining or retaining business or securing an improper business advantage. The U.K. Bribery Act and other anti-corruption laws that could apply to our business also prohibit non-governmental “commercial” bribery and accepting bribes. In addition, U.S.-listed companies are required to maintain records that accurately and fairly represent their transactions and to implement and enforce an adequate system of internal accounting controls.
Our global operations expose us to the risk of violating, or being accused of violating, anti-corruption laws and regulations. Our business requires us to import from and export to several countries, which exposes us to corruption risks, and we rely heavily on intermediaries to support our sales and marketing operations, including integrators and distributors, and we could potentially face liability if these intermediaries engage in misconduct related to our business. We also operate in areas of the world that have elevated corruption risks and, in certain circumstances, compliance with anti-corruption laws may conflict with local customs and practices. Although our policies and procedures prohibit bribery and we periodically train our employees and agents about these anti-corruption laws, we cannot assure compliance by our personnel or intermediaries with such anti-corruption laws. If we are found to be in violation of any applicable anti-corruption laws, this may expose us to reputational harm, investigation costs, or significant sanctions, including disgorgement of profits, injunctions, and suspension or debarment from government contracts, criminal or civil penalties, or other sanctions, which could harm our business.
The recent armed conflicts could harm our business.
In February 2022, armed conflict escalated between Russia and Ukraine. The sanctions against Russia announced by the United States and other countries following Russia’s invasion of Ukraine include restrictions on selling or importing goods, services or technology in or from affected regions; and travel bans and asset freezes impacting connected individuals and political, military, business and financial organizations in Russia; and such sanctions may be widened as the conflict continues. We continue to monitor developments in Ukraine, the related export controls and financial and economic sanctions, and Russia’s responsive restrictions. As a result, we have paused all sales of our product to companies in Russia and Belarus. Although we do not foresee direct material adverse effects upon our business, financial condition, or
32
results of operations as a result of developments in Ukraine and the consequent controls and sanctions, these factors may affect companies in many sectors and could lead to increased market volatility and uncertainty, which could affect us.
In October 2023, Hamas launched assaults against Israeli citizens in Israel, and Israel subsequently responded aggressively with operations against Hamas inside the Gaza Strip. The Israel-Hamas War has caused substantial regional instability and world-wide concern and potential involvement. While we do not currently believe this conflict has caused a direct material adverse impact on our business, escalating tensions in the region, including conflicts in the Red Sea, may disrupt global markets and foreign interest rates, cause increased inflation in energy and logistics costs, and negatively impact our supply chain. These conflicts are highly unpredictable and have already resulted in significant volatility in oil and natural gas prices worldwide. The increased cost of oil, along with increased or prolonged periods of inflation, would likely increase our costs in the form of higher wages, and further inflation on supplies and equipment necessary to operate our business. One or more of our suppliers could be negatively affected by global economic instability, which could in turn, negatively impact our business, financial condition, or results of operations.
Risks Related to Our Indebtedness
Our substantial indebtedness could materially adversely affect our financial condition and our ability to operate our business, react to changes in the economy or industry or pay our debts and meet our obligations under our debt and could divert our cash flow from operations for debt payments.
On December 8, 2021, we entered into a new credit agreement (the “Credit Agreement”) with various financial institutions consisting of $465.0 million senior secured term loans (the “Term Loan”) maturing in 2028 and a $100.0 million senior secured revolving credit facility (the “Revolving Credit Facility”) maturing in 2026. As of December 8, 2021, the day we refinanced our prior credit agreement (the “Old Credit Agreement”) with proceeds of the Credit Agreement, our total term loan borrowings under our Credit Agreement were $465.0 million. On October 2, 2022, we entered into an Incremental Agreement (the “Incremental Agreement”) which amended the Credit Agreement to obtain incremental term loans in an aggregate principal amount of $55.0 million (the “Incremental Term Loan”). The Incremental Term Loan matures in 2025. See “Management’s Discussion and Analysis of Financial Condition and Results of Operations — Liquidity and Capital Resources” for further discussion. In addition, subject to restrictions in the agreements governing our credit facilities, we may incur additional debt.
Our substantial indebtedness could have negative consequences, including the following:
•It may be difficult for us to satisfy our obligations, including debt service requirements under our outstanding debt, resulting in possible defaults on and acceleration of such indebtedness;
•Our ability to obtain additional financing for working capital, capital expenditures, debt service requirements, acquisitions or other general corporate purposes may be impaired;
•A substantial portion of cash flow from operations may be dedicated to the payment of principal and interest on our debt, therefore reducing our ability to use our cash flow to fund our operations, capital expenditures, future business opportunities, acquisitions, and other purposes;
•We are more vulnerable to economic downturns and adverse industry conditions and our flexibility to plan for, or react to, changes in our business or industry is more limited;
•Our ability to capitalize on business opportunities and to react to competitive pressures, as compared to our competitors, may be compromised due to our high level of debt; and
•Our ability to borrow additional funds or to refinance debt may be limited.
Furthermore, our debt under our Credit Agreement bears interest at variable rates. Although we entered into an interest rate cap agreement that became effective in December 2022, a portion of our debt still bears interest under variable interest rates. As these rates increase as they did in 2023, our debt service obligations increase even though the amount borrowed remains the same, and our net income and cash flows, including cash available for servicing our indebtedness, correspondingly decrease. If interest rates continue to increase, we will see a corresponding increase in these obligations. Accordingly, our ability to borrow additional funds may be reduced and risks related to our substantial indebtedness would intensify.
We and our subsidiaries may be able to incur substantial additional debt in the future. Although our Credit Agreement contains restrictions on the incurrence of additional debt, these restrictions are subject to multiple qualifications and
33
exceptions, and the debt incurred in compliance with these restrictions could be substantial. Additionally, we may successfully obtain waivers of these restrictions. These restrictions also do not prevent us from incurring obligations, such as trade payables, that do not constitute indebtedness as defined under our Credit Agreement. If we incur additional debt above the levels currently in effect, the risks associated with our leverage, including those described above, would increase.
Servicing our debt requires a significant amount of cash. Our ability to generate sufficient cash depends on numerous factors beyond our control, and we may be unable to generate sufficient cash flow to service our debt obligations.
Our business may not generate sufficient cash flow from operating activities to service our debt obligations. Our ability to make payments on and to refinance our debt and to fund planned capital expenditures depends on our ability to generate cash. To some extent, this is subject to general and regional economic, financial, competitive, legislative, regulatory, and other factors beyond our control. Like other companies, geopolitical unrest has resulted in longer supply chain lead times for certain products and materials. We have implemented strategies to mitigate these longer lead times for many of our products and materials, but there is no guarantee that our mitigation strategies will be successful and longer lead times could have a material impact on our liquidity and ability to service our debt.
If we are unable to generate sufficient cash flow from operations to service our debt and meet our other commitments, we may need to refinance all or a portion of our debt, sell material assets or operations, delay capital expenditures, or raise additional debt or equity capital. We may not be able to affect any of these actions on a timely basis, on commercially reasonable terms or at all, and these actions may not be sufficient to meet our capital requirements. In addition, the terms of our existing or future debt agreements may restrict us from pursuing any of these alternatives.
Restrictive covenants in our Credit Agreement governing our indebtedness may restrict our ability to pursue our business strategies, and failure to comply with any of these restrictions could result in acceleration of our debt.
The operating and financial restrictions and covenants in our Credit Agreement may materially adversely affect our ability to distribute monies to our stockholders, finance future operations or capital needs, or engage in other business activities. Such agreements limit our ability, among other things, to:
•Incur additional indebtedness and guarantee indebtedness;
•Pay dividends on or make distributions in respect of our common stock or make other restricted payments;
•Make loans and investments;
•Sell or otherwise dispose of assets;
•Incur liens;
•Consolidate, merge, sell, or otherwise dispose of all or substantially all of our assets;
•Enter into certain transactions with our affiliates; and
•Designate our subsidiaries as unrestricted subsidiaries.
In addition, our Credit Agreement covenants require us to maintain a specified first lien secured net leverage ratio when a certain percentage of our Revolving Credit Facility commitments are borrowed and outstanding as of the end of each fiscal quarter. The Revolving Credit Facility under our Credit Agreement is subject to a first lien secured net leverage ratio of 7.50 to 1:00, tested quarterly, if, and only if, the aggregate principal amount from the revolving facility, letters of credit (to the extent not cash collateralized or backstopped or, in the aggregate, not in excess of the greater of $10.0 million and the stated face amount of letters of credit outstanding on the initial closing date of the Credit Agreement) and swingline loans outstanding and/or issued, as applicable, exceed 35% of the total amount of the Revolving Credit Facility commitments on such date. In certain circumstances, our ability to meet this financial covenant may be affected by events beyond our control.
A breach of our Credit Agreement covenants could result in a default or an event of default under the Credit Agreement. Such a default or event of default might allow the creditors to accelerate all amounts outstanding under our Credit Agreement and might result in the acceleration of any other debt or the termination of other third-party contracts to which a cross-acceleration or cross-default provision applies. In addition, an event of default under our Credit Agreement would permit the lenders to terminate all commitments to extend further credit to us. Furthermore, we have pledged a significant portion of our assets as collateral to secure our debt, and if we were unable to repay the amounts due and payable, those creditors could proceed against the collateral. In the event our lenders accelerate the repayment of our borrowings, we and our subsidiaries may not have sufficient assets to repay that indebtedness.
34
As a result of all of these restrictions, we and/or our subsidiaries, as applicable, may be:
•Limited in how we conduct our business;
•Unable to raise additional debt or equity financing to operate during general economic or business downturns; or
•Unable to compete effectively or to take advantage of new business opportunities.
These restrictions might hinder our ability to service our indebtedness or grow in accordance with our business strategy.
Furthermore, the terms of any future indebtedness we may incur could have further additional restrictive covenants. We may not be able to maintain compliance with these covenants in the future, and in the event that we are not able to maintain compliance, we cannot assure you that we will be able to obtain waivers from the lenders or amend the covenants.
A downgrade in our credit ratings could increase our cost of funding and/or adversely affect our access to debt financing and working capital, as well as result in a loss of business and materially adversely affect our financial condition and results of operations.
Our credit ratings are important to our cost and availability of capital. The major rating agencies routinely evaluate our credit profile and assign credit ratings to us. This evaluation is based on a number of factors, which include financial strength, business and financial risk, as well as transparency with rating agencies, and timeliness of financial reporting. The addition of further leverage to our capital structure could result in a downgrade to our credit ratings in the future. As such, failure to maintain our current credit rating could adversely affect our cost of funding and our liquidity by limiting the access to capital markets or the availability of funding potential lenders. In addition, we purchase material and services from some suppliers on extended terms based on our overall credit rating. Negative changes in our credit rating may impact our suppliers’ willingness to extend terms and increase the cash requirements of the business.
Risks Related to Our Financial Statements
We may be subject to additional tax liabilities, which could materially adversely affect our financial condition, results of operations, or cash flows.
We are subject to income, sales, use, value added, franchise, tariffs, and other taxes in the United States and other countries in which we conduct business, which laws and rates vary greatly by jurisdiction. Certain jurisdictions in which we do not collect income, sales, use, value added, tariffs, or other taxes on our sales may assert that such taxes are applicable, which could result in tax assessments, penalties, and interest, and we may be required to collect such taxes in the future. Significant judgment is required in determining our worldwide provision for income taxes and evaluating our uncertain tax positions. These determinations are highly complex and require detailed analysis of the available information, applicable statutes and regulatory materials. In the ordinary course of our business, there are many transactions and calculations where the ultimate tax determination is uncertain. Although we believe our tax estimates are reasonable, the final determination of tax audits and any related litigation could be different from our historical tax practices, provisions and accruals. If we receive an adverse ruling as a result of an audit, or we unilaterally determine that we have misinterpreted provisions of the tax regulations to which we are subject, our tax provision, results of operations, or cash flows could be harmed. In addition, liabilities associated with taxes are often subject to an extended or indefinite statute of limitations period. Therefore, we may be subject to additional tax liability (including penalties and interest) for any particular year for extended periods of time depending on the specific statute of limitations in the relevant jurisdiction.
We have a recent history of losses and expect to incur increased operating costs in the future, and we may not achieve or sustain profitability or current revenue growth.
We have recorded net losses this year and net losses and negative cash flows from our operations in the past. We expect our operating expenses to increase in the future as we expand our operations and execute our product roadmap and strategy. We also plan to make significant future expenditures related to the expansion of our business and our product offerings, including investments in:
•Research and development to continue to introduce innovative new products and enhance existing products;
35
•Sales and marketing to expand our brand awareness, promote new products, increase our customer base, and expand sales within our existing customer base; and
•Legal, accounting, information technology, and other administrative expenses to sustain our operations as a public company.
If our net sales do not continue to grow to offset any increased expenses, we may continue to record net losses. We may incur significant losses in the future for a number of reasons, including the other risks and uncertainties described herein. Additionally, we may encounter unforeseen operating or legal expenses, difficulties, complications, delays in manufacturing and selling our products, and other unknown factors that may result in losses in future periods. If these losses exceed our expectations or our net sales growth expectations are not met in future periods, our operating results could be adversely affected and our stock price could be harmed and we may need to increase our valuation allowance against our U.S. federal and state deferred tax assets again in the future and our stock price may fall.
We may be required to recognize an impairment of our goodwill and other identifiable intangible assets, which represent a significant portion of our total assets.
As of December 29, 2023, we had $592.4 million of goodwill and $505.1 million of unamortized identifiable intangible assets recorded on our balance sheet. Goodwill and identifiable indefinite lived intangible assets are tested on the first day of the fourth quarter of each year. Impairment may result from, among other things, deterioration in performance, adverse market conditions, adverse changes in applicable laws or regulations, including changes that restrict the activities of or affect the solutions we offer, challenges to the validity of certain registered intellectual property, reduced sales of certain products or services incorporating registered intellectual property, increased attrition, and a variety of other factors. The amount of any quantified impairment must be expensed immediately as a charge to results of operations. Depending on future circumstances, it is possible that we may never realize the full value of our intangible assets. An impairment of all or a part of our goodwill or other identifiable intangible assets may have a material adverse effect on our business, financial condition, and results of operations. See “Management’s Discussion and Analysis of Financial Conditions and Results of Operations” and Note 6 in our Notes to the Consolidated Financial Statements for further discussion of our goodwill and other intangible assets.
Changes in accounting standards issued by the Financial Accounting Standards Board (“FASB”), or other standard-setting bodies may adversely affect trends and comparability of our financial results.
We are required to prepare our financial statements in accordance with GAAP, which is periodically revised and/or expanded. From time to time, we are required to adopt new or revised accounting standards issued by recognized authoritative bodies, including the FASB and the SEC. It is possible that future accounting standards we are required to adopt may require additional changes to the current accounting treatment we apply to our financial statements and may result in significant changes to our results, disclosures, and supporting reporting systems. Such changes could result in a material adverse impact on our results of operations and financial condition.
Trends in research and development spending could adversely affect our growth potential, business, results of operations, financial condition, and/or cash flows.
Our business operates in competitive markets characterized by changing consumer preferences and rapid technological innovation. We have made and expect to continue to make significant investments in research and development and related product opportunities. For fiscal year 2023, we invested $66.6 million in research and development activities. High levels of investment in research and development could harm our results of operations, especially if not offset by corresponding future net sales increases. We believe we must continue to dedicate a significant amount of resources to our research and development efforts to maintain our competitive position. However, it is difficult to estimate when, if ever, we will generate significant net sales as a result of these investments which could adversely impact our operating results as well as our reputation.
We may be required to make payments under our contingent value rights agreement with certain former holders.
Subject to the terms and conditions of the Agreement and Plan of Merger dated June 19, 2017 (the “Merger Agreement”) by and among us, former holders of the Company (the “Former Holders”) and the other parties thereto, the Former Holders received non-transferable contingent value rights (“CVRs”), which collectively entitle the Former Holders
36
to receive from us, in certain circumstances, aggregate payments of up to $25 million. Each CVR gives a Former Holder the ability to earn cash payments based on the return of certain investment funds of H&F’s original investment achieving stated thresholds in relation to the proceeds received from disposition of H&F’s initial ownership units. The CVRs were issued at two thresholds. The first CVR is payable to the Former Holders when H&F’s return on investment grows to between 2.25 and 2.5 times H&F’s original investment. The second CVR is payable to the Former Holders when H&F’s return on investment grows to between 2.5 and 2.67 times H&F’s original investment. To the extent we are required to make a payment to the Former Holders under the Merger Agreement, our liquidity may be adversely affected. For additional information on our obligations under the Merger Agreement, see “Management’s Discussion and Analysis of Financial Condition and Results of Operations — Contractual Obligations — Contingent Value Rights (“CVRs”)”.
Risks Related to Our Common Stock
We are controlled by Hellman & Friedman, LLC, whose interests may be different from the interests of other holders of our securities.
H&F owns a majority stake in the Company. As of December 29, 2023, certain investment funds advised by an affiliate of H&F owned approximately 72% of our total outstanding common stock, and had the ability to nominate members of our Board. As a result, H&F is able to control actions to be taken by us, including future issuances of our common stock or other securities, the payment of dividends, if any, on our common stock, amendments to our organizational documents and the approval of significant corporate transactions, including mergers, sales of substantially all of our assets, distributions of our assets, the incurrence of indebtedness, and any incurrence of liens on our assets.
The interests of H&F may be materially different from the interests of our other stakeholders. In addition, H&F may have an interest in pursuing acquisitions, divestitures, and other transactions that, in their judgment, could enhance their investment, even though such transactions might involve risks to you. For example, H&F may cause us to take actions or pursue strategies that could impact our ability to make payments under our Credit Agreement or cause a change of control. In addition, to the extent permitted by our Credit Agreement, H&F may cause us to pay dividends rather than make capital expenditures or repay debt. H&F is in the business of making investments in companies and may from time to time acquire and hold interests in businesses that compete directly or indirectly with us. Our amended and restated certificate of incorporation provides that H&F, its affiliates, and any director who is not employed by us (including any non-employee director who serves as one of our officers in both his director and officer capacities) or his or her affiliates does not have any duty to refrain from engaging, directly or indirectly, in the same business activities or similar business activities or lines of business in which we operate. H&F also may pursue acquisition opportunities that may be complementary to our business, and, as a result, those acquisition opportunities may not be available to us.
So long as H&F continues to own a significant amount of our outstanding common stock, even if such amount is less than 50%, they will continue to be able to strongly influence or effectively control our decisions and they will have the ability to nominate individuals to our Board pursuant to a stockholders’ agreement entered into by H&F and certain of our directors, officers, and other employees, in connection with the IPO. In addition, H&F is able to determine the outcome of all matters requiring stockholder approval and will be able to cause or prevent a change of control of our Company or a change in the composition of our Board and could preclude any unsolicited acquisition of our Company. The concentration of ownership could deprive you of an opportunity to receive a premium for your shares of common stock as part of a sale of our Company and ultimately might affect the market price of our common stock.
We are a “controlled company” within the meaning of the Nasdaq rules and the rules of the SEC. As a result, we will qualify for exemptions from certain corporate governance requirements that provide protection to stockholders of other companies.
H&F owns a majority of our outstanding common stock. As a result, we are a “controlled company” within the meaning of the corporate governance standards of Nasdaq. Under these rules, a company of which more than 50% of the voting power is held by an individual, group, or another company is a “controlled company” and may elect not to comply with certain corporate governance requirements, including:
•The requirement that a majority of our Board consist of “independent directors” as defined under the rules of the Nasdaq;
37
•The requirement that we have a compensation committee composed entirely of directors who meet the independence standards for compensation committee members with a written charter addressing the committee’s purpose and responsibilities; and
•The requirement that our director nominations be made, or recommended to our full Board, by our independent directors or by a nominations committee that consists entirely of independent directors and that we adopt a written charter or board resolution addressing the nominations process.
We do not currently utilize these exemptions. However, if we utilize any of these exemptions in the future, you will not have the same protections afforded to stockholders of companies that are subject to all of the corporate governance requirements of the Nasdaq.
Our stock price may change significantly, and purchasers of our common stock may not be able to resell shares of our common stock at or above the price they paid or at all, and they could lose all or part of their investment as a result.
The trading price of our common stock has been and is likely to continue to be volatile. The stock market has experienced extreme volatility. This volatility often has been unrelated or disproportionate to the operating performance of particular companies. Investors in our common stock may not be able to resell their shares at or above the purchase price due to multiple factors such as those listed in other portions of this “Risk Factors” section and the following:
•Actual or anticipated fluctuations in our quarterly financial and operating results;
•Introduction of new products, solutions, or services by us or our competitors;
•Our ability to integrate operations, technology, products, and services;
•Issuance of new or changed securities analysts’ reports or recommendations;
•Sales, or anticipated sales, of large blocks of our stock;
•Additions or departures of key personnel;
•Changing economic or overall market conditions;
•Industry developments; and
•Any default on our indebtedness.
These broad market and industry fluctuations may materially adversely affect the market price of our common stock, regardless of our actual operating performance. In addition, price volatility may be greater if the public float and trading volume of our common stock are low. Stock prices volatility also affect the impact we have with the authorized number of shares under our 2021 Equity Incentive Plan; a low stock price could require us to seek registration of additional shares to cover our obligations, which would dilute shares for our investors.
In the past, following periods of market volatility, stockholders have instituted securities class action litigation. If we were involved in securities litigation, it could have a substantial cost and divert resources and the attention of executive management from our business regardless of the outcome of such litigation.
As we realize the benefit of net operating losses and certain other tax benefits that arose prior to or in connection with our IPO, we are required to pay the TRA Participants equal to a significant portion of the benefit, which amounts could be material.
As further described in Note 13 in our Notes to the Consolidated Financial Statements, we expect to be able to utilize certain tax benefits that arose prior to or in connection with our IPO and are therefore attributable to the TRA Participants. These tax benefits will reduce the amount of tax we would otherwise be required to pay in the future.
We entered into a TRA with the TRA Participants which provides for the payment by us to the TRA Participants of 85% of the amount of cash savings, if any, in U.S. federal, state, and local income tax that we actually realize, or are deemed to realize (calculated using certain assumptions), as a result of utilizing such tax benefits subject to the TRA, including tax benefits attributable to payments under the TRA. We made payments, including accrued interest, pursuant to the TRA of $22.1 million and $10.5 million on January 12, 2024 and February 15, 2023, respectively. Future amounts and utilization of the tax benefits subject to the TRA, as well as the amount and timing of any payments under the TRA, will vary depending upon multiple factors, including the amount, character, and timing of our taxable income in the future. In addition, actual tax benefits realized by us may differ from the tax benefits calculated under the TRA as a result of the use of certain assumptions in the TRA, including an assumed state and local income tax rate to calculate tax benefits. We
38
expect that the additional payments we may make under the TRA will continue to be material. There may be a material negative effect on our liquidity if, as a result of timing discrepancies or otherwise, the payments under the TRA exceed the actual cash tax savings we realize in respect of the tax benefits subject to the TRA.
In certain cases, payments under the TRA may be accelerated and/or significantly exceed the actual cash savings we realize in respect of the tax benefits subject to the TRA.
The TRA provides that if we breach any of our material obligations under the TRA, whether as a result of a failure to make any payment when due, failure to honor any other material obligation required thereunder or by operation of law as a result of the rejection of the TRA in a case commenced under the federal bankruptcy laws or otherwise, upon the occurrence of certain bankruptcy or insolvency proceedings involving us, upon certain changes of control, or if, at any time, we elect an early termination of the TRA, our obligations under the TRA would be automatically accelerated and would be immediately due and payable, and such obligations would be calculated by reference to the value of all future payments that the TRA Participants would have been entitled to receive under the TRA using certain assumptions, including that we will have sufficient taxable income to fully utilize certain tax benefits subject to the TRA. Our ability to fully utilize certain tax benefits subject to the TRA will depend upon a number of factors, including the amount, character, and timing of our taxable income in the future. In periods prior to the occurrence of a change of control and absent circumstances requiring an early termination payment, we are only obligated to make payments under the TRA as and when we realize cash tax savings from the tax benefits subject to the TRA (calculated using certain assumptions contained therein). Accordingly, we will generally not be required (absent a change of control, material breach, or circumstances requiring an early termination payment) to make payments under the TRA for a taxable year in which we do not have taxable income because no cash tax savings will have been realized. In addition, recipients of payments under the TRA will not reimburse us for any payments previously made under the TRA if the tax attributes or our utilization of tax attributes underlying the relevant TRA payment are successfully challenged by the Internal Revenue Service (“IRS”) (although any such detriment would be taken into account as an offset against future payments due to the relevant recipient under the TRA). However, unutilized deductions that do not result in realized benefits in a given tax year as a result of insufficient taxable income may be applied to taxable income in future years and accordingly would impact the amount of cash tax savings in such future years and the amount of corresponding payments under the TRA in such future years.
Accordingly, it is possible that the actual cash tax savings we realize may be significantly less than the corresponding TRA payments. There may be a material negative effect on our liquidity if the payments under the TRA exceed the actual cash tax savings we realize in respect of the tax benefits subject to the TRA. We may need to incur additional indebtedness to finance payments under the TRA to the extent our cash resources are insufficient to meet our obligations under the TRA as a result of timing discrepancies or otherwise, and these obligations could have the effect of delaying, deferring, or preventing certain mergers, asset sales, other form of business combinations or other changes of control.
We are a holding company with no operations and rely on our operating subsidiaries to provide us with funds necessary to meet our financial obligations.
We are a holding company with no material direct operations. Our principal assets are the equity interests of Snap One, LLC that we hold indirectly through our subsidiaries. Snap One, LLC, together with its subsidiaries, owns substantially all our operating assets. As a result, we are dependent on loans, dividends, and other payments from our subsidiaries to generate the funds necessary to meet our financial obligations. Our subsidiaries are legally distinct from us and may be prohibited or restricted from paying dividends or otherwise making funds available to us. If we are unable to obtain funds from our subsidiaries, we may be unable to meet our financial obligations.
We currently do not intend to declare dividends on our common stock in the foreseeable future and, as a result, your only opportunity to achieve a return on your investment is if the price of our common stock appreciates.
We currently do not expect to declare any dividends on our common stock in the foreseeable future. Instead, we anticipate that all our earnings in the foreseeable future will be used to provide working capital, to support our operations, and to finance the growth and development of our business. Any determination to declare or pay dividends in the future will be at our Board’s discretion, subject to applicable laws and dependent upon multiple factors, including our earnings, capital requirements, and overall financial condition. In addition, our ability to pay dividends on our common stock is currently limited by the covenants of our credit facilities and may be further restricted by the terms of any future debt or preferred securities. Accordingly, your only opportunity to achieve a return on your investment in our Company may be if
39
the market price of our common stock appreciates and you sell your shares at a profit. The market price for our common stock may never exceed, and may fall below, the price you pay for such common stock.
Future sales, or the perception of future sales, by us or our existing stockholders in the public market could cause the market price for our common stock to decline.
The sale of shares of our common stock in the public market, or the perception that such sales could occur, could harm the prevailing market price of shares of our common stock. These sales, or the possibility that these sales may occur, also might make it more difficult for us to sell equity securities in the future at a time and at a price that we deem appropriate.
As of December 29, 2023, our directors, officers, executives, and our majority stockholder, H&F, represented approximately 77% of our total outstanding shares of common stock. If these stockholders were to sell a significant amount of their stock, or are perceived by the market as intending to sell a significant amount of their stock, the market price of our shares of common stock could drop significantly. The fact that a majority of our stock is owned by H&F could also make it more difficult for us to raise additional funds through future offerings of our shares of common stock or other securities.
Provisions in our organizational documents and Stockholders’ Agreement could delay or prevent a change of control.
Certain provisions of our amended and restated certificate of incorporation, amended and restated bylaws and Stockholders’ Agreement may have the effect of delaying or preventing a merger, acquisition, tender offer, takeover attempt, or other change-of-control transaction that a stockholder might consider to be in its best interest, including attempts that might result in a premium over the market price of our common stock.
These provisions provide for, among other things:
•The division of our Board into three classes, with directors in each class serving three-year terms and with terms of the directors of only one class expiring in any given year;
•That at any time when H&F and certain of its affiliates beneficially own, in the aggregate, less than 40% in voting power of the stock of our Company entitled to vote generally in the election of directors, directors may only be removed for cause, and only by the affirmative vote of the holders of at least two-thirds in voting power of all the then-outstanding shares of stock entitled to vote thereon, voting together as a single class;
•The ability of our Board to issue one or more series of preferred stock with voting or other rights or preferences that could have the effect of impeding the success of an attempt to acquire us or otherwise effect a change of control;
•Advance notice for nominations of directors by stockholders and for stockholders to include matters to be considered at stockholder meetings;
•The right of H&F and certain of its affiliates to nominate the majority of the members of our Board and the obligation of certain of our other pre-IPO stockholders to support such nominees;
•Certain limitations on convening special stockholder meetings; and
•That certain provisions of our amended and restated certificate of incorporation and amended and restated bylaws may be amended only by the affirmative vote of the holders of at least two-thirds in voting power of all the then-outstanding shares of our stock entitled to vote thereon, voting together as a single class, if H&F and certain of its affiliates beneficially own, in the aggregate, less than 40% in voting power of our stock entitled to vote generally in the election of directors.
These provisions could make it more difficult for a third-party to acquire us, even if the third-party’s offer may be considered beneficial by many of our stockholders. As a result, our stockholders may be limited in their ability to obtain a premium for their shares.
We are an “emerging growth company” and a “smaller reporting company” and the reduced disclosure requirements applicable to emerging growth companies or smaller reporting companies may make our common stock less attractive to investors.
We are an “emerging growth company,” as defined in the JOBS Act. We will remain an emerging growth company until the earliest to occur of: the last day of the fiscal year in which we have at least $1.235 billion in annual revenue; the
40
date we qualify as a “large accelerated filer,” with at least $700 million of equity securities held by non-affiliates; the issuance, in any three-year period, by us of more than $1.0 billion in non-convertible debt securities; or December 25, 2026, which is the last day of the fiscal year ending after the fifth anniversary of our IPO. For so long as we remain an emerging growth company, we are permitted by SEC rules and plan to rely on exemptions from certain disclosure requirements applicable to other SEC-registered public companies that are not emerging growth companies. These exemptions include not being required to comply with the requirement for an auditor attestation of the effectiveness of our internal control over financial reporting under Section 404 of the Sarbanes-Oxley Act (“SOX”), not being required to comply with any requirement that may be adopted by the Public Company Accounting Oversight Board regarding a supplement to the auditor’s report providing additional information about the audit and the financial statements, reduced disclosure obligations regarding executive compensation, and exemptions from the requirements of holding a nonbinding advisory vote on executive compensation and stockholder approval of any golden parachute payments not previously approved.
Additionally, we are a “smaller reporting company” as defined in Item 10(f)(1) of Regulation S-K. Smaller reporting companies may take advantage of certain reduced disclosure obligations, including providing only two years of audited financial statements (although we have elected to provide three years of audited financial statements in this Annual Report). We will remain a smaller reporting company until the last day of the fiscal year in which (1) the market value of our common stock held by non-affiliates equals or exceeds $250 million as of the prior last business day of the most recently completed second fiscal quarter or (2) our annual revenues equaled or exceeded $100 million during such completed fiscal year and the market value of our common stock held by non-affiliates equals or exceeds $700 million as of the prior last business day of the most recently completed second fiscal quarter. Even after we no longer qualify as an emerging growth company, we may still qualify as a smaller reporting company, which would allow us to continue to take advantage of many of the same exemptions from disclosure requirements, including reduced disclosure obligations regarding executive compensation in our periodic reports and proxy statements.
As a result of our reduced disclosure obligations, the information we provide stockholders will be different than the information that is available with respect to other public companies and may make it more difficult to compare out disclosures to other public companies. In this Annual Report, we have not included all of the executive compensation-related information that would be required if we were not an emerging growth company. We cannot predict whether investors will find our common stock less attractive if we rely on these exemptions. If some investors find our common stock less attractive as a result, there may be a less-active trading market for our common stock and our stock price may be more volatile.
In addition, an emerging growth company can take advantage of an extended transition period for complying with new or revised accounting standards. This allows an emerging growth company to delay the adoption of certain accounting standards until those standards would otherwise apply to private companies. We have elected to avail ourselves of this exemption from new or revised accounting standards and, therefore, we will not be subject to the same new or revised accounting standards as other public companies that are not emerging growth companies. As a result, our financial statements may not be comparable to companies that comply with new or revised accounting pronouncements as of public company effective dates.
Our management team identified a material weakness in our internal controls over financial reporting, which, if not remediated appropriately or timely, could result in the loss of investor confidence and could negatively impact our stock price and financial condition.
As a public company, we are required to maintain internal controls over financial reporting and to report any material weaknesses in such internal controls. Section 404 of SOX requires that we evaluate and determine the effectiveness of our internal controls over financial reporting. Our internal controls over financial reporting will not prevent or detect all errors and fraud. Because of the inherent limitations in all control systems, no evaluation can provide absolute assurance that misstatements due to error or fraud will not occur or that all control issues and instances of fraud will be detected.
In connection with the preparation of our consolidated financial statements as of December 25, 2020, and for the fiscal year then ended, we identified a material weakness in our internal controls over financial reporting. We did not design or maintain an effective control environment over certain information technology (“IT”) general controls or information systems and applications that are relevant to the preparation of our consolidated financial statements. Specifically, we did not design and maintain (i) program change management controls to ensure that IT program and data changes affecting
41
financial IT applications and underlying accounting records relevant to the preparation of our financial statements are identified, tested, authorized, and implemented appropriately, and (ii) access controls to ensure access to programs and data is authorized and entitlements and privileges are recertified on a periodic basis to validate that only authorized individuals have access to the Company’s data. As a result of the material weakness, our business process controls, both automated and manual, that are dependent on the affected IT general controls were also deemed ineffective because they could have been adversely impacted.
As further described in Management's Report on Internal Control over Financial Reporting, we have begun implementing a remediation plan to improve our internal control over financial reporting. To address this material weakness, we have hired personnel with public company experience and engaged external advisors to assist with evaluating and documenting the design and operating effectiveness of our internal controls over financial reporting and assisting with the remediation of deficiencies, including implementing new controls and processes. Additionally, the organization has focused resources on the consolidation of key financial systems and applications to support the standardization and enhancement of both information technology and business process controls. We intend to continue to take steps to remediate the material weakness through additional measures that include further evolving our accounting and business processes related to internal controls over financial reporting, including a plan to continue ongoing system enhancements.
We will not be able to fully remediate this material weakness until these steps have been completed and have been operating effectively for a sufficient period. Furthermore, we cannot assure you that the measures we have taken to date, and actions we may take in the future, will be sufficient to remediate the control deficiencies that led to this material weakness in our internal controls over financial reporting or that they will prevent or avoid potential future material weaknesses. Our current controls and any new controls we develop may become inadequate because of changes in conditions in our business. Further, additional weaknesses in our disclosure controls and internal controls over financial reporting may be discovered in the future. Any failure to develop or maintain effective controls or any difficulties encountered in their implementation or improvement could harm our operating results or cause us to fail to meet our reporting obligations and may result in a restatement of our annual or interim financial statements.
Our independent registered public accounting firm has not performed an evaluation of our internal controls over financial reporting in accordance with the SEC rules because no such evaluation has been required. Our independent registered public accounting firm is not expected to formally attest to the effectiveness of our internal controls over financial reporting until the Company ceases to be an emerging growth company and a smaller reporting company under applicable SEC rules. At such time, our independent registered public accounting firm may issue a report that is adverse in the event it is not satisfied with the level at which our internal controls over financial reporting is documented, designed, or operating. Any failure to implement and maintain effective internal controls over financial reporting also could adversely affect the results of periodic management evaluations and annual independent registered public accounting firm attestation reports regarding the effectiveness of our internal controls over financial reporting that we will eventually be required to include in our periodic reports filed with the SEC. Ineffective disclosure controls and procedures and internal controls over financial reporting could also cause investors to lose confidence in our reported financial and other information, which would likely have a negative effect on the trading price of our common stock. In addition, if we are unable to continue to meet these requirements, we may not be able to remain listed on the Nasdaq.
Our amended and restated certificate of incorporation provides, subject to limited exceptions, that the Court of Chancery of the State of Delaware and, to the extent enforceable, the federal district courts of the United States of America will be the sole and exclusive forums for certain stockholder litigation matters, which could limit our stockholders’ ability to obtain a favorable judicial forum for disputes with us or our directors, officers, or employees.
Our amended and restated certificate of incorporation provides, subject to limited exceptions, that unless we consent in writing to the selection of an alternative forum, the Court of Chancery of the State of Delaware shall, to the fullest extent permitted by law, be the sole and exclusive forum for any (i) derivative action or proceeding brought on behalf of our company, (ii) action asserting a claim of breach of a fiduciary duty owed by any director, officer, or other employee of our company to the Company or our stockholders, (iii) action asserting a claim against the Company or any director, officer or other employee of the Company arising pursuant to any provision of the Delaware General Corporation Law, (the “DGCL”), or our amended and restated certificate of incorporation or our amended and restated bylaws or as to which the DGCL confers jurisdiction on the Court of Chancery of the State of Delaware or (iv) action asserting a claim against the Company or any director, officer, or other employee of the Company governed by the internal affairs doctrine. These
42
provisions shall not apply to suits brought to enforce a duty or liability created by the Exchange Act or any other claim for which the federal courts have exclusive jurisdiction, and our stockholders cannot waive compliance with federal securities laws and the rules and regulations thereunder. Unless we consent in writing to the selection of an alternative forum, the federal district courts of the United States of America shall be the exclusive forum for the resolution of any complaint asserting a cause of action arising under the Securities Act. Any person or entity purchasing or otherwise acquiring any interest in shares of our capital stock shall be deemed to have notice of and consented to the forum provisions in our amended and restated bylaws.
These choice of forum provisions may limit a stockholder’s ability to bring a claim in a different judicial forum, including one that it may find favorable or convenient for disputes with us or any of our directors, officers, or other employees which may discourage lawsuits with respect to such claims.
Our Board is authorized to issue and designate shares of our preferred stock in additional series without stockholder approval.
Our certificate of incorporation authorizes our Board, without the approval of our stockholders, to issue 50 million shares of our preferred stock, subject to limitations prescribed by applicable law, rules and regulations and the provisions of our certificate of incorporation, as shares of preferred stock in series, to establish from time to time the number of shares to be included in each such series and to fix the designation, powers, preferences and rights of the shares of each such series and the qualifications, limitations, or restrictions thereof. The powers, preferences, and rights of these additional series of preferred stock may be senior to or on parity with our common stock, which may reduce its value.
Our stock repurchase program may not have an impact that is fully reflected in the current stock valuation.
Effective May 12, 2022, our Board authorized a $25.0 million share repurchase program, and as of December 29, 2023, we had approximately $21.9 million in remaining funds authorized under this program. The stock repurchase program was authorized to potentially offset dilution from equity issuances under our equity incentive plans and because our Board believes that, for reasons unrelated to our performance, the trading price of our common stock from time to time may not be reflective of the true value of the Company. The repurchase program was set to expire at the end of 2023, but was extended by the Board until the end of 2024. The Company is not obligated to acquire a specified number of shares and the program may be modified, suspended, or discontinued at any time at our Boards’ discretion. Stock repurchases may adversely affect the Company if the economy turns downward, as it could leave the Company limited in its ability to obtain cash necessary for ongoing operations or potential acquisition targets. In addition, any repurchase of stock may have no positive impact on our stock price. Further, as stock may be repurchased, given the volatility of our stock price, we may repurchase stock at prices which, in hindsight, are materially higher than the subsequent price of our stock.
Future acquisitions of technologies, assets or businesses that are paid for partially or entirely through the issuance of stock or stock rights could dilute the ownership of our existing stockholders.
In the past we have used our equity securities as part of the consideration for certain acquisitions, and in the future we expect that the consideration we might pay for acquisitions of technologies, assets or businesses could include stock, rights to purchase stock, cash, or some combination of the foregoing. If we issue stock or rights to purchase stock in connection with such future acquisitions, net income (loss) per share and then-existing holders of our common stock will experience dilution.
General Risks
Our business, results of operations, and financial condition have been adversely affected and could in the future be adversely affected by pandemics or other similar health crises.
The COVID-19 pandemic negatively impacted the global economy and global supply chains, and created significant disruption of global financial markets. While we are no longer experiencing any material impacts from COVID-19, new strains of COVID-19 or other viruses could emerge, causing authorities and businesses to take emergency measures to combat the spread of such viruses, including imposing lockdowns, shelter-in-place orders, quarantines, restrictions on travel and gatherings, and the shutdown of non-essential businesses. A pandemic and the associated responses to limit a potential pandemic could:
43
•Disrupt our hardware supply chain;
•Disrupt our ability to conduct product development activities and other activities necessary to improve products and bring new products to market;
•Disrupt and restrict our integrators’ ability to travel and to meet with residential and commercial end consumers who use our solutions;
•Cause cancellations or postponement of certain events;
•Cause temporary closures of our facilities, including manufacturing centers and critical product distribution locations, or the facilities of our service providers or suppliers; and
•Cause significant disruption of global financial markets, which may reduce our ability to access capital and which could negatively affect our liquidity in the future and impact our growth opportunities whether organically or through acquisitions.
Nearly all our operating cash is maintained in deposit accounts with various financial institutions and is not insured by the Federal Deposit Insurance Corporation.
The unexpected failure of several commercial banks last year, including First Republic Bank, Silicon Valley Bank, and Signature Bank, raised concerns about the stability of institutions with concentrated exposure to certain types of depositors in the same industry as well as those with large unrealized losses in their investment security holdings. While the Company does not have any direct exposure to any failed bank, nearly all our operating cash is maintained in deposit accounts at various financial institutions both in the United States of America and foreign countries. The majority of the Company’s funds held in the United States are with a single financial institution, which is among the largest in the United States. However, we may be subject to losses in excess of the Federal Depository Insurance Corporation insured limit in the event of a failure of this financial institution and the subsequent lack of intervention by the U.S. federal government. Additionally, if any of the institutions into which our funds are deposited experiences limited liquidity or otherwise defaults or does not perform its obligations to depositors, we may not be able to access those funds in a timely manner, or we may lose those funds, which could adversely affect our business, financial condition, or results of operations.
Risks associated with our labor force could have a significant adverse effect on our business.
We had approximately 1,610 full-time employees as of December 29, 2023. Various international, federal and state labor laws govern our relationships with our employees and affect our operating costs. These laws include, but are not limited to, employee classifications as exempt or non-exempt, minimum wage requirements, unemployment tax rates, workers’ compensation rates, overtime, family leave, anti-discrimination laws, safety standards, payroll taxes, employment agreements, citizenship requirements, and other wage and benefit requirements for employees classified as non-exempt. As our employees may be paid at rates that relate to the applicable minimum wage, further increases in the minimum wage could increase our labor costs. Employees may make claims against us under international, federal, or state laws, which could result in significant costs. Significant additional government regulations could materially affect our business, financial condition, and results of operations.
None of our U.S. employees is currently covered by collective bargaining or other similar labor agreements. However, if a large number of our U.S. employees were to unionize, our business could be negatively affected.
In addition, certain of our suppliers and logistics providers may have unionized work forces. Strikes, work stoppages or slowdowns could result in slowdowns or closures of facilities where the products we sell are manufactured or could affect the ability of our suppliers to deliver such products to us. Any interruption in the production or delivery of these products could delay or reduce availability of these products and increase our costs.
Given the complex nature of the technology on which our business is based and the speed with which such technology advances, our future success is dependent, in large part, upon our ability to attract and retain highly qualified executive, managerial, engineering, operations, and sales and marketing personnel. Competition for talented personnel is intense, and we cannot be certain that we can retain our executive, managerial, engineering, operations, and sales and marketing personnel, or that we can attract, assimilate, or retain such personnel in the future. Our inability to attract and retain such personnel may have a material adverse effect on our business, results of operations, and financial condition.
44
Increases in operating costs could adversely impact our business, financial position, results of operations, and cash flows.
Our financial performance is affected by the level of our operating expenses, such as wages and salaries, leases of distribution centers and sales and marketing offices, advertising and marketing, employee benefits, health care, insurance premiums, as well as various regulatory compliance costs, all of which may be subject to inflationary pressures. In particular, our financial performance is adversely affected by increases in these operating costs.
Our business is subject to the risks of earthquakes, hurricanes, fire, power outages, floods and other catastrophic events, and to interruption by man-made problems such as political unrest, information systems compromise, riots and terrorism.
A significant natural disaster, such as an earthquake, hurricane, fire, flood, pandemic, or a significant power outage could harm our business, results of operations, and financial condition. Natural disasters could affect our manufacturing vendors’ or logistics providers’ ability to perform services such as manufacturing products or assisting with shipments on a timely basis. In the event our manufacturing vendors’ information technology systems or manufacturing or logistics abilities are hindered, shipments could be delayed or cancelled, adversely affecting product deliveries, net sales and profitability, integrator and customer satisfaction, and our competitive standing. Further, if a natural disaster occurs in a region from which we derive a significant portion of our net sales, such as metropolitan areas in North America, end consumers in those regions may delay or forego purchases of our solutions from integrators, which may harm our results of operations for a particular period. All these risks may be exacerbated in the future due to climate change. In addition, acts of terrorism, including cyber terrorism or crime, acts of war, financial crises, trade friction or geopolitical and social turmoil in areas that serve as markets for our solutions, could cause disruptions in our business or the business of our manufacturers, logistics providers, integrators or the economy as a whole. These uncertainties may cause our end consumers to reduce discretionary spending and make it difficult for us to accurately plan future business activities. Given our typical concentration of sales at the end of each month and quarter, any disruption in the business of our manufacturers, logistics providers, integrators, and end consumers that impacts sales at the end of our quarter could have a greater impact on our quarterly results. All of these risks may be augmented if the disaster recovery plans for us and our suppliers and integrators prove to be inadequate. To the extent that any of the above results in delays or cancellations of orders, or delays in, or cancellations of the manufacture, deployment or shipment of our products, it may have a material adverse effect on our business, results of operations, and financial condition.
We will continue to incur increased costs as a result of operating as a publicly traded company, and our management will be required to devote substantial time to new compliance initiatives.
As a publicly traded company, we will continue to incur additional legal, accounting, and other expenses that we did not previously incur as a private company. These costs will increase after we are no longer an emerging growth company. Although we are currently unable to estimate these costs with any degree of certainty, they may be significant. In addition, SOX, the Dodd-Frank Wall Street Reform and Consumer Protection Act, and the rules of the SEC and Nasdaq have imposed various requirements on public companies. Our management and other personnel will need to devote a substantial amount of time to these compliance initiatives as well as investor relations. Moreover, these rules and regulations will increase our legal and financial compliance costs and will make some activities more time-consuming and costly. For example, we expect these rules and regulations to make it more difficult and more expensive for us to obtain director and officer liability insurance, and we may be required to incur additional costs to maintain the same or similar coverage.
If securities or industry analysts do not publish research or reports about our business, or publish negative reports about our business, our share price and trading volume could decline.
The trading market for our common stock depends in part on the research and reports that securities or industry analysts publish about our business. We do not have control over these analysts, activist investors, or those who short our stock. If one or more of the analysts who cover us, activist investors, or those who short our stock downgrade our shares, change their opinion of our shares, or publish negative or false reports for their own purposes, our share price will likely decline. If one or more of these analysts cease coverage of our Company or fail to regularly publish research or reports on us, we could lose visibility in the financial markets, which could cause our stock price or trading volume to decline.
45
Item 1B. Unresolved Staff Comments
Not applicable.
Item 1C. Cybersecurity
Risk Management Personnel
Primary responsibility for assessing, monitoring and managing our cybersecurity risks rests with the Company’s Senior Director of Cybersecurity and the Cybersecurity Core Team, supported by our Cybersecurity Leadership Team.
Senior Director of Cybersecurity:
Responsible for the day-to-day execution of our cybersecurity strategy, our Senior Director of Cybersecurity has a background with experience in information security and risk management. This person has over 28 years of IT and cybersecurity experience, with over 10 years specializing in digital forensics, incident response, and risk management, and holds a Management of Information Systems degree and Certified Information Systems Security Professional (“CISSP”) and Certified Information Security Manager (“CISM”) cybersecurity certifications. The Senior Director of Cybersecurity develops and implements policies, procedures, and controls to safeguard our information assets, and leads incident response efforts, ensuring a swift and effective response to potential cyber threats.
Cybersecurity Core Team:
Comprised of specialists in risk assessment, vulnerability management, and threat intelligence, the Cybersecurity Core Team focuses on identifying, evaluating, and mitigating cyber risks. Their backgrounds include various cybersecurity certifications including CISSP, CISM, Offensive Security Certified Professional (“OSCP”), Certified Information Systems Auditor (“CISA”), and Certified Cloud Security Professional (“CCSP”). This team conducts regular risk assessments, monitors the threat landscape, and collaborates with other departments to promptly address vulnerabilities.
Cybersecurity Leadership Team:
Comprised of leaders from various departments with a goal of providing high-level oversight and strategic direction for cybersecurity initiatives, the Cybersecurity Leadership Team strives to align cyber risk management with the overall business strategy and ensure resources are allocated appropriately. Members include employees from various operational perspectives and departments including IT, Finance, Legal, Product Development, Marketing, and People Management to foster a holistic approach to cybersecurity.
Engage Third Parties on Risk Management
Recognizing the complexity and evolving nature of cybersecurity threats, we engage with external consultants and auditors to assess and enhance our security posture. These third parties conduct periodic audits, vulnerability assessments, and provide recommendations to strengthen our overall cybersecurity framework. These partnerships enable us to leverage specialized knowledge and insights.
Oversee Third-party Risk
Because we are aware of the risks associated with third-party service providers, we endeavor to conduct due diligence of our third-party service providers before engagement and implement contractual protections designed to address potential risks and vulnerabilities.
Risks from Cybersecurity Threats
We are not aware of any specific cybersecurity incidents that individually or together materially affected our business in 2023, however we acknowledge that the current cyber environment means that we, like other companies in our industry, are under constant threat from hackers, terrorists and other cyber criminals that, if successful, could lead to data breaches,
46
unauthorized access to sensitive information, and other cyber threats that would be reasonably likely to materially affect our business strategy, financial condition, or results of operations.
Board of Directors Oversight
Management maintains a structured and systematic approach to reporting cybersecurity information to our Board. The audit and risk management committee (the “audit committee”) of our Board has primary oversight over our cybersecurity program. The audit committee is comprised of independent directors with expertise in risk management, technology, finance, and cybersecurity. In addition, audit committee members also have experience with cybersecurity oversight from their membership on other public company boards.
The audit committee meets periodically to review and assess the effectiveness of our cybersecurity program, incident response plans, and overall resilience against evolving threats. The audit committee also actively participates in strategic decisions related to cybersecurity, offering guidance and approval for major initiatives. This involvement ensures cybersecurity considerations are integrated into Snap One’s broader strategic objectives.
Management’s Role Managing Risk
Quarterly briefings and formal updates are provided by members of management to the audit committee to maintain transparency and facilitate informed decision-making regarding cybersecurity investments and strategies. These reports encompass a broad range of cybersecurity topics, including:
•Current Policies: Updates on the Company’s cybersecurity policies, procedures, and incident response plans;
•Threat Landscape Assessment: An overview of our current cybersecurity threat landscape, emerging trends, and potential risks;
•Incident Reporting: Details on any cybersecurity incidents, breaches, or threats, including the nature of the incident, response actions taken, and remediation plans.
•Investments and Initiatives: Updates on cybersecurity investments, initiatives, and projects to improve our overall cybersecurity posture; and
•Compliance and Regulatory Landscape: Insights into changes in cybersecurity regulations, compliance status, and efforts to align with industry best practices.
In addition, the audit committee regularly engages with our Senior Director of Cybersecurity and other relevant stakeholders to stay informed about the evolving threat landscape. The frequency of these additional meetings and reports vary to align with the dynamic nature of cybersecurity threats and the need for timely decision-making. This ensures the highest levels of management are kept abreast of the potential cybersecurity risks, and significant cybersecurity matters, and that strategic risk management decisions are escalated to the Board, ensuring they have comprehensive oversight and can provide guidance on critical cybersecurity issues.
In addition to meeting with the audit committee, the Senior Director of Cybersecurity and Cybersecurity Core Team conducts regular cybersecurity updates given to different groups of employees and management to promote awareness and accountability. These updates include risk assessments, tabletop exercises, incident response plans, and ongoing security initiatives. Further, recognizing employees’ critical role in cybersecurity, Snap One invests in training and awareness programs that empower employees to recognize and mitigate potential cyber risks, fostering a culture of cybersecurity throughout the organization.
Monitor Cybersecurity Incidents
Our program to manage and mitigate cybersecurity risks involves actively monitoring our systems for potential threats, including frequent reviews of threat-intelligence feeds, proactive security assessments, use of third-party software tools, and regular penetration tests to identify potential weaknesses. Our incident response plans are integral to our overall crisis management framework. In the event of a cybersecurity incident, our team follows an incident response plan that includes immediate actions to mitigate the impact and long-term strategies for remediation and prevention of future incidents.
47
Reporting Structure:
The escalation path for cyber incidents is determined by materiality. Minor cyber incidents are addressed immediately by the Cybersecurity Core Team. If the issue requires a cross-functional response, or there is any indication of business interruption, financial harm, data loss, significant system functionality loss, unreasonably delayed service provision or exposure of sensitive data (such as Personal Identifiable Information), the incident is escalated to the Cybersecurity Leadership Team to respond to the threat and perform an initial incident classification. If after further investigation, it is determined the incident could have a material impact on the business, the issue is escalated to the audit committee.
Continuous Improvement
We recognize the cybersecurity landscape is dynamic, and we strive to continuously refine our processes based on emerging threats and industry best practices. We conduct reviews of our cybersecurity risk management processes and make adjustments to adapt to the evolving threat landscape.
Item 2. Properties
As of December 29, 2023, our principal executive offices are in Charlotte, North Carolina and Lehi, Utah. Additionally, as of December 29, 2023, we had 43 existing local domestic branches across the United States, two Canadian branches and six distribution centers located in California, Kentucky, Missouri, North Carolina, the United Kingdom, and Australia. We lease or sublease all our corporate offices, distribution centers, and local branch spaces. We believe our facilities are adequate for our operations and that suitable additional space will be available when needed.
As of December 29, 2023, our material operating locations were as follows:
| Locations | Lease Expiration Dates | ||||
| Corporate Offices | |||||
Charlotte, North Carolina | 1/31/2025 | ||||
Lehi, Utah | 9/30/2033 | ||||
| Distribution Centers | |||||
Charlotte, North Carolina | 7/31/2025 | ||||
Hebron, Kentucky | 11/30/2025 | ||||
San Bernardino, California | 7/31/2027 | ||||
Saint Louis, Missouri | 9/15/2029 | ||||
Item 3. Legal Proceedings
From time to time, we are involved in legal proceedings arising in the ordinary course of our business. Management believes we do not have any pending or threatened litigation which, individually or in the aggregate, would have a material adverse effect on our business, results of operations, financial condition, or cash flows.
For additional information, see Note 14 in our Notes to the Consolidated Financial Statements.
Item 4. Mine Safety Disclosures
Not applicable.
48
Part II
Item 5. Market for Registrant’s Common Equity, Related Stockholder Matters and Issuer Purchases of Equity Securities
Market Information
Our common stock has been listed on the Nasdaq Global Select Market under the symbol “SNPO” since July 28, 2021. Prior to that time, there was no public market for our common stock.
Stock Performance Graph
This performance graph shall not be deemed “soliciting material” or to be “filed’ with the SEC for purposes of Section 18 of the Exchange Act, or otherwise subject to the liabilities under that Section, and shall not be deemed to be incorporated by reference into any of our filings under the Securities Act.
The following graph shows a comparison for the period from July 28, 2021 through December 29, 2023 of the cumulative total return for (i) our common stock, (ii) the Russell 2000 Index, and (iii) the Nasdaq Composite Index, assuming an initial investment of $100 on July 28, 2021 and reinvestment of all dividends. The returns in the graph are not intended to forecast or be indicative of possible future performance of our common stock.
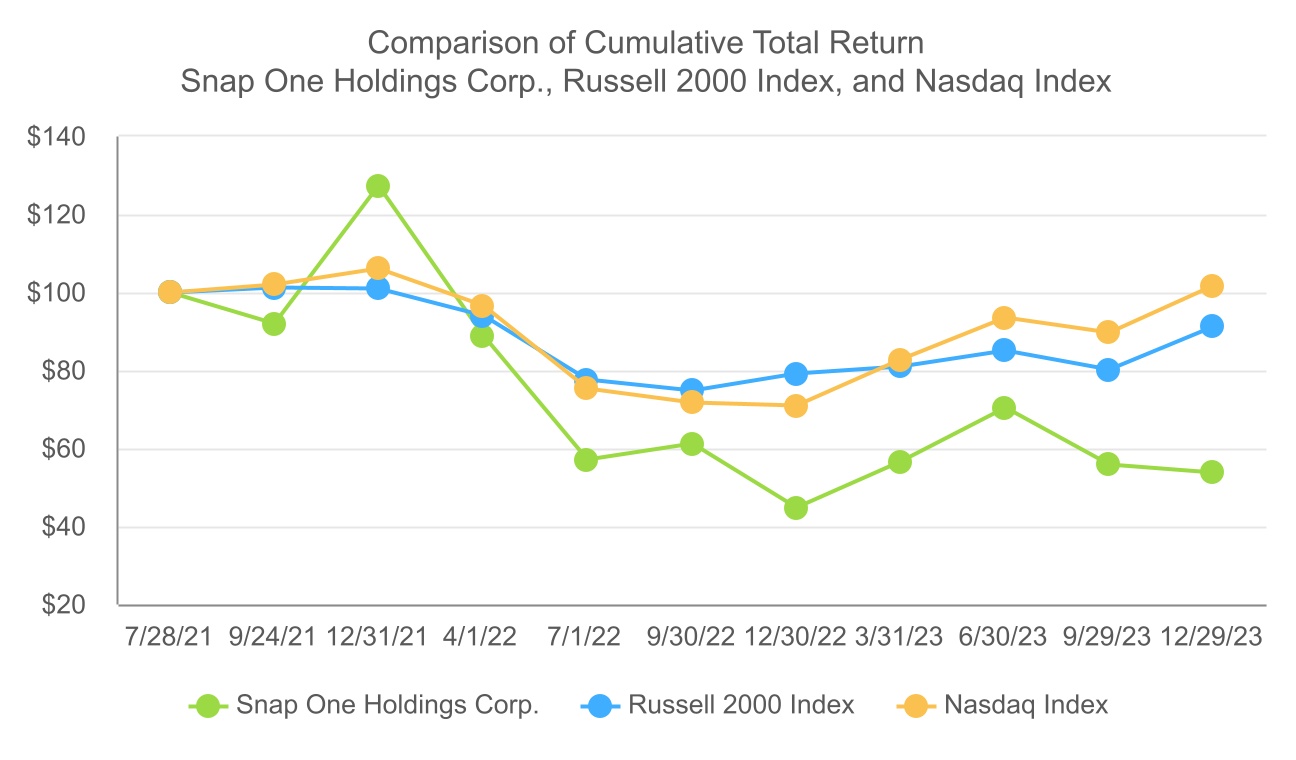
Holders of Record
As of March 4, 2024, there were 85 holders of record of our common stock. The actual number of stockholders is greater than this number of holders of record, and includes stockholders who are beneficial owners, but whose shares are held in street name by brokers and other nominees. This number of holders of record also does not include stockholders whose shares may be held in trust by other entities.
49
Dividend Policy
We have never declared or paid any cash dividends on our common stock and do not intend to pay any cash dividends in the foreseeable future. We anticipate that we will retain all our future earnings for use in the operation of our business and for general corporate purposes. Any determination to pay dividends in the future will be at the discretion of our Board.
Unregistered Sale of Equity Securities
On October 24, 2022, in connection with our acquisition of the remaining outstanding equity interests in our majority owned subsidiary, Remote Maintenance Systems LP, doing business as Parasol (“Parasol”), we agreed to issue 106,894 shares of our common stock (the “Parasol Transaction Equity”) to the three founders in full satisfaction of the $1.1 million purchase price for such remaining outstanding interests. Fifty percent of the Parasol Transaction Equity is subject to a contractual lock-up period that will end on the 12-month anniversary of its issuance. After this transaction, Parasol was merged into our wholly owned subsidiary, Snap One, LLC, which continues to provide the services formerly provided by Parasol.
The foregoing transaction did not involve any underwriters or any public offering. The issuance of the above securities was made in reliance on Section 4(a)(2) of the Securities Act or Regulation D promulgated thereunder as a transaction by an issuer not involving any public offering.
Securities Authorized for Issuance under Equity Compensation Plans
See “Security Ownership of Certain Beneficial Owners and Management and Related Stockholder Matters” for disclosure relating to our equity compensation plans. Such information will be included in our Proxy Statement relating to our 2024 Annual Meeting of Stockholders, which is incorporated herein by reference.
Purchase of Equity Securities
On May 12, 2022, the Board authorized a $25.0 million share repurchase program. The repurchase program does not obligate the Company to acquire a specified number of shares and may be modified, suspended, or discontinued at any time at the Boards’ discretion. The repurchase program was set to expire at the end of 2023, but on November 6, 2023 the Board extended the expiration of the repurchase program until the end of 2024. No common shares were repurchased by the Company during the three months ended December 29, 2023. As of December 29, 2023, we had approximately $21.9 million remaining under the repurchase program. See Note 16 in our Notes to the Consolidated Financial Statements for further information.
Item 6. [Reserved]
50
Unless otherwise indicated, references to the “Company,” “Snap One,” “we,” “us,” and “our” refer to Snap One Holdings Corp. and its consolidated subsidiaries. References to the “Former Parent Entity” means Crackle Holdings, L.P., the entity that, until the completion of our initial public offering, held all our outstanding equity.
Item 7. MANAGEMENT’S DISCUSSION AND ANALYSIS OF FINANCIAL CONDITION AND RESULTS OF OPERATIONS
The following discussion and analysis of our financial condition and results of operations should be read in conjunction with our consolidated financial statements and the related notes thereto included elsewhere in this Annual Report. This discussion may contain forward-looking statements based upon current expectations that involve risks and uncertainties. Actual results could differ materially from those discussed in or implied by forward-looking statements due to various factors, including those discussed below and elsewhere in this Annual Report, particularly in the “Risk Factors” or in other sections of this Annual Report.
We operate on a 52-week or 53-week fiscal year ending on the last Friday of December each year. Our fiscal year is divided into four quarters of 13 weeks, each beginning on a Saturday and containing one 5-week period followed by two 4-week periods. When a 53-week fiscal year occurs, we report the additional week in the fourth fiscal quarter. References to fiscal year 2021 are to our 53-week fiscal year ended December 31, 2021 and references to fiscal year 2022 are to our 52-week fiscal year ended December 30, 2022. References to fiscal year 2023 are to our 52-week fiscal year ended December 29, 2023.
Overview
Snap One powers smart-living by enabling professional integrators to deliver seamless experiences in the connected homes and businesses where people live, work, and play. We offer an end-to-end product ecosystem delivered through our powerful distribution network and further bolstered by our value-added services and support solutions. We serve a loyal and growing network of professional do-it-for-me (“DIFM”) integrator customers. We provide integrators with a leading, comprehensive, proprietary and third-party suite of connected, infrastructure, entertainment, and software solutions that deliver exceptional smart-living experiences to the end consumer. Our product and service offerings encompass all the elements required by integrators to build integrated smart-living systems that are easy to install and simple to manage while creating a powerful and premium experience for the end consumer. Our technology and software solutions are designed to support the integrator throughout the project lifecycle, enhancing their operations and helping them to profitably grow their businesses.
We are vertically integrated with most of our Net Sales and Contribution Margin coming from our proprietary branded, internally developed products sold to DIFM integrators in home technology, security, and commercial markets. Our comprehensive suite of solutions allows integrators to find everything they need in one place and to deliver high-quality, reliable, and configurable systems to end consumers. We also offer subscription-based services for end consumers including Parasol, 4Sight, Control4 Connect, and Control4 Assist. We launched Control4 Connect and Control4 Assist in January 2024, and we believe these new services significantly enhance our software platform, providing a foundation from which to build future service innovations and offerings. We have carefully designed our software platforms to enhance the long-term satisfaction of the end consumer, drive recurring revenue and incremental profitability for Snap One and our partners, and align the industry in a way that focuses on the end consumer. We believe these service offerings establish Snap One as a leader in the industry as it evolves to manage increasingly complex technology and more demanding customer expectations.
Key Factors Affecting Our Performance
Our historical financial performance has been primarily driven by the following factors, and we also expect these factors to continue to be the primary drivers of our financial performance in the future.
Increased Average Spend per Integrator via Wallet Share Expansion. Increasing wallet share with integrators depends, in part, on our ability to continue expanding our omni-channel coverage, extending our product suite, bolstering our support services, and creating deeper integration across our products to compel integrators to use Snap One as their one-stop shop. Average wallet share with our integrators varies across DIFM markets, with particular strength in home
51
technology and demonstrated success in commercial markets. We believe we can increase our wallet share with existing integrators through the adoption of our ecosystems, new product innovation, and our compelling loyalty program.
DIFM Integrator Additions in Home Technology, Commercial, and Internationally. We are a market leader in our core domestic home technology market, and we believe our value proposition appeals to integrators in attractive adjacent markets. We are utilizing our proven strategy of acquiring integrators in the home technology market to attract integrators in commercial markets, where we are less penetrated but have displayed a track record of growth. We believe strategic investments in expanding our product portfolio, improvements in targeted sales and marketing, and new integrator onboarding initiatives will allow us to grow our network of integrators across these markets. We also believe there is a meaningful opportunity to expand our existing market share in non-U.S. markets. We plan to grow in these markets by investing in sales resources, broadening our available product portfolio, and strengthening our direct-to-integrator sales approach in certain targeted international markets.
Investments in Our Integrated Platform. Our end-to-end product and software ecosystem and workflow solutions create an integrated platform of leading offerings, which we believe drive significant value for our integrators and personalized, immersive experiences for end consumers. We believe we can extend the value of our integrated platform by delivering value-added services to integrators and end consumers on a subscription basis.
Omni-Channel Strategy Expansion. Our business model is built around an e-commerce centric, omni-channel go-to-market strategy. We provide a comprehensive e-commerce portal, which allows integrators to easily research products, design projects, receive training and certifications, order products, and solicit ongoing support. Our e-commerce portal is complemented by a growing network of 43 domestic local branches, two Canadian local branches, and six distribution centers as of December 29, 2023. The local branch presence is an important part of our strategy as it allows us to better serve integrators by providing same-day product availability when necessary, creating a site for relationship building with our support team, and for training and product demonstration sessions. We believe integrators value the relationships and support we can deliver at the local level, and this further increases their loyalty to our business across channels.
Strategic Acquisitions. In addition to our organic growth, we continue to grow our business through strategic acquisitions such as our acquisitions of Access Networks, Staub, Parasol, and Clare to better serve existing and new integrators, broaden our product categories, and extend the geographic reach of our omni-channel capabilities. We expect to continue to pursue disciplined, accretive acquisitions that enhance our products, software, and workflow solutions and expand into adjacent markets that allow us to better serve our integrator base.
Macroeconomic Factors
Throughout the COVID-19 pandemic, we supported professional integrators with their business challenges to allow them to continue to provide their customers the infrastructure and connectivity they needed. In the wake of the COVID-19 pandemic, in 2021 and 2022, global supply chain constraints resulted in component sourcing, shipping, and logistics challenges resulting in cost inflation; which in turn resulted in delayed product availability in some cases. Although many supply chain issues have stabilized, and we are no longer experiencing any material impacts from COVID-19, we expect that some impact, including potential delayed product availability, may continue for as long as the global supply chain is experiencing these residual effects. We continue to invest in supply chain initiatives to attempt to mitigate the impact of future disruptions.
In February 2022, Russian military forces launched a military action in Ukraine and continued conflict and disruption in the region is likely. Although the length, impact, and outcome of the ongoing military action is highly unpredictable, this conflict has caused some global supply chain disruption, including volatility in commodity prices and supply of energy resources, instability in financial markets, political and social instability, and increases in cyberattacks and cyber and corporate espionage. Further, the Israel-Hamas War has caused substantial regional instability and world-wide concern and may disrupt global markets and foreign interest rates, cause increased inflation in energy and logistics costs, and disrupt the supply chain. Due to recent shipping disruptions in the Red Sea and surrounding waterways caused by attacks on shipping vessels in response to the Israel-Hamas war, we have taken preventative measures to avoid this route for any transportation activity. These alternative routes have not yet materially affected any of our lead-times or costs. We are actively monitoring these situations and potential impacts on the Company, but to date we have not experienced any material interruptions in our infrastructure, supplies, technology systems, or networks needed to support our operations from these international conflicts.
52
For additional information of risks related to these and other macroeconomic factors, refer to “Risk Factors” included in this Form 10-K.
53
Key Metrics and Reconciliation of Non-GAAP Financial Data
In addition to the measures presented in our consolidated financial statements, we present the following key business metrics on a fiscal year basis to help us monitor the performance of our business, identify trends affecting our business, and assist us in making strategic decisions:
Domestic Integrator Net Sales, Transacting Domestic Integrators, Spend per Transacting Domestic Integrator
We define “Domestic Integrator Net Sales” as sales in the fiscal year period from professional DIFM integrator customers who transact with Snap One in the United States through a traditional integrator channel. Domestic Integrator Net Sales is presented as a component of our revenue disaggregation.
We define “Transacting Domestic Integrators” as a unique integrator business that transacted with Snap One domestically in a fiscal year period.
We calculate “Spend per Transacting Domestic Integrator” as Domestic Integrator Net Sales divided by Transacting Domestic Integrators.
We believe these metrics are useful measures for evaluating our performance on a fiscal year basis by providing insight into the expansion of our integrator network and our ability to further capture wallet share.
The following table presents a reconciliation of Domestic Integrator Net Sales, Transacting Domestic Integrators, and Spend per Transacting Domestic Integrator for the periods presented:
| For the Years Ended | |||||||||||||||||
| December 29, 2023 | December 30, 2022 (a) | December 31, 2021(a) | |||||||||||||||
| ($ in thousands) | |||||||||||||||||
Domestic integrator net sales | $ | 904,788 | $ | 941,676 | $ | 849,074 | |||||||||||
| Divided by: | |||||||||||||||||
| Transacting domestic integrators (in thousands) | 19.7 | 19.6 | 19.6 | ||||||||||||||
Spend per transacting domestic integrator | $ | 45.9 | $ | 48.0 | $ | 43.3 | |||||||||||
| Year over year growth % | |||||||||||||||||
| Transacting domestic integrators | 0.5 | % | — | % | |||||||||||||
Spend per transacting domestic integrator | (4.4) | % | 10.9 | % | |||||||||||||
(a)Certain amounts, including Access Networks net sales and transacting domestic integrators, which were excluded in our presentation of these numbers in our prior Annual Report for the year ended December 30, 2022, have been reclassified to conform to the current period presentation.
Adjusted EBITDA and Adjusted Net Income
We define “Adjusted EBITDA” as net loss, plus interest expense, income tax benefit, depreciation and amortization, other expense (income), net, further adjusted to exclude equity-based compensation, acquisition-related and integration-related costs, IPO costs and certain other non-recurring, non-core, infrequent or unusual charges as set forth in the reconciliation in this section below.
We define “Adjusted Net Income” as net loss, plus amortization, further adjusted to exclude equity-based compensation, acquisition-related and integration-related costs, IPO costs, (income) expense related to the interest rate cap and certain non-recurring, non-core, infrequent or unusual charges, including the estimated tax impacts of these adjustments, as set forth in the reconciliation in this section below.
54
Adjusted EBITDA and Adjusted Net Income are key measures used by management to understand and evaluate our financial performance and generate future operating plans. Management uses these key measures to make strategic decisions regarding the allocation of capital and to analyze investments in initiatives that are focused on cultivating new markets for our products and services. We believe Adjusted EBITDA and Adjusted Net Income are useful measurements for analysts, investors, and other interested parties to evaluate companies in our markets as they help identify underlying trends that could otherwise be masked by certain expenses that we do not consider indicative of our ongoing performance.
Adjusted EBITDA and Adjusted Net Income have limitations as analytical tools. These measures are not calculated in accordance with GAAP and should not be considered in isolation from, or as a substitute for, financial information prepared in accordance with GAAP. In addition, Adjusted EBITDA and Adjusted Net Income may not be comparable to similarly titled metrics of other companies due to differences among the methods of calculation.
Certain prior period Adjusted EBITDA and Adjusted Net Income add-back amounts have been reclassified to conform to the current period presentation. These reclassifications had no effect on the previously reported Adjusted EBITDA and Adjusted Net Income totals.
The following table presents a reconciliation of net loss to Adjusted EBITDA for the periods presented:
| For the Years Ended | |||||||||||||||||
| December 29, 2023 | December 30, 2022 | December 31, 2021 | |||||||||||||||
| (in thousands) | |||||||||||||||||
| Net loss | $ | (21,368) | $ | (8,675) | $ | (36,457) | |||||||||||
| Interest expense | 58,263 | 35,839 | 33,162 | ||||||||||||||
| Income tax benefit | (12,041) | (1,459) | (6,642) | ||||||||||||||
| Depreciation and amortization | 61,125 | 59,582 | 56,581 | ||||||||||||||
| Other expense (income), net | 1,496 | 1,541 | (878) | ||||||||||||||
| Equity-based compensation | 23,492 | 23,291 | 21,522 | ||||||||||||||
| Loss on extinguishment of debt | — | — | 12,072 | ||||||||||||||
Severance cost(a) | 2,539 | 583 | — | ||||||||||||||
Compensation expense for payouts in lieu of TRA participation(b) | 642 | 1,116 | 10,925 | ||||||||||||||
IT system transition costs(c) | 515 | 552 | — | ||||||||||||||
Deferred acquisition payments(d) | 133 | 1,085 | 6,532 | ||||||||||||||
Fair value adjustment to contingent value rights(e) | (300) | (7,200) | 4,900 | ||||||||||||||
Loss on notes receivable(f) | — | 5,872 | — | ||||||||||||||
Acquisition and integration related costs(g) | — | 1,317 | 407 | ||||||||||||||
Deferred revenue purchase accounting adjustment(h) | — | 164 | 540 | ||||||||||||||
Fair value adjustment to contingent consideration(i) | — | (1,750) | — | ||||||||||||||
Initial public offering costs(j) | — | — | 4,755 | ||||||||||||||
Other professional services costs(k) | 469 | 2,116 | — | ||||||||||||||
Other(l) | 2,207 | 94 | 3,337 | ||||||||||||||
| Adjusted EBITDA | $ | 117,172 | $ | 114,068 | $ | 110,756 | |||||||||||
55
The following table presents a reconciliation of net loss to Adjusted Net Income for the periods presented:
| For the Years Ended | |||||||||||||||||
| December 29, 2023 | December 30, 2022 | December 31, 2021 | |||||||||||||||
| (in thousands) | |||||||||||||||||
| Net loss | $ | (21,368) | $ | (8,675) | $ | (36,457) | |||||||||||
| Amortization | 49,589 | 50,229 | 48,553 | ||||||||||||||
| Equity-based compensation | 23,492 | 23,291 | 21,522 | ||||||||||||||
| Interest rate cap expense | 2,034 | 2,563 | — | ||||||||||||||
Foreign currency (gain) loss | (187) | 88 | 131 | ||||||||||||||
| Loss on extinguishment of debt | — | — | 12,072 | ||||||||||||||
Severance cost(a) | 2,539 | 583 | — | ||||||||||||||
Compensation expense for payouts in lieu of TRA participation(b) | 642 | 1,116 | 10,925 | ||||||||||||||
IT system transition costs(c) | 515 | 552 | — | ||||||||||||||
Deferred acquisition payments(d) | 133 | 1,085 | 6,532 | ||||||||||||||
Fair value adjustment to contingent value rights(e) | (300) | (7,200) | 4,900 | ||||||||||||||
Loss on notes receivable(f) | — | 5,872 | — | ||||||||||||||
Acquisition and integration related costs(g) | — | 1,317 | 407 | ||||||||||||||
Deferred revenue purchase accounting adjustment(h) | — | 164 | 540 | ||||||||||||||
Fair value adjustment to contingent consideration(i) | — | (1,750) | — | ||||||||||||||
Initial public offering costs(j) | — | — | 4,755 | ||||||||||||||
Other professional services costs(k) | 469 | 2,116 | — | ||||||||||||||
Other(l) | 2,150 | 275 | 3,172 | ||||||||||||||
Income tax effect of adjustments(m) | (19,453) | (19,058) | (23,489) | ||||||||||||||
Adjusted Net Income | $ | 40,255 | $ | 52,568 | $ | 53,563 | |||||||||||
(a)Severance cost associated with various restructuring actions such as warehouse relocation, departmental reorganization, and focused reduction in workforce.
(b)Represents expense, net of forfeitures, related to payments to certain pre-IPO owners in lieu of their participation in the Tax Receivable Agreement entered into on July 29, 2021 (“TRA”). Management does not believe such costs are indicative of our ongoing operations as they are one-time awards specific to the establishment of the TRA.
(c)Represents costs associated with the implementation of enterprise resource planning (“ERP”) systems, customer resource management systems, and business intelligence systems as part of our initiative to modernize our information technology (“IT”) infrastructure.
(d)Represents expenses incurred related to deferred payments to employees associated with historical acquisitions. The deferred payments are cash retention awards for key personnel from the acquired companies and are to be paid to employees through 2023. Management does not believe such costs are indicative of our ongoing operations as they are one-time awards specific to acquisitions and are incremental to our typical compensation costs incurred and we do not expect such costs to be reflective of future increases in base compensation expense.
(e)Represents noncash gains and losses recorded from fair value adjustments related to contingent value right (“CVR”) liabilities. Fair value adjustments related to CVR liabilities represent potential obligations to the prior sellers in conjunction with the acquisition of the Company by investment funds managed by Hellman & Friedman, LLC (“H&F”) in August 2017.
(f)Represents provision for credit losses on notes receivable related to the Company’s unsecured loan to Clare.
56
(g)Represents costs directly associated with acquisitions and acquisition-related integration activities. These costs also include certain restructuring costs (e.g., severance) and other third-party transaction advisory fees associated with planned and completed acquisitions.
(h)Represents an adjustment related to the fair value of deferred revenue related to the Control4 Corporation acquisition.
(i)Represents noncash adjustment to the fair value of contingent consideration related to the Access Networks acquisition.
(j)Represents expenses related to professional fees in connection with preparation for our IPO.
(k)Represents professional service fees associated with managements remediation of the material weakness that was disclosed as part of our initial Registration Statement, preparation for compliance with SOX, the implementation of new accounting standards, and accounting for non-recurring transactions.
(l)Represents non-recurring expenses related to consulting, restructuring, and other expenses which management believes are not representative of our operating performance.
(m)Represents the tax impacts with respect to each adjustment noted above after considering the impact of permanent differences using the statutory tax rate related to the applicable federal and foreign jurisdictions and the blended state tax rate.
Contribution Margin
We define “Contribution Margin” for a particular period as net sales, less cost of sales, exclusive of depreciation and amortization, divided by net sales. Management uses this key measure to understand and evaluate our financial performance and generate future operating plans, make strategic decisions regarding the allocation of capital, and analyze investments in initiatives focused on cultivating new markets for our products and services. We believe Contribution Margin is a useful measurement for analysts, investors, and other interested parties to evaluate companies in our markets as they help identify underlying trends that could otherwise be masked by certain expenses that we do not consider indicative of our ongoing performance.
Contribution Margin has limitations as an analytical tool. This measure is not calculated in accordance with GAAP and should not be considered in isolation from, or as a substitute for, financial information prepared in accordance with GAAP. In addition, Contribution Margin may not be comparable to similarly titled metrics of other companies due to differences among the methods of calculation.
The following table presents the calculation of Contribution Margin:
| For the Years Ended | |||||||||||||||||
| December 29, 2023 | December 30, 2022 | December 31, 2021 | |||||||||||||||
| ($ in thousands) | |||||||||||||||||
Net sales | $ | 1,060,979 | $ | 1,123,811 | $ | 1,008,013 | |||||||||||
Cost of sales, exclusive of depreciation and amortization(a) | 613,661 | 682,638 | 599,923 | ||||||||||||||
Net sales less cost of sales, exclusive of depreciation and amortization | $ | 447,318 | $ | 441,173 | $ | 408,090 | |||||||||||
Contribution Margin | 42.2 | % | 39.3 | % | 40.5 | % | |||||||||||
(a)Cost of sales for fiscal years 2023, 2022, and 2021 excludes depreciation and amortization of $61.1 million, $59.6 million, and $56.6 million, respectively.
Free Cash Flow
We define “Free Cash Flow” as net cash provided by (used in) operating activities less capital expenditures, which consist of purchases of property and equipment as well as purchases of information technology, software development, and leasehold improvements. Free Cash Flow is not a measure calculated in accordance with GAAP and should not be
57
considered in isolation from, or as a substitute for financial information prepared in accordance with GAAP. In addition, Free Cash Flow may not be comparable to similarly titled metrics of other companies due to differences among methods of calculation. Free Cash Flow provides useful information to investors and others in understanding and evaluating our ability to generate additional cash from our business in the same manner as our management and Board. Free Cash Flow may be affected in the near to medium term by the timing of capital investments (such as purchases of information technology and other equipment and leasehold improvements), fluctuations in our growth and the effect of such fluctuations on working capital and changes in our cash conversion cycle due to increases or decreases of vendor payment terms as well as inventory turnover.
The following table presents a reconciliation of net cash provided by (used in) operating activities to Free Cash Flow for the periods presented:
| For the Years Ended | |||||||||||||||||
| December 29, 2023 | December 30, 2022 | December 31, 2021 | |||||||||||||||
| (in thousands) | |||||||||||||||||
Net cash provided by (used in) operating activities | $ | 89,295 | $ | (23,070) | $ | (30,415) | |||||||||||
Purchases of property and equipment | (22,805) | (21,492) | (10,004) | ||||||||||||||
Free Cash Flow | $ | 66,490 | $ | (44,562) | $ | (40,419) | |||||||||||
Basis of Presentation and Key Components of Results of Operations
Net Sales
We generate net sales by selling hardware products, primarily to our professional integrators, both with and without embedded software, which are then resold to end consumers, typically in the installation of an audio/video, IT, smart-home, or surveillance-related solution. We act both as a principal in selling proprietary products, and as an agent in selling certain third-party products through strategic partnerships with outside suppliers. In addition, we generate a small but growing percentage of our revenue through recurring revenue from subscription services associated with product sales including hosting services, technical support, and access to software updates and upgrades. Revenue is recognized when the integrator obtains control of the product, which typically occurs upon shipment, in an amount that reflects the consideration expected to be received in exchange for those products net of estimated discounts, rebates, returns, allowances, and any taxes collected and remitted to government authorities. Revenue allocated to subscription services is recognized over time as services are provided. See “ — Critical Accounting Estimates and Policies — Revenue Recognition.”
Cost of Sales, Exclusive of Depreciation and Amortization
Cost of sales, exclusive of depreciation and amortization, includes expenses related to production of proprietary finished goods, including raw materials and inbound freight, purchase costs for third-party products produced by strategic partners and sold by Snap One, rebates, inventory reserve adjustments, and employee costs related to assembly services. The components of our cost of sales, exclusive of depreciation and amortization may not be comparable to our peers. The changes in our cost of sales, exclusive of depreciation and amortization generally correspond with the changes in net sales and may be impacted by any significant fluctuations in the components of our cost of sales, exclusive of depreciation and amortization.
Selling, General, and Administrative Expenses
Selling, general, and administrative costs include payroll and related costs, occupancy costs, costs related to warehousing, distribution, outbound shipping to integrators, credit card processing fees, warranty, purchasing, advertising, research and development, non-income-based taxes, equity-based compensation, acquisition-related expenses, compensation expense for payouts in lieu of the TRA participation, provision for credit losses, and other corporate overhead costs.
58
Depreciation and Amortization
Depreciation expense is related to investments in property and equipment. Amortization expense consists of amortization of intangible assets originating from our acquisitions. Acquired intangible assets include developed technology, customer relationships, trademarks, and trade names.
Interest Expense
Interest expense includes interest expense on debt, including term loans and revolving credit facilities (each of which is described in more detail below under “— Liquidity and Capital Resources — Debt Obligations”), as well as the non-cash amortization of deferred financing costs.
Other Expense (Income), Net
Other expense (income), net, includes interest income, foreign currency remeasurement, TRA liability adjustments, interest rate cap expense, gains and losses on disposal of business, and transaction gains and losses.
Income Tax (Benefit) Expense
We are subject to U.S. federal, state, and local income taxes as well as foreign income taxes based on enacted tax rates in each jurisdiction, as adjusted for allowable credits and deductions. During the ordinary course of business, there are many transactions and calculations for which the ultimate tax determination is uncertain. As a result, we recognize tax liabilities based on estimates of whether additional taxes will be due.
59
Results of Operations
The following table sets forth our results of operations and results of operations data expressed as a percentage of net sales for the periods presented. The period-to-period comparison of financial results is not necessarily indicative of future results.
| For the Years Ended | |||||||||||||||||||||||||||||||||||
| December 29, 2023 | % of Net sales | December 30, 2022 | % of Net sales | December 31, 2021 | % of Net sales | ||||||||||||||||||||||||||||||
| ($ in thousands) | |||||||||||||||||||||||||||||||||||
Net sales | $ | 1,060,979 | 100.0 | % | $ | 1,123,811 | 100.0 | % | $ | 1,008,013 | 100.0 | % | |||||||||||||||||||||||
| Costs and expenses: | |||||||||||||||||||||||||||||||||||
| Cost of sales, exclusive of depreciation and amortization | 613,661 | 57.8 | % | 682,638 | 60.8 | % | 599,923 | 59.5 | % | ||||||||||||||||||||||||||
Selling, general, and administrative expenses | 359,843 | 33.9 | % | 354,345 | 31.5 | % | 350,252 | 34.7 | % | ||||||||||||||||||||||||||
| Depreciation and amortization | 61,125 | 5.8 | % | 59,582 | 5.3 | % | 56,581 | 5.6 | % | ||||||||||||||||||||||||||
| Total costs and expenses | 1,034,629 | 97.5 | % | 1,096,565 | 97.6 | % | 1,006,756 | 99.9 | % | ||||||||||||||||||||||||||
| Income from operations | 26,350 | 2.5 | % | 27,246 | 2.4 | % | 1,257 | 0.1 | % | ||||||||||||||||||||||||||
| Other expenses (income): | |||||||||||||||||||||||||||||||||||
| Interest expense | 58,263 | 5.5 | % | 35,839 | 3.2 | % | 33,162 | 3.3 | % | ||||||||||||||||||||||||||
| Loss on extinguishment of debt | — | — | % | — | — | % | 12,072 | 1.2 | % | ||||||||||||||||||||||||||
| Other expense (income), net | 1,496 | 0.1 | % | 1,541 | 0.1 | % | (878) | (0.1) | % | ||||||||||||||||||||||||||
| Total other expenses | 59,759 | 5.6 | % | 37,380 | 3.3 | % | 44,356 | 4.4 | % | ||||||||||||||||||||||||||
| Loss before income taxes | (33,409) | (3.1) | % | (10,134) | (0.9) | % | (43,099) | (4.3) | % | ||||||||||||||||||||||||||
| Income tax benefit | (12,041) | (1.1) | % | (1,459) | (0.1) | % | (6,642) | (0.7) | % | ||||||||||||||||||||||||||
| Net loss | (21,368) | (2.0) | % | (8,675) | (0.8) | % | (36,457) | (3.6) | % | ||||||||||||||||||||||||||
| Net loss attributable to noncontrolling interest | — | 0.0 | % | (49) | 0.0 | % | (55) | 0.0 | % | ||||||||||||||||||||||||||
| Net loss attributable to Company | $ | (21,368) | (2.0) | % | $ | (8,626) | (0.8) | % | $ | (36,402) | (3.6) | % | |||||||||||||||||||||||
Fiscal Year 2023 Compared to Fiscal Year 2022
Net Sales
| For the Years Ended | |||||||||||||||||||||||
| December 29, 2023 | December 30, 2022 | $ Change | % Change | ||||||||||||||||||||
| ($ in thousands) | |||||||||||||||||||||||
Net sales | $ | 1,060,979 | $ | 1,123,811 | $ | (62,832) | (5.6) | % | |||||||||||||||
Net sales decreased $62.8 million, or 5.6%, in fiscal year 2023, compared to fiscal year 2022. Of the 5.6% decrease in net sales from the prior fiscal year, we estimate that channel inventory destocking represented a significant portion of this year-over-year decrease. These decreases were partially offset by organic net sales growth, which primarily includes components such as the continued ramp of local branches opened in the past year and the cumulative impact of proprietary product price adjustments taken in the past year, partially offset by the year-over-year net change in backorder fulfillment.
60
Cost of Sales, Exclusive of Depreciation and Amortization
| For the Years Ended | |||||||||||||||||||||||
| December 29, 2023 | December 30, 2022 | $ Change | % Change | ||||||||||||||||||||
| ($ in thousands) | |||||||||||||||||||||||
| Cost of sales, exclusive of depreciation and amortization | $ | 613,661 | $ | 682,638 | $ | (68,977) | (10.1) | % | |||||||||||||||
| As a percentage of net sales | 57.8 | % | 60.8 | % | |||||||||||||||||||
Cost of sales, exclusive of depreciation and amortization, decreased $69.0 million, or 10.1%, in fiscal year 2023, compared to fiscal year 2022, primarily driven by a decrease in net sales. As a percentage of net sales, cost of sales, exclusive of depreciation and amortization, decreased to 57.8% in the current fiscal year from 60.8% in the prior fiscal year. The decrease in cost of sales, exclusive of depreciation and amortization, as a percentage of net sales, was primarily due to the cumulative impact of price adjustments taken in the last twelve months and the execution of supply chain cost management initiatives which drove input cost efficiencies. This was partially offset by lower proprietary product mix in the period due to the year-over-year net change in backorder fulfillment and channel inventory destocking, as well as growth in third-party product sales, which was largely driven by new local branch openings, incremental brand assortment, and certain manufacturer promotions. The decrease in cost of sales, exclusive of depreciation and amortization, as a percentage of net sales resulted in a higher Contribution Margin of 42.2% for fiscal year 2023, compared to 39.3% for fiscal year 2022.
Selling, General, and Administrative (“SG&A”) Expenses
| For the Years Ended | |||||||||||||||||||||||
| December 29, 2023 | December 30, 2022 | $ Change | % Change | ||||||||||||||||||||
| ($ in thousands) | |||||||||||||||||||||||
Selling, general, and administrative expenses | $ | 359,843 | $ | 354,345 | $ | 5,498 | 1.6 | % | |||||||||||||||
| As a percentage of net sales | 33.9 | % | 31.5 | % | |||||||||||||||||||
Selling, general, and administrative expenses increased $5.5 million, or 1.6%, in fiscal year 2023, compared to fiscal year 2022. The increase in selling, general, and administrative expenses was attributable in part to a $6.9 million year-over-year change in fair value adjustments to contingent value rights, partially offset by a $5.9 million decrease in provisions for credit losses on notes receivable. Additional drivers of the increase include $2.0 million increase in severance costs and the costs associated with local branch openings in the last year.
As described in the notes to the reconciliation of net loss to Adjusted EBITDA and Adjusted Net Income, severance cost includes costs associated with various restructuring actions such as warehouse relocation, departmental reorganization, and focused workforce reduction. The cumulative impact of these actions resulted in an approximately 5% reduction in workforce in fiscal year 2023.
Depreciation and Amortization
| For the Years Ended | |||||||||||||||||||||||
| December 29, 2023 | December 30, 2022 | $ Change | % Change | ||||||||||||||||||||
| ($ in thousands) | |||||||||||||||||||||||
| Depreciation and amortization | $ | 61,125 | $ | 59,582 | $ | 1,543 | 2.6 | % | |||||||||||||||
| As a percentage of net sales | 5.8 | % | 5.3 | % | |||||||||||||||||||
Depreciation and amortization expenses increased $1.5 million, or 2.6%, in fiscal year 2023, compared to fiscal year 2022. Depreciation expense increased primarily due to the build-out of our new corporate office in Lehi, UT, as well as the opening of new local branches in the last year.
61
Interest Expense
| For the Years Ended | |||||||||||||||||||||||
| December 29, 2023 | December 30, 2022 | $ Change | % Change | ||||||||||||||||||||
| ($ in thousands) | |||||||||||||||||||||||
| Interest expense | $ | 58,263 | $ | 35,839 | $ | 22,424 | 62.6 | % | |||||||||||||||
| As a percentage of net sales | 5.5 | % | 3.2 | % | |||||||||||||||||||
Interest expense increased $22.4 million, or 62.6%, in fiscal year 2023, compared to fiscal year 2022. The increase was primarily driven by higher interest rates as well as higher average outstanding balances on our long-term debt in fiscal year 2023, compared to fiscal year 2022.
Other Expense, Net
| For the Years Ended | |||||||||||||||||||||||
| December 29, 2023 | December 30, 2022 | $ Change | % Change | ||||||||||||||||||||
| ($ in thousands) | |||||||||||||||||||||||
Other expense | $ | 1,496 | $ | 1,541 | $ | (45) | (2.9) | % | |||||||||||||||
| As a percentage of net sales | 0.1 | % | 0.1 | % | |||||||||||||||||||
Other expense did not change materially in fiscal year 2023, compared to fiscal year 2022, as the $1.6 million decrease in expense related to the interest rate cap was offset by a $1.7 million increase related to TRA adjustments.
Income Tax (Benefit) Expense
| For the Years Ended | |||||||||||||||||||||||
| December 29, 2023 | December 30, 2022 | $ Change | % Change | ||||||||||||||||||||
| ($ in thousands) | |||||||||||||||||||||||
| Income tax benefit | $ | (12,041) | $ | (1,459) | $ | (10,582) | 725.3 | % | |||||||||||||||
| As a percentage of net sales | (1.1) | % | (0.1) | % | |||||||||||||||||||
Income tax benefit increased by $10.6 million, or 725.3%, in fiscal year 2023, compared to fiscal year 2022. The effective tax rate for fiscal year 2023 was a benefit of 36.0%, compared to 14.5% for fiscal year 2022. The change in the effective tax rate for fiscal year 2023, and the difference from the U.S. federal statutory rate of 21%, was primarily the result of research and development credits and changes to the valuation allowance, offset by nondeductible stock compensation and changes in uncertain tax positions.
Fiscal Year 2022 Compared to Fiscal Year 2021
The comparison of our fiscal year 2022 results with fiscal 2021 can be found under the heading “Fiscal Year 2022 Compared to Fiscal Year 2021” in the “Management’s Discussion and Analysis” section of the Company’s 2022 Annual Report on Form 10-K, filed with the SEC on March 15, 2023, as supplemented by the Form 10-K/A filed with the SEC on June 30, 2023 (together the Company’s “2022 Form 10-K”).
62
Liquidity and Capital Resources and Material Changes in Financial Position
Sources of Liquidity
Our primary sources of liquidity are net cash provided by operating activities and availability under our Credit Agreement. We assess our liquidity in terms of our ability to generate adequate amounts of cash to meet current and future needs. Our expected primary uses on a short-term and long-term basis are for working capital requirements, capital expenditures, geographic or service offering expansion, acquisitions, debt service requirements, and other general corporate purposes. Our primary working capital requirements are for the purchase of inventory, payroll, rent, other facility costs, distribution costs, and general and administrative costs. Our working capital requirements fluctuate during the year, driven primarily by seasonality and the timing of inventory purchases. Our capital expenditures are primarily related to infrastructure-related investments, including investments related to upgrading and maintaining our information technology systems, ongoing location improvements (joint design and manufacturing tooling), expenditures related to our distribution centers, and new local branch openings.
We have typically funded our operations and acquisitions primarily through internally generated cash on hand and our Credit Facilities. On July 30, 2021, we completed our IPO of 13.9 million shares of our common stock, and on August 18, 2021, we completed the sale of 1.2 million shares of additional common stock to the underwriters pursuant to their option to purchase additional shares, at an offering price of $18.00 per share. We raised net proceeds of $249.2 million through the IPO, after deducting underwriting discounts and other offering costs of $21.2 million.
Working Capital, Excluding Deferred Revenue
The following table summarizes our cash, cash equivalents, accounts receivable, and working capital, which we define as current assets minus current liabilities excluding deferred revenue, for the periods indicated:
| As of | |||||||||||
| December 29, 2023 | December 30, 2022 | ||||||||||
(in thousands) | |||||||||||
Cash and cash equivalents | $ | 61,023 | $ | 21,117 | |||||||
Accounts receivable, net | $ | 45,879 | $ | 48,174 | |||||||
Working capital, excluding deferred revenue | $ | 256,312 | $ | 267,457 | |||||||
Our cash and cash equivalents as of December 29, 2023, are available for working capital purposes. We do not enter into investments for trading purposes, and our investment policy is to invest any excess cash in short-term, highly liquid investments that reduce the risk of principal loss; therefore, our cash and cash equivalents are held in demand deposit accounts that generate very low returns.
We believe our existing cash and cash equivalents, together with expected cash flow from operating activities, will be sufficient to fund our operations and capital expenditure requirements for the next 12 months. Beyond the next 12 months, our primary capital requirements consist of required principal and interest payments on long-term debt, TRA Payments, and lease payments under non-cancelable lease commitments, as further described in Notes 7, 13, and 15 in our Notes to the Consolidated Financial Statements. If cash provided by operating activities and borrowings under our Credit Agreement are not sufficient or available to meet our short and long-term capital requirements, then we may consider additional equity or debt financing in the future. There can be no assurance debt or equity financing will be available to us if we need it or, if available, that the terms will be satisfactory to us. Our sources of liquidity could be affected by factors described under “Risk Factors.”
Debt Obligations
On December 8, 2021, we entered into a credit agreement (the “Credit Agreement”) with various financial institutions and Morgan Stanley Senior Funding, Inc., as administrative agent (the “Administrative Agent”) consisting of a $465.0 million aggregate principal amount of senior secured term loans (the “Term Loan”) maturing in 2028 and a $100.0 million senior secured revolving credit facility (the “Revolving Credit Facility”) (which includes borrowing capacity available for letters of credit) maturing in 2026.
63
On October 2, 2022, we entered into an Incremental Agreement (the “Incremental Agreement”) with the lenders party thereto and the Administrative Agent to provide incremental term loans (the “Incremental Term Loans”) maturing in 2025 in an aggregate principal amount of $55.0 million. The Incremental Agreement amended the Credit Agreement (the Credit Agreement, as amended by the Incremental Agreement, is the “Amended Credit Agreement”).
We further amended the Credit Agreement on April 17, 2023 to replace the London InterBank Offered Rate (“LIBOR”) with the Secured Overnight Financing Rate (“SOFR”) as applicable. See Note 7 in our Notes to the Consolidated Financial Statements for additional information about this amendment.
Borrowings under the Term Loan will bear interest at a rate per annum equal to, at the Company’s option, either (1) an applicable margin plus a base rate determined by reference to the highest of (a) 0.5% per annum plus the federal funds effective rate, (b) the prime rate, and (c) the eurocurrency rate determined by reference to the cost of funds for U.S. dollar deposits (subsequently changed to the forward-looking term rate based on SOFR for rates initiated after the effective date of the Amendment to the Credit Agreement) for an interest period of one month adjusted for certain additional costs, plus 1.0%; provided that such rate is not lower than a floor of 1.5% or (2) an applicable margin plus a eurocurrency rate determined by reference to the cost of funds for U.S. dollar deposits (subsequently changed to the forward-looking term rate based on SOFR for rates initiated after the effective date of the Amendment to the Credit Agreement) for the interest period relevant to such borrowing adjusted for certain additional costs; provided that such rate is not lower than a floor of 0.5%.
Borrowings under the Incremental Term Loan will bear interest at a rate per annum equal to, at the Company’s option, either (1) an applicable margin plus a base rate determined by reference to the highest of (a) 0.5% per annum plus the federal funds effective rate, (b) the prime rate, and (c) the forward-looking term rate based on the SOFR for an interest period of one month plus 1.0%; provided that such rate is not lower than a floor of 1.0% or (2) an applicable margin plus a forward-looking rate based on SOFR for the interest period relevant to such borrowing provided that such rate is not lower than a floor of 0.5%.
Borrowings under the Revolving Credit Facility will bear interest at a rate per annum equal to an applicable margin based upon a leverage-based pricing grid, plus, at the Company’s option, either (1) a base rate determined by reference to the highest of (a) 0.5% per annum plus the federal funds effective rate, (b) the prime rate, and (c) the eurocurrency rate determined by reference to the cost of funds adjusted for certain additional costs (subsequently changed to the forward-looking term rate based on SOFR for rates initiated after the effective date of the Amendment to the Credit Agreement) for an interest period of one month, plus 1.0%; provided such rate is not lower than a floor of 1.0% or (2) a eurocurrency rate determined by reference to the applicable cost of funds for such borrowing adjusted for certain additional costs (subsequently changed to the forward-looking term rate based on SOFR for rates initiated after the effective date of the Amendment to the Credit Agreement); provided such rate is not lower than a floor of zero, subsequently changed to 0.5% based on SOFR for rates initiated after the effective date of the Amendment to the Credit Agreement.
The Term Loan amortizes in fixed equal quarterly installments in an amount equal to 1.0% per annum of the total aggregate principal amount thereof immediately after borrowing, with the balance due at maturity. We may voluntarily prepay loans or reduce commitments under the Credit Agreement, in whole or in part, subject to minimum amounts, with prior notice but without premium or penalty (subject to customary exceptions, including prepayments of the Term Loan in connection with a repricing transaction that is consummated prior to June 8, 2022). We may be required, with certain exceptions, to make mandatory payments under the Credit Agreement using a percentage of our annual excess cash flows or net proceeds from any non-ordinary course asset sales or certain debt issuances, if any.
In addition, the Revolving Credit Facility is subject to a first lien secured net leverage ratio of 7.50 to 1.00, tested quarterly if, and only if, the aggregate principal amount from the Revolving Credit Facility loans, letters of credit (to the extent not cash collateralized or backstopped or, in the aggregate, not in excess of the greater of $10.0 million and the stated face amount of letters of credit outstanding on the initial closing date of the Credit Agreement) and swingline loans outstanding and/or issued, as applicable, exceeds 35.0% of the total amount of the Revolving Credit Facility commitments.
As of December 29, 2023, we had no outstanding borrowings under the Revolving Credit Facility. As of December 30, 2022, we had $12.0 million in borrowings outstanding under the Revolving Credit Facility. As of December 29, 2023 and December 30, 2022, we had $4.9 million and $5.1 million of outstanding letters of credit, respectively. The amount
64
available under the Revolving Credit Facility was $95.1 million and $82.9 million as of December 29, 2023 and December 30, 2022, respectively.
On October 26, 2022, the Company entered into an interest rate cap agreement (LIBOR subsequently transitioned to SOFR) on the floating rate component of interest with Bank of America as the counterparty. The interest rate cap became effective December 31, 2022. The Company will pay a premium of $6.6 million at the maturity date of December 31, 2025. For the period ended December 29, 2023, the notional amount of the interest rate cap is $347.8 million of the Term Loan and has a strike rate of 4.8%, which effectively caps SOFR on the notional amount at 4.8%. See Note 7 in our Notes to the Consolidated Financial Statements.
The Company was in compliance with all debt covenants as of December 29, 2023 and December 30, 2022. For additional information on the Company’s debt arrangements, debt covenants, and default provisions, see Note 7 in our Notes to the Consolidated Financial Statements.
Historical Cash Flows
The following table sets forth our cash flows for fiscal years 2023, 2022 and 2021:
| For the Years Ended | |||||||||||||||||
| December 29, 2023 | December 30, 2022 | December 31, 2021 | |||||||||||||||
| (in thousands) | |||||||||||||||||
Net cash provided by (used in) operating activities | $ | 89,295 | $ | (23,070) | $ | (30,415) | |||||||||||
Net cash used in investing activities | $ | (22,754) | $ | (52,556) | $ | (37,383) | |||||||||||
Net cash (used in) provided by financing activities | $ | (26,355) | $ | 57,512 | $ | 31,837 | |||||||||||
Operating Activities
Net cash provided by operating activities was $89.3 million in fiscal year 2023, compared to net cash used in operating activities of $23.1 million in fiscal year 2022, an increase of $112.4 million. The increase in net cash provided by operating activities during fiscal year 2023 was due to a $129.8 million net decrease in cash used for operating assets and liabilities. The improvement in cash provided was driven by a decrease in cash used for inventory and is consistent with our continued efforts to rebalance inventory levels. This was partially offset by an increased net loss of $12.7 million.
Investing Activities
Net cash used in investing activities was $22.8 million in fiscal year 2023, compared to $52.6 million in fiscal year 2022, a decrease of $29.8 million. The decrease in fiscal year 2023 was primarily driven by cash used in the prior fiscal year of $30.5 million to acquire Staub.
Financing Activities
Net cash used in financing activities was $26.4 million for fiscal year 2023, compared to net cash provided by financing activities of $57.5 million in fiscal year 2022, a decrease of $83.9 million. The decrease in net cash provided by financing activities for fiscal year 2023 was primarily due to cash provided by the Incremental Term Loans entered into during fiscal year 2022 of $55.0 million, and the decrease in cash flows related to our Revolving Credit Facility of $24.0 million as well as cash used to make the initial payment of $10.2 million related to the TRA in fiscal year 2023.
Fiscal 2022 Changes In Cash Flows
For the comparison of fiscal 2022 to fiscal 2021, refer to Part II, Item 7 "Management's discussion and analysis of financial condition and results of operations" of our 2022 Form 10-K under the subheading "Liquidity and Capital Resources - Historical Cash Flows.”
65
Off-Balance Sheet Arrangements
As of December 29, 2023 and December 30, 2022, we had off-balance sheet arrangements totaling $4.9 million and $5.1 million related to our outstanding letters of credit as further described in Note 7 in our Notes to the Consolidated Financial Statements.
66
Contractual Obligations
Debt Obligations
On August 4, 2021, we used a portion of the net proceeds from the IPO to repay a portion of the incremental term loan outstanding under the Old Credit Agreement totaling $215.9 million, plus accrued interest of $1.0 million. On December 8, 2021, we entered into our Credit Agreement with various financial institutions consisting of a $465.0 million Term Loan and our $100.0 million Revolving Credit Facility.
In connection with the closing of the Credit Agreement, we repaid in full approximately $451.4 million of borrowings, including accrued interest, under the Old Credit Agreement. The term loan and revolving credit facilities and related agreements and documents under the Old Credit Agreement were terminated upon the effectiveness of the Credit Agreement.
On October 2, 2022, we entered into an agreement to provide incremental term loans in an aggregate principal amount of $55.0 million. We used the proceeds from the Amended Credit Agreement to pay down the existing revolver balance, further increasing our liquidity and allowing for additional flexibility to invest in organic or inorganic growth or use for general corporate purposes.
On October 26, 2022, the Company entered into an interest rate cap agreement on the floating rate component of interest with Bank of America as the counterparty. The interest rate cap became effective December 31, 2022. The Company will pay a premium of $6.6 million at the maturity date of December 31, 2025.
See Note 7 in our Notes to the Consolidated Financial Statements for more information regarding our debt obligations.
Tax Receivable Agreement
On July 29, 2021, we executed the TRA with the TRA Participants. The TRA provides for the payment by us to the TRA Participants of 85% of the amount of cash savings, if any, in U.S. federal, state, and local income tax that we actually realize, or are deemed to realize (calculated using certain assumptions), as a result of the utilization of such tax benefits, including certain tax benefits attributable to payments under the TRA. The Company made payments, including accrued interest, pursuant to the TRA of $22.1 million and $10.5 million on January 12, 2024 and February 15, 2023, respectively. See Note 13 in our Notes to the Consolidated Financial Statements for more information regarding the TRA.
Contingent Value Rights (“CVRs”)
In connection with the acquisition of Snap One by H&F, we issued CVRs to the sellers. Each CVR gives the holder the ability to earn cash payments based on the return of H&F’s original investment achieving stated thresholds in relation to the proceeds received from disposition of H&F’s initial ownership units, which collectively entitle the sellers to receive from us, in certain circumstances, payments in an aggregate of up to $25.0 million. The CVRs were issued at two thresholds. The first CVR is payable to the holders when H&F’s return on investment grows to between 2.25 and 2.5 times H&F’s original investment. The second CVR is payable to the holders when H&F’s return on investment grows to between 2.5 and 2.67 times H&F’s original investment. Beginning on September 24, 2021, we have recorded CVR obligations at fair value utilizing the Monte Carlo simulation in an option-pricing framework. Adjustments to the fair value of CVR liabilities are included in selling, general, and administrative expenses in our consolidated statements of operations. See Note 8 in our Notes to the Consolidated Financial Statements for more information regarding CVRs.
Lease Commitments
The Company leases offices, warehouse space, and distribution centers. These leases are classified as operating leases with various expiration dates through 2033. See Note 15 in our Notes to the Consolidated Financial Statements for more information regarding Lease Commitments.
67
Seasonality
Our business experiences a moderate amount of seasonality. Sales activity is generally highest in the second quarter when our outdoor solutions, which include outdoor audio, video, surveillance, and access points, come into season. Sales continue to be strong in the third and fourth quarters due to end consumers’ desire to complete home projects prior to the holidays, followed by a modest slowdown in sales activity in the first quarter due to reduced integrator activity following the holiday season. Additionally, we generally experience a modest sales lift at the end of each calendar quarter as integrators seek to meet loyalty program spend thresholds.
Critical Accounting Estimates and Policies
Our accounting policies are more fully described in Note 2 in our Notes to the Consolidated Financial Statements. Our consolidated financial statements are prepared in accordance with GAAP. The preparation of these consolidated financial statements requires us to make estimates and assumptions that affect the reported amounts of assets, liabilities, net sales, expenses, and related disclosures during the reported period. In accordance with GAAP, we base our estimates on historical experience and on various other assumptions that we believe are reasonable under the circumstances. Actual results may differ from these estimates under different assumptions or conditions, and to the extent that there are differences between our estimates and actual results, our future financial statement presentation, financial condition, results of operations, and cash flows will be affected. Our most critical accounting estimates and policies are summarized below.
Revenue Recognition
We primarily enter into contracts with professional integrators to sell products and/or services. The professional integrators sell our products and/or services to end consumers to provide personalized connected systems. In certain instances, we sell specific products and/or services directly to end consumers. These contracts may result in arrangements to transfer multiple products and services and contain multiple performance obligations. Determining whether multiple products and services are considered distinct performance obligations that should be accounted for separately rather than as a combined performance obligation can require significant judgment.
For product sales, revenue is recognized when the integrator or, in the case of direct sales, consumer obtains control of the product, which occurs upon shipment, in an amount that reflects the consideration expected to be received in exchange for those products. For services, revenue is recognized ratably over the contract period as the integrator or customer receives such services on a consistent basis throughout the contract period. Technical support services represent a series of distinct performance obligations that have the same pattern of transfer to the integrator or customer, and thus are recognized as a single performance obligation ratably over the estimated life of the related product.
For contracts with multiple performance obligations, we allocate the contract’s transaction price to each performance obligation based on the relative standalone selling price (“SSP”). Judgment is required to determine the SSP for each distinct performance obligation that is not sold separately, including technical support, customer reward programs, unspecified software updates and upgrades, and hosting. In instances where SSP is not directly observable, the primary method used to estimate the SSP is the expected cost plus an estimated-margin approach, under which we forecast the expected costs of satisfying a performance obligation and then add an appropriate margin for that distinct service based on industry data, historical trends, and margins for similar services sold on a standalone basis.
Contracts with interdependent and highly interrelated hardware and software are accounted for as a single performance obligation with revenue recognized at the point in time when control is transferred to the integrator or consumer. In cases where there is more than one performance obligation, a portion of the transaction price is allocated based on a relative stand-alone selling price method. The allocated transaction price and corresponding revenue is deferred at the time of sale and recognized ratably over the estimated life of the related product as this method best depicts the progress towards the completion of the related performance obligation.
We offer certain subscription services where the integrator simultaneously receives and consumes the benefits provided by us throughout the subscription service period. There is a single performance obligation associated with the subscription services and the related revenue is deferred and recognized ratably over the contract period, which is typically one year, as this method best depicts the progress towards the completion of the related performance obligation.
68
We generate our revenue from the sale of products and services primarily as a principal, and for certain third-party product sales, as an agent. We have determined that we are the agent for such third-party product sales where the supplier is the party responsible for ensuring fulfillment of the orders, has the obligation to mitigate any issues the customers may have with the products, and has the discretion in establishing the price for the products. In such cases, we do not control the promised good before it is transferred. We record sales for which we act as an agent on a net basis.
We have various customer rewards programs (“marketing incentive programs”), which enable participants to earn points for qualifying rewards. The points are redeemed for rewards, including various prizes or product credits for future purchases. The marketing incentive programs provide the integrator or customer a material right and gives rise to a separate performance obligation. The related revenue and expense incurred are recognized at the time of redemption, expiration, or forfeiture, as that is the point at which the performance obligation related to this incentive program is satisfied.
Certain integrators or customers may receive cash-based incentives or credits (“volume rebates”) which are accounted for as variable consideration. We record reductions to revenue for integrator incentives at the time of the initial sale, which is based on estimates of the sales volume customers will reach during the measured period. Revenue is recognized net of estimated discounts, rebates, returns, allowances, and any taxes collected from integrators or customers, which are subsequently remitted to governmental authorities. We estimate the reduction to sales and cost of sales for returns based on current sales levels and historical return trends.
Share-Based Compensation
Former Parent Entity Incentive Plan — In October 2017, the Former Parent Entity approved the 2017 Plan pursuant to the Former Parent Entity’s partnership agreement (“Partnership Agreement”), which established the terms and provided for grants of certain incentive units to employees, officers, directors, consultants, and advisors of the Former Parent Entity containing service-based and/or market-based vesting criteria. Class B-1 Incentive Units (“B-1 Units”) issued under the 2017 Plan vest in installments over a five-year period, subject to the grantee’s continued employment or service. Class B-2 Incentive Units (“B-2 Units” and collectively with the B-1 Units, “Incentive Units”) issued under the 2017 Plan contain both service conditions consistent with the B-1 Units and market-based vesting conditions that require the achievement of a specified return hurdle to the controlling shareholders in order to vest.
The grant date fair value of all Incentive Units is estimated using the Black-Scholes option pricing model and is not remeasured. The pricing model requires assumptions, which include the expected holding period, the risk-free rate of return, the expected dividend yield, discount for lack of marketability and expected volatility of the units over the expected life, which significantly impacts the fair value. We account for forfeitures as they occur. In connection with the IPO, all Incentive Units were replaced with restricted stock awards or exchanged into shares of our common stock.
2021 Incentive Plan — Awards available for grant under the 2021 Incentive Plan include non-qualified and incentive stock options, restricted shares of our common stock, performance stock units, other equity-based awards tied to the value of our common stock, and cash-based awards. The fair value of restricted stock awards, restricted stock units, and performance stock units granted are based on the Company’s closing stock price on the date of grant. The Company also granted Time-based and Market-based options. The Company recognizes share-based compensation expense based on the fair value of the awards at the grant date. The Company utilized the Black-Scholes option pricing model to estimate the fair value of the Time-based options. The Company used a Monte Carlo simulation to estimate the fair value and derived service period of the Market-based options. Significant assumptions included in these models were the risk-free interest rate, the expected volatility, and the expected dividend yield. Volatility was estimated based on historical volatility of comparable companies. The average expected term for the Market-based options was derived based on an average of the outcomes of various scenarios performed under the Monte Carlo simulation. Both pricing models require various highly judgmental assumptions including volatility and expected option term. If any of the assumptions used in the models change significantly, stock-based compensation expense may differ materially in the future from that recorded in the current period. See Note 11 in our Notes to the Consolidated Financial Statements for more information regarding stock-based compensation.
Income Taxes
We estimate certain components of our provision for income taxes. Our estimates and judgments include, among other items, the calculations used to determine the deferred tax asset and liability balances, effective tax rates for state, local, and
69
foreign income taxes, uncertain tax positions, amounts deductible for tax purposes, and related reserves. We adjust our annual effective income tax rate as additional information on outcomes or events becomes available. Further, our assessment of uncertain tax positions requires judgments relating to the amounts, timing, and likelihood of resolution.
We account for income taxes under the liability method whereby deferred tax assets and liabilities are measured using enacted tax laws and rates expected to apply to taxable income in the years in which the assets and liabilities are expected to be recovered or settled. The effects on deferred tax assets and liabilities of subsequent changes in the tax laws and rates are recognized in income during the year the changes are enacted.
In assessing the realizability of deferred tax assets, we consider whether it is more-likely-than-not that some portion or all of the deferred tax assets will not be realized. The ultimate realization of deferred tax assets is dependent upon the generation of future taxable income during the periods in which those temporary differences become deductible. Management considers the scheduled reversal of deferred tax liabilities, projected future taxable income and tax planning strategies in making this assessment.
We follow the applicable authoritative guidance with respect to the accounting for uncertainty in income taxes recognized in our consolidated financial statements. It prescribes a recognition threshold and measurement attribute for the financial statement recognition and measurement of a tax position taken, or expected to be taken, in a tax return. We record any interest and penalties associated as additional income tax expense in the consolidated statements of operations. See Note 12 in our Notes to the Consolidated Financial Statements for further information.
Tax Receivable Agreement
On July 29, 2021, we executed a TRA with the TRA Participants that provides for payment by the Company to the TRA Participants of 85% of the amount of cash savings, if any, in U.S. federal, state, and local income tax that the Company utilizes in the future from net operating losses and certain other tax benefits that arose prior to the IPO. We recognize this contingent liability in our consolidated financial statements when incurrence of the liability becomes probable and amounts are reasonably estimable. The TRA liability is an estimate and estimating the amount of payments that may be made under the TRA is by its nature imprecise, insofar as the calculation of amounts payable depends on a variety of factors. The amount and timing of any payments under the TRA will vary depending upon a number of factors, including the amount, character, and timing of the Company’s income. Subsequent changes to the measurement of the TRA liability are recognized in the statements of income as a component of other expense (income), net.
Business Combinations
All of our acquisitions have been accounted for under ASC 805, Business Combinations. Accordingly, the accounts of the acquired companies, after adjustments to reflect fair values assigned to assets and liabilities, have been included in the consolidated financial statements from their respective dates of acquisition. We record purchase price in excess of amounts allocated to identifiable assets and liabilities as goodwill. Goodwill includes, but is not limited to, the value of the workforce in place, ability to generate profits and cash flows, and an established going concern.
Customer relationships have been valued using the multi-period excess earnings method, a derivative of the income approach. The multi-period excess earnings method estimates the discounted net earnings attributable to the customer relationships that were acquired after considering items, such as possible customer attrition. Estimated useful lives were determined based on the length and trend of projected cash flows. The length of the projected cash flow period was determined based on the expected attrition of the customer relationships, which is based on our historical experience in renewing and extending similar customer relationships and future expectations for renewing and extending similar existing customer relationships. The useful life of the customer relationships intangible assets represents the number of years over which we expect the customer relationships to economically contribute to the business.
The trade names have been valued using the relief from royalty method under the income approach to estimate the cost savings that will accrue to us, which we would otherwise have to pay royalties or license fees on revenue earned through the use of the assets. Estimated useful lives were determined based on management’s estimate of the period the name will be in use.
70
Technology has been valued using the multi-period excess earnings method, a derivative of the income approach. The net earnings attributed to the existing technology considers items such as projected research and development costs expected to be incurred to maintain the technology. Estimated useful lives were determined based on the length and trend of projected cash flows after considering items such as the projected research and development expected to be incurred to maintain the technology.
Inventories
Inventory is stated at the lower of cost or net realizable value, cost being determined under the moving- average method of inventory, first-in, first-out (“FIFO”) basis of inventory, and specific-identification basis of inventory. Inventory costs include the net acquisition cost from the factory, the cost of transporting the product to our warehouses, and product assembly costs. Reserves for slow-moving and obsolete inventories are determined based on historical experience, inventory aging, and product demand. Our reserve estimates require us to make assumptions based on the current rate of sales, age, salability of inventory and profitability of inventory, all of which may be affected by changes in our product mix and consumer preferences. We do not believe there is a reasonable likelihood that there will be a material change in the assumptions we use to calculate our inventory reserves. However, if actual demand is lower than our forecasted demand, we could be required to write down the value of additional inventory, which would have a negative impact on our gross profit. We evaluate the adequacy of these reserves and make adjustments to reserves, as required.
Goodwill and Intangible Assets
Goodwill and identifiable indefinite lived intangible assets have historically been tested for impairment annually as of the beginning of the fourth quarter of each fiscal year, or more frequently upon the occurrence of certain events or substantive changes in circumstances that indicate impairment is more likely than not. We performed annual impairment tests for goodwill and indefinite lived intangible assets at September 30, 2023 and October 1, 2022 and concluded there was no impairment.
In assessing potential goodwill impairment, we may first assess qualitative factors to determine whether events or circumstances indicate it is more likely than not that the fair value of our net assets is less than the carrying amount of our single reporting unit. If the qualitative factors indicate it is more likely than not that the fair value of net assets is less than its carrying amount, we perform a quantitative impairment test. In the quantitative assessment, we compare the fair value of the reporting unit to its carrying value. We estimate the fair value of the reporting unit using generally accepted valuation techniques which include a weighted combination of income and market approaches. The income approach incorporates a discounted future cash flows analysis with key assumptions in the cash flow model for future net sales, operating costs, working capital changes, capital expenditures, and a discount rate that approximates our weighted-average cost of capital. The market approach considers our results of operations and information about our publicly traded competitors, such as earnings multiples, making adjustments to the selected competitors based on size, strengths and weaknesses, as well as publicly announced acquisition transactions.
Our valuation methodology for assessing impairment requires management to make judgments and assumptions based on historical experience and projections of future operating performance. If these assumptions differ materially from future results, we may record impairment charges in the future.
We review identifiable definite-lived intangible assets for impairment whenever events or changes in circumstances indicate that the carrying amount of an asset may not be recoverable. For fiscal years 2023, 2022 and 2021, we determined there were no indicators of impairment relating to identifiable definite lived intangible assets.
Warranties
We provide assurance-type warranties on most of our proprietary products covering periods that vary between one year and the lifetime of the product. The warranties cover products that are defective under normal conditions of use and are in-line with industry standards. We estimate the costs that may be incurred under these warranties and record the liability at the time product sales are recorded. The warranty liability is primarily based on historical failure rates and costs to repair or replace the product, including any necessary shipping costs.
71
Contingent Value Rights (“CVRs”)
In connection with the acquisition of Snap One by H&F, we issued CVRs to the sellers. Each CVR gives the holder the ability to earn cash payments based on the return of H&F’s original investment achieving stated thresholds in relation to the proceeds received from disposition of H&F’s initial ownership units. The CVRs were issued at two thresholds. The first CVR is payable to the holders when H&F’s return on investment grows to between 2.25 and 2.5 times H&F’s original investment. The second CVR is payable to the holders when H&F’s return on investment grows to between 2.5 and 2.67 times H&F’s original investment. We record CVR obligations at fair value utilizing the Monte Carlo simulation in an option-pricing framework, where a range of possible scenarios are simulated, in order to determine the fair value of the CVRs. Key inputs and assumptions using a Monte-Carlo simulation include the current stock price, probabilities of exit scenarios, risk-free interest rates, and equity volatility. The fair value estimate of the CVR is based, in part, on subjective assumptions and could differ materially in the future. Any future increase in the fair value of the CVR obligations, based on an increased likelihood that the underlying milestones will be achieved, and the associated payment or payments will, therefore, become due and payable, will result in a charge to selling, general, and administrative expenses in the period in which the increase is determined. Similarly, any future decrease in the fair value of the CVR obligations will result in a reduction in selling, general, and administrative expenses.
Recent Accounting Pronouncements
See Note 2 in our Notes to the Consolidated Financial Statements for information regarding recently issued accounting pronouncements.
72
Emerging Growth Company and Smaller Reporting Company Status
We qualify as an “emerging growth company” as defined in the Jumpstart Our Business Startups (“JOBS”) Act. An emerging growth company may take advantage of reduced reporting requirements not otherwise applicable to public companies. These provisions include, but are not limited to:
•Not being required to comply with the auditor attestation requirements on the effectiveness of our internal controls over financial reporting;
•Reduced disclosure obligations regarding executive compensation arrangements in our periodic reports, proxy statements and registration statements; and
•Exemptions from the requirements of holding a nonbinding advisory vote on executive compensation and stockholder approval of any golden parachute payments not previously approved.
We may use these provisions until the last day of our fiscal year in which the fifth anniversary of the completion of our IPO occurs (which will be our 2026 fiscal year). However, if certain events occur prior to the end of such five-year period, including if we become a “large accelerated filer,” our annual gross revenues equal or exceed $1.235 billion, or we issue more than $1.0 billion of nonconvertible debt in any three-year period, we will cease to be an emerging growth company prior to the end of such five-year period.
Under the JOBS Act, emerging growth companies also can delay adopting new or revised accounting standards until such time as those standards would otherwise apply to private companies. We currently intend to take advantage of this exemption.
We are also a “smaller reporting company,” because the market value of our shares held by non-affiliates was less than $250 million as of the end of our most recently completed second fiscal quarter. We may continue to be a smaller reporting company if either (i) the market value of our shares held by non-affiliates is less than $250 million or (ii) our annual revenue was less than $100 million during the most recently completed fiscal year and the market value of our shares held by non-affiliates is less than $700 million. As a smaller reporting company, we are entitled to provide audited financial statements for just two fiscal years, in contrast with other reporting companies, which must provide audited financial statements for three fiscal years, although we have not elected to take advantage of this exemption in this Annual Report. If we are a smaller reporting company at the time we cease to be an emerging growth company, we may continue to rely on exemptions from certain disclosure requirements available to smaller reporting companies.
73
Item 7A. Quantitative and Qualitative Disclosures about Market Risk
Our earnings and financial position are exposed to financial market risk, including those resulting from changes in interest rates and market concentration risk.
Interest Rate Risk
We are subject to interest rate risk in connection with our Credit Agreement. As of December 29, 2023, we had $456.9 million outstanding under the Term Loan and $54.5 million outstanding under the Incremental Term Loan portions of the Credit Agreement. As of December 29, 2023, we had no outstanding borrowings under the Revolving Credit Facility. The term loans bear interest at variable rates. Each quarter point increase in the variable rates on the amounts outstanding under the Credit Agreement as of December 29, 2023 would increase annual cash interest in the aggregate by approximately $0.8 million. In order to mitigate our exposure to interest rate increases on our floating rate debt, we have entered into an interest-rate cap. This agreement caps LIBOR (subsequently transitioned to SOFR) on a notional amount of $347.8 million at 4.8% for the period ended December 29, 2023, thus reducing the impact of interest-rate increases on future income.
Foreign Currency Exchange Risk
Changes in the exchange rates for the functional currencies of our international subsidiaries may positively or negatively impact our sales, operating expenses and earnings. Historically, we have not hedged our currency exposure and fluctuations in exchange rates have not materially affected our operating results. While our international operations, including Canada, the United Kingdom, and Australia, accounted for only 12.8% of total net revenue during the year ended December 29, 2023, our exposure to currency rate fluctuations could be material in future years, to the extent that either currency rate changes are significant or that our international operations comprise a larger percentage of our consolidated results.
Inflation Risk
Inflationary factors may adversely affect our operating results. Although we do not believe inflation has had a material impact on our financial position or results of operations to date, the current high rate of inflation may have an adverse effect on our ability to maintain current levels of expenses as a percentage of revenue if our revenue does not correspondingly increase with inflation.
74
Item 8. Financial Statements and Supplementary Data
| INDEX TO CONSOLIDATED FINANCIAL STATEMENTS | |||||
Page | |||||
Report of Independent Registered Public Accounting Firm, | |||||
75
REPORT OF INDEPENDENT REGISTERED PUBLIC ACCOUNTING FIRM
To the stockholders and the Board of Directors of Snap One Holdings Corp.
Opinion on the Financial Statements
We have audited the accompanying consolidated balance sheets of Snap One Holdings Corp. and subsidiaries (the “Company”) as of December 29, 2023 and December 30, 2022, the related consolidated statements of operations, comprehensive loss, stockholders’ equity, and cash flows, for each of the three fiscal years in the period ended December 29, 2023, and the related notes (collectively referred to as the “financial statements”). In our opinion, the financial statements present fairly, in all material respects, the financial position of the Company as of December 29, 2023 and December 30, 2022, and the results of its operations and its cash flows for each of the three fiscal years in the period ended December 29, 2023, in conformity with accounting principles generally accepted in the United States of America.
Change in Accounting Principle
As discussed in Note 2 to the financial statements, the Company has changed its method of accounting for leases effective January 1, 2022 due to the adoption of the Financial Accounting Standards Board Accounting Standards Update 2016-12, Leases (Topic 842), using the modified retrospective approach.
Basis for Opinion
These financial statements are the responsibility of the Company's management. Our responsibility is to express an opinion on the Company's financial statements based on our audits. We are a public accounting firm registered with the Public Company Accounting Oversight Board (United States) (PCAOB) and are required to be independent with respect to the Company in accordance with the U.S. federal securities laws and the applicable rules and regulations of the Securities and Exchange Commission and the PCAOB.
We conducted our audits in accordance with the standards of the PCAOB. Those standards require that we plan and perform the audit to obtain reasonable assurance about whether the financial statements are free of material misstatement, whether due to error or fraud. The Company is not required to have, nor were we engaged to perform, an audit of its internal control over financial reporting. As part of our audits, we are required to obtain an understanding of internal control over financial reporting but not for the purpose of expressing an opinion on the effectiveness of the Company’s internal control over financial reporting. Accordingly, we express no such opinion.
Our audits included performing procedures to assess the risks of material misstatement of the financial statements, whether due to error or fraud, and performing procedures that respond to those risks. Such procedures included examining, on a test basis, evidence regarding the amounts and disclosures in the financial statements. Our audits also included evaluating the accounting principles used and significant estimates made by management, as well as evaluating the overall presentation of the financial statements. We believe that our audits provide a reasonable basis for our opinion.
/s/ DELOITTE & TOUCHE LLP
March 7, 2024
We have served as the Company’s auditor since 2014.
76
Snap One Holdings Corp. and Subsidiaries
Consolidated Balance Sheets
(in thousands, except par value)
| As of | |||||||||||
| December 29, 2023 | December 30, 2022 | ||||||||||
| Assets | |||||||||||
| Current assets: | |||||||||||
| Cash and cash equivalents | $ | $ | |||||||||
| Accounts receivable, net | |||||||||||
| Inventories | |||||||||||
| Prepaid expenses | |||||||||||
| Other current assets | |||||||||||
| Total current assets | |||||||||||
| Long-term assets: | |||||||||||
| Property and equipment, net | |||||||||||
| Goodwill | |||||||||||
| Other intangible assets, net | |||||||||||
| Operating lease right-of-use assets | |||||||||||
| Other assets | |||||||||||
| Total assets | $ | $ | |||||||||
| Liabilities and stockholders’ equity | |||||||||||
| Current liabilities: | |||||||||||
| Current maturities of long-term debt | $ | $ | |||||||||
| Accounts payable | |||||||||||
| Accrued liabilities | |||||||||||
| Current operating lease liability | |||||||||||
| Current tax receivable agreement liability | |||||||||||
| Total current liabilities | |||||||||||
| Long-term liabilities: | |||||||||||
| Revolving credit facility, net | |||||||||||
| Long-term debt, net of current portion | |||||||||||
| Deferred income tax liabilities, net | |||||||||||
| Operating lease liability, net of current portion | |||||||||||
| Tax receivable agreement liability, net of current portion | |||||||||||
| Other liabilities | |||||||||||
| Total liabilities | |||||||||||
Commitments and contingencies (Note 14) | |||||||||||
| Stockholders’ equity: | |||||||||||
Common stock, $ | |||||||||||
Preferred stock, $ | |||||||||||
| Additional paid-in capital | |||||||||||
| Accumulated deficit | ( | ( | |||||||||
Accumulated other comprehensive loss | ( | ( | |||||||||
| Total stockholders’ equity | |||||||||||
| Total liabilities and stockholders’ equity | $ | $ | |||||||||
77
Snap One Holdings Corp. and Subsidiaries
Consolidated Statements of Operations
(in thousands, except per share amounts)
| For the Years Ended | |||||||||||||||||
| December 29, 2023 | December 30, 2022 | December 31, 2021 | |||||||||||||||
| Net sales | $ | $ | $ | ||||||||||||||
| Costs and expenses: | |||||||||||||||||
| Cost of sales, exclusive of depreciation and amortization | |||||||||||||||||
Selling, general, and administrative expenses | |||||||||||||||||
| Depreciation and amortization | |||||||||||||||||
| Total costs and expenses | |||||||||||||||||
| Income from operations | |||||||||||||||||
| Other expenses (income): | |||||||||||||||||
| Interest expense | |||||||||||||||||
| Loss on extinguishment of debt | |||||||||||||||||
| Other expense (income), net | ( | ||||||||||||||||
| Total other expenses | |||||||||||||||||
| Loss before income taxes | ( | ( | ( | ||||||||||||||
| Income tax benefit | ( | ( | ( | ||||||||||||||
| Net loss | ( | ( | ( | ||||||||||||||
| Net loss attributable to noncontrolling interest | ( | ( | |||||||||||||||
| Net loss attributable to Company | $ | ( | $ | ( | $ | ( | |||||||||||
| Net loss per share, basic and diluted | $ | ( | $ | ( | $ | ( | |||||||||||
| Weighted average shares outstanding, basic and diluted | |||||||||||||||||
78
Snap One Holdings Corp. and Subsidiaries
Consolidated Statements of Comprehensive (Loss) Income
(in thousands)
| For the Years Ended | |||||||||||||||||
| December 29, 2023 | December 30, 2022 | December 31, 2021 | |||||||||||||||
| Net loss | $ | ( | $ | ( | $ | ( | |||||||||||
| Other comprehensive (loss) income, net of tax: | |||||||||||||||||
| Foreign currency translation adjustments | ( | ( | |||||||||||||||
| Comprehensive loss | ( | ( | ( | ||||||||||||||
| Comprehensive loss attributable to noncontrolling interest | ( | ( | |||||||||||||||
| Comprehensive loss attributable to Company | $ | ( | $ | ( | $ | ( | |||||||||||
See accompanying Notes to the Consolidated Financial Statements.
79
Snap One Holdings Corp. and Subsidiaries
Consolidated Statements of Stockholders’ Equity
(in thousands)
| Common Stock | Additional Paid-In Capital | Accumulated Other Comprehensive Income (Loss) | |||||||||||||||||||||||||||||||||||||||
| Shares | Amount | Accumulated Deficit | Noncontrolling Interest | Total Stockholders’ Equity | |||||||||||||||||||||||||||||||||||||
| Balance - December 25, 2020 | $ | $ | $ | ( | $ | $ | $ | ||||||||||||||||||||||||||||||||||
| Net loss | — | — | — | ( | — | ( | ( | ||||||||||||||||||||||||||||||||||
| Foreign currency translation adjustments | — | — | — | — | ( | — | ( | ||||||||||||||||||||||||||||||||||
Equity contributions | — | — | — | — | — | ||||||||||||||||||||||||||||||||||||
| Equity-based compensation | — | — | — | — | — | ||||||||||||||||||||||||||||||||||||
| Issuance of common stock for initial public offering, net of offering costs | — | — | — | ||||||||||||||||||||||||||||||||||||||
| Issuance of common stock pursuant to equity incentive plans | ( | — | — | — | |||||||||||||||||||||||||||||||||||||
| Establishment of income tax receivable liability | — | — | ( | — | — | — | ( | ||||||||||||||||||||||||||||||||||
| Other | — | — | ( | — | — | — | ( | ||||||||||||||||||||||||||||||||||
| Balance - December 31, 2021 | $ | $ | $ | ( | $ | ( | $ | $ | |||||||||||||||||||||||||||||||||
| Net loss | — | — | — | ( | — | ( | ( | ||||||||||||||||||||||||||||||||||
| Foreign currency translation adjustments | — | — | — | — | ( | — | ( | ||||||||||||||||||||||||||||||||||
| Equity-based compensation | — | — | — | — | — | ||||||||||||||||||||||||||||||||||||
| Repurchase and retirement of common stock | ( | ( | ( | — | — | — | ( | ||||||||||||||||||||||||||||||||||
| Issuance of common stock pursuant to equity incentive plans | ( | — | — | — | |||||||||||||||||||||||||||||||||||||
Issuance of common stock pursuant to employee stock purchase plan | — | — | — | ||||||||||||||||||||||||||||||||||||||
Parasol equity acquisition | — | — | ( | ||||||||||||||||||||||||||||||||||||||
| Balance - December 30, 2022 | $ | $ | $ | ( | $ | ( | $ | $ | |||||||||||||||||||||||||||||||||
| Net loss | — | — | — | ( | — | — | ( | ||||||||||||||||||||||||||||||||||
| Foreign currency translation adjustments | — | — | — | — | — | ||||||||||||||||||||||||||||||||||||
| Equity-based compensation | — | — | — | — | — | ||||||||||||||||||||||||||||||||||||
| Repurchase and retirement of common stock | ( | — | ( | — | — | — | ( | ||||||||||||||||||||||||||||||||||
| Issuance of common stock pursuant to equity incentive plans | ( | — | — | — | |||||||||||||||||||||||||||||||||||||
| Tax withholding on net share settlement of equity awards | ( | ( | ( | — | — | — | ( | ||||||||||||||||||||||||||||||||||
Issuance of common stock pursuant to employee stock purchase plan | — | — | — | ||||||||||||||||||||||||||||||||||||||
TRA distribution to shareholders | — | — | ( | — | — | — | ( | ||||||||||||||||||||||||||||||||||
| Balance - December 29, 2023 | $ | $ | $ | ( | $ | ( | $ | $ | |||||||||||||||||||||||||||||||||
See accompanying Notes to the Consolidated Financial Statements.
80
Snap One Holdings Corp. and Subsidiaries
Consolidated Statements of Cash Flows
(in thousands)
| For the Years Ended | |||||||||||||||||
| December 29, 2023 | December 30, 2022 | December 31, 2021 | |||||||||||||||
| Cash flows from operating activities: | |||||||||||||||||
| Net loss | $ | ( | $ | ( | $ | ( | |||||||||||
| Adjustments to reconcile net loss to net cash from operating activities: | |||||||||||||||||
| Depreciation and amortization | |||||||||||||||||
| Equity-based compensation | |||||||||||||||||
| Amortization of debt issuance costs | |||||||||||||||||
| Interest rate cap expense | |||||||||||||||||
| Deferred income taxes | ( | ( | ( | ||||||||||||||
| Non-cash operating lease expense | |||||||||||||||||
| Bad debt expense | |||||||||||||||||
| Fair value adjustment to contingent value rights | ( | ( | |||||||||||||||
Valuation adjustment to TRA liability | ( | ( | |||||||||||||||
Valuation adjustment to contingent liability | ( | ||||||||||||||||
| Loss on notes receivable | |||||||||||||||||
| Loss on extinguishment of debt | |||||||||||||||||
| Other, net | ( | ||||||||||||||||
| Change in operating assets and liabilities: | |||||||||||||||||
| Accounts receivable | ( | ||||||||||||||||
| Inventories | ( | ( | |||||||||||||||
| Prepaid expenses and other assets | ( | ||||||||||||||||
| Accounts payable and accrued liabilities | ( | ( | ( | ||||||||||||||
| Operating lease liabilities | ( | ( | |||||||||||||||
Net cash provided by (used in) operating activities | ( | ( | |||||||||||||||
| Cash flows from investing activities: | |||||||||||||||||
| Purchases of property and equipment | ( | ( | ( | ||||||||||||||
| Acquisition of business, net of cash acquired | ( | ( | |||||||||||||||
| Issuance of notes receivable | ( | ( | |||||||||||||||
Other | ( | ||||||||||||||||
| Net cash used in investing activities | ( | ( | ( | ||||||||||||||
| Cash flows from financing activities: | |||||||||||||||||
| Payments of tax receivable agreement | ( | ||||||||||||||||
| Proceeds from long-term debt | |||||||||||||||||
| Payments on long-term debt | ( | ( | ( | ||||||||||||||
| Payments of debt issuance costs | ( | ( | |||||||||||||||
| Proceeds from revolving credit facility | |||||||||||||||||
| Payments on revolving credit facility | ( | ( | |||||||||||||||
Proceeds on interest rate cap agreement | |||||||||||||||||
Payment of tax withholding obligation on settlement of equity awards | ( | ||||||||||||||||
| Proceeds from employee stock purchase plan | |||||||||||||||||
| Repurchase and retirement of common stock | ( | ( | |||||||||||||||
| Payments of contingent consideration | ( | ||||||||||||||||
| Proceeds from initial public offering, net of offering costs | |||||||||||||||||
Net cash (used in) provided by financing activities | ( | ||||||||||||||||
| Effect of exchange rate changes on cash and cash equivalents | ( | ( | ( | ||||||||||||||
Net increase (decrease) in cash and cash equivalents | ( | ( | |||||||||||||||
| Cash and cash equivalents at beginning of the period | |||||||||||||||||
| Cash and cash equivalents at end of the period | $ | $ | $ | ||||||||||||||
| Supplementary cash flow information: | |||||||||||||||||
| Cash paid for interest | $ | $ | $ | ||||||||||||||
| Cash paid for taxes, net | $ | $ | $ | ||||||||||||||
| Noncash investing and financing activities: | |||||||||||||||||
| Noncash tax receivable agreement liability | $ | $ | $ | ||||||||||||||
| Noncash equity contribution | $ | $ | $ | ||||||||||||||
| Capital expenditure in accounts payable | $ | $ | $ | ||||||||||||||
See accompanying Notes to the Consolidated Financial Statements.
81
Snap One Holdings Corp. and Subsidiaries
Notes to the Consolidated Financial Statements
(in thousands, except per share amounts)
1.Organization and Description of Business
Snap One Holdings Corp. (referred to herein as “Snap One” or the “Company”) is incorporated in Delaware with its principal executive offices located in Charlotte, North Carolina and Lehi, Utah. The Company provides products, software, and support solutions to its network of professional integrators that enable them to deliver smart-living experiences for their residential and business end consumers. The Company’s hardware and software portfolio includes leading proprietary and third-party offerings across connected, infrastructure, and entertainment categories. Additionally, the Company provides technology and software solutions designed to support the integrator throughout the project lifecycle, enhancing their operations and helping them to profitably grow their businesses.
2.Significant Accounting Policies
Basis of Presentation — The accompanying consolidated financial statements have been prepared in conformity with generally accepted accounting principles in the United States of America (“GAAP”). The consolidated financial statements include the accounts of the Company and all subsidiaries required to be consolidated. All intercompany balances and transactions have been eliminated in the consolidated financial statements.
The Company’s fiscal year is the 52- or 53-week period that ends on the last Friday of December. Fiscal years 2023 and 2022 were 52-week periods, and fiscal year 2021 was a 53-week period.
Use of Accounting Estimates — The preparation of financial statements in conformity with GAAP requires management to make estimates and assumptions that affect the amounts reported and disclosed in the consolidated financial statements and accompanying notes. Accordingly, the actual amounts could differ from those estimates.
Significant estimates relied upon in preparing these consolidated financial statements include, but are not limited to, the amortization period associated with customer relationships, estimated standalone selling prices associated with products that contain distinct performance obligations not sold separately, warranty reserves, excess and obsolete inventory reserves, impairment of long-lived assets, impairment of indefinite-lived intangibles and goodwill, estimated liability under our tax receivable agreement (“TRA”), assumptions related to the valuation of contingent value rights (“CVR”) and equity awards, the valuation allowance associated with deferred tax assets, and the valuation of assets and liabilities associated with acquisitions.
Business Combinations — All of the Company’s acquisitions have been accounted for under ASC 805, Business Combinations. Accordingly, the accounts of the acquired companies, after adjustments to reflect fair values assigned to assets and liabilities, have been included in the consolidated financial statements from their respective dates of acquisition. The Company records purchase price in excess of amounts allocated to identifiable assets and liabilities as goodwill. Goodwill includes, but is not limited to, the value of the workforce in place, ability to generate profits and cash flows, and an established going concern.
Customer relationships have been valued using the multi-period excess earnings method, a derivative of the income approach. The multi-period excess earnings method estimates the discounted net earnings attributable to the customer relationships that were acquired after considering items such as possible customer attrition. Estimated useful lives were determined based on the length and trend of projected cash flows. The length of the projected cash flow period was determined based on the expected attrition of the customer relationships, which is based on the Company’s historical experience in renewing and extending similar customer relationships and future expectations for renewing and extending similar existing customer relationships. The useful life of the customer relationships intangible assets represents the number of years over which the Company expects the customer relationships to economically contribute to the business.
82
Snap One Holdings Corp. and Subsidiaries
Notes to the Consolidated Financial Statements
(in thousands, except per share amounts)
The trade names have been valued using the relief from royalty method under the income approach to estimate the cost savings that will accrue to the Company, which would otherwise have to pay royalties or license fees on revenue earned by using the asset. The useful lives of the assets were determined based on management’s estimate of the period of time the name will be in use.
Technology has been valued using the multi-period excess earnings method, a derivative of the income approach. The net earnings attributed to the existing technology considers items such as projected research and development costs expected to be incurred to maintain the technology. The useful lives were determined based on the length and trend of projected cash flows after considering items such as the projected research and development expected to be incurred to maintain the technology.
Segment Information — Operating segments are identified as components of an enterprise for which discrete financial information is available for evaluation by the chief operating decision-maker, or CODM, in making decisions regarding resource allocation and assessing performance. The Company’s CODM is its Chief Executive Officer. The Company’s CODM views its operations and manages the business as a single operating and reportable segment.
Fair Value Measurements — GAAP defines fair value as the price that would be received for selling an asset or paid to transfer a liability in an orderly transaction between market participants at the measurement date. A fair value measurement assumes the transaction to sell the asset or transfer the liability occurs in the principal market for the asset or liability or, in the absence of a principal market, the most advantageous market. Assets and liabilities recorded at fair value are measured and classified in accordance with a three-tier fair value hierarchy based on the observability of the inputs available in the market used to measure fair value:
Level 1—Valuations based on unadjusted quoted prices for identical instruments in active markets that are available as of the measurement date.
Level 2—Valuations based on quoted prices in markets that are not active or for which all significant inputs are observable, either directly or indirectly.
Level 3—Valuations based on inputs that are unobservable and significant to the overall fair value measurement.
This fair value hierarchy requires entities to maximize the use of observable inputs and minimize the use of unobservable inputs.
The Company’s financial instruments that are remeasured at fair value on a recurring basis include CVRs, contingent consideration, and the interest rate cap. Additionally, cash and cash equivalents, accounts receivable, net, prepaid expenses, accounts payable, and accrued liabilities are classified as Level 1 and the carrying value of these assets and liabilities approximate their fair value due to the short-term nature of these financial instruments. See Note 8 for further details on fair value measurements.
Certain non-financial assets, such as property and equipment, leases, goodwill, and other intangible assets, are adjusted to fair value when an impairment charge is recognized using predominantly Level 2 and Level 3 inputs.
Cash and Cash Equivalents — The Company considers all cash on hand, credit card receivables, and short-term investments with original maturities of three months or less to be cash and cash equivalents.
Concentration of Credit Risk — The Company’s cash and cash equivalents and accounts receivable are potentially subject to concentration of credit risk. Certain balances in cash and cash equivalents exceed the Federal Deposit Insurance Corporation limit of $250. Cash and cash equivalents held at these banks, including those held in foreign banks, may exceed the amount of insurance provided on such deposits. These deposits may be redeemed upon demand, and
83
Snap One Holdings Corp. and Subsidiaries
Notes to the Consolidated Financial Statements
(in thousands, except per share amounts)
Inventories — Inventory is stated at the lower of cost or net realizable value, cost being determined under the moving-average method, first-in, first-out (“FIFO”) basis, or specific identification. Inventory costs include the net acquisition cost from the factory, the cost of transporting the product to the Company’s warehouses, and product assembly costs. Reserves for slow-moving and obsolete inventories are provided on historical experience, inventory aging, and product demand. Inventory write-downs and losses are recorded as a component of cost of sales in our consolidated statement of operations. The Company evaluates the adequacy of these reserves and adjusts reserves, as required.
Property and Equipment, Net — Property and equipment, net is stated at cost. Depreciation is computed using the straight-line method over the estimated useful lives of the assets. Leasehold improvements are amortized over the shorter of the useful life of the related assets or the lease term. Expenditures for repairs and maintenance are charged to expense as incurred. For assets sold or otherwise disposed of, the cost and related accumulated depreciation are removed from the accounts, and any related gain or loss is reflected in selling, general, and administrative expenses on the consolidated statements of operations.
The following table summarizes the estimated useful lives of each respective asset category:
| Equipment | |||||
| Computers and software | |||||
| Furniture and fixtures | |||||
| Leasehold improvements | Shorter of the useful life of the asset or the remaining lease term of the lease | ||||
Internal-Use Software — Internal-use software development costs incurred during the application development phase are capitalized and recorded on the consolidated balance sheet as a component of fixed assets. Capitalized costs are amortized using the straight-line method over the estimated economic life of the software, beginning when the software is substantially ready for use. Costs incurred in the preliminary project and post-implementation stages are expensed as incurred and are recorded in selling, general, and administrative expenses.
Cloud Computing Arrangements — Implementation costs of cloud computing arrangements that are incurred during the application development stage are capitalized in prepaid and other assets until the software is ready for intended use. The costs are then amortized on a straight-line basis over the term of the associated arrangement and are recognized in selling, general, and administrative expenses on the consolidated statement of operations. Capitalized costs, net of accumulated amortization, were $5,811 and $1,588 as of December 29, 2023 and December 30, 2022, respectively.
Goodwill and Indefinite-Lived Intangible Assets — Goodwill and identifiable indefinite lived intangible assets are tested for impairment annually as of the beginning of the fourth quarter of each fiscal year, or more frequently upon the occurrence of certain events or substantive changes in circumstances that indicate impairment is more likely than not. The Company performed annual impairment tests for goodwill and indefinite-lived intangible assets as of September 30, 2023 and October 1, 2022, and concluded there was no impairment.
In assessing potential goodwill impairment, the Company has the option to first assess qualitative factors to determine whether events or circumstances indicate it is more likely than not that the fair value of the Company’s net assets is less than the carrying amount of the Company’s single reporting unit. If the qualitative factors indicate it is more likely than not that the fair value of net assets is less than its carrying amount, the Company performs a quantitative impairment test. In the quantitative assessment, the Company compares the fair value of the reporting unit to its carrying value. The Company determines fair value of its reporting unit using an income and market approach incorporating market participant considerations and management’s assumptions on revenue growth rates, operating margins, discount rates, and expected capital expenditures.
84
Snap One Holdings Corp. and Subsidiaries
Notes to the Consolidated Financial Statements
(in thousands, except per share amounts)
The Company’s valuation methodology for assessing impairment requires management to make judgments and assumptions based on historical experience and projections of future operating performance. If these assumptions differ materially from future results, the Company may record impairment charges in the future.
Impairment of Definite Long-Lived Assets — The Company evaluates the recoverability of its long-lived assets, primarily comprised of property and equipment, definite-lived intangibles and operating lease right-of-use assets, for impairment whenever events or changes in circumstances indicate that the carrying amount may not be recoverable. The recoverability of long-lived assets is evaluated by comparing the carrying amount to the estimated undiscounted cash flows. If the carrying amount exceeds the estimated undiscounted cash flows, an impairment charge would be recognized for the amount by which the carrying amount exceeds the fair value of the long-lived asset. There were no
Warranties — The Company provides assurance-type warranties on most of its proprietary products covering periods that vary between one year and the lifetime of the product. The warranties cover products that are defective under normal conditions of use and are in-line with industry standards. The Company estimates the costs that may be incurred under its warranties and records the liability at the time product sales are recorded. The warranty liability is primarily based on historical failure rates and costs to repair or replace the product, including any necessary shipping costs. See Note 9 for changes in the Company’s accrued warranty liability for the years ended December 29, 2023, December 30, 2022, and December 31, 2021.
Tax Receivable Agreement — On July 29, 2021, the Company executed a tax receivable agreement (“TRA”) with participants (“TRA Participants”) that provides for payment by the Company to the TRA Participants of 85 % of the amount of cash savings, if any, in U.S. federal, state, and local income tax that the Company utilizes in the future from net operating losses and certain other tax benefits that arose prior to the IPO. The Company recognizes this contingent liability in its consolidated financial statements when incurrence of the liability becomes probable and amounts are reasonably estimable. Subsequent changes to the measurement of the TRA liability are recognized in the statements of operations as a component of other expense (income), net. If the Company does not have taxable income (before considering deductions that are subject to the TRA), it is not required (absent circumstances requiring an early termination payment, other acceleration of its obligations under the TRA or a change of control) to make payments under the TRA for that taxable year because no cash tax savings will have been realized. However, unutilized deductions that do not result in realized benefits in a given tax year as a result of insufficient taxable income may be applied to taxable income in future years. Accordingly, this would impact the amount of cash tax savings in such future years and the amount of corresponding payments under the TRA in such future years. See Note 13 for more information about the TRA.
Revenue Recognition — The Company sells hardware products to professional integrators, who then resell the products to end users in the installation of an audio/video, IT, smart-home, or surveillance-related package. In certain instances, the Company sells specific products directly to end users. The Company’s products consist of proprietary hardware products with and without embedded software, as well as third-party products. The Company provides services associated with product sales including the ability to access the Company’s hosted OvrC application (“hosting”), technical support, subscription services, and access to unspecified software updates and upgrades. The OvrC application provides the
85
Snap One Holdings Corp. and Subsidiaries
Notes to the Consolidated Financial Statements
(in thousands, except per share amounts)
Company’s customers, professional installers, and other dealers, a cloud-based remote management and monitoring platform to assist end consumers. These services are typically provided at no additional charge to the customer.
For product sales, revenue is recognized when the customer obtains control of the product, which occurs upon shipment, in an amount that reflects the consideration expected to be received in exchange for those products. For services, revenue is recognized ratably over the contract period in an amount that reflects the consideration expected to be received in exchange for those services as the customer receives such services on a consistent basis throughout the contract period. Technical support services represent a series of distinct performance obligations that have the same pattern of transfer to the customer and are recognized as a single performance obligation ratably over the estimated life of the related product.
For contracts with multiple performance obligations, the Company allocates the contract’s transaction price to each performance obligation based on the relative standalone selling price (“SSP”). Judgment is required to determine the SSP for each distinct performance obligation that is not sold separately, including technical support, customer reward programs, unspecified software updates and upgrades, and hosting. In instances where SSP is not directly observable, the primary method used to estimate the SSP is the expected cost plus an estimated margin approach, under which the Company forecasts the expected costs of satisfying a performance obligation and then adds an appropriate margin for that distinct service based on margins for similar services sold on a standalone basis.
For hardware products sold with embedded software, the products are dependent on and highly interrelated with the underlying software and accounted for as a single performance obligation with revenue recognized at the point in time when control is transferred to the customer, which is at the time the product is shipped. In cases where there is more than one performance obligation, a portion of the transaction price is allocated to hosting, unspecified software updates and upgrades, and technical support based on a relative stand-alone selling price method, as these services are provided at no additional charge. The allocated transaction price and corresponding revenue is deferred at the time of sale and recognized ratably over the estimated life of the related devices as this method best depicts the progress towards the completion of the related performance obligation.
The Company offers a subscription service that allows consumers to control and monitor their homes remotely and allows the consumer’s respective dealer to perform remote diagnostic services. With a subscription, the integrator simultaneously receives and consumes the benefits provided by the Company throughout the subscription period as the Company makes the service available for use. There is a single performance obligation associated with the subscription services and the related revenue is deferred and recognized ratably over the contract period, which is typically one year, as this method best depicts the progress towards the completion of the related performance obligation.
The Company evaluates whether the Company is the principal or the agent for all customer sales. Generally, the Company reports revenue on a gross basis (the amount billed to customers is recorded as revenue, and the amount paid to vendors is recorded as cost of sales, exclusive of depreciation and amortization). The Company is the principal in these instances because the Company controls the inventory before it is transferred to customers. The Company’s control is evidenced by the sole ability to monetize the inventory, being primarily responsible to customers, having discretion in pricing, or a combination of these factors. The Company also generates revenue through agency for certain third-party product sales where the supplier is the party responsible for ensuring fulfillment of the orders, has the obligation to mitigate any issues the customers may have with the products, and has the discretion in establishing the price for the products. In such cases, the Company does not control the promised good before it is transferred. The Company records sales for which the Company acts as an agent on a net basis.
The Company has various customer rewards programs (“marketing incentive programs”), which enable participants to earn points for qualifying rewards. The points are redeemed for rewards, including various prizes or product credits for future purchases. The marketing incentive programs provide the customer a material right and give rise to a separate performance obligation. The related revenue and expense incurred are recognized at the time of redemption, expiration, or forfeiture, as that is the point at which the performance obligation related to this incentive program is satisfied. As of December 29, 2023 and December 30, 2022, there was no no expense associated with the marketing incentive program for the year ended December 29, 2023. The expense associated with the marketing incentive program was $1,754 and $1,245 for the years ended December 30, 2022 and December 31, 2021, respectively, and was included in cost of sales, exclusive of depreciation and amortization, in the accompanying consolidated statements of operations.
86
Snap One Holdings Corp. and Subsidiaries
Notes to the Consolidated Financial Statements
(in thousands, except per share amounts)
Certain customers may receive cash-based incentives or credits (“volume rebates”) which are accounted for as variable consideration. The Company records reductions to revenue for dealer incentives at the time of the initial sale, which is based on estimates of the sales volume customers will reach during the measured period.
Revenue is recognized net of estimated discounts, rebates, and return allowances. The Company estimates the reduction to sales and cost of sales, exclusive of depreciation and amortization for returns based on current sales levels and the Company’s historical return trends.
The Company has elected to account for shipping and handling costs as activities to fulfill the promise to transfer the goods. As a result of this accounting policy election, the Company does not consider shipping and handling activities as promised services to its customers. Therefore, shipping and handling costs billed to customers are recorded in net sales, and the related costs in selling, general, and administrative expenses.
Payment terms and conditions vary by contract type, although terms generally include a requirement of payment within 30 days. In instances where the timing of revenue recognition differs from the timing of invoicing, the Company has determined the contracts do not include a significant financing component. The invoicing terms provide customers with a simplified and predictable way to purchase products and services and are not intended to provide the customer with financing from the Company. The Company records revenue net of any taxes collected from customers, which are subsequently remitted to governmental authorities.
Selling, General, and Administrative Expenses — Selling, general, and administrative expenses include office expenses such as payroll and occupancy costs, costs related to warehousing, distribution, outbound transportation to the Company’s customers, warranty, advertising, purchasing, insurance, non-income-based taxes, research and development, and corporate overhead costs.
Share-Based Compensation — The Company recognizes share-based compensation expense based on the fair value of the awards at the grant date. The Company utilized the Black-Scholes option pricing model to estimate the fair value of the time-based options and shares purchased by the participants of the Employee Stock Purchase Plan (“ESPP”). The Company used a Monte Carlo simulation to estimate the fair value and derived service period of the market-based options. The fair value of restricted stock units (“RSUs”) and performance stock units (“PSU”) is based on the Company’s closing stock price at the grant date. Compensation cost is recognized ratably over the vesting period of the related equity-based compensation award for time-based awards and on a graded-vesting basis for performance and market-based awards. Forfeitures are accounted for as they occur.
Upon the settlement date of certain outstanding equity awards, shares are withheld to cover the required withholding tax, which was based on the value of a share on the settlement date as determined by the closing price of the Company’s common stock on the trading day of the applicable settlement date. The remaining shares are delivered to the recipient as shares of the Company’s common stock. The amount remitted to the tax authorities for the employees’ tax obligation was reflected as a financing activity on the Company’s condensed consolidated statements of cash flows. These shares withheld by the Company as a result of the net settlement of equity awards issued under the 2021 Plan were not considered issued
87
Snap One Holdings Corp. and Subsidiaries
Notes to the Consolidated Financial Statements
(in thousands, except per share amounts)
and outstanding. These shares were returned to the 2021 Plan reserve and are available for future issuance thereunder. For vesting events where shares are not withheld, the Company required employees to sell a portion of the shares received upon the vesting of equity awards in order to cover any required withholding taxes. See Note 11 for further information about the Company’s share-based compensation.
Other Expense (Income) — Other expense (income) primarily consists of interest income, foreign currency remeasurement, TRA liability adjustments, interest rate cap expense, gains and losses on disposal of business, and transaction gains and losses.
Income Taxes — The Company files a consolidated federal income tax return and accounts for income taxes in accordance with ASC 740, Income Taxes, which requires the recognition of deferred tax assets and liabilities for the expected future tax consequences of events that have been included in the consolidated financial statements or income tax returns. Under this method, deferred income tax assets and liabilities are recognized based on the differences between the consolidated financial statement amounts and income tax basis of assets and liabilities using enacted tax rates in effect for the period in which the differences are expected to be recovered or settled. Valuation allowances are established, when necessary, to reduce deferred income tax assets to the amount expected to be realized. See Note 12 for further information about the Company’s income taxes.
The Company records liabilities for income tax positions taken, or expected to be taken, when those positions are deemed uncertain to be upheld upon examination by taxing authorities. Interest and penalties, if incurred, would be recorded within the income tax provision in the accompanying consolidated statements of operations.
Foreign Currency Translation and Foreign Currency Transactions — Certain non-U.S. wholly owned subsidiaries have functional currencies other than the U.S. dollar. For subsidiaries with a functional currency different from the U.S. dollar, the subsidiaries’ assets and liabilities have been translated to U.S. dollars using the exchange rates in effect at the balance sheet dates. Statements of operations amounts have been translated using the monthly average exchange rate for each year. Foreign currency translation gains or losses are reflected in accumulated other comprehensive loss as a component of equity in the accompanying consolidated balance sheets. Foreign currency remeasurement and transaction gains and losses are included in other expense (income).
Net Loss Per Share — The Company calculates net loss per share by dividing the net loss by the weighted average number of common shares outstanding. See Note 17 for information regarding the calculation of basic and dilutive shares for the periods presented.
Emerging Growth Company and Smaller Reporting Company Status — The JOBS Act permits an “emerging growth company” such as us to take advantage of an extended transition period to comply with new or revised accounting standards applicable to public companies until those standards would otherwise apply to private companies. The Company has elected not to “opt out” of such extended transition period, which means that when a standard is issued or revised and it has different application dates for public or private companies, the Company will adopt the new or revised standard at the time private companies adopt the new or revised standard and will do so until such time the Company either (i) irrevocably elects to “opt out” of such extended transition period or (ii) no longer qualifies as an emerging growth company. The Company may choose to early adopt any new or revised accounting standards whenever such early adoption is permitted for private companies.
The Company is also a “smaller reporting company,” because the market value of our shares held by non-affiliates was less than $250 million as of the end of its most recently completed second fiscal quarter. It may continue to be a smaller reporting company if either (i) the market value of its shares held by non-affiliates is less than $250 million or (ii) its annual revenue was less than $100 million during the most recently completed fiscal year and the market value of its shares held by non-affiliates is less than $700 million. If the Company is a smaller reporting company at the time it ceases to be an emerging growth company, it may continue to rely on exemptions from certain disclosure requirements available to smaller reporting companies.
Recent Accounting Pronouncements Pending Adoption — In November 2023, the Financial Accounting Standards Board (“FASB”) issued Accounting Standards Update (“ASU”) 2023-07, Segment Reporting (Topic 280): Improvements to Reportable Segment Disclosures which enhances disclosures about significant segment expenses. The amendment introduces a new requirement to disclose significant segment expenses regularly provided to the CODM, requires
88
Snap One Holdings Corp. and Subsidiaries
Notes to the Consolidated Financial Statements
(in thousands, except per share amounts)
disclosure for other segment items by reportable segment and a description of its composition, extends certain annual disclosures to interim periods, permits more than one measure of segment profit or loss to be reported under certain conditions and requires disclosure of the title and position of the CODM. The amendment in this update is effective for fiscal years beginning after December 15, 2023 and interim periods beginning after December 15, 2024, with early adoption permitted. The Company is currently in the process of determining the timing of adoption and evaluating the potential impact on its consolidated financial statements.
In December 2023, FASB issued ASU 2023-09, Income Taxes (Topic 740): Improvements to Income Tax Disclosures. The guidance requires public entities to disclose disaggregated information about their effective tax rate reconciliation as well as expanded information on income taxes paid by jurisdiction. The disclosure requirements will be applied on a prospective basis, with the option to apply them retrospectively. The effective date for the standard is for fiscal years beginning after December 15, 2024, with early adoption permitted. The Company is in the process of evaluating the timing and impact of the new standard on the related disclosures.
Recently Adopted Accounting Pronouncements — In March 2020, the FASB issued ASU 2020-04, Reference Rate Reform (Topic 848): Facilitation of the Effects of Reference Rate Reform on Financial Reporting (Accounting Standards Codification 848, “ASC 848”). ASC 848 provides practical expedients and exceptions for an entity to elect not to apply certain modification accounting requirements to contracts affected by reference rate reform if certain criteria are met. In January 2021, the FASB issued ASU 2021-01, Reference Rate Reform (Topic 848). The objective of the new reference rate reform standard is to clarify the scope of Topic 848 and provide explicit guidance to help companies applying optional expedients and exceptions. In December 2022, the FASB issued ASU 2022-06, Reference Rate Reform (Topic 848): Deferral of the Sunset Date of Topic 848 which extends the availability of the provisions of ASU 2021-01 until December 31, 2024. The Company’s exposure related to the cessation of the London InterBank Offered Rate (“LIBOR”) is limited to (i) the interest expense and certain fees it incurs on balances outstanding under its credit facilities, which the Company amended on April 17, 2023 to replace LIBOR with the Secured Overnight Financing Rate (“SOFR”) (see Note 7 for further discussion), (ii) certain interest rates that may become applicable pursuant to the Company’s TRA which may be amended by the Company and the TRA Party Representative if such interest rates become applicable and (iii) the Company’s interest rate cap agreement, which was amended on June 30, 2023 to replace LIBOR with SOFR as the interest rate benchmark for the Term Loan. The Company utilized the practical expedients set forth in Topic 848 and has continued to account for its interest rate cap at fair value and has not applied modification accounting to its debt instruments. The Company fully adopted the standard as of June 30, 2023 and the adoption did not have a material impact on our consolidated financial statements.
In October 2021, the FASB issued ASU 2021-08, Business Combinations (Topic 606): Accounting for Contract Assets and Contract Liabilities from Contracts with Customers, which requires that an entity recognize and measure contract assets and liabilities from contracts with customers in a business combination in accordance with ASC 606 as if it had originated the contracts. The amendment in this update is effective for fiscal years beginning after December 15, 2022, with early adoption permitted. The guidance should be applied prospectively to business combinations occurring on or after the effective date of the amendment in this update. The Company adopted the standard as of the beginning of fiscal year 2023 and the adoption did not have a material impact on the consolidated financial statements.
In September 2022, the FASB issued ASU 2022-04, Liabilities- Supplier Finance Programs (Subtopic 405-50): Disclosure of Supplier Finance Program Obligations, which requires buyers in a supplier finance program to disclose information related to the key terms of the program and the obligations the buyer has confirmed as valid to the finance provider or intermediary. The buyers are required to disclose obligations outstanding in interim reporting periods. The amendment in this update is effective for fiscal years beginning after December 15, 2022, with early adoption permitted. The Company adopted the standard as of the beginning of fiscal year 2023 and the adoption did not have an impact on the Company’s disclosures as the impact of supplier finance programs is not material to the Company’s consolidated financial statements.
In February 2016, the FASB issued ASU 2016-02, Leases (Topic 842), which establishes the principles to report transparent and economically neutral information about the assets and liabilities that arise from leases. This new guidance requires lessees to recognize the lease assets and lease liabilities that arise from leases in the statement of financial position and to disclose qualitative and quantitative information about lease transactions, such as information about variable lease payments and options to renew and terminate leases. The FASB issued ASU 2020-05, which deferred the effective date to fiscal years beginning after December 15, 2021, and interim periods within fiscal years beginning after December 15, 2022.
89
Snap One Holdings Corp. and Subsidiaries
Notes to the Consolidated Financial Statements
(in thousands, except per share amounts)
The Company adopted the new leasing standard as of January 1, 2022, using the modified retrospective approach. Therefore, results for reporting periods beginning after January 1, 2022 are presented under Topic 842, while comparative information has not been restated and continues to be reported under ASC 840 in effect for those periods. There was not a cumulative-effect adjustment to accumulated deficit at the beginning of the period of adoption. In adopting the new guidance, the Company elected the package of practical expedients permitted under the transition guidance within the standard, which eliminates the reassessment of whether existing contracts contain leases, lease classification, and capitalization of initial direct costs. The Company also elected an accounting policy to not recognize assets or liabilities for leases with a term of less than 12 months, to not separate lease and non-lease components for all asset classes and to not elect to use the hindsight practical expedient. The adoption of the new leasing standard resulted in the recognition of approximately $40,906 and $43,862 of right-of-use (“ROU”) assets and lease liabilities, respectively, on the Company’s consolidated balance sheets for its operating lease commitments. The difference between the ROU assets and lease liabilities is primarily attributable to deferred rent and lease incentives. The adoption of the standard did not have a material impact on the Company’s consolidated statements of operations or on the consolidated statements of cash flows.
In June 2016, the FASB issued ASU 2016-13, Financial Instruments — Credit Losses. The ASU sets forth a current expected credit loss (“CECL”) model which requires the Company to measure all expected credit losses for financial instruments held at the reporting date based on historical experience, current conditions, and reasonable and supportable forecasts. This replaces the existing incurred loss model and is applicable to the measurement of credit losses on financial assets measured at amortized cost and applies to some off-balance sheet credit exposures. This ASU was effective for fiscal years beginning after December 15, 2019, including interim periods within those fiscal years, with early adoption permitted. In November 2019, the FASB issued ASU 2019-10 which deferred the effective date to fiscal years beginning after December 15, 2022, including interim periods within those fiscal years. The Company early adopted the standard for the fiscal year beginning January 1, 2022. Adoption of the standard did not have a material impact on the consolidated financial statements.
3. Acquisitions
There were no acquisitions during the year ended December 29, 2023. There were three acquisitions during the year ended December 30, 2022, and one during the year ended December 31, 2021 as described further in this section below. The Company’s acquisitions have been accounted for under ASC 805, Business Combinations. Accordingly, the accounts of the acquired companies, after adjustments to reflect fair values assigned to assets and liabilities, have been included in the consolidated financial statements from their respective dates of acquisition.
Transactions Completed in Fiscal Year 2022
On October 24, 2022, the Company acquired the remaining outstanding interest of its majority-owned subsidiary, Remote Maintenance Systems LP, doing business as Parasol (“Parasol”), the provider of 24/7 remote support service to the Company’s integrators based on the Company’s remote management tool, OvrC. The Company acquired the remaining outstanding equity shares of Parasol in exchange for $1,100 of the Company’s common shares. The Company made an initial investment and established its controlling interest in 2018, and has included the results of operations, assets, and liabilities in its consolidated financial reports since 2018.
The Company completed two additional acquisitions during fiscal year 2022 with Clare Controls, LLC (“Clare”), on August 8, 2022, and Staub Electronics, LTD (“Staub”), on January 20, 2022. The Clare acquisition enabled Snap One to convert Clare’s product suite into higher-margin proprietary products and drive growth with professional integrators in adjacent markets. The Company agreed to a purchase price of $6,300 , consisting of $4,900 cash paid and $1,400 related to the settlement of a pre-existing note receivable from Clare owed to the Company. The Staub acquisition added two Canadian locations to the Company’s distribution footprint. The Company agreed to a cash purchase price of $26,395 for the issued and outstanding shares of Staub.
90
Snap One Holdings Corp. and Subsidiaries
Notes to the Consolidated Financial Statements
(in thousands, except per share amounts)
The final allocation of the purchase price for Clare and Staub is as follows:
| Clare | Staub | ||||||||||
| Total purchase consideration | $ | $ | |||||||||
| Cash and cash equivalents | $ | $ | |||||||||
| Accounts receivable | |||||||||||
| Inventory | |||||||||||
| Prepaid expenses | |||||||||||
| Property and equipment, net | |||||||||||
| Operating lease right-of-use assets | |||||||||||
| Identifiable intangible assets | |||||||||||
| Total identifiable assets acquired | |||||||||||
| Accounts payable | |||||||||||
| Accrued liabilities | |||||||||||
| Current operating lease liability | |||||||||||
| Deferred income tax liabilities | |||||||||||
| Operating lease liability, net of current portion | |||||||||||
| Other liabilities | |||||||||||
| Total liabilities assumed | |||||||||||
| Net identifiable assets acquired | |||||||||||
| Goodwill | |||||||||||
| Net assets acquired | $ | $ | |||||||||
The Company recorded intangible assets related to the acquisitions based on estimated fair value, which consisted of the following:
| Clare | Staub | ||||||||||||||||||||||
| Useful Lives (Years) | Acquired Value | Useful Lives (Years) | Acquired Value | ||||||||||||||||||||
Customer relationships | — | $ | — | $ | |||||||||||||||||||
Technology | — | — | |||||||||||||||||||||
Trade name | |||||||||||||||||||||||
Total intangible assets | $ | $ | |||||||||||||||||||||
Goodwill arising from the Clare acquisition primarily consists of synergies from integrating Clare’s automation and security products into the Company’s existing product portfolio. Goodwill arising from the Staub acquisition primarily consists of synergies from integrating the distribution channels of Staub into the Company’s distribution channels.
As a result of the Clare transaction, the Company has, for income tax purposes, goodwill of $2,746 that will be deductible in future periods.
The Company recognized $382 of transaction-related expenses for Clare in fiscal year 2022, consisting primarily of advisory, legal, and other professional fees, which were included in selling, general, and administrative expenses in the consolidated statement of operations. The Company recognized $328 of transaction-related expenses for Staub, $214 of expense in fiscal year 2022 and $114 of expense in fiscal year 2021, consisting primarily of advisory, legal, and other professional fees, which were included in selling, general, and administrative expenses in the consolidated statement of operations.
91
Snap One Holdings Corp. and Subsidiaries
Notes to the Consolidated Financial Statements
(in thousands, except per share amounts)
Transaction Completed in Fiscal Year 2021
On May 4, 2021, the Company entered into a purchase agreement pursuant to which it acquired the issued and outstanding shares of ANLA, LLC. (“Access Networks”), an enterprise-grade networking solutions provider offering networking products, design, configuration, monitoring, and support services. The acquisition enhanced the Company’s networking solutions for residential and commercial networks. The Company agreed to a purchase price of $36,641 , consisting of both cash and equity, plus contingent consideration of up to $2,000 based upon the achievement of specified financial targets. The Access Networks acquisition closed on May 28, 2021.
The consideration was allocated to the assets acquired and liabilities assumed based on their fair values as of the closing date. The Company allocated any excess purchase price over the fair value of the net tangible and intangible assets acquired and liabilities assumed to goodwill. Goodwill arising from the Access Networks acquisition primarily consists of synergies from integrating the distribution of products through the Company’s existing distribution channels.
As part of the acquisition, the Company was required to pay additional consideration upon the achievement of specified financial targets. As of the acquisition date, the fair value of the contingent consideration was $2,000 . During the year ended December 30, 2022, the agreement was modified to change the covered revenue period, reducing expected payouts based on future revenues to $250 which was recorded in accrued liabilities on the Company’s consolidated balance sheet. The change in fair value was recorded as a reduction in selling, general, and administrative expenses. The consideration was paid during the year ending December 29, 2023.
The allocation of the purchase price for the Access Networks acquisition is as follows:
| Total purchase consideration | $ | ||||
| Cash and cash equivalents | $ | ||||
| Accounts receivable | |||||
| Inventory | |||||
| Property and equipment | |||||
| Identifiable intangible assets | |||||
| Total identifiable assets acquired | |||||
| Accounts payable | |||||
| Accrued liabilities | |||||
| Other liabilities | |||||
| Deferred income tax liabilities | |||||
| Total liabilities assumed | |||||
| Net identifiable assets acquired | |||||
| Goodwill | |||||
| Net assets acquired | $ | ||||
As of the acquisition date, for income tax purposes, goodwill of $13,616 was determined to be deductible in future periods. The acquisition of Access Networks was treated partially as a taxable acquisition and therefore any contingent consideration paid would result in an increase in tax deductible goodwill. As of the acquisition date, the tax basis in deductible goodwill was evaluated based on the fair value of the contingent consideration at the acquisition date being settled in full. As a result of the reduction in contingent consideration expected to be paid, the value of tax-deductible goodwill was reduced by the same amount, bringing the value to $11,866 as of the year ended December 30, 2022.
92
Snap One Holdings Corp. and Subsidiaries
Notes to the Consolidated Financial Statements
(in thousands, except per share amounts)
The Company recorded intangible assets related to the acquisition based on estimated fair value, which consisted of the following:
| Useful Lives (Years) | Acquired Value | ||||||||||
Customer relationships | $ | ||||||||||
Trade name | |||||||||||
Total intangible assets | $ | ||||||||||
Other liabilities assumed consisted primarily of warranty reserves and deferred revenue. The long-term warranty reserves are primarily based on historical failure rates, costs to repair or replace the product, and any necessary shipping costs, which are considered to approximate the fair value of the remaining obligation. Deferred revenue was recorded at fair value, resulting in a cumulative balance for the acquisition of $883 in accrued liabilities and $586 in other liabilities.
The Company recognized $197 of transaction-related expenses for the year ended December 31, 2021, consisting primarily of advisory, legal, and other professional fees related to the acquisition. These transaction-related expenses were incurred by and for the benefit of the Company, and were included in selling, general, and administrative expenses in the consolidated statements of operations.
Pro forma financial information related to the Clare and Staub acquisitions in 2022 and the Access Networks acquisition in 2021 has not been provided as it is not material to the Company’s consolidated results of operations. The results of operations of the acquisitions are included in the Company’s consolidated results of operations from the date of acquisition and were not significant for the years ended December 30, 2022 and December 31, 2021, respectively.
4.Revenue and Geographic Information
Contract Balances — Amounts invoiced in advance of revenue recognition are recorded as deferred revenue on the consolidated balance sheets. Deferred revenue primarily relates to unspecified software updates and upgrades, hosting, technical support, marketing incentive programs, and subscription services.
The following table represents the changes in deferred revenue for the years ended December 29, 2023, December 30, 2022, and December 31, 2021:
| December 29, 2023 | December 30, 2022 | December 31, 2021 | |||||||||||||||
Deferred revenue – beginning of period | $ | $ | $ | ||||||||||||||
Amounts billed, but not recognized | |||||||||||||||||
Recognition of revenue | ( | ( | ( | ||||||||||||||
| Deferred revenue acquired | |||||||||||||||||
Deferred revenue – end of period | $ | $ | $ | ||||||||||||||
The Company recorded deferred revenue of $23,261 and $22,611 in accrued liabilities and $11,660 and $12,440 in other liabilities as of December 29, 2023 and December 30, 2022, respectively.
Disaggregation of Revenue — The following table sets forth revenue by geography for the years ended December 29, 2023, December 30, 2022, and December 31, 2021:
| 2023 | 2022(d) | 2021(d) | |||||||||||||||
Domestic integrators(a) | $ | $ | $ | ||||||||||||||
Domestic other(b) | |||||||||||||||||
International(c) | |||||||||||||||||
Total | $ | $ | $ | ||||||||||||||
(a)“Domestic integrators” is defined as professional “do-it-for-me” integrators who transact with Snap One through a traditional integrator channel in the United States.
93
Snap One Holdings Corp. and Subsidiaries
Notes to the Consolidated Financial Statements
(in thousands, except per share amounts)
(b)“Domestic other” is defined as revenue generated through managed transactions with non-integrator customers, such as national accounts.
(c)“International” consists of all integrators and distributors who transact with Snap One outside of the United States.
(d)Certain amounts, including Access Networks net sales, have been reclassified to conform to the current period presentation.
The following table sets forth revenue by product type between proprietary products and third-party products for the years ended December 29, 2023, December 30, 2022, and December 31, 2021:
| 2023 | 2022 | 2021 | |||||||||||||||
Proprietary products(a) | $ | $ | $ | ||||||||||||||
Third-party products(b) | |||||||||||||||||
Total | $ | $ | $ | ||||||||||||||
(a)Proprietary products consist of products and services internally developed by Snap One and sold under one of Snap One’s proprietary brands.
(b)Third-party products consist of products that Snap One distributes but to which Snap One does not own the intellectual property.
Additionally, the Company’s revenue includes amounts recognized over time and at a point in time, and are as follows for the years ended December 29, 2023, December 30, 2022, and December 31, 2021:
| 2023 | 2022 | 2021 | |||||||||||||||
Products transferred at a point in time | $ | $ | $ | ||||||||||||||
Services transferred over time | |||||||||||||||||
Total | $ | $ | $ | ||||||||||||||
Disaggregation of Property & Equipment — Property and equipment, net, by geography as of December 29, 2023 and December 30, 2022:
| December 29, 2023 | December 30, 2022 | ||||||||||
United States | $ | $ | |||||||||
International | |||||||||||
Total | $ | $ | |||||||||
5.Balance Sheet Components
94
Snap One Holdings Corp. and Subsidiaries
Notes to the Consolidated Financial Statements
(in thousands, except per share amounts)
Accounts Receivable Allowance:
Changes in the Company’s allowance for credit losses for the years ended December 29, 2023 and December 30, 2022, and allowance for doubtful accounts for the year ended December 31, 2021, are as follows:
| Allowance for doubtful accounts - December 25, 2020 | $ | ||||
| Bad debt expense | |||||
| Write-offs | ( | ||||
| Allowance for doubtful accounts - December 31, 2021 | |||||
| Bad debt expense | |||||
| Write-offs | ( | ||||
| Allowance for credit losses - December 30, 2022 | |||||
| Bad debt expense | |||||
| Write-offs | ( | ||||
| Allowance for credit losses - December 29, 2023 | $ | ||||
Inventories:
As of December 29, 2023 and December 30, 2022, the Company’s inventory consisted of the following:
| December 29, 2023 | December 30, 2022 | ||||||||||
Finished goods | $ | $ | |||||||||
Raw materials | |||||||||||
Work in process | |||||||||||
Reserve for obsolete and slow-moving inventory | ( | ( | |||||||||
Total inventories | $ | $ | |||||||||
Changes in the Company’s reserve for obsolete and slow-moving inventory for the years ended December 29, 2023, December 30, 2022, and December 31, 2021 consisted of the following:
| Inventory Reserve – December 25, 2020 | $ | ||||
| Valuation adjustment | |||||
| Write-offs | ( | ||||
| Inventory Reserve – December 31, 2021 | |||||
| Valuation adjustment | |||||
| Write-offs | ( | ||||
| Inventory Reserve – December 30, 2022 | |||||
| Valuation adjustment | |||||
| Write-offs | ( | ||||
| Inventory Reserve – December 29, 2023 | $ | ||||
Property and Equipment, Net:
Property and equipment, net, as of December 29, 2023 and December 30, 2022, consisted of the following:
95
Snap One Holdings Corp. and Subsidiaries
Notes to the Consolidated Financial Statements
(in thousands, except per share amounts)
| December 29, 2023 | December 30, 2022 | ||||||||||
| Equipment | $ | $ | |||||||||
| Computers and software | |||||||||||
| Furniture and fixtures | |||||||||||
| Leasehold improvements | |||||||||||
| Construction in progress | |||||||||||
| Total property and equipment | |||||||||||
| Less: Accumulated depreciation | ( | ( | |||||||||
| Property and equipment, net | $ | $ | |||||||||
Total depreciation expense for the years ended December 29, 2023, December 30, 2022, and December 31, 2021 was $11,536 , $9,353 , and $8,028 , respectively.
Accrued Liabilities:
Accrued liabilities as of December 29, 2023 and December 30, 2022, consisted of the following:
| December 29, 2023 | December 30, 2022 | ||||||||||
| Deferred revenue | $ | $ | |||||||||
| Payroll, vacation and bonus accruals | |||||||||||
| Warranty reserve | |||||||||||
| Customer rebate program | |||||||||||
| Sales return allowance | |||||||||||
| Incurred but not reported self-insurance | |||||||||||
| Interest payable | |||||||||||
| Taxes | |||||||||||
| Other accrued liabilities | |||||||||||
| Total accrued liabilities | $ | $ | |||||||||
6.Goodwill and Other Intangible Assets, Net
Changes in the carrying value of goodwill for the years ended December 29, 2023 and December 30, 2022 are summarized as follows:
| Balance - December 31, 2021 | $ | ||||
Additions (a) | |||||
| Cumulative translation adjustments | ( | ||||
| Balance - December 30, 2022 | |||||
| Cumulative translation adjustments | |||||
| Balance - December 29, 2023 | $ | ||||
(a)Goodwill increased by $12,184 for the year ended December 30, 2022 due to the acquisitions of Staub and Clare. See Note 3 for additional details on the Company’s acquisitions.
96
Snap One Holdings Corp. and Subsidiaries
Notes to the Consolidated Financial Statements
(in thousands, except per share amounts)
As of December 29, 2023, and December 30, 2022, other intangible assets, net, consisted of the following:
| December 29, 2023 | |||||||||||||||||||||||
| Estimated Useful Life | Gross Carrying Amount (b) | Accumulated Amortization | Net Carrying Amount | ||||||||||||||||||||
| Customer relationships | $ | $ | ( | $ | |||||||||||||||||||
| Technology | ( | ||||||||||||||||||||||
| Trade names – definite | ( | ||||||||||||||||||||||
| Trade names – indefinite | indefinite | — | |||||||||||||||||||||
| Total intangible assets | $ | $ | ( | $ | |||||||||||||||||||
| December 30, 2022 | |||||||||||||||||||||||
| Estimated Useful Life | Gross Carrying Amount (b) | Accumulated Amortization | Net Carrying Amount | ||||||||||||||||||||
| Customer relationships | $ | $ | ( | $ | |||||||||||||||||||
| Technology | ( | ||||||||||||||||||||||
| Trade names – definite | ( | ||||||||||||||||||||||
| Trade names – indefinite | indefinite | — | |||||||||||||||||||||
| Total intangible assets | $ | $ | ( | $ | |||||||||||||||||||
(b)Amounts include any net changes in intangible asset balances for the periods presented that resulted from foreign currency translation.
Total amortization expense for intangible assets for the years ended December 29, 2023, December 30, 2022, and December 31, 2021 was $49,589 , $50,229 and $48,553 , respectively. The weighted-average useful life remaining for amortizing definite-lived intangible assets was approximately 14.0 years as of December 29, 2023.
As of December 29, 2023, the estimated amortization expense for intangible assets for the next five fiscal years and thereafter are as follows:
| 2024 | $ | ||||
| 2025 | |||||
| 2026 | |||||
| 2027 | |||||
2028 | |||||
| Thereafter | |||||
| Total | $ | ||||
7.Debt Agreements
On August 4, 2017, the Company’s wholly owned subsidiary, Wirepath, LLC, (“Borrower”), entered into a credit agreement (as amended from time to time, “Old Credit Agreement”), consisting of a senior secured term loan (“Old Initial Term Loan”) and a senior secured revolving credit facility (“Old Revolving Credit Facility”). On August 1, 2019, the Borrower amended the Old Credit Agreement to borrow an additional senior secured term loan (“Old Incremental Term Loan” and, together with the Old Initial Term Loan, as amended, “Old Term Loans”) and increased the commitments under the Old Revolving Credit Facility.
On August 4, 2021, the Company used a portion of the net proceeds from the IPO to prepay $216,902 in aggregate of the amount of the Old Incremental Term Loan consisting of $215,874 in principal plus accrued interest of $1,028 . In connection with the prepayment, the Company incurred a charge of $6,645 related to the write-off of the proportionate
97
Snap One Holdings Corp. and Subsidiaries
Notes to the Consolidated Financial Statements
(in thousands, except per share amounts)
amount of the unamortized debt issuance costs at the time of the prepayment which was recorded in loss on extinguishment of debt on the Company’s consolidated statement of operations for the year ended December 31, 2021. The unamortized debt issuance costs are allocated between the remaining original loan balance and the portion of the loan paid down on a pro-rata basis.
On December 8, 2021, the Company entered into and became a party to a credit agreement (the “Credit Agreement”) by and between the Company, various financial institutions and Morgan Stanley Senior Funding, Inc., as administrative agent (the “Administrative Agent”) (as amended from time to time, the “Credit Agreement”) consisting of $465,000 in aggregate principal amount of senior secured term loans maturing seven years from the effective date (the “Term Loan”) and a $100,000 senior secured revolving credit facility (which includes borrowing capacity available for letters of credit) maturing five years from the effective date (the “Revolving Credit Facility”).
In connection with the closing of the Credit Agreement, the Company repaid in full approximately $451,400 of existing borrowings, including accrued interest. The Old Term Loans and Old Revolving Credit Facility and related agreements and documents under the Old Credit Agreement were terminated upon the effectiveness of the Credit Agreement.
The issuance of the Credit Agreement and repayment of the Old Term Loans were evaluated in accordance with ASC 470-50-40 - Debt-Modifications and Extinguishments - Derecognition, to determine whether the refinancing transaction should be accounted for as a debt modification or extinguishment. Each lender involved in the refinancing transaction was analyzed to determine if its participation was a debt modification or an extinguishment. Debt issuance costs for exiting lenders who chose not to participate in the Term Loan were accounted for as extinguishments. Debt discounts and costs incurred with third parties for the issuance of the Term Loan totaling $9,079 were capitalized and amortized over the term of the Term Loan. These capitalized fees associated with new and continuing lenders are presented as cash flows from financing activities on the consolidated statements of cash flows. The Company wrote off $5,427 in debt issuance costs related to the extinguishment of the Old Term Loans which was recorded in loss on extinguishment of debt on our consolidated statement of operations for the year ended December 31, 2021.
On October 2, 2022, the Company became party to an incremental agreement (the “Incremental Agreement”) with the lenders party thereto and the Administrative Agent to provide incremental term loans (the “Incremental Term Loan”) in an aggregate principal amount of $55,000 . The Incremental Term Loan matures three years from the effective date. The Incremental Agreement amended the Credit Agreement (the Credit Agreement, as amended by the Incremental Agreement, the “Amended Credit Agreement”).
On October 26, 2022, the Company entered into an interest rate cap agreement on the floating rate component of interest (LIBOR, subsequently transitioned to SOFR) for the Term Loan, with Bank of America as the counterparty. The interest rate cap became effective December 31, 2022. The Company will pay a premium of $6,573 at the maturity date of December 31, 2025. For the period ended December 29, 2023, the notional amount of the interest rate cap is $347,800 of the Term Loan and has a strike rate of 4.79 %, which effectively caps SOFR on the notional amount at 4.79 %. As of December 29, 2023, the three-month SOFR rate was 5.39 %.
On April 17, 2023, the Company entered into an Amendment to the Credit Agreement (the “Amendment to the Credit Agreement”), further amending the Credit Agreement dated as of December 8, 2021 (as amended by the Amended Credit Agreement dated as of October 2, 2022). The Amendment to the Credit Agreement replaces LIBOR with SOFR as the interest rate benchmark for certain loans as provided thereunder along with other conforming changes. Other than the foregoing, the parties to the Credit Agreement continue to have the same obligations set forth in the Credit Agreement prior to the effectiveness of the Amendment to the Credit Agreement.
Borrowings under the Term Loan will bear interest at a rate per annum equal to, at the Company’s option, either (1) an applicable margin plus a base rate determined by reference to the highest of (a) 0.50 % per annum plus the federal funds effective rate, (b) the prime rate and (c) the eurocurrency rate determined by reference to the cost of funds for U.S. dollar deposits (subsequently changed to the forward-looking term rate based on SOFR for rates initiated after the effective date of the Amendment to the Credit Agreement) for an interest period of one month adjusted for certain additional costs, plus 1.00 %; provided that such rate is not lower than a floor of 1.50 % or (2) an applicable margin plus a eurocurrency rate determined by reference to the cost of funds for U.S. dollar deposits (subsequently changed to the forward-looking term rate
98
Snap One Holdings Corp. and Subsidiaries
Notes to the Consolidated Financial Statements
(in thousands, except per share amounts)
based on SOFR for rates initiated after the effective date of the Amendment to the Credit Agreement) for the interest period relevant to such borrowing adjusted for certain additional costs; provided that such rate is not lower than a floor of 0.50 %.
Borrowings under the Incremental Term Loan will bear interest at a rate per annum equal to, at the Company’s option, either (1) an applicable margin plus a base rate determined by reference to the highest of (a) 0.50 % per annum plus the federal funds effective rate, (b) the prime rate and (c) the forward-looking term rate based on SOFR for an interest period of one month plus 1.00 %; provided that such rate is not lower than a floor of 1.00 % or (2) an applicable margin plus a forward-looking rate based on SOFR for the interest period relevant to such borrowing provided that such rate in not lower than a floor of 0.50 %.
The interest rate for the Term Loan was 10.04 % as of December 29, 2023 and 7.38 % as of December 30, 2022. The interest rate for the Incremental Term Loan was 12.14 % as of December 29, 2023 and 10.42 % as of December 30, 2022.
Borrowings under the Revolving Credit Facility will bear interest at a rate per annum equal to an applicable margin based upon a leverage-based pricing grid, plus, at the Company’s option, either (1) a base rate determined by reference to the highest of (a) 0.50 % per annum plus the federal funds effective rate, (b) the prime rate and (c) the eurocurrency rate determined by reference to the cost of funds adjusted for certain additional costs (subsequently changed to the forward-looking term rate based on SOFR for rates initiated after the effective date of the Amendment to the Credit Agreement) for an interest period of one month, plus 1.00 %; provided such rate is not lower than a floor of 1.00 % or (2) a eurocurrency rate determined by reference to the applicable cost of funds for such borrowing adjusted for certain additional costs (subsequently changed to the forward-looking term rate based on SOFR for rates initiated after the effective date of the Amendment to the Credit Agreement); provided such rate is not lower than a floor of zero , subsequently changed to 0.50 % based on SOFR for rates initiated after the effective date of the Amendment to the Credit Agreement. There were no borrowings under the Revolving Credit Facility as of December 29, 2023. The interest rate for the Revolving Credit Facility was 9.22 % as of December 30, 2022.
The Term Loan amortizes in fixed equal quarterly installments in an amount equal to 1.00 % per annum of the total aggregate principal amount thereof immediately after borrowing, with the balance due at maturity. The Company may voluntarily prepay loans or reduce commitments under the Credit Agreement, in whole or in part, subject to minimum amounts, with prior notice but without premium or penalty (subject to customary exceptions).
99
Snap One Holdings Corp. and Subsidiaries
Notes to the Consolidated Financial Statements
(in thousands, except per share amounts)
The Company’s outstanding debt as of December 29, 2023 and December 30, 2022 was as follows:
| Maturity Date | December 29, 2023 | December 30, 2022 | ||||||||||||||||||
| Credit Agreement | ||||||||||||||||||||
| Term Loan | December 8, 2028 | $ | $ | |||||||||||||||||
| Incremental Term Loan | October 2, 2025 | $ | $ | |||||||||||||||||
| Revolving Credit Facility | December 8, 2026 | $ | $ | |||||||||||||||||
| Outstanding letters of credit | December 8, 2026 | $ | $ | |||||||||||||||||
The amount available under the Revolving Credit Facility was $95,060 and $82,940 as of December 29, 2023 and December 30, 2022, respectively.
As of December 29, 2023, the future scheduled maturities of the above notes payable are as follows:
| 2024 | $ | ||||
| 2025 | |||||
| 2026 | |||||
| 2027 | |||||
| 2028 | |||||
| Total future maturities of debt | |||||
| Unamortized debt issuance costs | ( | ||||
| Total indebtedness | |||||
| Less: Current maturities of long-term debt | |||||
| Long-term debt | $ | ||||
Unamortized costs related to the issuance of the Term Loan were $11,793 as of December 29, 2023 and $14,655 as of December 30, 2022, and were presented as a direct deduction from the carrying amount of long-term debt. Unamortized costs related to the issuance of the Revolving Credit Facility were $895 as of December 29, 2023, and were included in other assets in the consolidated balance sheet. Unamortized costs related to the issuance of the Revolving Credit Facility were $1,200 as of December 30, 2022 and were presented as a direct deduction from the carrying amount of the Revolving Credit Facility. The costs related to debt issuances are amortized to interest expense over the life of the related debt.
As of December 29, 2023, the future amortization of debt issuance costs was as follows:
| 2024 | $ | ||||
| 2025 | |||||
| 2026 | |||||
| 2027 | |||||
| 2028 | |||||
| Total | $ | ||||
100
Snap One Holdings Corp. and Subsidiaries
Notes to the Consolidated Financial Statements
(in thousands, except per share amounts)
Interest expense for the years ended December 29, 2023, December 30, 2022, and December 31, 2021 consisted of the following:
| 2023 | 2022 | 2021 | |||||||||||||||
| Interest expense from Term Loan | $ | $ | $ | ||||||||||||||
| Interest expense from Revolving Credit Facility | |||||||||||||||||
| Interest expense from Old Credit Agreement | |||||||||||||||||
Interest expense, Other | |||||||||||||||||
| Amortization of debt issuance costs | |||||||||||||||||
Total interest expense | $ | $ | $ | ||||||||||||||
Debt Covenants and Default Provisions — The Credit Agreement contains various customary affirmative and negative covenants, including restrictive covenants that place restrictions on us and may limit our ability to, among other things, incur additional debt and liens, repurchase our securities, undertake transactions with affiliates, make other investments, consolidate, merge, sell or otherwise dispose of all or substantially all of our assets, pay dividends or distribute excess cash flow. The Company was in compliance with all debt covenants as of December 29, 2023 and December 30, 2022.
In addition, the Revolving Credit Facility is subject to a first lien secured net leverage ratio of 7.50 to 1.00, tested quarterly commencing with the fiscal quarter ending on or about June 30, 2022, if, and only if, the aggregate principal amount from the Revolving Credit Facility loans, letters of credit (to the extent not cash collateralized or backstopped or, in the aggregate, not in excess of the greater of $10,000 and the stated face amount of letters of credit outstanding on the initial closing date of the Credit Agreement) and swingline loans outstanding and/or issued, as applicable, exceeds 35.0 % of the total amount of the Revolving Credit Facility commitments.
The Company may also be required to make additional payments under the financing agreement equal to a percentage of the Company’s annual excess cash flows or net proceeds from any non-ordinary course asset sales or certain debt issuances, if any. The lender has the option to decline the prepayment. The Company did not incur any expected mandatory excess cash flow payments for the years ended December 29, 2023 or December 30, 2022.
8.Fair Value Measurement
Fair Value of Financial Instruments — The fair values and related carrying values of financial instruments that are not required to be remeasured at fair value on the consolidated statements of operations were as follows:
As of December 29, 2023 | As of December 30, 2022 | ||||||||||||||||||||||
Carrying Amount | Fair Value | Carrying Amount | Fair Value | ||||||||||||||||||||
| Liabilities | |||||||||||||||||||||||
| Term Loan | $ | $ | $ | $ | |||||||||||||||||||
| Incremental Term Loan | $ | $ | $ | $ | |||||||||||||||||||
The fair value of long-term debt was established using current market rates for similar instruments traded in secondary markets representing Level 2 inputs. The fair value of the Revolving Credit Facility approximates carrying value as the related interest rates approximate the Company’s incremental borrowing rate for similar obligations. Additionally, cash and cash equivalents, accounts receivable, net, prepaid expenses, accounts payable, and accrued liabilities are classified as Level 1 and the carrying value of these assets and liabilities approximates the fair value due to the short-term nature of these financial instruments.
Notes Receivable — During the year ended December 30, 2022, the Company acquired Clare, which had an outstanding unsecured loan with the Company. The Company recorded a $5,872 loss on the settlement of the unsecured loan from Clare which is included in selling, general, and administrative expenses on the Company’s consolidated statement of operations. At the acquisition date, the Company settled the notes receivable for $1,400 as part of the transaction. See Note 3 for more information regarding the Clare acquisition.
101
Snap One Holdings Corp. and Subsidiaries
Notes to the Consolidated Financial Statements
(in thousands, except per share amounts)
Assets and Liabilities that are Measured at Fair Value on a Recurring Basis — On October 26, 2022, the Company entered into an interest rate cap agreement, on the LIBOR (subsequently transitioned to SOFR) component of interest. The interest rate cap was effective December 31, 2022. The interest rate cap agreement does not qualify for hedge accounting treatment and, accordingly, the Company records the fair value of the agreements as an asset or liability and the change in fair value as income or expense during the period in which the change occurs. The fair value of the interest rate cap is determined using widely accepted valuation techniques based on its maturity and observable market-based inputs, including interest rate curves. This measurement is considered a Level 2 measurement. The interest rate cap had a fair value of $4,597 as of December 29, 2023 and $2,563 as of December 30, 2022 and is recorded in other liabilities on the Company’s consolidated balance sheet. The change in fair value was recognized as a component of other expense (income), net, in the consolidated statements of operations and was $2,034 and $2,563 of expense for the years ended December 29, 2023 and December 30, 2022, respectively. As there was an other-than-insignificant financing element present at inception of the interest rate cap agreement, proceeds from periodic settlements of the interest rate cap were reflected as a financing activity on the Company’s consolidated statements of cash flows.
The Company utilizes a Monte Carlo simulation in an option pricing framework, where a range of possible scenarios are simulated, to determine the fair value of the CVRs. Any future increase in the fair value of the CVR obligations, based on an increased likelihood that the underlying milestones will be achieved, and the associated payment or payments will therefore become due and payable, will result in a charge to selling, general, and administrative expenses in the period in which the increase is determined. Similarly, any future decrease in the fair value of the CVR obligations will result in a reduction in selling, general, and administrative expenses. CVR liabilities are categorized as other liabilities in the accompanying consolidated balance sheets and are classified as Level 3.
Fair value at December 29, 2023 | Valuation Technique | Unobservable Input | Volatility | ||||||||||||||||||||
| Contingent Value Rights | $ | Monte Carlo | Volatility | ||||||||||||||||||||
Changes in the CVRs for the years ended December 29, 2023, December 30, 2022, and December 31, 2021 were as follows:
CVR fair value – December 25, 2020 | $ | ||||
Fair value adjustments | |||||
CVR fair value – December 31, 2021 | |||||
Fair value adjustments | ( | ||||
CVR fair value – December 30, 2022 | |||||
| ( | |||||
CVR fair value – December 29, 2023 | $ | ||||
There were no transfers into or out of Level 3 during the years ended December 29, 2023 or December 30, 2022.
102
Snap One Holdings Corp. and Subsidiaries
Notes to the Consolidated Financial Statements
(in thousands, except per share amounts)
9.Warranties
Changes in the Company’s accrued warranty liability for the years ended December 29, 2023, December 30, 2022, and December 31, 2021, were as follows:
| Accrued warranty – December 25, 2020 | $ | ||||
| Warranty claims | ( | ||||
| Warranty provisions | |||||
| Accrued warranty – December 31, 2021 | |||||
| Warranty claims | ( | ||||
| Warranty provisions | |||||
| Accrued warranty – December 30, 2022 | |||||
| Warranty claims | ( | ||||
| Warranty provisions | |||||
| Accrued warranty – December 29, 2023 | $ | ||||
The Company has recorded accrued warranty liabilities of $8,776 and $10,682 in accrued liabilities as of December 29, 2023 and December 30, 2022, respectively, and $3,134 and $4,357 in other liabilities as of December 29, 2023 and December 30, 2022, respectively, in the accompanying consolidated balance sheet.
10.Retirement Plan
The Company has a that covers eligible employees as defined by the plan agreement. The Company matches 100 % of employee contributions to the plan, up to 3 % of the employees’ total compensation, and 50 % of employee contributions to the plan, up to 6 % of the employees’ total compensation.
Company contributions to the plan, net of forfeitures, were $5,174 , $5,355 , and $4,471 for the years ended December 29, 2023, December 30, 2022, and December 31, 2021, respectively.
11.Equity Agreements and Incentive Equity Plans
Former Parent Incentive Plan — In October 2017, the Former Parent Entity approved the Class B Unit Incentive Plan (the “2017 Plan”) pursuant to the Company’s partnership agreement (“Partnership Agreement”), which established the terms and provided for grants of certain incentive units to employees, officers, directors, consultants, and advisors of the Former Parent Entity containing service-based and/or market-based vesting criteria. Class B-1 Incentive Units (“B-1 Units”) issued under the 2017 Plan vest in installments over a five-year period, subject to the grantee’s continued employment or service. Class B-2 Incentive Units (“B-2 Units” and collectively with the B-1 Units, “Incentive Units”) issued under the 2017 Plan contain both service conditions consistent with the B-1 Units and market-based vesting conditions that require the achievement of a specified return hurdle to the controlling shareholders in order to vest. The fair value of equity-classified awards is determined on the date of grant and is not remeasured. All B-1 Units and B-2 Units are classified as equity awards. For B-2 Units, the determination of the fair value of these awards takes into consideration the likelihood of achievement of the market condition. Prior to the modification of the Incentive Units in connection with the Company’s IPO on July 27, 2021, the Company recognized $2,605 of compensation expense related to the Incentive Units within selling, general, and administrative expenses in the accompanying consolidated statements of operations during the year ended December 31, 2021. Prior to the IPO, the B-1 and B-2 Units granted and the total grant-date fair value of B-1 Units vested during the year-ended December 31, 2021 were not significant.
2021 Incentive Plan — On July 16, 2021, the Company adopted the 2021 Equity Incentive Plan (the “2021 Plan”) to provide a means through which to attract, retain, and motivate key personnel. Awards available for grant under the 2021 Plan include non-qualified and incentive stock options, restricted shares of our common stock, other equity-based awards tied to the value of our common stock, and cash-based awards.
Equity Award Conversion — During the year ended December 31, 2021, and in connection with the IPO, all outstanding unvested Incentive Units were replaced with newly issued shares of our restricted common stock based on:
103
Snap One Holdings Corp. and Subsidiaries
Notes to the Consolidated Financial Statements
(in thousands, except per share amounts)
•a ratio that takes into account the number of unvested Incentive Units held;
•the applicable distribution threshold applicable to the Incentive Units; and
•the value of distributions that the holder would have been entitled to receive had the Former Parent Entity liquidated on the date of such replacement in accordance with the terms of the distribution “waterfall” set forth in the Partnership Agreement.
Vested Incentive Units were exchanged into shares of our common stock using the same formula as unvested Incentive Units (together, the “Equity Award Conversion”). The Equity Award Conversion resulted in a modification of the Incentive Units for accounting purposes.
B-1 Incentive Unit Modification
The restricted stock awards issued in exchange for unvested B-1 Units were of commensurate value and did not result in any incremental fair value provided to the holders of such awards. The restricted shares of common stock that the holders received in exchange for their unvested B-1 Units are subject to the same vesting terms that applied to the B-1 Units prior to the Equity Award Conversion. The Company will recognize the remaining unrecognized compensation expense prospectively over the requisite service period under the straight-line method.
B-2 Incentive Unit Modification
Prior to the exchange for newly issued restricted stock awards, B-2 Units vested based upon the satisfaction of an explicit service period and a market condition. The restricted stock awards issued to replace B-2 Units vest based upon achievement of one or more of: (i) a total return hurdle, (ii) an average return hurdle, and/or (iii) a volume weighted average price hurdle, which are substantially the same as the previous market-condition vesting criteria of the B-2 Units. Although the restricted stock awards that replace the B-2 Units do not contain an explicit service condition, the vesting is subject to continued employment and will be forfeited if these hurdles, which include both market and performance conditions, are not achieved on or prior to February 4, 2024, resulting in a derived service period. For the majority of B-2 Units, the requisite service period was extended as a result of the modification. The acceleration of compensation expense due to the modification of vesting terms was immaterial.
Awards issued in connection with the 2021 Plan — During the year ended December 31, 2021, the Company, under the 2021 Plan and in connection with the Equity Award Conversion, granted 4,243 options to holders of B-1 Units (“Time-based Options”) and 1,155 options to holders of B-2 Units (“Market-based Options” and collectively with the Time-based Options, “Leverage Replacement Options”). The Leverage Replacement Options have an exercise price equal to the initial public offering price per share of the Company’s common stock and a contractual term of ten years from the initial grant date of the related Incentive Unit. The Time-based Options are subject to the same time-based vesting and the Market-based Options are subject to the same market-condition vesting criteria outlined for the restricted stock awards issued for the Incentive Units. Additionally, recipients of the Leverage Replacement Options received both vested and unvested Leverage Replacement Options in the same proportion as their vested and unvested B-1 and B-2 Units held immediately prior to the IPO and upon the Equity Award Conversion. The Company immediately recognized compensation expense for vested Time-based Options on the grant date as the awards provide value to the holders that is incremental to the value of B-1 Units held prior to the IPO and related modification. There were no vested B-2 Units at the date of the IPO and therefore no immediate expense recognition. In addition to the Leverage Replacement Options, the Company issued additional Time-based Options which vest over three years during the year ended December 31, 2021.
Restricted Stock Awards
In connection with the IPO, the Company issued restricted common stock to holders of unvested B-1 Units and B-2 Units. The grant date fair value of restricted stock awards was determined to be $18.00 per share, based on the initial listing price of the Company’s common stock on the grant date.
104
Snap One Holdings Corp. and Subsidiaries
Notes to the Consolidated Financial Statements
(in thousands, except per share amounts)
The summary of the Company’s restricted stock awards activity as of December 29, 2023 is as follows:
| Restricted Stock Awards | |||||||||||||||||||||||
| B-1 Incentive Units | B-2 Incentive Units | ||||||||||||||||||||||
| Number of Units | Weighted- Average Grant-Date Fair Value | Number of Units | Weighted- Average Grant-Date Fair Value | ||||||||||||||||||||
| Outstanding at December 30, 2022 | $ | $ | |||||||||||||||||||||
| Granted | |||||||||||||||||||||||
| Vested | |||||||||||||||||||||||
| Forfeited | |||||||||||||||||||||||
Outstanding at December 29, 2023 | $ | $ | |||||||||||||||||||||
Stock Options
The Company utilized the Black-Scholes option pricing model to estimate the fair value of the Time-based Options. The Company used a Monte Carlo simulation to estimate the fair value and derived service period of the Market-based Options. Significant assumptions included in these models were the risk-free interest rate, the expected volatility, and the expected dividend yield. Volatility was estimated based on historical volatility of comparable companies. The average expected term for the Market-based Options was derived based on an average of the outcomes of various scenarios performed under the Monte Carlo simulation. The fair values of the stock options were derived using the following key assumptions:
| Time-based Options | Market-based Options | ||||||||||
Expected term | |||||||||||
| Risk-free rate of return | % | ||||||||||
| Expected dividend yield | % | % | |||||||||
| Expected volatility | % | % | |||||||||
105
Snap One Holdings Corp. and Subsidiaries
Notes to the Consolidated Financial Statements
(in thousands, except per share amounts)
The summary of the Company’s option activity as of December 29, 2023 is as follows:
| Time-based Options | Market-based Options | ||||||||||||||||||||||||||||||||||
| Number of Units | Weighted- Average Grant-Date Fair Value | Aggregate Intrinsic Value(a) | Number of Units | Weighted- Average Grant-Date Fair Value | Aggregate Intrinsic Value(a) | ||||||||||||||||||||||||||||||
| Outstanding at December 30, 2022 | $ | $ | $ | $ | |||||||||||||||||||||||||||||||
| Granted | |||||||||||||||||||||||||||||||||||
| Exercised | |||||||||||||||||||||||||||||||||||
| Forfeited | |||||||||||||||||||||||||||||||||||
Outstanding at December 29, 2023 | $ | $ | |||||||||||||||||||||||||||||||||
Options exercisable at December 29, 2023 | $ | $ | $ | $ | |||||||||||||||||||||||||||||||
(a)The intrinsic value represents the amount by which the fair value of the Company’s stock exceeds the option exercise price as of December 29, 2023 and December 30, 2022, respectively.
Restricted Stock Units — The Company awarded restricted stock units (“RSUs”) under the 2021 Plan to its employees and directors. These RSUs are subject to time-based vesting conditions based on the continued service of the RSU holder. RSUs granted typically have an initial annual cliff vest and then vest quarterly over the remaining service period, which is generally to four years . The fair value of RSUs granted is based on the Company’s closing stock price on the date of grant.
The summary of the Company’s RSU activity as of December 29, 2023 is as follows:
| Restricted Stock Units | |||||||||||
| Number of Units | Weighted-Average Grant-Date Fair Value | ||||||||||
| Outstanding at December 30, 2022 | $ | ||||||||||
| Granted | |||||||||||
| Vested | |||||||||||
| Forfeited | |||||||||||
| Outstanding at December 29, 2023 | $ | ||||||||||
The weighted average grant date fair value of the restricted stock units granted during the years ended December 29, 2023, December 30, 2022, and December 31, 2021, was $11.04 , $16.99 , and $18.22 , respectively. The fair value of restricted stock units that vested was $11,147 and $4,012 for the years ended December 29, 2023 and December 30, 2022. No restricted stock units vested during the years ending December 31, 2021. As of December 29, 2023, there were 115 vested and unissued restricted stock units.
Performance Stock Units — During the years ended December 29, 2023 and December 30, 2022, the Company granted performance-based restricted stock units (“PSUs”) to certain employees under the 2021 Plan. The fair value of PSUs granted is based on the Company’s closing stock price on the date of grant. Each PSU grant vests in annual tranches over a three-year service period. Total units earned for grants may vary between 0 % and 200 % of the units granted based on the attainment company-specific targets during the performance period (generally the fiscal year of the date of the grant) and upon continued service. Adjustments to compensation expense are made each period based on changes in our estimate
106
Snap One Holdings Corp. and Subsidiaries
Notes to the Consolidated Financial Statements
(in thousands, except per share amounts)
of the number of PSUs that are probable of vesting. PSUs will vest with continued service and upon achievement of the relevant performance targets.
The awards issued during the year ended December 29, 2023 contain three separate tranches, each for a separate one-year 76.6 %.
The awards issued during the year ended December 30, 2022, vest in annual tranches over a three-year service period, subject to a one-year performance target. Total units earned for grants are based on the attainment of net sales and Company-specific adjusted EBITDA targets during the performance period (the fiscal year of the date of the grant) and upon continued service. For the year-ended December 30, 2022, the Company determined that, based on actual performance with respect to Adjusted EBITDA and Net Sales combined, the awards were earned at 51.0 %.
The summary of the Company’s PSU activity as of December 29, 2023 is as follows:
| Performance Stock Units | |||||||||||
| Number of Units | Weighted-Average Grant-Date Fair Value | ||||||||||
| Outstanding at December 30, 2022 | $ | ||||||||||
| Granted | |||||||||||
| Vested | |||||||||||
| Forfeited | |||||||||||
Performance Adjustment (a) | |||||||||||
| Outstanding at December 29, 2023 | $ | ||||||||||
(a)Performance adjustment represents adjustments in shares outstanding due to the actual achievement of performance based awards, the achievement of which was based upon predefined financial performance targets.
The weighted average grant date fair value of the PSUs granted during the years ended December 29, 2023 and December 30, 2022, was $11.31 and $19.01 , respectively. No PSUs were granted during the year ended December 31, 2021. The fair value of PSUs vested was $2,073 for the year ended December 29, 2023. No 71 vested and unissued performance share units.
Total equity-based compensation expense — Equity-based compensation expense is included within selling, general, and administrative expenses in the accompanying consolidated statements of operations. For all equity-based compensation awards, the Company recognizes forfeitures as they occur. Compensation expense for the years ended
107
Snap One Holdings Corp. and Subsidiaries
Notes to the Consolidated Financial Statements
(in thousands, except per share amounts)
December 29, 2023, December 30, 2022, and December 31, 2021, and unrecognized stock compensation expense and weighted average remaining expense period as of December 29, 2023 consisted of:
| December 29, 2023 | |||||||||||||||||||||||||||||
| December 29, 2023 | December 30, 2022 | December 31, 2021 | Unrecognized compensation expense | Weighted-Average Remaining Contractual Term (Years) | |||||||||||||||||||||||||
| 2017 Plan | |||||||||||||||||||||||||||||
| Incentive units | $ | $ | $ | $ | — | ||||||||||||||||||||||||
| 2021 Plan | |||||||||||||||||||||||||||||
| Restricted stock awards | |||||||||||||||||||||||||||||
| Time-based options | |||||||||||||||||||||||||||||
| Market-based options | |||||||||||||||||||||||||||||
| Restricted stock units | |||||||||||||||||||||||||||||
| Performance stock units | |||||||||||||||||||||||||||||
| Other equity-based compensation | |||||||||||||||||||||||||||||
| Total | $ | $ | $ | $ | |||||||||||||||||||||||||
Employee Stock Purchase Plan — The Company’s Board of Directors (the “Board”) adopted, and its shareholders approved, the Snap One Holdings Corp. 2021 Employee Stock Purchase Plan (the “ESPP”). The ESPP initially reserves 750 shares for issuance. The number of shares available for issuance under the ESPP is subject to adjustment for certain changes in our capitalization. Under the ESPP, shares of common stock may be purchased by eligible participants during defined purchase periods at 85 % of the lesser of the closing price of the Company’s common stock on the first day or last day of each purchase period. The Company used a Black-Scholes option pricing model to value the common stock purchased as part of the Company’s ESPP. The fair value estimated by the option pricing model is affected by the price of the common stock as well as subjective variables that include assumed interest rates, our expected dividend yield, and our expected share volatility over the term of the award.
Offering periods are generally six months long and begin on May 23 and November 23 of each year. For the year ended December 29, 2023, 322 shares of common stock were purchased under ESPP at an average price of $6.49 per share. For the year ended December 30, 2022, 158 shares of common stock were purchased under ESPP at an average price of $6.79 per share. Stock based compensation expense recognized related to the ESPP was $751 for the year ended December 29, 2023 and $438 for the year ended December 30, 2022. As of December 29, 2023 and December 30, 2022, eligible participants contributed $256 and $287 , which is included in accrued liabilities in the accompanying consolidated balance sheet. As of December 29, 2023, unrecognized compensation cost was $315 .
Control4 Equity Awards — In connection with the acquisition of Control4 Corporation (“Control4”) in 2019, the Company agreed to a settlement of Control4 equity awards that were outstanding immediately prior to the acquisition date, consisting of stock options and restricted stock units (collectively “C4 Equity Awards”). As of the acquisition date, 2,998 shares of C4 Equity Awards were cancelled and converted into rights to receive cash payments (“Replacement Awards”). As of December 30, 2022, all Replacement Awards have vested, and the related expense has been recognized. The Company recognized $294 and $4,265 of compensation expense relating to the Replacement Awards within selling, general, and administrative expenses in the accompanying consolidated statements of operations during the years ended December 30, 2022 and December 31, 2021, respectively.
108
Snap One Holdings Corp. and Subsidiaries
Notes to the Consolidated Financial Statements
(in thousands, except per share amounts)
12.Income Taxes
Income (loss) before income taxes, excluding loss for noncontrolling interests, consists of the following:
| December 29, 2023 | December 30, 2022 | December 31, 2021 | |||||||||||||||
| Domestic | $ | ( | $ | ( | $ | ( | |||||||||||
| Foreign | ( | ||||||||||||||||
| Total | $ | ( | $ | ( | $ | ( | |||||||||||
The components of income tax benefit for the years ended December 29, 2023, December 30, 2022, and December 31, 2021, were as follows:
| December 29, 2023 | December 30, 2022 | December 31, 2021 | |||||||||||||||
| Current | |||||||||||||||||
| Federal | $ | $ | $ | ||||||||||||||
| State | |||||||||||||||||
| Foreign | |||||||||||||||||
Total | |||||||||||||||||
| Deferred | |||||||||||||||||
| Federal | ( | ( | ( | ||||||||||||||
| State | ( | ( | ( | ||||||||||||||
| Foreign | ( | ( | |||||||||||||||
| Total | ( | ( | ( | ||||||||||||||
| Income tax benefit | $ | ( | $ | ( | $ | ( | |||||||||||
109
Snap One Holdings Corp. and Subsidiaries
Notes to the Consolidated Financial Statements
(in thousands, except per share amounts)
The tax effects of temporary differences and carryforwards that gave rise to deferred tax assets and liabilities as of December 29, 2023 and December 30, 2022, are as follows:
| December 29, 2023 | December 30, 2022 | ||||||||||
| Deferred Tax Assets | |||||||||||
| Net operating loss | $ | $ | |||||||||
| Interest carryforward | |||||||||||
| Accrued liabilities and reserves | |||||||||||
| Uniform capitalization | |||||||||||
| Capital loss carryforward | |||||||||||
| R&D credits | |||||||||||
| Deferred revenue | |||||||||||
| Depreciable property | |||||||||||
| Stock compensation | |||||||||||
| Section 174 research and expenditures | |||||||||||
| Total deferred tax assets | |||||||||||
| Valuation allowance | ( | ( | |||||||||
| Total deferred tax assets, net of valuation allowance | |||||||||||
| Deferred Tax Liabilities | |||||||||||
| Amortization of intangibles | ( | ( | |||||||||
| Amortization of goodwill | ( | ( | |||||||||
| Transaction Costs | ( | ( | |||||||||
| Other | ( | ( | |||||||||
| Total deferred tax liabilities | ( | ( | |||||||||
| Net deferred tax liabilities | $ | ( | $ | ( | |||||||
The components of the Company’s net deferred tax liabilities as of December 29, 2023 and December 30, 2022, are as follows:
| December 29, 2023 | December 30, 2022 | ||||||||||
| Domestic deferred tax liabilities | $ | ( | $ | ( | |||||||
| Foreign deferred tax liabilities | ( | ( | |||||||||
| Foreign deferred tax assets | |||||||||||
| Net deferred tax liabilities | $ | ( | $ | ( | |||||||
The Company’s deferred tax assets related to net operating losses and credits are shown net of their related unrecognized tax benefit.
Significant judgment is required in determining the Company’s provision for income taxes and recording valuation allowances against deferred tax assets. In evaluating the ability to recover its deferred tax assets, in full or in part, the Company considers all available positive and negative evidence, including past operating results, forecast of future market growth, forecasted earnings, future taxable income, and prudent and feasible tax planning strategies.
The Company determined, based on all the available evidence, that it is uncertain whether certain of its jurisdictions will generate sufficient future taxable income and of the correct character to recognize certain of these deferred tax assets. As a result, the Company’s deferred tax asset for net operating losses, capital loss carryforwards and credits reflect a valuation allowance of $13,705 and $15,554 as of December 29, 2023 and December 30, 2022, respectively.
The Company expects to fully utilize its state net operating loss carryforward balances, with the exception of a portion of the Utah state net operating loss. However, the Company expects a portion of their U.S. federal research and development credits to expire unused in future years along with all of their remaining state research and equipment credits.
110
Snap One Holdings Corp. and Subsidiaries
Notes to the Consolidated Financial Statements
(in thousands, except per share amounts)
A partial valuation allowance has been established for the portion of credits expected to expire unused. The Company will continue to maintain a full valuation allowance against the foreign tax credit carryovers. In 2020, the Company sold the stock of their fully owned subsidiary, Autonomic Controls, Inc., for $1,104 , incurring a capital loss of $35,039 for tax purposes. The Company has determined the capital loss will not be utilized due to insufficient capital gains. A full valuation allowance has been recorded against this asset for both federal and state.
Net operating loss and tax credit carryforwards as of December 29, 2023 are as follows (gross of valuation allowance and uncertain tax positions):
| Amount | Expiration Years | ||||||||||
| Net operating losses, state | $ | 2030-2041 | |||||||||
| Net operating losses, state | $ | Indefinite | |||||||||
| Net operating losses, foreign | $ | 2024-2033 | |||||||||
| Net operating losses, foreign | $ | Indefinite | |||||||||
| Tax credit carryforwards, federal | $ | 2024-2043 | |||||||||
| Tax credit carryforwards, state | $ | 2024-2028 | |||||||||
| Capital loss carryforwards, federal | $ | 2025 | |||||||||
| Capital loss carryforwards, state | $ | 2025 | |||||||||
The Company has performed Section 382 analyses to determine whether it experienced one or more ownership changes, as defined by Section 382, during the analysis period (the acquisition date in 2017 through the IPO effective date in July 2021) as well as other ownership changes. While an annual limitation does exist related to the net operating losses and credits carried forward, the Company does not anticipate that this limitation will cause any net operating losses and credits to expire before their utilization. U.S. Federal net operating losses incurred after 2017 are subject to an 80% limitation on taxable income. The Company does not have any U.S. Federal net operating losses subject to this limitation.
The Company recorded gross unrecognized tax benefit of $1,176 , $591 and $161 during the years ended December 29, 2023, December 30, 2022, and December 31, 2021, respectively. Based on our current assessment of various factors, including (i) the potential outcomes of these ongoing examinations, (ii) the expiration of statute of limitations for specific jurisdictions, (iii) the negotiated settlement of certain disputed issues, and (iv) the administrative practices of applicable taxing jurisdictions, it is reasonably possible that the related unrecognized tax benefits for uncertain tax positions previously taken may decrease by an immaterial amount within the next 12 months. The actual amount of such decrease, if any, will depend on several future developments and events, many of which are outside our control.
Our policy is to reflect interest expense associated with unrecognized tax benefits in income tax expense. We had accrued interest (presented before related tax benefits) of an immaterial amount at December 29, 2023 and none accrued as of December 30, 2022.
111
Snap One Holdings Corp. and Subsidiaries
Notes to the Consolidated Financial Statements
(in thousands, except per share amounts)
Changes in the Company’s unrecognized tax benefits for the years ended December 31, 2021, December 30, 2022 and December 29, 2023, were as follows:
| Balance - December 25, 2020 | $ | ||||
| Additions for tax position of the current year | |||||
| Reduction for tax positions of prior years for: | |||||
| Changes in judgment | ( | ||||
| Lapses of applicable statutes of limitations | ( | ||||
| Balance - December 31, 2021 | |||||
| Additions for tax position of the current year | |||||
| Reduction for tax positions of prior years for: | |||||
| Changes in judgment | |||||
| Lapses of applicable statutes of limitations | ( | ||||
| Balance - December 30, 2022 | |||||
| Additions for tax position of the current year | |||||
| Reduction for tax positions of prior years for: | |||||
| Changes in judgment | |||||
| Lapses of applicable statutes of limitations | ( | ||||
Balance - December 29, 2023 | $ | ||||
The total amount (including both interest and any related federal benefit) of unrecognized tax benefits that, if recognized, would impact the effective income tax rate was $10,023 and $8,847 at December 29, 2023 and December 30, 2022, respectively. The Company files income tax returns in the United States, including various state and local jurisdictions. The Company’s subsidiaries file income tax returns in the United Kingdom, Australia, China, Germany, India, New Zealand, Switzerland, Serbia, and Canada. The Company is subject to federal income tax as well as income tax of multiple state and foreign jurisdictions. The Company is no longer subject to income tax examinations for the following jurisdictions and years: federal, for years before 2020; state and local, for years before 2018; or foreign, for years before 2017. However, federal net operating loss and credit carryforwards from all years are subject to examination and adjustments for at least three years following the year in which the attributes are used.
The Company's position is that its overseas subsidiaries will not invest undistributed earnings indefinitely. Future undistributed earnings are anticipated to be categorized as either GILTI or Sub F distributions. Consequently, any such earnings will be classified as previously taxed income or qualify for a 100% dividends received deduction. If the earnings are repatriated there could be additional taxes which are not considered material. As a result, there is no requirement to record deferred tax liability associated with these undistributed earnings.
112
Snap One Holdings Corp. and Subsidiaries
Notes to the Consolidated Financial Statements
(in thousands, except per share amounts)
The reconciliation of the Company’s effective income tax rate with the statutory rate is as follows:
| December 29, 2023 | December 30, 2022 | December 31, 2021 | |||||||||||||||
| Federal income tax rate | % | % | % | ||||||||||||||
| State income taxes | % | ( | % | % | |||||||||||||
| Foreign income taxes | % | ( | % | ( | % | ||||||||||||
| Deferred rate change | % | ( | % | % | |||||||||||||
| Foreign tax rate differences | ( | % | ( | % | % | ||||||||||||
| Incentive stock compensation | ( | % | ( | % | ( | % | |||||||||||
Cash in lieu of TRA | % | % | ( | % | |||||||||||||
TRA adjustments/amortization | ( | % | ( | % | % | ||||||||||||
| Research and development tax credits | % | % | % | ||||||||||||||
| Valuation allowance | % | ( | % | % | |||||||||||||
| Changes in uncertain tax positions | ( | % | ( | % | ( | % | |||||||||||
| Contingent value rights | % | % | ( | % | |||||||||||||
| Foreign-derived intangible income | % | % | % | ||||||||||||||
| Global intangible low-taxed income | ( | % | ( | % | ( | % | |||||||||||
| Meals and entertainment | ( | % | ( | % | ( | % | |||||||||||
Other items, net (a) | ( | % | ( | % | ( | % | |||||||||||
| Effective income tax rate | % | % | % | ||||||||||||||
(a)Global intangible low-taxed income, contingent value rights, and meals and entertainment were grouped in other items, net for fiscal year 2021 as it was not material to require separate statement. The Company has updated the rate reconciliation for fiscal year 2021 to separately state these items for consistency purposes.
Due to pretax losses in the years ended December 29, 2023, December 30, 2022 and December 31, 2021, the effective rate items listed above with negative signs represent increases to income tax expense and positive amounts represent decreases to income tax expense.
On December 15, 2022, the European Union (EU) Members States formally adopted the EU’s Pillar Two Directive, which generally provided for a minimum effective tax rate of 15%, as established by the Organization for Economic Co-operation and Development (OECD) Pillar Two Framework. The EU effective dates are January 1, 2024, and January 1, 2025 for different aspects of the directive. A significant number of other countries are expected to also implement similar legislation with varying effective dates in the future. The Company is continuing to evaluate the potential impact of future periods of the Pillar Two Framework, pending legislative adoption by additional individual countries.
13.Tax Receivable Agreement
Upon the closing of the IPO, the Company recognized a TRA liability, which represented undiscounted aggregate payments that it expects to pay the TRA Participants under the TRA, with an offset to additional paid-in capital. Subsequent changes in the measurement of the liability are adjusted through the consolidated statement of operations. The TRA liability is an estimate and estimating the amount of payments that may be made under the TRA is by its nature imprecise, insofar as the calculation of amounts payable depends on a variety of factors. The amount and timing of any payments under the TRA will vary depending upon multiple factors, including the amount, character, and timing of the Company’s income. As of December 29, 2023, the Company recognized a total liability of $102,036 , of which $21,107 and $80,929 are recorded within the current and noncurrent financial statement line items, respectively. As of December 30, 2022, the Company recognized a total liability of $111,453 , of which $10,191 and $101,262 were recorded within the current and noncurrent financial statement line items, respectively. For the years ended December 29, 2023, December 30, 2022, and December 31, 2021, the Company recognized measurement adjustments of $775 , $(953 ), and $(275 ), which were recognized in other expense (income) on the consolidated statements of operations. Payments under the TRA began after the filing of the Company’s 2021 federal tax return. The Company made payments, including accrued interest, pursuant to the TRA of $22,089 and $10,468 on January 12, 2024 and February 15, 2023.
113
Snap One Holdings Corp. and Subsidiaries
Notes to the Consolidated Financial Statements
(in thousands, except per share amounts)
During the year-ended December 31, 2021, with respect to certain pre-IPO owners that are not TRA Participants, the Company paid $13,210 with cash on hand for their interests in lieu of their participation in the TRA. The Company paid $10,456 of the cash payments directly and were expensed and paid or accrued in conjunction with the closing of the IPO. The remaining $2,754 of the cash payments to pre-IPO owners are subject to vesting requirements and are held in escrow until vested. The cash payments held in escrow are included in the consolidated balance sheet in prepaid expenses and other assets and are expensed over the requisite service period. As of December 29, 2023 and December 30, 2022, $124 and $1,169 , respectively, are included in prepaid expense and other assets. During the year ended December 29, 2023, $396 of the amount held in escrow was forfeited by a pre-IPO owner and distributed to certain shareholders, resulting in a reduction of the prepaid expense balance and reversal of compensation expense. In total, $642 , $1,116 , and $10,925 was recorded as compensation expense within selling, general, and administrative expenses in the accompanying consolidated statements of operations for the year ended December 29, 2023, December 30, 2022, and December 31, 2021, respectively.
14.Commitments and Contingencies
Legal Proceedings — During the normal course of business, the Company is occasionally involved with various claims and litigation. Reserves are established in connection with such matters when a loss is probable, and the amount of such loss can be reasonably estimated. As of December 29, 2023 and December 30, 2022, no significant reserves were recorded. The determination of probability and the estimation of the actual amount of any such loss are inherently unpredictable, and it is therefore possible that the eventual outcome of such claims and litigation could exceed the estimated reserves, if any. However, the Company does not expect the outcome of the matters currently pending will have a material adverse effect on the consolidated financial statements.
15.Leases
The Company determines if an arrangement is a lease or contains a lease at inception. For all leases with a term longer than 12 months, operating leases are recorded under the noncurrent operating lease asset financial statement line item and the current and noncurrent operating lease liability financial statement line items on the Company’s consolidated balance sheets. The Company has lease agreements with lease and non-lease components, which the Company has elected to account for as a single lease component for all asset classes. Lease expense is recognized on a straight-line basis over the lease term.
ROU assets represent the Company’s right to use an underlying asset for the lease term and lease liabilities represent its obligation to make lease payments arising from the lease. Operating lease ROU assets and liabilities are recognized at commencement date based on the present value of lease payments over the lease term. Since most of the Company’s leases do not provide an implicit rate, the Company uses its own incremental borrowing rate (“IBR”) on a collateralized basis in determining the present value of lease payments. The Company utilizes a market-based approach to estimate the IBR.
The Company’s lease arrangements primarily consist of operating leases for offices, warehouse space, and distribution centers. The leases have remaining lease terms of 1 year to 10 years, some of which include options to extend for up to an additional 5 years, and some of which include options to terminate prior to completion of the contractual lease term with or without penalties. The Company’s lease term only includes periods covered by options if those options are reasonably certain of being exercised (or not reasonably certain of being exercised as it relates to termination options). Variable lease payments that depend on an index or rate (such as the Consumer Price Index or a market interest rate) are included in the measurement of ROU assets and lease liabilities using the index or rate at the commencement date. Variable payments, other than those dependent upon an index or rate, are excluded from the measurement of the ROU assets and lease liabilities and are recognized in the period in which the obligation for those payments is incurred. The variable lease cost primarily represents variable payments related to common area maintenance and utilities. The Company’s leases do not contain any material residual value guarantees.
114
Snap One Holdings Corp. and Subsidiaries
Notes to the Consolidated Financial Statements
(in thousands, except per share amounts)
The components of the Company’s lease costs are:
| December 29, 2023 | December 30, 2022 | ||||||||||
Operating lease cost (a) | $ | $ | |||||||||
| Variable lease cost | |||||||||||
| Short-term lease cost | |||||||||||
| Total lease cost | $ | $ | |||||||||
(a)Included in cost of sales, exclusive of depreciation and amortization, and selling, general, and administrative expenses in the Company’s consolidated statement of operations.
For the year ended December 31, 2021, the Company’s lease cost was $12,325 .
Supplemental cash flow information and non-cash activity related to the Company’s operating leases are as follows:
| December 29, 2023 | December 30, 2022 | ||||||||||
| Cash paid for amounts included in the measurement of lease liabilities | $ | $ | |||||||||
| Non-cash activity: | |||||||||||
| Right-of-use assets obtained in exchange for lease obligations | $ | $ | |||||||||
Weighted-average remaining lease term and discount rate for the Company’s operating leases are as follows:
| December 29, 2023 | December 30, 2022 | ||||||||||
| Weighted-average remaining lease term | |||||||||||
| Weighted-average discount rate | % | % | |||||||||
As of December 29, 2023, future lease payments under non-cancelable lease commitments for the next five fiscal years and thereafter were as follows:
| 2024 | $ | ||||
| 2025 | |||||
| 2026 | |||||
| 2027 | |||||
| 2028 | |||||
| Thereafter | |||||
Total lease payments | |||||
Less: Imputed interest | |||||
| Less: Lease incentive receivable | |||||
Present value of lease liabilities | $ | ||||
As of December 29, 2023, the Company has entered into one additional lease agreement for office space that has not yet commenced. Aggregate lease payments for this lease total $863 on an undiscounted basis.
16.Stockholders’ Equity
Holders of voting common stock are entitled to one vote per share and to receive dividends. There was no
115
Snap One Holdings Corp. and Subsidiaries
Notes to the Consolidated Financial Statements
(in thousands, except per share amounts)
Changes in noncontrolling interests each period include net income attributable to noncontrolling interests and cash contributions by minority partners to the Company’s consolidated subsidiaries. There were no
In July 2021, the Company amended its Amended and Restated Certificate of Incorporation which, among other things, effected a 150 -for-1 stock split of its shares of common stock, increased the par value of its common stock from $0.001 to $0.01 per share, increased the authorized number of shares of its common stock to 500,000 and authorized 50,000 shares of preferred stock. There was no
Share Repurchase Program — On May 12, 2022, the Board authorized a $25,000 share repurchase program. Under the share repurchase program, Snap One may purchase shares of common stock on a discretionary basis from time to time through open market repurchases, privately negotiated transactions, or other means, including through Rule 10b5-1 trading plans or through other techniques such as accelerated share repurchases. The timing and number of shares repurchased will depend on a variety of factors, including stock price, trading volume, and general business and market conditions. The repurchase program was set to expire at the end of 2023, but on November 6, 2023, the Board extended the expiration of the repurchase program until the end of 2024. The repurchase program does not obligate the Company to acquire a specified number of shares and may be modified, suspended, or discontinued at any time at the Boards’ discretion.
Share repurchase activity consists of the following:
| December 29, 2023 | December 30, 2022 | ||||||||||
| Number of shares repurchased | |||||||||||
| Total cost | $ | $ | |||||||||
| Average per share cost including commissions | $ | $ | |||||||||
The Company has elected to retire shares repurchased to date. Shares retired become part of the pool of authorized but unissued shares. The purchase price of the retired shares in excess of par value, including transaction costs, are recorded as a decrease to additional paid-in capital. As of December 29, 2023, there were no share repurchases included in accrued liabilities in the Company’s consolidated balance sheets which had not yet settled. As of December 30, 2022 there were $55 of share repurchases included in accrued liabilities in the Company’s consolidated balance sheets, as these repurchase transactions had not yet settled.
17.Loss Per Share
Basic net loss per share is calculated by dividing net loss attributable to the Company by the weighted-average number of shares of common stock outstanding. Diluted net loss per share adjusts the basic net loss per share and the weighted-average number of shares of common stock outstanding for the potentially dilutive impact of stock awards. The Company had no
The following table presents the calculations of basic and diluted loss per share for the years ended December 29, 2023, December 30, 2022, and December 31, 2021:
| For the Years Ended | |||||||||||||||||
| December 29, 2023 | December 30, 2022 | December 31, 2021 | |||||||||||||||
| Net loss attributable to Company | $ | ( | $ | ( | $ | ( | |||||||||||
| Weighted-average shares outstanding - basic and diluted | |||||||||||||||||
| Loss per share - basic and diluted | $ | ( | $ | ( | $ | ( | |||||||||||
The Company’s restricted stock awards, stock options and restricted stock units were excluded from the computation of diluted net loss per share because their effect would have been anti-dilutive. Awards with performance and market-based vesting conditions are excluded from the calculation of dilutive potential common shares until the conditions have been
116
Snap One Holdings Corp. and Subsidiaries
Notes to the Consolidated Financial Statements
(in thousands, except per share amounts)
satisfied. The following potentially dilutive shares were excluded from the computation of diluted net loss per share attributable to common stockholders:
| December 29, 2023 | December 30, 2022 | December 31, 2021 | |||||||||||||||
| Restricted stock awards | |||||||||||||||||
| Time-based options | |||||||||||||||||
| Market-based options | |||||||||||||||||
| Restricted stock units | |||||||||||||||||
| Performance stock units | |||||||||||||||||
| Other equity-based compensation | |||||||||||||||||
| Total | |||||||||||||||||
18.Related Parties
The Company’s controlling shareholder, H&F, owns an insurance brokerage vendor used by the Company. For the years ended December 30, 2022 and December 31, 2021, the Company incurred $1,114 and $1,874 of expenses from this vendor. During 2022, the Company discontinued the use of vendor as its insurance broker, however the Company’s 401(k) plan continued to use the vendor as it’s Plan Administrator. No fees were billed to the Company directly for the 401(k) plan administration service. Additionally, H&F also has an ownership interest in a human capital management, payroll, HR service, and workforce management vendor used by the Company. For the years ended December 29, 2023, December 30, 2022, and December 31, 2021, the Company incurred $454 , $519 , and $541 of expenses, respectively. These expenses are included in selling, general, and administrative expenses in the accompanying consolidated statements of operations. Amounts owed by the Company in connection with the expenses described above were not material as of December 29, 2023 and December 30, 2022, respectively.
117
Item 9. Changes in and Disagreements with Accountants on Accounting and Financial Disclosures
None.
Item 9A. Controls and Procedures
Evaluation of Disclosure Controls and Procedures
As required by Rule 13a-15(b) under the Exchange Act of 1934 (the “Exchange Act”), our management, including our Chief Executive Officer (“CEO”) and Chief Financial Officer (“CFO”), evaluated the effectiveness of our “disclosure controls and procedures,” as defined in Rule 13a-15(e) of the Exchange Act, as of the end of the period covered by this Annual Report. Based upon that evaluation, our CEO and CFO concluded our disclosure controls and procedures were not effective as of the period covered by this Annual Report due to the material weakness discussed below related to the inability to design or maintain an effective control environment over certain information technology (“IT”) general controls or information systems and applications relevant to the preparation of our consolidated financial statements.
Management’s Report on Internal Control Over Financial Reporting
Management is responsible for establishing and maintaining adequate internal control over financial reporting for the Company. Our internal control over financial reporting is designed to provide reasonable assurance to Management and the Board regarding the reliability of financial reporting and the preparation of financial statements for external purposes in accordance with GAAP and includes policies and procedures that:
•Pertain to the maintenance of records that in reasonable detail accurately and fairly reflect our transactions and the dispositions of our assets;
•Provide reasonable assurance that our transactions are recorded as necessary to permit preparation of financial statements in accordance with GAAP and that our receipts and expenditures are being made only in accordance with appropriate authorizations; and
•Provide reasonable assurance regarding prevention or timely detection of unauthorized acquisition, use or disposition of our assets that could have a material effect on our financial statements.
Because of its inherent limitations, a system of internal control over financial reporting can provide only reasonable assurance and may not prevent or detect misstatements. Further, because of changing conditions, effectiveness of internal control over financial reporting may vary over time.
With the participation of the CEO and the CFO, management conducted an assessment of the effectiveness of our internal control over financial reporting as of the end of the period covered by this Annual Report, at a reasonable assurance level described above. We performed an assessment of the effectiveness of our internal control over financial reporting based on the framework described in Internal Control - Integrated Framework (2013) issued by the Committee of Sponsoring Organizations of the Treadway Commission (“COSO”). Based on this assessment, our CEO and CFO concluded, given the existence of a material weakness described below, that our internal control over financial reporting was not effective as of the end of the period covered by this Annual Report.
A material weakness is a deficiency, or a combination of deficiencies, in internal control over financial reporting such that there is a reasonable possibility that a material misstatement of the registrant’s annual or interim financial statements will not be prevented or detected on a timely basis.
As previously reported in Part II, Item 9A “Controls and Procedures” of our Annual Reports on Form 10-K for the fiscal years ended December 30, 2022 and December 31, 2021, management, with the participation of our CEO and CFO, identified a material weakness in internal control related to ineffective information technology general controls (“ITGCs”) or information systems and applications relevant to the preparation of our consolidated financial statements. Our business process controls (automated and manual) that are dependent on the affected ITGCs were also deemed ineffective because they could have been adversely impacted. We identified a material weakness in internal control related to ineffective ITGCs in the areas where we did not design and maintain (1) program change management controls to ensure that IT program and data changes affecting financial IT applications and underlying accounting records relevant to the preparation of our financial statements are identified, tested, authorized, and implemented appropriately, and (2) access controls to
118
ensure access to programs and data is authorized and entitlements and privileges are recertified on a periodic basis to validate that only authorized individuals have access to Company data. We believe the combination of control deficiencies in this material weakness were a result of: IT control processes lacking sufficient design and documentation, insufficient training as it relates to the execution of ITGCs and insufficient resources to perform rigorous review over data sourced from key systems.
Our independent registered public accounting firm has not performed an evaluation of our internal controls over financial reporting in accordance with SEC rules because no such evaluation is currently, or in the past has been required.
Remediation Plan and Status
We have taken and intend to continue to take actions to remediate the material weakness described above. To remediate this material weakness, we began implementing a remediation plan to improve our internal control over financial reporting and remediate the related control deficiencies. Among other procedures, management has executed the following remedial actions:
•Completed the consolidation of certain key software applications for the Company’s domestic e-commerce transactions and began the migration of legacy Snap One local branches to a new enterprise resource planning (“ERP”) application, providing an opportunity to consolidate and enhance related business process and information technology controls.
•Designed and implemented enhanced change management workflows to strengthen the formalization of change requests, improve quality assurance requirements, and retain review and approval evidence.
•Designed and implemented new software tools and applications to support the monitoring and review of access controls, enhancing management’s review of segregation of duties and restrictive access risks.
•Implemented new control procedures over certain areas previously deemed ineffective related to design and operating effectiveness of both information technology general controls and business process controls.
•Formally enhanced, developed, and implemented policies, procedures, and processes relating to our internal controls over financial reporting, including the testing of a significant number of additional business process and information technology controls.
•Continued hiring of additional accounting, information technology, and internal controls personnel who possess public company accounting, auditing and reporting expertise.
•Continued engagement with outside consultants to advise on changes to the design of controls, procedures, and the implementation of future business processes and information technology systems.
•Enhanced our internal disclosure processes and the frequency and scope of internal governance discussions to provide greater representation across functions to improve opportunities to identify matters requiring controls and disclosures consideration.
In addition to the actions underway, we plan to continue enhancements to our internal controls over financial reporting in 2024. Additional remedial actions include:
•Finalizing enhanced control design and the migration of the remaining Snap One local branches to a newly designed ERP application, resulting in the retirement of four legacy ERP platforms.
•Implementing new control procedures over certain areas previously deemed ineffective related to design and operating effectiveness of change management, segregation of duties, and restricted access controls.
•Expanding the scope and frequency of both design and operating effectiveness testing over key business process and information technology controls.
•Designing and implementing new software and upgrading legacy applications to enhance the related business process and information technology controls.
•Implementing guidelines to establish requirements for documenting our procedures for validating the data sourced from key systems applicable to key business process and information technology controls.
•Determining any additional resources that may be necessary to effectively implement additional review and control procedures.
The actions we are taking are subject to ongoing senior management review, as well as oversight of the audit committee of our Board. We also may conclude that additional measures may be required to remediate the material weaknesses or determine to modify the remediation plans described above. We will not be able to fully remediate this
119
material weakness until these steps have been completed and have been operating effectively. We will continue to monitor the design and effectiveness of these and other processes, procedures, and controls and make any further changes management deems appropriate.
Changes in Internal Control over Financial Reporting
Other than those described above, there were no changes in our internal control over financial reporting during the quarter ended December 29, 2023, that has materially affected, or is reasonably likely to materially affect, our internal control over financial reporting.
Inherent Limitations on Effectiveness of Controls
Our management, including our CEO and CFO, do not expect that our disclosure controls or our internal control over financial reporting will prevent all errors and all fraud. A control system, no matter how well-conceived and operated, can provide only reasonable, not absolute, assurance that its objectives are met. Further, the design of a control system must reflect the fact that there are resource constraints, and the benefits of controls must be considered relative to their costs. Due to the inherent limitations in all control systems, no evaluation of controls can provide absolute assurance that all control issues and instances of fraud, if any, within the Company have been or would be detected. These inherent limitations include the realities that judgments in decision-making can be faulty, and that breakdowns can occur because of a simple error. Additionally, controls can be circumvented by individual acts, collusion of two or more people, or by management override. The design of any system of controls is also based in part upon assumptions regarding the likelihood of future events, and there can be no assurance that any design will succeed in achieving its stated goals under all potential future conditions; over time, controls may become inadequate due to changed conditions, or because the degree of compliance with policies or procedures may deteriorate. Due to the inherent limitations in a cost-effective control system, misstatements due to error or fraud may occur and go undetected.
Item 9B. Other Information
None.
Item 9C. Disclosure Regarding Foreign Jurisdictions that Prevent Inspections
Not applicable.
120
Part III
Item 10. Directors, Executive Officers, and Corporate Governance
All other information required by this Item will be contained in the Proxy Statement relating to our 2024 Annual Meeting of Stockholders, and is incorporated herein by reference. The Proxy Statement will be filed with the Securities and Exchange Commission within 120 days of the fiscal year ended December 29, 2023.
The following individuals currently serve as our Directors and Officers. Additional biographical information will be included in our Proxy Statement.
Independent Directors
•Jacob Best, Partner, Hellman & Friedman, LLC
•Thomas Hendrickson, Director and Audit Committee Chairperson for Ollies Bargain Outlet Holdings, Inc. and Director and Audit Committee Chairperson for O’Reilly Auto Parts
•Annmarie Neal, Partner, Hellman & Friedman, LLC
•Erik Ragatz, Senior Advisor, Hellman & Friedman, LLC
•Adalio Sanchez, President of S Group Advisory, LLC
•Amy Steel Vanden-Eykel, Chief Marketing Officer, Staples, Inc.
•Kenneth Wagers, III, Chief Financial Officer, TTEC Holdings, Inc.
Director and CEO
•John Heyman, Chief Executive Officer, Snap One
Other Executive Officers
•Michael Carlet, Chief Financial Officer, Snap One
•Kathleen Creech, Chief People Officer, Snap One
•Jefferson Dungan, Chief Operating Officer, Snap One
•JD Ellis, Chief Legal Officer, Snap One
•Ryan Marsh, Chief Revenue Officer, Snap One
•GPaul Hess, Chief Product Officer, Snap One
Item 11. Executive Compensation
The information required by this Item will be contained in the Proxy Statement relating to our 2024 Annual Meeting of Stockholders, and is incorporated herein by reference. The Proxy Statement will be filed with the Securities and Exchange Commission within 120 days of the fiscal year ended December 29, 2023.
Item 12. Security Ownership of Certain Beneficial Owners and Management and Related Stockholder Matters
The information required by this Item will be contained in the Proxy Statement relating to our 2024 Annual Meeting of Stockholders, and is incorporated herein by reference. The Proxy Statement will be filed with the Securities and Exchange Commission within 120 days of the fiscal year ended December 29, 2023.
Item 13. Certain Relationships and Related Transactions, and Director Independence
The information required by this Item will be contained in the Proxy Statement relating to our 2024 Annual Meeting of Stockholders, and is incorporated herein by reference. The Proxy Statement will be filed with the Securities and Exchange Commission within 120 days of the fiscal year ended December 29, 2023.
121
Item 14. Principal Accounting Fees and Services
The information required by this Item, aggregate fees billed to us by our principal accountant, Deloitte & Touche, LLP (PCAOB ID No. 34), will be contained in the Proxy Statement relating to our 2024 Annual Meeting of Stockholders, and is incorporated herein by reference. The Proxy Statement will be filed with the Securities and Exchange Commission within 120 days of the fiscal year ended December 29, 2023.
122
Part IV
Item 15. Exhibits and Financial Statement Schedules
(a) Documents filed as part of this Annual Report:
1.Consolidated Financial Statements. We have filed the consolidated financial statements listed in the index to Consolidated Financial Statements, Schedules and Exhibits in Part II, Item 8, of this Annual Report.
2.Financial Statement Schedules and Other. All financial statement schedules have been omitted because they are not applicable, not material or the required information is shown in the consolidated financial statements or the notes thereto.
3.Exhibits. The exhibits listed below are filed or incorporated by reference as part of this Annual Report.
(b) Exhibits:
Exhibit Number | Description | |||||||
| 2.1 | ||||||||
| 3.1 | ||||||||
| 3.2 | ||||||||
| 4.1 | ||||||||
| 4.2 | ||||||||
| 10.1 | ||||||||
| 10.2+ | ||||||||
| 10.3+ | ||||||||
| 10.4+ | ||||||||
123
| 10.5+ | ||||||||
| 10.6+ | ||||||||
| 10.7+ | ||||||||
| 10.8+ | ||||||||
10.9+ | ||||||||
10.10+ | ||||||||
10.11+ | ||||||||
10.12+ | ||||||||
10.13+ | ||||||||
| 10.14 | ||||||||
10.15+ | ||||||||
10.16+ | ||||||||
| 10.17 | ||||||||
10.18+ | ||||||||
10.19+ | ||||||||
124
| 10.20 | ||||||||
| 10.21 | ||||||||
| 10.22 | ||||||||
| 21.1* | ||||||||
| 23.1* | ||||||||
| 31.1* | ||||||||
| 31.2* | ||||||||
| 32.1** | ||||||||
| 32.2** | ||||||||
97* | ||||||||
| 101 | The following financial information from Snap One Holdings Corp.’s Annual Report on Form 10-K for the year ended December 29, 2023 formatted in Inline XBRL (Extensible Business Reporting Language) includes: (i) the Consolidated Balance Sheets, (ii) the Consolidated Statements of Operations, (iii) the Consolidated Statements of Comprehensive Loss, (iv) the Consolidated Statements of Changes in Stockholders Equity, (v) the Consolidated Statements of Cash Flows, and (vi) Notes to the Consolidated Financial Statements. | |||||||
| 104 | Cover Page Interactive Data File (formatted as Inline XBRL and contained in Exhibit 101). | |||||||
+ Indicates a management contract or compensatory plan or arrangement.
* Filed herewith.
** Furnished herewith. The certifications attached as Exhibit 32.1 and 32.2 that accompany this Annual Report are deemed furnished and not filed with the Securities and Exchange Commission and are not to be incorporated by reference into any filing of Snap One Holdings Corp. under the Securities Act of 1933, as amended, or the Securities Exchange Act of 1934, as amended, whether made before or after the date of this Annual Report, irrespective of any general incorporation language contained in such filing.
Item 16. Form 10-K Summary
None.
125
SIGNATURES
Pursuant to the requirements of Section 13 or 15(d) of the Securities Exchange Act of 1934, the registrant has duly caused this Annual Report to be signed on its behalf by the undersigned, thereunto duly authorized.
| Snap One Holdings Corp. | ||||||||
| March 7, 2024 | By: | /s/ John Heyman | ||||||
| Name: John Heyman | ||||||||
| Title: Chief Executive Officer | ||||||||
126
Pursuant to the requirements of the Securities Exchange Act of 1934, the registrant has duly caused this Annual Report to be signed on its behalf by the undersigned thereunto duly authorized.
| Signature | Title | Date | |||||||||
/s/ John Heyman | |||||||||||
| Name: John Heyman | Chief Executive Officer, Director (Principal Executive Officer) | March 7, 2024 | |||||||||
/s/ Michael Carlet | |||||||||||
| Name: Michael Carlet | Chief Financial Officer (Principal Financial and Accounting Officer) | March 7, 2024 | |||||||||
/s/ Erik Ragatz | |||||||||||
| Name: Erik Ragatz | Chairman of the Board | March 7, 2024 | |||||||||
/s/ Jacob Best | |||||||||||
| Name: Jacob Best | Director | March 7, 2024 | |||||||||
/s/ Tom Hendrickson | |||||||||||
| Name: Tom Hendrickson | Director | March 7, 2024 | |||||||||
/s/ Annmarie Neal | |||||||||||
| Name: Annmarie Neal | Director | March 7, 2024 | |||||||||
/s/ Adalio Sanchez | |||||||||||
| Name: Adalio Sanchez | Director | March 7, 2024 | |||||||||
/s/ Amy Steel Vanden-Eykel | |||||||||||
Name: Amy Steel Vanden-Eykel | Director | March 7, 2024 | |||||||||
/s/ Kenny Wagers | |||||||||||
Name: Kenny Wagers | Director | March 7, 2024 | |||||||||
127