UNITED STATES
SECURITIES AND EXCHANGE COMMISSION
Washington, D.C. 20549
FORM
(Mark One)
For the fiscal year ended
OR
FOR THE TRANSITION PERIOD FROM TO
Commission File Number
(Exact name of registrant as specified in its charter)
|
||
(State or other jurisdiction of incorporation or organization) |
|
(I.R.S. Employer |
|
|
|
|
||
(Address of principal executive offices) |
|
(Zip Code) |
Registrant’s telephone number, including area code: (
Securities registered pursuant to Section 12(b) of the Act:
|
|
|
Title of each class |
Trading Symbol(s) |
Name of each exchange on which registered |
(Nasdaq Global Select Market) |
Securities registered pursuant to Section 12(g) of the Act: None
Indicate by check mark if the registrant is a well-known seasoned issuer, as defined in Rule 405 of the Securities Act. YES
Indicate by check mark if the registrant is not required to file reports pursuant to Section 13 or Section 15(d) of the Act. YES
Indicate by check mark whether the registrant: (1) has filed all reports required to be filed by Section 13 or 15(d) of the Securities Exchange Act of 1934 during the preceding 12 months (or for such shorter period that the registrant was required to file such reports), and (2) has been subject to such filing requirements for the past 90 days.
Indicate by check mark whether the registrant has submitted electronically every Interactive Data File required to be submitted pursuant to Rule 405 of Regulation S-T (§232.405 of this chapter) during the preceding 12 months (or for such shorter period that the registrant was required to submit such files).
Indicate by check mark whether the registrant is a large accelerated filer, an accelerated filer, a non-accelerated filer, a smaller reporting company or an emerging growth company. See the definitions of “large accelerated filer,” “accelerated filer,” “smaller reporting company” and “emerging growth company” in Rule 12b-2 of the Exchange Act.
|
|
|
|
|
|
|
Large accelerated filer |
|
☐ |
|
|
|
|
|
|
|
|
|
|
|
Non-accelerated filer |
|
☐ |
|
Smaller reporting company |
|
|
|
|
|
|
|
|
|
Emerging growth company |
|
|
|
|
|
If an emerging growth company, indicate by check mark if the registrant has elected not to use the extended transition period for complying with any new or revised financial accounting standards provided pursuant to Section 13(a) of the Exchange Act:
Indicate by check mark whether the registrant has filed a report on and attestation to its management’s assessment of the effectiveness of its internal control over financial reporting under Section 404(b) of the Sarbanes-Oxley Act (15 U.S.C. 7262(b)) by the registered public accounting firm that prepared or issued its audit report.
If securities are registered pursuant to Section 12(b) of the Act, indicate by check mark whether the financial statements of the registrant included in the filing reflect the correction of an error to previously issued financial statements.
Indicate by check mark whether any of those error corrections are restatements that required a recovery analysis of incentive-based compensation received by any of the registrant’s executive officers during the relevant recovery period pursuant to §240.10D-1(b).
Indicate by check mark whether the registrant is a shell company (as defined in Rule 12b-2 of the Act). YES ☐ NO
As of July 29, 2023, the last business day of the registrant’s most recently completed second fiscal quarter, the aggregate market value of the voting and non-voting common equity held by non-affiliates of the registrant, based on the closing price of the shares of the registrant's common stock on The Nasdaq
Global Select Market on such date, was approximately $
The number of shares of the registrant’s common stock outstanding as of March 22, 2024 was
DOCUMENTS INCORPORATED BY REFERENCE
Portions of the registrant’s Definitive Proxy Statement relating to the 2024 Annual Meeting of Stockholders, which will be filed with the Securities and Exchange Commission within 120 days after the end of the registrant’s 2023 fiscal year ended February 3, 2024, are incorporated by reference into Part III of this Annual Report on Form 10-K.
Table of Contents
iii
References throughout this document to “Sportsman’s Warehouse,” “we,” “us,” and “our” refer to Sportsman’s Warehouse Holdings, Inc. and its subsidiaries, and references to “Holdings” refer to Sportsman’s Warehouse Holdings, Inc. excluding its subsidiaries. References to (i) “fiscal year 2023” refer to our fiscal year ended February 3, 2024; (ii) “fiscal year 2022” refer to our fiscal year ended January 28, 2023; and (iii) “fiscal year 2021” refer to our fiscal year ended January 29, 2022.
SPECIAL NOTE REGARDING FORWARD-LOOKING STATEMENTS
This Annual Report on Form 10-K (this “10-K”) contains statements that constitute forward-looking statements as that term is defined by the Private Securities Litigation Reform Act of 1995. These statements concern our business, operations and financial performance and condition as well as our plans, objectives and expectations for our business operations and financial performance and condition, which are subject to risks and uncertainties. All statements other than statements of historical fact included in this 10-K are forward-looking statements. These statements may include words such as “aim,” “anticipate,” “assume,” “believe,” “can have,” “could,” “due,” “estimate,” “expect,” “goal,” “intend,” “likely,” “may,” “objective,” “plan,” “positioned,” “potential,” “predict,” “should,” “target,” “will,” “would” and other words and terms of similar meaning in connection with any discussion of the timing or nature of future operating or financial performance or other events or trends. For example, all statements we make relating to our plans and objectives for future operations, growth or initiatives and strategies are forward-looking statements.
These forward-looking statements are based on current expectations, estimates, forecasts and projections about our business and the industry in which we operate and our management’s beliefs and assumptions. We derive many of our forward-looking statements from our own operating budgets and forecasts, which are based upon many detailed assumptions. While we believe that our assumptions are reasonable, we caution that predicting the impact of known factors is very difficult, and we cannot anticipate all factors that could affect our actual results.
All of our forward-looking statements are subject to risks and uncertainties that may cause our actual results to differ materially from our expectations. Important factors that could cause actual results to differ materially from our expectations include, but are not limited to:
The above is not a complete list of factors or events that could cause actual results to differ from our expectations, and we cannot predict all of them. All written and oral forward-looking statements attributable to us, or persons acting on our behalf, are expressly qualified in their entirety by the cautionary statements disclosed under “Part I, Item 1A., Risk Factors,” “Part II, Item 7, Management’s Discussion and Analysis of Financial Condition and
iv
Results of Operations” and elsewhere in this 10-K, as such disclosures may be amended, supplemented or superseded from time to time by other reports we file with the Securities and Exchange Commission (the “SEC”), including subsequent Annual Reports on Form 10-K and Quarterly Reports on Form 10-Q, and public communications. You should evaluate all forward-looking statements made in this 10-K and otherwise in the context of these risks and uncertainties.
Potential investors and other readers are urged to consider these factors carefully in evaluating the forward-looking statements and are cautioned not to place undue reliance on any forward-looking statements we make. These forward-looking statements speak only as of the date of this 10-K and are not guarantees of future performance or developments and involve known and unknown risks, uncertainties and other factors that in many cases are beyond our control. Except as required by law, we undertake no obligation to update or revise any forward-looking statements publicly, whether as a result of new information, future developments or otherwise.
v
PART I
ITEM 1. BUSINESS
Overview
Sportsman’s Warehouse is an outdoor sporting goods retailer focused on meeting the everyday needs of the seasoned outdoor veteran, the first-time participant and everyone in between. Our mission is to provide outstanding gear and exceptional service to inspire outdoor memories. We strive to accomplish this goal by tailoring our broad and deep merchandise assortment to meet local conditions and demand, offering everyday low prices and providing friendly support from our knowledgeable and highly trained staff. We also offer a top-tier e-commerce experience, extensive in-store events and educational programming. These core strategies help position Sportsman’s Warehouse as the “local outdoor experts” and the preferred place to not only shop, but to also share outdoor-based experiences in the communities we support and serve. As a result, we are growing our loyal customer base in existing markets, expanding our footprint into new markets, and increasing our omni-channel presence in both new and existing markets, which we believe will further drive our growth and profitability.
Sportsman’s Warehouse was founded in 1986 as a single retail store in Midvale, Utah and has grown to 146 stores across 32 states. Today, we have the largest outdoor specialty store base in the Western United States and Alaska. Our stores range from 7,500 to 75,000 gross square feet, with an average size of approximately 37,000 gross square feet. Our store layout is adaptable to both standalone locations and strip centers. We believe it is less capital-intensive for us to open new stores compared to our principal competitors because our value engineered store layout requires lower initial cash investments to build out and our stores generally require less square footage than the stores of our large retail competitors. We also have the largest assortment and offering of firearms available online for in-store purchase and buy-online-pickup-in-store when compared to the offerings of our major competitors. Together, these features and capabilities enable us to effectively serve markets of multiple sizes, from Metropolitan Statistical Areas (“MSAs”) with populations of less than 35,000 to major metropolitan areas with populations in excess of 1,000,000, while generating consistent four-wall adjusted earnings before interest, taxes, depreciation and amortization (“Adjusted EBITDA”), margins and returns on invested capital across a range of store sales volumes. For a reconciliation of Adjusted EBITDA to net income, the most directly comparable financial measure calculated in accordance with GAAP, see “Part II, Item 7, Management’s Discussion and Analysis of Financial Condition and Results of Operations—Non-GAAP Financial Measures.”
Our Competitive Strengths
We believe the following competitive strengths allow us to capitalize on the growth opportunity within the outdoor activities and sporting goods market:
Differentiated Shopping Experience for the Seasoned Outdoor Veteran, the First-Time Participant and Everyone in Between. We place great emphasis on creating an inviting and engaging store experience for customers of all experience levels. For the seasoned outdoor veteran, we offer a one-stop, convenient store layout that promotes “easy-in, easy-out” access to replenish supplies, learn about local conditions and test products. We also serve first-time participants and casual users who are interested in enjoying the outdoors but enter our store without a clear sense for the equipment needed for their chosen activity. Our highly trained employees, who often are local outdoor enthusiasts and users of the products we sell, engage and interact with our customers in order to educate them and equip them with the right gear. Our sales associates draw upon formal vendor sales training as well as first-hand experiences from using our products in local conditions. This selling approach allows us to offer a broad range of products and to deliver a shopping experience centered on the customer’s needs, which we believe results in increased customer loyalty, repeat visits and frequent referrals to other potential customers.
A customer’s shopping experience in our stores is further enhanced by a variety of helpful in-store and online offerings and features, including the use of technology to provide fishing reports and social media sharing with local market information for customers, access to hunting and fishing licenses, indoor test ranges for archery equipment and displays of customer-owned taxidermy. In addition, we host a variety of in-store programs (such as ladies’ nights and local events), contests (such as free-to-enter big-game trophy contests), thousands of educational seminars (such as turkey frying and firearm operation and safety). These programs are all designed to help our
6
customers connect with the outdoors and build the skills necessary to maximize enjoyment of their chosen activities. As a result, we believe our stores often serve as gathering spots where local enthusiasts can share stories, product knowledge and advice on outdoor recreation activities, which drives traffic and fosters customer loyalty.
Our in-store experience is further complimented by our top-tier e-commerce experience available on our website, sportsmans.com. We also offer the ability for our customers to buy our product on-line and pick up their order in any of our stores.
Comprehensive Locally Relevant Merchandise Serving the Needs of Outdoor Enthusiasts at a Compelling Value. We offer our customers an extensive and carefully selected assortment of branded, high-quality outdoor products at competitive prices. We accomplish this primarily in three ways:
Flexible and Adaptable Real Estate Strategy. We believe that our store model, combined with our rigorous site selection process, is a competitive advantage that enables us to better address the needs of markets of varying sizes and geographies. Our stores vary in size from approximately 7,500 to 75,000 gross square feet. We have had success with leasing existing sites, constructing new build-to-suit sites and purchasing existing stores and converting them to the Sportsman’s Warehouse brand. Our flexible store model permits us to serve both large metropolitan areas, like Phoenix, Arizona, and smaller MSAs, like Soldotna, Alaska, while generating consistent four-wall Adjusted EBITDA margins and returns on invested capital across a range of store sales volumes. In small- to medium-sized markets, we are often able to establish ourselves as a standalone destination for our customers; in larger markets, we have successfully leveraged existing infrastructure to open stores in shopping plazas near complementary retailers, drawing upon existing foot traffic. We believe our low-cost, flexible model allows us to access both large and small markets more economically than many of our peers.
We maintain a disciplined approach to new store development and perform comprehensive market research before selecting a new site, including partnering with specialized, third-party local real estate firms. We select sites using technology to create models and evaluate thousands of data points, including criteria such as local demographics, traffic patterns, density of hunting and fishing license holders in the area, abundance of hunting and fishing game and outdoor recreation activities, store visibility and accessibility, purchase data from our existing customer database and availability of attractive lease terms. We have established productive relationships with well-regarded commercial real estate firms and believe that we are a sought-after tenant, given the strength of the Sportsman’s
7
Warehouse brand, the high volume of customers that visit our stores and our strong financial performance since becoming a public company. As a result, we continue to have access to desirable retail sites on attractive terms.
Low Cost Operating Structure with Attractive and Replicable Store Economics. We strive to maintain a lower operating cost structure than many of our key competitors, which allows us to serve small- to medium-sized markets as well as larger MSAs. We achieve this through discipline and financial rigor around store-level expenses, real estate costs and corporate overhead. In addition, we utilize efficient, localized marketing campaigns and our “no frills” warehouse store layout helps us maintain comparatively low operating costs and provides us with the opportunity to achieve four-wall Adjusted EBITDA margins of 10% or more for stores in most new markets after the first 24 month period after opening the new store. Our typical new store requires an average net investment of approximately $2.9 million, consisting of capital investments, net of tenant allowances. In addition, we stock each new store with initial inventory at an average cost of approximately $1.8 million. We target a pre-tax return on invested capital after the first 24 month period after opening of over 40% excluding initial inventory cost (or over 20% including initial inventory cost). We do not currently plan to open new stores in fiscal year 2024 and we are currently evaluating our short-term strategy related to opening new stores. As of the end of fiscal year 2023, the majority of our stores that had been open for more than twelve months were profitable and those stores had an average four-wall Adjusted EBITDA margin of 9.9%. We believe this low-cost, capital-efficient approach also allows us to successfully serve markets that are not well-suited for the more capital-intensive store models of our key competitors. Approximately 63% of our markets currently lack another nationally recognized outdoor specialty retailer, which we believe is a result of these dynamics.
Significant New Store Growth Opportunity within Existing and New Markets. As of February 3, 2024, we operated 146 stores across 32 states, primarily in the Western United States and Alaska. We believe our leadership position in the Western United States and our continued expansion in other geographical regions of the United States, combined with our existing scalable infrastructure, provides a strong foundation for continued expansion within our core markets as well as expanding into new geographies. We believe that we are the largest, fastest growing public, pure-play outdoor specialty retailer in our space.
Passionate and Experienced Management Team with Proven Track Record. We are focused on delivering an unsurpassed shopping experience to anyone who enjoys the excitement of the outdoors. This passion and commitment is shared by team members throughout our entire organization, from senior management to the employees in our stores. Our senior management team has an average of over 20 years of retail experience, with extensive capabilities across a broad range of disciplines, including merchandising, real estate, finance, compliance, store operations, supply chain management and information technology.
Our Growth Strategy
We are pursuing a number of strategies designed to continue our growth and strong financial performance, including the following:
Leveraging Our Omni-Channel Presence and Increasing Our Same Store Sales Growth. We are committed to leveraging our omni-channel presence and increasing same store sales through a number of ongoing and new initiatives, including (i) improving the user experience on our website through continuous category optimization and personalization and product recommendations for online shopping, (ii) growing our consumer databases and leveraging them to drive revenue and the long term value of our customers, (iii) expanding our product assortment and SKU count online (with the assistance of our vendor partners through drop ship and our Federal Firearms License (“FFL”) dealer partners), refining our buy online, pick-up in store capabilities, expanding our apparel, footwear, and camping offerings and private label program (such as our proprietary Rustic Ridge™ and Killik™ apparel lines) and (iv) expanding our online content and expertise through live Q&A, product reviews, user-generated imagery, and providing exclusive online informational and education content, including news, buyer’s guide and how to’s, accessory finders, and wild game recipes. Each of these ongoing and new initiatives is designed to foster additional shopping convenience, add deeper merchandise selection and provide more engaging product information to the customer. We believe these initiatives have driven and will continue to drive additional traffic, improved conversion and increased average ticket value.
8
Continuing to Enhance Our Operating Margins. We believe our store base allows us to take advantage of economies of scale in product sourcing and leverage our existing infrastructure, supply chain, corporate overhead and other fixed costs. Furthermore, we expect to increase our gross profit margin by improving vendor terms with key suppliers, increasing sales of used firearms, selling more firearm service plans, expanding product offerings in our private label program, including our proprietary Rustic RidgeTM and KillikTM apparel lines, and continuing marketing initiatives in our higher-margin apparel and footwear departments.
Growing the Sportsman’s Warehouse Brands. We are committed to supporting our stores, product offerings and brand through a variety of marketing programs, private label offerings and corporate partnerships. Our marketing and promotional strategy includes coordinated print, digital and social media platforms. In-store, we offer a wide range of outdoor-themed activities and seminars, from turkey frying to firearm operation and safety. In addition, we sponsor community outreach and charity programs to more broadly connect with our local communities with the aim of promoting our brand and educating consumers. Finally, we are committed to local chapters of national and regional wildlife federations and other outdoor-focused organizations, such as Ducks Unlimited and the Rocky Mountain Elk Foundation. We believe all of these programs promote our mission of engaging with our customers and serving outdoor enthusiasts.
Growing our Loyalty and Credit Card Programs. We offer both a loyalty program and co-branded credit card program to our customers. These programs allow our customers to earn points that can be redeemed for in-store credit through purchases at Sportsman’s Warehouse stores and through the use of the co-branded credit card for all daily purchases. We believe these benefits are key in helping us obtain and retain new customers. We plan to continue to invest in the marketing of these programs, in particular at the point-of-sale.
Expanding Our Store Base. Over the last three fiscal years, we have opened an average of 11 stores per year. We do not plan to open any new stores in fiscal year 2024 as we re-evaluate our short-term growth strategy. Our current longer-term plans will continue to include expanding our store base to serve the outdoor needs of enthusiasts in markets across the United States. We believe our existing infrastructure, including distribution, omni-channel capabilities, information technology, loss prevention and employee training, is capable of sustaining our current growth plans without significant additional capital investment, although we may determine to invest in our existing infrastructure to prepare for future growth.
Strategic Acquisitions. While our primary long-term strategy for expansion is through organic store opening, we believe we can use strategic acquisitions as an additional source of growth, as we did with the 12 stores we acquired from Dick’s Sporting Goods in fiscal 2019 and 2020. We target acquisitions that will be accretive to our margins and profitability, provide content, private label expansion, or capabilities that would deliver efficiencies in operations and customer acquisition retention. We have a proven track record of successfully executing around strategic acquisitions and will continue to look for complementary targets.
Our Stores
We operate 146 stores across 32 states as of February 3, 2024. Most of our stores are located in power, neighborhood and lifestyle centers. Power centers are large, unenclosed shopping centers that are usually anchored by three or more national supercenters, such as Target, Walmart and Costco. Neighborhood centers are shopping centers anchored by a supermarket or drugstore that provide convenience goods and services to a neighborhood. Lifestyle centers are shopping centers that combine the traditional functions of a shopping mall with leisure amenities such as pedestrian friendly areas, open air seating and inviting meeting spaces. We also operate several single-unit, stand-alone locations. Our stores average approximately 37,000 gross square feet.
9
The following table lists the location by state of our 146 stores open as of February 3, 2024:
|
Number of Stores |
|
|
Number of Stores |
California |
17 |
|
New Mexico |
3 |
Washington |
14 |
|
North Carolina |
3 |
Utah |
12 |
|
South Carolina |
3 |
Arizona |
10 |
|
Kentucky |
2 |
Colorado |
9 |
|
New York |
2 |
Oregon |
8 |
|
Tennessee |
2 |
Pennsylvania |
7 |
|
West Virginia |
2 |
Wyoming |
7 |
|
Wisconsin |
2 |
Florida |
6 |
|
Arkansas |
1 |
Idaho |
6 |
|
Iowa |
1 |
Alaska |
5 |
|
Louisiana |
1 |
Michigan |
4 |
|
Minnesota |
1 |
Nevada |
4 |
|
Mississippi |
1 |
Virginia |
4 |
|
Nebraska |
1 |
Indiana |
3 |
|
North Dakota |
1 |
Montana |
3 |
|
Ohio |
1 |
Store Design and Layout
We present our broad and deep array of products in a convenient and engaging atmosphere to meet the everyday needs of all outdoor enthusiasts, from the seasoned veteran to the first-time participant. We maintain a consistent floor layout across our store base that we believe promotes an “easy-in, easy-out” shopping experience. All of our stores feature wide aisles, high ceilings, visible signage and central checkouts with multiple registers. Sportsman’s Warehouse stores, true to their name, are designed in a value engineered warehouse format that welcomes customers directly from or on the way to an outdoor activity. All of our stores also feature “store-within-a-store” concepts for certain popular brand partners, such as Huk, Ariat, Carhartt, Sitka, Costa, Leupold, Vortex Optics, Yeti and Christensen Arms, through which we dedicate a portion of our floor space to these brands to help increase visibility and drive additional sales.
Our stores include locally relevant features such as a large fishing board at the entrance that displays current fishing conditions in local lakes and rivers with coordinating gear in end-cap displays in the fishing aisles. We actively engage our customers through in-store features (such as sharing local fishing reports), various contests (such as free-to-enter fishing and hunting contests), and customer-owned taxidermy displays on the walls. We also host in-store programs (such as ladies’ night and local events) and a wide range of educational seminars (such as Dutch oven cooking and choosing the right binocular). Annually, we organize thousands of educational programs across our stores for the benefit of our customers. We believe these programs help us to connect with the communities in which we operate and encourage new participants to build the skills necessary to become outdoor enthusiasts and loyal customers.
In 2021, we started making a commitment to refurbishing our older stores, with 31 stores refurbished to date. Our goal is to keep these stores fresh with updated lifestyle type graphics, improving the flow of our merchandise and store to our customer, enhance our technological capabilities within the stores to ensure we are meeting the needs of every customer, and make the stores more energy efficient. We do not currently have any store refurbishments planned for fiscal year 2024.
The retail stores and the distribution center have loss prevention employees who monitor approximately 50 cameras at each store and 250 cameras at the distribution center. These cameras are observed locally and centrally at our headquarters in our dedicated surveillance room. Our sophisticated systems are a key factor in our shrink rates of less than 1.5% and an important component of our comprehensive compliance program.
10
Expansion Opportunities and Site Selection
We have developed a rigorous and flexible process for site selection. We select sites for new store openings or store acquisitions based on criteria such as local demographics, traffic patterns, density of hunting and fishing license holders in the area, abundance of hunting and fishing game and outdoor recreation activities, store visibility and accessibility, purchase data from our existing customer database and availability of attractive lease terms. Our store model is adaptable to markets of multiple sizes, from MSAs with populations of less than 75,000 to major metropolitan areas with populations in excess of 1,000,000. We have been successful both in remodeling existing buildings and in constructing new build-to-suit locations.
Our store model is designed to be profitable in a variety of real estate venues, including power, neighborhood and lifestyle centers as well as single-unit, stand-alone locations. In small- to medium-sized markets, we generally seek anchor locations within high-traffic, easily accessible shopping centers. In larger metropolitan areas, we generally seek locations in retail areas with major discount retailers (such as Walmart), wholesale retailers (such as Costco), other specialty hardline retailers (such as The Home Depot) or supermarkets. As we continue to expand our store base, we believe that small- to medium-sized markets offer a significant opportunity. In these markets, we believe our store size, which is smaller than many of our national competitors, but larger than many independent retailers, enables us to find convenient, easily accessible store locations while still offering the broad and deep selection of merchandise that our customers desire. In addition, our store format and size allow us to open multiple stores within major MSAs, which gives our customers convenient, easy access to our products without having to travel long distances.
Members of our real estate team spend considerable time and utilize sophisticated tools in evaluating prospective sites before bringing a proposal to our Real Estate Committee. Our Real Estate Committee, which is comprised of members of our senior management, including our Chief Executive Officer, Chief Financial Officer, and Chief Retail Officer, approves all prospective locations before a lease is signed.
Our typical store location ranges in size from 7,500 to 75,000 gross square feet. Our net investment to open a new store is approximately $2.9 million, consisting of capital investments, net of tenant allowances. In addition, we stock each new store with initial inventory at an average cost of approximately $1.8 million. After the first 24 month period after opening a new store, we typically have a four-wall Adjusted EBITDA margin of more than 10% and a pre-tax return on invested capital of over 40% excluding initial inventory cost (or over 20% including initial inventory cost). We do not plan to open any stores in fiscal year 2024 and are currently evaluating our short-term strategy related to opening new stores.
Omni-Channel Strategy
We believe our website is an extension of our brand and our retail stores. Our website, www.sportsmans.com, serves as both a sales channel and a platform for marketing and product education, which allows us to engage more fully with the outdoor community across all of our localities. In addition to offering similar merchandise found in our retail stores, our website offers a substantial amount of additional assortment. Regulatory restrictions create certain structural barriers to the online sale of a portion of our revenue, such as firearms, ammunition, certain cutlery, propane and reloading powder. As a result, this portion of our business is currently more protected from competition from online-only retailers.
We also provide our online customers with convenient omni-channel services. To ensure that our customers have access to our entire assortment of products available on the e-commerce website, our retail stores feature kiosks that allow customers to place orders for items that are available only on our website, out of stock or not regularly stocked. We view our kiosk offering as an important complement to our larger format stores, as well as a key differentiator and extension of our smaller format stores. Our in-store pickup offering allows customers to order products through our e-commerce website and pick up the products in our retail stores without incurring shipping costs. We believe our ship-to-store is a valuable service offering to customers, as well as a means to generate additional foot traffic to our retail stores. We also have the ability to ship-from-store to fulfill customer orders. This feature has allowed us to turn all of our retail stores into distribution centers, decreasing the time it takes to fulfill orders, and increasing our ability to leverage our inventory across our Company.
11
In addition, our website features local-area content, including fishing reports and event schedules, as well as online educational resources, including buyer’s guides, how to’s, tips, advice and links to video demonstrations on our dedicated YouTube channel. We are also highly engaged with hundreds of thousands of social media followers on our Facebook and Instagram pages. These platforms allow us to reach our customers more directly with targeted postings of advertisements and in-store events. We leverage technology that aggregates customer location, browsing behavior and purchase history to present a personalized shopping experience. We gather thousands of feedback data points near real-time from our customers and measure the customer satisfaction (“CSAT”) as an item of our performance measurement from various surveys on the website and leverage direct customer feedback to improve our online shopping experience. We believe our online educational resources and community outreach drive traffic to our website and retail stores, while improving user engagement as shoppers move from single-purchase users to loyal customers. We provide online customer service support and fulfill orders through our in-house distribution center and through select partner drop ship integration. In fiscal year 2023, our website received more than 119 million visits with e-commerce driven sales in excess of 18% of total sales, which we believe demonstrates our position as a leading resource for outdoor products and product education.
Our Products and Services
Merchandise Strategy
We offer a broad range of products at a variety of price points and carry a deep selection of branded merchandise from well-known manufacturers, such as Browning, Carhartt, Coleman, Columbia Sportswear, Federal Premium Ammunition, Honda, Johnson Outdoors, Crispi, Camp Chef, Shakespeare, Shimano, Smith & Wesson and Ruger. To reinforce our convenient shopping experience, we offer our products at everyday low prices. We believe our competitive pricing strategy supports our strong value proposition, instills price confidence in both our customers and our sales associates, and is a critical element of our competitive position.
We believe we offer a wider selection of hard goods than many of our key competitors. We employ a good, better, best merchandise strategy, with an emphasis on “better” products that meet the needs of customers of all experience levels. We strive to keep our merchandise mix fresh and exciting by continuously searching for new, innovative products and introducing them to our customers. Our hunting and shooting department, which is strategically located at the back of the store, is a key driver of store traffic and one of the reasons for our high frequency of customer visits. We carry a large array of consumable goods, which includes ammunition, bait, cleaning supplies, food, certain lures, propane and reloading supplies. During fiscal year 2023, sales of consumable goods accounted for approximately 44.0% of our unit sales and 20.0% of our dollar sales. We believe the sale of consumables and replenishment items drive repeat traffic, with the majority of our customers visiting our stores multiple times per year (according to our internal surveys). During such visits, our customers frequently browse and purchase other items, including additional gear and accessories.
We also carry a variety of private label and special make-up offerings under the Rustic RidgeTM, KillikTM, Vital ImpactTM, Yukon Gold, Lost Creek and Sportsman’s Warehouse brands as well as special make-up items through vendors such as Tikka, Weatherby, Camp Chef and various others. These products are designed and priced to complement our branded assortment, by rounding out the offering and ensuring customer choices for good, better and best within key product categories. During fiscal year 2023, private label offerings accounted for approximately 4.5% of our total sales with special make-up offerings accounting for an additional 2.2% of our total sales. This combined total of 6.7% compares to more than 20% for many of our sporting goods retail peers. We believe our private label and special make-up products are an important opportunity to drive sales and increase margins alongside our branded merchandise.
In addition to outfitting our customers with the correct gear, we provide our customers with value-added, technical support services, such as gunsmithing and firearm service plans. Our stores offer full-service archery technician services, fishing-reel line winding, scope mounting and bore sighting, and cleaning services. We also help participants enjoy the outdoors responsibly by issuing hunting and fishing licenses. We believe the support services provided by our highly trained staff technicians differentiate us from our competitors, increase customer loyalty and drive repeat traffic to our stores.
12
Products
Our stores are organized into six departments. The table below summarizes the key product lines by department:
|
|
|
Department |
|
Product Offerings |
Camping |
|
Backpacks, camp essentials, canoes and kayaks, coolers, outdoor cooking equipment, sleeping bags, tents and tools |
Apparel |
|
Camouflage, jackets, hats, outerwear, sportswear, technical gear and work wear |
Fishing |
|
Bait, electronics, fishing rods, flotation items, fly fishing, lines, lures, reels, tackle and small boats |
Footwear |
|
Hiking boots, socks, sport sandals, technical footwear, trail shoes, casual shoes, waders and work boots |
Hunting and Shooting |
|
Ammunition, archery items, ATV accessories, blinds and tree stands, decoys, firearms, firearms safety and storage, reloading equipment, and shooting gear |
Optics, Electronics, Accessories, and Other |
|
Gift items, GPS devices, knives, lighting, optics (e.g. binoculars), two-way radios, and other license revenue, net of revenue discounts |
Each department has buying and planning teams that are responsible for monitoring product availability from vendors and sales volume within the department and across all stores. We actively monitor the profitability of each product category within each department and adjust our assortment and floor space accordingly. This flexibility enables us to provide customers with more preferred product choices and to enhance the profit potential of each store.
Hunting and Shooting has historically been the largest contributor to our sales. Hunting and Shooting department products are generally sold at significantly higher price points than other merchandise, but often have lower margin percentages. Camping is our second largest department, and we believe family-oriented camping equipment in particular is a product category with high growth opportunity. We view Apparel sales as an important opportunity, given its high gross margins and appeal to a broad, growing demographic.
The following table shows our sales during the past three fiscal years presented by department:
|
|
|
|
Fiscal year Ended |
|
|||||||||
|
|
|
|
February 3, |
|
|
January 28, |
|
|
January 29, |
|
|||
Department |
|
Product Offerings |
|
2024 |
|
|
2023 |
|
|
2022 |
|
|||
Camping |
|
Backpacks, camp essentials, canoes and kayaks, coolers, outdoor cooking equipment, sleeping bags, tents and tools |
|
|
11.2 |
% |
|
|
12.5 |
% |
|
|
13.1 |
% |
Apparel |
|
Camouflage, jackets, hats, outerwear, sportswear, technical gear and work wear |
|
|
8.8 |
% |
|
|
9.3 |
% |
|
|
8.4 |
% |
Fishing |
|
Bait, electronics, fishing rods, flotation items, fly fishing, lines, lures, reels, tackle and small boats |
|
|
8.9 |
% |
|
|
8.9 |
% |
|
|
10.0 |
% |
Footwear |
|
Hiking boots, socks, sport sandals, technical footwear, trail shoes, casual shoes, waders and work boots |
|
|
7.2 |
% |
|
|
7.3 |
% |
|
|
6.8 |
% |
Hunting and Shooting |
|
Ammunition, archery items, ATV accessories, blinds and tree stands, decoys, firearms, reloading equipment and shooting gear |
|
|
57.4 |
% |
|
|
54.9 |
% |
|
|
54.2 |
% |
Optics, Electronics, Accessories, and Other |
|
Gift items, GPS devices, knives, lighting, optics, two-way radios, and other license revenue, net of revenue discounts |
|
|
6.5 |
% |
|
|
7.1 |
% |
|
|
7.5 |
% |
Total |
|
|
|
|
100.0 |
% |
|
|
100.0 |
% |
|
|
100.0 |
% |
13
Camping. Camping represented approximately 11.2% of our net sales during fiscal year 2023. Our camping assortment addresses both the technical requirements of the heavy-use camper, including gear for long-duration or deep-woods excursions, as well as the needs of the casual camper. We offer a broad selection of products for multi-day back country use and also for weekend outings, including tents and shelters, sleeping bags, backpacks and backpacking gear (including camouflaged styles for hunting), generators for home and camp use, cooking and food preparation equipment (including stoves and extended-use coolers), and dehydrated foods. Our camping department also includes canoes, kayaks and a selection of recreational camping equipment for the family, including basic automotive accessories, camp chairs and canopies. Our camping department includes brands such as Alps Mountaineering, Big Agnes, Camp Chef, Coleman, Honda, Teton Sports, Rustic Ridge Tents and Lost Creek Coolers.
Apparel. Apparel represented approximately 8.8% of our net sales during fiscal year 2023 and includes camouflage, outerwear, sportswear, technical gear, work-wear, jackets and hats. We primarily offer well-known brands in our apparel department, such as Carhartt, Columbia and Sitka. We also intend to grow our private label apparel lines, including Rustic RidgeTM and KillikTM. Our apparel selection offers technical performance capabilities for a variety of hunting activities, including upland game, waterfowl, archery, big game hunting, turkey hunting and shooting sports. Performance attributes include waterproofing, temperature control, scent control features and visual capabilities, such as blaze orange and camouflage in a wide range of patterns. Outerwear is an important product category for customers who are fishing, hiking, hunting or marine enthusiasts. We further complement our technical apparel with an assortment of casual apparel that fits our customers’ lifestyles, including a variety of branded graphic t-shirts, and private label t-shirts.
Fishing. Fishing represented approximately 8.9% of our net sales during fiscal year 2023 and includes products for fresh-water fishing, salt-water fishing, fly-fishing, ice-fishing and boating. Our broad assortment appeals to the beginning and weekend angler, as well as avid and tournament anglers. In addition to lures, rods and reels, our fishing assortment features a wide selection of products in tackle management and organization, electronics, fly-fishing, ice-fishing and marine accessories sub-categories. We also provide fishing-reel line winding services in all of our stores and live bait in most of our stores. We offer products for boat care and maintenance, as well as safety equipment and aquatic products such as float tubes and pontoons. All of our stores also sell fishing licenses. Our fishing department includes brands such as Johnson Outdoors, Normark, Plano, Pure Fishing, RoundRocks Fly Supply Co., Orvis and Shimano.
Footwear. Footwear represented approximately 7.2% of our net sales during fiscal year 2023 and includes work boots, technical footwear, hiking boots, trail shoes, socks, sport sandals and waders. As with apparel, our footwear selection offers a variety of technical performance features, such as different levels of support and types of tread, waterproofing, temperature control and visual attributes. Our footwear department includes brands such as Crispi, Danner, Keen, Merrell, and Hey Dude.
Hunting and Shooting. Hunting and shooting is our largest merchandise department, representing approximately 57.4% of our net sales during fiscal year 2023. Products such as ammunition, firearms cleaning supplies, firearms, firearms safety and storage and reloading products are typically key drivers of traffic in our stores. Our hunting and shooting merchandise assortment provides equipment, accessories and consumable supplies for virtually every type of hunting and shooting sport. Our expert technicians allow us to effectively support our hunting assortments for the avid hunter, shooter and archery enthusiast. Our merchandise selection includes a wide variety of firearms designed for hunting, shooting sports and home and personal defense, including air guns, black powder muzzle loaders, handguns, rifles and shotguns. We carry a wide selection of ammunition, archery equipment, dog training products, hunting equipment, reloading equipment and shooting accessories. Our hunting and shooting department includes brands such as Federal Premium Ammunition, Hornady, Browning, Ruger, Smith & Wesson and Winchester.
Optics, Electronics, Accessories and Other. Our optics, electronics, accessories and other department represented approximately 6.5% of our net sales during fiscal year 2023. This department supplements our other equipment departments with complementary products, such as optics (including binoculars, spotting scopes and rangefinders), GPS devices and other navigation gear, two-way radios, specialized and basic cutlery and tools, including hunting knives, lighting, bear spray and other accessories. Our optics, electronics and accessories department includes
14
brands such as Garmin, Leupold, Swarovski Optik and Vortex Optics. Our other department includes miscellaneous products and services.
Loyalty and Co-Branded Credit Card Programs
We have a loyalty program through which our customers are able to earn “points” towards Sportsman’s Warehouse gift cards on most of their purchases. The program is free to join and accepted both online and in-stores for purchases and the use of redemption cards. As of February 3, 2024, we had more than 4.4 million participants in our loyalty program and approximately 53% of our revenue is generated from our loyalty customers.
Customers may obtain a loyalty program card when making a purchase in-store or online. After obtaining a card, the customer must register on our website in order to redeem loyalty rewards. Customers earn one point for each dollar spent, with the exception of certain items, such as gift cards and fish and game licenses. For every 100 points accumulated, the customer is entitled to a $1.00 credit in loyalty rewards. Customers may choose to redeem loyalty rewards against purchases online and in-stores. The rewards points expire after 12 months of dormancy.
In addition, we offer our customers the multi-use Explorewards VISA Credit Card and the Explorewards Credit Card issued by Comenity Bank. Comenity Bank extends credit directly to cardholders and provides all servicing for the credit card accounts, funds the rewards and bears all credit and fraud losses. The Explorewards Visa Card allows customers to earn points whenever and wherever they use their card while the Explorewards Credit Card can be used only in Sportsman’s Warehouse stores and at Sportsman.com. Customers may redeem earned points for products and services just as they would redeem loyalty card points.
Sourcing and Distribution
Sourcing
We maintain central purchasing, replenishment and distribution functions to manage inventory planning, allocate merchandise to stores and oversee the replenishment of merchandise to the distribution center. We have no long-term purchase commitments. During fiscal year 2023, we purchased merchandise from approximately 1,100 vendors with no vendor accounting for more than 10% of total merchandise purchased. We have established long-standing, continuous relationships with our largest vendors.
Our sourcing organization is currently managed by our merchant team in our corporate headquarters. We also have field merchants that coordinate certain merchandising functions at the store level to provide a more localized merchandising model. To ensure that our product offerings are tailored to local market conditions and demand, our merchant teams regularly meet one-on-one with our vendors, and attend trade shows, review trade periodicals and evaluate merchandise offered by other retail and online merchants. We also frequently gather feedback and new product reviews from our store management and employees, as well as from reviews submitted by our customers. We believe this feedback is valuable to our vendor-partners and improves our access to new models and technologies.
Distribution and Fulfillment
We currently distribute all of our merchandise from our 507,000 square foot distribution center in Salt Lake City, Utah. We believe our current distribution center is sufficient to meet our needs for at least the next two years. The distribution center supports replenishment for all stores. We use preferred carriers for replenishment to our retail stores. The majority of our direct-to-consumer e-commerce orders are fulfilled by our 146 retail stores with additional orders fulfilled by our distribution center. We ship merchandise to our e-commerce customers via small parcel delivery. Our experienced distribution management team leads a staff of approximately 500 employees at peak inventory levels heading into the fourth quarter.
The distribution center has dynamic systems and processes that we believe can accommodate continued new store growth. We use Warehouse Management System (“WMS”) technology from Korber, to manage all activities. The system is highly adaptable and can be easily changed to accommodate new business requirements. For example, our WMS enabled us to support full omni-channel distribution under one roof by allowing us to comingle inventory to
15
optimize space requirements and labor. Additionally, we have developed customized radio frequency and voice-directed processes to handle the specific requirements of our operations. We have the capability to both case pick and item pick, which is designed to ensure that our stores have sufficient quantities of product while also allowing us to maintain appropriate in-stock levels. This balance allows us to effectively manage inventory and maximize sales in stores.
Marketing and Advertising
We believe, based on internal surveys, that the majority of our customers are male, between the ages of 35 and 65, and have an annual household income between $40,000 and $100,000. We also actively market to women and have expanded our product offerings of women’s and children’s outerwear, apparel and footwear to address rising participation rates in hunting and shooting sports, as well as overall outdoor activity.
Our primary marketing efforts are focused on driving additional consumers to the stores and increasing the frequency and profitability of visits by customers of all types. We employ a two-pronged marketing approach:
Our regional and national advertising programs emphasize seasonal requirements for hunting, fishing and camping in our various store geographies. Our advertising medium is typically digital advertising and newspaper inserts (primarily multi-page color inserts during key shopping periods such as the Christmas season and Father’s Day) supplemented with modest amounts of email, radio and national television ads. We proactively modify the timing and content of our message to match local and regional preferences, changing seasons, weather patterns and topography of a given region. Additionally, we sponsor several regional television and radio programs. Our total marketing expense for fiscal year 2023 was approximately $20.9 million.
The second prong of our marketing effort involves fostering grassroots relationships in the local community. Each Sportsman’s Warehouse store employs a variety of outreach tools to build local awareness. One key component to our local marketing strategy is hosting events throughout the year, targeting a variety of end-user customer profiles (such as hunters, campers, anglers and women). Our store base hosts or facilitates thousands of in-store and offsite seminars and events per year, such as ladies’ night, Waterfowl Weekend, Maintain the Terrain, and loyalty member events. We are also active in supporting a variety of conservation groups, such as Ducks Unlimited, Rocky Mountain Elk Foundation, Mule Deer Foundation and the National Wild Turkey Federation, both at the corporate level and through store employee local memberships and participation. Company representatives attend more than 600 events annually to provide support for these organizations and to solidify ties between their members and the Sportsman’s Warehouse brand. Such grass roots marketing campaigns and local outreach enable us to reduce our initial marketing spend in connection with new store openings. We believe that these initiatives are highly cost-effective tools to create brand awareness and engender a loyal community of local customers, as well as differentiate Sportsman’s Warehouse from its national competitors.
Information Technology
Business-critical information technology (“IT”) systems include the following: supply chain, merchandise, point-of-sale (“POS”), WMS, e-commerce, loss prevention and financial and payroll. Our IT infrastructure is designed to be able to access real-time data from any store or channel. The network infrastructure is designed to allow us to quickly and cost effectively add new stores to the wide area network (“WAN”). Our critical systems are backed up via offsite storage and are supported by backup generators, allowing us to remain operational in the event of a power failure. Each of our locations have redundant network connections reducing the potential for network outages.
We have implemented software for all of our major business-critical systems. Key operating systems include enterprise resource planning (“ERP”), system application processing (“SAP”) Commerce for our e-commerce channel, and Java point of sale (“JPOS”) for in-store functionality, and WMS. Our physical infrastructure is also built on products from vendors such as Cisco, Dell, Oracle Sun and VMWare. Originally designed with the goal of being able to run a significantly larger retail business, our IT systems are designed to be scalable to support our growth.
16
Furthermore, we have incorporated reporting tools that are designed to enable our management to more effectively monitor our financial and operational performance to drive financial results by leveraging a range of data insights that is both more granular and more comprehensive than our previous tools. Real-time sales data is available to district, store and departments managers. In addition, our reporting tools generate custom-created reports that provide our team with on-demand access to the data relevant to their area of responsibility.
Intellectual Property
Sportsman’s Warehouse®, Sportsman’s Warehouse America’s Premier Outfitter®, Lost Creek®, LC Lost Creek Fishing Gear and Accessories®, Rustic RidgeTM, KillikTM, K Killik & DesignTM, LC & DesignTM, Vital ImpactTM, and The American Parts Company - TAPCOTM are among our service marks or trademarks registered with the United States Patent and Trademark Office. In addition, we own several other registered and unregistered trademarks and service marks involving advertising slogans and other names and phrases used in our business. We also own numerous domain names, including www.sportsmans.com, among others. The information on, or that can be accessed through, our websites is not a part of this filing.
We believe that our trademarks are valid and valuable and intend to maintain our trademarks and any related registrations. We do not know of any material pending claims of infringement or other challenges to our right to use our marks in the United States or elsewhere. We have no franchises or other concessions that are material to our operations.
Our Market and Competition
Our Market
We compete in the large, growing and fragmented outdoor activities and sporting goods market, which we believe is currently underserved by full-line multi-activity retailers. We believe, based on the 2022 U.S. Fish and Wildlife national survey published in September of 2023 and conducted once every five years, that U.S. outdoor activities and sporting goods retail sales total over $170 billion annually. The U.S. outdoor activities and sporting goods sector is comprised of three primary categories—equipment, apparel and footwear—with each category containing distinct product sets to support a variety of activities, including hunting, fishing, camping and shooting, as well as other sporting goods activities.
We believe growth in the U.S. outdoor activities and sporting goods market is driven by key trends, centered around enhancing performance and enjoyment while participating in sporting and outdoor activities. This includes new product introductions, participation levels, and the resilience of consumer demand for product purchases in these categories versus other discretionary categories. We believe these factors will continue to foster growth in the outdoor activities and sporting goods market in the future.
Within the retail sporting goods sector, we operate primarily in the outdoor equipment, apparel and footwear segment, which includes hunting and shooting, fishing, camping, hiking, and boating. We believe that participation in these activities remains high and continues to grow. According to the 2022 U.S. Fish and Wildlife national survey, anglers and hunters spent more than $60 billion on equipment in 2022, which is approximately 40% higher than the amount reported in the 2016 survey. Additionally, the number of participating anglers and hunters increased by approximately 11% and 25%, respectively, from 2016 to 2022.
Furthermore, we believe that specialty retailers have generated incremental sales volume by expanding their presence, especially in smaller underserved communities, which has increased customers’ access to products that formerly were less available. The nature of the outdoor activities to which we cater, often requires recurring purchases throughout the year, resulting in high rates of conversion among customers. For example, active anglers typically purchase various fishing tackle throughout the year based on seasons and changing conditions. Hunting with firearms typically is accompanied by recurring purchases of ammunition and cleaning supplies throughout the year and multiple firearm styles for different hunted game.
17
Competition
We believe that the principal competitive factors in our industry are product selection, including locally relevant offerings, value pricing, convenient locations, technical services and customer service. Some of our competitors have a larger number of stores, and some of them have a greater market presence, name recognition and financial, distribution, marketing and other resources than we have. We believe that we compete effectively with our competitors with our distinctive branded selection and superior customer service, as well as our commitment to understanding and providing merchandise that is relevant to our targeted customer base. We cater to the outdoor enthusiast and believe that we have both an in-depth knowledge of the technical outdoor customer and a “grab and go” store environment that is uniquely conducive to their need for value and convenience. We believe that our flexible store format, combined with our low-cost, high-service model, also allows us to enter and serve smaller markets that our larger competitors cannot penetrate as effectively. In addition, certain barriers, including legal restrictions, exist on the sale of our product offerings that comprise a portion of our revenue, such as firearms, ammunition, certain cutlery, propane and reloading powder, and create a structural barrier to competition from many online retailers. Finally, over the last few years several big box retailers have either fully exited, or significantly reduced their exposure to the hunting and shooting sports categories as federal, state and local laws became more restrictive. Given our strong position in the hunting and shooting sports market, we believe we are well positioned to meet the needs of consumers seeking products in these large categories.
Our principal competitors include the following:
Independent, Local Specialty Stores. These stores generally range in size from approximately 2,000 to 10,000 square feet, and typically focus on more than one specific product categories, such as hunting, fishing or camping.
Other Specialty Retailers. Some of the other specialty retailers that compete with us across a significant portion of our merchandising categories are large-format retailers, with stores that generally range in size from 40,000 to 250,000 square feet. These retailers seek to offer a broad selection of merchandise focused on hunting, fishing, camping and other outdoor product categories. Some of these stores combine the characteristics of an outdoor retailer with outdoor entertainment and theme attractions. We believe that the number of these stores that can be supported in any single market area is limited because of their large size and significant per-store buildout cost.
Other specialty retailers are smaller chains that typically focus on offering a broad selection of merchandise in one or more of the following product categories—hunting, fishing, camping or other outdoor product categories. We believe we can offer a broader and deeper selection of merchandise or specialized services than these other outdoor-focused retail chains.
Large-Format Sporting Goods Stores and Chains. These stores generally range from 20,000 to 80,000 square feet and offer a broad selection of sporting goods merchandise covering a variety of sporting goods categories, including baseball, basketball, football and home gyms, as well as hunting, fishing and camping. However, we believe that the amount of space at these stores devoted to our outdoor product categories limits the extent of their offerings in these areas.
Mass Merchandisers, Warehouse Clubs, Discount Stores and Department Stores. With respect to retailers in this category with physical locations, these stores generally range in size from approximately 50,000 to over 200,000 square feet and are primarily located in shopping centers, free-standing sites or regional malls. Hunting, fishing and camping merchandise and apparel represent a small portion of the stores’ assortment and their total sales.
18
Online Retailers. E-commerce is a growing sales channel. We face competition from a diverse set of online retailers that sell a wide range of products in categories in which we participate. Online retailers include competitors with e-commerce only sales channels, in addition to many of the retailers mentioned above that also have an online presence.
There are almost 50,000 Type 01 FFLs in the United States today, of which only approximately 5,200 are currently held by national or regional specialty stores. Since FFLs are issued at the store level, these statistics imply that almost 90% of the market is fragmented among small independent retailers. We believe this fragmentation within the total addressable market presents an attractive opportunity for us to continue to expand our market share, as customers increasingly prefer a broad and appealing selection of merchandise, competitive prices, high levels of service and one-stop shopping convenience.
Seasonality
We experience moderate seasonal fluctuations in our net sales and operating results as a result of holiday spending and the opening of hunting seasons. While our sales are more balanced throughout the year compared to many retailers, historically, our sales are moderately higher in the third and fourth fiscal quarters than in the other quarterly periods. On average, over the last three fiscal years, we have generated approximately 26.3% and 27.8% of our net sales in the third and fourth fiscal quarters, respectively, which includes the holiday selling season as well as the opening of the Fall hunting season. However, Spring hunting, Father’s Day and the availability of hunting and fishing throughout the year in many of our markets counterbalance this seasonality to a certain degree. For additional information, see Part II, Item 7 “Management’s Discussion and Analysis of Financial Condition and Results of Operations.”
Regulation and Compliance
Regulation and Legislation
We operate in a highly regulated industry. There are a number of federal, state and local laws and regulations that affect our business. In every state in which we operate, we must obtain various licenses and/or permits in order to operate our business.
Because we sell firearms at all of our retail stores, we are subject to regulation by the Bureau of Alcohol, Tobacco, Firearms and Explosives (the “ATF”). Each store has its own FFL that permits the sale of firearms, and our distribution center has obtained an FFL to store and distribute firearms. Certain states require a state license to sell firearms and/or ammunition and we have obtained these licenses for the states in which we operate that have such a requirement.
We must comply with federal, state and local laws and regulations, including the National Firearms Act of 1934 (the “NFA”), the Gun Control Act of 1968 (the “GCA”), the Arms Export Control Act of 1976 and provisions of the Internal Revenue Code of 1986, as amended, applicable to the Firearms and Ammunition Excise Tax, all of which have been amended from time to time. The NFA and GCA require our business to, among other things, maintain FFLs for our locations and perform a pre-transfer background check in connection with each firearm purchase. We perform this background check using either the FBI-managed National Instant Criminal Background Check System (“NICS”), or a comparable state government-managed system that relies on NICS and any additional information collected by the state. These background check systems either confirm that a transfer can be made, deny the transfer or require that the transfer be delayed for further review, and provide us with a transaction number for the proposed transfer. We are required to record the transaction number on an ATF Form 4473 and retain this form in our records for auditing purposes for the entire duration we are in business.
The federal categories of prohibited purchasers are the prevailing minimum for all states. States (and, in some cases, local governments) on occasion enact laws that further restrict permissible purchases of firearms. We are also subject to numerous other federal, state and local laws and regulations regarding firearm sale procedures, record keeping, inspection and reporting, including adhering to minimum age restrictions regarding the acquisition, purchase or possession of firearms or ammunition, residency requirements, applicable waiting periods, importation regulations and regulations pertaining to the shipment and transportation of firearms.
19
In September 2004, Congress declined to renew the Assault Weapons Ban of 1994 (the “AWB”), which prohibited the manufacture of certain firearms defined as “assault weapons,” restricted the sale or possession of “assault weapons,” except those that were manufactured prior to the law’s enactment, and placed restrictions on the sale of new high-capacity ammunition feeding devices. Various states and local jurisdictions, including California, Colorado, New York and Washington (states in which we operate), have adopted their own versions of the AWB or high capacity ammunition feeding device restrictions, some of which restrictions apply to the products we sell in other states. If a statute similar to the AWB were to be enacted or re-enacted at the federal level, it would impact our ability to sell certain products. Additionally, state and local governments have proposed laws and regulations that, if enacted, would place additional restrictions on the manufacture, transfer, sale, purchase, possession and use of firearms, ammunition and shooting-related products. For example, several states, such as California, Colorado, Connecticut, Florida, Illinois, Maryland, Minnesota, New Jersey, New York, Oregon, Virginia and Washington have enacted laws and regulations that are more restrictive than federal laws and regulations that limit access to and sale of certain firearms and ammunition. California, Connecticut and New York impose mandatory screening of ammunition purchases; Washington recently passed legislation that, among other things, raises the minimum age to purchase certain firearms to 21 from 18 and imposes a multi-day waiting period on all gun purchases. California also raised the minimum age to purchase certain firearms to 21 and enacted several restrictions, including background checks on ammunition sales. Some states prohibit the sale of guns without internal or external locking mechanisms. Several states and the United States Congress have introduced microstamping legislation (that is, engraving the handgun’s serial number on the firing pin of new handguns) for certain firearms. Other state or local governmental entities may also explore similar legislative or regulatory initiatives that may further restrict the manufacture, sale, purchase, possession or use of firearms, ammunition and shooting-related products.
The Protection of Lawful Commerce in Arms Act (“PLCAA”), which became effective in October 2005, prohibits civil liability actions from being brought or continued in any federal or state court against federally licensed manufacturers, distributors, dealers or importers of firearms or ammunition for damages, punitive damages, injunctive or declaratory relief, abatement, restitution, fines, penalties or other relief resulting from the criminal or unlawful misuse of a qualified product by third parties. The legislation does not preclude traditional product liability actions.
Several states have immunity statues in place similar to the PLCAA. However, California, New Jersey and New York recently enacted state legislation that could allow firearm dealers, manufacturers, or importers to be held liable for improper marketing or sales as defined in the legislation.
We are also subject to a variety of federal, state and local laws and regulations relating to, among other things, protection of the environment, human health and safety, advertising, pricing, weights and measures, product safety and other matters. Some of these laws affect or restrict the manner in which we can sell certain items, such as archery equipment, handguns, smokeless powder, black powder substitutes, ammunition, pepper spray, bows, knives and other products. State and local laws and regulations governing hunting, fishing, boating, all-terrain vehicles and other outdoor activities and equipment can also affect our business. We believe that we are in substantial compliance with the terms of such laws and that we have no liabilities under such laws that we expect could have a material adverse effect on our business, results of operations or financial condition.
In addition, many of our imported products are subject to existing or potential duties, tariffs or quotas that may limit the quantity of products that we may import into the United States from other countries or impact the cost of such products. To date, quotas in the operation of our business have not restricted us, and customs duties have not comprised a material portion of the total cost of our products.
State, local and federal laws and regulations relating to products that we sell may change, sometimes significantly, as a result of political, economic or social events. For instance, in November 2022, the State of Oregon passed legislation that will, among other things, impose complex permitting and training requirements for the purchases of firearms. As a result, sales of firearms in Oregon may be halted or substantially diminished until such permitting and training programs are developed by the state, which may take a significant amount of time. If that were to occur, it could result in a substantial decline in our sales of firearms and related products and reduce traffic to our stores in Oregon, which could have a substantial impact on our sales and gross margin. On December 6, 2022, a state court judge in Oregon temporarily blocked the enforcement of such legislation. The measure is also being challenged in a
20
related case in federal court and is currently on appeal in the U.S. Court of Appeals for the Ninth Circuit. We currently operate eight stores in the State of Oregon.
Our e-commerce business is subject to the Mail or Telephone Order Merchandise Rule and related regulations promulgated by the Federal Trade Commission (the “FTC”), which affect our catalog mail order operations. FTC regulations, in general, govern the solicitation of orders, the information provided to prospective customers and the timeliness of shipments and refunds. In addition, the FTC has established guidelines for advertising and labeling many of the products we sell.
Compliance
We are routinely inspected by the ATF and various state agencies to ensure compliance with federal, state and local laws and regulations. While we view such inspections as a starting point, we employ more comprehensive internal compliance inspections to help ensure we follow and are compliant with all applicable laws and regulations. With the IT infrastructure systems we have in place, certain components of inspections can be done remotely. In order to maintain compliance with the applicable federal, state and local laws and regulations, we have implemented company-wide standard operating procedures that apply to the sale of firearms and ammunition. All relevant employee are trained in accordance with the policies and procedures regarding the sale of ATF regulated items.
We dedicate significant resources to ensure compliance with applicable federal, state and local laws and regulations. Since we began operations in 1986, we have never had an FFL revoked.
We are also subject to a variety of state laws and regulations relating to, among other things, advertising and product restrictions. Some of these laws prohibit or limit the sale, in certain states and locations, of certain items, such as black powder firearms, ammunition, bows, knives and similar products. Our compliance department administers various restriction codes and other software tools to prevent the sale of such jurisdictionally-restricted items.
We have particular expertise in the California market and have passed several California Department of Justice (“CA DOJ”) firearm audits with zero or only minor violations. The CA DOJ communicates with us for policy discussion, recognizing the strength of our compliance infrastructure.
Compliance with government regulations, including environmental regulations, has not had, and based upon current information and the applicable laws and regulation currently in effect, is not expected to have a material effect on our capital expenditures, results of operations or competitive position. However, laws and regulations may be changed, accelerated or adopted that impose significant operational restrictions and compliance requirements upon us and which could negatively impact our operating results and financial condition. See Item 1A, “Risk Factors—Risks Related to the Firearms Business”.
Data Privacy
In the ordinary course of business, we collect, receive, store, process, generate, use, transfer, disclose, make accessible, protect, secure, dispose of, transmit, and share (collectively, “process”) personal data, such as employee and consumer information. Accordingly, we may be subject to numerous data privacy and security obligations, including federal, state, and local laws, regulations, guidance, industry standards, external and internal privacy and security policies, contractual requirements and other obligations related to data privacy and security.
These frameworks are evolving and may impose potentially conflicting obligations. Such obligations may include, without limitation, the Federal Trade Commission Act, the California Consumer Privacy Act of 2018, as amended by the California Privacy Rights Act of 2020 (“CPRA”) (collectively, “CCPA”), industry standards, such as the Payment Card Industry Data Security Standard (“PCI DSS”), and wiretapping laws. The CCPA is an example of the increasingly stringent and evolving regulatory frameworks related to personal data processing that may increase our compliance obligations and exposure for any noncompliance. For example, the CCPA applies to personal data of consumers, business representative, and employees who are California residents, imposes specific obligations on covered businesses, provides for fines of up to $7,500 per intentional violation, and allows private litigants affected by certain data breaches to recover significant statutory damages.
21
In addition, numerous other U.S. states, such as Virginia, Colorado, Connecticut, and Utah, have enacted comprehensive data privacy laws, and similar laws are being considered at the federal, state, and local levels.
Human Capital
We appreciate the importance of retention, growth and development of our employees. We strive to provide competitive compensation and benefits packages, opportunities for advancement, and extensive training programs and learning opportunities for our employees.
As of February 3, 2024, we had approximately 5,400 total employees. Of our total employees, approximately 200 were based at our corporate headquarters in West Jordan, Utah, approximately 370 employees were located at our distribution center and approximately 4,830 were store employees. As of February 3, 2024, we had approximately 2,100 full-time employees and approximately 3,300 part-time employees, who are primarily store employees. None of our employees are represented by a labor union or are party to a collective bargaining agreement and we have had no labor-related work stoppages.
We believe we offer competitive compensation and benefits packages. We strive to ensure pay equity between our female and male employees performing equal or substantially similar work. We are also focused on understanding our diversity and inclusion strengths and opportunities and executing on a strategy to support further progress. As our employees are often outdoor enthusiasts, we offer an industry best in-class discount program to our employees. We believe our level of employee store patronage and employee expertise are unique among our competitors in this industry and enhances our differentiated shopping experience.
We believe that the recruitment, training and knowledge of our employees and the consistency and quality of the service they deliver are central to our success. We emphasize deep product knowledge for store managers and sales associates during both the hiring and training stages. We hire most of our sales associates for a specific department or product category. Our managers and sales associates undergo focused sales training, consisting of both sales techniques and specialized product instruction, both immediately upon hiring (approximately 20 hours) and continuing throughout their career (approximately 16 hours annually). For example, in our hunting department, all employees receive an additional nine hours of training on ATF and company policies initially upon hire, with continuing education throughout the year. Our store managers complete two to six months of on-the-job training at another store with a Sportsman’s Warehouse district manager, as part of which they receive approximately 80 hours of dedicated managerial training and instruction. Our department heads receive extensive online training as well as on-site instruction, totaling approximately 40 hours. As a result of these programs, our employees are highly trained to provide friendly and non-intimidating education, guidance and support to address our customers’ needs.
One of our unique assets is a designated training room located at our headquarters. Our training room is used frequently for company-wide training programs and by vendors to stage training demonstrations for new products. Training room sessions are broadcast real-time in high definition to each store location and are recorded for future viewing. Vendor training is particularly interactive, permitting vendor representatives to present a uniform message simultaneously to all employees, while allowing managers and sales staff in individual stores to ask questions and provide real-time feedback on products. This system increases vendors’ product knowledge reach and provides more effective training to our employees. Training room sessions are especially important for technical products, with numerous design features and a high unit price, because they enable our sales associates to better educate customers and provide additional assurance that a given product fits the customer’s needs.
Available Information
Our Annual Reports on Form 10-K, Quarterly Reports on Form 10-Q, Current Reports on Form 8-K and amendments to those reports filed or furnished pursuant to Sections 13(a) or 15(d) of the Securities Exchange Act of 1934, as amended (the “Exchange Act”), are available on our website at www.sportsmans.com, free of charge, as soon as reasonably practicable after the electronic filing of these reports with, or furnishing of these reports to, the SEC. We may post information that is important to investors on our website from time to time. The information provided on our website is not part of this report and is, therefore, not incorporated herein by reference.
22
ITEM 1A. RISK FACTORS
Our business faces significant risks and uncertainties. Certain important factors may have a material adverse effect on our business prospects, financial condition and results of operations, and you should carefully consider them. Accordingly, in evaluating our business, we encourage you to consider the following discussion of risk factors, in its entirety, in addition to other information contained in or incorporated by reference into this 10-K, including our consolidated financial statements and the related notes appearing at the end of this 10-K, and our other public filings with the SEC. Other events that we do not currently anticipate or that we currently deem immaterial may also affect our business, prospects, financial condition and results of operations.
Risks Related to the Firearms Business
Current and future government regulations, particularly regulations relating to the sale of firearms and ammunition, may negatively impact the demand for our products and our ability to conduct our business.
We operate in a complex regulatory and legal environment that could negatively impact the demand for our products and expose us to compliance and litigation risks, which could materially affect our operations and financial results. These laws may, and do, change, sometimes significantly, as a result of political, economic or social events. For instance, Washington passed legislation that, among other things, raises the minimum age to purchase certain firearms from 18 to 21 and imposes a five to ten day waiting period on gun purchases. In addition, Florida has also raised the minimum age for firearms purchases to 21 with some exceptions, and in November 2022, the State of Oregon passed legislation that will, among other things, impose complex permitting and training requirements for the purchases of firearms. Some of the federal, state or local laws and regulations that affect our business and demand for our products include:
Over the past several years, bills have been introduced in the United States Congress that would restrict or prohibit the manufacture, transfer, importation or sale of certain calibers of handgun ammunition, impose a tax and import controls on bullets designed to penetrate bullet-proof vests, impose a special occupational tax and registration requirements on manufacturers of handgun ammunition and increase the tax on handgun ammunition in certain calibers. Because we carry these products, such legislation could, depending on its scope, materially harm our sales.
Additionally, state and local governments have proposed laws and regulations that, if enacted, would place additional restrictions on the manufacture, transfer, sale, purchase, acquisition, possession and use of firearms, ammunition and shooting-related products. For example, in response to mass shootings and other incidents in the United States, several states, such as California, Colorado, Connecticut, Florida, Illinois, Maryland, Minnesota, New
23
Jersey, New York, Oregon, Virginia and Washington have enacted laws and regulations that limit access to and sale of certain firearms in ways more restrictive than federal laws. Other state or local governmental entities may continue to explore similar legislative or regulatory restrictions that could prohibit the manufacture, sale, purchase, possession or use of firearms and ammunition. In California, Connecticut and New York, mandatory screening of ammunition purchases is now required, as well as electronic recordkeeping that will be audited by the state. In addition, several states and the United States Congress have introduced microstamping legislation (that is, engraving the handgun’s serial number on the firing pin of new handguns) for certain firearms. Lastly, some states prohibit the sale of firearms without internal or external locking mechanisms, and several states are considering mandating certain design features on safety grounds, most of which would be applicable only to handguns. Other state or local governmental entities may also explore similar legislative or regulatory initiatives that may further restrict the manufacture, sale, purchase, acquisition, possession or use of firearms, ammunition and shooting-related products.
State, local and federal laws and regulations relating to products that we sell may change, sometimes significantly, as a result of political, economic or social events. For instance, in November 2022, the State of Oregon passed legislation that will, among other things, impose complex permitting and training requirements for the purchases of firearms. As a result, sales of firearms in Oregon may be halted or substantially diminished until such permitting and training programs are developed by the state, which may take a significant amount of time. If that were to occur, it could result in a substantial decline in our sales of firearms and related products and reduce traffic to our stores in Oregon, which could have a substantial impact on our sales and gross margin. On December 6, 2022, a state court judge in Oregon temporarily blocked the enforcement of such legislation. The measure is also being challenged in a related case in federal court and is currently on appeal in the U.S. Court of Appeals for the Ninth Circuit. We currently operate eight stores in the State of Oregon.
The regulation of firearms, ammunition and shooting-related products may even become more restrictive in the future. Changes in these laws and regulations or additional regulations, particularly new laws or increased regulations regarding sales and ownership of firearms and ammunition, could cause the demand for and sales of our products to decrease and could materially adversely impact our net sales and profitability. Sales of firearms represent a significant percentage of our net sales and are critical in drawing customers to our stores. A substantial reduction in our sales or margins on sales of firearms and firearm related products due to the establishment of new regulations could harm our operating results. Moreover, complying with increased or changed regulations could cause our operating expenses to increase.
We may incur costs from litigation involving products that we sell, particularly firearms and ammunition, which could adversely affect our net sales and profitability.
We may incur damages due to lawsuits involving products we sell, including lawsuits relating to firearms, ammunition, tree stands and archery equipment. We may incur losses due to lawsuits, including potential class actions, relating to our performance of background checks on firearms purchases and compliance with other sales laws as mandated by state and federal law. We may also incur losses from lawsuits relating to the improper use of firearms or ammunition sold by us, including lawsuits by municipalities or other organizations attempting to recover costs from manufacturers and retailers of firearms and ammunition. For instance, in July 2019, the estate and family of a victim of the Route 91 Harvest Festival shooting filed litigation against 16 defendants, including us, for wrongful death and negligence. This litigation was dismissed in March of 2022, with a finding of no liability for the Company. Our insurance coverage, as well as the insurance provided by our vendors for certain products they sell to us may be inadequate to cover claims and liabilities related to products that we sell. In addition, claims or lawsuits related to products that we sell, or the unavailability of insurance for product liability claims, could result in the elimination of these products from our product line, thereby reducing net sales. If one or more successful claims against us are not covered by or exceed our insurance coverage, or if insurance coverage is no longer available, our available working capital may be impaired and our operating results could be materially adversely affected. Even unsuccessful claims could result in the expenditure of funds and management time and could have a negative impact on our profitability and on future premiums we would be required to pay on our insurance policies.
24
Our net sales and profitability could be impacted if the strength of our brand is not maintained, and our sales of firearm-related products could present reputational risks and negative publicity.
Our success depends on the value and strength of the Sportsman’s Warehouse brand. The Sportsman’s Warehouse name is integral to our business as well as to the implementation of our strategies for expanding our business. Maintaining, promoting and positioning our brand will depend largely on the success of our marketing and merchandising efforts and our ability to provide high quality merchandise and a consistent, high quality customer experience both in-store and online. Our brand could be adversely affected if we fail to achieve these objectives or if our public image or reputation were to be tarnished by negative publicity, any of which could result in decreases in net sales. In addition, the sale of firearm-related products also may present reputational risks and negative publicity that could affect consumers’ perception of us or willingness to shop in our stores, which could harm our results of operations and financial condition.
Risks Related to Our Retail Operations
Our retail-based business model is impacted by general economic and market conditions, such as rising interest rates and inflationary pressures, and ongoing economic, market and financial uncertainties that may cause a decline in consumer spending that may adversely affect our business, operations, liquidity, financial results and stock price.
During fiscal year 2023 we saw decreased revenue and operated at a net loss as a result of inflationary pressures on our consumers discretionary spending, as well as, increased interest rates and higher energy costs and fuel prices. As a retail business that depends on consumer discretionary spending, we may continue to be adversely affected if our customers reduce, delay or forego their purchases of our products as a result of job losses, bankruptcies, higher consumer debt and interest rates, increases in inflation, higher energy and fuel costs, reduced access to credit, fluctuations in home prices and other adverse conditions in the mortgage and housing markets, lower consumer confidence, uncertainty or changes in tax policies and tax rates, uncertainty due to potential national or international security concerns, adverse or unseasonal weather conditions and uncertainty related to any health crisis. We experienced an increase in sales in fiscal year 2021 due to the pandemic and related events, although this increase in sales did not continue into fiscal year 2022 or fiscal year 2023. If we are required to close a large portion of our stores or we experience an acceleration of reduced store traffic, whether as a result of a pandemic, evolving macroeconomic conditions or geopolitical events, or otherwise, we may need additional liquidity to maintain our operations depending on how long these events impact our operations. Such events could adversely impact our sales and/or cause the temporary closure of our stores. Decreases in same store sales, customer traffic to our stores and e-commerce site or average ticket sales negatively affect our financial performance, and a prolonged period of depressed consumer spending could have a material adverse effect on our business. Promotional activities, vendor incentives, and decreased demand for consumer products could affect profitability and margins. In addition, adverse economic conditions may result in an increase in our operating expenses due to, among other things, higher costs of labor, energy, equipment and facilities. Due to fluctuations in the U.S. economy, our sales, operating and financial results for a particular period are difficult to predict, making it difficult to forecast results to be expected in future periods. Any of the foregoing factors could have a material adverse effect on our business, results of operations and financial condition and could adversely affect our stock price.
Our concentration of stores in the Western United States makes us susceptible to adverse conditions in this region.
The majority of our stores are currently located in the Western United States, comprising Alaska, Arizona, California, Colorado, Idaho, Montana, Nevada, New Mexico, Oregon, Utah, Washington and Wyoming. As a result, our operations are more susceptible to regional factors than the operations of more geographically diversified competitors. These factors include regional economic and weather conditions, natural disasters, demographic and population changes and governmental regulations in the states in which we operate. Environmental changes and disease epidemics affecting fish or game populations in any concentrated region may also affect our sales. In addition, adverse weather conditions and the impacts of climate change in any concentrated region may temporarily reduce the demand for some of our products and could have a negative effect on our sales, earnings or cash flows. If a region with a concentration of our stores were to suffer an economic downturn or other adverse event, our operating results could suffer.
25
Competition in the outdoor activities and sporting goods market could reduce our net sales and profitability.
The outdoor activities and sporting goods market is highly fragmented and competitive. Some of our competitors have a larger number of stores, and greater market presence (both brick and mortar and online), name recognition and financial, distribution, marketing and other resources than we have. As a result of this competition, we may need to spend more on advertising and promotion than we anticipate. In addition, the ability of consumers to compare prices on a real-time basis through the use of smartphones and digital technology puts additional pressure on us to maintain competitive pricing. If our competitors reduce their prices, we may have to reduce our prices in order to compete, which could harm our margins. Furthermore, some of our competitors may build new stores in or near our existing locations or in locations with high concentrations of our e-commerce business customers. As a result of this competition, we may need to spend more on advertising and promotion. Some of our mass merchandising competitors, such as Walmart, do not currently compete in many of the product lines we offer. However, if these competitors were to begin offering a broader array of competing products, or if any of the other factors listed above occurred, our net sales could be reduced or our costs could be increased, resulting in reduced profitability.
If we fail to anticipate changes in consumer demands, including regional preferences, in a timely manner, our operating results could suffer.
Our products appeal to consumers who regularly hunt, camp, fish and participate in various shooting sports. The preferences of these consumers cannot be predicted with certainty and are subject to change. In addition, due to different game and fishing species and varied weather conditions found in different markets, it is critical that our stores stock products appropriate for their markets. Our success depends on our ability to identify product trends in a variety of markets as well as to anticipate, gauge and quickly react to changing consumer demands in these markets. We usually must order merchandise well in advance of the applicable selling season. The extended lead times for many of our purchases may make it difficult for us to respond rapidly to new or changing product trends or changes in prices. If we misjudge either the market for our products or our customers’ purchasing habits, our net sales may decline significantly and we may not have sufficient quantities of merchandise to satisfy customer demand or we may be required to mark down excess inventory, either of which would result in lower profit margins and harm our operating results.
Our same store sales may fluctuate and may not be a meaningful indicator of future performance.
Our same store sales may vary from quarter to quarter, and an unanticipated decline in net sales or same store sales may cause the price of our common stock to fluctuate significantly. A number of factors have historically affected, and will continue to affect, our same store sales results, including:
26
Our operating results are subject to seasonal fluctuations.
We experience moderate seasonal fluctuations in our net sales and operating results. On average over the last three fiscal years, we have generated 26.3% and 27.8% of our annual net sales in the third and fourth fiscal quarters, respectively, which includes the holiday selling season as well as the opening of the fall hunting season. We incur additional expenses in the third and fourth fiscal quarters due to higher purchase volumes and increased staffing in our stores. If, for any reason, we miscalculate the demand for our products or our product mix during the third or fourth fiscal quarters, our sales in these quarters could decline, resulting in higher labor costs as a percentage of sales, lower margins and excess inventory, which could cause our annual operating results to suffer and our stock price to decline. Due to our seasonality, the possible adverse impact from other risks associated with our business, including atypical weather, consumer spending levels and general economic and business conditions, is potentially greater if any such risks occur during our peak sales seasons.
We currently rely on a single distribution center for our business, and if there is a natural disaster or other serious disruption at such facility, we may be unable to deliver merchandise effectively to our stores or customers.
We currently rely on a single distribution center in Salt Lake City, Utah for our business. Any natural disaster or other serious disruption at such facility due to fire, tornado, earthquake, flood or any other cause could damage our on-site inventory or impair our ability to use such distribution center. While we maintain business interruption insurance, as well as general property insurance, the amount of insurance coverage may not be sufficient to cover our losses in such an event. Any of these occurrences could impair our ability to adequately stock our stores or fulfill customer orders and harm our operating results.
Dynamic freight costs could adversely affect our business, financial condition, results of operations and our ability to accurately predict financial results.
Freight costs represent a significant portion of the cost of our products. We have experienced highly variable transportation and logistics costs over the last four years. While moderating in fiscal year 2023, we believe dynamic conditions may continue in future fiscal years. Freight rates on our products are affected by a myriad of factors, including the global economy, petroleum prices, carrier labor relations, congestion at U.S. ports and ocean freight carrier capacity.
We have experienced supply chain disruptions and delays of the supply of products from our vendors, which have had an adverse impact on our net sales and profitability.
We depend on merchandise purchased from our vendors to obtain products for our stores. We have no contractual arrangements providing for continued supply from our key vendors, and our vendors may discontinue selling to us at any time. Changes in commercial practices of our key vendors or manufacturers, such as changes in vendor support and incentives or changes in credit or payment terms, could also negatively impact our results. If we lose one or more key vendors or are unable to promptly replace a vendor that is unwilling or unable to satisfy our requirements with a vendor providing equally appealing products at comparable prices, we may not be able to offer products that are important to our merchandise assortment.
We also are subject to risks, such as the price and availability of raw materials and fabrics, labor disputes, union organizing activity, strikes, inclement weather, natural disasters, war and terrorism and adverse general economic and political conditions, that might limit our vendors’ ability to provide us with quality merchandise on a timely and cost-efficient basis. We may not be able to develop relationships with new vendors, and products from alternative sources, if any, may be of a lesser quality and more expensive than those we currently purchase. Any delay or failure in offering products to our customers could have a material adverse impact on our net sales and profitability.
27
Political and economic uncertainty and unrest in foreign countries where our merchandise vendors are located and trade restrictions upon imports from these foreign countries could adversely affect our ability to source merchandise and operating results.
In fiscal year 2023, approximately 2.3% of our merchandise was imported directly from vendors located in foreign countries, with a substantial portion of the imported merchandise being obtained directly from vendors in China and El Salvador. In addition, we believe that a significant portion of our domestic vendors obtain their products from foreign countries that may also be subject to political and economic uncertainty. We are subject to risks and uncertainties associated with changing economic, political, market and other conditions in foreign countries where our vendors are located, such as, increased import duties, tariffs, border-adjusted taxes, trade restrictions and quotas, adverse fluctuations of foreign currencies and geopolitical turmoil, such as the conflict between Russia and Ukraine and any resulting disruption, instability or volatility in the global markets and industries resulting from such conflict. Any event causing a disruption or delay of imports from foreign locations would likely increase the cost or reduce the supply of merchandise available to us and would adversely affect our operating results.
Finally, potential changes in federal restrictions on the importation of firearms and ammunition products could affect our ability to acquire certain popular brands of firearms and ammunition products from importers and wholesalers, which could negatively impact our net sales until replacements in the United States can be obtained, if at all.
We are subject to stringent and evolving U.S. obligations related to data privacy and security, and our actual or perceived failure to comply with such obligations could lead to adverse business consequences.
In the ordinary course of business, we process personal data and other sensitive information, including proprietary and confidential business data, trade secrets, intellectual property, sensitive third-party data, business plans, transactions, and financial information (collectively, sensitive data). These processing activities may subject us to numerous data privacy and security obligations, such as various laws, regulations, guidance, industry standards, external and internal privacy and security policies, contractual requirements, and other obligations relating to data privacy and security.
In the United States, federal, state, and local governments have enacted numerous data privacy and security laws, including data breach notification laws, personal data privacy laws, consumer protection laws(e.g., Section 5 of the Federal Trade Commission Act), and other similar laws (e.g., wiretapping laws). In the past few years, numerous
U.S. states—including California, Colorado, Connecticut, Utah and Virginia—have enacted comprehensive privacy
laws that impose certain obligations on covered businesses, including providing specific disclosures in privacy
notices and affording residents with certain rights concerning their personal data. As applicable, such rights may
include the right to access, correct, or delete certain personal data, and to opt-out of certain data processing
activities, such as targeted advertising, profiling, and automated decision-making. The exercise of these rights may
impact our business and ability to provide our products and services. Certain states also impose stricter requirements
for processing certain personal data, including sensitive information, such as conducting data privacy impact
assessments. These state laws allow for statutory fines for noncompliance. For example, the CCPA imposes obligations on covered businesses regarding their processing of personal data and provides for fines of up to $7,500 per intentional violation and a private right of action for certain data breaches. Similar laws are being considered in several other states, as well as at the federal and local levels, and we expect more states to pass similar laws in the future. Additionally, under various privacy laws and other obligations, we may be required to obtain certain consents to process personal data. Our inability or failure to do so could result in adverse consequences, such as threats of class-action litigation alleging violations of wiretapping laws.
In addition to data privacy and security laws, we are contractually subject to industry standards adopted by industry groups, such as the PCI DSS, and may become subject to such obligations in the future. We may also rely on vendors to process payment card data, and those vendors may be subject to PCI DSS, and our business may be negatively affected if our vendors are fined or suffer other consequences as a result of PCI DSS noncompliance.
We are also bound by other contractual obligations related to data privacy and security, and our efforts to comply with such obligations may not be successful.
28
We publish privacy policies, marketing materials, and other statements regarding data privacy and security. If these are found to be deficient, lacking in transparency, deceptive, unfair, or misrepresentative of our practices, we may be subject to investigation, enforcement actions by regulators, or other adverse consequences.
Obligations related to data privacy and security (and consumers’ data privacy expectations) are quickly changing, becoming increasingly stringent, creating regulatory uncertainty, and may be subject to differing applications and interpretations. Preparing for and complying with these obligations requires us to devote significant resources and may necessitate changes to our services, information technologies, systems, and practices and to those of any third parties that process personal data on our behalf.
Our employees and personnel use generative artificial intelligence (“AI”) technologies to perform their work, and
the disclosure and use of personal data in generative AI technologies is subject to various privacy laws and other
privacy obligations. Governments have passed and are likely to pass additional laws regulating generative AI. Our
use of this technology could result in additional compliance costs, regulatory investigations and actions, and
lawsuits. If we are unable to use generative AI, it could make our business less efficient and result in competitive
disadvantages.
We may at times be unsuccessful (or be perceived to have been unsuccessful) in our efforts to comply with our data privacy and security obligations. Moreover, despite our efforts, our personnel or third parties on whom we rely may be unsuccessful in complying with such obligations, which could negatively impact our business operations. If we or the third parties on whom we rely are unsuccessful, or are perceived to have been unsuccessful, to address or comply with applicable data privacy and security obligations, we could face significant consequences, including but not limited to: government enforcement actions (e.g., investigations, fines, penalties, audits, inspections, and similar); litigation (including class-action claims); additional reporting requirements and/or oversight; bans on processing personal data; and orders to destroy or not use personal data. Any of these events could have a material adverse effect on our reputation, business, or financial condition, including but not limited to: loss of customers; inability to process personal data or to operate in certain jurisdictions; limited ability to develop or commercialize our products; expenditure of time and resources to defend any claim or inquiry; adverse publicity; or substantial changes to our business model or operations.
Our business depends on our ability to meet our labor needs.
Our success depends in part upon our ability to attract, motivate and retain a sufficient number of qualified employees, including district managers, store managers, department managers and sales associates, who understand and appreciate our outdoor culture and are able to adequately represent this culture to our customers. We continually expand our employee base to manage our anticipated growth. Competition for non-entry level personnel, particularly for employees with retail experience, is highly competitive. Additionally, our ability to maintain consistency in the quality of customer service in our stores is critical to our success. Many of our store employees are in entry-level or part-time positions that historically have high rates of turnover. We are also dependent on the employees who staff our distribution center, many of whom are skilled. We may be unable to meet our labor needs and control our costs due to external factors such as the availability of a sufficient number of qualified persons in the work force of the markets in which we operate, competition, unemployment levels, demand for certain labor expertise, prevailing wage rates, wage inflation, changing demographics, health and other insurance costs and adoption of new or revised employment and labor laws and regulations. If we are unable to hire and retain sales associates capable of consistently providing a high level of customer service, as demonstrated by their enthusiasm for our culture and knowledge of our merchandise, our business could be materially adversely affected. Although none of our employees are currently covered by collective bargaining agreements, our employees may elect to be represented by labor unions in the future, which could increase our labor costs. Additionally, competition for qualified employees could require us to pay higher wages to attract a sufficient number of employees. An inability to recruit and retain a sufficient number of qualified individuals in the future may delay the planned openings of new stores. Any such delays, any material increases in employee turnover rates at existing stores or any increases in labor costs could have a material adverse effect on our business, financial condition or operating results.
29
Increases in the minimum wage have recently adversely affected our financial results.
Recently, several states in which we operate have enacted minimum wage increases and it is possible that other states or the federal government could also enact minimum wage increases. In fiscal year 2022 and 2023, 55 and 56 of our stores, respectively, were impacted by minimum wage increases, which increased our selling, general and administrative expenses. Base wage rates for some of our employees are at or slightly above the minimum wage. As more state minimum wage rates increase or if the federal government enacts a minimum wage increase, we may need to increase not only the wage rates of our minimum wage employees, but also the wages paid to our other hourly employees as well. Further, should we fail to increase our wages competitively in response to increasing wage rates, the quality of our workforce could decline, causing our customer service to suffer. Any increase in the cost of our labor could have an adverse effect on our operating costs, financial condition and results of operations.
Risks Related to Our Business Strategy
Our expansion into new, unfamiliar markets presents increased risks that may prevent us from being profitable in these new markets.
Over the long term, we intend to continue to expand by opening or acquiring stores in new markets, which may include small- to medium-sized markets and which may not have existing national outdoor sports retailers. As a result, we may have less familiarity with local customer preferences and encounter difficulties in attracting customers due to a reduced level of customer familiarity with our brand. Other factors that may impact our ability to open or acquire stores in new markets and operate them profitably, many of which are beyond our control, include:
Once we decide on a new market and find a suitable location, any delays in opening or acquiring new stores could impact our financial results. It is possible that events, such as delays in the entitlements process or construction delays caused by permitting or licensing issues, material shortages, labor issues, weather delays or other acts of god, discovery of contaminants, accidents, deaths or injunctions, could delay planned new store openings beyond their expected dates or force us to abandon planned openings altogether. In addition, new retail stores typically generate lower operating margins because pre-opening expenses are expensed as they are incurred and because fixed costs, as
30
a percentage of net sales, are higher. Furthermore, the substantial management time and resources which our retail store expansion strategy requires may result in disruption to our existing business operations, which may decrease our profitability.
As a result of the above factors, we cannot assure you that we will be successful in operating our stores in new markets on a profitable basis.
If we are unable to successfully develop and maintain our omni-channel strategy, we may not be able to compete effectively and our sales and profitability may be adversely affected.
Our e-commerce business is an important element of our brand and relationship with our customers, and we expect it to continue to grow. In 2021, we migrated our website to a new cloud platform with autoscaling capability, significantly increasing capacity and efficiency. E-commerce continues to be a rapidly growing sales channel for our business and an increasing source of competition in our industry. If we are unable to continue to successfully develop and maintain our omni-channel platform, we may not be able to compete effectively and our sales and profitability may be adversely affected. Our future success could also be adversely affected if we are unable to identify and capitalize on retail trends, including technology, e-commerce and other process efficiencies to gain market share and better service our customers.
In addition, many of our competitors already have e-commerce businesses that are substantially larger and more developed than ours, which places us at a competitive disadvantage. There are also regulatory restrictions on the online sale of a portion of our product offerings, such as ammunition, certain cutlery, firearms, propane and reloading powder. If we are unable to expand our e-commerce business, our growth plans will suffer and the price of our common stock could decline.
We are also vulnerable to additional risks and uncertainties associated with e-commerce sales, including rapid changes in technology, website downtime and other technical failures, security incidents, cyber-attacks, consumer privacy concerns, changes in state tax regimes and government regulation of internet activities. Our failure to successfully respond to these risks and uncertainties could reduce our e-commerce same store sales, increase our costs, diminish our growth prospects and damage our brand, which could negatively impact our results of operations and stock price.
If our information technology systems, or those of third parties upon which we rely, or our data are or were compromised, we could experience adverse consequences.
We and the third parties upon which we rely face a variety of evolving threats, which could cause security incidents, such as cyber-attacks, malicious internet-based activity, online and offline fraud, and other similar activities. Such threats are prevalent and continue to rise, are increasingly difficult to detect, and come from a variety of sources, including traditional computer “hackers,” threat actors, “hacktivists,” organized criminal threat actors, personnel (such as through theft or misuse), sophisticated nation states, and nation-state supported actors. Some actors now engage and are expected to continue to engage in cyber-attacks, including without limitation nation-state actors for geopolitical reasons and in conjunction with military conflicts and defense activities. During times of war and other major conflicts, we and the third parties upon which we rely may be vulnerable to a heightened risk of these attacks, including retaliatory cyber-attacks, that could materially disrupt our systems and operations, supply chain, and ability to produce, sell and distribute our products.
These threats include but are not limited to social-engineering attacks (including through deep fakes, which may increasingly difficult to identify as fake, and phishing attacks), malicious code (such as viruses and worms), malware (including as a result of advanced persistent threat intrusions), denial-of-service attacks, credential stuffing, credential harvesting, personnel misconduct or error, ransomware attacks, supply-chain attacks, software bugs, server malfunctions, software or hardware failures, loss of data or other information technology assets, adware, attacks enhanced or facilitated by AI, telecommunications failures, earthquakes, fires, floods, and other similar threats. In particular, severe ransomware attacks are becoming increasingly prevalent and can lead to significant interruptions in our operations, ability to provide our products or services, loss of sensitive data and income, reputational harm, and diversion of funds. Extortion payments may alleviate the negative impact of a ransomware
31
attack, but we may be unwilling or unable to make such payments due to, for example, applicable laws or regulations prohibiting such payments.
Remote work has become more common and has increased risks to our information technology systems and data, as more of our employees utilize network connections, computers, and devices outside our premises or network, including working at home, while in transit and in public locations. Additionally, future or past business transactions (such as acquisitions or integrations) could expose us to additional cybersecurity risks and vulnerabilities, as our systems could be negatively affected by vulnerabilities present in acquired or integrated entities’ systems and technologies. Furthermore, we may discover security issues that were not found during due diligence of such acquired or integrated entities, and it may be difficult to integrate companies into our information technology environment and security program.
In addition, we rely on third parties and their technologies to operate critical business systems to process sensitive data in a variety of contexts and to provide other products, services, parts, or otherwise to operate our business. Our ability to monitor these third parties’ information security practices is limited, and these third parties may not have adequate information security measures in place. If the third parties upon whom we rely experience a security incident or other interruption, we could experience adverse consequences. While we may be entitled to damages if these parties fail to satisfy their privacy or security-related obligations to us, any award may be insufficient to cover our damages, or we may be unable to recover such award. In addition, supply-chain attacks have increased in frequency and severity, and we cannot guarantee that third parties’ infrastructure in our supply chain or our third-party partners’ supply chains have not been compromised.
While we have implemented security measures designed to protect against security incidents, there can be no
assurance that these measures will be effective. We take steps designed to detect, mitigate, and remediate
vulnerabilities in our information systems (such as our hardware and/or software, including that of third parties upon
which we rely). We may not, however, detect and remediate all such vulnerabilities or on a timely basis.
Further, we may experience delays in developing and deploying remedial measures designed to address any such
identified vulnerabilities, which could be exploited and result in a security incident.
Any of the previously identified or similar threats could cause a security incident or other interruption that could result in unauthorized, unlawful, or accidental acquisition, modification, destruction, loss, alteration, encryption, disclosure of, or access to our sensitive data or our information technology systems, or those of the third parties upon whom we rely.
We may expend significant resources or modify our business activities to try to protect against security incidents. Additionally, certain data privacy and security obligations may require us to implement and maintain specific security measures to protect our information technology systems and sensitive data.
Applicable data privacy and security obligations may require us to notify relevant stakeholders, including affected individuals, customers, regulators, and investors, of security incidents, which can be costly and lead to adverse consequences.
If we (or a third party upon whom we rely) experience a security incident or are perceived to have experienced a security incident, we may experience adverse consequences, such as government enforcement actions (for example, investigations, fines, penalties, audits, and inspections); additional reporting requirements and/or oversight; restrictions on processing sensitive data (including personal data); litigation (including class claims); indemnification obligations; negative publicity; reputational harm; monetary fund diversions; diversion of management attention; interruptions in our operations (including availability of data); financial loss; and other similar harms. Security incidents and attendant consequences may prevent or cause customers to stop using our services, deter new customers from using our services, and negatively impact our ability to grow and operate our business.
Our contracts may not contain limitations of liability, and even where they do, there can be no assurance that limitations of liability in our contracts are sufficient to protect us from liabilities, damages, or claims related to our data privacy and security obligations. We cannot be sure that our insurance coverage will be adequate or sufficient
32
to protect us from or to mitigate liabilities arising out of our privacy and security practices, that such coverage will continue to be available on commercially reasonable terms or at all, or that such coverage will pay future claims.
In addition to experiencing a security incident, third parties may gather, collect, or infer sensitive data about us from public sources, data brokers, or other means that reveals competitively sensitive details about our organization and could be used to undermine our competitive advantage or market position. Additionally, sensitive data of the Company or our customers could be leaked, disclosed, or revealed as a result of or in connection with our employees’, personnel’s, or vendors’ use of generative AI technologies.
Our computer hardware and software systems are vulnerable to damage from natural disasters, power loss or other events outside of our control that could harm our business.
Our success, in particular our ability to successfully manage inventory levels, largely depends upon the efficient operation of our computer hardware and software systems. We use management information systems to track inventory information at the store level, communicate customer information and aggregate daily sales, margin and promotional information. These systems are vulnerable to damage or interruption from natural disasters, power loss, computer system failures, telecommunications failures, misappropriation and similar events, including those
addressed in “Risks Related to Our Business Strategy—If our information technology systems, or those of third
parties upon which we rely, or our data are or were compromised, we could experience adverse consequences.”
Any failure that causes an interruption in our systems processing could disrupt our operations and result in reduced sales. We have centralized the majority of our computer systems in our corporate office. It is possible that an event or disaster at our corporate office could materially and adversely affect the performance of our company and the ability of each of our stores to operate efficiently.
Our planned growth may strain our business infrastructure, which could adversely affect our operations and financial condition.
Over time, we expect to expand the size of our retail store network in new and existing markets. As we grow, we will face the risk that our existing resources and systems, including management resources, accounting and finance personnel and operating systems, may be inadequate to support our growth. We cannot assure you that we will be able to retain the personnel or make the changes in our systems that may be required to support our growth. Failure to secure these resources and implement these systems on a timely basis could have a material adverse effect on our operating results. In addition, hiring additional personnel and implementing changes and enhancements to our systems will require capital expenditures and other increased costs that could also have a material adverse impact on our operating results.
Our expansion in new markets may also create new distribution and merchandising challenges, including strain on our distribution facility, an increase in information to be processed by our management information systems and diversion of management attention from existing operations towards the opening of new stores and markets. To the extent that we are not able to meet these additional challenges, our sales could decrease and our operating expenses could increase.
Our private label brand offerings expose us to various risks.
We expect to continue to grow our exclusive private label brand offerings through a combination of brands that we own and brands that we license from third parties. We have invested in our development and procurement resources and marketing efforts relating to these private brand offerings. Although we believe that our private brand products offer value to our customers at each price point and provide us with higher gross margins than comparable third-party branded products we sell, the expansion of our private brand offerings also subjects us to certain specific risks in addition to those discussed elsewhere in this section, such as:
33
An increase in sales of our private brands may also adversely affect sales of our vendors’ products, which may, in turn, adversely affect our relationship with our vendors. Our failure to adequately address some or all of these risks could have a material adverse effect on our business, results of operations and financial condition.
We may pursue strategic acquisitions or investments, and the failure of an acquisition or investment to produce the anticipated results or the inability to fully integrate the acquired companies could have an adverse impact on our business.
We may from time to time acquire or invest in complementary companies, businesses or assets. The success of such acquisitions or investments will be based on our ability to make accurate assumptions regarding the valuation, operations, growth potential, integration and other factors relating to the respective business or assets. Our acquisitions or investments may not produce the results that we expect at the time we enter into or complete the transaction. For example, we may not be able to capitalize on previously anticipated synergies. Furthermore, acquisitions may result in dilutive issuances of our equity securities, the incurrence of debt, contingent liabilities, amortization expenses or write-offs of goodwill or other intangibles, any of which could harm our financial condition or results of operations. We also may not be able to successfully integrate operations that we acquire, including their personnel, financial systems, supply chain and other operations, which could adversely affect our business. Acquisitions may also result in the diversion of our capital and our management’s attention from other business issues and opportunities.
Risks Related to Liquidity and Capital Resources
Our ability to operate and expand our business and to respond to changing business and economic conditions will depend on the availability of adequate capital.
The operation of our business, the rate of our expansion and our ability to respond to changing business and economic conditions depend on the availability of adequate capital, which in turn depends on cash flow generated by our business and, if necessary, the availability of equity or debt capital. We will also need sufficient cash flow to meet our obligations under our existing debt agreements.
The amount that we are able to borrow and have outstanding under our revolving credit facility at any given time is subject to a borrowing base calculation. As a result, our ability to borrow is subject to certain risks and uncertainties, such as a deterioration in the quality of our inventory (which is the largest asset in our borrowing base), a decline in sales activity and the collection of our receivables, which could reduce the funds available to us under our revolving credit facility.
We cannot assure you that our cash flow from operations or cash available under our revolving credit facility will be sufficient to meet our needs. If we are unable to generate sufficient cash flows from operations in the future, and if availability under our revolving credit facility is not sufficient, we may have to obtain additional financing. If we obtain additional capital by issuing equity, the interests of our existing stockholders will be diluted. If we incur additional indebtedness, that indebtedness may contain significant financial and other covenants that may significantly restrict our operations, and our ability to fund expansion or take advantage of future opportunities. We cannot assure you that we could obtain refinancing or additional financing on favorable terms or at all.
34
Our revolving credit facility contains restrictive covenants that may impair our ability to access sufficient capital and operate our business.
Our revolving credit facility contains various provisions that limit our ability to, among other things, incur, create or assume certain indebtedness; create, incur or assume certain liens; make certain investments; make sales, transfers and dispositions of certain property; undergo certain fundamental changes, including certain mergers, liquidations and consolidations; purchase, hold or acquire certain investments; and declare or make certain dividends and distributions. These covenants may affect our ability to operate and finance our business as we deem appropriate. If we are unable to meet our obligations as they become due or to comply with various financial covenants contained in the instruments governing our current or future indebtedness, this could constitute an event of default under the instruments governing our indebtedness.
If there were an event of default under the instruments governing our indebtedness, the holders of the affected indebtedness could declare all of that indebtedness immediately due and payable, which, in turn, could cause the acceleration of the maturity of all of our other indebtedness. We may not have sufficient funds available, or we may not have access to sufficient capital from other sources, to repay any accelerated debt. Even if we could obtain additional financing, the terms of the financing may not be favorable to us. In addition, substantially all of our assets are subject to liens securing our revolving credit facility and term loan. If amounts outstanding under the revolving credit facility or term loans were accelerated, our lenders could foreclose on these liens and we could lose substantially all of our assets. Any event of default under the instruments governing our indebtedness could have a material adverse effect on our business, financial condition and results of operations.
An increase in market interest rates could increase our interest costs on existing and future debt and could adversely affect our stock price.
Our existing debt obligations are variable rate obligations with interest and related payments that vary with the movement of certain indices, and in the future, we may incur additional indebtedness in connection with the entry into new credit facilities or the financing of any acquisition. If interest rates increase, so could our interest costs for any new debt and our variable rate debt obligations under our revolving credit facility and term loan. This increased cost could make the financing of any acquisition more costly, as well as lower our current period earnings. Rising interest rates could limit our ability to refinance existing debt when it matures or cause us to pay higher interest rates upon refinancing. All of our debt outstanding under our credit agreement as of February 3, 2024 bears interest at a floating rate that uses the Secured Overnight Financing Rate ("SOFR") as the applicable reference rate to calculate the interest. Due to increased federal reserve rates we experienced higher interest rates in fiscal years 2022 and 2023. We anticipate that interest rates will remain elevated during fiscal year 2024.
Risks Related to Our Common Stock
Our bylaws, our certificate of incorporation and Delaware law contain provisions that could discourage another company from acquiring us and may prevent attempts by our stockholders to replace or remove our current management.
Provisions of our bylaws, our certificate of incorporation and Delaware law may discourage, delay or prevent a merger or acquisition that stockholders may consider favorable, including transactions in which our stockholders might otherwise receive a premium for their shares. In addition, these provisions may frustrate or prevent any attempts by our stockholders to replace or remove our current management by making it more difficult for stockholders to replace or remove our board of directors. These provisions include:
35
In addition, we are subject to Section 203 of the Delaware General Corporation Law. In general, subject to some exceptions, Section 203 prohibits a Delaware corporation from engaging in any “business combination” with any “interested stockholder” (which is generally defined as an entity or person who, together with the person’s affiliates and associates, beneficially owns, or within three years prior to the time of determination of interested stockholder status did own, 15% or more of the outstanding voting stock of the corporation), for a three-year period following the date that the stockholder became an interested stockholder. Section 203 could have the effect of delaying, deferring or preventing a change in control that our stockholders might consider to be in their best interests.
Further, our certificate of incorporation provides that, subject to limited exceptions, the Court of Chancery of the State of Delaware will be, to the fullest extent permitted by law, the exclusive forum for any derivative action or proceeding brought on our behalf; any action asserting a breach of fiduciary duty; any action asserting a claim against us arising pursuant to the Delaware General Corporation Law; or any action asserting a claim against us that is governed by the internal affairs doctrine. Our bylaws also designate the U.S. federal courts as the exclusive forum for all claims arising under the Securities Act of 1933, as amended (the "Securities Act"). These exclusive forum provisions may limit a stockholder’s ability to bring a claim in a judicial forum that it finds favorable for disputes with us or our directors, officers or other employees and agents, which may discourage such lawsuits against us and our directors, officers, employees and agents.
Together, these charter and statutory provisions could make the removal of management more difficult and may discourage transactions that otherwise could involve payment of a premium over prevailing market prices for our common stock. The existence of the foregoing provisions and anti-takeover measures could limit the price that investors might be willing to pay in the future for shares of our common stock. They could also deter potential acquirers of our company, thereby potentially reducing the likelihood that our stockholders could receive a premium for their common stock in an acquisition.
We expect that the price of our common stock will fluctuate.
The price of our common stock is volatile and may fluctuate significantly. During our fiscal year ended February 3, 2024, the closing price of our stock ranged from a high of $9.98 per share to a low of $3.33 per share. Volatility in the market price of our common stock may prevent our stockholders from being able to sell their common stock at or above the prices they paid for their common stock. The market price for our common stock could fluctuate significantly for various reasons, including, among other things, our operating and financial performance; conditions that impact demand for our products; the public’s reaction to our press releases or other public announcements; changes in earnings estimates or recommendations by securities analysts; market and industry perception of our success, or lack thereof, in pursuing our growth strategy; strategic actions by us or our competitors, such as acquisitions, store closures, or restructurings; actual or anticipated changes in federal and state government regulation, including regulations related to the sale of firearms and ammunition; sales of common stock by us or members of our management team; and changes in general market, economic and political conditions in the United States, including those resulting from natural disasters, health crises or pandemics, terrorist attacks, acts of war and responses to such events.
In addition, if the market for stocks in our industry, or the stock market in general, experiences a loss of investor confidence, the trading price of our common stock could decline for reasons unrelated to our business, financial condition or results of operations. If any of the foregoing occurs, it could cause our stock price to fall and may expose us to lawsuits that, even if unsuccessful, could be costly to defend and distract our management.
36
General Risks
Our inability or failure to protect our intellectual property could have a negative impact on our operating results.
Our trademarks, service marks, copyrights, patents, trade secrets, domain names and other intellectual property are valuable assets that are critical to our success. The unauthorized reproduction or other misappropriation of our intellectual property could diminish the value of our brands or goodwill and cause a decline in our net sales. Any infringement or other intellectual property claim made against us, whether or not it has merit, could be time-consuming, result in costly litigation, cause product delays or require us to enter into royalty or licensing agreements. As a result, any such claim could have a material adverse effect on our operating results.
Corporate responsibility, specifically related to environmental, social and governance (“ESG”) matters, may impose additional costs and expose us to new risks.
Public ESG and sustainability reporting is becoming more broadly expected by investors, shareholders and other third parties. Certain organizations that provide corporate governance and other corporate risk information to investors and shareholders have developed, and others may in the future develop, scores and ratings to evaluate companies and investment funds based upon ESG or “sustainability” metrics. Many investment funds focus on positive ESG business practices and sustainability scores when making investments and may consider a company’s ESG or sustainability scores as a reputational or other factor in making an investment decision. In addition, investors, particularly institutional investors, use these scores to benchmark companies against their peers and if a company is perceived as lagging, these investors may engage with such company to improve ESG disclosure or performance and may also make voting decisions, or take other actions, to hold these companies and their boards of directors accountable. Board diversity is an ESG topic that is, in particular, receiving heightened attention by investors, shareholders, lawmakers and listing exchanges. Certain states have passed laws requiring companies to meet certain gender and ethnic diversity requirements on their boards of directors. We may face reputational damage in the event our corporate responsibility initiatives or objectives, including with respect to board diversity, do not meet the standards set by our investors, shareholders, lawmakers, listing exchanges or other constituencies, or if we are unable to achieve an acceptable ESG or sustainability rating from third party rating services. A low ESG or sustainability rating by a third-party rating service could also result in the exclusion of our common stock from consideration by certain investors who may elect to invest with our competition instead. Ongoing focus on corporate responsibility matters by investors and other parties as described above may impose additional costs or expose us to new risks.
ITEM 1B. UNRESOLVED STAFF COMMENTS
None.
ITEM 1C. CYBERSECURITY
Risk management and strategy
We have implemented and maintain various information security processes designed to identify, assess and manage material risks from cybersecurity threats to our critical computer networks, third party hosted services, communications systems, hardware and software, and our critical data, including intellectual property, confidential information that is proprietary, strategic or competitive in nature, and information related to our customers and employees.
Our Information Security Department and Security Management functions, led by our Chief Information Officer (“CIO”) and supported by our Director of Information Security and Compliance, (collectively, “Security Team”), help identify, assess and manage the Company’s cybersecurity threats and risks. The Security Team identifies and assesses risks from cybersecurity threats by monitoring and evaluating our threat environment using various methods including, for example: manual and automated tools in certain environments and systems, internal and external audits of certain environments and systems, conducting scans of certain threat environments, evaluating our and our industry’s risk profile, analyzing certain reports of threats and actors, conducting threat assessments for
37
internal and external threats (including third party threat assessments) in certain environments, coordinating with law enforcement concerning select threats, subscribing to reports and services that identify cybersecurity threats, use of external intelligence feeds, conducting tabletop incident response exercises, evaluating certain threats reported to us, and conducting vulnerability assessments of certain environments and systems..
Depending on the environment and system, we implement and maintain various technical, physical, and organizational measures, processes, standards and policies designed to manage and mitigate material risks from cybersecurity threats to our information systems and data, including, for example: incident response policy, vulnerability management policy, risk assessments, encryption of certain data, network security controls and data segregation for certain environments and systems, access controls for certain environments and systems (such as identity controls and quarterly user access reviews), physical security, systems monitoring for certain systems, vendor risk management program, system configuration standards, employee security awareness training, asset management, managed detection and response tools, penetration testing, cybersecurity insurance and dedicated cybersecurity staff.
Our assessment and management of material risks from cybersecurity threats are integrated into the Company’s overall risk management processes. For example, the Security Team works with management to prioritize our risk management processes and mitigate cybersecurity threats that are more likely to lead to a material impact to our business.
We use third-party service providers to assist us from time to time to identify, assess and manage material risks from cybersecurity threats, including, for example: professional service firms including legal counsel, threat intelligence service providers, cybersecurity consultants, 24/7 cybersecurity monitoring software providers, managed cybersecurity service providers, penetration testing firms, dark web monitoring services and forensic investigators, managed detection and response providers, and external threat hunting partners.
We use third-party service providers to perform a variety of functions throughout our business, such as hosting companies and application providers. We have a vendor management program to manage cybersecurity risks associated with our use of certain of these providers. The program includes a risk assessment and security questionnaire for certain providers, review of security assessments for certain providers, and System and Organization Controls report reviews when determined necessary. Depending on the nature of the services provided, the sensitivity of the information systems and data at issue, and the identity of the provider, our vendor management process may involve different levels of assessment designed to help identify cybersecurity risks associated with a provider and impose contractual obligations related to cybersecurity on the provider.
For a description of the risks from cybersecurity threats that may materially affect the Company and how they may do so, see our risk factors under Part 1. Item 1A. Risk Factors in this Annual Report on Form 10-K.
Governance
Our board of directors addresses the Company’s cybersecurity risk management as part of its general oversight function. The board of directors’ audit committee is responsible for overseeing the Company’s cybersecurity risk management processes, including oversight and mitigation of risks from cybersecurity threats.
Our cybersecurity risk assessment and management processes are implemented and maintained by certain Company management, including our CIO and our Director of Information Security and Compliance, who has over 20 years of experience in the information technology industry and is a Certified Information Systems Security Professional (CISSP).
Our CIO is responsible for hiring appropriate personnel, helping to integrate cybersecurity risk considerations into the Company’s overall risk management strategy, and communicating key priorities to relevant personnel. Our CIO, Director of Information Security and Compliance and the CFO are responsible for approving budgets, helping prepare for cybersecurity incidents, approving cybersecurity processes, and reviewing security assessments and other security-related reports.
Our cybersecurity incident response and vulnerability management policies are designed to escalate certain cybersecurity incidents to members of management depending on the circumstances, including Security Management, the CIO, the Chief Executive Officer and others. These individuals work with the Company’s incident response team, pursuant to a documented incident response plan, to help the Company mitigate and remediate cybersecurity incidents of which they are notified. In addition, the Company’s incident response and
38
vulnerability management policies include reporting to the audit committee of the board of directors for certain cybersecurity incidents.
The audit committee receives regular reports from the Security Team concerning the Company’s significant cybersecurity threats and risk and the processes the Company has implemented to address them. The audit committee also receives various reports, summaries or presentations related to cybersecurity threats, risk and mitigation.
ITEM 2. PROPERTIES
We do not own any material real property nor do we plan to do so. Instead, we lease all of our store locations and expect to lease our future store locations. From time to time we will self-develop one of our properties with the intention to enter into a sale-leaseback transaction with a third party. Depending upon where we are in the process of completing the sale-leaseback transaction, we may legally own real property at any particular balance sheet date. Our corporate headquarters is located in an approximately 70,000 square foot building in West Jordan, Utah. The building is leased under an agreement expiring on March 31, 2035.
Our distribution center is located in a 507,000 square foot facility in Salt Lake City, Utah. The building is leased under an agreement expiring on December 31, 2028, with three options that each allow us to extend for an additional five years.
We currently operate 146 retail stores in 32 states. See “Part I, Item 1, Business – Our Stores” for a breakdown of our retail stores by state. In total we have approximately 5.4 million gross square feet across all of our stores. All of our stores are leased from third parties with lease terms typically ranging from five to fifteen years, and many of our lease agreements have additional five-year renewal options. All of our leases provide for additional payments associated with common area maintenance, real estate, taxes and insurance. In addition, many of our lease agreements have defined escalating rent provisions over the initial term and extensions.
ITEM 3. LEGAL PROCEEDINGS
See “Part II, Item 8, Financial Statements and Supplementary Data—Notes to Consolidated Financial Statements Note 14, Commitments and Contingencies—Legal Matters” for information regarding our material legal proceedings, which information is incorporated by reference into this Item 3.
ITEM 4. MINE SAFETY DISCLOSURES
Not Applicable.
PART II
ITEM 5. MARKET FOR REGISTRANT’S COMMON EQUITY, RELATED STOCKHOLDER MATTERS AND ISSUER PURCHASES OF EQUITY SECURITIES
Market Information
Our common stock is listed on the Nasdaq Global Select Market under the symbol “SPWH.”
Holders
As of March 25, 2024, there were 202 holders of record of our common stock. This number does not include persons who hold our common stock in nominee or “street name” accounts through brokers, banks or other institutions on behalf of stockholders.
39
Dividend Policy
We did not pay any dividends in fiscal year 2023 or fiscal year 2022. We do not anticipate paying any cash dividends in the foreseeable future. Any future determination to pay dividends will be at the discretion of our board of directors, subject to compliance with applicable law and any applicable contractual provisions.
Purchases of Equity Securities by the Issuer and Affiliated Purchasers
On March 24, 2022, our board of directors authorized a share repurchase program to provide for the repurchase of up to $75.0 million of outstanding shares of our common stock during the period from March 31, 2022 to March 31, 2023. On March 15, 2023, our board of directors extended the term of the share repurchase program through March 31, 2024. We may repurchase shares of our common stock at any time or from time to time, without prior notice, subject to market conditions and other considerations. Our repurchases may be made through Rule 10b5-1 plans, accelerated share repurchase transactions, open market purchases, privately negotiated transactions, tender offers, block purchases or other transactions. We intend to fund repurchases under the repurchase program using cash on hand or available borrowings under our revolving credit facility. We have no obligation to repurchase any shares of our common stock under the share repurchase program and we may modify, suspend or discontinue it at any time. During the fourteen weeks ended February 3, 2024, we did not repurchase any shares of our common stock. As of February 3, 2024, we had repurchased 7,326,507 shares of our common stock for $67.5 million, utilizing cash on hand and available borrowings under our revolving credit facility. As of February 3, 2024, $7.5 million remained available to us for repurchases of outstanding shares of our common stock pursuant to the share repurchase program.
Stock Performance Graph
The stock price performance graph below shall not be deemed soliciting material or to be filed with the SEC or subject to Regulation 14A or 14C under the Exchange Act or to the liabilities of Section 18 of the Exchange Act, nor shall it be incorporated by reference into any past or future filing under the Securities Act or the Exchange Act, except to the extent we specifically request that it be treated as soliciting material or specifically incorporate it by reference into a filing under the Securities Act or the Exchange Act.
The following graph shows the cumulative total stockholder return of an investment of $100 in cash at market close on February 2, 2019 through February 3, 2024 for (i) our common stock (“SPWH”), (ii) the S&P 500 Retailing Industry Group Index (“S&P Retail”) and (iii) the Russell 2000 Index (“Russell 2000”). Pursuant to applicable SEC rules, all values assume reinvestment of the full amount of all dividends. The stockholder return shown on the graph below is not necessarily indicative of future performance, and we do not make or endorse any predictions as to future stockholder returns.
40
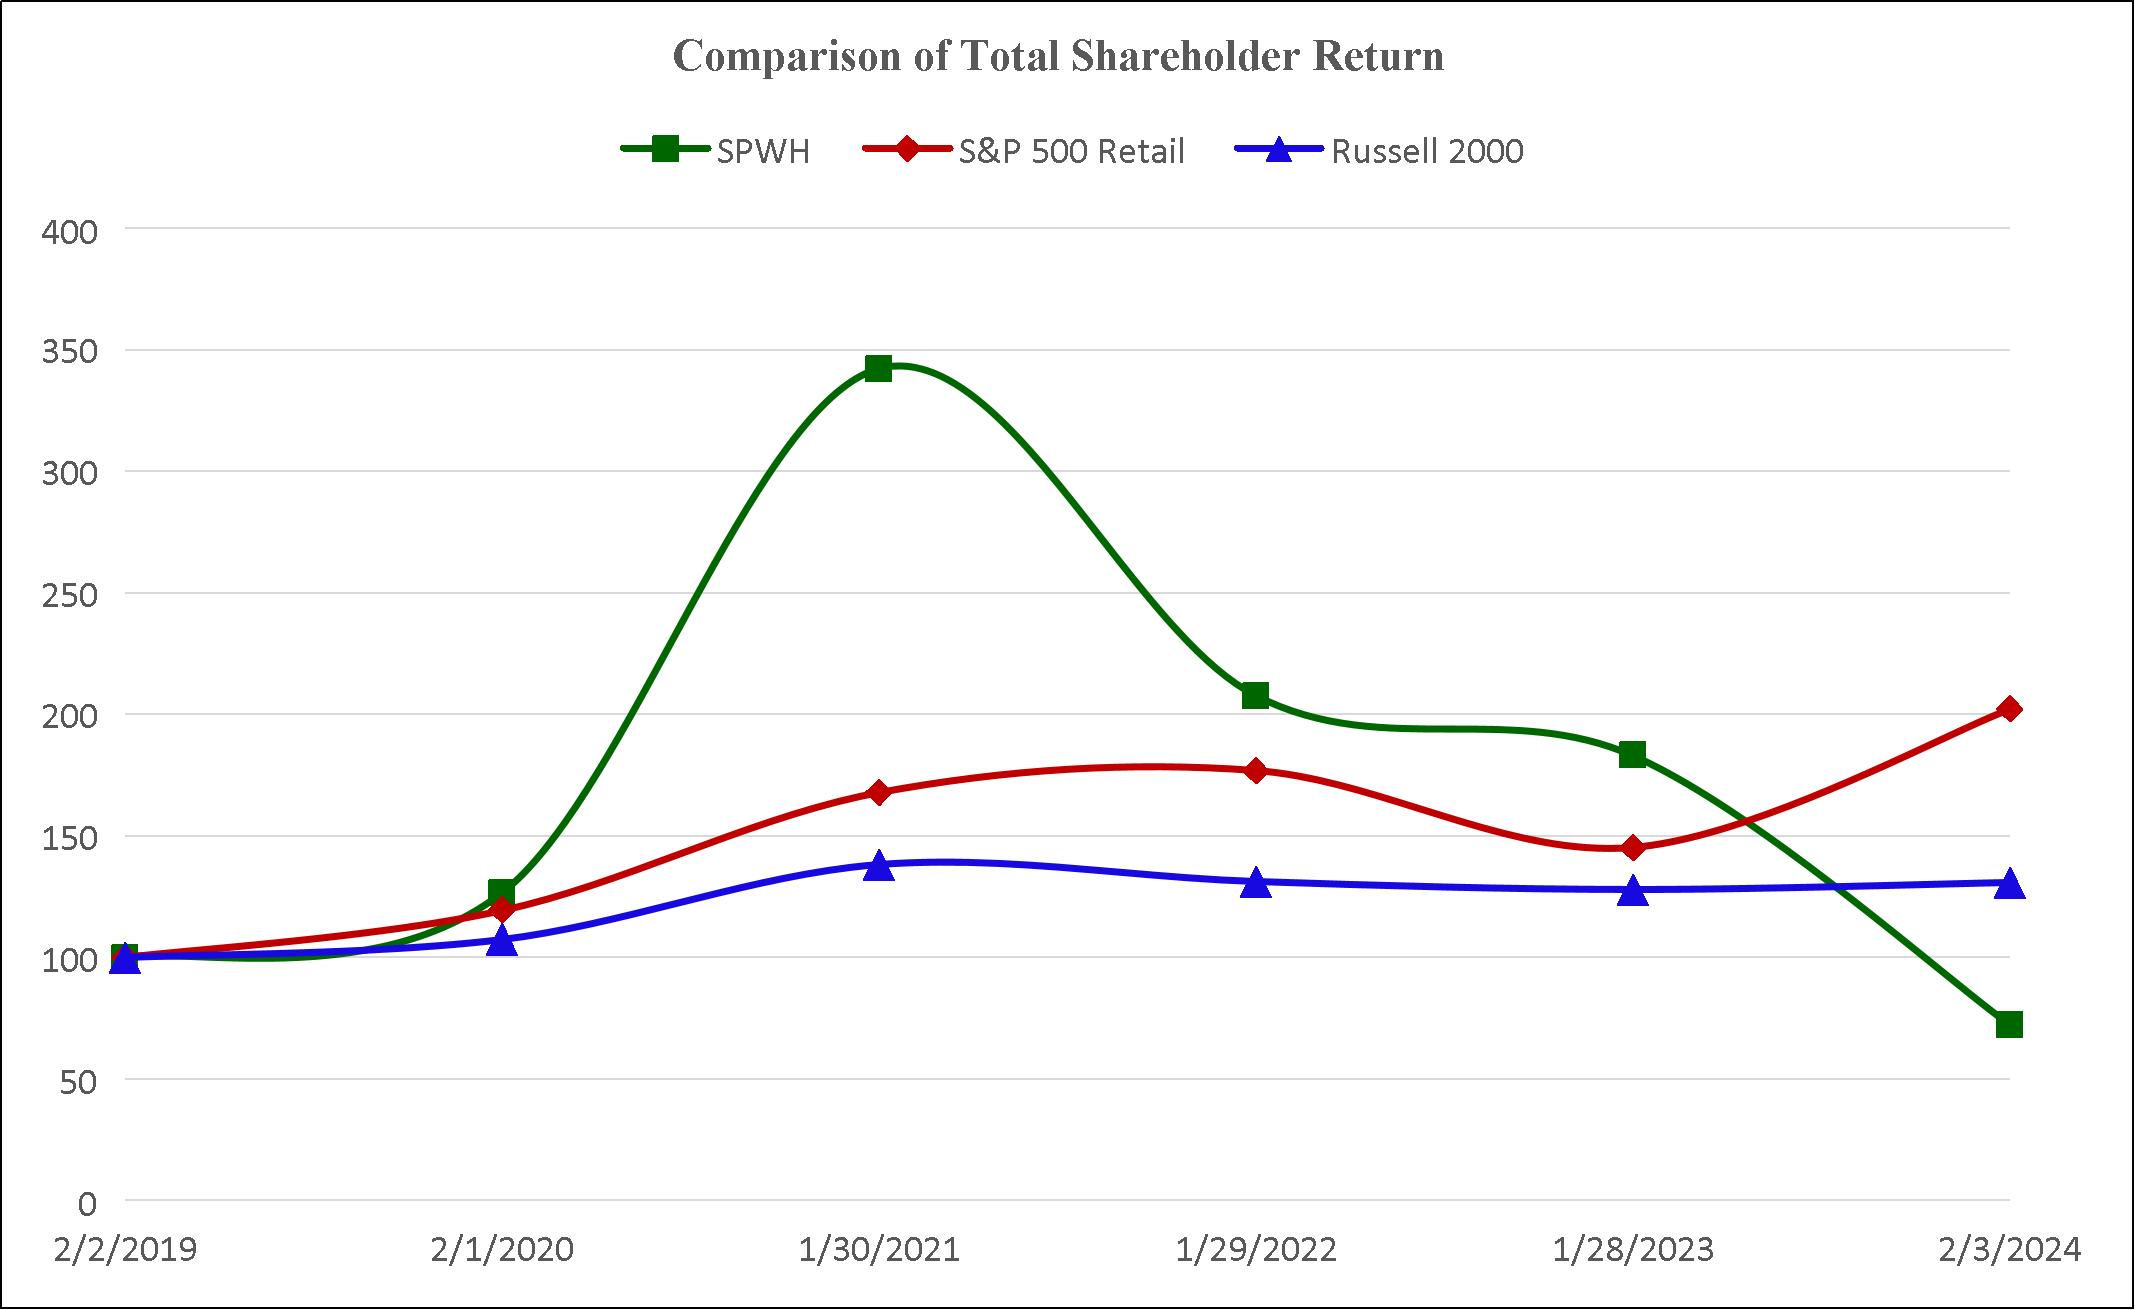
|
|
Fiscal Years Ended |
|
|||||||||||||||||||||
|
|
February 2, 2019 |
|
|
February 1, 2020 |
|
|
January 30, 2021 |
|
|
January 29, 2022 |
|
|
January 28, 2023 |
|
|
February 3, 2024 |
|
||||||
SPWH |
|
$ |
100.00 |
|
|
$ |
126.56 |
|
|
$ |
342.19 |
|
|
$ |
207.81 |
|
|
$ |
183.20 |
|
|
$ |
72.27 |
|
S&P Retail |
|
|
100.00 |
|
|
|
119.51 |
|
|
|
167.91 |
|
|
|
176.76 |
|
|
|
145.13 |
|
|
|
202.14 |
|
Russell 2000 |
|
|
100.00 |
|
|
|
107.46 |
|
|
|
138.05 |
|
|
|
131.05 |
|
|
|
127.79 |
|
|
|
130.67 |
|
ITEM 6. [RESERVED]
41
ITEM 7. MANAGEMENT’S DISCUSSION AND ANALYSIS OF FINANCIAL CONDITION AND RESULTS OF OPERATIONS
The discussion below contains forward-looking statements that involve risks and uncertainties. Our actual results could differ materially from those anticipated in these forward-looking statements as a result of various factors, including those which are discussed in the “Risk Factors” section in Part I, Item 1A of this 10-K. Also see “Special Note Regarding Forward-Looking Statements” preceding Part I. Additionally, our historical results are not necessarily indicative of the results that may be expected for any period in the future.
The following discussion and analysis should be read in conjunction with, and is qualified in its entirety by reference to, the consolidated financial statements and the notes thereto included in this 10-K.
Overview
We are an outdoor sporting goods retailer focused on meeting the everyday needs of the seasoned outdoor veteran, the first-time participant and everyone in between. Our mission is to provide outstanding gear and exceptional service to inspire outdoor memories.
Our business was founded in 1986 as a single retail store in Midvale, Utah. Today, we operate 146 stores in 32 states, totaling approximately 5.4 million gross square feet. During fiscal year 2023, we increased our gross square footage by 10.1% through the opening of 15 store locations. We also operate an e-commerce platform at www.sportsmans.com.
Our stores and our e-commerce platform are aggregated into one operating and reportable segment.
Impact of Macroeconomic Conditions
Our financial results and operations have been, and will continue to be, impacted by events outside of our control.
During the COVID-19 pandemic, we experienced increases in net sales compared to pre-pandemic levels, primarily driven by historically high sales in certain product categories, particularly firearms and ammunition. However, while our net sales and same store sales for fiscal year 2023 remained elevated as compared to pre-COVID periods, we experienced decreases in net sales and same store sales during fiscal year 2023 from the COVID-driven peak levels in fiscal year 2021.
Global economic and business activities continue to face widespread macroeconomic uncertainties, including labor shortages, inflation and monetary supply shifts, rising interest rates, recession risks and potential disruptions from the Russia-Ukraine conflict and the Israel-Hamas war. Starting in the second half of fiscal year 2022 and continuing through fiscal year 2023, our business was impacted by consumer inflationary pressures and recession concerns. As a result of our recent performance, we have taken steps to reduce our total inventory, implement cost reduction measures to reflect current sales trends and reduce investments in future new store openings. We currently do not plan to open any new stores during fiscal year 2024.
We continue to actively monitor the impact of these macroeconomic factors on our financial condition, liquidity, operations, suppliers, industry and workforce. The extent of the impact of these factors on our operational and financial performance, including our ability to execute our business strategies and initiatives in the expected timeframe, will depend on future developments, and the impact on our customers, partners and employees, all of which are uncertain and cannot be predicted; however, any continued or renewed disruption resulting from these factors could negatively impact our business.
Fiscal Year
We operate using a 52/53-week fiscal year ending on the Saturday closest to January 31. Fiscal years 2023, 2022 and 2021 ended on February 3, 2024, January 28, 2023 and January 29, 2022, respectively. Fiscal year 2023 contained 53 weeks of operation and each of fiscal years 2022 and 2021 contained 52 weeks of operations.
42
How We Assess the Performance of Our Business
In assessing the performance of our business, we consider a variety of performance and financial measures. The key measures for determining how our business is performing are net sales, same store sales, gross margin, selling, general and administrative expenses, income from operations and Adjusted EBITDA, which we define as net (loss) income plus interest expense, income tax (benefit) expense, depreciation and amortization, stock-based compensation expense, director and officer transition costs, expenses related to the implementation of our cost reduction plan and a one-time legal settlement and related fees and expenses that we do not believe are indicative of our ongoing expenses.
Net Sales and Same Store Sales
Our net sales are primarily received from revenue generated in our stores and also include sales generated through our e-commerce platform. When measuring revenue generated from our stores, we review our same store sales as well as the performance of our stores that have not operated for a sufficient amount of time and include each in same store sales. We include net sales from a store in same store sales on the first day of the 13th full fiscal month following the store’s grand opening or acquisition by us. We exclude sales from stores that were closed during the period from our same store sales calculation. We include net sales from e-commerce in our calculation of same store sales. For fiscal years consisting of 53 weeks, we exclude net sales during the 53rd week from our calculation of same store sales. Some of our competitors and other retailers may calculate same store sales differently than we do. As a result, data regarding our same store sales may not be comparable to similar data made available by other retailers.
Measuring the change in year-over-year same store sales allows us to evaluate how our retail store base is performing. Various factors affect same store sales, including:
We operate in a complex regulatory and legal environment that could negatively impact the demand for our products, which could significantly affect our operations and financial results. State, local and federal laws and regulations relating to products that we sell may change, sometimes significantly, as a result of political, economic or social events. For instance, in November 2022, the State of Oregon passed legislation that will, among other things, impose complex permitting and training requirements for the purchases of firearms. As a result, sales of firearms in Oregon may be halted or substantially diminished until such permitting and training programs are developed by the state, which may take a significant amount of time. If that were to occur, it could result in a substantial decline in our sales of firearms and related products and reduce traffic to our stores in Oregon, which could have a substantial impact on our sales and gross margin. On December 6, 2022, a state court judge in Oregon temporarily blocked the enforcement of such legislation pending trial. The measure is also being challenged in a
43
related case in federal court and is currently on appeal in the U.S. Court of Appeals for the Ninth Circuit. We currently operate eight stores in the State of Oregon.
Opening new stores and acquiring store locations is also an important part of our long-term growth strategy. During fiscal year 2022, we opened 9 new stores, and, during fiscal year 2023, we opened 15 new stores in fiscal year 2023. We currently do not plan to open any new stores during fiscal year 2024. We may deviate from this target if attractive opportunities are presented to open stores or acquire new store locations outside of our target growth rate.
We also have been scaling our e-commerce platform and increasing sales through our website, www.sportsmans.com.
We believe the key drivers to increasing our total net sales include:
Gross Margin
Gross profit consists of our net sales less cost of goods sold. Gross margin measures our gross profit as a percentage of net sales. Our cost of goods sold primarily consists of merchandise acquisition costs, including freight-in costs, shipping costs, payment term discounts received from the vendor and vendor allowances and rebates associated directly with merchandise and shipping costs related to e-commerce sales.
We believe the key drivers to improving our gross margin are increasing the product mix to higher margin products, particularly apparel and footwear, increasing foot traffic within our stores and traffic to our website, improving buying opportunities with our vendor partners and coordinating pricing strategies among our stores and our merchandise group. Our ability to properly manage our inventory can also impact our gross margin. Successful inventory management ensures we have sufficient high margin products in stock at all times to meet customer demand, while overstocking of items could lead to markdowns in order to help a product sell. During fiscal year 2023, we commenced an effort to reduce our inventory and initiated various strategic promotional efforts as part of this plan. While these efforts decreased our gross margins during fiscal year 2023, the inventory reduction plan progressed as planned. Gross margins in the fourth quarter of fiscal year 2023 were reduced by approximately 500 points compared to the corresponding period of fiscal year 2022. At the end of fiscal year 2023, we completed our inventory reduction plan and, in fiscal year 2024 expect our gross margins to return to rates more inline with historical numbers. We believe that the overall growth of our business can also help improve our gross margins, because increased merchandise volumes will enable us to maintain our strong relationships with our vendors. If we see significant declines in sales or increases in overstocked inventory, we may experience a decline in gross margins as we use promotions to drive traffic and reduce inventory.
Selling, General and Administrative Expenses
We closely manage our selling, general and administrative expenses. Our selling, general and administrative expenses are comprised of payroll, rent and occupancy, depreciation and amortization, acquisition expenses, pre-opening expenses and other operating expenses, including stock-based compensation expense. Pre-opening expenses include expenses incurred in the preparation and opening of a new store location, such as payroll, travel and supplies, but do not include the cost of the initial inventory or capital expenditures required to open a location.
44
Our selling, general and administrative expenses are primarily influenced by the volume of net sales of our locations, except for our corporate payroll, rent and occupancy and depreciation and amortization, which are generally fixed in nature. We control our selling, general and administrative expenses through a budgeting and reporting process that allows our personnel to adjust our expenses as trends in net sales activity are identified.
In response to persistent consumer inflationary pressures and adverse weather conditions in the Western United States during the first half of fiscal year 2023, we implemented a company-wide plan to reduce expenses, with increased focus on financial discipline and rigor throughout the organization. This plan continues as expected and is anticipated to result in a minimum of $25 million in annualized cost savings during fiscal year 2024 when compared to expenses prior to the implementation of our cost reduction plan.
Income from Operations
Income from operations is gross profit less selling, general and administrative expenses. We use income from operations as an indicator of the productivity of our business and our ability to manage selling, general and administrative expenses.
Adjusted EBITDA
We define Adjusted EBITDA as net (loss) income plus interest expense, income tax (benefit) expense, depreciation and amortization, stock-based compensation expense, director and officer transition costs, expenses related to the implementation of our cost reduction plan and a one-time legal settlement and related fees and expenses that we do not believe are indicative of our ongoing expenses. We define Adjusted EBITDA margin as Adjusted EBITDA divided by net sales. In evaluating our business, we use Adjusted EBITDA and Adjusted EBITDA margin as additional measurement tools for purposes of business decision-making, including evaluating store performance, developing budgets and managing expenditures. See “—Non-GAAP Financial Measures."
45
Results of Operations
The following table summarizes key components of our results of operations as a percentage of net sales during the periods presented:
|
|
Fiscal Year Ended |
|
|||||||||
|
|
February 3, |
|
|
January 28, |
|
|
January 29, |
|
|||
|
|
2024 |
|
|
2023 |
|
|
2022 |
|
|||
Percentage of net sales: |
|
|
|
|
|
|
|
|
|
|||
Net sales |
|
|
100.0 |
% |
|
|
100.0 |
% |
|
|
100.0 |
% |
Cost of goods sold |
|
|
70.2 |
|
|
|
67.1 |
|
|
|
67.4 |
|
Gross profit |
|
|
29.8 |
|
|
|
32.9 |
|
|
|
32.6 |
|
Selling, general and administrative expenses |
|
|
31.7 |
|
|
|
28.7 |
|
|
|
26.6 |
|
(Loss) income from operations |
|
|
(1.9 |
) |
|
|
4.2 |
|
|
|
6.0 |
|
Merger termination payment |
|
|
- |
|
|
|
- |
|
|
|
(3.7 |
) |
Interest expense |
|
|
1.0 |
|
|
|
0.3 |
|
|
|
0.1 |
|
(Loss) income before income taxes |
|
|
(2.9 |
) |
|
|
3.9 |
|
|
|
9.6 |
|
Income tax (benefit) expense |
|
|
(0.7 |
) |
|
|
1.0 |
|
|
|
2.4 |
|
Net (loss) income |
|
|
(2.2 |
)% |
|
|
2.9 |
% |
|
|
7.2 |
% |
Adjusted EBITDA |
|
|
1.9 |
% |
|
|
7.0 |
% |
|
|
8.8 |
% |
The following table shows our percentage of net sales by department during the periods presented:
|
|
|
|
Fiscal year Ended |
|
|||||||||
|
|
|
|
February 3, |
|
|
January 28, |
|
|
January 29, |
|
|||
Department |
|
Product Offerings |
|
2024 |
|
|
2023 |
|
|
2022 |
|
|||
Camping |
|
Backpacks, camp essentials, canoes and kayaks, coolers, outdoor cooking equipment, sleeping bags, tents and tools |
|
|
11.2 |
% |
|
|
12.5 |
% |
|
|
13.1 |
% |
Apparel |
|
Camouflage, jackets, hats, outerwear, sportswear, technical gear and work wear |
|
|
8.8 |
% |
|
|
9.3 |
% |
|
|
8.4 |
% |
Fishing |
|
Bait, electronics, fishing rods, flotation items, fly fishing, lines, lures, reels, tackle and small boats |
|
|
8.9 |
% |
|
|
8.9 |
% |
|
|
10.0 |
% |
Footwear |
|
Hiking boots, socks, sport sandals, technical footwear, trail shoes, casual shoes, waders and work boots |
|
|
7.2 |
% |
|
|
7.3 |
% |
|
|
6.8 |
% |
Hunting and Shooting |
|
Ammunition, archery items, ATV accessories, blinds and tree stands, decoys, firearms, reloading equipment and shooting gear |
|
|
57.4 |
% |
|
|
54.9 |
% |
|
|
54.2 |
% |
Optics, Electronics, Accessories, and Other |
|
Gift items, GPS devices, knives, lighting, optics, two-way radios, and other license revenue, net of revenue discounts |
|
|
6.5 |
% |
|
|
7.1 |
% |
|
|
7.5 |
% |
Total |
|
|
|
|
100.0 |
% |
|
|
100.0 |
% |
|
|
100.0 |
% |
46
Fiscal Year 2023 Compared to Fiscal Year 2022
Net Sales and Same Store Sales. Net sales decreased by $111.5 million, or 8.0%, to $1,288.0 million in fiscal year 2023 compared to $1,399.5 million in fiscal year 2022. Our net sales decreased primarily from the continued impact of consumer inflationary pressures and recessionary concerns on discretionary spending, resulting in a decline in store traffic and lower demand across all product categories. Additionally, net sales declined due to extended winter conditions in the Western United States, leading to decreased outdoor participation. These headwinds were partially offset by our opening of 15 new stores in fiscal year 2023 and fiscal year 2023 containing 53 weeks as compared to 52 weeks for fiscal year 2022. Stores that were opened in fiscal year 2023 and stores that have been open for less than 12 months and were, therefore, not included in our same store sales, contributed $85.3 million to net sales. E-commerce driven sales comprised more than 18% of total sales in fiscal year 2023. Same store sales decreased by 14.4% for fiscal year 2023 compared to fiscal year 2022, primarily as a result of the factors discussed above that impacted net sales. As of February 3, 2024, we had 131 stores included in our same store calculation. As fiscal year 2023 contained 53 weeks of operations, we have excluded net sales during the 53rd week from our calculation of same store sales.
Our Camping, Hunting and Shooting, Apparel, Optics, Electronics and Accessories, Fishing and Footwear departments saw decreases in net sales of $31.6 million, $30.1 million, $17.0 million, $11.5 million, $9.5 million and $8.7 million, respectively, for fiscal year 2023 compared to fiscal year 2022. These decreases were primarily driven by the continued impact of consumer inflationary pressures and recessionary concerns on discretionary spending, resulting in a decline in store traffic and lower demand across all product categories. Additionally, net sales declined due to extended winter conditions in the Western United States, leading to decreased outdoor participation. These headwinds were partially offset by our opening of 15 new stores in fiscal year 2023 and fiscal year 2023 containing 53 weeks as compared to 52 weeks for fiscal year 2022. Within our Hunting and Shooting department, sales from our firearms category increased by $1.5 million, or 0.5%, for fiscal year 2023 compared to fiscal year 2022. This increase in firearms sales was driven by the opening of new stores and fiscal year 2023 containing 53 weeks as compared to 52 weeks for fiscal year 2022. Within Hunting and Shooting, our ammunition category saw a decrease of $33.5 million, or 14.1%, for fiscal year 2023 compared to fiscal year 2022, which resulted from the drivers of decreased demand and inflationary pressures discussed above partially offset by our opening of new stores and fiscal year 2023 containing 53 weeks as compared to 52 weeks for fiscal year 2022.
With respect to same store sales, our Camping, Apparel, Optics, Electronics and Accessories, Fishing, Footwear and Hunting and Shooting departments saw decreased same store sales of 22.7%, 18.6%, 16.8%, 15.1%, 14.0% and 11.2%, respectively. Firearms and ammunition same store sales, included within our Hunting and Shooting department, decreased by 8.2% and 21.2%, respectively, for fiscal year 2023 compared to fiscal year 2022. As fiscal year 2023 contained 53 weeks of operations, we have excluded net sales during the 53rd week from our calculation of same store sales.
Gross Profit. Gross profit decreased by $76.8 million, or 16.7%, to $383.4 million for fiscal year 2023 from $460.2 million for fiscal year 2022. As a percentage of net sales, gross profit decreased to 29.8% for fiscal year 2023 compared to 32.9% for fiscal year 2022. These decreases were primarily driven by reduced product margins in our ammunition category within our Hunting and Shooting department, lower margins in our Apparel and Footwear departments, resulting from our increased promotional efforts to reduce inventory and decreases in net sales and same store sales.
Selling, General and Administrative Expenses. Selling, general and administrative expenses increased by $6.6 million, or 1.6%, to $408.8 million for fiscal year 2023 from $402.2 million for fiscal year 2022. This increase was primarily due to increases in rent and depreciation expenses of $11.5 million and $7.2 million, driven by the opening of 15 new store locations during fiscal year 2023. We incurred $4.8 million in executive transitional expenses after the retirement of our Chief Executive Officer in April 2023. Additionally, we incurred $1.2 million of severance expenses related to the implementation of our cost reduction plan and $0.7 million related to a one-time legal settlement and related fees and expenses. These increases were partially offset by a decreases of $12.8 million and $4.8 million in payroll and other operating expenses, respectively, driven by our ongoing cost cutting measures and increased operational efficiencies across our retail stores.
47
On a per store basis, our payroll and other operating expenses were down approximately 16% and 14%, respectively, compared to fiscal year 2022. As a percentage of net sales, selling, general, and administrative expenses increased to 31.7% of net sales during fiscal year 2023 compared to 28.7% of net sales in fiscal year 2022, as a result of the factors discussed above. New store pre-opening expenses increased by $2.1 million to $5.8 million during fiscal year 2023 compared to $3.7 million in fiscal year 2022.
Interest Expense. Interest expense increased by $8.7 million, or 206.8%, to $12.9 million in fiscal year 2023 from $4.2 million for fiscal year 2022. Interest expense increased primarily as a result increased borrowings on our revolving credit facility and higher interest rates for fiscal year 2023 compared to fiscal year 2022.
Income Taxes. We recorded an income tax benefit of $9.2 million for fiscal year 2023 compared to income tax expense of $13.4 million for fiscal year 2022. Our effective tax rate decreased to 24.1% during fiscal year 2023 compared to 24.8% in fiscal year 2022.
Fiscal Year 2022 Compared to Fiscal Year 2021
Net Sales and Same Store Sales. Net sales decreased by $106.6 million, or 7.1%, to $1,399.5 million in fiscal year 2022 compared to $1,506.1 million in fiscal year 2021. Our net sales decreased primarily due to lower demand across most product categories as we anniversaried the increased demand during the first half of fiscal year 2021 driven by the COVID-19 economic stimulus package (the American Rescue Plan) and social unrest and were impacted by current year consumer inflationary pressures and recessionary concerns. These headwinds were partially offset by our opening of nine new stores since January 29, 2022. Stores that were opened in fiscal year 2022 and stores that have been open for less than 12 months and were, therefore, not included in our same store sales, contributed $86.5 million to net sales. E-commerce driven sales comprised more than 15% of total sales in fiscal year 2022. Same store sales decreased by 12.2% for fiscal year 2022 compared to fiscal year 2021, primarily driven by decreased consumer demand as described above. Same store sales increased by 27.6% during fiscal year 2022 compared to the pre-pandemic fiscal year 2019. As of January 28, 2023, we had 122 stores included in our same store calculation.
Our Apparel department saw an increase of $3.9 million in net sales during fiscal year 2022 compared to fiscal year 2021 primarily due to the opening of nine new stores since January 29, 2022. Our Hunting and Shooting, Fishing, Camping, Optics, Electronics, Accessories and other, and Footwear departments saw decreases in net sales of $47.0 million, $27.0 million, $22.1 million, $17.5 million and $1.1 million, respectively, for fiscal year 2022 compared to fiscal year 2021 primarily due to lower demand across most product categories as we anniversaried the increased demand during the first half of fiscal year 2021 driven by the American Rescue Plan and social unrest and were impacted by current year consumer inflationary pressures and recessionary concerns. Within our Hunting and Shooting department, sales from our ammunition category were relatively flat, with an increase of $0.1 million, in sales of ammunition for fiscal year 2022 compared to fiscal year 2021. This increase in ammunition sales was driven by the opening of new stores. Within Hunting and Shooting, our firearms category saw a decrease of $41.7 million, or 12.2%, for fiscal year 2022 compared to fiscal year 2021, which resulted from decreased demand and inflationary pressures discussed above.
With respect to same store sales, our fishing, optics, electronics and accessories, camping, hunting, footwear and apparel departments saw decreased same store sales of 23.0%, 19.3%, 15.6%, 11.4%, 5.4% and 1.4%, respectively. Firearms and ammunition same store sales, included within our Hunting and Shooting department, decreased by 18.2% and 5.1%, respectively, for fiscal year 2022 compared to fiscal year 2021.
Gross Profit. Gross profit decreased by $30.1 million, or 6.1%, to $460.2 million for fiscal year 2022 from $490.3 million for fiscal year 2021. This decrease was primarily driven by a decrease in net sales and same store sales. As a percentage of net sales, gross profit increased to 32.9% for fiscal year 2022 compared to 32.6% for fiscal year 2021. This increase was primarily driven by decreased shipping, freight and logistical expenses, increased product margins across most categories and favorable product mix.
Selling, General and Administrative Expenses. Selling, general and administrative expenses increased by $2.5 million, or 0.6%, to $402.2 million for fiscal year 2022 from $399.7 million for fiscal year 2021. This increase was
48
primarily due to an increase in other general and administrative expenses of $10.2 million, which was largely driven by a return to pre-pandemic levels of marketing and travel activities. We also had increases in depreciation, rent, legal accruals and management recruiting expenses of $5.6 million, $3.6 million, $2.1 million and $1.3 million respectively, primarily related to the opening of nine new store locations during fiscal year 2022 and the recruiting and hiring of key senior managers. These increases were offset by a decrease in acquisition costs of $9.7 million due to the termination of the merger agreement with Great Outdoors Group, LLC and a decrease in payroll expense of $10.2 million primarily due to reduced annual bonuses to employees and increased operational efficiencies across our retail stores. Additionally, preopening expenses decreased by $0.4 million due to opening one fewer new retail location compared to the prior year.. Selling, general and administrative expenses increased to 28.7% of net sales in fiscal year 2022 compared to 26.5% of net sales in fiscal year 2021, due to lower net sales for fiscal year 2022 compared to fiscal year 2021 and the additional items noted above.
Interest Expense. Interest expense increased by $2.8 million, or 204.0%, to $4.2 million in fiscal year 2022 from $1.4 million for fiscal year 2021. Interest expense increased primarily as a result of increased borrowing on our revolving credit facility and higher interest rates for fiscal year 2022 compared to fiscal year 2021.
Other Income. Other income decreased by $55.0 million in fiscal year 2022 from $55.0 million for fiscal year 2021 due to the receipt of a $55.0 million payment in connection with the termination of the Merger Agreement with Great Outdoors Group, LLC in fiscal year 2021.
Income Taxes. We recorded an income tax expense of $13.4 million for fiscal year 2022 compared to income tax expense of $35.8 million for fiscal year 2021. Our effective tax rate remained flat from fiscal year 2021 at 24.8% in 2022.
Seasonality
Due to the openings of hunting season across the country and consumer holiday buying patterns, net sales are typically higher in our third and fourth fiscal quarters than in our first and second fiscal quarters. We also incur additional expenses in our third and fourth fiscal quarters due to higher sales volume and increased staffing in our stores. We anticipate our net sales will continue to reflect this seasonal pattern.
The timing of our new retail store openings also may have an impact on our quarterly results. First, we incur certain non-recurring expenses related to opening each new retail store, which are expensed as they are incurred. Second, most store expenses generally vary proportionately with net sales, but there is also a fixed cost component, which includes occupancy costs. These fixed costs typically result in lower store profitability during the initial period after a new retail store opens. Due to both of these factors, new retail store openings may result in a temporary decline in operating profit, in dollars and/or as a percentage of net sales.
Weather conditions affect outdoor activities and the demand for related apparel and equipment. Customers’ demand for our products, and, therefore, our net sales, can be significantly impacted by weather patterns on a local, regional and national basis. For example, weather conditions were a significant headwind for us in the first half of fiscal year 2023, especially in the western half of the United States. A combination of unusually high amounts of rain and snow influenced the timing of the spring fishing and camping seasons, pushing them to later than normal.
49
Liquidity and Capital Resources
Overview; Uses and Sources of Cash
As of February 3, 2024, we had cash and cash equivalents of $3.1 million and working capital, consisting of current assets less current liabilities, of $65.4 million.
Our primary cash requirements are for seasonal working capital needs, capital expenditures related to ongoing operational needs and new system investments. For both the short-term and the long-term, our primary sources of cash are borrowings under our $350.0 million senior secured revolving credit facility, operating cash flows and short and long-term debt financings from other banks and financial institutions. We believe that our cash on hand, cash generated by operating activities and funds available under our revolving credit facility will be sufficient to finance our operating activities and meet our cash requirements for at least the next twelve months and beyond.
Material Cash Requirements
Our material cash requirements from known contractual and other obligations are primarily for general operating expenses and other expenses discussed below.
Purchase Obligations. In the ordinary course of business, we enter into arrangements with vendors to purchase merchandise in advance of expected delivery. We or the vendor can generally terminate the purchase orders at any time. These purchase orders do not contain any termination payments or other penalties if cancelled. During 2023, we executed our inventory reduction plan, which resulted in less cash expenditures for merchandise inventory in 2023. While it weighed on our gross margins, moving this inventory progressed as planned reducing our gross margins by approximately 500 basis points during the fourth quarter of fiscal year 2023 when compared to the corresponding period of fiscal year 2022.
Operating Lease Obligations. Operating lease commitments consist principally of leases for our retail stores, corporate office and distribution center. Our leases often include options which allow us to extend the terms beyond the initial lease term. For fiscal year 2024, our expected operating lease payments will be $73.8 million and our total committed lease payments are $468.9 million as of February 3, 2024.
Capital Expenditures. For fiscal year 2023, we incurred approximately $60.3 million in capital expenditures, net of $19.6 million in tenant allowances, primarily related to the construction of new stores and the refurbishment of existing stores during the period. We expect capital expenditures net of tenant allowances, between $20 million and $25 million for fiscal year 2024 primarily related to strategic technological investments, such as planogramming, merchandising and replenishment and store scheduling tools, and general store fleet maintenance. We intend to fund these capital expenditures with our operating cash flows, existing cash and cash equivalents and funds available under our revolving credit facility. Other investment opportunities, such as potential strategic acquisitions or store expansion rates in excess of those presently planned, may require additional funding.
Principal and Interest Payments. We maintain a $350.0 million revolving credit facility. As of February 3, 2024, $135.3 million was outstanding under the revolving credit facility. Assuming no additional repayments or borrowings on our revolving credit facility after February 3, 2024, our interest payments would be approximately $9.4 million for fiscal year 2024 based on the interest rate as of February 3, 2024. See “—Indebtedness” below for additional information regarding our revolving credit facility, including the interest rate applicable to any borrowing under such facility.
Share Repurchase Authorization. Our board of directors authorized a share repurchase program to provide for the repurchase of up to $75.0 million of outstanding shares of our common stock during the period from March 31, 2022 to March 31, 2023. On March 15, 2023, our board of directors extended the term of the share repurchase program through March 31, 2024. We may repurchase shares of our common stock at any time or from time to time, without prior notice, subject to market conditions and other considerations. Our repurchases may be made through Rule 10b5-1 plans, accelerated share repurchase transactions, open market purchases, privately negotiated transactions, tender offers, block purchases or other transactions. We intend to fund repurchases under the repurchase program using cash on hand or available borrowings under our revolving credit facility. We have no obligation to repurchase
50
any shares of our common stock under the share repurchase program and we may modify, suspend or discontinue it at any time. As of February 3, 2024, we had repurchased 7,326,507 shares of our common stock for $67.5 million, utilizing cash on hand and available borrowings under our revolving credit facility. As of February 3, 2024, $7.5 million remained available to us for repurchases of outstanding shares of our common stock pursuant to the share repurchase program.
Cash Flows
Cash flows provided by (used in) operating, investing and financing activities are shown in the following table:
|
|
Fiscal Year Ended |
|
|||||
|
|
February 3, |
|
|
January 28, |
|
||
|
|
2024 |
|
|
2023 |
|
||
|
|
(in thousands) |
|
|||||
Cash flows provided by operating activities |
|
$ |
52,266 |
|
|
$ |
46,794 |
|
Cash flows used in investing activities |
|
|
(79,895 |
) |
|
|
(60,588 |
) |
Cash provided by (used in) financing activities |
|
|
28,381 |
|
|
|
(40,835 |
) |
Cash and cash equivalents at end of period |
|
|
3,141 |
|
|
|
2,389 |
|
Net cash provided by operating activities was $52.3 million for fiscal year 2023, compared to net cash provided by operating activities of $46.8 million for fiscal year 2022, a change of approximately $5.5 million. The increase in our cash flows provided by operating activities was primarily the result of our inventory reduction plan implemented during 2023, which resulted in reduced inventory levels at the end of fiscal year 2023 compared to the end of fiscal year 2022.
Net cash used in investing activities was $79.9 million for fiscal year 2023 compared to $60.6 million for fiscal year 2022. For fiscal year 2023, we incurred capital expenditures related to the construction of new stores and the refurbishment of existing stores. Our cash flows used in investing activities in fiscal year 2022 primarily related to costs incurred in connection with opening new stores and the refurbishment of existing stores.
Net cash provided by financing activities was $28.4 million for fiscal year 2023 compared to net cash used in financing activities of $40.8 million for fiscal year 2022, a change of approximately $69.2 million. The increase in cash provided by financing activities was primarily driven by our share repurchase of $64.7 million of in fiscal year 2022 compared to only $2.7 million in fiscal year 2023.
Indebtedness
We maintain a $350.0 million revolving credit facility, with $135.3 million outstanding as of February 3, 2024. Borrowings under our revolving credit facility are subject to a borrowing base calculation. Our revolving credit facility is governed by an amended and restated credit agreement with a consortium of banks led by Wells Fargo Bank, National Association (“Wells Fargo”). As of February 3, 2024, we had $88.3 million available for borrowing, calculated based upon certain borrowing base restrictions, and $2.0 million in stand-by commercial letters of credit.
Borrowings under the revolving credit facility bear interest based on either the base rate or Term SOFR (as defined by the credit agreement governing the revolving credit facility), at our option, in each case plus an applicable margin. The base rate is the greatest of (1) the floor rate (as defined in the credit agreement as a rate of interest equal to 0.0%) (2) Wells Fargo’s prime rate, (3) the federal funds rate (as defined in the credit agreement) plus 0.50% or (4) the one-month Term SOFR (as defined in the credit agreement) plus 1.00%. The applicable margin for loans under the revolving credit facility, which varies based on the average daily availability, ranges from 0.25% to 0.50% per year for base rate loans and from 1.35% to 1.60% per year for Term SOFR loans. We are required to pay a commitment fee for the unused portion of the revolving credit facility, which will range from 0.20% to 0.225% per annum, depending on the average daily availability under the revolving credit facility. The weighted average interest rate on the amounts outstanding under the revolving credit facility as of February 3, 2024 and January 28, 2023 was 7.01% and 5.86%, respectively.
51
Each of the subsidiaries of Holdings is a borrower under the revolving credit facility, and all obligations under the revolving credit facility are guaranteed by Holdings. All of the obligations under the revolving credit facility are secured by a lien on substantially all of Holdings’ tangible and intangible working capital assets and the tangible and intangible working capital assets of all of Holdings’ subsidiaries, including a pledge of all capital stock of each of Holdings’ subsidiaries. The lien securing the obligations under the revolving credit facility is a first priority lien as to certain liquid assets, including cash, accounts receivable, deposit accounts and inventory.
We may be required to make mandatory prepayments under the revolving credit facility in the event of a disposition of certain property or assets, in the event of receipt of certain insurance or condemnation proceeds, upon the issuance of certain debt or equity securities, upon the incurrence of certain indebtedness for borrowed money or upon the receipt of certain payments not received in the ordinary course of business.
Our revolving credit facility requires us to maintain a minimum availability at all times of not less than 10% of the gross borrowing base. In addition, the credit agreement governing our revolving credit facility contains customary affirmative and negative covenants, including covenants that limit our ability to incur, create or assume certain indebtedness, to create, incur or assume certain liens, to make certain investments, to make sales, transfers and dispositions of certain property and to undergo certain fundamental changes, including certain mergers, liquidations and consolidations. The credit agreement also contains customary events of default. As of February 3, 2024, we were in compliance with all covenants under the credit agreement governing our revolving credit facility.
Critical Accounting Estimates
Our financial statements are prepared in accordance with accounting principles generally accepted in the United States of America (“GAAP”). In connection with the preparation of the financial statements, we are required to make assumptions, make estimates and apply judgment that affect the reported amounts of assets, liabilities, revenue, expenses and the related disclosures. We base our assumptions, estimates and judgments on historical experience, current trends and other factors that we believe to be relevant at the time the consolidated financial statements are prepared. On a regular basis, we review the accounting policies, assumptions, estimates and judgments to ensure that our financial statements are presented fairly and in accordance with GAAP. However, because future events and their effects cannot be determined with certainty, actual results could differ from our assumptions and estimates, and such differences could be material.
Our significant accounting policies are discussed in Note 2 to our Consolidated Financial Statements elsewhere in this 10-K. We believe that the following accounting policies are the most critical to aid in fully understanding and evaluating our reported financial results.
Revenue Recognition
We operate solely as an outdoor retailer, which includes both retail stores and an e-commerce platform, that offers a broad range of products in the United States and online. Generally, all revenues are recognized when control of the promised goods is transferred to customers, in an amount that reflects the consideration in exchange for those goods. Accordingly, we implicitly enter into a contract with customers to deliver merchandise inventory at the point of sale. Collectability is reasonably assured since we only extend immaterial credit purchases to certain municipalities.
Substantially all of our revenue is for single performance obligations for the following distinct items:
For performance obligations related to retail store and e-commerce sales contracts, we typically transfer control, for retail stores, upon consummation of the sale when the product is paid for and taken by the customer and, for e-commerce sales, when the products are tendered for delivery to the common carrier.
52
The transaction price for each contract is the stated price on the product, reduced by any stated discounts at that point in time. We do not engage in sales of products that attach a future material right which could result in a separate performance obligation for the purchase of goods in the future at a material discount. The implicit point-of-sale contract with the customer, as reflected in the transaction receipt, states the final terms of the sale, including the description, quantity, and price of each product purchased. Payment for our contracts is due in full upon delivery. The customer agrees to a stated price implicit in the contract that does not vary over the contract.
The transaction price relative to sales subject to a right of return reflects the amount of estimated consideration to which we expect to be entitled. This amount of variable consideration included in the transaction price, and measurement of net sales, is included in net sales only to the extent that it is probable that there will be no significant reversal in a future period. Actual amounts of consideration ultimately received may differ from our estimates. The allowance for sales returns is estimated based upon historical experience and a provision for estimated returns is recorded as a reduction in sales in the relevant period. The estimated merchandise inventory cost related to the sales returns is recorded in prepaid expenses and other. If actual results in the future vary from our estimates, we adjust these estimates, which would affect net sales and earnings in the period such variances become known.
Contract liabilities are recognized primarily for gift card sales and our loyalty reward program. Cash received from the sale of gift cards is recorded as a contract liability in accrued expenses, and we recognize revenue upon the customer’s redemption of the gift card. Gift card breakage is recognized as revenue in proportion to the pattern of customer redemptions by applying a historical breakage rate of 4.0% when no escheat liability to relevant jurisdictions exists. We do not sell or provide gift cards that carry expiration dates. We recognized revenue for the breakage of loyalty reward points as revenue in proportion to the pattern of customer redemption of the points by applying an estimated breakage rate of 20% using historical rates and future expectations.
As it relates to e-commerce sales, we account for shipping and handling as fulfillment activities, and not a separate performance obligation. Accordingly, we recognize revenue for only one performance obligation, the sale of the product, at the shipping point (when the customer gains control). Revenue associated with shipping and handling is not material. The costs associated with fulfillment are recorded in costs of goods sold.
We offer promotional financing and credit cards issued by a third-party bank that manages and directly extends credit to our customers. We provide a license to our brand and marketing services, and we facilitate credit applications in our stores and online. The banks are the sole owners of the accounts receivable generated under the program and, accordingly, we do not hold any customer receivables related to these programs and act as an agent in the financing transactions with customers. We are eligible to receive a profit share from certain of our banking partners based on the annual performance of their corresponding portfolio, and we receive monthly payments based on forecasts of full-year performance. This is a form of variable consideration. We record such profit share as revenue over time using the most likely amount method, which reflects the amount earned each month when it is determined that the likelihood of a significant revenue reversal is not probable, which is typically monthly. Profit-share payments occur monthly, shortly after the end of each program month.
Taxes assessed by a governmental authority that are both imposed on and concurrent with a specific revenue-producing transaction, that are collected by us from a customer, are excluded from revenue.
Sales returns
We estimate a reserve for sales returns and record the respective reserve amounts, including a right to return asset when a product is expected to be returned and resold. Historical experience of actual returns, and customer return rights are the key factors used in determining the estimated sales returns.
53
Inventory Valuation
Inventory is measured at the lower of cost or net realizable value. Cost is determined using the weighted average cost method. We estimate a provision for inventory shrinkage based on our historical inventory accuracy rates as determined by periodic cycle counts. The allowance for damaged goods from returns is based upon our historical experience. We also adjust inventory for obsolete or slow-moving inventory based on inventory productivity reports and by specific identification of obsolete or slow-moving inventory. Had our estimated inventory reserves been lower or higher by 10% as of February 3, 2024, our cost of sales would have been correspondingly lower or higher by approximately $0.5 million.
Valuation of Long-Lived Assets
We review our long-lived assets with definite lives for impairment whenever events or changes in circumstances may indicate that the carrying value of an asset may not be recoverable. We use an estimate of the future undiscounted net cash flows of the related asset or group of assets over their remaining useful lives in measuring whether the assets are recoverable. If the carrying amount of an asset exceeds its estimated future cash flows, an impairment charge is recognized for the amount by which the carrying amount exceeds the estimated fair value of the asset. Impairment of long-lived assets is assessed at the lowest levels for which there are identifiable cash flows that are independent of other groups of assets. Assets to be disposed of are reported at the lower of the carrying amount or fair value, less the estimated costs to sell. No impairment charge to long-lived assets was recorded during the fiscal years ended February 3, 2024, January 28, 2023 and January 29, 2022.
Leases
We have operating leases for our retail stores facilities, distribution center, and corporate office. In accordance with ASC 842, which we adopted on February 3, 2019, we determine if an arrangement is a lease at inception. Operating lease liabilities are calculated using the present value of future payments and recognized at the commencement date based on the present value of lease payments over the reasonably certain lease term. As our leases generally do not provide an implicit rate, we used an estimated incremental borrowing rate (“IBR”) to determine the present value of lease payments. The IBR is determined by using our credit rating to develop a yield curve that approximates our market risk profile.
Off Balance Sheet Arrangements
We are not party to any off balance sheet arrangements.
Recent Accounting Pronouncements
For a description of recent accounting pronouncements, see Note 2 to our Consolidated Financial Statements included elsewhere in this 10-K.
Non-GAAP Financial Measures
In evaluating our business, we use Adjusted EBITDA and Adjusted EBITDA margin as supplemental measures of our operating performance. We define Adjusted EBITDA as net (loss) income plus interest expense, income tax (benefit) expense, depreciation and amortization, stock-based compensation expense, director and officer transition costs, expenses related to the implementation of our cost reduction plan and a one-time legal settlement and related fees and expenses. Beginning with the three months ended October 28, 2023, we no longer add back new store pre-opening expenses to our net (loss) income to determine Adjusted EBITDA. The presentation of past periods has been conformed to the current presentation. Net (loss) income is the most comparable GAAP financial measure to Adjusted EBITDA. We define Adjusted EBITDA margin as, for any period, the Adjusted EBITDA for that period divided by the net sales for that period. We consider Adjusted EBITDA and Adjusted EBITDA margin important supplemental measures of our operating performance and believe they are frequently used by analysts, investors and other interested parties in the evaluation of companies in our industry. Other companies in our industry, however, may calculate Adjusted EBITDA and Adjusted EBITDA margin differently than we do. Management also uses Adjusted EBITDA and Adjusted EBITDA margin as additional measurement tools for purposes of business
54
decision-making, including evaluating store performance, developing budgets and managing expenditures. Management believes Adjusted EBITDA and Adjusted EBITDA margin allow investors to evaluate our operating performance and compare our results of operations from period to period on a consistent basis by excluding items that management does not believe are indicative of our core operating performance.
Adjusted EBITDA is not defined under GAAP and is not a measure of operating income, operating performance or liquidity presented in accordance with GAAP. Adjusted EBITDA has limitations as an analytical tool, and when assessing our operating performance, you should not consider Adjusted EBITDA in isolation or as a substitute for net income or other condensed consolidated statement of operations data prepared in accordance with GAAP. Some of these limitations include, but are not limited to:
A reconciliation of net income to Adjusted EBITDA and a calculation of Adjusted EBITDA margin is set forth below for the periods presented (amounts in thousands).
|
|
Fiscal Year Ended |
|
|||||||||
|
|
February 3, |
|
|
January 28, |
|
|
January 29, |
|
|||
|
|
2024 |
|
|
2023 |
|
|
2022 |
|
|||
|
|
|
|
|
|
|
|
|
|
|||
Net (loss) income (1) |
|
$ |
(28,997 |
) |
|
$ |
40,518 |
|
|
$ |
108,470 |
|
Interest expense |
|
|
12,869 |
|
|
|
4,195 |
|
|
|
1,379 |
|
Income tax (benefit) expense |
|
|
(9,209 |
) |
|
|
13,350 |
|
|
|
35,769 |
|
Depreciation and amortization |
|
|
39,009 |
|
|
|
31,776 |
|
|
|
26,226 |
|
Stock-based compensation expense (2) |
|
|
4,237 |
|
|
|
4,673 |
|
|
|
3,328 |
|
Acquisition costs (3) |
|
|
— |
|
|
|
— |
|
|
|
9,733 |
|
Legal expense (4) |
|
|
687 |
|
|
|
2,088 |
|
|
|
— |
|
Cost reduction plan (5) |
|
|
1,216 |
|
|
|
— |
|
|
|
— |
|
Executive transition costs (6) |
|
|
4,763 |
|
|
|
1,329 |
|
|
|
— |
|
Retention pay (7) |
|
|
— |
|
|
|
— |
|
|
|
2,549 |
|
Merger termination payment (8) |
|
|
— |
|
|
|
— |
|
|
|
(55,000 |
) |
Adjusted EBITDA |
|
$ |
24,575 |
|
|
$ |
97,929 |
|
|
$ |
132,454 |
|
|
|
|
|
|
|
|
|
|
|
|||
Net sales |
|
|
1,287,987 |
|
|
|
1,399,515 |
|
|
|
1,506,072 |
|
Net (loss) income margin (9) |
|
|
(2.2 |
)% |
|
|
2.9 |
% |
|
|
7.2 |
% |
Adjusted EBITDA margin (9) |
|
|
1.9 |
% |
|
|
7.0 |
% |
|
|
8.8 |
% |
55
56
ITEM 7A. QUANTITATIVE AND QUALITATIVE DISCLOSURES ABOUT MARKET RISK
Our principal exposure to market risk relates to changes in interest rates. Borrowings under our revolving credit facility carry floating interest rates that are tied to SOFR, the federal funds rate and the prime rate, and, therefore, our income and cash flows will be exposed to changes in interest rates to the extent that we do not have effective hedging arrangements in place. We historically have not used interest rate swap agreements to hedge the variable cash flows associated with the interest on our credit facilities. Based on a sensitivity analysis at February 3, 2024, assuming the amount outstanding under our revolving credit facility would be outstanding for a full year, a 100 basis point increase in interest rates would have increased our interest expense by $1.4 million. We do not use derivative financial instruments for speculative or trading purposes. However, this does not preclude our adoption of specific hedging strategies in the future.
57
ITEM 8. FINANCIAL STATEMENTS AND SUPPLEMENTARY DATA
TABLE OF CONTENTS
|
|
|
Page |
REPORT OF INDEPENDENT REGISTERED PUBLIC ACCOUNTING FIRM – GRANT THORNTON LLP (PCAOB ID Number |
59 |
|
|
CONSOLIDATED FINANCIAL STATEMENTS: |
|
|
|
60 |
|
|
|
61 |
|
|
|
62 |
|
|
|
63 |
|
|
|
64 |
58
Report of Independent Registered Public Accounting Firm
Board of Directors and Shareholders
Sportsman’s Warehouse Holdings, Inc.
Opinion on the Financial Statements
We have audited the accompanying consolidated balance sheets of Sportsman’s Warehouse Holdings, Inc. (a Delaware corporation) and subsidiaries (the “Company”) as of February 3, 2024 and January 28, 2023, the related consolidated statements of operations, stockholders’ equity, and cash flows for each of the three years in the period ended February 3, 2024, and the related notes (collectively referred to as the “financial statements”). In our opinion, the financial statements present fairly, in all material respects, the financial position of the Company as of February 3, 2024 and January 28, 2023, and the results of its operations and its cash flows for each of the three years in the period ended February 3, 2024, in conformity with accounting principles generally accepted in the United States of America.
We also have audited, in accordance with the standards of the Public Company Accounting Oversight Board (United States) (“PCAOB”), the Company’s internal control over financial reporting as of February 3, 2024, based on criteria established in the 2013 Internal Control—Integrated Framework issued by the Committee of Sponsoring Organizations of the Treadway Commission (“COSO”), and our report dated April 4, 2024 expressed an unqualified opinion.
Basis for opinion
These financial statements are the responsibility of the Company’s management. Our responsibility is to express an opinion on the Company’s financial statements based on our audits. We are a public accounting firm registered with the PCAOB and are required to be independent with respect to the Company in accordance with the U.S. federal securities laws and the applicable rules and regulations of the Securities and Exchange Commission and the PCAOB.
We conducted our audits in accordance with the standards of the PCAOB. Those standards require that we plan and perform the audit to obtain reasonable assurance about whether the financial statements are free of material misstatement, whether due to error or fraud. Our audits included performing procedures to assess the risks of material misstatement of the financial statements, whether due to error or fraud, and performing procedures that respond to those risks. Such procedures included examining, on a test basis, evidence regarding the amounts and disclosures in the financial statements. Our audits also included evaluating the accounting principles used and significant estimates made by management, as well as evaluating the overall presentation of the financial statements. We believe that our audits provide a reasonable basis for our opinion.
Critical audit matters
Critical audit matters are matters arising from the current period audit of the financial statements that were communicated or required to be communicated to the audit committee and that: (1) relate to accounts or disclosures that are material to the financial statements and (2) involved our especially challenging, subjective, or complex judgments. We determined that there were no critical audit matters.
/s/ GRANT THORNTON LLP
We have served as the Company’s auditor since 2020.
Salt Lake City, Utah
April 4, 2024
59
SPORTSMAN’S WAREHOUSE HOLDINGS, INC. AND SUBSIDIARIES
CONSOLIDATED BALANCE SHEETS
Amounts in Thousands
|
|
February 3, |
|
|
January 28, |
|
||
|
|
2024 |
|
|
2023 |
|
||
Assets |
|
|
|
|
|
|
||
Current assets: |
|
|
|
|
|
|
||
Cash and cash equivalents |
|
$ |
|
|
$ |
|
||
Accounts receivable, net |
|
|
|
|
|
|
||
Merchandise inventories |
|
|
|
|
|
|
||
Prepaid expenses and other |
|
|
|
|
|
|
||
Total current assets |
|
|
|
|
|
|
||
Operating lease right of use asset |
|
|
|
|
|
|
||
Property and equipment, net |
|
|
|
|
|
|
||
Goodwill |
|
|
|
|
|
|
||
Deferred tax asset |
|
|
|
|
|
— |
|
|
Definite lived intangibles, net |
|
|
|
|
|
|
||
Total assets |
|
$ |
|
|
$ |
|
||
|
|
|
|
|
|
|
||
Liabilities and Stockholders' Equity |
|
|
|
|
|
|
||
Current liabilities: |
|
|
|
|
|
|
||
Accounts payable |
|
$ |
|
|
$ |
|
||
Accrued expenses |
|
|
|
|
|
|
||
Income taxes payable |
|
|
|
|
|
|
||
Operating lease liability, current |
|
|
|
|
|
|
||
Revolving line of credit |
|
|
|
|
|
|
||
Total current liabilities |
|
|
|
|
|
|
||
Long-term liabilities: |
|
|
|
|
|
|
||
Deferred income taxes |
|
|
|
|
|
|
||
Operating lease liability, noncurrent |
|
|
|
|
|
|
||
Total long-term liabilities |
|
|
|
|
|
|
||
Total liabilities |
|
|
|
|
|
|
||
|
|
|
|
|
|
|
||
|
|
|
|
|
|
|||
Stockholders' equity: |
|
|
|
|
|
|
||
Preferred stock, $ |
|
|
|
|
|
|
||
Common stock, $ |
|
|
|
|
|
|
||
Additional paid-in capital |
|
|
|
|
|
|
||
Retained earnings |
|
|
|
|
|
|
||
Total stockholders' equity |
|
|
|
|
|
|
||
Total liabilities and stockholders' equity |
|
$ |
|
|
$ |
|
||
See accompanying notes to the consolidated financial statements
60
SPORTSMAN’S WAREHOUSE HOLDINGS, INC. AND SUBSIDIARIES
CONSOLIDATED STATEMENTS OF OPERATIONS
Amounts in Thousands, Except Per Share Data
|
|
Fiscal Year Ended |
|
|||||||||
|
|
February 3, |
|
|
January 28, |
|
|
January 29, |
|
|||
|
|
2024 |
|
|
2023 |
|
|
2022 |
|
|||
Net sales |
|
$ |
|
|
$ |
|
|
$ |
|
|||
Cost of goods sold |
|
|
|
|
|
|
|
|
|
|||
Gross profit |
|
|
|
|
|
|
|
|
|
|||
|
|
|
|
|
|
|
|
|
|
|||
Selling, general and administrative expenses |
|
|
|
|
|
|
|
|
|
|||
(Loss) income from operations |
|
|
( |
) |
|
|
|
|
|
|
||
Other (income) expense: |
|
|
|
|
|
|
|
|
|
|||
Merger termination payment |
|
|
— |
|
|
|
— |
|
|
|
( |
) |
Interest expense |
|
|
|
|
|
|
|
|
|
|||
(Loss) income before income taxes |
|
|
( |
) |
|
|
|
|
|
|
||
Income tax (benefit) expense |
|
|
( |
) |
|
|
|
|
|
|
||
Net (loss) income |
|
$ |
( |
) |
|
$ |
|
|
$ |
|
||
(Loss) income per share: |
|
|
|
|
|
|
|
|
|
|||
Basic |
|
$ |
( |
) |
|
$ |
|
|
$ |
|
||
Diluted |
|
$ |
( |
) |
|
$ |
|
|
$ |
|
||
Weighted average shares outstanding: |
|
|
|
|
|
|
|
|
|
|||
Basic |
|
|
|
|
|
|
|
|
|
|||
Diluted |
|
|
|
|
|
|
|
|
|
|||
See accompanying notes to the consolidated financial statements
61
SPORTSMAN’S WAREHOUSE HOLDINGS, INC. AND SUBSIDIARIES
CONSOLIDATED STATEMENTS OF STOCKHOLDERS’ EQUITY
Amounts in Thousands
|
|
Common Stock |
|
|
Restricted nonvoting |
|
|
Treasury Stock |
|
|
Additional |
|
|
Accumulated |
|
|
Total |
|
||||||||||||||||||
|
|
Shares |
|
|
Amount |
|
|
Shares |
|
|
Amount |
|
|
Shares |
|
|
Amount |
|
|
Amount |
|
|
Amount |
|
|
Amount |
|
|||||||||
Balance at January 30, 2021 |
|
|
|
|
$ |
|
|
|
— |
|
|
$ |
— |
|
|
|
— |
|
|
$ |
— |
|
|
$ |
|
|
$ |
|
|
$ |
|
|||||
Vesting of restricted stock units |
|
|
|
|
|
|
|
|
— |
|
|
|
— |
|
|
|
— |
|
|
|
— |
|
|
|
( |
) |
|
|
— |
|
|
|
— |
|
||
Payment of withholdings on restricted stock units |
|
|
— |
|
|
|
— |
|
|
|
— |
|
|
|
— |
|
|
|
— |
|
|
|
— |
|
|
|
( |
) |
|
|
— |
|
|
|
( |
) |
Stock based compensation |
|
|
— |
|
|
|
— |
|
|
|
— |
|
|
|
— |
|
|
|
— |
|
|
|
— |
|
|
|
|
|
|
— |
|
|
|
|
||
Net income |
|
|
— |
|
|
|
— |
|
|
|
— |
|
|
|
— |
|
|
|
— |
|
|
|
— |
|
|
|
— |
|
|
|
|
|
|
|
||
Balance at January 29, 2022 |
|
|
|
|
$ |
|
|
|
— |
|
|
$ |
— |
|
|
|
— |
|
|
$ |
— |
|
|
$ |
|
|
$ |
|
|
$ |
|
|||||
Repurchase of treasury stock |
|
|
— |
|
|
|
— |
|
|
|
— |
|
|
|
— |
|
|
|
|
|
|
( |
) |
|
|
— |
|
|
|
— |
|
|
|
( |
) |
|
Retirement of treasury stock |
|
|
( |
) |
|
|
( |
) |
|
|
— |
|
|
|
— |
|
|
|
( |
) |
|
|
|
|
|
( |
) |
|
|
( |
) |
|
|
— |
|
|
Vesting of restricted stock units |
|
|
|
|
|
|
|
|
— |
|
|
|
— |
|
|
|
— |
|
|
|
— |
|
|
|
( |
) |
|
|
— |
|
|
|
— |
|
||
Payment of withholdings on restricted stock units |
|
|
— |
|
|
|
— |
|
|
|
— |
|
|
|
— |
|
|
|
— |
|
|
|
— |
|
|
|
( |
) |
|
|
— |
|
|
|
( |
) |
Issuance of common stock for cash per employee stock purchase plan |
|
|
|
|
|
|
|
|
— |
|
|
|
— |
|
|
|
— |
|
|
|
— |
|
|
|
|
|
|
— |
|
|
|
|
||||
Stock based compensation |
|
|
— |
|
|
|
— |
|
|
|
— |
|
|
|
— |
|
|
|
— |
|
|
|
— |
|
|
|
|
|
|
— |
|
|
|
|
||
Net income |
|
|
— |
|
|
|
— |
|
|
|
— |
|
|
|
— |
|
|
|
— |
|
|
|
— |
|
|
|
— |
|
|
|
|
|
|
|
||
Balance at January 28, 2023 |
|
|
|
|
$ |
|
|
|
— |
|
|
$ |
— |
|
|
|
— |
|
|
$ |
— |
|
|
$ |
|
|
$ |
|
|
$ |
|
|||||
Repurchase of treasury stock |
|
|
— |
|
|
|
— |
|
|
|
— |
|
|
|
— |
|
|
|
|
|
|
( |
) |
|
|
— |
|
|
|
— |
|
|
|
( |
) |
|
Retirement of treasury stock |
|
|
( |
) |
|
|
( |
) |
|
|
— |
|
|
|
— |
|
|
|
( |
) |
|
|
|
|
|
( |
) |
|
|
( |
) |
|
|
— |
|
|
Vesting of restricted stock units |
|
|
|
|
|
|
|
|
— |
|
|
|
— |
|
|
|
— |
|
|
|
— |
|
|
|
( |
) |
|
|
— |
|
|
|
— |
|
||
Payment of withholdings on restricted stock units |
|
|
— |
|
|
|
— |
|
|
|
— |
|
|
|
— |
|
|
|
— |
|
|
|
— |
|
|
|
( |
) |
|
|
— |
|
|
|
( |
) |
Issuance of common stock for cash per employee stock purchase plan |
|
|
|
|
|
|
|
|
— |
|
|
|
— |
|
|
|
— |
|
|
|
— |
|
|
|
|
|
|
— |
|
|
|
|
||||
Stock based compensation |
|
|
— |
|
|
|
— |
|
|
|
— |
|
|
|
— |
|
|
|
— |
|
|
|
— |
|
|
|
|
|
|
— |
|
|
|
|
||
Net (loss) |
|
|
— |
|
|
|
— |
|
|
|
— |
|
|
|
— |
|
|
|
— |
|
|
|
— |
|
|
|
— |
|
|
|
( |
) |
|
|
( |
) |
Balance at February 3, 2024 |
|
|
|
|
$ |
|
|
|
— |
|
|
$ |
— |
|
|
|
— |
|
|
$ |
— |
|
|
$ |
|
|
$ |
|
|
$ |
|
|||||
See accompanying notes to the consolidated financial statements
62
SPORTSMAN’S WAREHOUSE HOLDINGS, INC. AND SUBSIDIARIES
CONSOLIDATED STATEMENTS OF CASH FLOWS
Amounts in Thousands
|
|
Fiscal Year Ended |
|
|||||||||
|
|
February 3, |
|
|
January 28, |
|
|
January 29, |
|
|||
|
|
2024 |
|
|
2023 |
|
|
2022 |
|
|||
Cash flows from operating activities: |
|
|
|
|
|
|
|
|
|
|||
Net (loss) income |
|
$ |
( |
) |
|
$ |
|
|
$ |
|
||
Adjustments to reconcile net (loss) income to net cash provided by (used in) operating activities: |
|
|
|
|
|
|
|
|
|
|||
Depreciation of property and equipment |
|
|
|
|
|
|
|
|
|
|||
Amortization of deferred financing fees |
|
|
|
|
|
|
|
|
|
|||
Amortization of definite lived intangible |
|
|
|
|
|
|
|
|
|
|||
Noncash lease expense |
|
|
|
|
|
|
|
|
|
|||
Deferred income taxes |
|
|
( |
) |
|
|
|
|
|
|
||
Stock-based compensation |
|
|
|
|
|
|
|
|
|
|||
Change in operating assets and liabilities, net of amounts acquired: |
|
|
|
|
|
|
|
|
|
|||
Accounts receivable, net |
|
|
( |
) |
|
|
( |
) |
|
|
( |
) |
Operating lease liabilities |
|
|
( |
) |
|
|
( |
) |
|
|
( |
) |
Merchandise inventories |
|
|
|
|
|
( |
) |
|
|
( |
) |
|
Prepaid expenses and other |
|
|
|
|
|
( |
) |
|
|
( |
) |
|
Accounts payable |
|
|
|
|
|
( |
) |
|
|
( |
) |
|
Accrued expenses |
|
|
( |
) |
|
|
( |
) |
|
|
( |
) |
Income taxes payable and receivable |
|
|
( |
) |
|
|
( |
) |
|
|
|
|
Net cash provided by (used in) operating activities |
|
|
|
|
|
|
|
|
( |
) |
||
Cash flows from investing activities: |
|
|
|
|
|
|
|
|
|
|||
Purchase of property and equipment, net of amounts acquired |
|
|
( |
) |
|
|
( |
) |
|
|
( |
) |
Proceeds from sale-leaseback transactions |
|
|
— |
|
|
|
|
|
|
— |
|
|
Net cash used in investing activities |
|
|
( |
) |
|
|
( |
) |
|
|
( |
) |
Cash flows from financing activities: |
|
|
|
|
|
|
|
|
|
|||
Net borrowings on line of credit |
|
|
|
|
|
|
|
|
|
|||
Increase (Decrease) in book overdraft, net |
|
|
( |
) |
|
|
|
|
|
|
||
Proceeds from issuance of common stock per employee stock purchase plan |
|
|
|
|
|
|
|
|
— |
|
||
Payment of withholdings on restricted stock units |
|
|
( |
) |
|
|
( |
) |
|
|
( |
) |
Payments to acquire treasury stock |
|
|
( |
) |
|
|
( |
) |
|
|
— |
|
Payment of deferred financing costs |
|
|
— |
|
|
|
( |
) |
|
|
— |
|
Net cash provided by (used in) financing activities |
|
|
|
|
|
( |
) |
|
|
|
||
Net change in cash and cash equivalents |
|
|
|
|
|
( |
) |
|
|
( |
) |
|
Cash and cash equivalents at beginning of period |
|
|
|
|
|
|
|
|
|
|||
Cash and cash equivalents at end of period |
|
$ |
|
|
$ |
|
|
$ |
|
|||
|
|
|
|
|
|
|
|
|
|
|||
Supplemental disclosures of cash flow information: |
|
|
|
|
|
|
|
|
|
|||
Cash paid during the period for: |
|
|
|
|
|
|
|
|
|
|||
Interest, net of amounts capitalized |
|
$ |
|
|
$ |
|
|
$ |
|
|||
Income taxes, net of refunds |
|
|
|
|
|
|
|
|
|
|||
|
|
|
|
|
|
|
|
|
|
|||
Supplemental schedule of noncash activities: |
|
|
|
|
|
|
|
|
|
|||
Noncash change in operating lease right of use asset and operating lease liabilities from remeasurement of existing leases and addition of new leases |
|
$ |
|
|
$ |
|
|
$ |
|
|||
Purchases of property and equipment included in accounts payable and accrued expenses |
|
$ |
|
|
$ |
|
|
$ |
|
|||
See accompanying notes to the consolidated financial statements
63
SPORTSMAN’S WAREHOUSE HOLDINGS, INC. AND SUBSIDIARIES
Notes to Consolidated Financial Statements
Dollars in Thousands, except per share amounts
(1) Nature of Business
Description of Business
Sportsman’s Warehouse Holdings, Inc. (“Holdings”), a Delaware corporation, and subsidiaries (collectively, the “Company”) operate retail sporting goods stores. As of February 3, 2024, the Company operated
(2) Summary of Significant Accounting Policies
Principles of Consolidation
The consolidated financial statements of the Company have been prepared in accordance with U.S. generally accepted accounting principles (“GAAP”) and include the accounts of its
Fiscal Year
The Company operates using a
Seasonality
The Company’s business is generally seasonal, with a moderately higher portion of total sales occurring during the third and fourth quarters of the fiscal year.
Use of Estimates in the Preparation of Consolidated Financial Statements
The preparation of consolidated financial statements in conformity with GAAP requires management to make estimates and assumptions that affect the reported amounts of assets and liabilities and disclosure of contingent assets and liabilities at the date of the consolidated financial statements and the reported amounts of revenues and expenses during the reporting period. Actual results could differ from those estimates.
Segment Reporting
The Company operates solely as a sporting goods retailer whose Chief Operating Decision Maker (“CODM”) is the Chief Executive Officer. The CODM reviews financial information presented on a consolidated and individual store and cost center basis, for purposes of allocating resources and evaluating financial performance. The Company’s stores typically have similar square footage and offer essentially the same general product mix. The Company’s core customer demographic remains similar chainwide, as does the Company’s process for the procurement and marketing of its product mix. The Company distributes its product mix chainwide from a single distribution center. Furthermore, the Company also operates an e-commerce platform at www.sportsmans.com. Given that the stores and e-commerce platform have the same economic characteristics, the Company's stores and website are aggregated into
Cash and Cash Equivalents
The Company considers cash on hand in stores and operating accounts as cash. Checks issued pending bank clearance that result in overdraft balances for accounting purposes are classified as accrued expenses in the
64
accompanying consolidated balance sheets. Cash equivalents consist of short-term money market securities with maturities less than three months from the time of investment.
In accordance with the terms of a financing agreement (Note 7), the Company maintains depository accounts with two banks in a lock-box or similar arrangement. Deposits into these accounts are used to reduce the outstanding balance on the line of credit as soon as the respective bank allows the funds to be transferred to the financing company. At February 3, 2024 and January 28, 2023, the combined balance in these accounts was $
Accounts Receivable
The Company offers credit terms on the sale of products to certain government and corporate retail customers and requires no collateral from these customers. The Company performs ongoing credit evaluations of its customers’ financial condition and maintains an allowance for credit losses based upon historical experience and a specific review of accounts receivable at the end of each period. Actual bad debts may differ from these estimates and the difference could be significant. At February 3, 2024 and January 28, 2023, the Company had
Merchandise Inventories
The Company measures its inventory at the lower of cost or net realizable value. Cost is determined using the weighted average cost method. The Company estimates a provision for inventory shrinkage based on its historical inventory accuracy rates as determined by periodic cycle counts. The Company also adjusts inventory for obsolete, slow moving, or damaged inventory based on inventory activity thresholds and by specific identification of certain slow moving or obsolete inventory. The inventory write downs for shrinkage, damage, or obsolescence totaled $
Property and Equipment
Property and equipment are recorded at cost. Leasehold improvements primarily include the cost of improvements funded by landlord incentives or allowances. Maintenance, repairs, minor renewals, and betterments are expensed as incurred. Major renewals and betterments are capitalized. Upon retirement or disposal of assets, the cost and accumulated depreciation and amortization are eliminated from the respective accounts and the related gains or losses are credited or charged to earnings.
Depreciation and amortization of property and equipment is computed using the straight-line method over the estimated useful lives of the related assets. Leasehold improvements are amortized over the shorter of the useful lives of the improvements or the term of the lease. Furniture, fixtures, and equipment, are depreciated over useful lives ranging from to
Impairment of Long-Lived Assets
The Company reviews its long-lived assets with definite lives for impairment whenever events or changes in circumstances may indicate that the carrying value of an asset may not be recoverable. The Company uses an estimate of the future undiscounted net cash flows of the related asset or group of assets over their remaining useful lives in measuring whether the assets are recoverable. If the carrying amount of an asset exceeds its estimated future cash flows, an impairment charge is recognized for the amount by which the carrying amount exceeds the estimated fair value of the asset. Impairment of long-lived assets is assessed at the lowest levels for which there are identifiable cash flows that are independent of other groups of assets. Assets to be disposed of are reported at the lower of the carrying amount or fair value, less the estimated costs to sell. There were
65
Goodwill
At least annually, during the fourth quarter, or when events and circumstances warrant an evaluation, the Company performs its impairment assessment of goodwill. This assessment permits an entity to initially perform a qualitative assessment of whether it is more likely than not that a reporting unit’s fair value is less than its carrying amount before applying the quantitative goodwill impairment test. If an entity concludes that it is not more likely than not that the fair value of a reporting unit is less than its carrying amount, it would not need to perform the impairment test for the reporting unit.
If it is determined that it is more likely than not that the fair value of a reporting unit is less than its carrying amount, the impairment analysis is performed, which incorporates a fair-value based approach. The Company determines the fair value of its reporting units based on discounted cash flows and market approach analyses as considered necessary. The Company considers factors such as the economy, reduced expectations for future cash flows coupled with a decline in the market price of its stock and market capitalization for a sustained period as indicators for potential goodwill impairment. If the reporting unit’s carrying amount exceeds its fair value, the Company will record an impairment charge based on that difference. The impairment charge will be limited to the amount of goodwill allocated to that reporting unit.
Prepaid Expenses and Other
Prepaid expenses and other primarily consists of prepaid expenses, vendor rebates receivable, vendor advertising receivables, right of return assets, and miscellaneous deposits.
Leases
In accordance with ASC 842, the Company determines if an arrangement is a lease at inception. The Company has operating leases for the Company’s retail stores, distribution center, and corporate office. Operating leases are included in operating lease ROU assets and operating lease liabilities, current and noncurrent, on the consolidated balance sheet. Lease liabilities are initially recorded at the present value of the lease payments by discounting the lease payments by the Company's incremental borrowing rate (“IBR”) and then recording accretion over the lease term using the effective interest method. Operating lease classification results in a straight-line expense recognition pattern over the lease term and recognized lease expense as a single expense component, which results in amortization of the ROU asset that equals the difference between lease expense and interest expense. Operating lease expense is included in selling, general and administrative expense, based on the use of the leased asset, on the consolidated statement of operations. Leases with an initial term of 12 months or less are not recorded on the balance sheet and are not material; the Company recognizes lease expense for these leases on a straight-line basis over the remaining lease term.
ROU assets represent the right to use an underlying asset for the lease term and lease liabilities represent the obligation to make lease payments arising from the lease. Operating lease ROU assets and liabilities are recognized at the commencement date based on the present value of lease payments over the reasonably certain lease term. As the Company’s leases generally do not provide an implicit rental rate, the Company uses an IBR to determine the present value of future rental payments. The IBR is determined by using the Company’s credit rating to develop a yield curve that approximates the Company’s market risk profile. The operating lease ROU asset also includes any prepaid lease payments made by the tenant and is reduced by lease incentives such as tenant improvement allowances. The operating lease terms may include options to extend or terminate the lease when it is reasonably certain that the Company will exercise that option. Lease expense is recognized on a straight-line basis over the lease term.
See Note 5 for further discussion on leases.
66
Revenue Recognition
Revenue recognition accounting policy
The Company operates solely as an outdoor retailer, which includes both retail stores and an e-commerce platform, that offers a broad range of products in the United States and online. Generally, all revenues are recognized when control of the promised goods is transferred to customers, in an amount that reflects the consideration in exchange for those goods. Accordingly, the Company implicitly enters into a contract with customers to deliver merchandise inventory at the point of sale. Collectability is reasonably assured since the Company only extends immaterial credit for purchases to certain municipalities.
Substantially all of the Company’s revenue is for single performance obligations for the following distinct items:
For performance obligations related to retail store and e-commerce sales contracts, the Company typically transfers control, for retail stores, upon consummation of the sale when the product is paid for and taken by the customer and, for e-commerce sales, when the products are tendered for delivery to the common carrier.
The transaction price for each contract is the stated price on the product, reduced by any stated discounts at that point in time. The Company does not engage in sales of products that attach a future material right which could result in a separate performance obligation for the purchase of goods in the future at a material discount. The implicit point-of-sale contract with the customer, as reflected in the transaction receipt, states the final terms of the sale, including the description, quantity, and price of each product purchased. Payment for the Company’s contracts is due in full upon delivery. The customer agrees to a stated price implicit in the contract that does not vary over the contract.
The transaction price relative to sales subject to a right of return reflects the amount of estimated consideration to which the Company expects to be entitled. This amount of variable consideration included in the transaction price, and measurement of net sales, is included in net sales only to the extent that it is probable that there will be no significant reversal in a future period. Actual amounts of consideration ultimately received may differ from the Company’s estimates. The allowance for sales returns is estimated based upon historical experience and a provision for estimated returns is recorded as a reduction in sales in the relevant period. The estimated merchandise inventory cost related to the sales returns is recorded in prepaid expenses and other. The estimated refund liabilities are recorded in accrued expenses. If actual results in the future vary from the Company’s estimates, the Company adjusts these estimates, which would affect net sales and earnings in the period such variances become known.
Contract liabilities are recognized primarily for gift card sales and the Company’s loyalty reward program. Cash received from the sale of gift cards is recorded as a contract liability in accrued expenses, and the Company recognizes revenue upon the customer’s redemption of the gift card. Gift card breakage is recognized as revenue in proportion to the pattern of customer redemptions by applying a historical breakage rate of
As it relates to e-commerce sales, the Company accounts for shipping and handling as fulfillment activities, and not as a separate performance obligation. Accordingly, the Company recognizes revenue for only one performance obligation, the sale of the product, at the shipping point (when the customer gains control). Revenue associated with shipping and handling is not material. The costs associated with fulfillment are recorded in costs of goods sold.
67
The Company offers promotional financing and credit cards issued by a third-party bank that manages and directly extends credit to the Company’s customers. The Company provides a license to its brand and marketing services, and the Company facilitates credit applications in its stores and online. The banks are the sole owners of the accounts receivable generated under the program and, accordingly, the Company does not hold any customer receivables related to these programs and acts as an agent in the financing transactions with customers. The Company is eligible to receive a profit share from certain of its banking partners based on the annual performance of their corresponding portfolio, and the Company receives monthly payments based on forecasts of full-year performance. This is a form of variable consideration. The Company records such profit share as revenue over time using the most likely amount method, which reflects the amount earned each month when it is determined that the likelihood of a significant revenue reversal is not probable, which is typically monthly. Profit-share payments occur monthly, shortly after the end of each program month.
Taxes assessed by a governmental authority that are both imposed on and concurrent with a specific revenue-producing transaction, that are collected by the Company from a customer, are excluded from revenue.
Sales returns
The Company allows customers to return items purchased within 30 days provided the merchandise is in resaleable condition with original packaging and the original sales/gift receipt is presented. The Company estimates a reserve for sales returns and records the respective reserve amounts, including a right to return asset when a product is expected to be returned and resold. Historical experience of actual returns and customer return rights are the key factors used in determining the estimated sales returns.
Contract Balances
The following table provides information about right of return assets, contract liabilities, and sales return liabilities with customers as of February 3, 2024 and January 28, 2023:
|
|
February 3, 2024 |
|
|
January 28, 2023 |
|
||
Right of return assets, which are included in prepaid expenses and other |
|
$ |
|
|
$ |
|
||
Estimated gift card contract liability, net of breakage |
|
|
( |
) |
|
|
( |
) |
Estimated loyalty contract liability, net of breakage |
|
|
( |
) |
|
|
( |
) |
Sales return liabilities, which are included in accrued expenses |
|
|
( |
) |
|
|
( |
) |
For the fiscal years ended February 3, 2024, January 28, 2023, and January 29, 2022, the Company recognized $
The current balance of the right of return assets is the expected amount of inventory to be returned that is expected to be resold. The current balance of the contract liabilities primarily relates to the gift card and loyalty reward program liabilities. The Company expects the revenue associated with these liabilities to be recognized in proportion to the pattern of customer redemptions over the next
68
Disaggregation of revenue from contracts with customers
In the following table, revenue from contracts with customers is disaggregated by department. The percentage of net sales related to the Company’s departments during the fiscal years ended February 3, 2024, January 28, 2023, and January 29, 2022, was approximately:
|
|
|
|
Fiscal year Ended |
|
|||||||||
|
|
|
|
February 3, |
|
|
January 28, |
|
|
January 29, |
|
|||
Department |
|
Product Offerings |
|
2024 |
|
|
2023 |
|
|
2022 |
|
|||
Camping |
|
Backpacks, camp essentials, canoes and kayaks, coolers, outdoor cooking equipment, sleeping bags, tents and tools |
|
|
% |
|
|
% |
|
|
% |
|||
Apparel |
|
Camouflage, jackets, hats, outerwear, sportswear, technical gear and work wear |
|
|
% |
|
|
% |
|
|
% |
|||
Fishing |
|
Bait, electronics, fishing rods, flotation items, fly fishing, lines, lures, reels, tackle and small boats |
|
|
% |
|
|
% |
|
|
% |
|||
Footwear |
|
Hiking boots, socks, sport sandals, technical footwear, trail shoes, casual shoes, waders and work boots |
|
|
% |
|
|
% |
|
|
% |
|||
Hunting and Shooting |
|
Ammunition, archery items, ATV accessories, blinds and tree stands, decoys, firearms, reloading equipment and shooting gear |
|
|
% |
|
|
% |
|
|
% |
|||
Optics, Electronics, Accessories, and Other |
|
Gift items, GPS devices, knives, lighting, optics, two-way radios, and other license revenue, net of revenue discounts |
|
|
% |
|
|
% |
|
|
% |
|||
Total |
|
|
|
|
% |
|
|
% |
|
|
% |
|||
Cost of Goods Sold
Cost of goods sold primarily consists of merchandise acquisition costs, including freight-in costs, shipping costs, terms discounts received from the vendor and vendor allowances and rebates associated directly with merchandise. Vendor allowances include allowances and rebates received from vendors. The Company records an estimate of earned allowances based on purchase volumes. These funds are determined for each fiscal year, and the majority is based on various quantitative contract terms. Amounts expected to be received from vendors relating to purchase of merchandise inventories are recognized as a reduction of cost of goods sold as the merchandise is sold. Historical program results and current purchase volumes are reviewed when establishing the estimate for earned allowances.
Shipping and Handling Fees and Costs
All shipping and handling fees billed to customers are recorded as a component of net sales. All costs incurred related to the shipping and handling of products are recorded in cost of sales.
Vendor Allowances
Vendor allowances include price allowances, volume rebates, store opening costs reimbursements, marketing participation and advertising reimbursements received from vendors under the terms of specific arrangements with certain vendors. Vendor allowances related to merchandise are recognized as a reduction of the costs of merchandise as sold. Vendor reimbursements of costs are recorded as a reduction to expense in the period the related cost is incurred based on actual costs incurred. Any cost reimbursements exceeding expenses incurred are recognized as a reduction of the cost of merchandise sold. Volume allowances may be estimated based on historical purchases and estimates of projected purchases.
69
Health Insurance
The Company maintains for its employees a partially self-funded health insurance plan. The Company maintains stop-loss insurance through an insurance company with a $
The Company has established reserve amounts based upon claims history and estimates of claims that have been incurred but not reported (“IBNR”) for this plan. As of February 3, 2024, and January 28, 2023, the Company estimated the IBNR for this plan to be $
Workers Compensation Insurance
The Company maintains for its employees a high-deductible workers compensation plan. The Company maintains stop-loss insurance through an insurance company with a $
The Company has established reserve amounts based upon claims history and estimates of IBNR for this plan. As of February 3, 2024, and January 28, 2023, the Company estimated the IBNR for this plan to be $
Advertising
Costs for newspaper, television, radio, and other advertising are expensed in the period in which the advertising occurs. The Company participates in various advertising and marketing cooperative programs with its vendors, who, under these programs, reimburse the Company for certain costs incurred. Payments received under these cooperative programs are recorded as a decrease to expense in the period that the advertising occurred. For the fiscal years ended February 3, 2024, January 28, 2023, and January 29, 2022, net advertising expenses totaled $
Stock-Based Compensation
Compensation expense is estimated based on grant date fair value on a straight-line basis over the requisite service or offering period. Costs associated with awards are included in compensation expense as a component of selling, general, and administrative expenses.
Income Taxes
The Company recognizes a deferred income tax liability or deferred income tax asset for the future tax consequences attributable to differences between the financial statement basis of existing assets and liabilities and their respective tax basis. Deferred income tax assets and liabilities are measured using enacted tax rates expected to apply to taxable income in the years in which those temporary differences are expected to be recovered or settled. A valuation allowance is provided against deferred income tax assets when it is more likely than not that all or some portion of the deferred income tax assets will not be realized.
The Company recognizes the tax benefit from an uncertain tax position only if it is more likely than not that the tax position will be sustained on examination by the relevant tax authorities, based on the technical merits of the position. Interest and potential penalties are accrued related to unrecognized tax benefits in the provision for income taxes.
70
Fair Value of Financial Instruments
As of February 3, 2024, and January 28, 2023, the carrying amounts of financial instruments except for long-term debt approximate fair value because of the general short-term nature of these instruments. The carrying amounts of long-term variable rate debt approximate fair value as the terms are consistent with market terms for similar debt instruments.
Earnings Per Share
Basic earnings per share is calculated by dividing net income by the weighted-average shares of common stock outstanding, reduced by shares repurchased and held in treasury, during the period. Diluted earnings per share represents basic earnings per share adjusted to include the potentially dilutive effect of outstanding share option awards, nonvested share awards and nonvested share unit awards.
Comprehensive Income
The Company has
Share Retirement
The Company periodically repurchases and retires stock through a board authorized repurchase program. When shares are retired as part of this program the repurchased shares are returned to a status of authorized but unissued. The Company’s policy to account for the retired shares is to allocate the excess of the repurchase price over the par value of shares acquired to Additional Paid in Capital ("APIC") and Retained Earnings. The portion allocated to APIC is determined by dividing the number of retired shares by the number of shares issued as of the retirement date. This ratio is applied to the balance of APIC as of the retirement date. Any remaining amount of the excess of the repurchase price over the par value not allocated to APIC reduces Retained Earnings.
Recently Issued Accounting Pronouncements
In November 2023, the FASB issued ASU No. 2023-07, Segment Reporting (Topic 280)—Improvements to Reportable Segment Disclosures, which aims to improve reportable segment disclosure requirements, primarily through enhanced disclosures about significant segment expenses. In addition, the amendments in the ASU enhance interim disclosure requirements, clarify circumstances in which an entity can disclose multiple segment measures of profit or loss, provide new segment disclosure requirements for entities with a single reportable segment, and contain other disclosure requirements. The ASU applies to all public entities that are required to report segment information in accordance with ASC 280, and is effective for fiscal years beginning after December 15, 2023 and interim periods within fiscal years beginning after December 15, 2024, with early adoption permitted. The Company is evaluating the future impact of the issuance of this ASU on its consolidated financial statements.
In December 2023, the FASB issued ASU No. 2023-09, Income Taxes (Topic 740)—Improvements to Income Tax Disclosures, which include improvements to income tax disclosures by requiring (1) consistent categories and greater disaggregation of information in the rate reconciliation and (2) income taxes paid disaggregated by jurisdiction. This ASU also includes certain other amendments to better align disclosures with Regulation S-X and to remove disclosures no longer considered cost beneficial or relevant. This ASU is effective for public entities for annual periods beginning after December 15, 2024, with earlier or retrospective application permitted. The amendments in this ASU should be applied prospectively for annual financial statements not yet issued or made available for issuance. The Company is evaluating the future impact of the issuance of this ASU on its consolidated financial statements.
71
(3) Property and Equipment
Property and equipment consisted of the following as of February 3, 2024 and January 28, 2023:
|
|
February 3, |
|
|
January 28, |
|
||
|
|
2024 |
|
|
2023 |
|
||
Furniture, fixtures, and equipment |
|
$ |
|
|
$ |
|
||
Leasehold improvements |
|
|
|
|
|
|
||
Construction in progress |
|
|
|
|
|
|
||
Total property and equipment, gross |
|
|
|
|
|
|
||
Less accumulated depreciation and amortization |
|
|
( |
) |
|
|
( |
) |
Total property and equipment, net |
|
$ |
|
|
$ |
|
||
Depreciation expense was $
(4) Definite Lived Intangible Assets
Definite lived intangible assets consisted of the following as of February 3, 2024 and January 28, 2023:
|
|
February 3, 2024 |
|
|||||||||||
|
|
Amortization Period |
|
Gross carrying amount |
|
|
Accumulated amortization |
|
|
Net carrying amount |
|
|||
Amortizing intangible assets: |
|
|
|
|
|
|
|
|
|
|
|
|||
Domain Name |
|
|
|
|
|
|
( |
) |
|
|
|
|||
Intellectual Property |
|
|
|
|
|
|
( |
) |
|
|
|
|||
Total |
|
|
|
$ |
|
|
|
( |
) |
|
|
|
||
|
|
|
|
|
|
|
|
|
|
|
|
|||
|
|
January 28, 2023 |
|
|||||||||||
|
|
Amortization Period |
|
Gross carrying amount |
|
|
Accumulated amortization |
|
|
Net carrying amount |
|
|||
Amortizing intangible assets: |
|
|
|
|
|
|
|
|
|
|
|
|||
Domain Name |
|
|
|
|
|
|
( |
) |
|
|
|
|||
Intellectual Property |
|
|
|
|
|
|
( |
) |
|
|
|
|||
Total |
|
|
|
$ |
|
|
|
( |
) |
|
|
|
||
Amortization expense for definite lived intangible asset was $
(5) Leases
At the inception of the lease, the Company’s operating leases have remaining certain lease terms of up to
In the fiscal year ended February 3, 2024, the Company recorded a non-cash increase of $
The Company has certain retail locations at which the leases provide for variable payments for common area maintenance, property taxes, insurance and rental payments based on future sales volumes at the leased location, which are not measurable at the inception of the lease. The Company recognizes variable lease expense for these leases in the period incurred.
The Company’s lease agreements do not contain any material residual value guarantees or material restrictive covenants.
72
In accordance with ASC 842, total lease expense was comprised of the following:
|
|
Fiscal Year Ended |
|
|||||||||
|
|
February 3, |
|
|
January 28, |
|
|
January 29, |
|
|||
|
|
2024 |
|
|
2023 |
|
|
2022 |
|
|||
Operating lease expense |
|
$ |
|
|
$ |
|
|
$ |
|
|||
Variable lease expense |
|
|
|
|
|
|
|
|
|
|||
Short-term lease expense |
|
|
|
|
|
|
|
|
|
|||
Total lease expense |
|
$ |
|
|
$ |
|
|
$ |
|
|||
In accordance with ASC 842, other information related to leases was as follows:
|
|
Fiscal Year Ended |
|
|||||||||
|
|
February 3, |
|
|
January 28, |
|
|
January 29, |
|
|||
|
|
2024 |
|
|
2023 |
|
|
2022 |
|
|||
Operating cash flows from operating leases |
|
$ |
( |
) |
|
$ |
( |
) |
|
$ |
( |
) |
Cash paid for lease liabilities - operating leases |
|
|
( |
) |
|
|
( |
) |
|
|
( |
) |
|
|
|
|
|
|
|
|
|
|
|||
|
|
As of February 3, |
|
|
As of January 28, |
|
|
As of January 29, |
|
|||
|
|
2024 |
|
|
2023 |
|
|
2022 |
|
|||
Right-of-use assets obtained in exchange for new or |
|
$ |
|
|
$ |
|
|
$ |
|
|||
Terminated right-of-use assets and liabilities |
|
|
— |
|
|
|
— |
|
|
|
— |
|
Weighted-average remaining lease term - operating leases |
|
|
|
|
|
|
|
|
|
|||
Weighted-average discount rate - operating leases |
|
|
% |
|
|
% |
|
|
% |
|||
In accordance with ASC 842, maturities of operating lease liabilities as of February 3, 2024 were as follows:
|
|
Operating |
|
|
Fiscal Year Endings: |
|
Leases |
|
|
2024 |
|
$ |
|
|
2025 |
|
|
|
|
2026 |
|
|
|
|
2027 |
|
|
|
|
2028 |
|
|
|
|
Thereafter |
|
|
|
|
Undiscounted cash flows |
|
$ |
|
|
Reconciliation of lease liabilities: |
|
|
|
|
Present values |
|
$ |
|
|
Lease liabilities - current |
|
|
|
|
Lease liabilities - noncurrent |
|
|
|
|
Lease liabilities - total |
|
$ |
|
|
Difference between undiscounted and discounted cash flows |
|
$ |
|
|
The Company has excluded in the table above approximately $
73
(6) Accrued Expenses and Other Liabilities
Accrued expenses and other liabilities consist of the following at February 3, 2024 and January 28, 2023:
|
|
February 3, |
|
|
January 28, |
|
||
Book overdraft |
|
$ |
|
|
$ |
|
||
Unearned revenue |
|
|
|
|
|
|
||
Accrued payroll and related expenses |
|
|
|
|
|
|
||
Sales and use tax payable |
|
|
|
|
|
|
||
Accrued construction costs |
|
|
|
|
|
|
||
Other |
|
|
|
|
|
|
||
Total accrued expenses |
|
$ |
|
|
$ |
|
||
(7) Revolving Line of Credit
On May 27, 2022, Sportsman’s Warehouse, Inc. (“SWI”), a wholly owned subsidiary of Holdings, as lead borrower, Holdings and other subsidiaries of the Company, each as borrowers or guarantors, and Wells Fargo Bank, National Association (“Wells Fargo”), with a consortium of banks led by Wells Fargo, entered into an Amended and Restated Credit Agreement (as amended, restated, supplemented or otherwise modified, the “Credit Agreement”). The Credit Agreement governs the Company’s senior secured revolving credit facility (“Revolving Line of Credit”). The Revolving Line of Credit provides borrowing capacity of up to $
In conjunction with the Credit Agreement, the Company incurred $
As of February 3, 2024, and January 28, 2023, the Company had $
Borrowings under the Revolving Line of Credit bear interest based on either the base rate or Term SOFR (as defined in the Credit Agreement), at the Company’s option, in each case plus an applicable margin. The base rate is the greatest of (1) the floor rate (as defined in the Credit Agreement as a rate of interest equal to
The Company may be required to make mandatory prepayments under the Revolving Line of Credit in the event of a disposition of certain property or assets, in the event of receipt of certain insurance or condemnation proceeds, upon the issuance of certain debt or equity securities, upon the incurrence of certain indebtedness for borrowed money or upon the receipt of certain payments not received in the ordinary course of business.
The Credit Agreement contains customary affirmative and negative covenants, including covenants that limit the Company’s ability to incur, create or assume certain indebtedness, to create, incur or assume certain liens, to make certain investments, to make sales, transfers and dispositions of certain property and to undergo certain fundamental changes, including certain mergers, liquidations and consolidations.
74
Each of the subsidiaries of Holdings is a borrower under the Revolving Line of Credit, and all obligations under the Revolving Line of Credit are guaranteed by Holdings. All of the obligations under the Revolving Line of Credit are secured by a lien on substantially all of Holdings’ tangible and intangible working capital assets and the tangible and intangible working capital assets of all of Holdings’ subsidiaries, including a pledge of all capital stock of each of Holdings’ subsidiaries. The lien securing the obligations under the Revolving Line of Credit is a first priority lien as to certain liquid assets, including cash, accounts receivable, deposit accounts and inventory.
As of February 3, 2024 and January 28, 2023, the Credit Agreement had $
As of February 3, 2024, January 28, 2023, and January 29, 2022, gross borrowings under the Revolving Line of Credit and the Company's prior revolving line of credit were $
Restricted Net Assets
The provisions of the Revolving Line of Credit restrict all of the net assets of the Company’s consolidated subsidiaries, which constitute all of the net assets on the Company’s condensed consolidated balance sheet as of February 3, 2024, from being used to pay any dividends without prior written consent from the financial institutions party to the Revolving Line of Credit.
(8) Sale-Leaseback Transactions
During the fiscal year ended February 3, 2024, the Company did not complete any sale-leaseback transactions. In fiscal year 2022 the Company completed
(9) Common Stock
Holders of common stock are entitled to
(10) Earnings Per Share
Basic earnings per share is calculated by dividing net income by the weighted-average number of shares of common stock outstanding, during the period. Diluted earnings per share represents basic earnings per share adjusted to include the potentially dilutive effect of nonvested share awards and nonvested share unit awards.
75
The following table sets forth the computation of basic and diluted earnings per common share:
|
|
Fiscal Year Ended |
|
|||||||||
|
|
February 3, |
|
|
January 28, |
|
|
January 29, |
|
|||
|
|
2024 |
|
|
2023 |
|
|
2022 |
|
|||
Net (loss) income |
|
$ |
( |
) |
|
$ |
|
|
$ |
|
||
Weighted-average shares of common stock outstanding: |
|
|
|
|
|
|
|
|
|
|||
Basic |
|
|
|
|
|
|
|
|
|
|||
Dilutive effect of common stock equivalents |
|
|
|
|
|
|
|
|
|
|||
Diluted |
|
|
|
|
|
|
|
|
|
|||
Basic (loss) earnings per share |
|
$ |
( |
) |
|
$ |
|
|
$ |
|
||
Diluted (loss) earnings per share |
|
$ |
( |
) |
|
$ |
|
|
$ |
|
||
Restricted stock units considered anti-dilutive and excluded in the calculation |
|
|
|
|
|
|
|
|
|
|||
(11) Stock-Based Compensation
Stock-Based Compensation
The Company recognized total stock-based compensation expense, including expense relating to the employee stock purchase plan, of $
Employee Stock Plans
As of February 3, 2024, the number of shares available for awards under the 2019 Performance Incentive Plan (the “2019 Plan”) was
Inducement Plan
On September 21, 2023, the Company's Board of Directors adopted and approved the Sportsman’s Warehouse Holdings, Inc. Inducement Plan (the “Inducement Plan”) to reserve
Nonvested Performance-Based Stock Awards
During fiscal year 2023, the Company issued
76
and 2025), the number of shares eligible to vest, based on actual performance, will be fixed and vesting will then be subject to each employee’s continued employment over the remaining service period.
During fiscal year 2022, the Company issued
The following table sets forth the rollforward of outstanding nonvested performance-based stock awards (per share amounts are not in thousands):
|
|
|
|
|
Weighted |
|
||
|
|
|
|
|
average |
|
||
|
|
|
|
|
grant-date |
|
||
|
|
Shares |
|
|
fair value |
|
||
Balance at January 28, 2023 |
|
|
|
|
$ |
|
||
Grants |
|
|
|
|
|
|
||
Forfeitures |
|
|
( |
) |
|
|
|
|
Vested |
|
|
( |
) |
|
|
|
|
Balance at February 3, 2024 |
|
|
|
|
$ |
|
||
|
|
|
|
|
|
|
||
|
|
|
|
|
Weighted |
|
||
|
|
|
|
|
average |
|
||
|
|
|
|
|
grant-date |
|
||
|
|
Shares |
|
|
fair value |
|
||
Balance at January 29, 2022 |
|
|
|
|
$ |
|
||
Grants |
|
|
|
|
|
|
||
Forfeitures |
|
|
( |
) |
|
|
|
|
Vested |
|
|
( |
) |
|
|
|
|
Balance at January 28, 2023 |
|
|
|
|
$ |
|
||
Nonvested Stock Unit Awards
During the fiscal year 2023, the Company issued
During the fiscal year 2022, the Company issued
77
The following table sets forth the rollforward of outstanding nonvested stock units:
|
|
|
|
|
Weighted |
|
||
|
|
|
|
|
average |
|
||
|
|
|
|
|
grant-date |
|
||
|
|
Shares |
|
|
fair value |
|
||
Balance at January 28, 2023 |
|
|
|
|
$ |
|
||
Grants |
|
|
|
|
|
|
||
Forfeitures |
|
|
( |
) |
|
|
|
|
Vested |
|
|
( |
) |
|
|
|
|
Balance at February 3, 2024 |
|
|
|
|
$ |
|
||
|
|
|
|
|
|
|
||
|
|
|
|
|
Weighted |
|
||
|
|
|
|
|
average |
|
||
|
|
|
|
|
grant-date |
|
||
|
|
Shares |
|
|
fair value |
|
||
Balance at January 29, 2022 |
|
|
|
|
$ |
|
||
Grants |
|
|
|
|
|
|
||
Forfeitures |
|
|
( |
) |
|
|
|
|
Vested |
|
|
( |
) |
|
|
|
|
Balance at January 28, 2023 |
|
|
|
|
$ |
|
||
As of February 3, 2024, and January 28, 2023, the weighted average grant date fair value of the outstanding shares was $
(12) Employee Stock Purchase Plan
In June 2015, the Company’s stockholders approved the Sportsman’s Warehouse Holdings, Inc. Employee Stock Purchase Plan (“ESPP”), which provides for the granting of up to
(13) Income Taxes
For the fiscal years ended February 3, 2024, January 28, 2023, and January 29, 2022, the income tax provision consisted of the following:
|
|
February 3, |
|
|
January 28, |
|
|
January 29, |
|
|||
|
|
2024 |
|
|
2023 |
|
|
2022 |
|
|||
Current: |
|
|
|
|
|
|
|
|
|
|||
Federal |
|
$ |
|
|
$ |
|
|
$ |
|
|||
State |
|
|
|
|
|
|
|
|
|
|||
Total current |
|
|
|
|
|
|
|
|
|
|||
Deferred: |
|
|
|
|
|
|
|
|
|
|||
Federal |
|
|
( |
) |
|
|
|
|
|
|
||
State |
|
|
( |
) |
|
|
|
|
|
|
||
Total deferred |
|
|
( |
) |
|
|
|
|
|
|
||
Total income tax provision |
|
$ |
( |
) |
|
$ |
|
|
$ |
|
||
78
The provision for income taxes differs from the amounts computed by applying the federal statutory rate as follows for the following periods:
|
February 3, |
|
January 28, |
|
January 29, |
|
||||||
|
|
2024 |
|
|
2023 |
|
|
2022 |
|
|||
Federal statutory rate |
|
|
% |
|
|
% |
|
|
% |
|||
State tax, net of federal benefit |
|
|
|
|
|
|
|
|
|
|||
Permanent items |
|
|
( |
) |
|
|
|
|
|
|
||
Tax Credits |
|
|
|
|
|
( |
) |
|
|
( |
) |
|
Other items |
|
|
( |
) |
|
|
|
|
|
|
||
Effective income tax rate |
|
|
% |
|
|
% |
|
|
% |
|||
The tax effects of temporary differences that give rise to significant portions of the deferred tax assets and deferred tax liabilities at February 3, 2024 and January 28, 2023, respectively, are presented below:
|
|
February 3, |
|
|
January 28, |
|
||
|
|
2024 |
|
|
2023 |
|
||
Deferred tax assets: |
|
|
|
|
|
|
||
Accrued liabilities |
|
$ |
|
|
$ |
|
||
Operating lease liability |
|
|
|
|
|
|
||
Gift card liability |
|
|
|
|
|
|
||
Goodwill |
|
|
|
|
|
|
||
Intangible asset |
|
|
|
|
|
|
||
Inventories |
|
|
|
|
|
|
||
Sales return reserve |
|
|
|
|
|
|
||
Stock-based compensation |
|
|
|
|
|
|
||
Tax credits |
|
|
|
|
|
— |
|
|
Net operating losses |
|
|
|
|
|
— |
|
|
Loyalty program |
|
|
|
|
|
|
||
Total gross deferred tax assets |
|
$ |
|
|
$ |
|
||
Deferred tax liabilities: |
|
|
|
|
|
|
||
Depreciation |
|
$ |
( |
) |
|
$ |
( |
) |
ROU asset |
|
|
( |
) |
|
|
( |
) |
Prepaid expenses |
|
|
( |
) |
|
|
( |
) |
Total gross deferred tax liabilities |
|
|
( |
) |
|
|
( |
) |
Net deferred tax asset |
|
$ |
|
|
$ |
( |
) |
|
Deferred tax assets have resulted primarily from the Company’s future deductible temporary differences. In assessing the realizability of deferred tax assets, management considers whether it is more likely than not that some portion or all of the deferred tax asset will not be realized. The Company’s ability to realize its deferred tax assets depends upon the generation of sufficient future taxable income.
Management evaluates the realizability of the deferred tax assets and the need for additional valuation allowances quarterly. At February 3, 2024, based on current facts and circumstances, management believes that it is more likely than not that the Company will realize benefit for its deferred tax assets.
As of February 3, 2024, the Company had
The Company’s policy is to accrue interest expense, and penalties as appropriate, on estimated unrecognized tax benefits as a charge to interest expense in the consolidated statements of operations.
79
(14) Commitments and Contingencies
Legal Matters
The Company is involved in various legal matters generally incidental to its business. After discussion with legal counsel, management is not aware of any matters for which the likelihood of a loss is probable and reasonably estimable and which could have a material impact on its consolidated financial condition, liquidity, or results of operations.
On January 22, 2024, Jon Kogut filed a putative class action lawsuit against the Company and the members of its Board of Directors in the Delaware Court of Chancery (the “2024 Delaware Litigation”). The lawsuit asserts claims on behalf of a putative class comprised of all stockholders other than defendants and any current directors or officers of the Company and is captioned Kogut v. Bejar, et al., C.A. No. 2024-0055-MTZ (Del. Ch.). In his complaint, Mr. Kogut contends that certain provisions in the Company’s advance notice bylaws (the “Challenged Provisions”) are invalid and void and that the members of the Board have breached their fiduciary duty of loyalty by adopting and maintaining the Challenged Provisions. In addition to seeking declaratory, equitable, and injunctive relief, Mr. Kogut seeks an award of attorneys’ fees and other costs and expenses on behalf of the putative class.
(15) Retirement Plan
The Company sponsors a profit-sharing plan (the “Plan”) for which Company contributions are based upon wages paid. As approved by the Board of Directors (the “Board”), the Company makes discretionary contributions to the Plan at rates determined by management. The Company made contributions of $
(16) Terminated Merger with Great Outdoors Group, LLC
On December 2, 2021, Sportsman’s Warehouse, Great Outdoors Group, LLC and Phoenix Merger Sub I, Inc. (“Merger Subsidiary”) entered into a Termination Agreement (the “Termination Agreement”) under which the parties agreed to terminate the merger agreement, dated December 21, 2020, among the same parties (the “merger Agreement”), effective immediately. Pursuant to the terms and conditions set forth in the Merger Agreement, Merger Subsidiary would have been merged with and into Sportsman’s Warehouse, with Sportsman’s Warehouse continuing as the surviving corporation in the Merger and a wholly-owned subsidiary of Great Outdoors Group, LLC (the “Merger”). The decision to terminate the Merger Agreement followed feedback from the Federal Trade Commission (“FTC”) that led the parties to believe that they would not have obtained FTC clearance to consummate the Merger. Under the Termination Agreement, Great Outdoors Group, LLC agreed to pay us the Parent Termination Fee (as defined in the Merger Agreement) of $
80
ITEM 9. CHANGES IN AND DISAGREEMENTS WITH ACCOUNTANTS ON ACCOUNTING AND FINANCIAL DISCLOSURE
None.
ITEM 9A. CONTROLS AND PROCEDURES
Our disclosure controls and procedures (as defined in Rules 13a-15(e) and 15d-15(e) under the Exchange Act) are designed to ensure that information required to be disclosed in the reports that we file or submit under the Exchange Act is recorded, processed, summarized, and reported within the time periods specified in the SEC’s rules and forms and to ensure that information required to be disclosed is accumulated and communicated to our management, including our Chief Executive Officer and Chief Financial Officer, as appropriate, to allow for timely decisions regarding required disclosures. Our management has evaluated, under the supervision and with the participation of our Chief Executive Officer and Chief Financial Officer, the effectiveness of our disclosure controls and procedures (as defined in Rules 13a-15(e) and 15d-15(e) under the Exchange Act), as of the end of the period covered by this Annual Report on Form 10-K. Based on that evaluation, our Chief Executive Officer and Chief Financial Officer have concluded that our disclosure controls and procedures were effective as of February 3, 2024.
Inherent Limitations in Effectiveness of Controls
Our management, including our Chief Executive Officer and Chief Financial Officer, does not expect that our disclosure controls and procedures, or our internal controls, will prevent all error and all fraud. A control system, no matter how well conceived and operated, can provide only reasonable, not absolute, assurance that the objectives of the control system are met. Further, the design of a control system must reflect the fact that there are resource constraints, and the benefits of controls must be considered relative to their costs. Because of the inherent limitations in all control systems, no evaluation of controls can provide absolute assurance that all control issues and instances of fraud, if any, within the company have been detected. These inherent limitations include the realities that judgments in decision making can be faulty, and that breakdowns can occur because of simple error or mistake or fraud. Additionally, controls can be circumvented by individuals or groups of persons or by an unauthorized override of the controls. Accordingly, because of the inherent limitations in our control system, misstatements in our public reports due to error or fraud may occur and not be detected.
Our management is responsible for establishing and maintaining adequate internal control over financial reporting (as defined in Rules 13a-15(f) and 15d-15(f) under the Exchange Act). Internal control over financial reporting is a process to provide reasonable assurance regarding the reliability of our financial reporting for external purposes in accordance with GAAP. Our internal control over financial reporting includes those policies and procedures that:
81
Under the supervision and with the participation of our Chief Executive Officer and our Chief Financial Officer, management evaluated the effectiveness of our internal control over financial reporting as of February 3, 2024, based on the criteria established in Internal Control – Integrated Framework (2013) issued by the Committee of Sponsoring Organizations of the Treadway Commission. Based on this evaluation management concluded that our internal controls over financial reporting were effective as of February 3, 2024.
Our independent registered public accounting firm, Grant Thornton LLP, has audited our internal controls over financial reporting. Their opinion on the effectiveness of our internal controls over financial reporting as of February 3, 2024 appears in item 4 below.
There were no changes in our internal control over financial reporting (as defined in Rules 13a-15(d) and 15d-15(d) under the Exchange Act) during the quarter ended February 3, 2024 that have materially affected, or are reasonably likely to materially affect, our internal control over financial reporting.
82
Board of Directors and Shareholders
Sportsman’s Warehouse Holdings, Inc.
Opinion on internal control over financial reporting
We have audited the internal control over financial reporting of Sportsman’s Warehouse Holdings, Inc. (a Delaware corporation) and subsidiaries (the “Company”) as of February 3, 2024, based on criteria established in the 2013 Internal Control—Integrated Framework issued by the Committee of Sponsoring Organizations of the Treadway Commission (“COSO”). In our opinion, the Company maintained, in all material respects, effective internal control over financial reporting as of February 3, 2024, based on criteria established in the 2013 Internal Control—Integrated Framework issued by COSO.
We also have audited, in accordance with the standards of the Public Company Accounting Oversight Board (United States) (“PCAOB”), the consolidated financial statements of the Company as of and for the year ended February 3, 2024, and our report dated April 4, 2024 expressed an unqualified opinion on those financial statements.
Basis for opinion
The Company’s management is responsible for maintaining effective internal control over financial reporting and for its assessment of the effectiveness of internal control over financial reporting, included in the accompanying Management’s Report on Internal Control over Financial Reporting (“Management’s Report”). Our responsibility is to express an opinion on the Company’s internal control over financial reporting based on our audit. We are a public accounting firm registered with the PCAOB and are required to be independent with respect to the Company in accordance with the U.S. federal securities laws and the applicable rules and regulations of the Securities and Exchange Commission and the PCAOB.
We conducted our audit in accordance with the standards of the PCAOB. Those standards require that we plan and perform the audit to obtain reasonable assurance about whether effective internal control over financial reporting was maintained in all material respects. Our audit included obtaining an understanding of internal control over financial reporting, assessing the risk that a material weakness exists, testing and evaluating the design and operating effectiveness of internal control based on the assessed risk, and performing such other procedures as we considered necessary in the circumstances. We believe that our audit provides a reasonable basis for our opinion.
Definition and limitations of internal control over financial reporting
A company’s internal control over financial reporting is a process designed to provide reasonable assurance regarding the reliability of financial reporting and the preparation of financial statements for external purposes in accordance with generally accepted accounting principles. A company’s internal control over financial reporting includes those policies and procedures that (1) pertain to the maintenance of records that, in reasonable detail, accurately and fairly reflect the transactions and dispositions of the assets of the company; (2) provide reasonable assurance that transactions are recorded as necessary to permit preparation of financial statements in accordance with generally accepted accounting principles, and that receipts and expenditures of the company are being made only in accordance with authorizations of management and directors of the company; and (3) provide reasonable assurance regarding prevention or timely detection of unauthorized acquisition, use, or disposition of the company’s assets that could have a material effect on the financial statements.
Because of its inherent limitations, internal control over financial reporting may not prevent or detect misstatements. Also, projections of any evaluation of effectiveness to future periods are subject to the risk that controls may become inadequate because of changes in conditions, or that the degree of compliance with the policies or procedures may deteriorate.
/s/
April 4, 2024
83
ITEM 9B. OTHER INFORMATION
On April 1, 2024, our Compensation Committee approved a cash-based long-term incentive program (the “Cash LTIP”) pursuant to which each of our executive officers and two other officers were granted the right to earn between 0% and 200% of a specified target cash award. The ultimate payout (if any) with respect to the award will be based on our Adjusted EBITDA Margin and Leverage Ratio (each as defined in the Cash LTIP) for fiscal years 2024, 2025, and 2026, with one-third of the target award corresponding to each of those three performance periods. Performance-based vesting of the one-third of the total target award that corresponds to each fiscal year’s performance period will be determined based as follows: (a) 50% of that portion of the target award will become eligible to vest based on our Adjusted EBITDA Margin for each of fiscal years 2024, 2025 or 2026, and (b) 50% of that portion of the target award will become eligible to vest based on our Leverage Ratio for each of fiscal years 2024, 2025 or 2026. Each year’s performance will be determined independently. No cash award will be paid with respect to any of the performance periods until the third anniversary of the date of grant, and the executive must remain in our service through that anniversary date in order to receive any payment under the Cash LTIP.
ITEM 9C. DISCLOSURE REGARDING FOREIGN JURISDICTIONS THAT PREVENT INSPECTIONS
Not applicable.
84
PART III
ITEM 10. DIRECTORS, EXECUTIVE OFFICERS AND CORPORATE GOVERNANCE
The Company has adopted a Code of Conduct and Ethics applicable to our employees, directors, and officers. This Code of Conduct and Ethics is applicable to our principal executive officer, principal financial officer, principal accounting officer and controller, or persons performing similar functions. The code is available on our website at investors.sportsmans.com. If we ever were to amend or waive any provision that applies to our principal executive officer, principal financial officer, principal accounting officer or any person performing similar functions, we intend to promptly disclose any such amendments or waivers on our website at investors.sportsmans.com, rather than by filing a Current Report on Form 8-K.
The remaining information required by this Item 10 will be included in our proxy statement for our 2024 annual meeting of stockholders (the “Proxy Statement”) and is incorporated herein by reference.
ITEM 11. EXECUTIVE COMPENSATION
The information required by this Item 11 will be included in our Proxy Statement and is incorporated herein by reference.
ITEM 12. SECURITY OWNERSHIP OF CERTAIN BENEFICIAL OWNERS AND MANAGEMENT RELATED STOCKHOLDER MATTERS
The information required by this Item 12 will be included in our Proxy Statement and is incorporated herein by reference.
The information required by this Item 13 will be included in our Proxy Statement and is incorporated herein by reference.
ITEM 14. PRINCIPAL ACCOUNTANT FEES AND SERVICES
The information required by this Item 14 will be included in our Proxy Statement and is incorporated herein by reference.
85
PART IV
ITEM 15. EXHIBIT AND FINANCIAL STATEMENT SCHEDULES
Exhibit |
|
Description |
|
|
|
3.1 |
|
|
|
|
|
3.2 |
|
|
|
|
|
4.1 |
|
|
|
|
|
4.2+ |
|
Description of Capital Stock of Sportsman’s Warehouse Holdings, Inc. |
|
|
|
10.1 |
|
|
|
|
|
10.2 |
|
|
|
|
|
10.3 |
|
|
|
|
|
10.4 |
|
86
87
Exhibit |
|
Description |
|
|
|
10.20* |
|
|
|
|
|
10.21* |
|
|
|
|
|
10.22 |
|
|
|
|
|
21.1+ |
|
|
|
|
|
23.1+ |
|
|
|
|
|
31.1+ |
|
Certification of Chief Executive Officer pursuant to Section 302 of the Sarbanes-Oxley Act of 2002. |
|
|
|
31.2+ |
|
Certification of Chief Financial Officer pursuant to Section 302 of the Sarbanes-Oxley Act of 2002. |
|
|
|
32.1*** |
|
|
|
|
|
97.1*+ |
|
|
|
|
|
101 |
|
The following financial statements from the Company’s Annual Report on Form 10-K for the fiscal year ended February 3, 2024, formatted in Inline XBRL: (i) Consolidated Statements of Operations, (ii) Consolidated Statements of Comprehensive Income, (iii) Consolidated Balance Sheets (iv) Consolidated Statements of Stockholders’ Equity, (v) Consolidated Statements of Cash Flow and (v) Notes to Consolidated Financial Statements, tagged as blocks of text and including detailed tags |
|
|
|
104 |
|
The cover page from the Company’s Annual Report on Form 10-K for the fiscal year ended February 3, 2024, formatted in Inline XBRL (included as Exhibit 101) |
* Management contract or compensatory plan, contract or arrangement
+ Filed herewith
*** Furnished herewith
ITEM 16. FORM 10-K SUMMARY
None.
88
SIGNATURES
Pursuant to the requirements of Section 13 or 15(d) of the Securities Exchange Act of 1934, the registrant has duly caused this report to be signed on its behalf by the undersigned, thereunto duly authorized.
|
SPORTSMAN’S WAREHOUSE HOLDINGS, INC. |
|
|
|
|
Date: April 4, 2024 |
By: |
/s/Paul Stone |
|
|
Paul Stone |
|
|
President and Chief Executive Officer |
|
|
(Principal Executive Officer) |
|
|
|
Pursuant to the requirements of the Securities Exchange Act of 1934, this report has been signed below by the following persons on behalf of the registrant and in the capacities and on the dates indicated:
Signature |
|
Title |
|
Date |
|
|
|
|
|
/s/Paul Stone |
|
President, Chief Executive |
|
April 4, 2024 |
Paul Stone |
|
Officer and Director |
|
|
|
|
(Principal Executive Officer) |
|
|
|
|
|
|
|
/s/Jeff White |
|
Chief Financial Officer and Secretary |
|
April 4, 2024 |
Jeff White |
|
(Principal Financial and |
|
|
|
|
Accounting Officer) |
|
|
|
|
|
|
|
/s/Richard McBee |
|
Director |
|
April 4, 2024 |
Richard McBee |
|
|
|
|
|
|
|
|
|
/s/Steven R. Becker |
|
Director |
|
April 4, 2024 |
Steven R. Becker |
|
|
|
|
|
|
|
|
|
/s/Martha Bejar |
|
Director |
|
April 4, 2024 |
Martha Bejar |
|
|
|
|
|
|
|
|
|
/s/Gregory P. Hickey |
|
Director |
|
April 4, 2024 |
Gregory P. Hickey |
|
|
|
|
|
|
|
|
|
/s/Erica Fortune |
|
Director |
|
April 4, 2024 |
Erica Fortune |
|
|
|
|
|
|
|
|
|
/s/Nancy A. Walsh |
|
Director |
|
April 4, 2024 |
Nancy A. Walsh |
|
|
|
|
|
|
|
|
|
/s/Philip C. Williamson |
|
Director |
|
April 4, 2024 |
Philip C. Williamson |
|
|
|
|
|
|
|
|
|
/s/Steven W. Sansom |
|
Director |
|
April 4, 2024 |
Steven W. Sansom |
|
|
|
|
89