UNITED STATES
SECURITIES AND EXCHANGE COMMISSION
WASHINGTON, D.C. 20549
FORM 20-F
| REGISTRATION STATEMENT PURSUANT TO SECTION 12(b) OR (g) OF THE SECURITIES EXCHANGE ACT OF 1934 | |||||
OR
| ANNUAL REPORT PURSUANT TO SECTION 13 OR 15(d) OF THE SECURITIES EXCHANGE ACT OF 1934 | |||||
For the fiscal year ended December 31, 2023
OR
| TRANSITION REPORT PURSUANT TO SECTION 13 OR 15(d) OF THE SECURITIES EXCHANGE ACT OF 1934 | |||||
OR
| SHELL COMPANY REPORT PURSUANT TO SECTION 13 OR 15(d) OF THE SECURITIES EXCHANGE ACT OF 1934 | |||||
Date of event requiring this shell company report
For the transition period from to
Commission file number: 1-13546
(Exact name of Registrant as specified in its charter)
Not Applicable
(Translation of Registrant’s name into English)
The Netherlands
(Jurisdiction of incorporation or organization)
The Netherlands
(Address of principal executive offices)
Tel: +41 22 929 29 29
Fax: +41 22 929 29 88
(Name, Telephone, E-mail and/or Facsimile number and Address of Company Contact Person)
Securities registered or to be registered pursuant to Section 12(b) of the Act.
| Title of Each Class | Trading Symbol(s) | Name of each exchange on which registered | ||||||||||||
Securities registered or to be registered pursuant to Section 12(g) of the Act.
| None | ||
(Title of Class)
Securities for which there is a reporting obligation pursuant to Section 15(d) of the Act.
| None | ||
(Title of Class)
Indicate the number of outstanding shares of each of the issuer’s classes of capital or common stock as of the close of the period covered by the annual report.
Indicate by check mark if the registrant is a well-known seasoned issuer, as defined in Rule 405 of the Securities Act. SYes ☐No
If this report is an annual or transition report, indicate by check mark if the registrant is not required to file reports pursuant to Section 13 or 15(d) of the Securities Exchange Act of 1934. ☐Yes SNo
Note – Checking the box above will not relieve any registrant required to file reports pursuant to Section 13 or 15(d) of the Securities Exchange Act of 1934 from their obligations under those Sections.
Indicate by check mark whether the registrant (1) has filed all reports required to be filed by Section 13 or 15(d) of the Securities Exchange Act of 1934 during the preceding 12 months (or for such shorter period that the registrant was required to file such reports), and (2) has been subject to such filing requirements for the past 90 days. SYes ☐No
Indicate by check mark whether the registrant has submitted electronically every Interactive Data File required to be submitted pursuant to Rule 405 of Regulation S-T (§ 232.405 of this chapter) during the preceding 12 months (or for such shorter period that the registrant was required to submit such files). SYes ☐No
Indicate by check mark whether the registrant is a large accelerated filer, an accelerated filer, a non-accelerated filer, or an emerging growth company. See definition of “large accelerated filer”, “accelerated filer”, and “emerging growth company” in Rule 12b-2 of the Exchange Act.
| S | Accelerated filer | ☐ | ||||||||||||
| Non-accelerated filer | ☐ | Emerging growth company | ||||||||||||
If an emerging growth company that prepares its financial statements in accordance with U.S. GAAP, indicate by check mark if the registrant has elected not to use the extended transition period for complying with any new or revised financial accounting standards† provided pursuant to Section 13(a) of the Exchange Act. ☐
† The term “new or revised financial accounting standard” refers to any update issued by the Financial Accounting Standards Board to its Accounting Standards Codification after April 5, 2012.
Indicate by check mark whether the registrant has filed a report on and attestation to its management’s assessment of the effectiveness of its internal control over financial reporting under Section 404(b) of the Sarbanes-Oxley Act (15 U.S.C. 7262(b)) by the registered public accounting firm that prepared or issued its audit report. S
If securities are registered pursuant to Section 12(b) of the Act, indicate by check mark whether the financial statements of the
registrant included in the filing reflect the correction of an error to previously issued financial statements. ☐
Indicate by check mark whether any of those error corrections are restatements that required a recovery analysis of incentive based compensation received by any of the registrant’s executive officers during the relevant recovery period pursuant to §240.10D-1(b). ☐
Indicate by check mark which basis of accounting the registrant has used to prepare the financial statements included in this filing:
| S | International Financial Reporting Standards as issued | Other | ☐ | |||||||||||||||||
by the International Accounting Standards Board ☐ | ||||||||||||||||||||
If “Other” has been checked in response to the previous question, indicate by check mark which financial statement item the registrant has elected to follow. ☐ Item 17 ☐ Item 18
If this is an annual report, indicate by check mark whether the registrant is a shell company (as defined in Rule 12b-2 of the Exchange Act). ☐ Yes S No
(APPLICABLE ONLY TO ISSUERS INVOLVED IN BANKRUPTCY PROCEEDINGS DURING THE PAST FIVE YEARS)
Indicate by check mark whether the registrant has filed all documents and reports required to be filed by Sections 12, 13 or 15(d) of the Securities Exchange Act of 1934 subsequent to the distribution of securities under a plan confirmed by a court. ☐ Yes ☐ No
TABLE OF CONTENTS
| Page | ||||||||||||||
| Item 1. | ||||||||||||||
| Item 2. | ||||||||||||||
| Item 3. | ||||||||||||||
| Item 4. | ||||||||||||||
| Item 5. | ||||||||||||||
| Item 6. | ||||||||||||||
| Item 7. | Major Shareholders and Related Party Transactions | |||||||||||||
| Item 8. | Financial Information | |||||||||||||
| Item 9. | Listing | |||||||||||||
| Item 10. | ||||||||||||||
| Item 11. | ||||||||||||||
| Item 12. | ||||||||||||||
| Item 13. | ||||||||||||||
| Item 14. | ||||||||||||||
| Item 15. | ||||||||||||||
| Item 16. | ||||||||||||||
| Item 16A. | ||||||||||||||
| Item 16B. | ||||||||||||||
| Item 16C. | ||||||||||||||
| Item 16D. | ||||||||||||||
| Item 16E. | ||||||||||||||
| Item 16F. | ||||||||||||||
| Item 16G. | ||||||||||||||
Item 16H. | ||||||||||||||
Item 16I. | ||||||||||||||
Item 16J. | ||||||||||||||
Item 16K. | ||||||||||||||
| Item 17. | ||||||||||||||
| Item 18. | ||||||||||||||
| Item 19. | ||||||||||||||
3
PRESENTATION OF FINANCIAL AND OTHER INFORMATION
In this annual report on Form 20-F (the “Form 20-F”), references to “we”, “us” and “Company” are to STMicroelectronics N.V. together with its consolidated subsidiaries, references to “EU” are to the European Union, references to “€” and the “Euro” are to the Euro currency of the EU, references to the “United States” and the “U.S.” are to the United States of America and references to “$” and to “U.S. dollars” are to United States dollars. References to “mm” are to millimeters and references to “nm” are to nanometers.
We have compiled market size and our market share data in this Form 20-F using statistics and other information obtained from several third-party sources. Except as otherwise disclosed herein, all references to trade association data are references to World Semiconductor Trade Statistics (“WSTS”). Certain terms used in this Form 20-F are defined in “Certain Terms”.
We report our financial statements in U.S. dollars and prepare our Consolidated Financial Statements in accordance with generally accepted accounting principles in the United States (“U.S. GAAP”). We also report certain non-U.S. GAAP financial measures (free cash flow and net financial position), which are derived from the amounts presented in the financial statements prepared under U.S. GAAP. Furthermore, we are required by Dutch law to report our Statutory and Consolidated Financial Statements, in accordance with International Financial Reporting Standards (“IFRS”), as issued by the International Accounting Standards Board (“IASB”) and adopted by the European Union. The IFRS financial statements are reported separately and can differ materially from the statements reported in U.S. GAAP.
Various amounts and percentages used in this Form 20-F have been rounded and, accordingly, they may not total 100%.
We and our affiliates own or otherwise have rights to the trademarks and trade names, including those mentioned in this Form 20-F, used in conjunction with the marketing and sale of our products.
CAUTIONARY NOTE REGARDING FORWARD-LOOKING STATEMENTS
Some of the statements contained in this Form 20-F that are not historical facts, particularly in “Item 3. Key Information — Risk Factors”, “Item 4. Information on the Company” and “Item 5. Operating and Financial Review and Prospects” and “— Business Outlook” are statements of future expectations and other forward-looking statements (within the meaning of Section 27A of the Securities Act of 1933 or Section 21E of the Securities Exchange Act of 1934, each as amended) that are based on management’s current views and assumptions, and are conditioned upon and also involve known and unknown risks and uncertainties that could cause actual results, performance or events to differ materially from those anticipated by such statements due to, among other factors:
•changes in global trade policies, including the adoption and expansion of tariffs and trade barriers, that could affect the macro-economic environment and adversely impact the demand for our products;
•uncertain macro-economic and industry trends (such as inflation and fluctuations in supply chains), which may impact production capacity and end-market demand for our products;
•customer demand that differs from projections;
•the ability to design, manufacture and sell innovative products in a rapidly changing technological environment;
•changes in economic, social, public health, labor, political, or infrastructure conditions in the locations where we, our customers, or our suppliers operate, including as a result of macro-economic or regional events, geopolitical and military conflicts, social unrest, labor actions, or terrorist activities;
•unanticipated events or circumstances, which may impact our ability to execute our plans and/or meet the objectives of our R&D and manufacturing programs, which benefit from public funding;
4
•financial difficulties with any of our major distributors or significant curtailment of purchases by key customers;
•the loading, product mix, and manufacturing performance of our production facilities and/or our required volume to fulfill capacity reserved with suppliers or third-party manufacturing providers;
•availability and costs of equipment, raw materials, utilities, third-party manufacturing services and technology, or other supplies required by our operations (including increasing costs resulting from inflation);
•the functionalities and performance of our IT systems, which are subject to cybersecurity threats and which support our critical operational activities including manufacturing, finance and sales, and any breaches of our IT systems or those of our customers, suppliers, partners and providers of third-party licensed technology;
•theft, loss, or misuse of personal data about our employees, customers, or other third parties, and breaches of data privacy legislation;
•the impact of intellectual property (“IP”) claims by our competitors or other third parties, and our ability to obtain required licenses on reasonable terms and conditions;
•changes in our overall tax position as a result of changes in tax rules, new or revised legislation, the outcome of tax audits or changes in international tax treaties which may impact our results of operations as well as our ability to accurately estimate tax credits, benefits, deductions and provisions and to realize deferred tax assets;
•variations in the foreign exchange markets and, more particularly, the U.S. dollar exchange rate as compared to the Euro and the other major currencies we use for our operations;
•the outcome of ongoing litigation as well as the impact of any new litigation to which we may become a defendant;
•product liability or warranty claims, claims based on epidemic or delivery failure, or other claims relating to our products, or recalls by our customers for products containing our parts;
•natural events such as severe weather, earthquakes, tsunamis, volcano eruptions or other acts of nature, the effects of climate change, health risks and epidemics or pandemics in locations where we, our customers or our suppliers operate;
•increased regulation and initiatives in our industry, including those concerning climate change and sustainability matters and our goal to become carbon neutral by 2027 on scope 1 and 2 and partially scope 3;
•epidemics or pandemics, which may negatively impact the global economy in a significant manner for an extended period of time, and could also materially adversely affect our business and operating results;
•industry changes resulting from vertical and horizontal consolidation among our suppliers, competitors, and customers; and
•the ability to successfully ramp up new programs that could be impacted by factors beyond our control, including the availability of critical third-party components and performance of subcontractors in line with our expectations.
5
Such forward-looking statements are subject to various risks and uncertainties, which may cause actual results and performance of our business to differ materially and adversely from the forward-looking statements. Certain forward-looking statements can be identified by the use of forward-looking terminology, such as “believes”, “expects”, “may”, “are expected to”, “should”, “would be”, “seeks” or “anticipates” or similar expressions or the negative thereof or other variations thereof or comparable terminology, or by discussions of strategy, plans or intentions. Some of these risk factors are set forth and are discussed in more detail in “Item 3. Key Information — Risk Factors”. Should one or more of these risks or uncertainties materialize, or should underlying assumptions prove incorrect, actual results may vary materially from those described in this Form 20-F as anticipated, believed or expected. We do not intend, and do not assume any obligation, to update any industry information or forward-looking statements set forth in this Form 20-F to reflect subsequent events or circumstances.
Unfavorable changes in the above or other factors listed under “Item 3. Key Information — Risk Factors” from time to time in our Securities and Exchange Commission (“SEC”) filings, could have a material adverse effect on our business and/or financial condition.
6
PART I
Item 1. Identity of Directors, Senior Management and Advisers
Not applicable.
Item 2. Offer Statistics and Expected Timetable
Not applicable.
Item 3. Key Information
Selected Financial Data
The table below sets forth our selected consolidated financial data for each of the years in the five-year period ended December 31, 2023. Such data have been derived from our audited Consolidated Financial Statements. Audited Consolidated Financial Statements for each of the years in the three-year period ended December 31, 2023, including the Notes thereto (collectively, the “Consolidated Financial Statements”), are included elsewhere in this Form 20-F, while data for prior periods have been derived from our audited Consolidated Financial Statements used in such periods.
7
The following information should be read in conjunction with “Item 5. Operating and Financial Review and Prospects” and the audited Consolidated Financial Statements and the related Notes thereto included in “Item 18. Financial Statements” in this Form 20-F.
| Year Ended December 31, | ||||||||||||||||||||||||||||||||
| 2023 | 2022 | 2021 | 2020 | 2019 | ||||||||||||||||||||||||||||
| (In millions except per share and ratio data) | ||||||||||||||||||||||||||||||||
| Consolidated Statements of Income Data: | ||||||||||||||||||||||||||||||||
| Net sales | $ | 17,239 | $ | 16,083 | $ | 12,729 | $ | 10,181 | $ | 9,529 | ||||||||||||||||||||||
| Other revenues | 47 | 45 | 32 | 38 | 27 | |||||||||||||||||||||||||||
| Net revenues | 17,286 | 16,128 | 12,761 | 10,219 | 9,556 | |||||||||||||||||||||||||||
| Cost of sales | (8,999) | (8,493) | (7,435) | (6,430) | (5,860) | |||||||||||||||||||||||||||
| Gross profit | 8,287 | 7,635 | 5,326 | 3,789 | 3,696 | |||||||||||||||||||||||||||
| Operating expenses: | ||||||||||||||||||||||||||||||||
| Selling, general and administrative expenses | (1,631) | (1,454) | (1,323) | (1,109) | (1,093) | |||||||||||||||||||||||||||
| Research and development expenses | (2,100) | (1,901) | (1,723) | (1,548) | (1,498) | |||||||||||||||||||||||||||
| Other income and expenses, net | 55 | 159 | 141 | 202 | 103 | |||||||||||||||||||||||||||
| Impairment, restructuring charges and other related closure costs | — | — | (2) | (11) | (5) | |||||||||||||||||||||||||||
| Operating income | 4,611 | 4,439 | 2,419 | 1,323 | 1,203 | |||||||||||||||||||||||||||
Interest income (expense), net(1) | 171 | 58 | (29) | (20) | 1 | |||||||||||||||||||||||||||
| Other components of pension benefit costs | (19) | (11) | (10) | (12) | (16) | |||||||||||||||||||||||||||
| Income on equity-method investments | — | — | — | 2 | 1 | |||||||||||||||||||||||||||
| Loss on financial instruments, net | — | — | (43) | (26) | — | |||||||||||||||||||||||||||
Income before income taxes and noncontrolling interest(1) | 4,763 | 4,486 | 2,337 | 1,267 | 1,189 | |||||||||||||||||||||||||||
| Income tax expense | (541) | (520) | (331) | (159) | (156) | |||||||||||||||||||||||||||
Net income(1) | 4,222 | 3,966 | 2,006 | 1,108 | 1,033 | |||||||||||||||||||||||||||
| Net income attributable to noncontrolling interest | (11) | (6) | (6) | (2) | (1) | |||||||||||||||||||||||||||
Net income attributable to parent company(1) | 4,211 | 3,960 | 2,000 | 1,106 | 1,032 | |||||||||||||||||||||||||||
| Earnings per share (basic) attributable to parent company stockholders | 4.66 | 4.37 | 2.21 | 1.24 | 1.15 | |||||||||||||||||||||||||||
Earnings per share (diluted) attributable to parent company stockholders(1) | 4.46 | 4.19 | 2.16 | 1.20 | 1.14 | |||||||||||||||||||||||||||
| Number of shares used in calculating earnings per share (basic) | 903.5 | 905.6 | 904.3 | 894.6 | 894.3 | |||||||||||||||||||||||||||
Number of shares used in calculating earnings per share (diluted)(1) | 944.2 | 946.2 | 924.8 | 919.7 | 903.6 | |||||||||||||||||||||||||||
| Consolidated Balance Sheets Data (end of period): | ||||||||||||||||||||||||||||||||
| Cash and cash equivalents | 3,222 | 3,258 | 3,225 | 3,006 | 2,597 | |||||||||||||||||||||||||||
| Restricted cash | — | — | — | — | 10 | |||||||||||||||||||||||||||
| Short-term deposits | 1,226 | 581 | 291 | 581 | 4 | |||||||||||||||||||||||||||
| Marketable securities | 1,635 | 679 | — | 133 | 133 | |||||||||||||||||||||||||||
| Total assets | 24,453 | 19,982 | 15,540 | 14,454 | 11,868 | |||||||||||||||||||||||||||
Net assets(1) | 16,852 | 12,758 | 9,273 | 8,506 | 7,111 | |||||||||||||||||||||||||||
| Short-term debt | 217 | 175 | 143 | 795 | 173 | |||||||||||||||||||||||||||
Long-term debt(1) | 2,710 | 2,542 | 2,396 | 1,826 | 1,899 | |||||||||||||||||||||||||||
| Total parent company stockholders’ equity | 16,729 | 12,693 | 9,209 | 8,448 | 7,043 | |||||||||||||||||||||||||||
Common stock and Additional Paid-in Capital(1) | 4,023 | 3,788 | 3,690 | 4,219 | 4,149 | |||||||||||||||||||||||||||
| Other Data: | ||||||||||||||||||||||||||||||||
| Dividend per share | 0.240 | 0.240 | 0.240 | 0.168 | 0.240 | |||||||||||||||||||||||||||
| Capital expenditures, net of proceeds from sales and capital grants and other contributions | (4,111) | (3,524) | (1,828) | (1,279) | (1,174) | |||||||||||||||||||||||||||
| Net cash from operating activities | 5,992 | 5,202 | 3,060 | 2,093 | 1,869 | |||||||||||||||||||||||||||
| Depreciation and amortization | 1,561 | 1,216 | 1,045 | 923 | 854 | |||||||||||||||||||||||||||
Debt-to-equity ratio(2) | 0.17 | 0.21 | 0.28 | 0.31 | 0.29 | |||||||||||||||||||||||||||
————————
(1) On January 1, 2022, we adopted the new U.S. GAAP guidance applicable to 2020 Senior Unsecured Convertible Bonds. Prior year comparative periods have not been restated.
(2) Debt-to-equity ratio is the ratio between our total financial debt (short-term debt and long-term debt) and our total parent company stockholder’s equity.
8
RISK FACTORS
Summary of Risk Factors
Risks Related to the Semiconductor Industry which Impact Us
•We, and the semiconductor industry as a whole, may be impacted by changes in, or uncertainty about, global, regional and local economic, political, legal, regulatory and social environments as well as climate change
•The semiconductor industry is cyclical and downturns in the semiconductor industry can negatively affect our results of operations and financial condition
•Epidemics or pandemics may impact the global economy and could also adversely affect our business, financial condition and results of operations
•We may not be able to match our production capacity to demand
•Competition in the semiconductor industry is intense, and we may not be able to compete successfully if our product design technologies, process technologies and products do not meet market requirements. Furthermore, the competitive environment of the industry has resulted, and is expected to continue to result, in vertical and horizontal consolidation among our suppliers, competitors and customers, which may lead to erosion of our market share, impact our ability to compete and require us to restructure our operations
Risks Related to Our Operations
•Our high fixed costs could adversely impact our results
•Our capital needs are high compared to those competitors who do not manufacture their own products and we may need additional funding in the coming years to finance our investments, to purchase other companies or technologies developed by third parties or to refinance our maturing indebtedness
•Our operating results depend on our ability to obtain quality supplies on commercially reasonable terms. As we depend on a limited number of suppliers for materials, equipment and technology, we may experience supply disruptions if suppliers interrupt supply, increase prices or experience material adverse changes in their financial condition.
•Our financial results can be affected by fluctuations in exchange rates, principally in the value of the U.S. dollar.
•Our operating results may vary significantly from quarter to quarter and annually and may also differ significantly from our expectations or guidance
•If our external silicon foundries or back-end subcontractors fail to perform, this could adversely affect our business prospects, financial condition and results of operations
•Our manufacturing processes are highly complex, costly and potentially vulnerable to impurities, disruptions or inefficient implementation of production changes or interruptions that can significantly increase our costs and delay product shipments to our customers
•We may experience quality problems from time to time that can result in decreased sales and operating margin and product liability or warranty claims
•Disruptions in our relationships with any one of our key customers or distributors, and/or material changes in their strategy or financial condition or business prospects, could adversely affect our results of operations
•We may experience delays in delivering our product and technology roadmaps as well as transformation initiatives
9
•Our computer systems, including hardware, software, information and cloud-based initiatives, are subject to attempted security breaches and other cybersecurity threats, which, if successful, could adversely impact our business
•We may be subject to theft, loss, or misuse of personal data about our employees, customers, or other third parties, which could increase our expenses, damage our reputation, or result in legal or regulatory proceedings
•Our business is dependent in large part on continued growth in the industries and segments into which our products are sold and on our ability to retain existing customers and attract new ones. A market decline in any of these industries, our inability to retain and attract customers, or customer demand for our products which differs from our projections, could have a material adverse effect on our results of operations
•Market dynamics have driven, and continue to drive us, to a strategic repositioning
•We depend on collaboration with other semiconductor industry companies, research organizations, universities, customers and suppliers to further our R&D efforts, and our business and prospects could be materially adversely affected by the failure or termination of such alliances
•We depend on patents to protect our rights to our technology and may face claims of infringing the IP rights of others
•We operate in many jurisdictions with highly complex and varied tax regimes. Changes in tax rules, new or revised legislation or the outcome of tax assessments and audits could cause a material adverse effect on our results
•We receive public funding, and a reduction in the amount available to us or demands for repayment could increase our costs and impact our results of operations
•Some of our production processes and materials are environmentally sensitive, which could expose us to liability and increase our costs due to environmental, health and safety laws and regulations or because of damage to the environment
•Climate change and related sustainability regulations and initiatives, including our commitment to become carbon neutral by 2027 on scope 1 and 2 and partially scope 3, could place additional burden on us and our operations
•Loss of key employees and the inability to continuously recruit and retain qualified employees could hurt our competitive position
•The interests of our controlling shareholder, which is in turn indirectly controlled by the French and Italian governments, may conflict with other investors’ interests. In addition, our controlling shareholder may sell our existing common shares or issue financial instruments exchangeable into our common shares at any time
•Our shareholder structure and our preference shares may deter a change of control
•Any decision to reduce or discontinue paying cash dividends to our shareholders could adversely impact the market price of our common shares
•We are required to prepare financial statements under IFRS and we also prepare Consolidated Financial Statements under U.S. GAAP, and such dual reporting may impair the clarity of our financial reporting
•There are inherent limitations on the effectiveness of our controls
•Because we are subject to the corporate law of The Netherlands, U.S. investors might have more difficulty protecting their interests in a court of law or otherwise than if we were a U.S. company
10
Risks Related to the Semiconductor Industry which Impact Us
We, and the semiconductor industry as a whole, may be impacted by changes in, or uncertainty about, global, regional and local economic, political, legal, regulatory and social environments as well as climate change.
Changes in, and uncertainty about, economic, political, legal, regulatory and social conditions pose a risk as consumers and businesses may postpone spending in response to factors such as curtailment of trade and other business restrictions, financial market volatility, interest rate fluctuations, recessions, shifts in inflationary and deflationary expectations, lower capital and productivity growth, unemployment, negative news, declines in income or asset values and/or other factors. Such global, regional and local conditions could have a material adverse effect on customer and end-market demand for our products, thus materially adversely affecting our business and financial condition.
Geopolitical conflicts have resulted in certain countries imposing sanctions. Further consequences of such conflicts could include a risk of further sanctions, embargoes, regional instability, geopolitical shifts and adverse effects on macro-economic conditions, currency exchange rates and financial markets. This could lead to disruption to international commerce and the global economy, and could have a negative effect on our ability to sell to, ship products to, collect payments from, and support customers in certain regions based on trade restrictions, embargoes, logistics restrictions and export control law restrictions. We may also experience a shortage of certain semiconductor components and delays in shipments due to supply chain disruptions caused by geopolitical conflicts, and sales of our products may be negatively impacted by geopolitical conflicts, both directly and indirectly through a reduction of sales or production by our customers in or to affected areas or otherwise.
The institution of trade tariffs globally, as well as the threat thereof, could negatively impact economic conditions, which could have negative repercussions for our business. In particular, trade protection and national security policies of the U.S. and Chinese governments, including tariffs, trade restrictions, export restrictions and the placing of companies on restricted entity lists, have and may continue to limit or prevent us from transacting business with certain of our Chinese customers or suppliers; limit, prevent or discourage certain of our Chinese customers or suppliers from transacting business with us; or make it more expensive to do so. If disputes were to arise under any of our agreements with other parties conducting business in China, the resolution of such dispute may be subject to the exercise of discretion by the Chinese government, or agencies of the Chinese government, which may have a material adverse effect on our business. In addition, we could face increased competition as a result of China's programs to promote a domestic semiconductor industry and supply chains (including the Made in China 2025 campaign).
Trade policy changes could trigger retaliatory actions by affected countries, which could have a negative impact on our ability to do business in affected countries or lead to reduced purchases of our products by foreign customers, leading to increased costs of components contained in our products, increased manufacturing costs of our products, currency exchange rate volatility, and higher prices for our products in foreign markets. Further, protectionist measures, laws or governmental policies may encourage our customers to relocate their manufacturing capacity or supply chain to their own respective countries or other countries, or require their respective contractors, subcontractors and relevant agents to do so, which could impair our ability to sustain our current level of productivity and manufacturing efficiency.
We, and the semiconductor industry as a whole, face greater risks due to the international nature of the semiconductor business, including in the countries where we, our customers or our suppliers operate, such as:
•instability of foreign governments, including the threat of war, military conflict, civil unrest, regime changes, mass migration and terrorist attacks;
•natural events such as severe weather, earthquakes and tsunamis, or the effects of climate change;
•epidemics or pandemics such as disease outbreaks and other health related issues;
11
•changes in, or uncertainty about, laws, regulations (including executive orders) and policies affecting trade and investment, including following Brexit and including through the imposition of trade and travel restrictions, government sanctions, local practices which favor local companies and constraints on investment;
•complex and varying government regulations and legal standards, particularly with respect to export control regulations and restrictions, customs and tax requirements, data privacy, IP and anti-corruption;
•differing practices of regulatory, tax, judicial and administrative bodies, including with regards to the interpretation of laws, governmental approvals, permits and licenses;
•water availability, usage and consumption levels, as well as recycling and discharge practices; and
•labor and human rights, especially in international supply chains.
The semiconductor industry is cyclical and downturns in the semiconductor industry can negatively affect our results of operations and financial condition.
The semiconductor industry is cyclical and has been subject to significant downturns from time to time, as a result of global economic conditions, as well as industry-specific factors, such as built-in excess capacity, fluctuations in product supply, product obsolescence and changes in end-customer preferences. See “Item 3. Key Information — Risk Factors — Risks Related to the Semiconductor Industry which Impact Us — We, and the semiconductor industry as a whole, may be impacted by changes in, or uncertainty about, global, regional and local economic, political, legal, regulatory and social environments as well as climate change.”
Downturns are typically characterized by reduction in overall demand, accelerated erosion of selling prices, reduced revenues and high inventory levels, any of which could result in a significant deterioration of our results of operations. Such macro-economic trends typically relate to the semiconductor industry as a whole rather than to the individual semiconductor markets to which we sell our products. To the extent that industry downturns are concurrent with the timing of new increases in production capacity or introduction of new advanced technologies in our industry, the negative effects on our business from such industry downturns may also be more severe. We have experienced revenue volatility and market downturns in the past and expect to experience them in the future, which could have a material adverse impact on our results of operations and financial condition.
The recent increase in inflation rates in the markets in which we operate may lead us to experience higher costs related to labor, energy, water, transportation, wafer and other raw materials costs from suppliers. Our suppliers may raise their prices, and in the competitive markets in which we operate, we may not be able to make corresponding price increases to preserve our gross margins and profitability due to market conditions and competitive dynamics. Additionally, any such increase in prices may not be accepted by our customers.
Epidemics or pandemics may impact the global economy and could also adversely affect our business, financial condition and results of operations.
Epidemics or pandemics may result in authorities imposing, and businesses and individuals implementing, numerous measures to try to contain the virus, including travel bans and restrictions, shelter-in-place and stay-at-home orders, quarantines and social distancing guidelines. This may negatively impact the ability of our suppliers to deliver on their commitments to us, our ability to ship our products to our customers and general consumer demand for our products may be negatively impacted by the pandemic and/or government responses thereto.
Many of our products and services are considered to be essential under national and local guidelines. As such, during the COVID-19 pandemic, we generally continued to operate in each of the jurisdictions where we were present. However, certain of our facilities were not able to operate at optimal capacity and any future similarly restrictive measures may have a negative impact on our operations, supply chain and transportation networks, and our products and services may not be considered to be essential in the future. In addition, our customers and suppliers may experience disruptions in their operations and supply chains, which could result in
12
delayed, reduced, or cancelled orders, or collection risks, and which may adversely affect our results of operations and financial condition.
During an epidemic or pandemic, governments may look to re-direct resources and implement austerity measures in the future to balance public finances, which could result in reduced economic activity. Any resulting economic downturn could reduce overall demand for our products, accelerate the erosion of selling prices, lead to reduced revenues and higher inventory levels, any of which could result in a significant deterioration of our results of operations and financial condition.
An epidemic or pandemic may also lead to increased disruption and volatility in capital markets and credit markets. Unanticipated consequences of an epidemic or pandemic and resulting economic uncertainty could adversely affect our liquidity and capital resources in the future.
We may not be able to match our production capacity to demand.
As a result of the cyclicality and volatility of the semiconductor industry, it is difficult to predict future developments in the markets we serve, and, in turn, to estimate requirements for production capacity. If our markets, start-up or ramp-ups in manufacturing operations are not efficiently executed, major customers or certain product designs or technologies do not perform as well as we have anticipated, demand is impacted by factors outside of our or our customers’ control, or if there is otherwise any future excess capacity by us or other semiconductor manufacturers, we risk unused capacity charges, price erosion, write-offs of inventories and losses on products that may adversely impact our operating results, and we could be required to undertake restructuring and transformation measures that may involve significant charges to our earnings. Furthermore, during certain periods, the global supply of semiconductor industry fabrication capacity may not be sufficient to meet the demand for semiconductor products. We may also experience increased demand in certain market segments and product technologies and any future shortage of our capacity and the capacity of our sub-contractors may lead to an increase in the lead times of our delivery to customers, us being required to enter into agreements with our suppliers with onerous terms such as take-or-pay arrangements, or us being unable to service some of our customers, which may result in adverse effects on our customer relationships and in liability claims. Further, as a result of this supply imbalance, the industry in general may experience a high level of profitability and gross margins, which may not be sustainable over the long-term.
Competition in the semiconductor industry is intense, and we may not be able to compete successfully if our product design technologies, process technologies and products do not meet market requirements. Furthermore, the competitive environment of the industry has resulted, and is expected to continue to result, in vertical and horizontal consolidation among our suppliers, competitors and customers, which may lead to erosion of our market share, impact our ability to compete and require us to restructure our operations.
We compete in different product lines to various degrees on certain characteristics, for example, price, technical performance, product features, product design, product availability, process technology, manufacturing capabilities and sales and technical support. Given the intense competition in the semiconductor industry, if our products do not meet market requirements based on any of these characteristics, our business, financial condition and results of operations could be materially adversely affected. Our competitors may have a stronger presence in key markets and geographic regions, greater name recognition, larger customer bases, greater government support and greater financial, research and development, sales and marketing, manufacturing, distribution, technical and other resources than we do. These competitors may be able to adapt more quickly to changes in the business environment, to new or emerging technologies and to changes in customer requirements.
The semiconductor industry is intensely competitive and characterized by the high costs associated with developing marketable products and manufacturing technologies as well as high levels of investment in production capabilities. As a result, the semiconductor industry has experienced, and is expected to continue to experience, significant vertical and horizontal consolidation among our suppliers, competitors and customers. Consolidation in the semiconductor industry could erode our market share, negatively impact our ability to compete and require us to increase our R&D effort, engage in mergers and acquisitions and/or restructure our operations.
Risks Related to Our Operations
13
Our high fixed costs could adversely impact our results.
Our operations are characterized by high fixed or other costs which are difficult to reduce, including costs related to manufacturing, particularly as we operate our own manufacturing facilities, and the employment of our highly skilled workforce. When demand for our products decreases, competition increases or we fail to forecast demand accurately, we may be driven to reduce prices and we may not always be able to decrease our total costs in line with resulting revenue declines. As a result, the costs associated with our operations may not be fully absorbed, leading to unused capacity charges, higher average unit costs and lower gross margins, adversely impacting our results.
Our capital needs are high compared to those competitors who do not manufacture their own products and we may need additional funding in the coming years to finance our investments, to purchase other companies or technologies developed by third parties or to refinance our maturing indebtedness.
As a result of our choice to maintain control of a large portion of our manufacturing technologies and capabilities, we may require significant capital expenditure to maintain or upgrade our facilities if our facilities become inadequate in terms of capacity, flexibility and location. We monitor our capital expenditures taking into consideration factors such as trends in the semiconductor market, customer requirements and capacity utilization. These capital expenditures may increase in the future if we decide to upgrade or expand the capacity of our manufacturing facilities, purchase or build new facilities or increase investments supporting key strategic initiatives. For instance, we may be unable to successfully develop, maintain and operate large infrastructure projects. Such increased capital expenditures associated with large infrastructure projects and strategic initiatives might not achieve profitability or we may be unable to utilize infrastructure projects to full capacity. There can also be no assurance that future market demand and products required by our customers will meet our expectations. We also may need to invest in other companies, in IP and/or in technology developed either by us or by third parties to maintain or improve our position in the market or to reinforce our existing business. Failure to invest appropriately and in a timely manner or to successfully integrate any recent or future business acquisitions may prevent us from achieving the anticipated benefits and could have a material adverse effect on our business and results of operations.
The foregoing may require us to secure additional financing, including through the issuance of debt, equity or both. The timing and the size of any new share or bond offering would depend upon market conditions as well as a variety of other factors. In addition, the capital markets may from time to time offer terms of financing that are particularly favorable. We cannot exclude that we may access the capital markets opportunistically to take advantage of market conditions. Any such transaction or any announcement concerning such a transaction could materially impact the market price of our common shares. If we are unable to access capital on acceptable terms, this may adversely affect our business and results of operations.
Our operating results depend on our ability to obtain quality supplies on commercially reasonable terms. As we depend on a limited number of suppliers for materials, equipment and technology, we may experience supply disruptions if suppliers interrupt supply, increase prices or experience material adverse changes in their financial condition.
Our ability to meet our customers’ demand to manufacture our products depends upon obtaining adequate supplies of quality materials on a timely basis and on commercially reasonable terms. Certain materials are available from a limited number of suppliers or only from a limited number of suppliers in a particular region. We purchase certain materials whose prices on the world markets have fluctuated significantly in the past and may fluctuate significantly in the future. Although supplies for most of the materials we currently use are adequate, shortages could occur in various essential materials due to interruption of supply or increased demand in the industry. For instance, epidemics or pandemics could cause disruptions from the temporary closure of suppliers’ facilities or delays and reduced export or shipment of various materials. Geopolitical conflicts could also disrupt supply chains and cause shortages of certain semiconductor components and corresponding delays in shipments. Any such shortage may impact different geographical markets disproportionately, leading to shortages or unavailability of supplies in specific areas and higher transportation costs. In addition, the costs of certain materials may increase due to recent inflationary rates and market pressures and we may not be able to pass on such cost increases to our customers.
14
We also purchase semiconductor manufacturing equipment and third-party licensed technology from a limited number of suppliers and providers and, because such equipment and technology are complex, it is difficult to replace one supplier or provider with another or to substitute one piece of equipment or type of technology for another. In addition, suppliers and providers may extend lead times, limit our supply, increase prices or change contractual terms related to certain manufacturing equipment and third-party licensed technology, any of which could adversely affect our results. Furthermore, suppliers and technology providers tend to focus their investments on providing the most technologically advanced equipment, materials and technology and may not be able to address our requirements for equipment, materials or technology of older generations. Although we work closely with our suppliers and providers to avoid such shortages, there can be no assurance that we will not encounter these problems in the future.
Consolidation among our suppliers or vertical integration among our competitors may limit our ability to obtain sufficient quantities of materials, equipment and/or technology on commercially reasonable terms and engage in mergers and acquisitions. In certain instances, we may be required to enter into agreements with our suppliers with onerous terms, such as take-or-pay arrangements. If we are unable to obtain supplies of materials, equipment or technology in a timely manner or at all, or if such materials, equipment or technology prove inadequate or too costly, our results of operations could be adversely affected.
Our financial results can be affected by fluctuations in exchange rates, principally in the value of the U.S. dollar.
Currency exchange rate fluctuations affect our results of operations because our reporting currency is the U.S. dollar, in which we receive the major portion of our revenues, while, more importantly, we incur a limited portion of our revenue and a significantly higher portion of our costs in currencies other than the U.S. dollar. A significant variation of the value of the U.S. dollar against the principal currencies that have a material impact on us (primarily the Euro, but also certain other currencies of countries where we have operations, such as the Singapore dollar) could result in a favorable impact, net of hedging, on our net income in the case of an appreciation of the U.S. dollar, or a negative impact, net of hedging, on our net income if the U.S. dollar depreciates relative to these currencies, in particular with respect to the Euro.
In order to reduce the exposure of our financial results to the fluctuations in exchange rates, our principal strategy has been to balance as much as possible the proportion of sales to our customers denominated in U.S. dollars with the amount of purchases from our suppliers denominated in U.S. dollars and to reduce the weight of the other costs, including depreciation, denominated in Euros and in other currencies. In order to further reduce our exposure to U.S. dollar exchange rate fluctuations, we have hedged certain line items on our consolidated statements of income, in particular with respect to a portion of the cost of sales, the majority of the R&D expenses and certain SG&A expenses located in the Euro zone. We also hedge certain manufacturing costs, included within the cost of sales, denominated in Singapore dollars. There can be no assurance that our hedging transactions will prevent us from incurring higher Euro-denominated manufacturing costs and/or operating expenses when translated into our U.S. dollar-based accounts. See “Item 5. Operating and Financial Review and Prospects — Impact of Changes in Exchange Rates” and “Item 11. Quantitative and Qualitative Disclosures About Market Risk”.
Our operating results may vary significantly from quarter to quarter and annually and may also differ significantly from our expectations or guidance.
Our operating results are affected by a wide variety of factors that could materially and adversely affect revenues and profitability or lead to significant variability of our operating results from one period to the next. These factors include changes in demand from our key customers, capital requirements, inventory management, availability of funding, competition, new product developments, start of adoption of our new products by customers, technological changes, manufacturing or supplier issues and effective tax rates. In addition, in periods of industry overcapacity or when our key customers encounter difficulties in their end-markets or product ramps, orders are more exposed to cancellations, reductions, price renegotiation or postponements, which in turn reduce our ability to forecast the next quarter or full year production levels, revenues and margins. As a result, we may not meet our financial targets, which could in turn have an impact on our reputation or brand. For these reasons and others that we may not yet have identified, our revenues and operating results may differ materially from our expectations or guidance as visibility is reduced. See “Item 4. Information on the Company — Backlog”.
15
If our external silicon foundries or back-end subcontractors fail to perform, this could adversely affect our business prospects, financial condition and results of operations.
We currently use external silicon foundries and back-end subcontractors for a portion of our manufacturing activities. Any limitation on the ability of our external silicon foundries and back-end subcontractors to satisfy our demand may cause our results of operations and ability to satisfy the demand of our customers to suffer. Likewise, if we are unable to meet our commitments to silicon foundries and back-end subcontractors, our results of operations could suffer. Prices for these services also vary depending on capacity utilization rates at our external silicon foundries and back-end subcontractors, quantities demanded and product and process technology. Such outsourcing costs can vary materially and, in cases of industry shortages, they can increase significantly, negatively impacting our business prospects, financial condition and results of operations.
Our manufacturing processes are highly complex, costly and potentially vulnerable to impurities, disruptions or inefficient implementation of production changes or interruptions that can significantly increase our costs and delay product shipments to our customers.
Our manufacturing processes are highly complex, require advanced and increasingly costly equipment and are continuously modified or maintained in an effort to improve yields and product performance and lower the cost of production.
Furthermore, impurities or other difficulties in the manufacturing process can lower yields, interrupt production or result in scrap. As system complexity and production changes have increased and sub-micron technology has become more advanced, manufacturing tolerances have been reduced and requirements for precision have become even more demanding. We have from time to time experienced bottlenecks and production difficulties that have caused delivery delays and quality control problems. There can be no assurance that we will not experience bottlenecks or production, transition or other difficulties in the future.
In addition, we are exposed to risks related to interruptions of our manufacturing processes. If any of our property or equipment is damaged or otherwise rendered unusable or inoperable due to accident, cyberattack or otherwise this could result in interruptions which could have a material adverse effect on our business, financial condition and results of operations.
We may experience quality problems from time to time that can result in decreased sales and operating margin and product liability or warranty claims.
We sell complex products that may not in each case comply with specifications or customer requirements, or may contain design or manufacturing defects, that could cause personal injury, property damage or security risks that could be exploited by unauthorized third parties hacking, corrupting or otherwise obtaining access to our products, including the software loaded thereon by us, our suppliers or our customers. Although our general practice is to contractually limit our liability to the repair, replacement or refund of defective products, we occasionally agree to contractual terms with key customers in which we provide extended warranties and accordingly we may face product liability, warranty, delivery failure, and/or other claims relating to our products that could result in significant expenses relating to compensation payments, product recalls or other actions related to such extended warranties and/or to maintain good customer relationships, which could result in decreased sales and operating margin and other material adverse effects on our business. Costs or payments we may make in connection with warranty and other claims or product recalls may adversely affect our results of operations. There can be no assurance that we will be successful in maintaining our relationships with customers with whom we incur quality problems. Furthermore, if litigation occurs we could incur significant costs and liabilities to defend ourselves against such claims. The industry has experienced a rise in premiums and deductibles with regards to insurance policies. These may continue to increase and insurance coverage may also correspondingly decrease. If litigation occurs and damages are awarded against us, there can be no assurance that our insurance policies will be available or adequate to protect us against such claims.
16
Disruptions in our relationships with any one of our key customers or distributors, and/or material changes in their strategy or financial condition or business prospects, could adversely affect our results of operations.
A substantial portion of our sales is derived from a limited number of customers and distributors. There can be no assurance that our customers or distributors will continue to book the same level of sales with us that they have in the past, will continue to succeed in the markets they serve and will not purchase competing products over our products. Many of our key customers and distributors operate in cyclical businesses that are also highly competitive, and their own market positions may vary considerably. In recent years, some of our customers have vertically integrated their businesses. Such vertical integrations may impact our business. Our relationships with the newly formed entities could be either reinforced or jeopardized by the integration. If we are unable to maintain or increase our market share with our key customers or distributors, or if they were to increase product returns or fail to meet payment obligations, our results of operations could be materially adversely affected. Certain of our products are customized to our customers’ specifications. If customers do not purchase products made specifically for them, we may not be able to recover a cancellation fee from our customers or resell such products to other customers. In addition, the occurrence of epidemic or pandemic outbreaks could affect our customers. The geographic spread of epidemics or pandemics may be difficult to predict and adverse public health impacts on our customers could negatively affect our results.
We may experience delays in delivering our product and technology roadmaps as well as transformation initiatives.
Our industry adapts to technological advancements and it is likely that new products, equipment, processes and service methods, including transformation initiatives related to digitalization, are in the process of being implemented. Any failure by us to manage our data governance processes could undermine our initiatives related to digitalization and any failure by us to react to changes or advances in existing technologies and processes as we develop and invest in our product, technology and transformation roadmaps could materially delay the introduction of new solutions. If we are not able to execute on these roadmaps on a timely basis or at an acceptable cost this could result in loss of competitiveness of our solutions, decreased revenue and a loss of market share.
Our computer systems, including hardware, software, information and cloud-based initiatives, are subject to attempted security breaches and other cybersecurity threats, which, if successful, could adversely impact our business.
We have, from time to time, detected and experienced attempts by others to gain unauthorized access to our computer systems and networks. The reliability and security of our information technology infrastructure and software, including our artificial intelligence ("AI")technology, and our ability to expand and continually update technologies, including to transition to cloud-based technologies, in response to our changing needs is critical to our business. In the current environment, there are numerous and evolving risks to cybersecurity, including criminal hackers, state-sponsored intrusions, terrorism, industrial espionage, employee malfeasance, vandalism and human or technological error. Computer hackers and others routinely attempt to breach the security of technology products, services, and systems, and those of our customers, suppliers, partners and providers of third-party licensed technology, and some of those attempts may be successful. Such breaches could result in, for example, unauthorized access to, disclosure, modification, misuse, loss, or destruction of our, our customer, or other third-party data or systems, theft of our trade secrets and other sensitive or confidential data, including personal information and IP, system disruptions, and denial of service.
The attempts to breach our systems, including our cloud-based systems, and to gain unauthorized access to our information technology systems are becoming increasingly more sophisticated. These attempts may include covertly introducing malware into our computers, including those in our manufacturing operations, and impersonating unauthorized users, among others. For instance, employees and former employees, in particular former employees who become employees of our competitors or customers, may misappropriate, use, publish or provide to our competitors or customers our IP and/or proprietary or confidential business information. Also, third parties may attempt to register domain names similar to our brands or website, which could cause confusion and divert online customers away from our products. In the event of such breaches, we, our customers or other third parties could be exposed to potential liability, litigation, and regulatory action, as well as the loss of existing or potential customers, damage to our reputation, and other financial loss and such breaches could also result in losing existing or potential customers in connection with any actual or perceived security
17
vulnerabilities in our systems. In addition, the cost and operational consequences of responding to breaches and implementing remediation measures could be significant. As these threats continue to develop and grow, we have been adapting and strengthening our security measures.
As a result of work-from-home policies that we have undertaken, there has been additional reliance placed on our IT systems and resources. The resulting reliance on these resources, and the added need to communicate by electronic means, could increase our risk of cybersecurity incidents.
Geopolitical instability has been associated with an increase in cybersecurity incidents. This may result in a higher likelihood that we may experience direct or collateral consequences from cybersecurity conflicts between nation-states or other politically motivated actors targeting critical technology infrastructure.
U.S. and foreign regulators have increased their focus on cybersecurity vulnerabilities and risks, and customers and service providers are increasingly demanding more rigorous contractual certification and audit provisions regarding cybersecurity and data governance. This may result in an increase of our overall compliance burden due to increasingly onerous obligations and leading to significant expense. There may also be shorter deadlines in which to notify the authorities of data breaches and ever-increasing fines and penalties for businesses that fail to respond swiftly and appropriately to cyberattacks. Any failure to comply could also result in proceedings against us by regulatory authorities or other third parties.
We continue to increase the resources we allocate to implementing, maintaining and/or updating security systems to protect data and infrastructure and to raising security awareness among those having access to our systems. However, these security measures cannot provide absolute security and there can be no assurance that our employee training, operational, and other technical security measures or other controls will detect, prevent or remediate security or data breaches in a timely manner or otherwise prevent unauthorized access to, damage to, or interruption of our systems and operations.
We regularly evaluate our IT systems and business continuity plan to make enhancements and periodically implement new or upgraded systems, including the transition and migration of our data systems to cloud-based platforms and critical system migration. Any delay in the implementation of, or disruption in the transition to different systems could adversely affect our ability to record and report financial and management information on a timely and accurate basis and could impact our operations and financial position. In addition, a miscalculation of the level of investment needed to ensure our technology solutions are current and up-to-date as technology advances and evolves could result in disruptions in our business should the software, hardware or maintenance of such items become out-of-date or obsolete and the costs of upgrading our cybersecurity systems and remediating damages could be substantial.
We may also be adversely affected by security breaches related to our equipment providers and providers of IT services or third-party licensed technology. As a global enterprise, we could also be impacted by existing and proposed laws and regulations, as well as government policies and practices related to cybersecurity, data privacy and data protection. Additionally, cyberattacks or other catastrophic events resulting in disruptions to or failures in power, information technology, communication systems or other critical infrastructure could result in interruptions or delays to us, our customers, or other third-party operations or services, financial loss, potential liability, damage to our reputation and could also affect our relationships with our customers, suppliers and partners. See “Item 16K. Cybersecurity”.
We may be subject to theft, loss, or misuse of personal data about our employees, customers, or other third parties, which could increase our expenses, damage our reputation, or result in legal or regulatory proceedings.
The theft, loss, or misuse of personal data processed by us could result in significantly increased security costs or costs related to defending legal claims.
Further, with increasing digitalization, data privacy-related legislations are rapidly evolving around the globe which may have a negative impact on our business if interpreted or implemented in a manner that is inconsistent from country to country and inconsistent with the current policies and practices of our customers or business partners. We may also have to change the manner in which we contract with our business partners, store and transfer information and otherwise conduct our business, which could increase our costs and reduce our revenues.
18
Our business is dependent in large part on continued growth in the industries and segments into which our products are sold and on our ability to retain existing customers and attract new ones. A market decline in any of these industries, our inability to retain and attract customers, or customer demand for our products which differs from our projections, could have a material adverse effect on our results of operations.
The demand for our products depends significantly on the demand for our customers’ end products. Growth of demand in the industries and segments into which our products are sold fluctuates significantly and is driven by a variety of factors, including consumer spending, consumer preferences, the development and acceptance of new technologies and prevailing economic conditions. Changes in our customers’ markets and in our customers’ respective shares in such markets could result in slower growth and a decline in demand for our products. In addition, if projected industry growth rates do not materialize as forecasted, our spending on process and product development ahead of market acceptance could have a material adverse effect on our business, financial condition and results of operations.
Our business is dependent upon our ability to retain existing customers. In 2023 our largest customer, Apple, accounted for 12.3% of our total revenues. While we do not believe to be dependent on any one customer or group of customers, the loss of key customers or important sockets at key customers could have an adverse effect on our results of operations and financial condition.
Our existing customers’ product strategy may change from time to time and/or product specifications may change on short-time product life cycles and we have no certainty that our business, financial position and results of operations will not be affected. Our business is also dependent upon our ability to attract new customers. There can be no assurance that we will be successful in attracting and retaining new customers, or in adequately projecting customer demand for our products. Our failure to do so could materially adversely affect our business, financial condition and results of operations.
Market dynamics have driven, and continue to drive us, to a strategic repositioning.
In recent years, we have undertaken several initiatives to reposition our business. Our strategies to improve our results of operations and financial condition have led us, and may in the future lead us, to acquire businesses that we believe to be complementary to our own, to divest ourselves of or wind down activities that we believe do not serve our longer term business plans, or to enter into partnerships or joint ventures to enter into or strengthen our position in certain markets and increase our scale of operations. Our potential acquisition strategies depend in part on our ability to identify suitable acquisition targets, finance their acquisition, obtain approval by our shareholders and obtain required regulatory and other approvals. Our potential divestiture strategies depend in part on our ability to compete and to identify the activities in which we should no longer engage, obtain the relevant approvals pursuant to our governance process and then determine and execute appropriate methods to divest of them. Our actual or potential partnerships and joint venture strategies depend in part on our ability to execute sales and operations plans alongside our partner or joint venture.
We are constantly monitoring our product portfolio and cannot exclude that additional steps in this repositioning process may be required. Furthermore, we cannot assure that any strategic repositioning of our business, including executed and possible future acquisitions, dispositions or partnerships and joint ventures, will be successful and will not result in impairment, restructuring charges and other related closure costs.
Acquisitions, divestitures, partnerships and joint ventures involve a number of risks that could adversely affect our operating results and financial condition, including, in respect of acquisitions and divestitures, the inability for us to successfully integrate businesses or teams that we acquire with our culture and strategies on a timely basis or at all, and the potential requirement for us to record charges related to the goodwill or other long-term assets associated with the acquired businesses. There can be no assurance that we will be able to achieve the full scope of the benefits we expect from a particular acquisition, divestiture, partnership, joint venture or investment. Our business, financial condition and results of operations may suffer if we fail to coordinate our resources effectively to manage both our existing businesses and any acquired businesses. In addition, the financing of future acquisitions, divestitures, partnerships or joint ventures may negatively impact our financial position, including our ability to pay a dividend and/or repurchase our shares, and our credit rating and we could be required to raise additional funding.
Other risks associated with acquisitions include the assumption of potential liabilities, disclosed or undisclosed, associated with the business acquired, which liabilities may exceed the amount of indemnification
19
available from the seller, potential inaccuracies in the financials of the business acquired, and our ability to retain customers of an acquired entity, its business or industrialize an acquired process or technology. Identified risks associated with divestitures include loss of activities and technologies that may have complemented our remaining businesses or operations and loss of important services provided by key employees that are assigned to divested activities.
We depend on collaboration with other semiconductor industry companies, research organizations, universities, customers and suppliers to further our R&D efforts, and our business and prospects could be materially adversely affected by the failure or termination of such alliances.
Our success depends on our ability to introduce innovative new products and technologies to the marketplace on a timely basis. In light of the high levels of investment required for R&D activities, we depend in certain instances on collaborations with other semiconductor industry companies, research organizations, universities, customers and suppliers to develop or access new technologies.
Such collaboration provides us with a number of important benefits, including the sharing of costs, reductions in our own capital requirements, acquisitions of technical know-how and access to additional production capacities. However, there can be no assurance that our collaboration efforts will be successful and allow us to develop and access new technologies in due time, in a cost-effective manner and/or to meet customer demands. If a particular collaboration terminates before our intended goals are accomplished we may incur additional unforeseen costs, and our business and prospects could be adversely affected. Furthermore, if we are unable to develop or otherwise access new technologies, whether independently or in collaboration with another industry participant, we may fail to keep pace with the rapid technology advances in the semiconductor industry, our participation in the overall semiconductor industry may decrease and we may also lose market share.
We depend on patents to protect our rights to our technology and may face claims of infringing the IP rights of others.
We depend on patents and other IP rights to protect our products and our manufacturing processes against misappropriation by others. The process of seeking patent protection can be long and expensive, and there can be no assurance that that we will receive patents from currently pending or future applications. Even if patents are issued, they may not be of sufficient scope or strength to provide meaningful protection or any commercial advantage. In addition, effective IP protection may be unavailable or limited in some countries. Our ability to enforce one or more of our patents could be adversely affected by changes in patent laws, laws in certain foreign jurisdictions that may not effectively protect our IP rights or by ineffective enforcement of laws in such jurisdictions. Competitors may also develop technologies that are protected by patents and other IP and therefore either be unavailable to us or be made available to us subject to adverse terms and conditions. We have in the past used our patent portfolio to negotiate broad patent cross-licenses with many of our competitors enabling us to design, manufacture and sell semiconductor products, without concern of infringing patents held by such competitors. We may not in the future be able to obtain such licenses or other rights to protect necessary IP on favorable terms for the conduct of our business, and such failure may adversely impact our results of operations. Such cross-license agreements expire from time to time and there is no assurance that we can or we will extend them.
We have from time to time received, and may in the future receive, communications alleging possible infringement of third-party patents and other IP rights. Some of those claims are made by so-called non-practicing entities against which we are unable to assert our own patent portfolio to lever licensing terms and conditions. Competitors with whom we do not have patent cross-license agreements may also develop technologies that are protected by patents and other IP rights and which may be unavailable to us or only made available on unfavorable terms and conditions. We may therefore become involved in costly litigation brought against us regarding patents and other IP rights. See Note 25 to our Consolidated Financial Statements. IP litigation may also involve our customers who in turn may seek indemnification from us should we not prevail and/or who may decide to curtail their orders for those of our products over which claims have been asserted. Such lawsuits may therefore have a material adverse effect on our business. We may be forced to stop producing substantially all or some of our products or to license the underlying technology upon economically unfavorable terms and conditions or we may be required to pay damages for the prior use of third-party IP and/or face an injunction.
20
The outcome of IP litigation is inherently uncertain and may divert the efforts and attention of our management and other specialized technical personnel. Such litigation can result in significant costs and, if not resolved in our favor, could materially and adversely affect our business, financial condition and results of operations.
We operate in many jurisdictions with highly complex and varied tax regimes. Changes in tax rules, new or revised legislation or the outcome of tax assessments and audits could cause a material adverse effect on our results.
We operate in many jurisdictions with highly complex and varied tax regimes. Changes in tax rules, new or revised legislation or the outcome of tax assessments and audits could have a material adverse effect on our results.
In 2021, the Organization for Economic Cooperation and Development (OECD) and the G20 Inclusive Framework on base erosion and profit shifting (BEPS) agreed to a two-pillar solution to address the tax challenges arising from the digitalization of the economy. Pillar I is a set of proposals to revisit tax allocation rules in a changed economy. The intention is that a portion of a multinationals' residual profit is taxed in the jurisdiction where revenue is sourced.
Pillar II enforces a global minimum corporate income tax at an effective rate of 15% for large multinationals. On December 20, 2021 the OECD published the Global Anti-Base Erosion Model Rules ("GloBe Rules") for Pillar II. On December 22, 2021, the European Commission published a legislative proposal for Pillar II (the "EU Pillar II Directive").
On December 15, 2022, the Council of the European Union formally adopted the EU Pillar II Directive. The EU Pillar II Directive aims at consistently implementing among all 27 member states the GloBe Rules. EU Member States will have to transpose the EU Pillar II Directive into their national laws and will have to apply the Pillar II measures in respect of the fiscal years beginning on or after December 31, 2023. The Netherlands have transposed the EU Pillar II Directive into its national legislation with effect from December 31, 2023 pursuant to the Dutch Minimum Tax Act 2024 (Wet minimumbelasting 2024).
The tax impact of the Pillar I and Pillar II rules is monitored to determine the potential effect on our results and to ensure compliance when the legislation is effective. The impact on the Company's tax position will depend on the changes in the level of tax results within various local jurisdiction and the potential adoption of the legislation in the jurisdiction where the Company operates in 2024. Therefore no quantitative tax impact on the Company's tax position is provided as per December 31, 2023.
Our tax rate is variable and depends on changes in the level of operating results within various local jurisdictions and on changes in the applicable taxation rates of these jurisdictions, as well as changes in estimated tax provisions due to new events. We currently receive certain tax benefits or benefit from net operating losses cumulated in prior years in some countries, and these benefits may not be available in the future due to changes in the local jurisdictions or credits on net operating losses being no longer available due to either full utilization or expiration of the statute of limitations in such jurisdictions. As a result, our effective tax rate could increase and/or our benefits from carrying forward net operating losses could affect our deferred tax assets in certain countries in the coming years. In addition, the acquisition or divestiture of businesses in certain jurisdictions could materially affect our effective tax rate.
We evaluate our deferred tax asset position and the need for a valuation allowance on a regular basis. The ultimate realization of deferred tax assets is dependent upon, among other things, our ability to generate future taxable income that is sufficient to utilize in certain jurisdictions loss carry-forwards or tax credits before their expiration or our ability to implement prudent and feasible tax optimization strategies. The recorded amount of total deferred tax assets could be reduced, which could have a material adverse effect on our results of operations and financial position, if our estimates of projected future taxable income and benefits from available tax strategies are reduced as a result of a change in business condition or in management’s plans or due to other factors, such as changes in tax laws and regulations.
We are subject to the possibility of loss contingencies arising out of tax claims, assessment of uncertain tax positions and provisions for specifically identified income tax exposures. We are also subject to tax audits in certain jurisdictions. There can be no assurance that we will be successful in resolving potential tax claims that
21
result from these audits, which could result in material adjustments in our tax positions. We record provisions on the basis of the best current understanding; however, we could be required to record additional provisions in future periods for amounts that cannot currently be assessed. Our failure to do so and/or the need to increase our provisions for such claims could have a material adverse effect on our results of operations and our financial position.
Our operating results can vary significantly due to impairment of goodwill, other intangible assets and equity investments booked pursuant to acquisitions and the timeframe required to foster and realize synergies thereof, joint venture agreements and the purchase of technologies and licenses from third parties, as well as to impairment of tangible assets due to changes in the business environment. Because the market for our products is characterized by rapidly changing technologies, significant changes in the semiconductor industry, and the potential failure of our business initiatives, our future cash flows may not support the value of goodwill, tangible assets and other intangibles registered in our consolidated balance sheets. See “Item 5. Operating and Financial Review and Prospects— Critical Accounting Policies Using Significant Estimates — Impairment of goodwill”, “— Intangible assets subject to amortization” and “Item 4. Information on the Company — Property, Plants and Equipment”.
We receive public funding, and a reduction in the amount available to us or demands for repayment could increase our costs and impact our results of operations.
We have in the past obtained public funding, primarily to support our proprietary R&D for technology investments and investments in cooperative R&D ventures, and expect to obtain public funding in the future, mainly from EU member states (including France, Italy and Malta). The public funding we receive is subject to periodic review by the relevant authorities and there can be no assurance that we will continue to benefit from such programs at current levels or that sufficient alternative funding will be available if we lose such support. If any of the public funding programs we participate in are curtailed or discontinued and we do not reduce the relevant R&D or other costs, this could have a material adverse effect on our business. Furthermore, to receive public funding, we enter into agreements which require compliance with extensive regulatory requirements and set forth certain conditions relating to the funded programs. If we fail to meet the regulatory requirements or applicable conditions, we may, under certain circumstances, be required to refund previously received amounts, which could have a material adverse effect on our results of operations. If there are changes in the public funding we receive this could increase the net costs for us to, amongst others, continue investing in R&D at current levels and could result in a material adverse effect on our results of operations.
A change in the landscape in public funding may also affect our business. For example, the European Chips Act which entered into force on September 21, 2023 and is designed to bolster Europe’s competitiveness and resilience in semiconductor technologies and applications and any similar proposals in other regions, may provide public funding towards manufacturing activities of semiconductors. It is yet to be seen whether this would impact the amount of public funding currently available to us for our R&D or other investments and ventures, but any reduction in said funding will result in a material adverse effect on our results of operations. Further, this may result in new or existing competitors benefiting from such funding and could also have an impact on the competitive landscape in our industry. See “Item 4. Information on the Company — Public Funding”.
Some of our production processes and materials are environmentally sensitive, which could expose us to liability and increase our costs due to environmental, health and safety laws and regulations or because of damage to the environment.
We are subject to various laws and regulations, as well as increasing focus from our stakeholders regarding environmental, health and safety matters, including the use, storage, discharge and disposal of chemicals, gases and other hazardous substances used in our operations. Addressing such focus from stakeholders, as well as compliance with such laws and regulations could adversely affect our manufacturing costs or product sales by requiring us to acquire costly equipment, materials or greenhouse gas allowances, or to incur other significant expenses in adapting our manufacturing processes or waste and emission disposal processes. Furthermore, environmental claims or our failure to comply with present or future regulations could result in the assessment of damages or imposition of fines against us, suspension of production or a cessation of operations. Failure by us to control the use of, or adequately restrict the discharge of, chemicals or hazardous substances could subject us to future liabilities.
22
Climate change and related sustainability regulations and initiatives, including our commitment to become carbon neutral by 2027 on scope 1 and 2 and partially scope 3, could place additional burden on us and our operations.
As climate change issues become more pronounced, we may correspondingly face increased regulation and also expectations from our stakeholders to take actions beyond existing regulatory requirements to minimize our impact on the environment and mitigate climate change related effects. The semiconductor manufacturing process has historically contributed to direct greenhouse gas emissions by utilizing perfluorocarbons, which may lead to new or increased regulation of such compounds. In order to address such regulation, we may be required to adapt our production processes or purchase additional equipment or carbon offsets, leading to increased costs. As of the end of 2023, we are on track towards our goal to become carbon neutral by 2027 on scope 1 and 2 and partially scope 3, which includes two specific targets: compliance with the 1.5°C scenario defined at the Paris COP21 by 2025, implying a 50% reduction of direct and indirect greenhouse gas emissions compared to 2018, and the sourcing of 100% renewable energy by 2027 (as further explained below in “Item 4. – Environmental, Health and Safety Matters”).
To meet these additional requirements, we will need to continue to deploy additional equipment, introduce process changes, utilize alternative suppliers and materials, and take other similar actions, some or all of which may require us to incur additional costs which could result in a material adverse effect on our results of operations and our financial condition. In addition, if we fail to meet these expectations, or foster additional sustainability initiatives, we may experience reputational risk which could impact our ability to attract and retain customers, employees, and investors.
Further, our sites, as well as those of our partners along the supply chain, may be exposed to changing and/or increasing physical risks resulting from climate change that are either chronic (induced by longer-term shifts in climate patterns, such as sea level rise or constraints in the availability of water, changing temperature, wind or precipitation patterns) or acute (event-driven such as cyclones, hurricanes or heat waves). In the context of the transition to a lower-carbon economy, we will likely be exposed to further policy, legal, technology, and market transition risks. We have already seen further policy developments in this area in the form of Regulation (EU) 2020/852 of the European Parliament and of the Council of June 18, 2020 on the establishment of a framework to facilitate sustainable investment and amending Regulation (EU) 2019/2088 (the “EU Taxonomy Regulation”), which entered into force on July 12, 2020. As a result of the EU Taxonomy Regulation, we must disclose information on how and to what extent our activities are associated with economic activities that qualify as environmentally sustainable. See “Item 4. Information on the Company – Environmental, Health and Safety Matters”.
Directive (EU) 2022/2464 of the European Parliament and of the Council of December 14, 2022 amending Regulation (EU) No 537/2014, Directive 2004/109/EC, Directive 2006/43/EC and Directive 2013/34/EU, as regards corporate sustainability reporting (the “CSRD”), which entered into force on January 5, 2023 and which will apply to our reporting as of financial year 2024, strengthens the rules regarding social and environmental information that is required to be reported. The CSRD seeks to provide investors and other stakeholders with access to the information they need to assess investment risks arising from climate change and other sustainability topics. The CSRD further makes it mandatory for us to have an audit of the sustainability information that we report on. If our disclosure metrics relating to climate change and other sustainability topics are lower than those of our peers in the industry, this may lead to reputational risk which may lead to onward financial repercussions such as a decrease in share price or difficulty in raising capital.
Loss of key employees and the inability to continuously recruit and retain qualified employees could hurt our competitive position.
Our success depends to a significant extent upon our key executives and R&D, engineering, marketing, sales, manufacturing, support and other personnel. Our success also depends upon our ability to continue to identify, attract, retain and motivate highly trained and skilled engineering, technical and professional personnel in a competitive recruitment environment, as well our ability to ensure the smooth succession and continuity of business with newly hired and promoted personnel. For instance, in highly specialized areas, it may become more difficult to retain employees.
23
Our employee hiring and retention also depend on our ability to build and maintain a diverse and inclusive workplace culture and be viewed as an employer of choice. We intend to continue to devote significant resources to recruit, train and retain qualified employees, however, we may not be able to attract, obtain and retain these employees, which may affect our growth in future years and the loss of the services of any of these key personnel without adequate replacement or the inability to attract new qualified personnel could have a material adverse effect on us.
The interests of our controlling shareholder, which is in turn indirectly controlled by the French and Italian governments, may conflict with other investors’ interests. In addition, our controlling shareholder may sell our existing common shares or issue financial instruments exchangeable into our common shares at any time.
We understand that as of December 31, 2023, STMicroelectronics Holding N.V. (“ST Holding”), owned 250,704,754 shares, or approximately 27.5%, of our issued common shares. ST Holding may therefore be in a position to effectively control the outcome of decisions submitted to the vote at our shareholders’ meetings, including but not limited to the appointment of the members of our Managing and Supervisory Boards.
We have been informed that ST Holding’s shareholders, each of which is ultimately controlled by the French or Italian government, are party to a shareholders agreement (the “STH Shareholders Agreement”), which governs relations between them. We are not a party to the STH Shareholders Agreement. See “Item 7. Major Shareholders and Related Party Transactions — Major Shareholders”. The STH Shareholders Agreement includes provisions requiring the unanimous approval by the shareholders of ST Holding before ST Holding can vote its shares in our share capital, which may give rise to a conflict of interest between our interests and investors’ interests, on the one hand, and the (political) interests of ST Holding’s shareholders, on the other hand. Our ability to issue new shares or other securities giving access to our shares may be limited by ST Holding’s desire to maintain its shareholding at a certain level and our ability to buy back shares may be limited by ST Holding due to a Dutch law requiring one or more shareholders acquiring 30% or more of our voting rights to launch a tender offer for our outstanding shares.
The STH Shareholders Agreement also permits our respective French and Italian indirect shareholders to direct ST Holding to dispose of its stake in us at any time, thereby reducing the current level of their respective indirect interests in our common shares. Sales of our common shares or the issuance of financial instruments exchangeable into our common shares or any announcements concerning a potential sale by ST Holding could materially impact the market price of our common shares depending on the timing and size of such sale, market conditions as well as a variety of other factors.
Our shareholder structure and our preference shares may deter a change of control.
We have an option agreement in place with an independent foundation, whereby the foundation can acquire preference shares in the event of actions which the board of the independent foundation determines would be contrary to our interests, our shareholders and our other stakeholders and which in the event of a creeping acquisition or offer for our common shares are not supported by our Managing Board and Supervisory Board. In addition, our shareholders have authorized us to issue additional capital within the limits of the authorization by our Annual General Meeting of Shareholders (“AGM”), subject to the requirements of our Articles of Association, without the need to seek a specific shareholder resolution for each capital increase. Accordingly, an issue of preference shares or new shares may make it more difficult for a shareholder to obtain control over our general meeting of shareholders. These anti-takeover provisions could substantially impede the ability of our shareholders to benefit from a change in control and, as a result, may materially adversely affect the market price of our ordinary shares and our investors’ ability to realize any potential change of control premium. See “Item 7. Major Shareholders and Related Party Transactions — Major Shareholders — Preference Shares”.
Any decision to reduce or discontinue paying cash dividends to our shareholders could adversely impact the market price of our common shares.
On an annual basis, our Supervisory Board, upon the proposal of the Managing Board, may propose the distribution of a cash dividend to the general meeting of shareholders. See “Item 8. Dividend Policy”. Any
24
reduction or discontinuance by us of the payment of cash dividends at historical levels could cause the market price of our common shares to decline.
We are required to prepare financial statements under IFRS and we also prepare Consolidated Financial Statements under U.S. GAAP, and such dual reporting may impair the clarity of our financial reporting.
We use U.S. GAAP as our primary set of reporting standards. Applying U.S. GAAP in our financial reporting is designed to ensure the comparability of our results to those of our competitors, as well as the continuity of our reporting, thereby providing our stakeholders and potential investors with a clear understanding of our financial performance. As we are incorporated in The Netherlands and our shares are listed in Europe on Euronext Paris and on the Borsa Italiana, we are subject to EU regulations requiring us to also report our results of operations and financial statements using IFRS.
As a result of the obligation to report our financial statements under IFRS, we prepare our results of operations using both U.S. GAAP and IFRS, which are currently not consistent. Such dual reporting can materially increase the complexity of our financial communications. Our financial position and results of operations reported in accordance with IFRS will differ from our financial position and results of operations reported in accordance with U.S. GAAP, which could give rise to confusion in the marketplace.
There are inherent limitations on the effectiveness of our controls.
There can be no assurance that a system of internal control over financial reporting, including one determined to be effective, will prevent or detect all misstatements. A control system, no matter how well designed and operated, can provide only reasonable, not absolute, assurance regarding financial statement preparation and presentation. Projections of the results of any evaluation of the effectiveness of internal control over financial reporting into future periods are subject to inherent risk. The relevant controls may become inadequate due to changes in circumstances or the degree of compliance with the underlying policies or procedures may deteriorate.
Because we are subject to the corporate law of The Netherlands, U.S. investors might have more difficulty protecting their interests in a court of law or otherwise than if we were a U.S. company.
Our corporate affairs are governed by our Articles of Association and by the laws governing corporations incorporated in The Netherlands. The rights of our investors and the responsibilities of members of our Managing and Supervisory Boards under Dutch law are not as clearly established as under the rules of some U.S. jurisdictions. Therefore, U.S. investors may have more difficulty in protecting their interests in the face of actions by our management, members of our Managing and Supervisory Boards or our controlling shareholders than U.S. investors would have if we were incorporated in the United States.
Our executive offices and a substantial portion of our assets are located outside the United States. In addition, ST Holding and most members of our Managing and Supervisory Boards are residents of jurisdictions other than the United States. As a result, it may be difficult or impossible for shareholders to effect service within the United States upon us, ST Holding, or members of our Managing or Supervisory Boards. It may also be difficult or impossible for shareholders to enforce outside the United States judgments obtained against such persons in U.S. courts, or to enforce in U.S. courts judgments obtained against such persons in courts in jurisdictions outside the United States. This could be true in any legal action, including actions predicated upon the civil liability provisions of U.S. securities laws. In addition, it may be difficult or impossible for shareholders to enforce, in original actions brought in courts in jurisdictions located outside the United States, rights predicated upon U.S. securities laws.
We have been advised by Dutch counsel that the United States and The Netherlands do not currently have a treaty providing for reciprocal recognition and enforcement of judgments (other than arbitration awards) in civil and commercial matters. With respect to choice of court agreements in civil or commercial matters, it is noted that the Hague Convention on Choice of Court Agreements entered into force in The Netherlands, but has not entered into force in the United States. As a consequence, a final judgment for the payment of money rendered by any federal or state court in the United States based on civil liability, whether or not predicated solely upon the federal securities laws of the United States, will not be enforceable in The Netherlands.
25
However, if the party in whose favor such final judgment is rendered brings a new suit in a competent court in The Netherlands, such party may submit to The Netherlands court the final judgment that has been rendered in the United States. If The Netherlands court finds that the jurisdiction of the federal or state court in the United States has been based on grounds that are internationally acceptable and that proper legal procedures that are in accordance with the Dutch standards of proper administration of justice including sufficient safeguards (behoorlijke rechtspleging) have been observed, the court in The Netherlands would, under current practice, in principle give binding effect to the final judgment that has been rendered in the United States unless such judgment contradicts The Netherlands’ public policy and provided that the judgment by the foreign court is not incompatible with a decision rendered between the same parties by a Dutch court, or with a previous decision rendered between the same parties by a foreign court in a dispute that concerns the same subject and is based on the same cause, provided that the previous decision qualifies for acknowledgment in The Netherlands. Even if such a foreign judgment is given binding effect, a claim based thereon may, however, still be rejected if the foreign judgment is not or no longer formally enforceable.
Item 4. Information on the Company
History and Development of the Company
STMicroelectronics N.V. was formed and incorporated in 1987 as a result of the combination of the semiconductor business of SGS Microelettronica (then owned by Società Finanziaria Telefonica (S.T.E.T.), an Italian corporation) and the non-military business of Thomson Semiconducteurs (then owned by the former Thomson-CSF, now Thales, a French corporation). We completed our initial public offering in December 1994 with simultaneous listings on the Bourse de Paris (now known as “Euronext Paris”) and the New York Stock Exchange (“NYSE”). In 1998, we also listed our shares on the Borsa Italiana S.p.A. (“Borsa Italiana”).
We operated as SGS-Thomson Microelectronics N.V. until May 1998, when we changed our name to STMicroelectronics N.V. We are organized under the laws of The Netherlands, with our corporate legal seat in Amsterdam, The Netherlands, and our head offices at WTC Schiphol Airport, Schiphol Boulevard 265, 1118 BH Schiphol, The Netherlands. Our telephone number there is +31-20-654-3210. Our headquarters and operational offices are managed through our wholly owned subsidiary, STMicroelectronics International N.V., and are located at 39 Chemin du Champ des Filles, 1228 Plan-Les-Ouates, Geneva, Switzerland. Our main telephone number there is +41-22-929-2929. Our agent for service of process in the United States related to our registration under the U.S. Securities Exchange Act of 1934, as amended, is Corporation Service Company (CSC), 80 State Street, Albany, New York, 12207. Our operations are also conducted through our various subsidiaries, which are organized and operated according to the laws of their country of incorporation, and consolidated by STMicroelectronics N.V.
Business Overview
We are a global semiconductor company that designs, develops, manufactures and markets a broad range of products used in a wide variety of applications for the four end-markets we address: automotive, industrial, personal electronics and communications equipment, computers and peripherals. For the automotive and industrial markets we address a wide customer base, particularly in industrial, with a broad and deep product portfolio. In personal electronics and communications equipment, computers and peripherals we have a selective approach both in terms of the customers we serve, as well as in the technologies and products we offer, while leveraging our broad portfolio to address high-volume applications.
Our diverse product portfolio includes discrete and general purpose components, application-specific integrated circuits (“ASICs”), full-custom devices and semi-custom devices and application-specific standard products (“ASSPs”) for analog, digital and mixed-signal applications. It benefits from a unique, strong foundation of proprietary and differentiated leading-edge technologies. We use all of the prevalent function-oriented process technologies, including complementary metal-on silicon oxide semiconductors (“CMOS”), bipolar and non-volatile memory technologies. In addition, by combining basic processes, we have developed advanced systems-oriented technologies that enable us to produce differentiated and application-specific products, including fully depleted silicon-on-insulator (“FD-SOI”) technology offering superior performance and power efficiency compared to bulk CMOS, bipolar CMOS (“Bi-CMOS”) and radio frequency silicon-on-insulator (“RF-SOI”) for mixed-signal and high-frequency applications, as well as a combination of Bipolar, CMOS and DMOS (“BCD”), vertically integrated power (“VIPower”), and intelligent integrated gallium-nitride (STI2GaN) technologies for smart power applications, Power MOSFET, silicon carbide (“SiC”) and gallium-
26
nitride (“GaN”) for high-efficiency systems, Micro-Electro-Mechanical Systems (“MEMS”) technologies for sensors and actuators, embedded memory technologies for our microcontrollers and differentiated optical sensing technologies for our optical sensing solutions. For our 2023 Results of Operations, see “Item 5. Operating and Financial Review and Prospects — Results of Operations — Segment Information”.
Strategy
We have over 50,000 creators and makers of semiconductor technologies mastering the semiconductor supply chain with state-of-the-art manufacturing facilities. As an integrated device manufacturer, we work with more than 200,000 customers and thousands of partners to design and build products, solutions, and ecosystems that address their challenges and opportunities, and the need to support a more sustainable world. Our technologies enable smarter mobility, more efficient power and energy management, and the wide-scale deployment of cloud-connected autonomous things. We are committed to achieving our goal to become carbon neutral on scope 1 and scope 2 and partially on scope 3 by 2027.
Our strategy focuses on long-term value creation for the Company and its affiliated enterprises and takes into account the short-, medium- and longer-term evolution of the markets we serve and the environment and opportunities we see. It stems from key long-term enablers: Smart Mobility, where we provide innovative solutions to help car manufacturers make driving safer, greener and more connected; Power & Energy: our technology and solutions enable industries to increase energy efficiency and support the use of renewable energy and cloud-connected autonomous things; which transform our lives and the objects we use with smart, connected devices for personal, business and industrial applications.
We are focused on application areas which are expected to experience solid growth rates driven by broad, long-term trends in electronic systems. These trends require enablers such as autonomous systems, robotics, securely connected machines and personal devices, digitalization and electrification of automobiles and infrastructure, advanced communications equipment and networks and more power efficient systems. These enablers drive in turn the demand for the electronic components we develop and manufacture.
Product Information
Semiconductors are electronic components that serve as the building blocks inside electronic systems and equipment. Semiconductors, generally known as “chips” combine multiple transistors on a single piece of material to form a complete electronic circuit. With our portfolio of semiconductor products, we serve customers across the spectrum of electronics applications with innovative solutions.
We have a portfolio of power products and analog products, including sensors, signal channel devices and output power stages - discrete and/or integrated - as well as complete power management blocks. Our analog products, including both general purpose and application specific, can fulfill the needs of a wide range of designs and systems.
We also have digital products that are at the heart of electronics systems, including microcontrollers and microprocessors, ASICs and optical sensing solutions. Our full set of microcontrollers and microprocessors includes one of the industry’s broadest ranges of general-purpose devices serving all market segments, microprocessors addressing the industrial market, secure microcontrollers for mobile devices, wearables, banking, identification, industrial, automotive and Internet of Things (“IoT”) markets and a series of embedded processing solutions for our strategic end-markets (automotive, industrial, personal electronics and communications equipment, computers and peripherals).
We are one of the leading suppliers and innovators in the domain of semiconductor devices dedicated to automotive applications. We have a portfolio spanning complex power train, audio and infotainment devices and body and convenience dedicated and standard functions as well as a broad offering of components for advanced driver assistance systems (“ADAS”), dedicated automotive microcontrollers, MEMS automotive sensors and power drivers, including SiC and GaN devices for hybrid and electric cars. The products designed and manufactured specifically for automotive applications are complemented by a large range of “automotive grade” standard products, both tested and guaranteed to perform under stringent automotive environmental conditions.
On top of the product design R&D spending, our principal investment and resource allocation decisions in the semiconductor business area are for expenditures on technology R&D as well as capital investments in
27
front-end and back-end manufacturing facilities, which are planned at the corporate level; therefore, our product groups share common R&D for process technology and manufacturing capacity for some of their products.
As of December 31, 2023, our reportable segments were as follows:
•Automotive and Discrete Group (“ADG”), comprised of dedicated automotive integrated circuits (“ICs”), and discrete and power transistor products.
•Analog, MEMS and Sensors Group (“AMS”), comprised of analog, smart power, MEMS sensors and actuators, and optical sensing solutions.
•Microcontrollers and Digital ICs Group (“MDG”), comprised of general-purpose microcontrollers and microprocessors, connected security products (e.g. embedded secured elements and NFC readers), memories (e.g. serial and page EEPROM) and RF and Communications products.
In the first quarter of 2024, we announced that we are re-organizing our product groups and reportable segments to further accelerate our time-to-market and speed of product development innovation and efficiency. Effective as of February 5, 2024, we have moved from three product groups and three reportable segments (ADG, AMS and MDG), to two product groups and four reportable segments (the “Product Group Reorganization”), as follows:
•Analog, Power & Discrete, MEMS and Sensors, led by Marco Cassis, ST President and member of the Executive Committee, including two reportable segments (Analog Products, MEMS and Sensors and Power and Discrete Products; and
•Microcontrollers, Digital ICs and RF products, led by Remi El-Ouazzane, ST President and member of the Executive Committee, including two reportable segments (Microcontrollers, and Digital ICs and RF Products.
Below is a description of our main categories of products as of December 31, 2023.
Automotive and Discrete Group (ADG)
Dedicated Automotive ICs
We are a top automotive semiconductor vendor supplying innovative solutions to the automotive industry worldwide. We combine an unparalleled platform of advanced technologies with an unswerving commitment to quality, and a thorough understanding of the automotive market gained through close collaboration with leading customers. Our automotive-solutions portfolio is enabling the electrification and digitalization of the car and covers all key application areas including Powertrain, Chassis, Safety and Security, including ADAS, Body Electronics, Telematics & Infotainment and Connectivity.
For Powertrain, we provide silicon solutions for the full range of engine-management systems: from motorbikes and scooters to the most advanced drive-by-wire solutions. We continue to work closely with major automotive OEMs, as we have for decades, to reduce fuel consumption and CO2 emission via advanced technologies such as Variable Valve Timing and Gasoline Direct Injection and Battery Management for hybrid and full electric cars. Thanks to the cooperation with certain leading car makers, our microcontrollers are currently in the electrical engines of leading hybrid and electric cars. The first automotive microcontrollers to feature multiple Arm® Cortex®-R52 cores with on-chip non-volatile memory for safe, real-time performance, our Stellar microcontrollers provide advanced connectivity and security features to support the transition to service-oriented automotive system architectures.
For chassis applications, we provide a broad range of solutions to increase vehicle-occupant safety, including devices for airbags, anti-lock brakes, traction control, electric power steering and active suspension systems. We are a leading supplier of chips for automotive airbags and anti-lock braking systems, which currently represent the largest portion of automotive safety electronics.
28
We are a leading player in ADAS that help avoid or minimize the severity of traffic accidents. We manufacture leading-edge products for vision and radar (both short range 24 GHz and long range 77 GHz) based systems that assist the driver with capabilities such as lane-departure warning, forward-collision warning, vision/radar fusion and pedestrian detection including specific modular solutions for the mass market. We produce vision based ADAS solutions fully compliant with level 2+ and level 3 autonomous systems and we are prototyping ASICs fully compliant with level 4 autonomous systems. In conjunction with partners, we also produce V2X (vehicle to vehicle and vehicle to infrastructure) connectivity solution, and we are working on solutions to grant full connectivity using multiple channels such as Wi-Fi, radar and GNSS.
Today’s car body electronics involve a myriad of inter-networked electronic systems, from dome and door-zone controls, HVAC (heating, ventilation, and air-conditioning) systems, and seat controls to wiper and lighting controls. The penetration of electronics in the car is increasing, as are the requirements for improved reliability and diagnostic capabilities. We address the concept of the “smart” junction box, which is an intelligent power and switching center for the vehicle that integrates functions and features from exterior and cabin lighting to wipers, with a comprehensive architecture that consists of upgradable hardware and software modules. With our proprietary VIPower silicon technology and thorough application knowledge, we have become a market leader in automotive lighting electronics, offering solutions for both exterior and interior lighting, from incandescent bulbs to LED- or HID-based systems.
Our car infotainment and telematics portfolio includes complete turnkey solutions for digital radio, navigation and telematics, and wireless connectivity in the car. We have leveraged our experience of more than 30 years to lead in digital radio. We produce all of the semiconductor components for car radios — from the tuner through the baseband to multimedia processing and playback. Our car-radio systems are optimized for harsh reception environments and minimized power consumption. Our portfolio of products for navigation also includes a family of System-on-Chip solutions capable of receiving signals from multiple satellite navigation systems to improve user position accuracy and navigation in poor satellite visibility conditions, such as in urban canyons.
Discrete and Power Transistor
Discrete and power transistors families include both power products and protection devices serving our strategic end markets (automotive, industrial, personal electronics and communications equipment, computers and peripherals).
Leading-edge power technologies for both high-voltage and low-voltage applications combined with a full package range and innovative die bonding technologies exemplify our innovation in power transistors. Our portfolio includes silicon MOSFETs ranging from 12 to 1700 V, SiC MOSFETs from 650 to 2200 V featuring the industry’s highest temperature rating of 200°C, IGBTs with breakdown voltages ranging from 300 to 1700 V and a wide range of power bipolar transistors. We are expanding our offering based on wide bandgap materials with a full range of GaN-based power device solutions targeting a wide variety of applications. Our portfolio of protection devices supports all industry requirements for electrical overstress and electrostatic surge protection, lightning surge protection and automotive protection. Our protection devices have passed all certifications, meeting or exceeding international protection standards for electrical hazards on electronics boards found in the demanding automotive, industrial, personal electronics and communications equipment, computers and peripherals.
Analog, MEMS and Sensors Group (AMS)
Analog, Smart Power, Touch Screen Controllers
We develop a broad range of innovative power, smart power and analog ICs, to serve markets such as those relating to smart grid, cloud computing, automation, personal electronics and power conversion. These product families include Industrial ASICs and ASSPs, covering motion control, power and energy management and factory automation, General Purpose Analog Products, which includes high end analog front-end products as well as standard interfaces and Custom Analog ICs, mainly power management ICs for data storage, servers and portable power management devices. In 2023, we further deployed wireless charging solutions and enlarged our offering to cover low to high power products and across personal electronics applications from smartphones to wearables and industrial battery management enabling fast charging applications. We also expanded our
29
presence in the automotive and industrial markets with our Galvanic Isolated Gate Drivers (also known as STGAP Family).
We also develop a comprehensive range of operational amplifiers (both low-voltage and high-voltage), comparators and current-sense amplifiers. In addition to our portfolio of mainstream operational amplifiers and comparators, we offer specific products for healthcare, industrial, and automotive applications, as well as a range of high-performance products specifically designed to meet the strict requirements of the wearable market.
In 2023, we introduced further devices in our MasterGaN® family and the new ViperGaN family, integrating a silicon driver and GaN power transistors in a single package. Our connectivity ICs range from wireline to wireless solutions. We optimize our products for reliability of the communication channel and low power consumption. For wireline communication, we offer a complete family of transceivers compatible with different protocol standards used in the industry (PRIME, Meters and More, IEC 61334-5-1, CAN and others).
Our FingerTip family of Touch Screen Controllers provides true multi-touch capability, supporting unlimited simultaneous touches, and it is optimized for the extreme low power consumption. FingerTip also enhances multi-touch actions such as pinch-to-zoom, supports stylus operations and is compatible with both flat and curved display panel.
MEMS Sensors and Actuators
Our MEMS portfolio includes both Sensors and Actuators. We sell our MEMS products in a broad range of application fields, including smartphones, personal devices, computers, automotive, industrial, healthcare and IoT.
MEMS Sensors include Motion MEMS (accelerometers, gyroscopes, magnetic sensors), Environmental Sensors (pressure, humidity and temperature) and Microphones. We offer a unique sensor portfolio, from discrete to fully-integrated solutions, high performance sensor fusion to improve the accuracy of multi-axis sensor systems in order to enable highly-demanding applications, such as indoor navigation and location-based services, optical image stabilization and high-level quality products. Our latest range of smart sensors includes machine learning and edge AI processing capabilities built into the sensor.
MEMS actuators include: (i) Thermal and Piezoelectric Actuators for 2D and 3D Printing in Consumer, Commercial and Industrial market applications; (ii) Piezoelectric Actuators for applications such as smartphone camera auto focus and MEMS loudspeakers; and (iii) Piezoelectric, Electrostatic and Electromagnetic Actuators for emerging VR/AR applications such as our MEMS ScanAR technology, ultra-low power depth cameras and LIDAR Systems for assisted Smart Driving.
Optical Sensing Solutions
We also have a broad portfolio of optical sensing solutions based on our proprietary differentiated technologies such as FlightSense, addressing various markets, and in particular the fast growing 3D sensing consumer and automotive applications such as in-cabin monitoring and occupant detection. Our optical sensing solutions are composed of both specialized components developed for dedicated customers’ systems; and full optical sense and illumination system solutions targeting multiple customers.
Microcontrollers and Digital ICs Group (MDG)
Microcontrollers & Microprocessors
Our general purpose microcontroller product portfolio largely contains families of products based on 32-bit ARM®-based Cortex®-M0, -M0+, -M3, -M4, and M33 with the ARM® TrustZone®. The STM32U5, for secure & Ultra-Low-Power applications for the mass market, based on the Cortex®-M33 with the ARM® TrustZone® received level 3 Platform Security Architecture and Security Evaluation Standard for IOT Platform security certifications, taking IOT cyber-protection to the next level.
For each product family, a broad selection of features is available with respect to microcontroller performance, ultra-low-power, memory size, peripherals, and packaging. Numerous dedicated families include
30
features such as our TouchGFX advanced 3D graphics, dedicated peripherals for industrial motor controls, security features, and low-power wireless connectivity.
Our microprocessors product line targeting the industrial market is based on 32-bit ARM®-based® Cortex®-A7 Core, complemented by an integrated Cortex®-M4 and a dedicated Linux distribution.
The STM32 family based on the ARM® Cortex®-M and -A processors are designed to offer significant degrees of freedom to microcontroller and microprocessors users. The product range combines very high performance, real-time capabilities, digital signal processing, and low-power, low-voltage operation, while maintaining full integration and ease of development. We offer an unparalleled range of STM32 devices, accompanied by a vast choice of tools and software including support for Industrial Safety Standard IEC 61508 SIL2/3, Human Machine Interface. Our dedicated STM32 Cube-AI toolbox for Artificial Intelligence includes Machine learning and neural networks. This comprehensive portfolio makes our STM32 an ideal choice for enabling ever smarter objects for an increasingly broad range of applications.
In 2023, we continued to strengthen our STM32 microcontroller ecosystem with various releases and updates of STM32Cube, STM32Cube.AI, NanoEdge AI Studio, CubeMX, TouchGFX and MCU Edge-AI Developer Cloud. Together with Microsoft, we developed a highly secure Azure IoT cloud reference implementation embedding the STM32U5, Microsoft Azure RTOS and the STSAFE-A110 secure element. Together with Amazon Web Services, we also developed a new secure AWS FreeRTOS-qualified reference implementation embedding the STM32U5 and the STSAFE-A110 secure element.
Secure Microcontrollers
We offer leading products for secure applications in traditional smartcard applications and embedded security applications. Throughout our 30+ year presence in the smartcard security industry, we have supplied the market’s most advanced technologies and solutions, with a continuous focus on innovation and the highest levels of security certification. Our expertise in security is key to our leadership in the mobile communications, banking, digital identity, IoT security, pay-TV and transport fields. We are the leading supplier for the Embedded SIM market and we are scaling-up in secure mobile transactions using Near Field Communication (“NFC”) for mobile phones, trusted computing, brand protection and security for IoT devices. Our secure microcontroller product portfolio offers compliance with the latest security standards up to Common Criteria EAL6+, ICAO, and TCG1.2. Our secure microcontrollers cover a complete range of interfaces for both contact and contactless communication, including ISO 7816, ISO 14443 Type A & B, NFC, USB, SPI and I²C.
Our secure-microcontroller platforms rely on a highly secure architecture combined with leading-edge CPUs, such as ARM®’s SC300 and SC000, and our proprietary advanced embedded non-volatile memory technologies such as 40 nm embedded Flash and 80 nm embedded EEPROM technologies.
Memories
Our wide range of small density serial non-volatile memories has among the highest industry performance. The serial EEPROM family ranges from 1 Kbit to 32 Mbits and offers the most common serial interfaces to facilitate adoption: I²C, SPI and Microwire. Our wide range of products are also automotive compliant. Very small package options are available for applications where space is critical, such as in camera modules for consumer and mobile devices.
We offer RF memory and transceiver products that are key for logistic and retail applications and are based on the industry standard for short range High-Frequency RFID ISO 14443 and 15693. The products are compatible with all NFC technology standards, as defined by the NFC Forum, where ST plays a key role, including the latest NFC type 5. We offer one of the most comprehensive portfolios, which includes NFC/RFID readers, Dynamic NFC/RFID tags, also known as Dual Interface NFC/RFID tags, and Standalone NFC/RFID tags. We also offer RFID Readers operating in the UHF bands for longer range logistics operation.
RF Communications and ASICs
We offer RF, digital and mixed-signal ASICs, which are based on our proprietary FD-SOI, RF-SOI, and SiGe technologies, as well as foundry-based FinFET technologies, for satellite communications (satellites, ground stations, user antennas and terminals) as well as networking infrastructure.
31
We also use our proprietary FD-SOI, RF-SOI, and SiGe technologies to provide RF and mmWave components, based on our know-how in analog and digital beamforming design techniques, to address Massive MIMO Antenna Architectures.
Our unique combination of differentiated Silicon technologies and design expertise is particularly pertinent to address the markets for satellite constellations and user terminals, 5G infrastructure RF Front-End, and transceivers for very-short-range ultra-low-power 60 GHz multi-Gigabit/second links.
Alliances with Customers and Industry Partnerships
We believe that customer alliances and industry partnerships are critical to our success in the semiconductor market. Customer alliances provide us with valuable systems and application know-how and access to markets for key products, while enabling our customers to gain access to our technologies and manufacturing infrastructure. We are actively working to expand the number of our customer alliances, targeting key global OEMs as well as emerging, innovative customers and partners around the globe.
From time to time we collaborate with other semiconductor industry companies, research organizations, universities, customers, experts and suppliers to further our R&D efforts. Such collaboration provides us with a number of important benefits, including acquisition of technical know-how, access to additional production capacities, sharing of costs and reductions in our own capital requirements.
Customers and Applications
We design, develop, manufacture and market thousands of products which we sell to over 200,000 customers. We emphasize a broad and balanced product portfolio, in the applications and regional markets we serve, which helps foster closer, strategic relationships with customers. Our major customers include Apple, Bosch, Continental, HP, Huawei, Hyundai Motor, Mobileye, Samsung, SpaceX and Tesla. This broad product breadth provides opportunities to enable application solutions and to supply such customers’ requirements for all their product and technology needs. We also sell our products through our distribution channel.
In Automotive, we have identified a significant evolution of the relationship with customers. Historically, semiconductor companies addressed the needs of carmakers mostly through tier-1 and/or tier-2 automotive industry suppliers with whom we work closely. In recent years there has been an accelerated transformation of the automotive industry driven by the electrification and the digitalization of vehicles, significantly increasing the amount and complexity of semiconductor products in vehicles. As a result, and following further from the supply chain challenges which arose during and after the COVID-19 pandemic, carmakers are taking a more direct role in the decision making and control of both the semiconductor strategy and supply for their vehicles. Carmakers now have a more direct relationship with companies such as ours, notably playing a more active role in defining the specific solutions they require, as well as in certain instances engaging in direct co-operation agreements, including multi-year agreements to secure capacity corridors. We are committed to playing a major role in these new business models and we see multiple opportunities for co-operation with carmakers in this area, while also continuing to build on our co-operation with tier-1 and tier-2 automotive industry suppliers.
Sales, Marketing and Distribution
Our sales and marketing is organized by a combination of regional and key account coverage with the primary objective of accelerating sales growth and gaining market share. Emphasis is placed on strengthening the development of our global and major local accounts; boosting demand creation through an enhanced focus on geographical and key account coverage with strong technical and application expertise, supported in the mass market by our distribution channel and local initiatives; and establishing regional sales and marketing teams that are fully aligned with our strategic end-markets: automotive, industrial, personal electronics and communications equipment, computers and peripherals.
We have four regional sales organizations reporting to a global head of Sales & Marketing: Americas, APeC (Asia Pacific excluding China), China and EMEA (Europe, Middle-East and Africa). Our regional sales organizations have a similar structure to enhance global coordination and go-to-market activities. The sales and marketing teams are strongly focused on profitable revenue growth and business performance as well as on fostering demand creation, expanding the customer base, maximizing market share, developing new product-
32
roadmaps and providing the best technical and application support in the field for our customers. The sales and marketing activities are supported by sales engineers, system marketing, product marketing, application labs, competence centers, field application engineers and quality engineers.
In the first quarter of 2024, we announced that we will complement the existing Sales & Marketing organization by implementing a new application-specific marketing organization by segment, offering customers end-to-end system solutions based on our product and technology portfolio, covering the following four end markets:
•Automotive;
•Industrial Power and Energy;
•Industrial Automation, IoT and AI; and
•Personal Electronics, Communication Equipment and Computer Peripherals.
The current regional Sales & Marketing organization will remain unchanged.
We engage distributors and sales representatives to distribute and promote our products around the world. Typically, distributors handle a wide variety of products, including those that compete with ours. Our distributors have a dual role, in that they assist in fulfilling the demand of our customers by servicing their orders, while also supporting the creation of product demand and business development. Most of our sales to distributors are made under specific agreements allowing for price protection and stock rotation for unsold merchandise. Sales representatives, on the other hand, generally do not offer products that compete directly with our products, but may carry complementary items manufactured by others.
At the request of certain customers, we also sell and deliver our products to electronics manufacturing services (“EMS”) companies, which, on a contractual basis with our customers, incorporate our products into the application specific products they manufacture for our customers. We also sell products to original design manufacturers (“ODM”). ODMs manufacture products for our customers much like EMS companies do, but they also design applications for our customers, and in doing so themselves select the products and suppliers that they wish to purchase from. In furtherance of our strong commitment to quality, our sales organizations include personnel dedicated to close monitoring and resolution of quality-related issues. For a breakdown of net revenues by segment and geographic region for the last three fiscal years, see “Item 5. Operating and Financial Review and Prospects”.
Research and Development
We believe that market driven R&D based on leading-edge products and technologies is critical to our success. We devote significant effort to R&D because we believe such investment can be leveraged into competitive advantages: about 18% of our employees work in R&D on product design/development and technology and, in 2023, we spent approximately 12.2% of our net revenues on R&D.
New developments in semiconductor technology can make end products significantly cheaper, smaller, faster, more reliable and embedded than their predecessors, with differentiated functionalities. They can enable significant value creation opportunities with their timely appearance on the market. Our innovations in semiconductor technology as well as in hardware and software contribute to the creation of successful products that generate value for us and our customers. Our complete design platforms, including a large selection of IP and silicon-proven models and design rules, enable the fast development of products designed to meet customer expectations in terms of reliability, quality, competitiveness in price and time-to-market. Through our R&D efforts, we contribute to making our customers’ products more efficient, more appealing, more reliable and safer.
Our technology R&D strategy is based on the development of differentiated technologies, allowing for a unique offer in terms of new products and enabling new applications opportunities. We draw on a rich pool of chip fabrication technologies, including advanced CMOS, FD-SOI, RF-SOI, optical sensing, embedded non-volatile memories, mixed-signal, analog, MEMS, smart power, SiC and GaN processes. This is well embedded in our strong packaging technologies portfolio such as high pin count BGA, wafer level packaging, highly integrated sensor packages and leadframe package power products. We combine both front-end and back-end manufacturing and technology R&D under the same organization to ensure a smooth flow of information
33
between our R&D and manufacturing organizations. We leverage significant synergies and shared activities between our product groups to cross-fertilize them. We also use silicon foundries, especially for advanced CMOS beyond the 18 nm node that we do not plan to manufacture nor develop internally.
We have advanced R&D and innovation centers which offer us a significant advantage in quickly and cost effectively introducing products. Furthermore, we have established a strong culture of partnerships and through the years have created a network of strategic collaborations with key customers, suppliers, competitors, and leading universities and research institutes around the world. See “Item 4. Information on the Company — Alliances with Customers and Industry Partnerships”. We also play leadership roles in numerous projects running under the European Union’s IST (Information Society Technologies) programs. We also participate in certain R&D programs established by the EU, individual countries and local authorities in Europe (primarily in France and Italy). See “Item 4. Information on the Company — Public Funding”.
The total amount of our R&D expenses in the past three fiscal years was $2,100 million, $1,901 million and $1,723 million in 2023, 2022 and 2021, respectively. For more information on our R&D expenses, see “Item 5. Operating and Financial Review and Prospects — Results of Operations — Research and Development Expenses”.
34
Property, Plants and Equipment
We are an integrated device manufacturer with the ability to control and optimize the value chain, from semiconductor process development, chip design, testing and validation, wafer fabrication, to assembly, testing, and delivery to our customers. At our Company, manufacturing is based on our owned and operated facilities in EMEA and in Asia, complemented by outsourcing in both front-end and back-end processes. This enables us to provide customers with an independent, flexible and robust manufacturing and supply chain, which aids in our success. In addition, our proprietary semiconductor process technologies highlighted above enable product differentiation. We believe that the combination of these two aspects represent a differentiating factor for our Company as compared to fabless semiconductor companies and semiconductor foundries.
We currently operate 14 main manufacturing sites around the world. The table below sets forth certain information with respect to our current manufacturing facilities, products and technologies. Front-end manufacturing facilities are fabs and back-end facilities are assembly, packaging and final testing plants.
35
Location(1) | Products | Technologies | ||||||||||||
| Front-end facilities | ||||||||||||||
Agrate, Italy(2) | Application-specific, MEMS, Smart Power and analog ICs | Fab 1: 200mm, BCD and MEMS Fab 2: 200mm, advanced BCD and Integrated GaN Power ICs Fab 3: 300mm, Analog CMOS, BCD, and embedded non-volatile memories | ||||||||||||
Ang Mo Kio, Singapore | Application-specific, analog, commodity, MEMS, microcontrollers, non-volatile memories and power transistors | Fab 1: 150mm, BCD, Bi-CMOS, Bipolar, CMOS logic, EEPROM, MEMS, Microfluidics, Power metal-on silicon oxide semiconductor process technology (“MOS”) and SiC power devices Fab 2: 200mm, advanced BCD, BCD, EEPROM, embedded non-volatile memories, Power MOS and VIPpowerTM | ||||||||||||
Catania, Italy(3) | Application-specific, power transistors and Smart Power and analog ICs | Fab 1: 150mm, SiC power devices and RF GaN Fab 2: 200mm, advanced BCD, Power MOS, SiC power devices and VIPpowerTM | ||||||||||||
Crolles, France(4) | Application-specific, optical sensors, leading edge logic and non-volatile memories and microcontrollers | Fab 1: 200mm, Analog/RF, CMOS, Bi-CMOS and Optical Sensing Fab 2: 300mm, Analog/RF, Bi-CMOS, Bulk CMOS, embedded non-volatile memories, FD-SOI advanced CMOS and Optical Sensing | ||||||||||||
| Norrköping, Sweden | Industrialization, Research and development and SiC substrate | SiC 150mm and 200mm wafers; N+ doped and Semi Insulated | ||||||||||||
| Rousset, France | Application-specific and Standard and secure microcontrollers | Fab: 200mm, Analog/RF, BiCMOS EEPROM, embedded non-volatile memories and CMOS | ||||||||||||
| Tours, France | ASDTM power transistors, diodes, IPADTM and Protection thyristors | Fab 1: 150mm, Power Schottky diodes and Triacs Fab 2: 200mm IPD, Power GaN and rectifiers | ||||||||||||
| Back-end facilities | ||||||||||||||
| Bouskoura, Morocco | Discrete and standard, micro modules, power and power module, RF and subsystems | Micromodules, Power, Power Automotive and SOIC | ||||||||||||
| Calamba, Philippines | Application-specific and standard, MEMS | Ball and Land Grid Array, Optical Sensors Module, Micromodules and QFN | ||||||||||||
| Kirkop, Malta | Application-specific, MEMS, microcontrollers | Ball and Land Grid Array, FC Ball Grid Array and QFP | ||||||||||||
| Marcianise, Italy | Secure microcontrollers and smartcards | Reel-to-reel secure device provisioning and smartcards and issuance technology | ||||||||||||
| Muar, Malaysia | Application-specific and standard, microcontrollers | Ball Grid Array, Power Automotive, QFP and SOIC | ||||||||||||
| Rennes, France | Application specific | Rad-hard technologies | ||||||||||||
Shenzhen, China(5) | Application-specific and standard, discrete, Non-volatile memories, optical packages, power and power module | Optical Sensors, Power, Power Automotive, Power Modules and SOIC | ||||||||||||
_______________
(1) This table does not include the new 200mm silicon carbide device manufacturing joint venture with Sanan Optoelectronics in Chongqing, China, which we are currently building as we announced on June 7 2023. See “Item 5. Operating and Financial Review and Prospects - Financial outlook: Capital Investment” and Notes 7, 10 and 12 of the Consolidated Financial Statements.
(2) Fab 3 is currently shared between the Company and Tower Semiconductor.
(3) We are currently building a new integrated Silicon Carbide (SiC) substrate manufacturing facility for the production in volume of 200mm SiC epitaxial substrates, to support the increasing demand from our customers for SiC devices across automotive and industrial applications. Certain operations have also started in December 2023. The investment of €730 million over five years will benefit from a financial support of up to €292.5 million through the Italian Recovery and Resilience Plan.
(4) We are in the process of building a new, jointly-operated 300mm semiconductor manufacturing facility with GlobalFoundries Inc, following the approval received from the European Commission. This project represents an overall projected cost of €7.5 billion of capital expenditure, maintenance and ancillary costs and will benefit from significant financial support of up to roughly €2.9 billion from the State of France in line with the objectives set out in the European Chips Act.
36
(5) Jointly owned with SHIC, a subsidiary of Shenzhen Electronics Group.
At December 31, 2023, our front-end facilities had a total maximum capacity of approximately 140,000 wafer starts per week (200mm equivalent). The number of wafer starts per week varies from facility to facility and from period to period as a result of changes in product mix.
We own all of our manufacturing facilities, but certain facilities (Muar, Malaysia; Shenzhen, China; Kirkop, Malta; and Toa Payoh and Ang Mo Kio, Singapore) are built on land subject to long-term leases.
We have historically subcontracted a portion of total manufacturing volumes to external suppliers. In 2023, we subcontracted approximately 20% of the value of our total silicon production to external foundries. Our plan is to continue sourcing silicon from external foundries to give us flexibility in supporting our growth.
At December 31, 2023, we had approximately $1,899 million in outstanding orders for purchases of equipment (certain of which are subject to cancellation or amendment in accordance with their terms) and other assets for delivery in 2024. In 2023, our capital expenditure payments, net of proceeds from sales, capital grants and other contributions, was $4,111 million compared to $3,524 million in 2022. In the 2021-2023 period the ratio of capital expenditure payments, net of proceeds from sales, capital grants and other contributions to net revenues was about 20%. For more information, see “Item 5. Operating and Financial Review and Prospects — Financial Outlook: Capital Investment”.
Intellectual Property (IP)
Our success depends in part on our ability to obtain patents, licenses and other IP rights to protect our proprietary technologies and processes. IP rights that apply to our various products include patents, copyrights, trade secrets, trademarks and mask work rights. We currently own approximately 20,000 patents and pending patent applications.
We believe that our IP represents valuable assets. We rely on various intellectual property laws, confidentiality procedures and contractual provisions to protect our IP assets and enforce our IP rights. To optimize the value of our IP assets, we have engaged in licensing our design technology and other IP, including patents, when consistent with our competitive position and our customers’ interests. We have also entered into broad-scope cross-licenses and other agreements which enable us to design, manufacture and sell semiconductor products using the IP rights of third parties and/or operating within the scope of IP rights owned by third parties.
From time to time, we are involved in IP litigation and infringement claims. See Note 25 to our Consolidated Financial Statements and “Item 3. Key Information — Risk Factors”. Regardless of the validity or the successful assertion of such claims, we may incur significant costs with respect to the defense thereof, which could have a material adverse effect on our results of operations, cash flow or financial condition.
Backlog
Our sales are made primarily pursuant to standard purchase orders that are generally booked from one to twelve months in advance of delivery. Quantities actually purchased by customers, as well as prices, are subject to variations between booking and delivery and, in some cases, to cancellation due to changes in customer needs or industry conditions. During periods of economic slowdown and/or industry overcapacity and/or declining selling prices, customer orders are not generally made far in advance of the scheduled shipment date. Such reduced lead time can diminish management’s ability to forecast production levels and revenues. When the economy rebounds, our customers may strongly increase their demands, which can result in capacity constraints due to a time lag when matching manufacturing capacity with such demand.
In addition, our sales are affected by seasonality, with the first quarter generally showing lowest revenue levels in the year, and the third or fourth quarter historically generating higher amounts of revenues partly as a result of the seasonal dynamics for smartphone applications dynamics.
We also sell certain products to key customers pursuant to frame contracts. Frame contracts are annual contracts with customers setting forth quantities and prices on specific products that may be ordered in the future. These contracts allow us to schedule production capacity in advance and allow customers to manage their inventory levels consistent with just-in-time principles while shortening the cycle times required to produce
37
ordered products. Orders under frame contracts are also subject to a high degree of volatility, because they reflect expected market conditions which may or may not materialize. Thus, they are subject to risks of price reduction, order cancellation and modifications as to quantities actually ordered resulting in inventory build-ups.
Furthermore, developing industry trends, including customers’ use of outsourcing and their deployment of new and revised supply chain models, may reduce our ability to forecast changes in customer demand and may increase our financial requirements in terms of capital expenditures and inventory levels.
We entered 2023 with a backlog higher than we had entering 2022. For 2024, we entered the year with a backlog lower than what we had entering 2023.
Competition
Markets for our products are intensely competitive. We compete with major international semiconductor companies and while only a few companies compete with us in all of our product lines, we face significant competition from each of them. Smaller niche companies are also increasing their participation in the semiconductor market, and semiconductor foundry companies have expanded significantly, particularly in Asia. Competitors include manufacturers of standard semiconductors, ASICs and fully customized ICs, including both chip and board-level products, as well as customers who develop their own IC products and foundry operations. Some of our competitors are also our customers or suppliers. We compete in different product lines to various degrees on the basis of price, technical performance, product features, product system compatibility, customized design, availability, quality and sales and technical support. In particular, standard products may involve greater risk of competitive pricing, inventory imbalances and severe market fluctuations than differentiated products. Our ability to compete successfully depends on factors both within and outside our control, including successful and timely development of new products and manufacturing processes, product performance and quality, manufacturing yields and product availability, customer service, pricing, industry trends and general economic trends.
The semiconductor industry is characterized by the high costs associated with developing marketable products and manufacturing technologies as well as high levels of investment in production capabilities. As a result, the semiconductor industry has experienced, and is expected to continue to experience, significant vertical and horizontal consolidation among our suppliers, competitors and customers, which could lead to erosion of our market share, impact our capacity to compete and require us to restructure our operations. See “Item 3. Key Information — Risk Factors”.
Organizational Structure and History
We are organized in a matrix structure with geographic regions interacting with product lines, both supported by shared technology and manufacturing operations and by central functions, designed to enable us to be closer to our customers and to facilitate communication among the R&D, production, marketing and sales organizations.
While STMicroelectronics N.V. is the parent company, we conduct our global business through STMicroelectronics International N.V. and also conduct our operations through service activities from our subsidiaries. We provide certain administrative, human resources, legal, treasury, strategy, manufacturing, marketing, insurance and other overhead services to our consolidated subsidiaries pursuant to service agreements for which we recover the cost.
The following table lists our consolidated subsidiaries and our percentage of ownership as of December 31, 2023:
| Legal Seat | Name | Percentage of Ownership (direct or indirect) | ||||||
| Australia, Sydney | STMicroelectronics PTY Ltd | 100 | ||||||
| Austria, Vienna | STMicroelectronics Austria GmbH | 100 | ||||||
| Belgium, Diegem | Proton World International N.V. | 100 | ||||||
| Brazil, Sao Paulo | STMicroelectronics Ltda | 100 | ||||||
38
| Canada, Ottawa | STMicroelectronics (Canada), Inc. | 100 | ||||||
| China, Beijing | STMicroelectronics (Beijing) R&D Co. Ltd | 100 | ||||||
China, Chongqing(1) | SANAN, STMicroelectronics Co., Ltd. | 49 | ||||||
| China, Shanghai | STMicroelectronics (China) Investment Co. Ltd | 100 | ||||||
| China, Shenzhen | Shenzhen STS Microelectronics Co. Ltd | 60 | ||||||
| China, Shenzhen | STMicroelectronics (Shenzhen) R&D Co. Ltd | 100 | ||||||
| Czech Republic, Prague | STMicroelectronics Design and Application s.r.o. | 100 | ||||||
| Denmark, Aarhus | STMicroelectronics A/S | 100 | ||||||
| Egypt, Cairo | STMicroelectronics Egypt SSC | 100 | ||||||
| Finland, Nummela | STMicroelectronics Finland OY | 100 | ||||||
| France, Crolles | STMicroelectronics (Crolles 2) SAS | 100 | ||||||
| France, Grenoble | STMicroelectronics (Alps) SAS | 100 | ||||||
| France, Grenoble | STMicroelectronics (Grenoble 2) SAS | 100 | ||||||
| France, Le Mans | STMicroelectronics (Grand Ouest) SAS | 100 | ||||||
| France, Montrouge | STMicroelectronics France SAS. | 100 | ||||||
| France, Rousset | STMicroelectronics (Rousset) SAS | 100 | ||||||
| France, Tours | STMicroelectronics (Tours) SAS | 100 | ||||||
| Germany, Aschheim-Dornach | STMicroelectronics GmbH | 100 | ||||||
| Germany, Aschheim-Dornach | STMicroelectronics Application GmbH | 100 | ||||||
| Hong Kong, Kowloon | STMicroelectronics Ltd | 100 | ||||||
| India, New Delhi | ST-Ericsson India Pvt Ltd | 100 | ||||||
| India, Noida | STMicroelectronics Pvt Ltd | 100 | ||||||
| Israel, Netanya | STMicroelectronics Limited | 100 | ||||||
| Italy, Agrate Brianza | STMicroelectronics S.r.l. | 100 | ||||||
| Italy, Naples | STMicroelectronics Services S.r.l. | 100 | ||||||
| Japan, Tokyo | STMicroelectronics KK | 100 | ||||||
| Malaysia, Kuala Lumpur | STMicroelectronics Marketing SDN BHD | 100 | ||||||
| Malaysia, Muar | STMicroelectronics SDN BHD | 100 | ||||||
| Malaysia, Muar | STMicroelectronics Services Sdn.Bhd. | 100 | ||||||
| Malta, Kirkop | STMicroelectronics (Malta) Ltd | 100 | ||||||
| Mexico, Guadalajara | STMicroelectronics Marketing, S. de R.L. de C.V. | 100 | ||||||
| Morocco, Casablanca | STMicroelectronics (MAROC) SAS, a associé unique | 100 | ||||||
| The Netherlands, Amsterdam | STMicroelectronics Finance B.V. | 100 | ||||||
| The Netherlands, Amsterdam | STMicroelectronics Finance II N.V. | 100 | ||||||
| The Netherlands, Amsterdam | STMicroelectronics International N.V. | 100 | ||||||
| Philippines, Calamba | STMicroelectronics, Inc. | 100 | ||||||
| Philippines, Calamba | Mountain Drive Property, Inc. | 40 | ||||||
| Singapore, Ang Mo Kio | STMicroelectronics Asia Pacific Pte Ltd | 100 | ||||||
| Singapore, Ang Mo Kio | STMicroelectronics Pte Ltd | 100 | ||||||
| Slovenia, Ljubljana | STMicroelectronics d.o.o. | 100 | ||||||
| Spain, Barcelona | STMicroelectronics Iberia S.A. | 100 | ||||||
| Sweden, Jönköping | STMicroelectronics Software AB | 100 | ||||||
| Sweden, Kista | STMicroelectronics A.B. | 100 | ||||||
| Sweden, Norrköping | STMicroelectronics Silicon Carbide A.B. | 100 | ||||||
| Switzerland, Geneva | STMicroelectronics S.A. | 100 | ||||||
| Switzerland, Geneva | STMicroelectronics Re S.A. | 100 | ||||||
| Taiwan, Taipei City | Exagan Taiwan Ltd. | 100 | ||||||
| Thailand, Bangkok | STMicroelectronics (Thailand) Ltd | 100 | ||||||
| United Kingdom, Bristol | STMicroelectronics (Research & Development) Limited | 100 | ||||||
| United Kingdom, Marlow | STMicroelectronics Limited | 100 | ||||||
| United States, Coppell | STMicroelectronics Inc. | 100 | ||||||
| United States, Coppell | STMicroelectronics (North America) Holding, Inc. | 100 | ||||||
(1) SANAN, STMicroelectronics Co., Ltd. has been identified as a variable interest entity for which the Company is the primary beneficiary, and is consequently fully consolidated.
39
Public Funding
We receive public funding mainly from EU member states (including France, Italy and Malta). Such funding is generally provided to encourage R&D activities, enhance building capacities, industrialization and national, regional and local economic development. On September 21, 2023, the European Chips Act entered into force. The regulation, mobilizing more than €43 billion of public and private investments, is designed to bolster Europe’s competitiveness and resilience in semiconductor technologies and applications, help achieve both the digital and green transition and has, amongst others, the objective of supporting technological capacity building and innovation in the European Union by bridging the gap between the European Union's advanced research and innovation capabilities and their industrial exploitation.
Public funding in Europe is also generally available to all companies having R&D operations in Europe, regardless of their ownership structure or country of incorporation. The conditions for the receipt of government funding may include eligibility restrictions, approval by EU authorities, annual budget appropriations, compliance with EU regulations, royalties or contingent return provisions as well as specifications regarding objectives and results. The approval process for such funding may last up to several years. Certain specific contracts require compliance with extensive regulatory requirements and set forth certain conditions relating to the funded programs. There could be penalties if these objectives are not fulfilled. Other contracts contain penalties for late deliveries or for breach of contract, which may result in repayment obligations.
Further, some grants may be subject to a financial return based on future cumulative sales over a certain period. Our funding programs are classified under four general categories: funding for Research and Development (R&D), Innovation activities (RDI), funding for First Industrial Deployment activities (FID) and capital investment for pilot lines. We also benefit from tax credits for R&D activities in several countries which are generally available to all companies. See “Item 5. Operating and Financial Review and Prospects — Results of Operations” and the Notes to our Consolidated Financial Statements.
The main programs in which we are involved include: (i) Important Project of Common European Interest (IPCEI) which combines Research, Development and Innovation activities (RDI) as well as First Industrials Deployment activities (FID); (ii) Key Digital Technologies Initiative (KDT), formerly Electronic Components and Systems for European Leadership (ECSEL), which combines all electronics related R&D activities and is operated by joint undertakings formed by the European Union, certain member states and industry; (iii) EU R&D projects within Horizon Europe (the European Union's research and innovation framework); and (iv) national or regional programs for R&D and for industrialization in the electronics industries involving many companies and laboratories. The pan-European programs cover a period of several years, while national or regional programs in France and Italy are subject mostly to annual budget appropriation.
In December 2018, the European Commission announced the approval of the IPCEI, a Pan-European project initiated to foster research and innovation in microelectronics to be funded by Germany, France, Italy, the U.K. and Austria.
In our combined role as beneficiary of the IPCEI on Microelectronics, we have been allocated an overall funding budget of €340 million for the period 2018-2022 in France (locally referenced as Nano2022) which was linked to technical objectives and associated achievements, and approximately €720 million for the period 2018-2024 in Italy. The IPCEI program is highly strengthening our leadership in key technologies. It contributes to anticipating, accelerating, and securing our technological developments. The IPCEI also has wide ranging, pan-European benefits on the microelectronics ecosystem from education to downstream industries.
In December 2021, we submitted a new IPCEI program, titled IPCEI on Microelectronics and Communication Technologies (IPCEI – ME/CT). This new pan-European project was initiated to foster research and innovation and kick-start the first industrialization of microelectronics. This new IPCEI involves ST in France (2022-2026), Italy (2023-2027) and Malta (2021-2025), as well as around 65 other companies across 16 European countries. In 2023 we recognized grants of €135 million related to our participation in IPCEI in Italy, €120 million related to our participation in IPCEI, KDT and other national and European programs in France and $9 million related to our participation in IPCEI in Malta.
In addition to public funding through IPCEI programs, in October 2022, the European Commission approved, under EU State Aid Rules, a support up to €292.5 million through the Italian Recovery and Resilience Plan for the construction of a new integrated silicon carbide substrate manufacturing facility in Catania, Italy.
40
On April 28, 2023, the European Commission approved, under EU State Aid Rules, a French aid measure to support the Company and GlobalFoundries in the construction and operation of a front-end semiconductor production facility in Crolles, France. This project represents an overall projected cost of €7.5 billion for capital expenditure, maintenance and ancillary costs. The new facility will benefit from significant financial support of up to roughly €2.9 billion from France. These projects have been recognized as “first-of-a-kind” facilities in Europe in line with the ambitions and objectives of the European Chips Act.
For more information on our Public Funding, see Note 7 to our Consolidated Financial Statements.
Suppliers
We use three primary critical types of suppliers in our business: (i) equipment suppliers, (ii) material suppliers and (iii) external silicon foundries and back-end subcontractors. We also purchase third-party licensed technology from a limited number of providers.
In the front-end process, we use steppers, scanners, tracking equipment, strippers, chemo-mechanical polishing equipment, cleaners, inspection equipment, etchers, physical and chemical vapor-deposition equipment, implanters, furnaces, testers, probers and other specialized equipment. The manufacturing tools that we use in the back-end process include bonders, burn-in ovens, testers and other specialized equipment. The quality and technology of equipment used in the IC manufacturing process defines the limits of our technology. Demand for increasingly smaller chip structures means that semiconductor producers must quickly incorporate the latest advances in process technology to remain competitive. Advances in process technology cannot occur without commensurate advances in equipment technology, and equipment costs tend to increase as the equipment becomes more sophisticated.
Our manufacturing processes consume significant amounts of energy and use many materials, including silicon and SiC, GaN and glass wafers, lead frames, mold compound, ceramic packages and chemicals, gases and water. The prices of energy, such as electricity and natural gas, and many of these materials are volatile due to the specificity of the market, and other factors including geopolitics. We have therefore adopted a “multiple sourcing strategy” designed to protect us from the risk of price increases. The same strategy applies to energy and to supplies for the materials used by us to avoid potential material disruption of essential materials and to ensure the continuity of energy supply. Our “multiple sourcing strategy”, our financial risk monitoring as well as the robustness of our supply chain and strong partnership with suppliers are intended to mitigate these risks. See “Item 3. Key Information — Risk Factors”.
Finally, we also use external subcontractors to outsource wafer manufacturing and assembly and testing of finished products. See “— Property, Plants and Equipment” above.
Environmental, Health and Safety Matters
We adopt a rigorous and pro-active approach to managing our business operations in an environmentally responsible way and are subject to a variety of environmental, health and safety laws and regulations in the jurisdictions where we operate. Such laws and regulations govern, among other things, the use, storage, discharge and disposal of chemicals and other hazardous substances, emissions and waste, as well as the investigation and remediation of soil and ground water contamination. We are also required to obtain environmental permits, licenses and other forms of authorization, or give prior notification, in order to operate.
Consistent with our sustainability strategy, we have established proactive environmental policies with respect to the handling of chemicals, emissions, waste disposals and other substances of concern from our manufacturing operations. We are certified to be in compliance with quality standard ISO 9001 on a Company-wide basis. We implement the highest standards across our manufacturing activities and supply chain. The majority of our manufacturing sites are ISO 14001 (environment), ISO 14064 (greenhouse gas emissions), and ISO 50001 (energy) certified and EMAS validated.
We believe that in 2023 our activities complied with then-applicable environmental regulations in all material respects. We have engaged outside consultants to audit all of our environmental activities and have created environmental management teams, information systems and training. We have also instituted
41
environmental control procedures for processes used by us as well as our suppliers. In 2023, there were no material environmental claims made against us.
On December 9, 2020, we announced our goal to become carbon neutral by 2027 on scope 1 and 2 and partially scope 3. Our comprehensive roadmap to carbon neutrality includes two specific targets: compliance with the 1.5°C scenario defined at the Paris COP21 by 2025, which implies a 50% reduction of direct and indirect greenhouse gas emissions compared to 2018, and the sourcing of 100% renewable energy by 2027. Our action plan will reduce:
(i)our direct emissions of greenhouse gases (scope 1), mainly through investment in equipment to burn the gases remaining after manufacturing;
(ii)our overall energy consumption (scope 2);
(iii)our emissions from product transportation, business travel, and employee commuting (part of scope 3); and
(iv)remaining emissions through the identification and implementation of the most credible and relevant carbon avoidance and sequestration programs.
We also adopt a rigorous approach to protect the health and safety of our employees and contractors by preventing work-related injuries and illnesses and providing a safe working environment.
We have implemented a robust health and safety management system throughout our Company. Our main manufacturing sites are ISO 45001 certified. Our performance and management systems are evaluated annually through third-party surveillance audits and certifications are renewed every three years.
On July 12, 2020, the EU Taxonomy Regulation entered into force. The EU Taxonomy Regulation provides the basis for the EU taxonomy: a classification system, on the basis of which a list of environmentally sustainable economic activities has been drawn up. The EU Taxonomy Regulation defines overarching conditions that an economic activity must meet to be considered environmentally sustainable, and focuses on six environmental objectives. On January 1, 2022 the delegated acts on the technical screening criteria for two environmental objectives, being Climate Change Mitigation and Adaption to Climate Change, entered into force, in which technical screening criteria have been laid down which specify environmental performance requirements for the economic activities to be classified as environmentally sustainable. The delegated acts on the technical screening criteria for the remaining four environmental objectives entered into force on 1 January 2024. As we are subject for our reporting over financial year 2023 to an obligation to publish non-financial information pursuant to Directive 2013/34/EU of the European Parliament and of the Council of June 26, 2013 on the annual financial statements, consolidated financial statements and related reports of certain types of undertakings, amending Directive 2006/43/EC of the European Parliament and of the Council and repealing Council Directives 78/660/EEC and 83/349/EEC (the Non-Financial Reporting Directive), the EU Taxonomy Regulation is applicable to us, and subsequently, we must disclose information on how and to what extent our activities are associated with economic activities that qualify as environmentally sustainable. This information will be disclosed in our Dutch Annual Report expected to be filed in March 2024.
On January 5, 2023, the CSRD entered into force. The CSRD modernizes and strengthens the rules about the social and environmental information that companies have to report. The CSRD aims to ensure that investors and other stakeholders have access to the information they need to assess investment risks arising from climate change and other sustainability topics. As of our reporting in relation to financial year 2024, the CSRD will require us to disclose information on the basis of European Sustainability Reporting Standards (“ESRS”) in our annual report. Based on the CSRD, we will be required to report on the way we operate and manage social and environmental challenges. In connection with these reporting obligations we will be required to formulate long-term ESG targets, policy, strategic plans and to conduct due diligence for our own operations and supply chain. Under the CSRD, further transparency rules are introduced on division of roles and responsibilities within the Company for our ESG targets. The CSRD also makes it mandatory for companies to have an audit of the sustainability information that they report. The ESRS require us to disclose detailed information on environmental protection, social responsibility and treatment of employees, respect for human rights, anti-corruption, bribery and on diversity. This information will be disclosed in our Dutch Annual Report starting from financial year 2024 expected to be filed in March 2025.
42
Item 5. Operating and Financial Review and Prospects
Overview
The following discussion should be read in conjunction with our Consolidated Financial Statements and Notes thereto included elsewhere in this Form 20-F. The following discussion contains statements of future expectations and other forward-looking statements within the meaning of Section 27A of the Securities Act of 1933, or Section 21E of the Securities Exchange Act of 1934, each as amended, particularly in the sections “— Critical Accounting Policies Using Significant Estimates”, “— Business Outlook”, “— Liquidity and Capital Resources” and “— Financial Outlook: Capital Investment”. Our actual results may differ significantly from those projected in the forward-looking statements. For a discussion of factors that might cause future actual results to differ materially from our recent results or those projected in the forward-looking statements in addition to the factors set forth below, see “Cautionary Note Regarding Forward-Looking Statements” and Item 3. “Key Information — Risk Factors”. We assume no obligation to update the forward-looking statements or such risk factors.
Critical Accounting Policies Using Significant Estimates
The preparation of our Consolidated Financial Statements in accordance with U.S. GAAP requires us to make estimates and assumptions. The primary areas that require significant estimates and judgments by us include, but are not limited to:
•sales allowances for discounts, price protection, product returns and other rebates;
•inventory obsolescence reserves and normal manufacturing capacity thresholds to determine costs capitalized in inventory;
•recognition and measurement of loss contingencies;
•valuation at fair value of assets acquired and liabilities assumed on business acquisitions, and measurement of any contingent consideration;
•annual and trigger-based impairment review of goodwill and intangible assets, as well as the assessment of events, which could trigger impairment testing on tangible assets;
•assessment of our long-lived assets economic useful lives;
•assumptions used in measuring expected credit losses and impairment charges on financial assets;
•assumptions used in assessing the number of awards expected to vest on stock-based compensation plans;
•assumptions used in calculating pension obligations and other long-term employee benefits; and
•determination of the amount of tax expected to be paid and tax benefit expected to be received, including deferred income tax assets, valuation allowance and provisions for uncertain tax positions and claims.
We base the estimates and assumptions on historical experience and on various other factors such as market trends, market information used by market participants and the latest available business plans that we believe to be reasonable under the circumstances, the results of which form the basis for making judgments about the carrying values of assets and liabilities. While we regularly evaluate our estimates and assumptions, the actual results we experience could differ materially and adversely from our estimates.
We believe the following critical accounting policies require us to make significant judgments and estimates in the preparation of our Consolidated Financial Statements:
Revenue recognition. Arrangements with customers are considered contracts if all the following criteria are met: (a) parties have approved the contract and are committed to perform their respective obligations; (b)
each party’s rights regarding the goods or services to be transferred can be identified; (c) payment terms for the goods or services to be transferred can be identified; (d) the contract has commercial substance and (e) collectability of substantially all of the consideration is probable. We recognize revenue from products sold to a customer, including distributors, when we satisfy a performance obligation by transferring control over a product to the customer. In certain circumstances, we may enter into agreements that concern principally revenues from services, where the performance obligation is satisfied over time. The objective when allocating the transaction price is to allocate the transaction price to each performance obligation (or distinct good or service) in an amount that depicts the amount of consideration to which we expect to be entitled in exchange for transferring the promised goods or services to the customer. The payment terms typically range between 30 to 90 days. Certain of our customers require us to hold inventory as consignment in their hubs and only purchase inventory when they require it. Revenue for sales of such inventory is recognized when, at the customer’s option, the products are withdrawn from the consignment and we satisfy a performance obligation by transferring control over a product to the customer. We may also enter into several multi-annual capacity reservation and volume commitment arrangements with certain of our customers. These agreements constitute a binding commitment for our customers to purchase and for us to supply allocated commitment volumes in exchange for additional consideration. The consideration related to commitment fees is reported as revenues from sale of products as it is usually based on delivered quantities.
Consistent with standard business practice in the semiconductor industry, price protection is granted to distribution customers on their existing inventory of our products to compensate them for changes in market prices. We accrue a provision for price protection based on a rolling historical price trend computed monthly as a percentage of gross distributor sales. This historical price trend represents differences in recent months between the invoiced price and the final price to the distributor, adjusted to accommodate a significant change in the selling price. The short outstanding inventory time, visibility into the inventory product pricing and long distributor pricing history have enabled us to reliably estimate price protection provisions at period-end. We record the accrued amounts as a deduction of “Net sales” in the consolidated statements of income at the time of the sale.
Our customers occasionally return our products for technical reasons. Our standard terms and conditions of sale provide that if we determine that products do not conform, we will repair or replace the non-conforming products, or issue a credit note or rebate of the purchase price. Quality returns are identified shortly after sale in customer quality control testing. Quality returns are usually associated with end-user customers, not with distribution channels. We record the accrued amounts as a deduction of “Net sales” in the consolidated statements of income, using contractual and historical information.
We record a provision for warranty costs as a charge against “Cost of sales” in the consolidated statements of income, based on historical trends of warranty costs incurred as a percentage of sales, which management had determined to be a reasonable estimate of the probable losses to be incurred for warranty claims in a period. Any potential warranty claims are subject to our determination that we are at fault for damages, and such claims must usually be submitted within a short period of time following the date of sale. This warranty is given in lieu of all other warranties, conditions or terms expressed or implied by statute or common law. Our contractual terms and conditions typically limit our liability to the sales value of the products that gave rise to the claims.
Our insurance policy relating to product liability covers third-party physical damages and bodily injury, indirect financial damages as well as immaterial non-consequential damages caused by defective products.
In addition to product sales, we enter into arrangements with customers consisting in transferring licenses or related to license services. The revenue generated from these arrangements is reported on the line “Other revenues” of the consolidated statements of income.
Trade accounts receivable. We use a lifetime expected credit losses allowance for all trade receivables. The allowance includes reasonable assumptions about future credit trends. The historical loss rates are adjusted to reflect current and forward-looking information on macro-economic factors affecting the ability of our customers to settle the receivables. Adjustments to the expected credit losses allowance are reported in the line “Selling, general and administrative expenses” in the consolidated statements of income.
Business combinations and goodwill. The acquisition method of accounting applied to business combinations requires extensive use of estimates and judgments to allocate the purchase price to the fair value of
44
acquired assets less assumed liabilities, including any contingent consideration, net of related deferred tax impacts. If the assumptions and estimates used to allocate the purchase price are not correct or if business conditions change, purchase price adjustments or future asset impairment charges could be required. As of December 31, 2023, the value of goodwill in our consolidated balance sheet amounted to $303 million.
Impairment of goodwill. Goodwill recognized in business combinations is not amortized but is tested for impairment annually, or more frequently if a triggering event indicating a possible impairment exists. Goodwill subject to potential impairment is tested at the reporting unit level. This impairment test determines whether the fair value of each reporting unit under which goodwill is allocated is lower than the total carrying amount of relevant net assets allocated to such reporting unit, including its allocated goodwill. A goodwill impairment charge is recorded for the amount by which a reporting unit’s carrying value exceeds its fair value. Significant management judgments and estimates are used in forecasting the future discounted cash flows associated with the reporting unit, including: the applicable industry’s sales volume forecast and selling price evolution, the reporting unit’s market penetration and its revenues evolution, the market acceptance of certain new technologies and products, the relevant cost structure, the discount rates applied using a weighted average cost of capital and the perpetuity rates used in calculating cash flow terminal values. Our evaluations are based on financial plans updated with the latest available projections of the semiconductor market, our sales expectations and our costs evolution, and are consistent with the plans and estimates that we use to manage our business. It is possible, however, that the plans and estimates used may prove to be incorrect, and future adverse changes in market conditions, changes in strategies, lack of performance of major customers or operating results of acquired businesses that are not in line with our estimates may require impairments.
We performed our annual impairment test of goodwill during the fourth quarter of 2023 and concluded that there was no goodwill impairment loss. Impairment charges could result from new valuations triggered by changes in our product portfolio or strategic alternatives, particularly in the event of a downward shift in future revenues or operating cash flows in relation to our current plans or in case of capital injections by, or equity transfers to, third parties at a value lower than the current carrying value.
Intangible assets subject to amortization. Intangible assets subject to amortization include intangible assets purchased from third parties recorded at cost and intangible assets acquired in business combinations initially recorded at fair value, comprised mainly of technologies and licenses, and computer software. Intangible assets with finite useful lives are reflected net of any impairment losses and are amortized over their estimated useful lives. Amortization begins when the intangible asset is available for its intended use. Amortization reflects the pattern in which the asset’s economic benefits are consumed, which usually consists in applying the straight-line method to allocate the cost of the intangible assets over the estimated useful lives. The carrying value of intangible assets with finite useful lives is evaluated whenever changes in circumstances indicate that the carrying amount may not be recoverable. An impairment loss is recognized for the amount by which the asset’s carrying amount exceeds its fair value. We evaluate the remaining useful life of an intangible asset at each reporting date to determine whether events and circumstances warrant a revision to the remaining period of amortization. Our evaluations are based on financial plans updated with the latest available projections of growth in the semiconductor market and our sales expectations. They are consistent with the plans and estimates that we use to manage our business. It is possible, however, that the plans and estimates used may be incorrect and that future adverse changes in market conditions or operating results of businesses acquired may not be in line with our estimates and may therefore require us to recognize impairment charges on certain intangible assets.
In 2023 we recorded a $42 million impairment loss primarily related to technologies acquired as part of certain business combinations. In 2022, we impaired $38 million of certain technologies acquired as part of recent business combinations. In 2021, we impaired $1 million of acquired licenses and technologies with no alternative future use.
We will continue to monitor the carrying value of our assets. If market conditions deteriorate, this could result in future impairment losses. Further impairment charges could also result from new valuations triggered by changes in our product portfolio or by strategic transactions, particularly in the event of a downward shift in future revenues or operating cash flows in relation to our current plans or in case of capital injections by, or equity transfers to, third parties at a value lower than the one underlying the carrying amount.
As of December 31, 2023, the value of intangible assets subject to amortization in our consolidated balance sheet amounted to $367 million.
45
Property, plant and equipment. Our business requires substantial investments in technologically advanced manufacturing facilities, which may become significantly underutilized or obsolete as a result of rapid changes in demand and ongoing technological evolution. The largest component of our long-lived assets is our manufacturing equipment primarily in our front-end activities, for which the useful life is estimated to be six years, except for our 300mm manufacturing equipment and certain back-end equipment whose useful life is estimated to be ten years. This estimate is based on our experience using the equipment over time. Depreciation expense is an important element of our manufacturing cost structure. We begin to depreciate property, plant and equipment when it is ready for its intended use.
We evaluate each period whether there is reason to suspect that the carrying amount of tangible assets or groups of assets held for use might not be recoverable. Several impairment indicators exist for making this assessment, such as: restructuring plans, significant changes in the technology, market, economic or legal environment in which we operate, available evidence of obsolescence of the asset, or indication that its economic performance is, or will be, worse than expected. In determining the recoverability of assets to be held and used, we initially assess whether the carrying value of the tangible assets or group of assets exceeds the undiscounted cash flows associated with these assets. If exceeded, we then evaluate whether an impairment charge is required by determining if the asset’s carrying value also exceeds its fair value. We normally estimate this fair value based on independent market appraisals or the sum of discounted future cash flows, using market assumptions such as the utilization of our fabrication facilities and the ability to upgrade such facilities, change in the selling price and the adoption of new technologies. We also evaluate and adjust, if appropriate, the assets’ useful lives at each reporting date. In 2023, 2022 and 2021, no significant impairment charge was recorded on property, plant and equipment.
Our evaluations are based on financial plans updated with the latest projections of growth in the semiconductor market and our sales expectations, from which we derive the future production needs and loading of our manufacturing facilities, and which are consistent with the plans and estimates that we use to manage our business. These plans are highly variable due to the high volatility of the semiconductor business and therefore are subject to continuous modifications. If future growth differs from the estimates used in our plans, in terms of both market growth and production allocation to our manufacturing plants, this could require a further review of the carrying amount of our tangible assets and result in a potential impairment loss.
As of December 31, 2023, we did not hold any significant assets for sale.
Inventories. Inventories are stated at the lower of cost or net realizable value. Actual cost is based on an adjusted standard cost, which approximates cost on a first-in first-out basis for all categories of inventory (raw materials, work-in-process, finished products). Actual cost is therefore dependent on our manufacturing performance and is based on the normal utilization of our production capacity. In case of underutilization of our manufacturing facilities, we estimate the costs associated with unused capacity. These costs are not included in the valuation of inventories but are charged directly to cost of sales in the consolidated statements of income. Net realizable value is based upon the estimated selling price in the ordinary course of business, less reasonably predictable costs of completion, disposal and transportation.
Inventory reserve is estimated for excess uncommitted inventories based on historical sales data, order backlog and production plans. We perform, on a continuous basis, write-offs of inventories, which have the characteristics of slow-moving, old production dates and technical obsolescence. We evaluate inventory to identify obsolete or slow-selling items, as well as inventory that is not of saleable quality and we record a specific reserve if we estimate the inventory will eventually be written off. To the extent that future negative market conditions generate order backlog cancellations and declining sales, or if future conditions are less favorable than the projected revenue assumptions, we could record additional inventory reserve, which would have a negative impact on our gross margin.
Share-based compensation. Our share-based service awards are granted to senior executives and selected employees. We measure the cost of share-based service awards based on the fair value of the awards as of the grant date reflecting the market price of the underlying shares at the date of the grant, reduced by the present value of the dividends expected to be paid on the shares during the requisite service period. While the awards granted to selected employees are subject to a three-year service period, the awards granted to senior executives are subject to both a three-year service period and the fulfillment of certain performance conditions, including our financial results when compared to industry performance. The expense is recognized over the requisite service period. In 2023, approximately one-half of the total amount of shares awarded were granted to senior
46
executives and consequently were contingent on the achievement of performance conditions. In order to determine share-based compensation to be recorded for the period, we use estimates on the number of awards expected to vest, including the probability of achieving the fixed performance conditions including those relating to our financial results compared to industry performance, and our best estimates of award forfeitures and employees’ service periods. Our assumptions related to industry performance are generally taken with a one quarter lag in line with the availability of market information. In 2023, 2022 and 2021, we recorded a total charge of approximately $236 million, $215 million and $221 million relating to our outstanding stock award plans, respectively.
Financial assets. The financial assets held at reporting date are primarily receivables, debt securities and equity securities. Receivables are measured at amortized cost less any currently expected credit loss allowance. Investments in equity securities that have readily determinable fair values and for which we do not have the ability to exercise significant influence are classified as financial assets measured at fair value through earnings. For investments in equity securities without readily determinable fair values and for which we do not have the ability to exercise significant influence, we have elected to apply the cost-method as a measurement alternative. We determine the classification of our financial assets at initial recognition.
The fair values of publicly traded securities are based on current market prices. If the market for a financial asset is not active and if no observable market price is obtainable, we measure fair value by using assumptions and estimates. In measuring fair value, we make maximum use of market inputs and minimize the use of unobservable inputs.
Debt securities are classified as-available-for-sale financial assets, with changes in fair value recognized as a component of other comprehensive income in our consolidated statements of comprehensive income. Debt securities totaled $1,635 million and were reported as marketable securities in the consolidated balance sheet as of December 31, 2023.
As of December 31, 2023, we did not hold any material equity securities reported under the equity method.
Income taxes. We make estimates and judgments in determining income tax for the period, comprising current and deferred income tax. We assess the income tax expected to be paid related to the current year taxable profit in each tax jurisdiction and recognize deferred income tax for all temporary differences arising between the tax bases of assets and liabilities and their carrying amount in the Consolidated Financial Statements. We also recognize deferred tax assets on temporary differences arising from tax losses carried forward and tax credits. Furthermore, at each reporting date, we assess all material uncertain tax positions in all jurisdictions to determine the amount of income tax benefits that we do not expect to reasonably sustain. As of December 31, 2023, we had uncertain tax positions estimated at $55 million.
We also assess the likelihood of realization of our deferred tax assets. Their ultimate realization is dependent upon, among other things, our ability to generate future taxable profit available, or tax credits before their expiration, or our ability to implement prudent and feasible tax planning, or the possibility to settle uncertain tax positions against available net operating loss carry forwards, or similar tax losses and credits. We record a valuation allowance against the deferred tax assets when we consider it is more likely than not that the deferred tax assets will not be realized.
As of December 31, 2023, we had deferred tax assets of $592 million, net of valuation allowance.
We could be required to record further valuation allowances thereby reducing the amount of total deferred tax assets, resulting in an increase in our income tax charge, if our estimates of projected future taxable income and benefits from available tax strategies are reduced as a result of a change in business conditions or in management’s plans or due to other factors, or if changes in current tax regulations are enacted that impose restrictions on the timing or extent of our ability to utilize net operating losses and tax credit carry-forwards in the future. Likewise, a change in the tax rates applicable in the various jurisdictions or unfavorable outcomes of any ongoing tax audits could have a material impact on our future tax provisions in the periods in which these changes could occur.
Pension and Post-Employment Benefits. Our consolidated statements of income and our consolidated balance sheets include amounts for pension obligations and other long-term employee benefits that are measured
47
using actuarial valuations. As of December 31, 2023, our pension and other long-term employee benefit obligations net of plan assets amounted to $453 million. These valuations are based on key assumptions, including discount rates, expected long-term rates of return on plan assets, turnover rates and salary increase rates. The assumptions used in the determination of the net periodic benefit cost are updated on an annual basis at the beginning of each fiscal year or more frequently upon the occurrence of significant events. Any changes in the pension schemes or in the above assumptions can have an impact on our valuations. The measurement date we use for our plans is December 31.
Patent and other IP litigation or claims. We record a provision when we believe that it is probable that a liability has been incurred at the date of the Consolidated Financial Statements and the amount of the loss can be reasonably estimated. We regularly evaluate losses and claims to determine whether they need to be adjusted based on current information available to us. Such estimates are difficult to the extent that they are largely dependent on the status of ongoing litigation that may vary based on positions taken by the court with respect to issues submitted, demands of opposing parties, changing laws, discovery of new facts or other matters of fact or law. As of December 31, 2023, based on our current evaluation of ongoing litigation and claims we face, we have not estimated any amounts that could have a material impact on our results of operations and financial condition with respect to either probable or possible risks. In the event of litigation that is adversely determined with respect to our interests, or in the event that we need to change our evaluation of a potential third-party claim based on new evidence, facts or communications, unexpected rulings or changes in the law, this could have a material adverse effect on our results of operations or financial condition at the time it were to materialize. We are in discussion with several parties with respect to claims against us relating to possible infringement of IP rights. We are also involved in certain legal proceedings concerning such issues. See “Item 8. Financial Information — Legal Proceedings” and Note 25 to our Consolidated Financial Statements.
Other claims. We are subject to the possibility of loss contingencies arising in the ordinary course of business. These include but are not limited to: product liability claims and/or warranty costs on our products, contractual disputes, indemnification claims, employee grievances, tax claims beyond assessed uncertain tax positions as well as claims for environmental damages. We are also exposed to numerous legal risks which until now have not resulted in legal disputes and proceedings. These include risks related to product recalls, environment, anti-trust, anti-corruption and competition as well as other compliance regulations. We may also face claims in the event of breaches of law committed by individual employees or third parties. In determining loss contingencies, we consider the likelihood of a loss of an asset or the occurrence of a liability, as well as our ability to reasonably estimate the amount of such loss or liability. An estimated loss is recorded when we believe that it is probable that a liability has been incurred and the amount of the loss can be reasonably estimated. We regularly re-evaluate any losses and claims and determine whether our provisions need to be adjusted based on the current information available to us. As of December 31, 2023, based on our current evaluation of ongoing litigation and claims we face, we have not estimated any amounts that could have a material impact on our results of operations and financial condition with respect to either probable or possible risks. In the event we are unable to accurately estimate the amount of such loss in a correct and timely manner, this could have a material adverse effect on our results of operations or financial condition at the time such loss was to materialize. For further details of our legal proceedings refer to “Item 8. Financial Information — Legal Proceedings” and Note 25 to our Consolidated Financial Statements.
Fiscal Year 2023
Under Article 35 of our Articles of Association, our financial year extends from January 1 to December 31, which is the period end of each fiscal year. In 2023, the first quarter ended on April 1, the second quarter ended on July 1, the third quarter ended on September 30 and the fourth quarter ended on December 31. In 2024, the first quarter will end on March 30, the second quarter will end on June 29, the third quarter will end on September 28 and the fourth quarter will end on December 31. Based on our fiscal calendar, the distribution of our revenues and expenses by quarter may be unbalanced due to a different number of days in the various quarters of the fiscal year and can also differ from equivalent prior years’ periods, as illustrated in the below table for the years 2022, 2023 and 2024.
48
| Q1 | Q2 | Q3 | Q4 | |||||||||||||||||||||||
| Days | ||||||||||||||||||||||||||
| 2022 | 92 | 91 | 91 | 91 | ||||||||||||||||||||||
| 2023 | 91 | 91 | 91 | 92 | ||||||||||||||||||||||
| 2024 | 90 | 91 | 91 | 94 | ||||||||||||||||||||||
2023 Business Overview
Our results of operations for each period were as follows:
| Year ended December 31, | Three Months Ended | |||||||||||||||||||||||||||||||
| 2023 | 2022 | December 31, 2023 | September 30, 2023 | December 31, 2022 | ||||||||||||||||||||||||||||
| (In millions, except per share amounts) | (Unaudited, in millions, except per share amounts) | |||||||||||||||||||||||||||||||
| Net revenues | $ | 17,286 | $ | 16,128 | $ | 4,282 | $ | 4,431 | $ | 4,424 | ||||||||||||||||||||||
| Gross profit | 8,287 | 7,635 | 1,949 | 2,109 | 2,102 | |||||||||||||||||||||||||||
| Gross margin as percentage of net revenues | 47.9 | % | 47.3 | % | 45.5 | % | 47.6 | % | 47.5 | % | ||||||||||||||||||||||
| Operating income | 4,611 | 4,439 | 1,023 | 1,241 | 1,287 | |||||||||||||||||||||||||||
| Operating margin | 26.7 | % | 27.5 | % | 23.9 | % | 28.0 | % | 29.1 | % | ||||||||||||||||||||||
Net income attributable to parent company | 4,211 | 3,960 | 1,076 | 1,090 | 1,248 | |||||||||||||||||||||||||||
| Diluted earnings per share | 4.46 | 4.19 | 1.14 | 1.16 | 1.32 | |||||||||||||||||||||||||||
Our total available market is defined as “TAM”, while our serviceable available market is defined as “SAM” and represents the market for products sold by us (i.e., TAM excluding major devices such as microprocessors, DRAM and flash-memories, optoelectronics devices other than optical sensors, video processing and wireless application specific market products, such as baseband and application processors).
Based on industry data published by WSTS, semiconductor industry revenues in 2023 decreased on a year-over-year basis by approximately 8% for the TAM and increased by approximately 4% for the SAM, to reach approximately $527 billion and $295 billion, respectively. In the fourth quarter of 2023, on a year-over-year basis, the TAM increased by approximately 12% and the SAM increased by approximately 8%. Sequentially, the TAM increased by approximately 8% and the SAM increased by approximately 2%.
Full year 2023 net revenues increased 7.2% to $17.29 billion; gross margin was 47.9% and operating margin was 26.7%.
Our fourth quarter net revenues amounted to $4,282 million, decreasing 3.2% year-over-year, gross margin was 45.5%, and operating margin was 23.9%. On a sequential basis, fourth quarter net revenues decreased 3.4%, 40 basis points lower than the mid-point of our guidance. On a sequential basis, ADG reported an increase in net revenues, AMS was stable and MDG decreased.
Our quarterly performance was below the SAM on a sequential and a year-over-year basis.
Our effective average exchange rate was $1.08 for €1.00 for the full year 2023, as compared to $1.10 for €1.00 for the full year 2022. Our effective average exchange rate for the fourth quarter of 2023 was $1.08 for €1.00, compared to $1.09 for €1.00 for the third quarter of 2023 and $1.04 for €1.00 in the fourth quarter of 2022. For a more detailed discussion of our hedging arrangements and the impact of fluctuations in exchange rates, see “Impact of Changes in Exchange Rates”.
Our 2023 gross margin increased 60 basis points to 47.9% from 47.3% in 2022, principally driven by the positive impact of the combination of product mix and pricing, partially offset by higher input manufacturing costs and unused capacity charges.
49
Our fourth quarter 2023 gross profit was $1,949 million and gross margin was 45.5%, 50 basis points below the mid-point of our guidance, mainly due to a less favorable product mix. On a sequential basis, gross margin decreased by 210 basis points mainly due to a less favorable product mix, negative sales price impact, and higher unused capacity charges. On a year-over-year basis, gross margin decreased 200 basis points, due to higher input manufacturing costs, unused capacity charges, and negative currency effect net of hedging, partially offset by the combination of sales price and product mix.
Our operating expenses, comprised of aggregated selling, general & administrative (“SG&A”) and research & development (“R&D”) expenses, amounted to $3,731 million in 2023, increasing by 11.2% from $3,355 million in the prior year, mainly due to increased cost of labor and higher levels of activity, primarily in R&D programs, partially offset by positive currency effects. On aggregate, R&D and SG&A expenses were $937 million for the fourth quarter of 2023, compared to $926 million and $850 million in the prior and year-ago quarters, respectively. The sequential increase was mainly due to seasonality associated with lower vacation days. The year-over-year increase of operating expenses was mainly due to higher cost of labor, negative currency effects and higher levels of activity, primarily in R&D programs.
Other income and expenses, net, were $55 million in 2023 compared to $159 million in 2022, decreasing mainly due to higher start-up costs primarily for our new 300mm fab in Agrate, Italy, partially offset by higher income from public funding. Fourth quarter other income and expenses, net, were $11 million, compared to $58 million in the prior quarter and $35 million in the year-ago quarter. The sequential decrease was mainly due to lower income from public funding. The year-over-year decrease was principally driven by higher start-up costs.
Operating income in 2023 was $4,611 million, increasing by $172 million compared to 2022, mainly driven by the combining effect of higher revenues and improved gross margin profitability, partially offset by higher operating expenses.
Operating income in the fourth quarter decreased on a sequential and year-over-year basis to $1,023 million compared to $1,241 million and $1,287 million in the prior and year-ago quarter, respectively. The sequential decrease was mainly due to lower gross profit and decreased R&D funding. The year-over-year decrease was mainly due to lower revenues, decreased gross margin profitability and higher operating expenses.
Full year 2023 net income was $4,211 million, or $4.46 diluted earnings per share, compared to net income of $3,960 million, or $4.19 diluted earnings per share for the full year 2022. Fourth quarter net income increased on a sequential and year-over-year basis to $1,076 million, or $1.14 diluted earnings per share, compared to net income of $1,090 million, or $1.16 diluted earnings per share, in the prior quarter, and a net income of $1,248 million, or $1.32 diluted earnings per share, in the year-ago quarter.
During 2023, our net cash from operating activities was at $5,992 million. Our net cash used in investing activities was at $5,766 million with capital expenditure payments, net of proceeds from sales, capital grants and other contributions at $798 million and $4,111 million during the fourth quarter and full year 2023, respectively, compared to $920 million and $3,524 million for the fourth quarter and full year 2022 respectively.
Our free cash flow, a non-U.S. GAAP measure, amounted to $1,774 million in 2023 compared to $1,591 million in 2022. Refer to “Liquidity and Capital Resources” for the reconciliation of the free cash flow, a non-U.S. GAAP measure, to our consolidated statements of cash flows.
During 2023, we received $329 million of proceeds from long-term debt and used $346 million for the repurchase of common stock, $223 million of dividends paid to our shareholders and $169 million for long-term debt repayment.
Business Outlook
Our first quarter 2024 outlook reflects revenues of approximately $3.6 billion at the mid-point, decreasing year-over-year by 15.2%, and decreasing on a sequential basis by 15.9%, plus or minus 350 basis points. Gross margin is expected to be at approximately 42.3%, plus or minus 200 basis points. For 2024, we plan to invest about $2.5 billion in net capital expenditures.
We will drive the Company based on a plan for 2024 revenues in the range of $15.9 billion to $16.9 billion. Within this plan we expect a gross margin in the low to mid-40's.
50
This outlook is based on an assumed effective currency exchange rate of approximately $1.09 = €1.00 for the 2024 first quarter and includes the impact of existing hedging contracts. The first quarter will close on March 30, 2024.
These are forward-looking statements that are subject to known and unknown risks and uncertainties that could cause actual results to differ materially; in particular, refer to those known risks and uncertainties described in “Cautionary Note Regarding Forward-Looking Statements” and “Item 3. Key Information — Risk Factors” herein.
Other Developments
On January 10, 2024 we announced the Product Group Reorganization (as defined above)
On December 6, 2023, we announced the ST Edge AI Suite, a free-to-use integrated set of software tools to complement ST hardware.
On November 24, 2023, we signed a fifteen-year power purchase agreement with ERG for the supply of renewable energy to our operations in Italy over the 2024-2038 timeframe, in part to achieve our goal to become carbon neutral by 2027 on scope 1 and 2 and partially scope 3.
On September 19, 2023, we announced the decision of our Supervisory Board to propose that Mr. Jean-Marc Chery be reappointed for a three-year mandate as the sole member of the Managing Board, our President and Chief Executive Officer, for shareholder approval at the 2024 AGM.
On August 23, 2023, we published our IFRS 2023 Semi Annual Accounts for the six-month period ended July 1, 2023 on our website and filed them with the Netherlands Authority for the Financial Markets (Autoriteit Financiële Markten) (“AFM”).
On June 20, 2023, we signed an agreement with Airbus to cooperate on power electronics research & development to support more efficient and lighter power electronics, essential for future hybrid-powered aircraft and full-electric urban air vehicles.
On June 7, 2023, we signed an agreement with Sanan Optoelectronics to create a new 200mm silicon carbide device manufacturing joint venture in Chongqing, China (“SST JV”).
On June 5, 2023, we announced the finalization of our agreement with GlobalFoundries Inc. to create a new, jointly-operated, high-volume semiconductor manufacturing facility in Crolles, France.
On May 24, 2023, we announced that the members of our Supervisory Board appointed Mr. Nicolas Dufourcq as the Chairman and Mr. Maurizio Tamagnini as the Vice-Chairman of the Supervisory Board, respectively, for a three-year term to expire at the end of the 2026 AGM.
On May 24, 2023, we held our AGM in Amsterdam, the Netherlands. The proposed resolutions, all approved by the shareholders, were:
•The adoption of the Company's Statutory Annual Accounts for the year ended December 31, 2022, prepared in accordance with International Financial Reporting Standards (IFRS-EU) and filed with the Netherlands Authority for the Financial Markets (Autoriteit Financiële Markten) on March 23, 2023;
•The distribution of a cash dividend of $0.24 per outstanding share of the Company’s common stock to be distributed in quarterly installments of $0.06 in each of the second, third and fourth quarters of 2023 and first quarter of 2024;
•The reappointment of Mr. Frédéric Sanchez and Mr. Maurizio Tamagnini, as members of the Supervisory Board for a three-year term to expire at the end of the 2026 AGM;
•The reappointment of Ms. Ana de Pro Gonzalo, as member of the Supervisory Board, for a two-year term expiring at the end of the 2025 AGM;
51
•The reappointment of Mr. Yann Delabrière, as member of the Supervisory Board, for a one-year term expiring at the end of the 2024 AGM;
•The appointment of Mr. Paolo Visca, as member of the Supervisory Board, for a three-year term expiring at the 2026 AGM, in replacement of Mr. Alessandro Rivera whose mandate expired at the end of the 2023 AGM;
•The appointment of Ms. Hèlène Vletter-van Dort, as member of the Supervisory Board, for a two-year term expiring at the end of the 2025 AGM, in replacement of Ms. Heleen Kersten whose mandate expired at the end of the 2023 AGM;
•The approval of the stock-based portion of the compensation of the President and CEO;
•The authorization to the Managing Board, until the end of the 2024 AGM, to repurchase shares, subject to the approval of the Supervisory Board;
•The delegation to the Supervisory Board of the authority to issue new common shares, to grant rights to subscribe for such shares, and to limit and/or exclude existing shareholders’ pre-emptive rights on common shares, until the end of the 2024 AGM;
•The discharge of the sole member of the Managing Board; and
•The discharge of the members of the Supervisory Board.
On April 20, 2023, we announced the publication of our 26th sustainability report detailing our 2022 performance.
On April 13, 2023, we signed a multi-year supply agreement with ZF for the supply of our silicon carbide devices.
Results of Operations
Segment Information
We design, develop, manufacture and market a broad range of products, including discrete and standard commodity components, ASICs, full-custom devices and semi-custom devices and ASSPs for analog, digital and mixed-signal applications. In addition, we further participate in the manufacturing value chain of smartcard products, which includes the production and sale of both silicon chips and smartcards.
As of December 31, 2023, our reportable segments were as follows:
•Automotive and Discrete Group (ADG), comprised of dedicated automotive integrated circuits (“ICs”), and discrete and power transistor products.
•Analog, MEMS and Sensors Group (AMS), comprised of analog, smart power, MEMS sensors and actuators, and optical sensing solutions.
•Microcontrollers and Digital ICs Group (MDG), comprised of general-purpose microcontrollers and microprocessors, connected security products (e.g. embedded secured elements and NFC readers), memories (e.g. serial and page EEPROM) and RF and Communications products.
Net revenues of “Others” include revenues from sales assembly services and other revenues. For the computation of the segments’ internal financial measurements, we use certain internal rules of allocation for the costs not directly chargeable to the segments, including cost of sales, SG&A expenses and a part of R&D expenses. In compliance with our internal policies, certain costs are not allocated to the segments, but reported in “Others”. Operating income (loss) of Others includes items such as unused capacity charges, including reduced manufacturing activity due to COVID-19 and incidents leading to power outage, impairment, restructuring charges and other related closure costs, management reorganization expenses, start-up and phase-
52
out costs, and other unallocated income (expenses) such as: strategic or special R&D programs, certain corporate-level operating expenses, patent claims and litigations, and other costs that are not allocated to product groups, as well as operating earnings of other products. In addition, depreciation and amortization expense is part of the manufacturing costs allocated to the segments and is neither identified as part of the inventory variation nor as part of the unused capacity charges; therefore, it cannot be isolated in cost of sales. Finally, public grants are allocated to our segments proportionally to the incurred expenses on the sponsored projects..
Wafer costs are allocated to the segments based on actual cost. From time to time, with respect to specific technologies, wafer costs are allocated to segments based on market price.
In the first quarter of 2024, we announced that we are re-organizing our product groups and reportable segments to further accelerate our time-to-market and the efficiency of our product development. Effective as of February 5, 2024, we have moved from three product groups and three reportable segments (ADG, AMS and MDG), to two product groups and four reportable segments, as follows:
•Analog, Power & Discrete, MEMS and Sensors, led by Marco Cassis, ST President and member of the Executive Committee, including two reportable segments (Analog Products, MEMS and Sensors (and Power and Discrete Products; and
•Microcontrollers, Digital ICs and RF products, led by Remi El-Ouazzane, ST President and member of the Executive Committee, including two reportable segments (Microcontrollers and Digital ICs and RF Products.
Annual Results of Operations
The following table sets forth certain financial data from our consolidated statements of income:
| 2023 | 2022 | 2021 | ||||||||||||||||||||||||||||||||||||
| $ million | % of net revenues | $ million | % of net revenues | $ million | % of net revenues | |||||||||||||||||||||||||||||||||
| Net sales | $ | 17,239 | 99.7 | % | $ | 16,083 | 99.7 | % | $ | 12,729 | 99.7 | % | ||||||||||||||||||||||||||
| Other revenues | $ | 47 | 0.3 | $ | 45 | 0.3 | $ | 32 | 0.3 | |||||||||||||||||||||||||||||
| Net revenues | $ | 17,286 | 100.0 | $ | 16,128 | 100.0 | $ | 12,761 | 100.0 | |||||||||||||||||||||||||||||
| Cost of sales | $ | (8,999) | 52.1 | $ | (8,493) | (52.7) | $ | (7,435) | (58.3) | |||||||||||||||||||||||||||||
| Gross profit | $ | 8,287 | 47.9 | $ | 7,635 | 47.3 | $ | 5,326 | 41.7 | |||||||||||||||||||||||||||||
| Selling, general and administrative expenses | $ | (1,631) | (9.4) | $ | (1,454) | (9.0) | $ | (1,323) | (10.4) | |||||||||||||||||||||||||||||
| Research and development expenses | $ | (2,100) | (12.2) | $ | (1,901) | (11.8) | $ | (1,723) | (13.5) | |||||||||||||||||||||||||||||
| Other income and expenses, net | $ | 55 | 0.3 | $ | 159 | 1.0 | $ | 141 | 1.2 | |||||||||||||||||||||||||||||
| Impairment, restructuring charges and other related closure costs | $ | — | — | $ | — | — | $ | (2) | — | |||||||||||||||||||||||||||||
| Operating income | $ | 4,611 | 26.7 | $ | 4,439 | 27.5 | $ | 2,419 | 19.0 | |||||||||||||||||||||||||||||
| Interest income (expense), net | $ | 171 | 1.0 | $ | 58 | 0.4 | $ | (29) | (0.2) | |||||||||||||||||||||||||||||
| Other components of pension benefit costs | $ | (19) | (0.1) | $ | (11) | (0.1) | $ | (10) | (0.1) | |||||||||||||||||||||||||||||
| Loss on financial instruments, net | $ | — | — | $ | — | — | $ | (43) | (0.4) | |||||||||||||||||||||||||||||
| Income before income taxes and noncontrolling interest | $ | 4,763 | 27.6 | $ | 4,486 | 27.8 | $ | 2,337 | 18.3 | |||||||||||||||||||||||||||||
| Income tax expense | $ | (541) | (3.1) | $ | (520) | (3.2) | $ | (331) | (2.6) | |||||||||||||||||||||||||||||
| Net income | $ | 4,222 | 24.4 | $ | 3,966 | 24.6 | $ | 2,006 | 15.7 | |||||||||||||||||||||||||||||
| Net income attributable to noncontrolling interest | $ | (11) | — | $ | (6) | — | $ | (6) | — | |||||||||||||||||||||||||||||
| Net income attributable to parent company stockholders | $ | 4,211 | 24.4 | % | $ | 3,960 | 24.6 | % | $ | 2,000 | 15.7 | % | ||||||||||||||||||||||||||
53
Net revenues
| Year Ended December 31, | % Variation | |||||||||||||||||||||||||||||||
| 2023 | 2022 | 2021 | 2023 vs 2022 | 2022 vs 2021 | ||||||||||||||||||||||||||||
| (in millions) | ||||||||||||||||||||||||||||||||
| Net sales | $ | 17,239 | $ | 16,083 | $ | 12,729 | 7.2 | % | 26.3 | % | ||||||||||||||||||||||
| Other revenues | $ | 47 | $ | 45 | $ | 32 | 4.2 | 40.3 | ||||||||||||||||||||||||
| Net revenues | $ | 17,286 | $ | 16,128 | $ | 12,761 | 7.2 | % | 26.4 | % | ||||||||||||||||||||||
Our 2023 net revenues increased 7.2% compared to the prior year, as a result of an approximate 19% increase in average selling prices, driven by a more favorable product mix, partially offset by a 12% decrease in volumes.
Our 2022 net revenues increased 26.4% compared to the prior year, as a result of an approximate 27% increase in average selling prices, driven by a more favorable product mix and sales price increase, partially offset by 1% decrease in volumes.
In 2023, 2022 and 2021, our largest customer, Apple, accounted for 12.3%, 16.8% and 20.5% of our net revenues, respectively, reported within our three product groups.
Net revenues by product group
| Year Ended | % Variation | |||||||||||||||||||||||||||||||
| 2023 | 2022 | 2021 | 2023 vs 2022 | 2022 vs 2021 | ||||||||||||||||||||||||||||
| (In millions) | ||||||||||||||||||||||||||||||||
| ADG | $ | 7,848 | $ | 5,969 | $ | 4,350 | 31.5 | % | 37.2 | % | ||||||||||||||||||||||
| AMS | 3,991 | 4,911 | 4,587 | (18.7) | 7.1 | |||||||||||||||||||||||||||
| MDG | 5,431 | 5,228 | 3,802 | 3.9 | 37.5 | |||||||||||||||||||||||||||
| Others | 16 | 20 | 22 | — | — | |||||||||||||||||||||||||||
| Total consolidated net revenues | $ | 17,286 | $ | 16,128 | $ | 12,761 | 7.2 | % | 26.4 | % | ||||||||||||||||||||||
For the full year 2023, ADG revenues were up 31.5% with higher average selling prices of approximately 48%, thanks to a better product mix and higher selling prices, partially offset by lower volumes of approximately 16%. AMS revenues decreased 18.7% due to lower volumes of approximately 13% and lower average selling prices of approximately 6%. MDG revenues increased by 3.9% compared to prior year, driven by higher average selling prices of approximately 7%, due to a better product mix, partially offset by lower volumes of approximately 3%.
For the full year 2022, ADG revenues were up 37.2% with higher average selling prices of approximately 40%, thanks to a better product mix and higher selling prices, partially offset by lower volumes of approximately 3%. AMS revenues increased 7.1%,due to higher average selling prices of approximately 18%, mainly due to a better product mix, partially offset by lower volumes of approximately 11%. MDG revenues increased 37.5% compared to prior year, driven by higher average selling prices of approximately 24%, due to a better product mix and higher selling prices, and higher volumes of approximately 14%.
Net revenues by Market Channel(1)
| Year Ended December 31, | ||||||||||||||||||||
| 2023 | 2022 | 2021 | ||||||||||||||||||
| (As percentage of net revenues) | ||||||||||||||||||||
| OEM | 66 | % | 67 | % | 66 | % | ||||||||||||||
| Distribution | 34 | 33 | 34 | |||||||||||||||||
| Total | 100 | % | 100 | % | 100 | % | ||||||||||||||
(1) Original Equipment Manufacturers (“OEM”) are the end-customers to which we provide direct marketing application engineering support, while Distribution refers to the distributors and representatives that we engage to distribute our products around the world.
54
By market channel, our 2023 net revenues in Distribution amounted to 34% of our total consolidated revenues, increasing from 33% in 2022. When comparing 2022 with 2021 figures, net revenues in Distribution had decreased by 1 percentage point, from 34% to 33%.
Net Revenues by Location of Shipment(1)
| Year Ended December 31, | % Variation | |||||||||||||||||||||||||||||||
| 2023 | 2022 | 2021 | 2023 vs 2022 | 2022 vs 2021 | ||||||||||||||||||||||||||||
| (In millions) | ||||||||||||||||||||||||||||||||
| Europe, Middle-East and Africa ("EMEA") | $ | 4,836 | $ | 3,619 | $ | 2,557 | 33.7 | % | 41.6 | % | ||||||||||||||||||||||
| Americas | $ | 2,724 | $ | 2,310 | $ | 1,525 | 17.9 | 51.4 | ||||||||||||||||||||||||
| Asia Pacific | $ | 9,726 | $ | 10,199 | $ | 8,679 | (4.6) | 17.5 | ||||||||||||||||||||||||
| Total consolidated net revenues | $ | 17,286 | $ | 16,128 | $ | 12,761 | 7.2 | % | 26.4 | % | ||||||||||||||||||||||
__________________
(1) Net revenues by location of shipment are classified by location of customer invoiced or reclassified by shipment destination in line with customer demand. For example, products ordered by U.S.-based companies to be invoiced to Asia Pacific affiliates are classified as Asia Pacific revenues. Furthermore, the comparison among the different periods may be affected by shifts in shipments from one location to another, as requested by our customers.
By location of shipment, EMEA revenues grew 33.7%, mainly driven by higher sales in Automotive and Power Discrete. Americas revenues increased 17.9%, mainly due to higher sales in Power Discrete, RF Communications and Automotive. Asia Pacific revenues decreased 4.6% mainly driven by lower sales in Imaging and MEMS partially offset by higher sales in Automotive and Power Discrete.
In 2022, EMEA revenues grew 41.6%, mainly driven by higher sales in Microcontrollers and Automotive. Americas revenues increased 51.4%, mainly due to higher sales in Microcontrollers, Automotive, RF Communications and Power Discrete. Asia Pacific revenues increased 17.5% mainly driven by higher sales in Automotive, Microcontrollers and Power Discrete.
Gross profit
| Year Ended December 31, | Variation | |||||||||||||||||||||||||||||||
| 2023 | 2022 | 2021 | 2023 vs 2022 | 2022 vs 2021 | ||||||||||||||||||||||||||||
| (In millions) | ||||||||||||||||||||||||||||||||
| Cost of sales | $ | (8,999) | $ | (8,493) | $ | (7,435) | (6.0) | % | (14.2) | % | ||||||||||||||||||||||
| Gross profit | $ | 8,287 | $ | 7,635 | $ | 5,326 | 8.5 | % | 43.4 | % | ||||||||||||||||||||||
| Gross margin (as percentage of net revenues) | 47.9 | % | 47.3 | % | 41.7 | % | 60 bps | 560 bps | ||||||||||||||||||||||||
In 2023, gross margin increased 60 basis points to 47.9% from 47.3% in 2022, principally driven by the positive impact of the combination of product mix and pricing, partially offset by higher input manufacturing costs and unused capacity charges.
In 2022, gross margin increased by 560 basis points to 47.3% from 41.7% in 2021, principally driven by favorable pricing, improved product mix and positive currency effects, net of hedging, partially offset by the inflation of manufacturing input costs. Unused capacity charges in 2022 were $22 million.
Operating expenses
| Year Ended December 31, | Variation | |||||||||||||||||||||||||||||||
| 2023 | 2022 | 2021 | 2023 vs 2022 | 2022 vs 2021 | ||||||||||||||||||||||||||||
| (In millions) | ||||||||||||||||||||||||||||||||
| Selling, general and administrative expenses | $ | (1,631) | $ | (1,454) | $ | (1,323) | (12.2) | % | (9.9) | % | ||||||||||||||||||||||
| Research and development expenses | $ | (2,100) | $ | (1,901) | $ | (1,723) | (10.5) | (10.4) | ||||||||||||||||||||||||
| Total operating expenses | $ | (3,731) | $ | (3,355) | $ | (3,046) | (11.2) | % | (10.2) | % | ||||||||||||||||||||||
| As percentage of net revenues | 21.6 | % | 20.8 | % | 23.9 | % | 80bps | -310bps | ||||||||||||||||||||||||
55
The 2023 operating expenses increased 11.2% from $3,355 million in the prior year, mainly due to increased cost of labor and higher levels of activity, primarily in R&D programs, partially offset by positive currency effects.
The 2022 operating expenses increased 10.2% compared to the prior year, mainly due to higher cost of labor and higher levels of activity primarily in R&D programs, partially offset by positive currency effects, net of hedging.
The R&D expenses were net of research tax credits, which amounted to $126 million in 2023, $106 million in 2022 and $130 million in 2021.
Other income and expenses, net
| Year Ended December 31, | ||||||||||||||||||||
| 2023 | 2022 | 2021 | ||||||||||||||||||
| (In millions) | ||||||||||||||||||||
| Public funding | $ | 201 | $ | 177 | $ | 162 | ||||||||||||||
| Phase-out and start-up costs | $ | (134) | $ | (13) | $ | — | ||||||||||||||
| Exchange gain (loss), net | $ | 5 | $ | 15 | $ | 7 | ||||||||||||||
| Patent costs | $ | (12) | $ | (8) | $ | (10) | ||||||||||||||
| Gain on sale of non-current assets | $ | 6 | $ | 2 | $ | 5 | ||||||||||||||
| COVID-19 incremental costs | $ | — | $ | (10) | $ | (19) | ||||||||||||||
| Other, net | $ | (11) | $ | (4) | $ | (4) | ||||||||||||||
| Other income and expenses, net | $ | 55 | $ | 159 | $ | 141 | ||||||||||||||
| As percentage of net revenues | 0.3 | % | 1.0 | % | 1.2 | % | ||||||||||||||
In 2023 we recognized other income, net, of $55 million, decreasing compared to $159 million in 2022. The decrease was mainly due to higher start-up costs primarily for our new 300mm fab in Agrate, Italy, partially offset by higher income from public funding.
In 2022 we recognized other income, net, of $159 million, increasing compared to $141 million in 2021. The increase was mainly due to higher public funding.
Operating income
| Year Ended December 31, | ||||||||||||||||||||
| 2023 | 2022 | 2021 | ||||||||||||||||||
| (In millions) | ||||||||||||||||||||
| Operating income | $ | 4,611 | $ | 4,439 | $ | 2,419 | ||||||||||||||
| As percentage of net revenues | 26.7 | % | 27.5 | % | 19.0 | % | ||||||||||||||
Operating income in 2023 was $4,611 million, increasing by $172 million compared to 2022, mainly driven by the combining effect of higher revenues and improved gross margin profitability, partially offset by higher operating expenses.
Operating income in 2022 was $4,439 million, increasing by $2,020 million compared to 2021, mainly driven by the combining effect of higher revenues and improved gross margin profitability, partially offset by higher operating expenses.
56
Operating income by product group
| Year Ended December 31, | ||||||||||||||||||||||||||||||||||||||
| 2023 | 2022 | 2021 | ||||||||||||||||||||||||||||||||||||
$ million | % of net revenues | $ million | % of net revenues | $ million | % of net revenues | |||||||||||||||||||||||||||||||||
| ADG | $ | 2,497 | 31.8 | $ | 1,469 | 24.6 | $ | 512 | 11.8 | |||||||||||||||||||||||||||||
| AMS | $ | 690 | 17.3 | $ | 1,237 | 25.2 | $ | 1,022 | 22.5 | |||||||||||||||||||||||||||||
| MDG | $ | 1,838 | 33.8 | $ | 1,830 | 35.0 | $ | 908 | 23.7 | |||||||||||||||||||||||||||||
| Total operating income of product groups | $ | 5,025 | 29.1 | $ | 4,536 | 28.1 | $ | 2,442 | 19.2 | |||||||||||||||||||||||||||||
Others(1) | $ | (414) | — | $ | (97) | — | $ | (23) | — | |||||||||||||||||||||||||||||
| Total consolidated operating income | $ | 4,611 | 26.7 | % | $ | 4,439 | 27.5 | % | $ | 2,419 | 19.0 | % | ||||||||||||||||||||||||||
________________________
(1)Operating income (loss) of “Others” includes items such as unused capacity charges, including unloading charges due to COVID-19 and incidents leading to power outage, impairment, restructuring charges and other related closure costs, management reorganization costs, start-up and phase-out costs, and other unallocated expenses such as: strategic or special R&D programs, certain corporate-level operating expenses, patent claims and litigations, and other costs that are not allocated to product groups, as well as operating earnings of other products.
In 2023, ADG operating income was $2,497 million compared to $1,469 million in 2022, with higher profitability in both Automotive and Power Discrete. AMS operating income decreased by $547 million to $690 million, with all subgroups decreasing. MDG operating income increased by $8 million from $1,830 million in 2022.
In 2022, ADG operating income was $1,469 million compared to $512 million in 2021, with higher profitability in both Automotive and Power Discrete. AMS operating income increased by $215 million to $1,237 million, with all subgroups contributing. MDG operating income increased by $922 million from $908 million in 2021, driven by both Microcontrollers and RF Communications.
Reconciliation to consolidated operating income
| Year Ended December 31, | ||||||||||||||||||||
| 2023 | 2022 | 2021 | ||||||||||||||||||
| (In millions) | ||||||||||||||||||||
| Total operating income of product groups | $ | 5,025 | $ | 4,536 | $ | 2,442 | ||||||||||||||
| Impairment, restructuring charges and other related closure costs | $ | — | $ | — | $ | (2) | ||||||||||||||
| Impairment loss on intangible assets acquired through recent business combinations | $ | (36) | $ | — | $ | — | ||||||||||||||
| Start-up and phase-out costs | $ | (134) | $ | (13) | ||||||||||||||||
| Unused capacity charges | $ | (120) | $ | (22) | $ | (16) | ||||||||||||||
| Other unallocated manufacturing results | $ | (94) | $ | (57) | $ | 1 | ||||||||||||||
| Gain on sale of non-current assets | $ | 4 | $ | 2 | $ | 3 | ||||||||||||||
Strategic and other research and development programs and other non-allocated provisions(1) | $ | (34) | $ | (7) | $ | (9) | ||||||||||||||
| Total operating loss Others | $ | (414) | $ | (97) | $ | (23) | ||||||||||||||
| Total consolidated operating income | $ | 4,611 | $ | 4,439 | $ | 2,419 | ||||||||||||||
(1) Includes unallocated income and expenses such as certain corporate-level operating expenses and other income (costs) that are not allocated to the product groups.
57
Interest income (expense), net
| Year Ended December 31, | ||||||||||||||||||||
| 2023 | 2022 | 2021 | ||||||||||||||||||
| (In millions) | ||||||||||||||||||||
| Interest income (expense), net | $ | 171 | $ | 58 | $ | (29) | ||||||||||||||
In 2023, we recorded a net interest income of $171 million, compared to net interest income of $58 million and a net interest expense of $29 million in 2022 and 2021, respectively. In 2023, net interest income was composed of $226 million of interest income, offset by interest expense on borrowings and banking fees of $55 million. In 2022, net interest income was composed of $71 million of interest income, partially offset by interest expense on borrowings and banking fees of $13 million.
Interest expense includes the financial cost of the convertible bonds issued by the Company in 2020. On January 1, 2022, we adopted the new U.S. GAAP reporting guidance on distinguishing liabilities from equity and EPS, by applying the modified retrospective method, under which prior year periods are not restated. Interest expense recorded in 2021 included a charge of $34 million related to the outstanding senior unsecured convertible bonds, mainly resulting from the non-cash accretion expense, as recorded under the previous accounting guidance. With the adoption of the new guidance, the finance cost of the convertible debt instruments outstanding at the date of adoption is limited to the amortization expense of debt issuance costs. The amortization expense of debt issuance costs amounted to $1 million for the year ended December 31, 2023, $1 million for the year ended December 31, 2022 and $3 million for the year ended December 31, 2021.
In 2021, interest expense on our borrowings and banking fees amounted to $42 million, of which $34 million was a non-cash interest expense resulting from the accretion of the liability component of our senior unsecured convertible bonds. The interest expense was partially offset by $13 million of interest income on cash and cash equivalents, short-term deposits and marketable securities.
Income tax expense
| Year Ended December 31, | ||||||||||||||||||||
| 2023 | 2022 | 2021 | ||||||||||||||||||
| (In millions) | ||||||||||||||||||||
| Income tax expense | $ | (541) | $ | (520) | $ | (331) | ||||||||||||||
In 2023, we registered an income tax expense of $541 million, compared to $520 million in 2022 and $331 million in 2021. These amounts reflect the actual taxes calculated on our income before income taxes in each of our jurisdictions and tax benefits, net of valuation allowances, associated with our estimates of the net operating loss realization, in certain jurisdictions, against future taxable profits, one-time tax benefits related to previous year positions and our best estimate of additional tax charges related to potential uncertain tax positions and claims.
In 2023, the effective tax rate was 15%, before $174 million of tax benefit from discrete items, which included a one-time non-cash income tax benefit of $191 million.
In 2022, the effective tax rate was 15%, before $133 million of tax benefit from discrete items, which included a one-time non-cash income tax benefit of $140 million.
In 2021, the effective tax rate was 15%, before $17 million of tax benefit from discrete items.
Our tax rate is variable and depends on changes in the level of operating results within various local jurisdictions and on changes in the taxation rates applicable in these jurisdictions, as well as changes in estimates and assumptions used when assessing our tax positions. Our income tax amounts and rates depend also on our loss carry-forwards and their relevant valuation allowances, which are based on estimated projected plans and available tax planning; in the case of material changes to these plans, the valuation allowances could be adjusted accordingly with an impact on our income tax expense (benefit). We currently enjoy certain tax benefits in some countries. Such benefits may not be available in the future due to changes in the local jurisdictions; our effective tax rate could be different in future periods and may increase in the coming years. In
58
addition, our yearly income tax expense includes the estimated impact of provisions related to income tax positions which have been considered as uncertain.
Net income attributable to noncontrolling interest
| Year Ended December 31, | ||||||||||||||||||||
| 2023 | 2022 | 2021 | ||||||||||||||||||
| (In millions) | ||||||||||||||||||||
| Net income attributable to noncontrolling interest | $ | (11) | $ | (6) | $ | (6) | ||||||||||||||
Net income attributable to noncontrolling interest amounted to $11 million in 2023 and $6 million in 2022 and 2021.
Net income attributable to parent company
| Year Ended December 31, | ||||||||||||||||||||
| 2023 | 2022 | 2021 | ||||||||||||||||||
| (In millions) | ||||||||||||||||||||
| Net income attributable to parent company | $ | 4,211 | $ | 3,960 | $ | 2,000 | ||||||||||||||
| As percentage of net revenues | 24.4 | % | 24.6 | % | 15.7 | % | ||||||||||||||
For 2023, we reported a net income attributable to parent company of $4,211 million, compared to $3,960 million and $2,000 million for 2022 and 2021, respectively.
The 2023 net income attributable to parent company represented diluted earnings per share of $4.46 compared to $4.19 and $2.16 for 2022 and 2021, respectively.
Diluted earnings per share for the years 2023 and 2022 included the full dilutive effect of our outstanding convertible debt upon adoption of the newly applicable U.S. GAAP reporting guidance on January 1, 2022. Prior year period has not been restated.
Quarterly Results of Operations
Certain quarterly financial information for the years 2023 and 2022 are set forth below. Such information is derived from our unaudited Consolidated Financial Statements, prepared on a basis consistent with the audited Consolidated Financial Statements that include, in our opinion, all normal adjustments necessary for a fair statement of the interim information set forth therein. Operating results for any quarter are not necessarily indicative of results for any future period. In addition, in view of the significant volatility we have experienced in recent years, the increasingly competitive nature of the markets in which we operate, the changes in products mix and the currency effects of changes in the composition of sales and production among different geographic regions, we believe that period-to-period comparisons of our operating results should not be relied upon as an indication of future performance.
Our quarterly and annual operating results are also affected by a wide variety of other factors that could materially and adversely affect revenues and profitability or lead to significant variability of operating results, please see “Item 3. Key Information — Risk Factors — Risks Related to Our Operations”. As only a portion of our expenses varies with our revenues, there can be no assurance that we will be able to reduce costs promptly or adequately in relation to revenue declines to compensate for the effect of any such factors. As a result, unfavorable changes in the above or other factors have in the past and may in the future adversely affect our operating results. Quarterly results have also been and may be expected to continue to be substantially affected by the cyclical nature of the semiconductor and electronic systems industries, the speed of some process and manufacturing technology developments, market demand for existing products, the timing and success of new product introductions and the levels of provisions and other unusual charges incurred. Certain additions of our quarterly results will not total our annual results due to rounding.
59
Net revenues
| Three Months Ended | % Variation | |||||||||||||||||||||||||||||||
| December 31, 2023 | September 30, 2023 | December 31, 2022 | Sequential | Year- Over- Year | ||||||||||||||||||||||||||||
| (Unaudited, in millions) | ||||||||||||||||||||||||||||||||
| Net sales | $ | 4,262 | $ | 4,416 | $ | 4,408 | (3.5) | % | (3.3) | % | ||||||||||||||||||||||
| Other revenues | $ | 20 | $ | 15 | $ | 16 | 34.4 | 30.1 | ||||||||||||||||||||||||
| Net revenues | $ | 4,282 | $ | 4,431 | $ | 4,424 | (3.4) | % | (3.2) | % | ||||||||||||||||||||||
Our fourth quarter 2023 net revenues amounted to $4,282 million, registering a sequential decrease of 3.4%, 40 basis points below the mid-point of the released guidance. The sequential decrease resulted from lower volumes of approximately 3%.
On a year-over-year basis, our net revenues decreased by 3.2%. This decrease was mainly due to lower volumes of approximately 10%, partially offset by higher average selling prices of approximately 7%, driven by a more favorable product mix.
Net revenues by product group
| Three Months Ended | % Variation | |||||||||||||||||||||||||||||||
| December 31, 2023 | September 30, 2023 | December 31, 2022 | Sequential | Year- Over- Year | ||||||||||||||||||||||||||||
| (Unaudited, in millions) | ||||||||||||||||||||||||||||||||
| ADG | $ | 2,060 | $ | 2,025 | $ | 1,696 | 1.7 | % | 21.5 | % | ||||||||||||||||||||||
| AMS | $ | 993 | $ | 990 | $ | 1,339 | 0.4 | (25.8) | ||||||||||||||||||||||||
| MDG | $ | 1,225 | $ | 1,412 | $ | 1,383 | (13.3) | (11.5) | ||||||||||||||||||||||||
| Others | $ | 4 | $ | 4 | $ | 6 | — | — | ||||||||||||||||||||||||
| Total consolidated net revenues | $ | 4,282 | $ | 4,431 | $ | 4,424 | (3.4) | % | (3.2) | % | ||||||||||||||||||||||
On a sequential basis, ADG revenues were up 1.7%, driven by an approximate 12% increase in average selling prices, mainly due to a more favorable product mix, partially offset by lower volumes of approximately 10%. AMS revenues remained substantially flat as lower average selling prices of 7% were fully offset by higher volumes of approximately 7%. MDG revenues decreased 13.3% due to lower average selling prices of approximately 13%, mainly due to a less favorable product mix.
On a year-over-year basis, fourth quarter net revenues decreased 3.2%. ADG revenues increased 21.5% compared to the year-ago quarter due to higher average selling prices of approximately 37%, due to a better product mix and higher selling prices, partially offset by lower volumes of approximately 15%. AMS quarter revenues decreased 25.8% year-over-year due to lower average selling prices of approximately 21%, mainly due to a less favorable product mix, and lower volumes of approximately 5%. MDG fourth quarter revenues decreased 11.5%, driven by lower average selling prices of approximately 8%, and lower volumes of approximately 4%.
Net Revenues by Market Channel(1)
| Three Months Ended | ||||||||||||||||||||
| December 31, 2023 | September 30, 2023 | December 31, 2022 | ||||||||||||||||||
| (Unaudited, in %) | ||||||||||||||||||||
| OEM | 70 | % | 67 | % | 68 | % | ||||||||||||||
| Distribution | 30 | 33 | 32 | |||||||||||||||||
| Total | 100 | % | 100 | % | 100 | % | ||||||||||||||
60
(1) Original Equipment Manufacturers (“OEM”) are the end-customers to which we provide direct marketing application engineering support, while Distribution refers to the distributors and representatives that we engage to distribute our products around the world.
By market channel, our fourth quarter revenues in Distribution amounted to 30% of our total net revenues, 3% and 2% lower compared to the previous and year-ago quarters, respectively.
Net Revenues by Location of Shipment(1)
| Three Months Ended | % Variation | |||||||||||||||||||||||||||||||
| December 31, 2023 | September 30, 2023 | December 31, 2022 | Sequential | Year- Over- Year | ||||||||||||||||||||||||||||
| (Unaudited, in millions) | ||||||||||||||||||||||||||||||||
| EMEA | $ | 1,174 | $ | 1,231 | $ | 1,065 | (4.6) | % | 10.3 | % | ||||||||||||||||||||||
| Americas | $ | 654 | $ | 685 | $ | 669 | (4.4) | (2.2) | ||||||||||||||||||||||||
| Asia Pacific | $ | 2,454 | $ | 2,515 | $ | 2,690 | (2.4) | (8.8) | ||||||||||||||||||||||||
| Total consolidated net revenues | $ | 4,282 | $ | 4,431 | $ | 4,424 | (3.4) | % | (3.2) | % | ||||||||||||||||||||||
(1) Net revenues by location of shipment are classified by location of customer invoiced or reclassified by shipment destination in line with customer demand. For example, products ordered by U.S.-based companies to be invoiced to Asia Pacific affiliates are classified as Asia Pacific revenues. Furthermore, the comparison among the different periods may be affected by shifts in shipments from one location to another, as requested by our customers.
By region of shipment, in the 2023 fourth quarter, EMEA revenues decreased 4.6%, mainly driven by lower sales in Microcontrollers partially offset by higher revenues in Automotive. Americas revenues decreased 4.4%, mainly due to lower sales in Microcontrollers partially offset by RF Communications. Asia Pacific revenues decreased by 2.4%, mainly due to lower sales in Microcontrollers and Imaging, partially offset by higher sales in the Automotive sub-group.
On a year-over-year basis, EMEA revenues grew 10.3%, mainly driven by higher sales in Automotive partially offset by lower sales in Microcontrollers. Americas revenues decreased 2.2%, mainly due to lower sales in Microcontrollers partially offset by higher sales in RF Communications. Asia Pacific revenues decreased 8.8%, mainly due to lower sales in Imaging and Microcontrollers, partially offset by higher sales in the Automotive and Power Discrete sub-groups.
Gross Profit
| Three Months Ended | Variation | |||||||||||||||||||||||||||||||
| December 31, 2023 | September 30, 2023 | December 31, 2022 | Sequential | Year- Over- Year | ||||||||||||||||||||||||||||
| (Unaudited, in millions) | ||||||||||||||||||||||||||||||||
| Cost of sales | $ | (2,333) | $ | (2,322) | $ | (2,322) | 0.5 | % | 0.5 | % | ||||||||||||||||||||||
| Gross profit | $ | 1,949 | $ | 2,109 | $ | 2,102 | (7.6) | % | (7.3) | % | ||||||||||||||||||||||
| Gross margin (as percentage of net revenues) | 45.5 | % | 47.6 | % | 47.5 | % | -210bps | 200 bps | ||||||||||||||||||||||||
Fourth quarter gross profit was $1,949 million and gross margin was 45.5%, 50 basis points below the mid-point of our guidance, mainly due to a less favorable product mix. On a sequential basis, gross margin decreased by 210 basis points mainly due to a less favorable product mix, negative sales price impact, and higher unused capacity charges. On a year-over-year basis, gross margin decreased 200 basis points, due to higher input manufacturing costs, unused capacity charges, and negative currency effect net of hedging, partially offset by the combination of sales price and product mix.
61
Operating expenses
| Three Months Ended | % Variation | |||||||||||||||||||||||||||||||
| December 31, 2023 | September 30, 2023 | December 31, 2022 | Sequential | Year- Over- Year | ||||||||||||||||||||||||||||
| (Unaudited, in millions) | ||||||||||||||||||||||||||||||||
| Selling, general and administrative expenses | $ | (416) | $ | (407) | $ | (378) | (2.5) | % | (10.2) | % | ||||||||||||||||||||||
| Research and development expenses | $ | (521) | $ | (519) | $ | (472) | (0.3) | (10.3) | ||||||||||||||||||||||||
| Total operating expenses | $ | (937) | $ | (926) | $ | (850) | (1.2) | % | (10.2) | % | ||||||||||||||||||||||
| As percentage of net revenues | 21.9 | % | 20.9 | % | 19.2 | % | 100 bps | 270 bps | ||||||||||||||||||||||||
On a sequential basis, operating expenses increased by $11 million, mainly due to seasonality associated with lower vacation days.
On a year-over-year basis, operating expenses increased by $87 million, mainly due to higher cost of labor, negative currency effects and higher levels of activity, primarily in R&D programs.
R&D expenses were net of research tax credits, which amounted to $33 million in the fourth quarter of 2023, compared to $27 million and $33 million in the prior and year-ago quarters, respectively.
Other income and expenses, net
| Three Months Ended | ||||||||||||||||||||
| December 31, 2023 | September 30, 2023 | December 31, 2022 | ||||||||||||||||||
| (Unaudited, in millions) | ||||||||||||||||||||
| Public funding | $ | 56 | $ | 93 | $ | 47 | ||||||||||||||
| Start-up and phase-out costs | $ | (34) | $ | (33) | $ | (11) | ||||||||||||||
| Exchange gain (loss), net | $ | (2) | $ | 5 | $ | 2 | ||||||||||||||
| Patent costs | $ | (4) | $ | (3) | $ | (1) | ||||||||||||||
| Gain on sale of non-current assets | $ | — | $ | 1 | $ | — | ||||||||||||||
| COVID-19 incremental costs | $ | — | $ | — | $ | (1) | ||||||||||||||
| Other, net | $ | (5) | $ | (5) | $ | (1) | ||||||||||||||
| Other income and expenses, net | $ | 11 | $ | 58 | $ | 35 | ||||||||||||||
| As percentage of net revenues | 0.2 | % | 1.3 | % | 0.8 | % | ||||||||||||||
Fourth quarter other income and expenses, net, amounted to $11 million, compared to $58 million in the prior quarter and $35 million in the year-ago quarter. The sequential decrease was mainly due to lower income from public funding. The year-over-year decrease was principally driven by higher start-up costs.
Operating income
| Three Months Ended | ||||||||||||||||||||
| December 31, 2023 | September 30, 2023 | December 31, 2022 | ||||||||||||||||||
| (Unaudited, in millions) | ||||||||||||||||||||
| Operating income | $ | 1,023 | $ | 1,241 | $ | 1,287 | ||||||||||||||
| As percentage of net revenues | 23.9 | % | 28.0 | % | 29.1 | % | ||||||||||||||
In the fourth quarter of 2023, operating income was $1,023 million, compared to an operating income of $1,241 million and $1,287 million in the prior and year-ago quarters, respectively.
62
The sequential decrease was mainly due to lower gross profit and decreased R&D funding. The year-over-year decrease was mainly due to lower revenues, decreased gross margin profitability and higher operating expenses.
Operating income by product group
| Three Months Ended | ||||||||||||||||||||||||||||||||||||||
| December 31, 2023 | September 30, 2023 | December 31, 2022 | ||||||||||||||||||||||||||||||||||||
| $ million | % of net revenues | $ million | % of net revenues | $ million | % of net revenues | |||||||||||||||||||||||||||||||||
| (Unaudited) | ||||||||||||||||||||||||||||||||||||||
| ADG | $ | 657 | 31.9 | % | $ | 638 | 31.5 | % | $ | 470 | 27.7 | % | ||||||||||||||||||||||||||
| AMS | $ | 147 | 14.8 | $ | 186 | 18.8 | $ | 346 | 25.8 | |||||||||||||||||||||||||||||
| MDG | $ | 342 | 28.0 | $ | 496 | 35.1 | $ | 495 | 35.8 | |||||||||||||||||||||||||||||
| Total operating income of product groups | $ | 1,146 | 26.8 | $ | 1,320 | 29.8 | $ | 1,311 | 29.7 | |||||||||||||||||||||||||||||
Others(1) | $ | (123) | — | $ | (79) | — | $ | (24) | — | |||||||||||||||||||||||||||||
| Total consolidated operating income | $ | 1,023 | 23.9 | % | $ | 1,241 | 29.4 | % | $ | 1,287 | 29.1 | % | ||||||||||||||||||||||||||
(1) Effective July 1, 2022, the Low Power RF business unit was transferred from AMS to MDG with no significant impact on segment reporting. Prior year periods have been adjusted accordingly.
(2) Operating income (loss) of “Others” includes items such as unused capacity charges, including unloading charges due to COVID-19 and incidents leading to power outage, impairment, restructuring charges and other related closure costs, management reorganization costs, start-up and phase-out costs, and other unallocated expenses such as: strategic or special R&D programs, certain corporate-level operating expenses, patent claims and litigations, and other costs that are not allocated to product groups, as well as operating earnings of other products.
On a sequential basis, ADG fourth quarter operating income improved by $19 million, driven by Automotive. AMS operating income decreased sequentially by $39 million, due to lower profitability in Imaging. MDG operating income decreased by $154 million sequentially due to lower profitability in Microcontrollers.
On a year-over-year basis, ADG operating income increased by $187 million, reflecting higher profitability in Automotive. AMS operating income decreased by $199 million, due to lower profitability in all sub-groups. MDG operating income decreased by $153 million, driven by Microcontrollers partially offset by higher profitability in RF Communications.
Reconciliation to consolidated operating income
| Three Months Ended | ||||||||||||||||||||
| December 31, 2023 | September 30, 2023 | December 31, 2022 | ||||||||||||||||||
| (Unaudited, in millions) | ||||||||||||||||||||
| Total operating income of product groups | $ | 1,146 | $ | 1,320 | $ | 1,311 | ||||||||||||||
| Total operating income of product groups | $ | 1,146 | $ | 1,320 | $ | 1,311 | ||||||||||||||
| Impairment loss on intangible assets acquired through business combinations | $ | — | $ | — | $ | — | ||||||||||||||
| Start-up and phase-out costs | $ | (34) | $ | (33) | $ | (11) | ||||||||||||||
| Unused capacity charges | $ | (57) | $ | (46) | $ | — | ||||||||||||||
| Other unallocated manufacturing results | $ | (30) | $ | (3) | $ | 2 | ||||||||||||||
| Gain on sale of non-current assets | $ | — | $ | — | $ | — | ||||||||||||||
| Strategic and other R&D programs and other non-allocated provisions | $ | (2) | $ | 3 | $ | (15) | ||||||||||||||
| Total operating income (loss) Others | $ | (123) | $ | (79) | $ | (24) | ||||||||||||||
| Total consolidated operating income | $ | 1,023 | $ | 1,241 | $ | 1,287 | ||||||||||||||
63
Interest income (expense), net
| Three Months Ended | ||||||||||||||||||||
| December 31, 2023 | September 30, 2023 | December 31, 2022 | ||||||||||||||||||
| (Unaudited, in millions) | ||||||||||||||||||||
| Interest income (expense), net | $ | 57 | $ | 44 | $ | 33 | ||||||||||||||
In the fourth quarter of 2023, we recorded net interest income of $57 million, compared to $44 million in the prior quarter and $33 million of net interest expense in the year-ago quarter. The fourth quarter net interest income was composed of $71 million of interest income, partially offset by $14 million of interest expenses on our borrowings and banking fees.
Income tax benefit (expense)
| Three Months Ended | ||||||||||||||||||||
| December 31, 2023 | September 30, 2023 | December 31, 2022 | ||||||||||||||||||
| (Unaudited, in millions) | ||||||||||||||||||||
| Income tax benefit (expense) | 6 | (188) | (66) | |||||||||||||||||
During the fourth quarter of 2023 we recorded an income tax benefit of $6 million while for the third quarter of 2023 and the fourth quarter of 2022, we recorded an income tax expense of $188 million and $66 million, respectively.
The fourth quarter of 2023 income tax expense included a one-time tax benefit of $191 million.
Net income attributable to parent company
| Three Months Ended | ||||||||||||||||||||
| December 31, 2023 | September 30, 2023 | December 31, 2022 | ||||||||||||||||||
| Net income attributable to parent company | $ | 1,076 | $ | 1,090 | $ | 1,248 | ||||||||||||||
| As percentage of net revenues | 25.1 | % | 24.6 | % | 28.2 | % | ||||||||||||||
For the fourth quarter of 2023, we reported a net income of $1,076 million, compared to a net income of $1,090 million and $1,248 million in the prior and year-ago quarters, respectively. For the fourth quarter 2023, net income represented diluted earnings per share of $1.14 compared to $1.16 in the prior quarter and $1.32 in the prior-year quarter.
Impact of Changes in Exchange Rates
Our results of operations and financial condition can be significantly affected by material changes in the exchange rates between the U.S. dollar and other currencies, particularly the Euro.
As a market practice, the reference currency for the semiconductor industry is the U.S. dollar and the market prices of semiconductor products are mainly denominated in U.S. dollars. However, revenues for some of our products are quoted in currencies other than the U.S. dollar, such as Euro-denominated sales, and consequently are directly affected by fluctuations in the value of the U.S. dollar. As a result of currency variations, the appreciation of the Euro compared to the U.S. dollar could increase our level of revenues when translated into U.S. dollars or the depreciation of the Euro compared to the U.S. dollar could decrease our level of revenues when reported in U.S. dollars. Over time and depending on market conditions, the prices in the industry could align to the equivalent amount in U.S. dollars, except that there is a lag between the changes in
64
the currency rate and the adjustment in the price paid in local currency, which is proportional to the amplitude of the currency swing, and such adjustment could be only partial and/or delayed, depending on market demand. Furthermore, certain significant costs incurred by us, such as manufacturing costs, SG&A expenses, and R&D expenses, are largely incurred in the currency of the jurisdictions in which our operations are located. Given that most of our operations are located in the Eurozone and other non-U.S. dollar currency areas, including Singapore, our costs tend to increase when translated into U.S. dollars when the U.S. dollar weakens or to decrease when the U.S. dollar strengthens.
Our principal strategy to reduce the risks associated with exchange rate fluctuations is to balance as much as possible the proportion of sales to our customers denominated in U.S. dollars with the amount of materials, purchases and services from our suppliers denominated in U.S. dollars, thereby reducing the potential exchange rate impact of certain variable costs relative to revenues. Moreover, in order to further reduce the exposure to U.S. dollar exchange fluctuations, we hedge certain line items on our consolidated statements of income, in particular with respect to a portion of cost of sales, most of R&D expenses and certain SG&A expenses, located in the Eurozone, which we designate as cash flow hedge transactions. We use two different types of hedging instruments: forward contracts and currency options (including collars).
Our consolidated statements of income included income and expense items translated at the average U.S. dollar exchange rate for the period, plus the impact of the hedging contracts expiring during the period. Our effective average exchange rate was $1.08 for €1.00 for the full year 2023 and $1.10 for €1.00 for the full year 2022. Our effective exchange rate was $1.08 for €1.00 for the fourth quarter of 2023, $1.09 for €1.00 for the third quarter of 2023 and $1.04 for €1.00 for the fourth quarter of 2022. These effective exchange rates reflect the actual exchange rates combined with the effect of cash flow hedge transactions impacting earnings in the period.
The time horizon of our cash flow hedging for manufacturing costs and operating expenses may run up to 24 months, for a limited percentage of our exposure to the Euro, depending on currency market circumstances. As of December 31, 2023, the outstanding hedged amounts were €1,591 million to cover manufacturing costs and €685 million to cover operating expenses, at an average exchange rate of approximately $1.10 for €1.00 (considering the collars at upper strike), maturing from January 4, 2024 to January 6, 2025. As of December 31, 2023, measured in respect to the exchange rate at period closing of about $1.10 to €1.00, these outstanding hedging contracts and certain settled contracts covering manufacturing expenses capitalized in inventory resulted in a deferred gain of approximately $54 million before tax, recorded in “Accumulated other comprehensive income” in the consolidated statements of equity, compared to a deferred gain of approximately $17 million before tax as of December 31, 2022.
We also hedge certain manufacturing costs denominated in Singapore dollars (SGD); as of December 31, 2023, the outstanding hedged amounts were SGD 219 million at an average exchange rate of about SGD 1.33 to $1.00 maturing over the period from January 4, 2024 to November 27, 2024. As of December 31, 2023, the deferred gain of these outstanding hedging contracts were $3 million, compared to deferred gain of approximately $6 million before tax as of December 31, 2022.
Our cash flow hedging policy is not intended to cover our full exposure and is based on hedging a declining portion of our exposure in the next four quarters. In 2023, as a result of our cash flow hedging, we recycled to earnings a gain of $5 million, composed of a $1 million gain impacting cost of sales, a $3 million gain impacting R&D and a $1 million gain impacting SG&A expenses. In 2022, as a result of our cash flow hedging, we recycled to earnings a loss of $197 million, composed of a $129 million loss impacting cost of sales, a $53 million loss impacting R&D and $15 million loss impacting SG&A expenses.
In addition to our cash flow hedging, in order to mitigate potential exchange rate risks on our commercial transactions, we purchase and enter into foreign exchange forward contracts and currency options to cover foreign currency exposure in payables or receivables at our affiliates, which we do not designate for hedge accounting. We may in the future purchase or sell similar types of instruments. See “Item 11. Quantitative and Qualitative Disclosures About Market Risk” in our Form 20-F. Furthermore, we may not predict on a timely basis the amount of future transactions in the volatile industry environment. No assurance may be given that our hedging activities will sufficiently protect us against fluctuations in the value of the U.S. dollar. Consequently, our results of operations have been and may continue to be impacted by fluctuations in exchange rates. The net effect of our consolidated foreign exchange exposure in payables and receivables at our affiliates resulted in a
65
net gain of $5 million recorded in “Other income and expenses, net” in our 2023 consolidated statement of income compared to a net gain of $15 million and $7 million in 2022 and 2021, respectively.
The assets and liabilities of subsidiaries whose functional currency is different from the U.S. dollar reporting currency are, for consolidation purposes, translated into U.S. dollars at the period-end exchange rate. Income and expenses, as well as cash flows, are translated at the average exchange rate for the period. The balance sheet impact, as well as the income statement and cash flow impact, of these currency translations have been, and may be, significant from period to period since a large part of our assets and liabilities and activities are accounted for in Euros as they are located in jurisdictions where the Euro is the functional currency. Adjustments resulting from the currency translation are recorded directly in equity and are reported as “Accumulated other comprehensive income” in the consolidated statements of equity. As of December 31, 2023, our outstanding indebtedness was denominated mainly in U.S. dollars and in Euros.
For a more detailed discussion, see “Item 3. Key Information — Risk Factors — Risks Related to Our Operations”.
Impact of Changes in Interest Rates
Interest rates may fluctuate upon changes in financial market conditions and material changes can affect our results of operations and financial condition, since these changes can impact the total interest income received on our cash and cash equivalents, short-term deposits and marketable securities, as well as the total interest expense paid on our financial debt.
Our interest income (expense), net, as reported in our consolidated statements of income, is the balance between interest income received from our cash and cash equivalents, short-term deposits and marketable securities and interest expense recorded on our financial liabilities, including bank fees (including fees on committed credit lines or on the sale without recourse of receivables, if any). Our interest income is dependent upon fluctuations in interest rates, mainly in U.S. dollars and Euros, since we invest primarily on a short-term basis; any increase or decrease in the market interest rates would mean a proportional increase or decrease in our interest income. Our interest expenses are also dependent upon fluctuations in interest rates since our financial liabilities include European Investment Bank (“EIB”) and Cassa Depositi e Prestiti SpA (“CDP SpA”) Floating Rate Loans at Euribor plus variable spreads. See Note 15 to our Consolidated Financial Statements.
As of December 31, 2023, our total financial resources, including cash and cash equivalents, short-term deposits and marketable securities, generated an average annual interest rate of 5.11%. At the same date, the average annual interest rate on our outstanding debt was 2.20%.
A rise in interest rates to address inflation or otherwise will also impact the base rates applicable in our credit arrangements and will result in borrowed funds becoming more expensive to us over time. These financing and inflationary pressures may also reduce disposable income on a macro-economic basis, eroding the values of savings, and could have a negative impact on our customers’ ability to purchase our products in the same volumes.
Impact of Changes in Equity Prices
As of December 31, 2023, we did not hold any significant investments in equity securities with a material exposure to equity price risk. However, on these equity investments, carrying value could be reduced due to further losses or impairment charges. See Note 12 and Note 13 to our Consolidated Financial Statements.
Liquidity and Capital Resources
Treasury activities are regulated by our policies, which define procedures, objectives and controls. Our policies focus on the management of our financial risk in terms of exposure to currency rates and interest rates. Most treasury activities are centralized, with any local treasury activities subject to oversight from our head treasury office. The majority of our cash and cash equivalents are held in U.S. dollars and Euros and are placed with financial institutions rated at least as single A long-term rating from two of the major rating agencies, meaning at least A3 from Moody’s Investors Service (“Moody’s”) and A- from Standard & Poor’s (“S&P”) or Fitch Ratings (“Fitch”). Marginal amounts are held in other currencies. See “Item 11. Quantitative and Qualitative Disclosures About Market Risk”.
66
Our total liquidity was $6,083 million as of December 31, 2023, increasing compared to $4,518 million as of December 31, 2022. As of December 31, 2023, our total liquidity was comprised of $3,222 million in cash and cash equivalents, $1,226 million in short-term deposits and $1,635 million in marketable securities, all classified as current assets.
As of December 31, 2023, marketable securities were $1,635 million invested in U.S. Treasury Bonds, with a rating of Aaa/AA+/AA+ from Moody’s, S&P and Fitch, respectively, and a weighted average maturity of 1.6 years. The securities are classified as available-for-sale and reported at fair value. This fair value measurement corresponds to a Level 1 fair value hierarchy measurement. To optimize the return yield on our short-term investments, we also held $1,226 million of available cash in short-term deposits as of December 31, 2023. These short-term deposits represent liquidity with maturity beyond three months and below one year with no significant risk of changes in fair value.
Cash flow
We maintain an adequate cash position and a low debt-to-equity ratio to provide us with adequate financial flexibility. As in the past, our cash management policy is to finance our investment needs mainly with net cash from operating activities.
During 2023, our cash and cash equivalents decreased by $36 million. The components of the net cash decrease for 2023 and the comparable periods are set forth below:
| Year Ended December 31, | ||||||||||||||||||||
| 2023 | 2022 | 2021 | ||||||||||||||||||
| (In millions) | ||||||||||||||||||||
| Net cash from operating activities | $ | 5,992 | $ | 5,202 | $ | 3,060 | ||||||||||||||
| Net cash used in investing activities | $ | (5,766) | $ | (4,591) | $ | (1,518) | ||||||||||||||
| Net cash used in financing activities | $ | (267) | $ | (567) | $ | (1,314) | ||||||||||||||
| Effect of changes in exchange rates | $ | 5 | $ | (11) | $ | (9) | ||||||||||||||
| Net cash increase (decrease) | $ | (36) | $ | 33 | $ | 219 | ||||||||||||||
Net cash from operating activities. Net cash from operating activities is the sum of (i) net income adjusted for non-cash items and (ii) changes in net working capital. The net cash from operating activities in 2023 was $5,992 million compared to $5,202 million in the prior year, increasing mainly due to higher net income adjusted for non-cash items.
Net cash used in investing activities. Investing activities used $5,766 million in 2023, increasing from $4,591 million in the prior year, mainly due to increased payments for net purchase of tangible assets which totaled $4,111 million compared to $3,524 million in the prior year, higher purchases of marketable securities and net investment in short-term deposits, partially offset by proceeds from marketable securities. Capital investments for the year 2023 included (i) investments in advanced wafer fabs, such as the 300mm fab in Crolles, France and the 300mm fab in Agrate, Italy; (ii) SiC activities, primarily in Singapore and Catania, Italy; and (iii) in selected programs of capacity growth in other front-end and back-end activities.
Net cash used in financing activities. Net cash used in financing activities was $267 million in 2023, compared to net cash used in financing activities of $567 million in 2022, and consisted mainly of $346 million repurchase of common stock, $223 million of dividends paid to our stockholders and $169 million repayment of long-term debt, partially offset primarily by $329 million of proceeds from a new drawdown from our existing credit facility with EIB.
Free Cash Flow (non-U.S. GAAP measure). We also present Free Cash Flow, which is a non-U.S. GAAP measure, defined as (i) net cash from operating activities plus (ii) net cash used in investing activities, excluding payment for purchase of (and proceeds from matured) marketable securities, and net investment in (and proceeds from) short-term deposits, which are considered as temporary financial investments. This definition ultimately results in net cash from operating activities plus payment for purchase (and proceeds from sale) of tangible, intangible and financial assets, proceeds from capital grants and other contributions, and net cash paid for business acquisitions, if any.
67
We believe Free Cash Flow provides useful information for investors and management because it measures our capacity to generate cash from our operating and investing activities to sustain our operations. Free Cash Flow does not represent total cash flow since it does not include the cash flows from, or used in, financing activities.
Free Cash Flow reconciles with the total cash flow and the net cash increase (decrease) by including the payment for purchases of (and proceeds from matured) marketable securities and net investment in (and proceeds from) short-term deposits, the net cash from (used in) financing activities and the effect of changes in exchange rates. Our definition of Free Cash Flow may differ from definitions used by other companies. Free Cash Flow is determined from our unaudited interim consolidated statements of cash flows as follows:
| Year Ended December 31, | ||||||||||||||||||||
| 2023 | 2022 | 2021 | ||||||||||||||||||
| (In millions) | ||||||||||||||||||||
| Net cash from operating activities | $ | 5,992 | $ | 5,202 | $ | 3,060 | ||||||||||||||
| Payment for purchase of tangible assets, net of proceeds from sale and proceeds from capital grants and other contributions | $ | (4,111) | $ | (3,524) | $ | (1,828) | ||||||||||||||
| Payment for purchase of intangible assets, net of proceeds from sale | $ | (97) | $ | (87) | $ | (97) | ||||||||||||||
| Payment for purchase of financial assets, net of proceeds from sale | $ | (10) | $ | — | $ | (15) | ||||||||||||||
Free Cash Flow (non-U.S. GAAP measure)(1) | $ | 1,774 | $ | 1,591 | $ | 1,120 | ||||||||||||||
(1) Free Cash Flow can also be expressed as Net cash from operating and investing activities, excluding cash from (used in) marketable securities and short-term deposits.
In 2023, we had a positive Free Cash Flow of $1,774 million, compared to positive $1,591 million and positive $1,120 million in 2022 and 2021, respectively.
Capital Resources
Net Financial Position and Adjusted Net Financial Position (non-U.S. GAAP measures). Our Net Financial Position represents the difference between our total liquidity and our total financial debt. Our total liquidity includes cash and cash equivalents, short-term deposits and marketable securities, and our total financial debt includes short-term debt and long-term debt, as reported in our consolidated balance sheets. Adjusted Net Financial Position represents net financial position less advances from capital grants, to present the effect on total liquidity of advances received on capital grants for which capital expenditures have not been incurred yet. Prior periods are not impacted. Net Financial Position and Adjusted Net Financial Position are not U.S. GAAP measures, but we believe they provide useful information for investors and management because they give evidence of our global position either in terms of net indebtedness or net cash by measuring our capital resources based on cash and cash equivalents, restricted cash, if any, short-term deposits and marketable securities and the total level of our financial debt. Our definition of Net Financial Position may differ from definitions used by other companies and therefore comparability may be limited. Our Net Financial Position and Adjusted Net Financial Position for each period have been determined from our consolidated balance sheets as follows:
68
| Year Ended December 31, | ||||||||||||||||||||
| 2023 | 2022 | 2021 | ||||||||||||||||||
| (In millions) | ||||||||||||||||||||
| Cash and cash equivalents | $ | 3,222 | $ | 3,258 | $ | 3,225 | ||||||||||||||
| Short-term deposits | $ | 1,226 | $ | 581 | $ | 291 | ||||||||||||||
| Marketable securities | $ | 1,635 | $ | 679 | $ | — | ||||||||||||||
| Total liquidity | $ | 6,083 | $ | 4,518 | $ | 3,516 | ||||||||||||||
| Short-term debt | $ | (217) | $ | (175) | $ | (143) | ||||||||||||||
| Long-term debt | $ | (2,710) | $ | (2,542) | $ | (2,396) | ||||||||||||||
| Total financial debt | $ | (2,927) | $ | (2,717) | $ | (2,539) | ||||||||||||||
| Net Financial Position | $ | 3,156 | $ | 1,801 | $ | 977 | ||||||||||||||
| Advances from capital grants | $ | (152) | $ | — | $ | — | ||||||||||||||
| Adjusted Net Financial Position | $ | 3,004 | $ | 1,801 | $ | 977 | ||||||||||||||
Our Net Financial Position as of December 31, 2023 was a net cash position of $3,156 million, increasing compared to a net cash position of $1,801 million as of December 31, 2022.
Cash and cash equivalents amounted to $3,222 million as of December 31, 2023.
Short-term deposits amounted to $1,226 million as of December 31, 2023 and consisted of available liquidity with maturity over three months and below one year.
Marketable securities amounted to $1,635 million as of December 31, 2023 and consisted of U.S. Treasury Bonds classified as available-for-sale.
Financial debt was $2,927 million, as of December 31, 2023 and was composed of (i) $217 million of short-term debt and (ii) $2,710 million of long-term debt. The breakdown of our total financial debt included (i) $1,077 million in EIB loans, (ii) $284 million in CDP SpA loans, (iii) $1,496 million in our 2020 Senior Unsecured Convertible Bonds, (iii) $65 million in finance leases and, (iv) $5 million in loans from other funding programs.
The EIB loans are comprised of three long-term amortizing credit facilities as part of R&D funding programs. The first one, signed in August 2017, is a €500 million loan in relation to R&D and capital expenditures in the European Union for the years 2017 and 2018. The entire amount was fully drawn in Euros corresponding to $303 million outstanding as of December 31, 2023. The second one, signed in 2020, is a €500 million credit facility agreement with EIB to support R&D and capital expenditure programs in Italy and France. The amount was fully drawn in Euros representing $442 million outstanding as of December 31, 2023. In 2022, the Company signed a third long-term amortizing credit facility with EIB of €600 million, out of which, €300 million was withdrawn representing $332 million outstanding as of December 31, 2023. In January 2024, an amount of $300 million was withdrawn under this credit facility.
The CDP SpA loans are comprised of two long-term credit facilities. The first, signed in 2021, is a €150 million loan, fully drawn in Euros, of which $97 million were outstanding as of December 31, 2023. The second one, signed in 2022, is a €200 million loan, fully drawn in Euros, of which $187 million was outstanding as of December 31, 2023.
On August 4, 2020, we issued a $1.5 billion principal amount of dual tranche senior unsecured convertible bonds (Tranche A and Tranche B for $750 million each tranche), due 2025 and 2027, respectively. Tranche A bonds were issued at 105.8% as zero-coupon bonds while Tranche B bonds were issued at 104.5% as zero-coupon bonds. The conversion price at issuance was $43.62 for Tranche A equivalent to a 47.5% conversion premium and $45.10 for Tranche B, equivalent to a 52.5% conversion premium. These conversion features correspond to an equivalent of 4,585 shares per each Tranche A bond $200,000 par value and an equivalent of 4,435 shares per each Tranche B bond $200,000 par value. The bonds are convertible by the bondholders or are callable by the issuer upon certain conditions, on a net-share settlement basis, except if the issuer elects a full-cash or full-share conversion as an alternative settlement. The net proceeds from the bond offering were $1,567 million, after deducting issuance costs paid by the Company.
69
As of December 31, 2023, our stock price exceeded the conversion price of the senior unsecured convertible bonds. However, the 130% stock price contingent feature was not met. Consequently, Tranche A bonds are not callable by us and bondholders cannot exercise their conversion rights on Tranche B bonds.
Our long-term debt contains standard conditions but does not impose minimum financial ratios. We had unutilized committed medium-term credit facilities with core relationship banks totaling $1,030 million as of December 31, 2023.
As of December 31, 2023, debt payments at principal amount by period were as follows:
| Payments Due by Period | ||||||||||||||||||||||||||||||||||||||||||||
| Total | 2024 | 2025 | 2026 | 2027 | 2028 | Thereafter | ||||||||||||||||||||||||||||||||||||||
| (In millions) | ||||||||||||||||||||||||||||||||||||||||||||
| Long-term debt (including current portion) | $ | 2,931 | $ | 217 | $ | 962 | $ | 212 | $ | 947 | $ | 198 | $ | 395 | ||||||||||||||||||||||||||||||
Our 2020 Senior Unsecured Convertible Bonds are presented at their principal amount with original maturity date of 2025 for Tranche A and 2027 for Tranche B, in line with contractual terms.
Our current ratings with the two major rating agencies that report on us on a solicited basis, are as follows: S&P: “BBB+” with stable outlook; Moody’s: “Baa1” with positive outlook.
Contractual Obligations, Commercial Commitments and Contingencies
Our contractual obligations, commercial commitments and contingencies as of December 31, 2023, and for each of the five years to come and thereafter, were as follows:(1)
| Total | 2024 | 2025 | 2026 | 2027 | 2028 | Thereafter | ||||||||||||||||||||||||||||||||||||||
| (In millions) | ||||||||||||||||||||||||||||||||||||||||||||
Foundry purchases(2) | $ | 1,114 | $ | 553 | $ | 274 | $ | 101 | $ | 62 | $ | 62 | $ | 62 | ||||||||||||||||||||||||||||||
Other obligations(2) | $ | 783 | $ | 30 | $ | 47 | $ | 47 | $ | 47 | $ | 47 | $ | 565 | ||||||||||||||||||||||||||||||
Operating Lease obligations (including current portion)(3) | $ | 246 | $ | 58 | $ | 42 | $ | 30 | $ | 21 | $ | 18 | $ | 77 | ||||||||||||||||||||||||||||||
Long-term debt obligations (including current portion)(3)(4) | $ | 2,931 | $ | 217 | $ | 962 | $ | 212 | $ | 947 | $ | 198 | $ | 395 | ||||||||||||||||||||||||||||||
| of which: | ||||||||||||||||||||||||||||||||||||||||||||
| Finance Lease obligations | $ | 65 | $ | 10 | $ | 5 | $ | 5 | $ | 5 | $ | 20 | $ | 20 | ||||||||||||||||||||||||||||||
Pension obligations (including current portion)(3) | $ | 372 | $ | 62 | $ | 65 | $ | 88 | $ | 56 | $ | 62 | $ | 39 | ||||||||||||||||||||||||||||||
Other long-term liabilities(3)(5) | $ | 546 | $ | — | $ | 254 | $ | 92 | $ | 44 | $ | 34 | $ | 122 | ||||||||||||||||||||||||||||||
| Total | $ | 6,057 | $ | 930 | $ | 1,649 | $ | 575 | $ | 1,182 | $ | 441 | $ | 1,280 | ||||||||||||||||||||||||||||||
(1) Contingent liabilities which cannot be quantified are excluded from the table above.
(2) Items not reflected on the consolidated balance sheet as of December 31, 2023.
(3) Items reflected on the consolidated balance sheet as of December 31, 2023.
(4) For long-term debt obligations the difference between the total obligations and the total carrying amount of long-term debt is due to the unamortized debt issuance costs on the dual tranche senior unsecured convertible bonds. See Note 15 to our Consolidated Financial Statements as of December 31, 2023 for additional information related to long-term debt.
(5) For other long-term liabilities, the difference with the amount reported on the consolidated balance sheet as of December 31, 2023 is related to the long-term portion of the operating lease obligation of $188 million reported under the “Lease obligations” line. See Note 11 and Note 17 to our Consolidated Financial Statements as of December 31, 2023 for additional information related to leases and other long-term liabilities.
70
Purchase and other obligations are primarily comprised of purchase commitments for outsourced foundry wafers and firm contractual commitments related to power purchase and minimum energy efficiency, as part of our actions to become carbon neutral by 2027 on scope 1 and 2 and partially scope 3.
Long-term debt obligations mainly consist of bank loans and senior unsecured convertible bonds. In the table above, our 2020 Senior Unsecured Convertible Bonds are presented at their principal amount with original maturity date of 2025 for Tranche A and 2027 for Tranche B, in line with contractual terms. In 2024 we expect to repay with available cash and cash equivalents an amount of $205 million related to our loans with the European Investment Bank and CDP SpA through annual and semi-annual installments respectively and $10 million related to our finance leases. See “— Net financial position (non-U.S. GAAP measure)” above.
Pension obligations amounting to $372 million consist of our best estimates of the amounts projected to be payable by us for the pension and post-employment plans. The final actual amount to be paid and related timing of such payments may vary significantly due to early retirements, terminations and changes in assumptions rates. See Note 16 to our Consolidated Financial Statements.
Other long-term liabilities mainly include future obligations related to other long-term employees benefits, contingent consideration on business combinations and other contractual obligations. In accordance with the authoritative guidance for accounting for uncertainty in income taxes, as of December 31, 2023, liabilities related to uncertain tax positions totaled $55 million. See Note 23 of our Consolidated Financial Statements.
Off-Balance Sheet Arrangements
We had no material off-balance sheet arrangements as of December 31, 2023.
Financial Outlook: Capital Investment
Our policy is to modulate our capital spending according to the evolution of the semiconductor market. For 2024, we plan to invest about $2.5 billion in net capital expenditures.
A large portion of capital expenditures will be devoted to support our strategic programs, selected capacity additions and mix change in our manufacturing footprint, in particular for our wafer fabs:
•the increase capacity for silicon carbide products in our Catania and Singapore fabs;
•the ramp-up of a new integrated silicon carbide substrate manufacturing facility in Catania for the production in volume of 150mm, moving to 200mm, silicon carbide epitaxial substrates;
•the creation of new 200mm silicon carbide device manufacturing joint venture with Sanan Optoelectronics in Chongqing, China;
•the ramp-up of our new 300mm wafer fab in Agrate, Italy, to support mixed signal technologies and then phase-in smart power technologies and embedded-non-volatile memory at a later stage;
•digital 300mm in Crolles, France, to extend the cleanroom and support production ramp-up of our main runner technologies;
•certain selected programs of capacity growth in some of our most advanced 200mm fabs, including the analog 200mm fab in Singapore.
The most important 2024 capital investments for our back-end facilities will be: (i) capacity growth on certain package families, including PLP / Direct Copper Interconnect technology and automotive related packages, (ii) the new generation of Intelligent Power Modules for Automotive and Industrial applications, and (iii) specific investments in innovative assembly processes and test operations.
The remaining part of our capital investment plan covers the overall maintenance and efficiency improvements of our manufacturing operations and infrastructure, R&D activities, laboratories as well as the execution of our carbon neutrality programs.
Capital expenditures are net of proceeds from sales, capital grants and other contributions.
71
We will continue to invest to support revenues growth and new products introduction, taking into consideration factors such as trends in the semiconductor industry, capacity utilization and our goal to become carbon neutral by 2027 on scope 1 and 2 and partially scope 3. We expect to need significant financial resources in the coming years for capital expenditures and for our investments in manufacturing and R&D. We plan to fund our capital requirements with cash provided by operating activities, available funds and support from third parties, and may have recourse to borrowings under available credit lines and, to the extent necessary or attractive based on market conditions prevailing at the time, the issuance of debt, convertible bonds or additional equity securities. A substantial deterioration of our economic results, and consequently of our profitability, could generate a deterioration of the cash generated by our operating activities. Therefore, there can be no assurance that, in future periods, we will generate the same level of cash as in prior years to fund our capital expenditure plans for expanding/upgrading our production facilities, our working capital requirements, our R&D and manufacturing costs.
We believe that we have the financial resources needed to meet our currently projected business requirements for the next twelve months, including capital expenditures for our manufacturing activities, working capital requirements, approved dividend payments, share buy-backs as part of our current repurchase program and the repayment of our debt in line with maturity dates.
We will drive the Company based on a plan for 2024 revenues in the range of $15.9 billion to $16.9 billion. Within this plan, we expect a gross margin in the low to mid-40's.
Impact of Recently Issued U.S. Accounting Standards
See Note 2 to our Consolidated Financial Statements.
Backlog and Customers
See “Item 4. Information on the Company — Backlog”.
72
Item 6.Directors, Senior Management and Employees
Directors and Senior Management
The management of our Company is entrusted to the Managing Board under the supervision of the Supervisory Board.
The term “Directors” refers to the non-executive members of the Supervisory Board of the Company and the term “Senior Management” refers to:
•The sole member of the Managing Board, our President and Chief Executive Officer;
•The members of the Executive Committee (including the sole member of the Managing Board, our President and Chief Executive Officer) of the Company; and
•The Executive Vice Presidents of the Company.
A. Supervisory Board
i. Role of the Supervisory Board
Our Supervisory Board advises our Managing Board and is responsible for supervising the policies pursued by our Managing Board, the manner in which the Managing Board implements the long-term value creation strategy and the general course of our affairs and business. In performing its duties, the Supervisory Board shall be guided by the interests of our Company and its business; it shall take into account the relevant interests of all stakeholders (including our shareholders). The Supervisory Board is responsible for the quality of its own performance.
Our Supervisory Board consists of such number of members as is resolved by our AGM upon a non-binding proposal of our Supervisory Board, with a minimum of six members. Decisions by our AGM concerning the number and the identity of our Supervisory Board members are taken by a simple majority of the votes cast at a meeting, provided quorum conditions are met.
Our Supervisory Board was composed of the following nine members as of December 31, 2023:
| Year First | Term | |||||||||||||||||||||||||
| Name | Position | Appointed | Expires | Age | ||||||||||||||||||||||
| Nicolas Dufourcq | Chairman | 2015 | 2024 | 60 | ||||||||||||||||||||||
| Maurizio Tamagnini | Vice Chairman | 2014 | 2026 | 58 | ||||||||||||||||||||||
| Janet Davidson | Member | 2013 | 2024 | 67 | ||||||||||||||||||||||
| Yann Delabrière | Member | 2020 | 2024 | 73 | ||||||||||||||||||||||
| Ana de Pro Gonzalo | Member | 2020 | 2025 | 56 | ||||||||||||||||||||||
| Frédéric Sanchez | Member | 2017 | 2026 | 63 | ||||||||||||||||||||||
| Donatella Sciuto | Member | 2022 | 2025 | 61 | ||||||||||||||||||||||
Paolo Visca(1) | Member | 2023 | 2026 | 62 | ||||||||||||||||||||||
Hélène Vletter-van Dort(1) | Member | 2023 | 2025 | 59 | ||||||||||||||||||||||
___________________
(1) Ms. Heleen Kersten and Mr. Alessandro Rivera were members of our Supervisory Board until May 24, 2023, on which date their term expired and on such date Mr. Paolo Visca and Mrs. Hélène Vletter-van Dort were appointed as new members of the Supervisory Board.
Resolutions of our Supervisory Board require the approval of at least three-quarters of its members in office, with each member being entitled to one vote. Our Supervisory Board must meet upon request by two or more of its members or by our Managing Board. Our Supervisory Board meets at least five times a year (and in 2023, our Supervisory Board met 12 times), including to approve our quarterly, semi-annual and annual accounts and their release. In 2023, the average attendance rate for the meetings of our Supervisory Board was 91%. Our Supervisory Board has adopted (i) a Supervisory Board charter, (ii) a profile for the Supervisory Board based on which proposed new members of the Supervisory Board are selected (both of which are available on our website (www.st.com)), (iii)
73
a diversity policy for the composition of the Managing Board, the Executive Committee and the Supervisory Board, and (iv) a selection criteria and appointment procedure for the Supervisory Board and Managing Board members.
Our Supervisory Board may make a proposal to our AGM for the suspension or dismissal of one or more of its members. Each member of our Supervisory Board must resign no later than three years after appointment, as described in our Articles of Association, but may be reappointed following the expiration of his/her term of office. Pursuant to Dutch law, there is no mandatory retirement age for members of our Supervisory Board. Members of the Supervisory Board may be suspended or dismissed by our AGM. Certain of our Supervisory Board members are proposed by and may retain certain relationships with our direct or indirect shareholders represented through our major shareholder. See “Item 7. Major Shareholders and Related Party Transactions — Major Shareholders”.
In accordance with the best practice provisions of the Dutch Corporate Governance Code, on an annual basis our Supervisory Board undertakes to perform an evaluation of the functioning of the Managing Board and the Supervisory Board (which also includes an evaluation of the functioning of the Supervisory Board’s committees and its individual members). Once every three years, this evaluation is conducted by an independent external expert, whose mission is to assist the Supervisory Board in this evaluation through, inter alia, conducting interviews with individual members of the Supervisory Board and Managing Board and facilitating discussions within the Supervisory Board on the functioning of the boards, its committees and its members, including an evaluation of the involvement of each member, the culture within the Supervisory Board and the relationship between the Supervisory Board and the Managing Board. The evaluation for the year ended December 31, 2023 is on-going at the time of this report.
ii. Biographies of our Current Supervisory Board Members
Nicolas Dufourcq
Nicolas Dufourcq has been a member of our Supervisory Board since May 2015 and currently serves as its Chairman. He serves on our Supervisory Board’s Compensation Committee, Strategic Committee, Sustainability Committee and Nominating and Corporate Governance Committee. Mr. Dufourcq is a graduate of HEC (Hautes Etudes Commerciales) and ENA (Ecole Nationale d’Administration). He began his career at the French Ministry of Finance and Economics before joining the Ministry of Health and Social affairs in 1992. In 1994, he joined France Telecom, where he created the Multimedia division, before going on to chair Wanadoo, the firm’s listed Internet and Yellow Pages subsidiary. After joining the Capgemini Group in 2003, he was made responsible for the Central and Southern Europe region, successfully leading their financial turnaround. He was appointed Chief Financial Officer of the Group and member of the Executive Committee in September 2004. In 2005, he was named deputy Chief Executive Officer in charge of finance, risk management, IT, delivery, purchases and LEAN program and, in 2007, also in charge of the follow-up of the group’s major contracts. On February 7, 2013, Mr. Dufourcq was appointed Chief Executive Officer of Bpifrance (Banque Publique d’Investissement). Mr. Dufourcq is also a member of the Board of Directors of Stellantis.
Maurizio Tamagnini
Maurizio Tamagnini has been a member of our Supervisory Board since June 2014 and is the Vice Chairman of our Supervisory Board since June 2023. He also serves on our Supervisory Board’s Nominating & Corporate Governance Committee, Sustainability Committee, Compensation Committee and Strategic Committee. Mr. Tamagnini is currently Chief Executive Officer of FSI SGR S.p.A., an asset management company sponsored, until July 2022, by CDP SpA (with a 39% ownership), which is 82.7% controlled by the Italian Government. FSI SGR S.p.A. manages “FSI I” and “FSI II”, private equity closed-end funds with approximately €2 billion capital endowment, specialized on growth equity investments in Italian midmarket companies with development potential. He was, until April 2019, non-executive Chairman of FSI Investimenti S.p.A., which is controlled 77% by CDP SpA. Until 31st March 2016, Mr. Tamagnini was Chief Executive Officer and Chairman of the Investment Committee of Fondo Strategico Italiano S.p.A. (now CDP Equity S.p.A.), an investment company controlled by CDP SpA. Until April 2016, he was Chairman of the joint venture between Fondo Strategico Italiano S.p.A. and Qatar Holding (IQ Made in Italy Investment Company S.p.A.) with capital endowment of up to €2 billion in total for investments in the food, brands, furniture & design and tourism sectors. He was previously Southern European Manager of the Corporate & Investments Banking division of Bank of America Merrill Lynch and a member of the Executive Committee of Bank of America Merrill Lynch for the EMEA region. Mr. Tamagnini has gained over 33 years of experience in the financial sector specializing in the areas of Corporate Finance, Private Equity, Debt and Equity. Mr. Tamagnini is also a member of the International Advisory Board of BIDMC Harvard Medical School.
74
He holds a degree in International Monetary Economics from Bocconi University in Milan and has also studied at the Rensselaer Polytechnic Institute — Troy in New York, USA.
Janet Davidson
Janet Davidson has been a member of our Supervisory Board since June 2013. She serves on our Supervisory Board’s Audit Committee and Strategic Committee and chairs our Supervisory Board’s Sustainability Committee. She began her career in 1979 as a member of the Technical Staff of Bell Laboratories, Lucent Technologies (as of 2006 Alcatel Lucent), and served from 1979 through 2011 in several key positions, most recently as Chief Strategy Officer (2005 – 2006), Chief Compliance Officer (2006 – 2008) and EVP Quality & Customer Care (2008 – 2011). From 2005 through 2012, Ms. Davidson was a member of the Lehigh University Board of Trustees. In 2007 she served on the Riverside Symphonia Board of Trustees and in 2005 and 2006, Ms. Davidson was a member of the Liberty Science Center Board of Trustees. Ms. Davidson was a member of the board of the Alcatel Lucent Foundation from 2011 until 2014, and a member of the board of directors of Millicom from April 2016 until June 2020. Ms. Davidson is also a member of the board of the AES Corporation, since February 2019. Ms. Davidson is a graduate of the Georgia Institute of Technology (Georgia Tech), Atlanta, GA, United States of America, and Lehigh University, Bethlehem, PA, United States of America, and holds a Master’s degree in Electrical Engineering.
Yann Delabrière
Yann Delabrière has been a member of our Supervisory Board since June 2020 and serves on our Audit Committee. Mr. Delabrière began his career with the French Court of Auditors before working in the French Foreign Trade Ministry from 1981 to 1983. He served as chief financial officer for COFACE, from 1983 to 1987, and for Printemps (a retail group, now Kering) as group CFO from 1987 to 1990. In 1990, he joined PSA Peugeot Citroën as chief finance officer and, in 1998, he joined the newly created executive committee of the group and, in parallel of his position as CFO, became chairman and chief executive officer of PSA’s consumer finance unit, Banque PSA Finance. From February 2007 until July 2016, Mr. Delabrière was the chief executive officer of Faurecia, and the chairman of its board of directors until May 2017. He was appointed in April 2017 as advisor to the board and then in June 2017 as chief executive officer of Zodiac Aerospace and oversaw the sale to Safran group in February 2018. Since July 2020, Mr. Delabrière has been the chairman of the board of Idemia, a global leader in augmented reality, where he previously served as president and Chief Executive Officer (between October 2018 and July 2020). He has been appointed a non-executive member of the board of directors of Leddar Tech in February 2021. Mr. Delabrière has also been the lead independent director of Alstom since March 2017 and served as non-executive director and chairman of the audit committee of Capgemini from 2004 to May 2018, and as non-executive director of Société Générale from 2012 to 2016. Mr. Delabrière holds a PhD in Mathematics having graduated from the École Normale Supérieure and the École Nationale d’Administration. He is also a Chevalier de la Légion d’Honneur (Knight of the Legion of Honor) and Officier de l’Ordre National du Mérite (Officer of the National Order of Merit).
Ana de Pro Gonzalo
Ana de Pro Gonzalo has been a member of our Supervisory Board since June 2020. She chairs our Supervisory Board’s Audit Committee and serves on our Supervisory Board’s Sustainability Committee. She has been an independent non-executive director for Mobico Group PLC (formerly National Express Group PLC) and a member of its safety and security committee, audit committee and remuneration committee since October 2019 and she serves as independent non-executive director of Novartis A.G. and as a member of its audit and risk committees since March 2022. Until December 2020, she was chief financial officer of Amadeus IT Holding (a world leading technology provider and transaction processor for the global travel and tourism industry), with global responsibility for financial management and control for the Amadeus group. She was appointed in this role in February 2010 and was also a member of the Amadeus executive management team. From 2002 to 2010, Ms. De Pro Gonzalo was corporate general manager at Sacyr Vallehermoso and was instrumental in leading the international expansion of one of the major construction groups in the world. From 1994 to 2002, Ms. De Pro Gonzalo was deputy general manager and finance director at Metrovacesa, and from 1990 to 1994 she was a senior auditor at Arthur Andersen. She has been independent non-executive director for Merlin Properties, S.A. from 2015-2017 and for Indra Sistemas S.A. from 2020-2022. Since June 2019, Ms. De Pro Gonzalo is an independent member of the non-profit Global Steering Group for Impact Assessment (Consejo Asesor Nacional Español) and member of the Board of Trustees of foundation Juan XXIII for the people with special intellectual needs since October 2020. Ms. De Pro Gonzalo holds a BSc in Business Studies, specializing in Auditing, from Universidad Complutense de Madrid, and completed IESE Business School’s general management executive program.
75
Frédéric Sanchez
Frédéric Sanchez has been a member of our Supervisory Board since June 2017. He chairs our Supervisory Board’s Compensation Committee, and serves also on our Supervisory Board’s Strategic Committee and Nominating and Corporate Governance Committee. Mr. Sanchez is the chairman of Fives’ executive board, an industrial engineering group with heritage of over 200 years of engineering excellence and expertise. Fives designs and supplies machines, process equipment and production lines for the world’s largest industrial groups in various sectors such as aluminium, steel, glass, automotive, logistics, aerospace, cement and energy, in both developing and developed countries. Mr. Sanchez started his career in 1985 with Renault in Mexico, then in the USA. In 1987 he became a mission manager at Ernst & Young. In 1990 he joined Fives-Lille group, in which he held various positions before being appointed chief financial officer in 1994 and becoming chief operating officer in 1997. In 2002, the “Compagnie de Fives-Lille” (renamed Fives in 2007) became a company with a Management and Supervisory Board chaired by Mr. Sanchez. In 2018, Fives became a French simplified joint stock company (société par actions simplifiée) and Mr. Sanchez its chairman and Chief Executive Officer. Within MEDEF (French Business Confederation), Mr. Sanchez is President of MEDEF International, President of the Council of Entrepreneurs France-Japan, France-United Arab Emirates and France-Bahrain. Mr. Sanchez is an administrator of Primagaz, Orange, Thea and Bureau Veritas and he is honorary co-president of the Alliance Industrie du Futur. Mr. Sanchez graduated from HEC Business School (1983) and Sciences-Po Paris (1985) and he also holds a Master Degree in Economics from Université Paris-Dauphine (1984).
Donatella Sciuto
Donatella Sciuto has been a member of our Supervisory Board since May 25, 2022 and serves on our Supervisory Board’s Audit Committee and Compensation Committee. Ms. Sciuto has been the Executive Vice Rector of Politecnico di Milano since 2015 and is its Executive Rector since January 2023, and full professor in computer science and engineering (since 2000). She was appointed IEEE Fellow for her scientific contribution in the “embedded systems design”. Ms. Sciuto has been a member of the governing board of the Bank of Italy, since 2013. She has been an independent member of the board of directors of Avio S.p.A (since 2017) and of Fila S.p.A. (since 2020). Ms. Sciuto has also been a member of the board of the Italian Institute of Technology since 2021 and she was a member of the supervisory board of the Human Technopole Foundation until May 2022 and Rai Way S.p.A. until April 2023. Ms. Sciuto holds a degree in Electronic Engineering from Politecnico di Milano and a PhD in Electrical and Computer Engineering from the University of Colorado, Boulder. She holds a Master in Business and Administration (CEGA) from the Bocconi University School of Business Management.
Paolo Visca
Paolo Visca has been a member of our Supervisory Board since May 24, 2023. He serves on our Supervisory Board’s Strategic Committee and Nominating and Corporate Governance Committee. Mr. Visca retired in 2022 after gaining over 30 years of experience in the public sector during which he covered several senior positions, specializing in the areas of public investments, support to industrial projects manufacturing activities, public finance and relations with the European Union. He holds a master’s degree in political science from the University of Rome. Mr. Visca was the Head of the Cabinet of the Italian Minister of Economic Development from February 2021 until July 2022. In this capacity he oversaw several initiatives aimed to attract and promote public and private investments in Italy in the areas of semiconductor, automotive, technological and manufacturing industries and to foster the Italian venture capital ecosystem. Previously, he held the position of Chief of the Cabinet of the Vice President of the Council of Ministers of the Italian Republic (from June 2018 until February 2021) where he worked on several topics related to industrial and infrastructural investments. From November 2008 to June 2020, he held several positions within the Office of Relations with the European Union and the International Relations of the Italian Chamber of Deputies, being appointed as head in 2018. In this capacity he oversaw the relationship between the Republic of Italy and the European Union and other international organizations firstly with respect to the laws and projects requiring an EU clearance and more broadly supporting all the parliamentary activities in the international scenario. From February 2003 until November 2008, he was the head of the Italian office for “legislative coordination for the public finance area" and secretary of the commission for budgetary policies. From September 1996 until February 2003, he was the coordinator of the Italian Finance Department Task Force and from 2001, the head of office “coordination for the public finance area". Previously, he was the responsible of the Committees for Telecommunication and for Foreign Affairs within the Italian Parliament. In addition, he served several times on the Board of Directors of the Employees’ of the Chambers of Deputies Pension Fund.
76
Hélène Vletter-van Dort
Hélène Vletter-van Dort has been a member of our Supervisory Board since May 24, 2023. She chairs our Supervisory Board’s Nominating and Corporate Governance Committee and serves on our Supervisory Board’s Audit, Compensation and Sustainability Committees. Mrs. Vletter-van Dort is a partner at De Bestuurskamer (since 2022) and a professor of financial law and governance at Erasmus School of Law, Rotterdam (since 2004). She holds a BA / LLM in corporate and commercial law from the University of Leiden and a PhD from the Utrecht University. Mrs. Vletter-van Dort has been the chairperson of the board of Intertrust NV from 2015 until 2022. She has been a member of the board of Fortis Bank Netherlands (from 2008 until 2010) and member of its risk committee and remuneration committee. Ms. Vletter-van Dort has been a member of the board of the Dutch Central Bank and chair of its committee on supervisory policy (from 2010 until 2014). She has been a member of the Dutch Monitoring Committee Corporate Governance (from 2009 until 2018) and, from 2017 until 2019, a member of the board of Barclays Bank Plc and chair of its remuneration committee. Since 2015, Ms. Vletter-van Dort has been a member of the board of NN Group NV and, since 2019, vice-chair as well as chair of its remuneration committee. She is also a member of the board of the Dutch Foundation for Public Broadcasting, NPO (since 2020), Anthos Fund & Asset Management (since 2021) and Nyenrode Business University (since 2022) and serves on its audit committee and education & research committee. Since 2018, she is also the chairperson of Stichting Luchtmans, protective foundation Koninklijke Brill NV, a 335-year old listed publisher.
iii. Supervisory Board Committees
Membership and Attendance. As of December 31, 2023, the composition of the five standing committees of our Supervisory Board was as follows: (i) Ms. Ana de Pro Gonzalo is the Chair of the Audit Committee, and Ms. Janet Davidson, Mr. Yann Delabrière, Ms. Donatella Sciuto and Mrs. Hélène Vletter-van Dort are members of the Audit Committee; (ii) Mr. Frédéric Sanchez is the Chair of the Compensation Committee, and Mr. Nicolas Dufourcq, Ms. Donatella Sciuto, Mr. Maurizio Tamagnini and Mrs. Hélène Vletter-van Dort are members of the Compensation Committee; (iii) Mrs. Hélène Vletter-van Dort is the Chair of the Nominating and Corporate Governance Committee, and Messrs. Nicolas Dufourcq, Frédéric Sanchez, Maurizio Tamagnini and Paolo Visca are members of the Nominating and Corporate Governance Committee; (iv) Nicolas Dufourcq is the Chair of the Strategic Committee, and Ms. Janet Davidson, and Messrs. Frédéric Sanchez, Maurizio Tamagnini and Paolo Visca are members of the Strategic Committee; and (v) Ms. Janet Davidson is the Chair of the Sustainability Committee, and Mr. Nicolas Dufourcq, Ms. Ana de Pro Gonzalo, Mr. Maurizio Tamagnini and Mrs. Hélène Vletter-van Dort are members of the Sustainability Committee.
Detailed information on attendance at full Supervisory Board and Supervisory Board Committee meetings during 2023 is as follows:
| Number of Meetings attended in 2023 | Supervisory Board | % Attendance | Audit Committee | % Attendance | Compensation Committee | % Attendance | Strategic Committee | % Attendance | Nominating & Corporate Governance Committee | % Attendance | Sustainability Committee | % Attendance | ||||||||||||||||||||||||||||||||||||||||||||||||||||||||||||||
| Nicolas Dufourcq | 12 | 100% | — | —% | 2 | 100% | 1 | 100% | 7 | 100% | 3 | 75% | ||||||||||||||||||||||||||||||||||||||||||||||||||||||||||||||
| Maurizio Tamagnini | 12 | 100% | — | —% | 2 | 100% | 1 | 100% | 7 | 100% | 4 | 100% | ||||||||||||||||||||||||||||||||||||||||||||||||||||||||||||||
| Janet Davidson | 12 | 100% | 10 | 100% | — | —% | 1 | 100% | — | —% | 4 | 100% | ||||||||||||||||||||||||||||||||||||||||||||||||||||||||||||||
| Yann Delabrière | 11 | 92% | 9 | 90% | — | —% | — | —% | — | —% | — | —% | ||||||||||||||||||||||||||||||||||||||||||||||||||||||||||||||
| Ana de Pro Gonzalo | 11 | 92% | 10 | 100% | — | —% | — | —% | — | —% | 4 | 100% | ||||||||||||||||||||||||||||||||||||||||||||||||||||||||||||||
Heleen Kersten(1) | 2 | 50% | 3 | 60% | 1 | 100% | — | —% | 3 | 75% | 1 | 50% | ||||||||||||||||||||||||||||||||||||||||||||||||||||||||||||||
Alessandro Rivera(1) | 4 | 100% | — | —% | — | —% | — | —% | 4 | 100% | — | —% | ||||||||||||||||||||||||||||||||||||||||||||||||||||||||||||||
| Frédéric Sanchez | 12 | 100% | — | —% | 2 | 100% | 1 | 100% | 4 | 100% | — | —% | ||||||||||||||||||||||||||||||||||||||||||||||||||||||||||||||
| Donatella Sciuto | 11 | 92% | 8 | 80% | 2 | 100% | — | —% | — | —% | — | —% | ||||||||||||||||||||||||||||||||||||||||||||||||||||||||||||||
Paolo Visca(1) | 7 | 88% | — | —% | — | —% | 1 | 100% | 3 | 100% | — | —% | ||||||||||||||||||||||||||||||||||||||||||||||||||||||||||||||
| Hélène Vletter-van Dort(1) | 7 | 88% | 5 | 1 | 1 | 100% | — | —% | 3 | 100% | — | —% | ||||||||||||||||||||||||||||||||||||||||||||||||||||||||||||||
________________________
(1) Ms. Heleen Kersten and Mr. Alessandro Rivera were members of our Supervisory Board until May 24, 2023, on which date their term expired and Mr. Paolo Visca and Mrs. Hélène Vletter-van Dort were appointed as new members of the Supervisory Board.
Audit Committee. Our Audit Committee assists the Supervisory Board in fulfilling its oversight responsibilities relating to corporate accounting, reporting practices, and the quality and integrity of our financial
77
reports as well as our auditing practices, legal and regulatory related risks, execution of our auditors’ recommendations regarding corporate auditing rules and the independence of our external auditors.
Our Audit Committee met 10 times during 2023. At many of the Audit Committee’s meetings, the committee received presentations on current financial and accounting issues and had the opportunity to discuss with our Chief Executive Officer, Chief Financial Officer, Chief Accountant, Chief Audit and Risk Executive, President, Legal Counsel, Chief Ethics & Compliance Officer and our external auditors. Our Audit Committee also proceeded with its annual review of our internal audit function. Our Audit Committee reviewed our annual Consolidated Financial Statements in U.S. GAAP for the year ended December 31, 2023, and the results press release was published on January 25, 2024.
Our Audit Committee approved the compensation of our external auditors for 2023 and discussed the scope of their audit, audit related and non-audit related services for 2023.
At the end of each quarter, prior to each Supervisory Board meeting to approve our quarterly results, our Audit Committee reviewed our interim financial information and the proposed press release and had the opportunity to raise questions to management and the independent registered public accounting firm. In addition, our Audit Committee reviewed our quarterly “Operating and Financial Review and Prospects” and Consolidated Financial Statements (and notes thereto) before they were furnished to the SEC and voluntarily certified by the Chief Executive Officer and the Chief Financial Officer (pursuant to sections 302 and 906 of the Sarbanes Oxley Act). Our Audit Committee also reviewed Operating and Financial Review and Prospects and our Consolidated Financial Statements contained in this Form 20-F, prior to its approval by our Supervisory Board. Furthermore, our Audit Committee monitored our compliance with the European Directive and applicable provisions of Dutch law that require us to prepare a set of accounts pursuant to IFRS in advance of our AGM, which was held on May 24, 2023. See “Item 3. Key Information—Risk Factors—Risks Related to Our Operations”.
Our Audit Committee regularly reviewed management’s conclusions as to the effectiveness of internal control over financial reporting and supervised the implementation of our corporate Enterprise Risk Management (“ERM”) process.
As part of each of its quarterly meetings, our Audit Committee also reviewed our financial results as presented by management and whistleblowing reports, including independent investigative reports provided in relation thereto.
Compensation Committee. Our Compensation Committee advises our Supervisory Board in relation to the compensation of the members of the Supervisory Board and Managing Board, including in the case of our President and Chief Executive Officer, the variable portion of such compensation based on performance criteria recommended by our Compensation Committee. Our Compensation Committee also reviews the stock based compensation plans for our Senior Management and key employees. Our Compensation Committee met twice in 2023.
Among its main activities, in 2023 our Compensation Committee: (i) discussed the performance targets relating to the bonus of our President and Chief Executive Officer for the fiscal year ending on December 31, 2023 (which short-term targets are based on, inter alia, four to seven performance conditions with a mix of financial criteria for approximately 70% and non-financial criteria (including sustainability/corporate social responsibility performance) for approximately 30%, and long-term targets are based on, inter alia, two financial performance conditions constituting revenue growth versus a range of semiconductor peer companies (the “Peer Group” as discussed below) and average of operating margin ratio before restructuring, and one non-financial performance condition constituting the composite sustainability/corporate social responsibility index, including health and safety, CO2 neutrality, diversity & inclusion and people engagement (as further detailed in “—Compensation”)); and (ii) established, on behalf and with the approval of the entire Supervisory Board, the applicable performance criteria, which must be met by senior managers and selected key employees participating in the employee stock award plans to benefit from such awards (for the 2021 unvested stock award plan, these performance criteria are further described below in “Item 6. Managing Board – Managing Board compensation – Managing Board remuneration structure”).
Strategic Committee. Our Strategic Committee advises the Supervisory Board on and monitor key developments within the semiconductor industry, our overall strategy for long-term value creation, and the long-term planning and budgeting. Our Strategic Committee met once in 2023. In addition, there were strategic discussions, many of which occurred at extended Supervisory Board meetings and involved all Supervisory Board members.
78
Nominating and Corporate Governance Committee. Our Nominating and Corporate Governance Committee advises the Supervisory Board on the selection criteria and procedures relating to the appointment of members to our Supervisory Board and Managing Board, and the review of principles relating to corporate governance. Our Nominating and Corporate Governance Committee met 7 times during 2023 to discuss succession planning for our Supervisory Board and Managing Board, best practices regarding corporate governance, and the update of our corporate governance documents.
Sustainability Committee. Our Sustainability Committee advises and supports the Supervisory Board in relation to its responsibilities in supervising, monitoring and advising on the Company's sustainability strategy, targets, goals and overall sustainability performance. Our Sustainability Committee met 4 times in 2023 to discuss our overall sustainability strategy, as well as our sustainability performances and reporting.
Secretariat and Controllers. Our Supervisory Board appoints a Secretary and Vice Secretary. Furthermore, the Managing Board makes an Executive Secretary available to our Supervisory Board, who is also appointed by the Supervisory Board. The Secretary, Vice Secretary and Executive Secretary constitute the Secretariat of the Supervisory Board. The mission of the Secretariat is primarily to organize meetings, to ensure the continuing education and training of our Supervisory Board members and to maintain record keeping. Our Chief Ethics & Compliance Officer, Philippe Dereeper, serves as Executive Secretary for our Supervisory Board, and for each of the five standing committees of our Supervisory Board. Ms. Charlotte Fadlallah serves as Secretary and, since July 2023, Ms. Alessia Allegretti serves as Vice Secretary. Ms. Allegretti and Ms. Fadlallah also serve as managing directors of ST Holding.
Our Supervisory Board also appoints two financial experts (“Controllers”). The mission of the Controllers is primarily to assist our Supervisory Board in evaluating our operational and financial performance, business plan, strategic initiatives and the implementation of Supervisory Board decisions, as well as to review the operational reports provided under the responsibility of the Managing Board. The Controllers generally meet once a month with the management of the Company and report to our full Supervisory Board. The current Controllers are Mr. Samuel Dalens and, since July 2023, Mr Paolo Bonazzi. Mr. Dalens also serves as a member of the supervisory board of ST Holding.
The STH Shareholders Agreement between our principal indirect shareholders contains provisions with respect to the appointment of the Secretary, Vice Secretary and Controllers. See “Item 7. Major Shareholders and Related Party Transactions”.
iv. Supervisory Board Compensation
a.Supervisory Board Remuneration Policy
On December 1, 2019, a Dutch act implementing the revised EU Shareholders’ Rights Directive (2017/828/EU (“SRDII”)) took effect in The Netherlands. As the Company is incorporated under the laws of The Netherlands and the common shares of the Company are admitted to trading on regulated markets in the European Union, the Company was required, inter alia, to update the remuneration policy accordingly with respect to the compensation of the Supervisory Board members and to comply with the respective disclosure requirements introduced to the Dutch Civil Code. In connection therewith, we present in this section certain comparative information on our performance relative to the compensation of the Supervisory Board members.
Our Articles of Association provide that the compensation of our Supervisory Board members is determined by our general meeting of shareholders. Our proposal for adoption of a remuneration policy for the Supervisory Board members to ensure compliance with the new requirements under the Dutch Civil Code, following the implementation of SRDII, was approved by the AGM on June 17, 2020 with a vote percentage in favor of the policy of 98.43%.
b.Compensation paid to current and former Supervisory Board Members in financial year 2023
The annual compensation of the Supervisory Board Members is comprised of an annual fee and an attendance fee, promoting effective and independent supervision in the interest of the Company and the long-term success of the Company. There is no variable compensation nor stock-based compensation awarded to the members of our Supervisory Board.
79
The aggregate compensation for current and former members of our Supervisory Board with respect to service in 2023 was €996,500 before any applicable withholding or other taxes, as set forth in the following table. No reimbursement fees were paid to members of our Supervisory Board in 2023.
| Supervisory Board Members Fees | Annual Fees (Euro) | Attendance Fees (Euro) | Total (Euro) | |||||||||||||||||
Nicolas Dufourcq (1) | € | — | € | — | € | — | ||||||||||||||
| Maurizio Tamagnini | € | 144,000 | € | 33,500 | € | 177,500 | ||||||||||||||
| Janet Davidson | € | 84,500 | € | 33,000 | € | 117,500 | ||||||||||||||
| Yann Delabrière | € | 77,500 | € | 23,000 | € | 100,500 | ||||||||||||||
| Ana de Pro Gonzalo | € | 133,500 | € | 29,000 | € | 162,500 | ||||||||||||||
Heleen Kersten (2) | € | — | € | 13,000 | € | 13,000 | ||||||||||||||
Alessandro Rivera (2) | € | — | € | 10,000 | € | 10,000 | ||||||||||||||
| Frédéric Sanchez | € | 80,500 | € | 28,500 | € | 109,000 | ||||||||||||||
| Donatella Sciuto | € | 81,000 | € | 24,000 | € | 105,000 | ||||||||||||||
Paolo Visca (2) | € | 77,000 | € | 14,000 | € | 91,000 | ||||||||||||||
Hélène Vletter-van Dort (2) | € | 88,000 | 22,500 | 110,500 | ||||||||||||||||
| Total | € | 766,000 | € | 230,500 | € | 996,500 | ||||||||||||||
__________________
(1) Mr. Dufourcq waived his rights to receive any compensation from the Company in relation to his mandate as a member of the Supervisory Board or otherwise.
(2) Ms. Heleen Kersten and Mr. Alessandro Rivera were members of our Supervisory Board until May 24, 2023, on which date their term expired and on such date Mr. Paolo Visca and Mrs. Hélène Vletter-van Dort were appointed as new members of our Supervisory Board.
c.Supervisory Board Remuneration Comparison
Set forth in the following table is the annual change over the last three years of (i) the average remuneration of our Supervisory Board Members, (ii) the performance of the Company and (iii) the average remuneration of our indirect employees (i.e., all indirect employees other than the members of our Senior Management, including the sole member of the Managing Board, our President and Chief Executive Officer):
| 2023 | 2022 | 2021 | ||||||||||||||||||
| Supervisory Board remuneration | ||||||||||||||||||||
Average remuneration of Supervisory Board members(1) | $ | 119,413 | $ | 113,985 | $ | 114,775 | ||||||||||||||
| Company's performance | ||||||||||||||||||||
| Net revenues (amounts in millions) | $ | 17,286 | $ | 16,128 | $ | 12,761 | ||||||||||||||
| Operating income (amounts in millions) | $ | 4,611 | $ | 4,439 | $ | 2,419 | ||||||||||||||
| Employee remuneration | ||||||||||||||||||||
Average remuneration(2) of all global indirect employees (FTE basis)(3) | $ | 114,100 | $ | 109,600 | $ | 111,200 | ||||||||||||||
___________________
(1)Using the Euro per U.S. dollar exchange rate on December 31, 2023 of €1 = $1.078496.
(2)Remuneration is defined as all remuneration paid to indirect employees including base salary, variable compensation in both cash and shares, social premiums, pension, expense allowances and benefits in kind. The average is calculated by taking the sum of remuneration costs and dividing by the average number of full-time equivalent indirect employees over the period.
(3)Global indirect employees are all employees other than those directly manufacturing our products, excluding Senior Management. “FTE” refers to full time equivalent.
We do not have any service agreements with any of the members of our Supervisory Board. We did not extend any loans or overdrafts to any of our Supervisory Board members. Furthermore, we have not guaranteed any debts or concluded any leases with any of our Supervisory Board members or their families.
B.Managing Board
i.Role of the Managing Board
In accordance with Dutch law, our management is entrusted to the Managing Board under the supervision of our Supervisory Board. Mr. Jean-Marc Chery was appointed on May 31, 2018 for a three-year term and was re-
80
appointed on May 27, 2021 for a subsequent three-year term expiring at the 2024 AGM and is currently the sole member of the Managing Board with the function of President and Chief Executive Officer. Our Supervisory Board announced on September 19, 2023, that it will propose the reappointment of Mr. Jean-Marc Chery as sole member of the Managing Board, President and Chief Executive Officer for another three-year term for shareholder approval at the 2024 AGM. We continue to review and strengthen the succession planning for the Managing Board to ensure business continuity, taking into account, amongst others, the rapidly changing technological, social, economic and regulatory developments in our industry. For further biographical details concerning the sole member of the Managing Board, our President and Chief Executive Officer, please refer to the “Biographies of our Executive Committee members (including the President and Chief Executive Officer)” section.
Under our Articles of Association, Managing Board members are appointed for a three-year term upon a non-binding proposal by our Supervisory Board at our AGM and adoption by a simple majority of the votes cast at the AGM, provided quorum conditions are met, which term may be renewed one or more times.
Our shareholders’ meeting may suspend or dismiss one or more members of our Managing Board, in accordance with the procedures laid down in our Articles of Association. Under Dutch law, our Managing Board is entrusted with our general management and the representation of the Company. Our Managing Board must seek prior approval from our shareholders’ meeting for decisions regarding a significant change in the identity or nature of the Company. Under our Articles of Association and our Supervisory Board charter, our Managing Board must also seek prior approval from our Supervisory Board for certain other decisions with regard to the Company and our direct or indirect subsidiaries.
The sole member of our Managing Board may not serve on the board of a public company without the prior approval of our Supervisory Board. Pursuant to the Supervisory Board charter, the sole member of our Managing Board must inform our Supervisory Board of any (potential) conflict of interest and pursuant to such charter and Dutch law, any Managing Board resolution regarding a transaction in relation to which the sole member of our Managing Board has a conflict of interest must be approved and adopted by our Supervisory Board. Should our entire Supervisory Board also have a conflict of interest, the resolution must be adopted by our shareholders’ meeting pursuant to Dutch law. We are not aware of any actual or potential conflicts of interests between the private interest or other duties of the sole member of our Managing Board and members of our Senior Management and their duties to us.
Pursuant to our Articles of Association and the Supervisory Board charter, the following decisions by our Managing Board with regard to the Company and any of our direct or indirect subsidiaries (an “ST Group Company”) require prior approval from our Supervisory Board: (i) any modification of our or any ST Group Company’s Articles of Association or other constitutional documents, other than those of wholly owned subsidiaries; (ii) other than for wholly owned subsidiaries, any change in our or any ST Group Company’s authorized share capital or any issue, acquisition or disposal by us — with the exception of shares in our share capital acquired in order to transfer these shares under employee stock option or stock purchase plans — or any ST Group Company of own shares or change in share rights and any issue of instruments resulting in a share in performance conditions related to corporate social responsibility and environmental, social and governance factors. Both short-term and long-term incentive includes performance conditions promoting ST’s sustainable growth.
ii.Managing Board compensation
a.Guiding principles of Managing Board compensation
Amongst others, the following key principles are considered by the Supervisory Board to determine the remuneration structure of the sole member of the Managing Board, our President and Chief Executive Officer:
•Alignment with the Company’s strategy: the compensation package should be strongly linked to the achievement of targets that are indicators of the execution of the Company’s business strategy.
•Improving the performance of the Company: most of the compensation (excluding base salary, benefits, and pensions) is directly linked to the Company’s performance through variable pay incentives. These incentives are based on ambitious performance conditions that include a mix of internal and external criteria as well as relative performance conditions against peers.
81
•Enhancing long-term creation of shareholder value: to strengthen the alignment with the interests of the shareholders and to enhance the long-term value creation of the Company, the compensation structure includes short-term and long-term variable remuneration either in cash or in shares or a combination thereof.
•Promoting sustainable corporate development: to ensure that the Company is managed in a sustainable and responsible manner for the common good, the remuneration includes non-financial performance conditions related to corporate social responsibility and environmental, social, and governance factors. Both short- and long-term incentive include performance conditions promoting ST’s sustainable growth.
•Retaining and motivating key employees: the compensation package should be competitive, ensuring remuneration levels are determined by reference internally between the Company’s senior managers and externally against the Peer Group.
In accordance with the key principles of the Company’s remuneration structure, the total remuneration of the sole member of the Managing Board, our President and Chief Executive Officer takes into consideration factors such as the size and complexity of our Company, our global presence and that of our customers, the pace of change in our industry, the Company’s value proposition, strategy and goal of long-term value creation, and the need to recruit and retain key personnel.
b.Managing Board remuneration policy
The remuneration of the sole member of the Managing Board, our President and Chief Executive Officer, is determined by our Supervisory Board on the advice of the Compensation Committee.
In compliance with the disclosure requirements in the Dutch Civil Code, we present in this Item 6 comparative information on our performance relative to the compensation of the members of our Senior Management and the sole member of the Managing Board, our President and Chief Executive Officer.
The Compensation Committee advises the Supervisory Board in reviewing the remuneration package of the sole member of the Managing Board, our President and Chief Executive Officer both in the context of the Company performance and against the Peer Group and relevant market index. Before setting targets for the sole member of the Managing Board, our President and Chief Executive Officer, the Compensation Committee carries out scenario analyses of the possible financial outcomes of meeting target levels.
Set forth in the table below is the list of companies retained for the Peer Group compensation analysis used for the remuneration policy for the Managing Board:
| Analog Devices | ON Semiconductor | ||||
| Infineon | Texas Instruments | ||||
| Monolithic Power Systems | Vishay | ||||
| Microchip | Rohm | ||||
| NXP Semiconductors | Renesas | ||||
Should one of the Peer Group companies not publish financial results for any reason, Diodes and/or Melexis would replace the missing company.
The remuneration of the sole member of the Managing Board, our President and Chief Executive Officer, is bound by the remuneration policy as adopted by our 2021 AGM for a duration of a maximum of 4 years. Under the terms of the Dutch Civil Code, the remuneration policy for the Managing Board shall be submitted to the AGM for adoption at least every four years after its adoption. A resolution to adopt the remuneration policy requires a majority of at least 75% of the votes cast. At the 2023 AGM, over 92% of voting shareholders voted in favor of the remuneration report.
The remuneration policy for the Managing Board contains the following key features:
•the reinforcement of the link between Managing Board remuneration and long-term company strategy;
82
•the simplification of the short-term incentive structure (fully paid in cash, as compared to a hybrid cash-equity pay-out previously) featuring enhanced disclosure of criteria and threshold, targets, and maximum performance levels;
•the inclusion of corporate social responsibility criteria among performance conditions for both the short-term and long-term incentive in line with our objectives of promoting sustainable corporate development;
•enhanced disclosure of long-term incentive (share-settled) performance conditions and threshold and target performance levels as well as the remaining outstanding shares (which are not yet vested);
•a three-year performance period for long-term incentives (as compared to one year previously), with vesting based on performance measured over the 3-year performance period, to improve alignment of Managing Board remuneration with our objective of enhancing long-term shareholder value;
•enhanced disclosure regarding early vesting provisions for the unvested stock awards;
•the implementation of share ownership guidelines for the Managing Board; and
•claw-back provisions in order to reclaim payments after they have been awarded or to withhold remuneration under specific conditions.
c.Managing Board remuneration structure
The remuneration structure is reflective of the level of responsibility of the Company’s sole member of the Managing Board, our President and Chief Executive Officer. The remuneration structure is further aligned to the Company’s current context while remaining competitive and providing an incentive to promote the Company’s performance over the medium to long-term, and is in line with the Company’s corporate interest and the interests of all its stakeholders.
The Supervisory Board, upon proposal from the Compensation Committee, determines the remuneration structure and remuneration amounts for the sole member of the Managing Board, our President and Chief Executive Officer based on the analysis of the theoretical maximum total direct remuneration (i.e., sum of base salary, maximum short-term incentive, and maximum long-term incentive).
The remuneration package of the sole member of the Managing Board, our President and Chief Executive Officer is comprised of the following:
•A base salary; and
•Variable components, linked to performance:
oA short-term incentive of up to 210% of base salary which is fully paid in cash.
oA long-term incentive through the grant of stock awards, up to a maximum of 100,000 shares.
The sum of these three elements represents the maximum total direct remuneration for the sole member of the Managing Board, our President and Chief Executive Officer.
The above-mentioned three elements of the total maximum remuneration of the sole member of the Managing Board, our President and Chief Executive Officer are further described below:
Base salary
The purpose of the base salary is to provide a fixed level of earnings and to attract and retain the sole member of the Managing Board, our President and Chief Executive Officer. It is a key component of overall remuneration, particularly as the short-term incentive is expressed as a percentage of base salary. The Company seeks to determine a fair and competitive base salary as compared to the Peer Group based on several factors.
Short-term incentive
83
The purpose of the short-term incentive is to motivate the sole member of the Managing Board, our President and Chief Executive Officer to achieve financial and commercial objectives consistent with and supportive of the Company’s strategy and to create a tangible link between annual performance and individual pay opportunity.
In accordance with the Managing Board remuneration policy and effective from the year 2021, the short-term incentive of the sole member of the Managing Board, our President and Chief Executive Officer is fully paid in cash up to a maximum of 210% of the base salary for the relevant year, all subject to the assessment and achievement of a number of performance conditions which are set annually by the Compensation Committee of our Supervisory Board.
The short-term incentive is subject to annual performance measurement of a unique set of 4 to 7 predefined criteria (both financial and non-financial) and a performance matrix both for financial and non-financial criteria that explicitly outline threshold and target outcomes (as well as overperformance conditions for financial criteria).
Performance measures and weightings are reviewed annually by the Compensation Committee. The recommendations made by the Compensation Committee regarding scorecard targets and weightings are designed to support the delivery of the Company’s strategy. The Supervisory Board, upon recommendation by the Compensation Committee, retains the ability to adjust performance measure targets and weightings year-by-year within the overall target and maximum pay-outs approved in the remuneration policy.
The Supervisory Board, upon the recommendation of its Compensation Committee, sets the conditions and performance criteria that must be met by the sole member of the Managing Board, our President and Chief Executive Officer for the attribution of his short-term incentive (which is paid in the subsequent year).
These performance conditions will enable the Supervisory Board to conduct a holistic and comprehensive assessment of the annual performance of the sole member of the Managing Board, our President and Chief Executive Officer. The combination of financial and non-financial criteria is well balanced in terms of external and internal criteria and reflect the challenging objectives set by the Compensation Committee in line with the Company's ambitious long-term vision and business strategy.
The financial performance criteria for 2023, as chosen by the Supervisory Board were as follows:
•Market share evolution, which is measured by assessing the Company’s relative positioning and competitiveness in relation to its market and its industry peers and how fast the Company grows its revenues compared to its competitors. Market share is assessed on the basis of industry data published by WSTS.
•Revenue growth, which represents the total amount of income generated by the Company’s operations;
•Operating income, which is an important yardstick of profit measurement and reflects the operating performance of the business which does not take into consideration of non-operating gains or losses suffered by business, the impact of financial leverage and tax factors; and
•Net operating cash flow, which is a liquidity metric that evaluates whether the Company has enough liquidity to meet its debt obligations. This metric helps assess the financial soundness of the company in terms of liquidity risk, financial risk, credit risk and business risk.
The non-financial performance criteria for 2023, as chosen by the Supervisory Board were as follows:
•Execution of special manufacturing programs, including our new 300mm fab in Agrate, Italy, and wide-band gap capacity expansion notably in SiC (with notably our new integrated SiC substrate manufacturing facility in Catania, Italy, and the increase in capacity for SiC products in our Catania, Italy, and Singapore fabs);
•Execution of strategy implementation; and
•Sustainability/corporate social responsibility index, which is divided into four criteria related to:
oHealth & safety: measured against, amongst others, the employee safety performance;
84
oEnvironment/climate: measured against, amongst others, direct emissions (kCO2 equivalent);
oDiversity & inclusion: measured against, amongst others, gender ratio among management levels; and
oPeople management: measured against, amongst others, the employee survey (engagement index).
The weight of the sustainability/corporate social responsibility index is designed to remain stable over time, however the individual sub-components used to form the sustainability/corporate social responsibility index may evolve in the future to address sustainability priorities facing the Company and society.
Set forth in the following Table A1 and Chart A1 is the weight set for 2023 for each of the performance criteria that will be assessed by the Supervisory Board in March 2024 for the attribution of the 2023 short-term incentive (to be paid in 2024):
Table A1: Performance criteria with target weighting and pay-out
Annual short-term incentive performance criteria financial year 2023 (to be paid in 2024) | Target Weighting (as a % of total weighting for performance criteria) | Target pay-out (as a % of base salary) | ||||||||||||||||||||||||
| Financial performance conditions | ||||||||||||||||||||||||||
| o Market share evolution | 14% | 30% | ||||||||||||||||||||||||
| o Revenue growth | 19% | 40% | ||||||||||||||||||||||||
| o Operating income | 19% | 40% | ||||||||||||||||||||||||
| o Net operating cash flow | 19% | 40% | ||||||||||||||||||||||||
| Sub-total for financial performance conditions | 71% | 150% | ||||||||||||||||||||||||
| Non-financial performance conditions | ||||||||||||||||||||||||||
| o Execute special manufacturing programs | 14% | 30% | ||||||||||||||||||||||||
| o Execute strategy implementation | 5% | 10% | ||||||||||||||||||||||||
| o Sustainability/corporate social responsibility index | 10% | 20% | ||||||||||||||||||||||||
| Sub-total for non-financial performance conditions | 29% | 60% | ||||||||||||||||||||||||
| Total | 100% | 210% | ||||||||||||||||||||||||
85
Chart A1: Performance criteria with target weighting and pay-out | ||
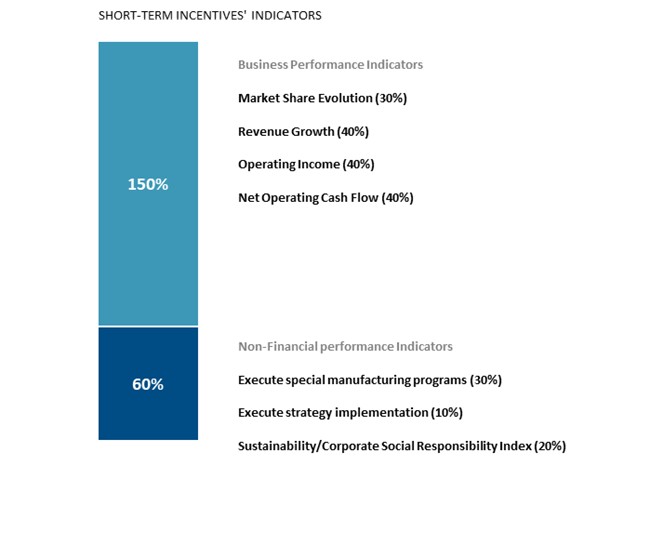
As described in Table A2 below, the final pay-out of the short-term incentive is calculated by measuring the performance of each condition, then adding the sums of the corresponding pay-out from Table A1 above, taking into account any applicable caps. The sum is then multiplied by the base salary to determine the final short-term incentive pay-out.
Table A2: Pay-out according to performance for each performance criterion
| Pay-out as a percentage of base salary | ||||||||||||||
Annual short-term incentive performance criteria financial year 2023 (to be paid in 2024) | Performance below threshold | Performance above or equal to threshold and below target | Performance above or equal to target and below stretch | Performance above stretch | ||||||||||
| Financial performance conditions | ||||||||||||||
oMarket share evolution | 0% | 15% | 30% | 45% | ||||||||||
oRevenue growth | 0% | 20% | 40% | 60% | ||||||||||
oOperating income | 0% | 20% | 40% | 60% | ||||||||||
oNet operating cash flow | 0% | 20% | 40% | 60% | ||||||||||
| Sub-total for financial performance conditions | 0% | 75% | 150% | Capped at 150%(1) | ||||||||||
| Non-financial performance conditions | ||||||||||||||
oExecute special manufacturing programs | 0% | 15% | 30% | 30% | ||||||||||
oExecute strategy implementation | 0% | 5% | 10% | 10% | ||||||||||
oSustainability/corporate social responsibility index | 0% | 10% | 20% | 20% | ||||||||||
| Sub-total for non-financial performance conditions | 0% | 30% | 60% | 60%(2) | ||||||||||
| Total | 0% | 105% | 210% | short-term incentive pay-out capped at 210% | ||||||||||
86
___________________________
(1) Over-performance for financial conditions can balance the potential under-performance of other financial conditions if performance exceeds stretch targets, without exceeding a maximum pay-out of 150% of base salary regarding the portion of the short-term incentive dependent on financial performance criteria.
(2) No stretch targets are defined for non-financial performance criteria.
As of the publication of this Form 20-F the evaluation and assessment of the fulfillment of conditions and performance criteria as well as the determination of conditions for the 2023 short-term incentive have not yet been completed by the Supervisory Board upon the proposal of the Compensation Committee (expected in March 2024).
As a result, performance achievement levels and final pay-out for the short-term incentive based on 2023 performance (to be paid in 2024), as well as the scorecard for the 2023 short-term incentive will be disclosed at a later date, and is expected to be included in the 2023 Dutch Annual Report. Scorecard targets are not disclosed prospectively as it would require the disclosure of commercially sensitive information. Scorecard targets for the 2023 short-term incentive will be disclosed only when they are no longer deemed to be commercially sensitive.
Long-term incentive
The purpose of the long-term incentive is to motivate the sole member of the Managing Board, our President and Chief Executive Officer to deliver sustainable long-term shareholder value through long-term profitability and share price growth.
The terms of this long-term incentive are included in the long-term incentive plan approved at the 2021 AGM, allowing for grants of unvested stock awards in 2021, 2022 and 2023. The vesting of unvested stock awards is subject to the achievement of performance conditions and calculated over a three-year performance period. Grants of unvested stock awards made in 2022 and 2023 will fully vest, subject to performance conditions, in 2025 and 2026 respectively.
Award levels are determined annually by the Compensation Committee within the maximum amounts set by the Supervisory Board. In accordance with the resolution adopted by our AGM, the maximum annual grant allowed in relation to the sole member of the Managing Board, our President and Chief Executive Officer’s stock award for 2021, 2022 and 2023 was 100,000 unvested stock awards subject to performance criteria.
The Supervisory Board, upon recommendation of the Compensation Committee, determines whether the performance criteria are met and concludes whether and to which extent the sole member of the Managing Board, our President and Chief Executive Officer, is entitled to any stock awards under the long-term incentive plan. Scorecard targets are not disclosed prospectively as it would require the disclosure of commercially sensitive information. Scorecard targets will be disclosed only when they are no longer deemed to be commercially sensitive.
Grants in 2023, 2022 and 2021
In accordance with the long-term incentive plan approved at the 2021 AGM, allowing for grants in 2021, 2022 and 2023, the stock awards vest at the end of a three-year performance period, from the date of the grant, provided that the sole member of the Managing Board, our President and Chief Executive Officer is still an employee at such time (subject to the termination provisions listed below in “Section f. Compensation provisions in the event of termination or departure of the sole member of the Managing Board, our President and Chief Executive Officer”).
For the 2023 long-term incentive, the performance criteria are:
•Revenue growth;
•Operating margin; and
•Sustainability/corporate social responsibility index, which was comprised of the following KPIs (including two external criteria):
oEnvironment/climate: measured against, amongst others, the direct emissions (kCO2 equivalent);
87
oDiversity, inclusion and people engagement: measured against, amongst others, gender ratio among management levels;
oInvestor ESG index: measured against, amongst others, the Dow Jones sustainability indices; and
oCarbon rating: measured against, amongst others, the CDP carbon rating.
Set forth in the following Table B1 and Chart B1 is the weight set for each of the performance criteria that will be assessed by the Supervisory Board over the three performance periods for the attribution of the relevant long-term incentive.
Table B1: Long-term incentive performance criteria and target weighting over the three performance periods
Long-term incentive plan performance criteria to be assessed over a 3-year period | Target Weighting (as % of maximum achievement score) | ||||
| Revenue growth (financial year 2025 vs financial year 2022 in comparison to Peer Group) | 33.33% | ||||
| Operating margin ratio before restructuring (average for the 2023 – 2025 period) | 33.33% | ||||
Sustainability/corporate social responsibility index | 33.33% | ||||
| Maximum achievement score | 100% which correspond to a maximum of 100,000 unvested stock awards | ||||
Chart B1: Long-term incentive performance criteria and target weighting over the three performance periods
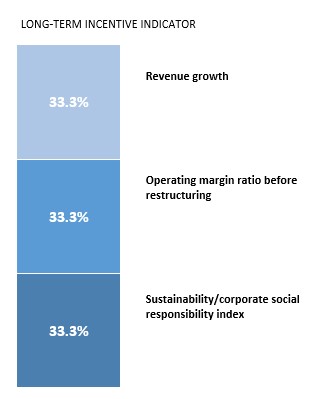
88
Table B2: Shares to vest at the end of the 3-year vesting period according to performance for each performance criterion
| Shares to vest as a percentage of maximum award | ||||||||||||||||||||||||||
| Long-term incentive plan performance criteria to be assessed over a 3-year period | Performance below threshold | Performance equal to threshold | Performance above threshold and below target | Performance above or at target | ||||||||||||||||||||||
Revenue growth (financial year 2025 vs financial year 2022 in comparison to Peer Group) | 0% | 16.67% | 25% | 33.33% | ||||||||||||||||||||||
Operating margin ratio before restructuring (average for the 2023 – 2025 period) | 0% | 16.67% | 16.67% | 33.33% | ||||||||||||||||||||||
| Sustainability/corporate social responsibility index | 0% | 16.67% | 16.67% | 33.33% | ||||||||||||||||||||||
| Total | 0% | 50% | 58.34% | 100% | ||||||||||||||||||||||
Table B3: Vesting schedule for the 2021, 2022 and 2023 long-term incentive grants
Set forth in the following table is an overview of the outstanding awards that have been granted to the sole member of the Managing Board, our President and Chief Executive Officer, in accordance with the new long-term incentive plan adopted by the 2021 AGM. For the purposes of the vesting schedule table below, a hypothetical achievement rate of 100% of performance conditions is used:
| Grant date | Final vesting date | Max. number of shares that can be granted | Number of shares that have been granted based on performance conditions achievement | Share price at grant (in $) | 2024 vesting | 2025 vesting | 2026 vesting | Unvested shares as of end of 2023 | ||||||||||||||||||||||||||||||||||||
July 26, 2023 | AGM date for 2026 | 100,000 | 100,000 | $51.55 | 100,000(1) | 100,000 | ||||||||||||||||||||||||||||||||||||||
| July 27, 2022 | AGM date for 2025 | 100,000 | 100,000 | $36.33 | 100,000(1) | 100,000 | ||||||||||||||||||||||||||||||||||||||
| July 28, 2021 | AGM date for 2024 | 100,000 | 100,000 | $39.33 | 100,000(1) | 100,000 | ||||||||||||||||||||||||||||||||||||||
Total vesting | 300,000 | |||||||||||||||||||||||||||||||||||||||||||
_________________
(1)In the event of 100% achievement of performance criteria to be assessed by the Supervisory Board.
Grant in 2020
Set forth in the following table are the performance criteria, weight, and achievement rate for the periods indicated below set for the long-term incentive grant in 2020.
Under the terms of the previous long-term incentive plan in place before the current remuneration policy, performance was measured over the course of the year following the grant, subject to three performance conditions.
89
Based on the achievement of long-term incentive performance conditions, the total number of shares to be vested was determined, up to a maximum of 100,000 shares. Performance conditions were assessed once, one year following the grant date. The unvested stock awards then vested as follows:
•One year post-grant: 32% of unvested stock awards vest (a maximum of 32,000 shares if all targets were met)
•2 years post-grant: 32% of unvested stock awards vest (a maximum of 32,000 shares if all targets were met)
•3 years post-grant: 36% of unvested stock awards vest (a maximum of 36,000 shares if all targets were met)
Following the implementation of the remuneration policy adopted at the 2021 AGM, the terms of long-term incentive plans from 2021 onwards have changed, as detailed in the section “Grants in 2023, 2022 and 2021” above).
Assessment of performance criteria for 2020 long-term incentive grants
| Target weighting | |||||||||||
| (as % of maximum | |||||||||||
| Long-term incentive plan performance criteria | achievement score) | 2020 | |||||||||
| Evolution of sales | 33.33% | Criteria met | |||||||||
| Evolution of operating income | 33.33% | Criteria met | |||||||||
| Return on net assets | 33.33% | Criteria met | |||||||||
| Maximum achievement score | 100% which correspond to a maximum of 100,000 unvested stock awards | 100% performance achieved | |||||||||
Vesting schedule for outstanding shares
Set forth in the following table is an overview of the outstanding awards under grants prior to implementation of the new long-term incentive plan adopted in 2021 that have been granted to the sole member of the Managing Board, our President and Chief Executive Officer:
| Plan | Grant date | Final vesting date | Max. number of shares that can be granted | Number of shares that have been granted based on performance conditions achievement | Share price at grant (in $) | 2021 vesting | 2022 vesting | 2023 vesting | Unvested shares as of end of 2023 | ||||||||||||||||||||
2020 unvested stock awards Grant | July 23, 2020 | June 17, 2023 | 100,000 | 100,000 | $29.97 | 32,000 | 32,000 | 36,000 | 0 | ||||||||||||||||||||
| Total vesting | 32,000 | 32,000 | 36,000 | 0 | |||||||||||||||||||||||||
90
Share ownership guidelines
The sole member of the Managing Board, our President and Chief Executive Officer is expected to build up a shareholding in the Company equal to 1.5 times of the base salary, in line with the remuneration policy.
Claw-back provisions under Dutch law
All performance-related remuneration awarded to the sole member of the Managing Board, our President and Chief Executive Officer are subject to the following claw-back provisions, in accordance with Dutch law. If the Supervisory Board considers that there is a significant downward restatement of the Company's financial results, breach of duty from the sole member of the Managing Board, our President and Chief Executive Officer, or where remuneration has been paid based upon incorrect information about the achievement of the goals on which the remuneration was based or the circumstances on which the short-term incentive was dependent, it may, in its discretion, within two years of the performance-related remuneration of the sole member of the Managing Board, our President and Chief Executive Officer vesting or being paid:
•require the sole member of the Managing Board, our President and Chief Executive Officer to repay to the Company an amount equal to the after-tax value of some or all of any short-term incentive or the Company's shares that were granted; and/or
•require the Company to withhold from, or offset against, any other remuneration to which the sole member of the Managing Board, our President and Chief Executive Officer may be or become entitled in connection with its employment such an amount as the Supervisory Board considers appropriate.
When reaching its decision, the Supervisory Board will take into account of the significance of the breach of duty and in addition, the Supervisory Board may take other actions in relation to the statutory provision e.g. claim for damages.
During 2023, no claw-backs have occurred.
The sole member of the Managing Board, our President and Chief Executive Officer may also receive other types of remuneration included as described in the remuneration policy, such as social premiums, benefits in kind (including a company car), pension contributions and miscellaneous allowances.
Statement of Compliance with Section 303A.14 of the New York Stock Exchange Listed Company Manual
In accordance with the applicable provisions of the New York Stock Exchange Listed Company Manual providing for the recovery of erroneously awarded incentive-based compensation, the Company has adopted a statement of compliance which provides for recovery of erroneously awarded incentive-based compensation (including both cash and equity compensation) received by current and former executive officers during a three-year look back period following an accounting restatement.
The statement of compliance is filed as an exhibit to this Form 20-F.
d.Compensation paid to the sole member of the Managing Board, our President and Chief Executive Officer in financial year 2023
The sole member of the Managing Board, our President and Chief Executive Officer, received compensation in the form of a base salary, short-term incentive (fully paid in cash from 2021 onwards), long-term incentive grant (unvested stock awards), social premiums, benefits in kind (including a company car), pension contributions and miscellaneous allowances.
Set forth in the following table and chart is an overview of the total compensation of the sole member of the Managing Board, our President and Chief Executive Officer paid in 2023:
91
| Base Salary | $ | 1,213,544 | |||||||||
| Variable components | |||||||||||
Short-term incentive(1) | $ | 2,819,125 | |||||||||
Long-term incentive(2) | $ | 1,838,364 | |||||||||
| Other components | |||||||||||
| Benefits | $ | 117,737 | |||||||||
| Social security contributions | $ | 877,128 | |||||||||
Pensions(3) | $ | 435,717 | |||||||||
| Miscellaneous allowances | $ | — | |||||||||
| Termination benefits | $ | — | |||||||||
| Total | $ | 7,301,615 | |||||||||
___________________
(1) Short-term incentive includes both the amount paid in cash in 2023 (based on 2022 performance) and a tranche from the short-term incentive payable in shares based on his 2020 performance. The achievement rate based on 2022 performance was 205% and paid in 2023. The short-term incentive based on 2023 performance will be determined by the Compensation Committee and paid at a date after the publication of this Form 20-F.
(2) The sole member of the Managing Board, our President and Chief Executive Officer was granted, in accordance with the remuneration policy and subsequent shareholder authorizations, up to a maximum of 100,000 unvested stock awards, subject to performance criteria. The vesting of such stock awards is conditional upon the sole member of the Managing Board, our President and Chief Executive Officer’s, continued service with us.
(3) Complementary pension plan for certain of the Company's key executives.
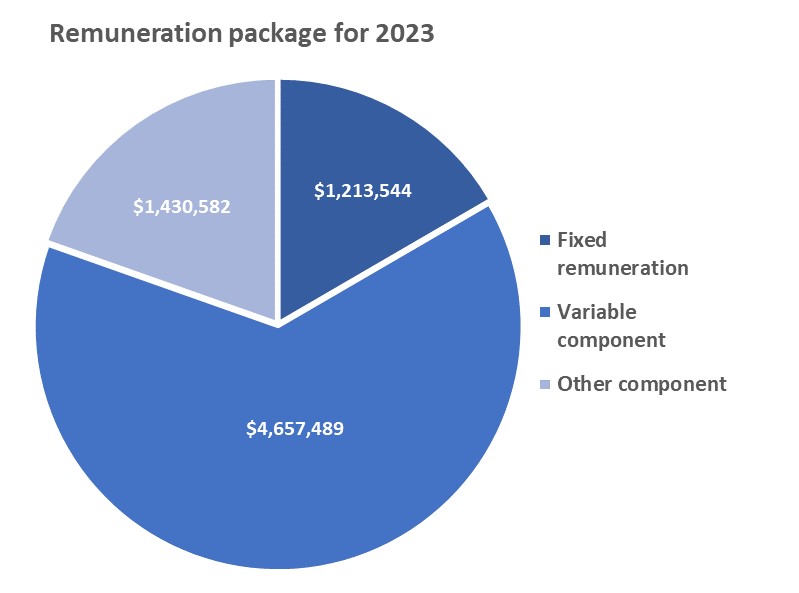
During 2023, the sole member of the Managing Board, our President and Chief Executive Officer, did not have any stock options, and did not purchase any shares in the Company. During 2023, the sole member of the Managing Board, our President and Chief Executive Officer sold 41,355 shares.
e.Evolution of paid remuneration to the Managing Board
Set forth in the following table is the total compensation of the sole member of the Managing Board, our President and Chief Executive Officer, paid from 2021 to 2023:
92
| Variable components | Other components(3) | ||||||||||||||||||||||||||||||||||||||||||||||||||||
| Name | Year | Base salary | Short-term Incentives (1) | Long-term Incentives | Benefits | Social security contributions(2) | Pensions | Total | Fixed/ Variable remuneration | ||||||||||||||||||||||||||||||||||||||||||||
| Jean‐Marc Chery | 2023 | $ | 1,213,544 | $ | 2,819,125 | $ | 1,838,364 | $ | 117,737 | $ | 877,128 | $ | 435,717 | $ | 7,301,615 | 36% fixed/ 64% variable | |||||||||||||||||||||||||||||||||||||
| Jean‐Marc Chery | 2022 | $ | 1,250,954 | $ | 2,506,576 | $ | 2,043,212 | $ | 108,023 | $ | 857,448 | $ | 452,230 | $ | 7,218,443 | 37% fixed / 63% variable | |||||||||||||||||||||||||||||||||||||
| Jean‐Marc Chery | 2021 | $ | 936,357 | $ | 1,907,307 | $ | 3,245,640 | $ | 101,867 | $ | 904,742 | $ | 463,617 | $ | 7,559,530 | 32% fixed / 68% variable | |||||||||||||||||||||||||||||||||||||
___________________
(1) The short-term incentive includes both the amount paid in cash and the amount paid in shares for the year 2020. As of 2021 with the implementation of the remuneration policy for our Managing Board adopted at the 2021 AGM, the short-term incentive is paid fully in cash. The short-term incentive related to 2023, 2022 and 2021 was approved by the Compensation Committee and Supervisory Board with respect to the 2023, 2022 and 2021 financial year, respectively, based on the evaluation and assessment of the actual fulfillment of a number of pre-defined objectives for such year. The short-term incentive related to a relevant year is paid in the subsequent year, i.e. the short-term incentive related to the 2023, 2022 and 2021 financial year, respectively, is paid in 2024, 2023 and 2022 respectively. The achievement rate for the 2022 short-term incentive (paid in 2023), based on 2022 performance, was 205% in cash out of maximum of 210%. The achievement rate for the 2021 short-term incentive (paid in 2022), based on 2021 performance, was 205% in cash out of maximum of 210%. The achievement rate for the 2020 short-term incentive (paid in 2021), based on 2020 performance, was 183% (135% in cash and 48% in shares) out of maximum of 210%.
(2) The employer social security contributions relate to the fixed and variable remuneration, including the unvested stock awards.
(3) There were no miscellaneous allowances nor termination benefits in the years 2023, 2022, and 2021.
f.Compensation provisions in the event of termination or departure of the sole member of the Managing Board, our President and Chief Executive Officer
The sole member of the Managing Board, our President and Chief Executive Officer, was appointed on May 31, 2018 for a three-year term and was reappointed for another three-year term at the 2021 AGM, expiring at the 2024 AGM. He has two employment agreements with us, the first with the Company, which relates to his activities as sole member of our Managing Board and representative of the Company, and the second with one of our entities in Switzerland, which relates to his activities as President and Chief Executive Officer, the EIP, Pension and other items covered by the remuneration policy for our Managing Board. While the relationship between a member of the Managing Board and a listed Dutch company will be treated as a mandate agreement, not an employment agreement, existing employment agreements, including the employment agreement between us and our sole member of the Managing Board, will remain in effect.
The agreements can be terminated with a notice period of 6 months if terminated by the Company or 3 months if terminated by the sole member of the Managing Board, our President and Chief Executive Officer.
Severance clause
Pursuant to the agreements, the sole member of the Managing Board, our President and Chief Executive Officer will be entitled to a severance payment if his employment is terminated at the initiative of the Company and other than for cause, considering amongst others, his critical role in the Company and his seniority. The severance payment will be equal to a gross lump sum payment in the amount of two times his latest gross annual salary, plus the short-term incentive (being the average of the short-term incentive received in the last three years) subject to any and all applicable legal, regulatory and/or contractual deductions.
Any severance payments made will be disclosed in the remuneration report in the annual report of the financial year that this amount relates to, as well as the reason for the severance payment.
Vesting of stock awards in the event of termination or departure
In the event of termination of the employment or departure of the sole member of the Managing Board, our President and Chief Executive Officer, his stock awards will either (i) be forfeited in full, (ii) accelerate in vesting or (iii) continue vesting, as shown in the table below.
Table of the compensation in the event of termination or departure of the sole member of the Managing Board, our President and Chief Executive Officer
93
Set forth in the table below is an overview of the compensation of the sole member of the Managing Board, our President and Chief Executive Officer in the event of his termination or departure, as applicable.
| Resignation | Retirement | Termination by the Company | |||||||||||||||
| Not in connection with change of control or serious or gross misconduct | In connection with change of control | In connection with serious or gross misconduct | |||||||||||||||
| Severance Clause | Not applicable | Not applicable | 2 times the annual base salary plus average short-term incentive over the last 3 years | 2 times the annual base salary plus average short-term incentive over the last 3 years | Not applicable | ||||||||||||
| Outcome of unvested stock awards | Forfeited in full | Continuation of vesting | Accelerated vesting | Accelerated vesting | Forfeited in full | ||||||||||||
C.Senior Management
i.Definition of Senior Management
The term “Senior Management” refers to:
•The sole member of the Managing Board, our President and Chief Executive Officer;
•The members of the Executive Committee (including the sole member of the Managing Board, our President and Chief Executive Officer); and
•The Executive Vice Presidents of the Company.
The sole member of the Managing Board, our President and Chief Executive Officer, is entrusted with our general management and is supported in his tasks by our Executive Committee and Executive Vice Presidents, who together constitute the Senior Management.
ii.Role of Executive Committee
The Executive Committee acts under the authority and responsibility of the Managing Board and in this respect manages the Company. The Managing Board remains legally responsible for the management of the Company. The responsibilities of the Executive Committee include overseeing the general strategy as well as the risk management in connection with the Company's activities, operational and financial objectives and financial reporting processes. The Executive Committee adopts resolutions based on consensus, or if no consensus can be reached, by a majority of the votes cast by the members of the Managing Board including the vote of the chairman of the Executive Committee.
The chairman of the Executive Committee is the President and Chief Executive Officer of the Company. Members of the Executive Committee are appointed by the Managing Board subject to the approval of the Supervisory Board. Members of the Executive Committee can be suspended and dismissed by the Managing Board without prior approval by the Supervisory Board.
The Executive Committee was composed of the following nine members as of December 31, 2023 as set forth in the table below:
94
Name (1) | Position | Years with Company | Years in Semi- Conductor Industry | Age | ||||||||||||||||||||||
| Jean-Marc Chery | President and Chief Executive Officer | 39 | 39 | 63 | ||||||||||||||||||||||
| Marco Cassis | President, Analog, MEMS and Sensors Group | 36 | 36 | 60 | ||||||||||||||||||||||
| Rajita D'Souza | President, Human Resources, Corporate Social Responsibility | 3 | 3 | 51 | ||||||||||||||||||||||
Remi El-Ouazzane | President, Microcontrollers and Digital ICs Group | 2 | 26 | 50 | ||||||||||||||||||||||
| Lorenzo Grandi | Chief Financial Officer (CFO) and President, Finance, Purchasing, Enterprise Risk Management (ERM) & Resilience | 36 | 36 | 62 | ||||||||||||||||||||||
| Fabio Gualandris | President, Quality, Manufacturing and Technology | 35 | 36 | 64 | ||||||||||||||||||||||
| Marco Monti | President, Automotive and Discrete Group | 37 | 37 | 62 | ||||||||||||||||||||||
| Steven Rose | President, Legal Counsel and Public Affairs | 32 | 32 | 61 | ||||||||||||||||||||||
Jerome Roux | President, Sales & Marketing | 32 | 36 | 58 | ||||||||||||||||||||||
_______________________
(1) Fabio Gualandris has, in August 2023, replaced Orio Bellezza as President, Quality, Manufacturing and Technology and as announced on January 10, 2024 Marco Monti will leave the Company.
iii.Biographies of our Senior Management
a.Biographies of our Executive Committee Members (including the President and Chief Executive Officer)
Jean-Marc Chery
Jean-Marc Chery is STMicroelectronics’ President and Chief Executive Officer and has held this position since May 2018. He is the Sole Member of ST’s Managing Board and chairs its Executive Committee. Chery began his career in the Quality organization of Matra, the French engineering group. In 1986, he joined Thomson Semiconducteurs, which subsequently became ST, and held various management positions in product planning and manufacturing, rising to lead ST’s wafer fabs in Tours, France, and later in Rousset, France. In 2005, Chery led the company-wide 6-inch wafer-production restructuring program before taking charge of ST’s Front-End Manufacturing operations in Asia Pacific. In 2008, he was promoted to Chief Technology Officer and assumed additional responsibilities for Manufacturing and Quality (2011) and the Digital Product Sector (2012). In 2014, Chery was appointed ST’s Chief Operating Officer responsible for Technology and Manufacturing operations. In July 2017, Chery was appointed Deputy CEO with overall responsibility for Technology and Manufacturing, as well as for Sales and Marketing operations. Chery sits on the Board of Directors at the Global Semiconductor Alliance (GSA) and France Industrie, and also serves as Chairman of the France – Malaysia Business Council at Medef International. He is a member of the Board of Directors at Legrand. Previously, Chery was President of the European microelectronics R&D program AENEAS and served as President of the European Semiconductor Industry Association (ESIA) in 2019-2021. Chery was promoted Knight of the Legion of Honor by the French Ministry of Economy and Finance in July 2019. Jean-Marc Chery was born in Orleans, France, in 1960, and graduated with a degree in Engineering from the ENSAM engineering school in Paris, France.
Marco Cassis
Marco Cassis is STMicroelectronics’ President, Analog, MEMS and Sensors Group and has held this position since January 1, 2022. He also heads the corporate functions of Strategy Development, System Research and Applications, and Innovation Office, and is a member of ST’s Executive Committee. Cassis joined SGS-Thomson Microelectronics (now STMicroelectronics) as a car-radio chip designer in 1987. He later moved to Japan to help expand ST’s audio business with major local players, including ST’s strategic alliance with Pioneer. In the early 2000s, Cassis managed the Audio Business Unit and was subsequently promoted to Director of Audio and Automotive Group. In 2004, Cassis was named Vice President of Marketing for automotive, computer peripheral, and telecom products. In 2005, he advanced to Vice President of the Automotive Segment Group and was promoted to lead ST’s operations in Japan. His mandate was expanded to include Korea in 2010 and Greater China and South
95
Asia in 2016, when he was appointed President of ST’s Asia Pacific Region. In 2017, Cassis was promoted President, Global Sales and Marketing, and added Communications and Strategy Development in 2018. Marco Cassis was born in Treviso, Italy, in 1963, and graduated with a degree in Electronic Engineering from the Polytechnic of Milan, Italy.
Rajita D’Souza
Rajita D’Souza is President of STMicroelectronics’ Human Resources and Corporate Social Responsibility (CHRO) and has held this role since January 2021. Her mandate also entails the Company’s directions on environment, health, and safety. D’Souza is a member of ST’s Executive Committee. D’Souza started her career in 1993 as Manager Operations with Reliance Consultancy Services in Mumbai, India. In 1997 she joined General Electric, where she held various HR leadership positions with increasing responsibility and scope. In 2007 D’Souza moved to SABIC to become Director Human Resources in Europe. In 2011, she was appointed Vice President Human Resources for the EMEA region of The Goodyear Tire & Rubber Company. In 2017 D’Souza joined Bekaert as Chief Human Resources Officer. Rajita D’Souza was born in Mumbai, India, in 1973. She holds a master’s degree in Law from the University of Mumbai and a bachelor’s degree in Business Management. She is also a certified Master Black-Belt in Six Sigma quality.
Remi El-Ouazzane
Remi El-Ouazzane is STMicroelectronics’ President, Microcontrollers and Digital ICs Group and has held this position since January 1, 2022. He is a member of ST’s Executive Committee. El-Ouazzane started his career at Texas Instruments in 1997. He rose through the ranks across the broadband, mobile, and embedded processing divisions to become Vice President and General Manager of the Open Multimedia Applications Platform (OMAP) in 2009. El-Ouazzane was appointed Chief Executive Officer of Movidius in 2013, responsible for driving its vision-processing technologies to advance the adoption of AI in the Internet of Things. With the acquisition of Movidius by Intel in 2016, he joined Intel’s New Technology Group as Vice President and General Manager and became Chief Operating Officer of Intel’s Artificial Intelligence Products Group in 2018. In 2020, El-Ouazzane became Intel’s Datacenter Platform Group Chief Strategy Officer, driving strategic initiatives in the data center and cloud markets. In 2009, El-Ouazzane was honored with the French-American Foundation’s Young Leaders Award. Remi El-Ouazzane was born in Neuilly-sur-Seine, France in 1973 and graduated from the Grenoble Institute of Technology (INPG) in 1996 and the Grenoble Institute of Political Studies in 1997. He graduated from the General Management Program at Harvard Business School in 2004.
Lorenzo Grandi
Lorenzo Grandi is STMicroelectronics’ Chief Financial Officer (CFO) and President, Finance, Purchasing, Enterprise Risk Management (ERM) & Resilience, and has held this position since January 1st, 2022. He is a member of ST’s Executive Committee. Grandi joined SGS-THOMSON Microelectronics (now STMicroelectronics) in 1987 as a R&D process engineer. In 1990, he moved to ST’s Memory Product Group as Financial Analyst and later was appointed Group Controller contributing to the expansion of ST’s flash memory business. In 2005, Grandi joined ST’s Corporate Finance organization responsible for Budgeting and Reporting. In 2012, he was promoted to Corporate Vice President in charge of Corporate Control. Grandi was appointed ST’s Chief Financial Officer in 2018 and his overall responsibilities include Finance and Business Control, Treasury, Capital investment Control and Planning, Global Procurement, Investor Relations, Enterprise Risk Management and Business Continuity. In December 2020, Grandi received a special award for his long-standing professional achievements from the French Association of Financial Directors and Management Controllers (DFCG). Lorenzo Grandi was born in Sondrio, Italy, in 1961. He graduated cum laude in Physics from the University of Modena, Italy, and holds an MBA from SDA Bocconi School of Management in Milan, Italy.
Fabio Gualandris
Fabio Gualandris is STMicroelectronics’ President, Quality, Manufacturing, and Technology and has held this position since July 2023. He was responsible for the company’s Back-End Manufacturing & Technology organization since 2016 and also led the Company’s Testing Council, alongside its manufacturing strategy in Asia and efforts in System-in-Package technology. Gualandris is a member of ST’s Executive Committee. Gualandris joined SGS Microelettronica (now ST) R&D in 1984. He became R&D Director of Operations in 1989 and became Automotive BU Director in 1996. After two years as President and CEO of Semitool, he rejoined ST in 2000 as Group VP responsible for memory products including the RAM/PSRAM and Automotive Flash. In 2005, Gualandris
96
was appointed CEO of ST Incard, an ST smart-card subsidiary. In 2008-2010, he served as VP and Supply Chain General Manager at ST’s memory JV with Intel. In 2011, Gualandris was appointed ST’s Executive Vice President, Product Quality Excellence. Gualandris has authored several technical and managerial papers and holds multiple international patents. He serves as Chairman of STS, ST's manufacturing JV in China. Fabio Gualandris was born in Bergamo, Italy, in 1959. He holds a Master’s degree in Physics from the University of Milan.
Marco Monti
Marco Monti is STMicroelectronics’ President, Automotive and Discrete Group. The head of ST’s Automotive Product Group since 2012, his mandate was expanded to include discrete and power transistor products in January 2016. Monti is a member of ST’s Executive Committee. Monti joined ST in Central R&D in 1986 and transferred to the Automotive Division in 1988, where he designed automotive ICs incorporating smart-power technologies. He moved to Japan in 1990 working on a co-development activity designing a noise-reduction system for audio applications. Subsequently, Monti transferred into marketing, contributing to the expansion of ST’s automotive business in Japan. In 2000, he became the marketing manager for ST’s Automotive Division and started the Company’s automotive microprocessor business two years later. In 2004, Monti was promoted to Division General Manager for Powertrain, Safety, and Chassis products. He earned responsibility for the Automotive Electronics Division in 2009. Then, in 2012, Monti was appointed Executive Vice President, General Manager of ST’s Automotive Product Group. Marco Monti was born in Milan, Italy, in 1961. He graduated cum laude in Electronic Engineering from the Polytechnic of Milan and earned a PhD in Electronics from the University of Pavia, Italy.
Steven Rose
Steven Rose is STMicroelectronics’ President, Legal Counsel and Public Affairs, and has held this position since July 2023. He was appointed President, Legal Counsel in May 2018 and has been in charge of ST’s legal affairs since 2013. Rose is a member of ST’s Executive Committee. Rose started his career as a corporate attorney at the law firm Gardere & Wynne in Dallas, Texas, providing legal advice and services to public and private companies. He joined SGS-THOMSON Microelectronics (now STMicroelectronics) in 1991 as the Associate General Counsel for the U.S. subsidiary, STMicroelectronics, Inc. In 2006, Rose was appointed Senior Associate General Counsel for the Americas, Greater China & South Asia, and Japan & Korea regions, in addition to serving as Vice President, Secretary & General Counsel and a Director of STMicroelectronics, Inc. Steven Rose was born in Wichita, Kansas (USA), in 1962. He obtained a degree in Accounting from Oklahoma State University and a Juris Doctor degree from the University of Oklahoma College of Law.
Jerome Roux
Jerome Roux is STMicroelectronics’ President, Sales & Marketing, and has held this position since January 1, 2022. He is a member of ST’s Executive Committee. Roux began his career in the Planning department of SGS-THOMSON Microelectronics (now STMicroelectronics) in 1988. He soon moved to the Company’s packaging facility in Casablanca, Morocco as Material Manager. Afterwards, Roux moved to Singapore and then Shanghai as the Asia Pacific Marketing Director for ST’s Discrete and Standard Product Group. He left ST briefly to manage an ST supplier company and returned to ST in 2006 as Group Vice President, Assembly & Testing Outsourcing Operations. Global Purchasing responsibilities were added to his mandate in 2008. Roux was promoted to Corporate Vice President in 2012 and managed ST’s sales in the Greater China & South Asia Region and later the whole Asia Pacific Region. In 2017, Roux was appointed Executive Vice President, Sales & Marketing, for the Company’s Asia Pacific region. Roux serves as Advisor to the French Government (CCEF) on Foreign Trade. Jerome Roux was born in Antibes, France, in 1965, and graduated from ISG Business School in Paris with a master’s degree in Commerce (Management & Marketing).
b.Biographies of our Executive Vice Presidents
The group of Executive Vice Presidents consisted of the following people as of December 31, 2023:
97
Name(1) | Position | Years with Company | Years in Semi- Conductor Industry | Age | ||||||||||||||||||||||
| Michael Anfang | Executive Vice President, Sales & Marketing, Europe, Middle East and Africa Region (EMEA) | 25 | 33 | 55 | ||||||||||||||||||||||
| Christophe Ayela | Executive Vice President, Analog & Power Front-End Manufacturing | 33 | 33 | 57 | ||||||||||||||||||||||
| Alexandre Balmefrezol | Executive Vice President and General Manager of the Imaging sub-group within ST’s Analog, MEMS and Sensors Group | 26 | 26 | 49 | ||||||||||||||||||||||
| Stefano Cantù | Executive Vice President, Smart Power Solutions Sub-Group within ST’s Automotive and Discrete Group (ADG), Automotive Business Deputy | 29 | 29 | 55 | ||||||||||||||||||||||
| Henry Cao | Executive Vice President, Sales & Marketing, China Region | 3 | 3 | 50 | ||||||||||||||||||||||
| Alessandro Cremonesi | Executive Vice President, Chief Innovation Officer and General Manager System Research and Applications (SRA) Group | 39 | 39 | 65 | ||||||||||||||||||||||
| Alberto Della Chiesa | Executive Vice President Supply Chain | 35 | 35 | 59 | ||||||||||||||||||||||
| Ricardo De Sa Earp | Executive Vice President, General-Purpose Microcontroller sub-group within ST's Microcontrollers and Digital ICs Group | 26 | 26 | 60 | ||||||||||||||||||||||
| Franck Freymond | Executive Vice President, Chief Audit & Risk Executive | 13 | 13 | 55 | ||||||||||||||||||||||
| Fabrice Gomez | Executive Vice President, Head of Back-End Manufacturing & Technology | 11 | 11 | 55 | ||||||||||||||||||||||
| Frédérique Le Grevès | Executive Vice President, Europe and France Public Affairs | 3 | 3 | 56 | ||||||||||||||||||||||
| Claudia Levo | Executive Vice President, Integrated Marketing & Communications | 12 | 14 | 58 | ||||||||||||||||||||||
| Matteo Lo Presti | Executive Vice President, General Manager, Analog sub-group within ST's Analog, MEMS and Sensors Group | 30 | 33 | 59 | ||||||||||||||||||||||
| Laurent Malier | Executive Vice President Digital Front-End Manufacturing and Technology | 8 | 29 | 56 | ||||||||||||||||||||||
| Edoardo Merli | Executive Vice President, Power Transistor sub-group within ST's Automotive and Discrete Group | 25 | 25 | 61 | ||||||||||||||||||||||
| Hiroshi Noguchi | Executive Vice President, Sales & Marketing, Asia Pacific Region excluding China (APeC) | 16 | 16 | 48 | ||||||||||||||||||||||
| Giuseppe Notarnicola | Executive Vice President, Treasury, Insurance, M&A, IP BU, and Italy Public Affairs | 18 | 18 | 62 | ||||||||||||||||||||||
| Rino Peruzzi | Executive Vice President, Sales & Marketing, Americas and Global Key Account Organization | 25 | 25 | 58 | ||||||||||||||||||||||
| Chouaib Rokbi | Executive Vice President, Digital Transformation and Information Technology, Corporate Development | 23 | 23 | 52 | ||||||||||||||||||||||
| Bertrand Stoltz | Executive Vice President Finance, Global Shared Services and Systems, Asia Public Affairs | 29 | 29 | 53 | ||||||||||||||||||||||
| Geoff West | Executive Vice President, Chief Procurement Officer | 30 | 38 | 60 | ||||||||||||||||||||||
| Nicolas Yackowlew | Executive Vice President, Product Quality & Reliability | 28 | 29 | 54 | ||||||||||||||||||||||
_________________________________
(1) Michael Hummel left his position in November 2023, and Christophe Ayela was appointed as Executive Vice President, Analog & Power Front-End Manufacturing. Alexandre Balmefrezol was appointed in January 2023 as Executive Vice President and General Manager of the Imaging sub-group replacing Eric Aussedat. Fabrice Gomez has replaced in July 2023 Fabrio Gualandris as Executive Vice President, Head of Back-End Manufacturing & Technology. Andrea Onetti left his position as Executive Vice President, MEMS Sub-Group in 2023. Geoff West was appointed as Executive Vice President, Chief Procurement Officer in 2023.
c.Biographies of our Executive Vice Presidents Committee Members
Michael Anfang
Michael Anfang is Executive Vice President, Sales & Marketing for STMicroelectronics’ Europe, Middle East and Africa Region (EMEA), and has held this position since November 2018. Anfang started his career with Siemens Semiconductor AG in 1990 in product engineering, followed by responsibilities in product design, automotive and strategic marketing. In 1999, he joined ST as an automotive business development manager. In 2002, Anfang was given responsibility for microcontroller product marketing at ST’s Automotive Division in Agrate, Italy and was promoted to Director of Marketing & Applications in 2005. Four years later, he was appointed Digital
98
Automotive Business Unit Director of the Automotive Product Group and became a member of the management team responsible for the MCU Joint Development Program between Freescale and STMicroelectronics. In 2013, Anfang joined the EMEA regional organization of STMicroelectronics as Automotive Marketing & Applications Vice President. Michael Anfang was born in Kitzbühel, Austria, in 1968. He graduated with a degree in Electronic Engineering from the Higher Technical School in Saalfelden, Austria, and a degree in Business Management and Marketing from the FU University in Hagen-Munich, Germany.
Christophe Ayela
Christophe Ayela is Executive Vice President, Analog & Power Front-End Manufacturing, and has held this position since November 2023. Ayela joined STMicroelectronics in Tours (France) as R&D engineer in 1990. Five years later, he moved to Tours Manufacturing as Engineering Manager. In 2005, Ayela was named Tours Operations Deputy Director. In 2011, Ayela became the Tours Operations Director; he was then promoted to Operations Director for the Tours front-end and Rennes back-end sites in 2016. In 2018, Ayela was appointed General Manager for ST’s Asia Pacific Region Front-End Manufacturing, leading the capacity extension and operations transformation of the 200mm fab in Ang Mo Kio (Singapore). Christophe Ayela was born in Cognac, France in 1966. He graduated in Microelectronics Engineering from the National Institute of Applied Sciences (INSA) of Toulouse, France.
Alexandre Balmefrezol
Alexandre Balmefrezol is Executive Vice President and General Manager of the Imaging sub-group within ST’s Analog, MEMS and Sensors Group and has held this position since January 2023.Balmefrezol started his professional career as Product Design Engineer at ST in 1997. He held various positions in product design developing ST’s expertise and leadership in power-management ICs for mobile phones. In 2009, Balmefrezol joined ST-Ericsson, serving in different roles in product and business management. He was appointed Fellow in mixed-signal IC design and became head of ST-Ericsson’s Analog & Mixed Signal group. In 2013, Balmefrezol returned to ST as a design manager and was subsequently promoted to lead system and product design for Time-of-Flight and global-shutter sensors at ST’s Imaging division. Alexandre Balmefrezol was born in Millau, France, in 1974. He graduated with a degree in Electronic Engineering from the Institute of Engineering Sciences of Montpellier (ISIM) in 1997 and earned a master’s degree in Management Technology & Innovation from Grenoble Ecole of Management in 2011.
Stefano Cantù
Stefano Cantù is Executive Vice President, Smart Power Solutions Sub-Group within STMicroelectronics’ Automotive and Discrete Group (ADG) and has held this position since September 2020. He has also been Automotive Business Deputy across all ADG organizations since April 2019. After experiences at Italtel and the Italian Ministry of Defense, Cantù joined the Planning organization of STMicroelectronics’ Dedicated Product Group in 1994. Five years later, he was appointed Central Planning Manager for the Telecom, Peripheral, and Automotive Group. In 2003-2004, Cantù managed production control at ST’s manufacturing sites in Phoenix and Carrollton in Texas, US and in 2005, he moved to Planning Director at ST’s Automotive Product Group. Cantù was promoted to Automotive Product Group Vice President responsible for Supply Chain in 2009 with Group Operations added to his mandate in 2012, before becoming Supply Chain General Manager in 2016. Stefano Cantù was born in Milan, Italy, in 1968, and he graduated with a degree in Electronic Engineering from the Polytechnic of Milan.
Henry Cao
Henry Cao is Executive Vice President, Sales & Marketing for STMicroelectronics’ China Region and has held this position since January 2022. Cao began his career as Account Manager at Siemens Communications Group in 1995 in charge of the communication-infrastructure business. In the following years, he moved among roles as Business Development Manager and Sales Director in various Siemens BUs and corporate functions in Munich, Beijing, and Shanghai. In 2006, Cao joined Dell Technologies as a Director, managing enterprise solutions covering server, storage, networking, and related software & service businesses. In 2014, he was appointed Vice President in charge of the data-center solutions business for Dell Technologies in Greater China and was promoted to Senior Vice President in 2018. Cao joined ST in June 2020 as Corporate Vice President to manage the Company’s sales in China. Henry Cao was born in Shanghai, China, in 1973. He graduated from Shanghai University of Engineering & Science with a degree in Mechanical & Electrical Engineering and holds an MBA degree from Washington University in St. Louis.
99
Alessandro Cremonesi
Alessandro Cremonesi is STMicroelectronics’ Executive Vice President, Chief Innovation Officer and General Manager of STMicroelectronics’ System Research and Applications (SRA) Group. He has managed the SRA group since 2013 and added the Innovation Office to his mandate in early 2020. Cremonesi’s responsibilities span from global innovation coordination to corporate advanced R&D to system-solutions support for ST customers. Cremonesi joined STMicroelectronics in 1984. He has served in managerial roles with both Strategic Marketing and R&D responsibilities across domains from telecommunications to audio/video digital-signal processing and multimedia applications. He has been a key contributor to ST’s extensive efforts and strategy in IoT and Artificial Intelligence and, more recently, has led the creation of strategic initiatives to increase ST’s innovation capability. Cremonesi was part of an expert group defining the strategy for Artificial Intelligence for the Italian Ministry of Economic Development. He has authored several technical papers and patents and is a member of the Scientific Advisory Board at IMEC. Born in Sant’Angelo Lodigiano, Italy in 1958, Alessandro Cremonesi graduated with a master's degree in Electronics Engineering from University of Pavia in 1984.
Alberto Della Chiesa
Alberto Della Chiesa is STMicroelectronics’ Executive Vice President in charge of Supply Chain and has held this role since May 2012. Della Chiesa joined STMicroelectronics as a New Product Planning Engineer in 1988. He was in charge of new product introductions in the Automotive and Hard Disk Drive market and pioneered a number of ST’s successful collaborative programs with major key customers. In his tenure at STMicroelectronics, Della Chiesa has covered different positions in both Planning and Operations. In 2005, he was appointed Director, Planning & Service for the Computer Peripherals Group, where he actively contributed to the creation of ST’s first operations and planning structure in Singapore. Over time, Della Chiesa rose to become Group Vice President of Supply Chain, followed by the nomination of General Manager and consequently Head of Operations and Supply Chain for ST’s Computers and Communications Infrastructure Product Group. Alberto Della Chiesa was born in Varese, Italy, in 1964, and holds a bachelor's degree in Statistics from the Catholic University of Milan, with a specialization in the manufacturing processes. He is also CPIM certified with the American Production and Inventory Control Society (APICS) in Paris, France.
Ricardo De Sa Earp
Ricardo De Sa Earp is STMicroelectronics’ Executive Vice President, General-Purpose Microcontroller Sub-Group Vice President and has held this position since January 2022. De Sa Earp started his career with Philips Consumer Electronics in Sao Paulo, Brazil, working in TV design. In 1993, he moved to the Electronics Division of Valeo, where he held positions in marketing and project management. De Sa Earp joined ST in 1997 as Strategic Marketing Manager in the ASD&IPAD Division at ST Tours (France). In 2003, he was promoted to the position of ASD&IPAD Division General Manager and successfully led the Division for 15 years. In 2018, De Sa Earp was appointed Group Vice President and General Manager of the Microcontrollers Division within ST’s Microcontrollers and Digital ICs Group. Ricardo De Sa Earp was born in Petropolis, Brazil, in 1963. He graduated in Electronic Engineering from the Instituto Tecnologico de Aeronautica Sao Jose dos Campos, Brazil, and completed his master’s degree in Electronic Engineering at the Technical University of Eindhoven, Holland. De Sa Earp also holds an MBA from INSEAD in France.
Franck Freymond
Franck Freymond is STMicroelectronics’ Executive Vice President, Chief Audit & Risk Executive, and has held this role since March 2019. Freymond started his career with Credit Suisse Group in 1992 as credit analyst/assistant account manager and then became manager in charge of financing solutions for specific segments of Swiss Corporates. In 2000, he joined EY (Ernst & Young) in Switzerland as manager in the Risk Advisory service line and was promoted Regional Leader and member of the service line leadership team in 2004. In those roles, Freymond advised multi-national companies globally in a wide cross-section of industries in governance, risk management, internal control, and internal audit matters. In 2010, he joined STMicroelectronics as Group Vice President, Chief Audit Executive in charge of the Corporate Audit function. Freymond’s scope of responsibilities was subsequently extended to Enterprise Risk Management and Resilience Management, including business continuity and crisis management. Freymond served as Chairman of STMicroelectronics’ Corporate Ethics Committee from 2012 to 2018. Franck Freymond was born in Morges near Lausanne, Switzerland in 1968. He holds a Master of Science in
100
Management from HEC Lausanne (Switzerland) and various professional certifications in internal audit and risk management assurance.
Fabrice Gomez
Fabrice Gomez is Executive Vice President, Head of ST’s Back-End Manufacturing & Technology organization. He has held this position since July 2023. Gomez started his career as a project manager at Solectron in 1992. He worked as General Manager and Sales Director for European PCB manufacturer Ruwel from 2001 to 2005, when he joined global EMS provider Flextronics, earning promotions to become Head of Operations in Bordeaux, France, in 2007. After two years with another EMS heavyweight Celestica, Gomez served as Managing Director for First Solar, a leading manufacturer of photovoltaic solar modules and systems in Vietnam. In 2012, he joined ST as General Manager of the back-end fab in Bouskoura, Morocco, one of the Company’s key manufacturing sites with high-volume production for Automotive, Industrial, and Consumer markets. Fabrice Gomez was born in Bordeaux, France, in 1968. He holds an engineering degree in microelectronics from the Ecole Nationale Supérieur d’Electronique et Radio in Bordeaux and a CPIM (Certified in Production and Inventory Management) certification from the Association for Supply Chain Management.
Frédérique Le Grevès
Frédérique Le Grevès is STMicroelectronics’ Executive Vice President, Europe and France Public Affairs. She has also held the position of President of STMicroelectronics France since March 2021. In 1990, Le Grevès started her career in marketing and communication for various international companies in Europe and in the US. From 1995 to 2003, she worked at Aptiv (ex-Delphi Automotive) as EMEA Communication Director. In 2003, Le Grevès joined Nissan Motors as VP Communication for Europe and in 2004, she moved to Los Angeles as VP Communications for Nissan Americas. Le Grevès returned to France in 2008 and joined the Renault Group as Global VP for Corporate Communication. Two years later, she expanded her role to Global VP of Communications and Deputy to the Chief Marketing and Communication officer. In 2011, Le Grevès was appointed Chief of Staff for the Renault Nissan Mitsubishi Alliance Chairman and CEO. More recently, she worked as senior advisor for several companies helping on corporate effectiveness, operations efficiency, and brand reputation. In April 2022, Le Grevès was appointed President of the “Electronic Industry” sector strategic committee in France and Vice President of the European Semiconductor Industry (ESIA) in December 2023. She is also an independent board member of the Supervisory Board of TRIGO Holding since May 2021 and sits on the Strategic Board of Clinatec since October 2021. Frédérique Le Grevès was promoted Knight of the Legion of Honor by the French Ministry of Economy and Finance in January 2023. Born in Suresnes, France, in 1967, Frédérique Le Grevès graduated with a master’s degree in business management from the Paris School of Business (1991) and graduated from the Senior Executive Program at the London Business School (2019).
Claudia Levo
Claudia Levo is Executive Vice President at STMicroelectronics with responsibility, since June 2018, for integrated Marketing & Communications strategies and plans. Her responsibilities encompass corporate communications, including PR, media and industry analyst relations, marketing communications and digital marketing. Levo began her career in 1993, with Marconi, a global telecommunications company, where she had responsibility for a number of management roles within the Communication function, including marketing communications and internal and external communications across wide geographies. In 2005, Levo managed the communication activities related to the integration of Marconi with Ericsson, and was subsequently appointed Vice President for Communications at the newly formed Ericsson Multimedia Business Unit. In 2008, Levo was appointed Vice President Communications at Italtel. In early 2009 she joined ST-Ericsson, the wireless joint venture between STMicroelectronics and Ericsson, as Senior Vice President and head of Global Communications. In this capacity, she has successfully built the Global Communication function covering marketing and portfolio communication, public and media relations, investor relations and internal communication. Claudia Levo was born in Genoa, Italy, in 1965, and holds a language school diploma (Liceo Linguistico) in English and Russian.
Matteo Lo Presti
Matteo Lo Presti is Executive Vice President, General Manager of the Analog sub-group within ST’s Analog, MEMS and Sensors Group, and has held this position since January 2016. Lo Presti joined the Advanced Research Group of SGS-Thomson Microelectronics (now STMicroelectronics) in 1994 and was appointed Head of Fuzzy Logic R&D four years later. From 2002 to 2004, Lo Presti led the marketing and application labs for the Industrial
101
and Automotive market segments in ST’s Emerging Markets. He gained responsibility for the Company’s Systems Lab in 2004 and the Subsystem Product Group and Technical Marketing for the Industrial & Multisegment Sector were added to his mandate in 2008 and 2009, respectively. In 2012, Lo Presti was promoted to Group Vice President, General Manager, Industrial and Power Conversion Division. From 1996 to 2004, Lo Presti served as a visiting professor at the University of Messina (Italy) and the University of Catania (Italy). He has authored more than 40 international publications and holds several industrial patents. Matteo Lo Presti was born in Misterbianco, Italy, in 1965, and graduated with a degree in Electronic Engineering from the University of Catania.
Laurent Malier
Laurent Malier is Executive Vice President of STMicroelectronics, Digital Front-End Manufacturing and Technology, and has held this position since January 2022. He manages ST’s manufacturing operations in Crolles and Rousset, as well as Technology R&D and Design Enablement for the Company’s Digital, Optical Sensing Solutions, RF, Non-Volatile Memory, and Smart Power technologies. After several years of research in chemical physics, Malier worked at the French Ministry of Defence from 1995 to 2000. He then joined Alcatel Optronics, first to lead new-product development and later managed semiconductor activities. Malier was appointed Front-End R&D and Manufacturing Director for Avanex Group that merged Alcatel’s and Corning’s opto-electronics operations in 2003. In 2005, he joined the French technology research center CEA-LETI as deputy director, Strategy and Programs, and became Chief Executive Officer of LETI in 2006. In 2015, Malier joined ST to drive the Company’s Digital Technology R&D. He was promoted to Group VP, RF & Communication sub-group in 2020. Malier was elected as Member of the French “Académie des Technologies” in 2019. He has authored 29 publications in physics and solid-state chemistry. Laurent Malier was born in Paris, France, in 1967. He graduated from the Ecole Polytechnique and has a PhD in Physics from Paris-Saclay University.
Edoardo Merli
Edoardo Merli is STMicroelectronics’ Executive Vice President, Power Transistor Sub-Group Vice President and has held this position since January 2022. Merli joined STMicroelectronics in 1998 as Head of System Architecture in the Telecom Wireline Division. In 2002, he formed and led ST’s WLAN Business Unit. Merli was appointed Director of the Automotive Product Group in 2007, where he took responsibility for the RF Competence Center & Connectivity Business Unit and subsequently for the Car Radio Business Unit. In 2012, Merli was promoted to Marketing & Application Director for ST’s Automotive and Discrete Group in Greater China and South Asia. In 2016, his responsibilities were extended to include the Company’s automotive activities in Korea. In 2017, Merli was promoted to Power Transistor Macro-Division General Manager and Group Vice President of ST’s Automotive and Discrete Group. Merli has filed several patents on ADSL, multi-service routers, switches, and throughput management, and authored numerous publications in the areas of Telecommunications, Automotive, and Connectivity. Edoardo Merli was born in Parma, Italy, in 1962, and graduated with a degree in Electronic Engineering from University of Bologna in 1989.
Hiroshi Noguchi
Hiroshi Noguchi is Executive Vice President, Sales & Marketing for STMicroelectronics’ Asia Pacific Region excluding China (APeC) and has held this position since January 1, 2022. Noguchi started his career as an optics engineer in Bell Labs at Lucent Technologies in 1999. He joined ST Japan in 2007 as a Motion MEMS marketing engineer. In 2011, Noguchi was promoted to Senior Marketing Manager for ST’s Advanced Analog group. Since 2015, he has served as Director of Analog, MEMS & Sensor group in Japan contributing to significant business growth and strengthening ST’s market leadership in Japan. In 2017, Noguchi was appointed Country Manager for ST Japan. Hiroshi Noguchi was born in Nagasaki, Japan, in 1975. He graduated from Northwestern University with a Bachelor of Science degree in Electrical Engineering and from Stanford University with a Master of Science degree in Electrical Engineering.
Giuseppe Notarnicola
Giuseppe Notarnicola is STMicroelectronics’ Executive Vice President responsible for managing Corporate Treasury, a position he has held since January 2006. His responsibilities were expanded in 2013 to include Insurance and in 2018 to include M&A, IP Business Unit and Public Affairs for Italy. Notarnicola started his career with Banca Nazionale del Lavoro (BNL), one of Italy’s largest banks, in 1987. At BNL, he managed financial operations in Singapore, the Financial Department of the London branch, the global Head Office, financial advisory arm for
102
corporate and institutional customers, and in 2004, was promoted Head of Large Corporate clients. Notarnicola joined ST in 2006, when he initiated the Company’s relationship with the European Investment Bank and managed the financing aspects of ST’s Flash memory business spin-out, as well as all the Company’s strategic funding in the capital markets. Notarnicola is President of ST Italy and a board member of several other ST affiliates. In 2021, he was appointed Vice President for Economic Research Department and FDI Attraction at Assolombarda, an industrial organization that associates nearly 7,000 companies in the Lombardy Region of Italy. Giuseppe Notarnicola was born in Codroipo near Udine, Italy, in 1961. He graduated cum laude in Business Administration from the LUISS Guido Carli University in Rome, Italy.
Rino Peruzzi
Rino Peruzzi is Executive Vice President, Sales & Marketing, Americas and Global Key Account Organization, and has held this combined position since August 2022. Peruzzi began his career in Electronics at Micom Communications Systems in 1984, moved to Macom, Inc in 1989, and into the storage sector in 1990, with StorageTek, Maxtor, and Seagate Technology. In 1998 he joined ST as an account executive in the Storage Business Unit, where he earned Samsung Electronics’ Presidential Award. Peruzzi was promoted to Key Account Manager in 2000 and Director of Sales for Worldwide Storage Business in 2003. He was promoted to VP Worldwide Storage Sales (2008) and VP Sales for the Consumer Business Unit (2011), before being appointed VP Global Key Accounts (GKAs) in 2012. Here, he assembled a global organization and grew a key account’s revenue to become ST’s biggest. In 2014 Peruzzi’s perimeter expanded to include both GKA and EMS (Electronics Manufacturing Services). In 2018 Peruzzi was promoted to the Chief Executive Officer’s staff as Group VP of GKAs and became Executive VP GKAs Sales and Marketing Regions in 2021. Rino Peruzzi was born in Buffalo, New York (USA), in 1965. He is currently pursuing his MBA from York St John University.
Chouaib Rokbi
Chouaib Rokbi is Executive Vice President, Digital Transformation and Information Technology at STMicroelectronics and has held this position since January 2022. His mandate was expanded in early 2023 to include Corporate Development, encompassing the Company’s business planning, M&A opportunities, corporate partnerships, and strategic alliances. Rokbi started his career in Tamrock, Sandvik’s hard-rock mining division, in 1995 as the design manager for small-size mining rigs, where he successfully led the redesign to reduce the cost of the equipment line. After earning his MBA in 2000, he joined STMicroelectronics as the industrial controller for the Rousset plant in France. Four years later, Rokbi’s controlling responsibilities were expanded to cover all of ST’s front-end manufacturing operations. Between 2007 and 2018, he held senior positions in financial control, efficiency improvement programs, and corporate strategic initiatives. In 2018, Rokbi was appointed Chief Transformation Officer with the mission to rebuild the Company’s main operational processes, including Supply Chain, Product Lifecycle Management, and Manufacturing Analytics, leveraging state-of-the-art digital technologies. Chouaib Rokbi was born in Lyon, France in 1971, and holds a degree in mechanical engineering from INSA Lyon and an MBA from Emlyon Business School in Lyon.
Bertrand Stoltz
Bertrand Stoltz is STMicroelectronics’ Executive Vice President in charge of Finance, Global Shared Services and Systems, as well as ST’s Asia Public Affairs, and has held both roles since April 2022. He also sits on ST’s Corporate Ethics Committee. Stoltz started his career at Finance of SGS-Thomson (now ST) in Tours, France, in 1994. From 1999 to 2002, he worked at the Company’s headquarters in Corporate Strategic Planning and Corporate Internal Audit. In 2002, Stoltz moved to Singapore to lead ST’s Asia Internal Audit team and became Head of Finance at ST Singapore in 2005. Stoltz was subsequently promoted to Group Vice President, expanding his mandate to cover Asia, Americas, France, Italy, and most recently all local financial reporting and regional business control worldwide. Managing Director for ST’s Singapore entities and a Board Member at several other ST affiliates, Stoltz also serves as Advisor to the French Government on Foreign Trade in Singapore. Bertrand Stoltz was born in Moulins, France, in 1970. He holds an honour’s degree with a major in finance from the Institute of Political Studies in Lyon. He also graduated with a degree from the University Business School in Tours, and the International Executive Program of INSEAD.
103
Geoff West
Geoff West is ST’s Executive Vice President, Chief Procurement Officer, and has been responsible for the Company’s Global Procurement Organization since 2016. West started his career as a fab accountant working for Plessey Semiconductors for seven years before joining SGS-THOMSON (now ST) as a Business Unit Controller in Bristol, UK, in 1993. Following controller roles of increasing responsibility in the US and France, he was appointed Group VP Manufacturing and Technology, Financial Control based in Rousset, France. In 2011, West was promoted to Vice President Finance and CFO for ST’s America Region, with European responsibility added in 2013. In that year, he was appointed General Manager Wafer Foundry Organization, managing the procurement of external manufacturing services including engineering, quality, and the supply chain. In 2016, West became Head of Global Sourcing, responsible for the development and implementation of ST’s corporate sourcing strategies. Geoff West was born in Warwick, England, in 1963. He holds a BA degree in Business Studies from the University of Plymouth, UK and is a Fellow of the Chartered Institute of Management Accountants.
Nicolas Yackowlew
Nicolas Yackowlew is Executive Vice President, Product Quality & Reliability at STMicroelectronics and has held this position since August 2018. Yackowlew began his career in 1996 as Product Quality Engineer at ST. He has successfully driven Quality and Reliability departments for many years at both the Division and Group levels. Yackowlew was promoted Division Quality & Reliability Manager in 2006 leading quality for Serial Non Volatile Memory. Three years later, he was appointed Quality & Reliability Director in charge of the Quality for Memory, Microcontrollers and Secured Microcontrollers. In 2016, Yackowlew took the responsibility of Quality & Reliability for the Microcontroller and Digital ICs Group (MDG). Nicolas Yackowlew was born in Mulhouse (France) in 1969 and graduated with a degree in Chemistry from the University of Nice Sophia Antipolis, France.
iv.Senior Management compensation
a.Guiding principles of Senior Management compensation
The Managing Board determines the remuneration structure of the Senior Management based on, amongst others, the same key principles that the Supervisory Board considers when determining the remuneration structure of the Managing Board. These key principles are described above in “section B.ii.a Guiding principles of Managing Board compensation”.
In accordance with the key principles, the total remuneration of the Senior Management takes into consideration factors such as the size and complexity of the Company, our global presence and that of our customers, the pace of change in our industry, the Company’s value proposition, strategy and goal of long-term value creation, and the need to recruit and retain key personnel.
b.Senior Management remuneration structure
The Managing Board determines the remuneration structure and remuneration amounts for our Senior Management based on the analysis of the theoretical maximum total direct remuneration (i.e., sum of base salary, maximum short-term incentive, and maximum long-term incentive).
The remuneration package of the Senior Management is comprised of the following:
•Base salary; and
•Variable components, linked to performance:
oA short-term incentive which is fully paid in cash.
oA long-term incentive through the grant of stock awards, that are included in the long-term incentive plan approved at the AGM.
The sum of these three elements represents the maximum total direct remuneration for the Senior Management.
104
Base salary
The purpose of the base salary is to provide a fixed level of earnings and to attract and retain talent. It is a key component of overall remuneration, particularly as the short-term incentive is expressed as a percentage of base salary.
Short-term incentive
The short-term incentive based on the corporate executive incentive program (“EIP”), entitles selected executives, including the members of Senior Management, to an annual short-term incentive. This short-term incentive is based upon the assessment of the achievement of individual, organizational and Company objectives that are set on an annual basis and focused on, inter alia, return on net assets, customer service, profit, cash flow and market share. The maximum amount awarded under the short-term incentive is based upon a percentage of the executive’s salary and the overall achievement of the relevant objectives on an annual basis.
The 2023 short-term incentive includes a sustainability/corporate social responsibility index for Senior Management, as part of our efforts to include corporate social responsibility into the performance framework of our Senior Management. For Executive Committee members and Executive Vice Presidents, the weight of the sustainability/corporate social responsibility index ranges between 5% and 10%. The sustainability/corporate social responsibility index is divided into four criteria related to health and safety, environment, diversity & inclusion, and people engagement.
For the 2023 short-term incentive, the sustainability/corporate social responsibility index was comprised of the following KPIs:
•Health & safety: measured against, amongst others, the employee safety performance
•Environment/climate: measured against, amongst others, direct emissions (kCO2 equivalent)
•Diversity & inclusion: measured against, amongst others, gender ratio among management levels
•People management: measured against, amongst others, the employee survey (engagement index)
The weight of the sustainability/corporate social responsibility index is designed to remain stable over time, however the individual sub-components used to form the sustainability/corporate social responsibility index may evolve in the future to address sustainability priorities facing the Company and society.
Long-term incentive
The purpose of the long-term incentive, through the grant of stock awards, is to motivate the Senior Management to deliver sustainable long-term shareholder value through long-term profitability and share price growth.
In accordance with the current long-term incentive plan, the vesting of unvested stock awards in respect of:
(i) the Executive Committee, is subject to the achievement of performance conditions and calculated over a three-year performance period. Grants of unvested stock awards made in 2023 and 2024 will fully vest, subject to performance conditions, in 2026 and 2027 respectively, provided also that the eligible employee is still an employee of the Company at such time; and
(ii) the Executive Vice Presidents, is subject to the achievement of performance conditions and will vest over a three-year horizon from the date of the grant, with 32% vesting after one year, a further 32% after two years and the remaining 36% after three years, provided also that the eligible employee is still an employee of the Company at such time.
The Supervisory Board determines whether the performance criteria are met and concludes whether and to which extent all eligible employees are entitled to any stock awards under the long-term incentive plan.
From 2021, a new sustainability/corporate social responsibility index has been introduced among the performance conditions for the long-term incentive.
105
For the 2023 long-term incentive, the sustainability/corporate social responsibility index was comprised of the following KPIs:
•Environment/climate: measured against, amongst others, the direct emissions (kCO2 equivalent)
•Diversity & inclusion: measured against, amongst others, gender ratio among management levels
•ESG investor index: measured against, amongst others, the Dow Jones sustainability indices
•Carbon rating agency: measured against, amongst others, the CDP carbon rating
The weight of the sustainability/corporate social responsibility index is designed to remain stable for future grants, however the individual sub-components used to form the sustainability/corporate social responsibility index may evolve in the future to address sustainability priorities facing the Company and society.
Pension plan, life and medical insurance
Our Supervisory Board has approved the establishment of a complementary pension plan for certain key executives as selected by the sole member of the Managing Board, our President and Chief Executive Officer, according to the general criteria of eligibility and service as determined by the Supervisory Board upon the proposal of its Compensation Committee. With respect to such complementary pension plan, we have set up an independent foundation under Swiss law which manages the plan and to which we make contributions. Pursuant to this plan, in 2023, we made a contribution of approximately $0.5 million to the plan of the sole member of the Managing Board, our President and Chief Executive Officer, and of $1.05 million to the plan for all beneficiaries other than the sole member of the Managing Board, our President and Chief Executive Officer. The amount of pension plan payments made for other beneficiaries, such as former employees retired in 2023 and/or no longer salaried in 2023, was $1.1 million.
The members of our Senior Management, including the sole member of the Managing Board, our President and Chief Executive Officer, were covered in 2023 under certain group life and medical insurance programs provided by us. The aggregate additional amount set aside by us in 2023 to provide pension, retirement or similar benefits to our Senior Management, including the sole member of the Managing Board, our President and Chief Executive Officer, including the amounts allocated to the complementary pension plan described above, is estimated to have been approximately $8.3 million, which includes statutory employer contributions for state run retirement, similar benefit programs and other miscellaneous allowances.
The structure of our remuneration for our (i) Managing Board, President and Chief Executive Officer, (ii) Senior Management, and (iii) certain other groups of senior employees is aligned and consists of a base salary, short-term incentive and long-term incentive, under specified conditions. The standard benefits for the aforementioned groups are also aligned.
c.Compensation paid to the Senior Management in 2023, 2022 and 2021
Base salary
Over the last three years the base salary paid to the Senior Management (including the sole member of the Managing Board, our President and Chief Executive Officer) is:
2023(1) | 2022(2) | 2021(3) | |||||||||||||||
Senior Management base salary | $19,225,024 | $20,848,371 | $14,665,462 | ||||||||||||||
___________________
(1) Including the amounts paid in 2023 to our former President, Technology, Manufacturing, Quality and Supply Chain, Orio Bellezza; former Executive Vice President Front-End Manufacturing, Analog and Power, Michael Hummel and former Executive Vice President, MEMS Sub-Group Analog, MEMS and Sensors Group, Andrea Onetti. During 2023, our Senior Management consisted of 34 members
(2) Including amounts paid in 2022 to our former Executive Vice President, Digital & Smart Power Technology and Digital Front-End Manufacturing, Joel Hartmann, and former Executive Vice President, General Manager, Sales & Marketing, Americas Region, Paul Cihak. During 2022, our Senior Management consisted of 33 members.
(3) Including amounts paid in 2021 to our former President, Analog, MEMS and Sensors Group, Benedetto Vigna and former Executive Vice President Europe and France Public Affairs, Thierry Tingaud. During 2021, our Senior Management consisted of 24 members.
106
Short-term incentive
The amounts paid in 2023 to our Senior Management (including the sole member of the Managing Board, our President and Chief Executive Officer) pursuant to the short-term incentive represented approximately 18.07% of the total compensation paid to our Senior Management and are further detailed below:
Bonus paid in 2023 (2022 performance) (1) | Bonus paid in 2022 (2021 performance)(2) | Bonus paid in 2021 (2020 performance)(3) | ||||||||||||||||||
| Short-term incentive (cash) amount | $ | 19,654,870 | $ | 17,557,713 | $ | 11,476,929 | ||||||||||||||
| Ratio short-term incentive / (base salary + Short-term incentive) | 50.55 | % | 45.72 | % | 47.43 | % | ||||||||||||||
______________
(1)Including amounts paid in 2023 to our former President, Technology, Manufacturing, Quality and Supply Chain, Orio Bellezza; former Executive Vice President Front-End Manufacturing, Analog and Power, Michael Hummel and former Executive Vice President, MEMS Sub-Group Analog, MEMS and Sensors Group, Andrea Onetti.
(2)Including amounts paid in 2022 to our former Executive Vice President, Digital & Smart Power Technology and Digital Front-End Manufacturing, Joel Hartmann, and former Executive Vice President, General Manager, Sales & Marketing, Americas Region, Paul Cihak.
(3)Including amounts paid in 2021 to our former President, Analog, MEMS and Sensors Group, Benedetto Vigna and former Executive Vice President Europe and France Public Affairs, Thierry Tingaud.
Long-term incentive
The second part of the variable component is the long-term incentive which links the long-term interests of the Senior Management with the shareholders’ and investors’ interests.
The amounts paid in 2023 to our Senior Management (including the sole member of the Managing Board, our President and Chief Executive Officer) pursuant to the long-term incentive represented approximately 45.97% of the total compensation paid to our Senior Management and are further detailed below:
Long-term incentives paid in 2023 (1) | Long-term incentives paid in 2022(2) | Long-term incentives paid in 2021(3) | |||||||||
| Long-term incentive amount | $ | 50,010,449 | $ | 41,000,100 | $ | 43,042,934 | |||||
| Ratio long-term incentive / base salary | 260.13% | 196.66% | 293.50% | ||||||||
Ratio long-term incentive / (short-term incentive + long-term incentive) | 71.79% | 70.02% | 78.95% | ||||||||
_____________
(1) Including amounts paid in 2023 to our former President, Technology, Manufacturing, Quality and Supply Chain, Orio Bellezza; former Executive Vice President Front-End Manufacturing, Analog and Power, Michael Hummel and former Executive Vice President, MEMS Sub-Group Analog, MEMS and Sensors Group, Andrea Onetti
(2) Including amounts paid in 2022 to our former Executive Vice President, Digital & Smart Power Technology and Digital Front-End Manufacturing, Joel Hartmann, and former Executive Vice President, General Manager, Sales & Marketing, Americas Region, Paul Cihak.
(3) Including amounts paid in 2021 to our former President, Analog, MEMS and Sensors Group, Benedetto Vigna and former Executive Vice President Europe and France Public Affairs, Thierry Tingaud.
Total Compensation
The following table sets forth the total amount paid as compensation in 2023, 2022 and 2021 to our Senior Management (including the sole member of the Managing Board, our President and Chief Executive Officer) as of December 31 of each year, before applicable withholding taxes and social contributions:
107
| Variable components | Other components(1) | |||||||||||||||||||||||||||||||||||||||||||||||||||||||||||||||||||||||||||||||||||||
| Year | Base salary | Short-term Incentives | Long-term Incentives | Benefits | Social security contributions | Pensions | Termination benefits | Total | Fixed/ Variable remuneration | |||||||||||||||||||||||||||||||||||||||||||||||||||||||||||||||||||||||||||||
2023(2) | $19,225,024 | $19,654,870 | $50,010,449 | $1,659,639 | $10,555,981 | $1,474,372 | $6,203,607 | $108,783,942 | 32% fixed / 68% variable | |||||||||||||||||||||||||||||||||||||||||||||||||||||||||||||||||||||||||||||
2022(3) | $20,848,371 | $17,557,713 | $41,000,100 | $1,706,799 | $10,468,677 | $1,498,828 | $2,284,907 | $95,365,395 | 39% fixed/ 61% variable | |||||||||||||||||||||||||||||||||||||||||||||||||||||||||||||||||||||||||||||
2021(4) | $14,665,462 | $11,476,929 | $43,042,934 | $1,395,509 | $9,626,193 | $794,387 | $3,288,715 | $84,290,129 | 35% fixed/ 65% variable | |||||||||||||||||||||||||||||||||||||||||||||||||||||||||||||||||||||||||||||
_______________________
(1) There were no miscellaneous allowances in the years 2023, 2022, and 2021.
(2) Including amounts paid in 2023 to our former President, Technology, Manufacturing, Quality and Supply Chain, Orio Bellezza; former Executive Vice President Front-End Manufacturing, Analog and Power, Michael Hummel and former Executive Vice President, MEMS Sub-Group Analog, MEMS and Sensors Group, Andrea Onetti.
(3) Including amounts paid in 2022 to our former Executive Vice President, Digital & Smart Power Technology and Digital Front-End Manufacturing, Joel Hartmann, and former Executive Vice President, General Manager, Sales & Marketing, Americas Region, Paul Cihak.
(4) Including amounts paid in 2021 to our former President, Analog, MEMS and Sensors Group, Benedetto Vigna and former Executive Vice President Europe and France Public Affairs, Thierry Tingaud.
We did not extend any loans or overdrafts to the sole member of the Managing Board, our President and Chief Executive Officer, nor to any other member of our Senior Management. Furthermore, we have not guaranteed any debts or concluded any leases with the sole member of the Managing Board, our President and Chief Executive Officer, nor with any other member of our Senior Management or their families.
As discussed above, Senior Management (and the compensation related hereto in this Item 6(C)(iv)(c)) refers to:
•The sole member of the Managing Board, our President and Chief Executive Officer;
•The members of the Executive Committee (including the sole member of the Managing Board, our President and Chief Executive Officer) of the Company; and
•The Executive Vice Presidents of the Company.
We also include below, for comparative purposes, (I.) compensation paid to the Executive Committee (excluding the sole member of the Managing Board, our President and Chief Executive Officer) in financial years 2023, 2022 and 2021, and (II.) compensation paid to the Executive Vice Presidents in financial years 2023, 2022 and 2021.
I. Compensation paid to the Executive Committee (excluding the sole member of the Managing Board, our President and Chief Executive Officer)
Base salary
The base salary paid to the Executive Committee (excluding the sole member of the Managing Board, our President and Chief Executive Officer) in financial years 2023, 2022 and 2021 is:
2023(1) | 2022 | 2021(2) | ||||||||||||||||||
Executive Committee base salary | $ | 6,782,818 | $ | 7,001,152 | $ | 6,310,664 | ||||||||||||||
_____________
(1) Including amounts paid in 2023 to our former President, Technology, Manufacturing, Quality and Supply Chain, Orio Bellezza
(2) Including amounts paid in 2021 to our former President, Analog, MEMS and Sensors Group, Benedetto Vigna.
Short-term incentive
The amounts paid in financial years 2023, 2022 and 2021 to the Executive Committee (excluding the sole member of the Managing Board, our President and Chief Executive Officer) pursuant to the short-term incentive are further detailed below:
108
Bonus paid in 2023 (2022 performance)(1) | Bonus paid in 2022 (2021 performance) | Bonus paid in 2021 (2020 performance)(2) | ||||||||||||
Short-term incentive (cash) amount | $8,553,348 | $6,647,780 | $5,063,522 | |||||||||||
Ratio short-term incentive / (base salary + Short-term incentive) | 56% | 49% | 45% | |||||||||||
_______________
(1)Including amounts paid in 2023 to our former President, Technology, Manufacturing, Quality and Supply Chain, Orio Bellezza.
(2)Including amounts paid in 2021 to our former President, Analog, MEMS and Sensors Group, Benedetto Vigna.
Long-term incentive
The amounts paid in financial years 2023, 2022 and 2021 to the Executive Committee (excluding the sole member of the Managing Board, our President and Chief Executive Officer) pursuant to the long-term incentive are further detailed below:
Long-term incentives paid in 2023(1) | Long-term incentives paid in 2022 | Long-term incentives paid in 2021(2) | |||||||||
Long-term incentive amount | $21,024,493 | $15,336,113 | $18,947,917 | ||||||||
Ratio long-term incentive / base salary | 310% | 219% | 300% | ||||||||
Ratio long-term incentive / (short-term incentive + long-term incentive) | 71% | 70% | 79% | ||||||||
___________
(1) Including amounts paid in 2023 to our former President, Technology, Manufacturing, Quality and Supply Chain, Orio Bellezza.
(2) Including amounts paid in 2021 to our former President, Analog, MEMS and Sensors Group, Benedetto Vigna.
Total Compensation
The following table sets forth the total amount paid as compensation in financial years 2023, 2022 and 2021, to the Executive Committee (excluding the sole member of the Managing Board, our President and Chief Executive Officer) as of December 31, before applicable withholding taxes and social contributions:
Variable components | Other components(1) | |||||||||||||||||||||||||||||||||||||||||||||||||
Year | Base salary | Short-term Incentives | Long-term Incentives | Benefits | Social security contributions | Pensions | Termination benefits | Total | Fixed/ Variable remuneration | |||||||||||||||||||||||||||||||||||||||||
2023(2) | $6,782,818 | $8,553,348 | $21,024,493 | $879,991 | $3,612,613 | $1,038,655 | $2,638,475 | $44,530,393 | 34% fixed/ 66% variable | |||||||||||||||||||||||||||||||||||||||||
| 2022 | $7,001,152 | $6,647,780 | $15,336,113 | $958,896 | $2,723,709 | $1,046,598 | $283,494 | $33,997,741 | 35% fixed/ 65% variable | |||||||||||||||||||||||||||||||||||||||||
2021(3) | $6,310,664 | $5,063,522 | $18,947,917 | $884,063 | $3,219,179 | $330,770 | $293,822 | $35,049,937 | 31% fixed/ 69% variable | |||||||||||||||||||||||||||||||||||||||||
___________
(1) There were no miscellaneous allowances in the years 2023, 2022, and 2021.
(2) Including amounts paid in 2023 to our former President, Technology, Manufacturing, Quality and Supply Chain, Orio Bellezza.
(3) Including amounts paid in 2021 to our former President, Analog, MEMS and Sensors Group, Benedetto Vigna.
II. Compensation paid to the Executive Vice Presidents
109
The base salary paid to the Executive Vice Presidents in financial years 2023, 2022 and 2021 is:
2023(1) | 2022(2) | 2021(3) | ||||||||||||||||||
Executive Vice Presidents base salary | $11,228,661 | $12,596,266 | $7,418,440 | |||||||||||||||||
________________
(1) Including amounts paid in 2023 to our former Executive Vice President Front-End Manufacturing, Analog and Power, Michael Hummel and former Executive Vice President, MEMS Sub-Group Analog, MEMS and Sensors Group, Andrea Onetti.
(2) Including amounts paid in 2022 to our former Executive Vice President, Digital & Smart Power Technology and Digital Front-End Manufacturing, Joel Hartmann, and former Executive Vice President, General Manager, Sales & Marketing, Americas Region, Paul Cihak.
(3) Including amounts paid in 2021 to Executive Vice President Europe and France Public Affairs, Thierry Tingaud.
Short-term incentive
The amounts paid in financial years 2023, 2022 and 2021 to the Executive Vice Presidents pursuant to the short-term incentive are further detailed below:
Bonus paid in 2023 (2022 performance)(1) | Bonus paid in 2022 (2021 performance)(2) | Bonus paid in 2021 (2020 performance)(3) | ||||||||||||
Short-term incentive (cash) amount | $8,282,397 | $8,403,357 | $4,506,101 | |||||||||||
Ratio short-term incentive / (base salary + Short-term incentive) | 42% | 40% | 38% | |||||||||||
(1) Including amounts paid in 2023 to our former Executive Vice President Front-End Manufacturing, Analog and Power, Michael Hummel and former Executive Vice President, MEMS Sub-Group Analog, MEMS and Sensors Group, Andrea Onetti.
(2) Including amounts paid in 2022 to our former Executive Vice President, Digital & Smart Power Technology and Digital Front-End Manufacturing, Joel Hartmann, and former Executive Vice President, General Manager, Sales & Marketing, Americas Region, Paul Cihak.
(3) Including amounts paid in 2021 to our former Executive Vice President Europe and France Public Affairs, Thierry Tingaud.
Long-term incentive
The amounts paid in financial years 2023, 2022 and 2021 to the Executive Vice Presidents pursuant to the long-term incentive are further detailed below:
Long-term incentives paid in 2023(1) | Long-term incentives paid in 2022(2) | Long-term incentives paid in 2021(3) | |||||||||
Long-term incentive amount | $27,147,593 | $23,620,775 | $20,849,377 | ||||||||
Ratio long-term incentive / base salary | 242% | 188% | 281% | ||||||||
Ratio long-term incentive / (short-term incentive + long-term incentive) | 77% | 74% | 82% | ||||||||
______________
(1) Including amounts paid in 2023 to our former Executive Vice President Front-End Manufacturing, Analog and Power, Michael Hummel and former Executive Vice President, MEMS Sub-Group Analog, MEMS and Sensors Group, Andrea Onetti.
(2) Including amounts paid in 2022 to our former Executive Vice President, Digital & Smart Power Technology and Digital Front-End Manufacturing, Joel Hartmann, and former Executive Vice President, General Manager, Sales & Marketing, Americas Region, Paul Cihak.
(3) Including amounts paid in 2021 to our former Executive Vice President Europe and France Public Affairs, Thierry Tingaud.
Total Compensation
The following table sets forth the total amount paid as compensation in financial years 2023, 2022 and 2021, to the Executive Vice Presidents as of December 31 of each year, before applicable withholding taxes and social
110
contributions:
Variable components | Other components(1) | ||||||||||||||||||||||||||||||||||||||||||||||||||||||||||
Year | Base salary | Short-term Incentives | Long-term Incentives | Benefits | Social security contributions | Termination benefits | Total | Fixed/ Variable remuneration | |||||||||||||||||||||||||||||||||||||||||||||||||||
2023(2) | $11,228,661 | $8,282,397 | $27,147,593 | $661,911 | $6,066,240 | $3,565,133 | $56,951,933 | 38% fixed / 62% variable | |||||||||||||||||||||||||||||||||||||||||||||||||||
2022(3) | $12,596,266 | $8,403,357 | $23,620,775 | $639,879 | $6,887,522 | $2,001,414 | $54,149,213 | 41% fixed / 59% variable | |||||||||||||||||||||||||||||||||||||||||||||||||||
2021(4) | $7,418,440 | $4,506,101 | $20,849,377 | $409,581 | $5,502,272 | $2,994,893 | $41,680,664 | 39% fixed / 61% variable | |||||||||||||||||||||||||||||||||||||||||||||||||||
_____________________
(1) There were no miscellaneous allowances in the years 2023, 2022, and 2021.
(2) Including amounts paid in 2023 to our former Executive Vice President Front-End Manufacturing, Analog and Power, Michael Hummel and former Executive Vice President, MEMS Sub-Group Analog, MEMS and Sensors Group, Andrea Onetti.
(3) Including amounts paid in 2022 to our former Executive Vice President, Digital & Smart Power Technology and Digital Front-End Manufacturing, Joel Hartmann, and former Executive Vice President, General Manager, Sales & Marketing, Americas Region, Paul Cihak.
(4) Including amounts paid in 2021 to our former Executive Vice President Europe and France Public Affairs, Thierry Tingaud.
d.Remuneration comparison between the Managing Board, the Executive Committee (excluding the sole member of the Managing Board, our President and Chief Executive Officer), the Executive Vice Presidents and employees
Set forth in the following table is the annual change over the last three years of (i) the remuneration of the sole member of the Managing Board, our President and Chief Executive Officer, (ii) the remuneration of the Executive Committee (excluding the sole member of the Managing Board, our President and Chief Executive Officer, (iii) the remuneration of the Executive Vice Presidents, (iv) the performance of the Company and (v) the average remuneration of all our indirect employees other than the members of our Senior Management, including the sole member of the Managing Board, our President and Chief Executive Officer. The average is calculated by taking the sum of remuneration costs and dividing by the average number of full-time equivalent indirect employees over the period. The table below also shows the pay ratio between our Managing Board, the Executive Committee (excluding the sole member of the Managing Board, our President and Chief Executive Officer), the Executive Vice Presidents and our indirect employees.
111
2023 | 2022 | 2021 | ||||||||||||||||||||||||
| Managing Board remuneration | ||||||||||||||||||||||||||
| Total remuneration of the sole member of the Managing Board, our President and Chief Executive Officer (A) (amounts in millions) | $7,302 | $7,218 | $7,559 | |||||||||||||||||||||||
Evolution of the remuneration of the sole member of the Managing Board, our President and Chief Executive Officer remuneration | 1% | (5)% | 32% | |||||||||||||||||||||||
Executive Committee (excluding the sole member of the Managing Board, our President and Chief Executive Officer) remuneration | ||||||||||||||||||||||||||
Average remuneration of the Executive Committee (excluding the sole member of the Managing Board, our President and Chief Executive Officer) (B) (amounts in millions) | $4,948 | $4,250 | $4,381 | |||||||||||||||||||||||
Evolution of average remuneration of the Executive Committee (excluding the sole member of the Managing Board, our President and Chief Executive Officer) | 16% | (3)% | 23% | |||||||||||||||||||||||
| Ratio A versus B | 1.48 | 1.70 | 1.73 | |||||||||||||||||||||||
Executive Vice Presidents remuneration | ||||||||||||||||||||||||||
Average remuneration of the Executive Vice Presidents (C) (amounts in millions) | $2,373 | $2,256 | $2,779 | |||||||||||||||||||||||
Evolution of the average remuneration of the Executive Vice Presidents | 5% | (19)% | 34% | |||||||||||||||||||||||
Ratio A versus C | 3.08 | 3.2 | 2.72 | |||||||||||||||||||||||
Employee remuneration(1) | ||||||||||||||||||||||||||
Average remuneration of all global indirect employees (FTE basis) (D)(2) | $114,100 | $109,600 | $111,200 | |||||||||||||||||||||||
Evolution of the average remuneration of all global indirect employees (FTE basis)(2) | 4% | (1)% | 13% | |||||||||||||||||||||||
Ratio A versus D | 64.0 | 65.9 | 68.0 | |||||||||||||||||||||||
Ratio B versus D | 43.4 | 38.8 | 39.4 | |||||||||||||||||||||||
Ratio C versus D | 20.8 | 20.6 | 25.0 | |||||||||||||||||||||||
| Company's performance | ||||||||||||||||||||||||||
| Net revenues (amounts in millions) | $17,286 | $16,128 | $12,761 | |||||||||||||||||||||||
| Evolution of the revenues | 7% | 26% | 25% | |||||||||||||||||||||||
| Operating income (amounts in millions) | $4,611 | $4,439 | $2,419 | |||||||||||||||||||||||
| Evolution of the Operating income | 4% | 84% | 83% | |||||||||||||||||||||||
________________________
(1) Employee remuneration is defined as all remuneration paid to our indirect employees including base salary, variable compensation in both cash and shares, social premiums, pension, expense allowances and benefits in kind. The average is calculated by taking the sum of remuneration costs and dividing by the average number of full-time equivalent indirect employees over the period.
(2) Global indirect employees are all employees other than those directly manufacturing our products, excluding Senior Management. “FTE” refers to full time equivalent.
Share Ownership and Stock Awards
i.Share Ownership
None of the members of our Supervisory Board, Managing Board or Senior Management holds shares or options to acquire shares representing more than 1% of our issued share capital.
ii.Overview of Stock Awards and Options
Our stock-based compensation plans are designed to incentivize, attract and retain our executives and key employees by aligning compensation with our performance and the evolution of our share price. Since 2005, we have adopted long-term incentive plans based on stock awards for our management as well as key employees. Furthermore, until 2012, the Compensation Committee (on behalf of the Supervisory Board and with its approval) granted stock-based awards (the options to acquire common shares in the share capital of the Company) to the members and professionals of the Supervisory Board. For a description of our stock option plans and unvested share award plans, please see Note 18 to our Consolidated Financial Statements, which is incorporated herein by reference.
112
Pursuant to the shareholders’ resolutions adopted by our General Meetings of Shareholders, our Supervisory Board, upon the proposal of the Managing Board and the recommendation of the Compensation Committee, took the following actions:
•approved conditions relating to our 2021 unvested stock award allocation under the 2021 Unvested Stock Award Plan, including restriction criteria linked to our performance (for selected employees);
•approved conditions relating to our 2022 unvested stock award allocation under the 2021 Unvested Stock Award Plan, including restriction criteria linked to our performance (for selected employees); and
•approved conditions relating to our 2023 unvested stock award allocation under the 2021 Unvested Stock Award Plan, including restriction criteria linked to our performance (for selected employees).
The sale or purchase of shares of our stock by the members or professionals of our Supervisory Board, the sole member of the Managing Board, our President and Chief Executive Officer, and all our employees are subject to an internal policy which involves, inter alia, certain blackout periods.
Employees
The tables below set forth the breakdown of employees by geographic area and main category of activity for the past three years.
| At December 31, | ||||||||||||||||||||
| 2023 | 2022 | 2021 | ||||||||||||||||||
| France | 11,958 | 11,953 | 11,312 | |||||||||||||||||
| Italy | 12,561 | 12,037 | 11,334 | |||||||||||||||||
| Rest of Europe | 1,198 | 1,128 | 1,044 | |||||||||||||||||
| Americas | 828 | 789 | 759 | |||||||||||||||||
| Mediterranean (Malta, Morocco, Tunisia, Egypt) | 5,923 | 5,634 | 4,854 | |||||||||||||||||
| Asia | 18,855 | 19,829 | 18,951 | |||||||||||||||||
| Total | 51,323 | 51,370 | 48,254 | |||||||||||||||||
| At December 31, | ||||||||||||||||||||
| 2023 | 2022 | 2021 | ||||||||||||||||||
| Research and Development | 9,426 | 9,036 | 8,355 | |||||||||||||||||
| Marketing and Sales | 2,671 | 2,573 | 2,379 | |||||||||||||||||
| Manufacturing | 32,822 | 33,690 | 31,780 | |||||||||||||||||
| Administration and General Services | 3,038 | 2,787 | 2,582 | |||||||||||||||||
| Divisional Functions | 3,366 | 3,284 | 3,158 | |||||||||||||||||
| Total | 51,323 | 51,370 | 48,254 | |||||||||||||||||
Our future success will partly depend on our ability to continue to attract, retain and motivate highly qualified technical, marketing, engineering and management personnel, as well as on our ability to timely adapt the size and/or profile of our personnel to changing industry needs. Unions are represented at almost all of our manufacturing facilities and at several of our R&D sites. We use temporarily employees if required during production spikes and, in Europe, during summer vacation. We have not experienced any significant strikes or work stoppages in recent years.
Disclosure of a registrants action to recover erroneously awarded compensation
The Company did not have any restatement of financial statements that required a recovery of erroneously awarded compensation for the fiscal year ended December 31, 2023, nor up to the date of this Form 20-F.
113
Item 7. Major Shareholders and Related Party Transactions
Major Shareholders
The following table sets forth certain information with respect to the ownership of our issued common shares as of December 31, 2023 based on information available to us:
| Common Shares Owned | ||||||||||||||
| Shareholders | Number | % | ||||||||||||
| STMicroelectronics Holding N.V. (“ST Holding”) | 250,704,754 | 27.5 | ||||||||||||
Public(1) | 652,066,327 | 71.6 | ||||||||||||
| Treasury shares | 8,510,839 | 0.9 | ||||||||||||
| Total | 911,281,920 | 100.0 | ||||||||||||
_______________
(1) According to the report available on Schedule 13G filed with the SEC on February 12, 2024, we understand that as of December 31, 2023 BlackRock, Inc. is the beneficial owner of 76,018,157 of our common shares (representing approximately 8.3% of our issued common shares).
We are not aware of any significant change over the past three years in the percentage ownership of our shares by ST Holding, our major shareholder. ST Holding does not have any different voting rights from those of our other shareholders.
Shareholders Agreement
According to the report on Schedule 13G (“2024 ST Holding 13G”) jointly filed with the SEC on February 14, 2024, by ST Holding, Bpifrance Participations S.A., a successor to its former wholly-owned subsidiary FT1CI, (“Bpifrance”), the Italian Ministry of the Economy and Finance (the “MEF” and together with Bpifrance hereinafter the “STH Shareholders”), Caisse des d'epots et consignations (“CDC”), EPIC BpiFrance (“EPIC”) and Bpifrance S.A., the Italian Government and the French Government, each indirectly through the MEF and Bpifrance, respectively, held 13.9% of our share capital as of December 31, 2023. The ownership percentages of each the MEF and Bpifrance are based on 902,771,081 shares outstanding as of December 31, 2023. Bpifrance is 99.9% owned by Bpifrance S.A., in which CDC and EPIC each hold a 49.2% participation. Below is a brief summary of certain details from the 2024 ST Holding 13G.
Corporate Governance
Managing Board and Supervisory Board members can only be appointed by the general meeting of shareholders upon a proposal by the Supervisory Board. The Supervisory Board passes resolutions, including on such a proposal, by at least three quarters of the votes of the members in office. The STH Shareholders Agreement, to which we are not a party, furthermore provides that: (i) each of the STH Shareholders, Bpifrance, on the one hand, and the MEF, on the other hand, may propose the same number of members for election to the Supervisory Board by our shareholders, and ST Holding shall vote in favor of such members; and (ii) any decision relating to the voting rights of ST Holding shall require the unanimous approval of the STH Shareholders. ST Holding may therefore be in a position to effectively control actions that require shareholder approval, including, as discussed above, the proposal of six out of nine members for election to our Supervisory Board (three members by each STH Shareholder) and the appointment of our Managing Board, as well as corporate actions, and the issuance of new shares or other securities. As a result of the STH Shareholders Agreement, the Chairman of our Supervisory Board is proposed by an STH Shareholder for a three-year term, and the Vice-Chairman of our Supervisory Board is proposed by the other STH Shareholder for the same period, and vice-versa for the following three-year term. The STH Shareholder proposing the appointment of the Chairman may furthermore propose the appointment of the Assistant Secretary of our Supervisory Board, and the STH Shareholder proposing the appointment of Vice-Chairman proposes the appointment of the Secretary of our Supervisory Board. Finally, each STH Shareholder also proposes the appointment of a financial controller to the Supervisory Board.
114
Ownership of ST Shares
The STH Shareholders Agreement provides that each STH Shareholder retains the right to cause ST Holding to dispose of its stake in us at its sole discretion pursuant to the issuance of financial instruments, an equity swap, a structured finance deal or a straight sale; however, except in the case of a public offer, no sales by any party to the STH Shareholders Agreement may be made of any of our shares or any shares of Bpifrance or ST Holding to any of our top ten competitors or any company controlling such a competitor. The STH Shareholders Agreement also requires all of the parties to the STH Shareholders Agreement to hold their stakes in us at all time through the current holding structure of ST Holding, subject to certain limited exceptions, and precludes all such parties and their affiliates from acquiring any of our common shares other than through ST Holding.
Change of Control Provision
The STH Shareholders Agreement provides for tag-along rights, pre-emptive rights, and provisions with respect to a change of control of any of the STH Shareholders or any controlling shareholder of Bpifrance, on the one hand, and the Italian Ministry of the Economy and Finance, on the other hand. The STH Shareholders may transfer shares of ST Holding and/or Bpifrance, as applicable, to any of their respective affiliates, which could include entities ultimately controlled by the Italian Government or the French Government.
Preference Shares
We have an option agreement with an independent foundation, Stichting Continuïteit ST (the “Stichting”), whereby the Stichting can acquire a maximum of 540,000,000 preference shares in the event of actions which the board of the Stichting determines would be contrary to our interests, our shareholders and our other stakeholders and which in the event of a creeping acquisition or an unsolicited offer for our common shares are not supported by our Managing Board and Supervisory Board. If the Stichting exercises its call option and acquires preference shares, it must pay at least 25% of the par value of such preference shares. The preference shares may remain outstanding for no longer than two years.
No preference shares have been issued to date. The effect of the preference shares may be to deter potential acquirers from effecting an unsolicited acquisition resulting in a change of control as well as to create a level-playing field in the event actions which are considered hostile by our Managing Board and Supervisory Board, as described above, occur and which the board of the Stichting determines to be contrary to our interests and our shareholders and other stakeholders. In addition, any issuance of additional capital within the limits of our authorized share capital, as approved by our shareholders, is subject to approval by our Supervisory Board, other than pursuant to an exercise of the call option granted to the Stichting.
Related Party Transactions
See Note 27 to our Consolidated Financial Statements, incorporated herein by reference, for transactions with significant related parties, which also include transactions between us and our equity method investments.
Item 8. Financial Information
Consolidated Statements and Other Financial Information
Please see “Item 18. Financial Statements” for a list of the financial statements filed with this Form 20-F.
Legal Proceedings
For a description of our material pending legal proceedings, please see Note 25 “Commitments, Contingencies, Claims and Legal Proceedings” to our Consolidated Financial Statements, which is incorporated herein by reference.
Dividend Policy
Our dividend policy reads as follows: “STMicroelectronics seeks to use its available cash in order to develop and enhance its position in a competitive semiconductor market while at the same time managing its
115
cash resources to reward its shareholders for their investment and trust in STMicroelectronics. Based on its results, projected capital requirements as well as business conditions and prospects, the Managing Board proposes on an annual basis to the Supervisory Board, whenever deemed possible and desirable in line with STMicroelectronics’ objectives and financial situation, the distribution of a quarterly cash dividend, if any. The Supervisory Board, upon the proposal of the Managing Board, decides or proposes on an annual basis, in accordance with this policy, which portion of the profits or distributable reserves shall not be retained in reserves to fund future growth or for other purposes and makes a proposal concerning the amount, if any, of the quarterly cash dividend”.
On May 24, 2023, our shareholders approved a cash dividend of US$0.24 per outstanding share of our common stock, which was distributed in quarterly installments of US$0.06 in each of the second, third and fourth quarters of 2023 and will also be distributed in the first quarter of 2024. Future dividends, if any, and their timing and amounts may be affected by our accumulated profits, our capacity to generate cash flow, our financial situation, the general economic situation and prospects and any other factors that the Supervisory Board, upon the recommendation of our Managing Board, shall deem important. For a history of dividends paid by us to our shareholders in the past three years, see Note 18 to our Consolidated Financial Statements “Shareholders’ Equity – Dividends”.
Item 9. Listing
Market Information
Our common shares are traded on the NYSE under the symbol “STM” and CUSIP #861012102, are listed on the compartment A (large capitalizations) of Euronext Paris under the ISIN Code NL0000226223 and are traded on the Borsa Italiana. On August 4, 2020, ST issued a $1.5 billion dual-tranche offering of new 2020 Senior Unsecured Convertible Bonds due 2025 and 2027 that trade on the Frankfurt Stock Exchange.
Our common shares are included in the CAC 40, a free float market capitalization weighted index that reflects the performance of the 40 most capitalized and traded shares listed on Euronext Paris, and is the most widely used indicator of the Paris stock market. Our common shares are included in the FTSE MIB Index, which is the primary benchmark Index for the Italian equity markets and measures the performance of 40 highly liquid, leading companies across ICB sectors in Italy seeking to replicate the broad sector weights of the Italian stock market.
Of the 902,771,081 common shares outstanding as of December 31, 2023, 65,973,974, or 7.3%, were registered in the common share registry maintained on our behalf in New York and 836,797,107 or 92.7%, of our common shares outstanding were listed on Euroclear France and traded on Euronext Paris and on the Borsa Italiana in Milan.
Item 10. Additional Information
A. Share Capital
Not applicable.
B. Memorandum and Articles of Association
We were incorporated under the laws of The Netherlands by deed of May 21, 1987 and are registered with the trade register (handelsregister) of the Dutch Chamber of Commerce (Kamer van Koophandel) under no. 33194537. Set forth below is a summary of certain provisions of our Articles of Association and relevant Dutch law. The summary below does not purport to be complete and is qualified in its entirety by reference to our Articles of Association, most recently amended on June 20, 2017, and relevant Dutch law.
Object and Purposes (Article 2)
The objects of our company is to participate in or take, in any manner, any interests in other business enterprises; to manage such enterprises; to carry on business in semiconductors and electronic devices; to take and grant licenses and other industrial property interests; to assume commitments in the name of any enterprises with which we may be associated within a group of companies; to take financial interests in such enterprises and to take any other action, such as but not limited to the granting of securities or the undertaking of obligations on
116
behalf of third parties, which in the broadest sense of the term, may be related or contribute to the aforementioned objects.
Supervisory Board Members
Our Articles of Association do not include any provisions related to a Supervisory Board member’s:
•power to vote on proposals, arrangements or contracts in which such member is materially interested;
•power, in the absence of an independent quorum, to vote on compensation to themselves or any members of the Supervisory Board;
•borrowing powers exercisable by the directors and how such borrowing powers can be varied;
•mandatory retirement age; or
•number of owned shares in our company required to qualify as a Supervisory Board member.
Our Supervisory Board charter and Dutch law, however, explicitly prohibit members of our Supervisory Board from participating in discussions and voting on matters where they have a conflict of interest. If our entire Supervisory Board has a conflict of interest, our shareholders’ meeting is the competent corporate body to adopt the relevant resolution. Our Articles of Association provide that our shareholders’ meeting must adopt the compensation of our Supervisory Board members. Neither our Articles of Association nor our Supervisory Board charter has a requirement or policy that Supervisory Board members hold a minimum number of our common shares.
We have balanced participation by men and women on our Supervisory Board and currently, our Supervisory Board comprises nine members of which 4 are female and 5 are male.
Distribution of Profits (Articles 37, 38, 39 and 40)
Subject to certain exceptions, dividends may only be paid out of the profits as shown in our adopted annual accounts. Our profits must first be used to set up and maintain reserves required by Dutch law and our Articles of Association. Subsequently, if any of our preference shares are issued and outstanding, preference shareholders shall be paid a dividend, which will be a percentage of the paid up part of the par value of their preference shares. Our Supervisory Board may then, upon proposal of our Managing Board, also establish reserves out of our annual profits. The portion of our annual profits that remains after the establishment or maintenance of reserves and the payment of a dividend to our preference shareholders is at the disposal of our shareholders’ meeting. No distribution may be made to our shareholders when the equity after such distribution is or becomes inferior to the fully-paid share capital, increased by the legal reserves. Our preference shares are cumulative by nature, which means that if in a financial year the dividend or the preference shares cannot be (fully) paid, the deficit must first be paid in the following financial year(s).
Our Supervisory Board independently as well as our shareholders’ meeting, upon the proposal of our Supervisory Board, may each declare distributions out of our share premium reserve and other reserves available for shareholder distributions under Dutch law. Pursuant to a resolution of our Supervisory Board, distributions adopted by the shareholders’ meeting may be fully or partially made in the form of our new shares to be issued. Our Supervisory Board may, subject to certain statutory provisions, make one or more interim distributions in respect of any year before the accounts for such year have been adopted at a shareholders’ meeting. Rights to cash dividends and distributions that have not been collected within five years after the date on which they became due and payable shall revert to us.
For the history of dividends paid by us to our shareholders in the past five years, see Note 18 to our Consolidated Financial Statements.
Notice Convening the Shareholders’ Meeting (Articles 25, 26, 27, 28 and 29)
Our ordinary shareholders’ meetings are held at least annually, within six months after the close of each financial year, in The Netherlands. Extraordinary shareholders’ meetings may be held as often as our
117
Supervisory Board deems necessary, and must be held upon the written request of registered shareholders or other persons entitled to attend shareholders’ meetings of at least 10% of the total issued share capital to our Managing Board or our Supervisory Board specifying in detail the business to be dealt with. Such written requests may not be submitted electronically.
The notice convening the shareholders’ meeting shall be given in such manner as shall be authorized or required by law with due observance of the statutory notice period, which is currently 42 days prior to the meeting.
One or more shareholders or other persons entitled to attend shareholders’ meetings representing at least one-tenth of our issued share capital may, provided that the request was made at least five days prior to the date of convocation of the meeting, request proposals to be included on the agenda. Furthermore, a request that a proposal be included on the agenda can be made in writing to our Managing Board within sixty days of a meeting by persons who are entitled to attend our shareholders’ meetings who, solely or jointly, represent at least 1% of our issued share capital or a market value of at least €50 million. The aforementioned requests may not be submitted electronically and must comply with conditions stipulated by our Managing Board, subject to the approval of our Supervisory Board, which shall be posted on our website. Pursuant to Dutch law a shareholder requesting discussion of an agenda item must disclose to us its entire beneficial interest (long and short position) and we are required to disclose this information on our website.
We are exempt from the proxy solicitation rules under the United States Securities Exchange Act of 1934. Euroclear France will provide notice of shareholders’ meetings to, and compile voting instructions from, holders of shares held directly or indirectly through Euroclear France. The Depository Trust Company (“DTC”) will provide notice of shareholders’ meetings to holders of shares held directly or indirectly through DTC and the New York Transfer Agent and Registrar will compile voting instructions. In order for holders of shares held directly or indirectly through Euroclear France to attend shareholders’ meetings in person, such holders must withdraw their shares from Euroclear France and have such shares registered directly in their name or in the name of their nominee. In order for holders of shares held directly or indirectly through DTC to attend shareholders’ meetings of shareholders in person, such holders need not withdraw such shares from DTC but must follow rules and procedures established by the New York Transfer Agent and Registrar.
Attendance at Shareholders’ Meetings and Voting Rights (Articles 30, 31, 32, 33 and 34)
Each share is entitled to one vote.
All shareholders and other persons entitled to attend shareholders’ meetings may attend in person or be represented by a person holding a written proxy. Shareholders and other persons entitled to vote, may do so pursuant to our Articles of Association. Subject to the approval of our Supervisory Board, our Managing Board may resolve to facilitate the use of electronic means of communication in relation to the participation and voting in shareholders’ meetings. Dutch law prescribes a fixed registration date of 28 days prior to the shareholders’ meeting, which means that shareholders and other persons entitled to attend shareholders’ meetings are those persons who have such rights at the 28th day prior to the shareholders’ meeting and, as such, are registered in a register designated by our Managing Board, regardless of who is a shareholder or otherwise a person entitled to attend shareholders’ meetings at the time of the meeting if a registration date would not be applicable. In the notice convening the shareholders’ meeting, the time of registration must be mentioned as well as the manner in which shareholders and other persons entitled to attend shareholders’ meetings can register themselves and the manner in which they can exercise their rights.
All matters regarding admittance to the shareholders’ meeting, the exercise of voting rights and the result of voting, as well as any other matters regarding the business of the shareholders’ meeting, shall be decided upon by the chairman of that meeting, in accordance with the requirements of Section 2:13 of the Dutch Civil Code.
Our Articles of Association allow for separate meetings for holders of common shares and for holders of preference shares. At a meeting of holders of preference shares at which the entire issued capital of shares of such class is represented, valid resolutions may be adopted even if the requirements in respect of the place of the meeting and the giving of notice have not been observed, provided that such resolutions are adopted by unanimous vote. Also, valid resolutions of preference shareholder meetings may be adopted outside a meeting if
118
all persons entitled to vote on our preference shares indicate in writing that they vote in favor of the proposed resolution, provided that no depositary receipts for preference shares have been issued with our cooperation.
Authority of our Shareholders’ Meeting (Articles 12, 16, 19, 25, 28, 32 and 41)
Our AGM may decide upon (i) the discharge of the members of our Managing Board for their management during the past financial year and the discharge of the members of our Supervisory Board for their supervision during the past financial year; (ii) the adoption of our statutory annual accounts and the distribution of dividends; (iii) the appointment of the members of our Supervisory Board and our Managing Board; and (iv) any other resolutions listed on the agenda.
Furthermore, our shareholders’ meeting has to approve resolutions of our Managing Board regarding a significant change in the identity or nature of us or our enterprise, including in any event (i) transferring our enterprise or practically our entire enterprise to a third-party, (ii) entering into or canceling any long-term cooperation between us or a subsidiary of us and any other legal person or company or as a fully liable general partner of a limited partnership or a general partnership, provided that such cooperation or the cancellation thereof is of essential importance to us, and (iii) us or a subsidiary of us acquiring or disposing of a participating interest in the capital of a company with a value of at least one-third of our total assets according to our consolidated balance sheets and notes thereto in our most recently adopted annual accounts.
Our Articles of Association may only be amended (and our liquidation can only be decided on) if amendments are proposed by our Supervisory Board and approved by a simple majority of the votes cast at a shareholders’ meeting at which at least 15% of the issued and outstanding share capital is present or represented. The complete proposal for the amendment (or liquidation) must be made available for inspection by the shareholders and the other persons entitled to attend shareholders’ meetings at our offices as from the day of the notice convening such meeting until the end of the meeting. Any amendment of our Articles of Association that negatively affects the rights of the holders of a certain class of shares requires the prior approval of the meeting of holders of such class of shares.
Quorum and Majority (Articles 4, 13 and 32)
Unless otherwise required by our Articles of Association or Dutch law, resolutions of shareholders’ meetings require the approval of a majority of the votes cast at a meeting at which at least 15% of the issued and outstanding share capital is present or represented, subject to the provisions explained below. We may not vote our common shares held in treasury. Blank and invalid votes shall not be counted.
A quorum of shareholders, present or represented, holding at least half of our issued share capital, is required to dismiss a member of our Managing Board, unless the dismissal is proposed by our Supervisory Board. In the event of the lack of a quorum, a second shareholders’ meeting must be held within four weeks, with no applicable quorum requirement. Any decision or authorization by the shareholders’ meeting which has or could have the effect of excluding or limiting preferential subscription rights must be taken by a majority of at least two-thirds of the votes cast, if at the shareholders’ meeting less than 50% of the issued and outstanding share capital is present or represented. Otherwise such a resolution can be taken by a simple majority at a meeting at which at least 15% of the issued and outstanding share capital is represented.
Disclosure of holdings and capital interest under Dutch Law
Holders of our shares (including certain comparable instruments, such as instruments with a value (partly) dependent on shares or distributions on shares, or contracts creating an economic position similar to shares) or voting rights (including potential interests, such as via options or convertible bonds) may have disclosure obligations under Dutch law. Any person or entity whose direct or indirect interest in our share capital or voting rights (including potential interest) reaches, exceeds or falls below a certain threshold must make a disclosure to the AFM immediately. The threshold percentages are 3%, 5%, 10%, 15%, 20%, 25%, 30%, 40%, 50%, 60%, 75% and 95%. If a person’s direct or indirect interest in the share capital or voting rights passively reaches, exceeds or falls below the abovementioned thresholds (e.g. as a result of a change in the capital of the company), the person in question must give notice to the AFM no later than the fourth trading day after the AFM has published the change in the share capital and/or voting rights in the public register. In addition, a
119
notification requirement applies in respect of shares with special statutory rights (e.g. priority shares), regardless of the abovementioned percentages.
Furthermore, each person who is or ought to be aware that the substantial holding he holds in the Company, reaches, exceeds or falls below any of the abovementioned thresholds vis-à-vis his most recent notification to the AFM, which change relates to the composition of the notification as a result of certain acts (e.g. (i) the exchange of certain financial instruments for shares or depositary receipts for shares, (ii) the exchange of shares for depositary receipts for shares, or (iii) as a result of the exercise of rights pursuant to a contract for the acquisition of voting rights) must give notice to the AFM no later than the fourth trading day after he became or ought to be aware of this change.
For the purpose of calculating the percentage of capital interest or voting rights, among others, the following interests must be taken into account: (i) those directly held by him; (ii) those held by his controlled undertakings for purposes of the Dutch Financial Supervision Act; (iii) shares held by a third-party for such person’s account and the votes such third-party may exercise; (iv) the votes held by a third-party if such person has concluded an oral or written voting agreement with such party which provides for a lasting common policy on voting; (v) the votes held by a third-party if such person has concluded an oral or written agreement with such party which provides for a temporary and paid transfer of the votes; and (vi) the votes which a person may exercise as a proxy but in his own discretion. A person who has a 3% or larger interest in the share capital or voting rights and who ceases to be a controlled undertaking must without delay notify the AFM. As of that moment, all notification obligations under the Dutch Financial Supervision Act will become applicable to the former controlled undertaking itself. The management company of a common fund (beleggingsfonds) shall be deemed to have the disposal of the shares held by the depositary and the related voting rights. The depositary of a common fund shall be deemed not to have the disposal of shares or voting rights. Furthermore, special rules apply to the attribution of the ordinary shares which are part of the property of a partnership or other community of property. A holder of a pledge or right of usufruct in respect of our shares can also be subject to a notification obligation if such person has, or can acquire, the right to vote on our shares. If a pledgor or usufructuary acquires such voting rights, this may also trigger a notification obligation for the holder of our shares. A person is also deemed to hold shares if he has a financial instrument (i) whose rise in value depends in part on the rise in value of the underlying shares or on dividend or other payments on those shares (in other words, a long position must be held in those shares), and (ii) which does not entitle him to acquire shares in a listed company (i.e., it is a cash-settled financial instrument). In addition, a person who may, by virtue of an option, be obliged to buy shares in a listed company is also equated with a shareholder. Moreover, a person who has entered into a contract (other than a cash-settled financial instrument) that gives him an economic position comparable to that of a shareholder in a listed company is also deemed to hold shares for the purposes of the disclosure obligation.
The holder of a financial instrument representing a short position in our shares is required to notify the AFM if such short position, expressed in a capital percentage, reaches or crosses a threshold percentage. The threshold percentages are the same as referred to above in this section. Short position refers to the gross short position (i.e., a long position held by the holder cannot be offset against the short position). There is also a requirement to notify the AFM of the net short position (i.e., long positions are offset against short positions) if such short position, expressed in a capital percentage, reaches or crosses a threshold percentage; The threshold percentages are 0.2% and each 0.1% above that. Notifications as of 0.5% and each 0.1% above that will be published by the AFM. The notification shall be made no later than 3:30 pm CET on the following trading day.
Under Dutch law, the sole member of our Managing Board and each of the members of our Supervisory Board must without delay notify the AFM of any changes in his interest or potential interest in our share capital or voting rights. Under the European Market Abuse Regulation, the sole member of our Managing Board, the members of the Executive Committee and each of the members of our Supervisory Board, as well as any other person who would have the power to take managerial decisions affecting the future developments and business prospects of the Company having regular access to inside information relating, directly or indirectly, to the Company, must notify the AFM of any transactions conducted for his or her own account relating to the shares or in financial instruments the value of which is also based on the value of the shares. In addition, certain persons who are closely associated with members of the Managing Board, the Executive Committee and Supervisory Board or any of the other persons as described above, are required to notify the AFM of any transactions conducted for their own account relating to the shares or in financial instruments the value of which is also based on the value of the shares.
120
The AFM publishes all notifications on its public website (www.afm.nl). Non-compliance with the notification obligations under European or Dutch law can lead to imprisonment or criminal fines, or administrative fines or other administrative sanctions. In addition, non-compliance with these notification obligations may lead to civil sanctions, including, without limitation, suspension of the voting rights attaching to our shares held by the offender for a maximum of three years, (suspension and) nullification of a resolution adopted by our shareholders’ meeting (if it is likely that such resolution would not have been adopted if the offender had not voted) and a prohibition for the offender to acquire our shares or votes for a period of no more than five years. Shareholders are advised to consult with their own legal advisers to determine whether notification obligations apply to them.
Share Capital (Articles 4, 5 and 6)
Our shares may not be issued at less than their par value. Our common shares must be fully paid up at the time of their issuance. Our preference shares must be paid up for at least 25% of their par value at the time of their issuance (and the remaining 75% if and when requested by our Managing Board). Our authorized share capital is not restricted by redemption provisions, sinking fund provisions or liability to further capital calls by us. Our Articles of Association allows for the acquisition of own shares and the cancellation of shares.
Type II shares are common shares in the form of an entry in our shareholders register with the issue of a share certificate consisting of a main part without a dividend coupon. In addition to type II shares, type I shares are available. Type I shares are common shares in the form of an entry in our shareholders register without the issue of a share certificate. Type II shares are only available should our Supervisory Board decide to offer them. Our preference shares are in the form of an entry in our shareholders register without issue of a share certificate.
Non-issued authorized share capital, which is different from issued share capital, allows us to proceed with capital increases excluding the preemptive rights, upon our Supervisory Board’s decision. Other securities in circulation which give access to our share capital include (i) the options giving the right to subscribe to our shares granted to our employees, including the sole member of our Managing Board and our senior managers; (ii) the options giving the right to subscribe to our shares granted in the past to the members of our Supervisory Board, its secretaries and controllers, as described in “Item 6. Directors, Senior Management and Employees”; (iii) our bonds; and (iv) the option giving the right to subscribe to our preference shares to Stichting Continuïteit ST. See “Item 7. Major Shareholders and Related Party Transactions”. We do not have securities not representing our share capital.
Our shareholders’ meeting, upon proposal and on the terms and conditions set by our Supervisory Board, has the power to issue shares and rights to subscribe for shares. The shareholders’ meeting may authorize our Supervisory Board, for a period of no more than five years, to issue shares and rights to subscribe for shares and to determine the terms and conditions of such issuances.
Each holder of common shares has a pro rata preemptive right to subscribe to an offering of common shares issued for cash in proportion to the number of common shares which he owns. There is no preemptive right with respect to an offering of shares for non-cash consideration, with respect to an offering of shares to our employees or to the employees of one of our subsidiaries, or with respect to preference shares.
Our shareholders’ meeting, upon proposal by our Supervisory Board, has the power to limit or exclude preemptive rights in connection with new issuances of shares. Such a resolution of the shareholders’ meeting must be taken with a majority of at least two-thirds of the votes cast if at such shareholders’ meeting less than 50% of the issued and outstanding share capital is present or represented. Otherwise such a resolution can be taken by a simple majority of the votes cast at a shareholders’ meeting at which at least 15% of our issued and outstanding share capital is present or represented. Our shareholders’ meeting may authorize our Supervisory Board, for a period of no more than five years, to limit or exclude preemptive rights.
Acquisition of Shares in Our Own Share Capital (Article 5)
We may acquire our own shares, subject to certain provisions of Dutch law and of our Articles of Association. Share acquisitions may be effected by our Managing Board, subject to the approval of our Supervisory Board, only if the shareholders’ meeting has authorized our Managing Board to effect such repurchases, which authorization may apply for a maximum period of 18 months. We may not vote shares we
121
hold in treasury. Our purchases of our own shares are subject to acquisition price conditions as authorized by our shareholders’ meeting. Our Articles of Association provide that we shall be able to acquire shares in our own share capital in order to transfer these shares under employee stock option or stock purchase plans, without an authorization of our shareholders’ meeting.
Upon the proposal of our Supervisory Board, our shareholders’ meeting may, in accordance with the legal provisions, reduce our issued capital by canceling the shares that we hold in treasury, by reducing the par value of the shares or by canceling our preference shares.
Liquidation Rights (Articles 42 and 43)
In the event of our dissolution and liquidation, after payment of all debts and liquidation expenses, the holders of preference shares if issued, would receive the paid up portion of the par value of their preference shares. Any assets then remaining shall be distributed among the registered holders of common shares in proportion to the par value of their shareholdings.
Limitations on Right to Hold or Vote Shares
There are currently no limitations imposed by Dutch law or by our Articles of Association on the right of non-resident holders to hold or vote the shares.
C. Material Contracts
None.
D. Exchange Controls
None.
E. Taxation
Dutch Taxation
This section only outlines certain material Dutch tax consequences of the acquisition, holding and disposal of our common shares. This section does not purport to describe all possible tax considerations or consequences that may be relevant to a holder or prospective holder of common shares and does not purport to deal with the tax consequences applicable to all categories of investors, some of which (such as trusts or similar arrangements) may be subject to special rules. In view of its general nature, this section should be treated with corresponding caution.
Tax matters are complex, and the tax consequences of the acquisition, holding and disposal to a particular holder of common shares will depend in part on such holder’s circumstances. Accordingly, you are urged to consult your own tax advisor for a full understanding of the tax consequences of the acquisition, holding and disposal to you, including the applicability and effect of Dutch tax laws.
Where in this section English terms and expressions are used to refer to Dutch concepts, the meaning to be attributed to such terms and expressions shall be the meaning to be attributed to the equivalent Dutch concepts under Dutch tax law. Where in this section the terms “The Netherlands” and “Dutch” are used, these refer solely to the European part of the Kingdom of The Netherlands.
This section assumes that we are organized, and that our business will be conducted, in the manner outlined in this Form 20-F. A change to such organizational structure or to the manner in which we conduct our business may invalidate the contents of this section, which will not be updated to reflect any such change.
Please note that this section does not describe the Dutch tax consequences for a holder of our common shares:
(i)who may be deemed an owner of our common shares for Dutch tax purposes pursuant to specific
statutory attribution rules in Dutch tax law;
statutory attribution rules in Dutch tax law;
122
(ii)who has a substantial interest (aanmerkelijk belang) or deemed substantial interest (fictief aanmerkelijk belang) in us under the Dutch Income Tax Act 2001 (Wet inkomstenbelasting 2001). Generally, a holder is considered to hold a substantial interest in us if such holder alone or, in the case of an individual, together with such holder’s partner for Dutch income tax purposes, or any relatives by blood or marriage in the direct line (including foster-children), directly or indirectly, holds (i) an interest of 5% or more of the total issued and outstanding capital of us or of 5% or more of the issued and outstanding capital of a certain class of shares; or (ii) rights to acquire, directly or indirectly, such interest; or (iii) certain profit sharing rights that relate to 5% or more of our annual profits or to 5% or more of our liquidation proceeds. A deemed substantial interest may arise if a substantial interest (or part thereof) in has been disposed of, or is deemed to have been disposed of, on a non-recognition basis;
(iii)if the common shares held by such holder qualify or qualified as a participation (deelneming) for purposes of the Dutch Corporate Income Tax Act 1969 (Wet op de vennootschapsbelasting 1969). Generally, a holder's shareholding of, or right to acquire, 5% or more in our nominal paid-up share capital qualifies as a participation. A holder may also have a participation if (a) such holder does not have a shareholding of 5% or more but a related entity (statutorily defined term) has a participation or (b) we are a related entity (statutorily defined term);
(iv)which is or who is entitled to the dividend withholding tax exemption (inhoudingsvrijstelling) with respect to any profits derived from the common shares (as defined in Article 4 of the Dutch Dividend Withholding Tax Act 1965 (Wet op de dividendbelasting). Generally, a holder of common shares may be entitled or required to apply, subject to certain other requirements, the dividend withholding tax exemption if it is an entity and holds an interest of 5% or more in our nominal paid-up share capital;
(v)pension funds, investment institutions (fiscale beleggingsinstellingen) and tax exempt investment institutions (vrijgestelde beleggingsinstellingen) (each as defined in the Dutch Corporate Income Tax Act 1969) and other entities that are, in whole or in part, not subject to or exempt from Dutch corporate income tax, entities that have a function comparable to an investment institution or a tax exempt investment institution, as well as entities that are exempt from corporate income tax in their country of residence, such country of residence being another state of the European Union, Norway, Liechtenstein, Iceland or any other state with which The Netherlands has agreed to exchange information in line with international standards; and
(vi)if such holder is an individual for whom the common shares or any benefit derived from the common shares is a remuneration or deemed to be a remuneration for (employment) activities performed by such holder or certain individuals related to such holder (as defined in the Dutch Income Tax Act 2001).
Dividend withholding tax
Dividends distributed by us are generally subject to Dutch dividend withholding tax at a rate of 15%. Generally, we are responsible for the withholding of such dividend withholding tax at source; the Dutch dividend withholding tax is for the account of the holder of common shares.
The expression “dividends distributed” includes, but is not limited to:
•distributions in cash or in kind, deemed and constructive distributions and repayments of paid-in capital not recognized for Dutch dividend withholding tax purposes;
•liquidation proceeds, proceeds from the redemption of common shares or proceeds from the repurchase of common shares (other than as temporary portfolio investment; tijdelijke belegging) by us or one of our subsidiaries or other affiliated entities, in each case to the extent such proceeds exceed the average paid-in capital of those common shares as recognized for Dutch dividend withholding tax purposes;
123
•an amount equal to the nominal value of the common shares issued or an increase of the nominal value of the common shares, to the extent that no related contribution, recognized for Dutch dividend withholding tax purposes, has been made or will be made; and
•partial repayment of the paid-in capital, recognized for Dutch dividend withholding tax purposes, if and to the extent that we have “net profits” (zuivere winst), unless (i) our general meeting of shareholders has resolved in advance to make such repayment and (ii) the nominal value of the common shares concerned has been reduced by an equal amount by way of an amendment to our articles of association. The term “net profits” includes anticipated profits that have yet to be realized.
Corporate legal entities that are resident or deemed to be resident of The Netherlands for Dutch corporate income tax purposes (“Dutch Resident Entities”) generally are entitled to an exemption from, or a credit for, any Dutch dividend withholding tax against their Dutch corporate income tax liability. The credit in any given year is, however, limited to the amount of Dutch corporate income tax payable in respect of the relevant year with an indefinite carry forward of any excess amount. Individuals who are resident or deemed to be resident of The Netherlands for Dutch personal income tax purposes (“Dutch Resident Individuals”) generally are entitled to a credit for any Dutch dividend withholding tax against their Dutch personal income tax liability and to a refund of any residual Dutch dividend withholding tax. The above generally also applies to holders of common shares that are neither resident nor deemed to be resident of The Netherlands (“Non-Resident Holders”) if the common shares are attributable to a Dutch permanent establishment of such Non-Resident Holder.
A holder of common shares resident of a country other than The Netherlands may, depending on such holder's specific circumstances, be entitled to exemptions from, reduction of, or full or partial refund of, Dutch dividend withholding tax under Dutch domestic tax law, EU law, or treaties for the avoidance of double taxation in effect between The Netherlands and such other country.
Dividend stripping
According to “Dutch domestic anti-dividend stripping” rules, no credit against Dutch tax, exemption from, reduction, or refund of Dutch dividend withholding tax will be granted if the recipient of the dividends we paid is not considered the beneficial owner (uiteindelijk gerechtigde; as described in the Dutch Dividend Withholding Tax Act 1965) of those dividends. This legislation generally targets situations in which a shareholder retains its economic interest in shares but reduces the withholding tax costs on dividends by a transaction with another party. It is not required for these rules to apply that the recipient of the dividends is aware that a dividend stripping transaction took place. The Dutch State Secretary of Finance takes the position that the definition of beneficial ownership introduced by this legislation will also be applied in the context of a double taxation convention. As from 1 January 2024, more stringent rules apply to the setoff, exemption from, and reduction or refund of Dutch dividend withholding tax to address situations where a claim for setoff, exemption, reduction or refund may align with the letter of Dutch tax law or a double taxation convention but goes against the underlying intention or spirit of the dividend stripping rules, as perceived by the legislator. In addition, the burden of proof in cases related to dividend stripping and beneficial owner status has in certain circumstances been shifted from the tax inspector to the person making a claim for a setoff, reduction or refund of or exemption from Dutch dividend withholding tax. Furthermore, for shares traded on a regulated market, including the Ordinary Shares, it has been codified that the record date is used when determining the person who is entitled to the dividend.
Conditional withholding tax on dividends
In addition to the regular Dutch dividend withholding tax as described above, a Dutch conditional withholding tax will be imposed on dividends distributed by us to entities related (gelieerd) to us (within the meaning of the Dutch Withholding Tax Act 2021; Wet bronbelasting 2021), if such related entity:
(i)is considered to be resident (gevestigd) in a jurisdiction that is listed in the yearly updated Dutch Regulation on low-taxing states and non-cooperative jurisdictions for tax purposes (Regeling laagbelastende staten en niet-coöperatieve rechtsgebieden voor belastingdoeleinden) (a “Listed Jurisdiction”); or
124
(ii)has a permanent establishment located in a Listed Jurisdiction to which the common shares are attributable; or
(iii)holds the common shares with the main purpose or one of the main purposes of avoiding taxation for another person or entity and there is an artificial arrangement or transaction or a series of artificial arrangements or transactions; or
(iv)is not considered to be the beneficial owner of the common shares in its jurisdiction of residence because such jurisdiction treats another entity as the beneficial owner of the common shares (a hybrid mismatch); or
(v)is not resident in any jurisdiction (also a hybrid mismatch); or
(vi)is a reverse hybrid (within the meaning of Article 2(12) of the Dutch Corporate Income Tax Act 1969), if and to the extent (x) there is a participant in the reverse hybrid which is related (gelieerd) to the reverse hybrid, (y) the jurisdiction of residence of such participant treats the reverse hybrid as transparent for tax purposes and (z) such participant would have been subject to the Dutch conditional withholding tax in respect of dividends distributed by us without the interposition of the reverse hybrid,
all within the meaning of the Dutch Withholding Tax Act 2021.
The Dutch conditional withholding tax on dividends will be imposed at the highest Dutch corporate income tax rate in effect at the time of the distribution (2024: 25.8%). The Dutch conditional withholding tax on dividends will be reduced, but not below zero, by any regular Dutch dividend withholding tax withheld in respect of the same dividend distribution. As such, based on the currently applicable rates, the overall effective tax rate of withholding the regular Dutch dividend withholding tax (as described above) and the Dutch conditional withholding tax on dividends will not exceed the highest corporate income tax rate in effect at the time of the distribution (2024: 25.8%).
Taxes on income and capital gains
Dutch Resident Entities
Generally, if the holder of common shares is a Dutch Resident Entity, any income derived or deemed to be derived from the common shares or any capital gains realized on the disposal or deemed disposal of the common shares is subject to Dutch corporate income tax at a rate of 19% with respect to taxable profits up to €200,000 and 25.8% with respect to taxable profits in excess of that amount (rates and brackets for 2024).
Dutch Resident Individuals
If the holder of common shares is a Dutch Resident Individual, any income derived or deemed to be derived from the common shares or any capital gains realized on the disposal or deemed disposal of the common shares is subject to Dutch personal income tax at the progressive rates (with a maximum of 49.5% in 2024), if:
(i)the common shares are attributable to an enterprise from which the holder of common shares derives a share of the profit, whether as an entrepreneur (ondernemer) or as a person who has a co-entitlement to the net worth (medegerechtigd tot het vermogen) of such enterprise without being a shareholder (as defined in the Dutch Income Tax Act 2001); or
(ii)the holder of common shares is considered to perform activities with respect to the common shares that go beyond ordinary asset management (normaal, actief vermogensbeheer) or otherwise derives benefits from the common shares that are taxable as benefits from miscellaneous activities (resultaat uit overige werkzaamheden).
Taxation of savings and investments
If the above-mentioned conditions (i) and (ii) do not apply to the Dutch Resident Individual, the common shares will be subject to an annual Dutch income tax under the regime for savings and investments (inkomen uit sparen en beleggen). Taxation only occurs insofar the Dutch Resident Individual's net investment assets for the
125
year exceed a statutory threshold (heffingvrij vermogen). The net investment assets for the year are the fair market value of the investment assets less the fair market value of the liabilities on January 1 of the relevant calendar year (reference date; peildatum). Actual income or capital gains realized in respect of the common shares are as such not subject to Dutch income tax.
The Dutch Resident Individual's assets and liabilities taxed under this regime, including the common shares, are allocated over the following three categories: (a) bank savings (banktegoeden), (b) other investments (overige bezittingen), including the common shares, and (c) liabilities (schulden). The taxable benefit for the year (voordeel uit sparen en beleggen) is equal to the product of (x) the total deemed return divided by the sum of bank savings, other investments and liabilities and (b) the sum of bank savings, other investments and liabilities minus the statutory threshold, and is taxed at a flat rate of 36% (rate for 2024).
The deemed return applicable to other investments, including the common shares, is set at 6.04% for the calendar year 2024. Transactions in the three-month period before and after January 1 of the relevant calendar year implemented to arbitrate between the deemed return percentages applicable to bank savings, other investments and liabilities will for this purpose be ignored if the holder of common shares cannot sufficiently demonstrate that such transactions are implemented for other than tax reasons.
The current Dutch income tax regime for savings and investments was implemented in Dutch tax law following the decision of the Dutch Supreme Court (Hoge Raad) of 24 December 2021 (ECLI:NL:2021:1963) (the “Decision”). In the Decision, the Dutch Supreme Court ruled that the (old) system of taxation for savings and investments based on a deemed return may under specific circumstances contravene with Section 1 of the First Protocol to the European Convention on Human Rights in combination with Section 14 of the European Convention on Human Rights (the “EC-Human Rights”). A new court procedure is pending before the Dutch Supreme Court questioning whether the current tax system for savings and investments is in line with the Decision. On 18 September 2023 (ECLI:NL:PHR:2023:655) the Attorney General Wattel concluded that the new tax system is not in line with the Decision, except for the taxation of bank savings, as the system is, in short, still based on a deemed return rather than actual returns, and as a result, the regime contravenes with the EC-Human Rights. The decision of the Dutch Supreme Court is expected mid-2024. In addition, on 8 September 2023, the former cabinet published a law proposal for a new tax system for savings and investments on the basis of actual returns according to an asset accumulation system, the 'Actual Return Box 3 Act' (Wet werkelijk rendement box 3). The proposed system is expected to come into effect on 1 January 2027 at the earliest. However, it is up to the new cabinet to submit a final law proposal to the Dutch parliament.
Holders of common shares are advised to consult their own tax advisor to ensure that the tax in respect of the common shares is levied in accordance with the applicable Dutch tax rules at the relevant time.
Non-Resident Holders
A holder of common shares that is neither a Dutch Resident Entity nor a Dutch Resident Individual will not be subject to Dutch income tax in respect of income derived or deemed to be derived from the common shares or in respect of capital gains realized on the disposal or deemed disposal of the common shares, provided that:
(i) such holder does not have an interest in an enterprise or deemed enterprise (as defined in the Dutch Income Tax Act 2001 and the Dutch Corporate Income Tax Act 1969, as applicable) which, in whole or in part, is either effectively managed in The Netherlands or carried on through a permanent establishment, a deemed permanent establishment or a permanent representative in The Netherlands and to which enterprise or part of an enterprise the common shares are attributable; and
(ii) in the event the holder is an individual, such holder does not carry out any activities in The Netherlands with respect to the common shares that go beyond ordinary asset management and does not otherwise derive benefits from the common shares that are taxable as benefits from miscellaneous activities in The Netherlands.
If you are neither a Dutch Resident Individual nor a Dutch Resident Entity, you will for Dutch tax purposes not carry on or be deemed to carry on an enterprise, in whole or in part, through a permanent
126
establishment or a permanent representative in The Netherlands by reason only of acquisition or holding of the common shares.
Gift and inheritance taxes
Residents of The Netherlands
Gift or inheritance taxes will arise in The Netherlands with respect to a transfer of common shares by way of a gift by, or on the death of, a holder of common shares who is resident or deemed resident of The Netherlands at the time of the gift or such holder's death.
Non-Residents
No gift or inheritance taxes will arise in The Netherlands with respect to a transfer of common shares by way of a gift by, or on the death of, a holder of common shares who is neither resident nor deemed to be resident of The Netherlands, unless:
(i) in the case of a gift of a common share by an individual who at the date of the gift was neither resident nor deemed to be resident of The Netherlands, such individual dies within 180 days after the date of the gift, while being resident or deemed to be resident of The Netherlands; or
(ii) in the case of a gift of a common shares is made under a condition precedent, the holder of common shares is resident or is deemed to be resident of The Netherlands at the time the condition is fulfilled; or
(iii) the transfer is otherwise construed as a gift or inheritance made by, or on behalf of, a person who, at the time of the gift or death, is or is deemed to be resident of The Netherlands.
For purposes of Dutch gift and inheritance taxes, amongst others, a person that holds the Dutch nationality will be deemed to be resident of The Netherlands if such person has been a resident of The Netherlands at any time during the ten years preceding the date of the gift or such person’s death. Additionally, for purposes of Dutch gift tax, amongst others, a person not holding the Dutch nationality will be deemed to be resident of The Netherlands if such person has been a resident of The Netherlands at any time during the twelve months preceding the date of the gift. Applicable tax treaties may override deemed residency.
Value added tax (VAT)
No Dutch VAT will be payable by a holder of common shares in respect of any payment in consideration for the holding or disposal of the common shares.
Stamp Duties
No Dutch documentation taxes (commonly referred to as stamp duties) will be payable by a holder of common shares in respect of any payment in consideration for the holding or disposal of the common shares.
United States Federal Income Taxation
The following discussion is a general summary of the material U.S. federal income tax consequences to a U.S. holder (as defined below) of the ownership and disposition of our common shares. You are a U.S. holder only if you are a beneficial owner of common shares:
•that is, for U.S. federal income tax purposes, (a) a citizen or individual resident of the United States, (b) a U.S. domestic corporation or a U.S. domestic entity taxable as a corporation, (c) an estate, the income of which is subject to U.S. federal income taxation regardless of its source, or (d) a trust, if a court within the United States can exercise primary supervision over the administration of the trust and one or more U.S. persons are authorized to control all substantial decisions of the trust;
127
•that owns, directly, indirectly or by attribution, less than 10% of our voting power or outstanding share capital;
•that holds the common shares as capital assets;
•whose functional currency for U.S. federal income tax purposes is the U.S. dollar;
•that is a resident of the United States and not also a resident of The Netherlands for purposes of the United States – The Netherlands Income Tax Treaty (the “U.S./NL Income Tax Treaty”);
•that is entitled, under the “limitation on benefits” provisions contained in the U.S./NL Income Tax Treaty, to the benefits of the U.S./NL Income Tax Treaty; and
•that does not have a permanent establishment or fixed base in The Netherlands.
This summary does not discuss all of the tax consequences that may be relevant to you in light of your particular circumstances. Also, it does not address holders that may be subject to special rules including, but not limited to, U.S. expatriates, tax-exempt organizations, persons subject to the alternative minimum taxes, banks, securities broker-dealers, financial institutions, regulated investment companies, insurance companies, traders in securities who elect to apply a mark-to-market method of accounting, persons holding our common shares as part of a straddle, hedging or conversion transaction, or persons who acquired common shares pursuant to the exercise of employee stock options or otherwise as compensation. Because this is a general summary, you are advised to consult your own tax advisor with respect to the U.S. federal, state, local and applicable foreign tax consequences of the ownership and disposition of our common shares. In addition, you are advised to consult your own tax advisor concerning whether you are entitled to benefits under the U.S./NL Income Tax Treaty.
If a partnership (including for this purpose any entity or arrangement treated as a partnership for U.S. federal income tax purposes) holds common shares, the tax treatment of a partner generally will depend upon the status of the partner and the activities of the partnership. If you are a partner in a partnership that holds common shares, you are urged to consult your own tax advisor regarding the specific tax consequences of the ownership and the disposition of common shares.
This summary is based on the Internal Revenue Code of 1986, as amended, the U.S./NL Income Tax Treaty, judicial decisions, administrative pronouncements and existing, temporary and proposed Treasury regulations as of the date of this Form 20-F, all of which are subject to change or changes in interpretation, possibly with retroactive effect.
Dividends
In general, you must include the gross amount of distributions paid (including the amount of any Dutch taxes withheld from those distributions) to you by us with respect to the common shares in your gross income as foreign-source taxable dividend income. The amount of any distribution paid in foreign currency (including the amount of any Dutch withholding tax thereon) will be equal to the U.S. dollar value of the foreign currency on the date of actual or constructive receipt by you regardless of whether the payment is in fact converted into U.S. dollars at that time. Gain or loss, if any, realized on a subsequent sale or other disposition of such foreign currency generally will be U.S.-source ordinary income or loss. Special rules govern and specific elections are available to accrual method taxpayers to determine the U.S. dollar amount includible in income in the case of taxes withheld in a foreign currency. Accrual basis taxpayers are urged to consult their own tax advisers regarding the requirements and elections applicable in this regard.
Subject to applicable limitations, Dutch taxes withheld from a distribution paid to you at a rate not exceeding the rate provided in the U.S./NL Income Tax Treaty will be eligible for credit against your U.S. federal income tax liability. The limitation on foreign taxes eligible for credit is calculated separately with respect to specific classes of income. For this purpose, dividends distributed by us with respect to the common shares generally will constitute “passive category income” or in the case of certain U.S. holders, “general category income”. The use of foreign tax credits is subject to complex rules and limitations. In lieu of a credit, a U.S. holder who itemizes deductions may elect to deduct all of such holder’s foreign taxes in the taxable year. A deduction does not reduce tax on a dollar-for-dollar basis like a credit, but the deduction for foreign taxes is not
128
subject to the same limitations applicable to foreign tax credits. You should consult your own tax advisor to determine whether and to what extent a credit would be available to you.
Certain non-corporate U.S. holders (including individuals) are eligible for reduced rates of U.S. federal income tax in respect of “qualified dividend income”. For this purpose, “qualified dividend income” generally includes dividends paid by a non-U.S. corporation if, among other things, the U.S. holders meet certain minimum holding period and other requirements and the non-U.S. corporation satisfies certain requirements, including either that (i) the shares of the non-U.S. corporation are readily tradable on an established securities market in the United States, or (ii) the non-U.S. corporation is eligible for the benefits of a comprehensive income tax treaty with the United States (such as the U.S./NL Income Tax Treaty) which provides for the exchange of information. We currently believe that dividends paid by us with respect to our common shares should constitute “qualified dividend income” for U.S. federal income tax purposes; however, this is a factual matter and subject to change. You are urged to consult your own tax advisor regarding the availability to you of a reduced dividend tax rate in light of your own particular situation. A dividends-received deduction will not be allowed with respect to dividends paid by us to corporate U.S. holders.
Sale, Exchange or Other Disposition of Common Shares
Upon a sale, exchange or other disposition of common shares, you generally will recognize capital gain or loss in an amount equal to the difference between the amount realized and your tax basis in the common shares, as determined in U.S. dollars. This gain or loss generally will be U.S.-source gain or loss, and will be treated as long-term capital gain or loss if you have held the common shares for more than one year. If you are an individual, capital gains generally will be subject to U.S. federal income tax at preferential rates if specified minimum holding periods are met. The deductibility of capital losses is subject to significant limitations.
Net Investment Income Tax
Certain U.S. holders that are individuals, estates or trusts and whose income exceeds certain thresholds generally will be subject to a 3.8% tax on “net investment income”, including, among other things, dividends on, and gains from the sale or other taxable disposition of, our common shares, subject to certain limitations and exceptions. You should consult your own tax advisor regarding the effect, if any, of such tax on your ownership and disposition of our common shares.
Passive Foreign Investment Company Status
We believe that we should not be classified as a passive foreign investment company (a “PFIC”) for U.S. federal income tax purposes for the year ended December 31, 2023 and we do not expect to become a PFIC in the foreseeable future. This conclusion is a factual determination that must be made annually at the close of each taxable year and therefore we can provide no assurance that we will not be a PFIC in our current or any future taxable year. If we were to be characterized as a PFIC for any taxable year, the tax on certain distributions on our common shares and on any gains realized upon the disposition of common shares may be materially less favorable than as described herein. In addition, if we were a PFIC in a taxable year in which we were to pay dividends or the prior taxable year, such dividends would not be “qualified dividend income” (as described above) and would be taxed at the higher rates applicable to other items of ordinary income. You should consult your own tax advisor regarding the application of the PFIC rules to your ownership of our common shares.
U.S. Information Reporting and Backup Withholding
Dividend payments with respect to our common shares and proceeds from the sale, exchange, retirement or other disposition of our common shares may be subject to information reporting to the U.S. Internal Revenue Service (the “IRS”) and possible U.S. backup withholding. Backup withholding will not apply to you, however, if you furnish a correct taxpayer identification number and make any other required certification, or if you are otherwise exempt from backup withholding. U.S. persons required to establish their exempt status generally must provide certification on IRS Form W-9. Backup withholding is not an additional tax. Amounts withheld as backup withholding may be credited against your U.S. federal income tax liability, and you may obtain a refund of any excess amounts withheld under the backup withholding rules by timely filing the appropriate claim for refund with the IRS and furnishing any required information.
129
In addition, U.S. holders should be aware of annual reporting requirements with respect to the holding of certain foreign financial assets, including our common shares that are not held in an account maintained by certain types of financial institutions, if the aggregate value of all of such assets exceeds $50,000 (or $100,000 for married couples filing a joint return). You should consult your own tax advisor regarding the application of the information reporting and backup withholding rules to our common shares and the application of the annual reporting requirements to your particular situation.
F. Dividends and Paying Agents
Not applicable.
G. Statement by Experts
Not applicable.
H. Documents on Display
Any statement in this Form 20-F about any of our contracts or other documents is not necessarily complete. If the contract or document is filed as an exhibit to this Form 20-F the contract or document is deemed to modify the description contained in this Form 20-F. You must review the exhibits themselves for a complete description of the contract or document.
Our Articles of Association, the minutes of our AGM, reports of the auditors and other corporate documentation may be consulted by the shareholders and any other individual authorized to attend the meetings at our head office at Schiphol Airport Amsterdam, The Netherlands, at the registered offices of the Managing Board in Geneva, Switzerland and at Crédit Agricole-Indosuez, 9, Quai du Président Paul-Doumer, 92400 Courbevoie, France.
You may review a copy of our filings with the U.S. Securities and Exchange Commission (the “SEC”), including exhibits and schedules filed with it, at the SEC’s public reference facilities in Room 1024, Judiciary Plaza, 450 Fifth Street, N.W., Washington, D.C. 20549. Please call the SEC at 1-800-SEC-0330 for further information. In addition, the SEC maintains an internet site (www.sec.gov) that contains reports and other information regarding issuers that file electronically with the SEC. These SEC filings are also available to the public from commercial document retrieval services.
WE ARE REQUIRED TO FILE REPORTS AND OTHER INFORMATION WITH THE SEC UNDER THE SECURITIES EXCHANGE ACT OF 1934. REPORTS AND OTHER INFORMATION FILED BY U.S. WITH THE SEC MAY BE INSPECTED AND COPIED AT THE SEC’S PUBLIC REFERENCE FACILITIES DESCRIBED ABOVE OR THROUGH THE INTERNET (WWW.SEC.GOV). AS A FOREIGN PRIVATE ISSUER, WE ARE EXEMPT FROM THE RULES UNDER THE EXCHANGE ACT PRESCRIBING THE FURNISHING AND CONTENT OF PROXY STATEMENTS AND OUR OFFICERS, DIRECTORS AND MAJOR SHAREHOLDERS ARE EXEMPT FROM THE REPORTING AND SHORT-SWING PROFIT RECOVERY PROVISIONS CONTAINED IN SECTION 16 OF THE EXCHANGE ACT. UNDER THE EXCHANGE ACT, AS A FOREIGN PRIVATE ISSUER, WE ARE NOT REQUIRED TO PUBLISH FINANCIAL STATEMENTS AS FREQUENTLY OR AS PROMPTLY AS UNITED STATES COMPANIES.
130
I. Subsidiary Information
Not applicable.
Item 11. Quantitative and Qualitative Disclosures About Market Risk
We are exposed to changes in financial market conditions in the normal course of business due to our operations in different foreign currencies and our ongoing investing and financing activities. Market risk is the uncertainty to which future earnings or asset/liability values are exposed due to operating cash flows denominated in foreign currencies and various financial instruments used in the normal course of operations. The major financial risks to which we are exposed are the foreign exchange risks related to the fluctuations of the U.S. dollar exchange rate compared to the Euro and the other major currencies in which costs are incurred, the variation of the interest rates and the risks associated to the investments of our available cash. We have established policies, procedures and internal processes governing our management of market risks and the use of financial instruments to manage our exposure to such risks.
Our interest income (expense), net, as reported in our consolidated statements of income, is the balance between interest income received from our cash and cash equivalents, short-term deposits and marketable securities and interest expense on our financial liabilities, including bank fees (including fees on committed credit lines or on the sale without recourse of receivables, if any). Our interest income is dependent upon fluctuations in interest rates, mainly in U.S. dollars and Euros, since we invest primarily on a short-term basis; any increase or decrease in the market interest rates would mean an equivalent increase or decrease in our interest income. See “Item 5. Operating and Financial Review and Prospects — Impact of Changes in Interest Rates”.
We place our cash and cash equivalents, or a part of it, with financial institutions with at least a single “A” long-term rating from two of the major rating agencies, meaning at least A3 from Moody’s and A- from S&P or Fitch, or better, invested as short-term deposits and Government debt securities and, as such, we are exposed to the fluctuations in the market interest rates on our placement and our cash, which can have an impact on our consolidated financial statements. We manage the credit risks associated with financial instruments through credit approvals, investment limits and centralized monitoring procedures but do not normally require collateral or other security from the parties to the financial instruments. As of December 31, 2023, the marketable securities have a value of $1,731 million. They are classified as available-for-sale and are reported at fair value. This fair value measurement corresponds to a Level 1 fair value hierarchy measurement. The estimated value of these securities could further decrease in the future as a result of credit market deterioration and/or other downgrading.
We do not anticipate any material adverse effect on our financial position, results of operations or cash flows resulting from the use of our instruments in the future. There can be no assurance that these strategies will be effective or that transaction losses can be minimized or forecasted accurately.
The information below summarizes our market risks associated with cash and cash equivalents, short-term deposits, marketable securities and debt obligations as of December 31, 2023. The information below should be read in conjunction with Note 15 and Note 26 to our Consolidated Financial Statements.
The table below presents principal amounts and related weighted-average interest rates by year of maturity for our investment portfolio and debt obligations (in millions of U.S. dollars, except percentages):
131
| Total | 2024 | 2025 | 2026 | 2027 | 2028 | Thereafter | Fair Value at December 31, 2023 | |||||||||||||||||||||||||||||||||||||||||||
| Assets: | ||||||||||||||||||||||||||||||||||||||||||||||||||
| Cash and cash equivalents | $ | 3,222 | $ | 3,222 | ||||||||||||||||||||||||||||||||||||||||||||||
| of which Cash at bank and on hand | $ | 343 | $ | 343 | ||||||||||||||||||||||||||||||||||||||||||||||
| of which Deposits at call with banks | $ | 2,879 | $ | 2,879 | ||||||||||||||||||||||||||||||||||||||||||||||
| Short-term deposits | $ | 1,226 | $ | 1,226 | ||||||||||||||||||||||||||||||||||||||||||||||
| Current marketable securities | $ | 1,635 | $ | 1,635 | ||||||||||||||||||||||||||||||||||||||||||||||
| Average yield to maturity | 1.56 | % | ||||||||||||||||||||||||||||||||||||||||||||||||
Long-term debt(1): | $ | 2,931 | $ | 217 | $ | 962 | $ | 212 | $ | 947 | $ | 198 | $ | 395 | $ | 3,245 | ||||||||||||||||||||||||||||||||||
| Average interest rate | 2.20 | % | ||||||||||||||||||||||||||||||||||||||||||||||||
| Amounts in millions of U.S. dollars | ||||||||
Long-term debt by currency as of December 31, 2023 (1): | ||||||||
| U.S. dollar | 1,500 | |||||||
| Euro | 1,431 | |||||||
| Total in U.S. dollars | 2,931 | |||||||
| Amounts in millions of U.S. dollars | ||||||||
Long-term debt by currency As of December 31, 2022 (1): | ||||||||
| U.S. dollar | 1,500 | |||||||
| Euro | 1,222 | |||||||
| Total in U.S. dollars | 2,722 | |||||||
(1)Long-term debt is presented at principal amount
132
The following table provides information about our FX forward contracts and FX currency options not designated as a hedge as of December 31, 2023 (in millions of U.S. dollars):
FORWARD CONTRACTS AND CURRENCY OPTIONS AS OF DECEMBER 31, 2023
| Notional Amount | Average Rate | Fair Value | ||||||||||||||||||||||||||||||||||||
| Buy | AUD | Sell | USD | 2 | 0.66 | — | ||||||||||||||||||||||||||||||||
| Buy | USD | Sell | CHF | 57 | 0.85 | (1) | ||||||||||||||||||||||||||||||||
| Buy | EUR | Sell | USD | 4 | 1.10 | — | ||||||||||||||||||||||||||||||||
| Buy | USD | Sell | JPY | 6 | 140.96 | — | ||||||||||||||||||||||||||||||||
| Buy | USD | Sell | CNY | 253 | 7.10 | (1) | ||||||||||||||||||||||||||||||||
| Buy | USD | Sell | PHP | 1 | 55.82 | — | ||||||||||||||||||||||||||||||||
| Buy | EUR | Sell | MAD | 30 | 11.06 | — | ||||||||||||||||||||||||||||||||
| Buy | USD | Sell | AUD | — | 0.66 | — | ||||||||||||||||||||||||||||||||
| Buy | CHF | Sell | USD | 1 | 0.87 | — | ||||||||||||||||||||||||||||||||
| Buy | USD | Sell | EUR | 108 | 1.11 | — | ||||||||||||||||||||||||||||||||
| Buy | USD | Sell | GBP | 3 | 1.26 | — | ||||||||||||||||||||||||||||||||
| Buy | HKD | Sell | USD | 2 | 7.81 | — | ||||||||||||||||||||||||||||||||
| Buy | JPY | Sell | EUR | 20 | 156.25 | — | ||||||||||||||||||||||||||||||||
| Buy | JPY | Sell | USD | 58 | 143.04 | 1 | ||||||||||||||||||||||||||||||||
| Buy | MYR | Sell | USD | 33 | 4.65 | 1 | ||||||||||||||||||||||||||||||||
| Buy | SEK | Sell | USD | 18 | 10.10 | — | ||||||||||||||||||||||||||||||||
| Buy | SGD | Sell | USD | 194 | 1.33 | 2 | ||||||||||||||||||||||||||||||||
| Buy | TWD | Sell | USD | 13 | 31.37 | — | ||||||||||||||||||||||||||||||||
| Buy | CNY | Sell | USD | 90 | 7.10 | 1 | ||||||||||||||||||||||||||||||||
| Buy | PHP | Sell | USD | 18 | 55.70 | — | ||||||||||||||||||||||||||||||||
| Buy | MAD | Sell | USD | 4 | 10.09 | — | ||||||||||||||||||||||||||||||||
| Buy | INR | Sell | USD | 49 | 83.46 | — | ||||||||||||||||||||||||||||||||
| Buy | KRW | Sell | USD | 10 | 1,296.60 | — | ||||||||||||||||||||||||||||||||
| Buy | CNH | Sell | USD | — | 7.08 | — | ||||||||||||||||||||||||||||||||
The following table provides information about our FX forward contracts and FX currency options not designated as a hedge as of December 31, 2022 (in millions of U.S. dollars):
133
FORWARD CONTRACTS AND CURRENCY OPTIONS AS OF DECEMBER 31, 2022
| Notional Amount | Average Rate | Fair Value | ||||||||||||||||||||||||||||||||||||
| Buy | AUD | Sell | USD | 1 | 0.67 | — | ||||||||||||||||||||||||||||||||
| Buy | EUR | Sell | USD | 399 | 1.06 | (1) | ||||||||||||||||||||||||||||||||
| Buy | EUR | Sell | JPY | — | 144.26 | — | ||||||||||||||||||||||||||||||||
| Buy | USD | Sell | SEK | 2 | 10.81 | — | ||||||||||||||||||||||||||||||||
| Buy | USD | Sell | CNY | 7 | 6.69 | — | ||||||||||||||||||||||||||||||||
| Buy | USD | Sell | PHP | 2 | 55.23 | — | ||||||||||||||||||||||||||||||||
| Buy | EUR | Sell | MAD | 32 | 11.17 | — | ||||||||||||||||||||||||||||||||
| Buy | CHF | Sell | USD | 47 | 0.92 | — | ||||||||||||||||||||||||||||||||
| Buy | HKD | Sell | USD | 1 | 7.79 | — | ||||||||||||||||||||||||||||||||
| Buy | JPY | Sell | EUR | 32 | 141.64 | — | ||||||||||||||||||||||||||||||||
| Buy | JPY | Sell | USD | 49 | 133.45 | 1 | ||||||||||||||||||||||||||||||||
| Buy | MYR | Sell | USD | 29 | 4.41 | — | ||||||||||||||||||||||||||||||||
| Buy | SEK | Sell | USD | 7 | 10.31 | — | ||||||||||||||||||||||||||||||||
| Buy | SGD | Sell | USD | 149 | 1.38 | 4 | ||||||||||||||||||||||||||||||||
| Buy | TWD | Sell | USD | 17 | 30.66 | — | ||||||||||||||||||||||||||||||||
| Buy | CNY | Sell | USD | 73 | 7.02 | 2 | ||||||||||||||||||||||||||||||||
| Buy | PHP | Sell | USD | 19 | 56.86 | — | ||||||||||||||||||||||||||||||||
| Buy | MAD | Sell | USD | 5 | 10.64 | — | ||||||||||||||||||||||||||||||||
| Buy | INR | Sell | USD | 47 | 82.22 | — | ||||||||||||||||||||||||||||||||
| Buy | KRW | Sell | USD | 11 | 1,353.81 | 1 | ||||||||||||||||||||||||||||||||
| Buy | CNH | Sell | USD | 1 | 6.96 | — | ||||||||||||||||||||||||||||||||
Our FX forward contracts and FX currency options, including collars, designated as a hedge, are further described in Note 26 to our Consolidated Financial Statements.
Item 12. Description of Securities Other than Equity Securities
We sell ordinary shares in the United States that are evidenced by American registered certificates (“New York Shares”). In connection therewith, a holder of our New York Shares may have to pay, either directly or indirectly, certain fees and charges, as described in Item 12D.3. In addition, we receive fees and other direct and indirect payments from our New York Agent that are related to our New York Shares, as described in Item 12D.4.
Fees and Charges that a holder of our New York Shares May Have to Pay
J.P. Morgan collects fees for the delivery and surrender of New York Shares directly from investors depositing or surrendering New York Shares for the purpose of withdrawal or from intermediaries acting for them.
Persons depositing or withdrawing our New York Shares must pay to J.P. Morgan:
•Up to $5.00 per 100 New York Shares (or portion of 100 New York Shares) for the issuance of New York Shares, including issuances resulting from a distribution of shares or rights or other property, and cancellation of New York Shares for the purpose of withdrawal, including if the New York Share agreement terminates;
•Taxes (including applicable interest and penalties) and other governmental charges;
•Registration fees as may from time to time be in effect for the registration of New York Shares;
•Cable, telex, facsimile and electronic transmission and delivery expenses;
134
•Expenses and charges incurred by J.P. Morgan in the conversion of foreign currency or the sale of any securities or property; and
•Any charges incurred by J.P. Morgan in connection with compliance with exchange control regulations and other regulatory requirements applicable to New York Shares
Fees and Other Payments Made by the New York Agent to Us
Under the New York Share program agreement with J.P. Morgan the annual amount (contribution) of USD 743,060 in respect of 2023 will be paid in 2024.
135
PART II
Item 13. Defaults, Dividend Arrearages and Delinquencies
None.
Item 14. Material Modifications to the Rights of Security Holders and Use of Proceeds
None.
Item 15. Controls and Procedures
Disclosure Controls and Procedures
Evaluation
Our management, including the Chief Executive Officer and Chief Financial Officer, performed an evaluation of the effectiveness of the design and operation of our disclosure controls and procedures as defined in Rules 13a-15(e) and 15d-15(e) under the Securities and Exchange Act of 1934 (“Disclosure Controls”) as of the end of the period covered by this Form 20-F. Disclosure Controls are controls and procedures designed to reasonably assure that information required to be disclosed in our reports filed under the Securities and Exchange Act of 1934, such as this Form 20-F, is recorded, processed, summarized and reported within the time periods specified in the SEC’s rules and forms. Disclosure Controls are also designed to reasonably assure that such information is accumulated and communicated to our management, including the Chief Executive Officer and Chief Financial Officer, as appropriate to allow timely decisions regarding required disclosure.
The evaluation of our Disclosure Controls included a review of the controls’ objectives and design, our implementation of the controls and their effect on the information generated for use in this Form 20-F. The components of our Disclosure Controls are also evaluated on an ongoing basis by our Corporate Audit Department, which reports directly to our Audit Committee. The overall goals of these various evaluation activities are to monitor our Disclosure Controls, and to modify them as necessary. Our intent is to maintain the Disclosure Controls as dynamic systems that change as conditions warrant.
Based on their evaluation, our Chief Executive Officer and Chief Financial Officer have concluded that, as of the end of the period covered by this Form 20-F, our Disclosure Controls were effective.
Changes in Internal Control over Financial Reporting
There were no changes to our internal control over financial reporting (as defined in Rule 13a-15(f) and 15d-15(f) under the Securities and Exchange Act of 1934) that occurred during the period covered by this form 20-F that have materially affected, or are reasonably likely to materially affect, our internal control over financial reporting.
Limitations on Effectiveness of Controls
No system of internal control over financial reporting, including one determined to be effective, may prevent or detect all misstatements. It can provide only reasonable assurance regarding financial statement preparation and presentation. Also, projections of the results of any evaluation of the effectiveness of internal control over financial reporting into future periods are subject to inherent risk. The relevant controls may become inadequate due to changes in circumstances or the degree of compliance with the underlying policies or procedures may deteriorate.
Other Reviews
We have sent this Form 20-F to our Audit Committee and Supervisory Board, which had an opportunity to raise questions with our management and independent auditors before we filed it with the SEC.
136
Management’s Report on Internal Control over Financial Reporting
Our management is responsible for establishing and maintaining adequate internal control over financial reporting to provide reasonable assurance regarding the reliability of our financial reporting and the preparation of financial statements for external purposes in accordance with U.S. generally accepted accounting principles.
Internal control over financial reporting includes those policies and procedures that (i) pertain to the maintenance of records that in reasonable detail accurately and fairly reflect the transactions and dispositions of the assets of the company; (ii) provide reasonable assurance that transactions are recorded as necessary to permit preparation of financial statements in accordance with U.S. generally accepted accounting principles, and that receipts and expenditures of the company are being made only in accordance with authorizations of management and directors of the company; and (iii) provide reasonable assurance regarding prevention or timely detection of unauthorized acquisition, use or disposition of the company’s assets that could have a material effect on the financial statements. Because of its inherent limitations, internal control over financial reporting may not prevent or detect misstatements. Projections of any evaluation of effectiveness to future periods are subject to the risk that controls may become inadequate because of changes in conditions, or that the degree of compliance with the policies or procedures may deteriorate. See “Item 3. Key Information — Risk Factors”.
Management assessed the effectiveness of our internal control over financial reporting as of December 31, 2023, the end of our fiscal year. Management based its assessment on criteria established in Internal Control — Integrated Framework issued by the Committee of Sponsoring Organizations of the Treadway Commission (“COSO”) in Internal Control-Integrated Framework (2013). Management’s assessment included evaluation of such elements as the design and operating effectiveness of key financial reporting controls, process documentation, accounting policies and our overall control environment. Based on this assessment the management concluded that, as of December 31, 2023 our internal control over financial reporting was effective and the financial reporting is prepared on a going concern basis.
The effectiveness of the Company’s internal control over financial reporting as of December 31, 2023 has been audited by Ernst & Young AG, an independent registered public accounting firm, as stated in their report.
Report of Independent Registered Public Accounting Firm
To the Supervisory Board and Stockholders of STMicroelectronics N.V.
Opinion on Internal Control over Financial Reporting
We have audited STMicroelectronics N.V.’s internal control over financial reporting as of December 31, 2023, based on criteria established in Internal Control - Integrated Framework issued by the Committee of Sponsoring Organizations of the Treadway Commission (2013 framework) (the "COSO criteria"). In our opinion, STMicroelectronics N.V. (the Company) maintained, in all material respects, effective internal control over financial reporting as of December 31, 2023, based on the COSO criteria.
We also have audited, in accordance with the standards of the Public Company Accounting Oversight Board (United States) ("PCAOB"), the consolidated balance sheets of STMicroelectronics N.V. as of December 31, 2023 and 2022, the related consolidated statements of income, comprehensive income, equity and cash flows for each of the three years in the period ended December 31, 2023, and the related notes and financial statements schedule on page S-1, and our report dated February 22, 2024 expressed an unqualified opinion thereon.
Basis for Opinion
The Company’s management is responsible for maintaining effective internal control over financial reporting and for its assessment of the effectiveness of internal control over financial reporting included in the accompanying Management’s Report on Internal Control over Financial Reporting. Our responsibility is to express an opinion on the Company’s internal control over financial reporting based on our audit. We are a public accounting firm registered with the PCAOB and are required to be independent with respect to the Company in accordance with the U.S. federal securities laws and the applicable rules and regulations of the Securities and Exchange Commission and the PCAOB.
137
We conducted our audit in accordance with the standards of the PCAOB. Those standards require that we plan and perform the audit to obtain reasonable assurance about whether effective internal control over financial reporting was maintained in all material respects.
Our audit included obtaining an understanding of internal control over financial reporting, assessing the risk that a material weakness exists, testing and evaluating the design and operating effectiveness of internal control based on the assessed risk, and performing such other procedures as we considered necessary in the circumstances. We believe that our audit provides a reasonable basis for our opinion.
Definition and Limitations of Internal Control Over Financial Reporting
A company’s internal control over financial reporting is a process designed to provide reasonable assurance regarding the reliability of financial reporting and the preparation of financial statements for external purposes in accordance with generally accepted accounting principles. A company’s internal control over financial reporting includes those policies and procedures that (1) pertain to the maintenance of records that, in reasonable detail, accurately and fairly reflect the transactions and dispositions of the assets of the company; (2) provide reasonable assurance that transactions are recorded as necessary to permit preparation of financial statements in accordance with generally accepted accounting principles, and that receipts and expenditures of the company are being made only in accordance with authorizations of management and directors of the company; and (3) provide reasonable assurance regarding prevention or timely detection of unauthorized acquisition, use, or disposition of the company’s assets that could have a material effect on the financial statements.
Because of its inherent limitations, internal control over financial reporting may not prevent or detect misstatements. Also, projections of any evaluation of effectiveness to future periods are subject to the risk that controls may become inadequate because of changes in conditions, or that the degree of compliance with the policies or procedures may deteriorate.
/s/ Ernst & Young AG
Lancy - Geneva, Switzerland
February 22, 2024
Item 16.
Item 16A. Audit Committee Financial Expert
Our Supervisory Board has concluded that Ana de Pro Gonzalo, the Chair of our Audit Committee, qualifies as an “audit committee financial expert” as defined in Item 16A and is independent as defined in the listing standards applicable to us as a listed issuer as required by Item 16A(2) of Form 20-F.
Item 16B. Code of Ethics
We have adopted written standards of business conduct and ethics (“Code of Conduct”) and related policies, which are designed to promote honest and ethical business conduct, to deter wrongdoing and to provide principles to which our employees are expected to adhere and advocate. Our Code of Conduct is applicable to all of our employees and senior managers. We believe our Code of Conduct is effective in its mission and we believe our employees are in compliance with the Code of Conduct. We have adapted and will amend our Code of Conduct and related policies as appropriate to reflect regulatory or other changes. Our Code of Conduct provides that if any employee or senior manager to whom it applies acts in contravention of the principles set forth therein, we will take appropriate steps in terms of the procedures in place for fair disciplinary action. This action may, in cases of severe breaches, include dismissal. Our Code of Conduct is available on our website in the Corporate Governance section, at https://www.st.com/content/st_com/en/about/st_company_information/code-of-conduct.html.
Item 16C. Principal Accountant Fees and Services
Our independent external auditors are elected at the AGM. At our AGM held in May 2015, Ernst & Young was first appointed as our independent external auditor for the 2016-2019 fiscal years. At our AGM held on June 17, 2020, our shareholders re-appointed Ernst & Young as our independent external auditor for the
138
2020-2023 fiscal years. The Supervisory Board will propose that Ernst & Young be re-appointed as our independent external auditor for the 2024-2025 fiscal years at our 2024 AGM. The following table presents the aggregate fees for professional audit services and other services rendered to us by Ernst & Young in 2023 and 2022.
| In thousand of U.S. dollars | 2023 | Percentage of Total Fees | 2022 | Percentage of Total Fees | ||||||||||||||||||||||
| Audit Fees | ||||||||||||||||||||||||||
| Audits of consolidated and statutory financial statements | $ | 4,926 | 90.0 | % | $ | 4,951 | 95.2 | % | ||||||||||||||||||
| Audit-Related Fees | $ | 546 | 10.0 | % | $ | 211 | 4.1 | % | ||||||||||||||||||
| Non-audit Fees | ||||||||||||||||||||||||||
| Tax Fees | $ | — | — | % | $ | 38 | 0.7 | % | ||||||||||||||||||
| All Other Fees | $ | — | — | % | $ | — | ||||||||||||||||||||
| Total | $ | 5,472 | 100.0 | % | $ | 5,200 | 100.0 | % | ||||||||||||||||||
Audit Fees consist of fees billed for the annual audit of our Company’s Consolidated Financial Statements, the statutory audit of the financial statements of the Company’s subsidiaries and consultations on complex accounting issues relating to the annual audit. Audit Fees also include services that only our independent external auditor can reasonably provide, such as comfort letters and carve-out audits in connection with strategic transactions.
Audit-related services are assurance and related fees consisting of the audit of employee benefit plans, due diligence services related to acquisitions and certain agreed-upon procedures.
Tax Fees include fees billed for tax compliance services, including the preparation of original and amended tax returns and claims for refund; tax consultations, such as assistance in connection with tax audits and expatriate tax compliance.
Audit Committee Pre-approval Policies and Procedures
Our Audit Committee is responsible for selecting the independent registered public accounting firm to be employed by us to audit our financial statements, subject to ratification by the Supervisory Board and approval by our shareholders for appointment. Our Audit Committee also assumes responsibility (inter alia in accordance with Dutch law and the Dutch Corporate Governance Code) for the retention, compensation, oversight and termination of any independent external auditor employed by us. We adopted a policy (the “Policy”), which was approved in advance by our Audit Committee, for the pre-approval of audit and permissible non-audit services provided by our independent external auditors. The Policy defines those audit-related services eligible to be approved by our Audit Committee.
All engagements with our independent external auditors, regardless of amount, must be authorized in advance by our Audit Committee, pursuant to the Policy and its pre-approval authorization or otherwise.
The independent external auditors submit a proposal for audit-related services to our Audit Committee on a quarterly basis in order to obtain prior authorization for the amount and scope of the services. The independent external auditors must state in the proposal that none of the proposed services affect their independence. The proposal must be endorsed by the office of our Chief Financial Officer with an explanation of why the service is needed and the reason for sourcing it to the audit firm and validation of the amount of fees requested.
We do not intend to retain our independent external auditors for permissible non-audit services other than by exception and within a limited amount of fees, and the Policy provides that such services must be explicitly authorized by our Audit Committee.
The Chief Audit and Risk Executive is responsible for monitoring that the actual fees are complying with the pre-approval amount and scope authorized by our Audit Committee. During 2023, all services provided to us by Ernst & Young were approved by our Audit Committee pursuant to paragraph (c)(7)(i) of Rule 2-01 of Regulation S-X.
139
Item 16D. Exemptions from the Listing Standards for Audit Committees
Not applicable.
Item 16E. Purchases of Equity Securities by the Issuer and Affiliated Purchasers
On July 1, 2021, we announced the launch of a share buy-back program of up to $1,040 million to be executed within a 3-year period. We intend to carry out the buy-back program, and hold the shares bought back as treasury stock for the purpose of meeting our obligations in relation to our employee stock award plans and to support the potential settlement of our outstanding convertible debt.
| Period | Total Number of Securities Purchased | Average Price Paid per Security € | Total Number of Securities Purchased as Part of Publicly Announced Programs | Maximum Number of Securities that may be Purchased Under the Programs | ||||||||||||||||||||||
| 2023-01-01 to 2023-01-31 | 749,642 | 37.79 | 13,938,970 | 28,500,000 | ||||||||||||||||||||||
| 2023-02-01 to 2023-02-28 | 561,114 | 45.38 | 14,500,084 | 28,500,000 | ||||||||||||||||||||||
| 2023-03-01 to 2023-03-31 | 593,502 | 45.52 | 15,093,586 | 28,500,000 | ||||||||||||||||||||||
| 2023-04-01 to 2023-04-30 | 909,865 | 44.39 | 16,003,451 | 28,500,000 | ||||||||||||||||||||||
| 2023-05-01 to 2023-05-31 | 999,467 | 39.46 | 17,002,918 | 28,500,000 | ||||||||||||||||||||||
| 2023-06-01 to 2023-06-30 | — | — | 17,002,918 | 28,500,000 | ||||||||||||||||||||||
| 2023-07-01 to 2023-07-31 | 519,233 | 45.65 | 17,522,151 | 28,500,000 | ||||||||||||||||||||||
| 2023-08-01 to 2023-08-31 | 883,934 | 43.99 | 18,406,085 | 28,500,000 | ||||||||||||||||||||||
| 2023-09-01 to 2023-09-30 | 391,913 | 42.40 | 18,797,998 | 28,500,000 | ||||||||||||||||||||||
| 2023-10-01 to 2023-10-31 | 985,384 | 39.35 | 19,783,382 | 28,500,000 | ||||||||||||||||||||||
| 2023-11-01 to 2023-11-30 | 481,938 | 39.35 | 20,265,320 | 28,500,000 | ||||||||||||||||||||||
| 2023-12-01 to 2023-12-31 | 520,990 | 44.79 | 20,786,310 | 28,500,000 | ||||||||||||||||||||||
As of December 31, 2023, we held 8,510,839 of our common shares in treasury stock pursuant to repurchases made in prior years.
Item 16F. Change in Registrant’s Certifying Accountant
Not applicable.
Item 16G. Corporate Governance
As we have common shares listed on the NYSE, pursuant to SEC and NYSE rules, in this Item 16G we provide a concise summary of any significant ways in which our corporate governance practices differ from those followed by U.S. companies under NYSE listing standards.
As a Dutch company, we are subject to the Dutch Corporate Governance Code. We have summarized our policies and practices in the field of corporate governance in our Corporate Governance Charter, including our corporate organization, the remuneration principles which apply to our Managing and Supervisory Boards, our information policy and our corporate policies relating to business ethics and conflicts of interests. We are committed to informing our shareholders of any significant changes in our corporate governance policies and practices at our AGM. Along with our Supervisory Board charter (which also includes the charters of our Supervisory Board Committees) and our Code of Conduct, the current version of our Corporate Governance Charter is posted on our website (www.st.com), and these documents are available in print to any shareholder who may request them.
Below is a description of the significant ways our corporate governance practices as a Dutch company differ from those followed by U.S. companies listed on the NYSE:
140
•Because we are a Dutch company, the Audit Committee is an advisory committee to the Supervisory Board, which reports to the Supervisory Board, and our general meeting of shareholders appoints our statutory auditors. Our Audit Committee has established a charter outlining its duties and responsibilities with respect to, among others, the monitoring of our accounting, auditing, financial reporting and the appointment, retention and oversight of our external auditors. In addition, our Audit Committee has established procedures for the receipt, retention and treatment of complaints regarding accounting, internal accounting controls or auditing matters, and the confidential anonymous submission by our employees regarding questionable accounting or auditing matters.
•Pursuant to our Supervisory Board charter, the Supervisory Board is responsible for handling and deciding on potential reported conflicts of interests between the Company and members of the Supervisory Board, as well as the Managing Board. See “Item 7. Major Shareholders and Related Party Transactions”.
•Our Supervisory Board is carefully selected based upon the combined experience and expertise of its members. In fulfilling their duties under Dutch law, Supervisory Board members shall be guided by the interests of our Company and its business, and it shall take into account the relevant interests of all of our stakeholders (including our shareholders) and must act independently in their supervision of our management. Our Supervisory Board has adopted criteria to assess the independence of its members in accordance with corporate governance listing standards of the NYSE. Our Supervisory Board has on various occasions discussed Dutch corporate governance standards, the implementing rules and corporate governance standards of the SEC and of the NYSE, as well as other corporate governance standards. The Supervisory Board has determined, based on the evaluations by an ad hoc committee, the following independence criteria for its members: Supervisory Board members must not have any material relationship with STMicroelectronics N.V., or any of our consolidated subsidiaries, or our management. A “material relationship” can include commercial, industrial, banking, consulting, legal, accounting, charitable and familial relationships, among others, but does not include a relationship with direct or indirect shareholders.
We believe we are fully compliant with all material NYSE corporate governance standards, to the extent possible for a Dutch company listed on Euronext Paris, Borsa Italiana, as well as the NYSE.
Our consistent commitment to good corporate governance principles is evidenced by:
•Our corporate organization under Dutch law that entrusts our management to a Managing Board acting under the supervision and control of a Supervisory Board totally independent from the Managing Board. Members of our Managing Board and of our Supervisory Board are appointed and dismissed by our shareholders;
•Our early adoption of policies on important issues such as business ethics, anti-corruption and conflicts of interest and strict policies to comply with applicable regulatory requirements concerning financial reporting, insider trading and public disclosures;
•Our compliance with Dutch securities laws, because we are a company incorporated under the laws of The Netherlands, as well as our compliance with American, French and Italian securities laws, as applicable, because our shares are listed in these jurisdictions, in addition to our compliance with the corporate, social and financial laws applicable to our subsidiaries in the countries in which we do business;
•Our broad-based activities in the field of corporate social responsibility, encompassing environmental, social, health, safety, educational and other related issues including our corporate governance statement which evidences our policy objectives with respect to diversity as well as the results of implementing our diversity policy for the year ended December 31, 2023;
•Our implementation of an ethics hotline (operated by an independent third-party). We encourage everyone, including external business partners, to express, in good faith, any concerns they might have regarding possible violations of our Code of Conduct, the Company’s policies, or the law through, amongst other things, our Code of Conduct, dedicated intranet web pages and our ST
141
Integrity App. Our 'speak-up' policy is communicated to all employees and includes an independent multilingual ethics hotline;
•Our Corporate Ethics Committee and Local Ethics Committees, whose mandate is to provide support to our management in its efforts to foster a business ethics culture consistent across regions, functions and organizations;
•Our Chief Compliance Officer, who reports to our Chief Executive Officer, also acts as Executive Secretary to our Supervisory Board; and
•Our Executive Vice President, Chief Audit and Risk Executive, who reports directly to our Audit Committee for Corporate Audit activities and directly to the Chief Financial Officer for Enterprise Risk Management and Resilience (business continuity and crisis management) are also, in conjunction with the Chief Compliance Officer, responsible for the management of the ethics hotline.
No member of the Supervisory Board or Managing Board has been (i) subject to any convictions in relation to fraudulent offenses during the five years preceding the date of this Form 20-F, (ii) no member has been associated with any company in bankruptcy, receivership or liquidation in the capacity of member of the administrative, management or supervisory body, partner with unlimited liability, founder or senior manager in the five years preceding the date of this Form 20-F or (iii) subject to any official public incrimination and/or sanction by statutory or regulatory authorities (including professional bodies) or disqualified by a court from acting as a member of the administrative, management or supervisory bodies of any issuer or from acting in the management or conduct of the affairs of any issuer during the five years preceding the date of this Form 20-F.
Item 16H. Mine Safety Disclosure
Not applicable.
Item 16I. Disclosure Regarding Foreign Jurisdictions that Prevent Inspections
Not applicable.
Item 16J. Insider Trading Policies
Not applicable. We will be required to comply with disclosure requirements under this item 16J for the fiscal year ending on December 31, 2024.
Item 16K. Cybersecurity
As a company operating globally in the semiconductor market, we are exposed to risks, including cybersecurity risks. As of December 31, 2023, we are not aware of any previous cybersecurity incidents that have materially affected or are reasonably likely to materially affect our service, systems or business, however, for a full description of our risk factors, please refer to “Item 3. Key Information - Risk Factors”.
Our overall risk approach is managed by our Chief Audit & Risk Executive, Mr. Franck Freymond, under the direct responsibility of our Managing Board and the oversight of our Supervisory Board.
Our embedded approach to enterprise risk management (“ERM”) is formalized in a specific policy and is aligned with ISO 31000 (Risk Management). This enables us to:
•set and enable our Company strategy, manage our performance, and capitalize on opportunities; and
•systematically identify, evaluate and treat specific risk scenarios.
142
Our ERM improvement roadmap includes, in particular, deploying our risk framework which is based on the following principles:
•taking into consideration the interests of our stakeholders;
•addressing uncertainty explicitly;
•pragmatic and tailored to us;
•integral part of our processes and decision-making;
•proactive, structured, dynamic, iterative and responsive to change; and
•based on the best available information.
Our risk governance, including our governance of cybersecurity risks, is described in the following chart:
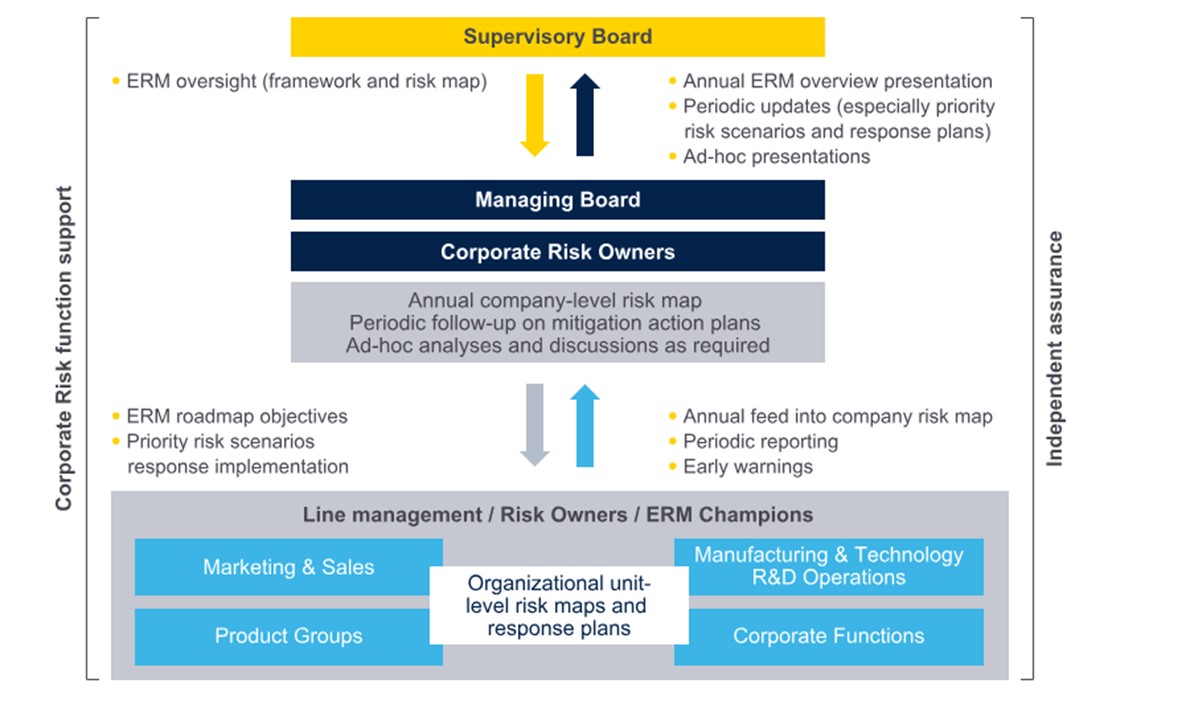
Risk owners (members of our Senior Management) are appointed for each priority risk area to develop risk response plans, adapt to changing external conditions and enhance monitoring capabilities. The risk response plans are regularly reviewed by our Executive Committee and periodically discussed with our Supervisory Board and Audit Committee.
143
The embedded ERM process takes a holistic view, combining both company-wide top-down and bottom-up perspectives, to ensure that specific risk scenarios are addressed at the right level. The process is implemented as described in the following chart:
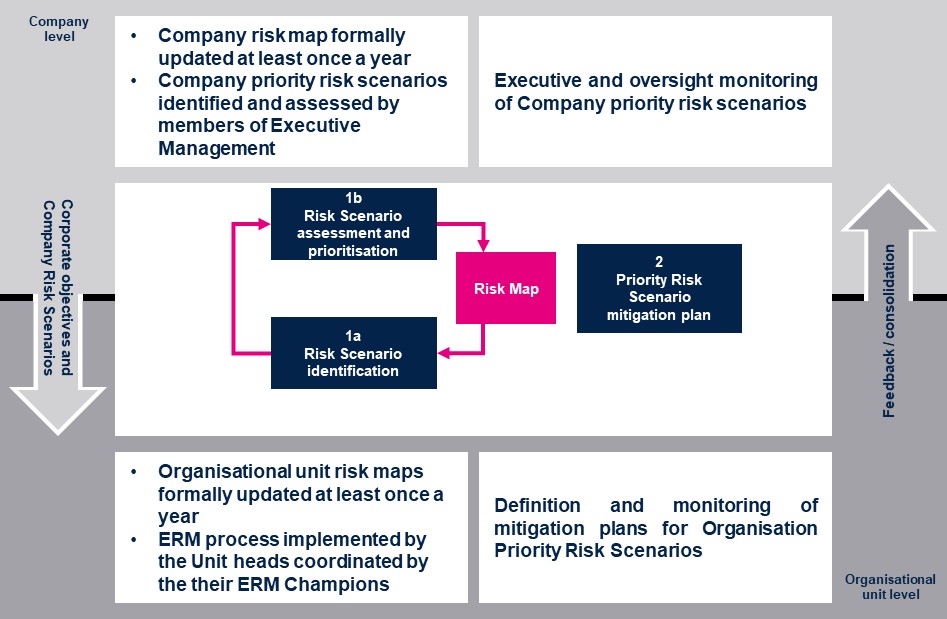
As part of the overall risk framework, we have also designed and implemented a dedicated resilience framework which provides a consistent approach to address risks of potential disruptions of our resources, including potential cybersecurity-attacks. In 2023, we continued to enhance a company-specific methodology underpinning a global dashboard: a range of relevant indicators based on internal or external standards, covering dimensions such as exposure to natural hazards, loss prevention characteristics, facilities robustness, equipment modernization and redundancy, IT infrastructure quality and cyber protection. For every significant site, those indicators are compiled in our “site resilience index”, which is updated on a quarterly basis. Annually, site management teams prepare and update a site improvement plan accordingly.
Cybersecurity risk management is an integral part of the overarching risk framework and seeks to identify and address fast-evolving cybersecurity threats. The management of cybersecurity risks are governed by the Executive Committee and receives regular oversight from the Audit Committee as a standing item. Please see “Item 6. Directors, Senior Management and Employees” for a description of the biographies of our Executive Committee and Audit Committee members.
We have a specialized Information Security team within the wider Digital Transformation and Information Technology team of the Company. The Information Security team covers the following:
•program definition and steering;
•framework, which include third-party security;
•awareness and training campaigns;
•architecture and engineering;
•business applications;
•R&D solutions;
144
•manufacturing and industrial solutions;
•IT infrastructures;
•information security operations (risk-based vulnerability management, privileged access management); and
•detection and reactions to information security incidents, as part of the wider crisis management process.
In particular, within our Information Security team, the Cyber Security Incident Response Team monitor on a continuous basis the evolving cyber threats, and detect and analyze incidents. Based on their initial assessments, any significant risk is escalated and would, if required, trigger the assembly of a Corporate Crisis Team ("CCT"). This CCT would lead the Company response (e.g. containment, forensic investigation, system restoration, and any associated business impact). The CCT would periodically inform the Executive Committee of any developments, and the Executive Committee would in-turn keep the Audit Committee and Supervisory Board informed.
In addition, we have recently created a Third-Party Management function within our procurement department, which will take into consideration cybersecurity risks in the overall management of third parties.
The maturity of our overall risk framework design and implementation, of which includes cybersecurity risks, is periodically audited by a leading independent organization. This was last performed in 2022, confirming a significant improvement in maturity compared to the previous such audit performed in 2017. In 2023, additional audits by a leading independent organization were completed and focused on the following specific areas:
•Maturity assessment of the design and implementation of our resilience framework, confirming its current level of maturity;
•Dedicated review of our cyber crisis playbook.
In addition, we have been ISO 22301 (Security and Resilience) certified since 2016. Throughout 2023, our continuous improvements have been subjected to both internal audits and external surveillance audits from the certification body. We have also been certified ISO SAE 21434 (Road Vehicles – Cybersecurity Engineering) since 2022 confirming that we established a certified management system and governance which meets and complies with the requirements of the automotive industry in the field of cyber security process management within product development phases.
145
PART III
Item 17. Financial Statements
Not applicable.
Item 18. Financial Statements
Item 19. Exhibits
| 2.3 | ||||||||
| 8.1 | ||||||||
| 12.1 | ||||||||
| 12.2 | ||||||||
| 13.1 | ||||||||
| 15.1 | ||||||||
97.1 | ||||||||
| 101 | Inline Interactive Data File | |||||||
| 104 | Cover Page Interactive Data File (embedded within the Inline XBRL document) | |||||||
146
CERTAIN TERMS
| ASD | application-specific discrete technology | |||||||
| ASIC | application-specific integrated circuit | |||||||
| ASSP | application-specific standard product | |||||||
| BCD | bipolar, CMOS and DMOS process technology | |||||||
| Bi-CMOS | bipolar and CMOS process technology | |||||||
| CMOS | complementary metal-on silicon oxide semiconductor | |||||||
| DMOS | diffused metal-on silicon oxide semiconductor | |||||||
| DRAMs | dynamic random access memory | |||||||
| EEPROM | electrically erasable programmable read-only memory | |||||||
| EMAS | Eco-Management and Audit Scheme, the voluntary European Community scheme for companies performing industrial activities for the evaluation and improvement of environmental performance | |||||||
| EMS | electronics manufacturing services | |||||||
| EWS | electrical wafer sorting | |||||||
| FD-SOI | fully depleted silicon-on-insulator | |||||||
GaN GNSS | gallium nitride Global Navigation Satellite System | |||||||
| GPS | global positioning system | |||||||
| HID | high-intensity discharge | |||||||
| IC | integrated circuit | |||||||
| IGBT | insulated gate bipolar transistors | |||||||
| IP | intellectual property | |||||||
| IPAD | integrated passive and active devices | |||||||
| ISO | International Organization for Standardization | |||||||
| LED | light-emitting diode | |||||||
| LoRa | long range low-power wide-area network modulation technique | |||||||
| LPWANs | low-power wide-area networks | |||||||
| MASK WORK | the two- or three-dimensional layout of an integrated circuit. | |||||||
| MEMS | micro-electro-mechanical system | |||||||
| MOS | metal-on silicon oxide semiconductor process technology | |||||||
| MOSFET | metal-on silicon oxide semiconductor field effect transistor | |||||||
| NFC | near field communication | |||||||
| OEM | original equipment manufacturer | |||||||
| QFP | quad-flat no-leads package | |||||||
| QFN | quad-flat package | |||||||
| RAM | random access memory | |||||||
| RF | radio frequency | |||||||
| SAM | serviceable available market | |||||||
| SiGe | silicon germanium | |||||||
| SiC | silicon carbide | |||||||
| SOI | silicon on insulator | |||||||
| SOIC | small-outline integrated circuit | |||||||
| TAM | total available market | |||||||
VIPpower™ | vertical integration power | |||||||
147
SIGNATURES
The registrant hereby certifies that it meets all of the requirements for filing on Form 20-F and that it has duly caused and authorized the undersigned to sign this annual report on its behalf.
| STMICROELECTRONICS N.V. | ||||||||
Date: February 22, 2024 | By: | /s/ Jean-Marc Chery | ||||||
| Jean-Marc Chery | ||||||||
| President and Chief Executive Officer and Sole Member of our Managing Board | ||||||||
148
Report of Independent Registered Public Accounting Firm
To the Supervisory Board and Stockholders of STMicroelectronics N.V.
Opinion on the Financial Statements
We have audited the accompanying consolidated balance sheets of STMicroelectronics N.V. (the Company) as of December 31, 2023 and 2022, and the related consolidated statements of income, comprehensive income, equity and cash flows for each of the three years in the period ended December 31, 2023, and the related notes and financial statements schedule on page S-1 (collectively referred to as the “consolidated financial statements”). In our opinion, the consolidated financial statements present fairly, in all material respects, the financial position of the Company at December 31, 2023 and 2022, and the results of its operations and its cash flows for each of the three years in the period ended December 31, 2023, in conformity with U.S. generally accepted accounting principles.
We also have audited, in accordance with the standards of the Public Company Accounting Oversight Board (United States) (PCAOB), the Company’s internal control over financial reporting as of December 31, 2023, based on criteria established in Internal Control - Integrated Framework issued by the Committee of Sponsoring Organizations of the Treadway Commission (2013 framework) and our report dated February 22, 2024 expressed an unqualified opinion thereon.
Basis for Opinion
These consolidated financial statements are the responsibility of the Company’s management. Our responsibility is to express an opinion on the Company’s consolidated financial statements based on our audits. We are a public accounting firm registered with the PCAOB and are required to be independent with respect to the Company in accordance with the U.S. federal securities laws and the applicable rules and regulations of the Securities and Exchange Commission and the PCAOB.
We conducted our audits in accordance with the standards of the PCAOB. Those standards require that we plan and perform the audit to obtain reasonable assurance about whether the consolidated financial statements are free of material misstatement, whether due to error or fraud. Our audits included performing procedures to assess the risks of material misstatement of the consolidated financial statements, whether due to error or fraud, and performing procedures that respond to those risks. Such procedures included examining, on a test basis, evidence regarding the amounts and disclosures in the consolidated financial statements. Our audits also included evaluating the accounting principles used and significant estimates made by management, as well as evaluating the overall presentation of the consolidated financial statements. We believe that our audits provide a reasonable basis for our opinion.
Critical Audit Matter
The critical audit matter communicated below is a matter arising from the current period audit of the consolidated financial statements that was communicated or required to be communicated to the audit committee and that: (1) relates to accounts or disclosures that are material to the consolidated financial statements and (2) involved our especially challenging, subjective or complex judgments. The communication of the critical audit matter does not alter in any way our opinion on the consolidated financial statements, taken as a whole, and we are not, by communicating the critical audit matter below, providing a separate opinion on the critical audit matter or on the accounts or disclosures to which it relates.
F-1
Recoverability of deferred tax assets
Description of the Matter: At December 31, 2023 the Company reports deferred tax assets of $592 million. As explained in note 2.7 to the consolidated financial statements, the Company performs an evaluation of the likelihood that future taxable income will be generated in an amount sufficient to utilize such deferred tax assets prior to their expiration, and, after having considered positive and negative available evidence, records a valuation allowance for any deferred tax assets when it is more likely than not they will not be realized.
Assessing the recoverability of deferred tax assets involves significant judgement and estimates in relation to the prospective financial information used by management in order to assess future taxable income, which are dependent on the outcome of future events.
How We Addressed the Matter
In Our Audit: We obtained an understanding, evaluated the design and tested the operating effectiveness of management’s controls around, among others: the calculation of the gross amount of deferred tax assets recorded, the preparation of the prospective financial information used to determine the Company’s future taxable income and the assessment of valuation allowance needed for deferred tax assets not deemed recoverable.
We involved tax professionals to assist with our procedures in evaluating management's weighting of available positive and negative evidence used in their assessment of the realizability of deferred tax assets. Among other procedures, we evaluated the timing of the reversal of the temporary differences and management’s prospective financial information used to determine future taxable income and its consistency with current transfer pricing policies. We compared management’s projections with the actual results of prior periods, as well as management’s consideration of current and expected industry and economic trends.
/s/ Ernst & Young AG
We have served as the Company’s auditor since 2016.
Lancy - Geneva, Switzerland
February 22, 2024
F-2
STMicroelectronics N.V.
CONSOLIDATED STATEMENTS OF INCOME
| Twelve months ended | ||||||||||||||||||||
| December 31, | December 31, | December 31, | ||||||||||||||||||
| In million of U.S. dollars except per share amounts | 2023 | 2022 | 2021 | |||||||||||||||||
| Net sales | ||||||||||||||||||||
| Other revenues | ||||||||||||||||||||
| Net revenues | ||||||||||||||||||||
| Cost of sales | ( | ( | ( | |||||||||||||||||
| Gross profit | ||||||||||||||||||||
| Selling, general and administrative expenses | ( | ( | ( | |||||||||||||||||
| Research and development expenses | ( | ( | ( | |||||||||||||||||
| Other income and expenses, net | ||||||||||||||||||||
| Impairment, restructuring charges and other related closure costs | ( | |||||||||||||||||||
| Operating income | ||||||||||||||||||||
| Interest income (expense), net | ( | |||||||||||||||||||
| Other components of pension benefit costs | ( | ( | ( | |||||||||||||||||
| Loss on financial instruments, net | ( | |||||||||||||||||||
| Income before income taxes and noncontrolling interest | ||||||||||||||||||||
| Income tax expense | ( | ( | ( | |||||||||||||||||
| Net income | ||||||||||||||||||||
| Net income attributable to noncontrolling interest | ( | ( | ( | |||||||||||||||||
| Net income attributable to parent company stockholders | ||||||||||||||||||||
| Earnings per share (Basic) attributable to parent company stockholders | ||||||||||||||||||||
| Earnings per share (Diluted) attributable to parent company stockholders | ||||||||||||||||||||
The accompanying notes are an integral part of these audited consolidated financial statements
F-3
STMicroelectronics N.V.
CONSOLIDATED STATEMENTS OF COMPREHENSIVE INCOME
| Twelve months ended | ||||||||||||||||||||
| In million of U.S. dollars | December 31, 2023 | December 31, 2022 | December 31, 2021 | |||||||||||||||||
| Net income | ||||||||||||||||||||
Other comprehensive income (loss), net of tax | ||||||||||||||||||||
Derivative instruments: | ||||||||||||||||||||
Change in fair value of cash-flow hedge | ( | ( | ||||||||||||||||||
Reclassification for net (gains)/losses realized and included in net income | ( | ( | ||||||||||||||||||
Total change in unrealized gains/losses on cash-flow hedge | ( | |||||||||||||||||||
Available-for-sale debt securities: | ||||||||||||||||||||
Change in fair value of available-for-sale debt securities | ( | ( | ||||||||||||||||||
Reclassification for net (gains)/losses realized and included in net income | ||||||||||||||||||||
Total change in unrealized gains/losses on available-for sale debt securities | ( | ( | ||||||||||||||||||
Defined benefit plans: | ||||||||||||||||||||
Actuarial gains/(losses) arising during the period | ( | |||||||||||||||||||
Amortization of actuarial gains losses included in net income | ||||||||||||||||||||
Total change in unrealized gains/losses on defined benefit plans | ( | |||||||||||||||||||
| Change in foreign currency translation | ( | ( | ||||||||||||||||||
Other comprehensive income (loss), net of tax | ( | ( | ||||||||||||||||||
Total comprehensive income | ||||||||||||||||||||
| Less: comprehensive income (loss) attributable to noncontrolling interest | ||||||||||||||||||||
Total comprehensive income attributable to the Company's stockholders | ||||||||||||||||||||
The accompanying notes are an integral part of these audited consolidated financial statements
F-4
STMicroelectronics N.V.
CONSOLIDATED BALANCE SHEETS
| December 31, | December 31, | |||||||||||||
| In million of U.S. dollars, except share amounts | 2023 | 2022 | ||||||||||||
| ASSETS | ||||||||||||||
| Current assets: | ||||||||||||||
| Cash and cash equivalents | ||||||||||||||
| Short-term deposits | ||||||||||||||
| Marketable securities | ||||||||||||||
| Trade accounts receivable, net | ||||||||||||||
| Inventories | ||||||||||||||
| Other current assets | ||||||||||||||
| Total current assets | ||||||||||||||
| Goodwill | ||||||||||||||
| Other intangible assets, net | ||||||||||||||
| Property, plant and equipment, net | ||||||||||||||
| Non-current deferred tax assets | ||||||||||||||
| Long-term investments | ||||||||||||||
| Other non-current assets | ||||||||||||||
| Total assets | ||||||||||||||
| LIABILITIES AND STOCKHOLDERS' EQUITY | ||||||||||||||
| Current liabilities: | ||||||||||||||
| Short-term debt | ||||||||||||||
| Trade accounts payable | ||||||||||||||
| Other payables and accrued liabilities | ||||||||||||||
| Dividends payable to stockholders | ||||||||||||||
| Accrued income tax | ||||||||||||||
| Total current liabilities | ||||||||||||||
| Long-term debt | ||||||||||||||
| Post-employment benefit obligations | ||||||||||||||
| Long-term deferred tax liabilities | ||||||||||||||
| Other long-term liabilities | ||||||||||||||
| Total liabilities | ||||||||||||||
| Commitment and contingencies | ||||||||||||||
| Stockholders' equity: | ||||||||||||||
| Parent company stockholders' equity | ||||||||||||||
Common stock (preferred stock: | ||||||||||||||
| Additional paid-in-capital | ||||||||||||||
| Retained earnings | ||||||||||||||
| Accumulated other comprehensive income | ||||||||||||||
| Treasury stock | ( | ( | ||||||||||||
| Total parent company stockholders' equity | ||||||||||||||
| Noncontrolling interest | ||||||||||||||
| Total stockholders' equity | ||||||||||||||
| Total liabilities and stockholders' equity | ||||||||||||||
| The accompanying notes are an integral part of these audited consolidated financial statements | ||||||||||||||
F-5
STMicroelectronics N.V.
CONSOLIDATED STATEMENTS OF EQUITY
| Accumulated | ||||||||||||||||||||||||||||||||||||||||||||
| Other | ||||||||||||||||||||||||||||||||||||||||||||
| Common | Additional Paid-In | Treasury | Retained | Comprehensive | Noncontrolling | Total | ||||||||||||||||||||||||||||||||||||||
| In million of U.S. dollars, except per share amounts | Stock | Capital | Stock | Earnings | Income (Loss) | Interest | Equity | |||||||||||||||||||||||||||||||||||||
| Balance as of December 31, 2020 | ( | |||||||||||||||||||||||||||||||||||||||||||
| Repurchase of common stock | ( | ( | ||||||||||||||||||||||||||||||||||||||||||
| Settlement of senior convertible bonds | ( | ( | ||||||||||||||||||||||||||||||||||||||||||
| Stock-based compensation expense | ( | |||||||||||||||||||||||||||||||||||||||||||
| Comprehensive income (loss): | ||||||||||||||||||||||||||||||||||||||||||||
| Net income | ||||||||||||||||||||||||||||||||||||||||||||
| Other comprehensive income (loss), net of tax | ( | ( | ||||||||||||||||||||||||||||||||||||||||||
| Comprehensive income | ||||||||||||||||||||||||||||||||||||||||||||
Dividends, $0.24 per share | ( | ( | ||||||||||||||||||||||||||||||||||||||||||
| Balance as of December 31, 2021 | ( | |||||||||||||||||||||||||||||||||||||||||||
| Repurchase of common stock | ( | ( | ||||||||||||||||||||||||||||||||||||||||||
| Transition effect of update in accounting standard | ( | ( | ||||||||||||||||||||||||||||||||||||||||||
| Stock-based compensation expense | ( | |||||||||||||||||||||||||||||||||||||||||||
| Comprehensive income (loss): | ||||||||||||||||||||||||||||||||||||||||||||
| Net income | ||||||||||||||||||||||||||||||||||||||||||||
| Other comprehensive income (loss), net of tax | ( | ( | ||||||||||||||||||||||||||||||||||||||||||
| Comprehensive income | ||||||||||||||||||||||||||||||||||||||||||||
| Dividends to noncontrolling interest | ( | ( | ||||||||||||||||||||||||||||||||||||||||||
Dividends, $ | ( | ( | ||||||||||||||||||||||||||||||||||||||||||
| Balance as of December 31, 2022 | ( | |||||||||||||||||||||||||||||||||||||||||||
| Capital contribution from noncontrolling interest | ||||||||||||||||||||||||||||||||||||||||||||
| Repurchase of common stock | ( | ( | ||||||||||||||||||||||||||||||||||||||||||
| Stock-based compensation expense | ( | |||||||||||||||||||||||||||||||||||||||||||
| Comprehensive income (loss): | ||||||||||||||||||||||||||||||||||||||||||||
| Net income | ||||||||||||||||||||||||||||||||||||||||||||
| Other comprehensive income (loss), net of tax | ||||||||||||||||||||||||||||||||||||||||||||
| Comprehensive income | ||||||||||||||||||||||||||||||||||||||||||||
| Dividends to noncontrolling interest | ( | ( | ||||||||||||||||||||||||||||||||||||||||||
Dividends, $0.24 per share | ( | ( | ||||||||||||||||||||||||||||||||||||||||||
| Balance as of December 31, 2023 | ( | |||||||||||||||||||||||||||||||||||||||||||
The accompanying notes are an integral part of these audited consolidated financial statements
F-6
STMicroelectronics N.V.
CONSOLIDATED STATEMENTS OF CASH FLOWS
| Twelve Months Ended | ||||||||||||||||||||
| December 31, | December 31, | December 31, | ||||||||||||||||||
| In million of U.S. dollars | 2023 | 2022 | 2021 | |||||||||||||||||
| Cash flows from operating activities: | ||||||||||||||||||||
| Net income | ||||||||||||||||||||
| Items to reconcile net income and cash flows from operating activities: | ||||||||||||||||||||
| Depreciation and amortization | ||||||||||||||||||||
| Interest and amortization of issuance costs on convertible bonds | ||||||||||||||||||||
| Interest on settled convertible bonds | ( | |||||||||||||||||||
| Loss on financial instruments, net | ||||||||||||||||||||
| Non-cash stock-based compensation | ||||||||||||||||||||
| Other non-cash items | ( | ( | ( | |||||||||||||||||
| Deferred income tax | ||||||||||||||||||||
| Impairment, restructuring charges and other related closure costs, net of cash payments | ||||||||||||||||||||
| Changes in assets and liabilities: | ||||||||||||||||||||
| Trade receivables, net | ( | ( | ||||||||||||||||||
| Inventories | ( | ( | ( | |||||||||||||||||
| Trade payables | ( | |||||||||||||||||||
| Other assets and liabilities, net | ||||||||||||||||||||
| Net cash from operating activities | ||||||||||||||||||||
| Cash flows used in investing activities: | ||||||||||||||||||||
| Payment for purchase of tangible assets | ( | ( | ( | |||||||||||||||||
| Proceeds from capital grants and other contributions | ||||||||||||||||||||
| Proceeds from sale of tangible assets | ||||||||||||||||||||
| Payment for purchase of marketable securities | ( | ( | ||||||||||||||||||
| Proceeds from matured marketable securities | ||||||||||||||||||||
| Net proceeds from (investment in) short-term deposits | ( | ( | ||||||||||||||||||
| Payment for purchase of intangible assets | ( | ( | ( | |||||||||||||||||
| Payment for purchase of financial assets | ( | ( | ||||||||||||||||||
| Proceeds from sale of financial assets | ||||||||||||||||||||
| Net cash used in investing activities | ( | ( | ( | |||||||||||||||||
| Cash flows from (used in) financing activities: | ||||||||||||||||||||
| Proceeds from long-term debt | ||||||||||||||||||||
| Repayment of issued convertible bonds | ( | |||||||||||||||||||
| Repayment of long-term debt | ( | ( | ( | |||||||||||||||||
| Repurchase of common stock | ( | ( | ( | |||||||||||||||||
| Dividends paid to stockholders | ( | ( | ( | |||||||||||||||||
| Dividends paid to noncontrolling interest | ( | ( | ( | |||||||||||||||||
| Proceeds from noncontrolling interest | ||||||||||||||||||||
| Proceeds from advances on capital grants | ||||||||||||||||||||
| Payment for withholding tax on vested shares | ( | ( | ( | |||||||||||||||||
| Payment for deferred consideration on business acquisitions | ( | |||||||||||||||||||
| Other financing activities | ( | |||||||||||||||||||
| Net cash used in financing activities | ( | ( | ( | |||||||||||||||||
| Effect of changes in exchange rates | ( | ( | ||||||||||||||||||
| Net cash increase (decrease) | ( | |||||||||||||||||||
| Cash and cash equivalents at beginning of the period | ||||||||||||||||||||
| Cash and cash equivalents at end of the period | ||||||||||||||||||||
| Supplemental cash information: | ||||||||||||||||||||
| Interest paid | ||||||||||||||||||||
| Income tax paid | ||||||||||||||||||||
The accompanying notes are an integral part of these audited consolidated financial statements | ||||||||||||||||||||
F-7
NOTES TO CONSOLIDATED FINANCIAL STATEMENTS
(In millions of U.S. dollars, except share and per-share amounts)
1.THE COMPANY
STMicroelectronics N.V. (the “Company”) is registered in the Netherlands with its corporate legal seat in Amsterdam, the Netherlands, and its corporate headquarters located in Geneva, Switzerland.
2. ACCOUNTING POLICIES
The accounting policies of the Company conform to accounting principles generally accepted in the United States of America (“U.S. GAAP”). All balances and values in the current and prior periods are in millions of U.S. dollars, except share and per-share amounts. Under Article 35 of the Company’s Articles of Association, the financial year extends from January 1 to December 31, which is the period-end of each fiscal year.
2.1 Basis of presentation and consolidation
The Company's consolidated financial statements include the assets, liabilities, results of operations and cash flows of its wholly-owned and majority-owned subsidiaries, after elimination of intercompany transactions and balances. Subsidiaries are fully consolidated from the date on which control is transferred to the Company. They are deconsolidated from the date that control ceases.
The Company assesses each investment in equity securities to determine whether the investee is a Variable Interest Entity (“VIE”). The Company consolidates the VIEs for which the Company is determined to be the primary beneficiary. The primary beneficiary of a VIE is the party that: (i) has the power to direct the most significant activities of the VIE and (ii) is obligated to absorb losses or has the rights to receive returns that would be considered significant to the VIE.
2.2 Use of estimates
The preparation of consolidated financial statements in accordance with U.S. GAAP requires management to make estimates and assumptions. The primary areas that require significant estimates and judgments by management include, but are not limited to:
•sales allowances for discounts, price protection, product returns and other rebates,
•inventory obsolescence reserves and normal manufacturing capacity thresholds to determine costs capitalized in inventory,
•recognition and measurement of loss contingencies,
•valuation at fair value of assets acquired and liabilities assumed on business acquisitions, and measurement of any contingent consideration,
F-8
•annual and trigger-based impairment review of goodwill and intangible assets, as well as the assessment of events which could trigger impairment testing on tangible assets,
•assessment of the Company’s long-lived assets economic useful lives,
•assumptions used in measuring expected credit losses and impairment charges on financial assets,
•assumptions used in assessing the number of awards expected to vest on stock-based compensation plans,
•assumptions used in calculating net defined pension benefit obligations and other long-term employee benefits,
•determination of the amount of tax expected to be paid and tax benefit expected to be received, including deferred income tax assets, valuation allowance and provisions for uncertain tax positions and claims.
2.3 Foreign currency
The U.S. dollar is the reporting currency of the Company. The U.S. dollar is the currency of the primary economic environment in which the Company operates since the worldwide semiconductor industry uses the U.S. dollar as a currency of reference for actual pricing in the market. Furthermore, the majority of the Company’s transactions are denominated in U.S. dollars, and revenues from external sales in U.S. dollars largely exceed revenues in any other currency. However, certain significant costs are incurred in the countries of the Eurozone and other non-U.S. dollar currency areas.
The functional currency of each subsidiary of the Company is either the local currency or the U.S. dollar, depending on the basis of the economic environment in which each subsidiary operates. Foreign currency transactions, including operations in local currency when the U.S. dollar is the functional currency, are measured into the functional currency using the prevailing exchange rate. Foreign exchange gains and losses resulting from the re-measurement at reporting date of monetary assets and liabilities denominated in currencies other than the functional currency are recognized in the line “Other income and expenses, net” of the consolidated statements of income.
For consolidation purposes, the results and financial position of the subsidiaries whose functional currency is different from the U.S. dollar are translated into the reporting currency as follows:
(a)assets and liabilities for each consolidated balance sheet presented are translated into U.S. dollars using exchange rates at the balance sheet dates;
(b)income and expenses for each consolidated statement of income presented are translated into U.S dollars using the monthly exchange rates;
(c)the resulting exchange differences are reported as Currency Translation Adjustments (“CTA”), a component of “Other comprehensive income (loss)” in the consolidated statements of comprehensive income.
F-9
2.4 Cash and cash equivalents
Cash and cash equivalents include cash on hand, deposits held at call with external financial institutions and other short-term highly liquid investments with effective maturities of three months or less. They are both readily convertible to known amounts of cash and so near their maturity that they present insignificant risk of changes in value because of changes in interest rates.
Short-term deposits representing cash equivalents with maturity beyond three months and below one year are reported as current assets in the line “Short-term deposits” of the consolidated balance sheets.
2.5 Trade accounts receivable
Trade accounts receivable are amounts due from customers for goods sold and services rendered to third parties in the ordinary course of business. The Company uses a lifetime expected losses allowance for all trade receivables. The allowance includes reasonable assumptions about future credit trends. The historical loss rates are adjusted to reflect current and forward-looking information on macro-economic factors affecting the ability of the Company’s customers to settle the receivables. Adjustments to the expected credit losses allowance are reported on the line “Selling, general and administrative expenses” in the consolidated statements of income and write-offs, if any, are recorded against the expected credit losses allowance.
In the event of transfers of receivables such as factoring, the Company derecognizes the receivables only to the extent that the Company has surrendered control over the receivables in exchange for a consideration other than beneficial interest in the transferred receivables.
2.6 Inventories
Inventories are stated at the lower of cost and net realizable value. Actual cost is based on an adjusted standard cost, which approximates cost on a first-in, first-out basis for all categories of inventory (raw materials, work-in-process, finished products). Actual cost is therefore dependent on the Company’s manufacturing performance and is based on the normal utilization of its production capacity. In case of underutilization of manufacturing facilities, the costs associated with unused capacity are not included in the valuation of inventories but charged directly to cost of sales. Net realizable value is based upon the estimated selling prices in the ordinary course of business, less reasonably predictable costs of completion, disposal and transportation.
2.7 Income taxes
Income tax for the period comprises current and deferred income tax. Income tax expense represents the income tax expected to be paid related to the current year taxable profit in each tax jurisdiction. Deferred income tax is recognized for all temporary differences arising between the tax bases of assets and liabilities and their carrying amount in the consolidated financial statements. Deferred tax assets are also recognized on temporary differences arising from tax losses carried forward and tax credits. Deferred tax liabilities are not recognized on the initial recognition of goodwill as a result of a business combination. Deferred income tax is determined using tax rates and laws that are enacted at the balance sheet date and are expected to apply when the related deferred income tax asset is realized or the deferred income tax liability is settled. The effect on deferred tax assets and liabilities from changes in tax laws and tax rates is recognized on the line “Income tax expense” in the consolidated statements of income in the period in which the law is enacted. Deferred income tax assets are recognized in full but the Company assesses whether future taxable profit will be available against which temporary differences can be utilized. A valuation allowance is provided for deferred tax assets when management considers it is more likely than not that they will not be realized.
The Company recognizes a deferred tax liability on undistributed earnings of subsidiaries when there is a presumption that taxable earnings will be remitted to the parent. A deferred tax asset is recognized on
F-10
compensation for the grant of stock awards to the extent that such charge constitutes a temporary difference in the subsidiaries’ local tax jurisdictions. Changes in the stock price do not result in any adjustments to the deferred tax asset prior to vesting.
At each reporting date, the Company assesses all significant income tax positions in all tax jurisdictions to determine any uncertain tax positions. The Company uses a two-step process for the evaluation of uncertain tax positions. The first step consists in assessing whether the tax benefit must be recognized. The second step consists in measuring the amount of tax benefit to be recognized on each uncertain tax position. In step 1 (recognition), the Company assesses whether a tax position, based solely on its technical merits, is more likely than not to be sustained upon examination. Only tax positions with a sustainability threshold higher than 50 % are recognized. In Step 2 (measurement), the Company determines the amount of recognizable tax benefit. The measurement methodology is based on a “cumulative probability” approach, resulting in the recognition of the largest amount that is greater than 50 % likely of being realized upon settlement with the taxing authority. The Company accrues for interest and penalties on uncertain tax liabilities reported on the consolidated balance sheets. Interests and penalties are classified as components of income tax expense in the consolidated statements of income.
2.8 Business combinations and goodwill
The acquisition method of accounting is applied to all business combinations. The identifiable assets acquired, liabilities assumed, and equity instruments issued are measured at acquisition date fair value. Any contingent consideration is recorded at acquisition date fair value and remeasured at each reporting date. Acquisition-related transaction costs and restructuring costs related to the acquired business are expensed as incurred. Acquired in-process research and development (“IPR&D”) is capitalized and recorded as an intangible asset at acquisition date, subject to impairment testing until the research or development is completed. The excess of the consideration transferred over the acquisition-date fair value of the identifiable assets acquired and liabilities assumed, net of related deferred tax impacts, is recorded as goodwill. In case of a bargain purchase, the Company reassesses whether it has correctly identified all of the assets acquired and all of the liabilities assumed, the noncontrolling interest in the acquiree, if any, the Company’s previously held equity interest in the acquiree, if any, and the consideration transferred. If after this review, a bargain purchase is still indicated, it is recognized in earnings attributable to parent company stockholders. The purchase of additional interests in a partially owned subsidiary is treated as an equity transaction as well as all transactions concerning the sale of subsidiary stock or the issuance of stock by the partially owned subsidiary, assuming there is no change in control of the subsidiary. In the case of a sale of subsidiary shares, whereby the Company no longer maintains control of the subsidiary, the Company recognizes a gain or loss in earnings.
Goodwill is carried at cost less accumulated impairment losses, if any. Goodwill is not amortized but is tested for impairment at least annually, and more frequently whenever events or changes in circumstances indicate that the carrying amount of goodwill may not be recoverable. Goodwill subject to potential impairment is tested at the reporting unit level. The impairment test determines whether the fair value of each reporting unit under which goodwill is allocated is lower than the total carrying amount of relevant net assets allocated to such reporting unit, including its allocated goodwill. The Company records an impairment loss on goodwill when a reporting unit’s carrying value exceeds its fair value. Significant management judgments and estimates are used in forecasting the future discounted cash flows associated with the reporting unit, including: the applicable industry’s sales volume forecast and selling price evolution, the reporting unit’s market penetration and its revenues evolution, the market acceptance of certain new technologies and products, the relevant cost structure, the discount rates applied using a weighted average cost of capital and the perpetuity rates used in calculating cash flow terminal values.
2.9 Intangible assets with definite useful lives
Intangible assets subject to amortization include intangible assets purchased from third parties recorded at cost and intangible assets acquired in business combinations initially recorded at fair value. Amortization begins when the intangible asset is available for its intended use. Amortization reflects the pattern in which the asset’s economic benefits are consumed, which usually consists in applying the straight-line method to allocate the cost of the intangible assets over their estimated useful lives.
The carrying value of intangible assets with definite useful lives is evaluated whenever changes in circumstances indicate that the carrying amount may not be recoverable. An impairment loss is recognized for
F-11
the amount by which the asset’s carrying amount exceeds its fair value. The Company evaluates the remaining useful life of an intangible asset at each reporting date to determine whether events and circumstances warrant a revision to the remaining period of amortization.
Technologies and licenses
Separately acquired technologies and licenses are recorded at historical cost. Technologies and licenses acquired in a business combination are initially recognized at acquisition date fair value. Technologies and licenses have a useful life which usually ranges from 3 to 11 years and are carried at cost less accumulated amortization and impairment losses, if any.
Computer software
Separately acquired computer software is recorded at historical cost. Costs associated with maintaining computer software programs are expensed as incurred and reported as “Cost of sales”, “Selling, general and administrative expenses”, or “Research and development expenses” in the consolidated statements of income according to their intended use. The capitalization of costs for internally generated software developed by the Company for its internal use begins when the preliminary project stage is completed and when the Company, implicitly or explicitly, authorizes and commits to funding a computer software project. It must be probable that the project will be completed and will be used to perform the function intended. Amortization of computer software begins when the software is available for its intended use and is calculated using the straight-line method over the estimated useful life, which does not exceed 4 years.
2.10 Property, plant and equipment
Property, plant and equipment are stated at historical cost, net of accumulated depreciation and any impairment losses. Property, plant and equipment acquired in a business combination are initially recognized at acquisition date fair value. Major additions and improvements are capitalized, while minor replacements and repairs are expensed and reported as “Cost of sales”, “Selling, general and administrative expenses”, or “Research and development expenses” in the consolidated statements of income according to their intended use.
Land is not depreciated. Depreciation on fixed assets is computed using the straight-line method over their estimated useful lives, as follows:
| Buildings | ||||||||
| Facilities and leasehold improvements | ||||||||
| Machinery and equipment | ||||||||
| Computer and R&D equipment | ||||||||
| Other | ||||||||
The Company also evaluates, and adjusts if appropriate, the assets’ useful lives.
Property, plant and equipment are periodically reviewed for impairment whenever events or changes in circumstances indicate that the carrying amount of an asset or a group of assets may not be recoverable. Several impairment indicators exist for making this assessment, such as: restructuring plans, significant changes in the technology, market, economic or legal environment in which the Company operates, available evidence of obsolescence of the asset, or indication that its economic performance is, or will be, worse than expected. In determining the recoverability of assets to be held and used, the Company initially assesses whether the carrying value of the tangible assets or group of assets exceeds the undiscounted cash flows associated with these assets. If exceeded, the Company then evaluates whether an impairment charge is required by determining if the asset’s carrying value also exceeds its fair value. This fair value is normally estimated by the Company based on independent market appraisals or the sum of discounted future cash flows, using market assumptions such as the utilization of the Company’s fabrication facilities and the ability to upgrade such facilities, change in the selling price and the adoption of new technologies. Any impairment loss is reported on the same income statement line as the depreciation expense recorded on the impaired group of assets, except in case of closure of operating sites or major restructuring plans and reorganizations. In such case, any impairment loss is reported on the line “Impairment, restructuring charges and other related closure costs” in the consolidated statements of income.
F-12
Gains and losses on disposals are determined by comparing the proceeds with the carrying amount and are included in “Other income and expenses, net” in the consolidated statements of income.
The Company did not
2.11 Leases
A lease contract is a contract, or part of a contract, that conveys the right to control the use of an identified asset for a period of time in exchange for consideration. If a lease is identified, classification between finance or operating is determined at lease commencement. Most leases entered by the Company are operating leases. Operating lease liabilities are recognized at the present value of the future lease payments at the lease commencement date. The rate implicit in the lease should be used as a discount rate whenever that rate is readily determinable. In most cases, this rate is not readily determinable and therefore, the Company uses its incremental borrowing rate, which is derived from information available at the lease commencement date. The Company considers its recent debt issuances as well as publicly available data for instruments with similar characteristics when calculating its incremental borrowing rates. Operating lease right-of-use assets are based on the corresponding lease liability adjusted for any lease payments made at or before commencement, initial direct costs, and lease incentives.
Right-of-use assets are included in the line “Property, plant and equipment, net” of the consolidated balance sheets. Operating lease liabilities due within one year are included in the line “Other payables and accrued liabilities”, while non-current operating lease liabilities are included in the line “Other long-term liabilities” of the Company’s consolidated balance sheets. Operating lease expenses are recognized in the consolidated statements of income, on a straight-line basis since the lease commencement date over the lease period and reported as “Cost of sales”, “Selling, general and administrative expenses”, or “Research and development expenses”, according to the intended use of the leased asset.
Finance lease liabilities due within one year are included in the line “Short-term debt”, while non-current finance lease liabilities are included in the line “Long-term debt” of the Company’s consolidated balance sheets. Right-of-use assets for finance leases are depreciated on a straight-line basis since the lease commencement date over the lease period or the estimated useful life of the leased asset in case of transfer of ownership or purchase option that is reasonably certain to be exercised. The depreciation expense is reported as “Cost of sales”, “Selling, general and administrative expenses”, or “Research and development expenses”, according to the intended use of the leased asset.
Certain lease contracts contain options to extend the lease. On these contracts, the Company estimates the lease term by including the extended duration when it is reasonably certain for the Company to exercise that option. In addition, for short-term leases, defined as leases with a term of twelve months or less, the Company elected the practical expedient to not recognize an associated lease liability and right-of-use asset. The short-term lease election is made at the commencement date only. Additionally, lease contracts with a sum of lease payments not exceeding $5,000 are excluded from recognition on the consolidated balance sheet.
The right-of-use asset is a non-monetary asset while the lease liability is a monetary liability. When accounting for a lease that is denominated in a foreign currency, the lease liability is remeasured using the current exchange rate, while the right-of-use asset is measured using the historical exchange rate as of the commencement date.
The Company does not separate lease and non-lease components and instead accounts for each separate lease component and the non-lease components associated with that lease component as a single lease component.
Variable lease payments that depend on an index or a rate are included in the lease payments and are measured using the prevailing index or rate at the measurement date. Changes to index and rate-based variable lease payments are recognized in earnings in the period of the change.
2.12 Loss contingencies
In determining loss contingencies, the Company considers the likelihood of the incurrence of a liability as well as the ability to reasonably estimate the amount of such loss or liability. An estimated loss from a loss contingency is accrued when information available indicates that it is probable that a liability has been incurred at the date of the consolidated financial statements and when the amount of the loss can be reasonably estimated.
F-13
2.13 Long-term debt
(a)Convertible debt
On January 1, 2022, the Company adopted the new guidance on distinguishing liabilities from equity by applying the modified retrospective approach, with the impact upon transition recorded in retained earnings for instruments outstanding as of the date of adoption of the new guidance. Prior to the new guidance, components of convertible debt instruments that may be settled in cash upon conversion based on a net-share settlement basis were accounted for separately as long-term debt and equity when the conversion feature of the convertible bonds constituted an embedded equity instrument. When an equity instrument was identified, proceeds from issuance were allocated between debt and equity by measuring first the liability component and then determining the equity component as a residual amount. The liability component was measured as the fair value of a similar non-convertible debt, which resulted in the recognition of a debt discount. In subsequent periods, the Company amortized the debt discount through earnings in the line “Interest income (expense), net” of the consolidated statements of income, using the effective interest method, based on the contractual maturity of the debt. The equity component, reported on the line “Additional paid-in capital” of the consolidated statement of equity, was not remeasured. Deferred taxes were recognized on the difference between the carrying amount of the liability component and its tax basis. In case of conversion from the bondholders, the fair value of the consideration transferred was allocated between the liability component and the equity component. The difference between the carrying amount of the debt at the settlement date and the fair value of the debt component was recorded in earnings as a loss on debt extinguishment and reported in the line “Loss on financial instruments, net” of the consolidated statements of income. The liability component was measured as the fair value of a similar non-convertible debt prior to settlement. The reacquired equity component was recorded in equity and reported on the line “Additional paid-in capital” of the consolidated statement of equity.
The new accounting guidance adopted on January 1, 2022 has eliminated the cash conversion model described above. At initial recognition, total cash proceeds received at issuance are reported as financial debt and no equity conversion instrument is recorded separately in equity. On subsequent periods, the carrying value of the convertible debt is incremented up to its nominal value over the amortization pattern of any unamortized debt discount and issuance costs.
Debt issuance costs are reported as a deduction of debt. They are subsequently amortized through earnings on the line “Interest income (expense), net” of the consolidated statements of income, using the effective interest rate method.
(b)Bank loans
Bank loans and non-convertible senior bonds are recognized at the amount of cash proceeds received, net of debt issuance costs incurred. They are subsequently reported at amortized cost; any difference between the proceeds (net of debt issuance costs) and the principal amount is recognized through earnings on the line “Interest income (expense), net” of the consolidated statements of income over the period of the borrowings using the effective interest method.
2.14 Employee benefits
(a) Pension obligations
The Company sponsors various pension schemes for its employees. These schemes conform to local regulations and practices in the countries in which the Company operates. Such plans include both defined benefit and defined contribution plans. For defined benefit pension plans, the liability recognized in the consolidated balance sheets is the present value of the defined benefit obligation at the balance sheet date less the fair value of plan assets. The funded status of the defined benefit plans is calculated as the difference between plan assets and the projected benefit obligations. Estimates are used in determining the assumptions incorporated in the calculation of the pension obligations, which is supported by input from independent actuaries. Actuarial gains and losses arising from changes in actuarial assumptions are recognized in “Accumulated other comprehensive income (loss)” in the consolidated statements of equity and are charged or credited to earnings over the employees’ average remaining service period using the corridor amortization method. Past service costs are recognized in earnings on the line “Other components of pension benefit costs” of the consolidated statements of income if the changes to the pension scheme are not conditional on the employees remaining in service for a specified period. Other past service costs are recognized in “Accumulated other comprehensive income (loss)”
F-14
in the consolidated statements of equity and are amortized on a straight-line basis over the average remaining service period. The net periodic benefit cost of the year is determined based on the assumptions used at the end of the previous year.
The service cost component of net periodic benefit costs is presented in the same income statement line as other employee compensation costs arising from services rendered during the period. The other components of the net periodic benefit cost are presented separately, outside operating income, on the line “Other components of pension benefit costs” of the consolidated statements of income. These elements include: interest cost; expected return on plan assets; amortization of transition (asset) obligation; amortization of prior service cost; amortization of net (gain) loss; (gain) loss recognized due to curtailment or settlement and; cost of special termination benefits.
For defined contribution pension plans, the Company pays contributions to publicly or privately administered pension insurance plans on a mandatory, contractual or voluntary basis. The Company has no further payment obligations once the contributions have been paid. The contributions are recognized as employee benefit expense when they are due. Prepaid contributions are recognized as an asset to the extent that a cash refund or a reduction in the future payments is available.
(b) Termination benefits
Termination benefits are payable when an employee is involuntarily terminated, or whenever an employee accepts voluntary termination in exchange for termination benefits. For the accounting treatment and timing of recognition of involuntary termination benefits, the Company distinguishes between one-time termination benefit arrangements and ongoing termination benefit arrangements. A one-time termination benefit arrangement is established by a termination plan and applies to a specified termination event. One-time involuntary termination benefits are recognized as a liability when the termination plan meets certain criteria and has been communicated to employees. If employees are required to render future service in order to receive these one-time termination benefits, the liability is recognized ratably over the future service period. Termination benefits other than one-time termination benefits are termination benefits for which the communication criterion is not met but that are committed to by management, or termination obligations that are not specifically determined in a new and single plan. These termination benefits are all legal, contractual and past practice termination obligations to be paid to employees in case of involuntary termination. These termination benefits are accrued for when commitment creates a present obligation to others for the benefits expected to be paid, when it is probable that employees will be entitled to the benefits and the amount can be reasonably estimated.
In case of special termination benefits related to voluntary redundancy programs, the Company recognizes a provision for voluntary termination benefits at the date on which the employee irrevocably accepts the offer and the amount can be reasonably estimated.
(c) Profit-sharing and bonus plans
The Company recognizes a liability and an expense for bonuses and profit-sharing plans when a contractual obligation exists or when there is a past practice that has created a present obligation.
(d) Other long-term employee benefits
The Company provides long-term employee benefits such as seniority awards in certain countries. The entitlement to these benefits is usually conditional on the employee completing a minimum service period. The expected costs of these benefits are accrued over the period of employment. Actuarial gains and losses arising from changes in actuarial assumptions are charged or credited to earnings in the period of the revised estimate. These obligations are valued annually with the assistance of independent qualified actuaries.
(e) Share-based compensation
The Company accounts for stock-based compensation for all stock-based awards granted to senior executives and selected employees, including awards that vest upon the satisfaction of a service condition and awards that vest upon the satisfaction of both a service condition and a performance condition. Both equity awards vest over
F-15
a three-year service period while performance-based awards also require the Company’s attainment of certain performance conditions. The Company measures the cost of the awards based on the related grant-date fair value, reflecting the market price of the underlying shares at the date of the grant, reduced by the present value of the dividends expected to be paid during the requisite service period. That cost is recognized ratably over the period during which an employee is required to provide service in exchange for the award. The compensation cost is recorded through earnings with the corresponding amount reported in equity, under “Additional paid-in capital” of the consolidated statements of equity. The compensation cost is calculated based on the number of awards expected to vest, net of an estimated number of awards to be forfeited due to the employees failing to satisfy the service condition or one or more performance conditions. By the end of the vesting period, compensation is recognized only for the awards that ultimately vest.
2.15 Share capital
Ordinary shares are classified as “Common stock” within equity on the consolidated balance sheets. Incremental costs directly attributable to the issuance of new shares are shown in equity as a deduction, net of tax, from the proceeds received.
Where the Company purchases its own equity share capital (treasury stock), the consideration paid, including any directly attributable incremental costs (net of income taxes), is deducted from parent company stockholders’ equity until the shares are cancelled, reissued, or disposed of.
2.16 Comprehensive income (loss)
Comprehensive income (loss) is defined as the change in equity of a business during a period except those changes resulting from investment by and distributions to stockholders. In the consolidated financial statements, “Other comprehensive income (loss)” and “Accumulated other comprehensive income” primarily consists of foreign currency translation adjustments, unrealized gains (losses) on debt securities classified as available-for-sale, unrealized gains (losses) on derivatives designated as cash flow hedge and the accounting for defined benefit plans, net of tax.
2.17 Revenue recognition
Arrangements with customers are considered contracts if all the following criteria are met: (a) parties have approved the contract and are committed to perform their respective obligations; (b) each party’s rights regarding the goods or services to be transferred can be identified; (c) payment terms for the goods or services to be transferred can be identified; (d) the contract has commercial substance and (e) collectability of substantially all of the consideration is probable. The Company recognizes revenue from products sold to a customer, including distributors, when it satisfies a performance obligation by transferring control over a product to the customer. The Company may also enter into several multi-annual capacity reservation and volume commitment arrangements with certain customers. These agreements constitute a binding commitment for the customers to purchase and for the Company to supply allocated commitment volumes in exchange for additional consideration. The consideration related to commitment fees is reported as revenues from sale of products as it is usually based on delivered quantities.
In certain circumstances, the Company may enter into agreements that concern principally revenues from services, where the performance obligation is satisfied over time. The objective when allocating the transaction price is to allocate the transaction price to each performance obligation (or distinct good or service) in an amount that depicts the amount of consideration to which the Company expects to be entitled in exchange for transferring the promised goods or services to the customer. The payment terms typically range between 30 to 90 days. Certain customers require the Company to hold inventory as consignment in their hubs and only purchase inventory when they require it. Revenue for sales of such inventory is recognized when, at the customer’s option, the products are withdrawn from the consignment and the Company satisfies a performance obligation by transferring control over a product to the customer.
F-16
Consistent with standard business practice in the semiconductor industry, price protection is granted to distribution customers on their existing inventory of the Company’s products to compensate them for changes in market prices. The Company accrues a provision for price protection based on a rolling historical price trend computed monthly as a percentage of gross distributor sales. This historical price trend represents differences in recent months between the invoiced price and the final price to the distributor, adjusted to accommodate a significant change in the selling price. The short outstanding inventory time, visibility into the inventory product pricing and long distributor pricing history have enabled the Company to reliably estimate price protection provisions at period-end. The Company records the accrued amounts as a deduction of “Net sales” in the consolidated statements of income at the time of the sale.
The Company’s customers occasionally return the Company’s products for technical reasons. The Company’s standard terms and conditions of sale provide that if the Company determines that products do not conform, the Company will repair or replace the non-conforming products, or issue a credit note or rebate of the purchase price. Quality returns are identified shortly after sale in customer quality control testing. The Company records the accrued amounts as a deduction of “Net sales” in the consolidated statements of income, using contractual and historical information.
The Company records a provision for warranty costs as a charge against “Cost of sales” in the consolidated statements of income, based on historical trends of warranty costs incurred as a percentage of sales, which management has determined to be a reasonable estimate of the probable losses to be incurred for warranty claims in a period. Any potential warranty claims are subject to the Company’s determination that the Company is at fault for damages, and such claims must usually be submitted within a short period of time following the date of sale. This warranty is given in lieu of all other warranties, conditions or terms expressed or implied by statute or common law. The Company’s contractual terms and conditions typically limit its liability to the sales value of the products which gave rise to the claims.
The Company’s insurance policy relating to product liability covers third-party physical damages and bodily injury, indirect financial damages as well as immaterial non-consequential damages caused by defective products.
2.18 Public funding
The Company receives funding from several governmental agencies and income is recognized when all contractual conditions for receipt of these funds are fulfilled and eligible expenditures incurred. Such funding is generally provided to encourage research, development and other innovation activities, industrialization deployment and local economic development. The conditions to receive government funding may include eligibility restrictions, approval by the local governmental authorities, annual budget appropriations, compliance with regulations, as well as specifications regarding objectives and results. Certain specific contracts include obligations to maintain a minimum level of employment and investment during a certain period. There could be penalties if these objectives are not fulfilled. Other contracts contain penalties for breach of contract, which may result in repayment obligations. Funding related to these contracts is recorded when the conditions required by the contracts are met. The Company’s funding programs are classified under two general categories: funding for research, development and other innovative activities, and capital investments.
Funding for research, development and innovative activities is the most common form of funding that the Company receives. This public funding is recorded as “Other income and expenses, net” in the consolidated statements of income. The funding is recognized ratably as the related costs are incurred once the agreement with the respective governmental agency has been signed and all applicable conditions are met. Other government assistance, such as funding received for industrialization deployment and local economic development in certain regions, are reported as a deduction of cost of sales or other operating expenses according to the nature of the underlying costs eligible to the grants.
French research tax credits (“Crédit Impôt Recherche”) and Italian research tax credits (“Credito d’Imposta Ricerca & Sviluppo”) are deemed to be grants in substance. The French research tax credits are to be paid in cash by the taxing authorities within three years in case they are not deducted from income tax payable during
F-17
this period of time. The Italian tax credits are compensated against payroll-related social charges. French and Italian tax credits are reported as a reduction of “Research and development expenses” in the consolidated statements of income.
Capital investment funding is recorded as a reduction of “Property, plant and equipment, net” on the consolidated balance sheets when the Company has incurred the eligible capital expenditures and when all conditions for eligibility have been fulfilled. Advances from capital grants received on capital investments that have not been incurred yet are reported as in the line "Other long-term liabilities" on the consolidated balance sheets. Capital investment funding is recognized in the Company’s consolidated statements of income by offsetting the depreciation charges of the funded assets during their useful lives. The Company also receives funding, which can be recovered through the reduction of various governmental liabilities, including income tax, value-added tax and employee-related social charges.
Funding receivables are reported as non-current assets unless cash settlement features of the receivables evidence that collection is expected within one year. Long-term receivables that do not present any tax attribute or legal restriction are reflected in the consolidated balance sheets at their net present value when the discounting effect is deemed to be significant.
2.19 Research and development
2.20 Advertising costs
2.21 Start-up and phase-out costs
2.22 Investments in equity securities
Investments in equity securities that have readily determinable fair values and for which the Company does not have the ability to exercise significant influence are classified as equity securities measured at fair value through earnings. Changes in the fair value of these securities are reported in the consolidated statements of income within “Other income and expenses, net” when these instruments are held within the Company’s operating activities. Gains and losses arising from changes in the fair value of securities not related to operating activities are presented in the consolidated statements of income as non-operating elements within “Gain (loss) on financial instruments, net” in the period in which they arise. The fair values of quoted equity securities are based on current market prices. If the market for a financial asset is not active or if no observable market price is obtainable, the Company measures fair value by using assumptions and estimates. In measuring fair value, the Company makes maximum use of market inputs and minimizes the use of unobservable inputs.
F-18
For investments in equity securities without readily determinable fair values and for which the Company does not have the ability to exercise significant influence, the Company has elected to apply the cost method as a measurement alternative. Under the cost method of accounting, investments are carried at historical cost, less impairment. An impairment loss is recorded when there are identified events or changes in circumstances that may have a significant adverse effect on the value of the investment. Loss is immediately recorded in the consolidated statements of income on the line “Gain (loss) on financial instruments, net” and is based on the Company’s assessment of any significant and sustained reductions in the investment’s value. Gains and losses on investments sold are determined on the specific identification method and are recorded as non-operating element in the line “Gain (loss) on financial instruments, net” of the consolidated statements of income when the transaction is not related to operating activities.
The Company did not hold any material equity securities as of December 31, 2023 and December 31, 2022.
2.23 Investments in debt securities
Debt securities are included in current assets when they represent investments of funds available for current operations.
Changes in fair value of debt securities classified as available-for-sale are recognized as a component of “Other comprehensive income (loss)” in the consolidated statements of comprehensive income. The Company assesses at each balance sheet date whether there is objective evidence that a debt security or group of debt securities is impaired. An unrealized impairment loss exists when the fair value of the instrument declines below its amortized cost basis. An impairment loss is recognized in earnings, through a direct reduction of the value of the asset, when the Company intends to sell the debt security or when it is more likely than not that the Company will be required to sell the instrument before recovery of the amortized cost basis. Moreover, an impairment loss is recognized in earnings through a credit loss allowance for any portion of the unrealized impairment loss resulting from a credit loss. Impairment losses recognized in the consolidated statements of income are not reversed through earnings.
The fair values of quoted debt securities are based on current market prices. If the market for a financial asset is not active and if no observable market price is obtainable, the Company measures fair value by using assumptions and estimates. In measuring fair value, the Company makes maximum use of market inputs and minimizes the use of unobservable inputs.
The Company did not hold any debt securities classified as held-to-maturity or for which the Company would have elected to apply the fair value option.
2.24 Derivative financial instruments and hedging activities
Derivative financial instruments are initially recognized on the date a derivative contract is entered into and are subsequently measured at fair value. The method of recognizing the gain or loss resulting from the derivative instrument depends on whether the derivative is designated as a hedging instrument, and if so, the nature of the hedge transaction. The Company has designated certain derivatives as hedges of a particular risk associated with a highly probable forecasted transaction (cash flow hedge).
The Company documents, at inception of the transaction, the relationship between hedging instruments and hedged items, as well as its risk management objectives and strategy for undertaking various hedging transactions. The Company also documents its assessment, both at hedge inception and on an ongoing basis, of whether the derivatives that are used in hedging transactions are highly effective in offsetting changes in cash flows of hedged items. Derivative instruments that are not designated as hedges are measured at fair value through earnings.
Cash Flow Hedge
As part of its ongoing operating, investing and financing activities, the Company enters into certain derivative transactions that may be designated and may qualify as hedging instruments. To reduce its exposure to U.S. dollar exchange rate fluctuations, the Company hedges certain Euro-denominated forecasted transactions that cover at reporting date a large part of its research and development, and selling, general and administrative expenses as well as a portion of its front-end manufacturing costs of semi-finished goods within cost of sales
F-19
through the use of currency forward contracts and currency options, including collars. The Company also hedges through the use of currency forward contracts certain Singapore dollar-denominated manufacturing forecasted transactions.
The derivative instruments are designated and qualify for cash flow hedge at inception of the contract and on an ongoing basis over the duration of the hedge relationship. They are reflected at their fair value as “Other current assets” or “Other payables and accrued liabilities” in the consolidated balance sheets when settlement is expected to occur within twelve months after the reporting date. They are reported as "Other non-current assets" or "Other long-term liabilities" in the consolidated balance sheets when settlement is expected beyond twelve months. The criteria for designating a derivative as a hedge include the instrument’s effectiveness in risk reduction and matching of the derivative instrument to its underlying transactions with the critical terms of the hedging instrument matching the terms of the hedged forecasted transaction. This enables the Company to conclude that changes in cash flows attributable to the risk being hedged are expected to be substantially offset by the hedging instruments.
For derivative instruments designated as cash flow hedge, the change in fair value for the effective portion of the hedge is reported as a component of “Other comprehensive income (loss)” in the consolidated statements of comprehensive income and is reclassified into earnings in the same period in which the hedged transaction affects earnings, and within the same consolidated statements of income line as the hedged transaction. For these derivatives, ineffectiveness appears if the cumulative gain or loss on the derivative hedging instrument exceeds the cumulative change in the expected future cash flows on the hedged transaction. Effectiveness on transactions hedged through purchased options is measured on the full fair value of the option, including time value.
Derivative financial instruments not designated as a hedge
The Company conducts its business on a global basis in various major international currencies. As a result, the Company is exposed to adverse movements in foreign currency exchange rates. The Company enters into foreign currency forward contracts and currency options to reduce its exposure to changes in exchange rates and the associated risk arising from the denomination of certain assets and liabilities in foreign currencies at the Company's subsidiaries.
2.25 Recent accounting pronouncements
(a)Accounting pronouncements effective in 2023
No new guidance was adopted in 2023 with a significant impact on the Company's financial statements, financial positions and operations.
(b)Accounting pronouncements expected to impact the Company’s operations that are not yet effective and have not been early adopted by the Company
In November 2023, the FASB issued new guidance related to segment reporting, which requires incremental disclosures about reportable segments, without changing though the definition of a segment or the guidance for determining reportable segments. The new guidance requires disclosures of significant segment expenses that are (i) regularly provided to (or easily computed from information regularly provided to) the chief operating decision maker ("CODM"); (ii) included in the reported measure of segment profit or loss. The new guidance also requires that an entity discloses, on an annual and interim basis, an amount for "other segment items" by reportable segment, and a description of its composition. Moreover, annual disclosures about a reportable segment's profit or loss and assets become mandatory on interim periods. Finally, the title and position of the CODM, together with an explanation of how the CODM uses the reported measures of segment profit or loss in assessing segment performance and deciding how to allocate resources, are also required. The guidance is effective for the Company's 2024 annual reporting and 2025 interim periods. The guidance will be applied retrospectively, with early adoption permitted. The Company will adopt the new guidance when effective and is currently assessing the impact the new guidance will have on its segment reporting.
F-20
3. SHORT-TERM DEPOSITS AND MARKETABLE SECURITIES
To optimize the return yield on its short-term investments, the Company invested $1,226 million of available cash in short-term deposits as of December 31, 2023, compared to $581 million as of December 31, 2022.
The Company also invested available liquidity in marketable securities. Changes in the fair value of marketable securities are detailed in the tables below:
| December 31, 2022 | Purchase | Accretion | Proceeds at maturity | Change in fair value included in OCI* | December 31, 2023 | |||||||||||||||||||||||||||||||||
| U.S. Treasury debt securities | ( | |||||||||||||||||||||||||||||||||||||
| Total | ( | |||||||||||||||||||||||||||||||||||||
* Other Comprehensive Income
| December 31, 2021 | Purchase | Accretion | Proceeds at maturity | Change in fair value included in OCI* | December 31, 2022 | |||||||||||||||||||||||||||||||||
| U.S. Treasury debt securities | ( | |||||||||||||||||||||||||||||||||||||
| Total | ( | |||||||||||||||||||||||||||||||||||||
* Other Comprehensive Income
In 2023, the Company invested $1,653 million available cash in U.S. Treasury bonds. The debt securities have an average rating of Aaa/AA+/AA+ from Moody’s, S&P and Fitch, respectively, with a weighted average maturity of 1.6 years. The debt securities are reported as current assets on the line “Marketable securities” on the consolidated balance sheet, since they represent investments of funds available for current operations. The Company does not intend to sell the investments and it is not more likely than not that the Company will be required to sell the investments before recovery of the amortized cost basis. The bonds are classified as available-for-sale financial assets and recorded at fair value as of December 31, 2023. The fair value measurement corresponds to a Level 1 fair value hierarchy measurement. The aggregate amortized cost basis of these securities totaled $1,645 million as of December 31, 2023.
Marketable securities totaling $750 million at principal amount were transferred to financial institutions as part of short-term securities lending transactions, in compliance with corporate policies. The Company, acting as the securities lender, does not hold any collateral in this unsecured securities lending transaction. The Company retains effective control on the transferred securities.
As of December 31, 2022, the Company held $679 million in marketable securities classified as available-for-sale debt securities.
F-21
The below table details debt securities that were in an unrealized loss position as of December 31, 2023:
| December 31, 2023 | ||||||||||||||||||||
| Less than 12 months | More than 12 months | Total | ||||||||||||||||||
| Description | Fair Value | Unrealized Losses | Fair Value | Unrealized Losses | Fair Value | Unrealized Losses | ||||||||||||||
| U.S. Treasury Bonds | ( | ( | ( | |||||||||||||||||
| Total | ( | ( | ( | |||||||||||||||||
Debt securities that were in an unrealized gain position as of December 31, 2023, were reported at a fair value of $1,049 million with an unrealized gain of $4 million.
The Company did not report any debt securities that were in an unrealized loss position for more than one year as of December 31, 2022.
4. TRADE ACCOUNTS RECEIVABLE, NET
Trade accounts receivable, net consist of the following:
| December 31, | December 31, | |||||||||||||
| 2023 | 2022 | |||||||||||||
| Trade accounts receivable | ||||||||||||||
| Current expected credit losses allowance ("CECLA") | ( | ( | ||||||||||||
| Total | ||||||||||||||
The Company uses a lifetime expected losses allowance for all trade receivables based on failure rates, as applied to the gross amounts of trade accounts receivable. The allowance also includes reasonable assumptions about future credit trends. The historical loss rates are adjusted to reflect current and forward-looking information on macro-economic factors affecting the ability of the Company’s customers to settle the receivables. In addition to the factors already embedded in the failure rates, as applied on trade accounts receivable, the Company has identified cyclicality and uncertainties around continued growth for the semiconductor industry and its serviceable available market to be the most relevant factors. These macro-economic factors are weighted into different economic scenarios, in line with estimates and methodologies applied by other business entities, including financial institutions.
On that basis, the changes in reported CECLA for the year ended December 31, 2023 are presented below:
| CECLA As of December 31, 2022 | ( | |||||||
| Current-period adjustment to CECLA | ||||||||
| CECLA As of December 31, 2023 | ( | |||||||
Adjustments to the expected credit losses allowance are reported in the line “Selling, general and administrative expenses” in the consolidated statements of income.
F-22
5. INVENTORIES
Inventories consist of the following:
| December 31, | December 31, | |||||||||||||
| 2023 | 2022 | |||||||||||||
| Raw materials | ||||||||||||||
| Work-in-process | ||||||||||||||
| Finished products | ||||||||||||||
| Total | ||||||||||||||
6. OTHER CURRENT ASSETS
Other current assets are detailed below:
| December 31, 2023 | December 31, 2022 | |||||||||||||
| Public funding receivables | ||||||||||||||
| Taxes and other government receivables | ||||||||||||||
| Advances and prepayments | ||||||||||||||
| Loans and deposits | ||||||||||||||
| Interest receivable | ||||||||||||||
| Derivative instruments | ||||||||||||||
| Other current assets | ||||||||||||||
| Total | ||||||||||||||
Public funding receivables are described in Note 7.
Taxes and other government receivables mainly include receivables related to value-added tax, primarily in European tax jurisdictions.
Advances and prepayments include prepaid amounts associated with multi-annual supply and service agreements.
Derivative instruments are further described in Note 26.
Other current assets include a $28 million contribution to be received in 2024 from a third party as part of a collaborative agreement associated with the ongoing capacity expansion project for the 300mm wafer fab in Crolles, France. Total contributions received from the third party as part of this collaborative agreement totaled $54 million, reported as "Proceeds from capital grants and other contributions" in the statement of cash flows for the year ended December 31, 2023.
The Company applies a current expected credit losses model on all financial assets measured at amortized cost, including deposits, loans and receivables. The major portion of other current assets to which this model applies corresponds to government receivables. Due to the existing history of zero-default on receivables originated by governments, the expected credit losses are assumed to be not significant as of December 31, 2023 and December 31, 2022. Other current assets presented in the table above within the lines “Loans and deposits” and “Other current assets” are composed of amounts not deemed at exposure of default. Consequently, no loss allowance was reported on those current assets as of December 31, 2023 and December 31, 2022.
7. PUBLIC FUNDING
The main government assistance received by the Company are classified under four general categories: funding for Research and Development (R&D), R&D and Innovation activities (RDI), funding for First Industrial Deployment activities (FID) and capital investments for pilot lines and other industrial activities.
Receivables related to public funding totaled $861 million as of December 31, 2023, of which $651 million reported on the line “Other current assets” and $210 million reported on the line “Other non-current assets”, as
F-23
collection is expected beyond 12 months. The receivables related to public funding included $378 million of capital grants associated with capital investments projects for the Company's 300mm wafer fab in Crolles, France and its silicon carbide manufacturing activities in Italy. These public funding programs also set forth a clawback mechanism according to which the public government agencies will require, at specific future testing dates, the remeasurement of the aid, which may trigger future payments by the Company. No provision was recorded as of December 31, 2023 in relation to this clawback mechanism.
Receivables related to public funding amounted to $346 million, of which $190 million reported on the line “Other current assets” and $156 million reported on the line “Other non-current assets” of the consolidated balance sheet as of December 31, 2022.
Research tax credit receivables totaled $246 million and were reported on the line “Other non-current assets” of the consolidated balance sheet as of December 31, 2023. Research tax credit receivables totaled $294 million and were reported on the line “Other non-current assets” of the consolidated balance sheet as of December, 31, 2022.
In 2023, the Company and Sanan Optoelectronics jointly created SANAN, STMicroelectronics Co., Ltd. ("SST JV"), for high-volume 200mm SiC device manufacturing in China. SST JV has been identified as a VIE for which the Company is the primary beneficiary. As such, SST JV was fully consolidated as of December 31, 2023, as further described in Note 12. The newly incorporated entity is part of a capital funding scheme with regional government agencies. As of December 31, 2023, long-term liabilities related to public funding included $152 million advances from capital grants received as part of this funding program.
Liabilities related to other public funding programs totaled $292 million as of December 31, 2023, of which $96 million reported on the line “Other payables and accrued liabilities” and $196 million reported on the line “Other long-term liabilities” of the consolidated balance sheet. Current liabilities related to public funding include $44 million grants subject to a financial return, which depended on future cumulative sales of a certain product group over a five-year period. As of December 31, 2022, liabilities related to public funding amounted to $88 million, of which, $37 million advances from grants reported in “Other payables and accrued liabilities” and $51 million reported on the line “Other long-term liabilities”.
Additionally, $711 million and $95 million capital investment grants were reported as a reduction of Property, plant and equipment, net as of December 31, 2023 and December 31, 2022 respectively. Tax incentives reducing the carrying amount of Property, plant and equipment are further described in Note 10 and in Note 23.
For the year ended December 31, 2023, the Company recorded $201 million of public funding related to R&D and innovation activities, reported on the line “” of the consolidated statement of income compared to $177 million for the year ended December 31, 2022. The research tax credit received in France totaled $126 million and was reported as a reduction of “Research and development” in the consolidated statement of income for the year ended December 31, 2023 compared to $106 million for the year ended December 31, 2022. The Company reported as a reduction of cost of sales in the consolidated statement of income for the year ended December 31, 2023 a total $102 million amount related to FID funding programs compared to $59 million for the year ended December 31, 2022.
The Company also benefits from research tax credits and other tax incentives to foster research and innovation activities, together with capital investments in certain tax jurisdictions, primarily in France and Italy. These research tax credits and tax incentive schemes are further described in Note 23. In addition, the impact on depreciation expense of tax incentives received in certain tax jurisdictions and reducing the carrying amount of “Property, plant and equipment, net”, are described in Note 10 and in Note 23.
8. GOODWILL
Goodwill allocated to reportable segments as of December 31, 2023 and 2022 and changes in the carrying amount of goodwill during the years ended December 31, 2023 and 2022 are as follows:
F-24
| ADG | AMS | MDG | Total | |||||||||||||||||||||||
| December 31, 2021 | ||||||||||||||||||||||||||
| Foreign currency translation | ( | ( | ( | |||||||||||||||||||||||
| December 31, 2022 | ||||||||||||||||||||||||||
| Foreign currency translation | ||||||||||||||||||||||||||
| December 31, 2023 | ||||||||||||||||||||||||||
9. OTHER INTANGIBLE ASSETS, NET
Other intangible assets, net are detailed below:
| December 31, 2023 | Gross Amount | Accumulated Amortization | Net Amount | |||||||||||||||||
| Technologies & licenses | ( | |||||||||||||||||||
| Purchased & internally developed software | ( | |||||||||||||||||||
| Technologies in progress | ||||||||||||||||||||
| Total | ( | |||||||||||||||||||
| December 31, 2022 | Gross Amount | Accumulated Amortization | Net Amount | |||||||||||||||||
| Technologies & licenses | ( | |||||||||||||||||||
| Purchased & internally developed software | ( | |||||||||||||||||||
| Technologies in progress | ||||||||||||||||||||
| Total | ( | |||||||||||||||||||
Fully amortized intangible assets that are no longer in use have been removed from the above tabular presentation. Comparative periods have been adjusted accordingly.
The line “Technologies in progress” in the table above also includes internally developed software under construction and software not ready for their intended use.
Amortization expense related to intangible assets subject to amortization was $97 million, $103 million and $93 million for the years ended December 31, 2023, 2022 and 2021, respectively.
Estimated future amortization expense related to intangible assets as of December 31, 2023 is as follows:
| Year | ||||||||
| 2024 | ||||||||
| 2025 | ||||||||
| 2026 | ||||||||
| 2027 | ||||||||
| 2028 | ||||||||
| Thereafter | ||||||||
| Total | ||||||||
In 2023, the Company recorded a total $42 million impairment loss, of which $25 million reported in the line “Research and development expenses” and $17 million in the line "Cost of sales" of the consolidated statement of income. The impairment loss was related primarily to technologies acquired as part of certain business combinations.
F-25
10. PROPERTY, PLANT AND EQUIPMENT, NET
Property, plant and equipment, net are detailed below:
| December 31, 2023 | Gross Amount | Accumulated Depreciation | Net Amount | |||||||||||||||||
| Land | ||||||||||||||||||||
| Buildings | ( | |||||||||||||||||||
| Facilities & leasehold improvements | ( | |||||||||||||||||||
| Machinery and equipment | ( | |||||||||||||||||||
| Computer and R&D equipment | ( | |||||||||||||||||||
| Operating lease right-of-use assets | ( | |||||||||||||||||||
| Finance lease right-of-use assets | ( | |||||||||||||||||||
| Other tangible assets | ( | |||||||||||||||||||
| Construction in progress | ||||||||||||||||||||
| Total | ( | |||||||||||||||||||
| December 31, 2022 | Gross Amount | Accumulated Depreciation | Net Amount | |||||||||||||||||
| Land | ||||||||||||||||||||
| Buildings | ( | |||||||||||||||||||
| Facilities & leasehold improvements | ( | |||||||||||||||||||
| Machinery and equipment | ( | |||||||||||||||||||
| Computer and R&D equipment | ( | |||||||||||||||||||
| Operating lease right-of-use assets | ( | |||||||||||||||||||
| Finance lease right-of-use assets | ( | |||||||||||||||||||
| Other tangible assets | ( | |||||||||||||||||||
| Construction in progress | ||||||||||||||||||||
| Total | ( | |||||||||||||||||||
The line “Construction in progress” in the table above includes property, plant and equipment under construction, and equipment under qualification that are not ready for their intended use.
In 2023, the Company transferred from construction in progress to definitive long-lived assets, approximately $131 million corresponding to assets dedicated to its new silicon carbide substrates plant in Catania, Italy, where operations started in December 2023.
The depreciation charge was $1,464 million, $1,113 million and $952 million in 2023, 2022 and 2021, respectively.
Tax incentives and capital investment funding reported as a reduction of tangible assets totaled $713 million, $25 million and $13 million, in 2023, 2022 and 2021, respectively. Tax incentives and public funding reduced depreciation charges by $69 million, $56 million and $61 million in 2023, 2022 and 2021, respectively. The Company reported $620 million of capital grants as a reduction of “Property, plant and equipment, net” on the consolidated balance sheet as of December 31, 2023, in relation to two new funding schemes associated with the capacity expansion in one of its manufacturing facilities in France and its new silicon carbide manufacturing activities in Italy, of which $239 million was received in cash in 2023 and reported as cash inflows from investing activities in the consolidated statement of cash flows for the year ended December 31, 2023. A
F-26
$12 million grant income was recognized as compensation of depreciation expense in 2023 as part of these capital funding schemes.
Capital investment public funding is described in Note 7. Tax incentives related to capital expenditures is further described in Note 23.
In 2023, the Company and Sanan Optoelectronics jointly created SANAN, STMicroelectronics Co., Ltd. for high-volume 200mm SiC device manufacturing in China. SST JV has been identified as a VIE for which the Company is the primary beneficiary. As such, SST JV was fully consolidated as of December 31, 2023, as further described in Note 12. As of December 31, 2023, a total amount of $38 million was reported as "Property, plant and equipment, net" on the consolidated balance sheet as of December 31, 2023.
For the years ended December 31, 2023, 2022 and 2021, the Company sold property, plant and equipment for cash proceeds of $8 million, $4 million and $2 million, respectively.
11. LEASES
The Company leases land, buildings, cars and certain equipment (including IT equipment) which have remaining lease terms between less than one year and 50 years.
Operating and finance leases consisted of the following:
| December 31, 2023 | December 31, 2022 | |||||||||||||
| Right-of-use assets | ||||||||||||||
| Total right-of-use assets | ||||||||||||||
| Lease liabilities | ||||||||||||||
| Current | ||||||||||||||
| Non-current | ||||||||||||||
| Total lease liabilities | ||||||||||||||
F-27
Maturities of lease liabilities are as follows:
| Operating Leases | Finance Leases | December 31, 2023 | ||||||||||||||||||
| 2024 | ||||||||||||||||||||
| 2025 | ||||||||||||||||||||
| 2026 | ||||||||||||||||||||
| 2027 | ||||||||||||||||||||
| 2028 | ||||||||||||||||||||
| Thereafter | ||||||||||||||||||||
| Total future undiscounted cash outflows | ||||||||||||||||||||
| Effect of discounting | ( | ( | ( | |||||||||||||||||
| Total lease liabilities | ||||||||||||||||||||
Operating and finance lease terms and discount rates are as follows:
| December 31, 2023 | December 31, 2022 | |||||||||||||
| Weighted average remaining lease term (in years) – operating leases | ||||||||||||||
| Weighted average remaining lease term (in years) – finance leases | ||||||||||||||
| Weighted average discount rate – operating lease | % | % | ||||||||||||
| Weighted average discount rate – finance lease | % | % | ||||||||||||
Operating and finance lease cost and cash paid are as follows:
| 2023 | 2022 | |||||||||||||
| Operating lease cost | ||||||||||||||
| Finance lease cost | ||||||||||||||
| Amortization of right-of-use assets | ||||||||||||||
| Interest | ||||||||||||||
| Operating lease cash paid | ||||||||||||||
| Finance lease cash paid | ||||||||||||||
Non-cash transaction right-of-use assets obtained in exchange for new lease liabilities are as follows:
| 2023 | 2022 | |||||||||||||
| Operating leases | ||||||||||||||
| Finance leases | ||||||||||||||
12. LONG-TERM INVESTMENTS AND VARIABLE INTEREST ENTITIES
| December 31, 2023 | December 31, 2022 | |||||||||||||
| Long-term investments | ||||||||||||||
| Total | ||||||||||||||
Long-term investments are equity securities with no readily determinable fair value for which the Company has elected to apply the cost method as a measurement alternative. Long-term investments include a $9 million interest in DNP Photomask Europe S.p.A (“DNP”). In 2023, the Company paid $10 million to acquire a minor
F-28
equity stake in a start up. The investment is related to the development of Silicon Photonics technology for the RF Communications business.
In 2023, the Company and Sanan Optoelectronics jointly created SANAN, STMicroelectronics Co., Ltd. for high-volume 200mm SiC device manufacturing activities in China. The purpose of the joint venture is to support the rising demand for the Company's SiC devices for car electrification and industrial power and energy applications in China. With the creation and future operations of SST JV, the Company seeks to create a fully integrated vertical value chain aiming at serving the Chinese electrification market. Sanan Optoelectronics will build a separate 200mm SiC substrate manufacturing facility to fulfill SST JV's needs. SST JV will produce SiC devices exclusively for the Company, using the Company's proprietary SiC manufacturing process technology and know how and serving as a dedicated foundry to support the Company's demand for Chinese customers.
The Company has identified SST JV as a VIE, primarily based on the disproportionality between its 49 % equity interest rights and its economic interest and operating role in the joint venture. Indeed the significant activities of SST JV involve or are conducted on behalf of the Company as the sole customer of the joint venture. Moreover, through its key role in the successful process qualification and future manufacturing efficiency based on its SiC manufacturing process technology, the Company has the power to control the activities that most significantly impact SST JV's future economic performance. Additionally, based on the nature of the risks impacting SST JV's future economic performance, the Company will absorb the potential losses of SST JV or the right to receive benefits downstream the whole integrated SiC device value chain. Consequently, the Company has a controlling financing interest in SST JV and is the primary beneficiary of the VIE.
As the primary beneficiary of SST JV, the Company fully consolidates the VIE, with the recognition of 51 % non-controlling interest. Non-controlling interest amounted to $52 million as of December 31, 2023, which corresponds to the capital contribution received from Sanan Optoelectronics upon creation and first consolidation of SST JV. No gain or loss was recognized on the initial consolidation of the VIE as no fair value measurement was required, the joint venture being a newly incorporated entity. Profit and loss reported by the VIE for the year ended December 31, 2023 was not material. The carrying amount of SST JV's assets and liabilities, together with their classification in the consolidated balance sheet as of December 31, 2023, are separately disclosed in Note 7, Note 10 and Note 17.
13. OTHER NON-CURRENT ASSETS
Other non-current assets are detailed below:
| December 31, | December 31, | |||||||||||||
| 2023 | 2022 | |||||||||||||
| Equity securities | ||||||||||||||
| Public funding receivables | ||||||||||||||
| Taxes and other government receivables | ||||||||||||||
| French research tax credit receivable | ||||||||||||||
| Defined benefit plans | ||||||||||||||
| Prepayments and deposits to third parties | ||||||||||||||
| Derivative instruments | ||||||||||||||
| Other non-current assets | ||||||||||||||
| Total | ||||||||||||||
F-29
Public funding receivables, including French research tax credit receivable, are described in Note 7.
Prepayments and deposits to third parties include receivables related to long-term supply agreements involving purchase of raw materials, capacity commitments, cloud-hosting arrangements, and other services.
In 2023 and 2022, the Company entered into factoring transactions to accelerate the realization in cash of certain long-term receivables. The Company sold without recourse $118 million and $110 million of these receivables in the years ended December 31, 2023 and 2022 respectively, with a financial cost of $5 million and $1 million respectively.
The major portion of other non-current assets to which the expected credit loss model applies are long-term State receivables. Due to the existing history of zero-default on receivables originated by governments, the expected credit losses are assumed to be negligible as of December 31, 2023 and December 31, 2022. Other non-current assets presented in the table above on the line “Other non-current assets” are composed of individually not significant amounts not deemed to have exposure of default. Consequently, no significant expected credit loss allowance was reported on other non-current assets at reporting date.
14. OTHER PAYABLES AND ACCRUED LIABILITIES
Other payables and accrued liabilities are detailed below:
| December 31, 2023 | December 31, 2022 | |||||||||||||
| Employee related liabilities | ||||||||||||||
| Employee compensated absences | ||||||||||||||
| Taxes other than income taxes | ||||||||||||||
| Advances from customers | ||||||||||||||
| Liabilities related to public funding | ||||||||||||||
| Derivative instruments | ||||||||||||||
| Defined benefit and contribution plans | ||||||||||||||
| Royalties | ||||||||||||||
| Others | ||||||||||||||
| Total | ||||||||||||||
Advances from customers are primarily related to multi-annual capacity reservation and volume commitment agreements signed in 2023 and 2022 with certain customers. Some of these arrangements include take-or-pay clauses, according to which the Company is entitled to receive the full amount of the contractual committed fees in case of non-compliant orders from those customers. Certain agreements include penalties in case the Company is not able to fulfill its contractual obligations. No significant provision for those penalties was reported on the consolidated balance sheets as of December 31, 2023 and December 31, 2022.
Liabilities related to public funding are described in Note 7.
Derivative instruments are further described in Note 26.
Defined benefit and defined contribution plans and other long-term employee benefits are further described in Note 16.
Lease liabilities are described in Note 11.
F-30
15. LONG-TERM DEBT
Long-term debt consisted of the following:
| December 31, | December 31, | |||||||||||||
| 2023 | 2022 | |||||||||||||
| Funding program loans from European Investment Bank ("EIB"): | ||||||||||||||
| Credit Facility from Cassa Depositi e Prestiti SpA ("CDP") | ||||||||||||||
| Dual tranche senior unsecured convertible bonds | ||||||||||||||
| Finance leases: | ||||||||||||||
| Other funding program loans: | ||||||||||||||
| Total long-term debt | ||||||||||||||
| Less current portion | ( | ( | ||||||||||||
| Total long-term debt, less current portion | ||||||||||||||
Long-term debt is denominated in the following currencies:
| December 31, 2023 | December 31, 2022 | |||||||||||||
| U.S. dollar | ||||||||||||||
| Euro | ||||||||||||||
| Total | ||||||||||||||
On August 4, 2020, the Company issued a $1.5 billion principal amount of dual tranche senior unsecured convertible bonds (Tranche A and Tranche B for $750 105.8 % as zero-coupon bonds while Tranche B bonds were issued at 104.5 % as zero-coupon bonds. The conversion price at issuance was $43.62 for Tranche A equivalent to a 47.5 % conversion premium and $45.10 for Tranche B, equivalent to a 52.5 % conversion premium. These conversion features correspond to an equivalent of 4,585 shares per each Tranche A bond $200,000 par value and an equivalent of 4,435 shares per each Tranche B bond $200,000 par value. The bonds are convertible by the bondholders or are callable by the issuer upon certain conditions, on a net-share settlement basis, except if the
F-31
issuer elects a full-cash or full-share conversion as an alternative settlement. The net proceeds from the bond offering were $1,567 million, after deducting issuance costs paid by the Company.
As per contractual terms, the bondholders have full conversion rights on Tranche A bonds, starting August 2023. In terms of Tranche B, up until August 2024, the bonds can be converted by the bondholders with a contingent feature of 130 % of the conversion price, measured at quarter-end for the following quarter. After that date, the bondholders will have full conversion rights.
As per contractual terms, starting August 2023, Tranche A bonds are callable by the Company with a 130 % contingent feature, with the exercise of its call rights being preceded by the release, by the Company, of an Optional Redemption Notice. The same feature applies for Tranche B bonds but only after August 2024.
As of December 31, 2023, the Company stock price exceeded the conversion price of the senior unsecured convertible bonds. However, the 130 % stock price contingent feature was not met. Consequently, Tranche A bonds are not callable by the Company and bondholders cannot exercise their conversion rights on Tranche B bonds.
The convertible debt was reported as Long-term debt in the consolidated balance sheets as of December 31, 2023 and December 31, 2022, based on its original maturity, after having considered several factors, such as the uncertainty around the timing of the potential exercise of the conversion rights by bondholders and the call rights by the Company.
Aggregate future maturities of total long-term debt (including current portion) at principal amount are as follows:
| December 31, | ||||||||
| 2023 | ||||||||
| 2024 | ||||||||
| 2025 | ||||||||
| 2026 | ||||||||
| 2027 | ||||||||
| 2028 | ||||||||
| Thereafter | ||||||||
| Total | ||||||||
The difference between the total aggregated future maturities in the preceding table and the total carrying amount of long-term debt is due to unamortized issuance costs on the dual tranche senior unsecured convertible bonds.
Credit facilities
The Company’s long-term debt contained standard conditions but does not impose minimum financial ratios. The Company had unutilized committed medium-term credit facilities with core relationship banks totalling $1,030 million as of December 31, 2023.
The EIB Loans are comprised of three long-term amortizing credit facilities as part of R&D funding programs. The first one, signed in August 2017, is a €500 million loan in relation to R&D and capital expenditures in the European Union for the years 2017 and 2018. The entire amount was fully drawn in Euros corresponding to $303 million outstanding as of December 31, 2023. The second one, signed in 2020, is a €500 million credit facility agreement with EIB to support R&D and capital expenditure programs in Italy and France. The amount was fully drawn in Euros representing $442 million outstanding as of December 31, 2023. In 2022, the Company signed a third long-term amortizing credit facility with EIB of €600 million, out of which, €300 million was withdrawn representing $332 million outstanding as of December 31, 2023. In January 2024, an amount of $300 million was withdrawn under this credit facility.
The CDP loans are comprised of two long-term credit facilities. The first, signed in 2021, is a €150 million loan, fully drawn in Euros, of which $97 million were outstanding as of December 31, 2023. The second one, signed in 2022, is a €200 million loan, fully drawn in Euros, of which $187 million was outstanding as of December 31, 2023.
F-32
16. POST-EMPLOYMENT AND OTHER LONG-TERM EMPLOYEES BENEFITS
The Company and its subsidiaries have a number of defined benefit pension plans, mainly unfunded, and other long-term employees’ benefits covering employees in various countries. The defined benefit plans provide pension benefits based on years of service and employee compensation levels. The other long-term employees’ plans provide benefits due during the employees’ period of service after certain seniority levels. The Company uses December 31 as measurement date for its plans. Eligibility is generally determined in accordance with local statutory requirements. For Italian termination indemnity plan (“TFR”), generated before July 1, 2007, the Company measures the vested benefits to which Italian employees are entitled as if the amounts were immediately due as of December 31, 2023, in compliance with U.S. GAAP guidance on determining vested benefit obligations for defined benefit pension plans.
The changes in benefit obligation and plan assets were as follows:
| Pension Benefits | Other Long-Term Benefits | |||||||||||||||||||||||||
| December 31, 2023 | December 31, 2022 | December 31, 2023 | December 31, 2022 | |||||||||||||||||||||||
| Change in benefit obligation: | ||||||||||||||||||||||||||
| Benefit obligation at beginning of year | ||||||||||||||||||||||||||
| Service cost | ||||||||||||||||||||||||||
| Interest cost | ||||||||||||||||||||||||||
| Employee contributions | ||||||||||||||||||||||||||
| Plan amendments | ( | |||||||||||||||||||||||||
| Benefits paid | ( | ( | ( | ( | ||||||||||||||||||||||
| Effect of settlement | ( | ( | ||||||||||||||||||||||||
| Actuarial (gain) loss | ( | ( | ( | |||||||||||||||||||||||
| Foreign currency translation | ( | ( | ||||||||||||||||||||||||
| Benefit obligation at end of year | ||||||||||||||||||||||||||
| Change in plan assets: | ||||||||||||||||||||||||||
| Plan assets at fair value at beginning of year | — | — | ||||||||||||||||||||||||
| Actual return on plan assets | ( | — | — | |||||||||||||||||||||||
| Employer contributions | — | — | ||||||||||||||||||||||||
| Employee contributions | — | — | ||||||||||||||||||||||||
| Benefits paid | ( | ( | — | — | ||||||||||||||||||||||
| Effect of settlement | ( | ( | — | — | ||||||||||||||||||||||
| Business combination | — | — | ||||||||||||||||||||||||
| Foreign currency translation | ( | — | — | |||||||||||||||||||||||
| Plan assets at fair value at end of year | ||||||||||||||||||||||||||
| Funded status | ( | ( | ( | ( | ||||||||||||||||||||||
| Amounts recorded in the consolidated balance sheets | ||||||||||||||||||||||||||
| Other investments and other non-current assets | ||||||||||||||||||||||||||
| Other payables and accrued liabilities | ( | ( | ( | ( | ||||||||||||||||||||||
| Other non-current liabilities | ( | ( | ||||||||||||||||||||||||
| Post-employment benefit obligations | ( | ( | ||||||||||||||||||||||||
| Net amount recorded | ( | ( | ( | ( | ||||||||||||||||||||||
F-33
The actuarial losses incurred in 2023 were primarily due to a decrease in discount rates applied against future expected benefit payments and resulted in an increase of the benefit obligation mainly for the plans located in the United States, France and Switzerland. The actuarial gains incurred in 2022 were primarily due to an increase in discount rates applied against future expected benefit payments and resulted in a decrease of the benefit obligation mainly for the plans located in France, in the United States and Switzerland.
Actual return on plan assets reflect changes in market conditions during each reporting year.
The components of accumulated other comprehensive loss (income) before tax effects were as follows:
| Actuarial (gains)/losses | Prior service cost | Total | ||||||||||||||||||
| Accumulated other comprehensive loss as of December 31, 2021 | ||||||||||||||||||||
| Net amount generated/arising in current year | ( | ( | ||||||||||||||||||
| Amortization | ( | ( | ( | |||||||||||||||||
| Foreign currency translation adjustment | ( | ( | ||||||||||||||||||
| Accumulated other comprehensive loss as of December 31, 2022 | ||||||||||||||||||||
| Net amount generated/arising in current year | ( | |||||||||||||||||||
| Amortization | ( | ( | ( | |||||||||||||||||
| Foreign currency translation adjustment | ||||||||||||||||||||
| Accumulated other comprehensive loss as of December 31, 2023 | ( | |||||||||||||||||||
The accumulated benefit obligations were as follows:
| Pension Benefits | Other Long-Term Benefits | |||||||||||||||||||||||||
| December 31, 2023 | December 31, 2022 | December 31, 2023 | December 31, 2022 | |||||||||||||||||||||||
| Accumulated benefit obligations | ||||||||||||||||||||||||||
For pension plans and other long-term benefits with accumulated benefit obligations in excess of plan assets, the accumulated benefit obligation and fair value of plan assets were $411 million and $182 million, respectively, as of December 31, 2023 and $409 million and $139 million, respectively, as of December 31, 2022.
For pension plans with projected benefit obligations in excess of plan assets, the benefit obligation and fair value of plan assets were $950 million and $478 million, respectively, as of December 31, 2023 and $839 million and $427 million, respectively, as of December 31, 2022.
The components of the net periodic benefit cost included the following:
| Pension Benefits | Other Long-term Benefits | |||||||||||||||||||||||||||||||||||||
| Year ended December 31, 2023 | Year ended December 31, 2022 | Year ended December 31, 2021 | Year ended December 31, 2023 | Year ended December 31, 2022 | Year ended December 31, 2021 | |||||||||||||||||||||||||||||||||
| Service cost | ||||||||||||||||||||||||||||||||||||||
| Interest cost | ||||||||||||||||||||||||||||||||||||||
| Expected return on plan assets | ( | ( | ( | |||||||||||||||||||||||||||||||||||
| Amortization of actuarial net loss (gain) | ( | ( | ||||||||||||||||||||||||||||||||||||
| Amortization of prior service cost | ||||||||||||||||||||||||||||||||||||||
| Effect of settlement | ||||||||||||||||||||||||||||||||||||||
| Net periodic benefit cost | ||||||||||||||||||||||||||||||||||||||
F-34
Pension benefits components other than service cost, recognized outside of operating income in “Other components of pension benefit costs” in the Company’s consolidated statements of income, were $19 million, $11 million and $10 million in the years ended December 31, 2023, 2022 and 2021, respectively.
The weighted average assumptions used to determine the benefit obligation and the periodic benefit costs for pension plans and other long-term benefits were as follows:
| 2023 | 2022 | 2021 | ||||||||||||||||||
| Benefit obligation | ||||||||||||||||||||
| Discount rate | % | % | % | |||||||||||||||||
| Salary increase rate | % | % | % | |||||||||||||||||
| Net periodic benefit cost | ||||||||||||||||||||
| Discount rate | % | % | % | |||||||||||||||||
| Salary increase rate | % | % | % | |||||||||||||||||
| Expected long-term rates of return on plan assets | % | % | % | |||||||||||||||||
The discount rate was determined by reference to market yields on high quality long-term corporate bonds applicable to the respective country of each plan, with terms consistent with the terms of the benefit obligations. In developing the expected long-term rate of return on assets, the Company modelled the expected long-term rates of return for broad categories of investments held by the plan against a number of various potential economic scenarios.
The Company’s pension plan asset allocation as of December 31, 2023 and December 31, 2022 is as follows:
| Percentage of Plan Assets at December | ||||||||||||||
| Asset Category | 2023 | 2022 | ||||||||||||
| Cash and cash equivalents | % | % | ||||||||||||
| Equity securities | % | % | ||||||||||||
| Government debt securities | % | % | ||||||||||||
| Corporate debt securities | % | % | ||||||||||||
Investments in funds(a) | % | % | ||||||||||||
| Real estate | % | % | ||||||||||||
| Other (mainly insurance assets – contracts and reserves) | % | % | ||||||||||||
| Total | % | % | ||||||||||||
(a) As of December 31, 2023, investments in funds were composed of commingled and multi-strategy funds invested in diversified portfolios of fixed income (68 %) - mainly corporate bonds, equities (24 %), time deposits and money market (5 %) and other instruments (3 %). As of December 31, 2022, investments in funds were composed of commingled and multi-strategy funds invested in diversified portfolios of fixed income (79 %) - mainly corporate bonds, time deposits and money market (11 %) and other instruments (10 %).
As of December 31, 2023, the Company’s plan asset allocation was in line with the targets set for each plan.
F-35
The Company’s detailed pension plan asset allocation including the fair-value measurements of those plan assets as of December 31, 2023 is as follows:
| Total | Quoted Prices in Active Markets for Identical Assets (Level 1) | Significant Other Observable Inputs (Level 2) | Significant Unobservable Inputs (Level 3) | |||||||||||||||||||||||
| Cash and cash equivalents | ||||||||||||||||||||||||||
| Equity securities | ||||||||||||||||||||||||||
| Government debt securities | ||||||||||||||||||||||||||
| Corporate debt securities | ||||||||||||||||||||||||||
| Investment funds | ||||||||||||||||||||||||||
| Real estate | ||||||||||||||||||||||||||
| Other (mainly insurance assets – contracts and reserves) | ||||||||||||||||||||||||||
| TOTAL | ||||||||||||||||||||||||||
The Company’s detailed pension plan asset allocation including the fair-value measurements of those plan assets as of December 31, 2022 is as follows:
| Total | Quoted Prices in Active Markets for Identical Assets (Level 1) | Significant Other Observable Inputs (Level 2) | Significant Unobservable Inputs (Level 3) | |||||||||||||||||||||||
| Cash and cash equivalents | ||||||||||||||||||||||||||
| Equity securities | ||||||||||||||||||||||||||
| Government debt securities | ||||||||||||||||||||||||||
| Corporate debt securities | ||||||||||||||||||||||||||
| Investment funds | ||||||||||||||||||||||||||
| Real estate | ||||||||||||||||||||||||||
| Other (mainly insurance assets – contracts and reserves) | ||||||||||||||||||||||||||
| TOTAL | ||||||||||||||||||||||||||
F-36
The majority of insurance contract plan assets relate to pension plans for the Company's employees in Switzerland. Those plans are provided by collective pension foundations and contributions are invested in fully insured assets that provide a guaranteed contractual return. As such, the fair value of such assets equals to the employees' accrued savings and calculated using total employer and employee contributions plus any accumulated interest credited, which is substantially equivalent to the related cash surrender value. The approach is consistent with prior years.
For plan assets measured at fair value using significant unobservable inputs (Level 3), the reconciliation between January 1, 2023 and December 31, 2023 is presented as follows:
| Fair Value Measurements using Significant Unobservable Inputs (Level 3) | ||||||||
| January 1, 2023 | ||||||||
| Contributions (employer and employee) | ||||||||
Actual return on plan assets (b) | ||||||||
Net benefit payments (a) | ||||||||
Settlements (b) | ( | |||||||
Foreign currency translation adjustment (c) | ||||||||
| December 31, 2023 | ||||||||
(a) Net cash flows between benefits paid from the insurance contracts and benefits transferred into the insurance contracts by employees.
(b) Included in non operating expenses in the consolidated statement of income.
(c) Unrealized gains included in the consolidated statement of comprehensive income.
For plan assets measured at fair value using significant unobservable inputs (Level 3), the reconciliation between January 1, 2022 and December 31, 2022 is presented as follows:
| Fair Value Measurements using Significant Unobservable Inputs (Level 3) | ||||||||
| January 1, 2022 | ||||||||
| Contributions (employer and employee) | ||||||||
Net benefit payments (a) | ||||||||
| Settlements | ( | |||||||
| Foreign currency translation adjustment | ( | |||||||
| December 31, 2022 | ||||||||
(a) Net cash flows between benefits paid from the insurance contracts and benefits transferred into the insurance contracts by employees.
The Company’s investment strategy for its pension plans is to optimize the long-term investment return on plan assets in relation to the liability structure to maintain an acceptable level of risk while minimizing the cost of providing pension benefits and maintaining adequate funding levels in accordance with applicable rules in each jurisdiction. The Company’s practice is to periodically conduct a review of its asset allocation strategy, in such a way that the asset allocation is in line with the targeted asset allocation within reasonable boundaries. The
F-37
Company’s asset portfolios are managed in such a way as to achieve appropriate diversification in line with the asset allocation strategy. The Company does not manage any assets internally.
After considering the funded status of the Company’s defined benefit plans, movements in the discount rate, investment performance and related tax consequences, the Company may choose to make contributions to its pension plans in any given year in excess of required amounts. The Company’s contributions to plan assets were $26 million in 2023 and $25 million in 2022 and the Company expects to contribute $27 million to plan assets in 2024.
The Company’s estimated future benefit payments as of December 31, 2023 are as follows:
| Years | Pension Benefits | Other Long-term Benefits | ||||||||||||
| 2024 | ||||||||||||||
| 2025 | ||||||||||||||
| 2026 | ||||||||||||||
| 2027 | ||||||||||||||
| 2028 | ||||||||||||||
| From 2029 to 2033 | ||||||||||||||
17. OTHER LONG-TERM LIABILITIES
Other long-term liabilities are detailed below:
| December 31, 2023 | December 31, 2022 | |||||||||||||
| Contingent consideration on business combinations | ||||||||||||||
| Other employee benefits | ||||||||||||||
| Liabilities related to public funding | ||||||||||||||
| Advances received on capital grants | ||||||||||||||
| Advances from customers | ||||||||||||||
| Derivative instruments | ||||||||||||||
| Others | ||||||||||||||
| Total | ||||||||||||||
Lease liabilities are described in Note 11.
Contingent consideration related to business acquisitions are further described in Note 26.
Other long-term employee benefits are described in Note 16.
Liabilities related to public funding are described in Note 7.
Advances received on capital grants relate to the joint venture the Company and Sanan Optoelectronics created in 2023 for high-volume 200mm SiC device manufacturing activities in China, as described in Note 12. The newly incorporated entity is a party to a regional public funding program, primarily consisting in capital grants received on eligible capital expenditures (infrastructures and equipment). As of December 31, 2023, the Company received $152 million of advances on these capital grants while the capital expenditures had not been
F-38
incurred yet. Consequently, these advances were reported as long-term liabilities in the consolidated balance sheet as of December 31, 2023. Public funding is further described in Note 7.
Advances from customers are described in Note 14 and Note 19.
Derivative instruments are described in Note 26.
Other long-term liabilities also include individually not significant amounts as of December 31, 2023 and December 31, 2022, presented cumulatively in the line “Others”.
18. SHAREHOLDERS’ EQUITY
18.1 Outstanding shares
The authorized share capital of the Company is Euro 1,810 million, consisting of 1,200,000,000 common shares and 540,000,000 preference shares, each with a nominal value of €1.04 . As of December 31, 2023, the number of shares of common stock issued was 911,281,920 shares (911,281,920 as of December 31, 2022).
As of December 31, 2023, the number of shares of common stock outstanding was 902,771,081 , 903,865,763 as of December 31, 2022 and 906,518,057 as of December 31, 2021.
18.2 Preference shares
The 540,000,000 preference shares, when issued, will entitle a holder to full voting rights and to a preferential right to dividends and distributions upon liquidation.
The Company is a party to an option agreement regarding the preference shares with Stichting Continuïteit ST (the “Stichting”), entered into on January 22, 2007, with a duration of ten years , an agreement which was extended for another ten years in October 2016. The Managing Board and Supervisory Board, along with the board of the Stichting, have declared that they are jointly of the opinion that the Stichting is independent of the Company. The option agreement provides for the issuance of up to a maximum 540,000,000 preference shares. Any such shares would be issued to the Stichting upon its request and in its sole discretion and upon payment of at least 25 % of the par value of the preference shares to be issued. The shares would be issuable in the event of actions which the board of the Stichting determines would be contrary to the Company’s interests, shareholders and other stakeholders and which, in the event of a creeping acquisition or offer for the Company’s common shares, are not supported by the Company’s Managing Board and Supervisory Board. The preference shares may remain outstanding for no longer than two years . The effect of the preference shares may be to deter potential acquirers from effecting an unsolicited acquisition resulting in a change of control as well as to create a level-playing field in the event actions which are considered to be hostile by the Company’s Managing Board and Supervisory Board, as described above, occur and which the board of the Stichting determines to be contrary to the Company’s interests, shareholders and other stakeholders.
There were no
18.3 Treasury stock
As of December 31, 2023, the Company owned 8,510,839 shares classified as treasury stock in the consolidated statement of equity compared to 7,416,157 shares as of December 31, 2022 and 4,758,863 shares as of December 31, 2021.
The treasury shares have been originally designated for allocation under the Company’s share-based remuneration programs. As of December 31, 2023, 81,022,515 of these treasury shares were transferred to employees under the Company’s share-based remuneration programs, of which 6,502,300 during the year ended December 31, 2023, 6,587,002 shares during the year ended December 31, 2022 and 7,448,615 shares during the year ended December 31, 2021.
On July 1, 2021, the Company announced the launch of a share buy-back program of up to $1,040 million to be executed within a three-year period. During 2023, the Company purchased approximately 7.6 million shares of its outstanding common stock for $346 million as part of the program. The Company purchased approximately
F-39
18.4 Unvested share awards for the Supervisory Board
On an annual basis and until the year 2012, the Compensation Committee (on behalf of the Supervisory Board and with its approval) used to grant stock-based awards (options to acquire common shares of the Company) to the members and professionals of the Supervisory Board (“The Supervisory Board Plan”). The awards were granted at the nominal value of the share of €1.04 (exercise price of the option). The options granted under the Supervisory Board Plan vested and became exercisable immediately, while the shares resulting from these awards vested and therefore became available for trade evenly over three years (one third every year), with no market, performance or service conditions.
At the Company’s AGM held on June 21, 2013, it was resolved to abolish and terminate the stock-based compensation for the Supervisory Board members and professionals.
The table below summarizes grants under the outstanding stock award plans, as authorized by the Compensation Committee:
| Year of grant | Options granted | Options waived at grant | ||||||||||||
| 2011 | ( | |||||||||||||
| 2012 | ( | |||||||||||||
| Since 2013 | No options granted | |||||||||||||
A summary of the options’ activity by plan for the years ended December 31, 2023 and December 31, 2022 is presented below:
| Year of grant | Outstanding as of December 31, 2021 | Exercised | Expired / Cancelled | Outstanding as of December 31, 2022 | Exercised | Expired / Cancelled | Outstanding as of December 31, 2023 | |||||||||||||||||||||||||||||||||||||
| 2011 | ||||||||||||||||||||||||||||||||||||||||||||
| 2012 | ( | ( | ||||||||||||||||||||||||||||||||||||||||||
18.5 Unvested share awards for the employees
On an annual basis, the Compensation Committee (on behalf of the Supervisory Board and with its approval) grants stock-based awards to the senior executives and selected employees (the “Employee Plan”). The awards are granted for services rendered under the Employee Plan. There are two types of unvested shares: (1) shares granted to employees, which are subject only to service conditions and vest over the requisite service period, and (2) shares granted to senior executives, for which vesting is subject to performance conditions.
For plan 2020, the performance conditions consisted of two external targets (sales evolution and operating income compared to a basket of competitors) weighting for two thirds of the total number of awards granted, and of one internal target (return on net assets compared to the previous period), weighting for one third of the total number of awards granted. For plans 2021, 2022 and 2023, the performance conditions consist of two one
Stock awards are subject to three-year cliff-vesting for the Company's CEO, while they vest over a grading three-year service period for other employees (32 % as of the first anniversary of the grant, 32 % as of the second anniversary of the grant and 36 % as of the third anniversary of the grant). Applicable only to the 2023 plan,
F-40
stock awards allocated to members of the Executive Committee are also subject to three-year cliff vesting. In addition, for the year 2020, a Special Bonus was granted to the Company’s CEO.
The table below summarizes grants outstanding during the year 2023, as authorized by the Compensation Committee:
| Date of grant | Plan name | Number of shares granted | Number of shares waived | Number of shares lost on performance conditions | ||||||||||||||||||||||
| June 17, 2020 | 2020 CEO Special Bonus | |||||||||||||||||||||||||
| July 23, 2020 | 2020 Employee Plan | |||||||||||||||||||||||||
| December 24, 2020 | 2020 Employee Plan | |||||||||||||||||||||||||
| July 28, 2021 | 2021 Employee Plan | ( | ||||||||||||||||||||||||
| December 21, 2021 | 2021 Employee Plan | ( | ||||||||||||||||||||||||
| July 27, 2022 | 2022 Employee Plan | |||||||||||||||||||||||||
| December 22, 2022 | 2022 Employee Plan | |||||||||||||||||||||||||
| July 26, 2023 | 2023 Employee Plan | (*) | ||||||||||||||||||||||||
| December 11, 2023 | 2023 Employee Plan | (*) | ||||||||||||||||||||||||
(*) As of the date of issuance of these consolidated financial statements, a final decision by the Compensation Committee of the Supervisory Board on the achievement of the performance conditions had not been made yet.
A summary of the unvested share activity by plan for the year ended December 31, 2023 is presented below:
| Unvested Shares | Unvested as at December 31, 2022 | Granted | Forfeited / waived | Cancelled on failed vesting conditions | Vested | Unvested as at December 31, 2023 | ||||||||||||||||||||||||||||||||
| 2020 CEO Special Bonus | ( | |||||||||||||||||||||||||||||||||||||
| 2020 Employee Plan | ( | ( | ||||||||||||||||||||||||||||||||||||
| 2021 Employee Plan | ( | ( | ||||||||||||||||||||||||||||||||||||
| 2022 Employee Plan | ( | ( | ||||||||||||||||||||||||||||||||||||
| 2023 Employee Plan | ( | |||||||||||||||||||||||||||||||||||||
| Total | ( | ( | ||||||||||||||||||||||||||||||||||||
The grant date fair value of unvested shares granted to the CEO under the 2020 CEO Special Bonus Plan was $26.64 , which was based on the market price of the shares at the date of the grant.
The grant date weighted average fair value of unvested shares granted to employees under the 2020 Employee Plan was $30.17 . On March 24, 2021, the Compensation Committee approved the statement that with respect to the shares subject to performance conditions, all three performance conditions were fully met. Consequently, the compensation expense recorded on the 2020 Employee Plan reflects the statement that – for the portion of shares subject to performance conditions – 100 % of the awards granted has fully vested, as far as the service condition was met.
The grant date weighted average fair value of unvested shares granted to employees under the 2021 Employee Plan was $39.20 . On March 23, 2022, the Compensation Committee approved the statement that with respect to the shares subject to performance conditions, two performance conditions were fully met. Consequently, the compensation expense recorded on the 2021 Employee Plan reflects the statement that – for the portion of shares subject to performance conditions – two thirds of the awards granted will fully vest, as far as the service condition is met.
The grant date weighted average fair value of unvested shares granted to employees under the 2022 Employee Plan was $35.92 . On March 22, 2023, the Compensation Committee approved the statement that with respect to
F-41
the shares subject to performance conditions, all three performance conditions were fully met. Consequently, the compensation expense recorded on the 2022 Employee Plan reflects the statement that – for the portion of shares subject to performance conditions – 100 % of the awards granted will fully vest, as far as the service condition is met.
The grant date weighted average fair value of unvested shares granted to employees under the 2023 Employee Plan was $50.96 . Moreover, for the portion of the shares subject to performance conditions (2,589,952 shares) the Company estimated the number of awards expected to vest by assessing the probability of achieving the performance conditions. As of the date of issuance of these consolidated financial statements, a final determination by the Compensation Committee of the Supervisory Board of the achievement of the performance conditions had not been made yet. The Company estimated that 100 % of the awards subject to performance conditions are expected to vest. Consequently, the compensation expense recorded for the 2023 Employee Plan reflects the expected vesting of 100 % of the awards granted with performance conditions, subject to the service condition being met. The assumption of the expected number of awards to be vested upon achievement of the performance conditions is subject to changes based on the final measurement of the conditions, which is expected to occur in the first half of 2024.
The following table illustrates the classification of pre-payroll tax and social contribution stock-based compensation expense included in the consolidated statements of income for the years ended December 31, 2023, 2022 and 2021:
| December 31, 2023 | December 31, 2022 | December 31, 2021 | ||||||||||||||||||
| Cost of sales | ||||||||||||||||||||
| R&D | ||||||||||||||||||||
| SG&A | ||||||||||||||||||||
| Total pre-payroll tax and social contribution compensation | ||||||||||||||||||||
The grant date fair value of the shares that vested in 2023 was $226 million compared to $189 million in 2022 and $181 million in 2021.
Stock-based compensation, excluding payroll tax and social contribution, capitalized as part of inventory was $13 million as of December 31, 2023, compared to $11 million as of December 31, 2022 and $9 million as of December 31, 2021. As of December 31, 2023, there was $265 million of total unrecognized compensation cost related to the grant of unvested shares, which is expected to be recognized over a weighted average period of approximately 10 months.
The total deferred income tax benefit recognized in the consolidated statements of income related to unvested share-based compensation expense amounted to $17 million, $15 million and $14 million for the years ended December 31, 2023, 2022 and 2021, respectively.
F-42
18.6 Accumulated other comprehensive income (loss) attributable to parent company stockholders
The table below details the changes in AOCI attributable to the company’s stockholders by component, net of tax, for the years ended December 31, 2023, 2022 and 2021:
| Gains (Losses) on Cash Flow Hedges | Gains (Losses) on Available- For-Sale Securities | Defined Benefit Pension Plan Items | Foreign Currency Translation Adjustments (“CTA”) | Total | ||||||||||||||||||||||||||||
| December 31, 2020 | ( | |||||||||||||||||||||||||||||||
| Cumulative tax impact | ( | |||||||||||||||||||||||||||||||
| December 31, 2020, net of tax | ( | |||||||||||||||||||||||||||||||
| OCI before reclassifications | ( | ( | ( | ( | ||||||||||||||||||||||||||||
| Amounts reclassified from AOCI | ( | ( | ||||||||||||||||||||||||||||||
| OCI for the year ended December 31, 2021 | ( | ( | ( | ( | ||||||||||||||||||||||||||||
| Cumulative tax impact | ( | |||||||||||||||||||||||||||||||
| OCI for the year ended December 31, 2021, net of tax | ( | ( | ( | ( | ||||||||||||||||||||||||||||
| December 31, 2021 | ( | ( | ||||||||||||||||||||||||||||||
| Cumulative tax impact | ||||||||||||||||||||||||||||||||
| December 31, 2021, net of tax | ( | ( | ||||||||||||||||||||||||||||||
| OCI before reclassifications | ( | ( | ( | ( | ||||||||||||||||||||||||||||
| Amounts reclassified from AOCI | ||||||||||||||||||||||||||||||||
| OCI for the year ended December 31, 2022 | ( | ( | ( | |||||||||||||||||||||||||||||
| Cumulative tax impact | ( | ( | ( | |||||||||||||||||||||||||||||
| OCI for the year ended December 31, 2022, net of tax | ( | ( | ( | |||||||||||||||||||||||||||||
| December 31, 2022 | ( | ( | ||||||||||||||||||||||||||||||
| Cumulative tax impact | ( | |||||||||||||||||||||||||||||||
| December 31, 2022, net of tax | ( | ( | ||||||||||||||||||||||||||||||
| OCI before reclassifications | ( | |||||||||||||||||||||||||||||||
| Amounts reclassified from AOCI | ( | |||||||||||||||||||||||||||||||
| OCI for the year ended December 31, 2023 | ( | |||||||||||||||||||||||||||||||
| Cumulative tax impact | ( | ( | ( | |||||||||||||||||||||||||||||
| OCI for the year ended December 31, 2023, net of tax | ( | |||||||||||||||||||||||||||||||
| December 31, 2023 | ( | ( | ||||||||||||||||||||||||||||||
| Cumulative tax impact | ( | |||||||||||||||||||||||||||||||
| December 31, 2023, net of tax | ( | ( | ||||||||||||||||||||||||||||||
F-43
Items reclassified out of Accumulated Other Comprehensive Income for the years ended December 31, 2023, 2022, 2021 are listed in the table below:
| Details about AOCI components | Amounts reclassified from AOCI in the year ended December 31, 2023 | Amounts reclassified from AOCI in the year ended December 31, 2022 | Amounts reclassified from AOCI in the year ended December 31, 2021 | Affected line item in the statement where net income (loss) is presented | ||||||||||||||||||||||
| Gains (Losses) on Cash Flow Hedges | ||||||||||||||||||||||||||
| Foreign exchange derivative contracts | $ | $ | ( | $ | Cost of sales | |||||||||||||||||||||
| Foreign exchange derivative contracts | $ | $ | ( | $ | Selling, general and administrative expenses | |||||||||||||||||||||
| Foreign exchange derivative contracts | $ | $ | ( | $ | Research and development expenses | |||||||||||||||||||||
| $ | $ | $ | ( | Income tax benefit (expense) | ||||||||||||||||||||||
| $ | $ | ( | $ | Net of tax | ||||||||||||||||||||||
| Defined Benefit Pension Plan Items | ||||||||||||||||||||||||||
| Amortization of actuarial gains (losses) | $ | ( | $ | ( | $ | ( | Other components of pension benefit costs | |||||||||||||||||||
| Amortization of prior service cost | $ | ( | $ | ( | $ | ( | Other components of pension benefit costs | |||||||||||||||||||
| $ | $ | $ | Income tax benefit (expense) | |||||||||||||||||||||||
| $ | ( | $ | ( | $ | ( | Net of tax | ||||||||||||||||||||
| Total reclassifications for the year | $ | ( | $ | ( | $ | |||||||||||||||||||||
| Attributable to noncontrolling interest | $ | $ | $ | |||||||||||||||||||||||
| Attributable to the parent company stockholders | $ | ( | $ | ( | $ | |||||||||||||||||||||
18.7 Dividends
The Company is governed under the laws of the Netherlands. The Articles of Association provide that the net result for the year, after deduction of (i) any amount to set up and maintain reserves required by Dutch Law and the Articles of Association, (ii) if any of our preference shares are issued and outstanding, the dividend to be paid to the holders of preference shares and (iii) the aforementioned allocation to the reserve fund, is subject to the disposition by the General Meeting of Shareholders ("AGM").
The AGM held on May 25, 2023, authorized the distribution of a cash dividend of $0.24 per outstanding share of the Company’s common stock, to be distributed in quarterly installments of $0.06 55 million corresponding to the first installment, $54 million corresponding to the second installment and $54 million corresponding to the third installment were paid as of December 31, 2023. The amount of $54 million corresponding to the last installment was presented in the line “Dividends payable to stockholders” in the consolidated balance sheet as of December 31, 2023.
The AGM held on May 25, 2022 authorized the distribution of a cash dividend of $0.24 per outstanding share of the Company’s common stock, to be distributed in quarterly installments of $0.06 55 million corresponding to the first installment, $54 million corresponding to the second installment and $48 million corresponding to the third installment were paid in 2022. An amount of $6 million corresponding to the remaining portion of the third installment and $54 million corresponding to the fourth installment were paid in 2023.
F-44
The AGM held on May 27, 2021 authorized the distribution of a cash dividend of $0.24 per outstanding share of the Company’s common stock, to be distributed in quarterly installments of $0.06 54 million corresponding to the first installment, $55 million corresponding to the second installment and $54 million corresponding to the third installment were paid in 2021. An amount of $55 million corresponding to the fourth installment was paid in 2022.
19. REVENUES
19.1 Nature of goods and services
The Company designs, develops, manufactures and markets a broad range of products, including discrete and standard commodity components, application-specific integrated circuits (“ASICs”), full-custom devices and semi-custom devices and application specific standard products (“ASSPs”) for analog, digital and mixed-signal applications. In addition, the Company participates in the manufacturing value chain of smartcard products, which includes the production and sale of both silicon chips and smartcards.
The principal activities – separated by reportable segments – from which the Company generates its revenues are described in Note 20.
Other revenues consist of license revenue, service revenue related to transferring licenses, patent royalty income, sale of scrap materials and manufacturing by-products.
While the majority of the Company’s sales agreements contain standard terms and conditions, the Company may, from time to time, enter into agreements that contain multiple performance obligations or terms and conditions. Those agreements concern principally the revenues from services, where the performance obligation is satisfied over time. The objective when allocating the transaction price is to allocate the transaction price to each performance obligation (or distinct good or service) in an amount that depicts the amount of consideration to which the Company expects to be entitled in exchange for transferring the promised goods or services to the customer.
19.2 Revenue recognition and disaggregation
The Company recognizes revenue from products sold to a customer, including distributors, when it satisfies a performance obligation at a point in time by transferring control over a product to the customer. This usually occurs at the time of shipment. The performance obligations linked to the sale of goods contracts have the original expected length of less than one year . The transaction price is determined based on the contract terms, adjusted for price protection, if applicable. The revenues from services are usually linked to performance obligations transferred over time and are recognized in line with the contract terms.
In 2023 and 2022, the Company signed several multi-annual capacity reservation and volume commitment arrangements with certain customers. These agreements constitute a binding commitment for the customers to purchase and for the Company to supply allocated commitment volumes in exchange for additional consideration. The consideration related to commitment fees is reported as revenues from sale of products as it is usually based on delivered quantities. Advances from customers received as part of those agreements are described in Note 14 and Note 17.
The payment terms typically range between 30 to 90 days.
The Company’s consolidated net revenues disaggregated by reportable segment are presented in Note 20. The following tables present the Company’s consolidated net revenues disaggregated by geographical region of shipment, nature and market channel:
F-45
| Year ended | ||||||||||||||||||||
| December 31, 2023 | December 31, 2022 | December 31, 2021 | ||||||||||||||||||
Net revenues by geographical region of shipment(1) | ||||||||||||||||||||
| EMEA | ||||||||||||||||||||
| Americas | ||||||||||||||||||||
| Asia Pacific | ||||||||||||||||||||
| Total net revenues | ||||||||||||||||||||
| Net revenues by nature | ||||||||||||||||||||
| Revenues from sale of products | ||||||||||||||||||||
| Revenues from sale of services | ||||||||||||||||||||
| Other revenues | ||||||||||||||||||||
| Total net revenues | ||||||||||||||||||||
Net revenues by market channel(2) | ||||||||||||||||||||
| Original Equipment Manufacturers (“OEM”) | ||||||||||||||||||||
| Distribution | ||||||||||||||||||||
| Total net revenues | ||||||||||||||||||||
(1)Net revenues by geographical region of shipment are classified by location of customer invoiced or reclassified by shipment destination in line with customer demand. For example, products ordered by U.S.-based companies to be invoiced to Asia Pacific affiliates are classified as Asia Pacific revenues. Furthermore, the Company, among the different periods, may be affected by shifts in shipments from one location to another, as requested by customers.
(2)Original Equipment Manufacturers (“OEM”) are the end-customers to which the Company provides direct marketing application engineering support, while Distribution refers to the distributors and representatives that the Company engages to distribute its products around the world.
The Company does not disclose the value of unsatisfied performance obligations for (i) contracts with an original expected length of one year or less and (ii) contracts for which the Company recognizes revenue at the amount to which the Company has the right to invoice for services performed.
In 2023, 2022 and 2021, the Company’s largest customer, Apple, represented 12.3 %, 16.8 % and 20.5 % of consolidated net revenues, respectively, reported in the ADG, AMS and MDG segments.
20. SEGMENT INFORMATION
The Company designs, develops, manufactures and markets a broad range of products, including discrete and standard commodity components, ASICs, full custom devices and semi-custom devices and ASSPs for analog, digital, and mixed-signal applications. In addition, the Company further participates in the manufacturing value chain of smartcard products, which includes the production and sale of both silicon chips and smartcards.
As of December 31, 2023, the Company’s reportable segments were as follows:
•Automotive and Discrete Group (ADG), comprised of dedicated automotive integrated circuits (“ICs”), and discrete and power transistor products.
•Analog, MEMS and Sensors Group (AMS), comprised of analog, smart power, MEMS sensors and actuators, and optical sensing solutions.
•Microcontrollers and Digital ICs Group (MDG), comprised of general-purpose microcontrollers and microprocessors, connected security products (e.g. embedded secured elements and NFC readers), memories (e.g. serial and page EEPROM) and RF and Communications products.
Net revenues of “Others” include revenues from sales assembly services and other revenues. For the computation of the segments’ internal financial measurements, the Company uses certain internal rules of allocation for the costs not directly chargeable to the segments, including cost of sales, SG&A expenses and a part of R&D expenses. In compliance with the Company’s internal policies, certain costs are not allocated to the segments, but reported in “Others”. Those comprise unused capacity charges, including reduced manufacturing activity due to COVID-19 and incidents leading to power outage, impairment, restructuring charges and other related closure costs, management reorganization expenses, start-up and phase-out costs, and other unallocated
F-46
income (expenses) such as: strategic or special R&D programs, certain corporate-level operating expenses, patent claims and litigations, and other costs that are not allocated to product groups, as well as operating earnings of other products. In addition, depreciation and amortization expense is part of the manufacturing costs allocated to the segments and is neither identified as part of the inventory variation nor as part of the unused capacity charges; therefore, it cannot be isolated in cost of sales. Finally, public grants are allocated to the Company’s segments proportionally to the incurred expenses on the sponsored projects.
Wafer costs are allocated to the segments based on actual cost. From time to time, with respect to specific technologies, wafer costs are allocated to segments based on market price.
The following tables present the Company’s consolidated net revenues and consolidated operating income by reportable segment.
Net revenues by reportable segment:
| December 31, 2023 | December 31, 2022 | December 31, 2021 | ||||||||||||||||||
| ADG | ||||||||||||||||||||
| AMS | ||||||||||||||||||||
| MDG | ||||||||||||||||||||
| Total net revenues of product segments | ||||||||||||||||||||
| Others | ||||||||||||||||||||
| Total consolidated net revenues | ||||||||||||||||||||
Operating income by reportable segment:
| December 31, 2023 | December 31, 2022 | December 31, 2021 | ||||||||||||||||||
| ADG | ||||||||||||||||||||
| AMS | ||||||||||||||||||||
| MDG | ||||||||||||||||||||
| Total operating income of product segments | ||||||||||||||||||||
Others(1) | ( | ( | ( | |||||||||||||||||
| Total consolidated operating income | ||||||||||||||||||||
(1)Operating income (loss) of “Others” includes items such as unused capacity charges, including unloading charges due to COVID-19 and incidents leading to power outage, impairment, restructuring charges and other related closure costs, management reorganization costs, start-up and phase-out costs, and other unallocated expenses such as: strategic or special R&D programs, certain corporate-level operating expenses, patent claims and litigations, and other costs that are not allocated to product groups, as well as operating earnings of other products.
F-47
The reconciliation of operating income of reportable segments to the total consolidated operating income is presented in the below table:
| December 31, 2023 | December 31, 2022 | December 31, 2021 | ||||||||||||||||||
| Total operating income of reportable segments | ||||||||||||||||||||
| Impairment, restructuring charges and other related closure costs | ( | |||||||||||||||||||
Impairment loss on intangible assets acquired through recent business combinations | ( | |||||||||||||||||||
| Start-up and phase-out costs | ( | ( | ||||||||||||||||||
| Unused capacity charges | ( | ( | ( | |||||||||||||||||
| Other unallocated manufacturing results | ( | ( | ||||||||||||||||||
| Gain on sale of non-current assets | ||||||||||||||||||||
Strategic and other research and development programs and other non-allocated provisions(1) | ( | ( | ( | |||||||||||||||||
| Total operating loss Others | ( | ( | ( | |||||||||||||||||
| Total consolidated operating income | ||||||||||||||||||||
(1)Includes unallocated income and expenses such as certain corporate-level operating expenses and other income (costs) that are not allocated to the product segments.
The following is a summary of operations by entities located within the indicated geographic areas for 2023, 2022 and 2021. Net revenues represent sales to third parties from the country in which each subsidiary is domiciled. The Company is incorporated under Dutch law with head offices located in the Netherlands while the Company’s operational office and headquarters are located in Switzerland. Long-lived assets consist of property, plant and equipment, net. A significant portion of property, plant and equipment expenditures is attributable to front-end and back-end facilities, located in the different countries in which the Company operates. As such, the Company mainly allocates capital spending resources according to geographic areas rather than along product segment areas.
Net revenues
| December 31, 2023 | December 31, 2022 | December 31, 2021 | ||||||||||||||||||
| Switzerland | ||||||||||||||||||||
| France | ||||||||||||||||||||
| Italy | ||||||||||||||||||||
| USA | ||||||||||||||||||||
| Singapore | ||||||||||||||||||||
| Japan | ||||||||||||||||||||
| Other countries | ||||||||||||||||||||
| Total net revenues | ||||||||||||||||||||
F-48
Property, plant and equipment, net
| December 31, 2023 | December 31, 2022 | |||||||||||||
| Netherlands | ||||||||||||||
| France | ||||||||||||||
| Italy | ||||||||||||||
| Other European countries | ||||||||||||||
| USA | ||||||||||||||
| Singapore | ||||||||||||||
| Malaysia | ||||||||||||||
| Other countries | ||||||||||||||
| Total property, plant and equipment, net | ||||||||||||||
21. OTHER INCOME AND EXPENSES, NET
Other income and expenses, net consisted of the following:
| Year ended December 31, 2023 | Year ended December 31, 2022 | Year ended December 31, 2021 | ||||||||||||||||||
| Public funding | ||||||||||||||||||||
| Start-up and phase-out costs | ( | ( | ||||||||||||||||||
| Exchange gain (loss), net | ||||||||||||||||||||
| Patent costs | ( | ( | ( | |||||||||||||||||
| Gain on sale of non-current assets | ||||||||||||||||||||
| COVID-19 incremental costs | ( | ( | ||||||||||||||||||
| Other, net | ( | ( | ( | |||||||||||||||||
| Total | ||||||||||||||||||||
The Company receives public funding from governmental bodies in several jurisdictions. Public funding is further described in Note 7.
Start-up costs represent costs incurred in the ramp-up phase of the Company’s newly integrated manufacturing facilities, primarily for the new 300mm fab in Agrate, Italy. Phase-out costs are costs incurred during the closing stage of a Company’s manufacturing facility.
Exchange gains and losses, net represent the portion of exchange rate changes on transactions denominated in currencies other than a subsidiary’s functional currency and the changes in fair value of derivative instruments which are not designated as hedges, as described in Note 26.
Patent costs mainly include legal and attorney fees and payment for claims, patent pre-litigation consultancy and legal fees. They are reported net of settlements, if any, which primarily include reimbursements of prior patent litigation costs.
COVID-19 incremental costs were mainly composed of incremental expenses primarily related to sanitary measures undertaken to protect employees. Starting January 1, 2023, the Company no longer reports Covid-19 related expenses as a component of the line “Other income and expenses, net” in the consolidated statement of income.
F-49
22. INTEREST INCOME (EXPENSE), NET
Interest income (expense), net consisted of the following:
| Year ended December 31, 2023 | Year ended December 31, 2022 | Year ended December 31, 2021 | ||||||||||||||||||
| Income | ||||||||||||||||||||
| Expense | ( | ( | ( | |||||||||||||||||
| Total | ( | |||||||||||||||||||
Interest income is related to cash and cash equivalents, short-term deposits and marketable securities held by the Company.
Interest income, net recorded in 2023 was composed of $226 million of interest income, partially offset by interest expense on borrowings and banking fees of $55 million.
Interest expense included the financial cost of the convertible bonds issued by the Company in 2020. On January 1, 2022, the Company adopted the new U.S. GAAP reporting guidance on distinguishing liabilities from equity and EPS. The new guidance was adopted by applying the modified retrospective method, under which prior year periods are not restated. Interest expense recorded in 2021 included a charge of $34 million related to the outstanding senior unsecured convertible bonds, mainly resulting from the non-cash accretion expense, as recorded under the previous accounting guidance. With the adoption of the new guidance, the finance cost of the convertible debt instruments outstanding at the date of adoption is limited to the amortization expense of debt issuance costs. The amortization expense of debt issuance costs amounted to $1 million for the year ended December 31, 2023, $1 million for the year ended December 31, 2022 and $3 million for the year ended December 31, 2021.
23. INCOME TAX
Income (loss) before income tax is comprised of the following:
| Year ended December 31, 2023 | Year ended December 31, 2022 | Year ended December 31, 2021 | ||||||||||||||||||
| Income (loss) recorded in the Netherlands | ( | ( | ( | |||||||||||||||||
| Income (loss) from foreign operations | ||||||||||||||||||||
| Income (loss) before income tax benefit (expense) | ||||||||||||||||||||
STMicroelectronics N.V. and its subsidiaries are individually liable for income taxes in their jurisdictions.
F-50
Income tax benefit (expense) is comprised of the following:
| Year ended December 31, 2023 | Year ended December 31, 2022 | Year ended December 31, 2021 | ||||||||||||||||||
| The Netherlands taxes - current | ||||||||||||||||||||
| Foreign taxes - current | ( | ( | ( | |||||||||||||||||
| Total current taxes | ( | ( | ( | |||||||||||||||||
| The Netherlands taxes - deferred | ||||||||||||||||||||
| Foreign taxes - deferred | ( | ( | ( | |||||||||||||||||
| Total deferred taxes | ( | ( | ( | |||||||||||||||||
| Income tax expense | ( | ( | ( | |||||||||||||||||
| Effective tax rate | % | % | % | |||||||||||||||||
The principal items comprising the differences in income taxes computed at the Netherlands statutory rate of 25.8 % in 2023, 25.8 % in 2022 and 25 % in 2021, and the effective income tax rate are the following:
| Year ended December 31, 2023 | Year ended December 31, 2022 | Year ended December 31, 2021 | ||||||||||||||||||
| Income tax benefit (expense) computed at statutory rate | ( | ( | ( | |||||||||||||||||
| Non-deductible and non-taxable permanent differences, net | ||||||||||||||||||||
| Change in valuation allowances | ( | |||||||||||||||||||
| Effect of changes in tax laws and similar | ||||||||||||||||||||
| Current year tax credits | ||||||||||||||||||||
| Other tax and credits | ( | ( | ||||||||||||||||||
| Benefits from tax holidays | ||||||||||||||||||||
| Net impact of changes to uncertain tax positions | ( | ( | ( | |||||||||||||||||
| Earnings of subsidiaries taxed at different rates | ||||||||||||||||||||
| Income tax benefit (expense) | ( | ( | ( | |||||||||||||||||
In 2022, the variation on the valuation allowance was related to the assessment of the recoverability of the deferred tax assets following the improved stability of profits of the Company in various jurisdictions.
The variation in the line "Effect of changes in tax laws and similar" in 2023 mainly relates to the recognition of a net deferred tax asset of $52 million related to a tax credit granted for technological activities, as well as the impact of the conclusion in 2023 of tax authority discussions resulting in the recognition of a net deferred tax asset of $81 million for intangibles recognized for tax purposes. These will be amortized over time and result in a future cash tax benefit.
The tax holidays represent a tax exemption period aimed to attract foreign technological investment in certain tax jurisdictions. The effect of the tax benefits, from tax holidays for countries which are profitable, on basic earnings per share was $0.05 , $0.07 and $0.05 for the years ended December 31, 2023, 2022 and 2021, respectively. These agreements are present in various countries and include programs that reduce up to and including 100
F-51
Component of the Net Deferred Tax Asset and Liability
Deferred tax assets and liabilities consisted of the following:
| December 31, 2023 | December 31, 2022 | |||||||||||||
| Tax loss carryforwards, tax credits and other tax attributes | ||||||||||||||
| Less unrecognized tax benefits | ( | ( | ||||||||||||
| Tax loss carryforwards, tax credits and other tax attributes, net of unrecognized tax benefits | ||||||||||||||
| Inventory valuation | ||||||||||||||
| Fixed asset depreciation | ||||||||||||||
| Increased depreciation incentives | ||||||||||||||
| Capitalized development costs | ||||||||||||||
| Receivables for government funding | ||||||||||||||
| Tax credits granted on capital investments | ||||||||||||||
| Pension | ||||||||||||||
| Stock awards | ||||||||||||||
| Operating lease liabilities | ||||||||||||||
| Commercial accruals | ||||||||||||||
| Other temporary differences | ||||||||||||||
| Total deferred tax assets | ||||||||||||||
| Valuation allowances | ( | ( | ||||||||||||
| Deferred tax assets, net | ||||||||||||||
| Accelerated fixed asset depreciation | ( | ( | ||||||||||||
| Acquired intangible assets | ( | ( | ||||||||||||
| Advances of government funding | ( | ( | ||||||||||||
| Operating lease right-of-use assets | ( | ( | ||||||||||||
| Other temporary differences | ( | ( | ||||||||||||
| Deferred tax liabilities | ( | ( | ||||||||||||
| Net deferred income tax asset | ||||||||||||||
For a particular tax-paying component of the Company and within a particular tax jurisdiction, all deferred tax liabilities and assets are offset and presented as a single amount in the balance sheet. The Company does not offset deferred tax liabilities and assets attributable to different tax-paying components or to different tax jurisdictions. The above table presents the deferred tax assets and liabilities before offset.
The variations in the lines "Tax losses carried forward, tax credits and other tax attributes" and "Valuation allowances” mainly include the recognition of deferred tax assets for a tax credit related to technological activities and the impact of the conclusion of discussions with the tax authorities for intangibles recognized for tax purposes, totaling $479 million decreased by $126 million related to the utilization of the tax losses in several jurisdictions following management’s assessment of the likelihood of future realization of the gross DTA recognized in the period.
The “Tax credits granted on capital investments” is mainly related to a 2003 agreement granting the Company certain tax credits for capital investments purchased through the year ending December 31, 2006. Any unused tax credits granted under the agreement will be impacted yearly by a legal inflationary index (currently 3.64% per annum). The credits may be utilized depending on the Company meeting certain program criteria and have no expiration date. In addition to this agreement, starting from 2007 the Company continues to receive tax credits on the yearly capital investments, which may be used to offset that year’s tax liabilities and increases by the legal inflationary rate. However, pursuant to the inability to utilize these credits currently and in future years,
F-52
the Company did not recognize any deferred tax asset on such tax allowance. As a result, there is no financial impact to the net deferred tax assets of the Company.
Deferred tax asset expiration
As of December 31, 2023, the Company and its subsidiaries have gross deferred tax assets on tax loss carryforwards, tax credits and other tax attributes that expire starting from 2024.
| December 31, | ||||||||
| Year | 2023 | |||||||
| 2024 | ||||||||
| 2025 | ||||||||
| 2026 | ||||||||
| 2027 | ||||||||
| 2028 | ||||||||
| Thereafter | ||||||||
| Total | ||||||||
The amount reported on the line “Thereafter” includes tax attributes that expire in 2029 for $276 million and tax credit which will expire in 2030 for $203 million. The majority of the remaining amount has no expiration date.
Deferred Tax expense recognized through Other Comprehensive Income
In 2023, the Company recognized a deferred tax expense of $4 million as a component of other comprehensive income (loss), compared to a deferred tax expense of $26 million in 2022. They were related primarily to the tax effects of the recognized unfunded status on defined benefits plan.
Deferred tax on undistributed Earnings from foreign subsidiaries
The cumulative amount of distributable earnings related to the Company’s investments in foreign subsidiaries and corporate joint ventures was $7,575 million and $7,140 million as of December 31, 2023 and December 31, 2022, respectively. Due to the Company’s legal and tax structure, with the parent company established in the Netherlands, there is no significant tax impact from the distribution of earnings for $6,965 million from investments in foreign subsidiaries and corporate joint ventures. This is because there is no tax impact on dividends paid up to a Dutch holding company by qualifying investments. The amount of distributable earnings becoming taxable upon repatriation amount to $607 million. An amount of $387 million is indefinitely reinvested by the foreign subsidiaries. As of December 31, 2023, a deferred tax liability is recognized for $22 million on the amount of earnings expected to be repatriated in a foreseeable future.
F-53
Unrecognized Tax Benefits
A reconciliation of 2023, 2022 and 2021 beginning and ending amounts of unrecognized tax benefits is as follows:
| December 31, 2023 | December 31, 2022 | December 31, 2021 | ||||||||||||||||||
| Balance at beginning of year | ||||||||||||||||||||
| Additions based on tax positions related to the current year | ||||||||||||||||||||
| Additions based on acquisitions related to the current year | ||||||||||||||||||||
| Additions for tax positions of prior years | ||||||||||||||||||||
| Reduction for tax positions of prior years | ( | ( | ||||||||||||||||||
| Settlements | ( | ( | ||||||||||||||||||
| Reductions due to lapse of statute of limitations | ( | |||||||||||||||||||
| Foreign currency translation | ( | ( | ||||||||||||||||||
| Balance at end of year | ||||||||||||||||||||
In addition, as of December 31, 2023, $21 million of unrecognized tax benefits were classified as a reduction of deferred tax assets (as of December 31, 2022, the amount was $25 million). It is reasonably possible that certain of the uncertain tax positions disclosed in the table above could increase or decrease within the next 12 months due to ongoing tax audits. The Company is not able to make an estimate of the range of the reasonably possible change impacting the annual effective tax rate.
Additionally, the Company elected to classify accrued interest and penalties related to uncertain tax positions as components of income tax expense in the consolidated statements of income. They were less than $1 million in 2023, less than $1 million in 2022 and $1 million in 2021. Accrued interest and penalties amounted to $6 million as of December 31, 2023 and $6 million as of December 31, 2022.
The tax years that remain open for review from the tax authorities in the Company’s major tax jurisdictions are from 1997 to 2023.
Pillar II income taxes
Pillar II legislation has been enacted in certain jurisdiction the Company operates (Netherlands, the majority of the European Countries and Switzerland). The legislation will be effective for the Company's financial year beginning January 1, 2024. The Company is in the scope and has performed a preliminary assessment of the potential exposure of the Pillar II incomes taxes.
The assessment of the potential exposure to Pillar II income taxes is based on the most recent tax filings, 2022 country-by-country reporting and financial statements for the constituent entities in the Company. Based on the assessment, the Pillar II effective tax rates in most of the jurisdictions are above 15%. However, there is a limited number of jurisdictions where the transitional safe harbour relief does not apply and the Pillar II effective tax rate is slightly below 15%. Therefore, the Company expects a limited tax exposure to Pillar II income taxes in those jurisdictions. Pillar II income taxes impact will depend on the level of 2024 operating results within those jurisdictions as well as potential enactment of the Pillar II legislation or change in tax laws in those jurisdictions.
F-54
24. EARNINGS PER SHARE
For the years ended December 31, 2023, 2022 and 2021, earnings per share (“EPS”) was calculated as follows:
| Year ended December 31, 2023 | Year ended December 31, 2022 | Year ended December 31, 2021 | ||||||||||||||||||
| Basic EPS | ||||||||||||||||||||
| Net income attributable to parent company as reported | ||||||||||||||||||||
| Weighted average number of shares outstanding | ||||||||||||||||||||
| Basic EPS | ||||||||||||||||||||
| Diluted EPS | ||||||||||||||||||||
| Net income attributable to parent company as reported | ||||||||||||||||||||
| add-back interest expense, net of income tax effect | ||||||||||||||||||||
| Net income attributable to parent company as adjusted | ||||||||||||||||||||
| Weighted average shares outstanding | ||||||||||||||||||||
| Dilutive effect of stock awards | ||||||||||||||||||||
| Dilutive effect of convertible bonds | ||||||||||||||||||||
| Number of shares used in calculating diluted EPS | ||||||||||||||||||||
| Diluted EPS | ||||||||||||||||||||
On January 1, 2022, the Company adopted the new guidance on distinguishing liabilities from equity and EPS by applying the modified retrospective method, under which prior year periods are not restated.
Under the previous guidance, the Company applied the treasury stock method to determine the dilutive effect of convertible bonds as past experience, existing stated policies, and the contractual terms of the bonds provided a reasonable basis to expect that the settlement would include cash, shares, or a mix of both.
With the adoption of the new guidance, the treasury stock method is no longer admitted and the application of the if-converted method is mandatory to determine the dilutive effect of convertible bonds. The senior unsecured convertible bonds issued on August 4, 2020 are consequently fully dilutive, with the total underlying shares presented in the line “Dilutive effect of convertible bonds” of the table above for the years ended December 31, 2023 and December 31, 2022.
25. COMMITMENTS, CONTINGENCIES, CLAIMS AND LEGAL PROCEEDINGS
The Company's commitments relate to multi-annual agreements with suppliers when there is a fixed, non-cancelable commitment or when minimum payments are due on a committed delivery schedule. These commitments are primarily comprised of purchase commitments for outsourced foundry wafers ($1.1 billion) and firm contractual commitments related to power purchase and minimum energy efficiency, as part of the Company's actions to become carbon neutral by 2027 on scope 1 and 2 and partially scope 3 ($0.8 billion).
The Company is subject to possible loss contingencies arising in the ordinary course of business. These include but are not limited to: product liability claims and/or warranty cost on the products of the Company, contractual disputes, indemnification claims, claims for unauthorized use of third-party intellectual property, employee grievances, tax claims beyond assessed uncertain tax positions as well as claims for environmental damages. In determining loss contingencies, the Company considers the likelihood of impairing an asset or the incurrence of a liability at the date of the consolidated financial statements as well as the ability to reasonably estimate the amount of such loss. The Company records a provision for a loss contingency when information available before the consolidated financial statements are issued or are available to be issued indicates that it is probable that an asset has been impaired or a liability has been incurred at the date of the consolidated financial statements and when the amount of loss can be reasonably estimated. The Company regularly re-evaluates claims to determine whether provisions need to be readjusted based on the most current information available to the Company. Changes in these evaluations could result in an adverse material impact on the Company’s results of operations, cash flows or its financial position for the period in which they occur.
F-55
The Company has received and may in the future receive communications alleging possible infringements of third-party patents or other third-party intellectual property rights. Furthermore, the Company from time to time enters into discussions regarding a broad patent cross license arrangement with other industry participants. There is no assurance that such discussions may be brought to a successful conclusion and result in the intended agreement. The Company may become involved in costly litigation brought against the Company regarding patents, mask works, copyrights, trademarks or trade secrets. In the event that the outcome of any litigation would be unfavorable to the Company, the Company may be required to take a license to third-party patents and/or other intellectual property rights at economically unfavorable terms and conditions, and possibly pay damages for prior use and/or face an injunction, all of which individually or in the aggregate could have a material adverse effect on the Company’s results of operations, cash flows, financial position and/or ability to compete.
On December 4, 2023, a jury in the United States District Court for the Western District of Texas in Waco, Texas (USA) returned a verdict in a patent infringement lawsuit in favor of the plaintiff, Purdue University. The Court has not issued final judgment. If the Court issues a final judgment in the plaintiff’s favor, the Company will file post-trial motions and, if they are denied, the Company will file an appeal to the United States Court of Appeals for the Federal Circuit in Washington DC. The risk on this case is considered as possible and, based on the jury verdict, the possible loss is estimated at $32 million.
The Company has contractual commitments to various customers which could require the Company to incur costs to repair or replace defective products it supplies to such customer. The duration of these contractual commitments varies and, in certain cases, is indefinite. The Company is otherwise also involved in various lawsuits, claims, inquiries, inspections, investigations and/or proceedings incidental to its business and operations. Such matters, even if not meritorious, could result in the expenditure of significant financial or managerial resources. Any of the foregoing could have a material adverse effect on the Company’s results of operations, cash flows or its financial position.
The Company regularly evaluates claims and legal proceedings together with their related probable losses to determine whether they need to be adjusted based on the current information available to the Company. There can be no assurance that its recorded reserves will be sufficient to cover the extent of its potential liabilities. Legal costs associated with claims are expensed as incurred. In the event of litigation which is adversely determined with respect to the Company’s interests, or in the event the Company needs to change its evaluation of a potential third-party claim, based on new evidence or communications, a material adverse effect could impact its operations or financial condition at the time it were to materialize.
As of December 31, 2023 and 2022, respectively, provisions for estimated probable losses with respect to claims and legal proceedings were not considered material.
26. FINANCIAL INSTRUMENTS AND RISK MANAGEMENT
26.1 Financial risk factors
The Company is exposed to changes in financial market conditions in the normal course of business due to its operations in different foreign currencies and its ongoing investing and financing activities. The Company’s activities expose it to a variety of financial risks: market risk (including foreign exchange risk, fair value interest rate risk, cash flow interest rate risk and price risk), credit risk and liquidity risk. The Company’s overall risk management program focuses on the unpredictability of financial markets and seeks to minimize potential adverse effects on the Company’s financial performance. The Company uses derivative financial instruments to hedge certain risk exposures.
Financial risk management is carried out by a central treasury department (Corporate Treasury). Additionally, a Treasury Committee, chaired by the Chief Financial Officer, steers treasury activities and ensures compliance with corporate policies. Treasury activities are thus regulated by the Company’s policies, which define procedures, objectives and controls. The policies focus on managing financial risk in terms of exposure to market risk, credit risk and liquidity risk. Treasury controls are subject to internal audits. Most treasury activities are centralized, with any local treasury activities subject to oversight from Corporate Treasury. Corporate Treasury identifies, evaluates and hedges financial risks in close cooperation with the Company’s subsidiaries. It provides written principles for overall risk management, as well as written policies covering specific areas, such as foreign exchange risk, interest rate risk, price risk, credit risk, use of derivative financial instruments, and investments of excess liquidity.
F-56
The majority of cash and cash equivalents is held in U.S. dollars and Euros and is placed with financial institutions rated at least a single “A” long-term rating from two of the major rating agencies, meaning at least A3 from Moody’s and A- from S&P and Fitch, or better. These ratings are closely and continuously monitored in order to manage exposure to the counterparty’s risk. Hedging transactions are performed only to hedge exposures deriving from operating, investing and financing activities conducted in the normal course of business.
Market risk
Foreign exchange risk
The Company conducts its business globally in various major international currencies. As a result, the Company is exposed to adverse movements in foreign currency exchange rates, primarily regarding the Euro. Foreign exchange risk mainly arises from recognized assets and liabilities at the Company’s subsidiaries and future commercial transactions.
Management has set up a policy to require the Company’s subsidiaries to hedge their entire foreign exchange risk exposure with the Company through financial instruments transacted or overseen by Corporate Treasury. Subsidiaries use forward contracts and purchased currency options to manage their foreign exchange risk arising from foreign-currency-denominated assets and liabilities. Foreign exchange risk arises when recognized assets and liabilities are denominated in a currency that is not the entity’s functional currency. These instruments do not qualify as hedging instruments for accounting purposes. Forward contracts and currency options, including collars, are also used by the Company to reduce its exposure to U.S. dollar fluctuations in Euro-denominated forecasted transactions that cover a large part of its R&D and corporate costs expenses as well as a portion of its front-end manufacturing costs of semi-finished goods. The Company also hedges through the use of currency forward contracts certain Singapore dollar-denominated manufacturing forecasted transactions. The derivative instruments used to hedge these forecasted transactions meet the criteria for designation as cash flow hedge. The hedged forecasted transactions have a high probability of occurring for hedge accounting purposes.
It is the Company’s policy to have the foreign exchange exposures in all the currencies hedged month by month against the monthly standard rate. At each month end, the forecasted flows for the coming month are hedged together with the fixing of the new standard rate. For this reason, the hedging transactions will have an exchange rate very close to the standard rate at which the forecasted flows will be recorded in the following month. As such, the foreign exchange exposure of the Company, which consists of the balance sheet positions and other contractually agreed transactions, is always close to zero and any movement in the foreign exchange rates will therefore not influence the exchange effect on items of the consolidated statement of income. Any discrepancy between the forecasted values and the actual results is constantly monitored and prompt actions are taken, if needed.
Derivative Instruments Not Designated as a Hedge
The Company enters into foreign currency forward contracts to reduce its exposure to changes in exchange rates and the associated risk arising from the denomination of certain assets and liabilities in foreign currencies at the Company’s subsidiaries. These include receivables from international sales by various subsidiaries, payables for foreign currency-denominated purchases and certain other assets and liabilities arising from intercompany transactions.
The notional amount of these financial instruments totaled $974 million, $931 million and $505 million on December 31, 2023, 2022 and 2021, respectively. The principal currencies covered at the end of the year 2023 are the China Yuan Renminbi, the Singapore dollar, the Euro, the Japanese yen, the Swiss franc, the Indian rupee, the Malaysian ringgit, the Moroccan dirham, the Philippines peso, the Swedish krona, the Taiwan dollar, and the South Korean won.
The risk of loss associated with forward contracts is equal to the exchange rate differential from the time the contract is entered into until the time it is settled. The risk of loss associated with purchased currency options is equal to the premium paid when the option is not exercised.
Foreign currency forward contracts not designated as cash flow hedge outstanding as of December 31, 2023 have remaining terms of 3 days to 166 days, maturing on average after 47 days.
F-57
Derivative Instruments Designated as a Hedge
To further reduce its exposure to U.S. dollar exchange rate fluctuations, the Company hedges through the use of currency forward contracts and currency options, including collars, certain Euro-denominated forecasted intercompany transactions that cover at year-end a large part of its R&D and SG&A expenses, as well as a portion of its front-end manufacturing costs of semi-finished goods within cost of sales. The Company also hedges through the use of currency forward contracts certain manufacturing transactions within cost of sales denominated in Singapore dollars.
The principles regulating the hedging strategy for derivatives designated as cash flow hedge are established as follows: (i) for R&D and corporate costs, up to 80 % of the total forecasted transactions; (ii) for manufacturing costs, up to 70 % of the total forecasted transactions. In order to follow a dynamic hedge strategy, the Company may change the percentage of the designated hedged item within the limit of 100 % of the forecasted transaction. The maximum length of time over which the Company could hedge its exposure to the variability of cash flows for forecasted transactions is 24 months.
For the year ended December 31, 2023, the Company recorded a decrease in cost of sales of $1 million and a decrease in operating expenses of $4 million, related to the realized gains incurred on such hedged transactions. For the year ended December 31, 2022, the Company recorded an increase in cost of sales of $129 million and an increase in operating expenses of $68 million, related to the realized losses incurred on such hedged transactions. For the year ended December 31, 2021, the Company recorded a decrease in cost of sales of $15 million and a decrease in operating expenses of $4 million, related to the realized gains incurred on such hedged transactions.
The notional amount of foreign currency forward contracts and currency options, including collars, designated as cash flow hedge totaled $2,681 million, $3,192 million and $2,165 million on December 31, 2023, 2022 and 2021, respectively. The forecasted transactions hedged as of December 31, 2023 were determined to have a high probability of occurring.
As of December 31, 2023, $55 million of deferred gains on derivative instruments included in “Accumulated other comprehensive income (loss)” in the consolidated statements of equity were expected to be reclassified as earnings during the next 12 months based on the monthly forecasted R&D expenses, corporate costs and semi-finished manufacturing costs. Foreign currency forward contracts and collars designated as cash flow hedge outstanding as of December 31, 2023 have remaining terms of 4 days to 13 months, maturing on average after 113 days.
As of December 31, 2023, the Company had the following outstanding derivative instruments that were entered into to hedge Euro-denominated and Singapore dollar-denominated forecasted transactions:
| In millions of Euros | Notional amount for hedge on forecasted R&D and other operating expenses | Notional amount for hedge on forecasted manufacturing costs | ||||||||||||
| Forward contracts | ||||||||||||||
| Currency collars | ||||||||||||||
| In millions of Singapore dollars | Notional amount for hedge on forecasted R&D and other operating expenses | Notional amount for hedge on forecasted manufacturing costs | ||||||||||||
| Forward contracts | ||||||||||||||
Cash flow and fair value interest rate risk
The Company’s interest rate risk arises from long-term borrowings. Borrowings issued at variable rates expose the Company to cash flow interest rate risk. Borrowings issued at fixed rates expose the Company to fair value interest rate risk.
The Company analyses its interest rate exposure on a dynamic basis. Various scenarios are simulated taking into consideration refinancing, renewal of existing positions, alternative financing and hedging. The Company invests primarily on a short-term basis and as such the Company’s liquidity is invested in floating interest rate
F-58
instruments. As a consequence, the Company is exposed to interest rate risk due to potential mismatch between the return on its short-term floating interest rate investments and the portion of its long-term debt issued at fixed rate.
Price risk
As part of its ongoing investing activities, the Company may invest in publicly traded equity securities and be exposed to equity security price risk. In order to hedge the exposure to this market risk, the Company may enter into certain derivative hedging transactions.
Information on fair value of derivative instruments and their location in the consolidated balance sheets as of December 31, 2023 and December 31, 2022 is presented in the table below:
| As of December 31, 2023 | As of December 31, 2022 | |||||||||||||||||||
| Asset Derivatives | Balance sheet classification | Fair value | Fair value | |||||||||||||||||
| Derivatives designated as a hedge: | ||||||||||||||||||||
| Foreign exchange forward contracts | Other current assets | |||||||||||||||||||
| Foreign exchange forward contracts | Other non-current assets | |||||||||||||||||||
| Currency collars | Other current assets | |||||||||||||||||||
| Currency collars | Other non-current assets | |||||||||||||||||||
| Total derivatives designated as a hedge: | ||||||||||||||||||||
| Derivatives not designated as a hedge: | ||||||||||||||||||||
| Foreign exchange forward contracts | Other current assets | |||||||||||||||||||
| Total derivatives not designated as a hedge: | ||||||||||||||||||||
| Total Derivatives | ||||||||||||||||||||
| As of December 31, 2023 | As of December 31, 2022 | |||||||||||||||||||
| Liability Derivatives | Balance sheet classification | Fair value | Fair value | |||||||||||||||||
| Derivatives designated as a hedge: | ||||||||||||||||||||
| Foreign exchange forward contracts | Other payables and accrued liabilities | ( | ( | |||||||||||||||||
| Foreign exchange forward contracts | Other non-current liabilities | ( | ||||||||||||||||||
| Currency collars | Other payables and accrued liabilities | ( | ||||||||||||||||||
| Currency collars | Other long-term liabilities | ( | ||||||||||||||||||
| Total derivatives designated as a hedge: | ( | ( | ||||||||||||||||||
| Derivatives not designated as a hedge: | ||||||||||||||||||||
| Foreign exchange forward contracts | Other payables and accrued liabilities | ( | ( | |||||||||||||||||
| Total derivatives not designated as a hedge: | ( | ( | ||||||||||||||||||
| Total Derivatives | ( | ( | ||||||||||||||||||
The Company entered into currency collars as combinations of two options, which are reported, for accounting purposes, on a net basis. As of December 31, 2023, the fair value of these collars represented assets for a net amount of $7 million (composed of $8 million assets offset with a $1 million liability). In addition, the Company entered into other derivative instruments, primarily forward contracts, which are governed by standard International Swaps and Derivatives Association (“ISDA”) agreements and are compliant with Protocols of the
F-59
European Market Infrastructure Regulation (“EMIR”), which are not offset in the statement of financial position and representing total assets of $53 million and liabilities of $4 million as of December 31, 2023.
The effect of derivative instruments designated as cash flow hedge on the consolidated statements of income for the year ended December 31, 2023 and December 31, 2022 and on the “Accumulated other comprehensive income (loss)” (“AOCI”) as reported in the consolidated statements of equity as of December 31, 2023 and December 31, 2022 is presented in the table below:
| Gain (loss) deferred in OCI on derivative | Location of gain (loss) | Gain (loss) reclassified from OCI into earnings | ||||||||||||||||||||||||||||||
| December 31, 2023 | December 31, 2022 | reclassified from OCI into earnings | December 31, 2023 | December 31, 2022 | ||||||||||||||||||||||||||||
| Foreign exchange forward contracts | Cost of sales | ( | ||||||||||||||||||||||||||||||
| Foreign exchange forward contracts | Selling, general and administrative expenses | ( | ||||||||||||||||||||||||||||||
| Foreign exchange forward contracts | Research and development expenses | ( | ||||||||||||||||||||||||||||||
| Currency collars | Cost of sales | ( | ||||||||||||||||||||||||||||||
| Currency collars | Selling, general and administrative expenses | ( | ||||||||||||||||||||||||||||||
| Currency collars | Research and development expenses | ( | ||||||||||||||||||||||||||||||
| Total | ( | |||||||||||||||||||||||||||||||
No significant ineffective portion of the cash flow hedge relationships was recorded in earnings for the years ended December 31, 2023 and December 31, 2022. No amount was excluded from effectiveness measurement on foreign exchange forward contracts and collars.
The effect on the consolidated statements of income for the year ended December 31, 2023 and December 31, 2022 of derivative instruments not designated as a hedge is presented in the table below:
| Location of gain | Gain (loss) recognized in earnings | |||||||||||||||||||
| (loss) recognized in earnings | December 31, 2023 | December 31, 2022 | ||||||||||||||||||
| Foreign exchange forward contracts | ||||||||||||||||||||
| Total | ||||||||||||||||||||
The Company did not enter into any derivative containing significant credit-risk-related contingent features.
Credit risk
The expected credit loss and impairment methodology applied on each category of financial assets is further described in each respective note. While cash and cash equivalents are also subject to the expected credit loss model, the identified expected credit loss is deemed to be immaterial. The maximum credit risk exposure for all financial assets is their carrying amount.
Credit risk is the risk that a counterparty will not meet its obligations under a financial instrument or customer contract, leading to a financial loss. Credit risk typically arises from cash and cash equivalents, contractual cash flows of debt investments carried at amortized cost, the counterparty of derivative financial instruments and deposits with banks and financial institutions, as well as credit exposure to customers, including outstanding receivables.
F-60
The Company is exposed to credit risk from its operating activities (primarily for trade receivables) and from its financing activities, including deposits with banks and financial institutions, foreign exchange transactions and other financial instruments. Credit risk is managed at the Group level. The Company selects banks and/or financial institutions that operate with the group based on the criteria of long-term rating from at least two major Rating Agencies and keeping a maximum outstanding amount per instrument with each bank not to exceed 20 % of the total. For derivative financial instruments, management has established limits so that, at any time, the fair value of contracts outstanding is not concentrated with any individual counterparty.
The Company monitors the creditworthiness of its customers to which it grants credit terms in the normal course of business. If certain customers are independently rated, these ratings are used. Otherwise, if there is no independent rating, risk control assesses the customer’s credit quality, considering its financial position, past experience and other factors. The utilization of credit limits is regularly monitored. Sales to customers are primarily settled in cash, which mitigates credit risk. As of December 31, 2023 and 2022, no 10
The Company’s investments in instruments carried at amortized cost primarily include receivables towards government bodies. As such, they are investments with immaterial expected credit loss. Any remaining receivable is of low credit risk and is individually not significant. The credit ratings of the investments are monitored for credit deterioration.
Liquidity risk
Prudent liquidity risk management includes maintaining sufficient cash and cash equivalents, short-term deposits and marketable securities, the availability of funding from committed credit facilities and the ability to close out market positions. The Company’s objective is to maintain a significant cash position and a low debt-to-equity ratio, which ensures adequate financial flexibility. Liquidity management policy is to finance the Company’s investments with net cash from operating activities.
Management monitors rolling forecasts of the Company’s liquidity reserve based on expected cash flows.
26.2 Capital risk management
The Company’s objectives when managing capital are to safeguard the Company’s ability to continue as a going concern in order to create sustainable value, benefits and returns for its stakeholders, as to maintain an optimal capital structure. In order to maintain or adjust its capital structure, the Company may review the amount of dividends paid to shareholders, return capital to shareholders, or issue new shares.
Consistent with other peers in the industry, the Company monitors capital on the basis of the net debt-to-equity ratio. This ratio is calculated as the net financial position of the Company, defined as the difference between total cash position (cash and cash equivalents, short-term deposits, marketable securities and restricted cash, if any) and total financial debt (short-term and long-term debt), divided by total parent company stockholders’ equity.
26.3 Fair value measurement
The fair value of financial instruments traded in active markets is based on quoted market prices at the balance sheet date. The quoted market price used for financial assets held by the Company is the bid price. If the market for a financial asset is not active and if no observable market price is obtainable, the Company measures fair value by using significant assumptions and estimates. When measuring fair value, the Company makes maximum use of market inputs and minimizes the use of unobservable inputs.
F-61
The table below details financial assets (liabilities) measured at fair value on a recurring basis as of December 31, 2023:
| Fair Value Measurements using | ||||||||||||||||||||||||||
| December 31, 2023 | Quoted Prices in Active Markets for Identical Assets (Level 1) | Significant Other Observable Inputs (Level 2) | Significant Unobservable Inputs (Level 3) | |||||||||||||||||||||||
| Marketable securities – U.S. Treasury debt securities | — | — | ||||||||||||||||||||||||
| Short-term deposits | — | — | ||||||||||||||||||||||||
| Equity securities measured at fair value through earnings | — | — | ||||||||||||||||||||||||
| Derivative assets designated as cash flow hedge | — | — | ||||||||||||||||||||||||
| Derivative assets not designated as cash flow hedge | — | — | ||||||||||||||||||||||||
| Derivative liabilities designated as cash flow hedge | ( | — | ( | — | ||||||||||||||||||||||
| Derivative liabilities not designated as cash flow hedge | ( | — | ( | — | ||||||||||||||||||||||
| Contingent consideration on business acquisition | ( | — | — | ( | ||||||||||||||||||||||
| Total | ( | |||||||||||||||||||||||||
The table below details financial assets (liabilities) measured at fair value on a recurring basis as of December 31, 2022:
| Fair Value Measurements using | ||||||||||||||||||||||||||
| December 31, 2022 | Quoted Prices in Active Markets for Identical Assets (Level 1) | Significant Other Observable Inputs (Level 2) | Significant Unobservable Inputs (Level 3) | |||||||||||||||||||||||
| Marketable securities – U.S. Treasury debt securities | — | — | ||||||||||||||||||||||||
| Short-term deposits | — | — | ||||||||||||||||||||||||
| Equity securities measured at fair value through earnings | — | — | ||||||||||||||||||||||||
| Derivative assets designated as cash flow hedge | — | — | ||||||||||||||||||||||||
| Derivative assets not designated as cash flow hedge | — | — | ||||||||||||||||||||||||
| Derivative liabilities designated as cash flow hedge | ( | — | ( | — | ||||||||||||||||||||||
| Derivative liabilities not designated as cash flow hedge | ( | — | ( | — | ||||||||||||||||||||||
| Contingent consideration on business acquisitions | ( | — | — | ( | ||||||||||||||||||||||
| Total | ( | |||||||||||||||||||||||||
For liabilities measured at fair value on a recurring basis using significant unobservable inputs (Level 3), the reconciliation between January 1, 2023 and December 31, 2023 is presented as follows:
| Fair Value Measurements using Significant Unobservable Inputs (Level 3) | ||||||||
| January 1, 2023 | ||||||||
| Changes in fair value measurement | ( | |||||||
| Currency translation adjustment | ||||||||
| December 31, 2023 | ||||||||
| Amount of total gains (losses) for the period included in earnings attributable to liabilities still held at the reporting date | ||||||||
Contingent consideration reported as liabilities on the consolidated balance sheet as of December 31, 2023 and December 31, 2022 is based on the probability that the milestones defining the variable components of the
F-62
consideration will be achieved. In 2023, the probability of achievement of these variable components was reassessed, resulting in a reduction of $12 million of the fair value of the contingent consideration related to a certain business acquisition from 2020. The Company reported this change in fair value in the line “” of the consolidated statement of income.
For liabilities measured at fair value on a recurring basis using significant unobservable inputs (Level 3), the reconciliation between January 1, 2022 and December 31, 2022 is presented as follows:
| Fair Value Measurements using Significant Unobservable Inputs (Level 3) | ||||||||
| January 1, 2022 | ||||||||
| Changes in fair value measurement | ( | |||||||
| Currency translation adjustment | ( | |||||||
| Payments made | ( | |||||||
| December 31, 2022 | ||||||||
| Amount of total gains (losses) for the period included in earnings attributable to liabilities still held at the reporting date | ||||||||
The Company evaluated in 2023, 2022 and 2021 for impairment the aggregate carrying amount of long-term investments for which the Company applies the cost method as a measurement alternative, as described in Note 2.22. No
The following table includes additional fair value information on financial assets and liabilities as of December 31, 2023 and 2022:
| 2023 | 2022 | |||||||||||||||||||||||||||||||
| Level | Carrying Amount | Estimated Fair Value | Carrying Amount | Estimated Fair Value | ||||||||||||||||||||||||||||
Cash equivalents (1) | 1 | |||||||||||||||||||||||||||||||
| Marketable securities | 1 | |||||||||||||||||||||||||||||||
| Short-term, deposits | 1 | |||||||||||||||||||||||||||||||
| Long-term debt | ||||||||||||||||||||||||||||||||
| – Bank loans (including current portion) | 2 | |||||||||||||||||||||||||||||||
| – Finance leases (including current portion) | 2 | |||||||||||||||||||||||||||||||
– Senior unsecured convertible bonds issued on August 4, 2020 (2) | 1 | |||||||||||||||||||||||||||||||
(1) Cash equivalents primarily correspond to deposits at call with banks.
(2) The carrying amount as of December 31, 2023, of the senior unsecured convertible bonds as reported above, corresponds to the nominal value of the bonds, net of $4 million unamortized debt issuance costs. The fair value represented the market price of the bonds trading on the Frankfurt Stock Exchange.
F-63
The methodologies used to estimate fair value are as follows:
| Components | Methodology used to estimate fair value | ||||
| Debt securities classified as available-for-sale | Quoted market prices for identical instruments | ||||
| Foreign exchange forward contracts, currency options and collars | Quoted market prices for similar instruments | ||||
| Equity securities measured at fair value through earnings | Quoted market prices for identical instruments | ||||
| Equity securities carried at cost as a measurement alternative | Valuation of the underlying investments on a new round of third-party financing or upon liquidation | ||||
| Long-term debt and current portion of long-term debt | Future cash flows on a borrowing-by-borrowing basis and discounting these future cash flows using the Company's incremental borrowing rates for similar types of borrowing arrangements. For convertible bonds, the fair value represents the market price of the bonds trading on the Frankfurt Stock Exchange | ||||
| Cash and cash equivalents, short-term deposits, accounts receivable, short-term borrowings, and accounts payable | The carrying amounts reflected in the consolidated financial statements are considered as reasonable estimates of fair value due to the relatively short period of time between the origination of the instruments and their expected realization. | ||||
27. RELATED PARTY TRANSACTIONS
The below table summarizes transactions incurred in 2023, 2022 and 2021 with companies for which certain members of the Company’s management perform similar policymaking functions. These include, but are not limited to: Orange, Idemia France and Politecnico di Milano. The amounts reported on the below table correspond to transactions up to the date members of the Company's management hold these similar functions.
| December 31, | December 31, | December 31, | ||||||||||||||||||
| 2023 | 2022 | 2021 | ||||||||||||||||||
| Sales and services | ||||||||||||||||||||
| Purchases and other contributions | ||||||||||||||||||||
| Accounts receivable | ||||||||||||||||||||
| Accounts payable | ||||||||||||||||||||
The Company did not hold any significant equity-method investments as of December 31, 2023, 2022 and 2021. Consequently, the Company did not report any material transaction with this type of investees in the corresponding years.
The Company made a cash contribution of $1 million for the year ended December 31, 2023 to the ST Foundation, a non-profit organization established to deliver and co-ordinate independent programs in line with its mission. A cash contribution of $1.0 million and $0.5 million was made for each of the years ended December 31, 2022 and 2021, respectively. Certain members of the Foundation’s Board are senior members of the Company’s management.
28. SUBSEQUENT EVENTS
In the first quarter of 2024, the Company announced its product group reorganization to further accelerate the Company's time-to-market and speed of product development innovation and efficiency. This new organization implies a change in segment reporting which will be applied in 2024.
F-64
STMICROELECTRONICS N.V.
VALUATION AND QUALIFYING ACCOUNTS
| Valuation and qualifying accounts deducted from the related asset accounts | Balance at beginning of period | Translation adjustment | Charged to costs and expenses | Additions/ (Deductions) | Balance at end of period | |||||||||||||||||||||||||||
| (Currency—millions of U.S. dollars) | ||||||||||||||||||||||||||||||||
| 2023 | ||||||||||||||||||||||||||||||||
| Accounts Receivable | $ | $ | — | $ | — | $ | ( | $ | ||||||||||||||||||||||||
| Deferred Tax Assets | $ | $ | $ | $ | $ | |||||||||||||||||||||||||||
| 2022 | ||||||||||||||||||||||||||||||||
| Accounts Receivable | $ | $ | — | $ | — | $ | $ | |||||||||||||||||||||||||
| Deferred Tax Assets | $ | $ | ( | $ | ( | $ | ( | $ | ||||||||||||||||||||||||
| 2021 | ||||||||||||||||||||||||||||||||
| Accounts Receivable | $ | $ | — | $ | — | $ | $ | |||||||||||||||||||||||||
| Deferred Tax Assets | $ | $ | ( | $ | ( | $ | ( | $ | ||||||||||||||||||||||||
S-1