UNITED STATES
SECURITIES AND EXCHANGE COMMISSION
Washington, D.C. 20549
FORM 10-K
ANNUAL REPORT PURSUANT TO SECTION 13 OR 15(D) OF THE SECURITIES EXCHANGE ACT OF 1934
For the fiscal year ended December 31 , 2023
| Commission file number: | ||||||||||||||

(Exact Name of Registrant as Specified in its Charter)
| (State of Incorporation) | (I.R.S. Employer Identification No.) | |||||||
| (Address of Principal Executive Offices) | (Zip Code) | ||||||||||||||||
(248 ) 208-2500
(Registrant's telephone number, including area code)
Securities registered pursuant to Section 12(b) of the Act:
| Title of each class | Trading Symbol(s) | Name of each exchange on which registered | ||||||||||||
Indicate by check mark if the Registrant is a well-known seasoned issuer, as defined in Rule 405 of the Securities Act. Yes ☒ No ☐
Indicate by check mark if the Registrant is not required to file reports pursuant to Section 13 or 15(d) of the Exchange Act. Yes ☐ No ☒
Indicate by check mark whether the Registrant (1) has filed all reports required to be filed by Section 13 or 15(d) of the Securities Exchange Act of 1934 during the preceding 12 months (or for such shorter period that the Registrant was required to file such reports), and (2) has been subject to such filing requirements for the past 90 days. Yes ☒ No ☐
Indicate by check mark whether the Registrant has submitted electronically every Interactive Data File required to be submitted pursuant to Rule 405 of Regulation S-T (§232.405 of this chapter) during the preceding 12 months (or for such shorter period that the Registrant was required to submit and post such files). Yes ☒ No ☐
Indicate by check mark whether the Registrant is a large accelerated filer, an accelerated filer, a non-accelerated filer, a smaller reporting company or an emerging growth company. See the definitions of "large accelerated filer," "accelerated filer," "smaller reporting company" and "emerging growth company" in Rule 12b-2 of the Exchange Act.
| Accelerated filer | Non-accelerated filer | Smaller reporting company | Emerging growth company | |||||||||||
| ☒ | ☐ | ☐ | ||||||||||||
If an emerging growth company, indicate by check mark if the Registrant has elected not to use the extended transition period for complying with any new or revised financial accounting standards provided pursuant to Section 13(a) of the Exchange Act. ☐
Indicate by check mark whether the Registrant has filed a report on and attestation to its management's assessment of the effectiveness of its internal control over financial reporting under Section 404(b) of the Sarbanes-Oxley Act (15 U.S.C. 7262(b)) by the registered public accounting firm that prepared or issued its audit report. ☒
If securities are registered pursuant to Section 12(b) of the Act, indicate by check mark whether the financial statements of the Registrant included in the filing reflect the correction of an error to previously issued financial statements. ☒
Indicate by check mark whether any of those error corrections are restatements that required a recovery analysis of incentive-based compensation received by any of the Registrant's executive officers during the relevant recovery period pursuant to Section 240.10D-1(b). ☐
Indicate by check mark whether the Registrant is a shell company (as defined in Rule 12b-2 of the Exchange Act). Yes ☐ No ☒
As of June 30, 2023, the aggregate market value of the Registrant's stock held by non-affiliates of the Registrant was $15,934,604,486 (computed by reference to the closing sales price of the Registrant's common stock as of June 30, 2023). For this computation, the Registrant has excluded the market value of all shares of common stock reported as beneficially owned by executive officers and directors of the Registrant; such exclusion shall not be deemed to constitute an admission that any such person is an affiliate of the Registrant.
Number of shares of Common Stock, $0.01 par value per share, outstanding as of February 20, 2024: 124,412,183
Documents Incorporated By Reference
Unless provided in an amendment to this Annual Report on Form 10-K, the information required by Part III is incorporated by reference to the Registrant's proxy statement to be filed pursuant to Regulation 14A, with respect to the Registrant's 2024 annual meeting of shareholders.
Explanatory Note
Sun Communities, Inc. is filing this comprehensive Annual Report on Form 10-K for the fiscal year ended December 31, 2023 (this "Annual Report"). This Annual Report contains our audited financial statements for the fiscal years ended December 31, 2023, 2022 and 2021, as well as restated unaudited financial information as of and for the three months ended March 31, 2023, the three and six months ended June 30, 2023 and the three and nine months ended September 30, 2023 (collectively, the "Interim Financial Statements").
Restatement Background
In 2022, we acquired a portfolio of holiday park properties located in the United Kingdom, which we refer to as our Park Holidays business, a reporting unit within our manufactured housing segment. As disclosed in our Current Report on Form 8-K filed with the Securities and Exchange Commission ("SEC") on February 20, 2024, during the course of management's 2023 year-end procedures, we reviewed the controls relating to the valuation of the Park Holidays business and the associated goodwill at March 31, 2023, June 30, 2023 and September 30, 2023. In connection with that review, we concluded that there were triggering events relevant to the valuation of the Park Holidays business, including reduced financial projections and increases in interest rates, that should have been taken into account when preparing the Interim Financial Statements. Management undertook a full review of the valuations and determined that at each of March 31, 2023, June 30, 2023 and September 30, 2023, we should have recognized non-cash impairments to goodwill for the Park Holidays business.
The non-cash goodwill impairments resulted in the following negative adjustments to net income / (loss) in the Interim Financial Statements:
•For the three months ended March 31, 2023, non-cash goodwill impairment increased net loss by $15.4 million;
•For the three and six month periods ended June 30, 2023, non-cash goodwill impairment changed net income to net loss by the amount of $309.7 million and $325.1 million, respectively;
•For the three month period ended September 30, 2023, non-cash goodwill impairment reduced net income by $44.8 million; and for the nine month period ended September 30, 2023, changed net income to net loss by the amount of $369.9 million.
Items Restated in this Form 10-K
This Annual Report reflects changes to the Consolidated Balance Sheets for the periods ended March 31, 2023, June 30, 2023 and September 30, 2023, and the Consolidated Statements of Operations, Comprehensive Loss, Shareholders' Equity and Cash Flows for the quarter and year to date periods ended March 31, 2023, June 30, 2023 and September 30, 2023. Restatements of the summarized consolidated financial information for the quarterly periods are disclosed in Note 22, "Quarterly Financial Data (Unaudited and Restated)," to our accompanying Consolidated Financial Statements.
We do not intend to file amendments to the previously filed Quarterly Reports on Form 10-Q for the quarters ended March 31, 2023, June 30, 2023 and September 30, 2023. Accordingly, investors should rely only on the financial information and other disclosures regarding the restated periods in this Annual Report or in future filings with the SEC, and not on any previously issued or filed reports, earnings releases or similar communications relating to these periods.
See Note 22, "Quarterly Financial Data (Unaudited and Restated)," to our accompanying Consolidated Financial Statements, included in Part II, Item 8 of this Annual Report, for additional information on the restatement and the related consolidated financial statement effects.
Internal Control Considerations
In connection with the restatement, management has assessed the effectiveness of our internal control over financial reporting. Based on this assessment, a material weakness in our internal control over financial reporting was identified, resulting in the conclusion by our principal executive officer and principal financial officer that our disclosure controls and procedures were not effective as of March 31, 2023, June 30, 2023, September 30, 2023, and that our internal control over financial reporting and disclosure controls and procedures were not effective as of December 31, 2023. Management is taking steps to remediate the material weakness in our internal control over financial reporting, as described in Part II, Item 9A, Controls and Procedures of this Annual Report.
SUN COMMUNITIES, INC.
Table of Contents
| Item | Description | Page | ||||||
Part I. | ||||||||
Item 1. | Business | |||||||
Item 1A. | Risk Factors | |||||||
Item 1B. | Unresolved Staff Comments | |||||||
Item 1C. | Cybersecurity | |||||||
Item 2. | Properties | |||||||
Item 3. | Legal Proceedings | |||||||
Item 4. | Mine Safety Disclosures | |||||||
Part II. | ||||||||
Item 5. | Market for the Registrant's Common Equity, Related Shareholder Matters and Issuer Purchases of Equity Securities | |||||||
Item 6. | [Reserved] | |||||||
Item 7. | Management's Discussion and Analysis of Financial Condition and Results of Operations | |||||||
Item 7A. | Quantitative and Qualitative Disclosures about Market Risk | |||||||
Item 8. | Financial Statements and Supplementary Data | |||||||
Item 9. | Changes in and Disagreements with Accountants on Accounting and Financial Disclosure | |||||||
Item 9A. | Controls and Procedures | |||||||
Item 9B. | Other Information | |||||||
Part III. | ||||||||
Item 10. | Directors, Executive Officers and Corporate Governance | |||||||
Item 11. | Executive Compensation | |||||||
Item 12. | Security Ownership of Certain Beneficial Owners and Management and Related Shareholder Matters | |||||||
Item 13. | Certain Relationships and Related Transactions, and Director Independence | |||||||
Item 14. | Principal Accountant Fees and Services | |||||||
Part IV. | ||||||||
Item 15. | Exhibits and Financial Statement Schedules | |||||||
Item 16. | Form 10-K Summary | |||||||
| Exhibits | ||||||||
| Signatures | ||||||||
| Index to the Consolidated Financial Statements and Financial Statement Schedule | F - 1 | |||||||
SUN COMMUNITIES, INC.
PART I
ITEM 1. BUSINESS
GENERAL OVERVIEW
Sun Communities, Inc., and all wholly-owned or majority-owned and controlled subsidiaries, including Sun Communities Operating Limited Partnership, a Michigan limited partnership (the "Operating Partnership"), Sun Home Services, Inc., ("SHS"), Safe Harbor Marinas, LLC ("Safe Harbor"), and the entities through which we operate our holiday parks business in the United Kingdom ("UK") (collectively, "Park Holidays"), are referred to herein as the "Company," "SUI," "we," "us," or "our."
We are a fully integrated real estate investment trust ("REIT"). We own manufactured housing ("MH") and recreational vehicle ("RV") communities and marinas in the United States ("U.S."), the UK and Canada (marinas and, together with MH and RV, the "properties"). We self-administer, self-manage, and operate or hold an interest in, and develop the majority of our properties, and a select number of our communities are operated by independent third party contractors on our behalf under management agreements. Others are operated by lessees under ground lease arrangements. Together with our affiliates and predecessors, we have been in the business of acquiring, operating, developing and expanding MH and RV communities since 1975 and marinas since 2020.
We lease individual parcels of land ("sites"), with utility access for the placement of manufactured homes and RVs to our MH and RV customers. Our MH communities are designed to offer affordable housing to individuals and families, while also providing certain amenities. In the UK, our MH communities are referred to as holiday parks and are predominantly located at irreplaceable seaside locations in the south of England. Our RV communities are designed to offer affordable vacation opportunities to individuals and families complemented by a diverse selection of high-quality amenities.
The majority of our marinas are concentrated in coastal regions. Our marinas offer wet slip and dry storage space leases, end-to-end service (such as routine maintenance, repair and winterization), fuel sales and other high-end amenities. These services and amenities offer convenience and resort-quality experiences to our members and guests.
As of December 31, 2023, we owned and operated, directly or indirectly, or had an interest in, a portfolio of 667 developed properties located in the U.S., the UK and Canada, including 353 MH communities, 179 RV communities and 135 marinas. As of December 31, 2023, the properties contained an aggregate of 227,340 developed sites comprised of 118,430 developed MH sites, 32,390 annual RV sites (inclusive of both annual and seasonal usage rights), 28,490 transient RV sites, and 48,030 wet slips and dry storage spaces. Additionally, we own or control land to support developing and expanding over 17,980 additional MH and RV sites suitable for development.
Through SHS, a taxable REIT subsidiary, we market, sell, and lease new and pre-owned homes to current and future residents in our MH communities. The operations of SHS support and enhance our occupancy levels, property performance and cash flows.
Our executive and principal property management office is located at 27777 Franklin Road, Suite 300, Southfield, Michigan 48034 and our telephone number is (248) 208-2500. We also have principal offices in Dallas, Texas, and in Bexhill-on-Sea, East Sussex, UK. We have regional property management offices throughout the U.S. We employed an aggregate of 6,780 full and part time employees as of December 31, 2023.
Our website address is www.suninc.com and we make available, free of charge, on or through our website all of our periodic reports, including our Annual Reports on Form 10-K, Quarterly Reports on Form 10-Q, and current reports on Form 8-K, as soon as reasonably practicable after we file such reports with the SEC. Additionally, the SEC maintains a website at https://www.sec.gov, that contains reports, proxy information statements and other information about us.
1
SUN COMMUNITIES, INC.
STRUCTURE OF THE COMPANY
The Company is a REIT and the general partner of the Operating Partnership. As the sole general partner of the Operating Partnership, we generally have the power to manage and have complete control over the conduct of the Operating Partnership's affairs and all decisions or actions made or taken by us as the general partner pursuant to the partnership agreement are generally binding upon all of the partners and the Operating Partnership.
The Operating Partnership is structured as an umbrella partnership REIT ("UPREIT"). We conduct substantially all of our operations through the Operating Partnership, which, directly or indirectly through other subsidiaries, owns substantially all of our assets. This UPREIT structure enables us to comply with certain complex requirements under the federal tax rules and regulations applicable to REITs, and to acquire properties in transactions that defer some or all of the sellers' tax consequences. The financial results of the Operating Partnership and our other subsidiaries are consolidated in our Consolidated Financial Statements. The financial results of the Operating Partnership include certain activities that do not necessarily qualify as REIT activities under the Internal Revenue Code of 1986, as amended (the "Code"). We have formed taxable REIT subsidiaries, as defined in the Code, to engage in such activities. We use taxable REIT subsidiaries to offer certain services to our residents and engage in activities that would not otherwise be permitted under the REIT rules if provided directly by us or by the Operating Partnership. The taxable REIT subsidiaries include our home sales business, SHS, which provides manufactured home sales, leasing, and other services to current and prospective tenants of our properties. Currently, all of our UK operations are conducted through taxable REIT subsidiaries.
Under the partnership agreement, the Operating Partnership is structured to make distributions with respect to certain of the Operating Partnership units ("OP units") at the same time that distributions are made to our common shareholders. The Operating Partnership is structured to permit limited partners holding certain classes or series of OP units to exchange those OP units for shares of our common stock (in a taxable transaction) and achieve liquidity for their investment.
2
SUN COMMUNITIES, INC.
As of December 31, 2023, we owned 95.4% of all of the OP Units and the limited partners of the Operating Partnership own the rest. The following table sets forth:
•The various series of OP units and the number of units of each series outstanding as of December 31, 2023;
•The relative ranking of the various series of OP units with respect to rights to the payment of distributions and the distribution of assets in the event of any voluntary or involuntary liquidation, dissolution or winding up of the Operating Partnership;
•The number of shares of our common stock issuable upon the exchange, directly or indirectly, of each OP unit of the applicable series;
•The annual distribution rate on each series of OP units; and
•Information regarding the terms of redemption rights for each series of OP units, as applicable.
| Ranking | Description | OP Units Outstanding at December 31, 2023 | Exchange Rate(1) | Annual Distribution Rate(2) | Cash Redemption(3) | Redemption Period | ||||||||||||||||||||||||||||||||
| 1 | Series A-1 preferred OP units | 202,144 | 2.4390 | 6.0 | % | N/A | N/A | |||||||||||||||||||||||||||||||
| 2 | Series C preferred OP units | 305,848 | 1.1100 | 5.0 | % | N/A | N/A | |||||||||||||||||||||||||||||||
| 3 | Series D preferred OP units | 488,958 | 0.8000 | 4.0 | % | Holder's Option | Any time | |||||||||||||||||||||||||||||||
| 4 | Series E preferred OP units | 80,000 | 0.6897 | 5.5 | % | N/A | N/A | |||||||||||||||||||||||||||||||
| 5 | Series F preferred OP units | 90,000 | 0.6250 | 3.0 | % | Holder's Option | Any time after earlier of May 14, 2025 or death of holder | |||||||||||||||||||||||||||||||
| 6 | Series G preferred OP units | 210,710 | 0.6452 | 3.2 | % | Holder's Option | Any time after earlier of September 30, 2025 or death of holder | |||||||||||||||||||||||||||||||
| 7 | Series H preferred OP units | 581,238 | 0.6098 | 3.0 | % | Holder's Option | Any time after earlier of October 30, 2025 or death of holder | |||||||||||||||||||||||||||||||
| 8 | Series J preferred OP units | 238,000 | 0.6061 | 2.85 | % | Holder's Option | During the 30-day period following a change of control of the Company or any time after April 21, 2026 | |||||||||||||||||||||||||||||||
| 9 | Series K preferred OP units | 1,000,000 | 0.5882(4) | 4.0 | % | Holder's Option | Within 60 days after March 23, 2028 | |||||||||||||||||||||||||||||||
| 10 | Series L preferred OP units | 20,000 | 0.6250(5) | 3.5 | % | N/A | N/A | |||||||||||||||||||||||||||||||
| 11 | Series A-3 preferred OP units | 40,268 | 1.8605 | 4.5 | % | N/A | N/A | |||||||||||||||||||||||||||||||
| 12 | Common OP units | 127,171,415(6) | 1.0 | Same distribution rate for common stock and common OP units | N/A | N/A | ||||||||||||||||||||||||||||||||
(1)Exchange rates are subject to adjustment upon stock splits, recapitalizations and similar events. The exchange rates of certain series of OP units are approximated to four decimal places. Holders of OP units generally may exchange them at any time.
(2)Except for Common OP units, distributions are payable on the issue price of each OP unit, which is $100.00 per unit for all these preferred OP units.
(3)The redemption price for each preferred OP unit redeemed will be equal to its issue price plus all accrued but unpaid distributions.
(4)Each Series K preferred OP unit is exchangeable for 0.5882 common OP units. Each such common OP unit will be exchangeable for one share of our common stock. We have the right to cause the holders of Series K preferred OP units to exchange such units into common OP units at the applicable exchange rate (a) within 60 days after March 23, 2028 or (b) if at any time the trading price of our common stock for each of the preceding 60 trading days is equal to or greater than 120% of the Series K conversion price of $170 (as it may be adjusted under the Operating Partnership's partnership agreement). If in connection with an exchange pursuant to clause (a) above the recent average price of our common stock (as determined under the Operating Partnership's partnership agreement) is less than the Series K conversion price, we will be required to make an additional cash payment in respect of each exchanged Series K preferred OP unit equal to the product of (i) the Series K exchange rate and (ii) the difference between such average price and the Series K conversion price.
(5)Each Series L preferred OP unit is exchangeable for 0.6250 common OP units. Each such common OP unit will be exchangeable for one share of our common stock. We have the right to cause the holders of Series L preferred OP units to exchange such units into common OP units at the applicable exchange rate (a) any time after December 31, 2028 or (b) if at any time the trading price of our common stock for each of the preceding 60 trading days is equal to or greater than 120% of the Series L conversion price of $160 (as it may be adjusted under the Operating Partnership's partnership agreement). If in connection with an exchange pursuant to clause (a) above the recent average price of our common stock (as determined under the Operating Partnership's partnership agreement) is less than the Series L conversion price, we will be required to make an additional cash payment in respect of each exchanged Series L preferred OP unit equal to the product of (i) the Series L exchange rate and (ii) the difference between such average price and the Series L conversion price.
(6)Of the 127,171,415 Common OP units, 124,436,432 or 97.8% were held by us, and 2,734,983 or 2.2% were owned by various limited partners.
3
SUN COMMUNITIES, INC.
REAL PROPERTY OPERATIONS
Throughout this report, we use the terms resident to represent a "resident" in the U.S. and a "customer" in the UK.
An MH community is a residential subdivision with sites for the placement of manufactured homes, related improvements and amenities. Manufactured homes are detached single-family homes that are produced off-site by manufacturers and installed on site within the community. Manufactured homes are available in a wide array of designs, providing owners with a level of customization generally unavailable in multi-family housing complexes. Modern MH communities contain improvements similar to other garden-style residential developments, including centralized entrances, paved streets, curbs, gutters and parkways. In addition, these communities also often provide a number of amenities, such as a clubhouse, a swimming pool, basketball courts, shuffleboard courts, tennis courts and laundry facilities.
An RV community is a resort with sites for the placement of RVs for varied lengths of time. RV communities may also provide vacation rental homes and may include a number of amenities such as restaurants, golf courses, swimming pools, water parks, tennis courts, fitness centers, planned activities and spacious social facilities.
From 2021 to 2023, we rebranded 151 RV communities under the "Sun Outdoors" umbrella guided by our belief that the Sun Outdoors brand supports our competitive advantage in the outdoor market. Implementation consisted of the conversion of the communities' digital presence (website, social media, reservation software and other internal systems) and the replacement of signage at the communities. Sun Outdoors offers RV sites, vacation rentals and tent camping with world-class amenities in the U.S. and Canada.
A marina is a specially-designed harbor that can be located on oceans, lakes, bays or rivers and typically includes dry storage systems that provide storage solutions for the placement of vessels ranging in size from small boats to super yachts for varied lengths of time. Dry storage systems also allow for the required maintenance of the vessels that we store. Marinas also provide ancillary services, such as fuel stations, ship stores, restaurants, swimming pools, cabin and lodging rentals, boat rentals, tennis courts, fitness centers, shower and laundry facilities, planned activities and other services to create a robust member experience.
Renters at our MH and RV communities lease the site on which a manufactured home, RV or vacation rental home is located. We typically own the underlying land, utility connections, streets, lighting, driveways, common area amenities, and other capital improvements and are responsible for enforcement of community guidelines and maintenance. In certain MH and RV communities, we do not own all of the underlying land and operate the communities pursuant to ground leases. Certain communities provide water and sewer service through public or private utility companies, while other communities provide these services to residents from on-site facilities. Each owner of a home within our properties is responsible for the maintenance of the home and leased site. As a result, our capital expenditure needs tend to be less significant relative to multi-family rental apartment complexes.
Renters at our marinas lease the wet slip or dry storage space on which a vessel is stored. We typically own the underlying land, building improvements, dock improvements, site improvements and other on-site amenity structures. Because we own the facilities and improvements on the land or submerged land at those marinas, we are responsible for the capital improvements and maintenance. In certain marinas, we do not own all of the underlying land and operate the marinas pursuant to ground leases.
We compete with other available MH and RV communities, and alternative forms of housing (such as on-site constructed homes, apartments, condominiums and townhouses) as they provide housing alternatives to potential tenants of MH and RV communities. We also compete with other available marinas in the U.S.
PROPERTY MANAGEMENT
Our property management strategy emphasizes intensive, detail-oriented, hands-on management by dedicated, on-site MH and RV community and marina managers. We believe our focus on creating an exceptional resident, guest and member experience creates a competitive advantage. It enables us to continually monitor and address concerns, the performance of competitive properties and local market conditions. As of December 31, 2023, of our 6,780 employees, 1,192 were located on-site as property managers, and of those, 99.3% were full-time employees.
4
SUN COMMUNITIES, INC.
Our MH and RV property managers in the U.S. and Canada are overseen by our Chief Operating Officer, four Senior Vice Presidents of Operations and Sales, 11 Divisional Vice Presidents and 43 Regional Vice Presidents. Each Regional Vice President oversees one to 16 properties and is responsible for regular property inspections, oversight of property operations and sales functions, semi-annual market surveys of competitive communities and interaction with local manufactured home dealers. Each property manager performs regular inspections in order to monitor the physical condition of properties and to effectively address tenant concerns. In addition to an on-site manager, each district or property has on-site maintenance personnel and management support staff. We hold mandatory training sessions for all new property management personnel to ensure that policies and procedures are executed effectively and professionally. All of our property management personnel participate in on-going training to ensure that changes to policies and procedures are implemented consistently. Our internal training program has led to increased knowledge and accountability for daily operations and policies and procedures.
Park Holidays' MH and RV property managers are overseen by a Chief Executive Officer of Park Holidays, a Chief Operating Officer, and two Regional Operations Directors.
Our marina business is overseen by a Chief Executive Officer of Safe Harbor, two Executive Vice Presidents of Operations, two Senior Vice Presidents of Operations and 15 Regional Vice Presidents who are responsible for regular marina inspections and oversight of operations.
HOME SALES AND RENTALS
We are engaged in the marketing, selling and leasing of new and pre-owned homes to current and future residents in our MH communities through SHS in the U.S. and Park Holidays in the UK. Because tenants often purchase a home already on-site within a community, the services SHS and Park Holidays provide enhance occupancy and property performance. Additionally, because many of the homes on the properties are sold through SHS and Park Holidays, better control of home quality in our communities can be maintained than if sales services were conducted solely through third-party brokers.
SHS also leases homes to prospective tenants. As of December 31, 2023, SHS's portfolio consists of over 10,230 occupied leased homes. New and pre-owned homes are purchased for our Rental Program. Leases associated with our Rental Program generally have a term of one year. The Rental Program requires management of costs associated with repair and refurbishment of these homes as the tenants vacate and the homes are re-leased. In 2023, we received over 51,200 applications to live in our MH and RV properties, providing a significant "resident onboarding" system that allows us to market the purchase of a home to qualified applicants. Through our Rental Program, we demonstrate our product and lifestyle to the renters, while monitoring their payment history and converting qualified renters to owners.
Park Holidays also rents homes for short-stays to allow people to experience the community park and facilities. Their short-stay experiences may, in turn, lead guests to ultimately purchase a home in a Park Holidays community. Holiday makers drive the pipeline for future home sales opportunities.
Our home sales and leasing operations compete with other national, and local MH dealers and MH community owners and other holiday park owners in the U.S. and UK.
MARINA MEMBER BASE
We are engaged in the marketing and leasing of wet slips and dry storage spaces and have approximately 48,000 members throughout our marina network as of December 31, 2023.
5
SUN COMMUNITIES, INC.
SITE LEASES OR USAGE RIGHTS
Typical tenant leases for MH sites in the U.S. are year-to-year or month-to-month, renewable upon the consent of both parties, or, in some instances, as provided by statute. Certain of our leases, mainly at our Florida and California properties, are tied to the consumer price index or other indices as they relate to rent increases. Generally, market rate adjustments are made on an annual basis. These leases are cancellable for non-payment of rent, violation of community rules and regulations or other specified defaults. During the five calendar years ended December 31, 2023, on average less than 1.0% of the homes in our MH communities have been removed by their owners and 6.1% of the homes have been sold by their owners to a new owner who then assumes rental obligations as a community resident. On average, our residents remain in our communities for approximately 15 years. Site license fees for MH sites in the UK are for a term of 20, 30 or 40 years depending on the product originally purchased. The holiday homeowner must pay an annual site fee for their holiday home to remain on the property. On average, Park Holidays homeowners remain in the communities for over seven years.
Typical resident agreements for RV sites are year-to-year or from move-in date until the end of the current calendar year. Generally, increases and market rate adjustments are made on an annual basis. These agreements are cancellable for non-payment of rent, violation of community rules and regulations or other specified defaults.
Leases for wet slips and dry storage spaces at our marinas are year-to-year, season-to-season, month-to-month, or transient by night, renewable upon the consent of both parties. On average, our members maintain leases in our marinas for approximately 8.3 years.
ACQUISITIONS
During the year ended December 31, 2023, we acquired one MH community with 68 sites and 72 development sites, and one marina with 24 wet slips and dry storage spaces, for a total purchase price of approximately $107.0 million.
EXPANSION / DEVELOPMENT
During the year ended December 31, 2023, we acquired four land parcels located in the U.S. and one land parcel in the UK for the potential development of over 1,350 sites, expanded our existing communities by over 440 sites and delivered 360 sites at five ground-up development properties.
REGULATIONS AND INSURANCE
General
MH, RV and marina properties are subject to various laws, ordinances and regulations, including regulations relating to recreational facilities such as swimming pools, clubhouses and other common areas. Each property has the necessary operating permits and approvals.
Insurance
With increased insurance claims across the industry and other market conditions, it has been more difficult to obtain insurance, in particular property insurance covering named windstorms, business interruption, flood and earthquake insurance. With fewer insurers willing to provide policies, and policies increasingly including lower coverage limits, higher deductibles and higher premiums, we have changed our insurance purchasing philosophy and strategy resulting in us self-insuring a greater risk to offset insurance market fluctuations. Our management believes that the properties are covered by adequate comprehensive liability, fire, property, business interruption, general liability, and (where appropriate) flood and earthquake insurance through a combination of our self-insurance partially covering our risk and insurance provided by reputable companies with commercially reasonable deductibles and limits. We maintain a blanket policy that covers all of our properties. We have obtained title insurance insuring fee title to the properties in an aggregate amount which we believe to be adequate. Claims made to our insurance carriers that are determined to be recoverable are classified in other receivables as incurred.
6
SUN COMMUNITIES, INC.
HUMAN CAPITAL
Human capital management is key to our success and focuses on diversity, equity and inclusion, employee retention and talent development practices. We are committed to building an equitable and inclusive culture that inspires and supports the growth of our employees, serves our communities and shapes a more sustainable business. The most significant measures and objectives that we focus on in managing our business and our related human capital initiatives include the following:
Culture
We foster a growth culture that is grounded in our vision and culture statements: We are an inspired, engaged and collaborative team committed to providing extraordinary service to our residents, guests and team members. Together as one team, we embrace the following seven key behaviors that make our company a great place to work:
•Live the Golden Rule: Treat others the way you want to be treated;
•Do the right thing;
•We over me;
•Nothing changes if nothing changes;
•Mindset is everything;
•Keep it simple; and
•Be yourself and thrive.
Leadership, Talent, Training and Development
We expect our leaders to be role models and lead in a way that enables our organization to achieve success. Our strategy is anchored in promoting the right internal talent and hiring the right external talent for career opportunities across our organization. We are focused on hiring and developing talent that mirrors the markets we serve, and investing in learning opportunities and capabilities that equip our workforce with the skills they need while improving engagement and retention.
•Our internal training program offers over 310 courses to our team members on a range of topics, including leadership, communication, inclusion and diversity, software and operations. Our internal training program has led to increased knowledge and accountability for daily operations and policies and procedures. In 2023, team members logged nearly 85,700 hours of training.
•We hold ongoing training sessions for all property management personnel to ensure that policies and procedures are executed effectively, professionally and consistently.
We are dedicated to attracting, developing and retaining our talent, focusing our efforts on ensuring that the returning seasonal team member pipeline remains robust each year and our annual talent management processes focus on the professional development of salaried team members. As of December 31, 2023, nearly 12% of our employees had over 10 years' tenure.
Our compensation philosophy, aimed to apply merit-based, equitable compensation practices, is designed to attract and retain top talent. For eligible team members, we offer competitive salary, health, welfare, retirement and pet insurance benefits, tuition reimbursement and rent / vacation discounts at our properties.
Inclusion, Diversity, Equity and Accessibility ("IDEA")
We make it a priority to recognize and appreciate the diverse characteristics that make individuals unique in an atmosphere that promotes and celebrates individual and collective achievement. We believe it's not just about gender or race, but about being diverse in thoughts, life and work experiences. Our inclusive environment challenges, inspires, rewards and transforms our team to be the best. We do not tolerate harassing, discriminatory or retaliatory conduct as such conduct is prohibited and inconsistent with our policies, practices and philosophy. We continue to put our resources and energy into strategies and initiatives to create a more equitable environment.
7
SUN COMMUNITIES, INC.
Workforce Diversity
We believe we are a stronger organization when our workforce represents a diversity of ideas and experiences. We value and embrace diversity in our employee recruiting, hiring and development practices. As of December 31, 2023, 40% of our employees were female, 23% of our employees (excluding those in Canada and the UK) were racially or ethnically diverse, and 44% of our employees were aged 50 years and older, with approximately 24% being aged 60 years and older.
Training and Resources
We offer training and resources on diversity, equity and inclusion to our employees. Diversity education and training programs for our team focus on unconscious bias, gender identity and transitions, generational differences, religion in the workplace, and self-awareness and self-assessments.
Pay Equity
We are committed to providing a total compensation package that is market-based, performance driven, fair and internally equitable. Our goal is to be competitive both within the general employment market as well as with our competitors in the real estate industry, with our strongest performers being paid more.
•Compensation for each position is determined by utilizing reliable third-party compensation surveys to obtain current market data. Additionally, position descriptions and compensation are routinely reviewed for market competitiveness.
•On an annual basis, the performance of all team members is evaluated and merit increases are allocated based on performance. This process ensures equitable performance review and corresponding pay practices that attract, retain and reward top talent.
Business Integrity
Our Code of Conduct and Business Ethics is grounded in our commitment to do the right thing. It serves as the foundation of our approach to ethics and compliance, and our anti-corruption compliance program is focused on conducting business in a fair, ethical and legal manner.
Workplace Health and Safety
We actively seek to minimize health, safety and environmental risks to our team members, residents, and guests by utilizing safe operating procedures and practices:
•As part of our commitment to safety, we oversee annual safety training programs for employees to provide tools and safeguards for accident prevention. Our managers are responsible for ensuring that team members receive the appropriate training to perform their jobs safely;
•All team members participate in safety training during the onboarding process, and thereafter, team members in the field complete an annual safety training course; and
•We uphold a safe workplace by complying with safety and health laws and regulations, maintaining internal requirements and remediating risks. Senior leadership review safety concerns throughout the year on regular site visits, and we also conduct comprehensive safety inspections annually on a subset of properties on a rolling basis.
8
SUN COMMUNITIES, INC.
ENVIRONMENTAL, SOCIAL AND GOVERNANCE ("ESG"): OUR COMMITMENT TO A SUSTAINABLE FUTURE
We continue to embrace a company-wide commitment to ESG practices and procedures implemented through executive commitments, sponsorship of various programs and our everyday business practices.
Environmental
The International Energy Agency ("IEA") estimates that the energy usage related to operating buildings (commercial and residential) accounts for 26% of global energy-related emissions. In recognition of the impact buildings have on global annual greenhouse gas ("GHG") emissions, in 2022 we adopted goals to achieve Carbon Neutrality by 2035 inclusive of ISO 14064:1 ("ISO 14064") categories 1, 2, 3 and 4, and Net Zero Emissions by 2045 (inclusive of all five ISO 14064 categories).
The main tactics we intend to use to achieve our commitment will be seen across all our properties as we work toward achieving our climate change goals through various means, including:
•Renewable Energy – Expanding the use of renewable energy throughout our portfolio through additional on-site energy generation, and the consideration for purchase of off-site generated energy and Renewable Energy Certificates (RECs);
•Energy Efficient Buildings – Increasing the use of certified energy efficient manufactured homes, including ENERGY STAR®, in our communities as well as energy-efficient lighting and building control systems;
•Waste – Reducing total waste and increasing diversion from landfills by evaluating all disposal options locally available, including recycling, and adopting the best solution(s) at each property; and
•Material Procurement – Partnering with our supply chain and consultants to collect emissions data on products and services.
During 2023, we completed a top ESG priority by expanding our data coverage to encompass our UK operations and Marina segment. Through collection of primary source data (e.g., utility bills and invoices) and accepted estimation methods, we were able to complete full reporting of all direct and indirect source emissions.
We are fully committed to reducing our environmental impact through investments in energy-efficiency technology, water conservation initiatives and waste reduction strategies implemented across the scope of our operations and through the services we deliver to our residents and guests.
Social
In addition to our commitments and practices discussed above, in the "Human Capital" section, we recognize the important social opportunity we have to provide housing that is both affordable and sustainable. Our business contributes to a vitally important function in our economy by providing high-quality, affordable housing that accommodates all-age and age-restricted communities. Our homes provide more space at less cost per square foot compared to other options.
According to Zillow.com's September 2023 rent index, the average MH site rent in a Sun community is approximately 50% less than the monthly cost of other rental options.
By providing safe, well-located and affordable communities, Sun is expanding the opportunity for home ownership, despite an ever-increasing housing affordability gap.
Another way we support the communities in which we operate is through volunteerism and sponsorship efforts. In 2023, our team members reported approximately 16,000 volunteer hours, an increase of 72% compared to the prior year.
Governance
Aligning Company policies and procedures with the interests of all stakeholders is always a priority for Sun. Among the best practices and policies described in our annual ESG reports and on our website, www.suninc.com, our Code of Conduct and Business Ethics policy serves as the foundation for our approach to ethics and compliance, and our anti-corruption compliance program is focused on conducting business in a fair, ethical and legal manner. Additionally, our publicly available policies outline the expectations we have of supply chain vendors and service providers with whom we partner to operate our properties.
9
SUN COMMUNITIES, INC.
Providing properties to our residents and guests is a privilege and also poses a responsibility to keep stakeholder data secure. Item 1C of this filing and our annual ESG reports provide information on our approach and standards for cybersecurity.
Increasing engagement with investors remains a priority. During 2023, we held nearly 240 meetings with investment firms, a 37% increase from over 170 meetings in 2022. Through focused outreach to investors, we deepen and evolve our understanding of their priorities, which we integrate into our ongoing ESG materiality assessments to identify considerations that are important to stakeholders.
10
SUN COMMUNITIES, INC.
CAUTIONARY STATEMENT REGARDING FORWARD-LOOKING STATEMENTS
This Annual Report on Form 10-K contains various "forward-looking statements" within the meaning of the Securities Act of 1933, as amended (the "Securities Act"), and the Securities Exchange Act of 1934, as amended (the "Exchange Act"), and we intend that such forward-looking statements will be subject to the safe harbors created thereby. For this purpose, any statements contained in this document that relate to expectations, beliefs, projections, future plans and strategies, trends or prospective events or developments and similar expressions concerning matters that are not historical facts are deemed to be forward-looking statements. Words such as "forecasts," "intends," "intend," "intended," "goal," "estimate," "estimates," "expects," "expect," "expected," "project," "projected," "projections," "plans," "predicts," "potential," "seeks," "anticipates," "anticipated," "should," "could," "may," "will," "designed to," "foreseeable future," "believe," "believes," "scheduled," "guidance," "target" and similar expressions are intended to identify forward-looking statements, although not all forward-looking statements contain these words. These forward-looking statements reflect our current views with respect to future events and financial performance, but involve known and unknown risks and uncertainties, both general and specific to the matters discussed in this document, some of which are beyond our control. These risks and uncertainties and other factors may cause our actual results to be materially different from any future results expressed or implied by such forward-looking statements. In addition to the risks disclosed under "Risk Factors" in this Annual Report on Form 10-K, and in our other filings with the SEC, from time to time, such risks, uncertainties and other factors include, but are not limited to:
•changes in general economic conditions, including inflation, deflation and energy costs, the real estate industry and the markets within which we operate;
•difficulties in our ability to evaluate, finance, complete and integrate acquisitions, developments and expansions successfully;
•our liquidity and refinancing demands;
•our ability to obtain or refinance maturing debt;
•our ability to maintain compliance with covenants contained in our debt facilities and our unsecured notes;
•availability of capital;
•outbreaks of disease and related restrictions on business operations;
•changes in foreign currency exchange rates, including between the U.S. dollar and each of the Canadian dollar, Australian dollar and Pound sterling;
•our ability to maintain rental rates and occupancy levels;
•our ability to maintain effective internal control over financial reporting and disclosure controls and procedures;
•our remediation plan and our ability to remediate the material weakness in our internal control over financial reporting;
•expectations regarding the amount or frequency of impairment losses, including as a result of the write-down of intangible assets, including goodwill;
•increases in interest rates and operating costs, including insurance premiums and real estate taxes;
•risks related to natural disasters such as hurricanes, earthquakes, floods, droughts and wildfires;
•general volatility of the capital markets and the market price of shares of our capital stock;
•our ability to maintain our status as a REIT;
•changes in real estate and zoning laws and regulations;
•legislative or regulatory changes, including changes to laws governing the taxation of REITs;
•litigation, judgments or settlements, including costs associated with prosecuting or defending claims and any adverse outcomes;
•competitive market forces;
•the ability of purchasers of manufactured homes and boats to obtain financing; and
•the level of repossessions by manufactured home and boat lenders.
Readers are cautioned not to place undue reliance on these forward-looking statements, which speak only as of the date the statement was made. We undertake no obligation to publicly update or revise any forward-looking statements included or incorporated by reference into this document, whether as a result of new information, future events, changes in our expectations or otherwise, except as required by law.
Although we believe that the expectations reflected in the forward-looking statements are reasonable, we cannot guarantee future results, levels of activity, performance or achievements. All written and oral forward-looking statements attributable to us or persons acting on our behalf are qualified in their entirety by these cautionary statements.
11
SUN COMMUNITIES, INC.
ITEM 1A. RISK FACTORS
Our prospects are subject to certain uncertainties and risks. Our future results could differ materially from current results, and our actual results could differ materially from those projected in forward-looking statements as a result of certain risk factors. These risk factors include, but are not limited to, those set forth below, other one-time events, and important factors disclosed previously and from time to time in our other filings with the SEC.
RISKS RELATED TO THE RESTATEMENT OF OUR PRIOR FINANCIAL STATEMENTS
We have identified a material weakness in our internal control over financial reporting which resulted in a material misstatement in certain of our previously issued interim unaudited consolidated financial statements, and we cannot provide assurances that this weakness will be effectively remediated or that additional material weaknesses will not occur in the future.
A material weakness is a deficiency, or a combination of deficiencies, in internal control over financial reporting, such that there is a reasonable possibility that a material misstatement of the Company's annual or interim financial statements will not be prevented or detected on a timely basis.
During the preparation of this Annual Report, we identified a material weakness in our internal control over financial reporting relating to the design of management's review controls over assessments of goodwill impairment for our Park Holidays business. As a result of this weakness, we concluded that our disclosure controls and procedures were not effective as of March 31, 2023, June 30, 2023 and September 30, 2023 and that our internal control over financial reporting and disclosure controls and procedures were not effective as of December 31, 2023. We have restated our interim unaudited consolidated financial statements as of March 31, 2023, June 30, 2023 and September 30, 2023 in this Annual Report.
We are actively engaged in the planning for, and implementation of, remediation efforts to address this material weakness but there can be no assurance that those efforts will be successful. A material weakness will not be considered remediated until the applicable controls operate for a sufficient period of time and management has concluded, through testing, that these controls are designed and operating effectively. If we do not remediate this material weakness in a timely manner, or if additional material weaknesses in our internal control over financial reporting are discovered, they may adversely affect our ability to record, process, summarize and report financial information timely and accurately and our financial statements may contain material misstatements or omissions. In addition, we may experience delays or be unable to meet our reporting obligations or to comply with SEC rules and regulations, which could result in investigations and sanctions by regulatory authorities. Any of these results may, among other adverse consequences, cause investors to lose confidence in our reported financial information, incur the expense of remediation, result in regulatory scrutiny, litigation, investigations or enforcement actions, limit our ability to access the capital markets, lead to a decline in our stock price, and otherwise have a material adverse effect on our business, financial condition, results of operations and cash flows.
For more information relating to the Company's internal control over financial reporting, the material weakness described above and the remediation activities undertaken by us, see "Controls and Procedures" in Part II, Item 9A, of this Annual Report on Form 10-K.
If we fail to maintain an effective system of internal controls, we may not be able to accurately report financial results, which could result in a loss of investor confidence and adversely affect the market price of our common stock.
We are required to establish and maintain internal control over financial reporting and disclosure controls and procedures. Internal control over financial reporting is a process designed to provide reasonable assurance regarding the reliability of financial reporting and the preparation of financial statements in accordance with generally accepted accounting principles. Disclosure controls and procedures are processes designed to ensure that information required to be disclosed is communicated to management and reported in a timely manner. We cannot be certain that we will successfully maintain adequate control over our financial reporting and disclosure controls and procedures. See "Controls and Procedures" in Part II, Item 9A, of this Annual Report on Form 10-K for a discussion of the material weakness in our internal control over financial reporting that management has concluded exist in connection with preparing our financial statements for the year ended December 31, 2023. Deficiencies, including any material weakness, in our internal control over financial reporting that may occur could result in misstatements or restatements of our financial statements or a decline in the price of our securities. In addition, to the extent we make additional significant acquisitions, our internal controls will become more complex and may require significantly more resources to ensure that our disclosure controls and procedures remain effective. Acquisitions can pose challenges in implementing the required processes, procedures and controls in the operations of the companies that we acquire. Companies that are acquired by us may not have disclosure controls and procedures or internal control over financial reporting that are as thorough or effective as those required by the securities laws that currently apply to us.
12
SUN COMMUNITIES, INC.
Moreover, the existence of any material weakness or significant deficiency in our internal controls and procedures has required and would require management to devote significant time and incur significant expense to remediate any such material weaknesses or significant deficiencies and management may not be able to remediate any such material weaknesses or significant deficiencies in a timely manner. If we cannot provide reliable financial reports, our reputation and operating results could be materially adversely affected, which could also cause investors to lose confidence in our reported financial information, which in turn could result in a reduction in the trading price of our common stock.
We have concluded that certain of our previously issued interim unaudited consolidated financial statements should not be relied upon and have restated certain of our previously issued financial statements, which was time-consuming and expensive and could expose us to additional risks that could have a negative effect on us.
As discussed in the Explanatory Note, we determined to restate our unaudited consolidated financial statements as of March 31, 2023, June 30, 2023 and September 30, 2023, and that such interim unaudited financial statements should no longer be relied upon. As a result, we have incurred unanticipated costs for accounting and legal fees related to this restatement, and have become subject to a number of additional risks and uncertainties, which may affect investor confidence in the accuracy of our financial disclosures and may raise reputational issues for our business. We expect to continue to face many of the risks and challenges related to the restatement, including the following:
•we may fail to remediate material weaknesses in our internal control over financial reporting and other material weaknesses may be identified in the future, which would adversely affect the accuracy and timing of our financial reporting;
•the processes undertaken to affect the restatement may not have been adequate to identify and correct all errors in our historical financial statements and, as a result, we may discover additional errors and our financial statements remain subject to the risk of future restatement;
•the incurrence of restatement-related expenses; and
•diversion of management and other human resources attention from the operation of our business.
We cannot assure that all of the risks and challenges described above will be eliminated and that lost business opportunities can be recaptured or that general reputational harm will not persist. If one or more of the foregoing risks or challenges persist, there may be a material adverse effect on our business, financial condition, results of operations, and cash flows.
We have been and may in the future be required to write down intangible assets, including goodwill, due to impairment, which could have a material adverse effect on our business, financial condition, results of operations and growth prospects.
We have in the past and may in the future be required to write down intangible assets, including goodwill, due to impairment, which would reduce earnings. We periodically calculate the fair value of our intangible assets to test for impairment. This calculation may be affected by several factors, including changes in general economic conditions, including inflation, deflation and energy costs; changes in foreign currency exchange rates; our rental rates and occupancy levels; increases in interest rates and operating costs, including insurance premiums and real estate taxes; the effects of natural disasters; and competitive market forces. Certain events can also trigger an immediate review of goodwill and intangible assets. If the carrying value of our intangible assets exceeds its fair value, the goodwill and other intangible assets are considered impaired, which would result in impairment losses and could have a material adverse effect on our business, financial condition, results of operations and growth prospects.
Refer to Note 1, "Significant Accounting Policies," Note 6, "Goodwill and Other Intangible Assets," and Note 22, "Quarterly Financial Data (Unaudited and Restated)", in our accompanying Consolidated Financial Statements, "Controls and Procedures" in Part II, Item 9A, and "Management's Discussion and Analysis of Financial Condition and Results of Operations" in Part II, Item 7 of this Annual Report for information on impairments to the goodwill for our Park Holidays portfolio in the UK that we recognized at each of March 31, 2023, June 30, 2023 and September 30, 2023.
MATERIAL RISKS RELATING TO OUR MH, RV AND MARINA BUSINESSES
General economic conditions and the concentration of our MH, RV and marina properties in certain geographic areas may affect our ability to generate revenue.
The market and economic conditions in our current markets generally, and specifically in metropolitan areas of our current markets, may significantly affect occupancy or rental rates. Occupancy and rental rates, in turn, may significantly affect our revenues, and if our properties do not generate revenues sufficient to meet our operating expenses, including debt service and capital expenditures, our cash flows and ability to pay or refinance our debt obligations could be adversely affected.
13
SUN COMMUNITIES, INC.
As of December 31, 2023, 150 of our MH and RV communities and marinas, representing 21.8% of developed sites, are located in Florida; 92 communities, representing 16.5% of developed sites, are located in Michigan; 55 communities, representing 9.4% of developed sites, are located in the UK; 48 communities, representing 6.4% of developed sites, are located in California; and 32 communities, representing 5.7% of developed sites, are located in Texas. As of December 31, 2023, we have revenue concentrations of marinas in Florida, Rhode Island and Georgia of approximately 32.8%, 8.7% and 8.0%, respectively. As a result of the geographic concentration of our MH and RV communities in Florida, Michigan, the UK, California and Texas, and of our marinas in Florida, Rhode Island and Georgia, we are exposed to the risks of downturns in local economies or other local real estate market conditions which could adversely affect occupancy rates, rental rates and property values in these markets.
Our revenue would also be adversely affected if tenants and members were unable to pay rent or if sites were unable to be rented on favorable terms. If we were unable to promptly relet or renew the leases for a significant number of the sites, or if the rental rates upon such renewal or reletting were significantly lower than expected rates, then our business and results of operations could be adversely affected. In addition, certain expenditures associated with each property (such as real estate taxes and maintenance costs) generally are not reduced when circumstances cause a reduction in income from the property. Furthermore, real estate investments are relatively illiquid and, therefore, will tend to limit our ability to vary our portfolio promptly in response to changes in economic or other conditions.
The following factors, among others, may adversely affect the revenues generated by our properties:
•the international, national and local economic climate which may be adversely impacted by, among other factors, plant closings, industry slowdowns and inflation;
•local real estate market conditions such as the oversupply of MH and RV sites or a reduction in demand for MH and RV sites in an area, and an oversupply of, or a reduced demand for, manufactured homes;
•increased operating costs, including insurance premiums, real estate taxes and utilities;
•competition from other available MH and RV communities and alternative forms of housing (such as apartment buildings and site-built single-family homes), and other marinas;
•a decrease in the number of people interested in the RV lifestyle or boating;
•outbreaks of disease and related restrictions on business operations;
•changes in foreign currency exchange rates, including between the U.S. dollar and each of the Canadian dollar, Australian dollar and Pound sterling;
•the number of repossessed homes in a particular market;
•the difficulty facing potential purchasers in obtaining affordable financing as a result of heightened lending criteria;
•an increase or decrease in the rate of manufactured home repossessions which provide aggressively priced competition to new manufactured home sales;
•the lack of an established MH dealer network;
•the housing rental market which may limit the extent to which rents may be increased to meet increased expenses without decreasing occupancy rates;
•the perceptions by prospective tenants of the safety, convenience and attractiveness of our MH properties and the neighborhoods where they are located;
•zoning or other environmental regulatory restrictions;
•our ability to effectively manage, maintain and insure our properties; and
•the enactment of rent control laws or laws taxing the owners of manufactured homes.
We may not be able to integrate or finance our expansion and development activities.
We build and develop new MH and RV communities and marinas and we expand existing communities and marinas. Our construction and development pipeline may be exposed to the following risks which are in addition to those risks associated with the ownership and operation of established MH and RV communities and marinas:
•we may not be able to obtain financing with favorable terms for development which may make us unable to proceed with the development;
14
SUN COMMUNITIES, INC.
•we may be unable to obtain, or face delays in obtaining, necessary zoning, building and other governmental permits and authorizations, which could result in increased costs and delays, and even require us to abandon development of the property entirely if we are unable to obtain such permits or authorizations;
•we may abandon development opportunities that we have already begun to explore and as a result we may not recover expenses already incurred in connection with exploring such development opportunities;
•we may be unable to complete construction and lease-up of a property on schedule resulting in increased debt service expense and construction costs;
•we may incur construction and development costs for a property which exceed our original estimates due to increased materials, labor or other costs, which could make completing the development uneconomical and we may not be able to increase rents to compensate for the increase in development costs which may impact our profitability;
•we may be unable to secure long-term financing on completion of development resulting in increased debt service and lower profitability;
•occupancy rates and rents at a newly developed property may fluctuate depending on several factors, including market and economic conditions, which may result in the property not being profitable; and
•climate change may cause new marina developments to be paused or restricted.
If any of the above risks occur, our business and results of operations could be adversely affected.
Competition affects occupancy levels and rents, which could adversely affect our revenues.
The MH, RV and marina industries are highly-fragmented. There are many international, national and regional competitors in the MH, RV and marina markets we currently serve and in new markets that we may enter. Our properties are located in developed areas that include other MH and RV communities, and marinas. The number of competitive MH and RV communities and marinas in a particular area could have a material adverse effect on our ability to lease sites and increase rents charged at our properties or at any newly acquired properties. We may be competing with others with greater resources. In addition, other forms of multi-family residential properties, such as private and federally funded or assisted multi-family housing projects and single-family housing, provide housing alternatives to potential tenants of MH and RV communities.
The cyclical and seasonal nature of the RV and marina industries may lead to fluctuations in our operating results.
The RV and marina industries can experience cycles of growth and downturn due to seasonality patterns. Results of operations in any one period may not be indicative of results in future periods. In the RV business, certain properties maintain higher occupancy during the summer months, while other properties maintain higher occupancy during the winter months. The RV business typically shows a decline in demand over the winter months, yet usually produces higher growth in the spring and summer months due to higher use by vacationers. In the marina business, demand for wet slip storage increases during the summer months as customers contract for the summer boating season, which also drives non-storage revenue streams such as service, fuel and on-premise restaurants or convenience storage. Demand for dry storage increases during the winter season as seasonal weather patterns require boat owners to store their vessels on dry docks or within covered racks. Our results on a quarterly basis can fluctuate due to this cyclicality and seasonality.
We may not be able to integrate or finance our acquisitions and our acquisitions may not perform as expected.
We have acquired and intend to continue to selectively acquire MH, RV and marina properties. Our acquisition activities and their success are subject to the following risks:
•we may be unable to acquire a desired property because of competition from other well-capitalized real estate investors, including both publicly traded REITs and institutional investment funds;
•even if we enter into an acquisition agreement for a property, it is usually subject to customary conditions to closing, including completion of due diligence investigations to our satisfaction, which may not be satisfied;
•even if we are able to acquire a desired property, competition from other real estate investors may significantly increase the purchase price;
•we may be unable to finance acquisitions on favorable terms;
•acquired properties may fail to perform as expected;
15
SUN COMMUNITIES, INC.
•acquired properties may be located in new markets where we face risks associated with a lack of market knowledge or understanding of the local economy, lack of business relationships in the area, and unfamiliarity with local governmental and permitting procedures; and
•we may be unable to quickly and efficiently integrate new acquisitions, particularly acquisitions of portfolios of properties, into our existing operations.
If any of the above risks occur, our business and results of operations could be adversely affected.
In addition, we may acquire properties subject to liabilities and we may be left with no, or limited, recourse, with respect to unknown liabilities. As a result, we may have to pay substantial sums to settle any liabilities asserted against us based upon ownership of newly acquired properties, which could adversely affect our cash flows.
Investments through joint ventures involve risks not present for properties in which we are the sole owner.
We have invested and may continue to invest as a joint venture partner in joint ventures. These investments involve risks, including, but not limited to, the possibility the other joint venture partner may have business goals which are inconsistent with ours, possess the ability to take or force action or withhold consent contrary to our requests, fail to provide capital or fulfill its obligations, or become insolvent and require us to assume and fulfill the joint venture's financial obligations. Conflicts arising between us and our joint venture partners may be difficult to manage or resolve and it could be difficult to manage or otherwise monitor the existing business arrangements. We and our joint venture partners may each have the right to initiate a buy-sell arrangement, which could cause us to sell our interest, or acquire a joint venture partner's interest, at a time when we otherwise would not have entered into such a transaction. Each joint venture agreement is individually negotiated, and our ability to operate, finance or dispose of a property in our sole discretion may be limited to varying degrees depending on the terms of the applicable joint venture agreement.
Many of our properties are located in areas that experience extreme weather conditions and natural disasters and climate change may adversely affect our business.
Extreme weather or weather-related conditions and other natural disasters, including hurricanes, flash floods, sea-level rise, droughts, tornadoes, wildfires or earthquakes, may interrupt our operations, damage our properties and reduce the number of customers who utilize our properties in the affected areas. Many of our properties are on coastlines that are subject to hurricane seasons, flash flooding and sea level rise; in areas adversely affected by wildfires, such as the western U.S.; and in earthquake-prone areas, such as the West Coast. If there are prolonged disruptions at our properties due to extreme weather or natural disasters, our results of operations and financial condition could be materially adversely affected.
While we maintain insurance coverage that may cover certain of the costs and loss of revenue associated with the effect of extreme weather and natural disasters at our properties, our coverage is subject to deductibles and limits on maximum benefits. We cannot assure you that we will be able to fully collect, if at all, on any claims resulting from extreme weather or natural disasters.
If any of our properties are damaged or if their operations are disrupted as a result of extreme weather or natural disasters, or if extreme weather or natural disasters adversely impact general economic or other conditions in the areas in which our properties are located or from which they draw their tenants and customers, our business, financial condition and results of operations could be materially adversely affected.
Significant changes in the climate could exacerbate extreme weather conditions or natural disasters that may occur in areas where our properties are located, all of which may result in additional physical damage to, or a decrease in demand for, properties located in these areas or affected by these conditions. If the impact of climate change is material in nature, including significant property damage to or destruction of our properties, or occur for lengthy periods of time, our financial condition or results of operations may be adversely affected.
While they are unpredictable, the impacts of climate change may change residential migration and vacation trends, which could reduce demand for our properties. If the areas in which our properties are located become less desirable places to live or vacation, the value of our properties and their ability to generate revenue may be materially adversely affected.
16
SUN COMMUNITIES, INC.
In addition, changes in federal, state, local and foreign legislation and regulation based on concerns about climate change, as well as voluntary measures we take to combat climate change, could result in increased capital expenditures at our properties. For example, these could include expenditures to improve energy efficiency, improve resistance to inclement weather and for infrastructure improvement to support existing and emerging low-carbon technologies. These expenditures may not result in a corresponding increase in revenue, resulting in material adverse impacts to our financial results.
Marinas may not be readily adaptable to other uses.
Marinas are specific-use properties and may contain features or assets that have limited alternative uses. These properties may also have distinct operational functions that involve specific procedures and training. If the operations of any of our marinas become unprofitable due to industry competition, operational execution or otherwise, then it may not be feasible to operate the property for another use, and the value of certain features or assets used at the property, or the property itself, may be impaired. Should any of these events occur, our financial condition, results of operations and cash flows could be adversely impacted.
We may be unable to obtain, renew or maintain permits, licenses and approvals necessary for the operation of our marinas.
The U.S. Army Corps of Engineers, the Coast Guard and other governmental bodies control much of the land located beneath and surrounding many of our marinas and lease such land to Safe Harbor under leases that typically range from five to 50 years. As a result, it is unlikely that we can obtain fee-simple title to the land on or near these marinas. If these governmental authorities terminate, fail to renew, or interpret in ways that are materially less favorable any of the permits, licenses and approvals necessary for operation of these properties, then our financial condition, results of operations and cash flows could be adversely impacted.
Some marinas must be dredged from time to time to remove silt and mud that collect in harbor-areas in order to assure that boat traffic can safely enter the harbor. Dredging and disposing of the dredged material can be very costly and require permits from various governmental authorities. If the permits necessary to dredge marinas or dispose of the dredged material cannot be timely obtained after the acquisition of a marina, or if dredging is not practical or is exceedingly expensive, the operations of such property would be materially and adversely affected.
We may incur liability under environmental laws arising from conditions at properties we acquire or operations at the properties we own and operate.
Under various federal, state, local and foreign laws, ordinances and regulations, an owner or operator of real estate is liable for the costs of removal or remediation of certain hazardous substances at, on, under, or in such property. Such hazardous substances may be used at or located on our properties, especially our marinas. Such laws often impose liability without regard to whether the owner knew of, or was responsible for, the presence of such hazardous substances. The presence of such substances, or the failure to properly remediate such substances, may adversely affect the owner's ability to sell or rent the property, to borrow using the property as collateral or to develop the property. Persons who arrange for the disposal or treatment of hazardous substances also may be liable for the costs of removal or remediation of such substances at a disposal or treatment facility owned or operated by another person. In addition, certain environmental laws impose liability for the management and disposal of asbestos-containing materials and for the release of such materials into the air. These laws may result in fines or penalties and may permit third parties to seek recovery from owners or operators of real properties for personal injury associated with asbestos-containing materials.
As the purchaser of properties we acquire or in connection with the operation of properties we own or manage, we may be liable for removal or remediation costs, governmental fines and injuries to persons and property. When we arrange for the treatment or disposal of hazardous substances at landfills or other facilities owned by other persons, we may be liable for the removal or remediation costs at such facilities.
As part of our standard acquisition due diligence, we subject our properties to a Phase I or similar environmental assessment as well as limited compliance evaluations (which involve general inspections without soil sampling or ground water analysis) completed by independent environmental and engineering consultants. In some cases, where these evaluations have recommended further, invasive investigations, those have also been conducted. While these environmental evaluations have not revealed any significant environmental liability that would have a material adverse effect on our business, they cannot reflect conditions arising after the studies were completed. No assurances can be given that existing environmental studies reveal all environmental liabilities, that any prior owner or operator of a property or neighboring owner or operator did not create any material environmental condition not known to us, or that a material environmental condition does not otherwise exist as to any one or more properties.
17
SUN COMMUNITIES, INC.
Moreover, we cannot be sure that future laws, ordinances or regulations will not impose any material environmental liability, or the current environmental condition of our properties will not be affected by tenants and occupants of the properties, by the condition of land or operations in the vicinity of our properties (such as the presence of underground storage tanks), or by unrelated third parties. Environmental liabilities that we may incur could have an adverse effect on our financial condition, results of operations and cash flows.
We are subject to additional risks from our international investments.
Park Holidays represents our first major investment in the UK. We may also pursue other significant acquisition opportunities outside the U.S. Our ownership of Park Holidays and any other international investments subjects us to additional risks, including:
•the laws, rules and regulations applicable in such jurisdictions outside of the U.S., including those related to property ownership by foreign entities, consumer and data protection, privacy, network security, encryption, payments and restricting us from removing profits earned from activities within the country to the U.S. (i.e., nationalization of assets located within a country);
•complying with a wide variety of foreign laws;
•fluctuations in exchange rates between foreign currencies and the U.S. dollar, and exchange controls;
•limited experience with local business and cultural factors that differ from our usual standards and practices;
•changes in the availability, cost and terms of mortgage funds and other borrowings resulting from varying national economic policies or changes in interest rates;
•reliance on local management;
•challenges in establishing effective controls and procedures to regulate operations in different regions and to monitor and ensure compliance with applicable regulations, such as applicable laws related to corrupt practices, employment, licensing, construction, climate change or environmental compliance;
•unexpected changes in regulatory requirements, tax, tariffs, trade barriers and other laws within jurisdictions outside the U.S. or between the U.S. and such jurisdictions;
•potentially adverse tax consequences with respect to our properties;
•the impact of regional or country-specific business cycles and economic instability, including deterioration in political relations with the U.S., instability in, or further withdrawals from, the European Union or other international trade alliances or agreements;
•the impact of disruptions in global, regional or local supply chains, including disruptions occurring as a result of outbreaks of disease; and
•political instability, uncertainty over property rights, civil unrest, drug trafficking, political activism or the continuation or escalation of terrorist activities.
If we are unable to adequately address these risks, they could have a significant adverse effect on our operations.
We depend on Safe Harbor's management to operate our marina business.
Safe Harbor's operations are separate from our other operations. The successful operation of our marinas depends on our ability to retain key employees with experience in the marina business, including Baxter R. Underwood, who is the Chief Executive Officer of Safe Harbor. The loss of services of Mr. Underwood or other key employees could have a material adverse effect on our ability to operate Safe Harbor. Although Mr. Underwood has entered into an employment and non-competition agreement, upon certain events he will have the option to eliminate the non-competition covenant by foregoing certain compensation and other benefits. We do not currently maintain or contemplate obtaining any "key-man" life insurance on any of the key employees of Safe Harbor.
Public health crises, such as outbreaks of disease, could materially and adversely affect our financial condition, operating results and cash flows.
A public health crisis, such as the COVID-19 pandemic, could have material and adverse effects on our ability to successfully operate our business and on our financial condition. The government and societal responses to public health crises are highly uncertain and we cannot predict with confidence the impact a public health crisis would have on our operations and financial condition.
18
SUN COMMUNITIES, INC.
Rent control legislation may harm our ability to increase rents.
National, state and local rent control laws in certain jurisdictions may limit our ability to increase rents at our MH properties to recover increases in operating expenses and the costs of capital improvements. Enactment of such laws has been considered from time to time in other jurisdictions. Certain properties are located, and we may purchase additional properties, in markets that are either subject to rent control or in which rent-limiting legislation exists or may be enacted.
RISKS RELATED TO OUR DEBT FINANCINGS
Our significant amount of debt could limit our operational flexibility or otherwise adversely affect our financial condition, and we may incur more debt in the future.
We have a significant amount of debt. As of December 31, 2023, we had approximately $7.8 billion of total debt outstanding, consisting of approximately $3.5 billion in collateralized term loans and debt that is secured by mortgage liens on 156 of our properties, $2.2 billion of senior unsecured notes and $2.1 billion on our line of credit and other debt. Including the impact of hedge activity, as of December 31, 2023, approximately 84% of our total debt was fixed rate financing and approximately 16% of our total debt was floating rate financing. If we fail to meet our obligations under our secured debt, the lenders would be entitled to foreclose on all or some of the collateral securing such debt which could have a material adverse effect on us and our ability to make expected distributions, and could threaten our continued viability.
We are subject to the risks normally associated with debt financing, including the following risks:
•our cash flows may be insufficient to meet required debt payments, or we may need to dedicate a substantial portion of our cash flows to pay our debt rather than to other areas of our business;
•our existing debt may limit our operating flexibility due to financial and other restrictive covenants, including restrictions on incurring additional debt;
•it may be more difficult for us to obtain additional financing for our operations, working capital requirements, capital expenditures, debt service or other general requirements;
•increases in interest rates will increase the costs of our floating rate debt and make obtaining new debt more expensive;
•we may be more vulnerable in the event of adverse economic and industry conditions or a downturn in our business;
•we may be placed at a competitive disadvantage compared to our competitors that have less debt; and
•we may not be able to refinance at all or on favorable terms, as our debt matures.
If any of the above risks occurred, our financial condition and results of operations could be materially adversely affected.
Despite our current debt levels, we may incur substantially more debt in the future. If new debt is added to our current debt levels, an even greater portion of our cash flows will be needed to satisfy our debt service obligations. As a result, the related risks that we now face could intensify and increase the risk of a default on our debt.
Covenants in our credit agreements and senior unsecured note indentures could limit our flexibility and adversely affect our financial condition.
The terms of our financing agreements and other debt require us to comply with a number of customary financial and other covenants. These covenants may limit our flexibility in our operations, and breaches of these covenants could result in defaults under the instruments governing the applicable debt even if we have satisfied our payment obligations. Our financing agreements contain certain cross-default provisions that could be triggered in the event that we default on our other debt. These cross-default provisions may require us to repay or restructure our senior credit facility in addition to any mortgage or other debt that is in default. If our properties were foreclosed upon, or if we are unable to refinance our debt at maturity or meet our payment obligations, the amount of our distributable cash flows and our financial condition would be adversely affected.
Our senior credit facility contains various financial covenants including, but not limited to a maximum leverage ratio, a minimum fixed charge coverage ratio and a maximum secured leverage ratio. In addition to our senior credit facility, our senior unsecured notes also contain various covenants including an aggregate debt test, a secured debt test, a debt service test, and a maintenance of total unencumbered assets test. These covenants may restrict our ability to pursue certain business initiatives or certain transactions that might otherwise be advantageous. Furthermore, failure to meet certain of these financial covenants could cause an event of default under and / or accelerate some or all of such debt which could have a material adverse effect on us.
19
SUN COMMUNITIES, INC.
An increase in market interest rates could raise our interest costs on existing and future debt or adversely affect our stock price, and a decrease in interest rates may lead to additional competition for the acquisition of real estate or adversely affect our results of operations.
Our interest costs for any new debt and our current debt obligations may rise if interest rates increase. This increased cost could make the financing of any new acquisition more expensive as well as lower our current period earnings. Rising interest rates could limit our ability to refinance existing debt when it matures or cause us to pay higher interest rates upon refinancing. In addition, an increase in interest rates could decrease the access our customers have to credit, thereby decreasing the demand for manufactured homes and recreational vehicles. An increase in market interest rates may lead prospective purchasers of our common stock to expect a higher dividend yield, which could adversely affect the market price of our common stock. Decreases in interest rates may lead to additional competition for the acquisition of real estate due to a reduction in desirable alternative income-producing investments. Increased competition for the acquisition of real estate may lead to a decrease in the yields on real estate targeted for acquisition. In such circumstances, if we are not able to offset the decrease in yields by obtaining lower interest costs on our borrowings, our results of operations may be adversely affected.
Our hedging strategies may not be successful in mitigating our risks associated with interest rates and could reduce the overall returns on your investment.
We use various derivative financial instruments to provide a level of protection against interest rate risks, but no hedging strategy can protect us completely. These instruments involve risks, such as the risk that the counterparties may fail to honor their obligations under these arrangements, that these arrangements may not be effective in reducing our exposure to interest rate changes, that a court could rule that such agreements are not legally enforceable and that we may have to post collateral to enter into hedging transactions, which we may lose if we are unable to honor our obligations. These instruments may also generate income that may not be treated as qualifying REIT income for purposes of the REIT income tests. In addition, the nature and timing of hedging transactions may influence the effectiveness of our hedging strategies. Poorly designed strategies or improperly executed transactions could actually increase our risk and losses. Moreover, hedging strategies involve transaction and other costs. We cannot assure you that our hedging strategy and the derivatives that we use will adequately offset the risk of interest rate volatility or that our hedging transactions will not result in losses that may reduce the overall return on your investment.
A downgrade in our credit ratings could have material adverse effects on our business and financial condition.
We intend to manage our operations to maintain our investment grade credit ratings from S&P Global and Moody's. These ratings are based on a number of factors, which include assessments of our financial strength, liquidity, capital structure, asset quality, and sustainability of cash flows and earnings. Changes in these factors could lead to a downgrade of our ratings, leading to an adverse impact on our cost and availability of capital, which could in turn have a material adverse impact on our financial condition, results of operations and liquidity.
TAX RISKS RELATED TO OUR STATUS AS A REIT
We may suffer adverse tax consequences and be unable to attract capital if we fail to qualify as a REIT.
We believe that since our taxable year ended December 31, 1994, we have been organized and operated, and intend to continue to operate, so as to qualify for taxation as a REIT under the Code. Although we believe that we have been and will continue to be organized and have operated and will continue to operate so as to qualify for taxation as a REIT, we cannot be assured that we have been or will continue to qualify as a REIT. Qualification as a REIT involves the satisfaction of numerous requirements on an annual and quarterly basis established under highly technical and complex Code provisions for which there are limited judicial or administrative interpretations and involves the determination of various factual matters and circumstances not entirely within our control. In addition, frequent changes occur in the area of REIT taxation, which requires us to continually monitor our tax status.
If we fail to qualify as a REIT in any taxable year, our taxable income could be subject to U.S. federal income tax at regular corporate rates. Moreover, unless entitled to relief under certain statutory provisions, we also would be disqualified from treatment as a REIT for the four taxable years following the year during which qualification was lost. This treatment would reduce our net earnings available for investment or distribution to shareholders because of the additional tax liability to us for the years involved. In addition, distributions to shareholders would no longer be required to be made.
20
SUN COMMUNITIES, INC.
Federal, state and foreign income tax laws governing REITs and related interpretations may change at any time, and any such legislative or other actions affecting REITs could have a negative effect on us.
Federal, state and foreign income tax laws governing REITs, or the administrative interpretations of those laws may be amended at any time. Changes to tax laws, regulations or administrative interpretations, which may be applied retroactively, could adversely affect us. We cannot predict whether, when, in what forms, or with what effective dates, the tax laws, regulations and administrative interpretations applicable to us may be changed. Such changes could significantly affect either our ability to qualify for taxation as a REIT or the income tax consequences to us.
We intend for the Operating Partnership to be taxed as a partnership, but we cannot guarantee that it will qualify.
We believe that the Operating Partnership has been organized as a partnership and will qualify for treatment as such under the Code. However, if the Operating Partnership is deemed to be a "publicly traded partnership," it will be treated as a corporation instead of a partnership for federal income tax purposes unless at least 90% of its income is qualifying income as defined in the Code. The income requirements applicable to REITs and the definition of "qualifying income" for purposes of this 90% test are similar in most respects. Qualifying income for the 90% test generally includes passive income, such as specified types of real property rents, dividends and interest. We believe that the Operating Partnership has and will continue to meet this 90% test, but we cannot guarantee that it has or will. If the Operating Partnership were to be taxed as a regular corporation, it would incur substantial tax liabilities, we would fail to qualify as a REIT for federal income tax purposes and our ability to raise additional capital could be significantly impaired.
Partnership tax audit rules could have a material adverse effect on us.
Under the rules applicable to U.S. federal income tax audits of partnerships, subject to certain exceptions, any audit adjustment to items of income, gain, loss, deduction or credit of a partnership (and a partner's allocable share thereof) is determined, and taxes, interest, and penalties attributable thereto are assessed and collected, at the partnership level. Unless the partnership makes an election or takes certain steps to require the partners to pay their tax on their allocable shares of the adjustment, it is possible that partnerships in which we directly or indirectly invest, including the Operating Partnership, would be required to pay additional taxes, interest and penalties as a result of an audit adjustment. We, as a direct or indirect partner of the Operating Partnership and other partnerships, could be required to bear the economic burden of those taxes, interest and penalties even though the Company, as a REIT, may not otherwise have been required to pay additional corporate-level tax. These rules are significant for collecting tax in partnership audits and there can be no assurance that these rules will not have a material adverse effect on us.
Our ability to accumulate cash may be restricted due to certain REIT distribution requirements.
In order to qualify as a REIT, we must distribute to our shareholders at least 90% of our REIT taxable income (calculated without any deduction for dividends paid and excluding net capital gain) and to avoid federal income taxation, our distributions must not be less than 100% of our REIT taxable income, including capital gains. As a result of the distribution requirements, we do not expect to accumulate significant amounts of cash. Accordingly, these distributions could significantly reduce the cash available to us in subsequent periods to fund our operations and future growth.
Our taxable REIT subsidiaries, or TRSs, are subject to special rules that may result in increased taxes.
As a REIT, we must pay a 100% penalty tax on certain payments that we receive if the economic arrangements between us and any of our TRSs are not comparable to similar arrangements between unrelated parties. The Internal Revenue Service may successfully assert that the economic arrangements of any of our inter-company transactions are not comparable to similar arrangements between unrelated parties. This would result in unexpected tax liability which would adversely affect our cash flows.
Dividends payable by REITs do not qualify for the reduced tax rates applicable to certain dividends.
The maximum federal tax rate for certain qualified dividends payable to domestic shareholders that are individuals, trusts and estates is 20%. Dividends payable by REITs, however, are generally not eligible for this reduced rate, although the Tax Cut and Jobs Act permits a 20% deduction equal to the amount of qualifying REIT dividends received, thus bringing the maximum federal tax rate on qualifying REIT dividends to 29.6%. While this rule does not adversely affect the taxation of REITs or dividends paid by REITs, the more favorable rates applicable to regular qualified corporate dividends could cause investors who are individuals, trusts and estates to perceive investments in REITs to be relatively less competitive than investments in stock of non-REIT corporations that pay dividends, which could adversely affect the comparative value of the stock of REITs, including our common stock and preferred stock.
21
SUN COMMUNITIES, INC.
Prospective investors should consult their own tax advisors regarding the effect of this change on their effective tax rate with respect to REIT dividends.
Complying with REIT requirements may cause us to forego otherwise attractive opportunities.
To remain qualified as a REIT for federal income tax purposes, we must continually satisfy requirements and tests under the tax law concerning, among other things, the sources of our income, the nature and diversification of our assets, the amounts we distribute to our shareholders and the ownership of our stock. In order to meet these tests, we may be required to forego or limit attractive business or investment opportunities and distribute all of our net earnings rather than invest in attractive opportunities or hold larger liquid reserves. Therefore, compliance with the REIT requirements may hinder our ability to operate solely to maximize profits.
RISKS RELATED TO OUR STRUCTURE
Certain provisions in our governing documents may make it difficult for a third-party to acquire us.
9.8% Ownership Limit. In order to qualify and maintain our qualification as a REIT, not more than 50% of the outstanding shares of our capital stock may be owned, directly or indirectly, by five or fewer individuals. Thus, ownership of more than 9.8%, in number of shares or value, of the issued and outstanding shares of our capital stock by any single shareholder has been restricted, with certain exceptions, for the purpose of maintaining our qualification as a REIT under the Code. Such restrictions in our charter do not apply to Milton M. Shiffman, Gary A. Shiffman and Robert B. Bayer; trustees, personal representatives and agents to the extent acting for them or their respective estates; or certain of their respective relatives.
The 9.8% ownership limit, as well as our ability to issue additional shares of common stock or shares of other stock (which may have rights and preferences over the common stock), may discourage a change of control of the Company and may also: (a) deter tender offers for the common stock, which offers may be advantageous to shareholders; and (b) limit the opportunity for shareholders to receive a premium for their common stock that might otherwise exist if an investor were attempting to assemble a block of common stock in excess of 9.8% of our outstanding shares or otherwise effect a change of control of the Company.
Preferred Stock. Our charter authorizes the Board of Directors to issue up to 20,000,000 shares of preferred stock, none of which is currently outstanding, and to establish the preferences and rights (including the right to vote and the right to convert into shares of common stock) of any shares issued. The power to issue preferred stock could have the effect of delaying or preventing a change in control of the Company even if a change in control were in the shareholders' interest.
Certain provisions of Maryland law could inhibit changes in control, which may discourage third parties from conducting a tender offer or seeking other change of control transactions that could involve a premium price for our common stock or that our shareholders otherwise believe to be in their best interest.
Certain provisions of the Maryland General Corporation Law ("MGCL") may have the effect of inhibiting a third-party from making a proposal to acquire us or of impeding a change of control under circumstances that otherwise could provide the holders of shares of our capital stock with the opportunity to realize a premium over the then-prevailing market price of such shares, including:
•"Business combination" provisions that, subject to limitations, prohibit certain business combinations between us and an "interested shareholder" (defined generally as any person who beneficially owns 10% or more of the voting power of our shares or an affiliate thereof or an affiliate or associate of ours who was the beneficial owner, directly or indirectly, of 10% or more of the voting power of our then outstanding voting stock at any time within the two-year period immediately prior to the date in question) for five years after the most recent date on which the shareholder becomes an interested shareholder, and thereafter impose fair price and / or supermajority and shareholder voting requirements on these combinations; and
•"Control share" provisions that provide that "control shares" of our company (defined as shares that, when aggregated with other shares controlled by the shareholder, entitle the shareholder to exercise one of three increasing ranges of voting power in electing directors) acquired in a "control share acquisition" (defined as the direct or indirect acquisition of ownership or control of issued and outstanding "control shares") have no voting rights except to the extent approved by our shareholder by the affirmative vote of at least two-thirds of all the votes entitled to be cast on the matter, excluding all interested shares.
22
SUN COMMUNITIES, INC.
The provisions of the MGCL relating to business combinations do not apply, however, to business combinations that are approved or exempted by our Board of Directors prior to the time that the interested shareholder becomes an interested shareholder. As permitted by the statute, our Board of Directors has by resolution exempted Milton M. Shiffman, Robert B. Bayer and Gary A. Shiffman, their affiliates and all persons acting in concert or as a group with the foregoing, from the business combination provisions of the MGCL and, consequently, the five-year prohibition and the supermajority vote requirements will not apply to business combinations between us and these persons. As a result, these persons may be able to enter into business combinations with us that may not be in the best interests of our shareholder without compliance by our company with the supermajority vote requirements and the other provisions of the statute.
Also, pursuant to a provision in our bylaws, we have exempted any acquisition of our stock from the control share provisions of the MGCL. However, our Board of Directors may by amendment to our bylaws opt into the control share provisions of the MGCL at any time in the future.
Additionally, Subtitle 8 of Title 3 of the MGCL permits our Board of Directors, without shareholder approval and regardless of what is currently provided in our charter or bylaws, to elect to be subject to certain provisions relating to corporate governance that may have the effect of delaying, deferring or preventing a transaction or a change of control of our company that might involve a premium to the market price of our common stock or otherwise be in our shareholders' best interests. These provisions include a classified board; two-thirds vote to remove a director; that the number of directors may only be fixed by the Board of Directors; that vacancies on the board as a result of an increase in the size of the board or due to death, resignation or removal can only be filled by the board, and the director appointed to fill the vacancy serves for the remainder of the full term of the class of director in which the vacancy occurred; and a majority requirement for the calling by shareholders of special meetings. Other than a classified board, the filling of vacancies as a result of the removal of a director and a majority requirement for the calling by shareholders of special meetings, we are already subject to these provisions, either by provisions of our charter and bylaws unrelated to Subtitle 8 or by reason of an election to be subject to certain provisions of Subtitle 8. In the future, our Board of Directors may elect, without shareholder approval, to make us subject to the provisions of Subtitle 8, to which we are not currently subject.
Our Board of Directors has power to adopt, alter or repeal any provision of our bylaws or make new bylaws, provided, however, that our shareholders may alter or repeal any provision of our bylaws and adopt new bylaws if any such alteration, repeal or adoption is approved by the affirmative vote of a majority of all votes entitled to be cast on the matter.
GENERAL RISK FACTORS
Our share price could be volatile and could decline, resulting in a substantial or complete loss on our shareholders' investment.
Our common stock has experienced significant price and volume fluctuations. In the future, the market price of our common stock and preferred stock could be similarly volatile, and investors in our common stock and preferred stock may experience a decrease in the value of their shares, including decreases unrelated to our operating performance or prospects. The price of our common stock and preferred stock could be subject to wide fluctuations in response to a number of factors, including:
•issuances of other equity securities in the future, including new series or classes of preferred stock;
•our operating performance and the performance of other similar companies;
•our ability to maintain compliance with covenants contained in our debt facilities and our unsecured notes;
•actual or anticipated variations in our operating results, funds from operations, cash flows or liquidity;
•changes in expectations of future financial performance or changes in our earnings estimates or those of analysts;
•changes in our distribution policy;
•publication of research reports about us or the real estate industry generally;
•increases in market interest rates that lead purchasers of our common stock and preferred stock to demand a higher dividend yield;
•changes in foreign currency exchange rates, including between the U.S. dollar and each of the Canadian dollar, Australian dollar and Pound sterling;
•changes in market valuations of similar companies;
•outbreaks of disease, and related restrictions on business operations;
•adverse market reaction to the amount of our debt outstanding at any time, the amount of our debt maturing in the near-term and medium-term and our ability to refinance our debt, or our plans to incur additional debt in the future;
23
SUN COMMUNITIES, INC.
•additions or departures of key management personnel;
•speculation in the press or investment community;
•equity issuances by us, or share resales by our shareholders or the perception that such issuances or resales may occur;
•actions by institutional shareholders;
•litigation or threatened litigation, which may divert our management's time and attention, require us to pay damages and expenses or restrict the operation of our business;
•failure to qualify and maintain our qualification as a REIT; and
•general market and economic conditions.
Many of the factors listed above are beyond our control. Those factors may cause the market price of our common stock or preferred stock to decline significantly, regardless of our financial condition, results of operations and prospects. It is impossible to provide any assurance that the market price of our common stock or preferred stock will not fall in the future, and it may be difficult for holders to resell shares of our common stock or preferred stock at prices they find attractive, or at all. In the past, securities class action litigation has often been instituted against companies following periods of volatility in their stock price. This type of litigation could result in substantial costs and divert our management's attention and resources.
Substantial sales or issuances of our common or preferred stock could cause our stock price to fall.
The sale or issuance of substantial amounts of our common stock or preferred stock, whether directly by us or in the secondary market, the perception that such sales could occur or the availability of future issuances of shares of our common stock, preferred stock, OP units or other securities convertible into or exchangeable or exercisable for our common stock or preferred stock, could materially and adversely affect the market price of our common stock or preferred stock and our ability to raise capital through future offerings of equity or equity-related securities. In addition, we may issue capital stock that is senior to our common stock in the future for a number of reasons, including to finance our operations and business strategy, to adjust our ratio of debt to equity or for other reasons.
Based on the applicable conversion ratios then in effect, as of February 20, 2024, in the future we may issue to the limited partners of the Operating Partnership, up to approximately 5.3 million shares of our common stock in exchange for their OP units. The limited partners may sell such shares pursuant to registration rights, if available, or an available exemption from registration. As of February 20, 2024, there were no outstanding options to purchase shares of our common stock under our equity incentive plans, and we had the authority to issue restricted stock awards or options to purchase up to an additional 3.0 million shares of our common stock pursuant to our equity incentive plans. In addition, we have entered into an At the Market Offering Sales Agreement to sell shares of common stock. As of December 31, 2023, we have remaining capacity to sell up to an additional $1.1 billion of common stock under this agreement. No prediction can be made regarding the effect that future sales of shares of our common stock or our other securities will have on the market price of shares.
Our business operations may not generate the cash needed to make distributions on our capital stock or to service our debt, and we may adjust our common stock distribution policy.
Our ability to make distributions on our common stock and preferred stock, and payments on our debt and to fund planned capital expenditures will depend on our ability to generate cash in the future. We cannot assure you that our business will generate sufficient cash flows from operations or that future borrowings will be available to us in an amount sufficient to enable us to make distributions on our common stock or preferred stock, to pay our debt or to fund our other liquidity needs.
The decision to declare and pay distributions on shares of our common stock in the future, as well as the timing, amount and composition of any such future distributions, will be at the sole discretion of our Board of Directors in light of conditions then existing, including our earnings, financial condition, capital requirements, debt maturities, the availability of debt and equity capital, applicable REIT and legal restrictions, general overall economic conditions and other factors. Any change in our distribution policy could have a material adverse effect on the market price of our common stock.
We rely on key management.
We depend on the efforts of our executive officers, including Gary A. Shiffman, Bruce D. Thelen, Fernando Castro-Caratini, Marc Farrugia, Aaron Weiss and Baxter R. Underwood. The loss of services of one or more of these executive officers could have a temporary adverse effect on our operations. We do not currently maintain or contemplate obtaining any "key-man" life insurance on our executive officers.
24
SUN COMMUNITIES, INC.
Cybersecurity breaches and other disruptions could compromise our information and expose us to liability, which would cause our business and reputation to suffer.
We rely intensively on information technology to account for tenant transactions, manage the privacy of tenant data, communicate internally and externally, and analyze our financial and operating results. In the ordinary course of our business, we collect and store sensitive data, including our proprietary business information and that of our tenants, clients, vendors and employees in our facilities and on our network. In addition, we engage third party service providers that may have access to such information in connection with providing necessary information technology and security and other business services to us. This information may include personally identifiable information such as social security numbers, banking information and credit card information.
We address potential breaches or disclosure of this confidential information by implementing a variety of security measures intended to protect the confidentiality and security of this information, including (among others) engaging reputable, recognized firms to help us design and maintain our information technology and data security systems, including testing and verification of their proper and secure operations on a periodic basis. We also maintain cyber risk insurance to provide some coverage for certain risks arising out of data and network breaches. Our senior leadership regularly updates the Board of Directors on security matters and meets at least annually to review program progress and plans, incidents if any, and emerging risks.
Despite our security measures, our information technology and infrastructure, as well as that of our third-party vendors, may be vulnerable to attacks by hackers (including through malware, ransomware, computer viruses and email phishing schemes) or breached due to employee error, malfeasance, fire, flood or other physical event, or other disruptions. Any such breach or disruption could compromise our or a third-party vendor's network and the information stored there could be accessed, publicly disclosed, lost or stolen. Any such access, disclosure or other loss of information could:
•result in legal claims or proceedings,
•disrupt our operations, including our ability to service our tenants and our ability to analyze and report our financial and operating results,
•decrease our revenues,
•damage our reputation,
•cause a loss of confidence,
•increase our insurance premiums, or
•have other material adverse effects on our business.
We depend on continuous access to the internet to use our cloud-based applications. Damage to, or failure of our information technology systems, including as a result of any of the reasons described above, could adversely affect our results of operations as we may incur significant costs or data loss. We continually assess new and enhanced information technology solutions to manage the risk of system failure or interruption.
Losses in excess of our insurance coverage or uninsured losses could adversely affect our operating results and cash flows and upon renewal of our insurance policies, our coverage may change and our costs may increase.
We have a significant concentration of MH and RV properties and marinas on coastlines and in other areas where natural disasters or other catastrophic events such as hurricanes, flash floods, sea-level rise, droughts, tornadoes, wildfires or earthquakes could negatively impact our operating results and cash flows. We maintain comprehensive liability, fire, property, business interruption, general liability, and (where appropriate) flood and earthquake insurance, and other lines of insurance we have determined to be appropriate for our business through a combination of self-insurance partially covering the risk and insurance provided by reputable companies with commercially reasonable deductibles and limits. We believe the policy specifications and insured limits are appropriate and adequate given the relative risk of loss, the cost of the coverage and industry practice. However, certain types of losses including, but not limited to, riots or acts of war, may be either uninsurable or not economically insurable. In the event an uninsured loss occurs, we could lose both our investment in and anticipated profits and cash flows from the affected property. We would also continue to be obligated to repay any mortgage debt or other obligations related to the community. If an uninsured liability to a third party were to occur, we would incur the cost of defense and settlement with, or court ordered damages to, that third party. A significant uninsured property or liability loss could have a material adverse effect on our business and our financial condition and results of operations.
25
SUN COMMUNITIES, INC.
We renew our insurance policies annually. As a result of increased insurance claims across the industry and other market conditions, it has been more difficult to obtain insurance, but in particular property insurance covering named windstorms, business interruption, flood and earthquake insurance. There are fewer insurers willing to provide policies, and policies increasingly include lower coverage limits, higher deductibles and higher premiums. These conditions may cause us to change the types and amounts of insurance we carry and may provide us with reduced coverage and / or higher costs. This may require a change in our insurance purchasing philosophy and strategy which can result in the assumption of greater risks to offset insurance market fluctuations.
Expanding social media platforms present new challenges.
Social media outlets continue to grow and expand, which presents us with new risks. Adverse content about us and our properties on social media platforms could result in damage to our reputation or brand. Improper posts by employees or others could result in disclosure of confidential or proprietary information regarding our operations.
Our operations are subject to regulation under various federal, state, local and foreign laws and regulations that may expose us to significant costs and liabilities.
Our properties and the operations at them are subject to regulation under various federal, state, local and foreign laws and regulations. Compliance with laws and regulations that govern our operations may require expenditures and modifications of development plans and operations that could have a detrimental effect on the operations of our properties and our financial condition, results of operations and cash flows. There can be no assurance that the application of laws, regulations or policies, or changes in such laws, regulations and policies, will not occur in a manner that could have a detrimental effect on any property.
We may be adversely impacted by fluctuations in foreign currency exchange rates.
Our current and future investments in and operations of Canadian, Australian and UK properties are or will be exposed to the effects of changes in the Canadian dollar, Australian dollar and Pound sterling, respectively, against the U.S. dollar. Changes in foreign currency exchange rates cannot always be predicted; as a result, substantial unfavorable changes in exchange rates could have a material adverse effect on our financial condition and results of operations.
Deterioration in general economic conditions in the United States, and globally, including the effect of prolonged periods of inflation, could harm our business and results of operations.
Our business and results of operations could be adversely affected by changes in national or global economic conditions. These conditions include but are not limited to inflation, deflation, rising interest rates, availability of capital markets, energy availability and costs, the negative impacts caused by outbreaks of disease and public health crises, negative impacts resulting from military conflicts and the effects of governmental initiatives to manage economic conditions.
ITEM 1B. UNRESOLVED STAFF COMMENTS
None.
ITEM 1C. CYBERSECURITY
Risk Management
Our business operations rely on the consistent availability of our communication platforms, enterprise applications, and related systems. We have implemented protocols to ensure the secure collection, storage, and transmission of data and have invested in the development and enhancement of controls designed to prevent, detect, and respond to unauthorized access, computer viruses, malware, data exfiltration, and other threats.
We have established an Information Security Management Committee to manage information security in accordance with the ISO 27001:2013 standard to ensure the consistent application of security principles, policy statements, and controls. In adhering to this industry standard, we manage and mitigate material risks from threats to our systems and data by partnering with reputable, recognized security firms, and conducting ongoing internal and external information security audits, risk assessments, anti-phishing campaigns, penetration testing exercises, systems monitoring activities, employee training, and cyber incident response exercises. Our policies include standards and procedures for vulnerability management, business continuity planning, encryption of sensitive data, physical security, user access controls, vendor risk management, teleworking, mobile device management and system monitoring.
26
SUN COMMUNITIES, INC.
Comprehensive contingency and recovery plans are in place to ensure the ongoing provision of services to customers in the event of a cybersecurity incident. These are tested on a regular basis against scenarios of varying degrees by both internal and external resources.
To manage vendor risk, we conduct ongoing risk assessments based on the vendor's published Systems and Operational Controls ("SOC") reports, information provided in vendor security questionnaires, and any publicly available information including ongoing litigation or external disclosures.
As of the time of this filing, we are not aware of any cybersecurity incidents that have materially affected or are reasonably likely to materially affect our business strategy, results of operations, or financial conditions. Refer to "Risk Factors" in Part I, Item 1A in this Annual Report on Form 10-K under the heading "Cybersecurity breaches and other disruptions could compromise our information and expose us to liability, which would cause our business and reputation to suffer," for additional discussion about cybersecurity related risks.
Governance
Senior leadership provides the Board of Directors with ongoing security updates, which include notable changes to program plans, changes to the risk environment, information regarding material incidents that may have occurred, third-party audit reports on recent assessments of our security controls, and details regarding forward-looking plans and strategies to mitigate cyber risk. The Audit Committee of the Board of Directors provides oversight and is responsible for assessing risks to our business, in accordance with its charter. The Audit Committee engages in regular conversations with senior leadership about our security systems in order to monitor and mitigate risks from cybersecurity incidents, in accordance with our security principles and protocols.
The Senior Vice President of Information Technology and the Director of Information Security bear direct responsibility for daily management of cyber risk. Oversight from the executive team, led by the Chief Administrative Officer, ensures strategic alignment. With a wealth of executive leadership spanning over 20 years in both public and private sectors, these individuals collectively possess more than 75 years of invaluable experience in information technology and security.
The Information Security Management Committee (ISMC) and Enterprise Risk Management Committees (ERM) meet regularly to provide oversight of cyber risk management functions. Committee composition includes members from cross-functional departments, including technology, innovation, human resources, accounting and finance, internal audit, operations and executive management. Various members of these committees hold industry certifications representing expertise in information security risk and compliance management, including the Certified Information Technology Professional (CITP), Certified Information Systems Security Professional (CISSP), Certified Information Security Auditor (CISA), and Certified in Risk and Information Systems Control (CRISC) designations.
27
SUN COMMUNITIES, INC.
ITEM 2. PROPERTIES
As of December 31, 2023, our properties were located in the U.S., the UK and Canada, and consisted of 353 MH communities, 179 RV communities and 135 marinas.
As of December 31, 2023, our properties contained an aggregate of 227,340 developed sites comprised of 118,430 developed MH sites, 32,390 annual RV sites (inclusive of both annual and seasonal usage rights), 28,490 transient RV sites and 48,030 wet slips and dry storage spaces. There are 17,980 additional MH and RV sites suitable for development. Most of our properties include amenities oriented toward family and retirement living. Of our 667 properties, 318 properties have 300 or more developed sites, with the largest having 2,340 developed MH and RV sites. See "Real Estate and Accumulated Depreciation, Schedule III," included in our Consolidated Financial Statements, for detail on properties that are encumbered.
As of December 31, 2023, our MH and RV properties had an occupancy rate of 96.4% excluding transient RV sites. Since January 1, 2019, our MH and RV properties have a five-year average annual turnover of homes (where the home is moved out of the community) of approximately 3.0% and a five-year average annual turnover of residents (where the resident-owned home is sold and remains within the community, typically without interruption of rental income) of approximately 6.9%. The average renewal rate for residents in our Rental Program was 70.4% for the year ended December 31, 2023.
We believe that our properties' high amenity levels, customer service loyalty, and customer retention program contribute to low turnover and generally high occupancy rates. All of the properties provide residents with attractive amenities with most offering a clubhouse, a swimming pool and laundry facilities. Many of the properties offer additional amenities such as sauna / whirlpool spas, tennis courts, shuffleboard, basketball courts and / or exercise rooms. Many RV communities offer incremental amenities including golf, pro shops, restaurants, zip lines, waterparks, watersports and thematic experiences.
Our MH and RV communities are principally located in the midwestern, southern and southeastern regions of the U.S., in the south of England in the UK and in Canada. Our marinas are principally located in the northeastern, southern, mid-Atlantic, western and midwestern regions of the U.S., with the majority of such marinas concentrated in coastal regions, and others located in various inland regions. We believe that geographic diversification helps to insulate the portfolio from regional economic influences. We have concentrated our properties within certain areas of the regions in order to achieve economies of scale in management and operations.
The following tables set forth certain information relating to our MH and RV properties as of December 31, 2023. The occupancy percentage includes MH sites and annual RV sites and excludes transient RV sites.
| Property Name | MH / RV | City / County (UK Only) | State / Country | MH and Annual RV Sites as of 12/31/2023 | Transient RV Sites as of 12/31/2023 | Occupancy as of 12/31/2023 | Occupancy as of 12/31/2022 | ||||||||||||||||||||||
| NORTH AMERICA | |||||||||||||||||||||||||||||
| UNITED STATES | |||||||||||||||||||||||||||||
| MIDWEST | |||||||||||||||||||||||||||||
| Michigan | |||||||||||||||||||||||||||||
| Academy / West Point | MH | Canton | MI | 440 | — | 99.5 | % | 98.0 | % | ||||||||||||||||||||
| Allendale Meadows | MH | Allendale | MI | 350 | — | 99.7 | % | 97.4 | % | ||||||||||||||||||||
| Alpine Meadows | MH | Grand Rapids | MI | 400 | — | 99.3 | % | 98.5 | % | ||||||||||||||||||||
| Andover | MH | Grass Lake | MI | 130 | — | 97.6 | % | 100.0 | % | ||||||||||||||||||||
| Apple Carr Village | MH | Muskegon | MI | 710 | — | 97.3 | % | 97.5 | % | ||||||||||||||||||||
| Arbor Woods | MH | Ypsilanti | MI | 460 | — | 98.9 | % | 98.0 | % | ||||||||||||||||||||
| Brentwood Village | MH | Kentwood | MI | 200 | — | 96.4 | % | 98.5 | % | ||||||||||||||||||||
| Broadview Estates | MH | Davison | MI | 470 | — | 98.7 | % | 97.9 | % | ||||||||||||||||||||
| Brookside Village | MH | Kentwood | MI | 200 | — | 99.5 | % | 99.5 | % | ||||||||||||||||||||
| Byron Center | MH | Byron Center | MI | 140 | — | 97.9 | % | 97.2 | % | ||||||||||||||||||||
| Camelot Villa | MH | Macomb | MI | 710 | — | 98.5 | % | 98.2 | % | ||||||||||||||||||||
| Charlevoix Estates | MH | Charlevoix | MI | 180 | — | 99.5 | % | 98.9 | % | ||||||||||||||||||||
| Cider Mill Crossings | MH | Fenton | MI | 620 | — | 98.6 | % | 97.6 | % | ||||||||||||||||||||
| Cider Mill Village | MH | Middleville | MI | 260 | — | 98.1 | % | 98.4 | % | ||||||||||||||||||||
| Country Acres | MH | Cadillac | MI | 180 | — | 94.5 | % | 95.1 | % | ||||||||||||||||||||
| Country Hills Village | MH | Hudsonville | MI | 240 | — | 100.0 | % | 100.0 | % | ||||||||||||||||||||
28
SUN COMMUNITIES, INC.
| Property Name | MH / RV | City / County (UK Only) | State / Country | MH and Annual RV Sites as of 12/31/2023 | Transient RV Sites as of 12/31/2023 | Occupancy as of 12/31/2023 | Occupancy as of 12/31/2022 | ||||||||||||||||||||||
| Country Meadows | MH | Flat Rock | MI | 580 | — | 97.4 | % | 98.4 | % | ||||||||||||||||||||
| Country Meadows Village | MH | Caledonia | MI | 400 | — | 100.0 | % | 100.0 | % | ||||||||||||||||||||
| Creek Wood | MH | Burton | MI | 340 | — | 98.8 | % | 98.5 | % | ||||||||||||||||||||
| Cutler Estates | MH | Grand Rapids | MI | 260 | — | 98.8 | % | 99.2 | % | ||||||||||||||||||||
| Dutton Mill Village | MH | Caledonia | MI | 310 | — | 99.3 | % | 98.0 | % | ||||||||||||||||||||
| East Village Estates | MH | Washington Twp. | MI | 710 | — | 99.3 | % | 98.6 | % | ||||||||||||||||||||
| Egelcraft | MH | Muskegon | MI | 460 | — | 99.6 | % | 98.9 | % | ||||||||||||||||||||
| Fisherman's Cove | MH | Flint Twp. | MI | 160 | — | 98.8 | % | 96.3 | % | ||||||||||||||||||||
| Fox Run | MH | Boyne City | MI | 140 | — | 16.4 | % | (1) | N/A | (2) | |||||||||||||||||||
| Frenchtown Villa / Elizabeth Woods | MH | Newport | MI | 1,140 | — | 97.5 | % | 98.9 | % | ||||||||||||||||||||
| Grand Village | MH | Grand Rapids | MI | 220 | — | 95.9 | % | 97.7 | % | ||||||||||||||||||||
| Hamlin | MH | Webberville | MI | 230 | — | 100.0 | % | 97.0 | % | ||||||||||||||||||||
| Hickory Hills Village | MH | Battle Creek | MI | 280 | — | 99.6 | % | 98.2 | % | ||||||||||||||||||||
| Highland Greens Estates | MH | Highland | MI | 880 | — | 76.0 | % | 67.5 | % | ||||||||||||||||||||
| Holiday West Village | MH | Holland | MI | 340 | — | 99.7 | % | 100.0 | % | ||||||||||||||||||||
| Holly Village / Hawaiian Gardens | MH | Holly | MI | 420 | — | 97.9 | % | 97.9 | % | ||||||||||||||||||||
| Hunters Crossing | MH | Capac | MI | 110 | — | 100.0 | % | 98.2 | % | ||||||||||||||||||||
| Hunters Glen | MH | Wayland | MI | 400 | — | 99.5 | % | 99.7 | % | ||||||||||||||||||||
| Huntington Run | MH | Kalamazoo | MI | 210 | — | 84.5 | % | (1) | 100.0 | % | |||||||||||||||||||
Jellystone Park™ Petoskey(3) | RV | Petoskey | MI | 50 | 240 | 100.0 | % | 100.0 | % | ||||||||||||||||||||
| Kensington Meadows | MH | Lansing | MI | 290 | — | 98.3 | % | 95.5 | % | ||||||||||||||||||||
| Kimberly Estates | MH | Newport | MI | 390 | — | 97.9 | % | 98.4 | % | ||||||||||||||||||||
| King's Court | MH | Traverse City | MI | 800 | — | 99.5 | % | 99.0 | % | ||||||||||||||||||||
| Knollwood Estates | MH | Allendale | MI | 160 | — | 98.1 | % | 96.9 | % | ||||||||||||||||||||
| Lafayette Place | MH | Warren | MI | 250 | — | 96.5 | % | 95.3 | % | ||||||||||||||||||||
| Lakeview | MH | Ypsilanti | MI | 390 | — | 99.0 | % | 97.4 | % | ||||||||||||||||||||
| Leisure Village | MH | Belmont | MI | 260 | — | 100.0 | % | 99.2 | % | ||||||||||||||||||||
| Lincoln Estates | MH | Holland | MI | 190 | — | 99.5 | % | 99.5 | % | ||||||||||||||||||||
| Meadow Lake Estates | MH | White Lake | MI | 420 | — | 99.5 | % | 97.9 | % | ||||||||||||||||||||
| Meadowbrook Estates | MH | Monroe | MI | 450 | — | 96.5 | % | 95.8 | % | ||||||||||||||||||||
| Meadowlands of Gibraltar | MH | Gibraltar | MI | 320 | — | 99.4 | % | 99.4 | % | ||||||||||||||||||||
| Meadowstone | MH | Hastings | MI | 230 | — | 95.7 | % | 97.0 | % | ||||||||||||||||||||
| Northville Crossing | MH | Northville | MI | 760 | — | 99.7 | % | 99.5 | % | ||||||||||||||||||||
| Oak Island Village | MH | East Lansing | MI | 250 | — | 98.4 | % | 97.2 | % | ||||||||||||||||||||
| Pinebrook Village | MH | Kentwood | MI | 190 | — | 99.5 | % | 96.2 | % | ||||||||||||||||||||
| Pineview Estates | MH | Flint | MI | 1,010 | — | 95.7 | % | 86.9 | % | ||||||||||||||||||||
| Presidential Estates | MH | Hudsonville | MI | 360 | — | 99.2 | % | 99.7 | % | ||||||||||||||||||||
| Richmond Place | MH | Richmond | MI | 120 | — | 99.1 | % | 94.9 | % | ||||||||||||||||||||
| River Haven Village | MH | Grand Haven | MI | 720 | — | 98.6 | % | 99.0 | % | ||||||||||||||||||||
| River Ridge | MH | Saline | MI | 290 | — | 99.7 | % | 99.7 | % | ||||||||||||||||||||
| Rudgate Clinton | MH | Clinton Township | MI | 670 | — | 98.8 | % | 99.1 | % | ||||||||||||||||||||
| Rudgate Manor | MH | Sterling Heights | MI | 930 | — | 98.4 | % | 98.0 | % | ||||||||||||||||||||
| Scio Farms | MH | Ann Arbor | MI | 910 | — | 99.6 | % | 99.3 | % | ||||||||||||||||||||
| Sheffield Estates | MH | Auburn Hills | MI | 230 | — | 96.9 | % | 98.2 | % | ||||||||||||||||||||
| Shelby Forest | MH | Shelby Twp. | MI | 660 | — | 98.6 | % | 98.5 | % | ||||||||||||||||||||
| Shelby West | MH | Shelby Twp. | MI | 640 | — | 99.8 | % | 98.8 | % | ||||||||||||||||||||
| Silver Springs | MH | Clinton Township | MI | 550 | — | 98.5 | % | 98.9 | % | ||||||||||||||||||||
| Southwood Village | MH | Grand Rapids | MI | 390 | — | 98.2 | % | 99.0 | % | ||||||||||||||||||||
| St. Clair Place | MH | St. Clair | MI | 100 | — | 98.0 | % | 98.0 | % | ||||||||||||||||||||
| Stonebridge | MH | Richfield Twp. | MI | — | — | N/A | (1) | N/A | (1) | ||||||||||||||||||||
Sun Outdoors Kensington Valley(3) | RV | New Hudson | MI | 320 | 170 | 100.0 | % | 100.0 | % | ||||||||||||||||||||
29
SUN COMMUNITIES, INC.
| Property Name | MH / RV | City / County (UK Only) | State / Country | MH and Annual RV Sites as of 12/31/2023 | Transient RV Sites as of 12/31/2023 | Occupancy as of 12/31/2023 | Occupancy as of 12/31/2022 | ||||||||||||||||||||||
Sun Outdoors Petoskey Bay Harbor(3) | RV | Petoskey | MI | 10 | 150 | 100.0 | % | 100.0 | % | ||||||||||||||||||||
Sun Retreats Gun Lake(3) | RV | Hopkins | MI | 310 | 20 | 100.0 | % | 100.0 | % | ||||||||||||||||||||
Sun Retreats Silver Lake(3) | RV | Mears | MI | 230 | 30 | 100.0 | % | 100.0 | % | ||||||||||||||||||||
| Sunset Ridge | MH | Portland | MI | 500 | — | 88.2 | % | (1) | 98.7 | % | |||||||||||||||||||
| Sycamore Village | MH | Mason | MI | 400 | — | 99.2 | % | 98.5 | % | ||||||||||||||||||||
| Sylvan Crossing | MH | Chelsea | MI | 280 | — | 54.4 | % | (1) | 49.1 | % | (1) | ||||||||||||||||||
| Sylvan Glen Estates | MH | Brighton | MI | 480 | — | 98.9 | % | 98.5 | % | ||||||||||||||||||||
| Tamarac Village | MH | Ludington | MI | 300 | — | 99.3 | % | 98.3 | % | ||||||||||||||||||||
| Tamarac Village RV Resort | RV | Ludington | MI | 110 | — | 100.0 | % | 100.0 | % | ||||||||||||||||||||
| Tanglewood Village | MH | Brownstown | MI | 250 | — | 100.0 | % | 100.0 | % | ||||||||||||||||||||
| Timberline Estates | MH | Coopersville | MI | 300 | — | 99.0 | % | 97.3 | % | ||||||||||||||||||||
| Town & Country | MH | Traverse City | MI | 190 | — | 99.5 | % | 99.0 | % | ||||||||||||||||||||
| Troy Villa | MH | Troy | MI | 280 | — | 90.8 | % | 85.1 | % | ||||||||||||||||||||
| Warren Dunes Village | MH | Bridgman | MI | 310 | — | 100.0 | % | 99.7 | % | ||||||||||||||||||||
| Waverly Shores Village | MH | Holland | MI | 410 | — | 99.8 | % | 100.0 | % | ||||||||||||||||||||
| West Village Estates | MH | Romulus | MI | 630 | — | 98.9 | % | 99.5 | % | ||||||||||||||||||||
| White Lake | MH | White Lake | MI | 320 | — | 98.7 | % | 95.9 | % | ||||||||||||||||||||
| Windham Hills | MH | Jackson | MI | 470 | — | 98.1 | % | 96.8 | % | ||||||||||||||||||||
| Windsor Woods Village | MH | Wayland | MI | 310 | — | 99.4 | % | 98.7 | % | ||||||||||||||||||||
| Woodhaven Place | MH | Woodhaven | MI | 220 | — | 99.5 | % | 94.5 | % | ||||||||||||||||||||
| Michigan Total | 32,890 | 610 | 97.1 | % | 96.7 | % | |||||||||||||||||||||||
| Indiana | |||||||||||||||||||||||||||||
| Brookside Manor | MH | Goshen | IN | 570 | — | 99.1 | % | 97.5 | % | ||||||||||||||||||||
| Carrington Pointe | MH | Fort Wayne | IN | 470 | — | 99.4 | % | 97.9 | % | ||||||||||||||||||||
| Clear Water | MH | South Bend | IN | 230 | — | 98.7 | % | 98.7 | % | ||||||||||||||||||||
| Cobus Green | MH | Osceola | IN | 380 | — | 99.7 | % | 99.7 | % | ||||||||||||||||||||
| Four Seasons | MH | Elkhart | IN | 220 | — | 97.2 | % | 95.9 | % | ||||||||||||||||||||
Jellystone Park™ at Barton Lake(3) | RV | Fremont | IN | 60 | 500 | 100.0 | % | 100.0 | % | ||||||||||||||||||||
| Liberty Farm | MH | Valparaiso | IN | 220 | — | 92.3 | % | 95.5 | % | ||||||||||||||||||||
| Pebble Creek | MH | Greenwood | IN | 300 | — | 99.3 | % | 99.0 | % | ||||||||||||||||||||
| Pine Hills | MH | Middlebury | IN | 130 | — | 97.7 | % | 99.2 | % | ||||||||||||||||||||
| Roxbury Park | MH | Goshen | IN | 400 | — | 95.7 | % | 93.2 | % | ||||||||||||||||||||
Sun Outdoors Lake Rudolph(3) | RV | Santa Claus | IN | — | 530 | N/A | N/A | ||||||||||||||||||||||
| The Willows | MH | Goshen | IN | 170 | — | 93.7 | % | (1) | 82.8 | % | (1) | ||||||||||||||||||
| Indiana Total | 3,150 | 1,030 | 97.8 | % | 96.6 | % | |||||||||||||||||||||||
| SOUTH | |||||||||||||||||||||||||||||
| Texas | |||||||||||||||||||||||||||||
Austin Lone Star(3) | RV | Austin | TX | 80 | 70 | 100.0 | % | 100.0 | % | ||||||||||||||||||||
| Bluebonnet Lake | MH | Austin | TX | — | — | N/A | (1) | N/A | (1) | ||||||||||||||||||||
| Boulder Ridge | MH | Pflugerville | TX | 1,220 | — | 99.3 | % | 98.6 | % | ||||||||||||||||||||
| Branch Creek Estates | MH | Austin | TX | 400 | — | 99.8 | % | 99.5 | % | ||||||||||||||||||||
| Chisholm Point | MH | Pflugerville | TX | 430 | — | 99.5 | % | 99.3 | % | ||||||||||||||||||||
| Comal Farms | MH | New Braunfels | TX | 370 | — | 98.9 | % | 98.9 | % | ||||||||||||||||||||
Coyote Ranch Resort(3) | RV | Wichita Falls | TX | — | 160 | N/A | N/A | ||||||||||||||||||||||
| Creeks Crossing | MH | Kyle | TX | 200 | — | 94.9 | % | (1) | 56.6 | % | (1) | ||||||||||||||||||
Jellystone Park™ at Guadalupe River(3) | RV | Kerrville | TX | — | 260 | N/A | N/A | ||||||||||||||||||||||
Jellystone Park™ at Hill Country(3) | RV | Canyon Lake | TX | — | 170 | N/A | N/A | ||||||||||||||||||||||
Jetstream NASA(3) | RV | Houston | TX | 110 | 90 | 100.0 | % | 100.0 | % | ||||||||||||||||||||
| Lantana Ranch South | MH | Brookshire | TX | — | — | N/A | (1) | N/A | (1) | ||||||||||||||||||||
30
SUN COMMUNITIES, INC.
| Property Name | MH / RV | City / County (UK Only) | State / Country | MH and Annual RV Sites as of 12/31/2023 | Transient RV Sites as of 12/31/2023 | Occupancy as of 12/31/2023 | Occupancy as of 12/31/2022 | ||||||||||||||||||||||
Lone Star Jellystone Park(3) | RV | Waller | TX | — | 350 | N/A | N/A | ||||||||||||||||||||||
| Oak Crest | MH | Austin | TX | 650 | — | 97.9 | % | 98.2 | % | ||||||||||||||||||||
Pearwood(3) | RV | Pearland | TX | 130 | 10 | 100.0 | % | 100.0 | % | ||||||||||||||||||||
| Pecan Branch | MH | Georgetown | TX | 230 | — | 98.7 | % | 99.1 | % | ||||||||||||||||||||
| Pine Acre Trails | MH | Conroe | TX | 250 | — | 44.2 | % | (1) | 6.0 | % | (1) | ||||||||||||||||||
| Pine Trace | MH | Houston | TX | 680 | — | 98.2 | % | 97.6 | % | ||||||||||||||||||||
| River Ranch | MH | Austin | TX | 850 | — | 99.4 | % | 98.9 | % | ||||||||||||||||||||
| River Ridge Estates | MH | Austin | TX | 510 | — | 99.0 | % | 98.4 | % | ||||||||||||||||||||
| Saddlebrook | MH | San Marcos | TX | 560 | — | 99.3 | % | 99.1 | % | ||||||||||||||||||||
| Sandy Lake | MH | Carrollton | TX | 50 | — | 100.0 | % | 100.0 | % | ||||||||||||||||||||
Sandy Lake RV Resort(3) | RV | Carrollton | TX | 210 | 10 | 100.0 | % | 100.0 | % | ||||||||||||||||||||
| Stonebridge | MH | San Antonio | TX | 330 | — | 99.1 | % | 100.0 | % | ||||||||||||||||||||
| Summit Ridge | MH | Converse | TX | 440 | — | 97.8 | % | 99.3 | % | ||||||||||||||||||||
Sun Outdoors Lake Travis(3) | RV | Austin | TX | 110 | 140 | 100.0 | % | 100.0 | % | ||||||||||||||||||||
Sun Retreats San Antonio West(3) | RV | San Antonio | TX | 110 | 160 | 100.0 | % | 100.0 | % | ||||||||||||||||||||
Sun Retreats Texas Hill Country(3) | RV | New Braunfels | TX | 130 | 240 | 100.0 | % | 100.0 | % | ||||||||||||||||||||
| Sunset Ridge | MH | Kyle | TX | 450 | — | 72.5 | % | (1) | 76.8 | % | (1) | ||||||||||||||||||
| Traveler's World | MH | San Antonio | TX | 10 | — | 100.0 | % | 100.0 | % | ||||||||||||||||||||
Traveler's World RV Resort(3) | RV | San Antonio | TX | 30 | 130 | 100.0 | % | 100.0 | % | ||||||||||||||||||||
Treetops(3) | RV | Arlington | TX | 130 | 40 | 100.0 | % | 100.0 | % | ||||||||||||||||||||
| Woodlake Trails | MH | San Antonio | TX | 320 | — | 99.1 | % | 94.3 | % | (1) | |||||||||||||||||||
| Texas Total | 8,990 | 1,830 | 96.1 | % | 94.3 | % | |||||||||||||||||||||||
| SOUTHEAST | |||||||||||||||||||||||||||||
| Florida | |||||||||||||||||||||||||||||
Arbor Terrace(3) | RV | Bradenton | FL | 330 | 40 | 100.0 | % | 100.0 | % | ||||||||||||||||||||
| Ariana Village | MH | Lakeland | FL | 210 | — | 99.5 | % | 99.0 | % | ||||||||||||||||||||
| Bahia Vista Estates | MH | Sarasota | FL | 250 | — | 99.2 | % | 100.0 | % | ||||||||||||||||||||
Baker Acres(3) | RV | Zephyrhills | FL | 310 | 50 | 100.0 | % | 100.0 | % | ||||||||||||||||||||
Big Tree(3) | RV | Arcadia | FL | 400 | 10 | 100.0 | % | 100.0 | % | ||||||||||||||||||||
| Blue Heron Pines | MH | Punta Gorda | FL | 410 | — | 99.3 | % | 99.8 | % | ||||||||||||||||||||
| Blue Jay | MH | Dade City | FL | 210 | — | 98.1 | % | 99.5 | % | ||||||||||||||||||||
| Blue Jay RV Resort | RV | Dade City | FL | 50 | — | 100.0 | % | 100.0 | % | ||||||||||||||||||||
Blueberry Hill(3) | RV | Bushnell | FL | 380 | 20 | 100.0 | % | 100.0 | % | ||||||||||||||||||||
| Brentwood Estates | MH | Hudson | FL | 190 | — | 99.5 | % | 99.5 | % | ||||||||||||||||||||
| Buttonwood Bay | MH | Sebring | FL | 410 | — | 99.3 | % | 99.5 | % | ||||||||||||||||||||
Buttonwood Bay RV Resort(3) | RV | Sebring | FL | 410 | 120 | 100.0 | % | 100.0 | % | ||||||||||||||||||||
| Candlelight Manor | MH | South Daytona | FL | 130 | — | 98.4 | % | 99.2 | % | ||||||||||||||||||||
| Carriage Cove | MH | Sanford | FL | 470 | — | 99.6 | % | 99.4 | % | ||||||||||||||||||||
| Central Park | MH | Haines City | FL | 130 | — | 83.6 | % | (1) | 89.5 | % | |||||||||||||||||||
Central Park RV Resort(3) | RV | Haines City | FL | 260 | 90 | 100.0 | % | 100.0 | % | ||||||||||||||||||||
Citrus Hill(3) | RV | Dade City | FL | 180 | 10 | 100.0 | % | 100.0 | % | ||||||||||||||||||||
| Club Wildwood | MH | Hudson | FL | 480 | — | 99.6 | % | 99.8 | % | ||||||||||||||||||||
| Colony in the Wood | MH | Port Orange | FL | 380 | — | 94.5 | % | 97.1 | % | ||||||||||||||||||||
| Cypress Greens | MH | Lake Alfred | FL | 260 | — | 99.2 | % | 98.5 | % | ||||||||||||||||||||
| Deerwood | MH | Orlando | FL | 570 | — | 99.8 | % | 99.3 | % | ||||||||||||||||||||
Ellenton Gardens(3) | RV | Ellenton | FL | 160 | 20 | 100.0 | % | 100.0 | % | ||||||||||||||||||||
| Fairfield Village | MH | Ocala | FL | 290 | — | 100.0 | % | 100.0 | % | ||||||||||||||||||||
Flamingo Lake(3) | RV | Jacksonville | FL | 180 | 240 | 100.0 | % | 100.0% | |||||||||||||||||||||
| Forest View | MH | Homosassa | FL | 300 | — | 98.7 | % | 98.7 | % | ||||||||||||||||||||
| Glen Haven | MH | Zephyrhills | FL | 50 | — | 100.0 | % | 100.0 | % | ||||||||||||||||||||
31
SUN COMMUNITIES, INC.
| Property Name | MH / RV | City / County (UK Only) | State / Country | MH and Annual RV Sites as of 12/31/2023 | Transient RV Sites as of 12/31/2023 | Occupancy as of 12/31/2023 | Occupancy as of 12/31/2022 | ||||||||||||||||||||||
Glen Haven RV Resort(3) | RV | Zephyrhills | FL | 200 | 20 | 100.0 | % | 100.0 | % | ||||||||||||||||||||
| Goldcoaster | MH | Homestead | FL | 540 | — | 98.9 | % | 99.4 | % | ||||||||||||||||||||
| Goldcoaster RV Resort | RV | Homestead | FL | 10 | — | 100.0 | % | 100.0 | % | ||||||||||||||||||||
| Grand Bay | MH | Dunedin | FL | 130 | — | 100.0 | % | 100.0 | % | ||||||||||||||||||||
Grove Ridge(3) | RV | Dade City | FL | 200 | 40 | 100.0 | % | 100.0 | % | ||||||||||||||||||||
| Gulfstream Harbor | MH | Orlando | FL | 970 | — | 99.8 | % | 99.8 | % | ||||||||||||||||||||
| Hacienda Del Rio | MH | Edgewater | FL | 800 | — | 90.9 | % | (1) | 91.0 | % | (1) | ||||||||||||||||||
Hidden River(3) | RV | Riverview | FL | 250 | 50 | 100.0 | % | 100.0 | % | ||||||||||||||||||||
| Holly Forest | MH | Holly Hill | FL | 400 | — | 99.8 | % | 100.0 | % | ||||||||||||||||||||
Horseshoe Cove RV Resort(3) | RV | Bradenton | FL | 410 | 60 | 100.0 | % | 100.0 | % | ||||||||||||||||||||
| Indian Creek | MH | Ft. Myers Beach | FL | — | — | — | % | (4) | — | % | (4) | ||||||||||||||||||
| Indian Creek RV Resort | RV | Ft. Myers Beach | FL | — | — | — | % | (4) | — | % | (4) | ||||||||||||||||||
| Island Lakes | MH | Merritt Island | FL | 300 | — | 100.0 | % | 100.0 | % | ||||||||||||||||||||
| King's Lake | MH | DeBary | FL | 240 | — | 100.0 | % | 100.0 | % | ||||||||||||||||||||
| Kings Manor | MH | Lakeland | FL | 240 | — | 98.7 | % | 96.2 | % | ||||||||||||||||||||
| Kings Pointe | MH | Lake Alfred | FL | 230 | — | 100.0 | % | 100.0 | % | ||||||||||||||||||||
| Kissimmee Gardens | MH | Kissimmee | FL | 240 | — | 99.6 | % | 99.2 | % | ||||||||||||||||||||
| Kissimmee South | MH | Davenport | FL | 140 | — | 96.5 | % | 96.5 | % | ||||||||||||||||||||
Kissimmee South RV Resort(3) | RV | Davenport | FL | 160 | 40 | 100.0 | % | 100.0 | % | ||||||||||||||||||||
| La Costa Village | MH | Port Orange | FL | 660 | — | 100.0 | % | 100.0 | % | ||||||||||||||||||||
| Lake Juliana Landings | MH | Auburndale | FL | 270 | — | 99.3 | % | 98.5 | % | ||||||||||||||||||||
| Lake Pointe Village | MH | Mulberry | FL | 360 | — | 99.4 | % | 99.2 | % | ||||||||||||||||||||
Lake San Marino RV Park(3) | RV | Naples | FL | 330 | 80 | 100.0 | % | 100.0 | % | ||||||||||||||||||||
Lakeland(3) | RV | Lakeland | FL | 220 | 10 | 100.0 | % | 100.0 | % | ||||||||||||||||||||
| Lakeshore Landings | MH | Orlando | FL | 310 | — | 99.7 | % | 98.7 | % | ||||||||||||||||||||
| Lakeshore Villas | MH | Tampa | FL | 280 | — | 99.6 | % | 98.9 | % | ||||||||||||||||||||
| Lamplighter | MH | Port Orange | FL | 260 | — | 99.2 | % | 99.6 | % | ||||||||||||||||||||
Majestic Oaks(3) | RV | Zephyrhills | FL | 230 | 30 | 100.0 | % | 100.0 | % | ||||||||||||||||||||
Marco Naples(3) | RV | Naples | FL | 210 | 90 | 100.0 | % | 100.0 | % | ||||||||||||||||||||
| Meadowbrook Village | MH | Tampa | FL | 260 | — | 100.0 | % | 100.0 | % | ||||||||||||||||||||
| Mill Creek | MH | Kissimmee | FL | 30 | — | 100.0 | % | 91.2 | % | ||||||||||||||||||||
Mill Creek RV Resort(3) | RV | Kissimmee | FL | 140 | 10 | 100.0 | % | 100.0 | % | ||||||||||||||||||||
North Lake(3) | RV | Moore Haven | FL | 230 | 40 | 100.0 | % | 100.0 | % | ||||||||||||||||||||
| Oakview Estates | MH | Arcadia | FL | 120 | — | 92.4 | % | 95.8 | % | ||||||||||||||||||||
| Ocean Breeze Resort - Jensen Beach | MH | Jensen Beach | FL | 330 | — | 87.5 | % | (1) | 79.7 | % | (1) | ||||||||||||||||||
Ocean Breeze Resort - Jensen Beach RV Resort(3) | RV | Jensen Beach | FL | 70 | 90 | 100.0 | % | 100.0 | % | ||||||||||||||||||||
| Ocean Breeze - Marathon | MH | Marathon | FL | 50 | — | 100.0 | % | 100.0 | % | (5) | |||||||||||||||||||
| Ocean Breeze - Marathon RV Resort | RV | Marathon | FL | — | — | N/A | (5) | — | % | (5) | |||||||||||||||||||
| Ocean View | MH | Jensen Beach | FL | 70 | — | 11.3 | % | (1) | N/A | (1) | |||||||||||||||||||
| Orange City | MH | Orange City | FL | — | — | 100.0 | % | 100.0 | % | ||||||||||||||||||||
Orange City RV Resort(3) | RV | Orange City | FL | 510 | 10 | 100.0 | % | 100.0 | % | ||||||||||||||||||||
| Orange Tree Village | MH | Orange City | FL | 250 | — | 100.0 | % | 100.0 | % | ||||||||||||||||||||
| Paddock Park South | MH | Ocala | FL | 190 | — | 84.6 | % | 80.9 | % | ||||||||||||||||||||
| Palm Key Village | MH | Davenport | FL | 200 | — | 100.0 | % | 100.0 | % | ||||||||||||||||||||
| Palm Village | MH | Bradenton | FL | 150 | — | 100.0 | % | 100.0 | % | ||||||||||||||||||||
| Park Place | MH | Sebastian | FL | 480 | — | 97.9 | % | 97.7 | % | ||||||||||||||||||||
| Park Royale | MH | Pinellas Park | FL | 310 | — | 99.0 | % | 100.0 | % | ||||||||||||||||||||
Pecan Park(3) | RV | Jacksonville | FL | 160 | 180 | 100.0 | % | 100.0 | % | ||||||||||||||||||||
| Pelican Bay | MH | Micco | FL | 220 | — | 97.7 | % | 99.1 | % | ||||||||||||||||||||
Pleasant Lake RV Resort(3) | RV | Bradenton | FL | 330 | 10 | 100.0 | % | 100.0 | % | ||||||||||||||||||||
32
SUN COMMUNITIES, INC.
| Property Name | MH / RV | City / County (UK Only) | State / Country | MH and Annual RV Sites as of 12/31/2023 | Transient RV Sites as of 12/31/2023 | Occupancy as of 12/31/2023 | Occupancy as of 12/31/2022 | ||||||||||||||||||||||
| Rainbow | MH | Frostproof | FL | 40 | — | 100.0 | % | 100.0 | % | ||||||||||||||||||||
| Rainbow RV Resort | RV | Frostproof | FL | 460 | — | 100.0 | % | 100.0 | % | ||||||||||||||||||||
Rainbow Village Largo(3) | RV | Largo | FL | 280 | 30 | 100.0 | % | 100.0 | % | ||||||||||||||||||||
Rainbow Village Zephyrhills(3) | RV | Zephyrhills | FL | 340 | 40 | 100.0 | % | 100.0 | % | ||||||||||||||||||||
| Red Oaks | MH | Bushnell | FL | 100 | — | 92.2 | % | 93.2 | % | ||||||||||||||||||||
Red Oaks RV Resort(3) | RV | Bushnell | FL | 600 | 310 | 100.0 | % | 100.0 | % | ||||||||||||||||||||
| Regency Heights | MH | Clearwater | FL | 390 | — | 100.0 | % | 99.2 | % | ||||||||||||||||||||
| Riverside Club | MH | Ruskin | FL | 730 | — | 96.7 | % | 94.2 | % | (1) | |||||||||||||||||||
| Royal Country | MH | Miami | FL | 860 | — | 99.9 | % | 99.9 | % | ||||||||||||||||||||
| Royal Palm Village | MH | Haines City | FL | 390 | — | 88.9 | % | 87.3 | % | ||||||||||||||||||||
| Saddle Oak Club | MH | Ocala | FL | 380 | — | 99.7 | % | 99.5 | % | ||||||||||||||||||||
| Saralake Estates | MH | Sarasota | FL | 200 | — | 100.0 | % | 99.5 | % | ||||||||||||||||||||
| Savanna Club | MH | Port St. Lucie | FL | 1,080 | — | 98.1 | % | 98.9 | % | ||||||||||||||||||||
| Serendipity | MH | North Fort Myers | FL | 340 | — | 90.5 | % | 92.9 | % | ||||||||||||||||||||
Settler's Rest(3) | RV | Zephyrhills | FL | 330 | 50 | 100.0 | % | 100.0 | % | ||||||||||||||||||||
| Shadow Wood Village | MH | Hudson | FL | 260 | — | 96.9 | % | 85.4 | % | (1) | |||||||||||||||||||
| Shady Road Villas | MH | Ocala | FL | 130 | — | 95.3 | % | 93.8 | % | ||||||||||||||||||||
| Shell Creek | MH | Punta Gorda | FL | 50 | — | 92.6 | % | 98.1 | % | ||||||||||||||||||||
Shell Creek RV Resort(3) | RV | Punta Gorda | FL | 150 | 30 | 100.0 | % | 100.0 | % | ||||||||||||||||||||
| Siesta Bay | RV | Ft. Myers | FL | — | — | — | % | (4) | — | % | (4) | ||||||||||||||||||
| Southern Charm | MH | Zephyrhills | FL | — | — | 100.0 | % | 100.0 | % | ||||||||||||||||||||
Southern Charm RV Resort(3) | RV | Zephyrhills | FL | 430 | 70 | 100.0 | % | 100.0 | % | ||||||||||||||||||||
Southern Leisure RV Resort(3) | RV | Chiefland | FL | 410 | 90 | 100.0 | % | 100.0 | % | ||||||||||||||||||||
| Southport Springs Golf & Country Club | MH | Zephyrhills | FL | 550 | — | 99.5 | % | 99.5 | % | ||||||||||||||||||||
| Spanish Main | MH | Thonotosassa | FL | 60 | — | 98.2 | % | 96.4 | % | ||||||||||||||||||||
Spanish Main RV Resort(3) | RV | Thonotosassa | FL | 250 | 30 | 100.0 | % | 100.0 | % | ||||||||||||||||||||
| Stonebrook | MH | Homosassa | FL | 210 | — | 94.0 | % | (1) | 93.5 | % | (1) | ||||||||||||||||||
| Sun Outdoors Islamorada | MH | Islamorada | FL | 60 | — | 42.9 | % | (5) | 5.0 | % | (5) | ||||||||||||||||||
Sun Outdoors Islamorada RV Resort(3) | RV | Islamorada | FL | — | 80 | 100.0 | % | — | % | (5) | |||||||||||||||||||
Sun Outdoors Key Largo(3) | RV | Key Largo | FL | 10 | 30 | 100.0 | % | 100.0 | % | ||||||||||||||||||||
Sun Outdoors Marathon(3) | RV | Marathon | FL | 10 | 80 | 100.0 | % | 100.0 | % | ||||||||||||||||||||
| Sun Outdoors Panama City Beach | MH | Panama City Beach | FL | 40 | — | 100.0 | % | 97.6 | % | ||||||||||||||||||||
Sun Outdoors Panama City Beach RV Resort(3) | RV | Panama City Beach | FL | — | 160 | N/A | N/A | ||||||||||||||||||||||
Sun Outdoors Sarasota(3) | RV | Sarasota | FL | 1,150 | 370 | 100.0 | % | 100.0 | % | ||||||||||||||||||||
Sun Outdoors St. Augustine(3) | RV | St. Augustine | FL | — | 170 | N/A | N/A | ||||||||||||||||||||||
Sun Outdoors Sugarloaf Key(3) | RV | Summerland Key | FL | — | 100 | N/A | N/A | ||||||||||||||||||||||
Sun Retreats Crystal River(3) | RV | Crystal River | FL | 310 | 90 | 100.0 | % | 100.0 | % | ||||||||||||||||||||
Sun Retreats Daytona Beach(3) | RV | Port Orange | FL | 180 | 50 | 100.0 | % | 100.0 | % | ||||||||||||||||||||
Sun Retreats Dunedin(3) | RV | Dunedin | FL | 200 | 40 | 100.0 | % | 100.0 | % | ||||||||||||||||||||
Sun Retreats Estero Bay(3) | RV | Fort Myers | FL | 280 | 20 | 100.0 | % | 100.0 | % | ||||||||||||||||||||
| Sun Retreats Fort Myers Beach | RV | Ft. Myers | FL | — | — | N/A | (4) | — | % | (4) | |||||||||||||||||||
Sun Retreats Homosassa River(3) | RV | Homosassa Springs | FL | 150 | 80 | 100.0 | % | 100.0 | % | ||||||||||||||||||||
Sun Retreats Lake Josephine(3) | RV | Sebring | FL | 170 | 10 | 100.0 | % | 100.0 | % | ||||||||||||||||||||
Sun Retreats Naples(3) | RV | Naples | FL | 150 | 20 | 100.0 | % | 100.0 | % | ||||||||||||||||||||
Sun Retreats Naples East(3) | RV | Naples | FL | 270 | 30 | 100.0 | % | 100.0 | % | ||||||||||||||||||||
Sun Retreats Ocala Orange Lake(3) | RV | Citra | FL | 340 | 70 | 100.0 | % | 100.0 | % | ||||||||||||||||||||
| Sun Retreats Orlando ChampionsGate | MH | Davenport | FL | 40 | — | 67.4 | % | (1) | 68.2 | % | (1) | ||||||||||||||||||
Sun Retreats Orlando ChampionsGate RV Resort(3) | RV | Davenport | FL | 100 | 170 | 100.0 | % | 100.0 | % | ||||||||||||||||||||
| Suncoast Gateway | MH | Port Richey | FL | 170 | — | 98.8 | % | 98.8 | % | ||||||||||||||||||||
| Sundance | MH | Zephyrhills | FL | 330 | — | 100.0 | % | 100.0 | % | ||||||||||||||||||||
33
SUN COMMUNITIES, INC.
| Property Name | MH / RV | City / County (UK Only) | State / Country | MH and Annual RV Sites as of 12/31/2023 | Transient RV Sites as of 12/31/2023 | Occupancy as of 12/31/2023 | Occupancy as of 12/31/2022 | ||||||||||||||||||||||
| Sunlake Estates | MH | Grand Island | FL | 410 | — | 97.3 | % | 96.8 | % | ||||||||||||||||||||
| Sunset Harbor at Cow Key Marina | MH | Key West | FL | 80 | — | 98.7 | % | 98.7 | % | ||||||||||||||||||||
Sweetwater(3) | RV | Zephyrhills | FL | 230 | 60 | 100.0 | % | 100.0 | % | ||||||||||||||||||||
| Tallowwood Isle | MH | Coconut Creek | FL | 270 | — | 97.1 | % | 97.1 | % | ||||||||||||||||||||
| Tampa East | MH | Dover | FL | 30 | — | 100.0 | % | 100.0 | % | ||||||||||||||||||||
Tampa East RV Resort(3) | RV | Dover | FL | 620 | 50 | 100.0 | % | 100.0 | % | ||||||||||||||||||||
| The Hamptons Golf & Country Club | MH | Auburndale | FL | 830 | — | 99.9 | % | 99.9 | % | ||||||||||||||||||||
| The Hideaway | MH | Key West | FL | 10 | — | 100.0 | % | 100.0 | % | ||||||||||||||||||||
| The Hills | MH | Apopka | FL | 100 | — | 99.0 | % | 99.0 | % | ||||||||||||||||||||
| The Landings at Lake Henry | MH | Haines City | FL | 390 | — | 99.5 | % | 99.2 | % | ||||||||||||||||||||
| The Ridge | MH | Davenport | FL | 480 | — | 99.4 | % | 99.8 | % | ||||||||||||||||||||
| The Valley | MH | Apopka | FL | 150 | — | 100.0 | % | 100.0 | % | ||||||||||||||||||||
ThemeWorld(3) | RV | Davenport | FL | 140 | 10 | 100.0 | % | 100.0 | % | ||||||||||||||||||||
Three Lakes(3) | RV | Hudson | FL | 280 | 30 | 100.0 | % | 100.0 | % | ||||||||||||||||||||
| Tranquility MHC | MH | Bushnell | FL | 20 | — | 48.0 | % | 30.8 | % | ||||||||||||||||||||
| Vista del Lago | MH | Bradenton | FL | 140 | — | 99.3 | % | 100.0 | % | ||||||||||||||||||||
| Vista del Lago RV Resort | RV | Bradenton | FL | 40 | — | 100.0 | % | 100.0 | % | ||||||||||||||||||||
| Vizcaya Lakes | MH | Port Charlotte | FL | 120 | — | 88.9 | % | 95.4 | % | ||||||||||||||||||||
| Walden Woods I | MH | Homosassa | FL | 210 | — | 100.0 | % | 100.0 | % | ||||||||||||||||||||
| Walden Woods II | MH | Homosassa | FL | 210 | — | 100.0 | % | 100.0 | % | ||||||||||||||||||||
| Water Oak Country Club Estates | MH | Lady Lake | FL | 1,610 | — | 80.0 | % | (1) | 79.3 | % | (1) | ||||||||||||||||||
Waters Edge(3) | RV | Zephyrhills | FL | 190 | 30 | 100.0 | % | 100.0 | % | ||||||||||||||||||||
| Westside Ridge | MH | Auburndale | FL | 220 | — | 100.0 | % | 99.1 | % | ||||||||||||||||||||
| Windmill Village | MH | Davenport | FL | 510 | — | 99.8 | % | 99.8 | % | ||||||||||||||||||||
| Woodlands at Church Lake | MH | Groveland | FL | 290 | — | 92.7 | % | 86.9 | % | ||||||||||||||||||||
| Florida Total | 40,650 | 3,760 | 97.7 | % | 97.4 | % | |||||||||||||||||||||||
| Virginia | |||||||||||||||||||||||||||||
Jellystone Park™ Chincoteague Island(6) | RV | Chincoteague | VA | 50 | 300 | 100.0 | % | N/A | |||||||||||||||||||||
Jellystone Park™ at Luray(3) | RV | East Luray | VA | — | 250 | N/A | N/A | ||||||||||||||||||||||
Jellystone Park™ at Natural Bridge(6) | RV | Natural Bridge Station | VA | 70 | 230 | 100.0 | % | 100.0 | % | ||||||||||||||||||||
| Pine Ridge | MH | Prince George | VA | 380 | — | 99.7 | % | 99.5 | % | ||||||||||||||||||||
Sun Outdoors Cape Charles(6) | RV | Cape Charles | VA | 60 | 600 | 100.0 | % | N/A | |||||||||||||||||||||
Sun Outdoors Chesapeake Bay(3) | RV | Temperanceville | VA | — | 250 | N/A | N/A | ||||||||||||||||||||||
| Sun Outdoors Chincoteague Bay | RV | Chincoteague | VA | — | — | N/A | (1) | N/A | (1) | ||||||||||||||||||||
Sun Retreats Gwynn's Island(3) | RV | Gwynn | VA | 120 | 10 | 100.0 | % | 100.0 | % | ||||||||||||||||||||
| Sun Retreats New Point | RV | New Point | VA | 320 | — | 100.0 | % | 100.0 | % | ||||||||||||||||||||
Sun Retreats Shenandoah Valley(3) | RV | Stuarts Draft | VA | 450 | 60 | 100.0 | % | 100.0 | % | ||||||||||||||||||||
Sunset Beach RV Resort(6) | RV | Cape Charles | VA | 50 | 250 | 100.0 | % | N/A | |||||||||||||||||||||
| Virginia Total | 1,500 | 1,950 | 99.9 | % | 99.8 | % | |||||||||||||||||||||||
| SOUTHWEST | |||||||||||||||||||||||||||||
| California | |||||||||||||||||||||||||||||
49'er Village(3) | RV | Plymouth | CA | 110 | 220 | 100.0 | % | 100.0 | % | ||||||||||||||||||||
| Alta Laguna | MH | Rancho Cucamonga | CA | 300 | — | 100.0 | % | 100.0 | % | ||||||||||||||||||||
| Bel Air Estates | MH | Menifee | CA | 200 | — | 89.9 | % | 88.9 | % | ||||||||||||||||||||
| Caliente Sands | MH | Cathedral City | CA | 120 | — | 99.2 | % | 98.3 | % | ||||||||||||||||||||
| Cisco Grove Campground & RV | RV | Emigrant Gap | CA | 20 | — | 100.0 | % | 100.0 | % | ||||||||||||||||||||
El Capitan Canyon(3) | RV | Goleta | CA | — | 170 | N/A | N/A | ||||||||||||||||||||||
| El Capitan Horse Ranch | RV | Goleta | CA | — | — | N/A | N/A | (2) | |||||||||||||||||||||
34
SUN COMMUNITIES, INC.
| Property Name | MH / RV | City / County (UK Only) | State / Country | MH and Annual RV Sites as of 12/31/2023 | Transient RV Sites as of 12/31/2023 | Occupancy as of 12/31/2023 | Occupancy as of 12/31/2022 | ||||||||||||||||||||||
| Forest Springs | MH | Grass Valley | CA | 370 | — | 93.3 | % | (1) | 92.0 | % | (1) | ||||||||||||||||||
| Friendly Village of La Habra | MH | La Habra | CA | 330 | — | 100.0 | % | 99.1 | % | ||||||||||||||||||||
| Friendly Village of Modesto | MH | Modesto | CA | 290 | — | 99.3 | % | 98.6 | % | ||||||||||||||||||||
| Friendly Village of Simi | MH | Simi Valley | CA | 220 | — | 100.0 | % | 99.5 | % | ||||||||||||||||||||
| Friendly Village of West Covina | MH | West Covina | CA | 160 | — | 99.4 | % | 98.7 | % | ||||||||||||||||||||
| Heritage | MH | Temecula | CA | 190 | — | 100.0 | % | 100.0 | % | ||||||||||||||||||||
Indian Wells(3) | RV | Indio | CA | 170 | 170 | 100.0 | % | 100.0 | % | ||||||||||||||||||||
Jellystone Park™ at Tower Park(3) | RV | Lodi | CA | — | 360 | N/A | N/A | ||||||||||||||||||||||
| Lakefront | MH | Lakeside | CA | 290 | — | 100.0 | % | 99.7 | % | ||||||||||||||||||||
| Lakeview Estates | MH | Yucaipa | CA | 300 | — | 99.7 | % | 99.7 | % | ||||||||||||||||||||
| Lazy J Ranch | MH | Arcata | CA | 220 | — | 99.1 | % | 98.6 | % | ||||||||||||||||||||
| Lemon Wood | MH | Ventura | CA | 230 | — | 100.0 | % | 100.0 | % | ||||||||||||||||||||
| Menifee Development | MH | Menifee | CA | — | — | N/A | (1) | N/A | (1) | ||||||||||||||||||||
| Moreno 66 Development | MH | Moreno Valley | CA | — | — | N/A | (1) | N/A | (1) | ||||||||||||||||||||
| Napa Valley | MH | Napa | CA | 260 | — | 99.6 | % | 100.0 | % | ||||||||||||||||||||
| Oak Creek | MH | Coarsegold | CA | 200 | — | 100.0 | % | 99.0 | % | ||||||||||||||||||||
| Ocean West | MH | McKinleyville | CA | 130 | — | 99.2 | % | 99.2 | % | ||||||||||||||||||||
| Palos Verdes Shores MH & Golf Community | MH | San Pedro | CA | 240 | — | 100.0 | % | 100.0 | % | ||||||||||||||||||||
| Pembroke Downs | MH | Chino | CA | 160 | — | 100.0 | % | 100.0 | % | ||||||||||||||||||||
Pismo Dunes Resort(3) | RV | Pismo Beach | CA | 330 | — | 100.0 | % | 100.0 | % | ||||||||||||||||||||
| Rancho Alipaz | MH | San Juan Capistrano | CA | 130 | — | 100.0 | % | 100.0 | % | ||||||||||||||||||||
| Rancho Caballero | MH | Riverside | CA | 300 | — | 99.3 | % | 99.7 | % | ||||||||||||||||||||
| Royal Palms | MH | Cathedral City | CA | 440 | — | 99.1 | % | 98.4 | % | ||||||||||||||||||||
| Royal Palms RV Resort | RV | Cathedral City | CA | 40 | — | 100.0 | % | 100.0 | % | ||||||||||||||||||||
Sun Outdoors Central Coast Wine Country(3) | RV | Paso Robles | CA | — | 200 | N/A | N/A | ||||||||||||||||||||||
Sun Outdoors Paso Robles(3) | RV | Paso Robles | CA | — | 330 | N/A | N/A | ||||||||||||||||||||||
| Sun Outdoors San Diego Bay | MH | San Diego | CA | — | — | N/A | (1) | N/A | (1) | ||||||||||||||||||||
Sun Outdoors San Diego Bay RV Resort(3) | RV | San Diego | CA | — | 250 | N/A | N/A | ||||||||||||||||||||||
Sun Outdoors Santa Barbara(3) | RV | Goleta | CA | — | 100 | N/A | N/A | ||||||||||||||||||||||
| Sunrise Estates | MH | Banning | CA | 180 | — | 91.7 | % | (1) | 90.6 | % | (1) | ||||||||||||||||||
| The Colony | MH | Oxnard | CA | 150 | — | 100.0 | % | 100.0 | % | ||||||||||||||||||||
| Vallecito | MH | Newbury Park | CA | 300 | — | 100.0 | % | 100.0 | % | ||||||||||||||||||||
| Victor Villa | MH | Victorville | CA | 290 | — | 98.6 | % | 99.3 | % | ||||||||||||||||||||
Vines(3) | RV | Paso Robles | CA | 50 | 80 | 100.0 | % | N/A | |||||||||||||||||||||
| Vista del Lago | MH | Scotts Valley | CA | 200 | — | 99.5 | % | 100.0 | % | ||||||||||||||||||||
| California Total | 6,920 | 1,880 | 98.8 | % | 98.6 | % | |||||||||||||||||||||||
| Arizona | |||||||||||||||||||||||||||||
| Blue Star | MH | Apache Junction | AZ | — | — | 100.0 | % | 100.0 | % | ||||||||||||||||||||
| Blue Star | RV | Apache Junction | AZ | 150 | — | 100.0 | % | 100.0 | % | ||||||||||||||||||||
| Brentwood West | MH | Mesa | AZ | 350 | — | 100.0 | % | 99.7 | % | ||||||||||||||||||||
| Buena Vista | MH | Buckeye | AZ | 400 | — | 98.3 | % | 92.0 | % | ||||||||||||||||||||
| Desert Harbor | MH | Apache Junction | AZ | 210 | — | 99.5 | % | 100.0 | % | ||||||||||||||||||||
| La Casa Blanca | MH | Apache Junction | AZ | 200 | — | 99.5 | % | 99.0 | % | ||||||||||||||||||||
Leaf Verde(3) | RV | Buckeye | AZ | 220 | 160 | 100.0 | % | 100.0 | % | ||||||||||||||||||||
| Lost Dutchman | MH | Apache Junction | AZ | 220 | — | 92.0 | % | (1) | 87.2 | % | (1) | ||||||||||||||||||
| Lost Dutchman RV Resort | RV | Apache Junction | AZ | — | — | N/A | N/A | ||||||||||||||||||||||
| Mountain View | MH | Mesa | AZ | 170 | — | 97.1 | % | 97.6 | % | ||||||||||||||||||||
| Palm Creek Resort & Residences | MH | Casa Grande | AZ | 510 | — | 82.0 | % | (1) | 78.7 | % | (1) | ||||||||||||||||||
Palm Creek Resort & Residences RV Resort(3) | RV | Casa Grande | AZ | 1,130 | 700 | 100.0 | % | 100.0 | % | ||||||||||||||||||||
35
SUN COMMUNITIES, INC.
| Property Name | MH / RV | City / County (UK Only) | State / Country | MH and Annual RV Sites as of 12/31/2023 | Transient RV Sites as of 12/31/2023 | Occupancy as of 12/31/2023 | Occupancy as of 12/31/2022 | ||||||||||||||||||||||
| Rancho Mirage | MH | Apache Junction | AZ | 310 | — | 99.7 | % | 99.7 | % | ||||||||||||||||||||
| Reserve at Fox Creek | MH | Bullhead City | AZ | 310 | — | 99.4 | % | 99.7 | % | ||||||||||||||||||||
| Spanish Trails West | MH | Casa Grande | AZ | 130 | — | 13.2 | % | (1) | 0.5 | % | (1) | ||||||||||||||||||
Spanish Trails West RV Resort(3) | RV | Casa Grande | AZ | 10 | 60 | 100.0 | % | N/A | (1) | ||||||||||||||||||||
| Sun Valley | MH | Apache Junction | AZ | 270 | — | 98.1 | % | 98.1 | % | ||||||||||||||||||||
| Arizona Total | 4,590 | 920 | 94.7 | % | 91.3 | % | |||||||||||||||||||||||
| Colorado | |||||||||||||||||||||||||||||
| Cave Creek | MH | Evans | CO | 450 | — | 99.8 | % | 100.0 | % | ||||||||||||||||||||
| Eagle Crest | MH | Firestone | CO | 440 | — | 99.5 | % | 99.8 | % | ||||||||||||||||||||
Jellystone Park™ at Larkspur(3) | RV | Larkspur | CO | — | 540 | N/A | N/A | ||||||||||||||||||||||
| North Point Estates | MH | Pueblo | CO | 110 | — | 99.1 | % | 95.4 | % | ||||||||||||||||||||
| Skyline | MH | Fort Collins | CO | 170 | — | 100.0 | % | 100.0 | % | ||||||||||||||||||||
| Smith Creek Crossing | MH | Granby | CO | 310 | — | 43.2 | % | (1) | 34.8 | % | (1) | ||||||||||||||||||
| Sun Outdoors Rocky Mountains | MH | Granby | CO | 40 | — | 100.0 | % | 100.0 | % | ||||||||||||||||||||
Sun Outdoors Rocky Mountains RV Resort(3) | RV | Granby | CO | — | 450 | 100.0 | % | N/A | |||||||||||||||||||||
| Swan Meadow Village | MH | Dillon | CO | 170 | — | 100.0 | % | 100.0 | % | ||||||||||||||||||||
| The Foothills | MH | Fort Collins | CO | — | — | N/A | N/A | ||||||||||||||||||||||
| The Grove at Alta Ridge | MH | Thornton | CO | 410 | — | 99.8 | % | 100.0 | % | ||||||||||||||||||||
| Timber Ridge | MH | Ft. Collins | CO | 580 | — | 99.1 | % | 99.3 | % | ||||||||||||||||||||
| Willow Crossing | MH | Fort Lupton | CO | 220 | — | 11.9 | % | (1) | — | % | (1) | ||||||||||||||||||
| Colorado Total | 2,900 | 990 | 87.0 | % | 88.2 | % | |||||||||||||||||||||||
| NORTHEAST | |||||||||||||||||||||||||||||
| Connecticut | |||||||||||||||||||||||||||||
| Beechwood | MH | Killingworth | CT | 300 | — | 98.7 | % | 98.3 | % | ||||||||||||||||||||
| Cedar Springs | MH | Southington | CT | 190 | — | 98.4 | % | 97.4 | % | ||||||||||||||||||||
| Forest Hill | MH | Southington | CT | 190 | — | 99.5 | % | 97.9 | % | ||||||||||||||||||||
| Grove Beach | MH | Westbrook | CT | 140 | — | 100.0 | % | 100.0 | % | ||||||||||||||||||||
| Hillcrest | MH | Uncasville | CT | 210 | — | 99.0 | % | 99.5 | % | ||||||||||||||||||||
| Lakeside | MH | Terryville | CT | 80 | — | 96.1 | % | 96.1 | % | ||||||||||||||||||||
| Lakeview CT | MH | Danbury | CT | 180 | — | 97.2 | % | 95.0 | % | ||||||||||||||||||||
| Laurel Heights | MH | Uncasville | CT | 50 | — | 91.8 | % | 89.8 | % | ||||||||||||||||||||
| Marina Cove | MH | Uncasville | CT | 20 | — | 92.0 | % | 92.0 | % | ||||||||||||||||||||
| Millwood | MH | Uncasville | CT | 40 | — | 31.1 | % | (1) | 13.3 | % | (1) | ||||||||||||||||||
| New England Village | MH | Westbrook | CT | 60 | — | 100.0 | % | 100.0 | % | ||||||||||||||||||||
| Oak Grove | MH | Plainville | CT | 40 | — | 93.3 | % | 93.3 | % | ||||||||||||||||||||
| Rolling Hills | MH | Storrs | CT | 200 | — | 82.0 | % | 78.0 | % | ||||||||||||||||||||
Sun Outdoors Mystic(3) | RV | Old Mystic | CT | 70 | 80 | 100.0 | % | 100.0 | % | ||||||||||||||||||||
| Three Gardens | MH | Southington | CT | 130 | — | 98.5 | % | 96.3 | % | ||||||||||||||||||||
| Yankee Village | MH | Old Saybrook | CT | 20 | — | 100.0 | % | 100.0 | % | ||||||||||||||||||||
| Connecticut Total | 1,920 | 80 | 95.0 | % | 93.4 | % | |||||||||||||||||||||||
| Maine | |||||||||||||||||||||||||||||
| Augusta Village | MH | Augusta | ME | 60 | — | 94.9 | % | 94.9 | % | ||||||||||||||||||||
| Birch Hill Estates | MH | Bangor | ME | 380 | — | 99.5 | % | 96.6 | % | ||||||||||||||||||||
| Hancock Heights Estates | MH | Hancock | ME | 110 | — | 97.3 | % | 97.3 | % | ||||||||||||||||||||
| Holiday Park Estates | MH | Bangor | ME | 220 | — | 97.7 | % | 92.7 | % | ||||||||||||||||||||
Jellystone Park™ Androscoggin Lake(3) | RV | North Monmouth | ME | 50 | 160 | 100.0 | % | 100.0 | % | ||||||||||||||||||||
| Maplewood Manor | MH | Brunswick | ME | 300 | — | 98.3 | % | 99.3 | % | ||||||||||||||||||||
| Merrymeeting | MH | Brunswick | ME | 40 | — | 100.0 | % | 97.7 | % | ||||||||||||||||||||
36
SUN COMMUNITIES, INC.
| Property Name | MH / RV | City / County (UK Only) | State / Country | MH and Annual RV Sites as of 12/31/2023 | Transient RV Sites as of 12/31/2023 | Occupancy as of 12/31/2023 | Occupancy as of 12/31/2022 | ||||||||||||||||||||||
| Norway Commons | MH | Norway | ME | 260 | — | 74.0 | % | (1) | 83.1 | % | (1) | ||||||||||||||||||
| Riverside Drive Park | MH | Augusta | ME | 160 | — | 92.6 | % | 81.0 | % | ||||||||||||||||||||
Sun Outdoors Old Orchard Beach Downtown(3) | RV | Old Orchard Beach | ME | 90 | 230 | 100.0 | % | 100.0 | % | ||||||||||||||||||||
Sun Outdoors Saco Old Orchard Beach(3) | RV | Saco | ME | 20 | 170 | 100.0 | % | N/A | |||||||||||||||||||||
Sun Outdoors Wells Beach(3) | RV | Wells | ME | — | 230 | N/A | N/A | ||||||||||||||||||||||
Sun Retreats at Wild Acres(3) | RV | Old Orchard Beach | ME | 380 | 250 | 100.0 | % | 100.0 | % | ||||||||||||||||||||
Sun Retreats Old Orchard Beach(3) | RV | Old Orchard Beach | ME | 260 | 30 | 100.0 | % | 100.0 | % | ||||||||||||||||||||
| Town & Country Village | MH | Lisbon | ME | 140 | — | 98.6 | % | 97.9 | % | ||||||||||||||||||||
| Maine Total | 2,470 | 1,070 | 96.0 | % | 95.4 | % | |||||||||||||||||||||||
| New Jersey | |||||||||||||||||||||||||||||
| Cape May Crossing | MH | Cape May | NJ | 30 | — | 100.0 | % | 100.0 | % | ||||||||||||||||||||
| Deep Run | MH | Cream Ridge | NJ | 240 | — | 100.0 | % | 100.0 | % | ||||||||||||||||||||
Hospitality Creek Campground(3) | RV | Williamstown | NJ | 70 | 170 | 100.0 | % | 100.0% | |||||||||||||||||||||
| Shady Pines | MH | Galloway Township | NJ | 40 | — | 100.0 | % | 100.0 | % | ||||||||||||||||||||
Shady Pines RV Resort(3) | RV | Galloway Township | NJ | 70 | 20 | 100.0 | % | 100.0 | % | ||||||||||||||||||||
Sun Outdoors Cape May(6) | RV | Cape May | NJ | 100 | 250 | 100.0 | % | N/A | |||||||||||||||||||||
Sun Retreats Avalon(3) | RV | Cape May Court House | NJ | 460 | 70 | 100.0 | % | 100.0 | % | ||||||||||||||||||||
Sun Retreats Cape May Wildwood(3) | RV | Cape May | NJ | 480 | 150 | 100.0 | % | 100.0 | % | ||||||||||||||||||||
Sun Retreats Long Beach Island(3) | RV | Barnegat | NJ | 180 | 30 | 100.0 | % | 100.0 | % | ||||||||||||||||||||
Sun Retreats Pleasant Acres Farm(3) | RV | Sussex | NJ | 160 | 130 | 100.0 | % | 100.0 | % | ||||||||||||||||||||
Sun Retreats Sea Isle(3) | RV | Clermont | NJ | 690 | 20 | 100.0 | % | 100.0 | % | ||||||||||||||||||||
Sun Retreats Seashore(3) | RV | Cape May | NJ | 450 | 230 | 100.0 | % | 100.0 | % | ||||||||||||||||||||
| New Jersey Total | 2,970 | 1,070 | 100.0 | % | 100.0 | % | |||||||||||||||||||||||
| New York | |||||||||||||||||||||||||||||
| Cherrywood | MH | Clinton | NY | 180 | — | 98.9 | % | 93.8 | % | (1) | |||||||||||||||||||
Jellystone Park™ at Birchwood Acres(6) | MH | Greenfield Park | NY | — | — | 100.0 | % | 100.0 | % | ||||||||||||||||||||
Jellystone Park™ at Birchwood Acres RV Resort(6) | RV | Greenfield Park | NY | 130 | 180 | 100.0 | % | 100.0 | % | ||||||||||||||||||||
Jellystone Park™ at Gardiner(3) | RV | Gardiner | NY | 20 | 310 | 100.0 | % | 100.0 | % | ||||||||||||||||||||
Jellystone Park™ of Western New York(3) | RV | North Java | NY | 10 | 340 | 100.0 | % | 100.0 | % | ||||||||||||||||||||
Kittatinny Campground & RV Resort(3) | RV | Barryville | NY | — | 330 | N/A | N/A | ||||||||||||||||||||||
| Parkside Village | MH | Cheektowaga | NY | 160 | — | 99.4 | % | 100.0 | % | ||||||||||||||||||||
| Sky Harbor | MH | Cheektowaga | NY | 520 | — | 98.7 | % | 97.7 | % | ||||||||||||||||||||
Sun Outdoors Association Island(3) | RV | Henderson | NY | 40 | 260 | 100.0 | % | 100.0 | % | ||||||||||||||||||||
| Sun Retreats Adirondack Gateway | RV | Gansevoort | NY | 340 | — | 100.0 | % | 100.0 | % | ||||||||||||||||||||
| The Villas at Calla Pointe | MH | Cheektowaga | NY | 120 | — | 100.0 | % | 100.0 | % | ||||||||||||||||||||
| New York Total | 1,520 | 1,420 | 99.3 | % | 98.5 | % | |||||||||||||||||||||||
| OTHER | |||||||||||||||||||||||||||||
Sun Outdoors Orange Beach(3) | RV | Orange Beach | AL | — | 500 | N/A | N/A | ||||||||||||||||||||||
| Fort Dupont | RV | Delaware City | DE | — | — | N/A | N/A | ||||||||||||||||||||||
| High Point Park | MH | Frederica | DE | 410 | — | 98.3 | % | 97.8 | % | ||||||||||||||||||||
Jellystone Park™ at Delaware Beaches(3) | RV | Delaware City | DE | — | 260 | N/A | N/A | ||||||||||||||||||||||
| Sea Air Village | MH | Rehoboth Beach | DE | 380 | — | 99.2 | % | 99.2 | % | ||||||||||||||||||||
Sea Air Village RV Resort(3) | RV | Rehoboth Beach | DE | 120 | 10 | 100.0 | % | 100.0 | % | ||||||||||||||||||||
Sun Outdoors Rehoboth Bay(6) | RV | Millsboro | DE | 10 | 290 | 100.0 | % | N/A | |||||||||||||||||||||
| Sun Retreats Rehoboth Bay | MH | Millsboro | DE | 200 | — | 100.0 | % | 95.0 | % | ||||||||||||||||||||
37
SUN COMMUNITIES, INC.
| Property Name | MH / RV | City / County (UK Only) | State / Country | MH and Annual RV Sites as of 12/31/2023 | Transient RV Sites as of 12/31/2023 | Occupancy as of 12/31/2023 | Occupancy as of 12/31/2022 | ||||||||||||||||||||||
| Sun Retreats Rehoboth Bay RV Resort | RV | Millsboro | DE | 300 | — | 100.0 | % | 100.0 | % | ||||||||||||||||||||
| Countryside Village of Atlanta | MH | Lawrenceville | GA | 260 | — | 98.9 | % | 99.2 | % | ||||||||||||||||||||
| Countryside Village of Gwinnett | MH | Buford | GA | 330 | — | 100.0 | % | 98.2 | % | ||||||||||||||||||||
| Countryside Village of Lake Lanier | MH | Buford | GA | 550 | — | 99.6 | % | 99.1 | % | ||||||||||||||||||||
| Wymberly | MH | Martinez | GA | 280 | — | 81.9 | % | (1) | 78.3 | % | (1) | ||||||||||||||||||
| Autumn Ridge | MH | Ankeny | IA | 410 | — | 97.8 | % | 97.6 | % | ||||||||||||||||||||
Jellystone Park™ of Chicago(3) | RV | Millbrook | IL | 150 | 240 | 100.0 | % | 100.0 | % | ||||||||||||||||||||
| Maple Brook | MH | Matteson | IL | 440 | — | 99.3 | % | 99.8 | % | ||||||||||||||||||||
| Oak Ridge | MH | Manteno | IL | 430 | — | 99.5 | % | 99.8 | % | ||||||||||||||||||||
Sun Retreats Rock River(3) | RV | Hillsdale | IL | 270 | 230 | 100.0 | % | 100.0 | % | ||||||||||||||||||||
| Wildwood Community | MH | Sandwich | IL | 480 | — | 99.2 | % | 99.2 | % | ||||||||||||||||||||
Jellystone Park™ at Mammoth Cave(6) | RV | Cave City | KY | — | 330 | N/A | N/A | ||||||||||||||||||||||
Sun Outdoors New Orleans North Shore(3) | RV | Ponchatoula | LA | — | 330 | N/A | N/A | ||||||||||||||||||||||
Sun Retreats Cape Cod(3) | RV | East Falmouth | MA | 80 | 180 | 100.0 | % | 100.0 | % | ||||||||||||||||||||
Sun Retreats Dennis Port(3) | RV | Dennisport | MA | 230 | 20 | 100.0 | % | 100.0 | % | ||||||||||||||||||||
Sun Retreats Peters Pond(3) | RV | Sandwich | MA | 370 | 40 | 100.0 | % | 100.0 | % | ||||||||||||||||||||
| Hyde Park | MH | Easton | MD | 240 | — | 99.6 | % | 100.0 | % | ||||||||||||||||||||
Jellystone Park™ at Maryland(3) | RV | Williamsport | MD | — | 230 | N/A | N/A | ||||||||||||||||||||||
| Southside Landing | MH | Cambridge | MD | 100 | — | 100.0 | % | 100.0 | % | ||||||||||||||||||||
Sun Outdoors Frontier Town(6) | RV | Berlin | MD | 30 | 660 | 100.0 | % | N/A | |||||||||||||||||||||
Sun Outdoors Ocean City(3) | RV | Berlin | MD | — | 390 | 100.0 | % | 100.0 | % | ||||||||||||||||||||
Sun Outdoors Ocean City Gateway(6) | RV | Whaleyville | MD | 20 | 190 | 100.0 | % | N/A | |||||||||||||||||||||
| Southern Hills / Northridge Place | MH | Stewartville | MN | 470 | — | 97.7 | % | 97.5 | % | ||||||||||||||||||||
Jellystone Park™ at Memphis(3) | RV | Horn Lake | MS | — | 160 | N/A | N/A | ||||||||||||||||||||||
Sun Outdoors Yellowstone North(3) | RV | Gardiner | MT | — | 80 | N/A | N/A | ||||||||||||||||||||||
| Coastal Estates | MH | Hampstead | NC | 150 | — | 94.8 | % | (1) | 82.5 | % | (1) | ||||||||||||||||||
| Glen Laurel | MH | Concord | NC | 260 | — | 98.8 | % | 98.8 | % | ||||||||||||||||||||
Jellystone Park™ at Golden Valley(3) | RV | Bostic | NC | — | 360 | N/A | N/A | ||||||||||||||||||||||
| Meadowbrook | MH | Charlotte | NC | 320 | — | 99.7 | % | 100.0 | % | ||||||||||||||||||||
Sun Retreats Nantahala(3) | RV | Sylva | NC | 70 | 20 | 100.0 | % | 100.0 | % | ||||||||||||||||||||
| Stoneridge Villas | MH | Gardnerville | NV | — | — | N/A | (1) | N/A | (1) | ||||||||||||||||||||
| Sun Villa Estates | MH | Reno | NV | 320 | — | 99.7 | % | 99.1 | % | ||||||||||||||||||||
| Brook Ridge | MH | Hooksett | NH | 90 | — | 100.0 | % | 100.0 | % | ||||||||||||||||||||
| Crestwood | MH | Concord | NH | 320 | — | 99.7 | % | 100.0 | % | ||||||||||||||||||||
| Farmwood Village | MH | Dover | NH | 160 | — | 100.0 | % | 100.0 | % | ||||||||||||||||||||
Glen Ellis Family Campground(3) | RV | Glen | NH | — | 300 | N/A | N/A | ||||||||||||||||||||||
| Hannah Village | MH | Lebanon | NH | 80 | — | 100.0 | % | 100.0 | % | ||||||||||||||||||||
| Hemlocks | MH | Tilton | NH | 100 | — | 100.0 | % | 100.0 | % | ||||||||||||||||||||
| River Pines | MH | Nashua | NH | 480 | — | 99.6 | % | 100.0 | % | ||||||||||||||||||||
Strafford / Lake Winnipesaukee South KOA(6) | RV | Strafford | NH | 10 | 130 | 100.0 | % | N/A | |||||||||||||||||||||
Westward Shores Cottages & RV Resort(3) | RV | West Ossipee | NH | 430 | 70 | 100.0 | % | 100.0 | % | ||||||||||||||||||||
| Apple Creek | MH | Amelia | OH | 180 | — | 98.9 | % | 98.3 | % | ||||||||||||||||||||
| East Fork Crossing | MH | Batavia | OH | 350 | — | 99.4 | % | 100.0 | % | ||||||||||||||||||||
| Oakwood Village | MH | Miamisburg | OH | 510 | — | 99.0 | % | 98.8 | % | ||||||||||||||||||||
| Orchard Lake | MH | Milford | OH | 150 | — | 99.3 | % | 98.0 | % | ||||||||||||||||||||
Sun Retreats Geneva on the Lake(3) | RV | Geneva on the Lake | OH | 510 | 120 | 100.0 | % | 100.0 | % | ||||||||||||||||||||
| Westbrook Senior Village | MH | Toledo | OH | 110 | — | 100.0 | % | 100.0 | % | ||||||||||||||||||||
| Westbrook Village | MH | Toledo | OH | 340 | — | 97.7 | % | 94.5 | % | ||||||||||||||||||||
| Willowbrook Place | MH | Toledo | OH | 270 | — | 97.4 | % | 95.1 | % | ||||||||||||||||||||
| Woodside Terrace | MH | Holland | OH | 440 | — | 96.4 | % | 95.7 | % | ||||||||||||||||||||
| Country Village Estates | MH | Oregon City | OR | 520 | — | 100.0 | % | 100.0 | % | ||||||||||||||||||||
38
SUN COMMUNITIES, INC.
| Property Name | MH / RV | City / County (UK Only) | State / Country | MH and Annual RV Sites as of 12/31/2023 | Transient RV Sites as of 12/31/2023 | Occupancy as of 12/31/2023 | Occupancy as of 12/31/2022 | ||||||||||||||||||||||
| Forest Meadows | MH | Philomath | OR | 130 | — | 72.9 | % | (1) | 58.1 | % | (1) | ||||||||||||||||||
Sun Outdoors Bend(3) | RV | Bend | OR | — | 120 | N/A | N/A | ||||||||||||||||||||||
Sun Outdoors Coos Bay(3) | RV | Coos Bay | OR | — | 80 | N/A | N/A | ||||||||||||||||||||||
Sun Outdoors Portland South(3) | RV | Wilsonville | OR | — | 130 | N/A | N/A | ||||||||||||||||||||||
| Woodland Park Estates | MH | Eugene | OR | 400 | — | 100.0 | % | 99.7 | % | ||||||||||||||||||||
| Countryside Estates | MH | Mckean | PA | 300 | — | 98.7 | % | 98.7 | % | ||||||||||||||||||||
Jellystone Park™ at Quarryville(3) | RV | Quarryville | PA | — | 260 | N/A | N/A | ||||||||||||||||||||||
| Pheasant Ridge | MH | Lancaster | PA | 550 | — | 99.6 | % | 99.8 | % | ||||||||||||||||||||
| River Beach Campsites & RV | RV | Milford | PA | — | — | N/A | N/A | ||||||||||||||||||||||
Sun Retreats Lancaster County(3) | RV | Narvon | PA | 290 | 140 | 100.0 | % | 100.0 | % | ||||||||||||||||||||
| Country Lakes | MH | Little River | SC | 140 | — | 100.0 | % | 100.0 | % | ||||||||||||||||||||
| Crossroads | MH | Aiken | SC | 170 | — | 94.0 | % | (1) | 92.3 | % | (1) | ||||||||||||||||||
| Crossroads RV Resort | RV | Aiken | SC | 20 | — | 100.0 | % | 100.0 | % | ||||||||||||||||||||
| Lakeside Crossing | MH | Conway | SC | 690 | — | 98.4 | % | 94.8 | % | (1) | |||||||||||||||||||
| Ocean Pines | MH | Garden City | SC | 580 | — | 99.8 | % | 99.8 | % | ||||||||||||||||||||
| Southern Palms | MH | Ladson | SC | 190 | — | 100.0 | % | 100.0 | % | ||||||||||||||||||||
Sun Outdoors Myrtle Beach(3) | RV | Conway | SC | 160 | 670 | 100.0 | % | 100.0 | % | ||||||||||||||||||||
| Bell Crossing | MH | Clarksville | TN | 240 | — | 97.0 | % | 99.6 | % | ||||||||||||||||||||
Sun Outdoors Pigeon Forge(3) | RV | Sevierville | TN | 70 | 240 | 100.0 | % | 100.0 | % | ||||||||||||||||||||
| Bear Lake Development Land | RV | Garden City | UT | — | — | N/A | (1) | N/A | (1) | ||||||||||||||||||||
Sun Outdoors Arches Gateway(3) | RV | Moab | UT | — | 130 | N/A | N/A | ||||||||||||||||||||||
Sun Outdoors Canyonlands Gateway(3) | RV | Moab | UT | — | 110 | N/A | N/A | ||||||||||||||||||||||
Sun Outdoors Garden City Utah(3) | RV | Garden City | UT | — | 180 | N/A | N/A | ||||||||||||||||||||||
Sun Outdoors Moab Downtown(3) | RV | Moab | UT | — | 130 | N/A | N/A | ||||||||||||||||||||||
Sun Outdoors North Moab(3) | RV | Moab | UT | — | 190 | N/A | N/A | ||||||||||||||||||||||
Sun Outdoors Salt Lake City(3) | RV | North Salt Lake | UT | — | 190 | N/A | N/A | ||||||||||||||||||||||
| 47 North | MH | Cle Elum | WA | — | — | N/A | (1) | N/A | (1) | ||||||||||||||||||||
Sun Outdoors Gig Harbor(3) | RV | Gig Harbor | WA | — | 110 | N/A | N/A | ||||||||||||||||||||||
Sun Retreats Birch Bay(3) | RV | Blaine | WA | 370 | 300 | 100.0 | % | 100.0 | % | ||||||||||||||||||||
Fond du Lac East / Kettle Moraine KOA(3) | RV | Glenbeulah | WI | 240 | 80 | 100.0 | % | 100.0 | % | ||||||||||||||||||||
| Thunderhill Estates | MH | Sturgeon Bay | WI | 270 | — | 98.9 | % | 98.1 | % | ||||||||||||||||||||
| Other Total | 17,540 | 8,200 | 98.7 | % | 98.1 | % | |||||||||||||||||||||||
| US TOTAL / AVERAGE | 128,010 | 24,810 | 97.3 | % | 96.7 | % | |||||||||||||||||||||||
| CANADA | |||||||||||||||||||||||||||||
| Pleasant Beach Campground | RV | Sherkston | ON | 100 | — | 100.0 | % | 100.0 | % | ||||||||||||||||||||
Sun Retreats Amherstburg(3) | RV | Amherstburg | ON | 220 | 80 | 100.0 | % | 100.0 | % | ||||||||||||||||||||
| Sun Retreats Arran Lake | RV | Allenford | ON | 190 | — | 100.0 | % | 100.0 | % | ||||||||||||||||||||
Sun Retreats Blue Mountains(3) | RV | Clarksburg | ON | 90 | 20 | 100.0 | % | 100.0 | % | ||||||||||||||||||||
Sun Retreats Cayuga(3) | RV | Cayuga | ON | 250 | 30 | 100.0 | % | 100.0 | % | ||||||||||||||||||||
| Sun Retreats Flamborough | RV | Millgrove | ON | 200 | — | 100.0 | % | 100.0 | % | ||||||||||||||||||||
Sun Retreats Georgian Bay(3) | RV | Seguin | ON | 230 | 10 | 100.0 | % | 100.0 | % | ||||||||||||||||||||
Sun Retreats Hay Bay(3) | RV | Napanee | ON | 200 | 10 | 100.0 | % | 100.0 | % | ||||||||||||||||||||
| Sun Retreats Huntsville | RV | Huntsville | ON | 230 | — | 100.0 | % | 100.0 | % | ||||||||||||||||||||
Sun Retreats Ipperwash(3) | RV | Lambton Shores | ON | 140 | 20 | 100.0 | % | 100.0 | % | ||||||||||||||||||||
Sun Retreats Penetanguishene(3) | RV | Tiny | ON | 220 | 40 | 100.0 | % | 100.0 | % | ||||||||||||||||||||
| Sun Retreats Sandbanks | RV | Cherry Valley | ON | 140 | — | 100.0 | % | 100.0 | % | ||||||||||||||||||||
Sun Retreats Sherkston Shores(3) | RV | Sherkston | ON | 1,700 | 240 | 100.0 | % | 100.0 | % | ||||||||||||||||||||
| Sun Retreats Stratford | RV | Bornholm | ON | 210 | — | 100.0 | % | 100.0 | % | ||||||||||||||||||||
Sun Retreats Turkey Point(3) | RV | Normandale | ON | 210 | 30 | 100.0 | % | 100.0 | % | ||||||||||||||||||||
39
SUN COMMUNITIES, INC.
| Property Name | MH / RV | City / County (UK Only) | State / Country | MH and Annual RV Sites as of 12/31/2023 | Transient RV Sites as of 12/31/2023 | Occupancy as of 12/31/2023 | Occupancy as of 12/31/2022 | ||||||||||||||||||||||
| Sun Retreats Willow Lake | RV | Scotland | ON | 370 | — | 100.0 | % | 100.0 | % | ||||||||||||||||||||
| CANADA TOTAL / AVERAGE | 4,700 | 480 | 100.0 | % | 100.0 | % | |||||||||||||||||||||||
| NORTH AMERICA TOTAL | 132,710 | 25,290 | 97.4 | % | 96.8 | % | |||||||||||||||||||||||
| UNITED KINGDOM | |||||||||||||||||||||||||||||
| England | |||||||||||||||||||||||||||||
Alberta(3) | MH | Whitstable, Kent | England | 330 | 10 | 94.5 | % | 93.6 | % | ||||||||||||||||||||
| Amble Links | MH | Amble, Northumberland | England | 660 | — | 91.2 | % | 93.6 | % | ||||||||||||||||||||
Ashbourne Heights(3) | MH | Ashbourne, Derbyshire | England | 110 | 120 | 90.4 | % | 90.2 | % | ||||||||||||||||||||
| Beauport | MH | Hastings, Sussex | England | 820 | — | 94.3 | % | 95.1 | % | ||||||||||||||||||||
| Birchington Vale | MH | Birchington, Kent | England | 490 | — | 97.3 | % | 97.1 | % | ||||||||||||||||||||
Bodmin Holiday Park (formerly Cornwall)(3) | MH | Bodmin, Cornwall | England | 10 | 60 | 69.2 | % | (1) | 64.3 | % | |||||||||||||||||||
Bowland Fell(3) | MH | Skipton, Yorkshire | England | 270 | 40 | 86.0 | % | 88.4 | % | ||||||||||||||||||||
Broadland Sands(3) | MH | Lowestoft, Suffolk | England | 440 | 180 | 95.7 | % | 91.0 | % | ||||||||||||||||||||
Carlton Meres(3) | MH | Saxmundham, Suffolk | England | 350 | 180 | 89.3 | % | 86.7 | % | ||||||||||||||||||||
| Chantry | MH | West Witton, Yorkshire | England | 140 | — | 79.1 | % | 77.9 | % | ||||||||||||||||||||
Chichester Lakeside(3) | MH | Chichester, Sussex | England | 500 | 100 | 94.2 | % | 93.0 | % | ||||||||||||||||||||
Coghurst Hall(3) | MH | Hastings, Sussex | England | 490 | 30 | 92.0 | % | 92.8 | % | ||||||||||||||||||||
| Dawlish Sands | MH | Dawlish, Devon | England | 170 | — | 91.6 | % | 94.6 | % | ||||||||||||||||||||
Dovercourt(3) | MH | Harwich, Essex | England | 530 | 110 | 91.0 | % | 92.8 | % | ||||||||||||||||||||
Felixstowe Beach(3) | MH | Felixstowe, Suffolk | England | 330 | 10 | 89.7 | % | 95.4 | % | ||||||||||||||||||||
Glendale(3) | MH | Wigton, Cumbria | England | 350 | 30 | 71.4 | % | 93.2 | % | ||||||||||||||||||||
Golden Sands(3) | MH | Dawlish, Devon | England | 300 | 120 | 86.6 | % | 80.6 | % | ||||||||||||||||||||
Harts(3) | MH | Isle of Sheppey, Kent | England | 480 | 160 | 87.2 | % | 87.6 | % | ||||||||||||||||||||
Hedley Wood(3) | MH | Holsworthy, Devon | England | 80 | 170 | 66.7 | % | (1) | 63.2 | % | |||||||||||||||||||
| Henfold | MH | Dorking, Surrey | England | — | — | N/A | (1) | N/A | (1) | ||||||||||||||||||||
Hengar Manor(3) | MH | Bodmin, Cornwall | England | 120 | 60 | 80.9 | % | 80.2 | % | ||||||||||||||||||||
Littondale(3) | MH | Skipton, Yorkshire | England | 90 | 10 | 92.2 | % | 88.3 | % | ||||||||||||||||||||
Malvern View(3) | MH | Stanford Bishop, Worcester | England | 320 | 30 | 87.2 | % | 89.1 | % | ||||||||||||||||||||
Marlie(3) | MH | Romney, Kent | England | 380 | 130 | 90.9 | % | 91.8 | % | ||||||||||||||||||||
Martello Beach(3) | MH | Clacton on Sea, Essex | England | 460 | 100 | 90.0 | % | 86.6 | % | ||||||||||||||||||||
New Beach(3) | MH | Dymchurch, Kent | England | 510 | 90 | 95.5 | % | 93.0 | % | ||||||||||||||||||||
Newhaven(3) | MH | Buxton, Derbyshire | England | 80 | 120 | 79.3 | % | 90.7 | % | ||||||||||||||||||||
| Oaklands | MH | Clacton on Sea, Essex | England | 290 | — | 88.4 | % | 93.2 | % | ||||||||||||||||||||
| Old Kerrow | MH | Ilfracombe, Devon | England | — | — | N/A | N/A | (2) | |||||||||||||||||||||
| Oyster Bay | MH | Truro, Cornwall | England | 160 | — | 71.3 | % | 87.4 | % | ||||||||||||||||||||
Pakefield(3) | MH | Pakefield, Suffolk | England | 320 | 30 | 91.4 | % | 88.4 | % | ||||||||||||||||||||
Par Sands(3) | MH | Par, Cornwall | England | 280 | 20 | 92.6 | % | 94.4 | % | ||||||||||||||||||||
Pentire(3) | MH | Bude, Cornwall | England | 120 | 10 | 92.3 | % | 93.2 | % | ||||||||||||||||||||
Pevensey Bay(3) | MH | Pevensey Bay, Sussex | England | 350 | 100 | 89.5 | % | 87.2 | % | ||||||||||||||||||||
Polperro(3) | MH | Looe, Cornwall | England | 70 | 90 | 71.6 | % | 54.1 | % | ||||||||||||||||||||
| Ribble Valley | MH | Clitheroe, Lancashire | England | 310 | — | 80.2 | % | 85.4 | % | ||||||||||||||||||||
| Rye Harbour | MH | Rye, Sussex | England | 240 | — | 89.3 | % | 88.8 | % | ||||||||||||||||||||
Sand le Mere(3) | MH | Hull, Yorkshire | England | 690 | 210 | 86.1 | % | 77.8 | % | ||||||||||||||||||||
40
SUN COMMUNITIES, INC.
| Property Name | MH / RV | City / County (UK Only) | State / Country | MH and Annual RV Sites as of 12/31/2023 | Transient RV Sites as of 12/31/2023 | Occupancy as of 12/31/2023 | Occupancy as of 12/31/2022 | ||||||||||||||||||||||
Sandhills(3) | MH | Christchurch, Dorset | England | 130 | 10 | 88.8 | % | 92.5 | % | ||||||||||||||||||||
| Sandy Bay | MH | Canvey Island, Essex | England | 730 | — | 80.0 | % | 80.0 | % | ||||||||||||||||||||
Seaview(3) | MH | Whitstable, Kent | England | 590 | 60 | 95.6 | % | 97.6 | % | ||||||||||||||||||||
Seawick(3) | MH | Clacton on Sea, Essex | England | 580 | 90 | 93.5 | % | 90.3 | % | ||||||||||||||||||||
Solent Breezes(3) | MH | Fareham, Hampshire | England | 250 | 10 | 91.9 | % | 87.9 | % | ||||||||||||||||||||
St. Osyth Beach(3) | MH | Clacton on Sea, Essex | England | 480 | 30 | 94.6 | % | 96.8 | % | ||||||||||||||||||||
Steeple Bay(3) | MH | Sothminster, Essex | England | 450 | 80 | 89.9 | % | 89.2 | % | ||||||||||||||||||||
| Stowford | MH | Ilfracombe, Devon | England | — | — | N/A | (1) | N/A | (2) | ||||||||||||||||||||
Suffolk Sands(3) | MH | Felixstowe, Suffolk | England | 360 | 20 | 94.4 | % | 94.6 | % | ||||||||||||||||||||
Tarka(3) | MH | Barnstaple, Devon | England | 120 | 10 | 87.3 | % | 93.5 | % | ||||||||||||||||||||
Trevella(3) | MH | Newquay, Cornwall | England | 180 | 180 | 88.0 | % | 91.6 | % | ||||||||||||||||||||
| Vernon Dene | MH | North Ripley, Bransgore | England | — | — | N/A | (1) | N/A | (1) | ||||||||||||||||||||
Waterside(3) | MH | Paignton, Devon | England | 200 | 30 | 87.4 | % | 91.3 | % | ||||||||||||||||||||
West Mersea(3) | MH | West Mersea, Essex | England | 400 | 40 | 96.8 | % | 97.5 | % | ||||||||||||||||||||
Winchelsea Sands(3) | MH | Winchelsea, Sussex | England | 260 | 10 | 85.1 | % | 82.9 | % | ||||||||||||||||||||
Wood Farm(3) | MH | Charmouth, Dorset | England | 130 | 110 | 83.1 | % | 90.4 | % | ||||||||||||||||||||
| Yorkshire Dales | MH | Leyburn, Yorkshire | England | 110 | — | 83.9 | % | 79.4 | % | ||||||||||||||||||||
| England Total | 16,610 | 3,000 | 89.6 | % | 90.4 | % | |||||||||||||||||||||||
| Scotland | |||||||||||||||||||||||||||||
Burghead(3) | MH | Burghead, Moray | Scotland | 80 | 20 | 63.8 | % | 67.5 | % | ||||||||||||||||||||
Lossiemouth(3) | MH | Lossiemouth, Moray | Scotland | 130 | 20 | 72.1 | % | 76.0 | % | ||||||||||||||||||||
Silver Sands(3) | MH | Lossiemouth, Moray | Scotland | 420 | 110 | 93.6 | % | 94.2 | % | ||||||||||||||||||||
Turnberry(3) | MH | Girvan, Ayrshire | Scotland | 260 | 20 | 80.5 | % | 83.5 | % | ||||||||||||||||||||
| Scotland Total | 890 | 170 | 84.0 | % | 85.9 | % | |||||||||||||||||||||||
| Wales | |||||||||||||||||||||||||||||
Brynteg(3) | MH | Llanryg, Caernafon | Wales | 290 | 30 | 92.5 | % | 94.9 | % | ||||||||||||||||||||
| Plas Coch | MH | Llanedwen, Anglesey | Wales | 320 | — | 95.7 | % | 95.1 | % | ||||||||||||||||||||
| Wales Total | 610 | 30 | 94.2 | % | 95.0 | % | |||||||||||||||||||||||
| UNITED KINGDOM TOTAL | 18,110 | 3,200 | 89.5 | % | 89.9 | % | |||||||||||||||||||||||
| COMPANY TOTAL / AVERAGE | 150,820 | 28,490 | 96.4 | % | 96.0 | % | |||||||||||||||||||||||
(1)Occupancy in these properties reflects the fact that these properties are held for future development or are in a lease-up phase following an expansion, redevelopment or initial construction.
(2)No occupancy in these properties for the year ended December 31, 2022 as properties were acquired during the year ended December 31, 2023.
(3)Occupancy percentage excludes transient RV sites. Percentage calculated by dividing revenue producing sites by developed sites. A revenue producing site is defined as a site that is occupied by a paying resident or reserved by a customer with annual or seasonal usage rights. A developed site is defined as an adequately sized parcel of land that has road and utility access which is zoned and licensed (if required) for use as a home site.
(4)Occupancy in these properties at December 31, 2022 reflects the redevelopment following asset impairments resulting from Hurricane Ian in October 2022.
(5)Occupancy in these properties at December 31, 2022 reflects the redevelopment following asset impairments resulting from Hurricane Irma in September 2017.
(6)We have an ownership interest in these properties, but do not maintain and operate these properties.
41
SUN COMMUNITIES, INC.
The following tables set forth certain information relating to our Safe Harbor branded marinas as of December 31, 2023.
| Marina Property Name | City | State / Municipal | Wet Slips and Dry Storage Spaces as of 12/31/2023 | Wet Slips and Dry Storage Spaces as of 12/31/2022 | ||||||||||
| UNITED STATES | ||||||||||||||
| NORTHEAST | ||||||||||||||
| Connecticut | ||||||||||||||
| Bruce & Johnsons | Branford | CT | 670 | 670 | ||||||||||
Dauntless(1) | Essex | CT | 340 | 340 | ||||||||||
Dauntless Shipyard(1) | Essex | CT | — | — | ||||||||||
| Deep River | Deep River | CT | 310 | 310 | ||||||||||
Essex Island(1) | Essex | CT | — | — | ||||||||||
| Ferry Point | Old Saybrook | CT | 140 | 140 | ||||||||||
Harbor House(2) | Stamford | CT | — | — | ||||||||||
| Mystic | Mystic | CT | 260 | 260 | ||||||||||
| Pilots Point | Westbrook | CT | 880 | 880 | ||||||||||
| Stratford | Stratford | CT | 210 | 210 | ||||||||||
Yacht Haven(2) | Stamford | CT | 520 | 520 | ||||||||||
| Connecticut Total | 3,330 | 3,330 | ||||||||||||
| Rhode Island | ||||||||||||||
| Allen Harbor | North Kingstown | RI | 180 | 140 | ||||||||||
| Cove Haven | Barrington | RI | 340 | 340 | ||||||||||
Cowesett(3) | Warwick | RI | 1,190 | 1,190 | ||||||||||
| Greenwich Bay | Warwick | RI | 550 | 550 | ||||||||||
Island Park(4) | Portsmouth | RI | — | — | ||||||||||
| Jamestown Boatyard | Jamestown | RI | 110 | 110 | ||||||||||
| New England Boatworks | Portsmouth | RI | 230 | 230 | ||||||||||
| Newport Shipyard | Newport | RI | 70 | 70 | ||||||||||
Sakonnet(4) | Portsmouth | RI | 420 | 420 | ||||||||||
| Silver Spring | Wakefield | RI | 110 | 110 | ||||||||||
Wickford(5) | Wickford | RI | — | — | ||||||||||
Wickford Cove(5) | Wickford | RI | 260 | 260 | ||||||||||
| Rhode Island Total | 3,460 | 3,420 | ||||||||||||
| New York | ||||||||||||||
| Capri | Port Washington | NY | 370 | 370 | ||||||||||
| Gaines | Rouses Point | NY | 290 | 290 | ||||||||||
| Glen Cove | Glen Cove | NY | 540 | 540 | ||||||||||
Greenport(6) | Greenport | NY | 420 | 420 | ||||||||||
| Haverstraw | West Haverstraw | NY | 900 | 900 | ||||||||||
| Montauk Yacht Club | Montauk | NY | 230 | 230 | ||||||||||
| Post Road | Mamaroneck | NY | 50 | 50 | ||||||||||
Stirling(6) | Greenport | NY | — | — | ||||||||||
| Willsboro Bay | Willsboro | NY | 220 | 220 | ||||||||||
| New York Total | 3,020 | 3,020 | ||||||||||||
| Massachusetts | ||||||||||||||
| Edgartown | Edgartown | MA | 120 | 120 | ||||||||||
| Fiddler's Cove | North Falmouth | MA | 200 | 200 | ||||||||||
| Green Harbor | Marshfield | MA | 200 | 200 | ||||||||||
| Hawthorne Cove | Salem | MA | 450 | 450 | ||||||||||
| Marina Bay | Quincy | MA | 700 | 700 | ||||||||||
| Onset Bay | Buzzards Bay | MA | 230 | 230 | ||||||||||
42
SUN COMMUNITIES, INC.
| Marina Property Name | City | State / Municipal | Wet Slips and Dry Storage Spaces as of 12/31/2023 | Wet Slips and Dry Storage Spaces as of 12/31/2022 | ||||||||||
| Plymouth | Plymouth | MA | 200 | 200 | ||||||||||
| Sunset Bay | Hull | MA | 240 | 240 | ||||||||||
| Vineyard Haven | Vineyard Haven | MA | 180 | 180 | ||||||||||
| Massachusetts Total | 2,520 | 2,520 | ||||||||||||
| Maryland | ||||||||||||||
| Annapolis | Annapolis | MD | 290 | 290 | ||||||||||
| Bohemia Vista | Chesapeake Bay | MD | 130 | 120 | ||||||||||
| Carroll Island | Baltimore | MD | 460 | 460 | ||||||||||
| Great Oak Landing | Chestertown | MD | 390 | 400 | ||||||||||
| Hacks Point | Chesapeake Bay | MD | 70 | 70 | ||||||||||
Narrows Point(7) | Grasonville | MD | 390 | 540 | ||||||||||
| Oxford | Oxford | MD | 140 | 140 | ||||||||||
| Podickory Point | Annapolis | MD | 310 | 310 | ||||||||||
| Zahnisers | Solomons | MD | 300 | 300 | ||||||||||
| Maryland Total | 2,480 | 2,630 | ||||||||||||
| New Jersey | ||||||||||||||
| Crystal Point | Point Pleasant | NJ | 170 | 170 | ||||||||||
| Manasquan River | Brick Township | NJ | 240 | 240 | ||||||||||
| New Jersey Total | 410 | 410 | ||||||||||||
| Maine | ||||||||||||||
| Great Island | Harpswell | ME | 140 | 140 | ||||||||||
| Kittery Point | Kittery | ME | 60 | 60 | ||||||||||
| Rockland | Rockland | ME | 50 | 50 | ||||||||||
| Maine Total | 250 | 250 | ||||||||||||
| New Hampshire | ||||||||||||||
| Wentworth by the Sea | New Castle | NH | 220 | 220 | ||||||||||
| New Hampshire Total | 220 | 220 | ||||||||||||
| Vermont | ||||||||||||||
| Shelburne Shipyard | Shelburne | VT | 210 | 210 | ||||||||||
| Vermont Total | 210 | 210 | ||||||||||||
| SOUTH | ||||||||||||||
| Georgia | ||||||||||||||
| Aqualand | Flowery Branch | GA | 1,570 | 1,570 | ||||||||||
| Bahia Bleu | Thunderbolt | GA | 260 | 260 | ||||||||||
| Hideaway Bay | Flowery Branch | GA | 690 | 690 | ||||||||||
Savannah Yacht Center(8) | Savannah | GA | 20 | N/A | ||||||||||
| Trade Winds | Appling | GA | 320 | 320 | ||||||||||
| Georgia Total | 2,860 | 2,840 | ||||||||||||
| Kentucky | ||||||||||||||
| Beaver Creek | Monticello | KY | 280 | 280 | ||||||||||
| Burnside | Somerset | KY | 350 | 350 | ||||||||||
| Grider Hill | Albany | KY | 710 | 710 | ||||||||||
| Jamestown | Jamestown | KY | 740 | 740 | ||||||||||
| Wisdom Dock | Albany | KY | 290 | 290 | ||||||||||
43
SUN COMMUNITIES, INC.
| Marina Property Name | City | State / Municipal | Wet Slips and Dry Storage Spaces as of 12/31/2023 | Wet Slips and Dry Storage Spaces as of 12/31/2022 | ||||||||||
| Kentucky Total | 2,370 | 2,370 | ||||||||||||
| Texas | ||||||||||||||
| Emerald Point | Austin | TX | 590 | 590 | ||||||||||
| Pier 121 | Lewisville | TX | 1,080 | 1,080 | ||||||||||
| Walden | Montgomery | TX | 390 | 390 | ||||||||||
| Texas Total | 2,060 | 2,060 | ||||||||||||
| Arkansas | ||||||||||||||
| Brady Mountain | Royal | AR | 580 | 580 | ||||||||||
| Arkansas Total | 580 | 580 | ||||||||||||
| Tennessee | ||||||||||||||
| Eagle Cove | Byrdstown | TN | 80 | 80 | ||||||||||
| Holly Creek | Celina | TN | 310 | 310 | ||||||||||
| Tennessee Total | 390 | 390 | ||||||||||||
| Mississippi | ||||||||||||||
| Aqua Yacht | Iuka | MS | 590 | 590 | ||||||||||
| Mississippi Total | 590 | 590 | ||||||||||||
| Alabama | ||||||||||||||
| Sportsman | Orange Beach | AL | 760 | 720 | ||||||||||
| Alabama Total | 760 | 720 | ||||||||||||
| Oklahoma | ||||||||||||||
| Harbors View | Afton | OK | 160 | 160 | ||||||||||
| Oklahoma Total | 160 | 160 | ||||||||||||
| SOUTHEAST | ||||||||||||||
| Florida | ||||||||||||||
| Angler House | Islamorada | FL | 20 | 20 | ||||||||||
| Burnt Store | Punta Gorda | FL | 910 | 760 | ||||||||||
| Calusa Island | Goodland | FL | 620 | 620 | ||||||||||
| Cape Harbour | Cape Coral | FL | 260 | 260 | ||||||||||
| Emerald Coast | Niceville | FL | 350 | 350 | ||||||||||
| Harborage Yacht Club | Stuart | FL | 310 | 310 | ||||||||||
| Harbortown | Fort Pierce | FL | 350 | 350 | ||||||||||
| Islamorada | Islamorada | FL | 260 | 260 | ||||||||||
Lauderdale Marine Center(9) | Fort Lauderdale | FL | 130 | 130 | ||||||||||
| Marathon | Marathon | FL | 160 | 160 | ||||||||||
| New Port Cove | Riviera Beach | FL | 360 | 360 | ||||||||||
| North Palm Beach | North Palm Beach | FL | 120 | 120 | ||||||||||
| Old Port Cove | North Palm Beach | FL | 210 | 210 | ||||||||||
| Pier 77 | Bradenton | FL | 200 | 200 | ||||||||||
| Pineland | Bokeelia | FL | 260 | 260 | ||||||||||
Port Phoenix(10) | North Fort Myers | FL | — | — | ||||||||||
| Regatta Pointe | Palmetto | FL | 370 | 370 | ||||||||||
| Riviera Beach | Riviera Beach | FL | 20 | 20 | ||||||||||
| Siesta Key | Sarasota | FL | 230 | 230 | ||||||||||
South Fork(9) | Fort Lauderdale | FL | — | — | ||||||||||
| West Palm Beach | West Palm Beach | FL | 60 | 60 | ||||||||||
44
SUN COMMUNITIES, INC.
| Marina Property Name | City | State / Municipal | Wet Slips and Dry Storage Spaces as of 12/31/2023 | Wet Slips and Dry Storage Spaces as of 12/31/2022 | ||||||||||
| Florida Total | 5,200 | 5,050 | ||||||||||||
| South Carolina | ||||||||||||||
| Beaufort | Beaufort | SC | 130 | 130 | ||||||||||
| Bristol | Charleston | SC | 190 | 190 | ||||||||||
Charleston City(11) | Charleston | SC | 450 | 450 | ||||||||||
| City Boatyard | Charleston | SC | 220 | 220 | ||||||||||
| Port Royal | Port Royal | SC | 250 | 250 | ||||||||||
| Port Royal Landing | Port Royal | SC | 160 | 160 | ||||||||||
| Reserve Harbor | Pawleys Island | SC | 230 | 230 | ||||||||||
| Skull Creek | Hilton Head | SC | 190 | 190 | ||||||||||
| South Carolina Total | 1,820 | 1,820 | ||||||||||||
| North Carolina | ||||||||||||||
| Jarrett Bay Boatworks | Beaufort | NC | 40 | 40 | ||||||||||
| Kings Point | Cornelius | NC | 780 | 780 | ||||||||||
| Outer Banks | Wanchese | NC | 210 | 210 | ||||||||||
| Peninsula Yacht Club | Cornelius | NC | 480 | 480 | ||||||||||
| Skippers Landing | Troutman | NC | 390 | 390 | ||||||||||
| South Harbour Village | Southport | NC | 140 | 140 | ||||||||||
| Westport | Denver | NC | 620 | 620 | ||||||||||
| North Carolina Total | 2,660 | 2,660 | ||||||||||||
| Puerto Rico | ||||||||||||||
| Puerto del Rey | Fajardo | PR | 1,610 | 1,610 | ||||||||||
| Puerto Rico Total | 1,610 | 1,610 | ||||||||||||
| Virginia | ||||||||||||||
| Bluewater | Hampton | VA | 200 | 200 | ||||||||||
| Stingray Point | Deltaville | VA | 220 | 220 | ||||||||||
| Virginia Total | 420 | 420 | ||||||||||||
| MIDWEST | ||||||||||||||
| Michigan | ||||||||||||||
| Belle Maer | Harrison Township | MI | 550 | 550 | ||||||||||
| Detroit River | Detroit | MI | 470 | 470 | ||||||||||
| Grand Isle | Grand Haven | MI | 450 | 450 | ||||||||||
| Great Lakes | Muskegon | MI | 470 | 470 | ||||||||||
| Jefferson Beach | St. Clair Shores | MI | 900 | 900 | ||||||||||
| Toledo Beach | La Salle | MI | 580 | 470 | ||||||||||
| Tower Marine | Douglas | MI | 480 | 480 | ||||||||||
| Michigan Total | 3,900 | 3,790 | ||||||||||||
| Ohio | ||||||||||||||
| Lakefront | Port Clinton | OH | 490 | 490 | ||||||||||
| Sandusky | Sandusky | OH | 550 | 550 | ||||||||||
| Ohio Total | 1,040 | 1,040 | ||||||||||||
| WEST | ||||||||||||||
| California | ||||||||||||||
| Anacapa Isle | Oxnard | CA | 540 | 540 | ||||||||||
| Ballena Isle | Alameda | CA | 420 | 420 | ||||||||||
45
SUN COMMUNITIES, INC.
| Marina Property Name | City | State / Municipal | Wet Slips and Dry Storage Spaces as of 12/31/2023 | Wet Slips and Dry Storage Spaces as of 12/31/2022 | ||||||||||
| Bayfront | Chula Vista | CA | 620 | 620 | ||||||||||
| Cabrillo Isle | San Diego | CA | 540 | 540 | ||||||||||
| Emeryville | Emeryville | CA | 460 | 460 | ||||||||||
| Loch Lomond | San Rafael | CA | 530 | 530 | ||||||||||
| Marina Bay Yacht Harbor | Richmond | CA | 800 | 800 | ||||||||||
| Shelter Island | San Diego | CA | 60 | 60 | ||||||||||
| South Bay | Chula Vista | CA | 560 | 560 | ||||||||||
| Sunroad | San Diego | CA | 650 | 650 | ||||||||||
| Ventura Isle | Ventura | CA | 530 | 530 | ||||||||||
| California Total | 5,710 | 5,710 | ||||||||||||
| COMPANY TOTAL | 48,030 | 47,820 | ||||||||||||
(1)Wet slips and dry storage spaces from Dauntless Shipyard and Essex Island are grouped into Dauntless.
(2)Wet slips and dry storage spaces from Harbor House are grouped into Yacht Haven.
(3)Wet slips and dry storage spaces from Apponaug Harbor are grouped into Cowesett.
(4)Wet slips and dry storage spaces from Island Park are grouped into Sakonnet.
(5)Wet slips and dry storage spaces from Wickford are grouped into Wickford Cove.
(6)Wet slips and dry storage spaces from Stirling are grouped into Greenport.
(7)Wet slips and dry storage spaces from Harrison Yacht Yard are grouped into Narrows Point.
(8)Property acquired during year ended December 31, 2023.
(9)Wet slips and dry storage spaces from South Fork are grouped into Lauderdale Marine Center.
(10)Property is temporarily used to store hurricane-affected vessels, which will be converted to a development site.
(11)Wet slips and dry storage spaces from Ashley Fuels are grouped into Charleston City.
46
SUN COMMUNITIES, INC.
ITEM 3. LEGAL PROCEEDINGS
Legal Proceedings
We are involved in various legal proceedings. Refer to Note 17, "Commitments and Contingencies," in our accompanying Notes to the Consolidated Financial Statements.
Environmental Matters
Item 103 of Regulation S-K requires disclosure of certain environmental matters when a governmental authority is a party to the proceedings and such proceedings involve potential monetary sanctions that we reasonably believe will exceed an applied threshold not to exceed $1.0 million. Applying this threshold, there are no environmental matters to disclose for the year ended December 31, 2023.
ITEM 4. MINE SAFETY DISCLOSURES
Not applicable.
47
SUN COMMUNITIES, INC.
PART II
ITEM 5. MARKET FOR REGISTRANT'S COMMON EQUITY, RELATED SHAREHOLDER MATTERS AND ISSUER
PURCHASES OF EQUITY SECURITIES
Market Information
Our common stock has been listed on the New York Stock Exchange ("NYSE") since December 8, 1993, and trades under the symbol "SUI." On February 20, 2024, the closing share price of our common stock was $130.85 per share on the NYSE, and there were 659 holders of record of 124,412,183 outstanding shares of common stock.
On February 20, 2024, the following OP units of the Operating Partnership were outstanding:
| OP Units | OP Units Issued and Outstanding | Exchangeable Shares of Common Stock | ||||||||||||
| Series A-1 preferred OP units | 192,112 | 468,566 | ||||||||||||
| Series A-3 preferred OP units | 40,268 | 74,917 | ||||||||||||
| Series C preferred OP units | 305,748 | 339,380 | ||||||||||||
| Series D preferred OP units | 488,958 | 391,166 | ||||||||||||
| Series E preferred OP units | 80,000 | 55,172 | ||||||||||||
| Series F preferred OP units | 90,000 | 56,250 | ||||||||||||
| Series G preferred OP units | 205,812 | 132,782 | ||||||||||||
| Series H preferred OP units | 581,229 | 354,408 | ||||||||||||
| Series J preferred OP units | 238,000 | 144,242 | ||||||||||||
| Series K preferred OP units | 1,000,000 | 588,235 | ||||||||||||
| Series L preferred OP units | 20,000 | 12,500 | ||||||||||||
| Common OP units | 2,694,232 | 2,694,232 | ||||||||||||
| Total | 5,936,359 | 5,311,850 | ||||||||||||
We have historically paid regular quarterly distributions to holders of our common stock and common OP units. In addition, we are obligated to make distributions to holders of each series of our preferred OP units. See "Structure of the Company" under Part I, Item 1 of this Annual Report on Form 10-K. Our ability to make distributions on our common stock and preferred OP units, payments on our indebtedness and to fund planned capital expenditures will depend on our ability to generate cash in the future. The decision to declare and pay distributions on shares of our common stock and common OP units in the future, as well as the timing, amount and composition of any such future distributions, will be at the sole discretion of our Board of Directors in light of conditions then existing, including our earnings, financial condition, capital requirements, debt maturities, the availability of debt and equity capital, applicable REIT and legal restrictions, general overall economic conditions and other factors.
Securities Authorized for Issuance Under Equity Compensation Plans
The following table reflects information about the securities authorized for issuance under our equity compensation plans as of December 31, 2023:
| Number of securities to be issued upon exercise of outstanding options, warrants and rights | Weighted-average exercise price of outstanding options, warrants and rights | Number of shares of common stock remaining available for future issuance under equity compensation plans (excluding securities reflected in column a) | ||||||||||||||||||
| Plan Category | (a) | (b) | (c) | |||||||||||||||||
| Equity compensation plans approved by shareholders | — | $ | — | 2,955,866 | ||||||||||||||||
Total | — | $ | — | 2,955,866 | ||||||||||||||||
48
SUN COMMUNITIES, INC.
Recent Sales of Unregistered Securities
From time to time, we may issue shares of common stock or common OP units in exchange for OP units in accordance with the terms and provisions of the limited partnership agreement of the Operating Partnership. Such shares are issued based on the exchange ratios and formulas described in "Structure of the Company" under Part I, Item 1 of this Annual Report on Form 10-K. Below is the activity of conversions for the three months and year ended December 31, 2023:
| Three Months Ended | Year Ended | |||||||||||||||||||||||||||||||||||||||||||
| December 31, 2023 | December 31, 2023 | |||||||||||||||||||||||||||||||||||||||||||
| Series | Conversion Rate | Units / Shares Converted | Common Stock(1) | Common OP Units(1) | Units / Shares Converted | Common Stock(1) | Common OP Units(1) | |||||||||||||||||||||||||||||||||||||
| Aspen preferred OP units | Various(2) | 314,934 | — | 102,615 | 1,258,819 | 113,972 | 293,838 | |||||||||||||||||||||||||||||||||||||
| Common OP units | 1.0000 | — | — | — | 8,848 | 8,848 | — | |||||||||||||||||||||||||||||||||||||
| Series A-1 preferred OP units | 2.4390 | — | — | — | 5,404 | 13,177 | — | |||||||||||||||||||||||||||||||||||||
| Series C preferred OP units | 1.1100 | — | — | — | 165 | 183 | — | |||||||||||||||||||||||||||||||||||||
| Series G preferred OP units | 0.6452 | — | — | — | 30,000 | 19,353 | — | |||||||||||||||||||||||||||||||||||||
| Series H preferred OP units | 0.6098 | — | — | — | 129 | 78 | — | |||||||||||||||||||||||||||||||||||||
| Series J preferred OP units | 0.6061 | — | — | — | 2,000 | 1,212 | — | |||||||||||||||||||||||||||||||||||||
(1) Calculation may yield minor differences due to rounding incorporated in the above numbers.
(2) Refer to Note 9, "Debt and Line of Credit," for additional detail on Aspen preferred OP unit conversions.
All of the securities described above were issued in private placements in reliance on Section 4(a)(2) of the Securities Act, including Regulation D promulgated thereunder. No underwriters were used in connection with any of such issuances.
Purchases of Equity Securities
The following table summarizes our common stock repurchases during the three months ended December 31, 2023:
| Total number of shares purchased | Average price paid per share | Total number of shares purchased as part of publicly announced plans or programs | Maximum number (or approximate dollar value) of shares that may yet be purchased under the plans or programs | |||||||||||||||||||||||
| Period | (a) | (b) | (c) | (d) | ||||||||||||||||||||||
| October 1, 2023 - October 31, 2023 | 6,212 | $ | 109.24 | — | $ | — | ||||||||||||||||||||
| November 1, 2023 - November 30, 2023 | — | $ | — | — | $ | — | ||||||||||||||||||||
| December 1, 2023 - December 31, 2023 | — | $ | — | — | $ | — | ||||||||||||||||||||
| Total | 6,212 | $ | 109.24 | — | $ | — | ||||||||||||||||||||
During the three months ended December 31, 2023, we withheld 6,212 shares from employees to satisfy estimated statutory income tax obligations related to vesting of restricted stock awards. The value of the common stock withheld was based on the closing price of our common stock on the applicable vesting date.
Performance Graph
Set forth below is a line graph comparing the yearly percentage change in the cumulative total shareholder return on our common stock against the cumulative total return of a broad market index composed of all issuers listed on the NYSE and an industry index comprised of 20 publicly traded REITs, for the five year period ending on December 31, 2023. This line graph assumes a $100.00 investment on December 31, 2018, a reinvestment of distributions and actual increase of the market value of our common stock relative to an initial investment of $100.00. The comparisons in this table are required by the SEC and are not intended to forecast or be indicative of possible future performance of our common stock.
49
SUN COMMUNITIES, INC.
Peer Group
We utilize peer group data for quantitative benchmarking against external market participants. We select our peer group based on a number of quantitative and qualitative factors including, but not limited to, revenues, total assets, market capitalization, industry, sub-industry, location, total shareholder return history, executive compensation components and peer decisions made by other companies. From time to time, we update our peer group based on analysis of the aforementioned factors and application of judgment.
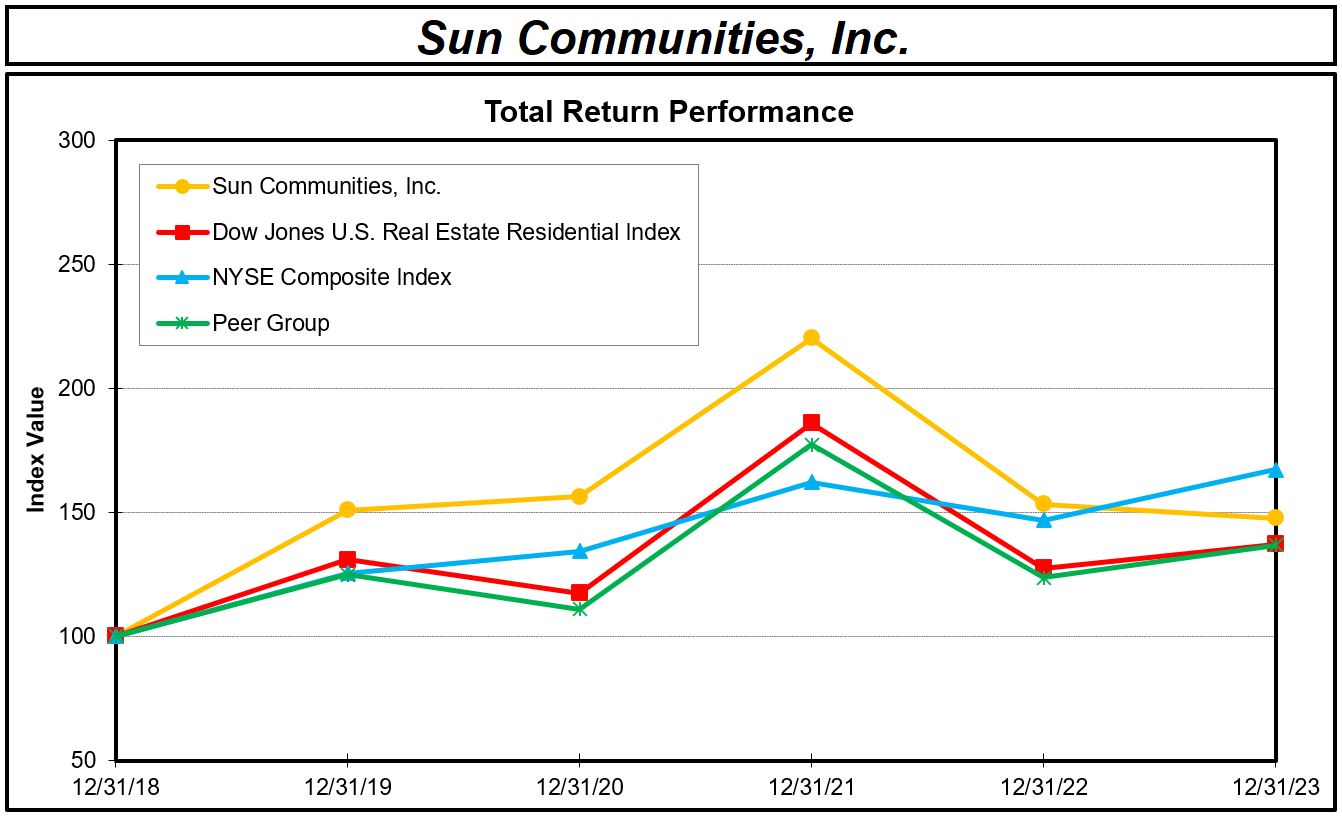
| Year Ended | ||||||||||||||||||||||||||||||||||||||
| Index | December 31, 2018 | December 31, 2019 | December 31, 2020 | December 31, 2021 | December 31, 2022 | December 31, 2023 | ||||||||||||||||||||||||||||||||
| Sun Communities, Inc. | $ | 100.00 | $ | 150.91 | $ | 156.32 | $ | 220.08 | $ | 153.35 | $ | 147.52 | ||||||||||||||||||||||||||
| Dow Jones U.S. Real Estate Residential Index | $ | 100.00 | $ | 130.83 | $ | 117.40 | $ | 185.93 | $ | 127.48 | $ | 137.08 | ||||||||||||||||||||||||||
| NYSE Composite Index | $ | 100.00 | $ | 125.51 | $ | 134.28 | $ | 162.04 | $ | 146.89 | $ | 167.12 | ||||||||||||||||||||||||||
SUI Peer Group(1) | $ | 100.00 | $ | 124.90 | $ | 110.87 | $ | 177.26 | $ | 123.58 | $ | 136.72 | ||||||||||||||||||||||||||
(1)SUI Peer Group includes: AvalonBay Communities, Inc., Camden Property Trust, CubeSmart, Equity Lifestyle Properties, Inc., Equity Residential, Essex Property Trust, Inc., Extra Space Storage Inc., Federal Realty Investment Trust, Invitation Homes Inc., Mid-America Apartment Communities, Inc., UDR, Inc. and Ventas, Inc.
The information included under the heading "Performance Graph" is not to be treated as "soliciting material" or as "filed" with the SEC, and is not incorporated by reference into any filing by the Company under the Securities Act or the Exchange Act that is made on, before or after the date of filing of this Annual Report on Form 10-K.
50
SUN COMMUNITIES, INC.
ITEM 6. [Reserved]
51
SUN COMMUNITIES, INC.
ITEM 7. MANAGEMENT'S DISCUSSION AND ANALYSIS OF FINANCIAL CONDITION AND RESULTS OF
OPERATIONS
The following discussion and analysis of the consolidated financial condition and results of operations should be read in conjunction with the Consolidated Financial Statements and accompanying footnotes thereto included in this Annual Report on Form 10-K. In addition to the results presented in accordance with GAAP below, we have provided NOI and FFO information as supplemental performance measures. Refer to Non-GAAP Financial Measures in this Item 7 for additional information.
OVERVIEW
We are a fully integrated REIT. As of December 31, 2023, we owned and operated, directly or indirectly, or had an interest in, a portfolio of 667 developed properties located in the U.S., the UK, and Canada, including 353 MH communities, 179 RV communities and 135 marinas. We have been in the business of acquiring, operating, developing and expanding MH and RV communities since 1975 and marinas since 2020. We lease individual sites with utilities access for placement of manufactured homes, RVs or boats to our customers. We are also engaged in the marketing, selling and leasing of new and pre-owned homes to current and future residents in our MH communities in the U.S. and in the sale of holiday home and associated site license activities to holiday homeowners in our MH communities in the UK. The Rental Program operations within our MH communities support and enhance our occupancy levels, property performance and cash flows.
Catastrophic Event-Related Charges - Hurricane Ian
In September 2022, Hurricane Ian made landfall on Florida's western coast. The storm primarily affected three RV properties in the Fort Myers area, comprising approximately 2,500 sites. These properties sustained significant flooding and wind damage from the hurricane. At other affected MH and RV properties, most of the damage was limited to trees, roofs, fences, skirting and carports. At affected marina properties, docks, buildings, and landscaping sustained wind and water damage.
We maintain property, casualty, flood and business interruption insurance for our community portfolio, subject to customary deductibles and limits. As of December 31, 2023, estimated insurance recoveries, excluding business interruption recoveries, of $56.7 million related to Hurricane Ian were recorded in Notes and other receivables, net on the Consolidated Balance Sheets.
Changes in estimated insurance recoveries related to Hurricane Ian during the year ended December 31, 2023 were primarily the result of $51.5 million of incremental costs that exceeded the applicable deductible, net of a $4.8 million reduction due to a decrease in estimated property losses. The foregoing estimates are based on current information available, and we continue to assess these estimates. Actual charges and insurance recoveries could vary significantly from these estimates. Any changes to these estimates will be recognized in the period(s) in which they are determined.
We are actively working with our insurance providers on claims for business interruption recoveries. During the year ended December 31, 2023, we recognized $20.2 million, net of deductibles, for the lost earnings covering the date of the hurricane event through August 31, 2023. These recoveries were included in Brokerage commissions and other, net on our Consolidated Statements of Operations during the year ended December 31, 2023. The related communities are under redevelopment. As such, we currently cannot estimate a date when operating results will be restored to pre-hurricane levels. Our business interruption insurance policy provides for up to 60 months of coverage from the date of restoration.
52
SUN COMMUNITIES, INC.
EXECUTIVE SUMMARY
2023 General Overview
•Total revenues for 2023 increased 8.6% to $3.2 billion.
•Achieved annual Core FFO of $7.10 per diluted share and OP unit.
•Achieved Real property Same Property NOI growth of 6.8% for MH, 4.8% for RV and 11.7% for Marina over 2022.
•Increased Same Property adjusted blended occupancy for MH and RV by 230 basis points to 98.9% as compared to 96.6% in 2022.
•Achieved 10-year total shareholder return of 323.1%, outperforming the MSCI US REIT, Russell 1000, U.S. REIT Residential and S&P 500 indexes.
•Completed the construction of over 800 total sites at five ground-up developments and 14 expansion and re-development properties.
•Completed acquisition investments of $368.7 million which represents the purchase price paid for operating properties and land parcels for future ground-up development and expansion activities, plus any capital improvements identified during due diligence needed to bring acquired properties up to the Company's operating standards.
•Closed $836.9 million of debt transactions, including an offering of underwritten senior unsecured notes of $400.0 million for net proceeds of $395.3 million which was used to pay down amounts drawn under our senior credit facility (the "Senior Credit Facility").
•Entered into derivative instruments with an aggregate notional value of $582.3 million to hedge interest rate risk associated with borrowings under our Senior Credit Facility and future debt issuance.
•Completed the sale of our 41.8 million share position in Ingenia Communities Group, generating $102.5 million of net proceeds, which was used to pay down amounts drawn under our Senior Credit Facility.
•Completed the transfer of an installment note receivable portfolio to an unrelated entity, generating net proceeds of $53.4 million that were used to pay down borrowings under our Senior Credit Facility.
•Simplified the structure of certain of our consolidated variable interest entities in a transaction with our joint venture partner.
Property Operations
Occupancy in our MH and annual RV properties, as well as our ability to increase rental rates, directly affect revenues. Our revenue streams are predominantly derived from customers renting our sites on a long-term basis. Our Same Property communities continue to achieve revenue and occupancy increases which drive continued NOI growth. Our Same Property marinas achieved revenue increases which contributed to our NOI growth.
| Year Ended | ||||||||||||||||||||
| Portfolio Information: | December 31, 2023 | December 31, 2022 | December 31, 2021 | |||||||||||||||||
Occupancy % - Total Portfolio - MH and Annual RV Occupancy(1) | 96.4 | % | 96.0 | % | 97.4 | % | ||||||||||||||
Occupancy % - Same Property - Adjusted MH and Annual RV Occupancy(1)(2)(3) | 98.9 | % | 96.6 | % | 96.8 | % | ||||||||||||||
| Core FFO per share | $ | 7.10 | $ | 7.35 | $ | 6.51 | ||||||||||||||
Real property NOI - Total Portfolio (in millions) | $ | 1,251.9 | $ | 1,167.0 | $ | 1,002.6 | ||||||||||||||
Real property NOI - Same Property (in millions) - MH, RV and Marina(3) | $ | 1,139.1 | $ | 1,061.9 | $ | 928.0 | ||||||||||||||
| Home sales volume - North America | 2,565 | 3,212 | 4,088 | |||||||||||||||||
Home sales volume - United Kingdom(4) | 2,857 | 2,343 | N/A | |||||||||||||||||
(1) Occupancy percent includes annual RV sites and excludes transient RV sites.
(2) Occupancy percent excludes recently completed but vacant expansion sites.
(3) Same Property is based on the reported year end Same Property count for each respective year.
(4) UK amounts for the year ended December 31, 2022 cover the period from April 8, 2022 (date of acquisition) through December 31, 2022.
53
SUN COMMUNITIES, INC.
Acquisition Activity
During the year ended December 31, 2023, we acquired one MH community with 68 sites and 72 development sites, and one marina with 24 wet slips and dry storage spaces, for a total purchase price of approximately $107.0 million. Refer to Note 3, "Real Estate Acquisitions and Dispositions," for details of our acquisition activities.
Disposition Activity
Management continually evaluates properties within the portfolio for potential disposition opportunities. When a given property no longer fits our desired growth profile, we seek to redeploy capital to properties and geographies fit to provide greater future returns. From time to time, strategic reductions to the portfolio are necessary to reduce exposure to less desirable locations and support long-term positioning of the Company.
During the year ended December 31, 2023, we sold one MH community located in Maine, with 155 sites for $6.8 million. In addition, we sold two parcels of land in the UK for total consideration of $111.5 million, which primarily consisted of $108.8 million in the form of an operator note receivable and subsequently reacquired these two parcels of land at fair value as part of the settlement of the related note receivable, with no remeasurement gain or loss recognized. Also, as part of a broader transaction with our joint venture partners in Sun NG, we disposed of our majority equity interest in three consolidated joint venture properties. The three RV communities had 955 developed sites. Refer to Note 3, "Real Estate Acquisitions and Dispositions," for details on the disposition activities, Note 4, "Notes and Other Receivables," for additional information on the settlement of the notes receivable, and Note 8, "Consolidated Variable Interest Entities," for more information on the Sun NG transaction.
Real Estate Held For Sale - Changes to a Plan of Sale
We periodically classify real estate as held for sale after an active program to sell an asset has commenced and when the sale is probable. Subsequent to the classification of assets as held for sale, no further depreciation expense is recorded.
In February 2023, the criteria was met to classify Sandy Bay, an operating MH community in the UK, with 730 developed sites, as held for sale. Previously, this property had been under contract. At December 31, 2023, the sale contract was no longer in effect, and due to an unexpected change in circumstance related to the counterparty, we reclassified the property as held for use and recorded the related depreciation and amortization expense in accordance with ASC Topic 360, "Property, Plant, and Equipment" during the three months ended December 31, 2023. Refer to Note 3, "Real Estate Acquisitions and Dispositions," for additional information.
Development and Expansion Activities
We have been focused selectively on property ground-up developments and expansion opportunities adjacent to our existing properties.
Ground-up Developments - During the year ended December 31, 2023, we delivered 360 total sites at five ground-up development properties located in Florida, Michigan and Colorado. We have developed over 2,230 sites within the past three years.
Expansions - During the year ended December 31, 2023, we expanded over 440 total sites at 14 properties. We have developed over 2,170 expansion sites within the past three years.
We continue to expand our properties utilizing our inventory of owned and entitled land. We have approximately 17,980 MH and RV sites suitable for future development.
54
SUN COMMUNITIES, INC.
Markets
Our MH and RV properties are largely concentrated in the U.S. in Florida, Michigan, Texas and California, and in the UK, which collectively contain 66.3% of our total MH and RV sites. We have expanded our market share in multiple states through recent acquisitions and increased our property holdings in high-growth areas of the U.S. including retirement and vacation destinations.
The age demographic of RV communities is attractive, as the population of retirement age adults in the U.S. is growing. RV communities have become a trending vacation opportunity not only for the retiree population, but as an affordable vacation alternative for families and millennials.
The following table identifies our MH and RV markets by total sites:
| December 31, 2023 | December 31, 2022 | |||||||||||||||||||||||||||||||||||||
| Major Market | Number of Properties | Total Sites | % of Total Sites | Number of Properties | Total Sites | % of Total Sites | ||||||||||||||||||||||||||||||||
| Florida | 129 | 44,410 | 24.8 | % | 129 | 44,280 | 24.7 | % | ||||||||||||||||||||||||||||||
| Michigan | 85 | 33,500 | 18.7 | % | 84 | 33,220 | 18.5 | % | ||||||||||||||||||||||||||||||
| Texas | 29 | 10,820 | 6.0 | % | 31 | 11,340 | 6.3 | % | ||||||||||||||||||||||||||||||
| California | 37 | 8,800 | 4.9 | % | 37 | 8,800 | 4.9 | % | ||||||||||||||||||||||||||||||
| Arizona | 13 | 5,510 | 3.1 | % | 13 | 5,520 | 3.1 | % | ||||||||||||||||||||||||||||||
| Ontario, Canada | 16 | 5,180 | 2.9 | % | 16 | 5,240 | 2.9 | % | ||||||||||||||||||||||||||||||
| Indiana | 12 | 4,180 | 2.3 | % | 12 | 4,180 | 2.3 | % | ||||||||||||||||||||||||||||||
| New Jersey | 11 | 4,040 | 2.3 | % | 11 | 4,040 | 2.3 | % | ||||||||||||||||||||||||||||||
| Colorado | 11 | 3,890 | 2.2 | % | 11 | 3,790 | 2.1 | % | ||||||||||||||||||||||||||||||
| Maine | 15 | 3,540 | 2.0 | % | 16 | 3,660 | 2.0 | % | ||||||||||||||||||||||||||||||
| Virginia | 10 | 3,450 | 1.9 | % | 10 | 3,450 | 1.9 | % | ||||||||||||||||||||||||||||||
| Ohio | 9 | 2,980 | 1.7 | % | 9 | 2,930 | 1.6 | % | ||||||||||||||||||||||||||||||
| New York | 10 | 2,940 | 1.6 | % | 10 | 2,940 | 1.6 | % | ||||||||||||||||||||||||||||||
| South Carolina | 6 | 2,620 | 1.5 | % | 6 | 2,620 | 1.5 | % | ||||||||||||||||||||||||||||||
| Illinois | 5 | 2,240 | 1.2 | % | 5 | 2,230 | 1.2 | % | ||||||||||||||||||||||||||||||
| New Hampshire | 9 | 2,170 | 1.2 | % | 10 | 2,380 | 1.3 | % | ||||||||||||||||||||||||||||||
| Connecticut | 16 | 2,000 | 1.1 | % | 16 | 2,010 | 1.1 | % | ||||||||||||||||||||||||||||||
| Delaware | 5 | 1,980 | 1.1 | % | 5 | 1,980 | 1.1 | % | ||||||||||||||||||||||||||||||
| Maryland | 6 | 1,860 | 1.0 | % | 6 | 1,860 | 1.0 | % | ||||||||||||||||||||||||||||||
| Pennsylvania | 5 | 1,540 | 0.9 | % | 5 | 1,540 | 0.9 | % | ||||||||||||||||||||||||||||||
| Georgia | 4 | 1,420 | 0.8 | % | 4 | 1,420 | 0.8 | % | ||||||||||||||||||||||||||||||
| Oregon | 6 | 1,380 | 0.8 | % | 6 | 1,380 | 0.8 | % | ||||||||||||||||||||||||||||||
| North Carolina | 5 | 1,180 | 0.7 | % | 5 | 1,180 | 0.7 | % | ||||||||||||||||||||||||||||||
| Utah | 6 | 930 | 0.5 | % | 6 | 930 | 0.5 | % | ||||||||||||||||||||||||||||||
| Massachusetts | 3 | 920 | 0.5 | % | 3 | 920 | 0.5 | % | ||||||||||||||||||||||||||||||
| Washington | 2 | 780 | 0.4 | % | 2 | 780 | 0.4 | % | ||||||||||||||||||||||||||||||
| Wisconsin | 2 | 590 | 0.3 | % | 2 | 590 | 0.3 | % | ||||||||||||||||||||||||||||||
| Tennessee | 2 | 550 | 0.3 | % | 2 | 540 | 0.3 | % | ||||||||||||||||||||||||||||||
| Alabama | 1 | 500 | 0.3 | % | 1 | 500 | 0.3 | % | ||||||||||||||||||||||||||||||
| Minnesota | 1 | 470 | 0.3 | % | 1 | 480 | 0.3 | % | ||||||||||||||||||||||||||||||
| Iowa | 1 | 410 | 0.2 | % | 1 | 410 | 0.2 | % | ||||||||||||||||||||||||||||||
| Kentucky | 1 | 330 | 0.2 | % | 1 | 330 | 0.2 | % | ||||||||||||||||||||||||||||||
| Louisiana | 1 | 330 | 0.2 | % | 1 | 330 | 0.2 | % | ||||||||||||||||||||||||||||||
| Nevada | 1 | 320 | 0.2 | % | 1 | 320 | 0.2 | % | ||||||||||||||||||||||||||||||
| Mississippi | 1 | 160 | 0.1 | % | 1 | 150 | 0.1 | % | ||||||||||||||||||||||||||||||
| Montana | 1 | 80 | — | % | 1 | 80 | — | % | ||||||||||||||||||||||||||||||
| North American Total | 477 | 158,000 | 88.1 | % | 480 | 158,350 | 88.2 | % | ||||||||||||||||||||||||||||||
| United Kingdom | 55 | 21,310 | 11.9 | % | 55 | 21,180 | 11.8 | % | ||||||||||||||||||||||||||||||
| Total | 532 | 179,310 | 100.0 | % | 535 | 179,530 | 100.0 | % | ||||||||||||||||||||||||||||||
55
SUN COMMUNITIES, INC.
The following table identifies our marina markets by total wet slips and dry storage spaces:
| December 31, 2023 | December 31, 2022 | |||||||||||||||||||||||||||||||||||||
| Major Market | Number of Properties | Wet Slips and Dry Storage Spaces | % Wet Slips and Dry Storage Spaces | Number of Properties | Wet Slips and Dry Storage Spaces | % Wet Slips and Dry Storage Spaces | ||||||||||||||||||||||||||||||||
| California | 11 | 5,710 | 11.9 | % | 11 | 5,710 | 11.9 | % | ||||||||||||||||||||||||||||||
| Florida | 21 | 5,200 | 10.8 | % | 21 | 5,050 | 10.6 | % | ||||||||||||||||||||||||||||||
| Michigan | 7 | 3,900 | 8.1 | % | 7 | 3,790 | 7.9 | % | ||||||||||||||||||||||||||||||
| Rhode Island | 12 | 3,460 | 7.2 | % | 12 | 3,420 | 7.2 | % | ||||||||||||||||||||||||||||||
| Connecticut | 11 | 3,330 | 6.9 | % | 11 | 3,330 | 7.0 | % | ||||||||||||||||||||||||||||||
| New York | 9 | 3,020 | 6.3 | % | 9 | 3,020 | 6.3 | % | ||||||||||||||||||||||||||||||
| Georgia | 5 | 2,860 | 6.0 | % | 4 | 2,840 | 5.9 | % | ||||||||||||||||||||||||||||||
| North Carolina | 7 | 2,660 | 5.5 | % | 7 | 2,660 | 5.6 | % | ||||||||||||||||||||||||||||||
| Massachusetts | 9 | 2,520 | 5.2 | % | 9 | 2,520 | 5.3 | % | ||||||||||||||||||||||||||||||
| Maryland | 9 | 2,480 | 5.2 | % | 9 | 2,630 | 5.5 | % | ||||||||||||||||||||||||||||||
| Kentucky | 5 | 2,370 | 4.9 | % | 5 | 2,370 | 5.0 | % | ||||||||||||||||||||||||||||||
| Texas | 3 | 2,060 | 4.3 | % | 3 | 2,060 | 4.3 | % | ||||||||||||||||||||||||||||||
| South Carolina | 8 | 1,820 | 3.8 | % | 8 | 1,820 | 3.8 | % | ||||||||||||||||||||||||||||||
| Puerto Rico | 1 | 1,610 | 3.4 | % | 1 | 1,610 | 3.4 | % | ||||||||||||||||||||||||||||||
| Ohio | 2 | 1,040 | 2.2 | % | 2 | 1,040 | 2.2 | % | ||||||||||||||||||||||||||||||
| Alabama | 1 | 760 | 1.6 | % | 1 | 720 | 1.5 | % | ||||||||||||||||||||||||||||||
| Mississippi | 1 | 590 | 1.2 | % | 1 | 590 | 1.2 | % | ||||||||||||||||||||||||||||||
| Arkansas | 1 | 580 | 1.2 | % | 1 | 580 | 1.2 | % | ||||||||||||||||||||||||||||||
| Virginia | 2 | 420 | 0.9 | % | 2 | 420 | 0.9 | % | ||||||||||||||||||||||||||||||
| New Jersey | 2 | 410 | 0.9 | % | 2 | 410 | 0.9 | % | ||||||||||||||||||||||||||||||
| Tennessee | 2 | 390 | 0.8 | % | 2 | 390 | 0.8 | % | ||||||||||||||||||||||||||||||
| Maine | 3 | 250 | 0.5 | % | 3 | 250 | 0.5 | % | ||||||||||||||||||||||||||||||
| New Hampshire | 1 | 220 | 0.5 | % | 1 | 220 | 0.5 | % | ||||||||||||||||||||||||||||||
| Vermont | 1 | 210 | 0.4 | % | 1 | 210 | 0.4 | % | ||||||||||||||||||||||||||||||
| Oklahoma | 1 | 160 | 0.3 | % | 1 | 160 | 0.3 | % | ||||||||||||||||||||||||||||||
| 135 | 48,030 | 134 | 47,820 | |||||||||||||||||||||||||||||||||||
56
SUN COMMUNITIES, INC.
NON-GAAP FINANCIAL MEASURES
In addition to the results reported in accordance with GAAP in our "Results of Operations" below, we have provided information regarding net operating income ("NOI") and funds from operations ("FFO") as supplemental performance measures. We believe NOI and FFO are appropriate measures given their wide use by and relevance to investors and analysts following the real estate industry. NOI provides a measure of rental operations and does not factor in depreciation, amortization and non-property specific expenses such as general and administrative expenses. FFO, reflecting the assumption that real estate values rise or fall with market conditions, principally adjusts for the effects of GAAP depreciation / amortization of real estate assets. In addition, NOI and FFO are commonly used in various ratios, pricing multiples / yields and returns and valuation calculations used to measure financial position, performance and value.
NOI
Total Portfolio NOI - NOI is derived from property operating revenues minus property operating expenses and real estate taxes. NOI is a non-GAAP financial measure that we believe is helpful to investors as a supplemental measure of operating performance because it is an indicator of the return on property investment and provides a method of comparing property performance over time. We use NOI as a key measure when evaluating performance and growth of particular properties and / or groups of properties. The principal limitation of NOI is that it excludes depreciation, amortization, interest expense and non-property specific expenses such as general and administrative expenses, all of which are significant costs. Therefore, NOI is a measure of the operating performance of our properties rather than of the Company overall. We believe that NOI provides enhanced comparability for investor evaluation of properties' performance and growth over time.
We believe that GAAP net income (loss) is the most directly comparable measure to NOI. NOI should not be considered to be an alternative to GAAP net income (loss) as an indication of our financial performance or GAAP cash flow from operating activities as a measure of our liquidity; nor is it indicative of funds available for our cash needs, including our ability to make cash distributions. Because of the inclusion of items such as interest, depreciation and amortization, the use of GAAP net income (loss) as a performance measure is limited as these items may not accurately reflect the actual change in market value of a property, in the case of depreciation and in the case of interest, may not necessarily be linked to the operating performance of a real estate asset, as it is often incurred at a parent company level and not at a property level.
Same Property NOI - This is a management tool used when evaluating the performance and growth of our Same Property portfolio. We define same properties as those we have owned and operated continuously since January 1, 2022. Same properties exclude ground-up development properties, acquired properties and properties sold after December 31, 2021. The Same Property data may change from time-to-time depending on acquisitions, dispositions, management discretion, significant transactions or unique situations. Same Property NOI does not include the revenues and expenses related to home sales, and service, retail, dining and entertainment activities at the properties. We believe that Same Property NOI is helpful to investors as a supplemental comparative performance measure of the income generated from the Same Property portfolio from one period to the next.
FFO
FFO is defined by the National Association of Real Estate Investment Trusts ("NAREIT") as GAAP net income (loss), excluding gains (or losses) from sales of depreciable operating property, plus real estate related depreciation and amortization, real estate related impairments, and after adjustments for unconsolidated partnerships and joint ventures. FFO is a non-GAAP financial measure that management believes is a useful supplemental measure of our operating performance. By excluding gains and losses related to sales of previously depreciated operating real estate assets, real estate related to impairment and real estate asset depreciation and amortization (which can vary among owners of identical assets in similar condition based on historical cost accounting and useful life estimates), FFO provides a performance measure that, when compared period-over-period, reflects the impact to operations from trends in occupancy rates, rental rates, and operating costs, providing perspective not readily apparent from GAAP net income (loss). Management believes the use of FFO has been beneficial in improving the understanding of operating results of REITs among the investing public and making comparisons of REIT operating results more meaningful.
Core FFO - In addition, we use FFO excluding certain gain and loss items that management considers unrelated to the operational and financial performance of our core business ("Core FFO").
57
SUN COMMUNITIES, INC.
We believe that FFO and Core FFO provide enhanced comparability for investor evaluations of period-over-period results. We believe that GAAP net income (loss) is the most directly comparable measure to FFO. The principal limitation of FFO is that it does not replace GAAP net income (loss) as a financial performance measure or GAAP cash flow from operating activities as a measure of our liquidity. Because FFO excludes significant economic components of GAAP net income (loss) including depreciation and amortization, FFO should be used as a supplement to GAAP net income (loss) and not as an alternative to it. Furthermore, FFO is not intended as a measure of a REIT's ability to meet debt principal repayments and other cash requirements, nor as a measure of working capital. FFO is calculated in accordance with our interpretation of standards established by NAREIT, which may not be comparable to FFO reported by other REITs that interpret the NAREIT definition differently.
58
SUN COMMUNITIES, INC.
RESULTS OF OPERATIONS
Summary Statements of Operations
The following tables reconcile the Net Income / (Loss) attributable to Sun Communities, Inc. common shareholders to NOI and summarize our consolidated financial results for the years ended December 31, 2023, 2022 and 2021 (in millions):
| Year Ended | ||||||||||||||||||||
| December 31, 2023 | December 31, 2022 | December 31, 2021 | ||||||||||||||||||
| Net income / (loss) attributable to SUI common shareholders | $ | (213.3) | $ | 242.0 | $ | 380.2 | ||||||||||||||
| Interest income | (45.4) | (35.2) | (12.2) | |||||||||||||||||
| Brokerage commissions and other revenues, net | (60.6) | (34.9) | (30.2) | |||||||||||||||||
| General and administrative | 270.2 | 256.8 | 181.3 | |||||||||||||||||
| Catastrophic event-related charges, net | 3.8 | 17.5 | 2.2 | |||||||||||||||||
| Business combinations | 3.0 | 24.7 | 1.4 | |||||||||||||||||
| Depreciation and amortization | 660.0 | 601.8 | 522.7 | |||||||||||||||||
| Asset impairments | 10.1 | 3.0 | — | |||||||||||||||||
| Goodwill impairment | 369.9 | — | — | |||||||||||||||||
Loss on extinguishment of debt (see Note 9) | — | 4.4 | 8.1 | |||||||||||||||||
| Interest expense | 325.8 | 229.8 | 158.6 | |||||||||||||||||
| Interest on mandatorily redeemable preferred OP units / equity | 3.3 | 4.2 | 4.2 | |||||||||||||||||
(Gain) / loss on remeasurement of marketable securities (see Note 15) | 16.0 | 53.4 | (33.5) | |||||||||||||||||
| (Gain) / loss on foreign currency exchanges | 0.3 | (5.4) | 3.7 | |||||||||||||||||
| Gain on disposition of properties | (11.0) | (12.2) | (108.1) | |||||||||||||||||
| Other expense, net | 7.5 | 2.1 | 12.1 | |||||||||||||||||
(Gain) / loss on remeasurement of notes receivable (see Note 4) | 106.7 | 0.8 | (0.7) | |||||||||||||||||
Income from nonconsolidated affiliates (see Note 7) | (16.0) | (2.9) | (4.0) | |||||||||||||||||
Loss on remeasurement of investment in nonconsolidated affiliates (see Note 7) | 4.2 | 2.7 | 0.2 | |||||||||||||||||
Current tax expense (see Note 13) | 14.5 | 10.3 | 1.2 | |||||||||||||||||
Deferred tax (benefit) / expense (see Note 13) | (22.9) | (4.2) | 0.1 | |||||||||||||||||
| Add: Preferred return to preferred OP units / equity interests | 12.3 | 11.0 | 12.1 | |||||||||||||||||
| Add: Income / (loss) attributable to noncontrolling interests | (8.1) | 10.8 | 21.5 | |||||||||||||||||
| NOI | $ | 1,430.3 | $ | 1,380.5 | $ | 1,120.9 | ||||||||||||||
| Year Ended | ||||||||||||||||||||
| December 31, 2023 | December 31, 2022 | December 31, 2021 | ||||||||||||||||||
| Real property NOI | $ | 1,251.9 | $ | 1,167.0 | $ | 1,002.6 | ||||||||||||||
| Home sales NOI | 124.5 | 154.6 | 74.4 | |||||||||||||||||
| Service, retail, dining and entertainment NOI | 53.9 | 58.9 | 43.9 | |||||||||||||||||
| NOI | $ | 1,430.3 | $ | 1,380.5 | $ | 1,120.9 | ||||||||||||||
59
SUN COMMUNITIES, INC.
Seasonality of Revenue
The RV and marina industries are seasonal in nature, and the results of operations in any one period may not be indicative of results in future periods.
In the RV segment, certain properties maintain higher occupancy during the summer months, while other properties maintain higher occupancy during the winter months. Based on the location of our properties with transient RV sites, our portfolio generally produces higher revenues between April and September than between October and March. The following table presents the seasonality of real property-transient revenue for the years ended December 31, 2023, 2022 and 2021:
| Real property - transient revenue (in millions) | For the Three Months Ended | ||||||||||||||||||||||||||||||||||
| Year | March 31 | June 30 | September 30 | December 31 | Total | ||||||||||||||||||||||||||||||
| 2023 | $ | 321.4 | 12.4 | % | 27.8 | % | 47.3 | % | 12.5 | % | 100.0 | % | |||||||||||||||||||||||
| 2022 | $ | 334.5 | 12.7 | % | 27.8 | % | 45.8 | % | 13.7 | % | 100.0 | % | |||||||||||||||||||||||
| 2021 | $ | 266.6 | 11.9 | % | 27.3 | % | 44.9 | % | 15.9 | % | 100.0 | % | |||||||||||||||||||||||
In the marina market, the majority of our wet slip and dry storage space leases have annual terms that are billed seasonally. Wet slip storage increases during the summer months for the boating season, whereas dry storage increases during the winter season as weather patterns require boat owners to store their vessels on dry docks or within covered racks. The following table presents the seasonality of Marina real property revenue for the years ended December 31, 2023, 2022 and 2021:
Seasonal real property revenue (in millions) | For the Three Months Ended | ||||||||||||||||||||||||||||||||||
| Year | March 31 | June 30 | September 30 | December 31 | Total | ||||||||||||||||||||||||||||||
| 2023 | $ | 348.7 | 20.8 | % | 25.9 | % | 28.6 | % | 24.7 | % | 100.0 | % | |||||||||||||||||||||||
| 2022 | $ | 310.2 | 20.1 | % | 25.6 | % | 29.0 | % | 25.3 | % | 100.0 | % | |||||||||||||||||||||||
| 2021 | $ | 246.6 | 17.7 | % | 25.0 | % | 29.9 | % | 27.4 | % | 100.0 | % | |||||||||||||||||||||||
60
SUN COMMUNITIES, INC.
Real Property Operations - Total Portfolio
The following tables reflect certain financial and other information for our real estate operations by segment as of and for the years ended December 31, 2023 and 2022 (in millions, except for statistical information):
| Year Ended December 31, 2023 | Year Ended December 31, 2022 | ||||||||||||||||||||||||||||||||||||||||||||||||||||||||||||||||||||||
| MH | MH | ||||||||||||||||||||||||||||||||||||||||||||||||||||||||||||||||||||||
| Financial Information | North America | UK | Total | RV | Marinas | Total | North America | UK(a) | Total | RV | Marinas | Total | |||||||||||||||||||||||||||||||||||||||||||||||||||||||||||
| Revenues | |||||||||||||||||||||||||||||||||||||||||||||||||||||||||||||||||||||||
| Real property (excluding transient) | $ | 906.1 | $ | 114.2 | $ | 1,020.3 | $ | 287.1 | $ | 406.8 | $ | 1,714.2 | $ | 844.0 | $ | 70.1 | $ | 914.1 | $ | 268.9 | $ | 365.9 | $ | 1,548.9 | |||||||||||||||||||||||||||||||||||||||||||||||
| Real property - transient | 1.9 | 42.1 | 44.0 | 276.8 | 24.8 | 345.6 | 1.6 | 38.5 | 40.1 | 294.4 | 18.8 | 353.3 | |||||||||||||||||||||||||||||||||||||||||||||||||||||||||||
| Total operating revenues | 908.0 | 156.3 | 1,064.3 | 563.9 | 431.6 | 2,059.8 | 845.6 | 108.6 | 954.2 | 563.3 | 384.7 | 1,902.2 | |||||||||||||||||||||||||||||||||||||||||||||||||||||||||||
| Expenses | |||||||||||||||||||||||||||||||||||||||||||||||||||||||||||||||||||||||
| Property operating expenses | 297.5 | 89.6 | 387.1 | 262.1 | 158.7 | 807.9 | 274.6 | 57.6 | 332.2 | 261.4 | 141.6 | 735.2 | |||||||||||||||||||||||||||||||||||||||||||||||||||||||||||
| Real Property NOI | $ | 610.5 | $ | 66.7 | $ | 677.2 | $ | 301.8 | $ | 272.9 | $ | 1,251.9 | $ | 571.0 | $ | 51.0 | $ | 622.0 | $ | 301.9 | $ | 243.1 | $ | 1,167.0 | |||||||||||||||||||||||||||||||||||||||||||||||
As of December 31, 2023 | As of December 31, 2022 | ||||||||||||||||||||||||||||||||||||||||||||||||||||||||||||||||||||||
| MH | MH | ||||||||||||||||||||||||||||||||||||||||||||||||||||||||||||||||||||||
| Other information | North America | UK | Total | RV | Marinas | Total | North America | UK(a) | Total | RV | Marinas | Total | |||||||||||||||||||||||||||||||||||||||||||||||||||||||||||
| Number of properties | 298 | 55 | 353 | 179 | 135 | 667 | 298 | 55 | 353 | 182 | 134 | 669 | |||||||||||||||||||||||||||||||||||||||||||||||||||||||||||
| Sites, wet slips and dry storage spaces | |||||||||||||||||||||||||||||||||||||||||||||||||||||||||||||||||||||||
Sites, wet slips and dry storage spaces(b) | 100,320 | 18,110 | 118,430 | 32,390 | 48,030 | 198,850 | 99,980 | 18,040 | 118,020 | 30,330 | 47,820 | 196,170 | |||||||||||||||||||||||||||||||||||||||||||||||||||||||||||
| Transient sites | N/M | 3,200 | 3,200 | 25,290 | N/A | 28,490 | N/M | 3,140 | 3,140 | 28,040 | N/A | 31,180 | |||||||||||||||||||||||||||||||||||||||||||||||||||||||||||
| Total | 100,320 | 21,310 | 121,630 | 57,680 | 48,030 | 227,340 | 99,980 | 21,180 | 121,160 | 58,370 | 47,820 | 227,350 | |||||||||||||||||||||||||||||||||||||||||||||||||||||||||||
| MH and Annual RV Occupancy | 96.6 | % | 89.5 | % | 95.5 | % | 100.0 | % | N/A | 96.4 | % | 95.9 | % | 89.0 | % | 95.0 | % | 100.0 | % | N/A | 96.0 | % | |||||||||||||||||||||||||||||||||||||||||||||||||
N/M = Not meaningful.
N/A = Not applicable.
(a) UK amounts for the year ended December 31, 2022 cover April 8, 2022 (date of acquisition) to December 31, 2022.
(b) MH annual sites included 10,237 and 9,334 rental homes in our Rental Program at December 31, 2023 and 2022, respectively. Our investment in occupied rental homes at December 31, 2023 was $697.1 million, an increase of 21.8% from $572.3 million at December 31, 2022.
For the year ended December 31, 2023, the $84.9 million, or 7.3% increase in Real Property NOI as compared to the same period in 2022, consists of $39.0 million from Same Property MH and $13.5 million from Same Property RV from the North America operations, $24.7 million from Same Property Marina, and $7.7 million, net from the UK operations and other recently acquired or developed properties.
61
SUN COMMUNITIES, INC.
Real Property Operations - Same Property Portfolio
Same Property refers to properties that we have owned for at least the preceding year, exclusive of properties recently completed or under construction, and other properties as determined by management. The Same Property data may change from time-to-time depending on acquisitions, dispositions, management discretion, significant transactions or unique situations.
In order to evaluate the growth of the Same Property portfolio, management has classified certain items differently than our GAAP statements. The reclassification difference between our GAAP statements and our Same Property portfolio is the reclassification of utility revenues from real property revenue to operating expenses. A significant portion of our utility charges are re-billed to our residents. Additionally, for the MH and RV segments, the amounts in the tables below reflect constant currency for comparative purposes. Additionally, prior period Canadian currency figures have been translated at 2023 and 2022 average exchange rates for constant currency comparability.
62
SUN COMMUNITIES, INC.
Real Property Operations - Same Property - MH, RV and Marina
The following tables reflect certain financial and other information for our Same Property MH, RV and Marina portfolios as of and for the years ended December 31, 2023 and 2022 (in millions, except for statistical information).
| Year Ended | |||||||||||||||||||||||||||||||||||||||||||||||||||||||||||||||||||||||||||||
| December 31, 2023 | December 31, 2022 | Total Change | % Change(c) | ||||||||||||||||||||||||||||||||||||||||||||||||||||||||||||||||||||||||||
MH(a) | RV(a) | Marina | Total | MH(a) | RV(a) | Marina | Total | MH | RV | Marina | Total(d) | ||||||||||||||||||||||||||||||||||||||||||||||||||||||||||||||||||
| Financial information | |||||||||||||||||||||||||||||||||||||||||||||||||||||||||||||||||||||||||||||
| Same Property Revenues | |||||||||||||||||||||||||||||||||||||||||||||||||||||||||||||||||||||||||||||
| Real property (excluding transient) | $ | 830.4 | $ | 263.8 | $ | 326.0 | $ | 1,420.2 | $ | 776.2 | $ | 228.1 | $ | 302.4 | $ | 1,306.7 | $ | 113.5 | 7.0 | % | 15.6 | % | 7.8 | % | 8.7 | % | |||||||||||||||||||||||||||||||||||||||||||||||||||
| Real property - transient | 1.6 | 256.2 | 21.7 | 279.5 | 1.2 | 275.4 | 16.4 | 293.0 | (13.5) | 25.9 | % | (7.0) | % | 32.6 | % | (4.6) | % | ||||||||||||||||||||||||||||||||||||||||||||||||||||||||||||
| Total Same Property operating revenues | 832.0 | 520.0 | 347.7 | 1,699.7 | 777.4 | 503.5 | 318.8 | 1,599.7 | 100.0 | 7.0 | % | 3.3 | % | 9.1 | % | 6.2 | % | ||||||||||||||||||||||||||||||||||||||||||||||||||||||||||||
| Same Property Expenses | |||||||||||||||||||||||||||||||||||||||||||||||||||||||||||||||||||||||||||||
Same Property operating expenses(b)(d) | 223.8 | 224.7 | 112.1 | 560.6 | 208.2 | 221.7 | 107.9 | 537.8 | 22.8 | 7.5 | % | 1.4 | % | 3.9 | % | 4.2 | % | ||||||||||||||||||||||||||||||||||||||||||||||||||||||||||||
Real Property NOI(d) | $ | 608.2 | $ | 295.3 | $ | 235.6 | $ | 1,139.1 | $ | 569.2 | $ | 281.8 | $ | 210.9 | $ | 1,061.9 | $ | 77.2 | 6.8 | % | 4.8 | % | 11.7 | % | 7.3 | % | |||||||||||||||||||||||||||||||||||||||||||||||||||
| Other information | |||||||||||||||||||||||||||||||||||||||||||||||||||||||||||||||||||||||||||||
Number of properties | 288 | 160 | 119 | 567 | 288 | 160 | 119 | 567 | |||||||||||||||||||||||||||||||||||||||||||||||||||||||||||||||||||||
| Sites, wet slips and dry storage spaces | 98,620 | 54,370 | 40,890 | 193,880 | 98,340 | 54,400 | 41,000 | 193,740 | |||||||||||||||||||||||||||||||||||||||||||||||||||||||||||||||||||||
| Year Ended | |||||||||||||||||||||||||||||||||||||||||||||||||||||||||||||||||||||||||||||
| December 31, 2022 | December 31, 2021 | Total Change | % Change(c) | ||||||||||||||||||||||||||||||||||||||||||||||||||||||||||||||||||||||||||
MH(a) | RV(a) | Marina | Total | MH(a) | RV(a) | Marina | Total | MH | RV | Marina | Total(d) | ||||||||||||||||||||||||||||||||||||||||||||||||||||||||||||||||||
| Financial information | |||||||||||||||||||||||||||||||||||||||||||||||||||||||||||||||||||||||||||||
| Same Property Revenues | |||||||||||||||||||||||||||||||||||||||||||||||||||||||||||||||||||||||||||||
| Real property (excluding transient) | $ | 759.7 | $ | 213.1 | $ | 233.7 | $ | 1,206.5 | $ | 726.4 | $ | 188.4 | $ | 217.0 | $ | 1,131.8 | $ | 74.7 | 4.6 | % | 13.1 | % | 7.8 | % | 6.6 | % | |||||||||||||||||||||||||||||||||||||||||||||||||||
| Real property - transient | 1.2 | 243.8 | 12.4 | 257.4 | 1.5 | 236.1 | 13.0 | 250.6 | 6.8 | (14.8) | % | 3.3 | % | (5.1) | % | 2.7 | % | ||||||||||||||||||||||||||||||||||||||||||||||||||||||||||||
| Total Same Property operating revenues | 760.9 | 456.9 | 246.1 | 1,463.9 | 727.9 | 424.5 | 230.0 | 1,382.4 | 81.5 | 4.5 | % | 7.6 | % | 7.0 | % | 5.9 | % | ||||||||||||||||||||||||||||||||||||||||||||||||||||||||||||
| Same Property Expenses | |||||||||||||||||||||||||||||||||||||||||||||||||||||||||||||||||||||||||||||
Same Property operating expenses(b)(d) | 202.7 | 195.4 | 84.1 | 482.2 | 187.5 | 187.4 | 79.5 | 454.4 | 27.8 | 8.1 | % | 4.2 | % | 5.8 | % | 6.1 | % | ||||||||||||||||||||||||||||||||||||||||||||||||||||||||||||
Real Property NOI(d) | $ | 558.2 | $ | 261.5 | $ | 162.0 | $ | 981.7 | $ | 540.4 | $ | 237.1 | $ | 150.5 | $ | 928.0 | $ | 53.7 | 3.3 | % | 10.3 | % | 7.7 | % | 5.8 | % | |||||||||||||||||||||||||||||||||||||||||||||||||||
| Other information | |||||||||||||||||||||||||||||||||||||||||||||||||||||||||||||||||||||||||||||
Number of properties | 276 | 145 | 101 | 522 | 276 | 145 | 101 | 522 | |||||||||||||||||||||||||||||||||||||||||||||||||||||||||||||||||||||
| Sites, wet slips and dry storage spaces | 94,930 | 48,770 | 35,550 | 179,250 | 94,400 | 48,720 | 35,740 | 178,860 | |||||||||||||||||||||||||||||||||||||||||||||||||||||||||||||||||||||
(a) Same Property results for our MH and RV properties reflect constant currency for comparative purposes. Canadian currency figures in the prior comparative period have been translated at the average exchange rate during the years ended December 31, 2023 and 2022 of $0.7418 and $0.7689 USD per Canadian dollar, respectively.
63
SUN COMMUNITIES, INC.
Real Property Operations - Same Property Portfolio (Continued)
(b) We net certain utilities revenues (which include utility reimbursement revenues from residents) against related utility expenses in property operating expenses as follows (in millions):
| Year Ended December 31, 2023 | Year Ended December 31, 2022 | ||||||||||||||||||||||||||||||||||||||||||||||
| MH | RV | Marina | Total | MH | RV | Marina | Total | ||||||||||||||||||||||||||||||||||||||||
Utility revenue netted against related utility expense | $ | 68.3 | $ | 19.3 | $ | 22.7 | $ | 110.3 | $ | 63.8 | $ | 18.1 | $ | 19.2 | $ | 101.1 | |||||||||||||||||||||||||||||||
| Year Ended December 31, 2022 | Year Ended December 31, 2021 | ||||||||||||||||||||||||||||||||||||||||||||||
| MH | RV | Marina | Total | MH | RV | Marina | Total | ||||||||||||||||||||||||||||||||||||||||
Utility revenue netted against related utility expense | $ | 61.9 | $ | 17.1 | $ | 11.4 | $ | 90.4 | $ | 57.3 | $ | 14.1 | $ | 11.1 | $ | 82.5 | |||||||||||||||||||||||||||||||
(c) Percentages are calculated based on unrounded numbers.
(d) Total Same Property operating expenses consist of the following components for the periods shown (in millions), and exclude amounts invested into recently acquired properties to bring them up to our standards.
| Year Ended | Year Ended | ||||||||||||||||||||||||||||||||||||||||||||||
| December 31, 2023 | December 31, 2022 | Change | % Change | December 31, 2022 | December 31, 2021 | Change | % Change | ||||||||||||||||||||||||||||||||||||||||
| Payroll and benefits | $ | 190.6 | $ | 181.6 | $ | 9.0 | 5.0 | % | $ | 161.8 | $ | 151.2 | $ | 10.6 | 7.0 | % | |||||||||||||||||||||||||||||||
| Real estate taxes | 107.2 | 103.1 | 4.1 | 4.0 | % | 94.1 | 88.4 | 5.7 | 6.5 | % | |||||||||||||||||||||||||||||||||||||
| Supplies and repairs | 75.2 | 78.9 | (3.7) | (4.7) | % | 73.0 | 68.2 | 4.8 | 6.9 | % | |||||||||||||||||||||||||||||||||||||
| Utilities | 64.7 | 67.0 | (2.3) | (3.4) | % | 63.3 | 57.3 | 6.0 | 10.4 | % | |||||||||||||||||||||||||||||||||||||
| Legal, state / local taxes, and insurance | 55.8 | 39.2 | 16.6 | 42.3 | % | 35.7 | 32.4 | 3.3 | 10.1 | % | |||||||||||||||||||||||||||||||||||||
| Other | 67.1 | 68.0 | (0.9) | (1.4) | % | 54.3 | 56.9 | (2.6) | (4.6) | % | |||||||||||||||||||||||||||||||||||||
| Total Same Property Operating Expenses | $ | 560.6 | $ | 537.8 | $ | 22.8 | 4.2 | % | $ | 482.2 | $ | 454.4 | $ | 27.8 | 6.1 | % | |||||||||||||||||||||||||||||||
64
SUN COMMUNITIES, INC.
Same Property Summary (in whole units)
| As of | As of | ||||||||||||||||||||||||||||||||||||||||||||||
| December 31, 2023 | December 31, 2022 | December 31, 2022 | December 31, 2021 | ||||||||||||||||||||||||||||||||||||||||||||
| MH | RV | MH | RV | MH | RV | MH | RV | ||||||||||||||||||||||||||||||||||||||||
| Other Information | |||||||||||||||||||||||||||||||||||||||||||||||
| Number of properties | 288 | 160 | 288 | 160 | 276 | 145 | 276 | 145 | |||||||||||||||||||||||||||||||||||||||
| Sites | |||||||||||||||||||||||||||||||||||||||||||||||
| MH and Annual RV sites | 98,620 | 32,090 | 98,340 | 30,030 | 94,930 | 28,420 | 94,400 | 26,660 | |||||||||||||||||||||||||||||||||||||||
| Transient RV sites | N/M | 22,280 | N/M | 24,370 | N/M | 20,350 | N/M | 22,060 | |||||||||||||||||||||||||||||||||||||||
| Total | 98,620 | 54,370 | 98,340 | 54,400 | 94,930 | 48,770 | 94,400 | 48,720 | |||||||||||||||||||||||||||||||||||||||
| MH & Annual RV Occupancy | |||||||||||||||||||||||||||||||||||||||||||||||
Occupancy(a) | 97.3 | % | 100.0 | % | 96.6 | % | 100.0 | % | 97.1 | % | 100.0 | % | 97.2 | % | 100.0 | % | |||||||||||||||||||||||||||||||
| Monthly base rent per site | $ | 670 | $ | 593 | $ | 630 | $ | 546 | $ | 635 | $ | 555 | $ | 607 | $ | 516 | |||||||||||||||||||||||||||||||
% change in monthly base rent(b) | 6.4 | % | 8.7 | % | N/A | N/A | 4.6 | % | 7.6 | % | N/A | N/A | |||||||||||||||||||||||||||||||||||
| Rental Program Statistics included in MH: | |||||||||||||||||||||||||||||||||||||||||||||||
Number of occupied sites, end of period(c) | 10,010 | N/A | 9,310 | N/A | 8,930 | N/A | 9,570 | N/A | |||||||||||||||||||||||||||||||||||||||
| Monthly rent per site - MH Rental Program | $ | 1,292 | N/A | $ | 1,221 | N/A | $ | 1,225 | N/A | $ | 1,117 | N/A | |||||||||||||||||||||||||||||||||||
% change(c) | 5.8 | % | N/A | N/A | N/A | 9.7 | % | N/A | N/A | N/A | |||||||||||||||||||||||||||||||||||||
N/M = Not meaningful. N/A = Not applicable.
(a) Same Property adjusted blended occupancy for MH and RV increased to 98.9% at December 31, 2023, from 96.6% at December 31, 2022. The 230 basis point increase was driven by MH expansion fills and the conversion of transient RV sites to annual sites. Same Property blended occupancy for MH and RV was 97.9% at December 31, 2023, from 97.4% at December 31, 2022. Same Property adjusted blended occupancy for MH and RV increased to 98.6% at December 31, 2022, from 96.8% at December 31, 2021. The 180 basis point increase was driven by MH expansion fills and the conversion of transient RV sites to annual sites. Same Property blended occupancy for MH and RV was 97.8% at December 31, 2022 and 2021.
(b) Calculated using actual results without rounding.
(c) Occupied rental program sites in Same Property are included in total sites.
For the years ended December 31, 2023 and 2022:
•The Same Property data includes all properties that we have owned and operated continuously since January 1, 2022 exclusive of ground-up development and redevelopment properties recently completed or under construction, and other properties as determined by management.
•The MH segment's increase in NOI of $39.0 million, or 6.8% when compared to the same period in 2022, is primarily due to an increase in Real property (excluding transient) revenue of $54.2 million, or 7.0%. Real property (excluding transient and other) revenue increased primarily due to a 6.4% increase in monthly base rent.
•The RV segment's increase in NOI of $13.5 million, or 4.8% when compared to the same period in 2022, is primarily due to an increase in Real property (excluding transient) revenue of $35.7 million, or 15.6%, primarily due to an 8.7% increase in monthly base rent and conversions of transient RV sites to annual RV sites.
•The Marina segment increase in NOI of $24.7 million, or 11.7% when compared to the same period in 2022, is primarily due to a $23.6 million, or 7.8% increase in Real property (excluding transient) revenue.
For the years ended December 31, 2022 and 2021:
•The Same Property data includes all properties that we owned and operated continuously since January 1, 2021, exclusive of ground-up development and redevelopment properties recently completed or under construction, and other properties as determined by management.
•The MH segment's increase in NOI of $17.8 million, or 3.3% when compared to the same period in 2021, is primarily due to an increase in Real property (excluding transient) revenue of $33.3 million, or 4.6%. Real property (excluding transient and other) revenue increased due to a 4.6% increase in monthly base rent.
•The RV segment's increase in NOI of $24.4 million, or 10.3% when compared to the same period in 2021, is primarily due to an increase in Real property - transient revenue of $24.7 million, or 13.1%, due to a 7.6% increase in monthly base rent and conversions of transient RV sites to annual RV sites.
•The Marina segment increase in NOI of $11.5 million, or 7.7% when compared to the same period in 2021, is primarily due to a $16.7 million, or 7.8% increase in Real property (excluding transient) revenue.
65
SUN COMMUNITIES, INC.
Home Sales Summary
We sell new and pre-owned homes to current and prospective residents and customers in our communities. This inventory is purchased from manufacturers, lenders, dealers, former residents or customers.
The following table reflects certain financial and statistical information for our Home Sales Program for the years ended December 31, 2023 and 2022 (in millions, except for average selling prices and other information):
| Year Ended | |||||||||||||||||||||||
| December 31, 2023 | December 31, 2022 | Change | % Change | ||||||||||||||||||||
| North America | |||||||||||||||||||||||
| Home sales | $ | 233.8 | $ | 275.4 | $ | (41.6) | (15.1) | % | |||||||||||||||
| Home cost and selling expenses | 178.7 | 203.3 | (24.6) | (12.1) | % | ||||||||||||||||||
| NOI | $ | 55.1 | $ | 72.1 | $ | (17.0) | (23.6) | % | |||||||||||||||
| NOI margin % | 23.6 | % | 26.2 | % | (2.6) | % | |||||||||||||||||
UK(a) | |||||||||||||||||||||||
| Home sales | $ | 186.1 | $ | 190.4 | $ | (4.3) | (2.3) | % | |||||||||||||||
| Home cost and selling expenses | 116.7 | 107.9 | 8.8 | 8.2 | % | ||||||||||||||||||
| NOI | $ | 69.4 | $ | 82.5 | $ | (13.1) | (15.9) | % | |||||||||||||||
| NOI margin % | 37.3 | % | 43.3 | % | (6.0) | % | |||||||||||||||||
| Total | |||||||||||||||||||||||
| Home sales | $ | 419.9 | $ | 465.8 | $ | (45.9) | (9.9) | % | |||||||||||||||
| Home cost and selling expenses | 295.4 | 311.2 | (15.8) | (5.1) | % | ||||||||||||||||||
| NOI | $ | 124.5 | $ | 154.6 | $ | (30.1) | (19.5) | % | |||||||||||||||
| NOI margin % | 29.6 | % | 33.2 | % | (3.5) | % | |||||||||||||||||
Units Sold:* | |||||||||||||||||||||||
| North America | 2,565 | 3,212 | (647) | (20.1) | % | ||||||||||||||||||
UK(a) | 2,857 | 2,343 | 514 | 21.9 | % | ||||||||||||||||||
| Total home sales | 5,422 | 5,555 | (133) | (2.4) | % | ||||||||||||||||||
Average Selling Price:* | |||||||||||||||||||||||
| North America | $ | 91,150 | $ | 85,741 | $ | 5,409 | 6.3 | % | |||||||||||||||
UK(a) | $ | 65,138 | $ | 81,263 | $ | (16,125) | (19.8) | % | |||||||||||||||
(a) UK amounts for the year ended December 31, 2022 cover the period from April 8, 2022 (date of acquisition) through December 31, 2022.
NOI - North America
For the year ended December 31, 2023, the 23.6% decrease in NOI is primarily driven by a 20.1% decrease in total home sales volume as compared to the same period in 2022.
NOI - UK
For the year ended December 31, 2023, the 15.9% decrease in NOI is primarily driven by a 19.8% decrease in average selling price, partially offset by a full period of activity related to our properties in the UK during the current period as compared to a shorter period of activity from the date of acquisition of Park Holidays on April 8, 2022 through December 31, 2022.
66
SUN COMMUNITIES, INC.
Other Items - Statements of Operations(1)
The following table summarizes other income and expenses for the years ended December 31, 2023 and 2022 (amounts in millions):
| Year Ended | |||||||||||||||||||||||
| December 31, 2023 | December 31, 2022 | Change | % Change | ||||||||||||||||||||
| Service, retail, dining and entertainment, net | $ | 53.9 | $ | 58.9 | $ | (5.0) | (8.5) | % | |||||||||||||||
| Interest income | $ | 45.4 | $ | 35.2 | $ | 10.2 | 29.0 | % | |||||||||||||||
| Brokerage commissions and other, net | $ | 60.6 | $ | 34.9 | $ | 25.7 | 73.6 | % | |||||||||||||||
| General and administrative expense | $ | 270.2 | $ | 256.8 | $ | 13.4 | 5.2 | % | |||||||||||||||
| Catastrophic event-related charges, net | $ | 3.8 | $ | 17.5 | $ | (13.7) | (78.3) | % | |||||||||||||||
| Business combinations | $ | 3.0 | $ | 24.7 | $ | (21.7) | (87.9) | % | |||||||||||||||
| Depreciation and amortization | $ | 660.0 | $ | 601.8 | $ | 58.2 | 9.7 | % | |||||||||||||||
| Asset impairments | $ | 10.1 | $ | 3.0 | $ | 7.1 | 236.7 | % | |||||||||||||||
| Goodwill impairment | $ | 369.9 | $ | — | $ | 369.9 | N/A | ||||||||||||||||
Loss on extinguishment of debt | $ | — | $ | 4.4 | $ | (4.4) | (100.0) | % | |||||||||||||||
| Interest expense | $ | 325.8 | $ | 229.8 | $ | 96.0 | 41.8 | % | |||||||||||||||
| Interest on mandatorily redeemable preferred OP units / equity | $ | 3.3 | $ | 4.2 | $ | (0.9) | (21.4) | % | |||||||||||||||
Loss on remeasurement of marketable securities | $ | (16.0) | $ | (53.4) | $ | 37.4 | (70.0) | % | |||||||||||||||
| Gain / (loss) on foreign currency exchanges | $ | (0.3) | $ | 5.4 | $ | (5.7) | N/M | ||||||||||||||||
| Gain on dispositions of properties | $ | 11.0 | $ | 12.2 | $ | (1.2) | (9.8) | % | |||||||||||||||
| Other expense, net | $ | (7.5) | $ | (2.1) | $ | (5.4) | 257.1 | % | |||||||||||||||
Loss on remeasurement of notes receivable | $ | (106.7) | $ | (0.8) | $ | (105.9) | N/M | ||||||||||||||||
Income from nonconsolidated affiliates | $ | 16.0 | $ | 2.9 | $ | 13.1 | N/M | ||||||||||||||||
Loss on remeasurement of investment in nonconsolidated affiliates | $ | (4.2) | $ | (2.7) | $ | (1.5) | (55.6) | % | |||||||||||||||
Current tax expense | $ | (14.5) | $ | (10.3) | $ | (4.2) | 40.8 | % | |||||||||||||||
Deferred tax benefit | $ | 22.9 | $ | 4.2 | $ | 18.7 | N/M | ||||||||||||||||
| Preferred return to preferred OP units / equity interests | $ | 12.3 | $ | 11.0 | $ | 1.3 | 11.8 | % | |||||||||||||||
| Income / (loss) attributable to noncontrolling interests | $ | (8.1) | $ | 10.8 | $ | (18.9) | (175.0) | % | |||||||||||||||
(1) Only items determined by management to be material, of interest, or unique to the periods disclosed above are explained below.
N/M = Not meaningful.
Interest income - for the year ended December 31, 2023, increased primarily due to a larger loan balance provided to Royale Holdings Group HoldCo Limited, a real estate operator, to fund investing and financing activities in the current period as compared to the same periods in 2022.
Brokerage commissions and other, net - for the year ended December 31, 2023, increased primarily due to the receipt of business interruption insurance recoveries of $20.2 million, net of deductibles, in connection with Hurricane Ian. Refer to Note 17, "Commitments and Contingencies," in our accompanying Consolidated Financial statements for additional information.
Catastrophic event-related charges, net - for the year ended December 31, 2023, was an expense of $3.8 million, compared to an expense of $17.5 million in 2022. The expense in 2023 was primarily due to an asset impairment charge of $7.0 million driven by flooding at an RV community in New Hampshire, partially offset by the receipt of insurance recoveries related to Hurricane Irma, compared to impairment charges in 2022 related to damaged property from Hurricane Ian. Refer to Note 17, "Commitments and Contingencies," in our accompanying Consolidated Financial Statements for additional information.
Business combinations - for the year ended December 31, 2023, decreased primarily as a result of no new acquisitions accounted for as business combinations during 2023 as compared to the same period in 2022. Refer to Note 3, "Real Estate Acquisitions and Dispositions," in our accompanying Consolidated Financial Statements for additional information.
Goodwill impairment - for the year ended December 31, 2023, was due to goodwill impairment charges driven by a decline in the fair value of our United Kingdom reporting unit within the MH segment. Refer to Note 6, "Goodwill and Other Intangible Assets," and Note 22, "Quarterly Financial Data (Unaudited and Restated)," in our accompanying Consolidated Financial Statements for additional information.
67
SUN COMMUNITIES, INC.
Interest expense - for the year ended December 31, 2023, increased due to the higher carrying balance of debt and increased interest rates as compared to the same period in 2022. Refer to Note 9, "Debt and Line of Credit," in our accompanying Consolidated Financial Statements for additional information.
Loss on remeasurement of marketable securities - for the year ended December 31, 2023, was a loss of $16.0 million, as compared to a loss of $53.4 million during the same period in 2022 due to the fluctuation in the price of publicly traded marketable securities we owned. During the year ended December 31, 2023, we sold all of these marketable securities. Refer to Note 16, "Fair Value of Financial Instruments," in our accompanying Consolidated Financial Statements for additional information.
Loss on remeasurement of notes receivable - for the year ended December 31, 2023, was a loss of $106.7 million, as compared to a loss of $0.8 million during the same period in 2022 due to an impairment charge of $102.9 million recorded in 2023 related to our note receivable from the Royale Holdings Group HoldCo Limited. Refer to Note 4, "Notes and Other Receivables," in our accompanying Consolidated Financial Statements for additional information.
Income from nonconsolidated affiliates - for the year ended December 31, 2023, increased as compared to 2022, primarily due to the gain recognized on the disposition of our investment in Rezplot of $15.3 million in 2023. Refer to Note 7, "Investments in Nonconsolidated Affiliates," in our accompanying Consolidated Financial Statements for additional information.
Deferred tax benefit - for the year ended December 31, 2023, increased primarily due to additional deferred interest deductions at our UK operations compared to the same period in 2022. Refer to Note 13, "Income Taxes," in our accompanying Consolidated Financial Statements for additional information.
68
SUN COMMUNITIES, INC.
RECONCILIATION OF NET INCOME ATTRIBUTABLE TO SUI COMMON SHAREHOLDERS TO FFO
The following table reconciles Net income / (loss) attributable to SUI common shareholders to FFO for the years ended December 31, 2023, 2022 and 2021 (in millions, except for per share amounts):
| Year Ended | |||||||||||||||||
| December 31, 2023 | December 31, 2022 | December 31, 2021 | |||||||||||||||
| Net Income / (Loss) Attributable to SUI Common Shareholders | $ | (213.3) | $ | 242.0 | $ | 380.2 | |||||||||||
| Adjustments | |||||||||||||||||
| Depreciation and amortization | 657.2 | 599.6 | 521.9 | ||||||||||||||
| Depreciation on nonconsolidated affiliates | 0.2 | 0.1 | 0.1 | ||||||||||||||
| Asset impairments | 10.1 | 3.0 | — | ||||||||||||||
| Goodwill impairment | 369.9 | — | — | ||||||||||||||
(Gain) / loss on remeasurement of marketable securities | 16.0 | 53.4 | (33.5) | ||||||||||||||
| Loss on remeasurement of investment in nonconsolidated affiliates | 4.2 | 2.7 | 0.2 | ||||||||||||||
| (Gain) / loss on remeasurement of notes receivable | 106.7 | 0.8 | (0.7) | ||||||||||||||
| Loss on remeasurement of collateralized receivables and secured borrowings, net | 0.4 | — | — | ||||||||||||||
| Gain on dispositions of properties, including tax effect | (8.9) | (12.2) | (108.1) | ||||||||||||||
| Add: Returns on preferred OP units | 11.8 | 9.5 | 4.0 | ||||||||||||||
| Add: Income attributable to noncontrolling interests | (8.1) | 10.4 | 14.7 | ||||||||||||||
| Gain on dispositions of assets, net | (38.0) | (54.9) | (60.5) | ||||||||||||||
FFO Attributable to SUI Common Shareholders and Dilutive Convertible Securities(1) | $ | 908.2 | $ | 854.4 | $ | 718.3 | |||||||||||
| Adjustments | |||||||||||||||||
Business combination expense | 3.0 | 24.7 | 1.3 | ||||||||||||||
Acquisition and other transaction costs(2) | 25.3 | 22.7 | 8.7 | ||||||||||||||
| Loss on extinguishment of debt | — | 4.4 | 8.1 | ||||||||||||||
| Catastrophic event-related charges, net | 3.8 | 17.5 | 2.2 | ||||||||||||||
Loss of earnings - catastrophic event-related charges, net(3) | 2.1 | 4.8 | 0.2 | ||||||||||||||
| (Gain) / loss on foreign currency exchanges | 0.3 | (5.4) | 3.7 | ||||||||||||||
Other adjustments, net(4) | (27.4) | 0.4 | 16.2 | ||||||||||||||
Core FFO Attributable to SUI Common Shareholders and Dilutive Convertible Securities(1) | $ | 915.3 | $ | 923.5 | $ | 758.7 | |||||||||||
| Weighted Average Common Shares Outstanding - Diluted | 128.9 | 125.6 | 116.5 | ||||||||||||||
| FFO Attributable to SUI Common Shareholders and Dilutive Convertible Securities Per Share | $ | 7.05 | $ | 6.80 | $ | 6.16 | |||||||||||
| Core FFO Attributable to SUI Common Shareholders and Dilutive Convertible Securities Per Share | $ | 7.10 | $ | 7.35 | $ | 6.51 | |||||||||||
(1)Excludes the effect of certain anti-dilutive convertible securities.
(2)These costs represent (i) nonrecurring integration expenses associated with acquisitions during the years ended December 31, 2023, and 2022, (ii) costs associated with potential acquisitions that will not close, (iii) costs associated with the termination of the bridge loan commitment during the three months ended March 31, 2022 related to the acquisition of Park Holidays, (iv) expenses incurred to bring recently acquired properties up to our operating standards, including items such as tree trimming and painting costs that do not meet our capitalization policy, and (v) other non-recurring transaction costs.
(3)Loss of earnings - catastrophic event-related charges, net for the year ended December 2023 included the following:
| Year Ended | |||||
| December 31, 2023 | |||||
Hurricane Ian - Three Fort Myers, Florida RV communities impaired | |||||
Estimated loss of earnings in excess of the applicable business interruption deductible | $ | 21.9 | |||
Insurance recoveries received for previously estimated loss of earnings through August 31, 2023 | (19.7) | ||||
| Hurricane Irma - Three Florida Keys communities impaired | |||||
Estimated loss of earnings in excess of the applicable business interruption deductible | 0.5 | ||||
Reversal of unpaid previously estimated loss of earnings that we do not expect to recover | (0.6) | ||||
Loss of earnings - catastrophic event-related charges, net | $ | 2.1 | |||
(4)Other adjustments, net relates primarily to (i) deferred tax expense / (benefit) and long term lease termination expense / (benefit) during the years ended December 31, 2023, 2022 and 2021, (ii) accelerated deferred compensation amortization and gain on sale of investment in nonconsolidated affiliate during the years ended December 31, 2023 and 2022, (iii) non-recurring management fees, severance costs, and ERP implementation costs during the year ended December 31, 2023, (iv) change in estimated contingent consideration during the years ended December 31, 2023 and December 31, 2021, (v) gain from legal settlement during the year ended December 31, 2022 and (vi) RV rebranding non-recurring costs for the years ended December 31, 2022 and 2021.
69
SUN COMMUNITIES, INC.
LIQUIDITY AND CAPITAL RESOURCES
Short-term Liquidity
Our principal short-term liquidity demands historically have been, and are expected to continue to be, distributions to our shareholders and the unit holders of the Operating Partnership, property acquisitions, development and expansion of our properties, capital improvement of our properties, the purchase of new and pre-owned homes, and debt repayment. We intend to meet our short-term liquidity requirements through available cash balances, cash flow generated from operations, draws on our Senior Credit Facility, and the use of debt and equity offerings under our shelf registration statement. Refer to Note 9, "Debt and Line of Credit" and Note 10, "Equity and Temporary Equity" and Note 21, "Subsequent Events," in our accompanying Consolidated Financial Statements for additional information and related activity subsequent to December 31, 2023.
We also intend to continue to strengthen our capital and liquidity positions by focusing on our core fundamentals, which are generating positive cash flows from operations, maintaining appropriate debt levels and leverage ratios, and controlling overhead costs. We take a disciplined approach to selecting the optimal mix of financing sources to meet our liquidity demands and minimize our overall cost of capital. Our investment grade credit ratings of BBB and Baa3 from S&P Global and Moody's, respectively, remain unchanged from the initial rating. We plan to continue to capitalize on our unsecured bond market access to optimize our cost of capital and increase our financial flexibility.
Current market and economic conditions, including relating to, among other things, interest rates, currency fluctuations, equity valuations and inflation, may adversely affect our ability to obtain debt and equity capital in the short term on attractive terms.
Throughout our history, we have demonstrated operational reliability and cash flow strength throughout economic cycles. Our current objectives include streamlining our operations with an emphasis on our reliable real property income. We recognize the headwinds we are facing from a challenging macroeconomic environment and are re-aligning our strategy to focus on our proven, durable income streams. We are positioned for ongoing organic growth with expected rental rate increases, occupancy gains and expense management. Looking ahead to 2024, we expect rental rate growth that exceeds headline inflation with ongoing focus on expense management to continue generating strong organic cash flow growth.
Given a macroeconomic backdrop of sustained higher interest rates, we intend to prioritize variable rate debt reduction as our primary use of free cash flow from our operations and selective capital recycling. In addition, we are pulling back on our development activity and capital spending considering the more challenging macroeconomic and capital market environment. Capital spending besides projects that are underway, will be solely focused on the most strategic opportunities. We also attempt to manage interest rate risks by using interest rate hedging instruments and by monitoring our overall leverage levels. We engage in certain hedging transactions to limit our exposure from the adverse effects of changes in interest rates on borrowing costs of our loans.
Acquisition, development and expansion activities
Subject to market conditions, we intend to selectively identify opportunities to expand our development pipeline and acquire existing properties. We finance acquisitions through available cash, secured financing, draws on our Senior Credit Facility, the assumption of existing debt on properties and the issuance of debt and equity securities. The current higher interest rate environment may make it more expensive to finance acquisitions and fund developments and expansion. We will continue very selectively to evaluate acquisition and development opportunities that meet our underwriting criteria.
During the year ended December 31, 2023, we acquired one MH community with 68 sites and 72 development sites, and one marina with 24 wet slips and dry storage spaces, for an aggregate purchase price of approximately $107.0 million. Total acquisition investments were $368.7 million during the year ended December 31, 2023, and represents the purchase price paid for operating properties and land parcels for future ground-up development and expansions activities, plus any capital improvements identified during due diligence needed to bring acquired properties up to our operating standards.
We have been focused on property ground-up development and expansion opportunities adjacent to our existing properties. During the year ended December 31, 2023, we acquired four land parcels located in the U.S. and the UK for the potential development of over 1,350 sites, expanded 14 of our existing communities by over 440 sites and delivered 360 sites at five ground-up development properties.
70
SUN COMMUNITIES, INC.
We continue to selectively expand our properties utilizing our inventory of owned and entitled land. We have over 17,980 MH and RV sites suitable for future development.
Refer to Note 3, "Real Estate Acquisitions and Dispositions," in our accompanying Consolidated Financial Statements for additional detail on acquisitions completed to date.
Capital Expenditures (excluding Acquisition costs)
Our capital expenditures include lot modifications, growth projects, rebranding, acquisition-related capital expenditures, expansion and development construction costs, rental home purchases and recurring capital expenditures.
Our capital expenditure activity is summarized as follows (in millions):
| Year Ended | |||||||||||
| December 31, 2023 | December 31, 2022 | ||||||||||
| Recurring Capital Expenditures | $ | 87.3 | $ | 73.8 | |||||||
| Non-Recurring Capital Expenditures and Related Activities | |||||||||||
| Lot Modifications | 54.9 | 39.1 | |||||||||
| Growth Projects | 104.5 | 99.5 | |||||||||
| Rebranding | 4.7 | 15.0 | |||||||||
| Capital improvements to recent acquisitions | 215.3 | 280.3 | |||||||||
| Expansion and Development | 276.3 | 261.8 | |||||||||
| Rental Program | 260.9 | 151.1 | |||||||||
| Other | (0.9) | 0.4 | |||||||||
| Total Non-Recurring Capital Expenditure and Related Activities | 915.7 | 847.2 | |||||||||
| Total Capital Expenditure and Related Activities | $ | 1,003.0 | $ | 921.0 | |||||||
Recurring capital expenditures
Property recurring capital expenditures are necessary to maintain asset quality, including purchasing and replacing items used to operate the communities and marinas. Recurring capital expenditures at our MH and RV properties include major road, driveway and pool improvements; clubhouse renovations; adding or replacing streetlights; playground equipment; signage; maintenance facilities; manager housing and property vehicles. Recurring capital expenditures at our marinas include dredging, dock repairs and improvements, and equipment maintenance and upgrades. The minimum capitalized amount is five hundred dollars.
Non-Recurring Capital Expenditures and Related Activities
Lot modifications - lot modification capital expenditures are incurred to modify the foundational structures required to set a new home after a previous home has been removed. These expenditures are necessary to create a revenue stream from a new site renter and often improve the quality of the community. Other lot modification expenditures include land improvements added to annual RV sites to aid in the conversion of transient RV guests to annual contracts.
Growth projects - growth projects consist of revenue generating or expense reducing activities at the properties. These include, but are not limited to, utility efficiency and renewable energy projects, site, slip or amenity upgrades such as the addition of a garage, shed or boat lift, and other special capital projects that substantiate an incremental rental increase.
Rebranding - rebranding includes new signage at our RV communities and the costs of building an RV mobile application and updated website.
Capital improvements subsequent to acquisition often require 24 to 36 months to complete after closing and include upgrading clubhouses; landscaping; new street light systems; new mail delivery systems; pool renovations including larger decks, heaters and furniture; new maintenance facilities; lot modifications; and new signage including main signs and internal road signs.
71
SUN COMMUNITIES, INC.
Expansion and development expenditures - consist primarily of construction costs such as roads, activities, and amenities, and costs necessary to complete site improvements, such as driveways, sidewalks and landscaping at our MH and RV communities. Expenditures also include costs to rebuild after damage has been incurred at MH, RV or marina properties, and research and development.
Rental program - consists of investment in the acquisition of homes intended for the Rental Program and the purchase of vacation rental homes at our RV communities. Expenditures for these investments depend upon the condition of the markets for repossessions and new home sales, rental homes and vacation rental homes.
Cash Flow Activities
Our cash flow activities are summarized as follows (in millions):
| Year Ended | |||||||||||||||||
| December 31, 2023 | December 31, 2022 | December 31, 2021 | |||||||||||||||
| Net Cash Provided by Operating Activities | $ | 790.5 | $ | 734.9 | $ | 753.6 | |||||||||||
| Net Cash Used for Investing Activities | $ | (919.5) | $ | (3,062.6) | $ | (2,338.2) | |||||||||||
| Net Cash Provided by Financing Activities | $ | 80.3 | $ | 2,348.6 | $ | 1,570.4 | |||||||||||
| Effect of Exchange Rate Changes on Cash, Cash Equivalents and Restricted Cash | $ | 1.0 | $ | (8.7) | $ | (0.2) | |||||||||||
Cash, cash equivalents and restricted cash decreased by $47.7 million from $90.4 million as of December 31, 2022, to $42.7 million as of December 31, 2023.
Operating activities - Net cash provided by operating activities increased by $55.6 million to $790.5 million for the year ended December 31, 2023, compared to $734.9 million for the year ended December 31, 2022. The increase in operating cash flow was primarily due to improved Same Property operating performance at our MH and RV communities and marinas, partially offset by an increase in interest expense during the year ended December 31, 2023 as compared to the corresponding period in 2022.
Our net cash flows provided by operating activities from continuing operations may be adversely impacted by, among other things:
•the market and economic conditions in our current markets generally, and specifically in the metropolitan areas of our current markets;
•lower occupancy and rental rates of our properties;
•substantial increases in insurance premiums;
•increases in other operating costs, such as wage and benefit costs, real estate taxes and utilities;
•decreased sales of manufactured homes;
•current volatility in economic conditions and the financial markets; and
•the effects of outbreaks of disease and related restrictions on business operations. Refer to "Risk Factors" in Part I, Item 1A in this Annual Report on Form 10-K.
Investing activities - Net cash used for investing activities decreased by $2.1 billion to $919.5 million for the year ended December 31, 2023, compared to $3.1 billion for the year ended December 31, 2022. The decrease in Net cash used for investing activities was primarily driven by a decrease in cash deployed to acquire properties during the year ended December 31, 2023 as compared to the corresponding period in 2022. Refer to the Consolidated Statements of Cash Flows for detail on the net cash used for investing activities during the years ended December 31, 2023 and 2022. Refer to Note 3, "Real Estate Acquisitions and Dispositions" and Note 21, "Subsequent Events," in our accompanying Consolidated Financial Statements for additional information on acquisitions and investment activity subsequent to December 31, 2023.
Financing activities - Net cash provided by financing activities decreased by $2.3 billion to $80.3 million for the year ended December 31, 2023, compared to $2.3 billion for the year ended December 31, 2022. The decrease in Net cash provided by financing activities was primarily driven by a decrease in borrowings on our Senior Credit Facility, net of repayments, a decrease in issuance of common stock, OP units and preferred OP units, net, during the year ended December 31, 2023 as compared to the corresponding period in 2022. Refer to the Consolidated Statements of Cash Flows for detail on the net cash provided by financing activities during the years ended December 31, 2023 and 2022. Refer to Note 8, "Consolidated Variable Interest Entities," Note 9, "Debt and Line of Credit" and Note 10, "Equity and Temporary Equity," in our accompanying Consolidated Financial Statements for additional information.
72
SUN COMMUNITIES, INC.
We are exposed to interest rate variability associated with our outstanding floating rate debt and any maturing debt that has to be refinanced. Interest rate movements impact our borrowing costs and, while as of December 31, 2023, over 84% of our total debt was fixed rate financing, including the impact of hedge activity, increases in interest costs are likely to adversely affect our financial results.
Equity and Debt Activity
Public Equity Offerings
In November 2021, we entered into forward sale agreements in connection with an underwritten registered public offering of 4,025,000 shares of our common stock at a public offering price of $185.00 per share. In April 2022, we completed the physical settlement of the 4,025,000 shares of common stock and received aggregate net proceeds of $705.4 million. We used the net proceeds to repay borrowings outstanding under our Senior Credit Facility, and for working capital and general corporate purposes.
At the Market Offering Sales Agreement
In December 2021, we entered into an At the Market Offering Sales Agreement (the "Sales Agreement"), with certain sales agents and forward sellers pursuant to which we may sell, from time to time, up to an aggregate gross sales price of $1.25 billion of our common stock through the sales agents, acting as our sales agents or, if applicable, as forward sellers, or directly to the sales agents as principals for their own accounts. We simultaneously terminated our prior sales agreement upon entering into the Sales Agreement. Through December 31, 2023, we had entered into forward sales agreements under our Sales Agreement for an aggregate gross sales price of $160.6 million.
During the three months ended September 30, 2022, we entered into forward sale agreements with respect to 15,000 shares of common stock under our Sales Agreement for $2.6 million. Additionally, we settled all of our outstanding forward sale agreements with respect to 1,526,212 shares of common stock which includes 620,109; 600,503; 290,600; and 15,000 shares of common stock from the three months ended December 31, 2021, March 31, June 30 and September 30, 2022 forward sale agreements, respectively. The net proceeds of $275.5 million from the settlement of these forward sale agreements were used to repay borrowings outstanding under our Senior Credit Facility.
During the three months ended June 30, 2022, we completed the physical settlement of 1,200,000 shares of common stock under our prior at the market offering program and received net proceeds of $229.5 million. Additionally, we entered into forward sales agreements with respect to 290,600 shares of common stock for $50.1 million, under our Sales Agreement. These forward sale agreements were settled during the three months ended September 30, 2022.
During the three months ended March 31, 2022, we entered into forward sales agreements with respect to 600,503 shares of common stock for $107.9 million, under our Sales Agreement. These forward sale agreements were settled during the three months ended September 30, 2022.
During the year ended December 31, 2021, we entered into forward sale agreements with respect to 1,820,109 shares of common stock under our prior at the market offering program for $356.5 million. We completed the physical settlement of 1,200,000 and 620,109 shares of common stock during the three months ended June 30, 2022 and September 30, 2022, respectively.
Marketable Securities
In October 2023, we sold our 41.8 million share position in Ingenia Communities Group (ASX: INA), generating $102.5 million of proceeds, net of underwriting and other fees, with a realized loss of $8.0 million. The proceeds were used to pay down amounts drawn under our Senior Credit Facility.
Secured Debt
During the three months ended December 31, 2023, we entered into new mortgage term loans for $252.8 million that mature in November 1, 2030 and bear interest at a fixed rate of 6.49%. As a result of the new mortgage term loans, two additional properties were encumbered. We used the proceeds to repay $117.8 million of mortgage term loans that matured on November 30, 2023 and pay down amounts drawn under our Senior Credit Facility. The effective interest rate on the new secured loans is 6.251% inclusive of the impact of the aforementioned terminated swap of $50.0 million.
73
SUN COMMUNITIES, INC.
During the three months ended March 31, 2023, we entered into mortgage term loans totaling $184.1 million related to 27 properties which mature between February 13, 2026 and April 1, 2033, and have a weighted average fixed interest rate of 5.39%. We used the net proceeds to repay borrowings outstanding under our Senior Credit Facility.
During the year ended December 31, 2022, we entered into a new $20.6 million construction loan, which was undrawn as of December 31, 2023, and a $3.4 million mortgage term loan that are jointly secured by one property. Both loans mature on August 10, 2047 and have a fixed interest rate of 3.65%. Additionally, we entered into a mortgage term loan of $226.0 million related to 18 existing encumbered properties, which mature between June 15, 2026 and December 15, 2029, and have a fixed interest rate of 4.5%.
During the three months ended September 30, 2022, we repaid $318.0 million of term loans collateralized by 35 properties. These loans had a weighted average interest rate of 4.81% and were set to mature from December 6, 2022 through September 6, 2024.
Senior Unsecured Notes
Subsequent to the three months ended December 31, 2023, the Operating Partnership issued $500.0 million of senior unsecured notes with an interest rate of 5.5% and a five-year term, due January 15, 2029. The net proceeds from the offering were $495.4 million, after deducting underwriters' discounts and estimated offering expenses. We used the majority of the net proceeds to repay borrowings outstanding under our Senior Credit Facility, reducing our floating-rate debt to total debt to approximately 10%. In connection with the note issuance, we settled seven forward swap contracts totaling $255.0 million and paid a net settlement payment of $2.3 million to several counterparties. Refer to Note 21, "Subsequent Events," in our accompanying Consolidated Financial Statements for additional information.
The following table sets forth certain information regarding our outstanding senior unsecured notes (in millions). All senior unsecured notes include interest payments on a semi-annual basis in arrears.
| Carrying Amount | ||||||||||||||||||||
| Principal Amount | December 31, 2023 | December 31, 2022 | ||||||||||||||||||
5.7% notes, issued in January 2023 and due in January 2033(1) | $ | 400.0 | $ | 395.7 | $ | — | ||||||||||||||
4.2% notes, issued in April 2022 and due in April 2032 | 600.0 | 592.6 | 591.8 | |||||||||||||||||
2.3% notes, issued in October 2021 and due in November 2028 | 450.0 | 446.8 | 446.2 | |||||||||||||||||
2.7% notes, issued in June 2021 and October 2021, and due in July 2031 | 750.0 | 742.4 | 741.6 | |||||||||||||||||
| Total | $ | 2,200.0 | $ | 2,177.5 | $ | 1,779.6 | ||||||||||||||
(1) In January 2023, the Operating Partnership issued $400.0 million of senior unsecured notes with an interest rate of 5.7% and a 10-year term, due January 15, 2033 (the "2033 Notes"). Interest on the notes is payable semi-annually in arrears on January 15 and July 15 of each year, beginning on July 15, 2023. The net proceeds from the offering were $395.3 million, after deducting underwriters' discounts and estimated offering expenses. We used the net proceeds from the offering to repay borrowings outstanding under our Senior Credit Facility.
The obligations of the Operating Partnership to pay principal, premiums, if any, and interest on our senior unsecured notes are guaranteed on a senior basis by Sun Communities, Inc. The guarantee is full and unconditional, and the Operating Partnership is a consolidated subsidiary of the Company. Under Rule 3-10 of Regulation S-X, as amended, subsidiary issuers of obligations guaranteed by its parent company are not required to provide separate financial statements, provided that the subsidiary obligor is consolidated into the parent company's consolidated financial statements, the parent guarantee is "full and unconditional" and, subject to certain exceptions, the alternative disclosure required by Rule 13-01 is provided, which includes narrative disclosure and summarized financial information. Accordingly, separate consolidated financial statements of the Operating Partnership have not been presented. Furthermore, as permitted under Rule 13-01(a)(4)(vi), we have excluded the summarized financial information for the Operating Partnership as the assets, liabilities and results of operations of the Operating Partnership are not materially different from the corresponding amounts presented in our consolidated financial statements and management believes such summarized financial information would be repetitive and not provide incremental value to investors.
Line of Credit
In April 2022, the Operating Partnership as borrower, SUI as guarantor, and certain lenders entered into the Credit Facility Amendment, which amended our Senior Credit Facility.
74
SUN COMMUNITIES, INC.
The Credit Facility Amendment increased the aggregate amount of our Senior Credit Facility to $4.2 billion with the ability to upsize the total borrowings by an additional $800.0 million, subject to certain conditions. The increased aggregate amount under the Senior Credit Facility consists of the following: (a) a revolving loan in an amount up to $3.05 billion and (b) a term loan facility of $1.15 billion, with the ability to draw funds from the combined facilities in U.S. dollars, Pound sterling, Euros, Canadian dollars and Australian dollars, subject to certain limitations. The Credit Facility Amendment extended the maturity date of the revolving loan facility to April 7, 2026. At our option that maturity date may be extended two additional six-month periods. In addition, the Credit Facility Amendment established the maturity date of the term loan facility under the Credit Facility Amendment as April 7, 2025, which may not be further extended.
The Senior Credit Facility bears interest at a floating rate based on the Adjusted Term Secured Overnight Financing Rate ("SOFR"), the Adjusted Eurocurrency Rate, the Australian Bank Bill Swap Bid Rate ("BBSY"), the Daily Sterling Overnight Index Average ("SONIA") Rate or the Canadian Dollar Offered Rate, as applicable, plus a margin, in all cases, which can range from 0.725% to 1.6%, subject to certain adjustments. As of December 31, 2023, the margins based on our credit ratings were 0.85% on the revolving loan facility and 0.95% on the term loan facility.
At the lenders' option, the Senior Credit Facility will become immediately due and payable upon an event of default under the Credit Facility Agreement. We had $944.1 million and $1.1 billion of borrowings outstanding under the revolving loan as of December 31, 2023 and 2022, respectively. We also had $1.1 billion of borrowings outstanding under the term loan on the Senior Credit Facility as of December 31, 2023 and 2022, respectively. These balances are recorded in Unsecured debt on the Consolidated Balance Sheets.
The Senior Credit Facility provides us with the ability to issue letters of credit. Our issuance of letters of credit does not increase our borrowings outstanding under the Senior Credit Facility, but does reduce the borrowing amount available. We had $26.2 million and $2.6 million of outstanding letters of credit at December 31, 2023 and 2022, respectively.
Financial Covenants
Pursuant to the terms of the Senior Credit Facility, we are subject to various financial and other covenants. The most restrictive financial covenants for the Senior Credit Facility are as follows:
| Covenant | Requirement | As of December 31, 2023 | ||||||||||||
| Maximum leverage ratio | <65.0% | 35.9% | ||||||||||||
| Minimum fixed charge coverage ratio | >1.40 | 3.02 | ||||||||||||
| Maximum secured leverage ratio | <40.0% | 13.8% | ||||||||||||
In addition, we are required to maintain the following covenants with respect to the senior unsecured notes payable:
| Covenant | Requirement | As of December 31, 2023 | ||||||||||||
| Total debt to total assets | ≤60.0% | 41.7% | ||||||||||||
| Secured debt to total assets | ≤40.0% | 18.9% | ||||||||||||
| Consolidated income available for debt service to debt service | ≥1.50 | 3.97 | ||||||||||||
| Unencumbered total asset value to total unsecured debt | ≥150.0% | 335.2% | ||||||||||||
As of December 31, 2023, we were in compliance with the above covenants and do not anticipate that we will be unable to meet these covenants in the near term.
75
SUN COMMUNITIES, INC.
Derivative Transactions
We enter into treasury rate lock contracts, interest rate swaps, and forward swaps for interest rate risk management purposes. We do not enter into derivative instruments for speculative purposes. The risks being hedged are the interest rate risk related to outstanding floating rate debt and forecasted debt issuance transactions, and the benchmark interest rates used are the SOFR and the SONIA Rate.
Subsequent to the three months ended December 31, 2023, in connection with the issuance of $500.0 million of senior unsecured notes with an interest rate of 5.5% and a five-year term, due January 15, 2029, we settled seven forward swap contracts totaling $255.0 million and paid a net settlement payment of $2.3 million to several counterparties. Refer to Note 21, "Subsequent Events," in our accompanying Consolidated Financial Statements for additional information.
During the year ended December 31, 2023, we entered into derivative contracts with aggregate notional amounts of $582.3 million and terminated derivative contracts with aggregate notional amounts of $300.0 million and received an aggregate cash settlement of $13.4 million.
During the year ended December 31, 2022, we entered into derivative contracts with aggregate notional amounts of $733.6 million, and terminated derivative contracts with aggregate notional amounts of $600.0 million and received an aggregate cash settlement of $35.3 million.
Long-term Financing and Capital Requirements
Long-term Financing
We anticipate meeting our long-term liquidity requirements, such as scheduled debt maturities, large property acquisitions, expansion and development of properties, other nonrecurring capital improvements and Operating Partnership unit redemptions through the long-term unsecured and secured debt and the issuance of certain debt or equity securities subject to market conditions. If current market and economic conditions, including relating to, among other things, interest rates, currency fluctuations, equity valuations and inflation, continue or worsen, our ability to obtain debt and equity capital in the long term on attractive terms may be adversely affected.
As of December 31, 2023, we had unrestricted cash on hand of $29.2 million, $2.0 billion of remaining capacity on the Senior Credit Facility, and a total of 511 unencumbered MH, RV and marina properties.
From time to time, we may also issue shares of our capital stock, issue equity units in our Operating Partnership, issue unsecured notes, obtain other debt financing or sell selected assets. Our ability to finance our long-term liquidity requirements in such a manner will be affected by numerous economic factors affecting the MH, RV and marina industries at the time, including the availability and cost of mortgage debt, our financial condition, the operating history of the properties, the state of the debt and equity markets, and the general national, regional and local economic conditions. When it becomes necessary for us to approach the credit markets, the volatility in those markets could make borrowing more difficult to secure, more expensive or effectively unavailable. In the event our current credit ratings are downgraded, it may become difficult or more expensive to obtain additional financing or refinance existing unsecured debt as maturities become due. Refer to "Risk Factors" in Part I, Item 1A of this Annual Report on Form 10-K. If we are unable to obtain additional debt or equity financing on acceptable terms, our business, results of operations and financial condition would be adversely impacted.
As of December 31, 2023, our net debt to enterprise value was 30.9% (assuming conversion of all common OP units, Series A-1 preferred OP units, Series A-3 preferred OP units, Series C preferred OP units, Series D preferred OP units, Series E preferred OP units, Series F preferred OP units, Series G preferred OP units, Series H preferred OP units, Series J preferred OP units, Series K preferred OP units and Series L preferred OP units to shares of common stock). Our debt has a weighted average interest rate of 4.23% and a weighted average years to maturity of 6.8.
76
SUN COMMUNITIES, INC.
Capital Requirements
Our capital requirements as of December 31, 2023 include both short and long term obligations:
Our primary long-term liquidity needs are principal payments on outstanding debt as summarized in the table below:
| Payments Due By Period (in millions) | ||||||||||||||||||||||||||
Outstanding Debt(1) | Total Due | Short-term Obligation ≤1 Year | Long-term Obligation After 1 Year | Refer to | ||||||||||||||||||||||
| Principal payments on long-term debt | $ | 7,816.4 | $ | 195.4 | $ | 7,621.0 | Note 9. Debt and Line of Credit | |||||||||||||||||||
Interest expense(2) | 1,712.9 | 229.3 | 1,483.6 | |||||||||||||||||||||||
| Operating leases | 296.2 | 13.9 | 282.3 | Note 18. Leases | ||||||||||||||||||||||
| Finance lease | 28.1 | 4.6 | 23.5 | Note 18. Leases | ||||||||||||||||||||||
| Total Outstanding Debt | $ | 9,853.6 | $ | 443.2 | $ | 9,410.4 | ||||||||||||||||||||
(1)Our outstanding debt in this table excludes debt premiums, discounts, deferred financing costs and fair value adjustment, as applicable.
(2)Our obligations related to interest expense are calculated based on the current debt levels, rates and maturities as of December 31, 2023 (including finance leases), and actual payments required in future periods may be different than the amounts included above. Perpetual securities include one year of interest expense for payment due after five years.
Certain of our nonconsolidated affiliates, which are accounted for under the equity-method of accounting, have incurred debt. We have not guaranteed the debt of our nonconsolidated affiliates in the arrangements referenced below, nor do we have any obligations to fund this debt should the nonconsolidated affiliates be unable to do so. Refer to Note 7, "Investments in Nonconsolidated Affiliates," in the accompanying Consolidated Financial Statements for additional information about these entities.
GTSC - During September 2019, GTSC entered into a warehouse line of credit with a maximum loan amount of $125.0 million. The line of credit was subsequently amended, with the maximum amount increased to $325.0 million as of December 31, 2022, with an option to increase to $375.0 million subject to the lender's consent. As of December 31, 2023 and 2022, the aggregate carrying amount of debt, including both our and our partner's share, incurred by GTSC was $261.3 million (of which our proportionate share is $104.5 million), and $275.0 million (of which our proportionate share is $110.0 million), respectively. The debt bears interest at a variable rate based on a Commercial Paper or adjusted SOFR plus a margin ranging from 1.65% to 2.5% per annum and matures on December 15, 2026.
Sungenia JV - During May 2020, Sungenia JV, entered into a debt facility agreement with a maximum loan amount of $27.0 million Australian dollars, or $18.4 million converted at the December 31, 2023 exchange rate. During July 2022, the maximum amount was increased to $50.0 million Australian dollars, or $34.1 million converted at the December 31, 2023 exchange rate. As of December 31, 2023 and 2022, the aggregate carrying amount of the debt, including both our and our partners' share, incurred by Sungenia JV was $25.2 million (of which our proportionate share is approximately $12.6 million), and $7.9 million (of which our proportionate share is $4.0 million), respectively. The debt bears interest at a variable rate based on the BBSY rate plus a margin ranging from 1.35% to 1.4%, subject to adjustment for additional future commitments, per annum and matures on June 30, 2027.
77
SUN COMMUNITIES, INC.
SIGNIFICANT ACCOUNTING POLICIES AND CRITICAL ACCOUNTING ESTIMATES
Critical Accounting Estimates
Our Consolidated Financial Statements are prepared in accordance with United States of America generally accepted accounting principles, which require the use of estimates, judgments and assumptions that affect the reported amounts of assets and liabilities, the disclosure of contingent assets and liabilities at the date of the financial statements, and the reported amounts of revenues and expenses in the periods presented. We believe that the accounting estimates employed are appropriate and resulting balances are reasonable; however, due to inherent uncertainties in making estimates, actual results could differ from the original estimates, requiring adjustments to these balances in future periods.
Our significant accounting estimates include acquisitions of investment properties, impairments of long-lived assets, and impairments of goodwill. Refer to Note 1, "Significant Accounting Policies," in our accompanying Consolidated Financial Statements for information regarding our critical accounting estimates that affect the Consolidated Financial Statements and that use judgments and assumptions. In certain situations, we discuss the likelihood that materially different amounts could be reported under varied conditions and assumptions.
Goodwill Impairment
In performing goodwill impairment testing, we utilize a third-party valuation specialist to assist management in determining the fair value of our reporting units. The fair value of each reporting unit is estimated based on a combination of discounted cash flows (income approach) and the use of pricing multiples derived from an analysis of comparable public companies multiplied against historical and / or anticipated financial metrics (market approach) for each reporting unit. These calculations contain uncertainties as they require management to make assumptions including, but not limited to, market comparables, future cash flows of the reporting units, and appropriate weighted average cost of capital and long-term growth rates. A decline in the actual cash flows of our reporting units in future periods, as compared to the projected cash flows used in our valuations, could result in the carrying value of the reporting units exceeding their respective fair values. Further, a change in market comparables, discount rate or long-term growth rates, as a result of a change in economic conditions or otherwise, could result in the carrying values of the reporting units exceeding their respective fair values. Refer to Note 6, "Goodwill and Other Intangible Assets," in our accompanying Consolidated Financial Statements for additional information regarding goodwill.
During the year ended December 31, 2023, we performed qualitative and quantitative assessments of our goodwill balance for potential impairment in accordance with ASC 350-20, "Goodwill and Other." As a result of our impairment testing, we determined that the fair value of the UK reporting unit was below its carrying value during the first, second and third quarters, and recorded aggregate non-cash impairment charges of $369.9 million. The decline in the fair value of the UK reporting unit was primarily driven by a higher weighted average cost of capital due to changes in the macroeconomic environment, as well as inflationary pressures in the UK causing a decline in projected future cash flows in the region. Refer to Note 22, "Quarterly Financial Data (Unaudited and Restated)," in our accompanying Consolidated Financial Statements for additional information regarding amounts reported for interim periods.
We performed a sensitivity analysis for the significant assumptions in the goodwill impairment testing analysis for our UK reporting unit. As of December 31, 2023, holding all other assumptions constant and as determined by the income approach:
•A hypothetical increase of approximately 70 basis points to the discount rate would result in goodwill impairment of approximately $32.0 million;
•A hypothetical decrease in the expected average annual revenue growth rate of approximately 40 basis points over the entire forecast period would result in goodwill impairment of approximately $32.0 million;
•A hypothetical decrease of approximately 280 basis points in the expected EBITDA margins in each year over the entire forecast period would result in goodwill impairment of approximately $32.0 million.
Our other reporting units are less sensitive to changes in macroeconomic factors and forecast assumptions than our UK reporting unit due to greater excess of fair value over carrying value. For the Marina reporting unit, we concluded that the fair value exceeded its carrying value by over 19% as of October 31, 2023. We did not identify a triggering event in any other reporting unit.
Impact of New Accounting Standards
Refer to Note 20, "Recent Accounting Pronouncements," in our accompanying Consolidated Financial Statements for information regarding new accounting pronouncements.
78
SUN COMMUNITIES, INC.
ITEM 7A. QUANTITATIVE AND QUALITATIVE DISCLOSURES ABOUT MARKET RISK
Market risk is the exposure to loss resulting from changes in market factors such as interest rates, foreign currency exchange rates, commodity prices and equity prices.
Interest Rate Risk
Our principal market risk exposure is interest rate risk. We mitigate this risk by maintaining prudent amounts of leverage, minimizing capital costs and interest expense while continuously evaluating all available debt and equity resources and following established risk management policies and procedures, which include the periodic use of derivatives. Our primary strategy in entering into derivative contracts is to minimize the variability that interest rate changes could have on our future cash flows. From time to time, we employ derivative instruments that effectively convert a portion of our variable rate debt to fixed rate debt. We do not enter into derivative instruments for speculative purposes.
Our variable rate debt totaled $1.3 billion and $1.7 billion as of December 31, 2023 and 2022, respectively, after adjusting for the impact of hedging in place through the use of interest rate swaps. As of December 31, 2023 and 2022, our variable debt bore interest at the Adjusted Term SOFR, the Adjusted Eurocurrency Rate, the Australian BBSY rate, the Daily SONIA Rate or the Canadian Dollar Offered Rate, and the Eurodollar rate or Prime rate plus a margin. If the above rates increased or decreased by 1.0%, our interest expense would have increased or decreased by $13.8 million and $14.2 million for the years ended December 31, 2023 and 2022, respectively, based on the $1.4 billion average balances outstanding under our variable rate debt facilities for the years ended December 31, 2023 and 2022, respectively. Our variable rate debt, interest expense and average balance outstanding under our variable rate debt facility includes the impact of hedge activity.
Foreign Currency Exchange Rate Risk
Foreign currency exchange rate risk is the risk that fluctuations in currencies against the U.S. dollar will negatively impact our results of operations. We are exposed to foreign currency exchange rate risk as a result of remeasurement and translation of the assets and liabilities of our properties in the UK and Canada, and our joint venture in Australia, into U.S. dollars. Fluctuations in foreign currency exchange rates can therefore create volatility in our results of operations and may adversely affect our financial condition.
At December 31, 2023 and 2022, our shareholder's equity included $893.9 million and $1.2 billion from our investments and operations in the UK, Canada, and Australia, which collectively represented 12.5% and 14.9% of total shareholder's equity, respectively. Based on our sensitivity analysis, a 10.0% strengthening of the U.S. dollar against the Pound sterling, Canadian dollar and Australian dollar would have caused a reduction of $89.4 million and $117.9 million to our total shareholder's equity at December 31, 2023 and 2022, respectively.
Capital Market Risk
We are exposed to risks related to the equity capital markets, and our related ability to raise capital through the issuance of our common stock or other equity instruments. We are also exposed to risks related to the debt capital markets, and our related ability to finance our business through borrowings under other financing arrangements. As a REIT, we are required to distribute a significant portion of our taxable income annually, which constrains our ability to accumulate operating cash flow and therefore requires us to utilize debt or equity capital to finance our business. We seek to mitigate these risks by monitoring the debt and equity capital markets to inform our decisions on the amount, timing and terms of capital we raise.
79
SUN COMMUNITIES, INC.
ITEM 8. FINANCIAL STATEMENTS AND SUPPLEMENTARY DATA
Financial statements and supplementary data are filed herewith under Item 15.
ITEM 9. CHANGES IN AND DISAGREEMENTS WITH ACCOUNTANTS ON ACCOUNTING AND FINANCIAL
DISCLOSURE
None.
ITEM 9A. CONTROLS AND PROCEDURES
Evaluation of disclosure controls and procedures
We maintain disclosure controls and procedures designed to ensure that information required to be disclosed in reports filed under the Exchange Act is recorded, processed, summarized and reported within the specified time periods and accumulated and communicated to our management, including our principal executive officer and principal financial officer, as appropriate to allow timely decisions regarding required disclosure. An evaluation of the effectiveness of the design and operation of our disclosure controls and procedures as of the end of the period covered by this Annual Report was made under the supervision and with the participation of our management, including our principal executive officer and principal financial officer.
Based upon this evaluation, our principal executive officer and principal financial officer have concluded that, as of December 31, 2023, our disclosure controls and procedures were not effective as of such date due to a material weakness in internal control over financial reporting, as described below.
Management's report on internal control over financial reporting
Our management is responsible for establishing and maintaining effective internal control over financial reporting as defined in Rules 13a-15(f) and 15d-15(f) under the Exchange Act. This system is designed to provide reasonable assurance regarding the reliability of financial reporting and the preparation of consolidated financial statements for external purposes in accordance with GAAP. Because of the inherent limitations of internal control over financial reporting, including the possibility of collusion or improper management override of controls, misstatements due to error or fraud may not be prevented or detected on a timely basis.
Our management performed an assessment of the effectiveness of our internal control over financial reporting as of December 31, 2023, utilizing the criteria discussed in the Internal Control - Integrated Framework (2013) issued by the Committee of Sponsoring Organizations of the Treadway Commission. The objective of this assessment was to determine whether our internal control over financial reporting was effective as of December 31, 2023. Based on management's assessment, we have concluded that our internal control over financial reporting was ineffective as of December 31, 2023, due to the material weakness described below.
A material weakness is a deficiency, or a combination of deficiencies, in internal control over financial reporting, such that there is a reasonable possibility that a material misstatement of our annual or interim financial statements will not be prevented or detected on a timely basis.
As of December 31, 2023, there was a material weakness relating to the design of management's review controls and failure to identify triggering events including reduced financial projections and increased interest rates, relevant to the evaluation of goodwill impairment relating to our Park Holidays business within the MH segment.
The effectiveness of our internal control over financial reporting has been audited by Grant Thornton LLP, an independent registered public accounting firm, as stated in its report included herein. This report contains an adverse opinion on the effectiveness of our internal control over financial reporting.
80
SUN COMMUNITIES, INC.
Plan for remediation of the material weakness
The Company and its Board of Directors are committed to maintaining a strong internal control environment. Management, with oversight from the Audit Committee of the Board of Directors, has begun developing a comprehensive plan to remediate the material weakness. Remediation efforts are focused on more rigorous policies and procedures and sufficiency of reviews for the Company's evaluation of goodwill for impairment. These efforts will include enhanced education and training from third party specialists, development of a continuous process for monitoring, assessment and communication, as well as involvement of additional key stakeholders in reviews.
We will not be able to conclude whether these efforts will fully remediate the material weakness until the updated controls have operated for a sufficient period of time and management has concluded, through testing, that such controls are operating effectively.
Changes in internal control over financial reporting
Except as discussed above, there were no changes in internal control over financial reporting during the quarter ended December 31, 2023, that have materially affected, or are reasonably likely to materially affect, our internal control over financial reporting.
ITEM 9B. OTHER INFORMATION
None.
81
SUN COMMUNITIES, INC.
PART III
ITEM 10. DIRECTORS, EXECUTIVE OFFICERS AND CORPORATE GOVERNANCE
Pursuant to the general instructions of Item 401 of Regulation S-K, certain information regarding our executive officers is contained in Part I of this Form 10-K. Unless provided in an amendment to this Annual Report on Form 10-K, the other information required by this Item is incorporated herein by reference to the applicable information in the proxy statement for our 2024 annual meeting (the "Proxy Statement,") including the information set forth under the captions "Proposal No.1 Election of Directors - Consideration of Director Nominees," "Corporate Governance - Board of Directors," "Corporate Governance - Board of Directors - Board Structure - Committees of the Board of Directors," "Security Ownership Information - Security Ownership of Directors and Executive Officers," and "Information About Executive Officers - Executive Officers Biographies."
ITEM 11. EXECUTIVE COMPENSATION
Unless provided in an amendment to this Annual Report on Form 10-K, the information required by this Item is incorporated by reference to the applicable information in the Proxy Statement, including the information set forth under the captions "Corporate Governance - Board of Directors - Board Structure - Compensation Committee Interlocks and Insider Participation," "Director Compensation," and "Compensation Discussion and Analysis." The information in the section captioned "Compensation Committee Report" in the Proxy Statement or an amendment to this Annual Report on Form 10-K is incorporated by reference herein but shall be deemed furnished, not filed, and shall not be deemed to be incorporated by reference into any filing we make under the Securities Act or the Exchange Act.
ITEM 12. SECURITY OWNERSHIP OF CERTAIN BENEFICIAL OWNERS AND MANAGEMENT AND RELATED
SHAREHOLDER MATTERS
Unless provided in an amendment to this Annual Report on Form 10-K, the information required by this Item is incorporated by reference to the applicable information in the Proxy Statement, including the information set forth under the captions "Security Ownership Information."
ITEM 13. CERTAIN RELATIONSHIPS AND RELATED TRANSACTIONS, AND DIRECTOR INDEPENDENCE
Unless provided in an amendment to this Annual Report on Form 10-K, the information required by this Item is incorporated by reference to the Proxy Statement, including the information set forth under the captions "Corporate Governance - Board of Directors," "Corporate Governance - Board of Directors - Board Structure - Committees of the Board of Directors," "Corporate Governance - Board of Directors - Board Structure - Leadership Structure and Independence of Non-Employee Directors," and "Corporate Governance - Board of Directors - Other Board Policies and Processes - Certain Relationships and Related Party Transactions."
ITEM 14. PRINCIPAL ACCOUNTANT FEES AND SERVICES
Unless provided in an amendment to this Annual Report on Form 10-K, the information required by this Item is incorporated by reference to the Proxy Statement, including the information set forth under the caption for the proposal related to "Ratification of Selection of Grant Thornton LLP."
82
SUN COMMUNITIES, INC.
PART IV
ITEM 15. EXHIBITS AND FINANCIAL STATEMENT SCHEDULES
The following documents are filed herewith as part of this Form 10-K:
1. Financial Statements
A list of the financial statements required to be filed as a part of this Annual Report on Form 10‑K is shown in the "Index to the Consolidated Financial Statements and Financial Statement Schedules" filed herewith.
2. Financial Statement Schedules
The financial statement schedules required to be filed as a part of this Annual Report on Form 10‑K is shown in the "Index to the Consolidated Financial Statements and Financial Statement Schedules" filed herewith.
3. Exhibits
A list of the exhibits required by Item 601 of Regulation S‑K to be filed as a part of this Annual Report on Form 10-K is filed herewith.
ITEM 16. FORM 10-K SUMMARY
None.
83
SUN COMMUNITIES, INC.
EXHIBITS
| Exhibit Number | Description | Method of Filing | ||||||
| 3.1 | Incorporated by reference to Exhibit 3.1 of Sun Communities, Inc.'s Annual Report on Form 10-K filed on February 22, 2018 | |||||||
| 3.2 | Incorporated by reference to Exhibit 3.1 of Sun Communities, Inc.'s Current Report on Form 8-K filed on February 21, 2023 | |||||||
| 3.3 | Incorporated by reference to Exhibit 3.1 to Sun Communities, Inc.'s Current Report on Form 8-K filed on May 19, 2023 | |||||||
| 4.1 | Incorporated by reference to Exhibit 4.1 of Sun Communities, Inc.'s Annual Report on Form 10-K filed for the year ended December 31, 2019 | |||||||
| 4.2 | Incorporated by reference to Exhibit 4.1 of Sun Communities Inc.'s Current Report on Form 8-K filed on June 28, 2021 | |||||||
| 4.3 | Incorporated by reference to Exhibit 4.2 of Sun Communities Inc.'s Current Report on Form 8-K filed on June 28, 2021 | |||||||
| 4.4 | Incorporated by reference to Exhibit 4.3 of Sun Communities Inc.'s Current Report on Form 8-K filed on June 28, 2021 | |||||||
| 4.5 | Incorporated by reference to Exhibit 4.3 of Sun Communities Inc.'s Current Report on Form 8-K filed on October 5, 2021 | |||||||
| 4.6 | Incorporated by reference to Exhibit 4.4 of Sun Communities Inc.'s Current Report on Form 8-K filed on October 5, 2021 | |||||||
| 4.7 | Incorporated by reference to Exhibit 4.2 of Sun Communities Inc.'s Current Report on Form 8-k filed on April 12, 2022 | |||||||
| 4.8 | Incorporated by reference to Exhibit 4.3 of Sun Communities Inc.'s Current Report on Form 8-K filed on April 12, 2022 | |||||||
| 4.9 | Incorporated by reference to Exhibit 4.2 of Sun Communities Inc.'s Current Report on Form 8-K filed on January 17, 2023 | |||||||
| 4.10 | Incorporated by reference to Exhibit 4.3 of Sun Communities Inc.'s Current Report on Form 8-K filed on January 17, 2023 | |||||||
| 4.11 | Incorporated by reference to Exhibit 4.2 of Sun Communities Inc.'s Current Report on Form 8-K filed on January 11, 2024 | |||||||
| 4.12 | Incorporated by reference to Exhibit 4.3 of Sun Communities Inc.'s Current Report on Form 8-K filed on January 11, 2024 | |||||||
| 10.1* | Incorporated by reference to Exhibit 10.61 of Sun Communities, Inc.'s Annual Report on Form 10-K for the year ended December 31, 2002, as amended | |||||||
| 10.2* | Incorporated by reference to Exhibit 10.9 of Sun Communities, Inc.'s Annual Report on Form 10-K filed on February 21, 2019 | |||||||
| 10.3* | Incorporated by reference to Exhibit 10.1 of Sun Communities, Inc.'s Current Report on Form 8-K filed January 13, 2020 | |||||||
| 10.4* | Incorporated by reference to Exhibit 10.1 of Sun Communities, Inc.'s Current Report on Form 8-K filed May 18, 2020 | |||||||
| 10.5* | Incorporated by reference to Exhibit 10.1 of Sun Communities, Inc.'s Current Report on Form 8-K filed October 6, 2020 | |||||||
| 10.6* | Incorporated by reference to Exhibit 10.1 of Sun Communities, Inc.'s Current Report on Form 8-K filed November 5, 2020 | |||||||
| 10.7* | Incorporated by reference to Exhibit 10.1 of Sun Communities, Inc.'s Current Report on Form 8-K filed January 4, 2021 | |||||||
| 10.8* | Incorporated by reference to Exhibit 10.1 of Sun Communities Inc.'s Current Report on Form 8-K filed on April 23, 2021 | |||||||
| 10.9* | Incorporated by reference to Exhibit 10.1 to Sun Communities, Inc.'s Current Report on Form 8-K filed on March 27, 2023 | |||||||
| 10.10* | Incorporated by reference to Exhibit 10.1 to Sun Communities, Inc.'s Current Report on Form 8-K filed on January 3, 2024 | |||||||
| 10.11# | Incorporated by reference to Exhibit 10.1 of Sun Communities, Inc.'s Current Report on Form 8-K filed July 25, 2012 | |||||||
| 10.12# | Incorporate by reference to Exhibit A of Sun Communities, Inc.'s Definitive Proxy Statement filed on March 29, 2018 | |||||||
84
SUN COMMUNITIES, INC.
| 10.13# | Incorporated by reference to Exhibit 10.1 of Sun Communities Inc.'s Current Report on Form 10-Q filed on April 26, 2022 | |||||||
| 10.14# | Incorporated by reference to Appendix A of Sun Communities, Inc.'s Proxy Statement filed on April 29, 2015 | |||||||
| 10.15# | Incorporated by reference to Appendix C of Sun Communities, Inc.'s Definitive Proxy Statement filed on April 4, 2022 | |||||||
| 10.16# | Incorporated by reference to Exhibit 10.4 of Sun Communities Inc.'s Current Report on Form 8-K filed on April 13, 2022 | |||||||
| 10.17# | Incorporated by reference to Exhibit 10.14 of Sun Communities, Inc.'s Current Report on Form 10-K filed February 22, 2022 | |||||||
| 10.18# | Incorporated by reference to Exhibit 10.1 of Sun Communities, Inc.'s Current Report on Form 8-K filed on March 31, 2021 | |||||||
| 10.19# | Incorporated by reference to Exhibit 10.1 of Sun Communities Inc.'s Current Report on Form 8-K filed on April 1, 2022 | |||||||
| 10.20# | Incorporated by reference to Exhibit 10.3 of Sun Communities Inc.'s Current Report on Form 8-K filed on April 13, 2022 | |||||||
| 10.21# | Incorporated by reference to Exhibit 10.1 of Sun Communities Inc.'s Current Report on Form 8-K filed on July 20, 2021 | |||||||
| 10.22# | Incorporated by reference to Exhibit 10.4 of Sun Communities Inc.'s Current Report on Form 8-K filed on April 1, 2022 | |||||||
| 10.23# | Incorporated by reference to Exhibit 10.1 of Sun Communities Inc.'s Current Report on Form 8-K filed on October 18, 2021 | |||||||
| 10.24# | Incorporated by reference to Exhibit 10.5 of Sun Communities Inc.'s Current Report on Form 8-K filed on April 1, 2022 | |||||||
| 10.25# | Filed herewith | |||||||
| 10.26#* | Incorporated by reference to Exhibit 10.1 of Sun Communities, Inc.'s Current Report on Form 8-K filed on September 29, 2020 | |||||||
| 10.27#* | Filed herewith | |||||||
| 10.28# | Filed herewith | |||||||
| 10.29* | Incorporated by reference to Exhibit 10.1 of Sun Communities Inc.'s Current Report on Form 8-K filed on June 14, 2021 | |||||||
| 10.30* | Incorporated by reference to Exhibit 10.1 of Sun Communities Inc.'s Current Report on Form 8-K filed on April 13, 2022 | |||||||
| 10.31* | Incorporated by reference to Exhibit 10.1 of Sun Communities Inc.'s Current Report on Form 8-K filed on February 16, 2024 | |||||||
| 21.1 | Filed herewith | |||||||
| 22.1 | Filed herewith | |||||||
| 23.1 | Filed herewith | |||||||
| 31.1 | Filed herewith | |||||||
| 31.2 | Filed herewith | |||||||
| 32.1 | Furnished herewith | |||||||
85
SUN COMMUNITIES, INC.
| 101.INS | XBRL Instance Document | The instance document does not appear in the Interactive Data File because its XBRL tags are embedded within the Inline XBRL document. | ||||||
| 101.SCH | XBRL Taxonomy Extension Schema Document | Filed herewith | ||||||
| 101.CAL | XBRL Taxonomy Extension Calculation Linkbase Document | Filed herewith | ||||||
| 101.DEF | XBRL Taxonomy Extension Definition Linkbase Document | Filed herewith | ||||||
| 101.LAB | XBRL Taxonomy Extension Label Linkbase Document | Filed herewith | ||||||
| 101.PRE | XBRL Taxonomy Extension Presentation Linkbase Document | Filed herewith | ||||||
| * | Certain schedules and exhibits have been omitted pursuance to Item 601(a)(5) of Regulation S-K because such schedules and exhibits do not contain information which is material to an investment decision or which is not otherwise disclosed in the filed agreements. The Company will furnish the omitted schedules and exhibits to the SEC upon request by the SEC. | |||||||
| # | Management contract or compensatory plan or arrangement | |||||||
86
SUN COMMUNITIES, INC.
SIGNATURES
Pursuant to the requirements of Section 13 or 15(d) of the Securities Exchange Act of 1934, the registrant has duly caused this report to be signed on its behalf by the undersigned, thereunto duly authorized.
SUN COMMUNITIES, INC. (Registrant) | |||||||||||
| Dated: February 27, 2024 | By | /s/ | Gary A. Shiffman | ||||||||
| Gary A. Shiffman, Chief Executive Officer | |||||||||||
Pursuant to the requirements of the Securities Exchange Act of 1934, this Annual Report on Form 10-K has been signed by the following persons on behalf of the registrant and in the capacities and on the dates indicated.
| Name | Capacity | Date | |||||||||||||||
| /s/ | Gary A. Shiffman | Chief Executive Officer, President and Chairman of the Board of Directors (Principal Executive Officer) | February 27, 2024 | ||||||||||||||
| Gary A. Shiffman | |||||||||||||||||
| /s/ | Fernando Castro-Caratini | Executive Vice President, Chief Financial Officer, Treasurer and Secretary (Principal Financial Officer and Principal Accounting Officer) | February 27, 2024 | ||||||||||||||
| Fernando Castro-Caratini | |||||||||||||||||
| /s/ | Tonya Allen | Director | February 27, 2024 | ||||||||||||||
| Tonya Allen | |||||||||||||||||
| /s/ | Meghan G. Baivier | Director | February 27, 2024 | ||||||||||||||
| Meghan G. Baivier | |||||||||||||||||
| /s/ | Stephanie W. Bergeron | Director | February 27, 2024 | ||||||||||||||
| Stephanie W. Bergeron | |||||||||||||||||
| /s/ | Jeff T. Blau | Director | February 27, 2024 | ||||||||||||||
| Jeff T. Blau | |||||||||||||||||
| /s/ | Jerome W. Ehlinger | Director | February 27, 2024 | ||||||||||||||
| Jerome W. Ehlinger | |||||||||||||||||
| /s/ | Brian M. Hermelin | Director | February 27, 2024 | ||||||||||||||
| Brian M. Hermelin | |||||||||||||||||
| /s/ | Ronald A. Klein | Director | February 27, 2024 | ||||||||||||||
| Ronald A. Klein | |||||||||||||||||
| /s/ | Craig A. Leupold | Director | February 27, 2024 | ||||||||||||||
| Craig A. Leupold | |||||||||||||||||
| /s/ | Clunet R. Lewis | Director | February 27, 2024 | ||||||||||||||
| Clunet R. Lewis | |||||||||||||||||
| /s/ | Arthur A. Weiss | Director | February 27, 2024 | ||||||||||||||
| Arthur A. Weiss | |||||||||||||||||
87
SUN COMMUNITIES, INC.
INDEX TO THE CONSOLIDATED FINANCIAL STATEMENTS AND
FINANCIAL STATEMENT SCHEDULES
| Page | |||||
Reports of Independent Registered Public Accounting Firm (PCAOB ID Number | F-2 | ||||
| Financial Statements: | |||||
Consolidated Balance Sheets as of December 31, 2023 and 2022 | F-7 | ||||
Consolidated Statements of Operations for the Years Ended December 31, 2023, 2022 and 2021 | F-8 | ||||
Consolidated Statements of Comprehensive Income / (Loss) for the Years Ended December 31, 2023, 2022 and 2021 | F-9 | ||||
Consolidated Statements of Shareholders' Equity for the Years Ended December 31, 2023, 2022 and 2021 | F-10 | ||||
Consolidated Statements of Cash Flows for the Years Ended December 31, 2023, 2022 and 2021 | F-11 | ||||
| Notes to Consolidated Financial Statements | F-13 | ||||
| Real Estate and Accumulated Depreciation, Schedule III | F-71 | ||||
F - 1
SUN COMMUNITIES, INC.
REPORT OF INDEPENDENT REGISTERED PUBLIC ACCOUNTING FIRM
Board of Directors and Shareholders
Sun Communities, Inc.
Opinion on the financial statements
We have audited the accompanying consolidated balance sheets of Sun Communities, Inc. (a Maryland corporation) and subsidiaries (the "Company") as of December 31, 2023 and 2022, the related consolidated statements of operations, comprehensive income, changes in shareholders' equity, and cash flows for each of the three years in the period ended December 31, 2023, and the related notes and financial statement schedule included under Item 15(a) (collectively referred to as the "financial statements"). In our opinion, the financial statements present fairly, in all material respects, the financial position of the Company as of December 31, 2023 and 2022, and the results of its operations and its cash flows for each of the three years in the period ended December 31, 2023, in conformity with accounting principles generally accepted in the United States of America.
We also have audited, in accordance with the standards of the Public Company Accounting Oversight Board (United States) ("PCAOB"), the Company's internal control over financial reporting as of December 31, 2023, based on criteria established in the 2013 Internal Control—Integrated Framework issued by the Committee of Sponsoring Organizations of the Treadway Commission ("COSO"), and our report dated February 27, 2024 expressed an adverse opinion.
Basis for opinion
These financial statements are the responsibility of the Company's management. Our responsibility is to express an opinion on the Company's financial statements based on our audits. We are a public accounting firm registered with the PCAOB and are required to be independent with respect to the Company in accordance with the U.S. federal securities laws and the applicable rules and regulations of the Securities and Exchange Commission and the PCAOB.
We conducted our audits in accordance with the standards of the PCAOB. Those standards require that we plan and perform the audit to obtain reasonable assurance about whether the financial statements are free of material misstatement, whether due to error or fraud. Our audits included performing procedures to assess the risks of material misstatement of the financial statements, whether due to error or fraud, and performing procedures that respond to those risks. Such procedures included examining, on a test basis, evidence regarding the amounts and disclosures in the financial statements. Our audits also included evaluating the accounting principles used and significant estimates made by management, as well as evaluating the overall presentation of the financial statements. We believe that our audits provide a reasonable basis for our opinion.
Critical audit matters
The critical audit matters communicated below are matters arising from the current period audit of the financial statements that were communicated or required to be communicated to the audit committee and that: (1) relate to accounts or disclosures that are material to the financial statements and (2) involved our especially challenging, subjective, or complex judgments. The communication of critical audit matters does not alter in any way our opinion on the financial statements, taken as a whole, and we are not, by communicating the critical audit matters below, providing separate opinions on the critical audit matters or on the accounts or disclosures to which they relate.
Estimation of fair value of real estate properties received in satisfaction of Operator Note Receivable
As described in Note 4 to the financial statements, during the three months ended December 31, 2023, the Company completed an administration process whereby it acquired through a credit bid the real estate assets in satisfaction of related amounts due under the operator note totaling $263.8 million. The Company recorded the real estate assets at their estimated fair value upon execution of the credit bid. The fair value was determined by the Company with the assistance of a third-party appraiser, which utilized an income approach that involved the application of certain subjective inputs including the absorption rate, sales price and discount rate.
We identified the fair value estimate of the real estate assets as a critical audit matter.
The principal consideration for our determination that the fair value estimate of the real estate assets is a critical audit matter is that management, with the assistance of a third-party appraiser, made significant judgments about the valuation methodology, absorption rate, the sales price and the discount rate, which are subjective inputs into the fair value estimate of the real estate assets. Significant management judgments and estimates utilized to determine the fair value of the real estate assets are subject to estimation uncertainty and required significant auditor judgment in evaluating the reasonableness of management's judgments and estimates.
F - 2
SUN COMMUNITIES, INC.
Our audit procedures related to evaluating the fair value estimate of the real estate assets acquired include the following, among others:
•We obtained an understanding and tested the design and operating effectiveness of management's review control over the estimation of the fair value of the assets acquired, which included reviewing the appropriateness of the valuation method, absorption rate, sales price and discount rate used by the third-party appraiser to determine the fair value of the real estate assets.
•We involved our valuation professionals with specialized skills and knowledge to assist in evaluating the reasonableness and appropriateness of the valuation method and these significant assumptions used in the fair value estimate.
Potential Impairment of Investment Properties
As described in Note 1 to the financial statements, the Company reviews the carrying value of its long-lived assets, which includes its investment properties, for impairment on a quarterly basis or whenever events or changes in circumstances indicate a possible impairment. Events or circumstances that may prompt a test of recoverability may include a significant decrease in the anticipated market price, an adverse change to the extent or manner in which an asset may be used or in its physical condition or other events that may significantly change the value of the long-lived asset.
The Company reviews investment properties for potential impairment and if any impairment indicators are identified, the Company undertakes additional analyses utilizing expected undiscounted future cash flows for identified investment properties. Forecasting of cash flows requires management to make estimates and assumptions about variables such as growth rates, forecasted net operating income, estimated holding period, development and operating expenses during the holding period, and capitalization rates.
We identified the evaluation of recoverability of investment properties when an impairment indicator is identified as a critical audit matter.
The principal consideration for our determination that the evaluation of recoverability of investment properties is a critical audit matter is that auditing management's evaluation of impairment is challenging due to the high degree of subjective auditor judgment necessary in evaluating management's determination of undiscounted cash flows for properties where impairment indicators have been identified. The significant assumptions used in the undiscounted cash flows analysis include growth rates, forecasted net operating income, estimated holding period, and capitalization rates. These assumptions can be affected by expectations about future market or economic conditions, demand, and competition.
Our audit procedures related to evaluating management's determination of undiscounted cash flows for properties where impairment indicators have been identified included the following, among others:
•We evaluated the design and tested the operating effectiveness of the controls that address the evaluation of recoverability, including management's review of the operations and financial performance of investment properties and preparation of undiscounted cash flow analysis.
•When an undiscounted cash flow analysis was necessary, we evaluated the significant assumptions and methods used in developing that analysis. As part of our evaluation, we assessed the historical accuracy of the Company's estimates and ability to forecast property performance. We also performed sensitivity analyses of certain significant assumptions to evaluate the changes in the undiscounted cash flows of certain properties that would result from changes in the assumptions used by management.
•We utilized an internal valuation specialist to compare the consistency of capitalization rates used by the Company to those used for comparable properties in the market.
Impairment of Goodwill
As described in Notes 1 and 6 to the financial statements, the Company recorded goodwill impairment charges during the year ended December 31, 2023, of $369.9 million to write down the value of their United Kingdom ("UK") reporting unit. Management assesses goodwill for impairment at the reporting unit level on an annual basis or more frequently if events or changes in circumstances arise and impairment indicators are identified. If the fair value of a reporting unit is lower than the carrying amount, a goodwill impairment charge is recorded and it is written down to its implied fair value. Events or circumstances that may result in an impairment review include changes in macroeconomic conditions, industry and market considerations, cost factors, overall financial performance, other relevant entity-specific events, specific events affecting the reporting unit or a sustained decrease in share price.
F - 3
SUN COMMUNITIES, INC.
During the year ended December 31, 2023, the UK market experienced adverse macroeconomic changes which were reflected in significant revisions to management's forecasts of projected future cash flows and earnings from previous budgets and forecasts. As a result of these factors, management performed impairment tests of goodwill. The fair value of the UK reporting unit was estimated by management using a combination of an income approach based on the present value of estimated future cash flows and a market approach based on pricing multiples derived from an analysis of comparable public companies multiplied against historical and/or anticipated financial metrics. These calculations contained significant judgments and assumptions relating to future cash flows of the reporting unit, the weighted average cost of capital, and long-term growth rates.
We identified the estimation of fair value of the UK reporting unit as a critical audit matter.
The principal considerations for our determination that the estimation of the fair value of the UK reporting unit is a critical audit matter are that (i) significant judgment and estimation was required by management in developing the fair value of the reporting unit and (ii) a high degree of auditor judgment, subjectivity and effort was required in performing procedures and in evaluating management's valuation methods, calculations and significant assumptions related to future cash flows of the reporting unit, the weighted average cost of capital, and terminal growth rates used in management's model.
Our audit procedures related to evaluating management's estimate of the fair value of the UK reporting unit included the following, among others:
•We involved an internal valuation specialist to assist in our evaluation of the appropriateness of the valuation methodologies and the reasonableness of the assumptions used by the Company, including the calculation of the risk-adjusted discount rates by recalculating the weighted average cost of capital and applied sensitivity analysis to long-term growth rates.
•We assessed the reasonableness of the Company's assumptions of forecasted revenue growth rates by comparing forecasted amounts to actual historical results to identify material changes, corroborating the basis for increases in forecasted revenues and expected cash flows.
•We evaluated whether the assumptions used were reasonable considering external market and industry data and whether assumptions were consistent with evidence obtained in other areas of the audit.
/s/ GRANT THORNTON LLP
We have served as the Company's auditor since 2003.
February 27, 2024
F - 4
SUN COMMUNITIES, INC.
REPORT OF INDEPENDENT REGISTERED PUBLIC ACCOUNTING FIRM
Board of Directors and Shareholders
Sun Communities, Inc.
Opinion on internal control over financial reporting
We have audited the internal control over financial reporting of Sun Communities, Inc. (a Maryland corporation) and subsidiaries (the "Company") as of December 31, 2023, based on criteria established in the 2013 Internal Control—Integrated Framework issued by the Committee of Sponsoring Organizations of the Treadway Commission ("COSO"). In our opinion, because of the effect of the material weakness described in the following paragraphs on the achievement of the objectives of the control criteria, the Company has not maintained effective internal control over financial reporting as of December 31, 2023, based on criteria established in the 2013 Internal Control—Integrated Framework issued by COSO.
A material weakness is a deficiency, or combination of control deficiencies, in internal control over financial reporting, such that there is a reasonable possibility that a material misstatement of the company's annual or interim financial statements will not be prevented or detected on a timely basis. The following material weakness has been identified and included in management's assessment.
Management identified a material weakness relating to the design of management's review controls and failure to identify triggering events including reduced financial projections and increased interest rates, relevant to the evaluation of goodwill impairment relating to their Park Holidays business within the manufactured homes segment.
We also have audited, in accordance with the standards of the Public Company Accounting Oversight Board (United States) ("PCAOB"), the consolidated financial statements of the Company as of and for the year ended December 31, 2023. The material weakness identified above was considered in determining the nature, timing, and extent of audit tests applied in our audit of the 2023 consolidated financial statements, and this report does not affect our report dated February 27, 2024 which expressed an unqualified opinion on those financial statements.
Basis for opinion
The Company's management is responsible for maintaining effective internal control over financial reporting and for its assessment of the effectiveness of internal control over financial reporting, included in the accompanying Management's report on internal control over financial reporting. Our responsibility is to express an opinion on the Company's internal control over financial reporting based on our audit. We are a public accounting firm registered with the PCAOB and are required to be independent with respect to the Company in accordance with the U.S. federal securities laws and the applicable rules and regulations of the Securities and Exchange Commission and the PCAOB.
We conducted our audit in accordance with the standards of the PCAOB. Those standards require that we plan and perform the audit to obtain reasonable assurance about whether effective internal control over financial reporting was maintained in all material respects. Our audit included obtaining an understanding of internal control over financial reporting, assessing the risk that a material weakness exists, testing and evaluating the design and operating effectiveness of internal control based on the assessed risk, and performing such other procedures as we considered necessary in the circumstances. We believe that our audit provides a reasonable basis for our opinion.
Definition and limitations of internal control over financial reporting
A company's internal control over financial reporting is a process designed to provide reasonable assurance regarding the reliability of financial reporting and the preparation of financial statements for external purposes in accordance with generally accepted accounting principles. A company's internal control over financial reporting includes those policies and procedures that (1) pertain to the maintenance of records that, in reasonable detail, accurately and fairly reflect the transactions and dispositions of the assets of the company; (2) provide reasonable assurance that transactions are recorded as necessary to permit preparation of financial statements in accordance with generally accepted accounting principles, and that receipts and expenditures of the company are being made only in accordance with authorizations of management and directors of the company; and (3) provide reasonable assurance regarding prevention or timely detection of unauthorized acquisition, use, or disposition of the company's assets that could have a material effect on the financial statements.
F - 5
SUN COMMUNITIES, INC.
Because of its inherent limitations, internal control over financial reporting may not prevent or detect misstatements. Also, projections of any evaluation of effectiveness to future periods are subject to the risk that controls may become inadequate because of changes in conditions, or that the degree of compliance with the policies or procedures may deteriorate.
/s/ GRANT THORNTON LLP
February 27, 2024
F - 6
SUN COMMUNITIES, INC.
CONSOLIDATED BALANCE SHEETS
(In millions, except for per share amounts)
| As of | |||||||||||
| December 31, 2023 | December 31, 2022 | ||||||||||
| Assets | |||||||||||
| Land | $ | $ | |||||||||
| Land improvements and buildings | |||||||||||
| Rental homes and improvements | |||||||||||
| Furniture, fixtures and equipment | |||||||||||
| Investment property | |||||||||||
| Accumulated depreciation | ( | ( | |||||||||
Investment property, net (see Note 8 at VIEs) | |||||||||||
Cash, cash equivalents and restricted cash (see Note 8 at VIEs) | |||||||||||
Marketable securities (see Note 16) | |||||||||||
| Inventory of manufactured homes | |||||||||||
| Notes and other receivables, net | |||||||||||
Collateralized receivables, net (see Note 5) | |||||||||||
| Goodwill | |||||||||||
Other intangible assets, net (see Note 8 at VIEs) | |||||||||||
Other assets, net (see Note 8 at VIEs) | |||||||||||
| Total Assets | $ | $ | |||||||||
| Liabilities | |||||||||||
Mortgage loans payable (see Note 9; Note 8 at VIEs) | $ | $ | |||||||||
Secured borrowings on collateralized receivables (see Note 9) | |||||||||||
Unsecured debt (see Note 9; Note 8 at VIEs) | |||||||||||
| Distributions payable | |||||||||||
Advanced reservation deposits and rent (see Note 8 at VIEs) | |||||||||||
Accrued expenses and accounts payable (see Note 8 at VIEs) | |||||||||||
Other liabilities (see Note 8 at VIEs) | |||||||||||
| Total Liabilities | |||||||||||
Commitments and contingencies (see Note 17) | |||||||||||
Temporary equity (see Note 10; Note 8 at VIEs) | |||||||||||
| Shareholders' Equity | |||||||||||
Common stock, $ | |||||||||||
| Additional paid-in capital | |||||||||||
| Accumulated other comprehensive income / (loss) | ( | ||||||||||
| Distributions in excess of accumulated earnings | ( | ( | |||||||||
| Total SUI shareholders' equity | |||||||||||
| Noncontrolling interests | |||||||||||
| Common and preferred OP units | |||||||||||
| Total noncontrolling interests | |||||||||||
| Total Shareholders' Equity | |||||||||||
| Total Liabilities, Temporary Equity and Shareholders' Equity | $ | $ | |||||||||
See accompanying Notes to Consolidated Financial Statements.
F - 7
SUN COMMUNITIES, INC.
CONSOLIDATED STATEMENTS OF OPERATIONS
(In millions, except for per share amounts)
| Year Ended | ||||||||||||||||||||
| December 31, 2023 | December 31, 2022 | December 31, 2021 | ||||||||||||||||||
| Revenues | ||||||||||||||||||||
| Real property | $ | $ | $ | |||||||||||||||||
| Home sales | ||||||||||||||||||||
| Service, retail, dining and entertainment | ||||||||||||||||||||
| Interest | ||||||||||||||||||||
| Brokerage commissions and other, net | ||||||||||||||||||||
| Total Revenues | ||||||||||||||||||||
| Expenses | ||||||||||||||||||||
| Property operating and maintenance | ||||||||||||||||||||
| Real estate tax | ||||||||||||||||||||
| Home costs and selling | ||||||||||||||||||||
| Service, retail, dining and entertainment | ||||||||||||||||||||
| General and administrative | ||||||||||||||||||||
| Catastrophic event-related charges, net | ||||||||||||||||||||
| Business combinations | ||||||||||||||||||||
| Depreciation and amortization | ||||||||||||||||||||
Asset impairments | ||||||||||||||||||||
Goodwill impairment (see Note 6 ) | ||||||||||||||||||||
Loss on extinguishment of debt (see Note 9) | ||||||||||||||||||||
| Interest | ||||||||||||||||||||
| Interest on mandatorily redeemable preferred OP units / equity | ||||||||||||||||||||
| Total Expenses | ||||||||||||||||||||
| Income Before Other Items | ( | |||||||||||||||||||
Gain / (loss) on remeasurement of marketable securities (see Note 16) | ( | ( | ||||||||||||||||||
| Gain / (loss) on foreign currency exchanges | ( | ( | ||||||||||||||||||
| Gain on dispositions of properties | ||||||||||||||||||||
| Other expense, net | ( | ( | ( | |||||||||||||||||
Gain / (loss) on remeasurement of notes receivable (see Note 4 and Note 16) | ( | ( | ||||||||||||||||||
Income from nonconsolidated affiliates (see Note 7) | ||||||||||||||||||||
Loss on remeasurement of investment in nonconsolidated affiliates (see Note 7) | ( | ( | ( | |||||||||||||||||
Current tax expense (see Note 13) | ( | ( | ( | |||||||||||||||||
Deferred tax benefit / (expense) (see Note 13) | ( | |||||||||||||||||||
| Net Income / (Loss) | ( | |||||||||||||||||||
| Less: Preferred return to preferred OP units / equity interests | ||||||||||||||||||||
| Less: Income / (loss) attributable to noncontrolling interests | ( | |||||||||||||||||||
| Net Income / (Loss) Attributable to SUI Common Shareholders | $ | ( | $ | $ | ||||||||||||||||
| Weighted average common shares outstanding - basic | ||||||||||||||||||||
| Weighted average common shares outstanding - diluted | ||||||||||||||||||||
Basic earnings / (loss) per share (see Note 14) | $ | ( | $ | $ | ||||||||||||||||
Diluted earnings / (loss) per share (see Note 14) | $ | ( | $ | $ | ||||||||||||||||
See accompanying Notes to Consolidated Financial Statements.
F - 8
SUN COMMUNITIES, INC.
CONSOLIDATED STATEMENTS OF COMPREHENSIVE INCOME / (LOSS)
(In millions)
| Year Ended | |||||||||||||||||
| December 31, 2023 | December 31, 2022 | December 31, 2021 | |||||||||||||||
| Net Income / (Loss) | $ | ( | $ | $ | |||||||||||||
| Foreign Currency Translation | |||||||||||||||||
| Foreign currency translation gain / (loss) arising during period | ( | ( | |||||||||||||||
| Adjustment for accumulated foreign currency translation loss reclassified into earnings | |||||||||||||||||
| Net foreign currency translation gain / (loss) | ( | ( | |||||||||||||||
| Cash Flow Hedges: | |||||||||||||||||
| Change in unrealized gain / (loss) on interest rate derivatives | ( | ||||||||||||||||
| Less: Interest rate derivative gain reclassified to earnings | ( | ( | |||||||||||||||
| Net unrealized gain / (loss) on interest rate derivatives | ( | ||||||||||||||||
| Total Comprehensive Income / (Loss) | ( | ||||||||||||||||
| Less: Comprehensive (income) / loss attributable to noncontrolling interests | ( | ( | |||||||||||||||
| Comprehensive Income / (Loss) attributable to SUI | $ | ( | $ | $ | |||||||||||||
See accompanying Notes to Consolidated Financial Statements.
F - 9
SUN COMMUNITIES, INC.
CONSOLIDATED STATEMENTS OF SHAREHOLDERS' EQUITY
(In millions)
| Shareholders' Equity | ||||||||||||||||||||||||||||||||||||||
| Temporary Equity | Common Stock (Shares) | Common Stock ($Value) | Additional Paid-in Capital | Distributions in Excess of Accumulated Earnings | Accumulated Other Comprehensive Income / (Loss) | Noncontrolling Interests | Total Shareholders' Equity | Total Equity | ||||||||||||||||||||||||||||||
| Balance at December 31, 2020 | $ | $ | $ | $ | ( | $ | $ | $ | $ | |||||||||||||||||||||||||||||
| Issuance of common stock and common OP units, net | — | — | — | |||||||||||||||||||||||||||||||||||
| Common stock withheld to satisfy income tax obligations related to vesting of restricted stock awards | — | ( | — | ( | — | — | — | ( | ( | |||||||||||||||||||||||||||||
| Conversion of OP units | — | — | — | — | ( | — | ||||||||||||||||||||||||||||||||
| Issuance of third party equity interests in consolidated entities | — | — | — | — | — | |||||||||||||||||||||||||||||||||
| Other redeemable noncontrolling interests | — | — | — | ( | — | — | ( | |||||||||||||||||||||||||||||||
| Share-based compensation - amortization and forfeitures | — | — | — | — | — | |||||||||||||||||||||||||||||||||
| Issuance of Series J preferred OP units | — | — | — | — | — | — | — | |||||||||||||||||||||||||||||||
| Other comprehensive loss | — | — | — | — | — | ( | — | ( | ( | |||||||||||||||||||||||||||||
| Net income | — | — | — | — | ||||||||||||||||||||||||||||||||||
| Distributions | ( | — | — | — | ( | — | ( | ( | ( | |||||||||||||||||||||||||||||
| OP Units accretion | — | — | — | ( | — | — | ( | |||||||||||||||||||||||||||||||
| Balance at December 31, 2021 | $ | $ | $ | $ | ( | $ | $ | $ | $ | |||||||||||||||||||||||||||||
| Issuance of common stock and common OP units, net | — | — | — | — | ||||||||||||||||||||||||||||||||||
| Common stock withheld to satisfy income tax obligations related to vesting of restricted stock awards | — | ( | — | ( | — | — | — | ( | ( | |||||||||||||||||||||||||||||
| Conversion of OP units | ( | — | — | — | ( | |||||||||||||||||||||||||||||||||
| Issuance of third party equity interests in consolidated entities | — | — | — | — | — | — | — | |||||||||||||||||||||||||||||||
| Other redeemable noncontrolling interests | — | — | — | ( | — | — | ( | |||||||||||||||||||||||||||||||
| Acquisition of third party equity interest in consolidated entities | — | — | — | — | — | ( | ( | ( | ||||||||||||||||||||||||||||||
| Share-based compensation - amortization and forfeitures | — | — | — | — | — | |||||||||||||||||||||||||||||||||
| Other comprehensive loss | — | — | — | — | — | ( | ( | ( | ( | |||||||||||||||||||||||||||||
| Net income | — | — | — | — | ||||||||||||||||||||||||||||||||||
| Distributions | ( | — | — | — | ( | — | ( | ( | ( | |||||||||||||||||||||||||||||
| OP Units accretion | — | — | — | ( | — | — | ( | |||||||||||||||||||||||||||||||
| Balance at December 31, 2022 | $ | $ | $ | $ | ( | $ | ( | $ | $ | $ | ||||||||||||||||||||||||||||
| Issuance of common stock and common OP units, net | — | — | ( | — | — | |||||||||||||||||||||||||||||||||
Common stock withheld to satisfy income tax obligations related to vesting of restricted stock awards | — | ( | — | ( | — | — | — | ( | ( | |||||||||||||||||||||||||||||
| Conversion of OP units | ( | — | — | — | ( | |||||||||||||||||||||||||||||||||
| Issuance of third party equity interests in consolidated entities | — | — | — | — | — | — | — | |||||||||||||||||||||||||||||||
| Other redeemable noncontrolling interests | — | — | — | ( | — | — | ( | |||||||||||||||||||||||||||||||
| Acquisition of third party equity interest in consolidated entities | ( | — | — | ( | — | — | ( | ( | ||||||||||||||||||||||||||||||
| Sale of consolidated affiliates | ( | — | — | — | — | — | — | — | ( | |||||||||||||||||||||||||||||
| Share-based compensation - amortization and forfeitures | — | — | — | — | — | |||||||||||||||||||||||||||||||||
| Issuance of Series K preferred OP units | — | — | — | — | — | — | — | |||||||||||||||||||||||||||||||
| Issuance of Series L preferred OP units | — | — | — | — | — | — | ||||||||||||||||||||||||||||||||
| Other comprehensive income / (loss) | — | — | — | — | — | ( | ||||||||||||||||||||||||||||||||
| Net loss | ( | — | — | — | ( | — | ( | ( | ( | |||||||||||||||||||||||||||||
| Distributions | ( | — | — | — | ( | — | ( | ( | ( | |||||||||||||||||||||||||||||
| OP Units accretion | — | — | — | ( | — | — | ( | |||||||||||||||||||||||||||||||
| Balance at December 31, 2023 | $ | $ | $ | $ | ( | $ | $ | $ | $ | |||||||||||||||||||||||||||||
See accompanying Notes to Consolidated Financial Statements.
F - 10
SUN COMMUNITIES, INC.
CONSOLIDATED STATEMENTS OF CASH FLOWS
(In millions)
| Year Ended | |||||||||||||||||
| December 31, 2023 | December 31, 2022 | December 31, 2021 | |||||||||||||||
| Operating Activities | |||||||||||||||||
| Net income / (loss) | $ | ( | $ | $ | |||||||||||||
| Adjustments to reconcile net income to net cash provided by operating activities: | |||||||||||||||||
| Gain on disposition of assets | ( | ( | ( | ||||||||||||||
| Gain on disposition of properties | ( | ( | ( | ||||||||||||||
| (Gain) / loss on foreign currency exchanges | ( | ||||||||||||||||
(Gain) / loss on remeasurement of marketable securities (see Note 16) | ( | ||||||||||||||||
| Contingent gain | ( | ||||||||||||||||
| Loss on remeasurement of contingent liabilities | |||||||||||||||||
| Asset impairment charges | |||||||||||||||||
| Catastrophic event-related impairment | ( | ||||||||||||||||
Goodwill impairment charge (See Note 6) | |||||||||||||||||
| Share-based compensation | |||||||||||||||||
| Depreciation and amortization | |||||||||||||||||
Deferred tax (benefit) / expense (see Note 13) | ( | ( | |||||||||||||||
| Other amortization and accretion | ( | ( | |||||||||||||||
Loss on extinguishment of debt (see Note 9) | |||||||||||||||||
(Gain) / loss on remeasurement of notes receivable (see Note 4) | ( | ||||||||||||||||
Loss on remeasurement of investment in nonconsolidated affiliates (see Note 7) | |||||||||||||||||
Income from nonconsolidated affiliates (see Note 7) | ( | ( | ( | ||||||||||||||
| Distributions of income from nonconsolidated affiliates | |||||||||||||||||
| Cash flow hedge gains reclassified to earnings | ( | ( | |||||||||||||||
| Proceeds from derivative settlements, net | |||||||||||||||||
| Early lease termination | |||||||||||||||||
| Change in notes receivable from financed sales of inventory homes, net of repayments | ( | ( | |||||||||||||||
| Change in inventory, other assets and other receivables, net | ( | ( | ( | ||||||||||||||
| Change in other liabilities | ( | ||||||||||||||||
| Net Cash Provided By Operating Activities | |||||||||||||||||
| Investing Activities | |||||||||||||||||
| Investment in properties | ( | ( | ( | ||||||||||||||
| Acquisitions, net of cash acquired | ( | ( | ( | ||||||||||||||
| Proceeds from deposit on acquisition | |||||||||||||||||
| Proceeds from insurance | |||||||||||||||||
| Proceeds from disposition of assets and depreciated homes, net | |||||||||||||||||
| Proceeds related to disposition of properties | |||||||||||||||||
| Issuance of notes and other receivables | ( | ( | ( | ||||||||||||||
| Repayments of notes and other receivables | |||||||||||||||||
| Investments in marketable securities | ( | ||||||||||||||||
| Proceeds from sale of marketable securities | |||||||||||||||||
| Investments in nonconsolidated affiliates | ( | ( | ( | ||||||||||||||
| Distributions of capital from nonconsolidated affiliates | |||||||||||||||||
| Net Cash Used For Investing Activities | ( | ( | ( | ||||||||||||||
| Financing Activities | |||||||||||||||||
| Issuance and costs of common stock, OP units and preferred OP units, net | ( | ||||||||||||||||
| Common stock withheld to satisfy income tax obligations related to vesting of restricted stock awards | ( | ( | ( | ||||||||||||||
| Borrowings on lines of credit | |||||||||||||||||
| Payments on lines of credit | ( | ( | ( | ||||||||||||||
| Proceeds from secured borrowing | |||||||||||||||||
| Proceeds from issuance of other debt | |||||||||||||||||
| Contributions from noncontrolling interest | |||||||||||||||||
| Payments on other debt | ( | ( | ( | ||||||||||||||
| Payments on financial liability | ( | ||||||||||||||||
| Fees paid in connection with extinguishment of debt | ( | ( | |||||||||||||||
| Distributions | ( | ( | ( | ||||||||||||||
| Payments for deferred financing costs, net of prepaid return | ( | ( | ( | ||||||||||||||
| Payment of contingent liability | ( | ||||||||||||||||
| Distributions for redemption of noncontrolling interests | ( | ||||||||||||||||
| Net Cash Provided By Financing Activities | |||||||||||||||||
| Effect of exchange rate changes on cash, cash equivalents and restricted cash | ( | ( | |||||||||||||||
| Net change in cash, cash equivalents and restricted cash | ( | ( | |||||||||||||||
| Cash, cash equivalents and restricted cash, beginning of period | |||||||||||||||||
| Cash, Cash Equivalents and Restricted Cash, End of Period | $ | $ | $ | ||||||||||||||
F - 11
| Year Ended | |||||||||||||||||
| December 31, 2023 | December 31, 2022 | December 31, 2021 | |||||||||||||||
| Supplemental Information | |||||||||||||||||
Cash paid for interest (net of capitalized interest of $ | $ | $ | $ | ||||||||||||||
| Cash paid for interest on mandatorily redeemable debt | $ | $ | $ | ||||||||||||||
| Cash paid for income taxes | $ | $ | $ | ||||||||||||||
| Noncash investing and financing activities | |||||||||||||||||
| Change in distributions declared and outstanding | $ | $ | $ | ||||||||||||||
| Conversion of common and preferred OP units | $ | $ | $ | ||||||||||||||
| Common OP units issued for acquisition of noncontrolling interests | $ | $ | $ | ||||||||||||||
| ROU asset obtained from new operating lease liabilities | $ | $ | $ | ||||||||||||||
| Release of note receivable and accrued interest in relation to acquisition of real estate collateral | $ | $ | $ | ||||||||||||||
| Issuance of notes and other receivables in relation to disposition of properties | $ | $ | $ | ||||||||||||||
| Properties transferred in exchange for noncontrolling interests | $ | $ | $ | ||||||||||||||
| Equity interest and note receivable transferred in exchange for noncontrolling interests | $ | $ | $ | ||||||||||||||
| Settlement of preferred equity interests in connection with exchange for noncontrolling interests | $ | $ | $ | ||||||||||||||
| Noncash investing and financing activities at the date of acquisition | |||||||||||||||||
| Acquisitions - Common stock and OP units issued | $ | $ | $ | ||||||||||||||
| Acquisitions - Series J preferred interest | $ | $ | $ | ||||||||||||||
| Acquisitions - Series K preferred interest | $ | $ | $ | ||||||||||||||
| Acquisitions - Holdback | $ | $ | $ | ||||||||||||||
| Acquisitions - Deferred liability | $ | $ | $ | ||||||||||||||
| Acquisitions - Finance lease liabilities | $ | $ | $ | ||||||||||||||
| Acquisitions - Financial liabilities | $ | $ | $ | ||||||||||||||
| Acquisitions - Deferred tax liabilities | $ | $ | $ | ||||||||||||||
See accompanying Notes to Consolidated Financial Statements.
F - 12
SUN COMMUNITIES, INC.
NOTES TO CONSOLIDATED FINANCIAL STATEMENTS
1. Significant Accounting Policies
Business
Sun Communities, Inc., a Maryland corporation, and all wholly-owned or majority-owned and controlled subsidiaries, including Sun Communities Operating Limited Partnership, a Michigan limited partnership (the "Operating Partnership"), Sun Home Services, Inc., a Michigan corporation ("SHS"), Safe Harbor Marinas, LLC, a Delaware limited liability company ("Safe Harbor") and Sun UK Holding LLC (together with its subsidiaries, "Park Holidays") are referred to herein as the "Company," "SUI," "us," "we," or "our."
We are a fully integrated, self-administered and self-managed REIT. As of December 31, 2023, we owned and operated or held an interest in a portfolio of 667 MH and RV communities and marinas (collectively, the "properties") located in the U.S., the UK, and Canada, including 353 MH communities, 179 RV communities, and 135 marinas. As of December 31, 2023, the properties contained an aggregate of 227,340 developed sites comprised of 118,430 developed MH sites, 32,390 annual RV sites (inclusive of both annual and seasonal usage rights), 28,490 transient RV sites, and 48,030 marina wet slips and dry storage spaces.
Principles of Consolidation
We consolidate our majority-owned subsidiaries in which we have the ability to control the operations of our subsidiaries and all variable interest entities with respect to which we are the primary beneficiary. We also consolidate entities in which we have a direct or indirect controlling or voting interest. All significant intercompany transactions have been eliminated in consolidation. Any subsidiaries in which we have an ownership percentage equal to or greater than 50%, but less than 100%, or are considered to be a consolidated VIE, represent subsidiaries with a non-controlling interest. The noncontrolling interests in our subsidiaries are allocated their proportionate share of the subsidiaries' financial results. Certain reclassifications have been made to prior period financial statements in order to conform to current period presentation. There was no impact to prior period net income for any of the reclassifications.
Use of Estimates
The preparation of financial statements in conformity with GAAP requires management to make estimates and assumptions related to the reported amounts included in our Consolidated Financial Statements and accompanying footnotes thereto. Actual results could differ from those estimates.
Segment Information
FASB Accounting Standards Codification ("ASC") Topic 280, "Segment Reporting," establishes standards for the way that business enterprises report information about operating segments in their financial statements. In accordance with ASC 280, management has determined that we have three operating segments: (i) Manufactured home ("MH") communities, (ii) Recreational vehicle ("RV") communities and (iii) Marinas.
The MH segment owns, operates, develops or has an interest in, a portfolio of MH communities in the U.S. and the UK, and is in the business of acquiring, operating and developing ground-up MH communities to provide affordable housing solutions to residents. The MH segment in the U.S. also provides manufactured home sales and leasing services to tenants and prospective tenants of our communities. The MH segment in the UK provides holiday home sales and associated site license activities to holiday homeowners in our communities.
The RV segment owns, operates, develops or has an interest in, a portfolio of RV communities and is in the business of acquiring, operating and developing ground-up RV communities in the U.S. and Canada. It also provides leasing services for vacation rentals within the RV communities.
The Marina segment owns, operates and develops marinas, and is in the business of acquiring and operating marinas in the U.S., with the majority of such marinas concentrated in coastal regions, and others located in various inland regions.
We evaluate segment operating performance based on NOI. Refer to Note 12, "Segment Reporting," for additional information.
F - 13
SUN COMMUNITIES, INC.
NOTES TO CONSOLIDATED FINANCIAL STATEMENTS
Investment Property
Investment property is recorded at cost, less accumulated depreciation.
Impairment of long-lived assets - we review the carrying value of long-lived assets to be held for use for impairment quarterly or whenever events or changes in circumstances indicate a possible impairment. Future events could occur which would cause us to conclude that impairment indicators exist, and significant adverse changes in national, regional, or local market conditions or trends may cause us to change the estimates and assumptions used in our impairment analysis. The results of an impairment analysis could be material to our financial statements. Our primary indicator for potential impairment is based on NOI trends period over period. Circumstances that may prompt a test of recoverability may include a significant decrease in the anticipated market price, an adverse change to the extent or manner in which an asset may be used or in its physical condition or other events that may significantly change the value of the long-lived asset. An impairment loss is recognized when a long-lived asset's carrying value is not recoverable and exceeds estimated fair value.
We estimate the fair value of our long-lived assets based on undiscounted future cash flows and any potential disposition proceeds for a given asset. Forecasting cash flows requires management to make estimates and assumptions about such variables as the estimated holding period, rental rates, occupancy, development and operating expenses during the holding period, as well as capitalization rates. Management uses its best judgment when developing these estimates and assumptions.
Real estate held for sale - we periodically classify real estate as held for sale. An asset is classified as held for sale after an active program to sell an asset has commenced and when the sale is probable. Subsequent to the classification of assets as held for sale, no further depreciation expense is recorded. There were no
Acquisitions - we evaluate acquisitions pursuant to ASC 805, "Business Combinations," to determine whether the acquisition should be classified as either an asset acquisition or a business combination.
Acquisitions for which substantially all of the fair value of the gross assets acquired are concentrated in a single identifiable asset or a group of similar identifiable assets are accounted for as an asset acquisition. The majority of our property acquisitions are accounted for as asset acquisitions. For asset acquisitions, we allocate the purchase price of these properties on a relative fair value basis and capitalize direct acquisition related costs as part of the purchase price. Acquisition costs that do not meet the criteria to be capitalized are expensed as incurred and presented as General and administrative costs in our Consolidated Statements of Operations.
Acquisitions that meet the definition of a business combination are recorded at fair value using a fair value model under which the assets and liabilities are generally recognized at their fair values and the difference between the consideration transferred, excluding transaction costs, and the fair values of the assets and liabilities is recognized as goodwill. For acquisitions that meet the definition of a business combination, we allocate the purchase price of those properties on a fair value basis and expense the acquisition related transaction costs as incurred. Transaction costs are presented as Business combinations expense in our Consolidated Statements of Operations.
For asset acquisitions and business combinations, we allocate the purchase price to net tangible and identified intangible assets acquired based on their fair values. In making estimates of fair values for purposes of allocating purchase price, we utilize an independent third party to value the net tangible and identified intangible assets in connection with the acquisition of the respective property. We provide historical and pro forma financial information obtained about each property, as well as any other information needed in order for the third party to ascertain the fair value of the tangible and intangible assets acquired.
Capitalized Costs
We capitalize certain costs incurred in connection with the development, redevelopment, capital enhancement and leasing of our properties. Management is required to use professional judgment in determining whether such costs meet the criteria for capitalization or immediate expense. The amounts are dependent on the volume and timing of such activities, and the costs associated with such activities:
Maintenance, repairs and minor improvements to properties are expensed when incurred.
F - 14
SUN COMMUNITIES, INC.
NOTES TO CONSOLIDATED FINANCIAL STATEMENTS
Renovations and improvements to our properties are capitalized and depreciated over their estimated useful lives and real estate project costs related to the development of new community or expansion sites are capitalized until the property is substantially complete and available for occupancy. Costs incurred to initially renovate pre-owned and repossessed homes that we acquire for our Rental Program are capitalized, and the majority of costs incurred to refurbish the homes at turnover and repair the homes while occupied, are expensed unless they extend the life of the home. Renovations and improvements to marinas are capitalized and depreciated over their estimated useful lives. Improvements made to docks, buildings, systems, equipment, shorelines and site improvements are capitalized until the project is substantially complete and available for use.
Certain expenditures to dealers and residents related to obtaining lessees in our communities are capitalized and amortized based on the anticipated term of occupancy of a resident.
Costs incurred to develop internal-use software are capitalized and amortized on a straight-line basis over the estimated useful life of the related software (typically to years).
Costs associated with purchases of furniture, fixtures and equipment, major replacements and improvements are capitalized and subsequently depreciated over their respective underlying assets estimated useful lives.
Costs incurred to obtain new debt financing (i.e. deferred financing costs) are capitalized and amortized over the term of the underlying loan agreement using the effective interest method for senior unsecured notes and the straight-line method (which approximates the effective interest method) for other financing. Deferred financing costs include fees and costs incurred to obtain long-term financing. Unamortized deferred financing costs are written off when debt is retired before the maturity date. Upon amendment of the line of credit or refinancing of mortgage debt, unamortized deferred financing costs and any related discounts or premiums are accounted for in accordance with ASC 470-50-40, "Modifications and Extinguishments." Deferred financing costs, discounts and premiums as included in our Consolidated Balance Sheets are as follows (in millions):
| Financial Statement Classification | Year Ended | |||||||||||||||||||
| Description | December 31, 2023 | December 31, 2022 | ||||||||||||||||||
| Secured debt - premium | Mortgage loans payable | $ | $ | |||||||||||||||||
| Secured debt - deferred financing costs | Mortgage loans payable | ( | ( | |||||||||||||||||
| Secured borrowings on collateralized receivables - fair value adjustment | Secured borrowings on collateralized receivables | |||||||||||||||||||
| Senior unsecured notes - discount | Unsecured debt | ( | ( | |||||||||||||||||
| Senior unsecured notes - deferred financing costs | Unsecured debt | ( | ( | |||||||||||||||||
Lines of credit - deferred financing costs | Unsecured debt | ( | ( | |||||||||||||||||
Total deferred financing costs, discounts, premiums and fair value adjustments included in Debt | $ | ( | $ | ( | ||||||||||||||||
Lines of credit - deferred financing costs | Other assets, net | |||||||||||||||||||
Total deferred financing costs, discounts, premiums and fair value adjustments | $ | ( | $ | ( | ||||||||||||||||
Cash and Cash Equivalents
We consider all highly liquid investments with a maturity of three months or less from the date of purchase to be cash and cash equivalents. At December 31, 2023 and 2022, $29.2 million and $72.8 million of cash and cash equivalents, respectively, was included as a component of Cash, cash equivalents and restricted cash on the Consolidated Balance Sheets. The maximum amount of credit risk arising from cash deposits in excess of federally insured amounts was approximately $45.6 million and $86.8 million as of December 31, 2023 and 2022, respectively. The maximum amount of credit risk arising from Park Holidays' cash deposits in excess of insured amounts through the Financial Services Compensation Scheme ("FSCS") was approximately £1.8 million ($2.3 million) and £7.7 million ($9.3 million) as of December 31, 2023 and 2022, respectively.
Restricted Cash
Restricted cash consists primarily of utility deposits and amounts held in deposit for tax, insurance and repair escrows held by lenders in accordance with certain debt agreements. At December 31, 2023 and 2022, $13.5 million and $17.6 million of restricted cash, respectively, was included as a component of Cash, cash equivalents and restricted cash on the Consolidated Balance Sheets. Changes in the restricted cash are reported in our Consolidated Statements of Cash Flows as operating, investing or financing activities based on the nature of the underlying activity. Restricted cash and restricted cash equivalents are included with cash and cash equivalents in the reconciliation of the beginning of period and the end of period cash balance on the Consolidated Statements of Cash Flows.
F - 15
SUN COMMUNITIES, INC.
NOTES TO CONSOLIDATED FINANCIAL STATEMENTS
Marketable Securities
Inventory
Inventory of manufactured homes is stated at lower of specific cost or net realizable value based on the specific identification method and the balance is separately disclosed on our Consolidated Balance Sheets. Other inventory at our MH and RV properties consists primarily of service and merchandise related items, grocery, food and beverage products and are stated at the lower of cost or net realizable value. Physical inventory counts are performed where inventory exists. Inventory records are adjusted accordingly to reflect actual inventory counts and any resulting shortage is recognized. Inventory at our marinas consists primarily of boats for sale at certain marinas, boat parts used in our service centers and retail related items such as merchandise used in our ship stores, gasoline and diesel fuel, and food and beverage products. Inventories at our marinas are stated at the lower of cost or net realizable value with cost determined using the First In, First Out ("FIFO") method. Physical inventory counts are performed where inventory exists. Inventory records are adjusted accordingly to reflect actual inventory counts and any resulting shortage is recognized. The other inventory balance is included in Other assets, net on our Consolidated Balance Sheet.
Investments in Nonconsolidated Affiliates
We apply the equity method of accounting to entities in which we do not have a direct or indirect controlling interest or for variable interest entities where we are not considered the primary beneficiary but can exercise significant influence over the entity with respect to its operations and major decisions. Under the equity method of accounting, the cost of an investment is adjusted for our share of the equity in net income or loss from the date of acquisition, reduced by distributions received and increased by contributions made. The income or loss of each entity is allocated in accordance with the provisions of the applicable operating agreements. The allocation provisions in these agreements may differ from the ownership interests held by each investor. The cost method is applied when (a) the investment is minimal (typically less than 5.0 %) and (b) our investment is passive. Our exposure to losses associated with nonconsolidated affiliates is primarily limited to the carrying value of these investments. Accordingly, distributions from a nonconsolidated affiliate in excess of our carrying value are recognized in earnings. We review the carrying value of our investments in nonconsolidated affiliates for other than temporary impairment whenever events or changes in circumstances indicate a possible impairment. Financial condition, operational performance and other economic trends are among the factors we consider when we evaluate the existence of impairment indicators. Refer to Note 7, "Investments in Nonconsolidated Affiliates," for additional information.
Notes and Other Receivables
Notes receivable - includes installment loans for manufactured homes purchased from us, transferred loans that have not met the requirements for sale accounting which are presented herein as collateralized receivables, and notes receivable from real estate developers and operators. The notes are collateralized by the underlying manufactured home sold.
Collateralized receivables - represent transferred loans that have not met the requirements for sale accounting under ASC 860, "Transfers and Servicing."
Installment notes receivable on manufactured homes - represent notes receivable for the purchase of manufactured homes primarily located in our communities, which are secured by the underlying manufactured home sold. Interest income is accrued based on the unpaid principal balance of the loans. Past due status of our notes receivable is determined based on the contractual terms of the note. When a note receivable becomes 60 days delinquent, we stop accruing interest on the note receivable. The interest on nonaccrual loans is accounted for on the cash basis until qualifying for return to accrual.
Notes receivable from real estate developers and operators - represent short-term construction loans provided to real estate developers and loans provided to a real estate operator to finance acquisition and development costs.
F - 16
SUN COMMUNITIES, INC.
NOTES TO CONSOLIDATED FINANCIAL STATEMENTS
We elected to fair value our installment notes receivable on manufactured homes, collateralized receivables and notes receivable from real estate developers and operators in accordance with ASU 2016-13, "Financial Instruments—Credit Losses (Topic 326): Measurement of Credit Losses on Financial Instruments" ("CECL"). Installment notes receivable on manufactured homes and notes receivable from real estate developers and operators are measured at fair value pursuant to FASB ASC 820, "Fair Value Measurements and Disclosures." The fair value is evaluated quarterly, and any fair value adjustments are recorded in Gain / (loss) on remeasurement of notes receivable on the Consolidated Statement of Operations. Refer to Note 16, "Fair Value of Financial Instruments," for additional information regarding the estimates and assumptions used to estimate the fair value of each financial instrument class.
Other receivables - are generally comprised of sale proceeds receivable from home sales near year end, amounts due from marina customers for storage, service and lease payments, amounts due from MH and annual RV residents for rent and related charges (utility charges, fees and other pass-through charges), insurance receivables and various other miscellaneous receivables. These receivables do not require incremental CECL reserves as we believe that the risk of future expected loss on those accounts is immaterial due to the short-term nature of the accounts, history of collectability, past relationships and various other mitigating factors. Accounts outstanding longer than the contractual payment terms are considered past due.
Accounts receivable from marina customers are stated at amounts due net of an allowance for doubtful accounts. Receivables related to our marina rents are reserved when we believe that collection is less than probable, which is generally 50% for certain receivable balances over 180 days, and 60% after the balance reaches 60 days past due for all other receivables.
Accounts receivable from residents are typically due within 30 days and stated at amounts due from residents net of an allowance for doubtful accounts. We evaluate the recoverability of our receivables whenever events occur or there are changes in circumstances such that management believes it is probable that it will be unable to collect all amounts due according to the contractual terms of the loan and lease agreements. Receivables related to MH community rents are reserved when we believe that collection is less than probable, which is generally after a resident balance reaches 60 to 90 days past due. In the UK, annual rents are noticed in full during the fourth quarter and due by January 31st of the following year. Payment can be made upfront or in monthly installments. Accounts receivables are reviewed regularly for collectability, with related reserves set annually for outstanding receivables.
Refer to Note 4, "Notes and Other Receivables," for additional detail on receivables.
Goodwill
We account for goodwill pursuant to ASC 350, "Intangibles—Goodwill and Other." ASC 350-20, "Goodwill and Other," allows entities testing goodwill for impairment the option of performing a qualitative assessment before calculating the fair value of a reporting unit (i.e. the first step of the goodwill impairment test). If entities determine, on the basis of qualitative factors, that the fair value of the reporting unit is more-likely-than-not greater than the carrying amount, a quantitative calculation would not be needed. Goodwill represents the excess of costs of an acquired business over the fair value of the identifiable assets acquired less identifiable liabilities assumed. The goodwill is attributable to the intellectual capital and going concern value of the acquired businesses. Goodwill is not amortized.
Goodwill is tested for impairment at the reporting unit level. If the fair value of goodwill is lower than its carrying amount, goodwill impairment is indicated and goodwill is written down to its implied fair value. We assess our goodwill for impairment on an annual basis or more frequently if events or changes in circumstances arise and impairment indicators are identified. Events or circumstances that may result in an impairment review include changes in macroeconomic conditions, industry and market considerations, cost factors, overall financial performance, other relevant entity-specific events, specific events affecting the reporting unit or a sustained decrease in share prices. Estimating the fair value of individual reporting units requires us to make assumptions and estimates regarding industry, economic, and regulatory conditions in each respective geographic region in which we conduct operations.
F - 17
SUN COMMUNITIES, INC.
NOTES TO CONSOLIDATED FINANCIAL STATEMENTS
In performing goodwill impairment testing, we utilize a third-party valuation specialist to assist management in determining the fair value of our reporting units. The fair value of each reporting unit is estimated based on a combination of discounted cash flows (income approach) and the use of pricing multiples derived from an analysis of comparable public companies multiplied against historical and / or anticipated financial metrics (market approach) for each reporting unit. These calculations contain uncertainties as they require management to make assumptions including, but not limited to, market comparables, future cash flows of the reporting units, and appropriate weighted average cost of capital and long-term growth rates. A decline in the actual cash flows of our reporting units in future periods, as compared to the projected cash flows used in our valuations, could result in the carrying value of the reporting units exceeding their respective fair values. Further, a change in market comparables, discount rate or long-term growth rates, as a result of a change in economic conditions or otherwise, could result in the carrying values of the reporting units exceeding their respective fair values.
During the year ended December 31, 2023, we performed goodwill impairment assessments. For the UK reporting unit, we recorded aggregate impairment charges of $369.9 million to write down the carrying value to its respective fair value. As of December 31, 2023 and 2022, we had $733.0 million and $1.0 billion of goodwill from acquisitions accounted for as business combinations, respectively.
Goodwill is deductible for income tax purposes. As such, the goodwill portion allocated to our U.S. taxable REIT subsidiaries will reduce their taxable income. However, the resulting tax benefits will be offset by a valuation allowance. Given that REITs do not customarily report any taxable income (due to the dividends paid deduction), we do not expect any significant tax benefits arising from the goodwill allocable to the REIT. Goodwill allocated to the UK taxable REIT subsidiaries is not deductible for UK tax purposes resulting in no tax benefit in the UK. However, it will reduce their U.S. dividends to the REIT in the future.
The carrying amount of goodwill is separately disclosed on our Consolidated Balance Sheets. Refer to Note 6, "Goodwill and Other Intangible Assets," for additional information on goodwill.
Other Intangible Assets
Other intangible assets primarily comprise in-place leases (including slip in-place leases), non-competition agreements, trademarks and trade names, customer relationships and franchise agreements. Other intangible assets are reviewed for impairment on an annual basis or more frequently if indicators of impairment are identified.
Intangible assets with finite lives - we amortize identified intangible assets that are determined to have finite lives over the period the assets are expected to contribute directly or indirectly to the future cash flows of the property or business.
Trademarks and trade names - we account for trademarks and trade names pursuant to ASC 350, "Intangibles-Goodwill and Other." Some trademarks and trade names have an indefinite useful life and some have a to 15 year useful life. Trademarks and trade names with finite lives are amortized over their useful life. Trademarks and trade names with indefinite-lives are not amortized. Trademarks and trade names are reviewed for impairment on an annual basis or more frequently if indicators of impairment are identified. We first review qualitative factors to determine if a quantitative impairment test is necessary. If the qualitative assessment reveals that it's "more likely than not" that the asset is impaired, a calculation of the fair value is performed and the asset is written down to its implied fair value, if it is lower than its carrying amount. As of December 31, 2023 and 2022, the carrying amounts of trademarks and trade names related to acquisitions accounted for as business combinations were $214.0 million and $216.6 million, respectively.
We account for implementation costs in a hosting arrangement in accordance with ASU 2018-15, "Intangibles—Goodwill and Other—Internal-Use Software (Subtopic 350-40): Customer's Accounting for Implementation Costs Incurred in a Cloud Computing Arrangement That Is a Service Contract (a consensus of the FASB Emerging Issues Task Force)," which aligns requirements for capitalizing implementation costs in a hosting arrangement as a service contract with internally developed software, and expense capitalized costs of the hosting arrangement over the term of the arrangement.
The carrying amounts of the other identified intangible assets are included in Other intangible assets, net on our Consolidated Balance Sheets. Refer to Note 6, "Goodwill and Other Intangible Assets," for additional information on other intangible assets.
F - 18
SUN COMMUNITIES, INC.
NOTES TO CONSOLIDATED FINANCIAL STATEMENTS
Deferred Taxes
We are subject to certain state taxes that are considered to be income taxes and have certain subsidiaries that are taxed as regular corporations for U.S. (i.e., federal, state, local, etc.) and non-U.S. income tax purposes. Deferred tax assets or liabilities are recognized for temporary differences between the tax basis of assets and liabilities and their carrying amounts in the financial statements and net operating loss carryforwards in certain subsidiaries, including those domiciled in foreign jurisdictions, which may be realized in future periods if the respective subsidiary generates sufficient taxable income. Deferred tax assets and liabilities are measured using currently enacted tax rates. A valuation allowance is established if, based on the available evidence, it is considered more likely than not that some portion or all of the deferred tax assets will not be realized. Refer to Note 13, "Income Taxes," for additional information.
Temporary Equity
Temporary equity includes preferred securities that are redeemable for cash at the holder's option or upon the occurrence of an event that is not solely within our control based on a fixed or determinable price. These securities are not mandatorily redeemable for cash nor do they contain a fixed maturity date. Temporary equity is classified between Liabilities and Shareholders' Equity on the Consolidated Balance Sheets.
Share-Based Compensation
We account for awards of restricted stock in accordance with ASC 718-10, "Compensation-Stock Compensation." ASC 718-10 requires that compensation cost for all stock awards be calculated and amortized over the service period (generally equal to the vesting period). The fair value of restricted stock awards with service vesting is equal to the fair value of our stock on the grant date. Share-based compensation cost for service vesting restricted stock awards is measured based on the closing share price of our common stock on the date of grant. We measure the fair value of awards with performance conditions based on an estimate of shares expected to vest using the closing price of our common stock as of the grant date. If it is not probable that the performance conditions will be satisfied, we do not recognize compensation expense. We estimate the fair value of share-based compensation for restricted stock with market conditions using a Monte Carlo simulation. We recognize compensation cost ratably over each tranche of shares based on the fair value estimated by the model. We also recognize related estimated award forfeitures ratably over each tranche of shares. We estimate forfeitures at the time of grant based on the historical turnover rate of employees and non-employees that are recipients of an award. We update our assumptions annually for the subsequent year awards. Refer to Note 11, "Share-Based Compensation," for additional information.
Fair Value of Financial Instruments
Our financial instruments consist primarily of cash, cash equivalents and restricted cash, marketable securities, notes and other receivables, derivative assets, debt, warrants and other liabilities. We utilize fair value measurements to record fair value adjustments to certain assets and liabilities and to determine fair value disclosures, pursuant to ASC 820, "Fair Value Measurements and Disclosures."
ASC 820, "Fair Value Measurements and Disclosures," requires disclosure regarding determination of fair value for assets and liabilities and establishes a hierarchy under which these assets and liabilities must be grouped, based on significant levels of observable or unobservable inputs. Observable inputs reflect market data obtained from independent sources, while unobservable inputs reflect our market assumptions. This hierarchy requires the use of observable market data when available. These two types of inputs have created the following fair value hierarchy:
Level 1 - Quoted unadjusted prices for identical instruments in active markets that we have the ability to access;
Level 2 - Quoted prices for similar instruments in active markets, quoted prices for identical or similar instruments in markets that are not active and model-derived valuations in which all significant inputs and significant value drivers are observable (e.g., interest rates, yield curves, prepayment speeds, default rates, loss severity, etc.) in active markets or can be corroborated by observable market data; and
Level 3 - Valuations derived from valuation techniques in which one or more significant inputs or significant value drivers are unobservable. The unobservable inputs reflect our assumptions about the assumptions that market participants would use.
Refer to Note 16, "Fair Value of Financial Instruments," for additional information on methods and assumptions used to estimate the fair value of each financial instrument class.
F - 19
SUN COMMUNITIES, INC.
NOTES TO CONSOLIDATED FINANCIAL STATEMENTS
Revenue Recognition
As a real estate owner and operator, the majority of our revenue is derived from site and home leases, and wet slip and dry storage space leases that are accounted for pursuant to ASC 842, "Leases." We account for revenue from contracts with customers following ASC 606, "Revenue from Contracts with Customers," except for those that are within the scope of other topics in the FASB ASC. The core principle of ASC 606 is that an entity should recognize revenue to depict the transfer of promised goods or services to customers in an amount that reflects the consideration to which the entity expects to be entitled in exchange for those goods or services. A five-step transactional analysis is required to determine how and when to recognize revenue. For transactions in the scope of ASC 606, we recognize revenue when control of goods or services transfers to the customer, in the amount that we expect to receive for the transfer of goods or provision of services. Due to the nature and timing of our identified revenue streams, there were no material outstanding performance obligations as of December 31, 2023. Refer to Note 2, "Revenue," for additional information.
Income from real property at our MH and RV properties includes revenue from residents and guests in our communities, who lease the site on which their home or RV is located and either own or lease their home or RV, rental home revenue, and short-term vacation home and site rentals. Revenues from residents and guests includes revenues from site leases to annual MH residents and annual RV guests, and site rentals to transient RV guests. Resident leases are generally for one-year, but may range from month-to-month to two year terms and are renewable by mutual agreement between the parties, or in some cases, as provided by statute. Revenues from site and home leases fall under the scope of ASC 842, and are accounted for as operating leases with straight-line recognition. Non-lease components of our site lease contracts, which are primarily provision of utility services, are accounted for with the site lease as a single lease component per ASC 842. In accordance with the practical expedient criteria to combine lease and non-lease components, we noted that the timing and pattern of transfer for the lease and non-lease components are the same, and the leases qualify as operating leases. Accordingly, we present rental revenues and utility recoveries as a single lease component within Income from real property in the Consolidated Statement of Operations. Rental home revenues which comprise rental agreements whereby we lease homes to residents in our communities, and short-term vacation home and site rentals are accounted for under ASC 842. Additionally, we include collections of real estate taxes from residents and guests within Income from real property. When payment of revenue is received in advance of being earned, those amounts are classified as deferred revenues.
Income from real property at our marinas includes rental income which consists primarily of storage revenues, derived from leasing out wet slips and storage spaces. The majority of our slip and storage space leases have annual terms that are generally billed seasonally and are renewable by mutual agreement between the parties. Slip and storage space leases are paid annually, seasonally, quarterly, monthly or transient by night. In accordance with ASC 842, slip and storage space lease revenues are typically earned on a monthly basis over the course of the term of the lease and are accounted for as operating leases with straight-line recognition. Storage income is earned when services have been rendered. When payment is received in advance of being earned, those amounts are classified as deferred revenues. There are commercial buildings and / or space within commercial buildings that we lease out in annual or multi-year arrangements. In accordance with ASC 842, commercial lease revenue is typically earned on a monthly basis. We recognize lease revenue on a straight-line basis when rental agreements contain material escalation clauses. As a lessor, we have a significant amount of variable lease payments that we receive, usually from revenue derived from percentage-based leases. The revenue from these leases is accounted for on an as earned basis. We also have a number of short-term leases that are accounted for on an as earned basis. All our revenues are recognized net of taxes collected from customers and submitted to taxing authorities. Real estate taxes are recorded as a liability when collected and released when payments are remitted to tax authorities.
Revenue from home sales - SHS, our U.S. taxable REIT subsidiary, and Park Holidays, sell manufactured homes to current and prospective residents in our communities. We recognize revenue from home sales pursuant to ASC 606 as manufactured homes are tangible personal property that can be located on any land parcel. Manufactured homes are not permanent fixtures or improvements to the underlying real estate and we therefore do not consider them to be subject to the guidance in ASC 360-20, "Real Estate Sales." In accordance with the core principle of ASC 606, we recognize revenue from home sales at the time of closing when control of the home transfers to the customer. After closing of the sale transaction, we have no remaining performance obligation. As of December 31, 2023 and 2022, we had $28.2 million and $28.9 million, respectively, of receivables from contracts with customers, which consists of home sales proceeds, and are presented as a component of Notes and other receivables, net on our Consolidated Balance Sheets. These receivables represent balances owed to us for previously completed performance obligations for sales of manufactured homes. We report real estate taxes collected from residents and remitted to taxing authorities in revenue.
F - 20
SUN COMMUNITIES, INC.
NOTES TO CONSOLIDATED FINANCIAL STATEMENTS
Service, retail, dining and entertainment revenue - is primarily composed of proceeds from restaurant, golf, merchandise, retail, fuel, service and other activities at our RV communities, marinas, and MH communities in the U.K, and is accounted for in accordance with ASC 606. Revenues are recognized at the point of sale when control of the good or service transfers to the customer and our performance obligation has been satisfied. In addition, Marina rental income, which includes boat rentals is earned when the customer takes control of the good or service and is included in Service, retail, dining and entertainment revenue. Sales and other taxes that we collect concurrent with revenue-producing activities are excluded from the transaction price.
Interest income - is earned primarily on our notes receivable, which include installment notes receivables on manufactured homes purchased by us from loan originators and notes receivable from real estate developers and operators. Interest income on these receivables is accrued based on the unpaid principal balances of the underlying loans on a level yield basis over the life of the loans. Interest income is not in the scope of ASC 606. Refer to Note 4, "Notes and Other Receivables," for additional information.
Brokerage commissions and other - comprise brokerage commissions for sales of manufactured homes at our MH and RV communities and brokerage commissions at our marinas, where we act as agent and arrange for a third party to transfer a manufactured home, a park model or a boat to a customer within one of our properties. Brokerage commission revenues are accounted for in accordance with ASC 606 and are recognized on a net basis at closing, when the transaction is completed and our performance obligations have been fulfilled. Other revenues primarily include prepaid rent adjustments, proceeds from business interruption insurance, dividend income and management fees earned from managing third-party-owned holiday parks and third-party-owned marinas.
Advertising Costs
Advertising costs are expensed as incurred. As of December 31, 2023, 2022 and 2021, we had advertising costs of $33.8 million, $30.9 million and $14.5 million, respectively.
Depreciation and Amortization
Depreciation and amortization are computed on a straight-line basis over the estimated useful lives of the assets, ranging from two months to 53 years depending upon the asset classification.
| Asset Class | Useful Life | |||||||||||||
| Land improvements and buildings | - | |||||||||||||
| Rental homes | ||||||||||||||
| Furniture, fixtures and equipment | - | |||||||||||||
| Computer hardware and software | - | |||||||||||||
| Dock improvements | - | |||||||||||||
| Site improvements | - | |||||||||||||
| Leasehold improvements | Lesser of lease term or useful life of assets | |||||||||||||
| Goodwill | Indefinite | |||||||||||||
| In-place leases (including slip in-place leases) | - | |||||||||||||
| Non-competition agreements | ||||||||||||||
| Trademarks and trade names | Various(1) | |||||||||||||
| Customer relationships | - | |||||||||||||
| Franchise agreements and other intangible assets | - | |||||||||||||
Foreign Currency
The assets and liabilities of our operations in the UK, Australia and Canada, where the functional currency is the Pound sterling, Australian dollar and Canadian dollar, respectively, are translated into U.S. dollars using the exchange rate in effect as of the balance sheet date. Income statement amounts are translated at the average exchange rate prevailing during the period. The resulting translation adjustments are recorded as a component of Accumulated other comprehensive income / (loss). Foreign currency exchange gains and losses arising from fluctuations in currency exchange rates on transactions and the effects of remeasurement of monetary balances denominated in currencies other than the functional currency are recorded in earnings within Gain / (loss) on foreign currency exchanges on the Consolidated Statements of Operations.
F - 21
SUN COMMUNITIES, INC.
NOTES TO CONSOLIDATED FINANCIAL STATEMENTS
For the years ended, December 31, 2023, 2022 and 2021, we recorded a foreign currency exchange loss of $0.3 million, gain of $5.4 million and loss of $3.7 million, respectively, on our Consolidated Statements of Operations.
Derivative Instruments and Hedging Activities
We enter into derivative instruments for risk management purposes to minimize the effect of interest rate changes on future cash outflows related to outstanding floating rate debt and forecasted issuances of long-term debt. Treasury rate lock contracts, interest rate swaps and forward swaps are used to accomplish this objective. We do not enter into derivative instruments for speculative purposes.
We recognize derivative instruments at fair value on a recurring basis on the Consolidated Balance Sheets and classify the derivatives within Level 2 of the fair value hierarchy. We adjust our Consolidated Balance Sheets on a quarterly basis to reflect the current fair market value of the derivative instruments. Refer to Note 16, "Fair Value of Financial Instruments," for additional information related to the fair value methodology used for derivative financial instruments.
As of December 31, 2023, all outstanding derivative instruments have been designated as cash flow hedges under ASC Topic 815, "Derivatives and Hedging." These contracts have maturities of 10 years or less. The risk being hedged is the interest rate risk related to forecasted debt transactions and outstanding floating rate debt. We assess the effectiveness of the derivative instruments in hedging the underlying interest rate exposure both at inception and on an ongoing basis. The unrealized gains or losses on the derivative instruments are recorded in Accumulated other comprehensive income / (loss) and are reclassified into earnings as decrease or increase to Interest expense on the Consolidated Statements of Operations during the same period in which the hedged transaction affects earnings. We estimate that $15.5 million will be reclassified as a reduction to Interest expense over the next 12 months for all of our outstanding cash flow hedges. Cash flow from these derivative instruments is classified in the same category as the cash flow items being hedged on the Consolidated Statements of Cash Flows. Refer to Note 15, "Derivative Financial Instruments," for additional information regarding derivative activity.
Accounting for Leases
Lessee Accounting
Pursuant to ASC Topic 842, "Leases," we determine if an arrangement is a lease at inception. Our operating lease agreements are primarily for land and submerged land under non-cancelable operating leases at certain properties, executive office spaces and certain equipment leases. The ROU asset and liabilities are included within Other assets, net and Other liabilities on the Consolidated Balance Sheets.
For operating leases with a term greater than one year, we recognize the ROU assets and liabilities related to the lease payments on the Consolidated Balance Sheets. The lease liabilities are initially and subsequently measured at the present value of the unpaid lease payments at the lease commencement date. The ROU assets represent our right to use the underlying assets for the term of the lease and the lease liabilities represent our obligation to make lease payments arising for the agreements. The ROU asset is initially measured at cost, which comprises the initial amount of the lease liability adjusted for lease payments made at or before the lease commencement date, plus any initial direct costs incurred less any lease incentives received, and any adjustments to reflect favorable or unfavorable terms of the lease when compared with market terms. The ROU asset is subsequently measured throughout the lease term at the carrying amount of the lease liability, plus unamortized initial direct costs, plus (minus) any prepaid (accrued) lease payments, less the unamortized balance of lease incentives received. Lease expense for lease payments is recognized on a straight-line basis over the lease term. The ROU asset is periodically reduced by impairment losses.
Variable lease payments, except for the ones that depend on index or rate, are excluded from the calculation of the ROU assets and lease liabilities and are recognized as variable lease expense in the Consolidated Statements of Operations in the period in which they are incurred. As most of our leases do not provide an implicit rate, we use our incremental borrowing rate based on the information available at commencement date in determining the present value of lease payments. Many of our lessee agreements include options to extend the lease, which we do not include in our minimum lease terms unless they are reasonably certain to be exercised. The lease liability costs are amortized over the straight-line method over the term of the lease. Operating leases with a term of less than one year are recognized as a lease expense over the term of the lease, with no asset or liability recognized on the Consolidated Balance Sheets.
F - 22
SUN COMMUNITIES, INC.
NOTES TO CONSOLIDATED FINANCIAL STATEMENTS
Finance leases where we are the lessee are included in Other assets, net and Other liabilities on our Consolidated Balance Sheets. The lease liabilities are initially measured in the same manner as operating leases and are subsequently measured at amortized cost using the effective interest method. The ROU asset is initially measured at cost, which comprises the initial amount of the lease liability adjusted for lease payments made at or before the lease commencement date, plus any initial direct costs incurred less any lease incentives received, and any adjustments to reflect favorable or unfavorable terms of the lease when compared with market terms. For finance leases, the ROU asset is subsequently amortized using the straight-line method from the lease commencement date to the earlier of the end of its useful life or the end of the lease term unless the lease transfers ownership of the underlying asset to us, or we are reasonably certain to exercise an option to purchase the underlying asset. In those cases, the ROU asset is amortized over the useful life of the underlying asset. We do not recognize an amortization of finance lease ROU asset on land as land is not amortizable. ROU assets are periodically assessed and adjusted for impairment. As of December 31, 2023, we have had no impairment losses. Refer to Note 18, "Leases," for information regarding leasing activities.
Lessor Accounting
Leases to Customers
Our income from real property at our MH and RV properties is derived from rental agreements where we are the lessor. ASC 842 limits the definition of initial direct costs to only the incremental costs of signing a lease. Internal sales employees' compensation, payroll-related fringe benefits, certain legal fees rendered prior to the execution of a lease, negotiation costs, advertising and other origination effort costs do not meet the definition of an initial direct cost and therefore, are accounted for as General and administrative expense or Property operating and maintenance expense in our Consolidated Statements of Operations. ASC 842 permits the capitalization of direct commission costs.
Our MH and RV sites are typically leased to customers on an annual basis. Seasonal RV sites are generally leased to customers for a period less than one year. Transient RV sites are leased to customers on a short-term basis. In addition, customers may lease homes that are located in our MH communities. Our MH and RV leases with customers are classified as operating leases. Fixed lease income from tenants is recognized on a straight-line basis over the terms of the relevant lease agreement and is included within Income from real property and Brokerage commissions and other revenue, net on the Consolidated Statements of Operations. Variable lease income consists of rent primarily based on a percentage of revenues at the related properties and is included within Income from real property and Brokerage commissions and other, net on the Consolidated Statements of Operations. When collectability is not reasonably assured, the resident is placed on non-accrual status and revenue is recognized when cash payments are received.
Our income from customers for wet slips and dry storage space leases at our marinas is accounted for pursuant to ASC 842. Wet slips and dry storage spaces are typically leased to customers on an annual basis. Seasonal wet slips and dry storage spaces are generally leased to customers for a period of less than one year. Transient wet slips and dry storage spaces are leased to customers on a short-term basis. Our wet slips and dry storage space leases are classified as operating leases with lease income recognized over the term of the respective operating lease or the length of a customer's stay.
Leases to Real Estate Operators
We do not have any operating leases with real estate operators at our MH properties. At our RV communities and marinas, our non-cancellable leases with real estate operators where we are the lessor are classified as operating leases with lease income recognized on a straight line basis over the terms of the relevant lease agreement and is included within Income from real property and Brokerage commissions and other, net.
F - 23
SUN COMMUNITIES, INC.
NOTES TO CONSOLIDATED FINANCIAL STATEMENTS
2. Revenue
Disaggregation of Revenue
The following table disaggregates our revenue by major source and segment (in millions):
| Year Ended | |||||||||||||||||||||||||||||||||||||||||||||||||||||||||||||||||||||||
| December 31, 2023 | December 31, 2022 | December 31, 2021 | |||||||||||||||||||||||||||||||||||||||||||||||||||||||||||||||||||||
| MH | RV | Marina | Consolidated | MH | RV | Marina | Consolidated | MH | RV | Marina | Consolidated | ||||||||||||||||||||||||||||||||||||||||||||||||||||||||||||
| Revenues | |||||||||||||||||||||||||||||||||||||||||||||||||||||||||||||||||||||||
Real property | $ | $ | $ | $ | $ | $ | $ | $ | $ | $ | $ | $ | |||||||||||||||||||||||||||||||||||||||||||||||||||||||||||
Home sales | |||||||||||||||||||||||||||||||||||||||||||||||||||||||||||||||||||||||
Service, retail, dining and entertainment | |||||||||||||||||||||||||||||||||||||||||||||||||||||||||||||||||||||||
Interest | |||||||||||||||||||||||||||||||||||||||||||||||||||||||||||||||||||||||
Brokerage commissions and other, net | |||||||||||||||||||||||||||||||||||||||||||||||||||||||||||||||||||||||
| Total Revenues | $ | $ | $ | $ | $ | $ | $ | $ | $ | $ | $ | $ | |||||||||||||||||||||||||||||||||||||||||||||||||||||||||||
Our revenue consists of real property revenue at our MH, RV and Marina properties, revenue from Home sales, Service, retail, dining and entertainment revenue, Interest income, and Brokerage commissions and other revenue.
The majority of our revenue is derived from site and home leases, and wet slip and dry storage space leases that are accounted for pursuant to ASC 842, "Leases." We account for all revenue from contracts with customers following ASC 606, "Revenue from Contracts with Customers," except for those that are within the scope of other topics in the FASB ASC. For additional information, refer to Note 1, "Significant Accounting Policies."
F - 24
SUN COMMUNITIES, INC.
NOTES TO CONSOLIDATED FINANCIAL STATEMENTS
3. Real Estate Acquisitions and Dispositions
2023 Acquisitions and Dispositions
For the year ended December 31, 2023, we acquired the following properties:
Property Name(1) | Type | Sites, Wet Slips and Dry Storage Spaces | Development Sites | State, Province or Country | Month Acquired | |||||||||||||||||||||||||||
| Fox Run | MH: asset acquisition | MI | January | |||||||||||||||||||||||||||||
Savannah Yacht Center | Marina: asset acquisition | GA | March | |||||||||||||||||||||||||||||
| Total | ||||||||||||||||||||||||||||||||
(1) Property names are subject to changes subsequent to acquisition.
The following table summarizes the amount of assets acquired, net of liabilities assumed, at the acquisition date and the consideration paid for the acquisitions completed during the year ended December 31, 2023 (in millions):
| At Acquisition Date | Consideration | ||||||||||||||||||||||||||||||||||||||||||||||
| Investment in property | Inventory of manufactured homes, boat parts and retail related items | Goodwill and other intangible assets | Other assets, net | Total identifiable assets acquired net of liabilities assumed | Cash and escrow | Temporary and permanent equity(1) | Total consideration | ||||||||||||||||||||||||||||||||||||||||
Asset Acquisitions(2) | |||||||||||||||||||||||||||||||||||||||||||||||
Fox Run(3) | $ | $ | $ | $ | $ | $ | $ | $ | |||||||||||||||||||||||||||||||||||||||
Savannah Yacht Center(4) | |||||||||||||||||||||||||||||||||||||||||||||||
| Total | $ | $ | $ | $ | $ | $ | $ | $ | |||||||||||||||||||||||||||||||||||||||
(1) Refer to Note 10, "Equity and Temporary Equity," for additional detail.
(2) Property names are subject to changes subsequent to acquisition.
(3) In conjunction with the acquisition, the Operating Partnership issued 31,289 common OP units valued at $4.4 million.
(4) In conjunction with the acquisition, the Operating Partnership issued one million Series K preferred OP units valued at $100.6 million.
As of December 31, 2023, we had incurred and capitalized $3.1 million of transaction costs, which have been allocated among various fixed asset categories for purchases that meet the asset acquisition criteria. During the year ended December 31, 2023, we recognized $3.0 million of business combination expenses in connection with transactions completed during 2022.
2023 Development and Expansion Activities
During the year ended December 31, 2023, we acquired four land parcels located in the U.S. and one land parcel in the UK for an aggregate purchase price of $35.8 million.
2023 Dispositions
In December 2023, as part of a transaction with our joint venture partners in Sun NG RV Resorts, Sun NG Whitewater RV Resorts LLC, Sun NG Beaver Brook LLC and four standalone affiliates (collectively, "Sun NG"), we disposed of our majority equity interest owned in three consolidated joint venture RV properties with 955 developed sites. Refer to Note 8, "Consolidated Variable Interest Entities," for more information on the Sun NG transaction.
In August 2023, we sold one MH community located in Maine with 155 developed sites at its net carrying value for cash consideration of $6.8 million. The property was previously classified as held for sale during the three months ended June 30, 2023, with its net carrying value of $13.1 million written down by $6.3 million within Asset impairments on our Consolidated Statements of Operations, to a fair value less cost to sell of $6.8 million.
F - 25
SUN COMMUNITIES, INC.
NOTES TO CONSOLIDATED FINANCIAL STATEMENTS
In February 2023, we sold two parcels of land in the UK for total consideration of $111.5 million. The consideration consisted of $108.8 million in the form of an operator note receivable that was added to an existing facility with a weighted average interest rate of 11.9 % per annum, due May 31, 2023 and subsequently extended to July 31, 2023 as part of the operator's total facility. On the date of sale, the carrying value of the note receivable approximated its fair value due to its short term nature. The dispositions resulted in a loss on sale totaling $2.2 million during the year ended December 31, 2023, net of the release of foreign currency translation losses from Accumulated other comprehensive income / (loss) ("AOCI") of $11.9 million. The total loss on sale was recorded in Gain on dispositions of properties on the Consolidated Statements of Operations. As of December 31, 2023, we have reacquired these two parcels of land at fair value as part of the settlement of the related note receivable, with no remeasurement gain or loss recognized. Refer to Note 4, "Notes and Other Receivables," for additional information on the settlement of the notes receivable.
Real Estate Held For Sale - Changes to a Plan of Sale
We periodically classify real estate as "held for sale" after an active program to sell an asset has commenced and when the sale is probable. Subsequent to the classification of assets as held for sale, no further depreciation expense is recorded.
In February 2023, the criteria was met to classify Sandy Bay, an operating MH community in the UK, with 730 developed sites, as held for sale. Previously, this property had been under contract. At December 31, 2023, the sale contract was no longer in effect, and due to an unexpected change in circumstance related to the counterparty, we reclassified the property as held for use. In accordance with ASC Topic 360, "Property, Plant, and Equipment," we recorded the property at the lower of the carrying amount before the asset was held for sale, adjusted for depreciation and amortization expense that would have been recognized had the asset been continually classified as held for use, and the fair value at the time of the reclassification. During the three months ended December 31, 2023, we recorded depreciation and amortization expense of $1.3 million in conjunction with the reclassification of the property. The following assets and liabilities, which were previously classified as held for sale within Other assets and Other liabilities, respectively, were reclassified as of December 31, 2023: Investment in property, net of $259.0 million, Inventory of manufactured homes of $4.6 million, Other intangible assets of $1.3 million, and Other liabilities, net of $55.8 million.
F - 26
SUN COMMUNITIES, INC.
NOTES TO CONSOLIDATED FINANCIAL STATEMENTS
Acquisitions and Dispositions
For the year ended December 31, 2022, we acquired the following MH and RV communities and marinas:
Property Name(1) | Type | Sites, Wet Slips and Dry Storage Spaces | Development Sites | State, Province or Country | Month Acquired | |||||||||||||||||||||||||||
Harrison Yacht Yard(2) | Marina: asset acquisition | MD | January | |||||||||||||||||||||||||||||
| Outer Banks | Marina: asset acquisition | NC | January | |||||||||||||||||||||||||||||
| Jarrett Bay Boatworks | Marina: business combination | NC | February | |||||||||||||||||||||||||||||
| Tower Marine | Marina: asset acquisition | MI | March | |||||||||||||||||||||||||||||
| Sandy Bay | MH: asset acquisition | UK | March | |||||||||||||||||||||||||||||
Park Holidays(3)(4) | MH: business combination | UK | April | |||||||||||||||||||||||||||||
Christies Parks(2)(4) | MH: asset acquisition | UK | April | |||||||||||||||||||||||||||||
| Bluewater | Marina: asset acquisition | Multiple | April | |||||||||||||||||||||||||||||
Bluewater Yacht Sales(2) | Marina: business combination | Multiple | April | |||||||||||||||||||||||||||||
Bodmin Holiday Park(4) | MH: asset acquisition | UK | April | |||||||||||||||||||||||||||||
| Kittery Point | Marina: asset acquisition | ME | May | |||||||||||||||||||||||||||||
| Spanish Trails MHC | MH: asset acquisition | AZ | June | |||||||||||||||||||||||||||||
| Pine Acre Trails | MH: asset acquisition | TX | June | |||||||||||||||||||||||||||||
Bel Air Estates & Sunrise Estates(5) | MH: asset acquisition | CA | June | |||||||||||||||||||||||||||||
Park Leisure(4)(6) | MH: business combination | UK | June | |||||||||||||||||||||||||||||
| Montauk Yacht Club | Marina: business combination | NY | July | |||||||||||||||||||||||||||||
Callaly Leisure(4)(7) | MH: asset acquisition | UK | September | |||||||||||||||||||||||||||||
Newhaven(4) | MH: asset acquisition | UK | October | |||||||||||||||||||||||||||||
| Bayfront Marina | Marina: asset acquisition | CA | November | |||||||||||||||||||||||||||||
| Marina Bay Yacht Harbor | Marina: asset acquisition | CA | December | |||||||||||||||||||||||||||||
| Jellystone Lincoln | RV: asset acquisition | DE | December | |||||||||||||||||||||||||||||
| Norway Commons | MH: asset acquisition | ME | December | |||||||||||||||||||||||||||||
| Total | ||||||||||||||||||||||||||||||||
(1) Property names are subject to changes subsequent to acquisition.
(2) Combined with an existing property.
(3) Includes 40 owned and two managed properties.
(4) Included in the Park Holidays business.
(5) Includes two properties.
(6) Includes 11 properties.
(7) Includes one development property.
F - 27
SUN COMMUNITIES, INC.
NOTES TO CONSOLIDATED FINANCIAL STATEMENTS
The following table summarizes the amounts of assets acquired, net of liabilities assumed, at the acquisition date and the consideration paid for the acquisitions completed in 2022 (in millions):
| At Acquisition Date | Consideration | ||||||||||||||||||||||||||||||||||||||||||||||
| Investment in property | Inventory of manufactured homes, boat parts and retail related items | In-place leases, goodwill and other intangible assets(1) | Other assets / (liabilities), net | Total identifiable assets acquired net of liabilities assumed | Cash and escrow | Temporary and permanent equity(2) | Total consideration | ||||||||||||||||||||||||||||||||||||||||
Asset Acquisitions(3) | |||||||||||||||||||||||||||||||||||||||||||||||
Harrison Yacht Yard(4) | $ | $ | $ | $ | $ | $ | $ | $ | |||||||||||||||||||||||||||||||||||||||
| Outer Banks | ( | ||||||||||||||||||||||||||||||||||||||||||||||
| Tower Marine | ( | ||||||||||||||||||||||||||||||||||||||||||||||
| Sandy Bay | ( | ||||||||||||||||||||||||||||||||||||||||||||||
Christies Parks(4)(5) | |||||||||||||||||||||||||||||||||||||||||||||||
| Bluewater | |||||||||||||||||||||||||||||||||||||||||||||||
Bodmin Holiday Park(5) | |||||||||||||||||||||||||||||||||||||||||||||||
| Kittery Point | ( | ||||||||||||||||||||||||||||||||||||||||||||||
| Spanish Trails MHC | |||||||||||||||||||||||||||||||||||||||||||||||
| Pine Acre Trails | |||||||||||||||||||||||||||||||||||||||||||||||
| Bel Air Estates & Sunrise Estates | |||||||||||||||||||||||||||||||||||||||||||||||
Callaly Leisure(5) | ( | ||||||||||||||||||||||||||||||||||||||||||||||
Newhaven(5) | |||||||||||||||||||||||||||||||||||||||||||||||
| Bayfront Marina | ( | ||||||||||||||||||||||||||||||||||||||||||||||
| Marina Bay Yacht Harbor | ( | ||||||||||||||||||||||||||||||||||||||||||||||
Jellystone Lincoln(6) | |||||||||||||||||||||||||||||||||||||||||||||||
| Norway Commons | |||||||||||||||||||||||||||||||||||||||||||||||
Business Combination(3) | |||||||||||||||||||||||||||||||||||||||||||||||
Jarrett Bay Boatworks(7) | |||||||||||||||||||||||||||||||||||||||||||||||
Park Holidays(5)(8) | ( | ||||||||||||||||||||||||||||||||||||||||||||||
Park Leisure(5) | ( | ||||||||||||||||||||||||||||||||||||||||||||||
| Montauk Yacht Club | |||||||||||||||||||||||||||||||||||||||||||||||
| Total | $ | $ | $ | $ | ( | $ | $ | $ | $ | ||||||||||||||||||||||||||||||||||||||
(1) Refer to Note 6, "Goodwill and Other Intangible Assets," for additional detail on goodwill and other intangible assets.
(2) Refer to Note 10, "Equity and Temporary Equity," for additional detail.
(3) Property names are subject to changes subsequent to acquisition.
(4) Combined with an existing property.
(5) Included in the Park Holidays business.
(6) In December 2020, we entered into a loan agreement pursuant to which we extended credit to Blue Water to finance the construction of Jellystone Lincoln (the "RV Park"). In December 2022, we entered into a purchase and sale agreement pursuant to which we purchased the RV Park for cash consideration of $5.0 million, which was applied toward the existing Blue Water loan balance of $12.9 million, and the remaining loan balance of $7.9 million was forgiven. Upon acquisition of the RV Park, we agreed to loan Blue Water an amount equal to $3.7 million, accounted as consideration based on the loan forgiveness terms. Additional consideration for vacation rental units of $0.4 million, resulted in a total purchase price of $17.0 million. In addition, we entered into a lease agreement pursuant to which Blue Water will pay rent to us and continue to operate the park.
(7) The balance includes the marina acquired in February and the yacht sales business acquired in April of which $0.1 million was recorded in Investment property, $17.6 million in Goodwill and other intangible assets, and $0.4 million in Other assets / (liabilities), net.
(8) Includes acquired intangible assets subject to amortization of $70.2 million with a weighted average amortization period of 14.6 years, consisting of trademarks and trade names, customer relationships and other intangible assets.
As of December 31, 2022, we incurred $19.2 million of transaction costs, which were capitalized and allocated among the various fixed asset categories for purchases that meet the asset acquisition criteria. During the year ended December 31, 2022, we also incurred $24.7 million of business combination expenses, which were expensed for acquisitions deemed to be business combinations.
F - 28
SUN COMMUNITIES, INC.
NOTES TO CONSOLIDATED FINANCIAL STATEMENTS
Total revenues and Net income included in the Consolidated Statements of Operations for the year ended December 31, 2022 related to business combinations completed in 2022 are set forth in the following table (in millions):
| Year Ended | ||||||||
| December 31, 2022 | ||||||||
| Total revenues | $ | |||||||
| Net income | $ | |||||||
The following unaudited pro forma financial information presents the results of our operations for the years ended December 31, 2022 and 2021, as if the properties combined through business combinations in 2022 had been acquired on January 1, 2021. The unaudited pro forma results reflect certain adjustments for items that are not expected to have a continuing impact, such as adjustments for transaction costs incurred, management fees and acquisition accounting.
The information presented below has been prepared for comparative purposes only and does not purport to be indicative of either future results of operations or the results of operations that would have actually occurred had the acquisitions been consummated on January 1, 2021 (in millions, except for per share data):
| Year Ended (unaudited) | ||||||||||||||
| December 31, 2022 | December 31, 2021 | |||||||||||||
| Total revenues | $ | $ | ||||||||||||
| Net income attributable to SUI common shareholders | $ | $ | ||||||||||||
| Net income per share attributable to SUI common shareholders - basic | $ | $ | ||||||||||||
| Net income per share attributable to SUI common shareholders - diluted | $ | $ | ||||||||||||
2022 Development and Expansion Activities
During the year ended December 31, 2022, we acquired six land parcels located in the U.S. and the UK for an aggregate purchase price of $26.2 million and two buildings and land parcels related to our marinas located in the U.S. for an aggregate purchase price of $13.9 million.
2022 Dispositions
During the three months ended September 30, 2022, we sold an RV community containing 514 sites located in California for $15.0 million. The disposition resulted in a loss on sale of $0.8 million, inclusive of selling costs.
During the three months ended March 31, 2022, we sold two MH communities and one community containing MH and RV sites, each located in Florida, with a total of 323 sites for $29.5 million. The gain from the sale of the properties was $13.3 million.
Refer to Note 21, "Subsequent Events," for information regarding acquisition and dispositions completed after December 31, 2023.
4. Notes and Other Receivables
The following table sets forth certain information regarding notes and other receivables (in millions):
| December 31, 2023 | December 31, 2022 | ||||||||||
| Installment notes receivable on manufactured homes, net | $ | $ | |||||||||
| Notes receivable from real estate developers and operators | |||||||||||
| Other receivables, net | |||||||||||
| Total Notes and Other Receivables, net | $ | $ | |||||||||
F - 29
SUN COMMUNITIES, INC.
NOTES TO CONSOLIDATED FINANCIAL STATEMENTS
Installment Notes Receivable on Manufactured Homes
Installment notes receivable are measured at fair value, using indicative pricing models from third party valuation specialists, in accordance with ASC Topic 820, "Fair Value Measurements and Disclosures." During the three months ended December 31, 2023, we transferred a group of installment notes receivable to an unrelated party. Refer to Note 5, "Collateralized Receivables and Transfers of Financial Assets," for additional details. The balances of installment notes receivable of $19.6 million (gross installment notes receivable of $20.4 million less fair value adjustment of $0.8 million) and $65.9 million (gross installment notes receivable of $67.3 million less fair value adjustment of $1.4 million) as of December 31, 2023 and 2022, respectively, are secured by manufactured homes. The notes represent financing to purchasers of manufactured homes located in our communities and require monthly principal and interest payments. The notes had a net weighted average interest rate (net of servicing costs) and maturity of 6.9 % and 17.2 years as of December 31, 2023, and 7.6 % and 13.8 years as of December 31, 2022. Refer to Note 16, "Fair Value of Financial Instruments," for additional details.
Notes Receivable from Real Estate Developers and Operators
Notes receivable from real estate developers and operators are measured at fair value, using indicative pricing models from third party valuation specialists, in accordance with ASC Topic 820, "Fair Value Measurements and Disclosures." Refer to Note 16, "Fair Value of Financial Instruments," for additional information.
Note Receivable from a Real Estate Operator
The note receivable from a real estate operator is comprised of a fully drawn loan provided to Royale Holdings Group HoldCo Limited, a real estate development owner and operator in the UK, and certain other parties, to fund investing and financing activities (the "Note").
As of December 31, 2022, the Note balance, which includes accrued interest, was $217.6 million. There were no remeasurement adjustments to the fair value of the Note during the year ended December 31, 2022. At December 31, 2022, the Note had a net weighted average interest rate of 15.3 % and maturity of 0.1 years. The Note was collateralized by a first-priority security interest in three real estate assets and three MH manufacturers in the UK. The real estate assets consisted of MH development properties that comprised a significant majority of the total appraised value of all collateral securing the Note.
After the maturity date of July 31, 2023, the Note became past due. On September 29, 2023, we appointed receivers over the real estate assets. The receivers marketed the real estate assets for sale during the fourth quarter of 2023. Upon completion of the marketing process, on December 28, 2023, we appointed administrators over the real estate assets and acquired such assets through a credit bid. During the fourth quarter, we engaged third party valuation specialists to appraise the real estate assets in accordance with ASC 820. The appraisals were completed using the discounted cash flow method (income approach), with the significant assumptions being estimated absorption rate, sale price and discount rate. The real estate assets appraised at fair value totaling $263.8 million. The Note balance was reduced by this amount, with an offsetting adjustment to Investment Property on our Consolidated Balance Sheets as of December 31, 2023.
As of December 31, 2023, the balance remaining on the Note, which was in nonaccrual status, collateralized by a first-priority security interest in three MH manufacturers in the UK, was adjusted to fair value totaling $10.8 million (gross notes receivable of $114.3 million, inclusive of accrued interest of $10.4 million, less a fair value adjustment of $103.5 million). The note had a weighted average interest rate of 12.5% as of December 31, 2023. Refer to Note 21, "Subsequent Events," for information regarding settlement of the remaining note balance.
Notes Receivable from Real Estate Developers
Other acquisition and construction loans provided to real estate developers total $123.7 million with a net weighted average interest rate and maturity of 9.2 % and 2.6 years as of December 31, 2023, and total $87.6 million with a net weighted average interest rate and maturity of 7.8 % and 2.3 years as of December 31, 2022. As of December 31, 2023, the additional acquisition and construction loans provided to real estate developers have $39.5 million of undrawn funds. There were no
F - 30
SUN COMMUNITIES, INC.
NOTES TO CONSOLIDATED FINANCIAL STATEMENTS
Other Receivables, net
Other receivables, net were comprised of amounts due from the following categories (in millions):
| December 31, 2023 | December 31, 2022 | ||||||||||
| Insurance receivables | $ | $ | |||||||||
MH and annual RV residents for rent, utility charges, fees and other pass-through charges, net(1) | |||||||||||
Marina customers for storage, service and lease payments, net(2) | |||||||||||
Home sale proceeds | |||||||||||
Other receivables(3) | |||||||||||
| Total Other Receivables, net | $ | $ | |||||||||
(1)Net of allowance of $4.8 million and $5.9 million as of December 31, 2023 and 2022, respectively.
(2)Net of allowance of $2.9 million and $2.2 million as of December 31, 2023 and 2022, respectively.
(3) Includes receivable from Rezplot Systems LLC, a nonconsolidated affiliate, in which we had a zero and 48.9 % ownership interest as of December 31, 2023 and 2022, respectively. In June 2020, we made a convertible secured loan to Rezplot Systems LLC. The note allows for a principal amount of up to $10.0 million to be drawn down over a period of three years , bears an interest rate of 3.0 %, matures in June 2024, and is secured by all the assets of Rezplot Systems LLC. In January 2022, we made an additional loan to Rezplot Systems LLC that allows for a principal amount of up to $5.0 million to be drawn over a period of three years , bears an interest rate of 3.0 % and matures in January 2025. In December 2023, in conjunction with the sale of our equity interest, we settled the outstanding note receivable balance of $12.2 million as part of a transaction with our joint venture partner in Sun NG. The outstanding balance was $12.7 million as of December 31, 2022. Refer to Note 7, "Investments in Nonconsolidated Affiliates," for additional information on Rezplot Systems LLC, and Note 8, "Consolidated Variable Interest Entities," for more information on the transaction with our joint venture partner in Sun NG.
5. Collateralized Receivables and Transfers of Financial Assets
During the three months ended December 31, 2023, we completed a transfer of our installment notes receivable to an unrelated entity and received net cash proceeds of $53.4 million, along with an agreed upon future cash payment of $1.1 million from the third-party servicer, in exchange for relinquishing our right, title and interest in the receivables. We used the proceeds to pay down borrowings outstanding under our Senior Credit Facility. We have no further obligations or rights with respect to the control, management, administration, servicing or collection of the installment notes receivables. However, we are subject to certain recourse provisions requiring us to purchase the underlying manufactured homes collateralizing such notes at a price calculated based on the agreed upon terms, in the event of a note default and subsequent repossession of the home by the unrelated entity. The recourse provisions are considered to be a form of continuing involvement which precluded establishing legal isolation, and therefore these transferred loans do not meet the requirements for sale accounting under ASC 860, "Transfers and Servicing."
The transaction has been accounted for in accordance with ASC 860-30, with the transferred assets classified as Collateralized receivables, net and the cash proceeds received from this transaction classified as Secured borrowings on collateralized receivables within the Consolidated Balance Sheets. We have elected to apply the fair value option to the collateralized receivables and related secured borrowings under ASC 820, "Fair Value Measurements and Disclosures." The balance of collateralized receivables was $56.2 million (gross collateralized receivable of $59.1 million less fair value adjustments of $2.9 million) as of December 31, 2023. The balance of secured borrowings on collateralized receivables was $55.8 million (gross secured borrowings of $53.9 million plus fair value adjustments of $1.9 million) as of December 31, 2023. The notes represent financing to purchasers of manufactured homes located in our communities and require monthly principal and interest payments. The notes had a net weighted average interest rate and maturity of 8.6 % and 14.2 years as of December 31, 2023. Refer to Note 16, "Fair Value of Financial Instruments," for additional details.
The collateralized receivables earn interest income and the secured borrowings accrue interest expense at the same amount. The amount of interest income and interest expense recognized during the year ended December 31, 2023 was $0.6 million.
F - 31
SUN COMMUNITIES, INC.
NOTES TO CONSOLIDATED FINANCIAL STATEMENTS
6. Goodwill and Other Intangible Assets
Our intangible assets include goodwill, in-place leases, non-competition agreements, trademarks and trade names, customer relationships, franchise agreements and other intangible assets. These intangible assets are recorded in Goodwill and Other intangible assets, net on the Consolidated Balance Sheets.
Goodwill
The measurement periods for the valuation of assets acquired and liabilities assumed in a business combination end as soon as information on the facts and circumstances that existed as of the acquisition dates becomes available on the earlier of (i) the dates of acquisition, or (ii) 12 months after the acquisition dates. Adjustments in purchase price allocations may require a change in the amounts allocated to goodwill during the periods in which the adjustments are determined. These purchase accounting adjustments are presented under Other in the table below. Changes in the carrying amount of goodwill during the years ended December 31, 2023 and 2022, respectively, by reportable segment were as follows (in millions):
| Goodwill by Segment | |||||||||||||||||||||||
| MH | RV | Marina | Total | ||||||||||||||||||||
Balance as of January 1, 2022 | $ | $ | $ | $ | |||||||||||||||||||
Acquisitions(1) | |||||||||||||||||||||||
| Currency Translation Adjustment | ( | ( | |||||||||||||||||||||
Other(2) | |||||||||||||||||||||||
Balance as of December 31, 2022 | $ | $ | $ | $ | |||||||||||||||||||
Impairments(3) | ( | ( | |||||||||||||||||||||
| Currency Translation Adjustment | |||||||||||||||||||||||
Other(4) | |||||||||||||||||||||||
Balance as of December 31, 2023 | $ | $ | $ | $ | |||||||||||||||||||
(1) During the year ended December 31, 2022, we recorded goodwill of $465.0 million in the MH segment related to the acquisition of Park Holidays, primarily attributed to the acquired platform and assembled workforce value associated with the scale of Park Holidays' existing operations in the UK. Additionally, we recorded goodwill of $41.5 million in the Marina segment related to the acquisitions of Jarrett Bay Boatworks and Montauk Yacht Club, primarily attributed to enterprise value and the assembled workforce value associated with existing operations, and $9.5 million in the RV segment related to the acquisition of Leisure Systems, Inc, primarily attributed to its licensing arrangements, ability to obtain new franchise relationships and assembled workforce. The total recognized goodwill of $516.0 million is expected to be deductible for income tax purposes.
(2) During the year ended December 31, 2022, adjustments in purchase price allocations resulted in the recognition of additional goodwill of $39.1 million in the MH segment, related to the acquisition of Park Holidays.
(3) During the year ended December 31, 2023, we performed qualitative and quantitative assessments of our goodwill balance for potential impairment in accordance with ASC 350-20, "Goodwill and Other." As a result of our impairment testing, we determined that the fair value of the UK reporting unit within the MH segment was below its carrying value. Accordingly, during the year ended December 31, 2023, we recorded aggregate non-cash impairment charges of $369.9 million within Goodwill impairment on the Consolidated Statements of Operations. The decline in fair value of the UK reporting unit was primarily driven by a higher weighted average cost of capital due to changes in the macroeconomic environment, as well as inflationary pressures in the UK causing a decline in financial projections.
(4) During the year ended December 31, 2023, adjustments in purchase price allocations resulted in the recognition of additional goodwill of $60.7 million in the MH segment, related to the Park Leisure business combination.
F - 32
SUN COMMUNITIES, INC.
NOTES TO CONSOLIDATED FINANCIAL STATEMENTS
Other Intangible Assets, net
The gross carrying amounts and accumulated amortization of our intangible assets were as follows (in millions):
| December 31, 2023 | December 31, 2022 | |||||||||||||||||||||||||||||||
| Other Intangible Asset | Useful Life | Gross Carrying Amount | Accumulated Amortization | Gross Carrying Amount | Accumulated Amortization | |||||||||||||||||||||||||||
| In-place leases | $ | $ | ( | $ | $ | ( | ||||||||||||||||||||||||||
| Non-competition agreements | ( | ( | ||||||||||||||||||||||||||||||
| Trademarks and trade names | ( | ( | ||||||||||||||||||||||||||||||
| Customer relationships | ( | ( | ||||||||||||||||||||||||||||||
| Franchise agreements and other intangible assets | ( | ( | ||||||||||||||||||||||||||||||
| Total finite-lived assets | ( | ( | ||||||||||||||||||||||||||||||
| Indefinite-lived assets - Trademarks and trade names | N/A | — | — | |||||||||||||||||||||||||||||
| Indefinite-lived assets - Other | N/A | — | — | |||||||||||||||||||||||||||||
| Total indefinite-lived assets | — | — | ||||||||||||||||||||||||||||||
| Total | $ | $ | ( | $ | $ | ( | ||||||||||||||||||||||||||
Amortization expenses related to our Other intangible assets were as follows (in millions):
| Year Ended | ||||||||||||||||||||
| Other Intangible Asset Amortization Expense | December 31, 2023 | December 31, 2022 | December 31, 2021 | |||||||||||||||||
| In-place leases | $ | $ | $ | |||||||||||||||||
| Non-competition agreements | ||||||||||||||||||||
| Trademarks and trade names | ||||||||||||||||||||
| Customer relationships | ||||||||||||||||||||
| Franchise fees and other intangible assets | ||||||||||||||||||||
| Total | $ | $ | $ | |||||||||||||||||
We anticipate amortization expense for Other intangible assets to be as follows for the next five years (in millions):
| Other Intangible Asset Future Amortization Expense | 2024 | 2025 | 2026 | 2027 | 2028 | |||||||||||||||||||||||||||
| In-place leases | $ | $ | $ | $ | $ | |||||||||||||||||||||||||||
| Non-competition agreements | ||||||||||||||||||||||||||||||||
| Trademarks and trade names | ||||||||||||||||||||||||||||||||
| Customer relationships | ||||||||||||||||||||||||||||||||
| Franchise agreements and other intangible assets | ||||||||||||||||||||||||||||||||
| Total | $ | $ | $ | $ | $ | |||||||||||||||||||||||||||
F - 33
SUN COMMUNITIES, INC.
NOTES TO CONSOLIDATED FINANCIAL STATEMENTS
7. Investments in Nonconsolidated Affiliates
Investments in joint ventures that are not consolidated, nor recorded at cost, are accounted for using the equity method of accounting as prescribed in ASC Topic 323, "Investments - Equity Method and Joint Ventures." Investments in nonconsolidated affiliates are recorded within Other assets, net on the Consolidated Balance Sheets. Equity income and loss are recorded in the Income / (loss) from nonconsolidated affiliates on the Consolidated Statements of Operations.
RezPlot Systems LLC ("Rezplot")
At December 31, 2023 and 2022, we had a zero and 48.9 % ownership interest, respectively, in RezPlot, a RV reservation software technology company, operating under the Campspot brand, which we acquired in January 2019. During the year ended December 31, 2023, in conjunction with the transaction with our joint venture partner in Sun NG, we disposed of our ownership interest in Rezplot and settled notes receivable due from Rezplot for $12.2 million. In conjunction with the disposition, we remeasured the investment to its fair value and recorded a gain of $15.3 million. The gain was recorded within Income from nonconsolidated affiliates on the Consolidated Statements of Operations. Refer to Note 4, "Notes and Other Receivables," for additional information on the notes receivable and Note 8, "Consolidated Variable Interest Entities," for more information on the transaction with our joint venture partner in Sun NG.
Sungenia joint venture ("Sungenia JV")
At December 31, 2023 and 2022, we had a 50
GTSC LLC ("GTSC")
At December 31, 2023 and 2022, we had a 40
Origen Financial Services, LLC ("OFS")
At December 31, 2023 and 2022, we had no 0.6 million. The gain from the sale was $0.3 million, which was recorded within Income from nonconsolidated affiliates on the Consolidated Statements of Operations.
SV Lift, LLC ("SV Lift")
At December 31, 2023 and 2022, we had a 50
The investment balance in each nonconsolidated affiliate is as follows (in millions):
| Investment | December 31, 2023 | December 31, 2022 | ||||||||||||
| Investment in Sungenia JV | $ | $ | ||||||||||||
| Investment in GTSC | ||||||||||||||
| Investment in SV Lift | ||||||||||||||
| Total | $ | $ | ||||||||||||
The income / (loss) from each nonconsolidated affiliate is as follows (in millions):
| Year Ended | ||||||||||||||||||||
| Income / (Loss) from Nonconsolidated Affiliates | December 31, 2023 | December 31, 2022 | December 31, 2021 | |||||||||||||||||
| RezPlot equity income / (loss) | $ | $ | ( | $ | ( | |||||||||||||||
| Sungenia JV equity income | ||||||||||||||||||||
| GTSC equity income | ||||||||||||||||||||
| OFS equity income | ||||||||||||||||||||
| SV Lift equity loss | ( | ( | ( | |||||||||||||||||
| Total Income from Nonconsolidated Affiliates | $ | $ | $ | |||||||||||||||||
F - 34
SUN COMMUNITIES, INC.
NOTES TO CONSOLIDATED FINANCIAL STATEMENTS
The change in the Sungenia JV investment balance is as follows (in millions):
| Year Ended | ||||||||||||||
| December 31, 2023 | December 31, 2022 | |||||||||||||
| Beginning balance | $ | $ | ||||||||||||
| Cumulative translation adjustment | ( | ( | ||||||||||||
| Contributions | ||||||||||||||
| Equity earnings | ||||||||||||||
| Ending Balance | $ | $ | ||||||||||||
The change in the GTSC investment balance is as follows (in millions):
| Year Ended | ||||||||||||||
| December 31, 2023 | December 31, 2022 | |||||||||||||
| Beginning balance | $ | $ | ||||||||||||
| Contributions | ||||||||||||||
| Distributions | ( | ( | ||||||||||||
| Equity earnings | ||||||||||||||
| Fair value adjustment | ( | ( | ||||||||||||
| Ending Balance | $ | $ | ||||||||||||
8. Consolidated Variable Interest Entities
The Operating Partnership
We consolidate the Operating Partnership under the guidance set forth in ASC 810, "Consolidation." We evaluated whether the Operating Partnership met the criteria for classification as a variable interest entity ("VIE") or, alternatively, as a voting interest entity and concluded that the Operating Partnership met the criteria of a VIE. Our significant asset is our investment in the Operating Partnership, and consequently, substantially all of our assets and liabilities represent those assets and liabilities of the Operating Partnership. We are the sole general partner and generally have the power to manage and have complete control over the Operating Partnership and the obligation to absorb its losses or the right to receive its benefits.
Other Consolidated VIEs
We consolidate Sun NG RV Resorts LLC ("Sun NG Resorts"), Sun NG Beaver Brook LLC, FPG Sun Menifee 80 LLC, Solar Energy Project LLC, Solar Energy Project CA II LLC, Solar Energy Project III LLC and FPG Sun Moreno Valley 66 LLC under the guidance set forth in ASC Topic 810, "Consolidation." We concluded that each entity is a VIE where we are the primary beneficiary, as we have the power to direct the significant activities of, and absorb the significant losses and receive the significant benefits from each entity. Refer to Note 9, "Debt and Line of Credit" and Note 10, "Equity and Temporary Equity," for additional information on Sun NG Resorts.
F - 35
SUN COMMUNITIES, INC.
NOTES TO CONSOLIDATED FINANCIAL STATEMENTS
Sun NG Resorts Transaction
During the three months ended December 31, 2023, we simplified the structure of certain of our consolidated variable interest entities, including Sun NG RV Resorts, Sun NG Whitewater RV Resorts LLC, Sun NG Beaver Brook LLC and four standalone affiliates (collectively "Sun NG") in a transaction with our joint venture partner in Sun NG. The transaction, which was primarily a non-monetary exchange and resulted in a net cash receipt of $8.2 million, consisted of the following:
•Disposition of our majority equity interest in three consolidated joint venture properties (including Sun NG Whitewater RV Resorts LLC) with a fair value of $166.1 million, which resulted in a gain of $13.2 million;
•Acquisition of all noncontrolling equity interests in 14 consolidated joint venture properties and a significant portion of the noncontrolling equity interest in five stand-alone joint venture properties (including Sun NG Beaver Brook LLC) with a fair value of $149.5 million. This resulted in us owning a 100 % controlling interest in 14 of these properties (the "Acquired RV Properties") and a majority interest in the remaining properties. The acquisition of the noncontrolling interest was accounted for as an equity transaction in accordance with ASC Topic 810, "Consolidation," with the difference between the fair value and carrying value of the acquired noncontrolling interest of $125.3 million recorded as a decrease to Additional paid-in capital;
•Settlement of the Series A and Series B preferred equity interests in the Sun NG Resorts joint venture of $35.2 million and $3.9 million, respectively, and issuance of 20,000 Series L preferred OP units valued at $2.0 million. The Series A and Series B preferred equity interests were accounted for as Unsecured debt and Temporary Equity on our Consolidated Balance Sheets, respectively. The Series L preferred OP units were recorded in Noncontrolling Interests in the Consolidated Balance Sheets;
•Disposition of our ownership interest in Rezplot, a nonconsolidated affiliate, and settlement of notes receivable due from Rezplot for $12.2 million. In conjunction with the disposition, we remeasured the investment to its fair value and recorded a gain of $15.3 million.
We concluded that the Acquired RV Properties no longer qualify as VIEs and instead will be consolidated under the voting interest model. The five properties remaining under joint venture agreements continue to be accounted for as consolidated VIEs and are included in the table below. Refer to Note 3, "Real Estate Acquisitions and Dispositions" related to the three properties that were sold, Note 4, "Notes and Other Receivables" related to the settlement of the receivable due from Rezplot, Note 7, "Investments in Nonconsolidated Affiliates" related to the sale of our investment in Rezplot, Note 9, "Debt and Line of Credit" related to the settlement of the Series A preferred equity interest, and Note 10, "Equity and Temporary Equity" related to the acquisition of the noncontrolling equity interest in 14 consolidated joint venture properties and issuance of Series L preferred OP units.
Other Noncontrolling Equity Interest Transactions
During the three months ended September 30, 2022, we acquired the noncontrolling equity interest held by third parties in a joint venture created for the purpose of acquiring land and constructing a marina in Fort Lauderdale, Florida ("SHM South Fork JV, LLC"). The transaction resulted in us owning a 100 % ownership interest in the joint venture and we concluded that SHM South Fork JV, LLC was no longer a VIE. The acquisition was accounted for as an equity transaction in accordance with ASC Topic 810, "Consolidation," with the difference between the purchase price and the noncontrolling interest of $1.9 million recorded as a decrease to Additional Paid-in Capital on the Consolidated Balance Sheets.
During the three months ended June 30, 2022, we acquired the noncontrolling equity interest held by third parties in Rudgate Village SPE LLC, Rudgate Clinton SPE LLC and Rudgate Clinton Estates, LLC (collectively, "Rudgate"), an MH community, which resulted in us owning a 100 % ownership interest in Rudgate. We concluded that Rudgate was no longer a VIE. The acquisition was accounted for as an equity transaction in accordance with ASC Topic 810, "Consolidation," with the difference between the purchase price and the acquired noncontrolling interest of $13.2 million recorded as an increase to Additional paid-in capital on the Consolidated Balance Sheets. Refer to Note 10, "Equity and Temporary Equity," for additional information.
F - 36
SUN COMMUNITIES, INC.
NOTES TO CONSOLIDATED FINANCIAL STATEMENTS
The following table summarizes the assets and liabilities of our consolidated VIEs after eliminations, with the exception of the Operating Partnership, included in our Consolidated Balance Sheets after eliminations (in millions):
| December 31, 2023 | December 31, 2022 | ||||||||||
| Assets | |||||||||||
| Investment property, net | $ | $ | |||||||||
| Cash, cash equivalents and restricted cash | |||||||||||
| Other intangible assets, net | |||||||||||
| Other assets, net | |||||||||||
| Total Assets | $ | $ | |||||||||
| Liabilities and Other Equity | |||||||||||
| Secured debt | $ | $ | |||||||||
| Unsecured debt | |||||||||||
| Advanced reservation deposits and rent | |||||||||||
| Accrued expenses and accounts payable | |||||||||||
| Other liabilities | |||||||||||
| Total Liabilities | |||||||||||
| Temporary equity | |||||||||||
| Total Liabilities and Other Equity | $ | $ | |||||||||
Total assets related to the consolidated VIEs, with the exception of the Operating Partnership, comprised 0.8 % and 4.5 % of our consolidated total assets at December 31, 2023 and 2022, respectively. Total liabilities comprised 0.3 % and 0.9 % of our consolidated total liabilities at December 31, 2023 and 2022, respectively. Equity Interests and Noncontrolling interests related to the consolidated VIEs, on an absolute basis, comprised less than 1.0
9. Debt and Line of Credit
The following table sets forth certain information regarding debt, including premiums, discounts and deferred financing costs (in millions, except for statistical information):
| Carrying Amount | Weighted Average Years to Maturity | Weighted Average Interest Rates | |||||||||||||||||||||||||||||||||
| December 31, 2023 | December 31, 2022 | December 31, 2023 | December 31, 2022 | December 31, 2023 | December 31, 2022 | ||||||||||||||||||||||||||||||
| Secured Debt | |||||||||||||||||||||||||||||||||||
Mortgage loans payable(1) | $ | $ | % | % | |||||||||||||||||||||||||||||||
Secured borrowings on collateralized receivables(2) | N/A | % | N/A | ||||||||||||||||||||||||||||||||
| Total Secured Debt | |||||||||||||||||||||||||||||||||||
| Unsecured Debt | |||||||||||||||||||||||||||||||||||
Senior unsecured notes(3) | % | % | |||||||||||||||||||||||||||||||||
Line of credit and other debt(4) | % | % | |||||||||||||||||||||||||||||||||
| Preferred equity - Sun NG Resorts - mandatorily redeemable | % | % | |||||||||||||||||||||||||||||||||
| Preferred OP units - mandatorily redeemable | % | % | |||||||||||||||||||||||||||||||||
| Total Unsecured Debt | |||||||||||||||||||||||||||||||||||
| Total Debt | $ | $ | % | % | |||||||||||||||||||||||||||||||
(1)Balances at December 31, 2023 and 2022 include zero and $0.1 million of net debt premium, respectively, and $16.9 million and $14.6 million of deferred financing costs, respectively.
(2)Balance at December 31, 2023 includes fair value adjustments of $1.9 million.
(3)Balances at December 31, 2023 and 2022 include $6.5 million and $6.1 million of net debt discount, respectively, and $16.0 million and $14.3 million of deferred financing costs, respectively. Weighted average interest rates include the impact of hedge activity.
(4)Balances at December 31, 2023 and 2022 include $1.6 million and $3.0 million of deferred financing costs, respectively. Weighted average interest rates include the impact of hedge activity.
F - 37
SUN COMMUNITIES, INC.
NOTES TO CONSOLIDATED FINANCIAL STATEMENTS
Secured Debt
Mortgage term loans
During the years ended December 31, 2023 and 2022, we repaid the following mortgage term loans during the quarters presented below (in millions, except for statistical information):
| Period | Repayment Amount | Fixed Interest Rate | Maturity Date | Loss on Extinguishment of Debt | ||||||||||||||||||||||
| Three months ended September 30, 2022 | $ | (1) | % | December 6, 2022 - September 6, 2024 | $ | |||||||||||||||||||||
| Three months ended June 30, 2022 | $ | % | October 1, 2022 | $ | ||||||||||||||||||||||
(1)Includes 17 mortgage term loans which were scheduled to mature from December 6, 2022 to September 6, 2024, that are secured by 35 properties.
During the years ended December 31, 2023 and 2022, we entered into the following mortgage term loans during the quarters presented below (in millions, except for statistical information):
| Period | Loan Amount | Term (in years) | Interest Rate | Maturity Date | ||||||||||||||||||||||
| Three months ended December 31, 2023 | $ | (1) | % | November 1, 2030 | ||||||||||||||||||||||
| Three months ended March 31, 2023 | $ | (2) | % | February 13, 2026 | ||||||||||||||||||||||
| $ | (3) | % | April 1, 2030 - April 1, 2033 | |||||||||||||||||||||||
| Three months ended December 31, 2022 | $ | (4) | % | June 15, 2026 - December 15, 2029 | ||||||||||||||||||||||
| Three months ended September 30, 2022 | $ | (5)(6) | % | August 10, 2047 | ||||||||||||||||||||||
| $ | (6) | % | August 10, 2047 | |||||||||||||||||||||||
(1)Includes two newly encumbered properties.
(2)Includes five existing encumbered properties.
(3)Includes 22 existing encumbered properties.
(4)Includes 18 existing encumbered properties.
(5)Represents a construction loan (undrawn as of December 31, 2023).
(6)Represents loans jointly secured by one property.
The mortgage term loans, which total $3.5 billion as of December 31, 2023, are secured by 156 properties comprised of 62,805 sites representing approximately $2.7 billion of net book value.
Secured Borrowings on Collateralized Receivables
Refer to Note 5, "Collateralized Receivables and Transfers of Financial Assets," for information on Secured Borrowings on Collateralized Receivables.
F - 38
SUN COMMUNITIES, INC.
NOTES TO CONSOLIDATED FINANCIAL STATEMENTS
Unsecured Debt
Senior Unsecured Notes
The following table sets forth certain information regarding our outstanding senior unsecured notes (in millions, except for statistical information). All senior unsecured notes include interest payments on a semi-annual basis in arrears, and are recorded within the Unsecured debt line item on the Consolidated Balance Sheets.
| Carrying Amount | ||||||||||||||||||||
| Principal Amount | December 31, 2023 | December 31, 2022 | ||||||||||||||||||
| $ | $ | $ | ||||||||||||||||||
| Total | $ | $ | $ | |||||||||||||||||
(1) In January 2023, the Operating Partnership issued $400.0 million of senior unsecured notes with an interest rate of 5.7 % and a 10-year term, due January 15, 2033 (the "2033 Notes"). Interest on the notes is payable semi-annually in arrears on January 15 and July 15 of each year, beginning on July 15, 2023. The net proceeds from the offering were $395.3 million, after deducting underwriters' discounts and estimated offering expenses. We used the net proceeds from the offering to repay borrowings outstanding under our Senior Credit Facility.
Line of Credit
In April 2022, the Operating Partnership (as borrower), SUI (as guarantor), and certain lenders entered into Amendment No. 1 to the Fourth Amended and Restated Credit Agreement and Other Loan Documents (the "Credit Facility Amendment"), which amended our senior credit facility (the "Senior Credit Facility").
The Credit Facility Amendment increased the aggregate amount of our Senior Credit Facility to $4.2 billion with the ability to upsize the total borrowings by an additional $800.0 million, subject to certain conditions. The increased aggregate amount under the Senior Credit Facility consists of the following: (a) a revolving loan in an amount up to $3.05 billion and (b) a term loan facility of $1.15 billion, with the ability to draw funds from the combined facilities in U.S. dollars, Pound sterling, Euros, Canadian dollars and Australian dollars, subject to certain limitations. The Credit Facility Amendment extended the maturity date of the revolving loan facility to April 7, 2026. At our option that maturity date may be extended two additional six-month periods. In addition, the Credit Facility Amendment established the maturity date of the term loan facility under the Credit Facility Amendment as April 7, 2025, which may not be further extended.
The Senior Credit Facility bears interest at a floating rate based on the Adjusted Term SOFR, the Adjusted Eurocurrency Rate, the Australian BBSY, the Daily SONIA Rate or the Canadian Dollar Offered Rate, as applicable, plus a margin, in all cases, which can range from 0.725 % to 1.6 %, subject to certain adjustments. As of December 31, 2023, the margins based on our credit ratings were 0.85 % on the revolving loan facility and 0.95 % on the term loan facility.
At the lenders' option, the Senior Credit Facility will become immediately due and payable upon an event of default under the Credit Facility Agreement. We had $944.1 million and $1.1 billion of borrowings outstanding under the revolving loan as of December 31, 2023 and 2022, respectively. We also had $1.1
The Senior Credit Facility provides us with the ability to issue letters of credit. Our issuance of letters of credit does not increase our borrowings outstanding under the Senior Credit Facility, but does reduce the borrowing amount available. We had $26.2 million and $2.6 million of outstanding letters of credit at December 31, 2023 and 2022, respectively.
F - 39
SUN COMMUNITIES, INC.
NOTES TO CONSOLIDATED FINANCIAL STATEMENTS
Unsecured Term Loan
In October 2019, we assumed a $58.0 million secured term loan facility related to an acquisition. The term loan initially had a four-year term ending October 29, 2023, and bore interest at a floating rate based on the Eurodollar rate or Prime rate plus a margin ranging from 1.2 % to 2.05 %. Effective July 1, 2021, we amended the agreement to release the associated collateral, extend the term loan facility maturity date to October 29, 2025 and adjust the interest rate margin to a range from 0.8 % to 1.6 %. In August 2022, we amended the secured term loan facility to transition from the Eurodollar rate to SOFR. As of December 31, 2023, the margin based on our credit rating was 0.95 %. The outstanding balance was $7.8 million and $19.8 million at December 31, 2023 and 2022, respectively. These balances are recorded in Unsecured debt on the Consolidated Balance Sheets.
Preferred Equity - Sun NG Resorts - Mandatorily Redeemable
In connection with the investment in Sun NG Resorts in June 2018, unrelated third parties purchased $35.3 million of mandatorily redeemable Series A Preferred Equity ("Preferred Equity - Sun NG Resorts") that carried a preferred rate of return of 6.0 % per annum and had a seven-year term ending June 1, 2025. In December 2023, we settled the Preferred Equity - Sun NG Resorts balance as part of the transaction with our joint venture partners in Sun NG. Accordingly, the outstanding balance on the Preferred Equity - Sun NG Resorts was zero and $35.2 million at December 31, 2023 and 2022, respectively. These balances were recorded in Unsecured debt on the Consolidated Balance Sheets. Refer to Note 8, "Consolidated Variable Interest Entities" for additional information related to the broader transaction with our joint venture partner in Sun NG.
Preferred OP Units - Mandatorily Redeemable
As of December 31, 2023, all Aspen preferred OP units were converted into common OP units. At December 31, 2022, the Preferred OP units included $34.0 million of Aspen preferred OP units recorded in Unsecured debt on the Consolidated Balance Sheets.
In January 2020, we amended the Operating Partnership's partnership agreement to extend the automatic redemption date and reduce the annual distribution rate for 270,000 of the Aspen preferred OP units (the "Extended Units"). The Extended Units redemption date was extended to January 1, 2034, and their distribution rate was lowered to 3.8 %. During the three months ended March 31, 2023, all of the Extended Units, representing $7.3 million of unsecured debt, converted into common equity.
For Aspen preferred OP units with no extended redemption date, subject to certain limitations, at any time prior to January 1, 2024, the holders of Aspen preferred OP units each had the option to convert such units into: (a) if the average closing price of our common stock for the preceding ten trading days is $68.00 per share or less, 0.397 common OP units; or (b) if the 10-day average closing price is greater than $68.00 per share, a number of common OP units determined by dividing (i) the sum of (A) $27.00 plus (B) 25.0 % of the amount by which the 10-day average closing price exceeds $68.00 per share, by (ii) the 10-day average closing price. The preferred distribution rate for the Aspen preferred OP units was 6.5 %. On January 2, 2024, we would have been required to redeem for cash any Aspen preferred OP units that had not been converted to common OP units. During the year ended December 31, 2023, unit holders converted all 322,934 remaining Aspen preferred OP units, representing $8.7 million of unsecured debt, into common OP units. Refer to Note 10, "Equity and Temporary Equity," for additional details related to Aspen preferred OP unit conversions.
Covenants
The mortgage term loans, senior unsecured notes and Senior Credit Facility are subject to various financial and other covenants. The most restrictive covenants are pursuant to (a) the terms of the Senior Credit Facility, which contains a maximum leverage ratio, minimum fixed charge coverage ratio and maximum secured leverage ratio, and (b) the terms of the senior unsecured notes, which contain a total debt to total assets ratio, secured debt to total assets ratio, consolidated income available for debt service to debt service ratio and unencumbered total asset value to unsecured debt ratio. At December 31, 2023, we were in compliance with all financial covenants.
In addition, certain of our subsidiary borrowers own properties that secure loans. These subsidiaries are consolidated within our accompanying Consolidated Financial Statements, however, each of these subsidiaries' assets and credit are not available to satisfy our debts and other obligations, and any of our other subsidiaries or any other person or entity.
F - 40
SUN COMMUNITIES, INC.
NOTES TO CONSOLIDATED FINANCIAL STATEMENTS
Interest Capitalized
We capitalize interest during the construction and development of our communities. Capitalized interest costs associated with construction and development activities during the years ended December 31, 2023, 2022 and 2021 were as follows (in millions):
| Year Ended | ||||||||||||||||||||
| December 31, 2023 | December 31, 2022 | December 31, 2021 | ||||||||||||||||||
Interest capitalized | $ | $ | $ | |||||||||||||||||
Long-term Debt Maturities
As of December 31, 2023, the total of our secured debt (excluding premiums and deferred financing costs) and unsecured debt (excluding discounts and deferred financing costs) by year were as follows (in millions):
| Maturities and Amortization By Year | |||||||||||||||||||||||||||||||||||||||||
| Total Due | 2024 | 2025 | 2026 | 2027 | 2028 | Thereafter | |||||||||||||||||||||||||||||||||||
| Secured Debt | |||||||||||||||||||||||||||||||||||||||||
| Mortgage loans payable | |||||||||||||||||||||||||||||||||||||||||
| Maturities | $ | $ | $ | $ | $ | $ | $ | ||||||||||||||||||||||||||||||||||
| Principal amortization | |||||||||||||||||||||||||||||||||||||||||
Secured borrowings on collateralized receivables(1) | |||||||||||||||||||||||||||||||||||||||||
| Total Secured Debt | |||||||||||||||||||||||||||||||||||||||||
| Unsecured Debt | |||||||||||||||||||||||||||||||||||||||||
| Senior unsecured notes | |||||||||||||||||||||||||||||||||||||||||
| Line of credit and other debt | |||||||||||||||||||||||||||||||||||||||||
| Total Unsecured Debt | |||||||||||||||||||||||||||||||||||||||||
| Total Debt | $ | $ | $ | $ | $ | $ | $ | ||||||||||||||||||||||||||||||||||
(1)Balance at December 31, 2023 excludes fair value adjustments of $1.9 million.
F - 41
SUN COMMUNITIES, INC.
NOTES TO CONSOLIDATED FINANCIAL STATEMENTS
10. Equity and Temporary Equity
Temporary Equity
Redeemable Preferred OP Units
Temporary equity includes preferred securities that are redeemable for cash at the holder's option or upon the occurrence of an event that is not solely within our control based on a fixed or determinable price. These securities are not mandatorily redeemable for cash nor do they contain a fixed maturity date. The following table sets forth the various series of redeemable preferred OP units that were outstanding as of December 31, 2023 and 2022 and the related terms, and summarizes the balance included within Temporary Equity on our Consolidated Balance Sheets (in millions, except for statistical information):
| Description | OP Units Outstanding | Exchange Rate(1) | Annual Distribution Rate(2) | Cash Redemption(3) | Redemption Period | Carrying Amount | ||||||||||||||||||||||||||||||||||||||
| December 31, 2023 | December 31, 2023 | December 31, 2022 | ||||||||||||||||||||||||||||||||||||||||||
| Series D preferred OP units | % | Holder's Option | Any time | $ | $ | |||||||||||||||||||||||||||||||||||||||
| Series F preferred OP units | % | Holder's Option | Any time after earlier of May 14, 2025 or death of holder | |||||||||||||||||||||||||||||||||||||||||
| Series G preferred OP units | % | Holder's Option | Any time after earlier of September 30, 2025 or death of holder | |||||||||||||||||||||||||||||||||||||||||
| Series H preferred OP units | % | Holder's Option | Any time after earlier of October 30, 2025 or death of holder | |||||||||||||||||||||||||||||||||||||||||
| Series J preferred OP units | % | Holder's Option | During the | |||||||||||||||||||||||||||||||||||||||||
Series K preferred OP units(4) | % | Holder's Option | Within | |||||||||||||||||||||||||||||||||||||||||
| Total | $ | $ | ||||||||||||||||||||||||||||||||||||||||||
(1) Exchange rates are subject to adjustment upon stock splits, recapitalizations and similar events. The exchange rates of certain series of OP units are approximated to four decimal places.
(2) Distributions are payable on the issue price of each OP unit, which is $100.00 per unit for all these preferred OP units.
(3) The redemption price for each preferred OP unit redeemed will be equal to its issue price plus all accrued but unpaid distributions.
(4) Series K Preferred OP Units - Each Series K preferred OP unit is exchangeable for 0.5882 common OP units. Each such common OP unit will be exchangeable for one share of our common stock. We have the right to cause the holders of Series K preferred OP units to exchange such units into common OP units at the applicable exchange rate (a) within 60 days after March 23, 2028 or (b) if at any time the trading price of our common stock for each of the preceding 60 trading days is equal to or greater than 120 % of the Series K conversion price of $170 (as it may be adjusted under the Operating Partnership's partnership agreement). If in connection with an exchange pursuant to clause (a) above the recent average price of our common stock (as determined under the Operating Partnership's partnership agreement) is less than the Series K conversion price, we will be required to make an additional cash payment in respect of each exchanged Series K preferred OP unit equal to the product of (i) the Series K exchange rate and (ii) the difference between such average price and the Series K conversion price. As of December 31, 2023, 1,000,000 Series K preferred OP units were outstanding. Refer to Note 3, "Real Estate Acquisitions and Dispositions," for additional information.
F - 42
SUN COMMUNITIES, INC.
NOTES TO CONSOLIDATED FINANCIAL STATEMENTS
Redeemable Equity Interests
The following table summarizes the redeemable equity interests included in Temporary Equity on our Consolidated Balance Sheets (in millions):
| Carrying Amount | ||||||||||||||||||||
| Equity Interest | Description | December 31, 2023 | December 31, 2022 | |||||||||||||||||
FPG Sun Moreno Valley 66 LLC | In connection with the investment in land for future development in the city of Moreno Valley, California, at the property known as FPG Sun Moreno Valley 66 LLC | $ | $ | |||||||||||||||||
Solar Energy Project CA II LLC | A joint venture that operates and maintains solar energy equipment in select California communities | |||||||||||||||||||
Solar Energy Project LLC | A joint venture that operates and maintains solar energy equipment in select California communities | |||||||||||||||||||
Solar Energy Project III LLC | A joint venture that operates and maintains solar energy equipment in select Arizona and California communities | |||||||||||||||||||
FPG Sun Menifee 80 LLC | In connection with the investment in land for future development in the city of Menifee, in California, at the property known as FPG Sun Menifee 80 LLC | |||||||||||||||||||
NG Sun Whitewater LLC | In connection with the investment in land at the property known as Whitewater | |||||||||||||||||||
| NG Sun Beaver Brook LLC | In connection with the investment in Sun NG Beaver Brook LLC, a joint venture that operates | |||||||||||||||||||
NG Sun LLC(1) and other stand-alone joint ventures | In connection with the investment in Sun NG Resorts, a joint venture that operates a portfolio of RV communities in the U.S. | |||||||||||||||||||
| Total | $ | $ | ||||||||||||||||||
(1) Equity Interest - NG Sun LLC - In June 2018, in connection with the investment in Sun NG Resorts, unrelated third parties purchased $6.5 million of Series B preferred equity interests and $15.4 million of common equity interests in Sun NG Resorts (herein jointly referred to as "Equity Interest - NG Sun LLC"). In April and September 2020, in connection with certain acquisitions, $3.0 million of Series B preferred equity interests were converted to common equity interests. The Series B preferred equity interests carried a preferred return at a rate that, at any time, was equal to the interest rate on Sun NG Resorts' indebtedness at such time. In December 2023, as part of the transaction with our joint venture partner in Sun NG, we settled the majority of the preferred and common equity interests related to the joint ventures under Sun NG Resorts. The Equity Interest - NG Sun LLC balance was $0.7 million and $31.1 million as of December 31, 2023 and 2022, respectively. Refer to Note 8, "Consolidated Variable Interest Entities," for more information on the transaction with our joint venture partner in Sun NG.
Permanent Equity
Universal Shelf Registration Statement
In April 2021, we filed a new universal shelf registration statement on Form S-3 with the SEC. The shelf registration statement was deemed automatically effective and provides for the registration of unspecified amounts of equity and debt securities. At our 2023 Annual Meeting of Shareholders on May 16, 2023, our shareholders approved the Articles of Amendment to the Company's charter, which increased the authorized number of shares of capital stock to 380,000,000 shares, of which 360,000,000 shares are common stock and 20,000,000 shares are preferred stock, par value $0.01 per share. As of December 31, 2023, we had 124,436,432 no
Public Equity Offerings
In November 2021, we entered into two forward sale agreements relating to an underwritten registered public offering of 4,025,000 shares of our common stock at a public offering price of $185.00 per share and completed the offering on November 18, 2021 (the "November 2021 Forward Sale Agreements"). We did not initially receive any proceeds from the sale of shares of our common stock by the forward purchaser or its affiliates. In April 2022, we completed the physical settlement of the 4,025,000 shares of common stock and received aggregate net proceeds of $705.4 million. We used the net proceeds to repay borrowings outstanding under our Senior Credit Facility, and for working capital and general corporate purposes.
At the Market Offering Sales Agreement
In December 2021, we entered into an At the Market Offering Sales Agreement with certain sales agents and forward sellers pursuant to which we may sell, from time to time, up to an aggregate gross sales price of $1.25 billion of our common stock (the "Sales Agreement"), through the sales agents, acting as our sales agents or, if applicable, as forward sellers, or directly to the sales agents as principals for their own accounts. The sales agents and forward sellers are entitled to compensation in an agreed amount not to exceed 2.0 % of the gross price per share for any shares sold under the Sales Agreement. We simultaneously terminated our prior sales agreement upon entering into the Sales Agreement. Through December 31, 2023, we had entered into forward sales agreements under our Sales Agreement for an aggregate gross sales price of $160.6 million.
F - 43
SUN COMMUNITIES, INC.
NOTES TO CONSOLIDATED FINANCIAL STATEMENTS
During the three months ended September 30, 2022, we entered into forward sale agreements with respect to 15,000 shares of common stock under our Sales Agreement for $2.6 million. Additionally, we settled all of our outstanding forward sale agreements with respect to 1,526,212 shares of common stock which includes 620,109 ; 600,503 ; 290,600 ; and 15,000 shares of common stock from the three months ended December 31, 2021, March 31, June 30 and September 30, 2022 forward sale agreements, respectively. The net proceeds of $275.5 million from the settlement of these forward sale agreements were used to repay borrowings outstanding under our Senior Credit Facility.
During the three months ended June 30, 2022, we completed the physical settlement of 1,200,000 shares of common stock under our prior at the market offering program and received net proceeds of $229.5 million. Additionally, we entered into forward sales agreements with respect to 290,600 shares of common stock for $50.1 million, under our Sales Agreement. These forward sale agreements were settled during the three months ended September 30, 2022.
During the three months ended March 31, 2022, we entered into forward sales agreements with respect to 600,503 shares of common stock for $107.9 million, under our Sales Agreement. These forward sale agreements were settled during the three months ended September 30, 2022.
During the year ended December 31, 2021, we entered into forward sale agreements with respect to 1,820,109 shares of common stock under our prior at the market offering program for $356.5 million. We completed the physical settlement of 1,200,000 and 620,109 shares of common stock during the three months ended June 30, 2022 and September 30, 2022, respectively.
Issuances of Common Stock in Connection with the Acquisition of Certain Properties
In April 2022, we issued 186,044 shares of common stock with a value of $33.9 million in connection with the acquisition of Park Holidays.
Issuances of Common OP Units in Connection with the Acquisition of Certain Properties
Year Ended December 31, 2023 and 2022 | Common OP Units Issued | Value at Issuance (in millions) | Related Acquisition | |||||||||||||||||
| January 2023 | $ | Fox Run | ||||||||||||||||||
| May 2022 | (1) | $ | Rudgate | |||||||||||||||||
| May 2022 | $ | Kittery Point | ||||||||||||||||||
| February 2022 | $ | Jarrett Bay Boatworks | ||||||||||||||||||
(1)During the three months ended June 30, 2022, we acquired the noncontrolling equity interest held by third parties in Rudgate for a total purchase price of $3.1 million. As consideration, we issued 10,854 common OP units and paid the remainder of the purchase price in cash. The acquisition resulted in us owning a 100.0 % controlling interest in Rudgate. Refer to Note 8, "Consolidated Variable Interest Entities," for additional information.
Accumulated Other Comprehensive Income / (Loss)
AOCI attributable to SUI common shareholders is separately presented on our Consolidated Balance Sheets as a component of total SUI shareholders' equity. OCI attributable to noncontrolling interests is allocated to, and included within, Noncontrolling interests on our Consolidated Balance Sheets. Refer to the Statements of Comprehensive Income for complete details related to OCI activity in the reporting period.
AOCI attributable to SUI common shareholders consisted of the following, net of tax (in millions):
| December 31, 2023 | December 31, 2022 | |||||||||||||
| Net foreign currency translation losses | $ | ( | $ | ( | ||||||||||
| Accumulated net gains on derivatives | ||||||||||||||
| Accumulated other comprehensive income / (loss) | $ | $ | ( | |||||||||||
F - 44
SUN COMMUNITIES, INC.
NOTES TO CONSOLIDATED FINANCIAL STATEMENTS
Noncontrolling Interests - Common and Preferred OP Units
The following table summarizes the common and preferred OP units included within Noncontrolling interests on our Consolidated Balance Sheets (in millions, except for shares and statistical information):
| Description | OP Units Outstanding | Exchange Rate(1) | Annual Distribution Rate(2) | Cash Redemption | Redemption Period | Carrying Amount | ||||||||||||||||||||||||||||||||||||||
| December 31, 2023 | December 31, 2023 | December 31, 2022 | ||||||||||||||||||||||||||||||||||||||||||
| Common OP units | Same distribution rate for common stock | N/A | N/A | $ | $ | |||||||||||||||||||||||||||||||||||||||
| Series A-1 preferred OP units | % | N/A | N/A | |||||||||||||||||||||||||||||||||||||||||
| Series A-3 preferred OP units | % | N/A | N/A | |||||||||||||||||||||||||||||||||||||||||
| Series C preferred OP units | % | N/A | N/A | |||||||||||||||||||||||||||||||||||||||||
| Series E preferred OP units | % | N/A | N/A | |||||||||||||||||||||||||||||||||||||||||
Series L preferred OP units(3) | % | N/A | N/A | |||||||||||||||||||||||||||||||||||||||||
| Total | $ | $ | ||||||||||||||||||||||||||||||||||||||||||
(1) Exchange rates are subject to adjustment upon stock splits, recapitalizations and similar events. The exchange rates of certain series of OP units are approximated to four decimal places.
(2) Distributions are payable on the issue price of each OP unit which is $100.00 per unit for all these preferred OP units.
(3) Series L Preferred OP Units - Each Series L preferred OP unit is exchangeable for 0.6250 common OP units. Each such common OP unit will be exchangeable for one share of our common stock. We have the right to cause the holders of Series L preferred OP units to exchange such units into common OP units at the applicable exchange rate (a) any time after December 31, 2028 or (b) if at any time the trading price of our common stock for each of the preceding 60 trading days is equal to or greater than 120 % of the Series L conversion price of $160 (as it may be adjusted under the Operating Partnership's partnership agreement). If in connection with an exchange pursuant to clause (a) above the recent average price of our common stock (as determined under the Operating Partnership's partnership agreement) is less than the Series L conversion price, we will be required to make an additional cash payment in respect of each exchanged Series L preferred OP unit equal to the product of (i) the Series L exchange rate and (ii) the difference between such average price and the Series L conversion price. As of December 31, 2023, 20,000 Series L preferred OP units were outstanding. Refer to Note 8, "Consolidated Variable Interest Entities," for more information on the transaction with our joint venture partner in Sun NG.
Conversions
Conversions to Common Stock and Common OP Units - Subject to certain limitations, holders can convert certain series of OP units to shares of our common stock and to common OP units at any time. Below is the activity of conversions during the years ended December 31, 2023 and 2022:
| Year Ended | ||||||||||||||||||||||||||||||||||||||
| December 31, 2023 | December 31, 2022 | |||||||||||||||||||||||||||||||||||||
| Series | Conversion Rate | Units / Shares Converted | Common Stock(1) | Common OP Units(1) | Units / Shares Converted | Common Stock(1) | ||||||||||||||||||||||||||||||||
| Aspen preferred OP units | Various(2) | |||||||||||||||||||||||||||||||||||||
| Common OP units | — | |||||||||||||||||||||||||||||||||||||
| Series A-1 preferred OP units | — | |||||||||||||||||||||||||||||||||||||
| Series C preferred OP units | — | |||||||||||||||||||||||||||||||||||||
| Series E preferred OP units | — | |||||||||||||||||||||||||||||||||||||
| Series G preferred OP units | — | |||||||||||||||||||||||||||||||||||||
| Series H preferred OP units | — | |||||||||||||||||||||||||||||||||||||
| Series I preferred OP units | — | |||||||||||||||||||||||||||||||||||||
| Series J preferred OP units | — | |||||||||||||||||||||||||||||||||||||
(1)Calculation may yield minor differences due to rounding incorporated in the above numbers.
(2)Refer to Note 9, "Debt and Line of Credit," for additional detail on Aspen preferred OP unit conversions.
F - 45
SUN COMMUNITIES, INC.
NOTES TO CONSOLIDATED FINANCIAL STATEMENTS
Distributions
Distributions declared for the three months ended December 31, 2023 were as follows:
| Common Stock, Common OP units and Restricted Stock Distributions | Record Date | Payment Date | Distribution Per Share | Total Distribution (in Millions) | ||||||||||||||||||||||
| December 31, 2023 | 12/29/2023 | 1/16/2024 | $ | $ | ||||||||||||||||||||||
11. Share-Based Compensation
As of December 31, 2023, we had two share-based compensation plans: the Sun Communities, Inc. 2015 Equity Incentive Plan (as amended, the "2015 Equity Incentive Plan") and the First Amended and Restated 2004 Non-Employee Director Option Plan (as amended, the "2004 Non-Employee Director Option Plan"). We believe granting equity awards will provide certain executives, key employees and directors additional incentives to promote our financial success and promote employee and director retention by providing an opportunity to acquire or increase the direct proprietary interest of those individuals in our operations and future. Time based awards for directors generally vest over three years . Time based awards for key employees and executives generally vest over five years . Market condition awards for executives generally vest after three years .
Restricted Stock
The majority of our share-based compensation is awarded as service vesting restricted stock grants to executives and key employees. We have also awarded restricted stock to our non-employee directors. We measure the fair value associated with these awards using the closing price of our common stock as of the grant date to calculate compensation cost. Employee awards typically vest over several years and are subject to continued employment by the employee. Award recipients receive distribution payments on unvested shares of restricted stock.
First Amendment to the 2015 Equity Incentive Plan
At our 2022 Annual Meeting on May 17, 2022, our shareholders approved the First Amendment to the 2015 Equity Incentive Plan. This amendment increased the number of shares of common stock that may be issued under the 2015 Equity Incentive Plan to 4,750,000 . As of December 31, 2023, there were 2,813,901 shares available for future issuance.
UK Sub-Plan
In April 2022, the Board of Directors adopted the UK Sub-Plan under the 2015 Equity Incentive Plan, which is solely applicable to employee participants located in the UK, and establishes certain rules and limitations for participation in the 2015 Equity Incentive Plan by UK employees for the purpose of complying with applicable UK laws.
Non-Employee Director Plans
2021 Non-Employee Directors Deferred Compensation Plan - In November 2021, we adopted the 2021 Non-Employee Directors Deferred Compensation Plan ("2021 Deferred Compensation Plan"). The 2021 Deferred Compensation Plan entitles a non-employee director to annually submit an election to defer all or a portion of his or her eligible share-based and cash compensation.
2004 Non-Employee Director Option Plan - The director option plan was approved by our shareholders at the Annual Meeting of Shareholders held on July 19, 2012. The director option plan amended and restated in its entirety our 2004 Non-Employee Director Stock Option Plan. At the Annual Meeting of the Shareholders held on May 17, 2018, the shareholders approved the First Amendment to the Sun Communities, Inc. First Amended and Restated 2004 Non-Employee Director Option Plan to increase the number of authorized shares under the plan by 200,000 shares.
The types of awards that may be granted under the director option plan are options, restricted stock and OP units. Only non-employee directors are eligible to participate in the director option plan. The maximum number of options, restricted stock and OP units that may be issued under the director option plan is 375,000 shares. As of December 31, 2023, 141,965 shares remained available for future issuance.
F - 46
SUN COMMUNITIES, INC.
NOTES TO CONSOLIDATED FINANCIAL STATEMENTS
During the years ended December 31, 2023 and 2022, shares were granted as follows:
| Grant Period | Type | Plan | Shares Granted | Grant Date Fair Value Per Share | Vesting Type | |||||||||||||||||||||||||||
| 2023 | Key Employees | 2015 Equity Incentive Plan | $ | (1) | Time Based | |||||||||||||||||||||||||||
| 2023 | Executive Officers | 2015 Equity Incentive Plan | $ | (1) | Time Based | |||||||||||||||||||||||||||
| 2023 | Executive Officers | 2015 Equity Incentive Plan | $ | (2) | Market Condition(3) | |||||||||||||||||||||||||||
| 2023 | Directors | 2004 Non-Employee Director Option Plan | $ | (1) | Time Based | |||||||||||||||||||||||||||
| 2022 | Key Employees | 2015 Equity Incentive Plan | $ | (1) | Time Based | |||||||||||||||||||||||||||
| 2022 | Executive Officers | 2015 Equity Incentive Plan | $ | (1) | Time Based | |||||||||||||||||||||||||||
| 2022 | Executive Officers | 2015 Equity Incentive Plan | $ | (2) | Market Condition(3) | |||||||||||||||||||||||||||
| 2022 | Directors | 2004 Non-Employee Director Option Plan | $ | (1) | Time Based | |||||||||||||||||||||||||||
(1)Represents the weighted average fair value per share of the closing price of our common stock on the dates the shares were awarded.
(2)Represents the weighted average fair value per share of the Monte Carlo simulation fair value price of our market condition awards on the dates the shares were awarded.
(3)Share-based compensation for restricted stock awards with market conditions is measured based on an estimate of shares expected to vest using a Monte Carlo simulation to determine fair value.
The following table summarizes our restricted stock activity for the years ended December 31, 2023, 2022 and 2021 (in millions, except share and per share data):
| Number of Shares | Weighted Average Grant Date Fair Value | Fair Value of Shares Vested | |||||||||||||||
| Unvested restricted shares at January 1, 2021 | $ | ||||||||||||||||
| Granted | $ | ||||||||||||||||
| Vested | ( | $ | $ | ||||||||||||||
| Forfeited | ( | $ | |||||||||||||||
| Unvested restricted shares at December 31, 2021 | $ | ||||||||||||||||
| Granted | $ | ||||||||||||||||
| Vested | ( | $ | $ | ||||||||||||||
| Forfeited | ( | $ | |||||||||||||||
| Unvested restricted shares at December 31, 2022 | $ | ||||||||||||||||
| Granted | $ | ||||||||||||||||
| Vested | ( | $ | $ | ||||||||||||||
| Forfeited | ( | $ | |||||||||||||||
| Unvested restricted shares at December 31, 2023 | $ | ||||||||||||||||
We capitalize a portion of share-based compensation costs for employees who work directly on construction and development of our communities. We recognized the following share-based compensation costs (in millions):
| Year Ended | ||||||||||||||||||||
| December 31, 2023 | December 31, 2022 | December 31, 2021 | ||||||||||||||||||
Share-based compensation - expensed(1) | $ | $ | $ | |||||||||||||||||
Share-based compensation - capitalized(2) | $ | $ | $ | |||||||||||||||||
(1) Recorded within General and administrative expense on the Consolidated Income Statements.
(2) Capitalized to Land improvements and buildings on the Consolidated Balance Sheets.
The remaining unrecognized share-based compensation cost, net related to our unvested restricted shares, which includes estimated forfeitures, as of December 31, 2023 was approximately $86.4 million and is expected to be recognized over a weighted average period of 1.7 years. Forfeitures are estimated at the grant date and are included monthly within compensation cost. The following table summarizes our expected share-based compensation cost, net related to our unvested restricted shares, in millions:
| 2024 | 2025 | 2026 | Thereafter | ||||||||||||||||||||
| Expected share-based compensation costs, net | $ | $ | $ | $ | |||||||||||||||||||
F - 47
SUN COMMUNITIES, INC.
NOTES TO CONSOLIDATED FINANCIAL STATEMENTS
12. Segment Reporting
We group our segments into reportable segments that provide similar products and services. Each operating segment has discrete financial information evaluated regularly by our chief operating decision maker in managing the business, making operating decisions, allocating resources and evaluating operating performance. As described in Note 1, "Significant Accounting Policies," our three reportable segments are: (i) MH communities, (ii) RV communities and (iii) Marinas. Hybrid properties are classified to a segment based on the predominant site counts at the properties. We evaluate segment operating performance based on NOI.
F - 48
SUN COMMUNITIES, INC.
NOTES TO CONSOLIDATED FINANCIAL STATEMENTS
A presentation of our segment financial information is summarized as follows (amounts in millions):
| Year Ended | |||||||||||||||||||||||||||||||||||||||||||||||||||||||||||||||||||||||
| December 31, 2023 | December 31, 2022 | December 31, 2021 | |||||||||||||||||||||||||||||||||||||||||||||||||||||||||||||||||||||
| MH | RV | Marina | Consolidated | MH | RV | Marina | Consolidated | MH | RV | Marina | Consolidated | ||||||||||||||||||||||||||||||||||||||||||||||||||||||||||||
| Operating revenues | $ | $ | $ | $ | $ | $ | $ | $ | $ | $ | $ | $ | |||||||||||||||||||||||||||||||||||||||||||||||||||||||||||
| Operating expenses / Cost of sales | |||||||||||||||||||||||||||||||||||||||||||||||||||||||||||||||||||||||
| NOI | $ | $ | $ | $ | $ | $ | $ | $ | $ | $ | $ | $ | |||||||||||||||||||||||||||||||||||||||||||||||||||||||||||
| Adjustments to arrive at net income | |||||||||||||||||||||||||||||||||||||||||||||||||||||||||||||||||||||||
| Interest income | |||||||||||||||||||||||||||||||||||||||||||||||||||||||||||||||||||||||
| Brokerage commissions and other revenues, net | |||||||||||||||||||||||||||||||||||||||||||||||||||||||||||||||||||||||
| General and administrative expense | ( | ( | ( | ||||||||||||||||||||||||||||||||||||||||||||||||||||||||||||||||||||
| Catastrophic event-related charges, net | ( | ( | ( | ||||||||||||||||||||||||||||||||||||||||||||||||||||||||||||||||||||
| Business combination expense, net | ( | ( | ( | ||||||||||||||||||||||||||||||||||||||||||||||||||||||||||||||||||||
| Depreciation and amortization | ( | ( | ( | ||||||||||||||||||||||||||||||||||||||||||||||||||||||||||||||||||||
| Asset impairments | ( | ( | |||||||||||||||||||||||||||||||||||||||||||||||||||||||||||||||||||||
Goodwill impairment | ( | ||||||||||||||||||||||||||||||||||||||||||||||||||||||||||||||||||||||
Loss on extinguishment of debt (see Note 9) | ( | ( | |||||||||||||||||||||||||||||||||||||||||||||||||||||||||||||||||||||
| Interest expense | ( | ( | ( | ||||||||||||||||||||||||||||||||||||||||||||||||||||||||||||||||||||
| Interest on mandatorily redeemable preferred OP units / equity | ( | ( | ( | ||||||||||||||||||||||||||||||||||||||||||||||||||||||||||||||||||||
| Gain / (loss) on remeasurement of marketable securities | ( | ( | |||||||||||||||||||||||||||||||||||||||||||||||||||||||||||||||||||||
| Gain / (loss) on foreign currency exchanges | ( | ( | |||||||||||||||||||||||||||||||||||||||||||||||||||||||||||||||||||||
| Gain on dispositions of properties | |||||||||||||||||||||||||||||||||||||||||||||||||||||||||||||||||||||||
| Other expense, net | ( | ( | ( | ||||||||||||||||||||||||||||||||||||||||||||||||||||||||||||||||||||
| Gain / (loss) on remeasurement of notes receivable | ( | ( | |||||||||||||||||||||||||||||||||||||||||||||||||||||||||||||||||||||
Income from nonconsolidated affiliates (see Note 7) | |||||||||||||||||||||||||||||||||||||||||||||||||||||||||||||||||||||||
| Loss on remeasurement of investment in nonconsolidated affiliates | ( | ( | ( | ||||||||||||||||||||||||||||||||||||||||||||||||||||||||||||||||||||
Current tax expense (see Note 13) | ( | ( | ( | ||||||||||||||||||||||||||||||||||||||||||||||||||||||||||||||||||||
Deferred tax benefit / (expense) (see Note 13) | ( | ||||||||||||||||||||||||||||||||||||||||||||||||||||||||||||||||||||||
| Net Income / (Loss) | ( | ||||||||||||||||||||||||||||||||||||||||||||||||||||||||||||||||||||||
| Less: Preferred return to preferred OP units / equity interests | |||||||||||||||||||||||||||||||||||||||||||||||||||||||||||||||||||||||
| Less: Income attributable to noncontrolling interests | ( | ||||||||||||||||||||||||||||||||||||||||||||||||||||||||||||||||||||||
| Net Income / (Loss) Attributable to SUI Common Shareholders | $ | ( | $ | $ | |||||||||||||||||||||||||||||||||||||||||||||||||||||||||||||||||||
F - 49
SUN COMMUNITIES, INC.
NOTES TO CONSOLIDATED FINANCIAL STATEMENTS
| December 31, 2023 | December 31, 2022 | ||||||||||||||||||||||||||||||||||||||||||||||
| MH | RV | Marina | Consolidated | MH | RV | Marina | Consolidated | ||||||||||||||||||||||||||||||||||||||||
| Identifiable Assets | |||||||||||||||||||||||||||||||||||||||||||||||
| Investment property, net | $ | $ | $ | $ | $ | $ | $ | $ | |||||||||||||||||||||||||||||||||||||||
| Cash, cash equivalents and restricted cash | |||||||||||||||||||||||||||||||||||||||||||||||
| Marketable securities | |||||||||||||||||||||||||||||||||||||||||||||||
| Inventory of manufactured homes | |||||||||||||||||||||||||||||||||||||||||||||||
| Notes and other receivables, net | |||||||||||||||||||||||||||||||||||||||||||||||
| Collateralized receivables, net | |||||||||||||||||||||||||||||||||||||||||||||||
| Goodwill | |||||||||||||||||||||||||||||||||||||||||||||||
| Other intangible assets, net | |||||||||||||||||||||||||||||||||||||||||||||||
| Other assets, net | |||||||||||||||||||||||||||||||||||||||||||||||
| Total Assets | $ | $ | $ | $ | $ | $ | $ | $ | |||||||||||||||||||||||||||||||||||||||
13. Income Taxes
We have elected to be taxed as a REIT pursuant to Section 856(c) of the Internal Revenue Code of 1986, as amended ("Code"). In order for us to qualify as a REIT, at least 95 % of our gross income in any year must be derived from qualifying sources. In addition, a REIT must distribute annually at least 90 % of its REIT taxable income (calculated without any deduction for dividends paid and excluding capital gains) to its shareholders and meet other tests.
Qualification as a REIT involves the satisfaction of numerous requirements (on an annual and quarterly basis) established under highly technical and complex Code provisions for which there are limited judicial or administrative interpretations and involves the determination of various factual matters and circumstances not entirely within our control. In addition, frequent changes occur in the area of REIT taxation, which requires us to continually monitor our tax status. We analyzed the various REIT tests and confirmed that we continued to qualify as a REIT for the year ended December 31, 2023.
As a REIT, we generally will not be subject to U.S. federal income taxes at the corporate level on the ordinary taxable income we distribute to our shareholders as dividends. If we fail to qualify as a REIT in any taxable year, our taxable income could be subject to U.S. federal income tax at regular corporate rates. Even if we qualify as a REIT, we may be subject to certain state and local income taxes, as well as U.S. federal income and excise taxes on our undistributed income. In addition, taxable income from non-REIT activities managed through taxable REIT subsidiaries is subject to federal, state and local income taxes. We are also subject to local income taxes in Canada, Puerto Rico and the UK due to certain properties located in those jurisdictions. We do not provide for withholding taxes on our undistributed earnings from our Canadian subsidiaries as they are reinvested and will continue to be reinvested indefinitely outside of the U.S. As currently structured, we are not subject to UK withholding taxes on distributions from our UK properties. However, we are subject to Australian withholding taxes on distributions from our investments in Ingenia Communities Group ("Ingenia") which was sold during the three months ended December 31, 2023. Refer to Note 16, "Fair Value of Financial Instruments," for additional details related to the sale of our shares in Ingenia.
For income tax purposes, distributions paid to common shareholders consist of ordinary income, capital gains, and return of capital. For the years ended December 31, 2023, 2022 and 2021, distributions paid per share were taxable as follows (unaudited / rounded):
| Year Ended | |||||||||||||||||||||||||||||||||||
| December 31, 2023 | December 31, 2022 | December 31, 2021 | |||||||||||||||||||||||||||||||||
| Amount | Percentage | Amount | Percentage | Amount | Percentage | ||||||||||||||||||||||||||||||
Ordinary income(1) | $ | % | $ | % | $ | % | |||||||||||||||||||||||||||||
| Capital gain | % | % | % | ||||||||||||||||||||||||||||||||
| Return of capital | % | % | % | ||||||||||||||||||||||||||||||||
Total distributions declared | $ | % | $ | % | $ | % | |||||||||||||||||||||||||||||
(1)98.924258 % of the ordinary taxable dividend qualifies as a Section 199A dividend for 2023 and 1.075742 % of the ordinary taxable dividend qualifies as a Qualified Dividend for 2023.
F - 50
SUN COMMUNITIES, INC.
NOTES TO CONSOLIDATED FINANCIAL STATEMENTS
The components of income / (loss) attributable to taxable subsidiaries before provision for income taxes are as follows (in millions):
| Year Ended | |||||||||||||||||
| December 31, 2023 | December 31, 2022 | December 31, 2021 | |||||||||||||||
| Domestic | $ | ( | $ | ( | $ | ( | |||||||||||
| Foreign | ( | ||||||||||||||||
| Income / (loss) before provision for income taxes | $ | ( | $ | $ | ( | ||||||||||||
The components of our provision / (benefit) for income taxes attributable to continuing operations for the years ended December 31, 2023, 2022 and 2021 are as follows (amounts in millions):
| Year Ended | |||||||||||||||||
| December 31, 2023 | December 31, 2022 | December 31, 2021 | |||||||||||||||
| Federal | |||||||||||||||||
| Current | $ | $ | $ | ||||||||||||||
| Deferred | |||||||||||||||||
| State and Local | |||||||||||||||||
| Current | |||||||||||||||||
| Deferred | ( | ||||||||||||||||
| Foreign | |||||||||||||||||
| Current | |||||||||||||||||
| Deferred | ( | ( | |||||||||||||||
| Total provision / (benefit) | $ | ( | $ | $ | |||||||||||||
A reconciliation of the provision / (benefit) for income taxes with the amount computed by applying the statutory federal income tax rate to income before provision for income taxes for the years ended December 31, 2023, 2022 and 2021 is as follows (amounts in millions):
| Year Ended | |||||||||||||||||||||||||||||||||||
| December 31, 2023 | December 31, 2022 | December 31, 2021 | |||||||||||||||||||||||||||||||||
| Pre-tax income / (loss) attributable to taxable subsidiaries | $ | ( | $ | $ | ( | ||||||||||||||||||||||||||||||
| Federal provision / (benefit) at statutory tax rate | ( | % | % | ( | % | ||||||||||||||||||||||||||||||
| State and local taxes, net of federal benefit | ( | % | % | ( | % | ||||||||||||||||||||||||||||||
| Rate differential | ( | % | ( | ( | % | ( | % | ||||||||||||||||||||||||||||
| Change in valuation allowance | ( | % | % | ( | % | ||||||||||||||||||||||||||||||
| Non-U.S. income taxed at other than the U.S. federal statutory tax rate | ( | % | ( | ( | % | % | |||||||||||||||||||||||||||||
| Others | ( | % | ( | ( | % | ( | % | ||||||||||||||||||||||||||||
| Tax provision / (benefit) - taxable subsidiaries | ( | % | % | ( | % | ||||||||||||||||||||||||||||||
| Other state taxes - flow through subsidiaries | |||||||||||||||||||||||||||||||||||
| Total provision / (benefit) | $ | ( | $ | $ | |||||||||||||||||||||||||||||||
Deferred tax assets and liabilities reflect the impact of temporary differences between the amounts of assets and liabilities for financial reporting purposes and the basis of such assets and liabilities as measured by tax laws. Deferred tax assets are reduced, if necessary, by a valuation allowance to the amount where realization is more likely than not assured after considering all available evidence. Our temporary differences primarily relate to net operating loss carryforwards, depreciation, interest and basis differences between tax and GAAP. Our deferred tax assets that have a full valuation allowance relate to our taxable REIT subsidiaries.
F - 51
SUN COMMUNITIES, INC.
NOTES TO CONSOLIDATED FINANCIAL STATEMENTS
The deferred tax assets and liabilities included in the Consolidated Balance Sheets are comprised of the following tax effects of temporary differences and based on the most recent tax rate legislation (amounts in millions):
| As of | |||||||||||||||||
| December 31, 2023 | December 31, 2022 | December 31, 2021 | |||||||||||||||
| Deferred Tax Assets | |||||||||||||||||
| NOL carryforwards | $ | $ | $ | ||||||||||||||
| Depreciation and basis differences | |||||||||||||||||
| Restricted interest carryforwards | |||||||||||||||||
| Other | |||||||||||||||||
| Gross deferred tax assets | |||||||||||||||||
| Valuation allowance | ( | ( | ( | ||||||||||||||
Net deferred tax assets(1) | |||||||||||||||||
| Deferred Tax Liabilities | |||||||||||||||||
| Basis differences - US assets | ( | ||||||||||||||||
Basis differences - foreign investment(2) | ( | ( | ( | ||||||||||||||
Gross deferred tax liabilities(3) | ( | ( | ( | ||||||||||||||
Net Deferred Tax Liability | $ | ( | $ | ( | $ | ( | |||||||||||
(1)Net deferred tax assets are included within Other assets, net in our Consolidated Balance Sheets.
(2)Balance as of December 31, 2023 relates to basis differences in our foreign investments in properties in the UK and Canada.
(3)Gross deferred tax liabilities are included within Other liabilities in our Consolidated Balance Sheets.
Our U.S. taxable REIT subsidiaries operating loss carryforwards are $138.0 million, or $28.7 million after tax, including SHS loss carryforwards of $134.1 million, or $28.2 million after tax, as of December 31, 2023. The loss carryforwards will begin to expire in 2024 through 2035 if not offset by future taxable income. In addition, our Canadian subsidiaries have operating loss carryforwards of $0.1 million, or $0.0 million after tax, as of December 31, 2023. The loss carryforwards will begin to expire in 2040 through 2042 if not offset by future taxable income.
We had no no significant increases or decreases in unrecognized tax benefits due to changes in tax positions within one year of December 31, 2023.
We classify certain state taxes as income taxes for financial reporting purposes. We recorded provisions for state income taxes of $2.9 million, $2.3 million and $1.1 million for the years ended December 31, 2023, 2022 and 2021, respectively.
Our policy is to report income tax penalties and income tax related interest expense as a component of income tax expense. No
14. Earnings / (Loss) Per Share
Earnings / (loss) per share ("EPS") is computed by dividing net income or loss by the weighted average number of common shares outstanding during the period on a basic and diluted basis. We calculate diluted EPS using the more dilutive of the treasury stock method and the two-class method for stock option and restricted common shares, the treasury stock method for forward equity sales and the if converted method for convertible units.
From time to time, we enter into forward equity sales agreements, which are discussed in Note 10, "Equity and Temporary Equity." We considered the potential dilution resulting from the forward equity sales agreements on the EPS calculations. At inception, the agreements do not have an effect on the computation of basic EPS as no shares are delivered unless there is a physical settlement. Common shares issued upon the physical settlement of the forward equity sales agreements, weighted for the period these common shares are outstanding, are included in the denominator of basic EPS. To determine the dilution resulting from the forward equity sales agreements during the period of time prior to settlement, we calculate the number of weighted-average shares outstanding - diluted in accordance with the treasury stock method.
F - 52
SUN COMMUNITIES, INC.
NOTES TO CONSOLIDATED FINANCIAL STATEMENTS
Our potentially dilutive securities include our potential common shares related to our forward equity offerings, our unvested restricted common shares, and our Operating Partnership outstanding common OP units, Series A-1 preferred OP units, Series A-3 preferred OP units, Series C preferred OP units, Series D preferred OP units, Series E preferred OP units, Series F preferred OP units, Series G preferred OP units, Series H preferred OP units, Series J preferred OP units, Series K preferred OP units and Series L preferred OP units, which, if converted or exercised, may impact dilution.
Diluted EPS considers the impact of potentially dilutive securities except when the potential common shares have an anti-dilutive effect. Our unvested restricted stock common shares contain rights to receive non-forfeitable distributions and participate equally with common stock with respect to distributions issued or declared, and thus, are participating securities, requiring the two-class method of computing EPS. In calculating the two-class method, undistributed earnings are allocated to both common shares and participating securities based on the weighted average number of shares outstanding during the period. The two-class method determines EPS by (1) dividing the sum of distributed earnings allocated to common shareholders and undistributed earnings allocated to common shareholders by the weighted average number of shares of common stock outstanding for the period; and (2) dividing the sum of distributed earnings allocated to participating securities and undistributed earnings allocated to participating securities by the weighted average number of shares of participating securities for the period. The remaining potential dilutive common shares do not contain rights to distributions and are included in the computation of diluted EPS.
Computations of basic and diluted EPS were as follows (in millions, except per share data):
| Year Ended | ||||||||||||||||||||
| December 31, 2023 | December 31, 2022 | December 31, 2021 | ||||||||||||||||||
| Numerator | ||||||||||||||||||||
| Net income / (loss) attributable to SUI common shareholders | $ | ( | $ | $ | ||||||||||||||||
| Less: allocation to restricted stock awards | ( | |||||||||||||||||||
| Basic earnings - net income / (loss) attributable to common shareholders after allocation to restricted stock awards | $ | ( | $ | $ | ||||||||||||||||
| Add: allocation to common and preferred OP units dilutive effect | ||||||||||||||||||||
| Add: allocation to restricted stock awards | ( | |||||||||||||||||||
Diluted earnings - net income / (loss) attributable to common shareholders after allocation to common and preferred OP units(1)(2) | $ | ( | $ | $ | ||||||||||||||||
| Denominator | ||||||||||||||||||||
| Weighted average common shares outstanding | $ | $ | $ | |||||||||||||||||
| Add: common shares dilutive effect from Forward Equity Offering | ||||||||||||||||||||
| Add: dilutive restricted stock | ||||||||||||||||||||
| Add: common and preferred OP units dilutive effect | ||||||||||||||||||||
Diluted weighted average common shares and securities(1)(2) | $ | $ | $ | |||||||||||||||||
| EPS Available to Common Shareholders After Allocation | ||||||||||||||||||||
| Basic earnings / (loss) per share | $ | ( | $ | $ | ||||||||||||||||
Diluted earnings / (loss) per share(1)(2) | $ | ( | $ | $ | ||||||||||||||||
(1) For the year ended December 31, 2023, diluted earnings per share was calculated using the treasury stock method for restricted stock awards as the application of this method resulted in a more diluted earnings per share during those periods.
(2) For the years ended December 31, 2022 and 2021, diluted earnings per share was calculated using the two-class method for restricted stock awards as the application of this method resulted in a more diluted earnings per share during those periods.
F - 53
SUN COMMUNITIES, INC.
NOTES TO CONSOLIDATED FINANCIAL STATEMENTS
We have excluded certain convertible securities from the computation of diluted EPS because the inclusion of those securities would have been anti-dilutive for the periods presented. The following table presents the outstanding securities that were excluded from the computation of diluted EPS as of December 31, 2023, 2022 and 2021 (amounts in thousands):
| Year Ended | |||||||||||||||||
| December 31, 2023 | December 31, 2022 | December 31, 2021 | |||||||||||||||
| Common OP units | |||||||||||||||||
| A-1 preferred OP units | |||||||||||||||||
| A-3 preferred OP units | |||||||||||||||||
Aspen preferred OP units(1) | N/A | ||||||||||||||||
| Series C preferred OP units | |||||||||||||||||
| Series D preferred OP units | |||||||||||||||||
| Series E preferred OP units | |||||||||||||||||
| Series F preferred OP units | |||||||||||||||||
| Series G preferred OP units | |||||||||||||||||
| Series H preferred OP units | |||||||||||||||||
Series I preferred OP units(2) | N/A | N/A | |||||||||||||||
| Series J preferred OP units | |||||||||||||||||
| Series K preferred OP units | N/A | N/A | |||||||||||||||
Series L preferred OP units | N/A | N/A | |||||||||||||||
| Total Securities | |||||||||||||||||
N/A = Not applicable.
(1) All of our outstanding Aspen preferred OP units converted during the year ended December 31, 2023.
(2) All of our outstanding Series I preferred OP units converted during the year ended December 31, 2022.
15. Derivative Financial Instruments
We hold treasury rate lock contracts, interest rate swaps, and forward swaps for interest rate risk management purposes. We do not enter into derivative instruments for speculative purposes. As of December 31, 2023 and 2022, respectively, we held 13 and 5 derivative contracts, which have each been designated as cash flow hedges under ASC Topic 815, "Derivatives and Hedging." The risks being hedged are the interest rate risk related to outstanding floating rate debt and forecasted debt issuance transactions, and the benchmark interest rates used are the SOFR and the SONIA Rate.
Derivative Contract Activity
During the year ended December 31, 2023 and 2022, we entered into the following derivative contracts (with notional amounts in millions):
| Period (Three months ended) | Number of Contracts | Instrument Type | Currency | Notional Amount | Index Type | Hedged Item | ||||||||||||||||||||||||||||||||
| December 31, 2023 | Forward Swap | USD | $ | SOFR | Future Debt Offering | |||||||||||||||||||||||||||||||||
| Interest Rate Swap | USD | SOFR | Term Loan Senior Credit Facility | |||||||||||||||||||||||||||||||||||
| September 30, 2023 | Interest Rate Swap | USD | SOFR | Term Loan Senior Credit Facility | ||||||||||||||||||||||||||||||||||
| March 31, 2023 | Interest Rate Swap | GBP(1) | SONIA | Term Loan Senior Credit Facility | ||||||||||||||||||||||||||||||||||
| Interest Rate Swap | USD | SOFR | Future Debt Offering | |||||||||||||||||||||||||||||||||||
| Total | $ | |||||||||||||||||||||||||||||||||||||
| December 31, 2022 | Forward Swap | USD | $ | SOFR | Future Debt Offering | |||||||||||||||||||||||||||||||||
| September 30, 2022 | Interest Rate Swap | GBP(3) | SONIA | Future Debt Offering | ||||||||||||||||||||||||||||||||||
Treasury Rate Locks(2) | SOFR | Future Debt Offering | ||||||||||||||||||||||||||||||||||||
| Total | $ | |||||||||||||||||||||||||||||||||||||
(1) The notional amount of the swap contract in local currency is £100.0 million. The USD equivalent amount is converted as of December 31, 2023.
(2) This includes two $100.0 million treasury rate locks.
(3) The notional amount of the swap contract in local currency is £400.0 million. The USD equivalent amount is converted as of December 31, 2022.
F - 54
SUN COMMUNITIES, INC.
NOTES TO CONSOLIDATED FINANCIAL STATEMENTS
During the year ended December 31, 2023 and 2022, we terminated the following derivative contracts (amounts in millions):
| Period (Three months ended) | Type | Currency | Notional Amount | Cash Settlement Received | |||||||||||||||||||||||||
| December 31, 2023 | Interest Rate Swap | USD | $ | $ | |||||||||||||||||||||||||
| March 31, 2023 | Treasury Rate Locks & Forward Swap(1) | USD | (1) | ||||||||||||||||||||||||||
| Total | $ | $ | |||||||||||||||||||||||||||
| June 30, 2022 | Treasury Rate Locks(2) | USD | (2) | ||||||||||||||||||||||||||
| Total | $ | $ | |||||||||||||||||||||||||||
(1) These includes two $100.0 million treasury rate locks and one $50.0 million forward swap which were terminated in connection with the 2033 Notes issuance.
(2) These includes four $150.0 million treasury rate locks which were terminated in connection with the issuance of $600.0 million of senior unsecured notes issued April 2022.
As of December 31, 2023, the net accumulated gains from the aforementioned settlements are included in Accumulated other comprehensive income / (loss) on our Consolidated Balance Sheets, and will be amortized as a reduction to interest expense over the term of the hedged transactions.
The following table presents the gross fair value amounts of our derivative financial instruments and the associated notional amounts (in millions):
| December 31, 2023 | December 31, 2022 | |||||||||||||||||||||||||||||||||||||
| Derivatives designated as cash flow hedges | Notional | Fair Value of Assets(1) | Fair Value of Liabilities(2) | Notional | Fair Value of Assets(1) | Fair Value of Liabilities | ||||||||||||||||||||||||||||||||
| Interest rate derivatives | $ | $ | $ | $ | $ | $ | ||||||||||||||||||||||||||||||||
(1)Included within Other assets, net on the Consolidated Balance Sheets.
(2)Included within Other liabilities on the Consolidated Balance Sheets.
The following table presents the gain / (loss) on derivatives in cash flow hedging relationships recognized in Accumulated other comprehensive income / (loss) (in millions):
| Year Ended | ||||||||||||||||||||
| Derivatives designated as cash flow hedges | December 31, 2023 | December 31, 2022 | December 31, 2021 | |||||||||||||||||
| Interest rate derivatives | $ | ( | $ | $ | ||||||||||||||||
The following table presents the amount of gains on derivative instruments reclassified from Accumulated other comprehensive income / (loss) into earnings (in millions):
| Year Ended | ||||||||||||||||||||||||||
| Derivatives designated as cash flow hedges | Financial Statement Classification | December 31, 2023 | December 31, 2022 | December 31, 2021 | ||||||||||||||||||||||
| Interest rate derivatives | Interest expense | $ | $ | $ | ||||||||||||||||||||||
Refer to Note 1, "Significant Accounting Policies," for disclosure of where cash flows associated with derivative instruments and their related gains and losses are presented in the statement of cash flows. Refer to Note 16, "Fair Value of Financial Instruments," for additional information related to the fair value methodology used for derivative financial instruments and Note 21, "Subsequent Events," for information regarding additional derivatives transactions subsequent to year end.
F - 55
SUN COMMUNITIES, INC.
NOTES TO CONSOLIDATED FINANCIAL STATEMENTS
16. Fair Value of Financial Instruments
Our financial instruments consist primarily of cash, cash equivalents and restricted cash, marketable securities, notes and other receivables, derivative assets and liabilities, debt, warrants and other liabilities. We utilize fair value measurements to record fair value adjustments to certain assets and liabilities and to determine fair value disclosures, pursuant to ASC 820, "Fair Value Measurements and Disclosures."
Assets by Hierarchy Level
The table below sets forth our financial assets and liabilities (in millions) that require disclosure of fair value on a recurring basis as of December 31, 2023. The table presents the carrying values and fair values of our financial instruments as of December 31, 2023 and 2022, that were measured using the valuation techniques described in Note 1, "Significant Accounting Policies." The table excludes other financial instruments such as other receivables and accounts payable as the carrying values associated with these instruments approximate their fair value since their maturities are less than one year. These are classified as Level 1 in the hierarchy.
| December 31, 2023 | ||||||||||||||||||||||||||||||||
| Carrying Value | Fair Value | |||||||||||||||||||||||||||||||
| Quoted Prices in Active Markets for Identical Assets and Liabilities (Level 1) | Significant Other Observable Inputs (Level 2) | Significant Unobservable Inputs (Level 3) | Total | |||||||||||||||||||||||||||||
| Financial Assets | ||||||||||||||||||||||||||||||||
| Cash, cash equivalents and restricted cash | $ | $ | $ | $ | $ | |||||||||||||||||||||||||||
| Installment notes receivable on manufactured homes, net | ||||||||||||||||||||||||||||||||
| Notes receivable from real estate developers and operators | ||||||||||||||||||||||||||||||||
| Collateralized receivables, net | ||||||||||||||||||||||||||||||||
| Total assets measured at fair value | $ | $ | $ | $ | $ | |||||||||||||||||||||||||||
| Financial Liabilities | ||||||||||||||||||||||||||||||||
| Mortgage loan payable | $ | $ | $ | $ | $ | |||||||||||||||||||||||||||
| Secured borrowings on collateralized receivables | ||||||||||||||||||||||||||||||||
| Total secured debt | ||||||||||||||||||||||||||||||||
| Unsecured debt | ||||||||||||||||||||||||||||||||
| Senior unsecured notes | ||||||||||||||||||||||||||||||||
| Line of credit and other unsecured debt | ||||||||||||||||||||||||||||||||
| Total unsecured debt | ||||||||||||||||||||||||||||||||
| Other financial liabilities (contingent consideration) | ||||||||||||||||||||||||||||||||
| Total liabilities measured at fair value | $ | $ | $ | $ | $ | |||||||||||||||||||||||||||
F - 56
SUN COMMUNITIES, INC.
NOTES TO CONSOLIDATED FINANCIAL STATEMENTS
| December 31, 2022 | ||||||||||||||||||||||||||||||||
| Fair Value | ||||||||||||||||||||||||||||||||
| Carrying Value | Quoted Prices in Active Markets for Identical Assets and Liabilities (Level 1) | Significant Other Observable Inputs (Level 2) | Significant Unobservable Inputs (Level 3) | Total | ||||||||||||||||||||||||||||
| Financial Assets | ||||||||||||||||||||||||||||||||
| Cash, cash equivalents and restricted cash | $ | $ | $ | $ | $ | |||||||||||||||||||||||||||
| Marketable securities | ||||||||||||||||||||||||||||||||
| Installment notes receivable on manufactured homes, net | ||||||||||||||||||||||||||||||||
| Notes receivable from real estate developers and operators | ||||||||||||||||||||||||||||||||
| Total assets measured at fair value | $ | $ | $ | $ | $ | |||||||||||||||||||||||||||
| Financial Liabilities | ||||||||||||||||||||||||||||||||
| Mortgage loan payable | $ | $ | $ | $ | $ | |||||||||||||||||||||||||||
| Unsecured debt | ||||||||||||||||||||||||||||||||
| Senior unsecured notes | ||||||||||||||||||||||||||||||||
| Line of credit and other unsecured debt | ||||||||||||||||||||||||||||||||
| Total unsecured debt | ||||||||||||||||||||||||||||||||
| Other financial liabilities (contingent consideration) | ||||||||||||||||||||||||||||||||
| Total liabilities measured at fair value | $ | $ | $ | $ | $ | |||||||||||||||||||||||||||
We utilize fair value measurements to record fair value adjustments to certain assets and liabilities and to determine fair value disclosures. The following methods and assumptions were used in order to estimate the fair value of each class of financial instruments for which it is practicable to estimate that value:
Cash, Cash Equivalents and Restricted Cash
The carrying values of cash, cash equivalents and restricted cash approximate their fair market values due to the short-term nature of the instruments. These are classified as Level 1 in the hierarchy.
Marketable Securities
The fair value is measured by the quoted unadjusted share price which is readily available in active markets (Level 1). The change in the marketable securities balance is as follows (in millions):
| December 31, 2023 | December 31, 2022 | ||||||||||
| Beginning Balance | $ | $ | |||||||||
| Change in fair value measurement | ( | ( | |||||||||
| Foreign currency exchange losses | ( | ( | |||||||||
| Dividend reinvestment, net of tax | |||||||||||
Dispositions(1) | ( | ||||||||||
| Ending Balance | $ | $ | |||||||||
(1)During the year ended December 31, 2023, we sold our 41.8 million share position in Ingenia, generating $102.5 million of proceeds, net of $1.0 million of underwriting and other fees, with a realized loss of $8.0 million. The proceeds were used to pay down amounts drawn under our Senior Credit Facility.
Installment Notes Receivable on Manufactured Homes and Collateralized Receivables
Installment notes receivable on manufactured homes and collateralized receivables are recorded at fair value and are measured using model-derived indicative pricing using primarily unobservable inputs, inclusive of default rates, interest rates and recovery rates (Level 3). Refer to Note 4, "Notes and Other Receivables" and Note 5, "Collateralized Receivables and Transfers of Financial Assets," for additional information.
F - 57
SUN COMMUNITIES, INC.
NOTES TO CONSOLIDATED FINANCIAL STATEMENTS
Notes Receivable from Real Estate Developers and Operators
Notes receivable from real estate developers and operators are recorded at fair value and are measured using model-derived indicative pricing using primarily unobservable inputs including interest rates and counterparty performance (Level 3). The carrying values of the notes generally approximate their fair market values either due to the nature of the note and / or the note being secured primarily by underlying real estate and other collateral and / or personal guarantees. Refer to Note 4, "Notes and Other Receivables," for additional information.
Derivatives Assets and Liabilities - Interest Rate Derivatives
Interest rate derivatives are recorded at fair value and consist of treasury rate lock contracts, interest rate swaps and forward swaps. The fair value of these financial instruments are measured using observable inputs based on the 10-year treasury note rate, the SOFR and SONIA Rates, respectively (Level 2).
Secured Debt
Mortgage term loans - the fair value of mortgage term loans is based on the estimates of management and on rates currently quoted, rates currently prevailing for comparable loans and instruments of comparable maturities (Level 2). Refer to Note 9, "Debt and Line of Credit," for additional information.
Secured borrowings on collateralized receivables - recorded at fair value and adjusted based on the same interest rates as the related collateralized receivables (Level 3). Refer to Note 5, "Collateralized Receivables and Transfers of Financial Assets" and Note 9, "Debt and Line of Credit," for additional information.
Unsecured Debt
Senior unsecured notes - the fair value of senior unsecured notes is based on the estimates of management and on rates currently quoted, rates currently prevailing for comparable loans and instruments of comparable maturities (Level 2). Refer to Note 9, "Debt and Line of Credit," for additional information.
Line of credit and other unsecured debt - consists primarily of our Senior Credit Facility. We have variable rates on our Senior Credit Facility. The fair value of the debt with variable rates approximates carrying value as the interest rates of these amounts approximate market rates (Level 2). The estimated fair value of our debt as of December 31, 2023 approximated its gross carrying value.
Other Financial Liabilities
We estimate the fair value of contingent consideration liabilities based on valuation models using significant unobservable inputs that generally consider discounting of future cash flows using market interest rates and adjusting for non-performance risk over the remaining term of the liability (Level 3).
Level 3 Reconciliation, Measurements and Transfers
We review the fair value hierarchy classifications each reporting period. Changes in the observability of the valuation attributes may result in a reclassification of certain financial assets or liabilities. Such reclassifications are reported as transfers in and out of Level 3 at the beginning fair value for the reporting period in which the changes occur. Availability of secondary market activity and consistency of pricing from third-party sources impacts our ability to classify securities as Level 2 or Level 3. There were no transfers into or out of Level 3 during the years ended December 31, 2023 and 2022.
F - 58
SUN COMMUNITIES, INC.
NOTES TO CONSOLIDATED FINANCIAL STATEMENTS
The following tables summarize changes to our financial instruments carried at fair value and classified within Level 3 of the fair value hierarchy for the years ended December 31, 2023 and 2022 (in millions):
| Year Ended | ||||||||||||||||||||||||||||||||||||||||||||
| December 31, 2023 | December 31, 2022 | |||||||||||||||||||||||||||||||||||||||||||
| Assets: | Installment Notes Receivable on MH, net | Notes Receivable From Real Estate Developers and Operators | Collateralized Receivables, net | Warrants | Installment Notes Receivable on MH, net | Notes Receivable From Real Estate Developers and Operators | Warrants | |||||||||||||||||||||||||||||||||||||
Level 3 beginning balance at December 31, 2023 and 2022 | $ | $ | $ | $ | $ | $ | $ | |||||||||||||||||||||||||||||||||||||
Realized gains / (losses) | ( | (1) | ( | (1) | (2) | ( | (3) | ( | ( | (3) | ||||||||||||||||||||||||||||||||||
| Purchases and issuances | ||||||||||||||||||||||||||||||||||||||||||||
| Sales and settlements | ( | ( | ( | ( | ( | |||||||||||||||||||||||||||||||||||||||
| Foreign currency exchange gains / (losses) | ( | |||||||||||||||||||||||||||||||||||||||||||
Other adjustments(4) | ( | |||||||||||||||||||||||||||||||||||||||||||
Level 3 ending balance at December 31, 2023 and 2022 | $ | $ | $ | $ | $ | $ | $ | |||||||||||||||||||||||||||||||||||||
(1) Realized losses recorded within on the Consolidated Statements of Operations.
(2) Realized gains recorded within Other expense, net on the Consolidated Statements of Operations.
(3) Realized losses recorded within Income from nonconsolidated affiliates on the Consolidated Statements of Operations.
(4) Primarily relates to the transfer of Installment notes receivable classified Collateralized receivables, net. Refer to Note 5, "Collateralized Receivables and Transfers of Financial Assets." for additional details.
| Year Ended | |||||||||||||||||||||||
| December 31, 2023 | December 31, 2022 | ||||||||||||||||||||||
| Liabilities: | Secured Borrowing on Collateralized Receivables | Other Liabilities (Contingent Consideration) | Secured Borrowing on Collateralized Receivables | Other Liabilities (Contingent Consideration) | |||||||||||||||||||
Level 3 beginning balance at December 31, 2023 and 2022 | $ | $ | $ | $ | |||||||||||||||||||
Realized losses | (1) | ||||||||||||||||||||||
| Purchases and issuances | |||||||||||||||||||||||
| Sales and settlements | ( | ||||||||||||||||||||||
| Other adjustments | |||||||||||||||||||||||
Level 3 ending balance at December 31, 2023 and 2022(1) | $ | $ | $ | $ | |||||||||||||||||||
(1) Realized losses are recorded within Other expense, net on the Consolidated Statements of Operations.
Although we have determined the estimated fair value amounts using available market information and commonly accepted valuation methodologies, considerable judgment is required in interpreting market data to develop fair value estimates. The fair value estimates are based on information available as of December 31, 2023. As such, our estimates of fair value could differ significantly from the actual carrying value.
17. Commitments and Contingencies
Legal Proceedings - Class Action Litigation
Since August 31, 2023, several putative class action complaints have been filed in the U.S. District Court for the Northern District of Illinois, Eastern Division, against Datacomp Appraisal Systems, Inc., us, and nine other large MH operators in the United States. The complaint alleges that the defendants have violated federal antitrust laws by sharing and receiving competitively sensitive non-public information to maintain artificially high site rents. The complaints have been consolidated into the case captioned In re Manufactured Home Lot Rents Antitrust Litigation, No. 1:23-cv-06715.
F - 59
SUN COMMUNITIES, INC.
NOTES TO CONSOLIDATED FINANCIAL STATEMENTS
Plaintiffs seek both injunctive relief and monetary damages, as well as attorneys' fees. We are unable to estimate a range of loss, if any, that could result were there to be an adverse final decision in this litigation. If an unfavorable result were to occur, it is possible that the impact could be material to our results of operations in the periods in which any such outcome becomes probable and estimable.
We believe that the plaintiffs' allegations are without merit and intend to defend against them vigorously. However, litigation is inherently uncertain and there can be no assurance regarding the likelihood that our defense of this litigation will be successful.
Other Legal Proceedings
We are involved in various other legal proceedings arising in the ordinary course of business. All such other proceedings, taken together, are not expected to have a material adverse impact on our results of operations or financial condition.
Catastrophic Event-Related Charges
When Hurricane Ian made landfall on Florida's western coast in September 2022, the storm primarily affected three RV properties in the Fort Myers area, comprising approximately 2,500 sites. These properties sustained significant flooding and wind damage from the hurricane. At other affected MH and RV properties, most of the damage was limited to trees, roofs, fences, skirting and carports. At affected marina properties, seawalls, docks, buildings, and landscaping sustained wind and water damage.
We maintain property, casualty, flood and business interruption insurance for our community portfolio, subject to customary deductibles and limits.
Estimated property insurance recoveries, excluding business interruption recoveries, of $56.7 million related to Hurricane Ian were recorded in Notes and other receivables, net on the Consolidated Balance Sheets as of December 31, 2023. The table below sets forth changes in estimated property insurance recoveries, excluding business interruption recoveries (in millions):
| Year Ended December 31, 2023 | ||||||||
| Total estimated insurance receivable - December 31, 2022 | $ | |||||||
| Change in estimated property insurance recoveries | ||||||||
| Proceeds received from insurer | ( | |||||||
| Total estimated insurance receivable - December 31, 2023 | $ | |||||||
Changes in estimated property insurance recoveries related to Hurricane Ian during the year ended December 31, 2023 were primarily the result of $51.5 million of incremental costs that exceeded the applicable deductible, net of a $4.8 million reduction due to a decrease in the estimated property impairment. The foregoing estimates are based on current information available, and we continue to assess these estimates. Actual charges and insurance recoveries could vary significantly from these estimates. Any changes to these estimates will be recognized in the period(s) in which they are determined.
We are actively working with our insurance providers on claims for business interruption recoveries. During the year ended December 31, 2023, we recognized $20.2 million, net of deductibles, for the lost earnings covering September 28, 2022, the date of the hurricane event, through August 31, 2023. These recoveries were included in Brokerage commissions and other, net on our Consolidated Statements of Operations during the year ended December 31, 2023. The related communities are under redevelopment. As such, we currently cannot estimate a date when operating results will be restored to pre-hurricane levels. Our business interruption insurance policy provides for up to 60 months of coverage from the date of restoration.
F - 60
SUN COMMUNITIES, INC.
NOTES TO CONSOLIDATED FINANCIAL STATEMENTS
18. Leases
Lessee Accounting
We lease land under non-cancelable operating leases at certain MH, RV and marina properties expiring at various dates through 2100. The majority of the leases have terms requiring fixed payments plus additional rents based on a percentage of revenues at those properties. We also have other operating leases, primarily office space and equipment expiring at various dates through 2042.
Future minimum lease payments under non-cancellable leases as of December 31, 2023 where we are the lessee include (in millions):
| Maturity of Lease Liabilities | Finance Leases | Operating Leases | Total | |||||||||||||||||
| 2024 | $ | $ | $ | |||||||||||||||||
| 2025 | ||||||||||||||||||||
| 2026 | ||||||||||||||||||||
| 2027 | ||||||||||||||||||||
| 2028 | ||||||||||||||||||||
| Thereafter | ||||||||||||||||||||
| Total Lease Payments | $ | $ | $ | |||||||||||||||||
| Less: Imputed interest | ( | ( | ( | |||||||||||||||||
| Present Value of Lease Liabilities | $ | $ | $ | |||||||||||||||||
Right-of-use ("ROU") assets and lease liabilities for finance and operating leases as included in our Consolidated Balance Sheets are as follows (in millions):
| Financial Statement Classification | As of | |||||||||||||||||||
| Description | December 31, 2023 | December 31, 2022 | ||||||||||||||||||
| Lease Assets | ||||||||||||||||||||
| Finance lease, ROU asset, net of accumulated amortization | $ | $ | ||||||||||||||||||
| Operating lease, ROU asset, net | $ | $ | ||||||||||||||||||
| Below market operating leases, net | Other assets, net | $ | $ | |||||||||||||||||
| Lease Liabilities | ||||||||||||||||||||
| Finance lease liabilities | $ | $ | ||||||||||||||||||
| Operating lease liabilities | $ | $ | ||||||||||||||||||
The components of lease costs for finance and operating leases, as included in our Consolidated Statements of Operations are as follows (in millions):
| Year Ended | ||||||||||||||||||||||||||
| Description | Financial Statement Classification | December 31, 2023 | December 31, 2022 | December 31, 2021 | ||||||||||||||||||||||
| Finance Lease Cost | ||||||||||||||||||||||||||
| Amortization of ROU assets | Depreciation and amortization | $ | $ | $ | ||||||||||||||||||||||
| Interest on lease liabilities | Interest expense | |||||||||||||||||||||||||
| Operating lease cost | General and administrative expense, Property operating and maintenance, Depreciation and amortization | |||||||||||||||||||||||||
Operating lease impairment(1) | Other expense, net | |||||||||||||||||||||||||
| Variable lease cost | Property operating and maintenance | |||||||||||||||||||||||||
| Total Lease Cost | $ | $ | $ | |||||||||||||||||||||||
(1)Refer to Note 1, "Significant Accounting Policies," for additional details.
F - 61
SUN COMMUNITIES, INC.
NOTES TO CONSOLIDATED FINANCIAL STATEMENTS
Lease term, discount rates and additional information for finance and operating leases are as follows:
| As of | ||||||||||||||
| Lease Term and Discount Rate | December 31, 2023 | December 31, 2022 | ||||||||||||
| Weighted-average Remaining Lease Terms (years) | ||||||||||||||
| Finance lease | ||||||||||||||
| Operating lease | ||||||||||||||
| Weighted-average Discount Rate | ||||||||||||||
| Finance lease | % | % | ||||||||||||
| Operating lease | % | % | ||||||||||||
| Year Ended | ||||||||||||||||||||
| Other Information (in millions) | December 31, 2023 | December 31, 2022 | December 31, 2021 | |||||||||||||||||
| Cash Paid for Amounts Included in the Measurement of Lease Liabilities | ||||||||||||||||||||
| Operating cash outflows for operating leases | $ | $ | $ | |||||||||||||||||
| Financing cash outflows for finance leases | ||||||||||||||||||||
| Total Cash Paid on Lease Liabilities | $ | $ | $ | |||||||||||||||||
During the year ended December 31, 2022, we vacated certain of our leased spaces to better align with our needs and workplace strategies. As a result, we impaired the corresponding operating lease right of use assets, resulting in a charge of $4.0 million recorded within Other expense, net within the Consolidated Statement of Operations.
Lessor Accounting
We are not the lessor for any finance leases at our MH, RV or marina properties as of December 31, 2023.
Nearly all of our operating leases with our residents and customers at our MH and RV properties where we are the lessor are either month to month or for a time period not to exceed one year. As of December 31, 2023, future minimum lease payments with our residents or customers would not exceed 12 months.
We do not have any operating leases with real estate operators at our MH properties. At our RV communities and marinas, future minimum lease payments under non-cancellable leases with real estate operators where we are the lessor include the following as of December 31, 2023 (in millions):
| Maturity of Lease Payments | Operating Leases | |||||||
| 2024 | $ | |||||||
| 2025 | ||||||||
| 2026 | ||||||||
| 2027 | ||||||||
| 2028 | ||||||||
| Thereafter | ||||||||
| Total Undiscounted Cash Flows | $ | |||||||
The components of lease income for our operating leases, as included in our Consolidated Statement of Operations are as follows (in millions):
| Year Ended | ||||||||||||||||||||||||||
| Description | Financial Statement Classification | December 31, 2023 | December 31, 2022 | December 31, 2021 | ||||||||||||||||||||||
| Operating Leases | ||||||||||||||||||||||||||
| Fixed lease income | Income from real property; Brokerage commissions and other revenue, net | $ | $ | $ | ||||||||||||||||||||||
Variable lease income(1) | Income from real property; Brokerage commissions and other revenue, net | $ | $ | $ | ||||||||||||||||||||||
(1)Consists of rent primarily based on a percentage of operating revenues beyond target thresholds.
F - 62
SUN COMMUNITIES, INC.
NOTES TO CONSOLIDATED FINANCIAL STATEMENTS
During the year ended December 31, 2021, we terminated our operating ground lease agreements at two properties and settled a contingent consideration earn-out provision in the amount of $17.2 million. As these properties were deemed asset acquisitions, the contingent consideration payment was recognized as an additional purchase price within Land improvements and buildings in the Consolidated Balance Sheets, and within Acquisition of properties, net of cash acquired, in the Consolidated Statement of Cash Flows.
In conjunction with the termination, we entered into management agreements with the previous operators to manage these properties effective January 1, 2022.
During the year ended December 31, 2021, we terminated our operating ground lease agreement at one property and settled a contingent consideration earnout provision in the amount of $20.1 million. The initial contingent consideration liability of $9.8 million was recognized at acquisition within Investment property in the Consolidated Balance Sheets, and within financing in the Consolidated Statement of Cash Flows. As this property was deemed a business combination, incremental contingent consideration expense of $10.3 million was recognized within Other expense, net in the Consolidated Statement of Operations and within Operating in the Consolidated Statement of Cash Flows. In conjunction with the termination, we entered into a management agreement with the previous operator to manage the property effective January 1, 2022.
Failed Sale Leaseback
In connection with our acquisition of Park Holidays, we assumed ground lease arrangements for 34 UK properties that we concluded to be failed sale-leaseback transactions under ASC Topic 842, "Leases." The arrangements have maturities ranging from 2117 through 2197 with an option to repurchase for £1.00 at the end of the term. The obligation related to the underlying ground leases has been recorded as a financial liability in Other Liabilities on the Consolidated Balance Sheets. The financial liability was $359.7 million and $339.7 million as of December 31, 2023 and December 31, 2022, respectively. The following table presents the future minimum rental payments for this financial liability as of December 31, 2023 (in millions):
| Maturity of Financial Liability (in millions) | December 31, 2023 | |||||||
| 2024 | $ | |||||||
| 2025 | ||||||||
| 2026 | ||||||||
| 2027 | ||||||||
| 2028 | ||||||||
| Thereafter | ||||||||
| Total Payments | $ | |||||||
| Less: Imputed interest | ( | |||||||
| Present Value of Financial Liability | $ | |||||||
19. Related Party Transactions
Lease of Executive Offices - Gary A. Shiffman, together with certain of his family members, indirectly owns an equity interest of approximately 28.1 % in American Center LLC, the entity from which we lease office space for our principal executive offices. Each of Brian M. Hermelin, Ronald A. Klein and Arthur A. Weiss indirectly owns less than one percent interest in American Center LLC. Mr. Shiffman is our Chairman of the Board, President and Chief Executive Officer. Each of Mr. Hermelin, Mr. Klein and Mr. Weiss is a director of the Company. Under this agreement, we lease approximately 60,261 rentable square feet of permanent space. The lease agreement includes annual graduated rent increases through the initial end date of October 31, 2026. As of December 31, 2023, the average gross base rent was $20.95 per square foot. Each of Mr. Shiffman, Mr. Hermelin, Mr. Klein and Mr. Weiss may have a conflict of interest with respect to his obligations as our officer and / or director and his ownership interest in American Center LLC.
Use of Airplane - Gary A. Shiffman is the beneficial owner of an airplane that we use from time to time for business purposes. During the years ended December 31, 2023, 2022 and 2021, we paid $0.5 million, $0.7 million and $0.7 million for the use of the airplane, respectively. Mr. Shiffman may have a conflict of interest with respect to his obligations as our officer and director and his ownership interest in the airplane.
Telephone Services - Brian M. Hermelin is a principal and a beneficial owner of an entity that installs and maintains emergency telephone systems at our properties. During the years ended December 31, 2023, 2022 and 2021, we paid $0.3 million, $0.2 million and $0.2 million for these services, respectively. Mr. Hermelin may have a conflict of interest with respect to his obligations as our director and his position with and ownership interest in the provider of these services.
F - 63
SUN COMMUNITIES, INC.
NOTES TO CONSOLIDATED FINANCIAL STATEMENTS
Legal Counsel - Arthur A. Weiss is a partner at Taft Stettinius & Hollister LLP (formerly Jaffe, Raitt, Heuer, & Weiss, Professional Corporation) which acts as our general counsel and represents us in various matters. We incurred legal fees and expenses owed to this law firm of approximately $7.9 million, $9.7 million and $10.3 million during the years ended December 31, 2023, 2022 and 2021, respectively.
Tax Consequences Upon Sale of Properties - Gary A. Shiffman holds limited partnership interests in the Operating Partnership which were received in connection with the contribution of properties from partnerships previously affiliated with him. Prior to any redemption of these limited partnership interests for our common stock, Mr. Shiffman will have tax consequences different from those on us and our public shareholders upon the sale of any of these partnerships. Therefore, we and Mr. Shiffman may have different objectives regarding the appropriate pricing and timing of any sale of those properties.
20. Recent Accounting Pronouncements
Recent Accounting Pronouncements - Adopted
In March 2020, the FASB issued ASU 2020-04, "Reference Rate Reform (Topic 848) - Facilitation of the Effects of Reference Rate Reform on Financial Reporting," which provides optional guidance for accounting for contracts, hedging relationships and other transactions affected by the reference rate reform, if certain criteria are met. The provisions of this standard were available for election through December 31, 2022. In December 2022, the FASB issued ASU 2022-06, "Reference Rate Reform (Topic 848) - Deferral of the Sunset Date of Topic 848," which defers the sunset date for Topic 848 from December 31, 2022 to December 31, 2024, after which entities will no longer be permitted to apply the relief in Topic 848. As of December 31, 2023, all of our debt and derivative instruments have been converted from LIBOR to alternative reference rates. The adoption of this ASU did not have a material impact on our Consolidated Financial Statements as the majority of our debt has fixed interest rates.
Recent Accounting Pronouncements - Not Yet Adopted
In October 2023, the FASB issued ASU 2023-06, "Disclosure Improvements: Codification Amendments in Response to the SEC's Disclosure Update and Simplification Initiative," which adds interim and annual disclosure requirements to the US GAAP codification at the request of the SEC. The new guidance is intended to align GAAP requirements with those of the SEC and to facilitate the application of GAAP for all entities. These disclosure requirements are currently included in either SEC Regulation S-X or SEC Regulation S-K. The effective date for each amendment will be the date on which the SEC's removal of that related disclosure from Regulation S-X or Regulation S-K becomes effective. Early adoption is prohibited and the amendments should be applied prospectively. If the SEC has not removed the applicable requirement from Regulation S-X or Regulation S-K by June 30, 2027, the amendments will be removed from the US GAAP codification and will not be effective.
In November 2023, the FASB issued ASU 2023-07, "Segment Reporting (Topic 280): Improvements to Reportable Segment Disclosures," which enhances disclosure of significant segment expenses that are regularly provided to the chief operating decision maker to assess segment performance, including each reported measure of segment profit or loss, an amount and description of the composition for other segment items to reconcile to segment profit or loss, interim disclosures of a reportable segment's profit or loss and assets, and the title and position of our chief operating decision maker. This ASU is effective for fiscal years beginning after December 15, 2023, and interim periods within fiscal years beginning after December 15, 2024. Early adoption is permitted and the amendments should be applied prospectively. We are currently evaluating the provisions of this amendment and the impact on our Consolidated Financial Statements and related disclosures.
In December 2023, the FASB issued ASU 2023-09, "Income Taxes (Topic 740): Improvements to Income Tax Disclosures," which requires disclosure of specific categories in the effective tax rate reconciliation as well as provide additional information for reconciling items that meet a quantitative threshold. Further, this amendment requires certain disclosure of income taxes paid disaggregated by federal, state and foreign taxes, and the amount of income taxes paid disaggregated by individual jurisdiction in which income taxes paid meet a quantitative threshold. The new guidance is intended to enhance the transparency and decision usefulness of income tax disclosures. This ASU is effective for fiscal years beginning after December 15, 2024. Early adoption is permitted and the amendments should be applied prospectively. We are currently evaluating the provisions of this amendment and the impact on our Consolidated Financial Statements and related disclosures.
F - 64
SUN COMMUNITIES, INC.
NOTES TO CONSOLIDATED FINANCIAL STATEMENTS
21. Subsequent Events
Acquisitions
Subsequent to the year ended December 31, 2023, we acquired one land parcel located in the U.S. for a purchase price of $11.7 million.
Dispositions
In February 2024, we sold two MH and RV operating communities located in Florida and Arizona with 533 total developed sites for total cash consideration of $53.3 million and total gain on sale of approximately $6.3 million.
Notes Receivable from Real Estate Developers and Operators
Subsequent to the year ended December 31, 2023, we completed a receivership process related to the remaining three MH manufacturers in the UK. The receivers sold such assets for total consideration of $10.7 million, resulting in cash proceeds to the Company of $7.0 million, net of non-cash consideration and fees. The sale of these assets resulted in an incremental fair value remeasurement adjustment of $0.8 million.
Senior Unsecured Notes and Derivatives
In January 2024, the Operating Partnership issued $500.0 million of senior unsecured notes with an interest rate of 5.5 % and a five-year term, due January 15, 2029. Interest on the notes is payable semi-annually in arrears on January 15 and July 15 of each year, beginning on July 15, 2024. The net proceeds from the offering were $495.4 million, after deducting underwriters' discounts and estimated offering expenses. We used the majority of the net proceeds to repay borrowings outstanding under our Senior Credit Facility.
In connection with the note issuance, we settled seven forward swap contracts totaling $255.0 million and made a net settlement payment of $2.3 million to several counterparties. As of the settlement date, the net accumulated loss is included in AOCI and is being reclassified into earnings as an increase to interest expense on a straight-line basis over the five-year term of the hedged transaction.
In February 2024, we entered into an interest rate swap contract to hedge variable rate borrowings of $25.0 million.
Legal Settlement
In January 2024, we were awarded two mixed use parking garages at one of our marina properties located in Florida, as part of a legal settlement. As a result, we recorded $10.4 million of building and land and recognized the related gain.
We have evaluated our Consolidated Financial Statements for subsequent events through the date that this Form 10-K was issued.
F - 65
SUN COMMUNITIES, INC.
NOTES TO CONSOLIDATED FINANCIAL STATEMENTS
22. Quarterly Financial Data (Unaudited and Restated)
Restatement of Prior Quarterly 2023 Financial Statements (Unaudited)
During the course of preparation and review of our financial statements for the year end December 31, 2023, it was determined that we did not identify certain factors indicative of triggering events relevant to the valuation of the UK reporting unit, including reduced financial projections and increased interest rates when preparing our previously issued unaudited interim consolidated financial statements (collectively, the "Interim Financial Statements") as of and for the period ended March 31, 2023, as of and for the period ended June 30, 2023, and as of and for the period ended September 30, 2023 (collectively, the "Interim Periods"), included in our Quarterly Reports on Form 10-Q for the quarters ended March 31, 2023, June 30, 2023 and September 30, 2023, respectively. Management undertook a full review of the valuations and determined that as of each of March 31, 2023, June 30, 2023 and September 30, 2023 we should have recognized non-cash impairments to goodwill for the UK reporting unit within our MH segment.
Pursuant to SEC Staff Accounting Bulletin ("SAB") No. 99, Materiality, and SAB No. 108, Considering the Effects of Prior Year Misstatements when Quantifying Misstatements in Current Year Financial Statements, we evaluated these misstatements, and based on an analysis of quantitative and qualitative factors, determined that the impact of misstatements related to goodwill impairments was material to our Interim Periods. Accordingly, we have restated the unaudited consolidated financial statements for the Interim Periods and have included that restated unaudited financial information within this Annual Report. Restatement of amounts in previously filed Interim Financial Statements are reflected below.
The restated Consolidated Balance Sheet line items for the first through third quarters of 2023 were as follows:
As of March 31, 2023 | ||||||||||||||||||||
| As Previously Reported | Adjustments | As Restated | ||||||||||||||||||
| Goodwill | $ | $ | ( | $ | ||||||||||||||||
| Total assets | $ | $ | ( | $ | ||||||||||||||||
Other liabilities(1) | $ | $ | ( | $ | ||||||||||||||||
Total liabilities(1) | $ | $ | ( | $ | ||||||||||||||||
| Temporary equity | $ | $ | ( | $ | ||||||||||||||||
| Accumulated other comprehensive income | $ | $ | ( | $ | ||||||||||||||||
| Distributions in excess of accumulated earnings | $ | ( | $ | ( | $ | ( | ||||||||||||||
| Total SUI shareholder's equity | $ | $ | ( | $ | ||||||||||||||||
| Common and preferred OP units | $ | $ | ( | $ | ||||||||||||||||
| Total noncontrolling interests | $ | $ | ( | $ | ||||||||||||||||
| Total shareholder's equity | $ | $ | ( | $ | ||||||||||||||||
| Total liabilities, temporary equity and shareholder's equity | $ | $ | ( | $ | ||||||||||||||||
(1) Adjustments due to rounding effects.
As of June 30, 2023 | ||||||||||||||||||||
| As Previously Reported | Adjustments | As Restated | ||||||||||||||||||
| Goodwill | $ | $ | ( | $ | ||||||||||||||||
| Total assets | $ | $ | ( | $ | ||||||||||||||||
Other liabilities(1) | $ | $ | ( | $ | ||||||||||||||||
Total liabilities(1) | $ | $ | ( | $ | ||||||||||||||||
| Temporary equity | $ | $ | ( | $ | ||||||||||||||||
| Accumulated other comprehensive income | $ | $ | ( | $ | ||||||||||||||||
| Distributions in excess of accumulated earnings | $ | ( | $ | ( | $ | ( | ||||||||||||||
| Total SUI shareholder's equity | $ | $ | ( | $ | ||||||||||||||||
| Common and preferred OP units | $ | $ | ( | $ | ||||||||||||||||
| Total noncontrolling interests | $ | $ | ( | $ | ||||||||||||||||
| Total shareholder's equity | $ | $ | ( | $ | ||||||||||||||||
| Total liabilities, temporary equity and shareholder's equity | $ | $ | ( | $ | ||||||||||||||||
(1) Adjustments due to rounding effects.
F - 66
SUN COMMUNITIES, INC.
NOTES TO CONSOLIDATED FINANCIAL STATEMENTS
As of September 30, 2023 | ||||||||||||||||||||
| As Previously Reported | Adjustments | As Restated | ||||||||||||||||||
| Goodwill | $ | $ | ( | $ | ||||||||||||||||
| Total assets | $ | $ | ( | $ | ||||||||||||||||
Other liabilities(1) | $ | $ | ( | $ | ||||||||||||||||
Total liabilities(1) | $ | $ | ( | $ | ||||||||||||||||
| Temporary equity | $ | $ | ( | $ | ||||||||||||||||
| Accumulated other comprehensive income | $ | $ | $ | |||||||||||||||||
| Distributions in excess of accumulated earnings | $ | ( | $ | ( | $ | ( | ||||||||||||||
| Total SUI shareholder's equity | $ | $ | ( | $ | ||||||||||||||||
| Common and preferred OP units | $ | $ | ( | $ | ||||||||||||||||
| Total noncontrolling interests | $ | $ | ( | $ | ||||||||||||||||
| Total shareholder's equity | $ | $ | ( | $ | ||||||||||||||||
| Total liabilities, temporary equity and shareholder's equity | $ | $ | ( | $ | ||||||||||||||||
(1) Adjustments due to rounding effects.
The restated line items of the Consolidated Statements of Operations and Comprehensive Income / (Loss) for the first through third quarters of 2023 are as follows:
Three Months Ended March 31, 2023 | |||||||||||||||||||||||||||||||||||
| As Previously Reported | Adjustments | As Restated | |||||||||||||||||||||||||||||||||
| Goodwill impairment | $ | $ | $ | ||||||||||||||||||||||||||||||||
| Total expenses | $ | $ | $ | ||||||||||||||||||||||||||||||||
| Loss before other items | $ | ( | $ | ( | $ | ( | |||||||||||||||||||||||||||||
| Net loss | $ | ( | $ | ( | $ | ( | |||||||||||||||||||||||||||||
| Loss attributable to noncontrolling interests | $ | ( | $ | ( | $ | ( | |||||||||||||||||||||||||||||
| Net loss attributable to SUI common shareholders | $ | ( | $ | ( | $ | ( | |||||||||||||||||||||||||||||
| Basic loss per share | $ | ( | $ | ( | $ | ( | |||||||||||||||||||||||||||||
| Diluted loss per share | $ | ( | $ | ( | $ | ( | |||||||||||||||||||||||||||||
Three Months Ended March 31, 2023 | |||||||||||||||||||||||||||||||||||
| As Previously Reported | Adjustments | As Restated | |||||||||||||||||||||||||||||||||
| Net loss | $ | ( | $ | ( | $ | ( | |||||||||||||||||||||||||||||
| Foreign currency translation gain arising during period | $ | $ | ( | $ | |||||||||||||||||||||||||||||||
| Net foreign currency translation gain | $ | $ | ( | $ | |||||||||||||||||||||||||||||||
| Total Comprehensive Loss | $ | ( | $ | ( | $ | ( | |||||||||||||||||||||||||||||
| Less: Comprehensive loss attributable to noncontrolling interests | $ | $ | $ | ||||||||||||||||||||||||||||||||
| Comprehensive loss attributable to SUI | $ | ( | $ | ( | $ | ( | |||||||||||||||||||||||||||||
F - 67
SUN COMMUNITIES, INC.
NOTES TO CONSOLIDATED FINANCIAL STATEMENTS
Three Months Ended June 30, 2023 | Six Months Ended June 30, 2023 | ||||||||||||||||||||||||||||||||||
| As Previously Reported | Adjustments | As Restated | As Previously Reported | Adjustments | As Restated | ||||||||||||||||||||||||||||||
| Goodwill impairment | $ | $ | $ | $ | $ | $ | |||||||||||||||||||||||||||||
| Total expenses | $ | $ | $ | $ | $ | $ | |||||||||||||||||||||||||||||
| Income / (loss) before other items | $ | $ | ( | $ | ( | $ | $ | ( | $ | ( | |||||||||||||||||||||||||
| Net income / (loss) | $ | $ | ( | $ | ( | $ | $ | ( | $ | ( | |||||||||||||||||||||||||
Preferred return to preferred OP units / equity interests(1) | $ | $ | ( | $ | $ | $ | ( | $ | |||||||||||||||||||||||||||
| Income / (loss) attributable to noncontrolling interests | $ | $ | ( | $ | ( | $ | ( | $ | ( | $ | ( | ||||||||||||||||||||||||
| Net income / (loss) attributable to SUI common shareholders | $ | $ | ( | $ | ( | $ | $ | ( | $ | ( | |||||||||||||||||||||||||
| Weighted average common shares outstanding - diluted | |||||||||||||||||||||||||||||||||||
| Basic earnings / (loss) per share | $ | $ | ( | $ | ( | $ | $ | ( | $ | ( | |||||||||||||||||||||||||
| Diluted earnings / (loss) per share | $ | $ | ( | $ | ( | $ | $ | ( | $ | ( | |||||||||||||||||||||||||
(1) Adjustments due to rounding effects.
| Three Months Ended June 30, 2023 | Six Months Ended June 30, 2023 | ||||||||||||||||||||||||||||||||||
| As Previously Reported | Adjustments | As Restated | As Previously Reported | Adjustments | As Restated | ||||||||||||||||||||||||||||||
| Net income / (loss) | $ | $ | ( | $ | ( | $ | $ | ( | $ | ( | |||||||||||||||||||||||||
| Foreign currency translation gain arising during period | $ | $ | ( | $ | $ | $ | ( | $ | |||||||||||||||||||||||||||
| Net foreign currency translation gain | $ | $ | ( | $ | $ | ( | |||||||||||||||||||||||||||||
| Total comprehensive income / (loss) | $ | $ | ( | $ | ( | $ | $ | ( | $ | ( | |||||||||||||||||||||||||
| Less: Comprehensive (income) / loss attributable to noncontrolling interests | $ | ( | $ | $ | $ | ( | $ | $ | |||||||||||||||||||||||||||
| Comprehensive income / (loss) attributable to SUI | $ | $ | ( | $ | ( | $ | $ | ( | $ | ( | |||||||||||||||||||||||||
Three Months Ended September 30, 2023 | Nine Months Ended September 30, 2023 | ||||||||||||||||||||||||||||||||||
| As Previously Reported | Adjustments | As Restated | As Previously Reported | Adjustments | As Restated | ||||||||||||||||||||||||||||||
| Goodwill impairment | $ | $ | $ | $ | $ | $ | |||||||||||||||||||||||||||||
| Total expenses | $ | $ | $ | $ | $ | $ | |||||||||||||||||||||||||||||
| Income / (loss) before other items | $ | $ | ( | $ | $ | $ | ( | $ | ( | ||||||||||||||||||||||||||
| Net income / (loss) | $ | $ | ( | $ | $ | $ | ( | $ | ( | ||||||||||||||||||||||||||
Preferred return to preferred OP units / equity interests(1) | $ | $ | $ | $ | $ | $ | |||||||||||||||||||||||||||||
| Income / (loss) attributable to noncontrolling interests | $ | $ | ( | $ | $ | $ | ( | $ | ( | ||||||||||||||||||||||||||
| Net income / (loss) attributable to SUI common shareholders | $ | $ | ( | $ | $ | $ | ( | $ | ( | ||||||||||||||||||||||||||
| Weighted average common shares outstanding - diluted | |||||||||||||||||||||||||||||||||||
| Basic earnings / (loss) per share | $ | $ | ( | $ | $ | $ | ( | $ | ( | ||||||||||||||||||||||||||
| Diluted earnings / (loss) per share | $ | $ | ( | $ | $ | $ | ( | $ | ( | ||||||||||||||||||||||||||
(1) Adjustments due to rounding effects.
F - 68
SUN COMMUNITIES, INC.
NOTES TO CONSOLIDATED FINANCIAL STATEMENTS
Three Months Ended September 30, 2023 | Nine Months Ended September 30, 2023 | ||||||||||||||||||||||||||||||||||
| As Previously Reported | Adjustments | As Restated | As Previously Reported | Adjustments | As Restated | ||||||||||||||||||||||||||||||
| Net income / (loss) | $ | $ | ( | $ | $ | $ | ( | $ | ( | ||||||||||||||||||||||||||
| Foreign currency translation gain / (loss) arising during period | $ | ( | $ | $ | ( | $ | $ | $ | |||||||||||||||||||||||||||
| Net foreign currency translation gain / (loss) | $ | ( | $ | $ | ( | $ | |||||||||||||||||||||||||||||
| Total comprehensive income / (loss) | $ | $ | ( | $ | $ | $ | ( | $ | ( | ||||||||||||||||||||||||||
| Less: Comprehensive (income) / loss attributable to noncontrolling interests | $ | ( | $ | $ | ( | $ | ( | $ | $ | ||||||||||||||||||||||||||
| Comprehensive income / (loss) attributable to SUI | $ | $ | ( | $ | $ | $ | ( | $ | ( | ||||||||||||||||||||||||||
The restated line items for the Consolidated Statements of Shareholders' Equity for the first through third quarters of 2023 are as follows:
| As of March 31, 2023 | ||||||||||||||||||||
| As Previously Reported | Adjustments | As Restated | ||||||||||||||||||
| Temporary equity | $ | $ | ( | $ | ||||||||||||||||
| Accumulated other comprehensive income | $ | $ | ( | $ | ||||||||||||||||
| Distributions in excess of accumulated earnings | $ | ( | $ | ( | $ | ( | ||||||||||||||
| Noncontrolling interests | $ | $ | ( | $ | ||||||||||||||||
| Total shareholders' equity | $ | $ | ( | $ | ||||||||||||||||
| Total equity | $ | $ | ( | $ | ||||||||||||||||
| As of June 30, 2023 | ||||||||||||||||||||
| As Previously Reported | Adjustments | As Restated | ||||||||||||||||||
| Temporary equity | $ | $ | ( | $ | ||||||||||||||||
| Accumulated other comprehensive income | $ | $ | ( | $ | ||||||||||||||||
| Distributions in excess of accumulated earnings | $ | ( | $ | ( | $ | ( | ||||||||||||||
| Noncontrolling interests | $ | $ | ( | $ | ||||||||||||||||
| Total shareholders' equity | $ | $ | ( | $ | ||||||||||||||||
| Total equity | $ | $ | ( | $ | ||||||||||||||||
| As of September 30, 2023 | ||||||||||||||||||||
| As Previously Reported | Adjustments | As Restated | ||||||||||||||||||
| Temporary equity | $ | $ | ( | $ | ||||||||||||||||
| Accumulated other comprehensive income | $ | $ | $ | |||||||||||||||||
| Distributions in excess of accumulated earnings | $ | ( | $ | ( | $ | ( | ||||||||||||||
| Noncontrolling interests | $ | $ | ( | $ | ||||||||||||||||
| Total shareholders' equity | $ | $ | ( | $ | ||||||||||||||||
| Total equity | $ | $ | ( | $ | ||||||||||||||||
F - 69
SUN COMMUNITIES, INC.
NOTES TO CONSOLIDATED FINANCIAL STATEMENTS
The following is a condensed summary of our unaudited quarterly results for the years ended December 31, 2023 and 2022 (in millions, except per share data):
2023 Quarters | 2022 Quarters | ||||||||||||||||||||||||||||||||||||||||||||||
| March 31, 2023 | June 30, 2023 | September 30, 2023 | December 31, 2023 | March 31, 2022 | June 30, 2022 | September 30, 2022 | December 31, 2022 | ||||||||||||||||||||||||||||||||||||||||
| As Restated | As Restated | As Restated | |||||||||||||||||||||||||||||||||||||||||||||
| Total Revenues | $ | $ | $ | $ | $ | $ | $ | $ | |||||||||||||||||||||||||||||||||||||||
| Total Expenses | |||||||||||||||||||||||||||||||||||||||||||||||
| Income / (Loss) Before Other Items | $ | ( | $ | ( | $ | $ | ( | $ | $ | $ | $ | ||||||||||||||||||||||||||||||||||||
| Net Income / (Loss) | $ | ( | $ | ( | $ | $ | ( | $ | $ | $ | $ | ||||||||||||||||||||||||||||||||||||
| Net Income / (Loss) Attributable to SUI Common Shareholders | $ | ( | $ | ( | $ | $ | ( | $ | $ | $ | $ | ||||||||||||||||||||||||||||||||||||
Earnings per share(1) | |||||||||||||||||||||||||||||||||||||||||||||||
| Basic earnings / (loss) per share | $ | ( | $ | ( | $ | $ | ( | $ | $ | $ | $ | ||||||||||||||||||||||||||||||||||||
| Diluted earnings / (loss) per share | $ | ( | $ | ( | $ | $ | ( | $ | $ | $ | $ | ||||||||||||||||||||||||||||||||||||
(1)Earnings per share for the year may not equal the sum of the quarters' earnings per share due to changes in basic and diluted shares outstanding.
F - 70
SUN COMMUNITIES, INC.
REAL ESTATE AND ACCUMULATED DEPRECIATION, SCHEDULE III
DECEMBER 31, 2023
(amounts in millions)
The following tables set forth real estate and accumulated depreciation relating to our MH and RV properties.
| Initial Cost to Company | Costs Capitalized Subsequent to Acquisition (Improvements) | Gross Amount Carried at December 31, 2023 | ||||||||||||||||||||||||||||||||||||||||||||||||||||||||||||||||||||||||
| Property Name | Location | Encumbrances(4) | Land | Depreciable Assets | Land | Depreciable Assets | Land | Depreciable Assets | Total | Accumulated Depreciation | Date | Acquired (A) or Constructed (C) | ||||||||||||||||||||||||||||||||||||||||||||||||||||||||||||||
47 North(2)(5) | Cle Elum, WA | $ | $ | $ | $ | $ | $ | $ | $ | $ | ( | 2021 | (C) | |||||||||||||||||||||||||||||||||||||||||||||||||||||||||||||
49'er Village(8) | Plymouth, CA | ( | 2017 | (A) | ||||||||||||||||||||||||||||||||||||||||||||||||||||||||||||||||||||||
| Academy / West Point | Canton, MI | ( | 2000 | (A) | ||||||||||||||||||||||||||||||||||||||||||||||||||||||||||||||||||||||
| Allendale Meadows | Allendale, MI | ( | 1996 | (A) | ||||||||||||||||||||||||||||||||||||||||||||||||||||||||||||||||||||||
| Alpine Meadows | Grand Rapids, MI | ( | 1996 | (A&C) | ||||||||||||||||||||||||||||||||||||||||||||||||||||||||||||||||||||||
| Alta Laguna | Rancho Cucamonga, CA | ( | 2016 | (A) | ||||||||||||||||||||||||||||||||||||||||||||||||||||||||||||||||||||||
| Andover | Grass Lake, MI | ( | 2021 | (A) | ||||||||||||||||||||||||||||||||||||||||||||||||||||||||||||||||||||||
| Apple Carr Village | Muskegon, MI | ( | 2011 | (A&C) | ||||||||||||||||||||||||||||||||||||||||||||||||||||||||||||||||||||||
| Apple Creek | Amelia, OH | ( | 1999 | (A) | ||||||||||||||||||||||||||||||||||||||||||||||||||||||||||||||||||||||
Arbor Terrace(8) | Bradenton, FL | ( | 1996 | (A) | ||||||||||||||||||||||||||||||||||||||||||||||||||||||||||||||||||||||
| Arbor Woods | Ypsilanti, MI | ( | 2017 | (A) | ||||||||||||||||||||||||||||||||||||||||||||||||||||||||||||||||||||||
| Ariana Village | Lakeland, FL | ( | 1994 | (A) | ||||||||||||||||||||||||||||||||||||||||||||||||||||||||||||||||||||||
| Augusta Village | Augusta, ME | ( | 2020 | (A) | ||||||||||||||||||||||||||||||||||||||||||||||||||||||||||||||||||||||
Austin Lone Star(8) | Austin, TX | ( | 2016 | (A) | ||||||||||||||||||||||||||||||||||||||||||||||||||||||||||||||||||||||
| Autumn Ridge | Ankeny, IA | ( | 1996 | (A) | ||||||||||||||||||||||||||||||||||||||||||||||||||||||||||||||||||||||
| Bahia Vista Estates | Sarasota, FL | ( | 2016 | (A) | ||||||||||||||||||||||||||||||||||||||||||||||||||||||||||||||||||||||
Baker Acres(8) | Zephyrhills, FL | ( | (3) | ( | 2016 | (A) | ||||||||||||||||||||||||||||||||||||||||||||||||||||||||||||||||||||
Beechwood | Killingworth, CT | ( | 2019 | (A) | ||||||||||||||||||||||||||||||||||||||||||||||||||||||||||||||||||||||
Bear Lake Development Land(5) | Garden City, UT | 2022 | (C) | |||||||||||||||||||||||||||||||||||||||||||||||||||||||||||||||||||||||
| Bel Air Estates | Menifee, CA | ( | 2022 | (A) | ||||||||||||||||||||||||||||||||||||||||||||||||||||||||||||||||||||||
| Bell Crossing | Clarksville, TN | ( | 1999 | (A&C) | ||||||||||||||||||||||||||||||||||||||||||||||||||||||||||||||||||||||
Big Tree(8) | Arcadia, FL | ( | 2016 | (A) | ||||||||||||||||||||||||||||||||||||||||||||||||||||||||||||||||||||||
| Birch Hill Estates | Bangor, ME | ( | 2020 | (A) | ||||||||||||||||||||||||||||||||||||||||||||||||||||||||||||||||||||||
| Blue Heron Pines | Punta Gorda, FL | ( | 2015 | (A&C) | ||||||||||||||||||||||||||||||||||||||||||||||||||||||||||||||||||||||
Blue Jay(8) | Dade City, FL | ( | 2016 | (A) | ||||||||||||||||||||||||||||||||||||||||||||||||||||||||||||||||||||||
Blue Star(7) | Apache Junction, AZ | ( | (7) | ( | ( | 2014 | (A) | |||||||||||||||||||||||||||||||||||||||||||||||||||||||||||||||||||
| Blueberry Hill | Bushnell, FL | ( | 2012 | (A) | ||||||||||||||||||||||||||||||||||||||||||||||||||||||||||||||||||||||
Bluebonnet Lake(5) | Austin, TX | 2021 | (C) | |||||||||||||||||||||||||||||||||||||||||||||||||||||||||||||||||||||||
| Boulder Ridge | Pflugerville, TX | ( | 1998 | (C) | ||||||||||||||||||||||||||||||||||||||||||||||||||||||||||||||||||||||
| Branch Creek | Austin, TX | ( | 1995 | (A&C) | ||||||||||||||||||||||||||||||||||||||||||||||||||||||||||||||||||||||
| Brentwood Estates | Hudson, FL | ( | 2015 | (A) | ||||||||||||||||||||||||||||||||||||||||||||||||||||||||||||||||||||||
F - 71
SUN COMMUNITIES, INC.
REAL ESTATE AND ACCUMULATED DEPRECIATION, SCHEDULE III
DECEMBER 31, 2023
(amounts in millions)
| Initial Cost to Company | Costs Capitalized Subsequent to Acquisition (Improvements) | Gross Amount Carried at December 31, 2023 | ||||||||||||||||||||||||||||||||||||||||||||||||||||||||||||||||||||||||
| Property Name | Location | Encumbrances(4) | Land | Depreciable Assets | Land | Depreciable Assets | Land | Depreciable Assets | Total | Accumulated Depreciation | Date | Acquired (A) or Constructed (C) | ||||||||||||||||||||||||||||||||||||||||||||||||||||||||||||||
| Brentwood Village | Kentwood, MI | ( | (3) | ( | 1996 | (A) | ||||||||||||||||||||||||||||||||||||||||||||||||||||||||||||||||||||
| Brentwood West | Mesa, AZ | ( | 2014 | (A) | ||||||||||||||||||||||||||||||||||||||||||||||||||||||||||||||||||||||
| Broadview Estates | Davison, MI | ( | 1996 | (A&C) | ||||||||||||||||||||||||||||||||||||||||||||||||||||||||||||||||||||||
| Brook Ridge | Hooksett, NH | ( | 2019 | (A) | ||||||||||||||||||||||||||||||||||||||||||||||||||||||||||||||||||||||
| Brookside Manor | Goshen, IN | ( | 1985 | (A&C) | ||||||||||||||||||||||||||||||||||||||||||||||||||||||||||||||||||||||
| Brookside Village | Kentwood, MI | ( | 2011 | (A) | ||||||||||||||||||||||||||||||||||||||||||||||||||||||||||||||||||||||
Buena Vista | Buckeye, AZ | ( | 2019 | (A) | ||||||||||||||||||||||||||||||||||||||||||||||||||||||||||||||||||||||
Buttonwood Bay(8) | Sebring, FL | ( | 2001 | (A) | ||||||||||||||||||||||||||||||||||||||||||||||||||||||||||||||||||||||
| Byron Center | Byron Center, MI | ( | 1996 | (A) | ||||||||||||||||||||||||||||||||||||||||||||||||||||||||||||||||||||||
| Caliente Sands | Cathedral City, CA | ( | 2017 | (A) | ||||||||||||||||||||||||||||||||||||||||||||||||||||||||||||||||||||||
| Camelot Villa | Macomb, MI | ( | 2013 | (A) | ||||||||||||||||||||||||||||||||||||||||||||||||||||||||||||||||||||||
| Candlelight Manor | South Daytona, FL | ( | 2016 | (A) | ||||||||||||||||||||||||||||||||||||||||||||||||||||||||||||||||||||||
| Cape May Crossing | Cape May, NJ | ( | 2016 | (A) | ||||||||||||||||||||||||||||||||||||||||||||||||||||||||||||||||||||||
| Carriage Cove | Sanford, FL | ( | 2014 | (A) | ||||||||||||||||||||||||||||||||||||||||||||||||||||||||||||||||||||||
| Carrington Pointe | Fort Wayne, IN | ( | 1997 | (A&C) | ||||||||||||||||||||||||||||||||||||||||||||||||||||||||||||||||||||||
| Cave Creek | Evans, CO | ( | 2004 | (C) | ||||||||||||||||||||||||||||||||||||||||||||||||||||||||||||||||||||||
| Cedar Springs | Southington, CT | ( | 2019 | (A) | ||||||||||||||||||||||||||||||||||||||||||||||||||||||||||||||||||||||
Central Park(8) | Haines City, FL | ( | 2016 | (A) | ||||||||||||||||||||||||||||||||||||||||||||||||||||||||||||||||||||||
| Charlevoix Estates | Charlevoix, MI | ( | 2021 | (A) | ||||||||||||||||||||||||||||||||||||||||||||||||||||||||||||||||||||||
| Cherrywood | Clinton, NY | ( | (3) | ( | 2019 | (A) | ||||||||||||||||||||||||||||||||||||||||||||||||||||||||||||||||||||
| Chisholm Point | Pflugerville, TX | ( | 1995 | (A&C) | ||||||||||||||||||||||||||||||||||||||||||||||||||||||||||||||||||||||
| Cider Mill Crossings | Fenton, MI | ( | 2011 | (A&C) | ||||||||||||||||||||||||||||||||||||||||||||||||||||||||||||||||||||||
| Cider Mill Village | Middleville, MI | ( | 2011 | (A) | ||||||||||||||||||||||||||||||||||||||||||||||||||||||||||||||||||||||
| Cisco Grove Campground & RV | Emigrant Gap, CA | ( | (3) | ( | 2021 | (A) | ||||||||||||||||||||||||||||||||||||||||||||||||||||||||||||||||||||
Citrus Hill(8) | Dade City, FL | ( | 2016 | (A) | ||||||||||||||||||||||||||||||||||||||||||||||||||||||||||||||||||||||
| Clear Water | South Bend, IN | ( | 1986 | (A) | ||||||||||||||||||||||||||||||||||||||||||||||||||||||||||||||||||||||
| Club Wildwood | Hudson, FL | ( | 2016 | (A) | ||||||||||||||||||||||||||||||||||||||||||||||||||||||||||||||||||||||
Coastal Estates | Hampstead, NC | ( | (3) | ( | 2019 | (A) | ||||||||||||||||||||||||||||||||||||||||||||||||||||||||||||||||||||
| Cobus Green | Osceola, IN | ( | 1993 | (A) | ||||||||||||||||||||||||||||||||||||||||||||||||||||||||||||||||||||||
| Colony in the Wood | Port Orange, FL | ( | 2017 | (A&C) | ||||||||||||||||||||||||||||||||||||||||||||||||||||||||||||||||||||||
| Comal Farms | New Braunfels, TX | ( | 2000 | (A&C) | ||||||||||||||||||||||||||||||||||||||||||||||||||||||||||||||||||||||
| Country Acres | Cadillac, MI | ( | 1996 | (A) | ||||||||||||||||||||||||||||||||||||||||||||||||||||||||||||||||||||||
| Country Hills Village | Hudsonville, MI | ( | 2011 | (A) | ||||||||||||||||||||||||||||||||||||||||||||||||||||||||||||||||||||||
Country Lakes | Little River, SC | ( | 2019 | (A) | ||||||||||||||||||||||||||||||||||||||||||||||||||||||||||||||||||||||
F - 72
SUN COMMUNITIES, INC.
REAL ESTATE AND ACCUMULATED DEPRECIATION, SCHEDULE III
DECEMBER 31, 2023
(amounts in millions)
| Initial Cost to Company | Costs Capitalized Subsequent to Acquisition (Improvements) | Gross Amount Carried at December 31, 2023 | ||||||||||||||||||||||||||||||||||||||||||||||||||||||||||||||||||||||||
| Property Name | Location | Encumbrances(4) | Land | Depreciable Assets | Land | Depreciable Assets | Land | Depreciable Assets | Total | Accumulated Depreciation | Date | Acquired (A) or Constructed (C) | ||||||||||||||||||||||||||||||||||||||||||||||||||||||||||||||
| Country Meadows | Flat Rock, MI | ( | 1994 | (A&C) | ||||||||||||||||||||||||||||||||||||||||||||||||||||||||||||||||||||||
| Country Meadows Village | Caledonia, MI | ( | 2011 | (A&C) | ||||||||||||||||||||||||||||||||||||||||||||||||||||||||||||||||||||||
Country Village Estates | Oregon City, OR | ( | 2019 | (A) | ||||||||||||||||||||||||||||||||||||||||||||||||||||||||||||||||||||||
| Countryside Estates | Mckean, PA | ( | 2014 | (A) | ||||||||||||||||||||||||||||||||||||||||||||||||||||||||||||||||||||||
| Countryside Village of Atlanta | Lawrenceville, GA | ( | 2004 | (A&C) | ||||||||||||||||||||||||||||||||||||||||||||||||||||||||||||||||||||||
| Countryside Village of Gwinnett | Buford, GA | ( | 2004 | (A) | ||||||||||||||||||||||||||||||||||||||||||||||||||||||||||||||||||||||
| Countryside Village of Lake Lanier | Buford, GA | ( | 2004 | (A) | ||||||||||||||||||||||||||||||||||||||||||||||||||||||||||||||||||||||
| Coyote Ranch Resort | Wichita Falls, TX | ( | 2021 | (A) | ||||||||||||||||||||||||||||||||||||||||||||||||||||||||||||||||||||||
Creeks Crossing | Kyle, TX | ( | 2019 | (C) | ||||||||||||||||||||||||||||||||||||||||||||||||||||||||||||||||||||||
| Creek Wood | Burton, MI | ( | 1997 | (C) | ||||||||||||||||||||||||||||||||||||||||||||||||||||||||||||||||||||||
Crestwood | Concord, NH | ( | (3) | ( | 2019 | (A) | ||||||||||||||||||||||||||||||||||||||||||||||||||||||||||||||||||||
Crossroads | Aiken, SC | ( | 2019 | (A&C) | ||||||||||||||||||||||||||||||||||||||||||||||||||||||||||||||||||||||
| Cutler Estates | Grand Rapids, MI | ( | 1996 | (A) | ||||||||||||||||||||||||||||||||||||||||||||||||||||||||||||||||||||||
| Cypress Greens | Lake Alfred, FL | ( | 2015 | (A) | ||||||||||||||||||||||||||||||||||||||||||||||||||||||||||||||||||||||
Deep Run | Cream Ridge, NJ | ( | 2019 | (A) | ||||||||||||||||||||||||||||||||||||||||||||||||||||||||||||||||||||||
| Deerwood | Orlando, FL | ( | 2015 | (A) | ||||||||||||||||||||||||||||||||||||||||||||||||||||||||||||||||||||||
| Desert Harbor | Apache Junction, AZ | ( | 2014 | (A) | ||||||||||||||||||||||||||||||||||||||||||||||||||||||||||||||||||||||
| Dutton Mill Village | Caledonia, MI | ( | 2011 | (A) | ||||||||||||||||||||||||||||||||||||||||||||||||||||||||||||||||||||||
| Eagle Crest | Firestone, CO | ( | 1998 | (C) | ||||||||||||||||||||||||||||||||||||||||||||||||||||||||||||||||||||||
| East Fork Crossing | Batavia, OH | ( | 2000 | (A&C) | ||||||||||||||||||||||||||||||||||||||||||||||||||||||||||||||||||||||
| East Village Estates | Washington Twp., MI | ( | 2012 | (A) | ||||||||||||||||||||||||||||||||||||||||||||||||||||||||||||||||||||||
| Egelcraft | Muskegon, MI | ( | 2014 | (A) | ||||||||||||||||||||||||||||||||||||||||||||||||||||||||||||||||||||||
El Capitan Canyon(5) | Goleta, CA | ( | 2020 | (A) | ||||||||||||||||||||||||||||||||||||||||||||||||||||||||||||||||||||||
Ellenton Gardens(8) | Ellenton, FL | ( | 2016 | (A) | ||||||||||||||||||||||||||||||||||||||||||||||||||||||||||||||||||||||
| Fairfield Village | Ocala, FL | ( | 2015 | (A) | ||||||||||||||||||||||||||||||||||||||||||||||||||||||||||||||||||||||
Farmwood Village | Dover, NH | ( | 2019 | (A) | ||||||||||||||||||||||||||||||||||||||||||||||||||||||||||||||||||||||
| Fisherman's Cove | Flint Twp., MI | ( | 1993 | (A) | ||||||||||||||||||||||||||||||||||||||||||||||||||||||||||||||||||||||
Flamingo Lake(8) | Jacksonville, FL | ( | 2020 | (A) | ||||||||||||||||||||||||||||||||||||||||||||||||||||||||||||||||||||||
| Fond du Lac East / Kettle Moraine KOA | Glenbeulah, WI | ( | 2013 | (A) | ||||||||||||||||||||||||||||||||||||||||||||||||||||||||||||||||||||||
Forest Hill | Southington, CT | ( | 2019 | (A) | ||||||||||||||||||||||||||||||||||||||||||||||||||||||||||||||||||||||
| Forest Meadows | Philomath, OR | ( | 1999 | (A) | ||||||||||||||||||||||||||||||||||||||||||||||||||||||||||||||||||||||
| Forest Springs | Grass Valley, CA | ( | 2020 | (A) | ||||||||||||||||||||||||||||||||||||||||||||||||||||||||||||||||||||||
| Forest View | Homosassa, FL | ( | 2015 | (A) | ||||||||||||||||||||||||||||||||||||||||||||||||||||||||||||||||||||||
Fort Dupont(2)(5) | Delaware City, DE | 2021 | (C) | |||||||||||||||||||||||||||||||||||||||||||||||||||||||||||||||||||||||
F - 73
SUN COMMUNITIES, INC.
REAL ESTATE AND ACCUMULATED DEPRECIATION, SCHEDULE III
DECEMBER 31, 2023
(amounts in millions)
| Initial Cost to Company | Costs Capitalized Subsequent to Acquisition (Improvements) | Gross Amount Carried at December 31, 2023 | ||||||||||||||||||||||||||||||||||||||||||||||||||||||||||||||||||||||||
| Property Name | Location | Encumbrances(4) | Land | Depreciable Assets | Land | Depreciable Assets | Land | Depreciable Assets | Total | Accumulated Depreciation | Date | Acquired (A) or Constructed (C) | ||||||||||||||||||||||||||||||||||||||||||||||||||||||||||||||
| Four Seasons | Elkhart, IN | ( | 2000 | (A) | ||||||||||||||||||||||||||||||||||||||||||||||||||||||||||||||||||||||
| Fox Run | Boyne City, MI | ( | 2023 | (A) | ||||||||||||||||||||||||||||||||||||||||||||||||||||||||||||||||||||||
| Frenchtown Villa / Elizabeth Woods | Newport, MI | ( | 2014 | (A&C) | ||||||||||||||||||||||||||||||||||||||||||||||||||||||||||||||||||||||
| Friendly Village of La Habra | La Habra, CA | ( | 2016 | (A) | ||||||||||||||||||||||||||||||||||||||||||||||||||||||||||||||||||||||
| Friendly Village of Modesto | Modesto, CA | ( | 2016 | (A) | ||||||||||||||||||||||||||||||||||||||||||||||||||||||||||||||||||||||
| Friendly Village of Simi | Simi Valley, CA | ( | 2016 | (A) | ||||||||||||||||||||||||||||||||||||||||||||||||||||||||||||||||||||||
| Friendly Village of West Covina | West Covina, CA | ( | 2016 | (A) | ||||||||||||||||||||||||||||||||||||||||||||||||||||||||||||||||||||||
Glen Ellis Family Campground | Glen, NH | ( | 2019 | (A) | ||||||||||||||||||||||||||||||||||||||||||||||||||||||||||||||||||||||
Glen Haven(8) | Zephyrhills, FL | ( | 2016 | (A) | ||||||||||||||||||||||||||||||||||||||||||||||||||||||||||||||||||||||
| Glen Laurel | Concord, NC | ( | 2001 | (A&C) | ||||||||||||||||||||||||||||||||||||||||||||||||||||||||||||||||||||||
| Goldcoaster | Homestead, FL | ( | 1997 | (A) | ||||||||||||||||||||||||||||||||||||||||||||||||||||||||||||||||||||||
| Grand Bay | Dunedin, FL | ( | 2016 | (A) | ||||||||||||||||||||||||||||||||||||||||||||||||||||||||||||||||||||||
| Grand Village | Grand Rapids, MI | ( | 1996 | (A) | ||||||||||||||||||||||||||||||||||||||||||||||||||||||||||||||||||||||
Grove Beach | Westbrook, CT | ( | 2019 | (A) | ||||||||||||||||||||||||||||||||||||||||||||||||||||||||||||||||||||||
Grove Ridge(8) | Dade City, FL | ( | 2016 | (A) | ||||||||||||||||||||||||||||||||||||||||||||||||||||||||||||||||||||||
| Gulfstream Harbor | Orlando, FL | ( | 2015 | (A) | ||||||||||||||||||||||||||||||||||||||||||||||||||||||||||||||||||||||
Hacienda Del Rio | Edgewater, FL | ( | 2019 | (A) | ||||||||||||||||||||||||||||||||||||||||||||||||||||||||||||||||||||||
| Hamlin | Webberville, MI | ( | 1984 | (A&C) | ||||||||||||||||||||||||||||||||||||||||||||||||||||||||||||||||||||||
Hancock Heights(8) | Hancock, ME | ( | 2020 | (A) | ||||||||||||||||||||||||||||||||||||||||||||||||||||||||||||||||||||||
| Hannah Village | Lebanon, NH | ( | 2019 | (A) | ||||||||||||||||||||||||||||||||||||||||||||||||||||||||||||||||||||||
Hemlocks | Tilton, NH | ( | 2019 | (A) | ||||||||||||||||||||||||||||||||||||||||||||||||||||||||||||||||||||||
| Heritage | Temecula, CA | ( | 2016 | (A) | ||||||||||||||||||||||||||||||||||||||||||||||||||||||||||||||||||||||
| Hickory Hills Village | Battle Creek, MI | ( | 2011 | (A) | ||||||||||||||||||||||||||||||||||||||||||||||||||||||||||||||||||||||
Hidden River(8) | Riverview, FL | ( | 2016 | (A) | ||||||||||||||||||||||||||||||||||||||||||||||||||||||||||||||||||||||
| High Point Park | Frederica, DE | ( | 1997 | (A) | ||||||||||||||||||||||||||||||||||||||||||||||||||||||||||||||||||||||
| Highland Greens Estates | Highland, MI | ( | 2020 | (A) | ||||||||||||||||||||||||||||||||||||||||||||||||||||||||||||||||||||||
Hillcrest | Uncasville, CT | ( | 2019 | (A) | ||||||||||||||||||||||||||||||||||||||||||||||||||||||||||||||||||||||
| Holiday Park Estates | Bangor, ME | ( | 2020 | (A) | ||||||||||||||||||||||||||||||||||||||||||||||||||||||||||||||||||||||
| Holiday West Village | Holland, MI | ( | 2011 | (A) | ||||||||||||||||||||||||||||||||||||||||||||||||||||||||||||||||||||||
| Holly Forest | Holly Hill, FL | ( | 1997 | (A) | ||||||||||||||||||||||||||||||||||||||||||||||||||||||||||||||||||||||
| Holly Village / Hawaiian Gardens | Holly, MI | ( | 2004 | (A) | ||||||||||||||||||||||||||||||||||||||||||||||||||||||||||||||||||||||
| Horseshoe Cove RV Resort | Bradenton, FL | ( | 2016 | (A) | ||||||||||||||||||||||||||||||||||||||||||||||||||||||||||||||||||||||
| Hospitality Creek Campground | Williamstown, NJ | ( | 2021 | (A) | ||||||||||||||||||||||||||||||||||||||||||||||||||||||||||||||||||||||
| Hunters Crossing | Capac, MI | ( | 2012 | (A) | ||||||||||||||||||||||||||||||||||||||||||||||||||||||||||||||||||||||
F - 74
SUN COMMUNITIES, INC.
REAL ESTATE AND ACCUMULATED DEPRECIATION, SCHEDULE III
DECEMBER 31, 2023
(amounts in millions)
| Initial Cost to Company | Costs Capitalized Subsequent to Acquisition (Improvements) | Gross Amount Carried at December 31, 2023 | ||||||||||||||||||||||||||||||||||||||||||||||||||||||||||||||||||||||||
| Property Name | Location | Encumbrances(4) | Land | Depreciable Assets | Land | Depreciable Assets | Land | Depreciable Assets | Total | Accumulated Depreciation | Date | Acquired (A) or Constructed (C) | ||||||||||||||||||||||||||||||||||||||||||||||||||||||||||||||
| Hunters Glen | Wayland, MI | ( | 2004 | (C) | ||||||||||||||||||||||||||||||||||||||||||||||||||||||||||||||||||||||
| Huntington Run | Kalamazoo, MI | ( | 2021 | (A) | ||||||||||||||||||||||||||||||||||||||||||||||||||||||||||||||||||||||
Hyde Park | Easton, MD | ( | 2019 | (A) | ||||||||||||||||||||||||||||||||||||||||||||||||||||||||||||||||||||||
Indian Creek RV Resort(8)(9) | Ft. Myers Beach, FL | ( | (9) | ( | 1996 | (A) | ||||||||||||||||||||||||||||||||||||||||||||||||||||||||||||||||||||
Indian Wells(8) | Indio, CA | ( | 2016 | (A) | ||||||||||||||||||||||||||||||||||||||||||||||||||||||||||||||||||||||
| Island Lakes | Merritt Island, FL | ( | 1995 | (A) | ||||||||||||||||||||||||||||||||||||||||||||||||||||||||||||||||||||||
| Jellystone Park™ Androscoggin Lake | North Monmouth, ME | ( | 2021 | (A) | ||||||||||||||||||||||||||||||||||||||||||||||||||||||||||||||||||||||
| Jellystone Park™ at Barton Lake | Fremont, IN | ( | 2020 | (A) | ||||||||||||||||||||||||||||||||||||||||||||||||||||||||||||||||||||||
Jellystone Park™ at Birchwood Acres(8) | Greenfield Park, NY | ( | 2013 | (A) | ||||||||||||||||||||||||||||||||||||||||||||||||||||||||||||||||||||||
| Jellystone Park™ of Chicago | Millbrook, IL | ( | 2021 | (A) | ||||||||||||||||||||||||||||||||||||||||||||||||||||||||||||||||||||||
Jellystone Park™ Chincoteague Island | Chincoteague, VA | ( | 2019 | (A) | ||||||||||||||||||||||||||||||||||||||||||||||||||||||||||||||||||||||
Jellystone Park™ at Delaware Beaches(2)(8) | Delaware City, DE | ( | ( | 2022 | (A) | |||||||||||||||||||||||||||||||||||||||||||||||||||||||||||||||||||||
| Jellystone Park™ at Gardiner | Gardiner, NY | ( | 2018 | (A) | ||||||||||||||||||||||||||||||||||||||||||||||||||||||||||||||||||||||
| Jellystone Park™ at Golden Valley | Bostic, NC | ( | 2018 | (A&C) | ||||||||||||||||||||||||||||||||||||||||||||||||||||||||||||||||||||||
| Jellystone Park™ at Guadalupe River | Kerrville, TX | ( | 2018 | (A) | ||||||||||||||||||||||||||||||||||||||||||||||||||||||||||||||||||||||
| Jellystone Park™ at Hill Country | Canyon Lake, TX | ( | 2018 | (A) | ||||||||||||||||||||||||||||||||||||||||||||||||||||||||||||||||||||||
| Jellystone Park™ at Larkspur | Larkspur, CO | ( | 2016 | (A&C) | ||||||||||||||||||||||||||||||||||||||||||||||||||||||||||||||||||||||
| Jellystone Park™ at Luray | East Luray, VA | ( | 2018 | (A) | ||||||||||||||||||||||||||||||||||||||||||||||||||||||||||||||||||||||
| Jellystone Park™ at Mammoth Cave | Cave City, KY | ( | 2021 | (A) | ||||||||||||||||||||||||||||||||||||||||||||||||||||||||||||||||||||||
| Jellystone Park™ at Maryland | Williamsport, MD | ( | 2018 | (A) | ||||||||||||||||||||||||||||||||||||||||||||||||||||||||||||||||||||||
| Jellystone Park™ at Memphis | Horn Lake, MS | ( | 2018 | (A) | ||||||||||||||||||||||||||||||||||||||||||||||||||||||||||||||||||||||
| Jellystone Park™ at Natural Bridge | Natural Bridge Station, VA | ( | 2020 | (A) | ||||||||||||||||||||||||||||||||||||||||||||||||||||||||||||||||||||||
| Jellystone Park™ Petoskey | Petoskey, MI | ( | 2018 | (A) | ||||||||||||||||||||||||||||||||||||||||||||||||||||||||||||||||||||||
| Jellystone Park™ at Quarryville | Quarryville, PA | ( | 2018 | (A) | ||||||||||||||||||||||||||||||||||||||||||||||||||||||||||||||||||||||
Jellystone Park™ at Tower Park(2) | Lodi, CA | ( | 2018 | (A) | ||||||||||||||||||||||||||||||||||||||||||||||||||||||||||||||||||||||
| Jellystone Park™ of Western New York | North Java, NY | ( | 2013 | (A) | ||||||||||||||||||||||||||||||||||||||||||||||||||||||||||||||||||||||
Jetstream NASA(8) | Houston, TX | ( | 2021 | (A) | ||||||||||||||||||||||||||||||||||||||||||||||||||||||||||||||||||||||
| Kensington Meadows | Lansing, MI | ( | 1995 | (A&C) | ||||||||||||||||||||||||||||||||||||||||||||||||||||||||||||||||||||||
| Kimberly Estates | Newport, MI | ( | 2016 | (A) | ||||||||||||||||||||||||||||||||||||||||||||||||||||||||||||||||||||||
| King's Court | Traverse City, MI | ( | 1996 | (A&C) | ||||||||||||||||||||||||||||||||||||||||||||||||||||||||||||||||||||||
| King's Lake | DeBary, FL | ( | 1994 | (A) | ||||||||||||||||||||||||||||||||||||||||||||||||||||||||||||||||||||||
| Kings Manor | Lakeland, FL | ( | 2016 | (A) | ||||||||||||||||||||||||||||||||||||||||||||||||||||||||||||||||||||||
| Kings Pointe | Lake Alfred, FL | ( | 2015 | (A) | ||||||||||||||||||||||||||||||||||||||||||||||||||||||||||||||||||||||
F - 75
SUN COMMUNITIES, INC.
REAL ESTATE AND ACCUMULATED DEPRECIATION, SCHEDULE III
DECEMBER 31, 2023
(amounts in millions)
| Initial Cost to Company | Costs Capitalized Subsequent to Acquisition (Improvements) | Gross Amount Carried at December 31, 2023 | ||||||||||||||||||||||||||||||||||||||||||||||||||||||||||||||||||||||||
| Property Name | Location | Encumbrances(4) | Land | Depreciable Assets | Land | Depreciable Assets | Land | Depreciable Assets | Total | Accumulated Depreciation | Date | Acquired (A) or Constructed (C) | ||||||||||||||||||||||||||||||||||||||||||||||||||||||||||||||
| Kissimmee Gardens | Kissimmee, FL | ( | 2016 | (A) | ||||||||||||||||||||||||||||||||||||||||||||||||||||||||||||||||||||||
Kissimmee South(8) | Davenport, FL | ( | 2016 | (A) | ||||||||||||||||||||||||||||||||||||||||||||||||||||||||||||||||||||||
| Kittatinny Campground & RV Resort | Barryville, NY | ( | 2020 | (A) | ||||||||||||||||||||||||||||||||||||||||||||||||||||||||||||||||||||||
| Knollwood Estates | Allendale, MI | ( | 2001 | (A) | ||||||||||||||||||||||||||||||||||||||||||||||||||||||||||||||||||||||
| La Casa Blanca | Apache Junction, AZ | ( | 2014 | (A) | ||||||||||||||||||||||||||||||||||||||||||||||||||||||||||||||||||||||
| La Costa Village | Port Orange, FL | ( | 2015 | (A) | ||||||||||||||||||||||||||||||||||||||||||||||||||||||||||||||||||||||
| Lafayette Place | Warren, MI | ( | 1998 | (A) | ||||||||||||||||||||||||||||||||||||||||||||||||||||||||||||||||||||||
| Lake Juliana Landings | Auburndale, FL | ( | 1994 | (A) | ||||||||||||||||||||||||||||||||||||||||||||||||||||||||||||||||||||||
| Lake Pointe Village | Mulberry, FL | ( | 2015 | (A) | ||||||||||||||||||||||||||||||||||||||||||||||||||||||||||||||||||||||
| Lake San Marino RV Park | Naples, FL | ( | 1996 | (A) | ||||||||||||||||||||||||||||||||||||||||||||||||||||||||||||||||||||||
| Lakefront | Lakeside, CA | ( | 2016 | (A) | ||||||||||||||||||||||||||||||||||||||||||||||||||||||||||||||||||||||
Lakeland(8) | Lakeland, FL | ( | 2016 | (A) | ||||||||||||||||||||||||||||||||||||||||||||||||||||||||||||||||||||||
| Lakeshore Landings | Orlando, FL | ( | 2014 | (A) | ||||||||||||||||||||||||||||||||||||||||||||||||||||||||||||||||||||||
| Lakeshore Villas | Tampa, FL | ( | 2015 | (A) | ||||||||||||||||||||||||||||||||||||||||||||||||||||||||||||||||||||||
Lakeside | Terryville, CT | ( | 2019 | (A) | ||||||||||||||||||||||||||||||||||||||||||||||||||||||||||||||||||||||
| Lakeside Crossing | Conway, SC | ( | 2015 | (A&C) | ||||||||||||||||||||||||||||||||||||||||||||||||||||||||||||||||||||||
| Lakeview | Ypsilanti, MI | ( | 2004 | (A) | ||||||||||||||||||||||||||||||||||||||||||||||||||||||||||||||||||||||
Lakeview CT | Danbury, CT | ( | 2019 | (A) | ||||||||||||||||||||||||||||||||||||||||||||||||||||||||||||||||||||||
Lakeview Estates(8) | Yucaipa, CA | ( | 2020 | (A) | ||||||||||||||||||||||||||||||||||||||||||||||||||||||||||||||||||||||
| Lamplighter | Port Orange, FL | ( | 2015 | (A) | ||||||||||||||||||||||||||||||||||||||||||||||||||||||||||||||||||||||
Lantana Ranch(5)(8) | Brookshire, TX | 2022 | (A) | |||||||||||||||||||||||||||||||||||||||||||||||||||||||||||||||||||||||
Laurel Heights | Uncasville, CT | ( | 2019 | (A) | ||||||||||||||||||||||||||||||||||||||||||||||||||||||||||||||||||||||
| Lazy J Ranch | Arcata, CA | ( | 2017 | (A) | ||||||||||||||||||||||||||||||||||||||||||||||||||||||||||||||||||||||
Leaf Verde(8) | Buckeye, AZ | ( | 2018 | (A) | ||||||||||||||||||||||||||||||||||||||||||||||||||||||||||||||||||||||
| Leisure Village | Belmont, MI | ( | 2011 | (A) | ||||||||||||||||||||||||||||||||||||||||||||||||||||||||||||||||||||||
| Lemon Wood | Ventura, CA | ( | 2016 | (A) | ||||||||||||||||||||||||||||||||||||||||||||||||||||||||||||||||||||||
| Liberty Farm | Valparaiso, IN | ( | 1985 | (A&C) | ||||||||||||||||||||||||||||||||||||||||||||||||||||||||||||||||||||||
| Lincoln Estates | Holland, MI | ( | 1996 | (A) | ||||||||||||||||||||||||||||||||||||||||||||||||||||||||||||||||||||||
| Lone Star Jellystone Park | Waller, TX | ( | 2020 | (A) | ||||||||||||||||||||||||||||||||||||||||||||||||||||||||||||||||||||||
| Lost Dutchman | Apache Junction, AZ | ( | 2014 | (A) | ||||||||||||||||||||||||||||||||||||||||||||||||||||||||||||||||||||||
Majestic Oaks(8) | Zephyrhills, FL | ( | 2016 | (A) | ||||||||||||||||||||||||||||||||||||||||||||||||||||||||||||||||||||||
| Maple Brook | Matteson, IL | ( | 2014 | (A) | ||||||||||||||||||||||||||||||||||||||||||||||||||||||||||||||||||||||
| Maplewood Manor | Brunswick, ME | ( | 2014 | (A) | ||||||||||||||||||||||||||||||||||||||||||||||||||||||||||||||||||||||
Marco Naples(8) | Naples, FL | ( | 2016 | (A) | ||||||||||||||||||||||||||||||||||||||||||||||||||||||||||||||||||||||
F - 76
SUN COMMUNITIES, INC.
REAL ESTATE AND ACCUMULATED DEPRECIATION, SCHEDULE III
DECEMBER 31, 2023
(amounts in millions)
| Initial Cost to Company | Costs Capitalized Subsequent to Acquisition (Improvements) | Gross Amount Carried at December 31, 2023 | ||||||||||||||||||||||||||||||||||||||||||||||||||||||||||||||||||||||||
| Property Name | Location | Encumbrances(4) | Land | Depreciable Assets | Land | Depreciable Assets | Land | Depreciable Assets | Total | Accumulated Depreciation | Date | Acquired (A) or Constructed (C) | ||||||||||||||||||||||||||||||||||||||||||||||||||||||||||||||
| Marina Cove | Uncasville, CT | ( | 2019 | (A) | ||||||||||||||||||||||||||||||||||||||||||||||||||||||||||||||||||||||
Meadow Lake(8) | White Lake, MI | ( | 1994 | (A) | ||||||||||||||||||||||||||||||||||||||||||||||||||||||||||||||||||||||
| Meadowbrook | Charlotte, NC | ( | 2000 | (A&C) | ||||||||||||||||||||||||||||||||||||||||||||||||||||||||||||||||||||||
| Meadowbrook Estates | Monroe, MI | ( | 1986 | (A) | ||||||||||||||||||||||||||||||||||||||||||||||||||||||||||||||||||||||
| Meadowbrook Village | Tampa, FL | ( | 1994 | (A) | ||||||||||||||||||||||||||||||||||||||||||||||||||||||||||||||||||||||
Meadowlands(8) | Gibraltar, MI | ( | 2015 | (A) | ||||||||||||||||||||||||||||||||||||||||||||||||||||||||||||||||||||||
| Meadowstone | Hastings, MI | ( | 2021 | (A) | ||||||||||||||||||||||||||||||||||||||||||||||||||||||||||||||||||||||
Menifee Development(5) | Menifee, CA | 2020 | (C) | |||||||||||||||||||||||||||||||||||||||||||||||||||||||||||||||||||||||
| Merrymeeting | Brunswick, ME | ( | 2014 | (A) | ||||||||||||||||||||||||||||||||||||||||||||||||||||||||||||||||||||||
Mill Creek(8) | Kissimmee, FL | ( | 2016 | (A) | ||||||||||||||||||||||||||||||||||||||||||||||||||||||||||||||||||||||
Millwood | Uncasville, CT | ( | 2019 | (A&C) | ||||||||||||||||||||||||||||||||||||||||||||||||||||||||||||||||||||||
Moreno 66 Development(5) | Moreno Valley, CA | 2021 | (C) | |||||||||||||||||||||||||||||||||||||||||||||||||||||||||||||||||||||||
| Mountain View | Mesa, AZ | ( | 2014 | (A) | ||||||||||||||||||||||||||||||||||||||||||||||||||||||||||||||||||||||
| Napa Valley | Napa, CA | ( | 2016 | (A) | ||||||||||||||||||||||||||||||||||||||||||||||||||||||||||||||||||||||
New England Village | Westbrook, CT | ( | 2019 | (A) | ||||||||||||||||||||||||||||||||||||||||||||||||||||||||||||||||||||||
North Lake(8) | Moore Haven, FL | ( | 2011 | (A) | ||||||||||||||||||||||||||||||||||||||||||||||||||||||||||||||||||||||
| North Point Estates | Pueblo, CO | ( | 2001 | (C) | ||||||||||||||||||||||||||||||||||||||||||||||||||||||||||||||||||||||
| Northville Crossing | Northville, MI | ( | 2012 | (A) | ||||||||||||||||||||||||||||||||||||||||||||||||||||||||||||||||||||||
| Norway Commons | Norway, ME | ( | 2022 | (A) | ||||||||||||||||||||||||||||||||||||||||||||||||||||||||||||||||||||||
| Oak Creek | Coarsegold, CA | ( | 2014 | (A) | ||||||||||||||||||||||||||||||||||||||||||||||||||||||||||||||||||||||
| Oak Crest | Austin, TX | ( | 2002 | (C) | ||||||||||||||||||||||||||||||||||||||||||||||||||||||||||||||||||||||
Oak Grove | Plainville, CT | ( | 2019 | (A) | ||||||||||||||||||||||||||||||||||||||||||||||||||||||||||||||||||||||
| Oak Island Village | East Lansing, MI | ( | 2011 | (A) | ||||||||||||||||||||||||||||||||||||||||||||||||||||||||||||||||||||||
| Oak Ridge | Manteno, IL | ( | 2014 | (A) | ||||||||||||||||||||||||||||||||||||||||||||||||||||||||||||||||||||||
| Oakview Estates | Arcadia, FL | ( | 2016 | (A) | ||||||||||||||||||||||||||||||||||||||||||||||||||||||||||||||||||||||
| Oakwood Village | Miamisburg, OH | ( | 1998 | (A&C) | ||||||||||||||||||||||||||||||||||||||||||||||||||||||||||||||||||||||
Ocean Breeze Resort(8) | Jensen Beach, FL | ( | 2016 | (A&C) | ||||||||||||||||||||||||||||||||||||||||||||||||||||||||||||||||||||||
Ocean Breeze(6)(8) | Marathon, FL | ( | 2016 | (A) | ||||||||||||||||||||||||||||||||||||||||||||||||||||||||||||||||||||||
| Ocean Pines | Garden City, SC | ( | 2019 | (A) | ||||||||||||||||||||||||||||||||||||||||||||||||||||||||||||||||||||||
| Ocean View | Jensen Beach, FL | ( | 2020 | (A) | ||||||||||||||||||||||||||||||||||||||||||||||||||||||||||||||||||||||
| Ocean West | McKinleyville, CA | ( | 2017 | (A) | ||||||||||||||||||||||||||||||||||||||||||||||||||||||||||||||||||||||
Orange City(8) | Orange City, FL | ( | 2011 | (A) | ||||||||||||||||||||||||||||||||||||||||||||||||||||||||||||||||||||||
| Orange Tree Village | Orange City, FL | ( | 1994 | (A) | ||||||||||||||||||||||||||||||||||||||||||||||||||||||||||||||||||||||
| Orchard Lake | Milford, OH | ( | 1999 | (A) | ||||||||||||||||||||||||||||||||||||||||||||||||||||||||||||||||||||||
F - 77
SUN COMMUNITIES, INC.
REAL ESTATE AND ACCUMULATED DEPRECIATION, SCHEDULE III
DECEMBER 31, 2023
(amounts in millions)
| Initial Cost to Company | Costs Capitalized Subsequent to Acquisition (Improvements) | Gross Amount Carried at December 31, 2023 | ||||||||||||||||||||||||||||||||||||||||||||||||||||||||||||||||||||||||
| Property Name | Location | Encumbrances(4) | Land | Depreciable Assets | Land | Depreciable Assets | Land | Depreciable Assets | Total | Accumulated Depreciation | Date | Acquired (A) or Constructed (C) | ||||||||||||||||||||||||||||||||||||||||||||||||||||||||||||||
| Paddock Park South | Ocala, FL | ( | 2016 | (A) | ||||||||||||||||||||||||||||||||||||||||||||||||||||||||||||||||||||||
Palm Creek Resort & Residences(8) | Casa Grande, AZ | ( | 2012 | (A&C) | ||||||||||||||||||||||||||||||||||||||||||||||||||||||||||||||||||||||
| Palm Key Village | Davenport, FL | ( | 2015 | (A) | ||||||||||||||||||||||||||||||||||||||||||||||||||||||||||||||||||||||
| Palm Village | Bradenton, FL | ( | 2016 | (A) | ||||||||||||||||||||||||||||||||||||||||||||||||||||||||||||||||||||||
Palos Verdes Shores MH & Golf Community(2) | San Pedro, CA | ( | 2016 | (A) | ||||||||||||||||||||||||||||||||||||||||||||||||||||||||||||||||||||||
| Park Place | Sebastian, FL | ( | 2015 | (A) | ||||||||||||||||||||||||||||||||||||||||||||||||||||||||||||||||||||||
| Park Royale | Pinellas Park, FL | ( | 2015 | (A) | ||||||||||||||||||||||||||||||||||||||||||||||||||||||||||||||||||||||
| Parkside Village | Cheektowaga, NY | ( | 2014 | (A) | ||||||||||||||||||||||||||||||||||||||||||||||||||||||||||||||||||||||
Pearwood(8) | Pearland, TX | ( | ( | 2021 | (A) | |||||||||||||||||||||||||||||||||||||||||||||||||||||||||||||||||||||
| Pebble Creek | Greenwood, IN | ( | 2000 | (A&C) | ||||||||||||||||||||||||||||||||||||||||||||||||||||||||||||||||||||||
| Pecan Branch | Georgetown, TX | ( | 1999 | (C) | ||||||||||||||||||||||||||||||||||||||||||||||||||||||||||||||||||||||
Pecan Park(8) | Jacksonville, FL | ( | 2016 | (A&C) | ||||||||||||||||||||||||||||||||||||||||||||||||||||||||||||||||||||||
| Pelican Bay | Micco, FL | ( | 2015 | (A) | ||||||||||||||||||||||||||||||||||||||||||||||||||||||||||||||||||||||
| Pembroke Downs | Chino, CA | ( | 2016 | (A) | ||||||||||||||||||||||||||||||||||||||||||||||||||||||||||||||||||||||
| Pheasant Ridge | Lancaster, PA | ( | 2002 | (A) | ||||||||||||||||||||||||||||||||||||||||||||||||||||||||||||||||||||||
| Pine Acre Trails | Conroe, TX | ( | 2022 | (A) | ||||||||||||||||||||||||||||||||||||||||||||||||||||||||||||||||||||||
| Pine Hills | Middlebury, IN | ( | 1980 | (A) | ||||||||||||||||||||||||||||||||||||||||||||||||||||||||||||||||||||||
| Pine Ridge | Prince George, VA | ( | 1986 | (A&C) | ||||||||||||||||||||||||||||||||||||||||||||||||||||||||||||||||||||||
| Pine Trace | Houston, TX | ( | (3) | ( | 2004 | (A&C) | ||||||||||||||||||||||||||||||||||||||||||||||||||||||||||||||||||||
| Pinebrook Village | Kentwood, MI | ( | 2011 | (A) | ||||||||||||||||||||||||||||||||||||||||||||||||||||||||||||||||||||||
| Pineview Estates | Flint, MI | ( | 2021 | (A) | ||||||||||||||||||||||||||||||||||||||||||||||||||||||||||||||||||||||
Pismo Dunes Resort(8) | Pismo Beach, CA | ( | 2017 | (A) | ||||||||||||||||||||||||||||||||||||||||||||||||||||||||||||||||||||||
| Pleasant Beach Campground | Sherkston, ON | ( | (1) | 2021 | (A) | |||||||||||||||||||||||||||||||||||||||||||||||||||||||||||||||||||||
| Pleasant Lake RV Resort | Bradenton, FL | ( | 2016 | (A) | ||||||||||||||||||||||||||||||||||||||||||||||||||||||||||||||||||||||
| Presidential Estates | Hudsonville, MI | ( | 1996 | (A) | ||||||||||||||||||||||||||||||||||||||||||||||||||||||||||||||||||||||
Rainbow(8) | Frostproof, FL | ( | 2012 | (A) | ||||||||||||||||||||||||||||||||||||||||||||||||||||||||||||||||||||||
Rainbow Village Largo(8) | Largo, FL | ( | 2016 | (A) | ||||||||||||||||||||||||||||||||||||||||||||||||||||||||||||||||||||||
Rainbow Village Zephyrhills(8) | Zephyrhills, FL | ( | 2016 | (A) | ||||||||||||||||||||||||||||||||||||||||||||||||||||||||||||||||||||||
Rancho Alipaz(2) | San Juan Capistrano, CA | ( | 2016 | (A) | ||||||||||||||||||||||||||||||||||||||||||||||||||||||||||||||||||||||
| Rancho Caballero | Riverside, CA | ( | 2016 | (A) | ||||||||||||||||||||||||||||||||||||||||||||||||||||||||||||||||||||||
| Rancho Mirage | Apache Junction, AZ | ( | 2014 | (A) | ||||||||||||||||||||||||||||||||||||||||||||||||||||||||||||||||||||||
Red Oaks(2)(8) | Bushnell, FL | ( | 2016 | (A) | ||||||||||||||||||||||||||||||||||||||||||||||||||||||||||||||||||||||
| Regency Heights | Clearwater, FL | ( | 2016 | (A) | ||||||||||||||||||||||||||||||||||||||||||||||||||||||||||||||||||||||
F - 78
SUN COMMUNITIES, INC.
REAL ESTATE AND ACCUMULATED DEPRECIATION, SCHEDULE III
DECEMBER 31, 2023
(amounts in millions)
| Initial Cost to Company | Costs Capitalized Subsequent to Acquisition (Improvements) | Gross Amount Carried at December 31, 2023 | ||||||||||||||||||||||||||||||||||||||||||||||||||||||||||||||||||||||||
| Property Name | Location | Encumbrances(4) | Land | Depreciable Assets | Land | Depreciable Assets | Land | Depreciable Assets | Total | Accumulated Depreciation | Date | Acquired (A) or Constructed (C) | ||||||||||||||||||||||||||||||||||||||||||||||||||||||||||||||
| Reserve at Fox Creek | Bullhead City, AZ | ( | 2014 | (A) | ||||||||||||||||||||||||||||||||||||||||||||||||||||||||||||||||||||||
| Richmond Place | Richmond, MI | ( | 1998 | (A) | ||||||||||||||||||||||||||||||||||||||||||||||||||||||||||||||||||||||
| River Beach Campsites & RV | Milford, PA | ( | 2020 | (A) | ||||||||||||||||||||||||||||||||||||||||||||||||||||||||||||||||||||||
River Haven(8) | Grand Haven, MI | ( | 2001 | (A) | ||||||||||||||||||||||||||||||||||||||||||||||||||||||||||||||||||||||
River Pines | Nashua, NH | ( | 2019 | (A) | ||||||||||||||||||||||||||||||||||||||||||||||||||||||||||||||||||||||
| River Ranch | Austin, TX | ( | 2000 | (A&C) | ||||||||||||||||||||||||||||||||||||||||||||||||||||||||||||||||||||||
| River Ridge | Saline, MI | ( | 2021 | (A) | ||||||||||||||||||||||||||||||||||||||||||||||||||||||||||||||||||||||
| River Ridge Estates | Austin, TX | ( | 2002 | (C) | ||||||||||||||||||||||||||||||||||||||||||||||||||||||||||||||||||||||
| Riverside Club | Ruskin, FL | ( | 2015 | (A) | ||||||||||||||||||||||||||||||||||||||||||||||||||||||||||||||||||||||
| Riverside Drive Park | Augusta, ME | ( | 2020 | (A) | ||||||||||||||||||||||||||||||||||||||||||||||||||||||||||||||||||||||
Rolling Hills | Storrs, CT | ( | 2019 | (A) | ||||||||||||||||||||||||||||||||||||||||||||||||||||||||||||||||||||||
| Roxbury Park | Goshen, IN | ( | 2001 | (A) | ||||||||||||||||||||||||||||||||||||||||||||||||||||||||||||||||||||||
| Royal Country | Miami, FL | ( | 1994 | (A) | ||||||||||||||||||||||||||||||||||||||||||||||||||||||||||||||||||||||
| Royal Palm Village | Haines City, FL | ( | 2015 | (A) | ||||||||||||||||||||||||||||||||||||||||||||||||||||||||||||||||||||||
Royal Palms(2)(8) | Cathedral City, CA | ( | 2016 | (A) | ||||||||||||||||||||||||||||||||||||||||||||||||||||||||||||||||||||||
| Rudgate Clinton | Clinton Township, MI | ( | 2012 | (A) | ||||||||||||||||||||||||||||||||||||||||||||||||||||||||||||||||||||||
| Rudgate Manor | Sterling Heights, MI | ( | 2012 | (A) | ||||||||||||||||||||||||||||||||||||||||||||||||||||||||||||||||||||||
| Saddle Oak Club | Ocala, FL | ( | 1995 | (A) | ||||||||||||||||||||||||||||||||||||||||||||||||||||||||||||||||||||||
| Saddlebrook | San Marcos, TX | ( | 2002 | (C) | ||||||||||||||||||||||||||||||||||||||||||||||||||||||||||||||||||||||
Sandy Lake(8) | Carrollton, TX | ( | 2016 | (A) | ||||||||||||||||||||||||||||||||||||||||||||||||||||||||||||||||||||||
| Saralake Estates | Sarasota, FL | ( | 2016 | (A) | ||||||||||||||||||||||||||||||||||||||||||||||||||||||||||||||||||||||
| Savanna Club | Port St. Lucie, FL | ( | 2015 | (A&C) | ||||||||||||||||||||||||||||||||||||||||||||||||||||||||||||||||||||||
| Scio Farms | Ann Arbor, MI | ( | 1995 | (A&C) | ||||||||||||||||||||||||||||||||||||||||||||||||||||||||||||||||||||||
| Sea Air Village | Rehoboth Beach, DE | ( | 1997 | (A) | ||||||||||||||||||||||||||||||||||||||||||||||||||||||||||||||||||||||
| Serendipity | North Fort Myers, FL | ( | (3) | ( | 2015 | (A) | ||||||||||||||||||||||||||||||||||||||||||||||||||||||||||||||||||||
Settler's Rest(8) | Zephyrhills, FL | ( | 2016 | (A) | ||||||||||||||||||||||||||||||||||||||||||||||||||||||||||||||||||||||
| Shadow Wood Village | Hudson, FL | ( | 2016 | (A) | ||||||||||||||||||||||||||||||||||||||||||||||||||||||||||||||||||||||
Shady Pines(8) | Galloway Township, NJ | ( | 2016 | (A) | ||||||||||||||||||||||||||||||||||||||||||||||||||||||||||||||||||||||
| Shady Road Villas | Ocala, FL | ( | 2016 | (A) | ||||||||||||||||||||||||||||||||||||||||||||||||||||||||||||||||||||||
| Sheffield Estates | Auburn Hills, MI | ( | 2006 | (A) | ||||||||||||||||||||||||||||||||||||||||||||||||||||||||||||||||||||||
Shelby Forest | Shelby Twp., MI | ( | 2019 | (A) | ||||||||||||||||||||||||||||||||||||||||||||||||||||||||||||||||||||||
Shelby West | Shelby Twp., MI | ( | 2019 | (A) | ||||||||||||||||||||||||||||||||||||||||||||||||||||||||||||||||||||||
Shell Creek(8) | Punta Gorda, FL | ( | 2016 | (A) | ||||||||||||||||||||||||||||||||||||||||||||||||||||||||||||||||||||||
Siesta Bay(8)(9) | Ft. Myers, FL | ( | (9) | ( | 1996 | (A) | ||||||||||||||||||||||||||||||||||||||||||||||||||||||||||||||||||||
F - 79
SUN COMMUNITIES, INC.
REAL ESTATE AND ACCUMULATED DEPRECIATION, SCHEDULE III
DECEMBER 31, 2023
(amounts in millions)
| Initial Cost to Company | Costs Capitalized Subsequent to Acquisition (Improvements) | Gross Amount Carried at December 31, 2023 | ||||||||||||||||||||||||||||||||||||||||||||||||||||||||||||||||||||||||
| Property Name | Location | Encumbrances(4) | Land | Depreciable Assets | Land | Depreciable Assets | Land | Depreciable Assets | Total | Accumulated Depreciation | Date | Acquired (A) or Constructed (C) | ||||||||||||||||||||||||||||||||||||||||||||||||||||||||||||||
| Silver Springs | Clinton Township, MI | ( | 2012 | (A) | ||||||||||||||||||||||||||||||||||||||||||||||||||||||||||||||||||||||
| Sky Harbor | Cheektowaga, NY | ( | 2014 | (A) | ||||||||||||||||||||||||||||||||||||||||||||||||||||||||||||||||||||||
| Skyline | Fort Collins, CO | ( | 2014 | (A) | ||||||||||||||||||||||||||||||||||||||||||||||||||||||||||||||||||||||
| Smith Creek Crossing | Granby, CO | ( | 2018 | (C) | ||||||||||||||||||||||||||||||||||||||||||||||||||||||||||||||||||||||
Southern Charm(8) | Zephyrhills, FL | ( | 2016 | (A) | ||||||||||||||||||||||||||||||||||||||||||||||||||||||||||||||||||||||
| Southern Hills / Northridge Place | Stewartville, MN | ( | 2014 | (A&C) | ||||||||||||||||||||||||||||||||||||||||||||||||||||||||||||||||||||||
| Southern Leisure RV Resort | Chiefland, FL | ( | 2021 | (A) | ||||||||||||||||||||||||||||||||||||||||||||||||||||||||||||||||||||||
Southern Palms | Ladson, SC | ( | 2019 | (A) | ||||||||||||||||||||||||||||||||||||||||||||||||||||||||||||||||||||||
| Southport Springs Golf & Country Club | Zephyrhills, FL | ( | 2015 | (A&C) | ||||||||||||||||||||||||||||||||||||||||||||||||||||||||||||||||||||||
Southside Landing | Cambridge, MD | ( | 2019 | (A) | ||||||||||||||||||||||||||||||||||||||||||||||||||||||||||||||||||||||
| Southwood Village | Grand Rapids, MI | ( | 2011 | (A) | ||||||||||||||||||||||||||||||||||||||||||||||||||||||||||||||||||||||
Spanish Main(8) | Thonotosassa, FL | ( | 2016 | (A) | ||||||||||||||||||||||||||||||||||||||||||||||||||||||||||||||||||||||
| Spanish Trails West | Casa Grande, AZ | ( | 2022 | (A) | ||||||||||||||||||||||||||||||||||||||||||||||||||||||||||||||||||||||
| St. Clair Place | St. Clair, MI | ( | 1998 | (A) | ||||||||||||||||||||||||||||||||||||||||||||||||||||||||||||||||||||||
Stonebridge (MI)(5) | Richfield Twp., MI | ( | 1998 | (C) | ||||||||||||||||||||||||||||||||||||||||||||||||||||||||||||||||||||||
Stonebridge(8) | San Antonio, TX | ( | (3) | ( | 2000 | (A&C) | ||||||||||||||||||||||||||||||||||||||||||||||||||||||||||||||||||||
| Stonebrook | Homosassa, FL | ( | 2015 | (A) | ||||||||||||||||||||||||||||||||||||||||||||||||||||||||||||||||||||||
Stoneridge Villas(5) | Gardnerville, NV | 2022 | (A) | |||||||||||||||||||||||||||||||||||||||||||||||||||||||||||||||||||||||
Strafford / Lake Winnipesaukee South KOA | Strafford, NH | ( | 2019 | (A) | ||||||||||||||||||||||||||||||||||||||||||||||||||||||||||||||||||||||
| Summit Ridge | Converse, TX | ( | (3) | ( | 2000 | (A&C) | ||||||||||||||||||||||||||||||||||||||||||||||||||||||||||||||||||||
| Sun Outdoors Arches Gateway | Moab, UT | ( | 2018 | (A) | ||||||||||||||||||||||||||||||||||||||||||||||||||||||||||||||||||||||
| Sun Outdoors Association Island | Henderson, NY | ( | 2021 | (A) | ||||||||||||||||||||||||||||||||||||||||||||||||||||||||||||||||||||||
Sun Outdoors Bend(2) | Bend, OR | ( | 2020 | (A) | ||||||||||||||||||||||||||||||||||||||||||||||||||||||||||||||||||||||
| Sun Outdoors Canyonlands Gateway | Moab, UT | ( | 2018 | (A) | ||||||||||||||||||||||||||||||||||||||||||||||||||||||||||||||||||||||
| Sun Outdoors Cape Charles | Cape Charles, VA | ( | 2021 | (A) | ||||||||||||||||||||||||||||||||||||||||||||||||||||||||||||||||||||||
| Sun Outdoors Cape May | Cape May, NJ | ( | 2021 | (A) | ||||||||||||||||||||||||||||||||||||||||||||||||||||||||||||||||||||||
Sun Outdoors Central Coast Wine Country(8) | Paso Robles, CA | ( | 2014 | (A&C) | ||||||||||||||||||||||||||||||||||||||||||||||||||||||||||||||||||||||
Sun Outdoors Chesapeake Bay(2) | Temperanceville, VA | ( | 2021 | (A) | ||||||||||||||||||||||||||||||||||||||||||||||||||||||||||||||||||||||
| Sun Outdoors Coos Bay | Coos Bay, OR | ( | 2018 | (A) | ||||||||||||||||||||||||||||||||||||||||||||||||||||||||||||||||||||||
Sun Outdoors Chincoteague Bay(2)(5) | Chincoteague, VA | ( | 2021 | (C) | ||||||||||||||||||||||||||||||||||||||||||||||||||||||||||||||||||||||
| Sun Outdoors Frontier Town | Berlin, MD | ( | 2015 | (A) | ||||||||||||||||||||||||||||||||||||||||||||||||||||||||||||||||||||||
| Sun Outdoors Garden City Utah | Garden City, UT | ( | 2021 | (A) | ||||||||||||||||||||||||||||||||||||||||||||||||||||||||||||||||||||||
| Sun Outdoors Gig Harbor | Gig Harbor, WA | ( | 2020 | (A) | ||||||||||||||||||||||||||||||||||||||||||||||||||||||||||||||||||||||
F - 80
SUN COMMUNITIES, INC.
REAL ESTATE AND ACCUMULATED DEPRECIATION, SCHEDULE III
DECEMBER 31, 2023
(amounts in millions)
| Initial Cost to Company | Costs Capitalized Subsequent to Acquisition (Improvements) | Gross Amount Carried at December 31, 2023 | ||||||||||||||||||||||||||||||||||||||||||||||||||||||||||||||||||||||||
| Property Name | Location | Encumbrances(4) | Land | Depreciable Assets | Land | Depreciable Assets | Land | Depreciable Assets | Total | Accumulated Depreciation | Date | Acquired (A) or Constructed (C) | ||||||||||||||||||||||||||||||||||||||||||||||||||||||||||||||
Sun Outdoors Islamorada(6) | Islamorada, FL | ( | 2016 | (A) | ||||||||||||||||||||||||||||||||||||||||||||||||||||||||||||||||||||||
| Sun Outdoors Kensington Valley | New Hudson, MI | ( | 2021 | (A) | ||||||||||||||||||||||||||||||||||||||||||||||||||||||||||||||||||||||
| Sun Outdoors Key Largo | Key Largo, FL | ( | 2016 | (A) | ||||||||||||||||||||||||||||||||||||||||||||||||||||||||||||||||||||||
| Sun Outdoors Lake Rudolph | Santa Claus, IN | ( | 2014 | (A&C) | ||||||||||||||||||||||||||||||||||||||||||||||||||||||||||||||||||||||
| Sun Outdoors Lake Travis | Austin, TX | ( | 2015 | (A) | ||||||||||||||||||||||||||||||||||||||||||||||||||||||||||||||||||||||
| Sun Outdoors Marathon | Marathon, FL | ( | 2016 | (A) | ||||||||||||||||||||||||||||||||||||||||||||||||||||||||||||||||||||||
| Sun Outdoors Moab Downtown | Moab, UT | ( | 2018 | (A) | ||||||||||||||||||||||||||||||||||||||||||||||||||||||||||||||||||||||
Sun Outdoors Myrtle Beach(8) | Conway, SC | ( | 2017 | (A&C) | ||||||||||||||||||||||||||||||||||||||||||||||||||||||||||||||||||||||
| Sun Outdoors Mystic | Old Mystic, CT | ( | 2013 | (A) | ||||||||||||||||||||||||||||||||||||||||||||||||||||||||||||||||||||||
Sun Outdoors New Orleans North Shore | Ponchatoula, LA | ( | 2019 | (A) | ||||||||||||||||||||||||||||||||||||||||||||||||||||||||||||||||||||||
Sun Outdoors North Moab | Moab, UT | ( | 2019 | (A) | ||||||||||||||||||||||||||||||||||||||||||||||||||||||||||||||||||||||
| Sun Outdoors Ocean City | Berlin, MD | ( | 2014 | (A&C) | ||||||||||||||||||||||||||||||||||||||||||||||||||||||||||||||||||||||
| Sun Outdoors Ocean City Gateway | Whaleyville, MD | ( | 2015 | (A) | ||||||||||||||||||||||||||||||||||||||||||||||||||||||||||||||||||||||
Sun Outdoors Old Orchard Beach Downtown | Old Orchard Beach, ME | ( | 2019 | (A) | ||||||||||||||||||||||||||||||||||||||||||||||||||||||||||||||||||||||
Sun Outdoors Orange Beach | Orange Beach, AL | ( | 2019 | (A) | ||||||||||||||||||||||||||||||||||||||||||||||||||||||||||||||||||||||
Sun Outdoors Panama City Beach(2) | Panama City Beach, FL | ( | 2017 | (A) | ||||||||||||||||||||||||||||||||||||||||||||||||||||||||||||||||||||||
| Sun Outdoors Paso Robles | Paso Robles, CA | ( | 2014 | (C) | ||||||||||||||||||||||||||||||||||||||||||||||||||||||||||||||||||||||
| Sun Outdoors Petoskey Bay Harbor | Petoskey, MI | ( | 2016 | (A) | ||||||||||||||||||||||||||||||||||||||||||||||||||||||||||||||||||||||
Sun Outdoors Pigeon Forge(2) | Sevierville, TN | ( | 2019 | (A) | ||||||||||||||||||||||||||||||||||||||||||||||||||||||||||||||||||||||
Sun Outdoors Portland South(2) | Wilsonville, OR | ( | ( | 2021 | (A) | |||||||||||||||||||||||||||||||||||||||||||||||||||||||||||||||||||||
| Sun Outdoors Rocky Mountains | Granby, CO | ( | (3) | ( | 2018 | (C) | ||||||||||||||||||||||||||||||||||||||||||||||||||||||||||||||||||||
Sun Outdoors Rehoboth Bay | Millsboro, DE | ( | 2019 | (A) | ||||||||||||||||||||||||||||||||||||||||||||||||||||||||||||||||||||||
| Sun Outdoors Saco Old Orchard Beach | Saco, ME | ( | 2014 | (A) | ||||||||||||||||||||||||||||||||||||||||||||||||||||||||||||||||||||||
| Sun Outdoors Salt Lake City | North Salt Lake, UT | ( | 2018 | (A) | ||||||||||||||||||||||||||||||||||||||||||||||||||||||||||||||||||||||
Sun Outdoors San Diego Bay(2) | San Diego, CA | ( | 2019 | (A) | ||||||||||||||||||||||||||||||||||||||||||||||||||||||||||||||||||||||
| Sun Outdoors Santa Barbara | Goleta, CA | ( | 2020 | (A) | ||||||||||||||||||||||||||||||||||||||||||||||||||||||||||||||||||||||
| Sun Outdoors Sarasota | Sarasota, FL | ( | (3) | ( | 2016 | (A) | ||||||||||||||||||||||||||||||||||||||||||||||||||||||||||||||||||||
| Sun Outdoors St. Augustine | St. Augustine, FL | ( | 2018 | (A) | ||||||||||||||||||||||||||||||||||||||||||||||||||||||||||||||||||||||
Sun Outdoors Sugarloaf Key(2) | Summerland Key, FL | ( | 2021 | (A) | ||||||||||||||||||||||||||||||||||||||||||||||||||||||||||||||||||||||
Sun Outdoors Wells Beach(2) | Wells, ME | ( | 2021 | (A) | ||||||||||||||||||||||||||||||||||||||||||||||||||||||||||||||||||||||
Sun Outdoors Yellowstone North(2) | Gardiner, MT | ( | ( | 2021 | (A) | |||||||||||||||||||||||||||||||||||||||||||||||||||||||||||||||||||||
| Sun Retreats Adirondack Gateway | Gansevoort, NY | ( | 2016 | (A) | ||||||||||||||||||||||||||||||||||||||||||||||||||||||||||||||||||||||
| Sun Retreats Amherstburg | Amherstburg, ON | ( | 2016 | (A) | ||||||||||||||||||||||||||||||||||||||||||||||||||||||||||||||||||||||
F - 81
SUN COMMUNITIES, INC.
REAL ESTATE AND ACCUMULATED DEPRECIATION, SCHEDULE III
DECEMBER 31, 2023
(amounts in millions)
| Initial Cost to Company | Costs Capitalized Subsequent to Acquisition (Improvements) | Gross Amount Carried at December 31, 2023 | ||||||||||||||||||||||||||||||||||||||||||||||||||||||||||||||||||||||||
| Property Name | Location | Encumbrances(4) | Land | Depreciable Assets | Land | Depreciable Assets | Land | Depreciable Assets | Total | Accumulated Depreciation | Date | Acquired (A) or Constructed (C) | ||||||||||||||||||||||||||||||||||||||||||||||||||||||||||||||
| Sun Retreats Arran Lake | Allenford, ON | ( | 2016 | (A) | ||||||||||||||||||||||||||||||||||||||||||||||||||||||||||||||||||||||
| Sun Retreats Avalon | Cape May Court House, NJ | ( | 2013 | (A) | ||||||||||||||||||||||||||||||||||||||||||||||||||||||||||||||||||||||
| Sun Retreats Blue Mountains | Clarksburg, ON | ( | 2016 | (A) | ||||||||||||||||||||||||||||||||||||||||||||||||||||||||||||||||||||||
| Sun Retreats Birch Bay | Blaine, WA | ( | 2021 | (A) | ||||||||||||||||||||||||||||||||||||||||||||||||||||||||||||||||||||||
| Sun Retreats Cape Cod | East Falmouth, MA | ( | 2020 | (A) | ||||||||||||||||||||||||||||||||||||||||||||||||||||||||||||||||||||||
| Sun Retreats Cape May Wildwood | Cape May, NJ | ( | 2013 | (A) | ||||||||||||||||||||||||||||||||||||||||||||||||||||||||||||||||||||||
| Sun Retreats Cayuga | Cayuga, ON | ( | (1) | ( | 2016 | (A) | ||||||||||||||||||||||||||||||||||||||||||||||||||||||||||||||||||||
Sun Retreats Crystal River(8) | Crystal River, FL | ( | 2015 | (A) | ||||||||||||||||||||||||||||||||||||||||||||||||||||||||||||||||||||||
| Sun Retreats Daytona Beach | Port Orange, FL | ( | 2016 | (A) | ||||||||||||||||||||||||||||||||||||||||||||||||||||||||||||||||||||||
| Sun Retreats Dennis Port | Dennisport, MA | ( | 2016 | (A) | ||||||||||||||||||||||||||||||||||||||||||||||||||||||||||||||||||||||
| Sun Retreats Dunedin | Dunedin, FL | ( | 2016 | (A) | ||||||||||||||||||||||||||||||||||||||||||||||||||||||||||||||||||||||
Sun Retreats Estero Bay(8) | Fort Myers, FL | ( | 2020 | (A) | ||||||||||||||||||||||||||||||||||||||||||||||||||||||||||||||||||||||
| Sun Retreats Flamborough | Millgrove, ON | ( | (1) | ( | 2016 | (A) | ||||||||||||||||||||||||||||||||||||||||||||||||||||||||||||||||||||
Sun Retreats Fort Myers Beach(8)(9) | Ft. Myers, FL | (9) | ( | 1997 | (A) | |||||||||||||||||||||||||||||||||||||||||||||||||||||||||||||||||||||
| Sun Retreats Georgian Bay | Seguin, ON | ( | (1) | ( | 2016 | (A) | ||||||||||||||||||||||||||||||||||||||||||||||||||||||||||||||||||||
| Sun Retreats Geneva on the Lake | Geneva on the Lake, OH | ( | 2013 | (A&C) | ||||||||||||||||||||||||||||||||||||||||||||||||||||||||||||||||||||||
| Sun Retreats Gwynn's Island | Gwynn, VA | ( | 2013 | (A) | ||||||||||||||||||||||||||||||||||||||||||||||||||||||||||||||||||||||
| Sun Retreats Gun Lake | Hopkins, MI | ( | 2011 | (A) | ||||||||||||||||||||||||||||||||||||||||||||||||||||||||||||||||||||||
| Sun Retreats Hay Bay | Napanee, ON | ( | 2016 | (A) | ||||||||||||||||||||||||||||||||||||||||||||||||||||||||||||||||||||||
Sun Retreats Homosassa River(8) | Homosassa Springs, FL | ( | 2016 | (A) | ||||||||||||||||||||||||||||||||||||||||||||||||||||||||||||||||||||||
| Sun Retreats Huntsville | Huntsville, ON | ( | (1) | ( | 2016 | (A) | ||||||||||||||||||||||||||||||||||||||||||||||||||||||||||||||||||||
| Sun Retreats Ipperwash | Lambton Shores, ON | ( | (1) | ( | 2016 | (A) | ||||||||||||||||||||||||||||||||||||||||||||||||||||||||||||||||||||
SUN Retreats Lake Josephine(8) | Sebring, FL | ( | 2016 | (A) | ||||||||||||||||||||||||||||||||||||||||||||||||||||||||||||||||||||||
| Sun Retreats Lancaster County | Narvon, PA | ( | 2012 | (A) | ||||||||||||||||||||||||||||||||||||||||||||||||||||||||||||||||||||||
| Sun Retreats Long Beach Island | Barnegat, NJ | ( | 2016 | (A) | ||||||||||||||||||||||||||||||||||||||||||||||||||||||||||||||||||||||
| Sun Retreats Nantahala | Sylva, NC | ( | 2016 | (A) | ||||||||||||||||||||||||||||||||||||||||||||||||||||||||||||||||||||||
Sun Retreats Naples(8) | Naples, FL | ( | 2011 | (A) | ||||||||||||||||||||||||||||||||||||||||||||||||||||||||||||||||||||||
Sun Retreats Naples East(8) | Naples, FL | ( | 2011 | (A) | ||||||||||||||||||||||||||||||||||||||||||||||||||||||||||||||||||||||
| Sun Retreats New Point | New Point, VA | ( | 2013 | (A) | ||||||||||||||||||||||||||||||||||||||||||||||||||||||||||||||||||||||
Sun Retreats Ocala Orange Lake(8) | Citra, FL | ( | 2012 | (A) | ||||||||||||||||||||||||||||||||||||||||||||||||||||||||||||||||||||||
| Sun Retreats Old Orchard Beach | Old Orchard Beach, ME | ( | 2013 | (A) | ||||||||||||||||||||||||||||||||||||||||||||||||||||||||||||||||||||||
| Sun Retreats Orlando ChampionsGate | Davenport, FL | ( | 2020 | (A) | ||||||||||||||||||||||||||||||||||||||||||||||||||||||||||||||||||||||
| Sun Retreats Penetanguishene | Tiny, ON | ( | (1) | ( | 2016 | (A) | ||||||||||||||||||||||||||||||||||||||||||||||||||||||||||||||||||||
F - 82
SUN COMMUNITIES, INC.
REAL ESTATE AND ACCUMULATED DEPRECIATION, SCHEDULE III
DECEMBER 31, 2023
(amounts in millions)
| Initial Cost to Company | Costs Capitalized Subsequent to Acquisition (Improvements) | Gross Amount Carried at December 31, 2023 | ||||||||||||||||||||||||||||||||||||||||||||||||||||||||||||||||||||||||
| Property Name | Location | Encumbrances(4) | Land | Depreciable Assets | Land | Depreciable Assets | Land | Depreciable Assets | Total | Accumulated Depreciation | Date | Acquired (A) or Constructed (C) | ||||||||||||||||||||||||||||||||||||||||||||||||||||||||||||||
| Sun Retreats Peters Pond | Sandwich, MA | ( | 2013 | (A) | ||||||||||||||||||||||||||||||||||||||||||||||||||||||||||||||||||||||
| Sun Retreats Pleasant Acres Farm | Sussex, NJ | ( | 2021 | (A) | ||||||||||||||||||||||||||||||||||||||||||||||||||||||||||||||||||||||
Sun Retreats Rehoboth Bay | Millsboro, DE | ( | 2019 | (A) | ||||||||||||||||||||||||||||||||||||||||||||||||||||||||||||||||||||||
| Sun Retreats Rock River | Hillsdale, IL | ( | 2017 | (A) | ||||||||||||||||||||||||||||||||||||||||||||||||||||||||||||||||||||||
Sun Retreats San Antonio West(8) | San Antonio, TX | ( | 2012 | (A) | ||||||||||||||||||||||||||||||||||||||||||||||||||||||||||||||||||||||
| Sun Retreats Sandbanks | Cherry Valley, ON | ( | 2016 | (A) | ||||||||||||||||||||||||||||||||||||||||||||||||||||||||||||||||||||||
| Sun Retreats Sea Isle | Clermont, NJ | ( | 2014 | (A) | ||||||||||||||||||||||||||||||||||||||||||||||||||||||||||||||||||||||
| Sun Retreats Seashore | Cape May, NJ | ( | 2014 | (A) | ||||||||||||||||||||||||||||||||||||||||||||||||||||||||||||||||||||||
| Sun Retreats Shenandoah Valley | Stuarts Draft, VA | ( | 2020 | (A) | ||||||||||||||||||||||||||||||||||||||||||||||||||||||||||||||||||||||
| Sun Retreats Sherkston Shores | Sherkston, ON | ( | (1) | ( | 2016 | (A) | ||||||||||||||||||||||||||||||||||||||||||||||||||||||||||||||||||||
| Sun Retreats Silver Lake | Mears, MI | ( | 2018 | (C) | ||||||||||||||||||||||||||||||||||||||||||||||||||||||||||||||||||||||
| Sun Retreats Stratford | Bornholm, ON | ( | (1) | ( | 2016 | (A) | ||||||||||||||||||||||||||||||||||||||||||||||||||||||||||||||||||||
Sun Retreats Texas Hill Country(8) | New Braunfels, TX | ( | 2016 | (A&C) | ||||||||||||||||||||||||||||||||||||||||||||||||||||||||||||||||||||||
| Sun Retreats Turkey Point | Normandale, ON | ( | (1) | ( | 2016 | (A) | ||||||||||||||||||||||||||||||||||||||||||||||||||||||||||||||||||||
| Sun Retreats Wild Acres | Old Orchard Beach, ME | ( | 2013 | (A) | ||||||||||||||||||||||||||||||||||||||||||||||||||||||||||||||||||||||
| Sun Retreats Willow Lake | Scotland, ON | ( | 2016 | (A) | ||||||||||||||||||||||||||||||||||||||||||||||||||||||||||||||||||||||
| Sun Valley | Apache Junction, AZ | ( | 2014 | (A) | ||||||||||||||||||||||||||||||||||||||||||||||||||||||||||||||||||||||
| Sun Villa Estates | Reno, NV | ( | (3) | ( | 1998 | (A) | ||||||||||||||||||||||||||||||||||||||||||||||||||||||||||||||||||||
| Suncoast Gateway | Port Richey, FL | ( | 2016 | (A) | ||||||||||||||||||||||||||||||||||||||||||||||||||||||||||||||||||||||
| Sundance | Zephyrhills, FL | ( | 2015 | (A) | ||||||||||||||||||||||||||||||||||||||||||||||||||||||||||||||||||||||
| Sunlake Estates | Grand Island, FL | ( | 2015 | (A) | ||||||||||||||||||||||||||||||||||||||||||||||||||||||||||||||||||||||
| Sunrise Estates | Banning, CA | ( | 2022 | (A) | ||||||||||||||||||||||||||||||||||||||||||||||||||||||||||||||||||||||
| Sunset Beach RV Resort | Cape Charles, VA | ( | 2016 | (A) | ||||||||||||||||||||||||||||||||||||||||||||||||||||||||||||||||||||||
| Sunset Harbor at Cow Key Marina | Key West, FL | ( | 2016 | (A) | ||||||||||||||||||||||||||||||||||||||||||||||||||||||||||||||||||||||
Sunset Ridge(8) | Portland, MI | ( | 1998 | (C) | ||||||||||||||||||||||||||||||||||||||||||||||||||||||||||||||||||||||
| Sunset Ridge (TX) | Kyle, TX | ( | 2000 | (A&C) | ||||||||||||||||||||||||||||||||||||||||||||||||||||||||||||||||||||||
| Swan Meadow Village | Dillon, CO | ( | 2014 | (A) | ||||||||||||||||||||||||||||||||||||||||||||||||||||||||||||||||||||||
Sweetwater(8) | Zephyrhills, FL | ( | 2016 | (A) | ||||||||||||||||||||||||||||||||||||||||||||||||||||||||||||||||||||||
| Sycamore Village | Mason, MI | ( | 2011 | (A) | ||||||||||||||||||||||||||||||||||||||||||||||||||||||||||||||||||||||
| Sylvan Crossing | Chelsea, MI | ( | 2021 | (A) | ||||||||||||||||||||||||||||||||||||||||||||||||||||||||||||||||||||||
| Sylvan Glen Estates | Brighton, MI | ( | 2021 | (A) | ||||||||||||||||||||||||||||||||||||||||||||||||||||||||||||||||||||||
| Tallowwood Isle | Coconut Creek, FL | ( | 2016 | (A) | ||||||||||||||||||||||||||||||||||||||||||||||||||||||||||||||||||||||
Tamarac Village(8) | Ludington, MI | ( | 2011 | (A) | ||||||||||||||||||||||||||||||||||||||||||||||||||||||||||||||||||||||
Tampa East(8) | Dover, FL | ( | 2005 | (A) | ||||||||||||||||||||||||||||||||||||||||||||||||||||||||||||||||||||||
F - 83
SUN COMMUNITIES, INC.
REAL ESTATE AND ACCUMULATED DEPRECIATION, SCHEDULE III
DECEMBER 31, 2023
(amounts in millions)
| Initial Cost to Company | Costs Capitalized Subsequent to Acquisition (Improvements) | Gross Amount Carried at December 31, 2023 | ||||||||||||||||||||||||||||||||||||||||||||||||||||||||||||||||||||||||
| Property Name | Location | Encumbrances(4) | Land | Depreciable Assets | Land | Depreciable Assets | Land | Depreciable Assets | Total | Accumulated Depreciation | Date | Acquired (A) or Constructed (C) | ||||||||||||||||||||||||||||||||||||||||||||||||||||||||||||||
| Tanglewood Village | Brownstown, MI | ( | 2021 | (A) | ||||||||||||||||||||||||||||||||||||||||||||||||||||||||||||||||||||||
The Colony(2) | Oxnard, CA | ( | 2016 | (A) | ||||||||||||||||||||||||||||||||||||||||||||||||||||||||||||||||||||||
The Foothills(5) | Fort Collins, CO | 2021 | (C) | |||||||||||||||||||||||||||||||||||||||||||||||||||||||||||||||||||||||
| The Grove at Alta Ridge | Thornton, CO | ( | 2014 | (A) | ||||||||||||||||||||||||||||||||||||||||||||||||||||||||||||||||||||||
| The Hamptons Golf & Country Club | Auburndale, FL | ( | 2015 | (A) | ||||||||||||||||||||||||||||||||||||||||||||||||||||||||||||||||||||||
| The Hideaway | Key West, FL | ( | 2016 | (A) | ||||||||||||||||||||||||||||||||||||||||||||||||||||||||||||||||||||||
| The Hills | Apopka, FL | ( | 2016 | (A) | ||||||||||||||||||||||||||||||||||||||||||||||||||||||||||||||||||||||
| The Landings at Lake Henry | Haines City, FL | ( | 2015 | (A) | ||||||||||||||||||||||||||||||||||||||||||||||||||||||||||||||||||||||
| The Ridge | Davenport, FL | ( | 2015 | (A) | ||||||||||||||||||||||||||||||||||||||||||||||||||||||||||||||||||||||
| The Valley | Apopka, FL | ( | 2016 | (A) | ||||||||||||||||||||||||||||||||||||||||||||||||||||||||||||||||||||||
| The Villas at Calla Pointe | Cheektowaga, NY | ( | 2014 | (A) | ||||||||||||||||||||||||||||||||||||||||||||||||||||||||||||||||||||||
| The Willows | Goshen, IN | ( | 2021 | (A) | ||||||||||||||||||||||||||||||||||||||||||||||||||||||||||||||||||||||
Themeworld(8) | Davenport, FL | ( | 2021 | (A) | ||||||||||||||||||||||||||||||||||||||||||||||||||||||||||||||||||||||
Three Gardens | Southington, CT | ( | 2019 | (A) | ||||||||||||||||||||||||||||||||||||||||||||||||||||||||||||||||||||||
| Three Lakes | Hudson, FL | ( | 2012 | (A) | ||||||||||||||||||||||||||||||||||||||||||||||||||||||||||||||||||||||
| Thunderhill Estates | Sturgeon Bay, WI | ( | 2014 | (A) | ||||||||||||||||||||||||||||||||||||||||||||||||||||||||||||||||||||||
| Timber Ridge | Ft. Collins, CO | ( | 1996 | (A) | ||||||||||||||||||||||||||||||||||||||||||||||||||||||||||||||||||||||
| Timberline Estates | Coopersville, MI | ( | 1994 | (A) | ||||||||||||||||||||||||||||||||||||||||||||||||||||||||||||||||||||||
| Town & Country | Traverse City, MI | ( | 1996 | (A) | ||||||||||||||||||||||||||||||||||||||||||||||||||||||||||||||||||||||
| Town & Country Village | Lisbon, ME | ( | 2014 | (A) | ||||||||||||||||||||||||||||||||||||||||||||||||||||||||||||||||||||||
| Tranquility MHC | Bushnell, FL | ( | 2021 | (C) | ||||||||||||||||||||||||||||||||||||||||||||||||||||||||||||||||||||||
Traveler's World(8) | San Antonio, TX | ( | 2016 | (A) | ||||||||||||||||||||||||||||||||||||||||||||||||||||||||||||||||||||||
Treetops(8) | Arlington, TX | ( | 2016 | (A) | ||||||||||||||||||||||||||||||||||||||||||||||||||||||||||||||||||||||
| Troy Villa | Troy, MI | ( | 2020 | (A) | ||||||||||||||||||||||||||||||||||||||||||||||||||||||||||||||||||||||
| Vallecito | Newbury Park, CA | ( | 2016 | (A) | ||||||||||||||||||||||||||||||||||||||||||||||||||||||||||||||||||||||
| Victor Villa | Victorville, CA | ( | 2016 | (A) | ||||||||||||||||||||||||||||||||||||||||||||||||||||||||||||||||||||||
Vines(8) | Paso Robles, CA | ( | 2013 | (A) | ||||||||||||||||||||||||||||||||||||||||||||||||||||||||||||||||||||||
| Vista Del Lago | Scotts Valley, CA | ( | 2016 | (A) | ||||||||||||||||||||||||||||||||||||||||||||||||||||||||||||||||||||||
| Vista Del Lago MH & RV Resort | Bradenton, FL | ( | 2016 | (A) | ||||||||||||||||||||||||||||||||||||||||||||||||||||||||||||||||||||||
| Vizcaya Lakes | Port Charlotte, FL | ( | 2015 | (A) | ||||||||||||||||||||||||||||||||||||||||||||||||||||||||||||||||||||||
Walden Woods I(10) | Homosassa, FL | ( | ( | ( | 2015 | (A) | ||||||||||||||||||||||||||||||||||||||||||||||||||||||||||||||||||||
Walden Woods II(10) | Homosassa, FL | ( | 2015 | (A) | ||||||||||||||||||||||||||||||||||||||||||||||||||||||||||||||||||||||
| Warren Dunes Village | Bridgman, MI | ( | 2011 | (A&C) | ||||||||||||||||||||||||||||||||||||||||||||||||||||||||||||||||||||||
| Water Oak Country Club Estates | Lady Lake, FL | ( | 1993 | (A&C) | ||||||||||||||||||||||||||||||||||||||||||||||||||||||||||||||||||||||
F - 84
SUN COMMUNITIES, INC.
REAL ESTATE AND ACCUMULATED DEPRECIATION, SCHEDULE III
DECEMBER 31, 2023
(amounts in millions)
| Initial Cost to Company | Costs Capitalized Subsequent to Acquisition (Improvements) | Gross Amount Carried at December 31, 2023 | ||||||||||||||||||||||||||||||||||||||||||||||||||||||||||||||||||||||||
| Property Name | Location | Encumbrances(4) | Land | Depreciable Assets | Land | Depreciable Assets | Land | Depreciable Assets | Total | Accumulated Depreciation | Date | Acquired (A) or Constructed (C) | ||||||||||||||||||||||||||||||||||||||||||||||||||||||||||||||
Waters Edge(8) | Zephyrhills, FL | ( | 2016 | (A) | ||||||||||||||||||||||||||||||||||||||||||||||||||||||||||||||||||||||
| Waverly Shores Village | Holland, MI | ( | 2011 | (A&C) | ||||||||||||||||||||||||||||||||||||||||||||||||||||||||||||||||||||||
| West Village Estates | Romulus, MI | ( | 2012 | (A) | ||||||||||||||||||||||||||||||||||||||||||||||||||||||||||||||||||||||
| Westbrook Senior Village | Toledo, OH | ( | 2001 | (A) | ||||||||||||||||||||||||||||||||||||||||||||||||||||||||||||||||||||||
| Westbrook Village | Toledo, OH | ( | 1999 | (A) | ||||||||||||||||||||||||||||||||||||||||||||||||||||||||||||||||||||||
| Westside Ridge | Auburndale, FL | ( | 2015 | (A) | ||||||||||||||||||||||||||||||||||||||||||||||||||||||||||||||||||||||
| Westward Shores Cottages & RV Resort | West Ossipee, NH | ( | 2018 | (A) | ||||||||||||||||||||||||||||||||||||||||||||||||||||||||||||||||||||||
| White Lake | White Lake, MI | ( | 1997 | (A&C) | ||||||||||||||||||||||||||||||||||||||||||||||||||||||||||||||||||||||
| Wildwood Community | Sandwich, IL | ( | 2014 | (A) | ||||||||||||||||||||||||||||||||||||||||||||||||||||||||||||||||||||||
Willow Crossing(8) | Fort Lupton, CO | ( | 2021 | (C) | ||||||||||||||||||||||||||||||||||||||||||||||||||||||||||||||||||||||
| Willowbrook Place | Toledo, OH | ( | 1997 | (A) | ||||||||||||||||||||||||||||||||||||||||||||||||||||||||||||||||||||||
| Windham Hills | Jackson, MI | ( | 1998 | (A&C) | ||||||||||||||||||||||||||||||||||||||||||||||||||||||||||||||||||||||
| Windmill Village | Davenport, FL | ( | 2015 | (A) | ||||||||||||||||||||||||||||||||||||||||||||||||||||||||||||||||||||||
| Windsor Woods Village | Wayland, MI | ( | 2011 | (A) | ||||||||||||||||||||||||||||||||||||||||||||||||||||||||||||||||||||||
| Woodhaven Place | Woodhaven, MI | ( | 1998 | (A) | ||||||||||||||||||||||||||||||||||||||||||||||||||||||||||||||||||||||
| Woodlake Trails | San Antonio, TX | ( | 2000 | (A&C) | ||||||||||||||||||||||||||||||||||||||||||||||||||||||||||||||||||||||
| Woodland Park Estates | Eugene, OR | ( | 1998 | (A) | ||||||||||||||||||||||||||||||||||||||||||||||||||||||||||||||||||||||
| Woodlands at Church Lake | Groveland, FL | ( | 2015 | (A) | ||||||||||||||||||||||||||||||||||||||||||||||||||||||||||||||||||||||
| Woodside Terrace | Holland, OH | ( | 1997 | (A) | ||||||||||||||||||||||||||||||||||||||||||||||||||||||||||||||||||||||
| Wymberly | Martinez, GA | ( | 2019 | (A) | ||||||||||||||||||||||||||||||||||||||||||||||||||||||||||||||||||||||
| Yankee Village | Old Saybrook, CT | ( | 2019 | (A) | ||||||||||||||||||||||||||||||||||||||||||||||||||||||||||||||||||||||
| $ | $ | $ | $ | $ | $ | $ | $ | $ | ( | |||||||||||||||||||||||||||||||||||||||||||||||||||||||||||||||||
| Corporate Headquarters and Other Fixed Assets | Southfield, MI | ( | ||||||||||||||||||||||||||||||||||||||||||||||||||||||||||||||||||||||||
| $ | $ | $ | $ | $ | $ | $ | $ | $ | ( | |||||||||||||||||||||||||||||||||||||||||||||||||||||||||||||||||
(1)Gross amount carried at December 31, 2023, at our Canadian properties, reflects the impact of foreign currency translation.
(2)All or part of this property is subject to a ground lease.
(3)Gross amount carried at December 31, 2023 has decreased at this property due to a partial disposition of land or depreciable assets, as applicable.
(4)Balance outstanding represents total amount due at maturity and excludes any premiums or discounts and deferred financing costs.
(5)This property was not included in our community count as of December 31, 2023 as it was not fully developed.
(6)This property was impaired as a result of Hurricane Irma in September 2017.
(7)This property was split into two separate properties in 2021.
(8)This property had a name change during the year ended December 31, 2023.
(9)This property was impaired as a result of Hurricane Ian in October 2022.
(10)This property is one physical property but was split into two separate properties for encumbrance reporting purposes.
F - 85
SUN COMMUNITIES, INC.
REAL ESTATE AND ACCUMULATED DEPRECIATION, SCHEDULE III
DECEMBER 31, 2023
(amounts in millions)
The following tables set forth real estate and accumulated depreciation relating to our MH properties in the UK.
| Initial Cost to Company | Costs Capitalized Subsequent to Acquisition (Improvements) | Gross Amount Carried at December 31, 2023 | ||||||||||||||||||||||||||||||||||||||||||||||||||||||||||||||||||||||||
| Property Name | Location | Encumbrances | Land | Depreciable Assets | Land | Depreciable Assets | Land | Depreciable Assets | Total | Accumulated Depreciation | Date | Acquired (A) or Constructed (C) | ||||||||||||||||||||||||||||||||||||||||||||||||||||||||||||||
| Alberta | Whitstable, Kent, England | $ | $ | $ | $ | $ | $ | $ | $ | $ | ( | 2022 | (A) | |||||||||||||||||||||||||||||||||||||||||||||||||||||||||||||
| Amble Links | Amble, Northumberland, England | ( | 2022 | (A) | ||||||||||||||||||||||||||||||||||||||||||||||||||||||||||||||||||||||
| Ashbourne Heights | Ashbourne, Derbyshire, England | ( | 2022 | (A) | ||||||||||||||||||||||||||||||||||||||||||||||||||||||||||||||||||||||
| Beauport | Hastings, Sussex, England | ( | 2022 | (A) | ||||||||||||||||||||||||||||||||||||||||||||||||||||||||||||||||||||||
Birchington Vale(3) | Birchington, Kent, England | ( | ( | 2022 | (A) | |||||||||||||||||||||||||||||||||||||||||||||||||||||||||||||||||||||
| Bodmin Holiday Park (formerly Cornwall) | Bodmin, Cornwall, England | ( | 2022 | (A) | ||||||||||||||||||||||||||||||||||||||||||||||||||||||||||||||||||||||
| Bowland Fell | Skipton, Yorkshire, England | ( | 2022 | (A) | ||||||||||||||||||||||||||||||||||||||||||||||||||||||||||||||||||||||
| Broadland Sands | Lowestoft, Suffolk, England | ( | 2022 | (A) | ||||||||||||||||||||||||||||||||||||||||||||||||||||||||||||||||||||||
| Brynteg | Llanryg, Caernafon, Wales | ( | 2022 | (A) | ||||||||||||||||||||||||||||||||||||||||||||||||||||||||||||||||||||||
| Burghead / Lossiemouth / Silver Sands | Burghead, Moray, Scotland | ( | 2022 | (A) | ||||||||||||||||||||||||||||||||||||||||||||||||||||||||||||||||||||||
| Carlton Meres | Saxmundham, Suffolk, England | ( | 2022 | (A) | ||||||||||||||||||||||||||||||||||||||||||||||||||||||||||||||||||||||
| Chantry | West Witton, Yorkshire, England | ( | 2022 | (A) | ||||||||||||||||||||||||||||||||||||||||||||||||||||||||||||||||||||||
| Chichester Lakeside | Chichester, Sussex, England | ( | 2022 | (A) | ||||||||||||||||||||||||||||||||||||||||||||||||||||||||||||||||||||||
| Coghurst Hall | Hastings, Sussex, England | ( | ( | 2022 | (A) | |||||||||||||||||||||||||||||||||||||||||||||||||||||||||||||||||||||
| Dawlish Sands | Dawlish, Devon, England | ( | 2022 | (A) | ||||||||||||||||||||||||||||||||||||||||||||||||||||||||||||||||||||||
| Dovercourt | Harwich, Essex, England | ( | 2022 | (A) | ||||||||||||||||||||||||||||||||||||||||||||||||||||||||||||||||||||||
| Felixstowe Beach | Felixstowe, Suffolk, England | ( | 2022 | (A) | ||||||||||||||||||||||||||||||||||||||||||||||||||||||||||||||||||||||
| Glendale | Wigton, Cumbria, England | ( | 2022 | (A) | ||||||||||||||||||||||||||||||||||||||||||||||||||||||||||||||||||||||
| Golden Sands | Dawlish, Devon, England | ( | 2022 | (A) | ||||||||||||||||||||||||||||||||||||||||||||||||||||||||||||||||||||||
| Harts | Isle of Sheppey, Kent, England | ( | 2022 | (A) | ||||||||||||||||||||||||||||||||||||||||||||||||||||||||||||||||||||||
| Hedley Wood | Holsworthy, Devon, England | ( | 2022 | (A) | ||||||||||||||||||||||||||||||||||||||||||||||||||||||||||||||||||||||
Henfold(1)(2)(4) | Dorking, Surrey, England | ( | (4) | 2021 | (A) | |||||||||||||||||||||||||||||||||||||||||||||||||||||||||||||||||||||
| Hengar Manor | Bodmin, Cornwall, England | ( | 2022 | (A) | ||||||||||||||||||||||||||||||||||||||||||||||||||||||||||||||||||||||
| Littondale | Skipton, Yorkshire, England | ( | 2022 | (A) | ||||||||||||||||||||||||||||||||||||||||||||||||||||||||||||||||||||||
| Malvern View | Stanford Bishop, Worcester, England | ( | 2022 | (A) | ||||||||||||||||||||||||||||||||||||||||||||||||||||||||||||||||||||||
| Marlie | Romney, Kent, England | ( | 2022 | (A) | ||||||||||||||||||||||||||||||||||||||||||||||||||||||||||||||||||||||
| Martello Beach | Clacton on Sea, Essex, England | ( | 2022 | (A) | ||||||||||||||||||||||||||||||||||||||||||||||||||||||||||||||||||||||
| New Beach | Dymchurch, Kent, England | ( | 2022 | (A) | ||||||||||||||||||||||||||||||||||||||||||||||||||||||||||||||||||||||
F - 86
SUN COMMUNITIES, INC.
REAL ESTATE AND ACCUMULATED DEPRECIATION, SCHEDULE III
DECEMBER 31, 2023
(amounts in millions)
| Initial Cost to Company | Costs Capitalized Subsequent to Acquisition (Improvements) | Gross Amount Carried at December 31, 2023 | ||||||||||||||||||||||||||||||||||||||||||||||||||||||||||||||||||||||||
| Property Name | Location | Encumbrances | Land | Depreciable Assets | Land | Depreciable Assets | Land | Depreciable Assets | Total | Accumulated Depreciation | Date | Acquired (A) or Constructed (C) | ||||||||||||||||||||||||||||||||||||||||||||||||||||||||||||||
| Newhaven | Buxton, Derbyshire, England | ( | ( | 2022 | (A) | |||||||||||||||||||||||||||||||||||||||||||||||||||||||||||||||||||||
| Oaklands | Clacton on Sea, Essex, England | ( | 2022 | (A) | ||||||||||||||||||||||||||||||||||||||||||||||||||||||||||||||||||||||
Old Kerrow(2)(4) | Llfracombe, Devon, England | 2023 | (A) | |||||||||||||||||||||||||||||||||||||||||||||||||||||||||||||||||||||||
| Oyster Bay | Truro, Cornwall, England | ( | 2022 | (A) | ||||||||||||||||||||||||||||||||||||||||||||||||||||||||||||||||||||||
Pakefield(3) | Pakefield, Suffolk, England | ( | 2022 | (A) | ||||||||||||||||||||||||||||||||||||||||||||||||||||||||||||||||||||||
Par Sands(3) | Par, Cornwall, England | ( | 2022 | (A) | ||||||||||||||||||||||||||||||||||||||||||||||||||||||||||||||||||||||
| Pentire | Bude, Cornwall, England | ( | 2022 | (A) | ||||||||||||||||||||||||||||||||||||||||||||||||||||||||||||||||||||||
| Pevensey Bay | Pevensey Bay, Sussex, England | ( | 2022 | (A) | ||||||||||||||||||||||||||||||||||||||||||||||||||||||||||||||||||||||
| Plas Coch | Llanedwen, Anglesey, Wales | ( | 2022 | (A) | ||||||||||||||||||||||||||||||||||||||||||||||||||||||||||||||||||||||
| Polperro | Looe, Cornwall, England | ( | 2022 | (A) | ||||||||||||||||||||||||||||||||||||||||||||||||||||||||||||||||||||||
| Ribble Valley | Clitheroe, Lancashire, England | ( | 2022 | (A) | ||||||||||||||||||||||||||||||||||||||||||||||||||||||||||||||||||||||
| Rye Harbour | Rye, Sussex, England | ( | 2022 | (A) | ||||||||||||||||||||||||||||||||||||||||||||||||||||||||||||||||||||||
| Sand le Mere | Hull, Yorkshire, England | ( | 2022 | (A) | ||||||||||||||||||||||||||||||||||||||||||||||||||||||||||||||||||||||
| Sandhills | Christchurch, Dorset, England | ( | 2022 | (A) | ||||||||||||||||||||||||||||||||||||||||||||||||||||||||||||||||||||||
Sandy Bay(1)(2) | Canvey Island, Essex, England | ( | (1) | ( | 2022 | (A) | ||||||||||||||||||||||||||||||||||||||||||||||||||||||||||||||||||||
| Seaview | Whitstable, Kent, England | ( | 2022 | (A) | ||||||||||||||||||||||||||||||||||||||||||||||||||||||||||||||||||||||
| Seawick | Clacton on Sea, Essex, England | ( | 2022 | (A) | ||||||||||||||||||||||||||||||||||||||||||||||||||||||||||||||||||||||
| Solent Breezes | Fareham, Hampshire, England | ( | 2022 | (A) | ||||||||||||||||||||||||||||||||||||||||||||||||||||||||||||||||||||||
| St. Osyth Beach | Clacton on Sea, Essex, England | ( | 2022 | (A) | ||||||||||||||||||||||||||||||||||||||||||||||||||||||||||||||||||||||
| Steeple Bay | Sothminster, Essex, England | ( | 2022 | (A) | ||||||||||||||||||||||||||||||||||||||||||||||||||||||||||||||||||||||
Stowford(2)(4) | Llfracombe, Devon, England | 2023 | (A) | |||||||||||||||||||||||||||||||||||||||||||||||||||||||||||||||||||||||
Suffolk Sands(3) | Felixstowe, Suffolk, England | ( | 2022 | (A) | ||||||||||||||||||||||||||||||||||||||||||||||||||||||||||||||||||||||
| Tarka | Barnstaple, Devon, England | ( | ( | 2022 | (A) | |||||||||||||||||||||||||||||||||||||||||||||||||||||||||||||||||||||
Trevella(3) | Newquay, Cornwall, England | ( | 2022 | (A) | ||||||||||||||||||||||||||||||||||||||||||||||||||||||||||||||||||||||
| Turnberry | Girvan, Ayrshire, Scotland | ( | 2022 | (A) | ||||||||||||||||||||||||||||||||||||||||||||||||||||||||||||||||||||||
Waterside(3) | Paignton, Devon, England | ( | 2022 | (A) | ||||||||||||||||||||||||||||||||||||||||||||||||||||||||||||||||||||||
| West Mersea | West Mersea, Essex, England | ( | 2022 | (A) | ||||||||||||||||||||||||||||||||||||||||||||||||||||||||||||||||||||||
| Winchelsea Sands | Winchelsea, Sussex, England | ( | 2022 | (A) | ||||||||||||||||||||||||||||||||||||||||||||||||||||||||||||||||||||||
| Wood Farm | Charmouth, Dorset, England | ( | 2022 | (A) | ||||||||||||||||||||||||||||||||||||||||||||||||||||||||||||||||||||||
| Yorkshire Dales | Leyburn, Yorkshire, England | ( | 2022 | (A) | ||||||||||||||||||||||||||||||||||||||||||||||||||||||||||||||||||||||
| $ | $ | $ | $ | ( | $ | $ | $ | $ | $ | ( | ||||||||||||||||||||||||||||||||||||||||||||||||||||||||||||||||
F - 87
SUN COMMUNITIES, INC.
REAL ESTATE AND ACCUMULATED DEPRECIATION, SCHEDULE III
DECEMBER 31, 2023
(amounts in millions)
| Initial Cost to Company | Costs Capitalized Subsequent to Acquisition (Improvements) | Gross Amount Carried at December 31, 2023 | ||||||||||||||||||||||||||||||||||||||||||||||||||||||||||||||||||||||||
| Property Name | Location | Encumbrances | Land | Depreciable Assets | Land | Depreciable Assets | Land | Depreciable Assets | Total | Accumulated Depreciation | Date | Acquired (A) or Constructed (C) | ||||||||||||||||||||||||||||||||||||||||||||||||||||||||||||||
UK Headquarters and Other(3) | Sussex, England | ( | ||||||||||||||||||||||||||||||||||||||||||||||||||||||||||||||||||||||||
| $ | $ | $ | $ | ( | $ | $ | $ | $ | $ | ( | ||||||||||||||||||||||||||||||||||||||||||||||||||||||||||||||||
(1) Gross amount carried at December 31, 2023 reflects the impact of foreign currency translation.
(2) This property was not included in our community count as of December 31, 2023 as it was not fully developed.
(3) All or part of this property is subject to a ground lease.
(4) These properties were reacquired in exchange for settlement of the related note receivable. Refer to Note 4, "Notes and Other Receivables," for additional information.
The following tables set forth real estate and accumulated depreciation relating to our Safe Harbor marinas.
| Initial Cost to Company | Costs Capitalized Subsequent to Acquisition (Improvements) | Gross Amount Carried at December 31, 2023 | ||||||||||||||||||||||||||||||||||||||||||||||||||||||||||||||||||||||||
| Property Name | Location | Encumbrances | Land | Depreciable Assets | Land | Depreciable Assets | Land | Depreciable Assets | Total | Accumulated Depreciation | Date | Acquired (A) or Constructed (C) | ||||||||||||||||||||||||||||||||||||||||||||||||||||||||||||||
Allen Harbor(3) | North Kingstown, RI | $ | $ | $ | $ | $ | $ | $ | $ | $ | ( | 2021 | (A) | |||||||||||||||||||||||||||||||||||||||||||||||||||||||||||||
Anacapa Isle(3) | Oxnard, CA | ( | 2020 | (A) | ||||||||||||||||||||||||||||||||||||||||||||||||||||||||||||||||||||||
| Angler House | Islamorada, FL | ( | 2021 | (A) | ||||||||||||||||||||||||||||||||||||||||||||||||||||||||||||||||||||||
| Annapolis | Annapolis, MD | ( | 2020 | (A) | ||||||||||||||||||||||||||||||||||||||||||||||||||||||||||||||||||||||
| Aqua Yacht | Iuka, MS | ( | 2020 | (A) | ||||||||||||||||||||||||||||||||||||||||||||||||||||||||||||||||||||||
Aqualand(3) | Flowery Branch, GA | ( | 2020 | (A) | ||||||||||||||||||||||||||||||||||||||||||||||||||||||||||||||||||||||
| Bahia Bleu | Thunderbolt, GA | ( | 2020 | (A) | ||||||||||||||||||||||||||||||||||||||||||||||||||||||||||||||||||||||
| Ballena Isle | Alameda, CA | ( | 2020 | (A) | ||||||||||||||||||||||||||||||||||||||||||||||||||||||||||||||||||||||
Bayfront(3) | Chula Vista, CA | ( | 2022 | (A) | ||||||||||||||||||||||||||||||||||||||||||||||||||||||||||||||||||||||
Beaufort(3) | Beaufort, SC | ( | 2020 | (A) | ||||||||||||||||||||||||||||||||||||||||||||||||||||||||||||||||||||||
Beaver Creek(3) | Monticello, KY | ( | 2020 | (A) | ||||||||||||||||||||||||||||||||||||||||||||||||||||||||||||||||||||||
| Belle Maer | Harrison Township, MI | ( | 2020 | (A) | ||||||||||||||||||||||||||||||||||||||||||||||||||||||||||||||||||||||
| Bluewater | Hampton, VA | ( | 2022 | (A) | ||||||||||||||||||||||||||||||||||||||||||||||||||||||||||||||||||||||
| Bohemia Vista | Chesapeake Bay, MD | ( | 2020 | (A) | ||||||||||||||||||||||||||||||||||||||||||||||||||||||||||||||||||||||
Brady Mountain(3) | Royal, AR | ( | 2020 | (A) | ||||||||||||||||||||||||||||||||||||||||||||||||||||||||||||||||||||||
| Bristol | Charleston, SC | ( | 2020 | (A) | ||||||||||||||||||||||||||||||||||||||||||||||||||||||||||||||||||||||
F - 88
SUN COMMUNITIES, INC.
REAL ESTATE AND ACCUMULATED DEPRECIATION, SCHEDULE III
DECEMBER 31, 2023
(amounts in millions)
| Initial Cost to Company | Costs Capitalized Subsequent to Acquisition (Improvements) | Gross Amount Carried at December 31, 2023 | ||||||||||||||||||||||||||||||||||||||||||||||||||||||||||||||||||||||||
| Property Name | Location | Encumbrances | Land | Depreciable Assets | Land | Depreciable Assets | Land | Depreciable Assets | Total | Accumulated Depreciation | Date | Acquired (A) or Constructed (C) | ||||||||||||||||||||||||||||||||||||||||||||||||||||||||||||||
| Bruce & Johnsons | Branford, CT | ( | 2020 | (A) | ||||||||||||||||||||||||||||||||||||||||||||||||||||||||||||||||||||||
Burnside(3) | Somerset, KY | ( | 2020 | (A) | ||||||||||||||||||||||||||||||||||||||||||||||||||||||||||||||||||||||
Burnt Store(5) | Punta Gorda, FL | ( | 2020 | (A) | ||||||||||||||||||||||||||||||||||||||||||||||||||||||||||||||||||||||
Cabrillo Isle(3) | San Diego, CA | ( | 2021 | (A) | ||||||||||||||||||||||||||||||||||||||||||||||||||||||||||||||||||||||
Calusa Island(5) | Goodland, FL | ( | 2020 | (A) | ||||||||||||||||||||||||||||||||||||||||||||||||||||||||||||||||||||||
Cape Harbour(5) | Cape Coral, FL | ( | 2020 | (A) | ||||||||||||||||||||||||||||||||||||||||||||||||||||||||||||||||||||||
| Capri | Port Washington, NY | ( | 2020 | (A) | ||||||||||||||||||||||||||||||||||||||||||||||||||||||||||||||||||||||
| Carroll Island | Baltimore, MD | ( | 2020 | (A) | ||||||||||||||||||||||||||||||||||||||||||||||||||||||||||||||||||||||
Charleston City(3)(7) | Charleston, SC | ( | 2020 | (A) | ||||||||||||||||||||||||||||||||||||||||||||||||||||||||||||||||||||||
| City Boatyard | Charleston, SC | ( | 2020 | (A) | ||||||||||||||||||||||||||||||||||||||||||||||||||||||||||||||||||||||
| Cove Haven | Barrington, RI | ( | 2020 | (A) | ||||||||||||||||||||||||||||||||||||||||||||||||||||||||||||||||||||||
Cowesett(6) | Warwick, RI | ( | 2020 | (A) | ||||||||||||||||||||||||||||||||||||||||||||||||||||||||||||||||||||||
| Crystal Point | Point Pleasant, NJ | ( | 2020 | (A) | ||||||||||||||||||||||||||||||||||||||||||||||||||||||||||||||||||||||
Dauntless(1) | Essex, CT | ( | 2020 | (A) | ||||||||||||||||||||||||||||||||||||||||||||||||||||||||||||||||||||||
Dauntless Shipyard(1) | Essex, CT | 2020 | (A) | |||||||||||||||||||||||||||||||||||||||||||||||||||||||||||||||||||||||
| Deep River | Deep River, CT | ( | 2020 | (A) | ||||||||||||||||||||||||||||||||||||||||||||||||||||||||||||||||||||||
| Detroit River | Detroit, MI | ( | 2021 | (A) | ||||||||||||||||||||||||||||||||||||||||||||||||||||||||||||||||||||||
Eagle Cove(3) | Byrdstown, TN | ( | 2020 | (A) | ||||||||||||||||||||||||||||||||||||||||||||||||||||||||||||||||||||||
| Edgartown | Edgartown, MA | ( | 2021 | (A) | ||||||||||||||||||||||||||||||||||||||||||||||||||||||||||||||||||||||
| Emerald Coast | Niceville, FL | ( | 2021 | (A) | ||||||||||||||||||||||||||||||||||||||||||||||||||||||||||||||||||||||
Emerald Point(3) | Austin, TX | ( | 2020 | (A) | ||||||||||||||||||||||||||||||||||||||||||||||||||||||||||||||||||||||
Emeryville(3) | Emeryville, CA | ( | 2020 | (A) | ||||||||||||||||||||||||||||||||||||||||||||||||||||||||||||||||||||||
Essex Island(1) | Essex, CT | 2020 | (A) | |||||||||||||||||||||||||||||||||||||||||||||||||||||||||||||||||||||||
| Ferry Point | Old Saybrook, CT | ( | 2020 | (A) | ||||||||||||||||||||||||||||||||||||||||||||||||||||||||||||||||||||||
| Fiddler's Cove | North Falmouth, MA | ( | 2020 | (A) | ||||||||||||||||||||||||||||||||||||||||||||||||||||||||||||||||||||||
| Gaines | Rouses Point, NY | ( | 2020 | (A) | ||||||||||||||||||||||||||||||||||||||||||||||||||||||||||||||||||||||
| Glen Cove | Glen Cove, NY | ( | 2020 | (A) | ||||||||||||||||||||||||||||||||||||||||||||||||||||||||||||||||||||||
| Grand Isle | Grand Haven, MI | ( | 2020 | (A) | ||||||||||||||||||||||||||||||||||||||||||||||||||||||||||||||||||||||
| Great Island | Harpswell, ME | ( | 2020 | (A) | ||||||||||||||||||||||||||||||||||||||||||||||||||||||||||||||||||||||
| Great Lakes | Muskegon, MI | ( | 2020 | (A) | ||||||||||||||||||||||||||||||||||||||||||||||||||||||||||||||||||||||
| Great Oak Landing | Chestertown, MD | ( | 2020 | (A) | ||||||||||||||||||||||||||||||||||||||||||||||||||||||||||||||||||||||
| Green Harbor | Marshfield, MA | ( | 2020 | (A) | ||||||||||||||||||||||||||||||||||||||||||||||||||||||||||||||||||||||
F - 89
SUN COMMUNITIES, INC.
REAL ESTATE AND ACCUMULATED DEPRECIATION, SCHEDULE III
DECEMBER 31, 2023
(amounts in millions)
| Initial Cost to Company | Costs Capitalized Subsequent to Acquisition (Improvements) | Gross Amount Carried at December 31, 2023 | ||||||||||||||||||||||||||||||||||||||||||||||||||||||||||||||||||||||||
| Property Name | Location | Encumbrances | Land | Depreciable Assets | Land | Depreciable Assets | Land | Depreciable Assets | Total | Accumulated Depreciation | Date | Acquired (A) or Constructed (C) | ||||||||||||||||||||||||||||||||||||||||||||||||||||||||||||||
Greenport(2) | Greenport, NY | ( | 2020 | (A) | ||||||||||||||||||||||||||||||||||||||||||||||||||||||||||||||||||||||
| Greenwich Bay | Warwick, RI | ( | 2020 | (A) | ||||||||||||||||||||||||||||||||||||||||||||||||||||||||||||||||||||||
Grider Hill(3) | Albany, KY | ( | 2020 | (A) | ||||||||||||||||||||||||||||||||||||||||||||||||||||||||||||||||||||||
| Hacks Point | Chesapeake Bay, MD | ( | 2020 | (A) | ||||||||||||||||||||||||||||||||||||||||||||||||||||||||||||||||||||||
| Harbor House | Stamford, CT | ( | 2020 | (A) | ||||||||||||||||||||||||||||||||||||||||||||||||||||||||||||||||||||||
| Harborage Yacht Club | Stuart, FL | ( | 2021 | (A) | ||||||||||||||||||||||||||||||||||||||||||||||||||||||||||||||||||||||
Harbors View(3) | Afton, OK | ( | 2020 | (A) | ||||||||||||||||||||||||||||||||||||||||||||||||||||||||||||||||||||||
| Harbortown | Fort Pierce, FL | ( | 2020 | (A) | ||||||||||||||||||||||||||||||||||||||||||||||||||||||||||||||||||||||
Haverstraw(3) | West Haverstraw, NY | ( | 2020 | (A) | ||||||||||||||||||||||||||||||||||||||||||||||||||||||||||||||||||||||
| Hawthorne Cove | Salem, MA | ( | 2020 | (A) | ||||||||||||||||||||||||||||||||||||||||||||||||||||||||||||||||||||||
Hideaway Bay(3) | Flowery Branch, GA | ( | 2020 | (A) | ||||||||||||||||||||||||||||||||||||||||||||||||||||||||||||||||||||||
Holly Creek(3) | Celina, TN | ( | 2020 | (A) | ||||||||||||||||||||||||||||||||||||||||||||||||||||||||||||||||||||||
| Islamorada | Islamorada, FL | ( | 2021 | (A) | ||||||||||||||||||||||||||||||||||||||||||||||||||||||||||||||||||||||
| Island Park | Portsmouth, RI | ( | 2020 | (A) | ||||||||||||||||||||||||||||||||||||||||||||||||||||||||||||||||||||||
Jamestown(3) | Jamestown, KY | ( | 2020 | (A) | ||||||||||||||||||||||||||||||||||||||||||||||||||||||||||||||||||||||
| Jamestown Boatyard | Jamestown, RI | ( | 2020 | (A) | ||||||||||||||||||||||||||||||||||||||||||||||||||||||||||||||||||||||
| Jarrett Bay Boatworks | Beaufort, NC | ( | 2022 | (A) | ||||||||||||||||||||||||||||||||||||||||||||||||||||||||||||||||||||||
| Jefferson Beach | St. Clair Shores, MI | ( | 2020 | (A) | ||||||||||||||||||||||||||||||||||||||||||||||||||||||||||||||||||||||
| Kings Point | Cornelius, NC | ( | 2020 | (A) | ||||||||||||||||||||||||||||||||||||||||||||||||||||||||||||||||||||||
| Kittery Point | Kittery, ME | ( | 2022 | (A) | ||||||||||||||||||||||||||||||||||||||||||||||||||||||||||||||||||||||
| Lakefront | Port Clinton, OH | ( | 2020 | (A) | ||||||||||||||||||||||||||||||||||||||||||||||||||||||||||||||||||||||
| Lauderdale Marine Center | Fort Lauderdale, FL | ( | 2021 | (A) | ||||||||||||||||||||||||||||||||||||||||||||||||||||||||||||||||||||||
| Loch Lomond | San Rafael, CA | ( | 2020 | (A) | ||||||||||||||||||||||||||||||||||||||||||||||||||||||||||||||||||||||
| Manasquan River | Brick Township, NJ | ( | 2020 | (A) | ||||||||||||||||||||||||||||||||||||||||||||||||||||||||||||||||||||||
| Marathon | Marathon, FL | ( | 2021 | (A) | ||||||||||||||||||||||||||||||||||||||||||||||||||||||||||||||||||||||
| Marina Bay | Quincy, MA | ( | 2020 | (A) | ||||||||||||||||||||||||||||||||||||||||||||||||||||||||||||||||||||||
| Marina Bay Yacht Harbor | Richmond, CA | ( | 2022 | (C) | ||||||||||||||||||||||||||||||||||||||||||||||||||||||||||||||||||||||
| Montauk Yacht Club | Montauk, NY | ( | 2022 | (A) | ||||||||||||||||||||||||||||||||||||||||||||||||||||||||||||||||||||||
| Mystic | Mystic, CT | ( | 2020 | (A) | ||||||||||||||||||||||||||||||||||||||||||||||||||||||||||||||||||||||
| Narrows Point | Grasonville, MD | ( | 2020 | (A) | ||||||||||||||||||||||||||||||||||||||||||||||||||||||||||||||||||||||
| New England Boatworks | Portsmouth, RI | ( | 2020 | (A) | ||||||||||||||||||||||||||||||||||||||||||||||||||||||||||||||||||||||
F - 90
SUN COMMUNITIES, INC.
REAL ESTATE AND ACCUMULATED DEPRECIATION, SCHEDULE III
DECEMBER 31, 2023
(amounts in millions)
| Initial Cost to Company | Costs Capitalized Subsequent to Acquisition (Improvements) | Gross Amount Carried at December 31, 2023 | ||||||||||||||||||||||||||||||||||||||||||||||||||||||||||||||||||||||||
| Property Name | Location | Encumbrances | Land | Depreciable Assets | Land | Depreciable Assets | Land | Depreciable Assets | Total | Accumulated Depreciation | Date | Acquired (A) or Constructed (C) | ||||||||||||||||||||||||||||||||||||||||||||||||||||||||||||||
| New Port Cove | Riviera Beach, FL | ( | 2020 | (A) | ||||||||||||||||||||||||||||||||||||||||||||||||||||||||||||||||||||||
| Newport Shipyard | Newport, RI | ( | 2020 | (A) | ||||||||||||||||||||||||||||||||||||||||||||||||||||||||||||||||||||||
| North Palm Beach | North Palm Beach, FL | ( | 2020 | (A) | ||||||||||||||||||||||||||||||||||||||||||||||||||||||||||||||||||||||
| Old Port Cove | North Palm Beach, FL | ( | 2020 | (A) | ||||||||||||||||||||||||||||||||||||||||||||||||||||||||||||||||||||||
| Onset Bay | Buzzards Bay, MA | ( | 2020 | (A) | ||||||||||||||||||||||||||||||||||||||||||||||||||||||||||||||||||||||
| Outer Banks | Wanchese, NC | ( | 2022 | (A) | ||||||||||||||||||||||||||||||||||||||||||||||||||||||||||||||||||||||
| Oxford | Oxford, MD | ( | 2020 | (A) | ||||||||||||||||||||||||||||||||||||||||||||||||||||||||||||||||||||||
| Peninsula Yacht Club | Cornelius, NC | ( | 2020 | (A) | ||||||||||||||||||||||||||||||||||||||||||||||||||||||||||||||||||||||
Pier 121(3) | Lewisville, TX | ( | 2020 | (A) | ||||||||||||||||||||||||||||||||||||||||||||||||||||||||||||||||||||||
| Pier 77 | Bradenton, FL | ( | 2020 | (A) | ||||||||||||||||||||||||||||||||||||||||||||||||||||||||||||||||||||||
| Pilots Point | Westbrook, CT | ( | 2020 | (A) | ||||||||||||||||||||||||||||||||||||||||||||||||||||||||||||||||||||||
Pineland(5) | Bokeelia, FL | ( | 2020 | (A) | ||||||||||||||||||||||||||||||||||||||||||||||||||||||||||||||||||||||
| Plymouth | Plymouth, MA | ( | 2020 | (A) | ||||||||||||||||||||||||||||||||||||||||||||||||||||||||||||||||||||||
| Podickory Point | Annapolis, MD | ( | 2021 | (A) | ||||||||||||||||||||||||||||||||||||||||||||||||||||||||||||||||||||||
Port Phoenix(3) | North Fort Myers, FL | ( | 2022 | (A) | ||||||||||||||||||||||||||||||||||||||||||||||||||||||||||||||||||||||
Port Royal(4) | Port Royal, SC | ( | ( | 2021 | (A) | |||||||||||||||||||||||||||||||||||||||||||||||||||||||||||||||||||||
| Port Royal Landing | Port Royal, SC | ( | 2020 | (A) | ||||||||||||||||||||||||||||||||||||||||||||||||||||||||||||||||||||||
Post Road(4) | Mamaroneck, NY | ( | ( | 2020 | (A) | |||||||||||||||||||||||||||||||||||||||||||||||||||||||||||||||||||||
| Puerto del Rey | Fajardo, Puerto Rico | ( | 2021 | (A) | ||||||||||||||||||||||||||||||||||||||||||||||||||||||||||||||||||||||
Regatta Pointe(3) | Palmetto, FL | ( | 2020 | (A) | ||||||||||||||||||||||||||||||||||||||||||||||||||||||||||||||||||||||
| Reserve Harbor | Pawleys Island, SC | ( | 2020 | (A) | ||||||||||||||||||||||||||||||||||||||||||||||||||||||||||||||||||||||
| Riviera Beach | Riviera Beach, FL | ( | 2020 | (A) | ||||||||||||||||||||||||||||||||||||||||||||||||||||||||||||||||||||||
| Rockland | Rockland, ME | ( | 2020 | (A) | ||||||||||||||||||||||||||||||||||||||||||||||||||||||||||||||||||||||
Sakonnet(4) | Portsmouth, RI | ( | ( | 2020 | (A) | |||||||||||||||||||||||||||||||||||||||||||||||||||||||||||||||||||||
Sandusky(3) | Sandusky, OH | ( | 2020 | (A) | ||||||||||||||||||||||||||||||||||||||||||||||||||||||||||||||||||||||
| Savannah Yacht Center | Savannah, GA | ( | 2023 | (A) | ||||||||||||||||||||||||||||||||||||||||||||||||||||||||||||||||||||||
| Shelburne Shipyard | Shelburne, VT | ( | 2020 | (A) | ||||||||||||||||||||||||||||||||||||||||||||||||||||||||||||||||||||||
Shelter Island(3) | San Diego, CA | ( | 2021 | (A) | ||||||||||||||||||||||||||||||||||||||||||||||||||||||||||||||||||||||
| Siesta Key | Sarasota, FL | ( | 2020 | (A) | ||||||||||||||||||||||||||||||||||||||||||||||||||||||||||||||||||||||
| Silver Spring | Wakefield, RI | ( | 2020 | (A) | ||||||||||||||||||||||||||||||||||||||||||||||||||||||||||||||||||||||
| Skippers Landing | Troutman, NC | ( | 2020 | (A) | ||||||||||||||||||||||||||||||||||||||||||||||||||||||||||||||||||||||
F - 91
SUN COMMUNITIES, INC.
REAL ESTATE AND ACCUMULATED DEPRECIATION, SCHEDULE III
DECEMBER 31, 2023
(amounts in millions)
| Initial Cost to Company | Costs Capitalized Subsequent to Acquisition (Improvements) | Gross Amount Carried at December 31, 2023 | ||||||||||||||||||||||||||||||||||||||||||||||||||||||||||||||||||||||||
| Property Name | Location | Encumbrances | Land | Depreciable Assets | Land | Depreciable Assets | Land | Depreciable Assets | Total | Accumulated Depreciation | Date | Acquired (A) or Constructed (C) | ||||||||||||||||||||||||||||||||||||||||||||||||||||||||||||||
| Skull Creek | Hilton Head, SC | ( | 2020 | (A) | ||||||||||||||||||||||||||||||||||||||||||||||||||||||||||||||||||||||
South Bay(3) | Chula Vista, CA | ( | 2021 | (A) | ||||||||||||||||||||||||||||||||||||||||||||||||||||||||||||||||||||||
| South Fork | Fort Lauderdale, FL | ( | 2020 | (C) | ||||||||||||||||||||||||||||||||||||||||||||||||||||||||||||||||||||||
| South Harbour Village | Southport, NC | ( | 2020 | (A) | ||||||||||||||||||||||||||||||||||||||||||||||||||||||||||||||||||||||
| Sportsman | Orange Beach, AL | ( | 2020 | (A) | ||||||||||||||||||||||||||||||||||||||||||||||||||||||||||||||||||||||
| Stingray Point | Deltaville, VA | ( | 2021 | (A) | ||||||||||||||||||||||||||||||||||||||||||||||||||||||||||||||||||||||
Stirling(2) | Greenport, NY | 2020 | (A) | |||||||||||||||||||||||||||||||||||||||||||||||||||||||||||||||||||||||
| Stratford | Stratford, CT | ( | 2020 | (A) | ||||||||||||||||||||||||||||||||||||||||||||||||||||||||||||||||||||||
Sunroad(3) | San Diego, CA | ( | 2021 | (A) | ||||||||||||||||||||||||||||||||||||||||||||||||||||||||||||||||||||||
| Sunset Bay | Hull, MA | ( | 2020 | (A) | ||||||||||||||||||||||||||||||||||||||||||||||||||||||||||||||||||||||
| Toledo Beach | La Salle, MI | ( | 2020 | (A) | ||||||||||||||||||||||||||||||||||||||||||||||||||||||||||||||||||||||
| Tower Marine | Douglas, MI | ( | 2022 | (A) | ||||||||||||||||||||||||||||||||||||||||||||||||||||||||||||||||||||||
Trade Winds(3) | Appling, GA | ( | 2020 | (A) | ||||||||||||||||||||||||||||||||||||||||||||||||||||||||||||||||||||||
Ventura Isle(3) | Ventura, CA | ( | 2020 | (A) | ||||||||||||||||||||||||||||||||||||||||||||||||||||||||||||||||||||||
| Vineyard Haven | Vineyard Haven, MA | ( | 2021 | (A) | ||||||||||||||||||||||||||||||||||||||||||||||||||||||||||||||||||||||
Walden(3) | Montgomery, TX | ( | 2020 | (A) | ||||||||||||||||||||||||||||||||||||||||||||||||||||||||||||||||||||||
| Wentworth by the Sea | New Castle, NH | ( | 2021 | (A) | ||||||||||||||||||||||||||||||||||||||||||||||||||||||||||||||||||||||
| West Palm Beach | West Palm Beach, FL | ( | 2020 | (A) | ||||||||||||||||||||||||||||||||||||||||||||||||||||||||||||||||||||||
| Westport | Denver, NC | ( | 2020 | (A) | ||||||||||||||||||||||||||||||||||||||||||||||||||||||||||||||||||||||
Wickford(4) | Wickford, RI | ( | 2020 | (A) | ||||||||||||||||||||||||||||||||||||||||||||||||||||||||||||||||||||||
| Wickford Cove | Wickford, RI | ( | 2020 | (A) | ||||||||||||||||||||||||||||||||||||||||||||||||||||||||||||||||||||||
| Willsboro Bay | Willsboro, NY | ( | 2020 | (A) | ||||||||||||||||||||||||||||||||||||||||||||||||||||||||||||||||||||||
Wisdom Dock(3) | Albany, KY | ( | 2020 | (A) | ||||||||||||||||||||||||||||||||||||||||||||||||||||||||||||||||||||||
| Yacht Haven | Stamford, CT | ( | 2020 | (A) | ||||||||||||||||||||||||||||||||||||||||||||||||||||||||||||||||||||||
| Zahnisers | Solomons, MD | ( | 2020 | (A) | ||||||||||||||||||||||||||||||||||||||||||||||||||||||||||||||||||||||
| $ | $ | $ | $ | $ | $ | $ | $ | $ | ( | |||||||||||||||||||||||||||||||||||||||||||||||||||||||||||||||||
| Marinas Headquarters and Other Fixed Assets | Dallas, TX | ( | ||||||||||||||||||||||||||||||||||||||||||||||||||||||||||||||||||||||||
| $ | $ | $ | $ | $ | $ | $ | $ | $ | ( | |||||||||||||||||||||||||||||||||||||||||||||||||||||||||||||||||
(1) All costs from Dauntless Shipyard and Essex Island are grouped into Dauntless.
(2) All costs from Stirling are grouped into Greenport.
(3) All or part of this property is subject to a ground lease.
F - 92
SUN COMMUNITIES, INC.
REAL ESTATE AND ACCUMULATED DEPRECIATION, SCHEDULE III
DECEMBER 31, 2023
(amounts in millions)
(4) Gross amount carried at December 31, 2023 has decreased at this property due to a partial disposition of land or depreciable assets, as applicable.
(5) This property was impaired as a result of Hurricane Ian in October 2022.
(6) All costs related to Apponaug Harbour are grouped into Cowesett.
(7) All costs related to Ashley Fuels are grouped into Charleston City.
Depreciation of our buildings, improvements, furniture, fixtures and equipment is calculated over the following useful lives, on a straight-line basis:
•Land improvement and buildings: 1 year - 53 years
•Furniture, fixtures and equipment: 1 year - 40 years
•Dock improvements: 1 year - 52 years
•Site improvements: 1 year - 40 years
The aggregate cost of total real estate for federal income tax purposes was approximately $10.9 billion as of December 31, 2023.
The change in investment property for the years ended December 31, 2023, 2022 and 2021 is as follows (in millions):
| Year Ended | |||||||||||||||||
| December 31, 2023 | December 31, 2022 | December 31, 2021 | |||||||||||||||
| Beginning balance | $ | $ | $ | ||||||||||||||
| Property and land acquisitions, including immediate improvements | |||||||||||||||||
| Property expansion and development | |||||||||||||||||
| Improvements | |||||||||||||||||
| Asset impairment | ( | ( | (1) | ||||||||||||||
| Dispositions and other | ( | ( | ( | ||||||||||||||
| Ending balance | $ | $ | $ | ||||||||||||||
The change in accumulated depreciation for the years ended December 31, 2023, 2022 and 2021 is as follows (in millions):
| Year Ended | |||||||||||||||||
| December 31, 2023 | December 31, 2022 | December 31, 2021 | |||||||||||||||
| Beginning balance | $ | $ | $ | ||||||||||||||
| Depreciation for the period | |||||||||||||||||
| ( | (1) | ||||||||||||||||
| Dispositions and other | ( | ( | ( | ||||||||||||||
| Ending balance | $ | $ | $ | ||||||||||||||
(1)Represents the gross impact due to property impairment charges of $28.6 million resulting from Hurricane Ian. Refer to Note 17, "Commitments and Contingencies," for additional information.
F - 93