UNITED STATES
SECURITIES AND EXCHANGE COMMISSION
Washington, D.C. 20549
________________________________________________
FORM 10-Q
| (Mark One) | |||||
| QUARTERLY REPORT PURSUANT TO SECTION 13 OR 15(d) OF THE SECURITIES EXCHANGE ACT OF 1934 | |||||
For the quarterly period ended March 31, 2024
| OR | |||||
| TRANSITION REPORT PURSUANT TO SECTION 13 OR 15(d) OF THE SECURITIES EXCHANGE ACT OF 1934 | |||||
| For the transition period from ______ to ______ . | |||||
Commission File Number: 1-14829

(Exact name of registrant as specified in its charter)
(State or other jurisdiction of incorporation or organization)
(Address of principal executive offices)
(I.R.S. Employer Identification No.)
(Zip Code)
(Registrant's telephone number, including area code)
_______________________________________________________________
Securities registered pursuant to Section 12(b) of the Act:
| Title of each class | Trading symbols | Name of each exchange on which registered | ||||||||||||
Indicate by check mark whether the registrant (1) has filed all reports required to be filed by Section 13 or 15(d) of the Securities Exchange Act of 1934 during the preceding 12 months (or for such shorter period that the registrant was required to file such reports), and (2) has been subject to such filing requirements for the past 90 days. Yes ý No o
Indicate by check mark whether the registrant has submitted electronically every Interactive Data File required to be submitted pursuant to Rule 405 of Regulation S-T (§232.405 of this chapter) during the preceding 12 months (or for such shorter period that the registrant was required to submit such files). Yes ý No o
Indicate by check mark whether the registrant is a large accelerated filer, an accelerated filer, a non-accelerated filer, a smaller reporting company, or an emerging growth company. See the definitions of "large accelerated filer," "accelerated filer," "smaller reporting company" and "emerging growth company" in Rule 12b-2 of the Exchange Act.
If an emerging growth company, indicate by check mark if the registrant has elected not to use the extended transition period for complying with any new or revised financial accounting standards provided pursuant to Section 13(a) of the Exchange Act. o
Indicate by check mark whether the registrant is a shell company (as defined in Rule 12b-2 of the Exchange Act). Yes ☐ No ý
Indicate the number of shares outstanding of each of the issuer's classes of common stock, as of April 23, 2024:
Class A Common Stock — 2,563,034 shares
Class B Common Stock — 197,267,354 shares
Exchangeable shares:
As of April 23, 2024, the following number of exchangeable shares were outstanding for Molson Coors Canada, Inc.:
Class A Exchangeable shares — 2,678,963 shares
Class B Exchangeable shares — 9,362,866 shares
The Class A exchangeable shares and Class B exchangeable shares are shares of the share capital in Molson Coors Canada Inc., a wholly-owned subsidiary of the registrant. They are publicly traded on the Toronto Stock Exchange under the symbols TPX.A and TPX.B, respectively. These shares are intended to provide substantially the same economic and voting rights as the corresponding class of Molson Coors common stock in which they may be exchanged. In addition to the registered Class A common stock and the Class B common stock, the registrant has also issued and outstanding one share each of a Special Class A voting stock and Special Class B voting stock. The Special Class A voting stock and the Special Class B voting stock provide the mechanism for holders of Class A exchangeable shares and Class B exchangeable shares to be provided instructions to vote with the holders of the Class A common stock and the Class B common stock, respectively. The holders of the Special Class A voting stock and Special Class B voting stock are entitled to one vote for each outstanding Class A exchangeable share and Class B exchangeable share, respectively, excluding shares held by the registrant or its subsidiaries, and generally vote together with the Class A common stock and Class B common stock, respectively, on all matters on which the Class A common stock and Class B common stock are entitled to vote. The Special Class A voting stock and Special Class B voting stock are subject to a voting trust arrangement. The trustee which holds the Special Class A voting stock and the Special Class B voting stock is required to cast a number of votes equal to the number of then-outstanding Class A exchangeable shares and Class B exchangeable shares, respectively, but will only cast a number of votes equal to the number of Class A exchangeable shares and Class B exchangeable shares as to which it has received voting instructions from the owners of record of those Class A exchangeable shares and Class B exchangeable shares, other than the registrant or its subsidiaries, respectively, on the record date, and will cast the votes in accordance with such instructions so received.
MOLSON COORS BEVERAGE COMPANY AND SUBSIDIARIES
INDEX
| Page | ||||||||||||||
2
Glossary of Terms and Abbreviations
AOCI | Accumulated other comprehensive income (loss) | ||||
CAD | Canadian Dollar | ||||
| COGS | Cost of goods sold | ||||
| CZK | Czech Koruna | ||||
| DBRS | A global credit rating agency in Toronto | ||||
| EBITDA | Earnings before interest, tax, depreciation and amortization | ||||
EPS | Earnings per share | ||||
| EUR | Euro | ||||
FASB | Financial Accounting Standards Board | ||||
GBP | British Pound | ||||
| MG&A | Marketing, general and administrative | ||||
Moody’s | Moody’s Investors Service Limited, a nationally recognized statistical rating organization designated by the SEC | ||||
| OCI | Other comprehensive income (loss) | ||||
| OPEB | Other postretirement benefit plans | ||||
PSUs | Performance share units | ||||
| RON | Romanian Leu | ||||
RSD | Serbian Dinar | ||||
| RSUs | Restricted stock units | ||||
| SEC | U.S. Securities and Exchange Commission | ||||
| Standard & Poor’s | Standard and Poor’s Ratings Services, a nationally recognized statistical rating organization designated by the SEC | ||||
STWs | Sales-to-wholesalers | ||||
| U.K. | United Kingdom | ||||
U.S. | United States | ||||
| U.S. GAAP | Accounting principles generally accepted in the U.S. | ||||
| USD or $ | U.S. Dollar | ||||
| VIEs | Variable interest entities | ||||
3
Cautionary Statement Pursuant to Safe Harbor Provisions of the Private Securities Litigation Reform Act of 1995
This Quarterly Report on Form 10-Q ("this report") contains forward-looking statements within the meaning of Section 27A of the Securities Act of 1933, as amended, and Section 21E of the Securities Exchange Act of 1934, as amended (the "Exchange Act"). From time to time, we may also provide oral or written forward-looking statements in other materials we release to the public. Such forward-looking statements are subject to the safe harbor created by the Private Securities Litigation Reform Act of 1995.
Statements that refer to projections of our future financial performance, our anticipated growth and trends in our businesses, and other characterizations of future events or circumstances are forward-looking statements, and include, but are not limited to, statements in Part I.—Item 2. Management's Discussion and Analysis of Financial Condition and Results of Operations in this report under the heading "Items Affecting Reported Results", with respect to, among others, expectations of cost inflation, limited consumer disposable income, consumer preferences, overall volume and market share trends, pricing trends, industry forces, cost reduction strategies, shipment levels and profitability, the sufficiency of capital resources, anticipated results, expectations for funding future capital expenditures and operations, effective tax rate, debt service capabilities, timing and amounts of debt and leverage levels, Preserving the Planet and related environmental initiatives and expectations regarding future dividends and share repurchases. In addition, statements that we make in this report that are not statements of historical fact may also be forward-looking statements. Words such as "expects," "intends," "goals," "plans," "believes," "continues," "may," "anticipate," "seek," "estimate," "outlook," "trends," "future benefits," "potential," "projects," "strategies" and variations of such words and similar expressions are intended to identify forward-looking statements.
Forward-looking statements are subject to risks and uncertainties that could cause actual results to be materially different from those indicated (both favorably and unfavorably). These risks and uncertainties include, but are not limited to, those described in Part II.— Item IA. "Risk Factors" in this report and those described from time to time in our past and future reports filed with the SEC, including in our Annual Report on Form 10-K for the year ended December 31, 2023 ("Annual Report"). Caution should be taken not to place undue reliance on any such forward-looking statements. Forward-looking statements speak only as of the date when made and we undertake no obligation to update any forward-looking statement, whether as a result of new information, future events or otherwise, except as required by applicable law.
Market and Industry Data
The market and industry data used in this report are based on independent industry publications, customers, trade or business organizations, reports by market research firms and other published statistical information from third parties (collectively, the "Third Party Information"), as well as information based on management’s good faith estimates, which we derive from our review of internal information and independent sources. Such Third Party Information generally states that the information contained therein or provided by such sources has been obtained from sources believed to be reliable.
4
PART I. FINANCIAL INFORMATION
ITEM 1. FINANCIAL STATEMENTS (UNAUDITED)
MOLSON COORS BEVERAGE COMPANY AND SUBSIDIARIES
CONDENSED CONSOLIDATED STATEMENTS OF OPERATIONS
(IN MILLIONS, EXCEPT PER SHARE DATA)
(UNAUDITED)
| Three Months Ended | |||||||||||
| March 31, 2024 | March 31, 2023 | ||||||||||
| Sales | $ | $ | |||||||||
| Excise taxes | ( | ( | |||||||||
| Net sales | |||||||||||
| Cost of goods sold | ( | ( | |||||||||
| Gross profit | |||||||||||
| Marketing, general and administrative expenses | ( | ( | |||||||||
| Other operating income (expense), net | ( | ||||||||||
| Equity income (loss) | ( | ||||||||||
| Operating income (loss) | |||||||||||
| Interest income (expense), net | ( | ( | |||||||||
Other pension and postretirement benefit (cost), net | |||||||||||
| Other non-operating income (expense), net | ( | ||||||||||
| Income (loss) before income taxes | |||||||||||
| Income tax benefit (expense) | ( | ( | |||||||||
| Net income (loss) | |||||||||||
| Net (income) loss attributable to noncontrolling interests | ( | ( | |||||||||
| Net income (loss) attributable to Molson Coors Beverage Company | $ | $ | |||||||||
| Net income (loss) attributable to Molson Coors Beverage Company per share | |||||||||||
| Basic | $ | $ | |||||||||
| Diluted | $ | $ | |||||||||
| Weighted-average shares outstanding | |||||||||||
| Basic | |||||||||||
| Dilutive effect of share-based awards | |||||||||||
| Diluted | |||||||||||
See notes to unaudited condensed consolidated financial statements.
5
MOLSON COORS BEVERAGE COMPANY AND SUBSIDIARIES
CONDENSED CONSOLIDATED STATEMENTS OF COMPREHENSIVE INCOME (LOSS)
(IN MILLIONS)
(UNAUDITED)
| Three Months Ended | |||||||||||
| March 31, 2024 | March 31, 2023 | ||||||||||
| Net income (loss) including noncontrolling interests | $ | $ | |||||||||
| Other comprehensive income (loss), net of tax | |||||||||||
| Foreign currency translation adjustments | ( | ||||||||||
| Unrealized gain (loss) recognized on derivative instruments | ( | ||||||||||
| Derivative instrument activity reclassified from other comprehensive income (loss) | |||||||||||
| Pension and other postretirement activity reclassified from other comprehensive income (loss) | ( | ( | |||||||||
| Ownership share of unconsolidated subsidiaries' other comprehensive income (loss) | |||||||||||
| Total other comprehensive income (loss), net of tax | ( | ||||||||||
| Comprehensive income (loss) | |||||||||||
| Comprehensive (income) loss attributable to noncontrolling interests | ( | ( | |||||||||
| Comprehensive income (loss) attributable to Molson Coors Beverage Company | $ | $ | |||||||||
See notes to unaudited condensed consolidated financial statements.
6
MOLSON COORS BEVERAGE COMPANY AND SUBSIDIARIES
CONDENSED CONSOLIDATED BALANCE SHEETS
(IN MILLIONS, EXCEPT PAR VALUE)
(UNAUDITED)
| As of | |||||||||||
| March 31, 2024 | December 31, 2023 | ||||||||||
| Assets | |||||||||||
| Current assets | |||||||||||
| Cash and cash equivalents | $ | $ | |||||||||
| Trade receivables, net | |||||||||||
| Other receivables, net | |||||||||||
| Inventories, net | |||||||||||
| Other current assets, net | |||||||||||
| Total current assets | |||||||||||
| Property, plant and equipment, net | |||||||||||
| Goodwill | |||||||||||
| Other intangibles, net | |||||||||||
| Other assets | |||||||||||
| Total assets | $ | $ | |||||||||
| Liabilities and equity | |||||||||||
| Current liabilities | |||||||||||
| Accounts payable and other current liabilities | $ | $ | |||||||||
| Current portion of long-term debt and short-term borrowings | |||||||||||
| Total current liabilities | |||||||||||
| Long-term debt | |||||||||||
| Pension and postretirement benefits | |||||||||||
| Deferred tax liabilities | |||||||||||
| Other liabilities | |||||||||||
| Total liabilities | |||||||||||
| Redeemable noncontrolling interest | |||||||||||
| Molson Coors Beverage Company stockholders' equity | |||||||||||
| Capital stock | |||||||||||
Preferred stock, $ | |||||||||||
Class A common stock, $ | |||||||||||
Class B common stock, $ | |||||||||||
Class A exchangeable shares, no par value (issued and outstanding: | |||||||||||
Class B exchangeable shares, no par value (issued and outstanding: | |||||||||||
| Paid-in capital | |||||||||||
| Retained earnings | |||||||||||
| Accumulated other comprehensive income (loss) | ( | ( | |||||||||
Class B common stock held in treasury at cost ( | ( | ( | |||||||||
| Total Molson Coors Beverage Company stockholders' equity | |||||||||||
| Noncontrolling interests | |||||||||||
| Total equity | |||||||||||
| Total liabilities and equity | $ | $ | |||||||||
7
MOLSON COORS BEVERAGE COMPANY AND SUBSIDIARIES
CONDENSED CONSOLIDATED STATEMENTS OF CASH FLOWS
(IN MILLIONS)
(UNAUDITED)
| Three Months Ended | |||||||||||
| March 31, 2024 | March 31, 2023 | ||||||||||
| Cash flows from operating activities | |||||||||||
| Net income (loss) including noncontrolling interests | $ | $ | |||||||||
| Adjustments to reconcile net income (loss) to net cash provided by (used in) operating activities | |||||||||||
| Depreciation and amortization | |||||||||||
| Amortization of debt issuance costs and discounts | |||||||||||
| Share-based compensation | |||||||||||
| (Gain) loss on sale or impairment of property, plant, equipment and other assets, net | ( | ( | |||||||||
| Unrealized (gain) loss on foreign currency fluctuations and derivative instruments, net | |||||||||||
| Equity (income) loss | ( | ||||||||||
| Income tax (benefit) expense | |||||||||||
| Income tax (paid) received | ( | ( | |||||||||
| Interest expense, excluding amortization of debt issuance costs and discounts | |||||||||||
| Interest paid | ( | ( | |||||||||
| Change in current assets and liabilities and other | ( | ( | |||||||||
| Net cash provided by (used in) operating activities | |||||||||||
| Cash flows from investing activities | |||||||||||
| Additions to property, plant and equipment | ( | ( | |||||||||
| Proceeds from sales of property, plant, equipment and other assets | |||||||||||
| Other | ( | ||||||||||
| Net cash provided by (used in) investing activities | ( | ( | |||||||||
| Cash flows from financing activities | |||||||||||
| Dividends paid | ( | ( | |||||||||
| Payments for purchases of treasury stock | ( | ( | |||||||||
| Payments on debt and borrowings | ( | ( | |||||||||
| Proceeds on debt and borrowings | |||||||||||
| Other | ( | ||||||||||
| Net cash provided by (used in) financing activities | ( | ( | |||||||||
| Effect of foreign exchange rate changes on cash and cash equivalents | ( | ||||||||||
| Net increase (decrease) in cash and cash equivalents | ( | ( | |||||||||
| Balance at beginning of year | |||||||||||
| Balance at end of period | $ | $ | |||||||||
See notes to unaudited condensed consolidated financial statements.
8
MOLSON COORS BEVERAGE COMPANY AND SUBSIDIARIES
CONDENSED CONSOLIDATED STATEMENTS OF STOCKHOLDERS' EQUITY
AND NONCONTROLLING INTERESTS
(IN MILLIONS)
(UNAUDITED)
| Molson Coors Beverage Company Stockholders' Equity | |||||||||||||||||||||||||||||||||||||||||||||||||||||||||||
| Accumulated | Common stock | ||||||||||||||||||||||||||||||||||||||||||||||||||||||||||
| Common stock | Exchangeable | other | held in | Non | |||||||||||||||||||||||||||||||||||||||||||||||||||||||
| issued | shares issued | Paid-in- | Retained | comprehensive | treasury | controlling | |||||||||||||||||||||||||||||||||||||||||||||||||||||
| Total | Class A | Class B | Class A | Class B | capital | earnings | income (loss) | Class B | interests(1) | ||||||||||||||||||||||||||||||||||||||||||||||||||
| As of December 31, 2022 | $ | $ | $ | $ | $ | $ | $ | $ | ( | $ | ( | $ | |||||||||||||||||||||||||||||||||||||||||||||||
| Exchange of shares | — | — | — | — | ( | — | — | — | — | ||||||||||||||||||||||||||||||||||||||||||||||||||
| Shares issued under equity compensation plan | ( | — | — | — | — | ( | — | — | — | — | |||||||||||||||||||||||||||||||||||||||||||||||||
| Amortization of share-based compensation | — | — | — | — | — | — | — | — | |||||||||||||||||||||||||||||||||||||||||||||||||||
| Net income (loss) including noncontrolling interests | — | — | — | — | — | — | — | ||||||||||||||||||||||||||||||||||||||||||||||||||||
| Other comprehensive income (loss), net of tax | — | — | — | — | — | — | — | ||||||||||||||||||||||||||||||||||||||||||||||||||||
| Share repurchase program | ( | — | — | — | — | — | — | — | ( | — | |||||||||||||||||||||||||||||||||||||||||||||||||
| Distributions and dividends to noncontrolling interests | ( | — | — | — | — | — | — | — | — | ( | |||||||||||||||||||||||||||||||||||||||||||||||||
| Dividends declared | ( | — | — | — | — | — | ( | — | — | — | |||||||||||||||||||||||||||||||||||||||||||||||||
| As of March 31, 2023 | $ | $ | $ | $ | $ | $ | $ | $ | ( | $ | ( | $ | |||||||||||||||||||||||||||||||||||||||||||||||
| Molson Coors Beverage Company Stockholders' Equity | |||||||||||||||||||||||||||||||||||||||||||||||||||||||||||
| Accumulated | Common stock | ||||||||||||||||||||||||||||||||||||||||||||||||||||||||||
| Common stock | Exchangeable | other | held in | Non | |||||||||||||||||||||||||||||||||||||||||||||||||||||||
| issued | shares issued | Paid-in- | Retained | comprehensive | treasury | controlling | |||||||||||||||||||||||||||||||||||||||||||||||||||||
| Total | Class A | Class B | Class A | Class B | capital | earnings | income (loss) | Class B | interests(1) | ||||||||||||||||||||||||||||||||||||||||||||||||||
| As of December 31, 2023 | $ | $ | $ | $ | $ | $ | $ | $ | ( | $ | ( | $ | |||||||||||||||||||||||||||||||||||||||||||||||
| Shares issued under equity compensation plan | ( | — | — | — | — | ( | — | — | — | — | |||||||||||||||||||||||||||||||||||||||||||||||||
| Amortization of share-based compensation | — | — | — | — | — | — | — | — | |||||||||||||||||||||||||||||||||||||||||||||||||||
| Net income (loss) including noncontrolling interests | — | — | — | — | — | — | — | ||||||||||||||||||||||||||||||||||||||||||||||||||||
| Other comprehensive income (loss), net of tax | ( | — | — | — | — | — | — | ( | — | ( | |||||||||||||||||||||||||||||||||||||||||||||||||
| Share repurchase program | ( | — | — | — | — | — | — | — | ( | — | |||||||||||||||||||||||||||||||||||||||||||||||||
| Distributions and dividends to noncontrolling interests | ( | — | — | — | — | — | — | — | — | ( | |||||||||||||||||||||||||||||||||||||||||||||||||
| Dividends declared | ( | — | — | — | — | — | ( | — | — | — | |||||||||||||||||||||||||||||||||||||||||||||||||
| As of March 31, 2024 | $ | $ | $ | $ | $ | $ | $ | $ | ( | $ | ( | $ | |||||||||||||||||||||||||||||||||||||||||||||||
9
(1) All activity included in the noncontrolling interests column of the condensed consolidated statements of stockholder's equity and noncontrolling interests excludes activity from our redeemable noncontrolling interest.
See notes to unaudited condensed consolidated financial statements.
10
MOLSON COORS BEVERAGE COMPANY AND SUBSIDIARIES
NOTES TO UNAUDITED CONDENSED CONSOLIDATED FINANCIAL STATEMENTS
1. Basis of Presentation and Summary of Significant Accounting Policies
Unless otherwise noted in this report, any description of "we," "us" or "our" includes Molson Coors Beverage Company ("MCBC" or the "Company"), principally a holding company, and its operating and non-operating subsidiaries included within our reporting segments. Our reporting segments include Americas and EMEA&APAC. Our Americas segment operates in the U.S., Canada and various countries in the Caribbean, Latin and South America, and our EMEA&APAC segment operates in Bulgaria, Croatia, Czech Republic, Hungary, Montenegro, the Republic of Ireland, Romania, Serbia, the U.K., various other European countries and certain countries within the Middle East, Africa and Asia Pacific.
Unless otherwise indicated, information in this report is presented in USD and comparisons are to comparable prior periods. Our primary operating currencies, other than the USD, include the CAD, the GBP and our Central European operating currencies such as the EUR, CZK, RON and RSD.
The accompanying unaudited condensed consolidated financial statements reflect all adjustments which are necessary for a fair statement of the financial position, results of operations and cash flows for the periods presented in accordance with U.S. GAAP. Such unaudited condensed consolidated financial statements have been prepared in accordance with the instructions to Form 10-Q pursuant to the rules and regulations of the SEC. Certain information and footnote disclosures normally included in financial statements prepared in accordance with U.S. GAAP have been condensed or omitted pursuant to such rules and regulations.
These unaudited condensed consolidated financial statements should be read in conjunction with our Annual Report, and have been prepared on a consistent basis with the accounting policies described in Note 1 of the Notes to the Audited Consolidated Financial Statements included in our Annual Report, except as noted in Note 2, "New Accounting Pronouncements".
The results of operations for the three months ended March 31, 2024 are not necessarily indicative of the results that may be achieved for the full year or any other future period.
Anti-Dilutive Securities
Anti-dilutive securities excluded from the computation of diluted EPS were 1.1 million and 1.7 million as of March 31, 2024 and March 31, 2023, respectively.
Dividends
On February 13, 2024, our Company's Board of Directors ("Board") declared a dividend of $0.44 per share, paid on March 15, 2024, to shareholders of Class A and Class B common stock of record on March 1, 2024. Shareholders of exchangeable shares received the CAD equivalent of dividends declared on Class A and Class B common stock, equal to CAD 0.59 per share.
Share Repurchase Program
During the third quarter of 2023, our Board approved a share repurchase program authorizing the repurchase of up to an aggregate of $2.0 billion of our Company's Class B common stock excluding brokerage commissions and excise taxes, with an expected program term of five years . This repurchase program replaces and supersedes any repurchase program previously approved by our Board, including the program approved during the first quarter of 2022.
The following table presents the shares repurchased and aggregate cost, including brokerage commissions and excise taxes incurred, under the current and superseded share repurchase programs for the three months ended March 31, 2024 and March 31, 2023.
| Three Months Ended | |||||||||||
| March 31, 2024 | March 31, 2023 | ||||||||||
| Shares repurchased | |||||||||||
Aggregate cost (in millions) | $ | $ | |||||||||
11
Non-Cash Activity
Non-cash investing activities include movements in our guarantee of indebtedness of certain equity method investments. See Note 3, "Investments" for further discussion. We also had non-cash activities related to capital expenditures incurred but not yet paid of $182.1 million and $203.3 million during the three months ended March 31, 2024 and March 31, 2023, respectively. In addition, we had non-cash activities related to certain issuances of share-based awards.
Other than the activity mentioned above and the supplemental non-cash activity related to the recognition of leases further discussed in Note 6, "Leases," there was no other significant non-cash activity during the three months ended March 31, 2024 and March 31, 2023, respectively.
Share-Based Compensation
During the three months ended March 31, 2024 and March 31, 2023, we granted stock options, RSUs and PSUs to certain officers and other eligible employees. We recognized share-based compensation expense of $12.8 million and $9.8 million during the three months ended March 31, 2024 and March 31, 2023, respectively.
Supplier Financing
We are the buyer under a supplier finance program with Citibank N.A. with $136.3 million and $147.5 million confirmed as valid and outstanding as of March 31, 2024 and December 31, 2023, respectively. We recognize these unpaid balances in accounts payable and other current liabilities on our unaudited condensed consolidated balance sheets.
Allowance for Doubtful Accounts
The allowance for doubtful accounts for trade receivables was $13.5 million and $12.7 million as of March 31, 2024 and December 31, 2023, respectively.
2. New Accounting Pronouncements
New Accounting Pronouncements Not Yet Adopted
In December 2023, the FASB issued ASU 2023-09, Income Taxes (Topic 740): Improvements to Income Tax Disclosures intended to enhance transparency and decision usefulness of income tax disclosures. This guidance is effective for us starting with our annual report for the year ending December 31, 2025 and the guidance should be applied prospectively. We are permitted to early adopt and can choose to apply the guidance retrospectively. When adopted, we expect the guidance to have an impact on disclosures only and to not have a material effect on our financial position or results of operations. We are still considering if we will apply the standard prospectively or retrospectively.
In November 2023, the FASB issued ASU 2023-07, Segment Reporting (Topic 280): Improvements to Reportable Segment Disclosures intended to improve reportable segment disclosures and to enhance disclosures about significant reportable segment expenses. This guidance is effective for us starting with our annual report for the year ending December 31, 2024 and the subsequent interim periods and is required to be applied retrospectively to all prior periods presented. Because the amendments do not change the methodology for the identification of operating segments, the aggregation of those operating segments or the application of the quantitative thresholds to determine reportable segments, we do not expect the guidance to have a material effect on our financial position or results of operations.
Other than the items noted above, there have been no new accounting pronouncements not yet effective or adopted in the current year that we believe have a significant impact, or potential significant impact, on our unaudited condensed consolidated financial statements.
3. Investments
Our investments include both equity method and consolidated investments. Those entities identified as VIEs have been evaluated to determine whether we are the primary beneficiary. The VIEs included under "Consolidated VIEs" below are those for which we have concluded that we are the primary beneficiary and accordingly, we have consolidated these entities. We have not provided any financial support to any of our VIEs during the three months ended March 31, 2024 that we were not previously contractually obligated to provide. Amounts due to and due from our equity method investments are recorded as affiliate accounts payable and affiliate accounts receivable which are presented within accounts payable and other current liabilities and trade receivables, net on the unaudited condensed consolidated balance sheets.
12
Authoritative guidance related to the consolidation of VIEs requires that we continually reassess whether we are the primary beneficiary of VIEs in which we have an interest. As such, the conclusion regarding the primary beneficiary status is subject to change and we continually evaluate circumstances that could require consolidation or deconsolidation. Our consolidated VIEs are Cobra Beer Partnership, Ltd. ("Cobra U.K." or "CBPL"), Rocky Mountain Metal Container ("RMMC"), and Rocky Mountain Bottle Company ("RMBC"), as well as other immaterial entities. Our unconsolidated VIEs are Brewers Retail Inc. ("BRI"), Brewers Distributor Ltd. ("BDL") and The Yuengling Company LLC ("TYC"), as well as other immaterial investments. Under our CBPL U.K. partnership agreement, our partner has exercised an option which will result in our acquisition of the remaining 49.9 % ownership interest, with the transaction anticipated to close during the second quarter of 2024 pending finalization of terms.
Both BRI and BDL have outstanding third party debt which is guaranteed by their respective shareholders. As a result, we had a guarantee liability of $31.9 million and $35.4 million recorded as of March 31, 2024 and December 31, 2023, respectively, which is presented within accounts payable and other current liabilities on the unaudited condensed consolidated balance sheets and represents our proportionate share of the outstanding balance of these debt instruments. The offset to the guarantee liability was recorded as an adjustment to our respective equity method investment within the unaudited condensed consolidated balance sheets. The resulting change in our equity method investments during the year due to movements in the guarantee represents a non-cash investing activity.
Consolidated VIEs
The following summarizes the assets and liabilities of our consolidated VIEs (including noncontrolling interests):
| As of | |||||||||||||||||||||||
| March 31, 2024 | December 31, 2023 | ||||||||||||||||||||||
| Total Assets | Total Liabilities | Total Assets | Total Liabilities | ||||||||||||||||||||
| (In millions) | |||||||||||||||||||||||
| RMMC/RMBC | $ | $ | $ | $ | |||||||||||||||||||
| Other | $ | $ | $ | $ | |||||||||||||||||||
As of March 31, 2024, for RMMC/RMBC, $93.8 million and $116.7 million were recorded in inventories, net and property, plant and equipment, net, respectively on the unaudited condensed consolidated balance sheets. As of December 31, 2023, for RMMC/RMBC, $108.2 million and $120.7 million were recorded in inventories, net and property, plant and equipment, net, respectively on the consolidated balance sheets.
4. Inventories
| As of | |||||||||||
| March 31, 2024 | December 31, 2023 | ||||||||||
| (In millions) | |||||||||||
| Finished goods | $ | $ | |||||||||
| Work in process | |||||||||||
| Raw materials | |||||||||||
| Packaging materials | |||||||||||
| Inventories, net | $ | $ | |||||||||
5. Goodwill and Intangible Assets
Goodwill
The changes in the carrying value of goodwill is presented in the table below by segment.
| Americas | EMEA&APAC | Consolidated(1) | |||||||||||||||
| (In millions) | |||||||||||||||||
| Balance as of December 31, 2023 | $ | $ | $ | ||||||||||||||
| Foreign currency translation, net | ( | ( | |||||||||||||||
| Balance as of March 31, 2024 | $ | $ | $ | ||||||||||||||
(1)Accumulated impairment losses for the Americas segment was $1,513.3 1,484.3
13
As of the date of our annual impairment test performed as of October 1, 2023, the fair value of the Americas reporting unit goodwill balance was in excess of its carrying value by slightly less than 15 %, and as such, the reporting unit continues to be at heightened risk of future impairment in the event of significant unfavorable changes in assumptions. We continue to focus on growing our core power brand net sales, aggressively premiumizing our portfolio and scaling and expanding beyond beer. While progress has been made on these strategies over recent years, including the strengthening of our core brands, the growth targets included in management’s forecasted future cash flows are inherently at risk given that the strategies are still in progress. These growth targets have factored in current expectations of the beer industry environment and broader macroeconomic conditions. However, the fair value determinations are sensitive to changes in forecasted cash flows, macroeconomic conditions, market multiples or discount rates that could negatively impact future analyses, including the impacts of cost inflation, further increases to interest rates and other external industry factors impacting our business.
We determined that there was no triggering event that occurred during the three months ended March 31, 2024 that would indicate the carrying value of our goodwill was greater than its fair value.
Intangible Assets, Other than Goodwill
The following table presents details of our intangible assets, other than goodwill, as of March 31, 2024:
| Useful life | Gross | Accumulated amortization | Net | ||||||||||||||||||||
| (Years) | (In millions) | ||||||||||||||||||||||
| Intangible assets subject to amortization | |||||||||||||||||||||||
| Brands | $ | $ | ( | $ | |||||||||||||||||||
| License agreements and distribution rights | ( | ||||||||||||||||||||||
Other | ( | ||||||||||||||||||||||
| Intangible assets not subject to amortization | |||||||||||||||||||||||
| Brands | Indefinite | — | |||||||||||||||||||||
| Distribution networks | Indefinite | — | |||||||||||||||||||||
| Other | Indefinite | — | |||||||||||||||||||||
| Total | $ | $ | ( | $ | |||||||||||||||||||
The following table presents details of our intangible assets, other than goodwill, as of December 31, 2023:
| Useful life | Gross | Accumulated amortization | Net | ||||||||||||||||||||
| (Years) | (In millions) | ||||||||||||||||||||||
| Intangible assets subject to amortization | |||||||||||||||||||||||
| Brands | $ | $ | ( | $ | |||||||||||||||||||
| License agreements and distribution rights | ( | ||||||||||||||||||||||
Other | ( | ||||||||||||||||||||||
| Intangible assets not subject to amortization | |||||||||||||||||||||||
| Brands | Indefinite | — | |||||||||||||||||||||
| Distribution networks | Indefinite | — | |||||||||||||||||||||
| Other | Indefinite | — | |||||||||||||||||||||
| Total | $ | $ | ( | $ | |||||||||||||||||||
The changes in the gross carrying amounts of intangible assets from December 31, 2023 to March 31, 2024 were primarily driven by the impact of foreign exchange rates, as a significant amount of intangible assets, other than goodwill, are denominated in foreign currencies.
14
Based on foreign exchange rates as of March 31, 2024, the estimated future amortization expense of intangible assets was as follows:
| Fiscal year | Amount | |||||||
| (In millions) | ||||||||
| 2024 - remaining | $ | |||||||
| 2025 | $ | |||||||
| 2026 | $ | |||||||
| 2027 | $ | |||||||
| 2028 | $ | |||||||
Amortization expense of intangible assets was $52.4 million and $51.1 million for the three months ended March 31, 2024 and March 31, 2023, respectively. This expense was presented within MG&A expenses in our unaudited condensed consolidated statements of operations.
As of the date of our annual impairment test of indefinite-lived intangible assets, performed as of October 1, 2023, the carrying value of the Staropramen family of brands in EMEA&APAC was determined to be in excess of its fair value such that an impairment loss was recorded during the three months ended December 31, 2023. As this was a partial impairment, the intangible asset is considered to be at a heightened risk of future impairment in the event of significant unfavorable changes in assumptions, including forecasted future cash flows based on execution of strategic initiatives for expansion and distribution of the brand, as well as discount rates and other macroeconomic factors.
The fair value of the Coors brands in the Americas, the Miller brands in the U.S. and the Carling brands in EMEA&APAC all exceeded their respective carrying values by over 15 % as of the annual testing date.
No triggering events were identified during the three months ended March 31, 2024 that would indicate the carrying values of our indefinite-lived or definite-lived intangible assets were greater than their fair values.
Fair Value Assumptions
6. Leases
Supplemental balance sheet information related to leases as of March 31, 2024 and December 31, 2023 was as follows:
| As of | ||||||||||||||
| March 31, 2024 | December 31, 2023 | |||||||||||||
| Balance Sheet Classification | (In millions) | |||||||||||||
| Operating Leases | ||||||||||||||
| Operating lease right-of-use assets | $ | $ | ||||||||||||
| Current operating lease liabilities | $ | $ | ||||||||||||
| Non-current operating lease liabilities | ||||||||||||||
| Total operating lease liabilities | $ | $ | ||||||||||||
| Finance Leases | ||||||||||||||
| Finance lease right-of-use assets | $ | $ | ||||||||||||
| Current finance lease liabilities | $ | $ | ||||||||||||
| Non-current finance lease liabilities | ||||||||||||||
| Total finance lease liabilities | $ | $ | ||||||||||||
15
Supplemental cash flow information related to leases for the three months ended March 31, 2024 and March 31, 2023 was as follows:
| Three Months Ended | |||||||||||
| March 31, 2024 | March 31, 2023 | ||||||||||
| (In millions) | |||||||||||
| Cash paid for amounts included in the measurements of lease liabilities | |||||||||||
| Operating cash flows from operating leases | $ | $ | |||||||||
| Operating cash flows from finance leases | $ | $ | |||||||||
| Financing cash flows from finance leases | $ | $ | |||||||||
| Supplemental non-cash information on right-of-use assets obtained in exchange for new lease liabilities | |||||||||||
| Operating leases | $ | $ | |||||||||
| Finance leases | $ | $ | |||||||||
As of March 31, 2024, we entered into leases that have not yet commenced with estimated aggregated future lease payments of approximately $26 million. The leases are expected to commence in 2024.
7. Debt
Debt Obligations
| As of | |||||||||||
| March 31, 2024 | December 31, 2023 | ||||||||||
| (In millions) | |||||||||||
| Long-term debt | |||||||||||
EUR | $ | $ | |||||||||
CAD | |||||||||||
$ | |||||||||||
$ | |||||||||||
$ | |||||||||||
| Finance leases | |||||||||||
| Other | |||||||||||
| Less: unamortized debt discounts and debt issuance costs | ( | ( | |||||||||
| Total long-term debt (including current portion) | |||||||||||
| Less: current portion of long-term debt | ( | ( | |||||||||
| Total long-term debt | $ | $ | |||||||||
Short-term borrowings(1) | $ | $ | |||||||||
| Current portion of long-term debt | |||||||||||
| Current portion of long-term debt and short-term borrowings | $ | $ | |||||||||
(1)Our short-term borrowings include bank overdrafts, borrowings on our overdraft facilities and other items.
As of March 31, 2024, we had $28.6 million in bank overdrafts and $69.8 million in bank cash related to our cross-border, cross-currency cash pool for a net positive position of $41.2 million. As of December 31, 2023, we had $16.5 million in bank overdrafts and $75.5 million in bank cash related to our cross-border, cross-currency cash pool for a net positive position of $59.0 million.
16
Debt Fair Value Measurements
We utilize market approaches to estimate the fair value of certain outstanding borrowings by discounting anticipated future cash flows derived from the contractual terms of the obligations using observable market interest and foreign exchange rates. As of March 31, 2024 and December 31, 2023, the fair value of our outstanding long-term debt (including the current portion of long-term debt) was approximately $5.8 billion and $5.9 billion, respectively. All senior notes are valued based on significant observable inputs and classified as Level 2 in the fair value hierarchy. The carrying values of all other outstanding long-term borrowings and our short-term borrowings approximate their fair values and are also classified as Level 2 in the fair value hierarchy.
Revolving Credit Facility and Commercial Paper
We maintain a $2.0 billion amended and restated revolving credit facility with a maturity date of June 26, 2028 that allows us to issue a maximum aggregate amount of $2.0 billion in commercial paper or make other borrowings at any time at variable interest rates. We use this facility from time to time to fund the repayment of debt upon maturity and for working capital or general purposes.
We had no no
Debt Covenants
Under the terms of each of our debt facilities, we must comply with certain restrictions. These include customary events of default and specified representations, warranties and covenants, as well as covenants that restrict our ability to incur certain additional priority indebtedness (certain thresholds of secured consolidated net tangible assets), certain leverage threshold percentages, create or permit liens on assets, and restrictions on mergers, acquisitions and certain types of sale lease-back transactions.
8. Derivative Instruments and Hedging Activities
Our risk management and derivative accounting policies are presented within Part II.—Item 8. Financial Statements, Note 1, "Basis of Presentation and Summary of Significant Accounting Policies" and Note 10, "Derivative Instruments and Hedging Activities" in our Annual Report and did not significantly change during the three months ended March 31, 2024. As noted in Part II. - Item 8. Financial Statements, Note 10, "Derivative Instruments and Hedging Activities" in our Annual Report, due to the nature of our counterparty agreements, and the fact that we are not subject to master netting arrangements, we are not able to net positions with the same counterparty and, therefore, present our derivative positions on a gross basis in our unaudited condensed consolidated balance sheets. Except as noted below, our significant derivative positions have not changed considerably since December 31, 2023.
Derivative Fair Value Measurements
We utilize market approaches to estimate the fair value of our derivative instruments by discounting anticipated future cash flows derived from the derivative's contractual terms and observable market interest, foreign exchange and commodity rates. The fair values of our derivatives also include credit risk adjustments to account for our counterparties' credit risk, as well as our own non-performance risk, as appropriate.
17
The table below summarizes our derivative assets and liabilities that were measured at fair value as of March 31, 2024 and December 31, 2023. The fair value for all derivative contracts as of March 31, 2024 and December 31, 2023 were valued using significant other observable inputs, also known as Level 2 inputs.
| As of | |||||||||||
| March 31, 2024 | December 31, 2023 | ||||||||||
| (In millions) | |||||||||||
| Forward starting interest rate swaps | $ | $ | |||||||||
| Foreign currency forwards | ( | ||||||||||
| Commodity swaps and options | ( | ( | |||||||||
| Total | $ | $ | |||||||||
As of March 31, 2024 and December 31, 2023, we had no significant transfers between Level 1 and Level 2. New derivative contracts transacted during the three months ended March 31, 2024 were all included in Level 2.
Results of Period Derivative Activity
The tables below include the results of our derivative activity in our unaudited condensed consolidated balance sheets as of March 31, 2024 and December 31, 2023, and our unaudited condensed consolidated statements of operations for the three months ended March 31, 2024 and March 31, 2023.
Fair Value of Derivative Instruments in the Unaudited Condensed Consolidated Balance Sheets (in millions):
| As of March 31, 2024 | |||||||||||||||||||||||||||||
| Derivative Assets | Derivative Liabilities | ||||||||||||||||||||||||||||
| Notional amount | Balance sheet location | Fair value | Balance sheet location | Fair value | |||||||||||||||||||||||||
| Derivatives designated as hedging instruments | |||||||||||||||||||||||||||||
| Forward starting interest rate swaps | $ | Other non-current assets | $ | Other liabilities | $ | ||||||||||||||||||||||||
| Foreign currency forwards | $ | Other current assets | Accounts payable and other current liabilities | ( | |||||||||||||||||||||||||
| Other non-current assets | Other liabilities | ( | |||||||||||||||||||||||||||
| Total derivatives designated as hedging instruments | $ | $ | ( | ||||||||||||||||||||||||||
| Derivatives not designated as hedging instruments | |||||||||||||||||||||||||||||
Commodity swaps(1) | $ | Other current assets | $ | Accounts payable and other current liabilities | $ | ( | |||||||||||||||||||||||
| Other non-current assets | Other liabilities | ( | |||||||||||||||||||||||||||
Commodity options(1) | $ | Other current assets | Accounts payable and other current liabilities | ( | |||||||||||||||||||||||||
| Total derivatives not designated as hedging instruments | $ | $ | ( | ||||||||||||||||||||||||||
| As of December 31, 2023 | |||||||||||||||||||||||||||||
| Derivative Assets | Derivative Liabilities | ||||||||||||||||||||||||||||
| Notional amount | Balance sheet location | Fair value | Balance sheet location | Fair value | |||||||||||||||||||||||||
| Derivatives designated as hedging instruments | |||||||||||||||||||||||||||||
| Forward starting interest rate swaps | $ | Other non-current assets | $ | Other liabilities | $ | ||||||||||||||||||||||||
| Foreign currency forwards | $ | Other current assets | Accounts payable and other current liabilities | ( | |||||||||||||||||||||||||
| Other non-current assets | Other liabilities | ( | |||||||||||||||||||||||||||
| Total derivatives designated as hedging instruments | $ | $ | ( | ||||||||||||||||||||||||||
| Derivatives not designated as hedging instruments | |||||||||||||||||||||||||||||
Commodity swaps(1) | $ | Other current assets | $ | Accounts payable and other current liabilities | $ | ( | |||||||||||||||||||||||
| Other non-current assets | Other liabilities | ( | |||||||||||||||||||||||||||
Commodity options(1) | $ | Other current assets | Accounts payable and other current liabilities | ( | |||||||||||||||||||||||||
| Total derivatives not designated as hedging instruments | $ | $ | ( | ||||||||||||||||||||||||||
18
The Pretax Effect of Cash Flow Hedge Accounting on Other Comprehensive Income (Loss), Accumulated Other Comprehensive Income (Loss) and Income (Loss) (in millions):
| Derivatives in cash flow hedge relationships | Amount of gain (loss) recognized in OCI on derivatives | Location of gain (loss) reclassified from AOCI into income | Amount of gain (loss) recognized from AOCI into income on derivative | |||||||||||||||||
| Three Months Ended March 31, 2024 | ||||||||||||||||||||
| Forward starting interest rate swaps | $ | Interest income (expense), net | $ | ( | ||||||||||||||||
| Foreign currency forwards | Cost of goods sold | |||||||||||||||||||
| Other non-operating income (expense), net | ( | |||||||||||||||||||
| Total | $ | $ | ( | |||||||||||||||||
| Three Months Ended March 31, 2023 | ||||||||||||||||||||
| Forward starting interest rate swaps | $ | ( | Interest income (expense), net | $ | ( | |||||||||||||||
| Foreign currency forwards | ( | Cost of goods sold | ||||||||||||||||||
| Other non-operating income (expense), net | ( | |||||||||||||||||||
| Total | $ | ( | $ | ( | ||||||||||||||||
| Net investment hedge relationships | Amount of gain (loss) recognized in OCI | Location of gain (loss) recognized in income (amount excluded from effectiveness testing) | Amount of gain (loss) recognized in income (amount excluded from effectiveness testing) (1) | |||||||||||||||||
| Three Months Ended March 31, 2024 | ||||||||||||||||||||
EUR | $ | Other non-operating income (expense), net | $ | |||||||||||||||||
| Three Months Ended March 31, 2023 | ||||||||||||||||||||
EUR | $ | ( | Other non-operating income (expense), net | $ | ||||||||||||||||
(1)Represents amounts excluded from the assessment of effectiveness for which the difference between changes in fair value and period amortization is recorded in OCI.
The cumulative translation adjustments related to our net investment hedges remain in AOCI until the respective underlying net investment is sold or liquidated. During the three months ended March 31, 2024 and March 31, 2023, respectively, we did not reclassify any amounts related to net investment hedges from AOCI into earnings.
As of March 31, 2024, we expect net losses of approximately $1 million (pretax) recorded in AOCI will be reclassified into earnings within the next 12 months. For derivatives designated in cash flow hedge relationships, the maximum length of time over which forecasted transactions are hedged as of March 31, 2024 is approximately 3 years, as well as those related to our forecasted debt issuances in 2026.
The Effect of Derivatives Not Designated as Hedging Instruments on the Unaudited Condensed Consolidated Statements of Operations (in millions):
| Derivatives not in hedging relationships | Location of gain (loss) recognized in income on derivative | Amount of gain (loss) recognized in income on derivative | ||||||||||||
| Three Months Ended March 31, 2024 | ||||||||||||||
| Commodity swaps | Cost of goods sold | $ | ( | |||||||||||
| Three Months Ended March 31, 2023 | ||||||||||||||
| Commodity swaps | Cost of goods sold | $ | ( | |||||||||||
9. Income Tax
| Three Months Ended | |||||||||||
| March 31, 2024 | March 31, 2023 | ||||||||||
| Effective tax rate | % | % | |||||||||
19
The lower effective tax rate for the three months ended March 31, 2024 compared to the prior year was primarily due to a decrease in net discrete tax expense. We recognized a $5.7 million discrete tax benefit in the three months ended March 31, 2024 as compared to recognition of $7.5 million discrete tax expense in the three months ended March 31, 2023.
Our tax rate can be volatile and may change with, among other things, the amount and source of pretax income or loss, our ability to utilize foreign tax credits, excess tax benefits or deficiencies from share-based compensation, changes in tax laws and the movement of liabilities established pursuant to accounting guidance for uncertain tax positions as statutes of limitations expire, positions are effectively settled, or when additional information becomes available. There are proposed or pending tax law changes in various jurisdictions and other changes to regulatory environments in countries in which we do business that, if enacted, could have an impact on our effective tax rate.
Recently, intergovernmental entities such as the Organization for Economic Development ("OECD") and European Union ("EU") have proposed changes to the existing tax laws of member countries, including model rules introduced by the OECD for a new 15% global minimum tax. In December 2022, the EU member states agreed to incorporate the 15% global minimum tax into their respective domestic laws effective for fiscal years beginning on or after December 31, 2023. In addition, several non-EU countries, including the U.K., have proposed and/or adopted legislation consistent with the OECD global minimum tax framework. The global minimum tax, which is now effective in countries with enacted legislation, did not materially impact our financial or cash tax position in the three months ended March 31, 2024. We continue to evaluate the impact on future periods as previously-enacting countries issue related guidance and additional countries consider adoption of the global minimum tax rules.
10. Commitments and Contingencies
Litigation and Other Disputes and Environmental
Related to litigation, other disputes and environmental issues, we have an aggregate accrued contingent liability of $70.9 million and $70.2 million as of March 31, 2024 and December 31, 2023, respectively. While we cannot predict the eventual aggregate cost for litigation, other disputes and environmental matters in which we are currently involved, we believe adequate reserves have been provided for losses that are probable and estimable. For all matters unless otherwise noted below, we believe that any reasonably possible losses in excess of the amounts accrued are immaterial to our unaudited condensed consolidated financial statements. Our litigation, other disputes and environmental issues are discussed in further detail within Part II.—Item 8. Financial Statements, Note 13, "Commitments and Contingencies" in our Annual Report and did not significantly change during the three months ended March 31, 2024.
Other than those disclosed below, we are also involved in other disputes and legal actions arising in the ordinary course of our business. While it is not feasible to predict or determine the outcome of these proceedings, in our opinion, based on a review with legal counsel, other than as noted, none of these disputes or legal actions are expected to have a material impact on our business, consolidated financial position, results of operations or cash flows. However, litigation is subject to inherent uncertainties and an adverse result in these, or other matters, may arise from time to time that may harm our business.
On February 12, 2018, Stone Brewing Company filed a trademark infringement lawsuit in federal court in the Southern District of California against Molson Coors Beverage Company USA LLC ("MCBC USA"), a wholly owned subsidiary of our Company, alleging that the Keystone brand had “rebranded” itself as “Stone” and was marketing itself in a manner confusingly similar to Stone Brewing Company's registered Stone trademark. In the first quarter of 2022, a jury returned a verdict in which it concluded that trademark infringement had occurred and awarded Stone Brewing Company $56.0 million in damages. After denial of post-trial motions, in the fourth quarter of 2023, MCBC USA filed a notice of appeal in the 9th Circuit Court of Appeals. As of March 31, 2024 and December 31, 2023, the Company had a recorded accrued liability of $59.0 million and $58.5 million, respectively, within other liabilities on our unaudited condensed consolidated balance sheets reflecting the best estimate of probable loss in this case based on the judgment plus associated post-judgment interest. However, it is reasonably possible that the estimate of the loss could change in the near term based on the progression of the case, including the appeals process. We will continue to monitor the status of the case and will adjust the accrual in the period in which any significant change occurs which could impact the estimate of the loss for this matter.
20
Regulatory Contingencies
The Province of Ontario and Molson Canada 2005, a wholly owned indirect subsidiary of our Company, Labatt Brewing Company Limited, Sleeman Breweries Ltd. (collectively, the "Representative Owners") and The Beer Store ("TBS") are parties to a Master Framework Agreement ("MFA") that dictates the terms of the beer distribution and retail systems in Ontario. In December 2023, the Province of Ontario notified the Representative Owners and TBS that it would not be renewing the MFA after the initial term expires on December 31, 2025. The Province of Ontario simultaneously announced a set of non-binding key principles ("Key Principles") agreed upon between the Province of Ontario, the Representative Owners and TBS, concerning the intended features of the future marketplace for beer distribution and retail systems in the Province of Ontario which are expected to be introduced no later than January 1, 2026. Under the Key Principles, TBS will be permitted to continue its retail operations and will continue to be the primary distributor of beer in the Province of Ontario through at least 2031. The Key Principles also state grocery stores, convenience stores, gas stations and big-box retailers in the Province of Ontario will be able to apply for licenses to sell beer, wine, cider and ready-to-drink cocktails starting no later than January 1, 2026. We continue to evaluate the impacts of the Key Principles and the expected future marketplace for beer distribution and retail systems in the Province of Ontario on our results of operations.
Guarantees and Indemnities
We guarantee indebtedness and other obligations to banks and other third parties for some of our equity method investments and consolidated subsidiaries. As of March 31, 2024 and December 31, 2023, the unaudited condensed consolidated balance sheets include liabilities related to these guarantees of $33.4 million and $36.9 million, respectively.
Separately, related to our Cervejarias Kaiser Brasil S.A. ("Kaiser") indemnities, we accrued $11.4 million and $11.8 million, in aggregate, as of March 31, 2024 and December 31, 2023 respectively. Our Kaiser liabilities are discussed in further detail within Part II.—Item 8. Financial Statements, Note 13, "Commitments and Contingencies" in our Annual Report and did not significantly change during the three months ended March 31, 2024.
11. Accumulated Other Comprehensive Income (Loss)
| MCBC stockholders' equity | |||||||||||||||||||||||||||||
| Foreign currency translation adjustments | Gain (loss) on derivative instruments | Pension and postretirement benefit adjustments | Equity method investments | Accumulated other comprehensive income (loss) | |||||||||||||||||||||||||
| (In millions) | |||||||||||||||||||||||||||||
| As of December 31, 2023 | $ | ( | $ | $ | ( | $ | ( | $ | ( | ||||||||||||||||||||
| Foreign currency translation adjustments | ( | — | — | — | ( | ||||||||||||||||||||||||
| Gain (loss) recognized on net investment hedges | — | — | — | ||||||||||||||||||||||||||
| Unrealized gain (loss) recognized on derivative instruments | — | — | — | ||||||||||||||||||||||||||
| Derivative instrument activity reclassified from other comprehensive income (loss) | — | — | — | ||||||||||||||||||||||||||
| Pension and other postretirement activity reclassified from other comprehensive income (loss) | — | — | ( | — | ( | ||||||||||||||||||||||||
| Ownership share of unconsolidated subsidiaries' other comprehensive income (loss) | — | — | — | ||||||||||||||||||||||||||
| Tax benefit (expense) | ( | ( | ( | ( | |||||||||||||||||||||||||
| As of March 31, 2024 | $ | ( | $ | $ | ( | $ | ( | $ | ( | ||||||||||||||||||||
21
12. Other Operating Income (Expense), net
We have recorded incurred charges or realized benefits that we believe are significant to our current operating results warranting separate classification in other operating income (expense), net.
| Three Months Ended | |||||||||||
| March 31, 2024 | March 31, 2023 | ||||||||||
| (In millions) | |||||||||||
| Restructuring | |||||||||||
| Employee-related charges | $ | $ | ( | ||||||||
Gains (losses) on disposals and other | |||||||||||
| Other operating income (expense), net | $ | $ | ( | ||||||||
13. Segment Reporting
Our reporting segments are based on the key geographic regions in which we operate and include the Americas and EMEA&APAC segments. Our Americas segment operates in the U.S., Canada and various countries in the Caribbean, Latin and South America and our EMEA&APAC segment operates in Bulgaria, Croatia, Czech Republic, Hungary, Montenegro, the Republic of Ireland, Romania, Serbia, the U.K., various other European countries and certain countries within the Middle East, Africa and Asia Pacific.
We also have certain activity that is not allocated to our segments, which has been reflected as "Unallocated" below. Specifically, Unallocated activity primarily includes financing-related costs such as interest expense and income, foreign exchange gains and losses on intercompany balances, realized and unrealized changes in fair value on derivative instruments not designated in hedging relationships related to financing and other treasury-related activities and the unrealized changes in fair value on our commodity swaps not designated in hedging relationships recorded within cost of goods sold, which are later reclassified when realized to the segment in which the underlying exposure resides. Additionally, only the service cost component of net periodic pension and OPEB cost is reported within each operating segment and all other components remain in Unallocated.
Summarized Financial Information
Net sales from transactions with one customer of our Americas segment represented approximately $0.3 billion and $0.2 billion of our consolidated net sales for the three months ended March 31, 2024 and March 31, 2023 respectively.
Consolidated net sales represent sales to third-party external customers less excise taxes. Inter-segment transactions impacting net sales and income (loss) before income taxes eliminate upon consolidation and are primarily related to the Americas segment royalties received from, and sales to the EMEA&APAC segment.
The following tables present net sales and income (loss) before income taxes by segment:
| Three Months Ended | |||||||||||
| March 31, 2024 | March 31, 2023 | ||||||||||
| (In millions) | |||||||||||
| Americas | $ | $ | |||||||||
| EMEA&APAC | |||||||||||
| Inter-segment net sales eliminations | ( | ( | |||||||||
| Consolidated net sales | $ | $ | |||||||||
| Three Months Ended | |||||||||||
| March 31, 2024 | March 31, 2023 | ||||||||||
| (In millions) | |||||||||||
| Americas | $ | $ | |||||||||
| EMEA&APAC | ( | ( | |||||||||
| Unallocated | ( | ( | |||||||||
| Consolidated income (loss) before income taxes | $ | $ | |||||||||
22
The following table presents total assets by segment:
| As of | |||||||||||
| March 31, 2024 | December 31, 2023 | ||||||||||
| (In millions) | |||||||||||
| Americas | $ | $ | |||||||||
| EMEA&APAC | |||||||||||
| Consolidated total assets | $ | $ | |||||||||
23
ITEM 2. MANAGEMENT'S DISCUSSION AND ANALYSIS OF FINANCIAL CONDITION AND RESULTS OF OPERATIONS
Overview
For over two centuries, we have been brewing beverages that unite people to celebrate all life’s moments. From our core power brands Coors Light, Miller Lite, Coors Banquet, Molson Canadian, Carling and Ožujsko to our above premium brands including Madri, Staropramen, Blue Moon Belgian White and Leinenkugel’s Summer Shandy, to our economy and value brands like Miller High Life and Keystone, we produce many beloved and iconic beer brands. While our Company’s history is rooted in beer, we offer a modern portfolio that expands beyond the beer aisle as well, including flavored beverages like Vizzy Hard Seltzer, spirits like Five Trail whiskey as well as non-alcoholic beverages. As a business, our ambition is to be the first choice for our people, our consumers and our customers, and our success depends on our ability to make our products available to meet a wide range of consumer segments and occasions.
Management's Discussion and Analysis of Financial Condition and Results of Operations ("MD&A") in this Quarterly Report on Form 10-Q is provided as a supplement to, and should be read in conjunction with, our audited consolidated financial statements, the accompanying notes and the MD&A included in our Annual Report on Form 10-K for the fiscal year ended December 31, 2023 ("Annual Report"), as well as our unaudited condensed consolidated financial statements and the accompanying notes included in this report. Due to the seasonality of our operating results, quarterly financial results are not necessarily indicative of the results that may be achieved for the full year or any other future period.
Unless otherwise noted in this report, any description of "we," "us" or "our" includes Molson Coors Beverage Company ("MCBC" or the "Company"), principally a holding company, and its operating and non-operating subsidiaries included within our reporting segments. Our reporting segments include Americas and EMEA&APAC. Our Americas segment operates in the U.S., Canada and various countries in the Caribbean, Latin and South America and our EMEA&APAC segment operates in Bulgaria, Croatia, Czech Republic, Hungary, Montenegro, the Republic of Ireland, Romania, Serbia, the U.K., various other European countries, and certain countries within the Middle East, Africa and Asia Pacific.
Unless otherwise indicated, information in this report is presented in USD and comparisons are to comparable prior periods. Our primary operating currencies, other than the USD, include the CAD, the GBP, and our Central European operating currencies such as the EUR, CZK, RON and RSD.
24
Consolidated Results of Operations
The following table highlights summarized components of our unaudited condensed consolidated statements of operations for the three months ended March 31, 2024 and 2023. See Part I.—Item 1. Financial Statements for additional details of our U.S. GAAP results.
| Three Months Ended | |||||||||||||||||
| March 31, 2024 | March 31, 2023 | % change | |||||||||||||||
| (In millions, except percentages and per share data) | |||||||||||||||||
| Net sales | $ | 2,596.4 | $ | 2,346.3 | 10.7 | % | |||||||||||
| Cost of goods sold | (1,632.9) | (1,575.6) | 3.6 | % | |||||||||||||
| Gross profit | 963.5 | 770.7 | 25.0 | % | |||||||||||||
| Marketing, general and administrative expenses | (654.6) | (615.0) | 6.4 | % | |||||||||||||
| Other operating income (expense), net | 6.3 | (0.5) | N/M | ||||||||||||||
| Equity income (loss) | (0.9) | 3.0 | N/M | ||||||||||||||
| Operating income (loss) | 314.3 | 158.2 | 98.7 | % | |||||||||||||
| Total non-operating income (expense), net | (48.9) | (56.3) | (13.1) | % | |||||||||||||
| Income (loss) before income taxes | 265.4 | 101.9 | 160.5 | % | |||||||||||||
| Income tax benefit (expense) | (55.5) | (28.7) | 93.4 | % | |||||||||||||
| Net income (loss) | 209.9 | 73.2 | 186.7 | % | |||||||||||||
| Net (income) loss attributable to noncontrolling interests | (2.1) | (0.7) | 200.0 | % | |||||||||||||
| Net income (loss) attributable to MCBC | $ | 207.8 | $ | 72.5 | 186.6 | % | |||||||||||
| Net income (loss) attributable to MCBC per diluted share | $ | 0.97 | $ | 0.33 | 193.9 | % | |||||||||||
| Financial volume in hectoliters | 17.974 | 17.006 | 5.7 | % | |||||||||||||
N/M = Not meaningful
Foreign currency impacts on results
During the three months ended March 31, 2024, foreign currency movements had the following impacts on our USD consolidated results:
•Net sales - Favorable impact of $12.6 million (favorable impact for EMEA&APAC and Americas of $11.8 million and $0.8 million, respectively).
•Cost of goods sold - Unfavorable impact of $8.5 million (unfavorable impact for EMEA&APAC and Americas of $8.0 million and $0.6 million, respectively, partially offset by the favorable impact for Unallocated of $0.1 million).
•MG&A - Unfavorable impact of $3.8 million (unfavorable impact for EMEA&APAC and Americas of $3.6 million and $0.2 million, respectively).
•Income (loss) before income taxes - Unfavorable impact of $7.6 million (unfavorable impact for Unallocated, EMEA&APAC and Americas of $4.4 million, $1.9 million and $1.3 million, respectively).
The impacts of foreign currency movements on our consolidated USD results described above for the three months ended March 31, 2024 were primarily due to the weakening of the USD compared to the GBP.
Included in these amounts are both translational and transactional impacts of changes in foreign exchange rates. We calculate the impact of foreign exchange by translating our current period local currency results at the average exchange rates used to translate the financial statements in the comparable prior year period during the respective period throughout the year and comparing that amount with the reported amount for the period. The impact of transactional foreign currency gains and losses, including the impact of undesignated foreign currency forwards, is recorded within other non-operating income (expense), net in our unaudited condensed consolidated statements of operations.
25
Volume
Financial volume represents owned or actively managed brands sold to unrelated external customers within our geographic markets (net of returns and allowances), as well as contract brewing, wholesale/factored non-owned volume and company-owned distribution volume. This metric is presented on an STW basis to reflect the sales from our operations to our direct customers, generally distributors. We believe this metric is important and useful for investors and management because it gives an indication of the amount of beer and adjacent products that we have produced and shipped to customers. This metric excludes royalty volume, which consists of our brands produced and sold under various license and contract brewing agreements. Factored volume in our EMEA&APAC segment is the distribution of beer, wine, spirits and other products owned and produced by other companies to the on-premise channel, which is a common arrangement in the U.K.
Net Sales
The following table highlights the drivers of the change in net sales for the three months ended March 31, 2024 compared to March 31, 2023 (in percentages):
| Financial Volume | Price and Sales Mix | Currency | Total | ||||||||||||||||||||
| Consolidated net sales | 5.7 | % | 4.4 | % | 0.6 | % | 10.7 | % | |||||||||||||||
Net sales increased 10.7% for the three months ended March 31, 2024, compared to prior year, driven by higher financial volumes, favorable price and sales mix and favorable foreign currency impacts.
Financial volumes increased 5.7% for the three months ended March 31, 2024, compared to prior year, primarily due to higher financial volumes in the Americas segment.
Price and sales mix favorably impacted net sales for the three months ended March 31, 2024 by 4.4% primarily due to increased net pricing as well as favorable sales mix as a result of lower contract brewing volume in the the Americas segment.
A discussion of currency impacts on net sales is included in the "Foreign currency impacts on results" section above.
Cost of goods sold
We utilize cost of goods sold per hectoliter, as well as the year over year changes in this metric, as a key metric for analyzing our results. This metric is calculated as cost of goods sold per our unaudited condensed consolidated statements of operations divided by financial volume for the respective period. We believe this metric is important and useful for investors and management because it provides an indication of the trends of sales mix and other cost impacts on our cost of goods sold.
Cost of goods sold increased 3.6% for the three months ended March 31, 2024, compared to prior year, primarily due to higher financial volumes and unfavorable foreign currency impacts, partially offset by lower cost of goods sold per hectoliter. Cost of goods sold per hectoliter improved 1.9% for the three months ended March 31, 2024 compared to prior year, including unfavorable foreign currency impacts of 0.6%, primarily due to the favorable changes in our unrealized mark-to-market derivative positions of $52.6 million, the benefits of cost savings and volume leverage, partially offset by cost inflation related to materials and manufacturing expenses and unfavorable mix driven by lower contract brewing volumes in the Americas segment.
Marketing, general and administrative expenses
MG&A expenses increased 6.4% for the three months ended March 31, 2024 compared to prior year, primarily due to increased marketing investment to support our brands and innovations and unfavorable foreign currency impacts.
Other operating income (expense), net
See Part I.—Item 1. Financial Statements, Note 12, "Other Operating Income (Expense), net" for detail of our other operating income (expense), net.
Total non-operating income (expense), net
Total non-operating expense, net improved 13.1% for the three months ended March 31, 2024, compared to prior year, primarily due to lower net interest expense of 18.1% as a result of higher interest income from higher cash balances and higher interest rates as well as our continued deleveraging actions and higher pension and OPEB non-service net benefit, partially offset by unfavorable transactional foreign currency impacts.
26
Income taxes benefit (expense)
| Three Months Ended | |||||||||||
| March 31, 2024 | March 31, 2023 | ||||||||||
| Effective tax rate | 21 | % | 28 | % | |||||||
The lower effective tax rate for the three months ended March 31, 2024 compared to the same period in the prior year was primarily due to a decrease in net discrete tax expense. We recognized a $5.7 million discrete tax benefit in the three months ended March 31, 2024 compared to $7.5 million discrete tax expense in the three months ended March 31, 2023.
Our tax rate can be volatile and may change with, among other things, the amount and source of pretax income or loss, our ability to utilize foreign tax credits, excess tax benefits or deficiencies from share-based compensation, changes in tax laws and the movement of liabilities established pursuant to accounting guidance for uncertain tax positions as statutes of limitations expire, positions are effectively settled or when additional information becomes available. There are proposed or pending tax law changes in various jurisdictions and other changes to regulatory environments in countries in which we do business that, if enacted, could have an impact on our effective tax rate.
Refer to Part I.—Item 1. Financial Statements, Note 9, "Income Tax" for discussion regarding our effective tax rate.
Segment Results of Operations
Americas Segment
| Three Months Ended | |||||||||||||||||
| March 31, 2024 | March 31, 2023 | % change | |||||||||||||||
| (In millions, except percentages) | |||||||||||||||||
Net sales(1) | $ | 2,145.4 | $ | 1,939.0 | 10.6 | % | |||||||||||
| Income (loss) before income taxes | $ | 320.6 | $ | 233.4 | 37.4 | % | |||||||||||
Financial volume in hectoliters(1)(2) | 13.910 | 12.936 | 7.5 | % | |||||||||||||
(1)Includes gross inter-segment sales and volumes which are eliminated in the consolidated totals.
(2)Excludes royalty volume of 0.591 million hectoliters and 0.618 million hectoliters for the three months ended March 31, 2024 and March 31, 2023, respectively.
Net sales
The following table highlights the drivers of the change in net sales for the three months ended March 31, 2024 compared to March 31, 2023 (in percentages):
| Financial Volume | Price and Sales Mix | Currency | Total | ||||||||||||||||||||
| Americas net sales | 7.5 | % | 3.1 | % | 0.0 | % | 10.6 | % | |||||||||||||||
Net sales increased 10.6% for the three months ended March 31, 2024, compared to prior year, driven by higher financial volumes and favorable price and sales mix.
Financial volumes increased 7.5% for the three months ended March 31, 2024, compared to prior year, primarily due to an increase in U.S. volumes driven by volume growth in our core brands, partially offset by lower contract brewing volumes related to the wind down of a contract brewing arrangement leading up to the termination by the end of 2024. The increase in U.S. volume was impacted by the continued shifts in consumer purchasing behavior largely within the premium beer segment and the building of distributor inventory levels to support the peak summer selling season and to mitigate the impact of the Fort Worth brewery strike that commenced in mid-February 2024.
Price and sales mix favorably impacted net sales for the three months ended March 31, 2024 by 3.1% primarily due to increased net pricing and favorable sales mix as a result of lower contract brewing volumes in the U.S. related to the wind down of a contract brewing arrangement leading up to the termination by the end of 2024.
A discussion of currency impacts on net sales is included in the "Foreign currency impacts on results" section above.
27
Income (loss) before income taxes
Income before income taxes improved 37.4% for the three months ended March 31, 2024 compared to prior year, primarily due to higher financial volumes, increased net pricing, favorable sales mix and cost savings initiatives, partially offset by cost inflation related to materials and manufacturing expenses, as well as higher MG&A expense. Higher MG&A spend was primarily due to increased marketing investment to support our brands and innovations.
EMEA&APAC Segment
| Three Months Ended | |||||||||||||||||
| March 31, 2024 | March 31, 2023 | % change | |||||||||||||||
| (In millions, except percentages) | |||||||||||||||||
Net sales(1) | $ | 454.7 | $ | 410.1 | 10.9 | % | |||||||||||
| Income (loss) before income taxes | $ | (11.0) | $ | (25.4) | (56.7) | % | |||||||||||
Financial volume in hectoliters(1)(2) | 4.064 | 4.071 | (0.2) | % | |||||||||||||
(1)Includes gross inter-segment sales and volumes which are eliminated in the consolidated totals.
(2)Excludes royalty volume of 0.218 million hectoliters and 0.156 million hectoliters for the three months ended March 31, 2024 and March 31, 2023 respectively.
The following table highlights the drivers of the change in net sales for the three months ended March 31, 2024 compared to March 31, 2023 (in percentages):
| Financial Volume | Price and Sales Mix | Currency | Total | ||||||||||||||||||||
| EMEA&APAC net sales | (0.2) | % | 8.2 | % | 2.9 | % | 10.9 | % | |||||||||||||||
Net sales increased 10.9% for the three months ended March 31, 2024, compared to prior year, driven by favorable price and sales mix as well as favorable foreign currency impacts, partially offset by slightly unfavorable financial volumes.
Financial volumes slightly decreased 0.2% for the three months ended March 31, 2024, compared to prior year primarily due to lower volumes in Western Europe impacted by challenges in the U.K. off-premise, partially offset by increased volumes in Central and Eastern Europe as inflation pressures ease for this market.
Price and sales mix favorably impacted net sales for the three months ended March 31, 2024 by 8.2%, primarily due to increased net pricing to customers and favorable sales mix driven by premiumization.
A discussion of currency impacts on net sales is included in the "Foreign currency impacts on results" section above.
Income (loss) before income taxes
Loss before income taxes improved $14.4 million or 56.7% for the three months ended March 31, 2024, compared to the prior year, primarily due to increased net pricing to customers and favorable sales mix, partially offset by higher MG&A expense. Higher MG&A spend was primarily due to increased marketing to support our brands and innovations as well as cost inflation and unfavorable foreign currency impacts.
Unallocated Segment
We have certain activity that is not allocated to our segments, which has been reflected as "Unallocated" below. Specifically, "Unallocated" activity primarily includes financing-related costs such as interest expense and income, foreign exchange gains and losses on intercompany balances and realized and unrealized changes in fair value on instruments not designated in hedging relationships related to financing and other treasury-related activities and the unrealized changes in fair value on our commodity swaps not designated in hedging relationships recorded within cost of goods sold, which are later reclassified when realized to the segment in which the underlying exposure resides. Additionally, only the service cost component of net periodic pension and OPEB cost is reported within each operating segment, and all other components remain unallocated.
28
| Three Months Ended | |||||||||||||||||
| March 31, 2024 | March 31, 2023 | % change | |||||||||||||||
| (In millions, except percentages) | |||||||||||||||||
| Cost of goods sold | $ | 0.5 | $ | (50.7) | N/M | ||||||||||||
| Gross profit | 0.5 | (50.7) | N/M | ||||||||||||||
| Operating income (loss) | 0.5 | (50.7) | N/M | ||||||||||||||
| Total non-operating income (expense), net | (44.7) | (55.4) | (19.3) | % | |||||||||||||
| Income (loss) before income taxes | $ | (44.2) | $ | (106.1) | (58.3) | % | |||||||||||
N/M = Not meaningful
Cost of goods sold
The unrealized changes in fair value on our commodity derivatives, which are economic hedges, make up substantially all of the activity presented within cost of goods sold in the table above for the three months ended March 31, 2024 and March 31, 2023. As the exposure we are managing is realized, we reclassify the gain or loss on our commodity derivatives to the segment in which the underlying exposure resides, allowing our segments to realize the economic effects of the derivative without the resulting unrealized mark-to-market volatility. See Part I.—Item 1. Financial Statements, Note 8, "Derivative Instruments and Hedging Activities" for further information.
Total non-operating income (expense), net
Total non-operating expense, net improved 19.3% for the three months ended March 31, 2024, compared to prior year, primarily due to lower net interest expense of 17.8% as a result of higher interest income from higher cash balances and higher interest rates as well as our continued deleveraging actions and higher pension and OPEB non-service net benefit, partially offset by the unfavorable impact of transactional foreign currency impacts.
See Part I.—Item 1. Financial Statements, Note 7, "Debt" for further details on our debt instruments.
Liquidity and Capital Resources
Liquidity
Overview
Our primary sources of liquidity include cash provided by operating activities and access to external capital. We continue to monitor world events which may create credit or economic challenges that could adversely impact our profit or operating cash flows and our ability to obtain additional liquidity. We currently believe that our cash and cash equivalents, cash flows from operations and cash provided by short-term and long-term borrowings, when necessary, will be adequate to meet our ongoing operating requirements, scheduled principal and interest payments on debt, anticipated dividend payments, capital expenditures and other obligations for the twelve months subsequent to the date of the issuance of this quarterly report and our long-term liquidity requirements. We do not have any restrictions that prevent or limit our ability to declare or pay dividends.
While a significant portion of our cash flows from operating activities are generated within the U.S., our cash balances include cash held outside the U.S. and in currencies other than the USD. As of March 31, 2024, approximately 54% of our cash and cash equivalents were located outside the U.S., largely denominated in foreign currencies. Fluctuations in foreign currency exchange rates have had and may continue to have a material impact on these foreign cash balances. Cash balances in foreign countries are often subject to additional restrictions. We may, therefore, have difficulties timely repatriating cash held outside the U.S., and such repatriation may be subject to tax. These limitations may affect our ability to fully utilize our cash resources for needs in the U.S. and other countries and may adversely affect our liquidity. To the extent necessary, we accrue for tax consequences on the earnings of our foreign subsidiaries as they are earned. We may utilize tax planning and financing strategies in an effort to ensure that our worldwide cash is available in the locations in which it is needed. We periodically review and evaluate these plans and strategies, including externally committed and non-committed credit agreements accessible by our Company and each of our operating subsidiaries. We believe these financing arrangements, along with the cash generated from the operations of our U.S. business, are sufficient to fund our current cash needs in the U.S.
Cash Flows and Use of Cash
Our business historically generates positive operating cash flows each year and our debt maturities are generally of a longer-term nature. However, our liquidity could be impacted significantly by the risk factors we described in Part I—Item 1A. "Risk Factors" in our Annual Report, Part II.—Item 1A. "Risk Factors" in this report and the items listed above.
29
Cash Flows from Operating Activities
Net cash provided by operating activities of $25.4 million for the three months ended March 31, 2024 increased $22.0 million compared to $3.4 million for the three months ended March 31, 2023. The increase in net cash provided by operating activities was primarily due to higher net income and lower interest paid, partially offset by the unfavorable timing of working capital. The unfavorable timing of working capital was primarily driven by the timing of cash receipts on trade receivables as well as higher payments for prior year annual incentive compensation.
Cash Flows from Investing Activities
Net cash used in investing activities of $212.5 million for the three months ended March 31, 2024 increased $35.1 million compared to $177.4 million for the three months ended March 31, 2023. The increase in net cash used in investing activities was primarily due to higher capital expenditures driven by the timing of capital projects.
Cash Flows from Financing Activities
Net cash used in financing activities of $216.2 million for the three months ended March 31, 2024 increased $113.7 million compared to $102.5 million for the three months ended March 31, 2023. The increase in net cash used in financing activities was primarily due to higher Class B common stock share repurchases and higher dividend payments.
Capital Resources, including Material Cash Requirements
Cash and Cash Equivalents
As of March 31, 2024, we had total cash and cash equivalents of $458.4 million, compared to $868.9 million as of December 31, 2023 and $328.2 million as of March 31, 2023. The decrease in cash and cash equivalents from December 31, 2023 was primarily due to capital expenditures, Class B common stock share repurchases and dividends paid, partially offset by the net proceeds from operating activities. The increase in cash and cash equivalents from March 31, 2023 was primarily due to the net cash provided by operating activities, partially offset by capital expenditures, net debt repayments, including the repayment of our CAD 500 million 2.84% notes which matured in July 2023, dividend payments, Class B common stock share repurchases as well as cash paid for acquisitions.

30
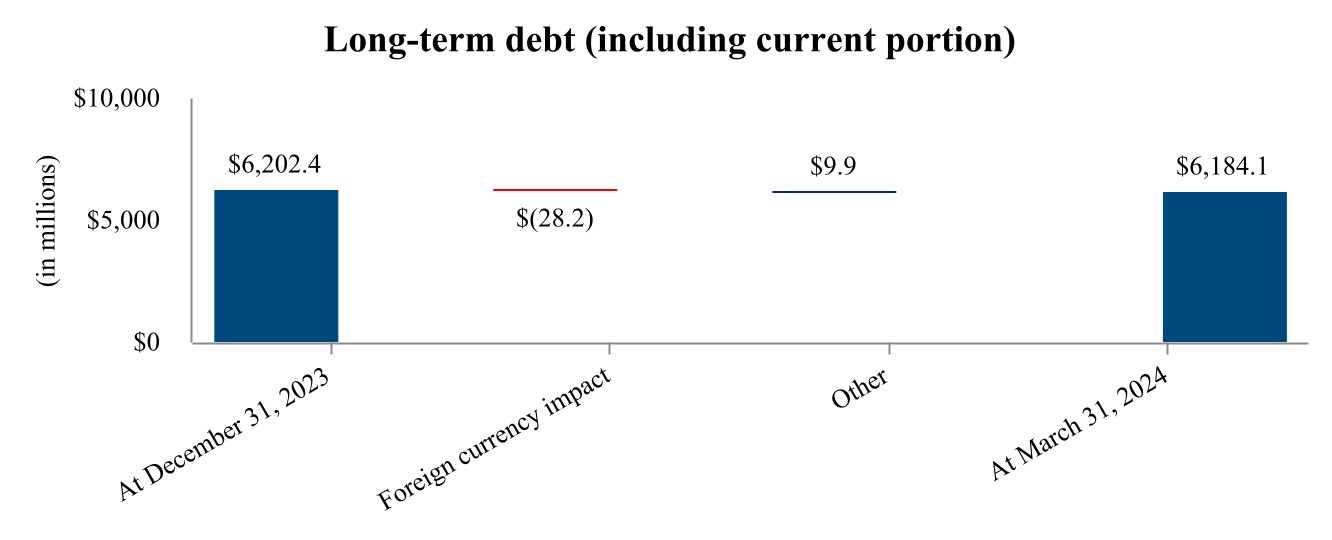
Based on the credit profile of our lenders that are party to our credit facilities, we are confident in our ability to draw on our amended and restated revolving credit facility if the need arises. As of March 31, 2024, we had $2.0 billion available to draw on our $2.0 billion amended and restated revolving credit facility. As of March 31, 2024, we had no borrowings drawn on this amended and restated revolving credit facility and no commercial paper borrowings.
We intend to further utilize our cross-border, cross currency cash pool as well as our commercial paper programs for liquidity as needed. We also have CAD, GBP and USD overdraft facilities across several banks should we need additional short-term liquidity.
Under the terms of each of our debt facilities, we must comply with certain restrictions. These include customary events of default and specified representations, warranties and covenants, as well as covenants that restrict our ability to incur certain additional priority indebtedness (certain thresholds of secured consolidated net tangible assets), certain leverage threshold percentages, create or permit liens on assets and restrictions on mergers, acquisitions and certain types of sale lease-back transactions.
The maximum net debt to EBITDA leverage ratio, as defined by the amended and restated revolving credit facility agreement, was 4.00x as of March 31, 2024 and December 31, 2023. As of March 31, 2024 and December 31, 2023, we were in compliance with all of these restrictions and covenants, have met such financial ratios and have met all debt payment obligations. All of our outstanding senior notes as of March 31, 2024 rank pari-passu.
See Part I.—Item 1. Financial Statements, Note 7, "Debt" for further discussion of our borrowings and available sources of borrowings, including lines of credit.
Guarantees
We guarantee indebtedness and other obligations to banks and other third parties for some of our equity method investments and consolidated subsidiaries. See Part I.—Item 1. Financial Statements, Note 10, "Commitments and Contingencies" for further discussion.
Material Cash Requirements from Contractual and Other Obligations
There were no material changes to our material cash requirements from contractual and other obligations outside the ordinary course of business or due to factors similar in nature to inflation, changing prices on operations or changes in the remaining terms of the contracts since December 31, 2023, as reported in Part II.— Item 7. Management's Discussion and Analysis of Financial Condition and Results of Operations, "Material Cash Requirements from Contractual and Other Obligations" in our Annual Report.
Credit Rating
Our current long-term credit ratings are BBB/Stable Outlook, Baa2/Positive Outlook and BBB/Stable Outlook with Standard & Poor's, Moody's and DBRS, respectively. Our short-term credit ratings are A-2, Prime-2 and R-2, respectively. A securities rating is not a recommendation to buy, sell or hold securities, and it may be revised or withdrawn at any time by the applicable rating agency.
31
Guarantor Information
SEC Registered Securities
For purposes of this disclosure, including the tables, "Parent Issuer" shall mean MCBC in its capacity as the issuer of the senior notes under the May 2012 Indenture and the July 2016 Indenture. "Subsidiary Guarantors" shall mean certain Canadian and U.S. subsidiaries reflecting the substantial operations of our Americas segment.
Pursuant to the indenture dated May 3, 2012 (as amended, the "May 2012 Indenture"), MCBC issued its outstanding 5.0% senior notes due 2042. Additionally, pursuant to the indenture dated July 7, 2016 ("July 2016 Indenture"), MCBC issued its outstanding 3.0% senior notes due 2026, 4.2% senior notes due 2046 and 1.25% senior notes due 2024. The issuances of the senior notes issued under the May 2012 Indenture and the July 2016 Indenture were registered under the Securities Act of 1933, as amended. These senior notes are guaranteed on a senior unsecured basis by certain subsidiaries of MCBC, which are listed in Exhibit 22 of this Quarterly Report on Form 10-Q (the Subsidiary Guarantors, and together with the Parent Issuer, the "Obligor Group"). Each of the Subsidiary Guarantors is 100% owned by the Parent Issuer. The guarantees are full and unconditional and joint and several.
None of our other outstanding debt was issued in a transaction that was registered with the SEC, and such other outstanding debt is issued or otherwise generally guaranteed on a senior unsecured basis by the Obligor Group or other consolidated subsidiaries of MCBC. These other guarantees are also full and unconditional and joint and several.
As of March 31, 2024, the senior notes and related guarantees rank pari-passu with all other unsubordinated debt of the Obligor Group and senior to all future subordinated debt of the Obligor Group. The guarantees can be released upon the sale or transfer of a Subsidiary Guarantors' capital stock or substantially all of its assets, or if such Subsidiary Guarantor ceases to be a guarantor under our other outstanding debt.
See Part I.—Item 1. Financial Statements, Note 7, "Debt" for details of all debt issued and outstanding as of March 31, 2024.
The following summarized financial information relates to the Obligor Group as of March 31, 2024 on a combined basis, after elimination of intercompany transactions and balances between the Obligor Group, and excluding the investments in and equity in the earnings of any non-guarantor subsidiaries. The balances and transactions with non-guarantor subsidiaries have been separately presented.
Summarized Financial Information of Obligor Group
| Three Months Ended | |||||
| March 31, 2024 | |||||
| (in millions) | |||||
| Net sales, out of which: | $ | 2,107.8 | |||
| Intercompany sales to non-guarantor subsidiaries | $ | 24.3 | |||
| Gross profit, out of which: | $ | 803.3 | |||
| Intercompany net costs from non-guarantor subsidiaries | $ | (103.2) | |||
| Net interest expense, out of which: | $ | (35.5) | |||
Intercompany net interest income from non-guarantor subsidiaries | $ | 13.0 | |||
| Income before income taxes | $ | 278.2 | |||
| Net income | $ | 215.0 | |||
32
| As of March 31, 2024 | As of December 31, 2023 | ||||||||||
| (in millions) | |||||||||||
| Total current assets, out of which: | $ | 1,798.2 | $ | 1,814.3 | |||||||
| Intercompany receivables from non-guarantor subsidiaries | $ | 262.7 | $ | 255.7 | |||||||
| Total noncurrent assets, out of which: | $ | 24,507.3 | $ | 24,641.0 | |||||||
| Noncurrent intercompany notes receivable from non-guarantor subsidiaries | $ | 4,094.3 | $ | 4,178.6 | |||||||
| Total current liabilities, out of which: | $ | 2,968.8 | $ | 3,048.4 | |||||||
| Current portion of long-term debt and short-term borrowings | $ | 867.3 | $ | 885.6 | |||||||
| Intercompany payables due to non-guarantor subsidiaries | $ | 148.2 | $ | 117.7 | |||||||
| Total noncurrent liabilities, out of which: | $ | 8,106.4 | $ | 8,094.7 | |||||||
| Long-term debt | $ | 5,257.7 | $ | 5,257.6 | |||||||
Capital Expenditures
We incurred $143.9 million, and paid $214.7 million, for capital improvement projects worldwide in the three months ended March 31, 2024, excluding capital spending by equity method joint ventures, representing a decrease of $5.1 million from the $149.0 million of capital expenditures incurred in the three months ended March 31, 2023. We continue to focus on where and how we employ our planned capital expenditures, with an emphasis on strengthening our focus on required returns on invested capital as we determine how to best allocate cash within the business.
Contingencies
We are party to various legal proceedings arising in the ordinary course of business, environmental litigation and indemnities associated with our sale of Kaiser to FEMSA. See Part I.—Item 1. Financial Statements, Note 10, "Commitments and Contingencies" for further discussion.
Off-Balance Sheet Arrangements
Refer to Part II.—Item 8. Financial Statements, Note 13, "Commitments and Contingencies" in our Annual Report for discussion of off-balance sheet arrangements. As of March 31, 2024, we did not have any other material off-balance sheet arrangements.
Critical Accounting Estimates
Our accounting policies and accounting estimates critical to our financial condition and results of operations are set forth in our Annual Report and did not change during the three months ended March 31, 2024. See Part I.—Item 1. Financial Statements, Note 2, "New Accounting Pronouncements" for discussion of recently adopted accounting pronouncements. See also Part I.—Item 1. Financial Statements, Note 5, "Goodwill and Intangible Assets" for discussion of the results of our 2023 annual impairment testing analysis, the related risks to our indefinite-lived intangible brand assets and the goodwill amounts associated with our reporting units.
New Accounting Pronouncements Not Yet Adopted
See Part I.—Item 1. Financial Statements, Note 2, "New Accounting Pronouncements" for a description of any new accounting pronouncements that have or could have a significant impact on our financial statements.
ITEM 3. QUANTITATIVE AND QUALITATIVE DISCLOSURES ABOUT MARKET RISK
See Part II.—Item 7A. "Quantitative and Qualitative Disclosures About Market Risk" in our Annual Report for further details of our market risks and our market sensitive instruments as of December 31, 2023. During the three months ended March 31, 2024, our market risk sensitive instruments fluctuated as a result of changes in interest rates, currency exchange rates and commodity prices.
33
Interest Rate Risk
For the periods ended March 31, 2024, and December 31, 2023, the following table presents our fixed rate debt and forward starting interest rate swaps as well as the impact of an absolute 1% adverse change in interest rates on their respective fair values. Notional amounts and fair values are presented in USD based on the applicable exchange rates as of March 31, 2024 and December 31, 2023, respectively. See Part I - Item 1. Financial Statements, Note 7. "Debt" for the maturity dates of our outstanding debt instruments.
| Notional amounts | Fair Value Asset/(Liability) | Effect of 1% Adverse Change | ||||||||||||||||||||||||||||||||||||
| (in millions) | As of March 31, 2024 | As of December 31, 2023 | As of March 31, 2024 | As of December 31, 2023 | As of March 31, 2024 | As of December 31, 2023 | ||||||||||||||||||||||||||||||||
USD denominated fixed rate notes | $ | 4,900.0 | $ | 4,900.0 | $ | (4,484.4) | $ | (4,608.2) | $ | (388.0) | $ | (414.4) | ||||||||||||||||||||||||||
Foreign currency denominated fixed rate notes | $ | 1,232.5 | $ | 1,260.7 | $ | (1,224.8) | $ | (1,248.6) | $ | (10.3) | $ | (13.5) | ||||||||||||||||||||||||||
| Forward starting interest rate swaps | $ | 1,000.0 | $ | 1,000.0 | $ | 62.6 | $ | 41.6 | $ | (75.4) | $ | (78.9) | ||||||||||||||||||||||||||
Foreign Exchange Risk
The following table includes details of our foreign currency denominated fixed rate debt and our foreign currency forwards used to hedge our foreign exchange rate risk as well as the impact of a hypothetical 10% adverse change in the related foreign currency exchange rates on their respective fair values. Notional amounts and fair values are presented in USD based on the applicable exchange rates as of March 31, 2024 and December 31, 2023.
| Notional amounts | Fair Value Asset/(Liability) | Effect of 10% Adverse Change | ||||||||||||||||||||||||||||||||||||
| (in millions) | As of March 31, 2024 | As of December 31, 2023 | As of March 31, 2024 | As of December 31, 2023 | As of March 31, 2024 | As of December 31, 2023 | ||||||||||||||||||||||||||||||||
Foreign currency denominated fixed rate notes | $ | 1,232.5 | $ | 1,260.7 | $ | (1,224.8) | $ | (1,248.6) | $ | (119.9) | $ | (124.8) | ||||||||||||||||||||||||||
| Foreign currency forwards | $ | 233.7 | $ | 219.4 | $ | 2.4 | $ | (1.4) | $ | (24.6) | $ | (23.6) | ||||||||||||||||||||||||||
Commodity Price Risk
The following table includes details of our commodity swaps used to hedge commodity price risk as well as the impact of a hypothetical 10% adverse change in the related commodity prices on the fair value of the derivatives. The following table excludes our commodity options because we have offsetting buy and sell positions. Notional amounts and fair values are presented in USD based on the applicable exchange rates as of March 31, 2024 and December 31, 2023.
| Notional amounts | Fair Value Asset/(Liability) | Effect of 10% Adverse Change | ||||||||||||||||||||||||||||||||||||
| (in millions) | As of March 31, 2024 | As of December 31, 2023 | As of March 31, 2024 | As of December 31, 2023 | As of March 31, 2024 | As of December 31, 2023 | ||||||||||||||||||||||||||||||||
| Swaps | $ | 618.1 | $ | 653.5 | $ | (29.4) | $ | (30.4) | $ | (54.8) | $ | (58.1) | ||||||||||||||||||||||||||
ITEM 4. CONTROLS AND PROCEDURES
Evaluation of Disclosure Controls and Procedures
Under the supervision and with the participation of our management, including our Chief Executive Officer and Chief Financial Officer, we conducted an evaluation of our disclosure controls and procedures as such term is defined under Rule 13a-15(e) under the Exchange Act. Based on this evaluation, our Chief Executive Officer and Chief Financial Officer concluded that our disclosure controls and procedures were effective as of March 31, 2024 to provide reasonable assurance that information required to be disclosed in our reports that we file or submit under the Exchange Act is recorded, processed, summarized and reported within the time periods specified in the SEC rules and forms and that such information is accumulated and communicated to our management, including our Chief Executive Officer and Chief Financial Officer, as appropriate, to allow timely decisions regarding required disclosure. Management necessarily applies its judgment in assessing the costs and benefits of such controls and procedures that, by their nature, can only provide reasonable assurance regarding management's control objectives. Also, we have investments in certain unconsolidated entities that we do not control or manage.
34
Changes in Internal Control over Financial Reporting
There were no changes in our internal control over financial reporting (as defined in Exchange Act Rule 13a-15(f)) during the three months ended March 31, 2024 that have materially affected, or are reasonably likely to materially affect, our internal control over financial reporting.
PART II. OTHER INFORMATION
ITEM 1. LEGAL PROCEEDINGS
Litigation and other disputes
For information regarding litigation, other disputes and environmental and regulatory proceedings see Part I.—Item 1. Financial Statements, Note 10, "Commitments and Contingencies."
ITEM 1A. RISK FACTORS
In addition to the other information set forth in this report, the factors discussed in Part I.—Item 1A. "Risk Factors" in our Annual Report, which could materially affect our business, financial condition and/or future results, should be carefully considered. There have been no material changes to the risk factors contained in our Annual Report. The risks described in our Annual Report and herein are not the only risks facing us. Additional risks and uncertainties not currently known to us or that we currently deem to be immaterial may also materially adversely affect our business, financial condition, cash flows and/or future results.
ITEM 2. UNREGISTERED SALES OF EQUITY SECURITIES AND USE OF PROCEEDS
The following table presents information with respect to Class B common stock purchases made by our Company during the three months ended March 31, 2024:
| Issuer Purchases of Equity Securities | ||||||||||||||||||||||||||
| Total number of shares purchased | Average price paid per share | Total number of shares purchased as part of publicly announced plans or programs | Approximate dollar value of shares that may yet be purchased under the plans or programs(1) | |||||||||||||||||||||||
| January 1, 2024 through January 31, 2024 | 447,856 | $ | 62.53 | 447,856 | $ | 1,821,954,166 | ||||||||||||||||||||
| February 1, 2024 through February 29, 2024 | 1,013,764 | $ | 61.92 | 1,013,764 | $ | 1,759,184,369 | ||||||||||||||||||||
| March 1, 2024 through March 31, 2024 | 298,495 | $ | 65.71 | 298,495 | $ | 1,739,570,931 | ||||||||||||||||||||
| Total | 1,760,115 | $ | 62.72 | 1,760,115 | $ | 1,739,570,931 | ||||||||||||||||||||
(1)On September 29, 2023, our Board approved a share repurchase program up to an aggregate of $2.0 billion of our Company's Class B common stock, excluding brokerage commissions and excise taxes, with an expected program term of five years.
The number, price, structure and timing of the repurchases under the program, if any, will be at our sole discretion and future repurchases will be evaluated by us depending on market conditions, liquidity needs, restrictions under our debt agreements and other factors. Share repurchases may be made in the open market, in structured transactions or in privately negotiated transactions. The repurchase authorization does not oblige us to acquire any particular amount of our Company's Class B common stock. The Board may suspend, modify or terminate the repurchase program at any time without prior notice.
ITEM 3. DEFAULTS UPON SENIOR SECURITIES
None.
ITEM 4. MINE SAFETY DISCLOSURES
Not applicable.
35
ITEM 5. OTHER INFORMATION
On March 15, 2024 , Roxanne M. Stelter , our Vice President and Controller , entered into a pre-arranged stock trading plan (the "Stelter 10b5-1 Sales Plan"). The Stelter 10b5-1 Sales Plan provides for the potential sale of up to 1,536 shares of the Company's Class B common stock between June 14, 2024 and March 14, 2025. Further, the Stelter 10b5-1 Sales Plan was entered into during an open insider trading window and is intended to satisfy the affirmative defense of Rule 10b5-1(c) under the Exchange Act.
During the three months ended March 31, 2024, no other directors or officers adopted or terminated
ITEM 6. EXHIBITS
The following are filed, furnished or incorporated by reference as a part of this Quarterly Report on Form 10-Q:
(a) Exhibit
| Exhibit Number | Document Description | ||||||||||
| 3.1 | |||||||||||
| 3.2 | |||||||||||
10.1+‡ | |||||||||||
10.2+‡ | |||||||||||
10.3+‡ | |||||||||||
10.4+‡ | |||||||||||
10.5+‡ | |||||||||||
10.6+‡ | |||||||||||
10.7+‡ | |||||||||||
10.8+‡ | |||||||||||
10.9+‡ | |||||||||||
10.10+‡ | |||||||||||
22+ | |||||||||||
| 31.1+ | |||||||||||
| 31.2+ | |||||||||||
| 32++ | |||||||||||
| 101.INS+ | XBRL Instance Document - the instance document does not appear in the Interactive Data File because its XBRL tags are embedded within the Inline XBRL document.* | ||||||||||
| 101.SCH+ | XBRL Taxonomy Extension Schema Document.* | ||||||||||
| 101.CAL+ | XBRL Taxonomy Extension Calculation Linkbase Document.* | ||||||||||
36
| 101.LAB+ | XBRL Taxonomy Extension Label Linkbase Document.* | ||||||||||
| 101.PRE+ | XBRL Taxonomy Extension Presentation Linkbase Document.* | ||||||||||
| 101.DEF+ | XBRL Taxonomy Extension Definition Linkbase Document.* | ||||||||||
| 104 | Cover Page Interactive Data File (embedded within the Inline XBRL document and contained in Exhibit 101) | ||||||||||
| * | Attached as Exhibit 101 to this report are the following documents formatted in iXBRL (Inline Extensible Business Reporting Language): (i) the Unaudited Condensed Consolidated Statements of Operations, (ii) the Unaudited Condensed Consolidated Statements of Comprehensive Income (Loss), (iii) the Unaudited Condensed Consolidated Balance Sheets, (iv) the Unaudited Condensed Consolidated Statements of Cash Flows, (v) the Unaudited Condensed Consolidated Statements of Stockholders' Equity and Noncontrolling Interests, (vi) the Notes to Unaudited Condensed Consolidated Financial Statements and (vii) document and entity information. | ||||||||||
| ‡ | Represents a management contract or compensatory plan or arrangement. | ||||||||||
| + | Filed herewith. | ||||||||||
| ++ | Furnished herewith. | ||||||||||
SIGNATURE
Pursuant to the requirements of the Securities Exchange Act of 1934, the registrant has duly caused this report to be signed on its behalf by the undersigned thereunto duly authorized.
| MOLSON COORS BEVERAGE COMPANY | |||||||||||
| By: | /s/ ROXANNE M. STELTER | ||||||||||
Roxanne M. Stelter Vice President and Controller (Principal Accounting Officer) April 30, 2024 | |||||||||||
37