UNITED STATES
SECURITIES AND EXCHANGE COMMISSION
Washington, D.C. 20549
_________________________
FORM 10-K
_________________________
|
|
ANNUAL REPORT PURSUANT TO SECTION 13 OR 15(d) OF THE SECURITIES EXCHANGE ACT OF 1934
|
For the fiscal year ended December 31, 2023
|
|
TRANSITION REPORT PURSUANT TO SECTION 13 OR 15(d) OF THE SECURITIES EXCHANGE ACT OF 1934
|
For the transition period from ___________ to ___________
Commission File Number: 001-40566
_________________________
(Exact name of registrant as specified in its charter)
_________________________
|
(State or other jurisdiction of
incorporation or organization)
|
(I.R.S. Employer
Identification No.)
|
|
(Address of principal executive offices)
|
(Zip code)
|
|
(Registrant’s telephone number, including area code)
|
|
_________________________
Securities registered pursuant to Section 12(b) of the Act:
|
Title of each class
|
Trading
Symbol(s)
|
Name of each exchange on which registered
|
||
|
|
|
|
||
|
|
|
|
Securities registered pursuant to Section 12(g) of the Act: None
Indicate by check mark if the registrant is a well-known seasoned issuer, as defined in Rule 405 of the Securities Act. ☐ Yes ☒ No
Indicate by check mark if the registrant is not required to file reports pursuant to Section 13 or 15(d) of the Act. ☐ Yes ☒ No
Indicate by check mark whether the registrant (1) has filed all reports required to be filed by Section 13 or 15(d) of the Securities Exchange Act of
1934 during the preceding 12 months (or for such shorter period that the registrant was required to file such reports), and (2) has been subject to such filing requirements for the past 90 days. ☒ Yes ☐ No
Indicate by check mark whether the registrant has submitted electronically every Interactive Data File required to be submitted pursuant to Rule 405 of
Regulation S-T (§232.405 of this chapter) during the preceding 12 months (or for such shorter period that the registrant was required to submit such files). ☒ Yes ☐ No
Indicate by check mark whether the registrant is a large accelerated filer, an accelerated filer, a non-accelerated filer, a smaller reporting company,
or an emerging growth company. See the definitions of “large accelerated filer,” “accelerated filer,” “smaller reporting company,” and “emerging growth company” in Rule 12b-2 of the Exchange Act.
|
Large accelerated filer
|
☐
|
|
☒
|
|
|
Non-accelerated filer
|
☐
|
Smaller reporting company
|
|
|
|
Emerging growth company
|
|
If an emerging growth company, indicate by check mark if the registrant has elected not to use the extended transition period for complying with any
new or revised financial accounting standards provided pursuant to Section 13(a) of the Exchange Act. ☐
Indicate by check mark whether the registrant has filed a report on and attestation to its
management’s assessment of the effectiveness of its internal control over financial reporting under Section 404(b) of the Sarbanes-Oxley Act (15 U.S.C. 7262(b)) by the registered public accounting firm that prepared or issued its audit report. ☒
If securities are registered pursuant to Section 12(b) of the Act, indicate by check mark whether the financial
statements of the registrant included in the filing reflect the correction of an error to previously issued financial statements. ☐
Indicate by check mark whether any of those error corrections are restatements that required a recovery analysis of
incentive-based compensation received by any of the registrant’s executive officers during the relevant recovery period pursuant to §240.10D-1(b). ☐
Indicate by check mark whether the registrant is a shell company (as defined in Rule 12b-2 of the Exchange Act). ☐ Yes ☒ No
The aggregate market value of the voting and non-voting shares held by non-affiliates of the Registrant, based on the closing price of the shares of
$3.11 on June 30, 2023 the last business day of the registrant’s most recently completed second fiscal quarter was approximately $676.3
million.
As of February 22, 2024 the Registrant had outstanding 295,463,243 Ordinary shares and 45,198,702 Non-Voting Ordinary shares.
DOCUMENTS INCORPORATED BY REFERENCE
Portions of the Registrant’s 2024 definitive Proxy Statement, which will be filed with the Securities and Exchange Commission within 120 days after
December 31, 2023, are incorporated by reference in Part III of this Form 10-K.
BASIS OF PRESENTATION
Our financial statements have been prepared in accordance with United States Generally Accepted Accounting Principles (“GAAP”) . We present our consolidated financial statements in U.S. dollars.
Our fiscal year ends on December 31 of each year.
Certain monetary amounts, percentages and other figures included elsewhere in this Annual Report have been subject to rounding adjustments. Accordingly, figures
shown as totals in certain tables or charts may not be the arithmetic aggregation of the figures that precede them, and figures expressed as percentages in the text may not total 100% or, as
applicable, when aggregated may not be the arithmetic aggregation of the percentages that precede them.
Throughout this Annual Report, we provide a number of key performance indicators used by our management and often used by others in our industry. For details, see Item 7. “Management’s Discussion And Analysis Of Financial Condition And Results Of Operations.”
Certain capitalized terms used in this Annual Report are defined in the Glossary following Item 16.
Market and Industry Data
Unless otherwise indicated, information in this Annual Report concerning economic conditions, our industry, our markets and our competitive position is based on a variety of sources, including
information from independent industry analysts and publications, as well as our own estimates and research.
Our estimates are derived from publicly available information released by third-party sources, as well as data from our internal research, which we believe to be reasonable. None of the
independent industry publications used in this Annual Report were prepared on our behalf.
Trademarks
We or our licensors have proprietary rights to trademarks, trade names and service marks used in this Annual Report. Solely for convenience, trademarks, trade names and service marks referred to
in this Annual Report may appear without the “®” or “™” symbols, but such references
are not intended to indicate, in any way, that we will not assert, to the fullest extent possible under applicable law, our rights or the rights of the applicable licensor to these trademarks, trade names and service marks. We do not intend our
use or display of other companies’ trademarks, trade names or service marks to imply a relationship with, or endorsement or sponsorship of us by, any other companies. Each trademark, trade name or service mark of any other company appearing in
this Annual Report is the property of its respective holder.
Certain statements in this Annual Report may constitute “forward-looking statements” for purposes of the federal securities laws. Taboola’s forward-looking statements include, but are not limited
to, statements regarding Taboola or its management team’s expectations, hopes, beliefs, intentions or strategies regarding the future. In addition, any statements that refer to projections, forecasts or other characterizations of future events or
circumstances, including any underlying assumptions, are forward-looking statements. The words “anticipate,” “appear,” “approximate,” “believe,” “continue,” “could,” “estimate,” “expect,” “foresee,” “intends,” “may,” “might,” “plan,” “possible,”
“potential,” “predict,” “project,” “seek,” “should,” “would” and similar expressions (or the negative version of such words or expressions) may identify forward-looking statements, but the absence of these words does not mean that a statement is
not forward-looking. Forward-looking statements in this Annual Report may include, for example, statements about:
|
•
|
our financial performance; and
|
|
•
|
the outcome of any known and unknown litigation and regulatory proceedings.
|
These forward-looking statements are based on information available as of the date of this Annual Report, and current expectations, forecasts and assumptions, and involve a number of judgments,
risks and uncertainties. Accordingly, forward-looking statements should not be relied upon as representing our views as of any subsequent date, and we do not undertake any obligation to update forward-looking statements to reflect events or
circumstances after the date they were made, whether as a result of new information, future events or otherwise, except as may be required under applicable securities laws.You should not place undue reliance on these forward-looking statements. As
a result of a number of known and unknown risks and uncertainties, including those described in Part I, Item 1A, “Risk Factors” in this Annual Report on Form 10-K, our actual results or performance may be materially different from those expressed
or implied by these forward-looking statements.
The following is a summary of the material risks we are exposed to in the course of our business activities. The below summary does not contain all of the information that
may be important to you, and you should read the below summary together with the more detailed discussion of risks set forth under the heading “Risk Factors,” as well as elsewhere in this Annual Report.
| • |
Taboola may be unable to attract new digital properties and Advertisers, sell additional offerings to its existing digital properties and Advertisers, or maintain enough business with its existing digital properties and Advertisers;
|
| • |
If Taboola’s performance under contracts with digital properties where Taboola is obligated to pay a specified minimum guaranteed amount per thousand impressions does not meet the minimum guarantee requirements, its gross profit could be
negatively impacted and its results of operations and financial condition could be harmed;
|
| • |
If the Yahoo partnership and our ability to transition and fully launch the native advertising service with Yahoo is not successful or implemented on the currently projected timeframe, the partnership may not be as financially accretive
as we are projecting and our business, operating results or financial condition and our reputation could be adversely affected;
|
| • |
Taboola may not be able to compete successfully against current and future competitors;
|
| • |
Taboola’s future growth and success depends on its ability to continue to scale its existing offerings and to introduce new solutions that gain acceptance and that differentiate it from its competitors;
|
| • |
If Taboola fails to make the right investment decisions in its offerings and technology platform, or if Taboola is unable to generate or otherwise obtain sufficient funds to invest in them, Taboola may not attract and retain digital
properties and Advertisers;
|
| • |
If Taboola’s ability to personalize its advertisements and content to users is restricted or prohibited due to various privacy or data protection laws or regulations, Taboola could lose digital properties and Advertisers;
|
| • |
If Taboola’s AI powered platform fails to accurately predict what ads and content would be of most interest to users or if Taboola fails to continue to improve on its ability to further predict or optimize user engagement or conversion
rates for its Advertisers, its performance could decline and Taboola could lose digital properties and Advertisers;
|
| • |
Taboola’s business depends on continued engagement by users who interact with its platform on various digital properties;
|
| • |
Historically, the majority of Taboola’s agreements with digital properties have typically required them to provide it exclusivity or other incentives based on preferred usage, for the term of the agreement; to the extent that such
exclusivity is reduced or eliminated for any reason, digital properties could elect to implement competitive platforms or services that could be detrimental to its performance;
|
| • |
Taboola’s business depends on strong brands and well-known digital properties, and failing to maintain and enhance its brands and well-known digital properties would hurt its ability to expand its number of Advertisers and digital
properties;
|
| • |
Taboola is a multinational organization faced with complex and changing laws and regulations regarding privacy, data protection, content, competition, consumer protection, and other matters;
|
|
•
|
Conditions in Israel could adversely affect Taboola’s business;
|
| • |
Natural disasters, political events, war, terrorism and the emergence of another pandemic, each of which could disrupt our business and adversely affect our results of operations; and
|
|
•
|
Other risks and uncertainties set forth in the section entitled “Risk Factors” in this Annual Report.
|
3
|
Page
|
||||
|
2
|
||||
|
3
|
||||
|
Part I
|
||||
|
Item 1.
|
5 | |||
|
Item 1A.
|
23
|
|||
|
Item 1B.
|
57 | |||
|
Item 1C.
|
57 | |||
|
Item 2.
|
58 | |||
|
Item 3.
|
58 | |||
|
Item 4.
|
58
|
|||
|
Part II
|
||||
|
Item 5.
|
59 | |||
|
Item 6.
|
60 | |||
|
Item 7.
|
60 | |||
|
Item 7A.
|
79 | |||
|
Item 8.
|
82 | |||
|
Item 9.
|
129 | |||
|
Item 9A.
|
129 | |||
|
Item 9B.
|
130 | |||
|
Item 9C.
|
130 | |||
|
Part III
|
||||
|
Item 10.
|
131 | |||
|
Item 11.
|
131 | |||
|
Item 12.
|
131 |
|
Item 13.
|
132 | |||
|
Item 14.
|
132 | |||
|
Part IV
|
||||
|
Item 15.
|
132 | |||
|
Item 16.
|
134 | |||
| 134 | ||||
| 135 |
Our Mission
We power recommendations for the Open Web, helping people all around the world discover things they may like, but never knew existed.
Our Company
Taboola is a technology company that powers recommendations across the Open Web with an artificial intelligence, or
AI-based, algorithmic engine that we have developed since the Company began operations in 2007. Taboola has also expanded more directly into e-Commerce, allowing its partners with digital properties
the ability to use its platforms to display advertising suited to the audiences of those partners’ web sites or other digital services.
We think of ourselves as a search engine, but in reverse — instead of expecting people to search for information, we recommend information to people or enable our partners to
use our technology. You’ve seen us before: we partner with websites, devices, and mobile apps, which we collectively refer to as digital properties, to recommend editorial content and advertisements on the Open Web, outside of the closed
ecosystems of the walled gardens such as Meta/Facebook, Google, and Amazon.
Digital properties use our technology platforms to achieve their business goals, such as driving new audiences to their sites and apps, or increasing engagement
on site — and we don’t charge them for these services. We also provide a meaningful monetization opportunity to digital properties by surfacing paid recommendations by Advertisers. Unlike walled
gardens, we are a business-to-business, or B2B, company with no competing consumer interests. We only interact with consumers through our partners’ digital properties, hence we do not compete with our partners for user attention. Our
motivations are aligned. When our partners win, we win, and we grow together.
We empower Advertisers to leverage our proprietary AI-powered recommendation platform to reach targeted audiences
utilizing effective, native ad formats across digital properties. We generate revenues primarily when people (consumers) click on, purchase from or, in some cases, view the ads that appear within our partners’ digital experiences via our
recommendation platform. Advertisers pay us for those clicks, purchases or impressions and we share the resulting revenue with the digital properties who display those ads and generate those clicks and downstream consumer actions.
Our powerful recommendation platform was built to address a technology challenge of significant complexity: predicting which recommendations users would be interested in,
without explicit intent data or social media profiles. Search advertising platforms have access, at a minimum, to users’ search queries which indicate intent, while social media advertising platforms have access to rich personal profiles created
by users. In contrast, we base our recommendations on an extensive dataset of context and user behavior derived from the intersection of thousands of digital properties and millions of recommended items, including ads and editorial content.
Yahoo Partnership
In November 2022, we announced we had entered into a 30-year exclusive commercial agreement with Yahoo, under which we will power
native advertising across all of Yahoo’s digital properties, expanding our native advertising offering. In January 2023 we closed on the various related agreements, including the issuance of 39,525,691 Ordinary shares and 45,198,702 Non-Voting
Ordinary shares to Yahoo.
Cost Restructuring Program
In September 2022, in response to macroeconomic conditions, the Company announced and implemented a cost restructuring program impacting approximately 6% of
the Company’s global headcount. Restructuring expenses were approximately $3.4 million for the year ended December 31, 2022 primarily consisting of one-time incremental employee termination benefits and other costs related to the
Company’s business prioritization.
See Note 14 of Notes to the Consolidated Financial Statements in this Annual Report for additional details
regarding the cost restructuring program.
Connexity Acquisition
On September 1, 2021 we completed our previously announced acquisition of Shop Holding Corporation, which we refer to as Connexity. The total consideration amount of approximately $800 million
included retention incentives and is subject to customary purchase price adjustments for working capital and indebtedness. For additional information about the Connexity acquisition, including the issuance of Ordinary shares and the entry of a
$300 million senior secured term loan credit agreement to finance a portion of the acquisition see Notes 7, 10, and 13 of Notes to Consolidated Financial Statements in this Annual report.
ION Merger Agreement
On January 25, 2021, we and one of our subsidiaries entered into a Merger Agreement with ION Acquisition Corp. 1 Ltd. Under that agreement, our subsidiary merged with and into ION, with ION
continuing as the surviving company and becoming our direct, wholly-owned subsidiary. The Merger Agreement and the related transactions were unanimously approved by both the ION board of directors and the Board. The Business Combination and other
transactions contemplated by the Merger Agreement, closed on June 29, 2021 after receipt of the required approval by our shareholders and ION’s shareholders and the fulfillment of certain other conditions. In connection with the Merger Agreement,
we also obtained commitments for the purchase in private transactions that closed concurrently with the Business Combination of approximately $285 million of our Ordinary shares, of which approximately $150 million was purchased directly from
certain of our existing shareholders, primarily from early investors.
Industry Trends
Taboola’s opportunity is to offer advertisers easy access to a curated supply of Open Web publisher inventory in a way that offers significant scale, reach and frequency with better user
experience and monetization performance than what they are seeing today.
Advertising Budgets Shift to Digital Marketing. As we have witnessed over the last decade,
advertising budgets continue to shift from traditional media, such as print newspapers, magazines and television, to digital channels. No longer a trend, a change in consumer attention to digital properties has become a lasting movement, giving
Advertisers an opportunity to reach increasing numbers of consumers at scale with relevant content and precise targeting, thereby driving a higher return on their investment.
Walled Gardens Dominate Digital Advertising Spend. According to eMarketer, more than half of digital advertising budgets are spent within
the closed ecosystems of tech giants like Google, Facebook and Amazon, which we refer to as “walled gardens.” With the proliferation of these walled gardens and the time spent by consumers within them, the Open Web is fighting for user attention
and as a result for advertising dollars.
Highly Fragmented Open Web. According to our estimates, Advertisers spent approximately $80 billion advertising on the Open Web in 2023. Because the Open Web is, by definition, highly fragmented, it is harder for
Advertisers to access than the walled gardens.
The Technology behind Digital Advertising has become Increasingly Complex. Technologies for more
automated and efficient buying and selling of digital advertising have been gaining traction for several years with both advertising buyers and digital properties. The ability to collect, collate and analyze intent data points using AI and
machine-learning technology is a key differentiator for Advertisers, digital properties and advertising intermediaries. Data insights can now be used to optimize digital advertising campaigns in ways
that were not previously possible. This means that advertising intermediaries who do not have access to data or are not using AI to power their platforms may be at a disadvantage.
Shift from Offline Shopping to Online Shopping and e-Commerce. Online shopping saw significant acceleration during the Covid-19 pandemic and growth is expected to continue ~8% annually through 2027 doubling the growth of physical retail over that same period.
Native Format Proliferation. According to eMarketer, native ads - ads that match the look, feel
and function of the media format in which they appear, such as those used by Taboola - accounted for approximately 66% of total U.S. display ad spending in 2023.
Native advertising is a format that has been popularized by social media and is now familiar to consumers.
Increasing Focus on Privacy and the Disappearance of Third Party Cookies. Government regulators,
consumers, and technology companies recently turned their attention toward the use of personal data and related privacy practices. This has led to increased regulation, such as the European
Union’s General Data Protection Regulation, or GDPR, its equivalent in the United Kingdom (commonly referred to as the UK GDPR), and the California Consumer Privacy Act
(as modified by the California Privacy Rights Act), or CCPA. In parallel, major Internet browsers, such as Safari and Firefox are already blocking third party cookies and Google has announced plans to
completely phase out third-party cookies in Google Chrome during the second half of 2024. These changes pose a challenge for the digital marketing landscape, which currently relies extensively on third-party
cookie data for personalization and must adapt to comply with increasing regulation of personal data.
Our Market Opportunity
We believe the Open Web needs a technology partner that enables digital properties to compete effectively with the scale and technological advantages of the tech giants. We
believe our recommendation technology is applicable to a wide range of digital properties, including websites, apps, devices, and in the future, connected TVs and other mediums.
Unlike walled gardens, we are a B2B company with no competing consumer interests. We do not compete with our digital property partners for users’ attention. Our
motivations are aligned: when our partners win, we win, and we grow together. This win-win mentality applies to our relationships with digital property partners and our Advertiser clients. Our Advertiser clients typically utilize a performance-based pricing model, which means they only pay us after a desired event, most commonly a click, occurs. In addition, our deep relationships with digital properties
offer a compelling value for Advertisers, granting consolidated access to Open Web audiences and, thus, reducing the effects of fragmentation. In the fourth quarter of 2023, we worked with approximately 17,000 Advertisers to serve ads to users across the Open Web and reached nearly 600 million daily active users, which, for this figure, we calculated as the average daily number of users that have been exposed to Taboola content recommendations at least twice in the preceding seven days. We and our digital property
partners both benefit when users stay engaged with content on the digital property. To that end, we share advertising revenue as well as content-consumption data with digital properties, which they can use to make editorial decisions that best
accommodate their audiences’ interests and increase user engagement.
What We Do: Our Recommendation Platform
At the core of the Taboola platform is our AI-powered predictive recommendation engine, which predicts what people may find interesting by employing unique Deep Learning
technology and utilizing a broad range of inputs.
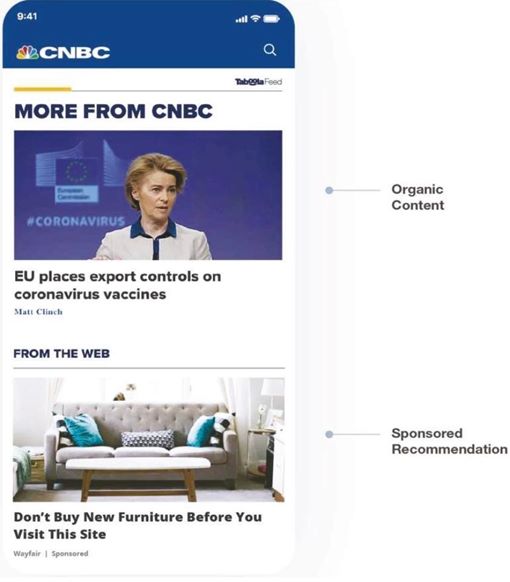
In Taboola’s core business, we serve two types of recommendations: (1) editorial, or “organic,” content from the site that the user is currently visiting, in
order to engage the user and increase their chances of staying on the site longer; and (2) third-party ads paid for by our Advertiser partners. Our recommendations support text, image and video
formats.
We generate revenue by enabling Advertisers to place bids for the right to serve their ads to targeted audiences
across the Taboola network of digital properties, including some of the most premium sites in the world. As part of our e-Commerce offerings, we also
syndicate our retailer Advertisers’ monetized product listings and links (clickable advertisements) into commerce content-oriented consumer experiences on both the Open Web and within the dominant
traditional ad platforms.
Representative Product Implementation
Our Platform for Digital Properties
Through our technology, data and Advertiser relationships, we help digital properties achieve three key goals:
| • |
Engagement: We keep users engaged with the digital property they are currently visiting, helping digital
properties grow their business and not lose users to walled gardens. Digital properties work extremely hard to create engaging content and rely, in part, on Taboola to surface that content to the right user at the right time. To that end,
the more content people read, the more time they spend on that digital property’s site, and the greater the opportunity for the digital property to monetize their business by, among other things, serving ads and offering subscriptions. In
2023, people clicked on Taboola recommendations tens of billions of times and approximately one-third of those clicks were on editorial content, keeping users on the site that they were on.
|
| • |
Audience: Digital properties using our platform can grow their audience in seven main ways: (1) using our Taboola Newsroom product, they can use
the readership data we compile from across the Taboola network to inform editorial decisions and optimize their content strategy, ultimately bringing new users to their property; (2) creating audience exchange programs between their own
sites and those of other digital properties on our network, diversifying their audiences and introducing their content to new users; (3) acquiring new quality audiences from across the Taboola network of digital properties; (4) driving
subscriptions to newsletters and paid subscriptions which, help bring loyal readers again and again to their site; (5) distributing their editorial content onto devices, OEMs, mobile carriers and more; (6) providing access to structured
product content that can be used to create compelling consumer experiences; and (7) delivering insights and real-time analytics that enable the optimization of e-Commerce content strategy to increase engagement and organic traffic
generation.
|
| • |
Monetization: We enable digital properties to monetize their content with seamlessly integrated native ads,
typically displayed in a feed format appearing at the end of an article, as well as other prime locations such as homepages, section fronts and middle of the articles. When people click on these ads or make a purchase, and in certain
cases when they view the ads, Advertisers pay us and we then share in this revenue with the digital property on which the click or impression occurred. With the addition of Taboola’s new
offerings through its acquisition of e-Commerce focused Connexity, Inc., we also offer cost-per-click and cost-per-action monetization of both product listings and links to retailers that reside directly within editorial content.
|
Our Platform for Advertisers
Advertisers utilize Taboola’s platform and leverage our AI-powered recommendation engine to reach their audiences throughout the buyer journey, from building
brand awareness to increasing customer loyalty. Using Taboola’s predictive engine, Advertisers can engage consumers at the right time with the right content, using text, image or video formats. Taboola
allows Advertisers to run campaigns either directly through Taboola, using Taboola’s campaign management dashboard, or programmatically.
We believe we offer Advertisers a complement to the walled gardens:
| • |
Massive reach: With an average of nearly 600 million daily active
users in the fourth quarter of 2023, our platform creates opportunities to reach people on the Open Web when they’re most receptive to brand messages and new content.
|
| • |
Targeting: Our recommendation platform allows Advertisers to target
their campaigns according to multiple parameters, such as context, user location, device and network connection type. Additionally, we use the Advertiser’s own data to target demographics,
interests, “lookalike audiences” and more. Our predictive engine and large readership dataset enable Advertisers to reach their target audiences with the right message, at the right time and in
the right context. In contrast with social networks, where Advertisers reach users based on carefully curated personas as well as other signals, our Advertisers
reach users based on signals from what people are reading on the Open Web, which we believe is a more authentic representation of their true interests.
|
| • |
Impactful Native Ad Formats: Our close partnerships with premium digital properties allow us to develop highly
impactful ad experiences that support a variety of ad formats and achieve diverse Advertiser goals, from awareness, to consideration, to purchase.
|
| • |
Brand Safe: Ads distributed by Taboola are typically served on pages that display editorial content rather than
the ubiquitous user-generated content of platforms such as YouTube or Facebook. In addition, our ad platform allows Advertisers to control the properties and topics on which their content
appears, ensuring that their ads are displayed within suitable environments.
|
| • |
Measurable Performance-Based Advertising: Performance-based Advertisers only pay when a consumer has actually engaged with the ad
unit and in some cases only when a transaction is completed which is typically on a cost per click or cost per action basis. This is a particularly strong proposition for the retailer client advertising because it is a tangible return on
the retailer client’s media investment.
|
Our Recommendation Technology
Our Research and development team has spent over a decade developing our proprietary AI-based recommendation
technology used in our core product, solving an incredibly complex problem — how to construct a personalized recommendation feed from millions of available articles, videos and ads, in real-time, when you have nearly 600 million daily active users and need to optimize for diverse outcomes and support multiple pricing models.
Rather than rely on knowledge of what people are searching for or what they share on social media, our predictive algorithms employ unique Deep Learning technology to develop
a powerful model of people’s interests across the Open Web. Our technology performs exceptionally well on diverse types of input data, such as text, images and video, and is designed to discover non-trivial relations between content and users in
a specific context. We predict which recommendations users are most likely to engage with based on a broad set of ‘signals’ that fall into the following categories:
| • |
User Behavior. We are experts in analyzing pseudonymized user behavior across the Open Web. We gather a massive amount of content consumption data
from users who visit our partners’ digital properties, which our Deep Learning engines then ingest.
|
| • |
Context. Our algorithms ingest contextual signals, such as geographic location of the user, what device the user is using, time of day, day of
week, page layout, page language and more.
|
| • |
Analysis of Recommended Items. We analyze recommended items, including paid advertisements, editorial articles, images and videos, to identify
signals such as topic, title, thumbnail image, semantics and sentiment.
|
Generating a Rich Recommendation Feed
We serve the majority of our recommendations within a feed that was modeled after widely popular social media feeds and adapted for the Open Web. While the feed format
provides a good user experience, it requires technological expertise that is an order of magnitude more complex than optimizing a single ad.
This is both a competitive advantage and a technological challenge that requires our algorithms to optimize multiple placements simultaneously across an entire web page,
while also supporting the unique objectives of our various partners. Indeed, any recommendation we generate takes into consideration the other advertisements and editorial content recommendations that we display in the same feed. The effect of
the sum of these parts allows us to predict the user engagement in different contexts, and make algorithmic decisions concerning the content we serve the user next.
In order to populate recommendations within a feed, our technology must consider the whole page, and recommend content or ads within the context of that page. This has
implications both on the algorithms to predict engagement, as well as on how ad auctions are conducted. We have built an efficient algorithm to estimate the incrementality of new items based on what is already in the feed, and taking into account
both how strong the item is standalone, as well as how similar it is to the other items already in the feed.
Additionally, our Deep Learning engine allows us to optimize for multiple objectives simultaneously, which delivers efficacy to Advertisers, increases user engagement and supports the achievement of many other business goals 6in tandem. As opposed to other digital ad intermediaries who optimize the placements of a single ad unit in an environment they do
not control, we influence, and more often create, the setting in which ads appear as we control the entire feed of content and ads, and optimize across the entire feed, page or session.
Lastly, we have built a robust ability to conform our recommendation feeds to the design of our digital property partners’ pages and layouts. Presenting a variable mix of
both editorial and paid content in this native format also mitigates the risk of user fatigue, commonly referred to as “banner blindness,” that has been noted in traditional display ads.
How We Recommend Editorial Content
Recommending editorial, or organic, content produced by digital properties enables us to help our publisher partners keep users active on their site for a longer period of
time, increasing their exposure to more personalized editorial content — thus increasing overall satisfaction and loyalty.
To successfully recommend editorial content items, we developed algorithms that extract and analyze content consumption patterns from our entire network of digital
properties. Our recommendations also rely on our deep understanding of reading habits based on our analysis of redundancy, recency, vertical, longevity, relevance device type and other factors.
In order to refine our ability to recommend editorial content even further, we have built multiple crawlers to ingest editorial content, categorize it, and extract named
entities and topics using our Natural Language Understanding platform, which transforms human language into a machine-readable format. We also automated the assimilation, classification and generation of creatives, including images, videos,
titles and descriptions.
We also take into consideration the optimization of recommendations to support our publishers’ goals, including subscriptions, pages per session, session duration,
subscriptions to newsletters and more.
How We Recommend Ads
Recommending ads is particularly complex because the process requires accurately predicting multiple facets of the user’s interaction:
| • |
The probability the user will interact (click on an ad, or go to an Advertiser’s site/app after seeing an ad), given a specific
user and context.
|
| • |
The probability a user will convert (into a lead, sales or other KPIs the Advertiser wishes to optimize) after she clicked/viewed
an ad, given a specific user and context.
|
| • |
The price of a specific item (we support cost per click (CPC) and cost per thousand impressions (CPM)).
|
Our ultimate measure of success in recommending ads is achieving the Advertiser’s goals. In order to do so, Taboola’s
algorithms are designed to select the right opportunity to engage the right user with the right ad, while at the same time optimizing pricing and selecting the best creative assets to use. Our technology is designed to predict the value of each
item and optimize both the advertising creatives and the format mix in each auction.
As described above, in order to make effective recommendations, our technology must first predict a user’s engagement with a given advertisement. When combined
with the bid for each item, and the prediction of the conversion, this allows us to calculate the relative value of each item available for recommendation. To create an efficient marketplace, our algorithms support diverse pricing models,
including CPC and CPM, and are able to conduct efficient auctions between them in order to maximize available inventory for Advertisers with diverse marketing objectives. We optimize bids for a
particular ad, Advertiser, user and context, while factoring in constraints, such as geographic location targeting or audience segment targeting, regardless of pricing model.
In order to assist Advertisers in executing efficient and effective campaigns, we developed a pricing automation tool
called Smart Bid. Smart Bid is an automated campaign bidding strategy that utilizes platform data to bid effectively in real-time on impressions that are most likely to lead to conversions.
To maximize the probability of a user engaging with an ad, we support flexible native ad formats that include images, videos, text and interactive elements; we also support
specialized elements, such as product price, discount, number of items left in stock, mobile app rating and more. Selecting the optimal ad also involves determining the best version and format of the ad from a very large number of combinations;
Taboola does so by running a scalable infrastructure of multi-variant testing, which in turn allows the algorithm to choose the best creative combination efficiently.
How we Enable Digital Properties to make e-Commerce Recommendations
With our acquisition of Connexity, our solutions have expanded to include e-Commerce focused content and monetization solutions for publishers. From a content point of view, we provide publishers
with access to over 500 million product listings that are structured into product categories and enriched with product attributes. We syndicate those enriched offers to publishers, thereby enabling them to create consumer shopping or editorial
experiences by embedding those product listings as native content within their websites, apps or social media feeds.
There are a variety of implementations in terms of how publishers can access and engage with the content. Technology-savvy enterprise publishers will ingest the entire product listings feed and
use their own search engine or content management system to choose how, when and which content to display. Less tech-enabled publishers will call Connexity’s search engine API to retrieve product listing results based on a search query, and then
they will publish those product listings within their consumer experience in real-time. Lastly, professional editors or social influencers can use a browser-based editorial tool to hand-pick a specific product to display within their editorial
content experience.
In each of those cases, from a monetization perspective, we enable the publisher to seamlessly earn revenue on either a CPC or cost-per-action (CPA) for clicks and conversions that are generated
by consumer engagement with the product listings or other retail-oriented editorial content.
To enable these publishers to maximize the success of the commerce content initiatives, the company provides a suite of analytics dashboards that showcase real-time feedback on the performance of
each of their product listing or editorial placements. In addition, the company also provides insights into industry trends including visibility into the type of content and products that are converting well across the entire network. These
real-time feedback loops and insights are critical inputs that drive publishers’ content strategy and decisions about which products to promote. They accrue significant benefits to both publishers and the company in the form of increased yield
and significantly differentiate the solution as the network effect is difficult to replicate.
We are Built for the Open Web as a Complement to the Walled Gardens
In support of our win-win approach to partnerships, our recommendation technology is built to operate differently. Because we power editorial recommendations, digital
properties typically embed our code directly on their web page. This means we can serve our own first-party cookie, much like what digital properties do on their own sites and applications.
Our recommendation platform allows both digital properties and Advertisers to control their brand identity within
Taboola’s network. For example, digital properties can set “acceptance profiles” to determine which types of Advertisers we will recommend, and Advertisers
can target or block selected digital properties. To consistently regulate the quality of our network, we also maintain a public content policy and employ a content review team that reviewed over ten million
items in the fourth quarter of 2023. This combination of technology and human review is designed to create a consistently high level of brand safety and quality content within our network.
While developing our recommendation technology, privacy is always at the top of our mind. We have long established and adopted privacy-by-design as a central
element of our technology, and product design and development cycles, with a strong commitment to ensuring best practices in privacy, security and safety for our partners and users. Since 2017, we have had a designated Data Privacy Officer
along with a team of privacy specialists. These specialists are integrated within our Research and development and Product organizations and processes, and consider all facets of user privacy as key
elements in the design of any new technology, solution or feature of our recommendation platform. We also perform ongoing privacy impact assessments to monitor potential risks during the product lifecycle and proactively mitigate those risks.
Infrastructure
To successfully deliver optimized recommendations to nearly 600 million daily active users, and 500,000
recommendation related requests every second, we developed powerful software and hardware infrastructures from the ground up.
Our data infrastructure was designed and implemented with several principles to ensure both very high accuracy and high speed to process and ingest every new data input at a
very high scale and throughput. This infrastructure continuously “feeds” the predictive Deep Learning models, granting access to rich user history and enabling enrichment of data.
In order to support the massive amount of text analysis, processing, named entities and general semantic understanding, we have built a Natural Language Understanding
platform with a large scale knowledge graph. Designed to recognize multiple languages, topics, concepts, named entities and categories for the entire Taboola platform, this platform is built using Deep Learning technologies.
The ability to control the entire feed across multiple canvases is enabled by building state of the art client-side technologies to render and serve a rich feed of content
across billions of devices, canvases and user touch points. This process operates within strict SLA and performance constraints, which requires us to develop our technology to work efficiently on low-end and high-end devices and canvases.
As of December 31, 2023, we utilized approximately 12,000 servers; four
back-end data centers processing over 100TB of data per day to train our AI engine; and nine front-end global data centers that, together, have served up to one trillion recommendations monthly. We use around 500,000 CPU cores, 2.5PB of memory and around 71,000PB of storage overall.
Deployment of our code to the production environment is fully automated and includes execution of tens of thousands of automated tests for each code change,
using AI to locate anomalies in the code to prevent errors. This allows our Research and development to develop software quickly and enables us to continuously deliver reliable code and AI models to
production. To address the extreme complexity of operating at such a massive scale, we use cutting-edge technologies, such as Tensorflow, Spark, Cassandra and Kafka, as well as highly sophisticated code we developed to allow these tools to meet
our scale and reliability requirements.
Our Team
We have assembled a world class team of engineers and data scientists with a business-focused, innovative engineering culture. We have access to top talent in
Asia, Europe, Israel, and the U.S., including very strong talent in AI, Deep Learning, high-scale infrastructure and browser-based technologies. We believe our engineering culture plays a key role in our success: we assign business KPIs to Research
and development teams so technological decisions and priorities are aligned with business needs; we empower engineers to own features end-to-end, from ideation to full adoption; and we put special emphasis on
collaboration. Our engineering culture relies strongly on experimentation and multi-variants testing. We continuously deploy and run hundreds of different AI models, UI variations and optimizations, in effect measuring hundreds of KPIs. We
build our infrastructure such that it enables this culture of continuous improvement.
Our Competitive Strengths
We believe the following key strengths provide us with competitive advantages:
| • |
Performance of our AI Technology. We have spent over 15 years
developing our AI-powered recommendation technology to drive high yield for digital properties, high returns on advertising spend for Advertisers, and relevant recommendations to consumers, who
spend more time consuming content on digital properties. Similarly Connexity, our e-Commerce solution, uses AI powered technology to drive optimized performance for Advertisers and digital
properties.
|
| • |
More than Monetization. The value we provide to digital properties goes beyond monetization. Our technology helps digital properties grow their
audience by optimizing audience exchange programs; recommending content created by the digital properties to increase the time consumers spend on these properties; helping editorial teams make data-driven decisions, and more. We work daily
with our extensive network of global digital properties to improve our platform and create more value for the entire Taboola network.
|
| • |
Exclusive, Multi-Year Partnerships with Premium Digital Properties. We have established long-standing, and in
many cases exclusive relationships with digital properties on the Open Web. They have chosen to work with Taboola across all types of platforms, including desktop, mobile and tablet devices. This provides Taboola and Taboola Advertisers with predictable access to audiences and supply.
|
| • |
Direct Relationships with Advertisers. We work directly with the majority of the Advertisers that use our platform. This allows us to build strong relationships, help Advertisers succeed on our platform, and evolve our technology based on direct feedback.
|
| • |
High Reach and Scale. We have nearly 600 million daily active users across the globe, enabling Advertisers to run campaigns at scale.
|
| • |
Network Effect. As more digital properties use our platform, we gather more content consumption data. More data
makes our AI-driven algorithms more effective in making predictions, which in turn enables us to deliver better performance for Advertisers, which drives higher yields for digital properties.
These higher yields make it easier to retain digital properties and acquire new partners.
|
| • |
Founder-led Experienced Management Team. Our founder, Adam Singolda, has successfully led Taboola as CEO since we began operations in 2007. Most of Taboola’s senior management has worked together with our founder for many years: the average tenure of our senior
management is over nine years, demonstrating strong execution and achieving rapid growth.
|
| • |
Strong Financial Profile. We designed our business to be highly scalable, with a focus on sustainable long-term
development. Since we began operations in 2007, we have demonstrated a track record over time of growth in revenue, gross profit and ex-TAC Gross Profit.
|
| • |
Not Dependent on Third Party Cookies. Our direct integration with many digital properties has helped us navigate changes in the industry. Our engineers continue to
work closely with industry stakeholders to ensure we will be prepared in the likely event that third-party cookies are fully blocked and we continue to invest in innovative solutions that deliver relevant and engaging discovery experiences
for our users.
|
Our Growth Opportunities
We drive revenue by growing users and user engagement, and by driving yield, which represents the revenue we can generate per user. We do this by focusing on the following key
areas:
| • |
Continued Investment in AI. Continuously investing in our AI technology is at the heart of what we do. We
believe AI is critical to engaging Open Web users and will ultimately provide better service and greater monetization to Advertisers and digital properties, increasing our yields and accelerating
our growth.
|
| • |
Grow our Core Digital Property and Advertiser Client Base. While we already have an extensive network of global
digital properties and Advertisers, we believe the efficacy of our recommendation platform gives us the opportunity to expand our partnerships and client base even further, as demonstrated by our
30-year partnership with Yahoo which closed in January 2023. We expect to continue investing in our technology, expanding our global presence, and growing our sales and client service teams to
support further growth.
|
| • |
Add User Touchpoints. At our core, Taboola is a recommendation engine. We believe many types of digital properties need a recommendation engine to
engage their consumers, find new audiences and monetize. This includes e-Commerce websites, connected TVs, devices and more. In 2018, we launched Taboola News, an offering which seamlessly integrates premium content from our digital
properties into connected devices. We believe our existing partnerships with leading device manufacturers and mobile carriers, as well as potential future partnerships with connected TV vendors and others, presents a substantial growth
opportunity for both Taboola and our partners.
|
| • |
Add New Types of Recommendations. From experience, we know recommendation engines become better when they are
able to recommend a greater variety of content. For example, in 2016, we predicted that video content presented a huge opportunity for Advertisers to reach their audiences in a highly impactful
way, for digital properties to drive better monetization and for users to engage with suggested videos, similar to how they are used on social networks such as Instagram. To that end, we added support for video formats in our
recommendation platform and saw significant returns from doing so. Similarly, we believe there is opportunity to further diversify our recommendation offerings and intend to invest in new formats and advertising partnerships to improve
both consumer experience and yield. The ability to display a variety of media formats in novel combinations is key to preventing “banner blindness” that plagues traditional display formats and making our recommendation engine even better.
|
| • |
E-Commerce. We have expanded into the e-Commerce market through our acquisition of Connexity, which
strengthens our data, pairing our readership data with purchasing data that can make our AI better, grow yield and make our advertising partners more successful. Our expansion into e-Commerce aligns with Taboola’s overall business strategy,
which is about working directly with both Advertisers and publishers, serving high quality advertising experiences that do not depend on cookies. E-Commerce is also the way for us to diversify what we recommend - to recommend products - and
to grow our yield for publishers, which helps us become even more competitive. These new capabilities will provide merchants, and publishers, large and small, more opportunities to scale outside of the walled gardens, making the open web
thrive.
|
| • |
Pursue Value-Enhancing Acquisition Opportunities. The Open Web remains highly fragmented, which may present attractive opportunities for us to grow through strategic and value-enhancing acquisitions. We will continue to evaluate potential acquisition
opportunities in light of changing industry trends and competitive conditions. However, given the level of effort we anticipate in launching our partnership with Yahoo, we would expect any acquisitions that we consider to either be small
and very simple to integrate or dramatically value-enhancing.
|
Our Business Partners
We primarily have two types of business partners: digital properties that use Taboola to drive new audiences,
engagement and monetization; and Advertisers, and their agencies, that use Taboola to achieve a variety of marketing objectives.
Digital Properties
Taboola had approximately 12,000 digital property partners in the fourth quarter of 2023, including many premium properties such as Microsoft, NBCUniversal, CBSi, The Independent and El Mundo. These partners value our ability to
drive new audiences to their sites, engage their users, and monetize their digital properties, while our data insights assist them in making informed editorial decisions. Our value is evidenced by our many multi-year, exclusive partnerships. As
of December 31, 2023, our average contract term length with our digital properties was over two years as measured by contract duration at inception; some of our largest partners have even longer-term
agreements. Microsoft is our largest partner. Other than Microsoft, no other digital property partner accounted for 5% or more of our Revenues generated from Advertisers
on digital properties in 2023.
Advertisers
We had approximately 17,000 Advertisers working with us directly, or through advertising agencies, worldwide during the fourth quarter of 2023. The vast
majority of our Revenues comes from Advertisers working with us directly, rather than via an agency. We support the leading programmatic channels via integrations with leading demand side platforms, or
DSPs. Thanks to the effectiveness of our recommendation engine, many of our Advertiser clients are considered “always on,” which means they continuously invest on our platform, rather than running
finite campaigns.
Our Advertiser customer base is highly diverse. Some of the verticals we have seen strong adoption in are health
& fitness, finance, hobbies & interests, technology & computing, home & garden, shopping and automotive. Our ten largest Advertisers accounted for less than 13% of total Revenues on our network in 2023, with none larger than 3%.
Sales and Marketing
To support our “win-win” approach to working with both digital properties and Advertisers, we employ a global sales
team tasked with signing new partners and growing existing implementations. Our team is deployed around the world with sales hubs in Bangkok, London, Los Angeles, New York, and Sao Paulo, supported by regional satellite offices in order to best
serve our geographically diverse client base.
Selling to Digital Properties
Our sales teams are responsible for adding new partnerships with digital properties. Once a digital property joins our network, our account management team works with the
digital property’s stakeholders to understand their goals, help them reach those goals, and identify new opportunities for mutual growth on an ongoing basis.
Selling to Advertisers
We sell to Advertisers through our global sales team and a “self-service” website. Our sales team onboards new
customers, mostly large Advertisers, through direct outreach from one of our international sales offices. Our account management teams provide ongoing guidance and data insights that inform campaign
strategies and help Advertisers learn how to maximize their return on investment with Taboola. Advertisers can also choose our self-service platform to launch and manage campaigns. Outside of account
managers, we support Advertisers through our online Help Center, in-product instructions, and a large number of video tutorials.
Marketing
To support our global sales force, our marketing team presents at industry conferences and hosts webinars and customer events. In addition, our marketing team invests in
public relations, advertises online to build brand awareness and acquire new customers, creates case studies, sponsors third-party research, authors data insight reports, creates marketing collateral, publishes blog posts and creates and sponsors
events online and in-person.
Competition
We operate in a highly competitive industry. Our main competition for advertising budgets and digital property partnerships are walled gardens and advertising intermediaries:
Walled Gardens. We compete for advertising dollars with the closed ecosystems of technology
companies such as Google, Meta/Facebook and Amazon. In many cases we also compete with those companies, in particular Google, for real estate on digital properties. As described above, unlike the
walled gardens, our business is based on a “win-win” model of partnership, where we do not compete with our partners and our goals are aligned.
Advertising Intermediaries. A large number of companies provide a solution to one or more of the
steps involved in the buying and selling of advertisements online. These include The Trade Desk, Magnite, PubMatic, Xandr, Outbrain, Plista, TripleLift, RevContent, Teads and others. While these
companies may be in competition with us, some are also partners of ours.
When competing for Advertiser business, we compete for budgets based on price, reach, speed, brand safety and
performance. When competing for digital properties’ business, we are measured on our ability to generate revenue and support other business goals, such as audience development.
Intellectual Property
Our proprietary recommendation engine and associated algorithms and technologies are key to our success, and we rely upon a combination of trade secret, trademark, copyright,
and patent laws in the United States and abroad as well as confidentiality agreements and technical measures to establish, maintain and protect our intellectual property and protect our proprietary recommendation engine and associated algorithms
and technologies.
Historically, we have not patented our proprietary technology in order to keep our technology architecture, trade secrets, and engineering roadmap private;
however, as of December 31, 2023, we own approximately twenty issued patents. We also own registrations for certain domain names, trademarks and service marks
in the United States and in certain locations outside the United States. Additionally, we rely upon common law protection for certain trademarks. We generally enter into confidentiality and invention assignment agreements with our employees and
contractors, and confidentiality agreements with our partners and clients with whom we conduct business, in order to limit access to, and disclosure and use of, our proprietary information.
Our proprietary, internally developed know-how is also an important element of our intellectual property portfolio.
The development and management of our platform requires sophisticated coordination among many specialized employees. To protect our technology, we implement multiple layers of security and our data protection measures are ISO 27001 certified.
Taboola’s General Privacy Practices
Taboola is committed to protecting personal data and providing users transparency and control over the use of their data in online advertising. We seek to strictly enforce our privacy and data
protection policies, knowing this is important to our partners, clients, users and vendors.
Historically, we have not collected data that would enable the direct identification of Internet users. As of December 31, 2023, we used only pseudonymous data about Internet users on our
platform to manage and execute digital advertising campaigns. We either collect this data directly from users’ devices or it is passed to us by third parties. We provide consumers with notice about our use of cookies and our collection and use of
data in connection with the delivery of targeted advertising and allow them to opt-out from the use of data we collect for the delivery of targeted advertising.
We are members of, or participants, in industry self-regulatory organizations, including the Digital Advertising Alliance, the Digital Advertising Alliance Canada, and the European Interactive
Digital Advertising Alliance. Taboola also adheres to the Interactive Advertising Bureau’s Self-Regulatory Principles for Online Behavioral Advertising, and the IAB Europe OBA Framework. In addition, Taboola is a proud member in good standing of
the Network Advertising Initiative, an association dedicated to responsible data collection use in digital advertising, and we adhere to the NAI Code of Conduct for Web and Mobile.
Our privacy team delivers company-wide privacy training, enforces our privacy policies and is integral to ensuring that we consider the privacy implications in all aspects of our proprietary
platform. We regularly review and document our internal privacy policies, amend existing policies as necessary, and seek to enforce these policies with our clients, publisher partners and vendors. Our privacy team is also actively involved in
negotiations with our customers on data and privacy terms to ensure compliance with relevant laws.
Privacy and data protection laws and regulations play a significant role in our business. Our ability to collect, augment, analyze, use, share and otherwise process data relies upon the ability
to uniquely identify devices across websites, and applications, and to collect data about user interactions with those devices for purposes such as serving relevant ads and measuring the effectiveness of ads. Federal, state and international laws
and regulations regarding the collection, use and other processing of personal data by advertising networks, Advertisers and digital properties is frequently evolving. This includes those related to the level of consumer notice and consent
required before a company can employ cookies or other electronic tools to collect data about interactions with users online. Taboola’s operation of its platform and services is subject to numerous U.S. and global privacy regulations, including,
without limitation, the following: the European Union’s General Data Protection Regulation and ePrivacy Directive, the United Kingdom’s General Data Protection Regulation, the California Consumer Privacy Act (as amended by the California Privacy
Rights Act), China’s Personal Information Protection Law, South Korea’s Personal Information Protection Act, Turkey’s Law on the Protection of Personal Data, and New Zealand’s Privacy Act 2020.
Privacy Regulation in the U.S.
In the United States, at both the federal and state level, there are laws that govern activities such as the collection, use and other processing of personal data by covered companies. At the
federal level, online advertising activities and data processing activities are subject to regulation by the Federal Trade Commission, which has regularly relied upon Section 5 of the Federal Trade Commission Act to enforce against unfair and
deceptive acts and practices, including alleged violations of consumer privacy interests. The Federal Trade Commission has also started enforcing HIPAA in relation to disclosure of online identifiers by covered entities to adtech companies. In
addition, some proposed and recently enacted legislation concerning privacy and data protection has affected and will continue to affect our operations and those of our industry partners. Certain state laws may be more stringent or broader in
scope, or offer greater individual rights, with respect to personal data than federal, international, or other state laws, which may differ from one other, complicating compliance efforts.
For example, the California Consumer Privacy Act (as amended by the California Privacy Rights Act), or CCPA, increases privacy rights for California consumers and imposes obligations on companies
that process their personal data (including device identifiers, IP addresses, cookies and geo-location). Among other things, the CCPA requires covered companies to provide disclosures to California consumers and provide such consumers with data
protection and privacy rights, including the ability to opt-out of certain sales or sharing of personal data, including for targeted advertising, and the ability to limit the processing of certain sensitive personal data. The CCPA provides for
civil penalties for violations, as well as a private right of action for certain data breaches that result in the loss of personal data. Numerous other states have enacted, or are considering enacting, similar legislation. State laws continue to
change rapidly, all while discussions continue in Congress about a new comprehensive U.S. federal data privacy law to which Taboola would become subject, if it is enacted. In addition, laws in all 50 U.S. states generally require businesses to
provide notice under certain circumstances to consumers whose personal data has been disclosed as a result of a data breach. These laws are not consistent, and compliance in the event of a widespread data breach is difficult and may be costly.
Moreover, there has been a rise in enforcement action and regulation for data privacy in various sectors. For example, Washington state has passed the first comprehensive state health data law,
the Washington My Health My Data Act, or MHMD, which, starting in March 2024, will require Taboola to obtain opt-in consent for processing health data in Washington or of Washington consumers. MHMD broadly defines health data to include data that
is inferred from nonhealth data when that information is used by a covered entity, or its processor, to associate or identify a consumer with health data. This broad definition means that Taboola will be limited with what advertising services it
can provide in Washington to customers in the health and wellness field. MHMD also provides a private right of action for consumers to sue entities that process their data in violation of the MHMD. Further, the FTC has issued substantial fines to
HIPAA covered entities for sharing protected health information with third parties like Taboola for advertising purposes and has released guidance around what kind of online tracking activity constitutes sharing protected health information. This
new guidance on the scope of HIPAA applicability reduces the data we can collect on users.
Privacy Regulation in Europe
Our business activities are also subject to foreign legislation and regulation. For example, we are required to comply with the General Data Protection Regulation, or GDPR, in the European
Economic Area, or EEA, and the GDPR’s equivalent in the United Kingdom, or UK GDPR, which impose strict obligations and restrictions on the ability to collect, use, retain, protect, disclose, transfer and otherwise process personal data
(including online identifiers and location data). The GDPR and UK GDPR enhance data protection obligations for “controllers” of such data and for service providers, called “processors,” processing the data. They also provide certain rights, such
as access and deletion, to the individuals about whom the personal data relates and we have adapted our services to accommodate such rights. The digital advertising industry has collaborated to create a user-facing framework, which we use as of
December 31, 2023, for establishing and managing legal bases under the GDPR and other EEA privacy laws including the EU Directive 2002/58/EC (as amended by Directive 2009/136/EC).
While the UK GDPR currently imposes substantially the same obligations as the GDPR, the UK GDPR will not automatically incorporate changes to the GDPR going forward (which would need to be
specifically incorporated by the United Kingdom, or UK, government). Moreover, the UK government has publicly announced plans to reform the UK GDPR in ways that, if formalized, are likely to deviate from the GDPR, all of which creates a risk of
divergent parallel regimes and related uncertainty, along with the potential for increased compliance costs and risks for affected businesses. Failure to comply with the GDPR or UK GDPR can result in fines of up to 4% of global annual revenue or
€20 million (or £17 million under the UK GDPR), whichever is greater. In addition, some EU countries are considering or have passed legislation implementing data protection requirements or requiring local storage and processing of data or similar
requirements that could increase the cost and complexity of delivering our services.
Moreover, legal developments in the EEA have created complexity and uncertainty regarding transfers of personal data from the EEA to the U.S. and other so-called third countries outside the EEA.
Similar complexities and uncertainties also apply to transfers from the UK to third countries. For the transfer of personal data from the EEA to the U.S. and from the UK to the U.S., we rely upon the EU’s standard contractual clauses, or SCCs,
and the UK’s international data transfer agreement (or the UK’s international data transfer addendum that can be used with the EU’s SCCs). However, SCCs have been subjected to regulatory and judicial scrutiny and the legal bases for cross-border
data transfers are constantly evolving. On July 10, 2023, the European Commission adopted an adequacy decision concluding that the U.S. ensures an adequate level of protection for personal data transferred from the EU to the U.S. under the
EU-U.S. Data Privacy Framework (followed on October 12, 2023 with the adoption of an adequacy decision in the UK for the U.S.-UK Data Bridge). While Taboola is working to participate in the EU-U.S. Data Privacy Framework and the U.S.-UK Data
Bridge, such adequacy decision by the European Commission has been challenged in EU courts, and is likely to face additional challenges. Moreover, although the European Commission has issued an adequacy decision in respect of the UK’s data
protection framework, enabling data transfers from the EEA to the UK to continue without requiring organizations to put in place contractual or other measures in order to lawfully transfer personal data between the territories, this adequacy
determination will automatically expire in June 2025 unless extended. Further, the European Commission may unilaterally revoke the adequacy decision at any point.
Further, EU Directive 2009/136/EC, commonly referred to as the “Cookie Directive,” directs European Union, or EU, member states to ensure that accessing information on an Internet user’s device,
such as through a cookie, is allowed only if the Internet user has given his or her consent. As there were different transpositions of the Cookie Directive in domestic laws across the EU Member States, there are currently different
interpretations of what constitutes valid consent (e.g., explicit versus implied consent) across the EU, posing a risk of regulatory divergence and creating legal uncertainty for businesses. The EU also has released a proposed replacement to the
Cookie Directive, commonly known as the “ePrivacy Regulation,” to, among other things, better align EU member states and the rules governing online tracking technologies and electronic communications, such as unsolicited marketing and cookies,
with the requirements of the GDPR. While the ePrivacy Regulation was originally intended to be adopted alongside the GDPR, it is currently going through the European legislative process, and commentators now expect it to be adopted in the coming
years. Like the GDPR, the proposed ePrivacy Regulation has extra-territorial application as it applies to businesses established outside the EU which provide publicly-available electronic communications services to, or gather data from the
devices of, users in the EU. The ePrivacy Regulation may impose burdensome requirements around obtaining consent and impose fines for violations that are materially higher than those imposed under the EU’s current ePrivacy Directive and related
EU member state legislation.
Privacy Regulation in the Asia-Pacific Region
Our business activities are also subject to legislation and regulation in the Asia-Pacific region. Following the implementation of the GDPR, many jurisdictions have moved to amend, release,
review and strengthen their existing data privacy and cybersecurity laws, and there has been a progressive effort in the region to work towards coordination of their otherwise disparate laws. For example, many countries have also sought out
adequacy decisions from the EU. New Zealand’s updated Privacy Act and South Korea’s amendments to its Personal Information Protection Act, which went into effect in 2020, and China’s Personal Information Protection Law (PIPL), which went into
effect in 2021, largely align with requirements of the GDPR. Thailand and Japan’s new similar updates and regulations also became effective in 2021 and 2022, respectively.
While China’s PIPL establishes a regime that is largely similar to the GDPR, it also imposes some stricter requirements. For instance, the PIPL has heightened disclosure requirements and specific
consents for processing sensitive personal data and transferring personal data outside of China. The PIPL also mandates security impact assessments under a number of processing scenarios and imposes a data localization requirement on both
operators of critical information infrastructure and covered companies that process large volumes of personal data. The PIPL also creates penalties for organizations that fail to fulfill their obligations to protect personal data, with potential
fines up to 5% of annual revenue.
In August 2023, India passed the Digital Personal Data Protection Act, or DPDP Act, a comprehensive privacy law with extra-territorial effect that mirrors other privacy laws like the GDPR and
puts requirements on data fiduciaries for when and how they can process data and gives data subjects rights to their data. Penalties for violating the DPDP Act can be up to INR 250 crores (approximately $30 million). Taboola will be subject to
the DPDP Act upon its effective date, which has not yet been set.
Other jurisdictions, such as Singapore, Malaysia and Hong Kong, are reviewing their existing privacy regimes, with an eye toward similar privacy and data protection developments.
To address this range of developments, Taboola’s privacy and data protection program is largely rooted in the GDPR and ISO 27001 security standards, and any international data transfers from the
Asia-Pacific region are governed by direct contractual agreements between the regional entities and Taboola’s Israeli parent corporate entity, Taboola.com Ltd. Otherwise, our privacy team works to oversee compliance with these Asia-Pacific
regional requirements and to address compliance with our region-specific clients and business teams.
Human Capital
We strive to create a diverse, inclusive and ambitious environment where every employee can discover and unleash their potential to achieve individual and collective success.
Our employees are our most valuable asset.
Employees
On December 31, 2023, we had approximately 1,900 employees, the majority of
which have been employed by Taboola for over two years (including service periods of persons employed by Connexity prior to Taboola’s acquisition of Connexity). We have approximately 500 employees working in research and development, with an average tenure of four years.
As of December 31, 2023, our employees are not covered by a collective bargaining agreement, except as required by law
under arrangements in France, Spain, and Brazil, covering a total of approximately 80 employees. We have never experienced a general strike or similar work stoppage.
Transparency
The ability to be transparent and share and discuss our business challenges and opportunities openly and broadly with all our employees is important to our success. We
promote an open dialogue with our employees through all-hands meetings, usually twice a month, which include Q&A sessions with senior leadership. We conduct annual and topic-specific employee feedback surveys which consistently receive 80% or
higher response rate. Survey results are shared publicly with our managers and employees. We continue to adjust our investment in human capital based on the feedback from our employees.
Talent Acquisition and Development
We are focused on recruiting and retaining talented employees across the organization, with a particular focus on unique talent in algorithms, product, customer
relationship management and many other areas that are critical to our success. We continue to invest to hire and retain top talent in all of our offices, and provide competitive compensation for our employees and a range of flexible
benefits, including an industry-leading parental leave policy. We have been consistently recognized by Dun & Bradstreet as a top high-tech company to work for in Israel in 2023, by UK Campaigns as a 100 Best Places to Work and by Built In as one of the 100 best large companies to work for in all four of our major U.S. officers in 2023: New York, Los Angeles, Chicago and Atlanta. Our strong external reputation led to a quarterly average of over 20,000 candidates applying to work at
Taboola in 2023. For new hires, we developed an onboarding program tailored towards their roles and responsibilities. On an ongoing basis, we invest in training and development programs that help our
employees achieve their career goals, build management skills and lead their organizations. We have two formal career feedback discussions per year where managers and their employees discuss progress and feedback for each other. We believe in
developing and promoting top talent from within: in 2023, approximately 15% of our employees were offered an
opportunity for career advancement within the company.
Performance and Alignment
We seek to implement a “pay for performance” culture that we believe drives superior results. We invest in our
workforce by offering competitive salaries, incentives, and benefits. We align the interests of our employees with those of Taboola through a broad-based equity award program, generally with a four-year vesting schedule. Typically, employee
bonus plans are based on both personal and company goals.
Wellness and Diversity
In 2020, we launched a global taskforce that is focused on promoting wellness and diversity within our
organization. The task force works with our senior management team to address global wellness and diversity topics and develop relevant initiatives to ensure we continue to build a culture where every employee
feels valued, seen, and heard. We continue to have a mechanism for employees to anonymously voice concerns.
Throughout 2023, we continued to see the results of our initiatives. With respect to finding top diverse talent, we began by assessing our current workforce demographics by region and business
unit, and established goals and guidelines in efforts of diversifying our recruitment funnel at the first assessment stage. We committed to wellness and diversity in recruiting by starting a Diverse Interview Slate Campaign to promote diversity
in the interview process and reduce biases, which led to hiring more women managers in technical roles. We further invested in strategic partnerships with employment platforms that provide us multi-pronged access to highly skilled
underrepresented talent, who may not currently be on our platform, such as Built-In, Ivy Research Council, and Jopwell. As a result, in 2023, we saw that 45% of our new hires were women and 16% of those women were hired into technical positions.
Within the organization, in 2023 we increased the number of Employee Resource Groups from seven to nine, and each has an annual budget to sponsor programming and events. We also have a mentorship
program connecting Black, Indigenous and People of Color (BIPOC) talent to senior leaders. We continue to have a number of global and region-specific initiatives held to promote a culture of inclusion and belonging - such as, workshops, panels,
networking events and communities for various interest groups. We also partner with Gold Enterprises to create robust programming for our multi-year wellness and diversity training plan.
We are committed to building a long-term plan that will help foster a community that is diverse and inclusive, both internally and externally.
Available Information
The mailing address of Taboola’s principal executive office is 16 Madison Square West, 7th fl., New York, NY, 10010 and its telephone number is (212) 206-7663. Our agent for service of process in the United States is Taboola, Inc., 16 Madison Square West, 7th fl., New York, NY, 10010.
We recognize that in today’s environment, our current and potential investors, the media and others interested in us look to social media and other online sources for information about us. We
believe that these sources represent important communications channels for disseminating information about us, including information that could be deemed to constitute material non-public information. As a result, in addition to our investor
relations website (https://investors.taboola.com), filings made with the SEC, press releases we issue from time to time, and public webcasts and conference calls, we have used and intend to continue to use various social media and other
online sources to disseminate information about us and, without limitation, our general business developments; financial performance; product and service offerings; research, development and other technical updates; relationships with customers,
platform providers and other partners; and market and industry developments. We intend to use the following social media and other websites for the dissemination of information:
Our blog: https://blog.taboola.com/
Our X feed: https://twitter.com/taboola
Our CEO, Adam Singolda’s X feed: https://twitter.com/AdamSingolda
Our Facebook page: https://www.facebook.com/Taboola/
Our corporate LinkedIn page: https://www.linkedin.com/company/taboola/
We invite our current and potential investors, the media and others interested in us to visit these sources for information related to us. Please note that this list of social media and other
websites may be updated from time to time on our investor relations website and/or filings we make with the SEC. We have included our web address and social media and other web addresses in this Annual Report
solely for informational purposes and the information on our website and those social media channels is not incorporated by reference into this Annual Report.
The SEC maintains an Internet site that contains reports, proxy and information statements, and other information regarding issuers, such as we, that file electronically,
with the SEC at www.sec.gov.
Executive Officers
Adam Singolda (42) has been the Chief Executive Officer, as well as a director, of Taboola since it began operations in 2007. He also serves as a member of the board of directors of K Health, the healthcare startup he co-founded in
2016. Prior to that Mr. Singolda studied Computer Science at The Open University of Israel and spent 6½ years serving in an advanced cyber technology unit of the Israel Defense Forces, or IDF, serving
as a research and development engineer and manager. He graduated from the IDF officers’ academy with honors. Mr. Singolda’s experience as the founder and Chief Executive Officer of Taboola makes him exceptionally well qualified to serve on our
board of directors.
Eldad Maniv (55) has been the President and Chief Operating Officer of Taboola since 2012. Mr. Maniv leads Taboola’s worldwide
operations including Taboola’s sales, professional services, and human resources organizations. Mr. Maniv has spent approximately two decades building technology companies in the United States and Israel, having previously served in executive
positions at BMC Software, Zend Technologies, and Identify Software. Earlier in his career, he founded NextNine which was acquired by Honeywell. Mr. Maniv currently serves as a director on the board of
directors of Verbit.ai. Mr. Maniv holds a B.S. degree from the Talpiot program at the Hebrew University in Jerusalem, and served five years as a systems engineering officer in an intelligence unit of the Israel Defense Forces.
Lior Golan (53) has been Chief Technology Officer of Taboola since 2009 and is responsible for Taboola’s product and technical strategy worldwide. Prior to joining Taboola, Mr. Golan was co-founder, Chief Technology Officer, and
Vice President of Research & Development of Cyota, a leader in consumer Internet security. After Cyota was acquired by RSA Security in 2005, Mr. Golan spent two years as Chief Technology Officer and Vice President of Strategy of the RSA
Security Consumer Division and was responsible for leading the product and business direction of its consumer business. Mr. Golan holds a B.S. degree from the Talpiot program at the Hebrew University in Jerusalem and served eight years in an
intelligence unit of the Israel Defense Forces.
Stephen Walker (54) has been Chief Financial Officer of Taboola since June 2020. Prior to that, he served as Taboola’s Senior Vice
President of Worldwide Sales Operations from 2015 to 2020 and as the General Manager of Taboola-X product between 2014 and 2015. From 2007 until 2014, he served as President and Chief Operating Officer of Perfect Market, until it was acquired
by Taboola. Earlier, Mr. Walker held positions in Idealab’s New Ventures Group and led several of Idealab’s portfolio companies. Mr. Walker has a B.S. degree in Computer Science and Finance from Boston College and an M.B.A degree from Harvard
Business School.
Kristy Sundjaja (46) has been Chief People Officer since February 2022. Prior to that she served as Senior Vice President of People Operations for Taboola from 2019 to 2022. Prior to joining Taboola in 2019, she co-founded Exceptional Artists Foundation in 2017, a non-profit organization empowering the disabled community, and remains as its President. From 2012 to 2017, Ms. Sundjaja was the Chief of Staff and the Global Head of People at
LivePerson. Between 2009 and 2012, Ms. Sundjaja was the Head of Industry Transformation Teams at New York City Economic Development
Corporation. Prior to that, Ms. Sundjaja was an Associate Partner at Oliver Wyman where she worked between 1999 and 2009. Ms. Sundjaja graduated from the University of Pennsylvania with a B.S. degree in Economics from the Wharton School and a
B.S. degree and an M.S. degree in Engineering. She also holds an M.B.A degree from Columbia University.
| ITEM 1A. |
RISK FACTORS
|
Risks Related to Our Business and Industry
If we are unable to attract new digital properties and Advertisers, sell additional offerings to
our existing digital properties and Advertisers, or maintain enough business with our existing digital properties and Advertisers, our revenue growth prospects
will be adversely affected.
We must add new digital properties and Advertisers, and encourage existing digital properties and Advertisers to add additional offerings from us, in order to sustain or increase our revenue. As the digital advertising industry matures and as competitors introduce more competitive pricing or differentiated
products or services that compete with or are perceived to compete with ours, our ability to sell our solutions to new and existing digital properties and Advertisers could be impaired. In addition, we
may reach a point of saturation at which we cannot continue to grow our revenue from existing digital properties and Advertisers because of internal limits they may place on the allocation of space on
their sites, allocation of their advertising budgets to digital media, to particular campaigns, to a particular provider, or other reasons. We may also lose revenues if our existing digital properties and Advertisers reduce the amount of business they do with us for any reason, including nonrenewal of their agreements with us or renewal on less favorable terms. If we are unable to attract new digital properties and Advertisers or obtain new business from existing digital properties and Advertisers or maintain enough business with our existing digital properties and Advertisers, our revenue, our revenue growth prospects and business will be adversely affected.
If our performance under contracts with digital properties, where we are obligated to pay a specified minimum guaranteed amount per thousand impressions, do
not meet the minimum guarantee requirements, our gross profit could be negatively impacted and our results of operations and financial condition could be harmed.
A significant amount of our revenue comes from contracts with digital properties where we are obligated to pay a specified minimum guaranteed amount per thousand
impressions to the digital property. In each of the years ended December 31, 2022 through 2023, our guarantee costs, which we calculate as total payments due
under guarantee arrangements in excess of amounts we otherwise would have been required to pay under revenue sharing arrangements, as a percentage of our total payments to digital properties, or TAC, was approximately 19% or less. Although we focus on achieving sufficient revenue per impression through the improvement of our algorithms and using our scale to exceed the minimum guarantees made to digital properties, we may not succeed in doing so.
In addition, due to unfavorable macroeconomic, competitive or other conditions, we may be unable to perform as expected under arrangements that provide for such minimum guarantees, in which case our gross profit could be negatively impacted and
our results of operation and financial condition could be adversely affected.
We may not be able to compete successfully against current and future competitors because competition in our industry is intense and many
competitors, such as Google and Facebook, have substantially more resources than we do. Our competitors may also offer solutions that are perceived by our digital properties and Advertisers to be more
attractive than our platform. These factors could result in declining revenue or inhibit our ability to grow our business.
Competition for our clients’ advertising budgets is intense. We compete for a share of total advertising budgets with online search and display advertising, including large
“walled garden” advertising platforms such as Google and Facebook, and with traditional advertising media, such as direct mail, television, radio, cable and print. Many current and potential competitors have competitive advantages relative to us,
such as longer operating histories, greater name recognition, larger client bases, greater access to advertising inventory on premium websites and significantly greater financial, technical, sales and marketing resources. Thus, increased
competition may result in the loss of business or the inability to win new business, which could negatively affect our revenue and future operating results and our ability to grow our business.
We also expect competition on the digital property side to continue increasing as the industry grows. Increased competition may require us to increase the revenue share with
our digital properties, charge less for our solutions, or offer other pricing models that are less attractive to us, any of which could decrease our revenues and margins and harm our results of operations.
If the Yahoo partnership and our ability to transition and fully launch the native advertising service with Yahoo is not successful or implemented on the currently projected
timeframe the partnership may not be as financially accretive as we are projecting and our business, operating results, financial condition and reputation could be adversely affected.
Our ability to transition and fully launch the native advertising service with Yahoo is dependent on several factors, including the need to achieve key technological milestones and to efficiently
manage the integration of our solution with Yahoo. Adapting our technology and successfully integrating our solution with Yahoo is complex, difficult, time-consuming, and costly and may place significant strain on our personnel, systems and
resources. If we are unable to integrate our solution with Yahoo in a timely manner, or if Yahoo Advertisers terminate their existing contracts and decline to move to the new Taboola service or if there is otherwise inadequate market acceptance of
the new service (or a combination of the foregoing) it could result in the failure to meet our projected financial targets. We may also experience attrition from Yahoo employees resulting in the loss of critical institutional knowledge needed to
successfully integrate the partnership. The financial accretion we expect to generate from the Yahoo partnership may not be realized until we successfully integrate our platform with Yahoo which may be later than we currently project, or at all,
and requires significant upfront expenditures which may exceed our current estimates. These factors, including the size and complexity of the integration, if not implemented and managed successfully, may result in a deterioration of our client
relationships, increased costs of integration, harm to our reputation, any of which could materially adversely affect our business, operating results and financial condition.
Our future growth and success depends on our ability to continue to scale our existing offerings and to introduce new solutions that gain
acceptance from digital properties and Advertisers and that differentiate us from our competitors.
Our future success depends on our ability to effectively scale our offerings as our business grows to keep pace with demand for our solutions, and achieve long-term
profitability. If we fail to implement these changes on a timely basis, or if we are unable to implement them effectively or at all due to factors beyond our control or other reasons, our business may suffer. We may not be successful in addressing
these and other challenges we may face in the future. As a growing company in a rapidly evolving industry, our business prospects depend in large part on our ability to:
| • |
develop and offer a competitive technology platform and offerings that meet our digital properties’ and Advertisers’ needs as they
change;
|
| • |
continuously innovate and improve on the algorithms underlying our technology in order to deliver positive results for our Advertisers
and digital properties;
|
| • |
build a reputation for superior solutions and create trust and long-term relationships with digital properties and Advertisers;
|
| • |
distinguish ourselves from strong competitors in our industry;
|
| • |
maintain and expand our relationships with Advertisers who can provide quality content and advertisements;
|
| • |
respond to evolving industry and government oversight, standards and regulations that impact our business, particularly in the areas of native advertising, data collection, privacy and data protection;
|
| • |
prevent or otherwise mitigate failures or breaches of security or privacy; and
|
| • |
attract, hire, integrate and retain qualified and motivated employees.
|
If we are unable to meet one or more of these objectives or otherwise adequately address the risks and difficulties that we face, our business may suffer, our revenue may
decline and we may not be able to achieve further growth or long-term profitability.
If we do not manage our growth effectively, the quality of our platform or our relationships with our digital properties and Advertisers may suffer, and our operating results may be negatively affected.
Our business has historically grown rapidly. We rely heavily on information technology, or IT, systems to manage critical functions such as content
recommendation, campaign management and operations, payment from Advertisers and to digital properties, data storage and retrieval, revenue recognition, budgeting, forecasting, financial reporting and
other administrative functions. To manage our growth effectively, we must continue to improve and expand our infrastructure, including our IT, financial and administrative systems and controls. We must also continue to manage our employees,
operations, finances, research and development and capital investments efficiently. Our productivity and the quality of our platform may be adversely affected if we do not integrate and train our new employees, particularly our research and
development, sales and account management personnel, quickly and effectively and if we fail to appropriately coordinate across our executive, finance, human resources, legal, marketing, sales, operations and Advertiser support teams. If we continue to experience rapid growth, we will incur additional expenses, and our growth may place a strain on our resources, infrastructure and ability to maintain the
quality of our platform. If we do not adapt to meet these evolving growth challenges, and if the current and future members of our management team do not effectively scale with our growth, the quality of our platform may suffer and our corporate
culture may be harmed. Failure to manage our future growth effectively could cause our business to suffer, which, in turn, could have an adverse impact on our financial condition and results of operations.
If we fail to make the right investment decisions in our offerings and technology platform, or if we are unable to generate or otherwise
obtain sufficient funds to invest in them, we may not attract and retain digital properties and Advertisers and our revenue and results of operations may decline.
Our industry is subject to rapid changes in standards, regulations, technologies, products and service offerings, as well as in digital property and Advertiser demands and expectations. We continuously need to make decisions regarding which offerings and technology to invest in to meet such demands and evolving industry standards and regulatory requirements. We may
make wrong decisions regarding these investments. If new or existing competitors offer more attractive offerings, we may lose digital property and/or Advertisers, or Advertisers may decrease their spending on our platform. New digital property or Advertiser demands, superior competitive offerings, new industry standards or regulations could render our existing
solutions unattractive, unmarketable or obsolete and require us to make substantial unanticipated changes to our technology platform or business model. Our failure to adapt to a rapidly changing market or to anticipate digital property and/or Advertiser demands could harm our business and our financial performance.
We have had, and may in the future continue to have, significant fluctuations in our operating results, which make our future results difficult to predict
and could cause our operating results to fall below investors’ expectations.
Our quarterly and annual operating results have fluctuated significantly in the past. Similarly, we expect our future operating results to fluctuate for the
foreseeable future due to a variety of factors, many of which are beyond our control. Our fluctuating results could cause our performance to fall below the expectations of investors, and adversely affect the price of our Ordinary shares. Because our business is changing and evolving rapidly, our historical operating results may not be useful in predicting our future operating results and it is difficult for us to accurately predict future results.
In addition, our rapid growth has limited our ability to reliably track key business metrics and so we have limited understanding of certain aspects of our operations. For example, we do not have good visibility into the seasonality of our
business due to the fact that our rapid growth may have masked seasonality. Factors that may increase the volatility of our operating results include the following:
| • |
the addition or loss of new digital properties;
|
| • |
changes in demand and pricing for our platform;
|
| • |
the seasonal nature of Advertisers’ spending on digital advertising campaigns;
|
| • |
changes in our pricing policies or the pricing policies of our competitors;
|
| • |
the introduction of new technologies, product or service offerings by our competitors;
|
| • |
changes in Advertisers’ budget allocations or marketing strategies;
|
| • |
changes and uncertainty in the regulatory environment for us or Advertisers;
|
| • |
changes in the economic prospects of our digital properties and Advertisers or the economy generally, which could alter current or
prospective Advertisers’ spending priorities, or could increase the time or costs required to complete sales with digital properties or Advertisers;
|
| • |
changes in the availability of advertising inventory or in the cost to reach end consumers through digital advertising;
|
| • |
changes in our capital expenditures as we acquire the hardware, equipment and other assets required to support our business and potential supply issues in acquiring
that hardware and assets;
|
| • |
costs related to acquisitions of people, businesses or technologies; and
|
| • |
traffic patterns.
|
Based upon all of the factors described above and others that we may not anticipate, including those beyond our control, we have a limited ability to forecast our future
revenue, costs and expenses. As a result, our operating results may from time to time fall below our estimates or the expectations of investors.
If the use of cookies is rejected by Internet users, subject to unfavorable legislation or regulation, restricted, blocked or limited by technical changes on end users’ devices
or Internet browsers, or our ability to use cookie data is otherwise restricted and we are unable to track users in some other way, our performance could decline and we could lose digital properties and Advertisers and, as a result, revenue.
We use “cookies” (small text files) to gather important data to help deliver our solutions. These cookies are placed through an Internet browser on an Internet user’s device and correspond to a
data set that we keep on our servers. Some of our cookies are “third party” cookies where we do not have a direct relationship with the Internet user. Our cookies collect information, such as when an Internet user views an Internet site, clicks on
an ad, or visits one of our digital properties. We use these cookies to help us achieve our digital property or Advertisers’ campaign goals, to help us ensure that the same Internet user does not unintentionally see the same recommendations too
frequently, to report aggregate information to our Advertisers regarding the performance of their campaigns, and to detect and prevent fraudulent activity. We also use data from cookies to help us decide on an opportunity to place a recommendation
in a certain location, at a given time, in front of a particular Internet user. A lack of data associated with cookies may detract from our ability to make decisions about an Advertiser’s campaign and undermine the effectiveness of our solutions.
Recently, there has been a general trend among Internet users to refuse to accept cookies on their Internet browsers. All of the most commonly used Internet browsers (including Chrome, Firefox,
Internet Explorer, Edge and Safari) allow Internet users to prevent cookies from being accepted by their browsers. Internet users can also delete cookies from their devices at any time. Some Internet users also download “ad blocking” software that
prevents cookies from being stored on a user’s device. If more Internet users block or delete cookies more frequently than they currently do, our business could be harmed.
Moreover, technology companies in the Internet browser and operating system spaces, including Google, have announced intentions to discontinue the use of cookies, and to develop alternative methods
and mechanisms for tracking users. These web browser and operating system developers have significant resources at their disposal and command substantial market share, and any restrictions they impose could foreclose our ability to understand the
preferences of a substantial number of consumers. The Safari, Firefox, and Edge browsers currently block cookies by default, and other browsers may do so in the future. On January 4, 2024, Google started restricting third-party cookies by default
for 1% of global Google Chrome users. Unless such default settings in browsers are adjusted by Internet users, our ability to set our cookies in browsers will be more limited, which could adversely affect our business. Google also has announced
plans to completely phase out third-party cookies in Google Chrome during the second half of 2024. Moreover, mobile devices using Android and iOS operating systems limit the ability of cookies to track users while they are using applications other
than their web browser on the device. As a consequence, fewer of our cookies or media partners’ cookies may be set in browsers or be accessible in mobile devices, which can adversely affect our ability to target and measure ads effectively.
Additionally, the use of cookies, as well as the use of the data collected using cookies, is subject to legislation and regulation, and may be subject to further legislation or regulation in the
future. The EU, the UK, the U.S. and other governments have enacted or are considering legislation that regulate the level of consumer notice and consent required before a company can employ cookies or other electronic tracking tools.
Although we believe we are well positioned to adapt and continue to provide key data insights to our media partners without cookies, this transition could be more disruptive, slower, or more
expensive than we currently anticipate, and could materially affect the accuracy of our recommendations and ads and thus our ability to serve our Advertisers, including through our data marketplace product, adversely affecting our business, results
of operations, and financial condition. Limitations on the use or effectiveness of cookies, or other limitations on our ability to collect and use data for advertising, may impact the performance of our platform. We may be required to, or otherwise
may determine that it is advisable to, make significant changes in our business operations and product and services to obtain user opt-in for cookies and use of cookie data, or develop or obtain additional tools and technologies to compensate for a
lack of cookie data. We may not be able to make the necessary changes in our business operations and products and services to obtain user opt-in for cookies and use of cookie data, or develop, implement or acquire additional tools that compensate
for the lack of data associated with cookies. Moreover, even if we are able to do so, such additional products and tools may be subject to further legislation or regulation, time consuming to develop or costly to obtain, or less effective than our
current use of cookies.
For information on the regulation of cookies in the EU, see the section titled “Part I, Item 1—Business—“Privacy Regulation in Europe.”
If Taboola’s ability to personalize its advertisements and content to users is restricted or prohibited due to various privacy laws or regulations or industry changes, we could
lose digital properties and Advertisers, which could cause our financial condition, results of operations, and revenues to decline.
The efficacy of our platform for both Advertisers and digital properties relies, in part, on our ability to personalize the recommendations that we serve to Internet users. If we are unable to
personalize due to changes in various privacy laws or regulations, the preferences of our publisher clients, or for some other reason beyond our control, the efficacy of our platform may be negatively affected causing our business to suffer, which,
in turn, could have an adverse impact on our financial condition, results of operations and revenues.
Our use of AI, and the integration of AI with our products and services, may not be successful, including for predicting what ads and content would be of most interest to our
users and for improving on our ability to further predict or optimize user engagement or conversion rates for our Advertiser, and may present business, compliance and reputational challenges, which could lead to a decline in our performance, a loss
of digital properties and Advertisers, operational or reputational damage, legal and regulatory risk, and additional costs, any of which could cause our results of operations and revenues to decline.
We utilize AI in connection with our business, including in our platform. The effective delivery of our solution depends on the ability of Taboola’s AI powered platform to predict what ads and
content would be of most interest to users so that our Advertisers can achieve desirable returns on their advertising spend. We need to continuously deliver satisfactory results for our Advertisers and digital properties in terms of predicting user
engagement and conversion rates in order to maintain and increase revenue, which in turn depends in part on the optimal functioning of Taboola’s AI powered platform. In addition, as we have increased the number of Advertisers and digital properties
that use our offerings on a global basis, we have experienced significant growth in the amount and complexity of data processed by Taboola’s AI and the number of ad and content impressions we deliver. Beyond the use of AI in our recommendation
engine, in 2023, we launched a new tool for Advertisers to create personalized ads using generative AI. We also may incorporate AI in our business and operations in new and more significant ways over time.
There are significant risks involved in utilizing AI and no assurance can be provided that our use of AI will produce the intended results. For example, AI algorithms may be flawed, insufficient,
of poor quality, reflect unwanted forms of bias, or contain other errors or inadequacies, any of which may not be easily detectable; AI has been known to produce false or “hallucinatory” inferences or outputs; AI can present ethical issues and may
subject us to new or heightened legal, regulatory, ethical or other challenges; and inappropriate or controversial data practices by developers and end-users, or other factors adversely affecting public opinion of AI, could impair the acceptance of
AI solutions, including those incorporated in our products and services.
In particular, errors and defects in Taboola’s AI powered platform may have a significant adverse impact on our business. As the amount of data and number of variables processed by Taboola’s AI
powered platform increase, the risk of errors in the type of data collected, stored, generated or accessed also increases. In addition, the calculations that the algorithms must compute become increasingly complex and the likelihood of any defects
or errors increases. If we were to experience significant errors or defects in Taboola’s AI powered platform, our solution could be impaired or stop working altogether, which could prevent us from generating any revenue until the errors or defects
were detected and corrected. Other negative consequences from significant errors or defects in Taboola’s AI powered platform could include:
| • |
a loss of Advertisers and digital properties;
|
| • |
fewer user visits to our digital properties;
|
| • |
lower click-through rates;
|
| • |
lower conversion rates;
|
| • |
lower profitability per impression, up to and including negative margins;
|
| • |
lower return on advertising spend for Advertisers;
|
| • |
lower price for the advertising inventory we are able to offer to digital properties;
|
| • |
delivery of advertisements that are less relevant or irrelevant to users;
|
| • |
liability for damages or regulatory inquiries or lawsuits; and
|
| • |
harm to our reputation.
|
Furthermore, the ability of Taboola’s AI powered platform to accurately predict engagement by a user depends in part on our ability to continuously innovate and improve the algorithms underlying
Taboola’s AI powered platform in order to deliver positive results for our Advertisers and digital properties that can be clearly attributed to the services we provide. The failure to do so could result in delivering poor performance for our
Advertisers and a reduced ability to secure advertising inventory. If failures in Taboola’s AI powered platform or our inability to innovate and improve the algorithms underlying Taboola’s AI powered platform result in Advertisers and digital
properties ceasing to partner with us, we cannot guarantee that we will be able to replace, in a timely or effective manner, departing Advertisers with new Advertisers that generate comparable revenue or departing digital properties with new
digital properties. As a result, the failure by Taboola’s AI powered platform to accurately predict user engagement or conversion rates and to continue to do so over time could result in significant costs to us and our results of operation and
financial condition could be adversely affected.
In addition, the use of generative AI, a relatively new and emerging technology in the early stages of commercial use, exposes us to additional risks. For example, our generative AI-based tool for
ad creation, while made available through the Taboola platform, uses software tools provided by third parties and, while we are not aware of any infringement, we do not independently verify whether the content generated using such tools infringes
third-party intellectual property or other rights. Further, any content created using generative AI tools may not be subject to copyright protection, which may adversely affect Advertisers’ intellectual property rights in, or ability to
commercialize or use, any such content. If we or our Advertisers do not have sufficient rights to use the data or other material or content on which the AI tools we use or offer rely, or the output of such AI tools, we or our Advertisers also may
incur liability through the violation of applicable laws and regulations, third-party intellectual property, privacy or other rights, or contracts to which we are party. Any such liability incurred by Advertisers in connection with the use of our
generative AI-based tools may also lead to harm to our reputation and a decrease in the use of such tools or our platform by Advertisers.
Regulation of AI is rapidly evolving as legislators and regulators are increasingly focused on these powerful technologies. The technologies underlying AI and its uses are subject to a variety of
laws and regulations, including intellectual property, data privacy and cybersecurity, consumer protection, competition, and equal opportunity laws, and are expected to be subject to increased regulation and new laws or new applications of existing
laws and regulations. AI is also the subject of ongoing review by various U.S. and foreign governmental and regulatory agencies, and certain jurisdictions are applying, or are considering applying, their platform moderation, data privacy and
cybersecurity laws and regulations to AI or are considering general legal frameworks for AI. We may not be able to anticipate how to respond to these rapidly evolving frameworks, and we may need to expend resources to adjust our operations or
offerings in certain jurisdictions if the legal frameworks are inconsistent across jurisdictions. Further, because AI itself is highly complex and rapidly developing, it is not possible to predict all of the legal, operational or technological
risks that may arise relating to the use of AI.
Our business depends on continued engagement by users who interact with our platform on various digital properties. If users begin to ignore
our platform or direct their attention to other elements on the digital property, our performance could decline and we could lose digital properties and Advertisers, which could cause our results of
operations and revenues to decline.
Our ability to sustain continued engagement by users who interact with our platform on various digital properties depends on our ability to continue to provide
attractive content to users. If users begin to ignore our platform or direct their attention to other elements on the digital property, our performance could decline and digital property and Advertiser
satisfaction with our platform may decrease. Technological and other developments may also cause changes in consumer behavior that could affect the attractiveness of our content and ads to users.
While we have adopted a number of strategies and initiatives to address these challenges, there can be no guarantee that our efforts will be successful. If we are
unable to demonstrate the continuing value of our platform to Advertisers and digital properties, our results may suffer. A decrease in advertising expenditures by our Advertisers could lead to a reduction in our ability to obtain high-quality content from digital properties, which in turn could have an adverse effect on our results of operations and revenues.
We have historically relied, and expect to continue to rely, on a small number of partners and their respective affiliates for a significant percentage of
our revenue. The loss of all or a significant part of their business or an adverse change in the terms of our agreements could significantly harm our reputation, business, financial condition and results of operations.
In 2023, our largest digital property, Microsoft and affiliates, accounted for approximately 10% of our gross revenues generated from Advertisers on digital properties, and our top five digital properties accounted for approximately 23% of our gross revenues. We have long-term contracts with our large digital properties, which, in general, contain minimum guarantee requirements. The typical contract length with our large digital properties is over two years (without
any right by these properties to terminate earlier than that absent cause).
The loss of all or a significant part of our business with our largest partners or unfavorable changes in the terms of our agreements with these partners could significantly
harm our reputation, business, financial condition and results of operations.
We do not have long-term commitments from our Advertisers, and we may not be able to retain Advertisers or attract new Advertisers that provide us with revenue that is comparable to the revenue generated by any Advertisers
we may lose.
Most of our Advertisers do business with us by placing insertion orders for particular advertising campaigns. If we
perform well on a particular campaign, then the Advertiser may place new insertion orders with us for additional advertising campaigns. We do not always get written commitment from an Advertiser beyond the campaign-specific insertion order and, even then, each particular insertion order may not be completed since Advertisers can typically terminate a campaign at any time on twenty-four hours’ notice. As a result, our success is dependent upon our ability to outperform our competitors and win repeat business from existing Advertisers, while continually expanding the number of Advertisers for whom we provide services. In addition, it is relatively easy for Advertisers to seek an alternative provider for their campaigns because there are no significant switching costs. In addition, advertising agencies, with whom we do business, often have relationships with many different providers, each of
whom may be running portions of the same campaign. Because we generally do not have long-term contracts, it may be difficult for us to accurately predict future revenue streams. We cannot provide assurance that our current Advertisers will continue to use our solutions, or that we will be able to replace departing Advertisers with new Advertisers that
provide us with comparable revenue.
We may not be able to retain digital properties or attract new digital properties that provide us with digital space that is sufficient for our volume of
sponsored content or comparable to the digital space provided by any digital properties we may lose.
We do business with our partners by allowing them to share in the revenues we receive from Advertisers from campaigns
that are placed on their digital properties. If the content we place on the digital property is successful, and the partner is satisfied with our performance and ability to generate revenue, the digital property partner may continue to want us to
place content on their website. Alternatively, if we cannot maintain the quality of the content, digital property satisfaction with our platform may decrease. As our Advertiser content may appear on
multiple digital properties, any decrease in quality may rapidly affect many digital properties in a short period of time. Our commitments from digital properties are for various periods of time, but our success is dependent upon our ability to
successfully execute campaigns using available digital space and maintaining partner satisfaction, while continually expanding the number of digital properties from whom we purchase digital space as needed to meet content volume. In addition, leading
up to the expiration of our agreements, it is easy for digital properties to seek an alternative supplier of content for their digital space because there are no fees tied to switching providers. We also face a risk that digital property contract renewals decrease our margins as digital properties may seek to negotiate a higher revenue share. Thus, we cannot provide assurance that our current partners will
continue to want us to place content on their digital properties, or that we will be able to replace departing digital properties with new digital properties that provide us with sufficient or comparable digital space. In addition, certain trends
in the industry designed to achieve a different user experience may significantly impact our business. For example, a partner may redesign its digital property causing us to have less real estate for our content or placing us in less profitable
locations of the website.
If our access to quality digital properties or content from Advertisers is diminished or if we fail
to acquire new content, our revenue could decline and our growth prospects could be impeded.
We must maintain a consistent supply of attractive content and quality digital properties on which we place content. If our access to attractive content
diminishes, our ability to pay digital properties will diminish, and if access to quality digital properties diminishes then Advertisers may not want to work with us. Thus, our success depends both on
our ability to secure quality content and digital real estate.
The amount, quality and cost of supply available to us can change over time. Our digital properties’ contracts are for various periods. As a result, we cannot
provide any assurance that we will have ongoing access to a consistent supply of quality digital real estate. Moreover, the number of competitors in our industry is substantial and continues to increase, which could negatively affect the terms of
doing business with our digital property partners and ultimately our gross margin. If we are unable to compete favorably for digital properties, we may not be able to place content at competitive rates or find alternative sources of supply with
comparable traffic patterns and consumer demographics in a timely manner. Similarly, if we are unable to maintain a consistent supply of quality content from Advertisers for any reason, our business,
digital property partners retention and loyalty, financial condition and results of operations would be harmed.
If we are successful in attracting more advertising inventory from digital properties than we can satisfy with demand from Advertisers, our relationship with certain digital properties, our revenues and our business could be adversely impacted.
Our business model depends on our ability to coordinate the supply of advertising inventory from our digital property partners with demand for that inventory from
Advertisers. Any material failure to effectively maintain a sufficient number of Advertisers relative to the inventory we have available could cause digital
properties not to utilize our platform or impair Taboola’s AI’s ability to accurately predict user engagement. As a result, our relationships with certain digital properties, our revenues and our business could be adversely impacted.
If Taboola fails to maintain the quality of content or to prevent low quality, offensive or other non-compliant content from appearing on the
digital properties, we could lose digital properties and Advertisers, which could cause our results of operations and revenues to decline.
Advertiser and digital property satisfaction with our solution depends on our ability to place high quality Advertiser
content with content from digital properties that is well-suited to the Advertiser’s product or service. If we are unable to keep our Advertisers’ content from
being placed with low quality, offensive or other non-compliant editorial content, or if we are unable to keep low quality, offensive or other non-compliant ads from appearing in our network of digital
properties, our reputation and business may suffer. As we grow our business to serve a larger number of Advertisers and digital properties, it could become more challenging to prevent low quality,
offensive or other non-compliant content from being shown. In addition, the categories of content that our digital properties accept may change over time and as these categories are removed from our inventory, we could suffer a decrease in
cost-per-click and overall revenue. If we are unable to maintain the quality of our Advertiser and digital properties, our reputation and business may suffer and we may not be able to retain or secure
additional Advertiser or digital property relationships.
Historically, the majority of our agreements with digital properties have typically required them to provide us with exclusivity for the term of the
agreement. To the extent that such exclusivity is reduced or eliminated for any reason, including due to changes in market practice or changes in or in response to laws, rules or regulations, digital properties could elect to implement competitive
platforms or services that could be detrimental to our performance, thereby reducing our revenues and harming our business.
Although the majority of our agreements with digital properties have historically required digital properties to provide us with exclusivity for the term of the
agreement, there is no guarantee that we will be able to continue to obtain such exclusive arrangements or to renew existing arrangements on similar terms in the future. To the extent that such exclusivity is reduced or eliminated for any reason,
including due to changes in market practice or changes in or in response to laws, rules or regulations, our partners could elect to implement other platforms or services on their digital properties, develop their own, or to seek out other third parties with which to do business, which could be detrimental to our performance, thereby reducing our revenues and having an adverse effect on our business.
If we fail to detect fraudulent clicks, including non-human traffic, serve advertisements on undesirable websites, or serve content that is inappropriate to
certain of our digital properties, our reputation will suffer, which would harm our brand and reputation and negatively impact our business, financial condition and results of operations.
Our business depends in part on providing our Advertisers and digital properties with a service that they trust, and we
have contractual commitments to take reasonable measures to prevent click fraud or distributing content on undesirable digital properties. We use proprietary technology to detect click fraud and block inventory that we know or suspect to be
fraudulent. Preventing and combating fraud requires constant vigilance, and we may not always be successful in our efforts to do so. In addition, as we continue to improve our click fraud detection mechanisms, we may find that a portion of our
traffic is the result of click fraud, and eliminating this fraudulent traffic would reduce our revenues. We also use proprietary technology to prevent our Advertisers’ content from appearing on
undesirable digital properties, but we may not be successful in doing so, which would harm our relationship with Advertisers. Any of these things would harm our brand and reputation and negatively impact
our business, financial condition and results of operations.
Our platform and business are subject to a wide variety of risks from individuals from inside and outside our company. Our policies and procedures may be
inadequate to protect us from material losses or other harm caused by these bad actors, which could negatively impact our business, results of operations and reputation.
Our platform and business are subject to a wide variety of risks from individuals both inside and outside our company. We have established policies and procedures
to manage our exposure to risk, including risks arising from the actions of our employees. These policies may not be adequate or effective in managing our future risk exposure or protecting us against unidentified or unanticipated risks. Although
we regularly update our policies and procedures, including with respect to sanctions, bribery, money laundering and insider trading, we may fail to predict future risks due to rapid changes in the market and regulatory conditions and in new
markets we enter. Although we have established internal controls to ensure our risk management policies and procedures are adhered to by our employees as we conduct our business, our internal controls may not effectively prevent or detect any
non-compliance of our policies and procedures. In particular, these measures may not adequately address or prevent all illegal, improper, or otherwise inappropriate activity from occurring and such conduct could expose us to liability, including
through litigation, or adversely affect our brand or reputation. Further, any negative publicity related to the foregoing, could adversely affect public perception of our industry as a whole, which could negatively affect demand for platforms
like ours, and potentially lead to increased regulatory or other legal exposure. Any of the foregoing risks could negatively impact our business, results of operations and reputation.
Our business depends on strong brands and well-known digital properties, and failing to maintain and enhance our brands and well-known digital
properties would hurt our ability to expand our number of Advertisers and digital properties.
Building and maintaining market awareness, brand recognition and goodwill in a cost-effective manner is important to our overall success in achieving widespread
acceptance of our existing and future solutions. In particular, our business depends on access to strong brands and well-known digital properties, such as prominent media outlets, and failing to maintain and enhance our relationships with such
brands and digital properties would hurt our ability to strengthen our own brand and to expand our current number of Advertisers and digital properties. Our efforts in developing our brand may be
hindered by the marketing efforts of our competitors, to the degree our competitors are able to decrease the number of high-profile digital properties we are able to work with. Alternatively, if a significant number of well-known digital
properties ceased to do business with us due to changing market conditions or for other reasons, our own brand image and reputation could suffer and our business and results of operations could be adversely affected.
The widespread use of technologies that can block or limit the display of our ads could adversely affect our financial results and business.
Technologies have been developed, and will likely continue to be developed, that can block the display of our ads or content or block our ad measurement tools, particularly for
advertising displayed on personal computers. We generate substantially all of our revenue from advertising, including revenue resulting from the display of ads via our platform on personal computers. Revenue generated from the display of ads on
personal computers has been impacted by these technologies from time to time. As a result, these technologies may have an adverse effect on our financial results and, if such technologies continue to proliferate, in particular with respect to
mobile platforms, our future financial results may be harmed.
Our business depends on continued and unimpeded access to the Internet and digital properties by us and our users. Internet access providers,
device manufacturers, browser developers or owners of digital properties may be able to restrict, block, degrade, or charge for access to certain of our products and services, which could lead to significant degradation of our service or
additional expenses and the loss of users and Advertisers.
Our products and services depend on the ability of consumers to access the Internet. Currently, this access is provided by companies that have significant market
power in the broadband and internet access marketplace, including incumbent telephone companies, cable companies, mobile communications companies, and government-owned service providers. Some of these providers may take measures that could
degrade, disrupt, or increase the cost of user access by restricting or prohibiting the use of their infrastructure to support our platform, by charging increased fees to us or our users, or by providing our competitors preferential access. Some
jurisdictions have adopted regulations prohibiting certain forms of discrimination by internet access providers; however, substantial uncertainty exists in the United States and elsewhere regarding such protections. For example, in 2018 the
United States Federal Communications Commission repealed net neutrality rules, which could permit internet access providers to restrict, block, degrade, or charge for access. In addition, our platform may be subject to government-initiated
restrictions or blockages. These could result in a decrease of users interacting with our platform, and could impair our ability to attract new Advertisers and digital properties.
In addition, we rely on data signals from user activity on websites that we do not control in order to deliver relevant and effective ads on behalf of our Advertisers. Our advertising revenue is dependent on targeting and measurement tools that incorporate these signals, and any changes in our ability to use such signals will adversely affect our business. For example,
legislative and regulatory changes, such as the GDPR and CCPA, may impact our ability to use such signals in our ad products. In addition, mobile operating system and browser providers, such as Apple and Google, have announced product changes as
well as future plans to limit the ability of application developers to use these signals to target and measure advertising on their platforms. These developments may limit our ability to target and measure the effectiveness of ads on our
platform, and any additional loss of such signals in the future will adversely affect our targeting and measurement capabilities and negatively impact our advertising revenue.
Large and established internet and technology companies may be able to independently transform the marketplace for data and native advertising and
significantly impair our ability to operate.
Large and established internet and technology companies such as Amazon, Apple, Facebook and Google may have the power to significantly change the very nature of the internet
display advertising marketplace, and these changes could materially disadvantage us. For example, Amazon, Apple, Facebook and Google have substantial resources and have a significant share of widely adopted industry platforms such as web browsers,
mobile operating systems and advertising exchanges and networks. In addition, these or other companies may bundle other services alongside the services that compete with our solutions, thus potentially creating a more competitive platform than
ours. Therefore, these companies could leverage their position to make changes to their web browsers, mobile operating systems, platforms, exchanges, networks or other products or services that could be significantly harmful to our business and
results of operations.
From time to time certain of our digital properties, typically small and medium digital properties, have, and in the future may continue to, violate the
terms of their agreements with us by depriving us of their contractually required advertising inventory.
If a significant number of these digital properties violate their agreements, it could be impractical for us to pursue remedies against all of them and as a
result we may lack sufficient or timely advertising inventory for our Advertiser clients. As a result, Advertisers may be less likely to contract with us in the
future. The combined effect of this disruption to our anticipated advertising inventory, and related supply and demand dynamics, could have an adverse effect on our revenue, business operations and reputation.
We have already and may in the future invest in or
acquire other businesses, which could require significant management attention, disrupt our business, dilute shareholder value and adversely affect our financial condition and results of operations.
As part of our business strategy, we have made and may make future investments in or acquisitions of complementary companies, products or technologies. These
activities, including the Connexity acquisition in September 2021, involve significant risks to our business. We may not be able to find other suitable
acquisition candidates, and we may not be able to complete such acquisitions on favorable terms, if at all. If we do complete acquisitions, they may not ultimately strengthen our competitive position. Any acquisitions we complete could be viewed
negatively by our partners and clients, which could have an adverse impact on our business. In addition, if we are unsuccessful at integrating employees or technologies acquired, our financial condition and results of operations, including
revenue growth, could be adversely affected. Any acquisition and subsequent integration will require significant time and resources. We may not be able to successfully evaluate and use the acquired technology or employees, or otherwise manage the
acquisition and integration processes successfully. We will be required to pay cash, incur debt and/or issue equity securities to pay for any such acquisition, each of which could adversely affect our financial condition. Our use of cash to pay
for acquisitions would limit other potential uses of our cash, including investments in our sales and marketing and product development organizations, and in infrastructure to support scalability. The issuance or sale of equity or convertible
debt securities to finance any such acquisitions would result in dilution to our shareholders. If we incur debt, it would result in increased fixed obligations and could also impose covenants or other restrictions that could impede our ability to
manage our operations.
If we do not effectively grow and train our sales team and account managers, we may be unable to add new digital properties and Advertisers or increase sales to our existing digital properties and Advertisers, and our business would be adversely affected.
We continue to be substantially dependent on our sales team and account managers to obtain new digital properties and Advertisers
and to drive sales from our existing digital properties and Advertisers. We believe that there is significant competition for sales personnel with the skills and technical knowledge that we require. Our
ability to achieve significant revenue growth will depend, in large part, on our success in recruiting, training, integrating and retaining sufficient numbers of sales personnel to support our growth. New hires require significant training and it
may take significant time before they achieve full productivity. Our recent hires and planned hires may not become productive as quickly as we expect, and we may be unable to hire or retain sufficient numbers of qualified individuals in the
markets where we do business or plan to do business. In addition, if we continue to grow rapidly, a large percentage of our sales team will be new to the company and our solutions. If we are unable to hire and train sufficient numbers of
effective sales personnel, or the sales personnel are not successful in obtaining new digital properties and Advertisers or increasing sales to our existing digital property and Advertiser base, our business would be adversely affected. Finally, managing our sales team and account managers, particularly in light of our growth, and enforcing compliance with our sales policies is a challenge for
us.
If we do not effectively maintain and grow our research and development team with top talent, including employees who are trained in
artificial intelligence, machine learning and advanced algorithms, we may be unable to continue to improve on our artificial intelligence, our performance could decline and we could lose digital properties and Advertisers, which could cause our results of operations and revenues to decline.
Our future success depends on our ability to continue to attract, retain and motivate highly skilled employees, software engineers and other employees with the
technical skills in artificial intelligence, machine learning and advanced algorithms that will enable us to deliver effective advertising and content solutions. Competition for highly skilled employees in our industry is intense, particularly
in the fields of artificial intelligence and data science. We expect certain of our key competitors, who generally are larger than us and have access to more substantial
resources, to pursue top talent even more aggressively.
We may be unable to attract or retain such highly skilled personnel who are critical to our success, which could hinder our ability to keep pace with innovation
and technological change in our industry or result in harm to our key Advertiser and digital property relationships, loss of key information, expertise or proprietary knowledge and unanticipated recruitment and training costs. The loss of the services of such key employees could make it more difficult to successfully operate our business and pursue our business goals.
Our growth depends, in part, on the success of our strategic relationships with third parties, including ready access to hardware in key
locations to facilitate the delivery of our platform and reliable management of Internet traffic. Supply disruptions can impede our operations, ability to grow and financial performance and also result in significant cost increases.
We anticipate that we will continue to depend on various third-party relationships in order to grow our business. We continue to pursue additional relationships with third
parties, such as technology and content providers, content delivery networks, data partnerships, co-location facilities and other strategic partners. Identifying, negotiating and documenting relationships with third parties requires significant
time and resources, as does integrating third-party data and services. Our agreements with providers of technology, computer hardware, co-location facilities, and content are typically non-exclusive, do not prohibit them from working with our
competitors or from offering competing services and do not typically have minimum purchase commitments. Our competitors may be effective in providing incentives to third parties to favor their products or services over ours or to otherwise prevent
or reduce purchases of our solutions. In addition, these third parties may go out of business, no longer offer their services to us or not perform as expected under our agreements with them, and we may have disagreements or disputes with such third
parties, which could negatively affect our brand and reputation.
In particular, our continued growth depends on our ability to source computer hardware, including servers built to our specifications, and the ability to locate those servers
and related hardware in co-location facilities in the most desirable locations to facilitate the timely delivery of our services. Disruptions in the services provided at co-location facilities that we rely upon can degrade the level of services
that we can provide, which could harm our business. We also rely on our integration with many third-party technology providers to execute our business on a daily basis. We rely on a third-party domain name service, or DNS, to direct traffic to our
closest data center for efficient processing. If our DNS provider experiences disruptions or performance problems, this could result in inefficient balancing of traffic across our servers as well as impairing or preventing web browser connectivity
to our site, which could harm our business.
Supply disruptions could materially impede our growth and our ability to maintain our existing platform. Disruptions in supply can be caused by many factors, including decreases in manufacturing
output and labor shortages; the availability of one or more components including semiconductors which are currently in short supply; the impacts of pent up demand; transportation and delivery issues; geopolitical issues; and other circumstances.
Such disruptions can result in the delay or inability to obtain necessary hardware, or significant cost increases, any of which could have a material adverse effect on our existing business, our ability to grow and our financial performance.
Our future success depends on the continuing efforts of our key employees, including our founder, and on our ability to hire, train, motivate and retain
additional employees, including key employees.
Our future success depends heavily upon the continuing services of our key employees, including our founder and CEO, Adam Singolda, and on our ability to attract and retain
members of our management team and other highly skilled employees, including software engineers, analytics and operations employees and sales professionals. The market for talent in our key areas of operations, including Bangkok, California, New
York, Sao Paulo, Tel Aviv, and London, is intensely competitive. Our competitors may provide more generous benefits, more diverse opportunities and better chances for career advancement than we do. Some of these advantages may be more appealing to
high-quality candidates than those we have to offer. Any of our employees may terminate his or her employment with us at any time.
New employees often require significant training and, in many cases, take significant time before they achieve full productivity. As a result, we may incur significant costs to
attract and retain employees, including significant expenditures related to salaries and benefits and compensation expenses related to equity awards, and we may lose new employees to our competitors or other companies before we realize the benefit
of our investment in recruiting and training them. Moreover, new employees may not be or become as productive as we expect, as we may face challenges in adequately or appropriately integrating them into our workforce and culture. In addition, as we
move into new geographies, we will need to attract and recruit skilled employees in those areas.
Even if we are successful in hiring qualified new employees, we may be subject to allegations that we have improperly solicited such employees while they remained employed by
our competitors, that such employees have improperly solicited other colleagues of theirs employed by the same competitors or that such employees have divulged proprietary or other confidential information to us in violation of their agreements
with such competitors. If we are unable to attract, integrate and retain suitably qualified individuals, our business, financial position and results of operations would be harmed.
Our corporate culture has contributed to our success. If we cannot maintain a strong corporate culture, we could lose the innovation, creativity and
teamwork fostered by our culture, and our business could be harmed.
We believe our corporate culture has been a critical component of our success as we believe it fosters innovation, teamwork, passion for partners and clients and focus on
execution, while facilitating knowledge sharing across our organization. As we grow and change, we may find it difficult to preserve our corporate culture, which could reduce our ability to innovate and operate effectively. In turn, the failure to
preserve our culture could negatively affect our ability to attract, recruit, integrate and retain employees, continue to perform at current levels and effectively execute our business strategy.
Many Advertisers typically spend less in the first quarter and more in the fourth quarter of each
calendar year. Our historical revenue growth has mitigated the impact of these seasonal fluctuations in advertising activity. If our growth declines or these typical advertising patterns become more pronounced, seasonality could have a material
impact on our revenue, cash flows and operating results.
Our revenue, cash flow and other key operating and performance metrics may vary from quarter to quarter due to the seasonal nature of our Advertiser clients’ spending on advertising campaigns. For example, many Advertisers tend to devote more of their advertising budgets to the fourth calendar quarter to
coincide with consumer holiday spending and correspondingly to spend less in the first quarter. Moreover, advertising inventory in the fourth quarter may be more expensive due to increased demand for it. Our historical revenue growth has masked
the impact of seasonality in the past, but if our growth rate declines or seasonal spending becomes more pronounced, seasonality could have a more significant impact on our revenue, cash flow and results of operations from period to period.
We usually incur the cost of an Advertiser’s campaign before we bill for services. Such Advertisers may have or develop high-risk credit profiles, which may result in credit risk.
We usually incur the cost of an Advertiser’s campaign before we bill for services. A portion of our Advertiser-side business is sourced through advertising agencies, and we contract with these agencies as agent for a disclosed principal, which is the Advertiser. Typically,
the advertising agency pays for our services once it has received payment from the Advertiser for our services. Our agreements with these agencies typically provide that if the Advertiser does not pay the agency, the agency is not liable to us, and we must seek payment solely from the advertiser.
In addition, contracting with Advertisers who have or develop high-risk credit profiles, subjects us to credit risk.
This credit risk may vary depending on the nature of the Advertiser’s business and the Advertiser’s monetization of the traffic generated. Any inability to
collect costs we have advanced or other amounts due to us, including write-offs of accounts receivable, could have a materially negative effect on our results of operations.
We often pay our digital properties their share of the revenue generated by an Advertiser’s campaigns whether or not we
have received payment from the Advertisers and even if we never receive payment from such Advertiser. In addition, we agree with digital properties on a fixed
cost for the digital space but a large portion of our revenue from Advertisers is tied to the performance of the campaign. As a result, our results of operations and financial condition could be
adversely impacted if we do not receive timely payment from our Advertisers or if our campaigns do not perform as expected.
Risks Related to Laws and Regulations
We are a multinational organization faced with complex and changing laws and regulations regarding privacy, data protection, content, competition, consumer protection, and other
matters. Many of these laws and regulations are subject to change and uncertain interpretation, and could result in claims, changes to our business practices, monetary penalties, increased cost of operations, or declines in user engagement, or
otherwise harm our business.
We are subject to a variety of laws and regulations in the United States and other countries that involve matters central to our business, including privacy, data protection, content,
competition, consumer protection, and other matters. The expansion of our activities in certain jurisdictions, or other actions that we may take may subject us to additional laws, regulations, or other government scrutiny. In addition, foreign
privacy, data protection, content, competition, and other laws and regulations can impose different obligations or be more restrictive than those in the United States. For additional discussion of privacy and data protection laws and regulations
applicable to our business, see “Risk Factors—Risks Related to Laws and
Regulations—Legislation and regulation of online businesses, including privacy and data protection regimes, could create unexpected costs, subject us to enforcement actions for compliance failures, or cause us to change our technology platform
or business model, which could have a material adverse effect on our business.”
Laws and regulations of the countries and their legal subdivisions in which we operate or conduct business or in which our employees reside, which in some cases can be enforced by private parties
in addition to government entities, are constantly evolving and can be subject to significant change. As a result, the application, interpretation, and enforcement of these laws and regulations are often uncertain, particularly in the new and
rapidly evolving industry in which we operate, and may be interpreted and applied inconsistently from country to country and inconsistently with our current policies and practices. For example, regulatory or legislative actions affecting the manner
in which we display content to our users could adversely affect user growth and engagement. Such actions could affect the manner in which we provide access to our platform or adversely affect our financial results.
These laws and regulations, as well as any associated claims, inquiries, or investigations or any other government actions, have in the past led to, and may in the future lead to, unfavorable
outcomes including increased compliance costs, delays or impediments in the development of new products, negative publicity and reputational harm, increased operating costs, diversion of management time and attention, and remedies that harm our
business, including fines or demands or orders that we modify or cease existing business practices.
Legislation and regulation of online businesses, including privacy and data protection regimes, could create unexpected costs, subject us to enforcement actions for compliance
failures, or cause us to change our technology platform or business model, which could have a material adverse effect on our business.
Government regulation could increase the costs of doing business online. U.S. and many international governments have enacted, or are considering enacting, legislation and regulation related to
online advertising to which we are or may become subject, and we expect to see an increase in legislation and regulation related to digital advertising, the collection and use of Internet user data and unique device identifiers, such as IP address
or unique mobile device identifiers, and other privacy and data protection legislation and regulation. The regulatory environment related to privacy and data protection is increasingly rigorous, with new and constantly changing requirements
applicable to our business, and enforcement practices are likely to remain uncertain for the foreseeable future. Such legislation and regulation could affect the costs of doing business online, and could reduce the demand for our solutions or
otherwise harm our business, financial condition, and results of operations. These laws and regulations may be interpreted and applied differently over time and from jurisdiction to jurisdiction, and it is possible that they will be interpreted and
applied in ways that may have a material adverse effect on our results of operations, financial condition and cash flows. For example, a wide variety of provincial, state, national, and international laws and regulations apply to the collection,
use, retention, protection, disclosure, transfer and other processing of personal data. While we generally have not collected data from Internet users that is traditionally considered to be personally identifiable data, such as name, email address,
address, phone numbers, social security numbers, credit card numbers, financial, or health data, we typically do collect and store IP addresses, cookie IDs, and other device identifiers that are or may be considered personal data in some
jurisdictions or otherwise may be the subject of legislation or regulation. Legislation or regulation that reduces the data we can collect may cause us to not be able to track advertising conversions as efficiently or target campaigns as
effectively, which may negatively impact our revenue.
Evolving and changing definitions of personal data, within the EEA, the UK, Asia, the United States, and elsewhere, especially relating to classification of IP addresses, machine or device
identifiers, and other information, have in the past and could in the future, cause us to change our business practices, expend significant costs to modify our data processing practices or policies, preoccupy management, divert resources from other
initiatives and projects, or limit or inhibit our ability to operate or expand our business. Evolving data protection and privacy-related laws and regulations could embolden regulatory and public scrutiny, increase levels of enforcement, and pose
risk of sanctions for noncompliance. While we currently take steps to avoid collecting personal data that would enable the direct identification of Internet users, we may inadvertently receive this information from Advertisers or advertising
agencies or through the process of delivering our service. Additionally, while we take measures to protect the security of information that we collect, use, disclose and otherwise process in the operation of our business, and to offer certain
privacy protections with respect to such information, such measures may not always be effective. Our advertising clients or digital property partners have imposed, or may in the future impose, new restrictions relating to the quickly evolving
privacy and data protection laws and regulations with which we must adapt and comply. Our failure to comply with applicable laws and regulations, or to protect personal data, could result in enforcement or litigation action against us, including
fines, sanctions, penalties, judgments, imprisonment of our officers and public censure, claims for damages by consumers and other affected individuals, obligations to notify regulators and affected individuals, damage to our reputation and loss of
goodwill, any of which could have a material adverse impact on our business, financial condition and results of operations. Even the perception of privacy concerns, whether or not valid, could harm our reputation and inhibit adoption of our
solutions by current and future clients and partners.
For more information on the privacy and data protection laws and regulations to which we are subject, see the sections titled “Part I, Item 1—Business—“Privacy Regulation in the U.S.”, “Part I,
Item 1—Business—“Privacy Regulation in Europe” and “Part I, Item 1—Business—“Privacy Regulation in the Asia-Pacific Region.”
Potential “Do Not Track” standards or government regulation could negatively impact our business by limiting our access to the user data that informs the advertising campaigns
we run, and as a result could degrade our performance for our digital properties and Advertisers.
As the use of cookies has received ongoing media attention in recent years, some government regulators and privacy advocates have suggested creating a “Do Not Track” standard that would allow
Internet users to express a preference, independent of cookie settings in their web browser, not to have their website browsing recorded. All the major Internet browsers have implemented some version of a “Do Not Track” setting. However, there is
limited guidance, consensus and industry standards regarding the definition of “tracking,” what message is conveyed by a “Do Not Track” setting and how to respond to a “Do Not Track” preference. We could face competing policy standards, or
standards that put our business model at a competitive disadvantage to other companies that collect data from Internet users, standards that reduce the effectiveness of our solutions, or standards that require us to make costly changes to our
solutions. For example, the FTC has stated that it will pursue a legislative solution if the industry cannot agree upon a standard. “Do Not Track” has seen renewed emphasis from proponents of the CCPA, which, in certain circumstances, requires
browser-based or similar “do not sell” signals. If a standard is imposed by international federal or state legislation, or agreed upon by standard setting groups, that requires us to recognize a “Do Not Track” signal and prohibits us from using
data as we currently do, then that could hinder growth of advertising and content production on the web generally, and limit the quality and amount of data we are able to store and use, which would cause us to change our business practices and
adversely affect our business.
On May 16, 2023, the EU Interactive Advertising Bureau (IAB), a digital marketing trade association, released an updated version of the IAB Transparency & Consent Framework, or TCF, to
reflect updated regulator guidance and decisions. While Taboola is a registered vendor on the latest version of the TCF, the TCF remains under review by European courts after the IAB appealed a February 2022 decision by the Belgian data
protection authority that the TCF violates the GDPR. The TCF is currently a key tool in the EU ad tech ecosystem for passing on consent and “do not sell” signals, and in turn, facilitating compliance with the GDPR. If the TCF is found to be
unlawful under the GDPR, the ad tech industry will need to determine new mechanisms for GDPR compliance, which could affect our ability to serve targeted ads and consequently impact our revenue.
User growth and engagement depends upon effective interoperation with devices, platforms and standards set by third parties across the entire ad tech ecosystem that we do not
control.
Technology companies in the Internet browsers and operating systems spaces have announced intentions to discontinue the use of cookies, and to develop alternative methods and mechanisms for
tracking users. The most commonly used Internet browsers allow users to modify their browser settings to block first-party cookies (placed directly by the media partner or website owner that the user intends to interact with) or third-party
cookies, and some browsers block third-party cookies by default. For example, Apple previously released an update to its Safari browser that limits the use of third-party cookies, which reduces our ability to provide the most relevant ads to our
users and impacts monetization, and also released changes to iOS, requiring users to voluntarily choose (opt-in) to permit app developers to track them across applications and websites, that limit our ability to target and measure ads effectively.
In addition , Google has announced its intention to disable the use of third-party cookies across its Google Chrome web browser. Based on public announcements from Google, the phase out will be in effect for all users in the second half of 2024
subject to regulatory compliance. This change may force many businesses to reevaluate their marketing strategies.
Furthermore, mobile devices using Android and iOS operating systems limit the ability of cookies to track users while they are using applications other than their web browser on the device. As a
consequence, fewer of our cookies or media partners’ cookies may be set in browsers or be accessible in mobile devices, which can adversely affect our business.
As technology companies in such sectors replace cookies, it is possible that such companies may rely on proprietary algorithms or statistical methods to track users without cookies, or may utilize
log-in credentials entered by users into other web properties owned by these companies, such as their email services, to track web usage, including usage across multiple devices. Alternatively, such companies may build different and potentially
proprietary user tracking methods into their widely-used web browsers. Although we believe we are well positioned to adapt and continue to provide key data insights to our media partners without cookies, this transition could be more disruptive,
slower, or more expensive than we currently anticipate, and could materially affect the accuracy of our recommendations and ads and thus our ability to serve our Advertisers, including through our data marketplace product, adversely affecting our
business, results of operations, and financial condition.
Potential regulation or oversight over native advertising disclosure standards could negatively impact our business by affecting click through rates, which in turn affects the
profitability of our digital properties and Advertisers.
We are subject to complex and changing advertising regulations in many jurisdictions in which we operate, including regulatory and self-regulatory requirements to comply with native advertising
regulations in connection with our native advertising offering. For example, in the United States, the Federal Trade Commission requires that all online advertising meet certain principles, including the clear and conspicuous disclosure of
advertisements. If we, or our advertisers, make mistakes in implementing this varied and evolving guidance, or our commitments with respect to these principles, we could be subject to negative publicity, government investigation, government or
private litigation, or investigation by self-regulatory bodies such as the Interactive Advertising Bureau (IAB), the National Advertising Division (NAD) as well as the Advertising Standards Authority (ASA) in the UK or other accountability groups.
Any such action against us could be costly and time consuming and may require us to change our business practices, cause us to divert management’s attention and our resources and be damaging to our reputation and our business. Moreover, additional
or different disclosures may lead to a reduction in user engagement, which could have an adverse effect on our business, results of operations, and financial condition.
We are a multinational organization faced with complex and changing advertising regulation in many jurisdictions in which we operate, and we are obligated to comply with such
advertising regulations in connection with the advertising we distribute on behalf of our Advertiser clients. If we fail to comply with these advertising regulations we or our Advertisers could be subject to liability or forced to reduce or suspend
operations until we are able to comply, which could reduce our revenues.
We are subject to complex and changing advertising regulations in many jurisdictions in which we operate, and we are obligated to comply with such advertising regulations in connection with the
advertising we distribute on behalf of our Advertiser clients. For example, much of the federal oversight on digital advertising in the U.S. currently comes from the FTC, which has primarily relied upon Section 5 of the Federal Trade Commission
Act, which prohibits companies from engaging in “unfair” or “deceptive” acts or practices in or affecting commerce, including alleged violations of representations concerning privacy and data security protections and acts that allegedly violate
individuals’ privacy and data protection interests. If we or our Advertiser clients are not able to comply with these laws or regulations or if we become liable under these laws or regulations, we could be directly harmed, and we may be forced to
implement new measures to reduce our exposure to this liability. This may require us to expend substantial resources or to alter our business strategy, which would negatively affect our business, financial condition and results of operations.
From time to time we are subject to litigation, administrative inquiries and similar governmental procedures, which may be extremely costly to defend, could
result in substantial judgment or settlement costs or subject us to other remedies. Litigation and other disputes can also divert management’s attention from our operations and hurt our reputation.
From time to time we are involved in various legal proceedings or government investigations, including, but not limited to, actions relating to breach of contract, intellectual
property infringement, competition law or other issues. Claims may be expensive to defend, may divert management’s time away from our operations, and may affect the availability and premiums of our liability insurance coverage, regardless of
whether they are meritorious or ultimately lead to a judgment against us. We cannot assure you we will be able to successfully defend or resolve any current or future litigation matters, in which case those litigation matters could have a material
and adverse effect on our business, financial condition, operating results, cash flows, reputation and prospects.
We are a multinational organization faced with increasingly complex tax issues in many jurisdictions, and we could be obligated to pay additional taxes in
various jurisdictions as a result of new taxes and related laws, which may materially affect our business and results of operations.
As a multinational organization, operating in multiple jurisdictions, including Brazil, China, European Union, India,
Israel, Japan, South Korea, Taiwan, Thailand, Turkey, the United Kingdom and the United States, among others, we may be subject to taxation in several jurisdictions around the world with increasingly complex tax laws, the application of which may
be uncertain. The amount of taxes we pay in these jurisdictions could increase substantially as a result of changes in the applicable tax principles, including increased tax rates, new tax laws or revised interpretations of existing tax laws and
precedents, which could have a material adverse effect on our liquidity and results of operations. In addition, as internet commerce and globalization continue to evolve, increasing regulation by government authorities becomes more likely. Our
business could be negatively impacted by the application of existing laws and regulations or the enactment of new laws applicable to digital advertising. The cost to comply with such laws or regulations could be significant, and we may be unable
to pass along those costs to our clients in the form of increased fees, which may negatively affect our business and results of operation. We are subject to regular review and audit by Israeli, U.S. and other foreign tax authorities. Although we
believe our tax estimates are reasonable, the authorities in these jurisdictions could review our tax returns and impose additional taxes, interest and penalties, and the authorities could claim that various withholding requirements apply to us
or our subsidiaries or assert that benefits of tax treaties are not available to us or our subsidiaries, any of which could materially affect our income tax provision, net income, or cash flows in the period or periods for which such
determination and settlement is made.
Our operations may expose us to greater than anticipated tax liabilities, which could harm our financial condition and results of operations, and increase the costs our clients
would have to pay for our products.
There is heightened scrutiny by fiscal authorities in many jurisdictions on the potential taxation of digital services, including but not limited to, online advertising, search engine and
e-commerce businesses (referred to as DST or alike). The Organization for Economic Co-operation and Development (OECD) has issued guidelines, referred to as the Base Erosion and Profit Shifting project (BEPS), to its member-nations aimed at
encouraging broad-based legislative initiatives intended to prevent perceived base erosion transactions and income shifting in a tax-advantaged manner. Further, for the past several years, the OECD has had a specific focus on the taxation
implications of digital services including online advertising, search engine and e-commerce businesses, generally referred by the OECD as the “digital economy.” In the fourth quarter of 2019, the OECD released details on its proposed approach which
would, among other changes, create a new right to tax certain “digital economy” income not necessarily based on traditional nexus concepts nor on the “arm’s length principle.” As there has been a lack of consensus among the key members,
particularly the United States, several jurisdictions legislated digital tax provisions in an uncoordinated and unilateral manner that could result in greater or even double taxation that companies may not have sufficient means to remedy. For
example, a number of jurisdictions, including the U.K., France, Italy, Spain, Austria, Turkey, India and other countries have already adopted or have formally proposed legislation to affect the taxation of digital services based on differing
criteria and metrics.
The taxation by multiple jurisdictions of digital services including online advertising and e-commerce could increase our tax burdens and compliance obligations as well as our costs of doing
business internationally and our worldwide effective tax rate which may lead to adverse impact on our financial position and results of operations.
Further, the taxation by multiple jurisdictions of digital businesses could subject us to exposure to withholding, sales, value added taxes (VAT), levies, and/or other taxes, including transaction
taxes on our past and future transactions in such jurisdictions where we currently or in the future may be required to report taxable transactions. We are currently subject to and in the future may become subject to additional compliance
requirements for certain of these taxes. A successful assertion by one or more U.S. states or foreign countries or change of law requiring us to pay or collect taxes where we presently do not do so, or to pay or collect more taxes in a jurisdiction
in which we currently do pay or collect some taxes, could result in substantial liabilities, including taxes on past sales, as well as interest and penalties. Any such assertion could also create significant administrative burdens for us,
discourage potential customers from subscribing to our platform due to the incremental cost of any such sales or other related taxes, or otherwise harm our business. Changes in our exposure to withholding, sales, VAT, levies and/or other taxes
could have an adverse impact on our financial condition in the future.
In addition, in October 2021, the OECD released an outline that describes the conceptual agreement between 136 countries on fundamental reforms to international tax rules. The outline provides
for two primary “Pillars.” Pillar One is aimed to apply to the largest multinational corporations and replace DST, though the time of its introduction is still unknown. As the Pillar Two model, which provides for a global minimum corporate tax
rate of 15%, has partially taken effect in some, but not all, countries for the taxable year beginning on January 1, 2024, with some additional provisions taking effect in 2025, there is still uncertainty as to how the Pillar Two model will be
applied evenly during this transition period. While Pillar One is not expected to apply to us, Pillar Two could increase our effective tax rate and adversely affect our financial results.
Our effective tax rate may vary significantly depending on our stock price.
The tax effects of the accounting for share-based compensation may significantly impact our effective tax rate from period to period. In periods in which our stock price is
higher than the grant price of the share-based compensation vesting in that period, we will recognize excess tax benefits that will decrease our effective tax rate, while in periods in which our stock price is lower than the grant price of the
share-based compensation vesting in that period, our effective tax rate may increase. The amount and value of share-based compensation issued relative to our earnings in a particular period will also affect the magnitude of the impact of
share-based compensation on our effective tax rate. These tax effects are dependent on our stock price, which we do not control, and a decline in our stock price could significantly increase our effective tax rate and adversely affect our financial
results.
The Israeli tax benefits we currently receive require us to meet several conditions and may be terminated or reduced in the future, which would likely increase our taxes,
possibly with a retroactive effect.
Some of our operations in Israel, referred to as “Benefited Enterprise” for 2018 and 2019 and “Preferred Technological Enterprise” commencing with 2020 (in case of taxable income position) carry
certain tax benefits under the Law for the Encouragement of Capital Investments, 5719-1959, or the Investment Law. In order to be eligible for tax benefits under the Investment Law, our Benefited/Preferred Technological Enterprises must comply with
various conditions set forth in the Investment Law, as well as periodic reporting obligations. If we do not meet the requirements for maintaining these benefits or if our assumptions regarding the key elements affecting our tax rates are rejected
by the Israeli tax authorities, they may be reduced or canceled and the relevant operations would be subject to Israeli corporate tax at the standard rate, which is 23% in 2018 and thereafter.
In addition to being subject to the standard corporate tax rate, we could be required to refund any tax benefits we have already received, plus interest and penalties thereon under this program or
similar programs we have utilized in the past. Even if we continue to meet the relevant requirements, the tax benefits our current “Preferred Technological Enterprise” receive may not be continued in the future at their current levels or at all. If
these tax benefits were reduced or eliminated, the amount of taxes we pay would likely increase, as all of our Israeli operations would consequently be subject to corporate tax at the standard rate, which could adversely affect our results of
operations. Additionally, if we increase our activities outside of Israel, for example, by way of acquisitions, our increased activities may not be eligible for inclusion in Israeli tax benefit programs. If the Israeli government discontinues or
modifies these programs and potential tax benefits, our business, financial condition and results of operations could be adversely affected.
On November 15, 2021, the Encouragement of Capital Investments Law was amended in order, inter alia, to encourage companies to voluntarily elect for an immediate payment of corporate tax on
previously tax-exempted earnings which were earned pursuant to Approved and Benefited Enterprises (the “Amendment”). The Amendment provides a reduced corporate tax payment on Exempt Earnings accumulated until December 31, 2020 that were not yet
distributed as a dividend, all subject to certain qualifying terms and conditions. The Company implemented the Amendment and as a result, paid the reduced corporate income tax subject to the dividend distribution in an amount of approximately
$4.3 million.
Transfer pricing rules may adversely affect our corporate income tax expense.
Many of the jurisdictions in which we conduct business have detailed transfer pricing rules, which require contemporaneous documentation establishing that all transactions with
non-resident related parties be priced using arm’s length pricing principles. The tax authorities in these jurisdictions could challenge our related party transfer pricing policies and as a consequence the tax treatment of corresponding expenses
and income. International transfer pricing is an area of taxation that depends heavily on the underlying facts and circumstances and generally involves a significant degree of judgment. If any of these tax authorities were to be successful in
challenging our transfer pricing policies, we may be liable for additional corporate income tax, and penalties and interest related thereto, which may have a significant impact on our results of operations and financial condition.
We may be exposed to liabilities under the U.S. Foreign Corrupt Practices Act and other U.S. and foreign anti-corruption, anti-money laundering, export
control, sanctions and other trade laws and regulations, and any determination that we violated these laws could have a material adverse effect on our business.
We are subject to export control and import laws and regulations, including the U.S. Export Administration Regulations, U.S. Customs regulations and various economic and trade
sanctions regulations administered by the U.S. Treasury Department’s Office of Foreign Assets Control. We are also subject to the U.S. Foreign Corrupt Practices Act of 1977, as amended, the U.S. domestic bribery statute contained in 18 U.S.C. §
201, the U.S. Travel Act, the USA PATRIOT Act, the United Kingdom Bribery Act 2010, the Proceeds of Crime Act 2002, Chapter 9 (sub-chapter 5) of the Israeli Penal Law, 1977, the Israeli Prohibition on Money Laundering Law—2000 and possibly other
anti-bribery and anti-money laundering laws in countries outside of the United States in which we conduct our activities. Compliance with these laws has been the subject of increasing focus and activity by regulatory authorities, both in the United
States and elsewhere, in recent years. Anti-corruption laws are interpreted broadly and prohibit companies and their employees and third-party intermediaries from authorizing, promising, offering, providing, soliciting or accepting, directly or
indirectly, improper payments or benefits to or from any person whether in the public or private sector. Although we endeavor to conduct our business in accordance with applicable laws and regulations, we cannot guarantee compliance.
Noncompliance with anti-corruption, anti-money laundering, export control, sanctions and other trade laws could subject us to whistleblower complaints, investigations,
sanctions, settlements, prosecution, other enforcement actions, disgorgement of profits, significant fines, damages, other civil and criminal penalties or injunctions, suspension and/or debarment from contracting with certain persons, the loss of
export privileges, reputational harm, adverse media coverage and other collateral consequences. If subpoenas or investigations are launched, or governmental or other sanctions are imposed, or if we do not prevail in any possible civil or criminal
litigation, our business, results of operations and financial condition could be materially harmed. Responding to any action will likely result in a materially significant diversion of management’s attention and resources and significant defense
and compliance costs and other professional fees. In addition, regulatory authorities may seek to hold us liable for successor liability for violations committed by companies in which we invest or that we acquire. As a general matter, enforcement
actions and sanctions could harm our business, results of operations and financial condition.
Although we do not believe that we were a “passive foreign investment company,” or a PFIC, for U.S. federal income tax purposes for 2023, if we are a PFIC in 2024 or in any future year, a U.S. investor in our Ordinary shares or Warrants may be subject to adverse U.S. federal income tax consequences.
Under the Internal Revenue Code of 1986, as amended, or the Code, we will be classified as a PFIC for any taxable year in which, either (i) at least 75% of our
gross income in a taxable year, including our pro rata share of the gross income of any corporation in which we are considered to own at least 25% of the shares by value, is passive income or (ii) at least 50% of our assets in a taxable year
(ordinarily determined based on fair market value and averaged quarterly over the year), including our pro rata share of the assets of any corporation in which we are considered to own at least 25% of the shares by value, are held for the
production of, or produce, passive income. Passive income generally includes, among other things, dividends, interest, rents and royalties (other than rents or royalties derived from the active conduct of a trade or business) and gains from the
disposition of passive assets. The Company believes that it was not a PFIC for U.S. federal income tax purposes for its 2023 taxable year and it does not expect to become one in the foreseeable future. However, PFIC status is determined annually and depends on the composition of a company’s income and assets and the fair market value of its assets and no assurance can be given that we were not a PFIC in 2023, or as to whether we will be a PFIC in 2024 or for any future taxable years.
If we are a PFIC for any taxable year during which a U.S. investor holds our Ordinary shares or Warrants, we would continue to be treated as a PFIC with respect to that U.S. investor for all succeeding years during which the U.S. investor holds our Ordinary shares or Warrants, even if we ceased to meet the threshold requirements for PFIC status, unless certain exceptions apply. Such a U.S. investor may be subject to adverse U.S. federal income tax consequences, including (i) the treatment
of all or a portion of any gain on the disposition of our Ordinary shares or Warrants as ordinary income (and therefore ineligible for the preferential rates that
apply to capital gains with respect to some U.S. investors), (ii) the application of a deferred interest charge on such gain and the receipt of certain dividends on our Ordinary shares, (iii) the
ineligibility to claim the preferential tax rate afforded to certain non-corporate U.S. investors on “qualified dividend income” with respect to dividends on our Ordinary shares and (iv) compliance with
certain reporting requirements.
It may be difficult to enforce a U.S. judgment against Taboola or its respective directors and officers outside the United States, or to assert U.S.
securities law claims outside of the United States.
A number of Taboola directors and executive officers are not residents of the United States, and the majority of Taboola’s assets and the assets of these persons are
located outside the United States. As a result, it may be difficult or impossible for investors to effect service of process upon Taboola within the United States or other jurisdictions, including judgments predicated upon the civil liability
provisions of the federal securities laws of the United States. Additionally, it may be difficult to assert U.S. securities law claims in actions originally instituted outside of the United States. Foreign courts may refuse to hear a U.S.
securities law claim because foreign courts may not be the most appropriate forum in which to bring such a claim. Even if a foreign court agrees to hear a claim, it may determine that the law of the jurisdiction in which the foreign court
resides, and not U.S. law, is applicable to the claim. Further, if U.S. law is found to be applicable, the content of applicable U.S. law must be proved as a fact, which can be a time-consuming and costly process, and certain matters of
procedure would still be governed by the law of the jurisdiction in which the foreign court resides.
Risks Related to Our Intellectual Property and Technology
Our intellectual property and proprietary rights may be difficult to enforce, particularly because
in many instances we rely on trade secrets rather than patents or similar registered legal protections. This could enable others to copy or use aspects of our platform without compensating us, which could erode our competitive advantages and
harm our business.
Our success depends, in part, on our ability to protect proprietary methods and technologies that we develop under the intellectual property laws of Israel,
the United States and other countries, so that we can prevent others from using our intellectual property and proprietary information. If we fail to protect our intellectual property and proprietary
rights adequately, our competitors might gain access to our technology and proprietary information, and our business could be adversely affected. We rely on trademark, copyright, trade secret, patent and
confidentiality procedures and contractual provisions to protect our proprietary methods and technologies.
Unauthorized parties may attempt to copy aspects of our technology or obtain and use information we regard as proprietary. We generally enter into
confidentiality and/or license agreements with our employees, consultants, vendors and Advertisers, and generally limit access to and distribution of our proprietary information. However, any steps taken
by us may not prevent infringement, misappropriation or other violation of our intellectual property, technology and proprietary information. Policing unauthorized
use of our technology is difficult. In addition, the laws of some foreign countries may not be as protective of intellectual property and proprietary rights as those of the U.S, and mechanisms for
enforcement of our intellectual property and proprietary rights in such countries may be inadequate. From time to time, legal action by us may be necessary to enforce our intellectual property and proprietary rights, to protect our trade secrets, to determine the validity and scope of the intellectual property and proprietary rights of others, or to defend against claims of
infringement, misappropriation or other violation. Although we generally rely on trade secret laws to protect our intellectual property, we may encounter difficulties
enforcing our rights where we lack patent protection. Such litigation could result in substantial costs and the diversion of limited resources and could negatively affect our business, financial
condition and results of operations. If we are unable to protect our intellectual property and proprietary rights, including aspects of our technology platform, we may find ourselves at a competitive disadvantage to others who have not
incurred the same level of expense, time and effort to create and protect their intellectual property.
We may be subject to intellectual property rights claims by third parties, which are extremely costly to defend, could require us to pay significant
damages and could limit our ability to use certain technologies.
Third parties may assert claims of infringement, misappropriation or other violation of intellectual property rights,
including in proprietary technology, against us or against our digital properties or Advertisers for which we may be held liable or have an indemnification obligation. Our risk of third-party claims may
be increased to the extent we rely on unaffiliated persons or firms, over whom we have less control than we would have over our own employees, to develop code. Any claim of infringement, misappropriation or other violation of
intellectual property rights by a third party, even those without merit, could cause us to incur substantial costs defending against the claim and could distract our management from operating our business.
Although third parties may offer a license to their technology or other intellectual property, the terms of any offered
license may not be acceptable and the failure to obtain a license or the costs associated with any license could cause our business, financial condition and results of operations to be materially and adversely affected. In addition, some
licenses may be non-exclusive, and therefore our competitors may have access to the same technology licensed to us. Alternatively, we may be required to develop non-infringing technology, which could require significant effort and expense and
ultimately may not be successful. Furthermore, a successful claimant could secure a judgment or we may agree to a settlement that prevents us from distributing certain products or performing certain services or that requires us to pay
substantial damages, including treble damages if we are found to have willfully infringed such claimant’s patents or copyrights, royalties or other fees. Any of these events could seriously harm our business financial condition and results of
operations.
Legal claims against us resulting from the actions of our Advertisers or digital properties could
damage our reputation and be costly to defend.
We receive representations from Advertisers that the content we place on their behalf does not infringe on any
third-party rights. We also rely on representations from our digital properties that their content does not infringe on any third-party rights and that they maintain adequate privacy policies that allow
us to place pixels on their properties and collect data from users that visit those websites to aid in delivering our solutions. However, we do not independently verify whether we are permitted to deliver advertising to our digital
properties’ Internet users or that the content we deliver is legally permitted. If any of our Advertisers’ or digital properties’ representations are untrue and our Advertisers
or digital properties do not abide by foreign, federal, state or local laws or regulations governing their content or privacy practices, we could become subject to legal claims against us, we could be exposed to potential liability (for which
we may or may not be indemnified by our Advertisers or digital properties), and our reputation could be damaged. Even in those instances where our Advertisers and
digital properties do indemnify us, it is possible these entities may not be willing or able to cover the claims and we will be responsible for the cost of litigation or required to pay substantial damages.
Indemnity provisions in various agreements potentially expose us to substantial liability for intellectual property infringement and other losses.
Our agreements with digital properties, Advertiser and other third parties may include indemnification provisions under
which we agree to indemnify them for losses suffered or incurred as a result of claims of intellectual property infringement, damages caused by us to property or persons, or other liabilities relating to or arising from our products,
services, or other contractual obligations. The term of these indemnity provisions generally survives termination or expiration of the applicable agreement. Large indemnity payments would harm our business, financial condition and results of
operations.
Our solution relies on third-party open-source software components, and failure to comply with the terms of the underlying open-source software licenses
could restrict our ability to sell our platform.
Our platform, including our computational infrastructure, relies on software licensed to us by third-party authors under “open-source” licenses. The use of
open-source software may entail greater risks than the use of third-party commercial software, as open-source licensors generally do not provide warranties, indemnities or other contractual protections regarding infringement claims or the
quality of the code. Some open-source licenses contain requirements that we make available source code for modifications or derivative works of the open-source code on unfavorable terms or at no cost. If we combine our proprietary software with open-source software in a certain manner, we could, under certain open-source licenses, be required to release the source code of our proprietary software to the public.
This would allow our competitors to create similar solutions with less development effort and time and ultimately put us at a competitive disadvantage.
Although we monitor our use of open-source software to avoid subjecting our products to conditions we do not intend, the terms of many open-source licenses
have not been interpreted by United States courts, and there is a risk that these licenses could be construed in a way that could impose unanticipated conditions or restrictions on our ability to commercialize our services. Moreover, we
cannot guarantee our processes for controlling our use of open-source software will be effective. If we face claims from third parties seeking to enforce the terms of an open-source software license, or if we are held to have breached the terms of an open-source software license, we could be required to seek licenses from third parties to continue operating our platform on terms that are not economically feasible, to re-engineer our
platform or the supporting computational infrastructure to discontinue use of certain code, or to make generally available, in source code form, portions of our proprietary code, any of which could adversely affect our business, financial
condition and results of operations.
We face risks related to cybersecurity breaches, attacks or threats, or other outages or disruptions of our services, including scheduled or unscheduled
downtime, which could harm our brand and reputation and negatively impact our revenue and results of operations.
As we grow our business, we expect to continue to invest in technology services, hardware and software, including data centers, network services, storage and
database technologies. Creating the appropriate support for our technology platform, including large-scale serving infrastructure and big data transmission, storage and computation infrastructure, is expensive and complex, and our execution
can result in inefficiencies or operational failures and increased vulnerability to cybersecurity breaches, attacks and threats which, in turn, could diminish the
quality of our services and our performance for our digital properties and our Advertisers. Cyberbreaches, attacks and threats could include denial-of-service attacks
impacting service availability (including the ability to deliver ads) and reliability; the exploitation of software vulnerabilities in Internet facing applications; phishing attacks or social engineering attacks (such as tricking company employees into releasing control of their systems to a hacker); or the introduction of computer viruses, software bugs, ransomware or malware into our systems,
including with a view to steal, access, modify, destroy or disclose personal, confidential, sensitive or proprietary data. To date, we have not identified
cybersecurity incidents that resulted in a material adverse impact to our business or operations, but there can be no guarantee we will not experience such an impact in the future. Cybersecurity breaches, attacks and threats of increasing sophistication may be difficult to detect and could result in the theft of our intellectual property and our data or our digital properties’ or Advertisers’ data, including our or
our digital properties’ or Advertisers’ personal data. In addition, we are vulnerable to unintentional errors as well as malicious actions by persons with authorized access to our systems that exceed the
scope of their access rights, or unintentionally or intentionally alter parameters or otherwise interfere with the intended operations of our platform.
A cybersecurity breach or attack, or a technology glitch, with respect to our systems, may cause a catastrophic effect where a large number of digital properties will stop using our service in a short period of time. While we take measures to protect the security of the systems and information used in the operation
of our business, and to implement certain privacy protections with respect to such information, such measures may not always be effective. The steps we take to increase the reliability, integrity and security of our systems as they scale may
be expensive and may not prevent system failures, unintended vulnerabilities or other cybersecurity incidents, including those resulting from the increasing number of persons with access to our systems, complex interactions within our
technology platform and the increasing number of connections with third party partners and vendors’ technology. Furthermore, because the methods of cyber-attack and deception change frequently, are increasingly complex and sophisticated, and
can originate from a wide variety of sources, including traditional computer hackers, organized crime groups, nation-state actors
and nation-state supported actors. Despite our reasonable efforts to ensure the integrity of our systems, we may not be able to anticipate, detect, appropriately react and respond to, or implement effective
preventative measures against, all cybersecurity incidents. Additionally, due to the Russia-Ukraine conflict, there have been publicized threats to increase cyber-attack activity against the critical infrastructure of any nation or
organization that retaliates against Russia for its invasion of Ukraine. Any such increase in such attacks on our third-party service providers or other systems could adversely affect our network systems or other operations. In addition to
our own systems, we use third-party vendors to store, transmit and otherwise process certain of our personal, confidential, sensitive or proprietary data on our
behalf. Due to applicable laws and regulations or contractual obligations, we may be held responsible for any cybersecurity incident attributed to our service providers as they relate to the information we share with them. Although we
typically require contractual commitments from these service providers to implement and use reasonable security measures, we cannot control third parties and cannot guarantee a security breach will not
occur in their systems.
We may be required to expend significant capital and other resources to protect against, respond to, and recover from any potential, attempted, or existing
cybersecurity incidents. As cybersecurity incidents continue to evolve, we may be required to expend significant additional resources to continue to modify or enhance our protective measures or to investigate and remediate any information
security vulnerabilities. In addition, our remediation efforts may not be successful. The inability to implement, maintain and upgrade adequate safeguards could have a material adverse effect on our results of operations, financial condition
and cash flow. Operational errors or failures or successful cyber-attacks, media reports about such an incident, whether accurate or not, or our failure to make adequate or timely disclosures to the public or law enforcement agencies
following any such event, whether due to delayed discovery or a failure to follow existing protocols, could result in violation of applicable privacy and data security laws and regulations, notification obligations, damage to our reputation, loss of current and new digital properties or Advertisers and other partners and clients, the disclosure of personal, confidential, sensitive or
proprietary data, interruptions to our operations and distraction to our management, and significant legal, regulatory and financial liabilities and lost revenues, which could harm our business.
While we currently maintain cybersecurity insurance, such insurance may not be sufficient in type or amount to cover us against claims related to breaches, failures or
other cybersecurity-related incidents, and we cannot be certain that cyber insurance will continue to be available to us on economically reasonable terms, or at all, or that any insurer will not deny coverage as to any future claim. The
successful assertion of one or more large claims against us that exceed available insurance coverage, or the occurrence of changes in our insurance policies, including premium increases or the imposition of large deductible or co-insurance
requirements, could have a material adverse effect on our results of operations, financial condition and cash flows.
Defects, errors or failures in our technology platform, including our software and systems, could adversely affect our business, operating results and
growth prospects.
We depend upon the sustained and uninterrupted performance of our technology platform to operate fundamental aspects of our business. If our technology
platform cannot scale to meet demand, or if there are defects or errors in our execution of any of these functions on our platform, then our business could be harmed. Our software and systems are complex and may contain defects or errors, or
may experience failures when implemented or when new functionality is released, as we may modify, enhance, upgrade and implement new software, systems, procedures and controls to reflect changes in our business, technological advancements and
changing industry trends. Undetected defects, errors and failures may occur, especially when new versions or updates are made. Despite testing by us, defects, errors or bugs in our software have in the past, and may in the future, not be
found until the software is in our live operating environment. Any defects, errors, failures or other similar performance problems or disruptions in our software or systems could materially and adversely affect our business, financial
condition and results of operations. Defects, errors, failures or other similar performance problems or disruptions, whether in connection with day-to-day operations or otherwise, could damage our clients’ businesses and result in negative
publicity, damage to our brand and reputation, loss of or delay in market acceptance of our solutions, increased costs or loss of revenue, loss of competitive position or claims by Advertisers for losses
sustained by them. In such an event, we may be required or choose to expend additional resources to help mitigate any problems resulting from defects, errors or failures in our software or systems. Alleviating problems resulting from defects,
errors or failures in our software or systems could require significant expenditures of capital and other resources and could cause interruptions, delays or the cessation of our business, any of which would adversely impact our financial
position, results of operations and growth prospects. In addition, if we experience any defects, errors, failures or other performance problems, our partners could seek to terminate or elect not to renew their contracts, delay or withhold
payment or make claims against us. Any of these actions could result in liability, lost business, increased insurance costs, difficulty in collecting accounts receivable, costly litigation or adverse publicity, which could materially and
adversely affect our business, financial condition and results of operations. Additionally, our software utilizes open-source software and any defects or errors in such open-source software could materially and adversely affect our business,
financial condition and results of operations.
We rely on third-party service providers for many aspects of our business, and any disruption of service experienced by such third-party service
providers or our failure to manage and maintain existing relationships or identify other high-quality, third-party service providers could harm our business, results of operations and growth prospects.
We rely on a variety of third-party service providers in connection with the operation of our solutions. Any performance issues, errors, bugs, defects
or failures with respect to third-party software or services could result in performance issues, errors, bugs, defects or failures with respect to our solutions, which could materially and adversely affect our business, financial condition and results of operations. Many of our third-party service providers attempt to impose limitations on their liability for such performance
issues, errors, bugs, defects or failures, and if enforceable, we may have additional liability to our clients or to other third parties that could harm our reputation and increase our operating costs.
Additionally, in the future, we might need to license other software or services to enhance our solutions and meet evolving client demands and requirements, which may not be available to us on commercially reasonable terms or at all. Any
limitations in our ability to use or obtain third-party software or services could significantly increase our expenses and otherwise result in delays, a reduction in functionality, or performance issues, errors, bugs, defects or failures with respect to our solutions until equivalent technology or content is either developed by us or, if available, identified, obtained through purchase or licensed and
integrated into our solutions, which could adversely affect our business. In addition, third-party software and services may expose us to increased risks, including risks associated with the integration of new technology, the diversion of
resources from the development of our own proprietary technology and our inability to generate revenue from new technology sufficient to offset associated acquisition and maintenance costs, all of which may increase our expenses and
materially and adversely affect our business, financial condition and results of operations. We will need to maintain our relationships with third-party service providers and obtain software and services from such providers that do not
contain any errors, bugs or defects. Any failure to do so could adversely affect our ability to deliver effective solutions to our clients and adversely affect our business.
Risks Related to Being a Public Company
Our management team has limited experience managing a public company.
Most members of our management team have limited experience managing a publicly traded company, interacting with public company investors, and complying with the
increasingly complex laws, rules and regulations that govern public companies. As a public company, we are subject to significant obligations relating to reporting, procedures and internal controls, and our management team may not successfully
or efficiently manage such obligations. These obligations and scrutiny require significant attention from our management and could divert their attention away from the day-to-day management of our business, which could adversely affect our
business, financial condition and results of operations.
We are required to provide management’s assessment on the effectiveness of our internal control over financial reporting. If we are unable to maintain appropriate internal
financial reporting controls and procedures, it could cause us to fail to meet our reporting obligations on a timely basis, result in material misstatements in our consolidated financial statements and adversely affect our operating results.
As a public company, we have significant requirements for enhanced financial reporting and internal controls. The process of designing, implementing, testing
and maintaining effective internal controls is a continuous effort that requires us to anticipate and react to changes in our business and the economic and regulatory environments. In this regard, we will need to continue to dedicate internal
resources, potentially engage outside consultants, adopt a detailed work plan to assess and document the adequacy of internal control over financial reporting, continue steps to improve control processes as appropriate, validate through
testing whether such controls are functioning as documented, and maintain a continuous reporting and improvement process for internal control over financial reporting.
Pursuant to Section 404(a) of the Sarbanes-Oxley Act, we are required to file a report with the SEC by our management on, among other things, the effectiveness of our internal control over
financial reporting. This assessment is required to include disclosure of any material weaknesses identified by our management in our internal control over financial reporting. The rules governing the standards that must be met for our
management to assess our internal control over financial reporting are complex and require significant documentation and testing. Testing and maintaining internal controls may divert our management’s attention from other matters that are
important to our business. In addition, pursuant to Section 404(b), we are required to include in the annual reports that we file with the SEC an attestation report on our internal control over financial reporting issued by our independent
registered public accounting firm. It is possible in the future that our internal control over financial reporting will not be effective
because it cannot detect or prevent material errors at a reasonable level of assurance. If we are unable to maintain appropriate internal financial reporting controls and procedures, it could cause us to fail to meet our reporting obligations
on a timely basis, result in material misstatements in our consolidated financial statements and adversely affect our operating results.
Furthermore, we may, during the course of our annual testing of our internal controls or during the related testing by
our independent registered public accounting firm, identify deficiencies which would have to be remediated to satisfy the SEC rules for certification of our internal controls over financial reporting. As a consequence, we may have to disclose
in periodic reports we file with the SEC significant deficiencies or material weaknesses in our system of internal controls. The existence of a material weakness would preclude management from concluding that our internal controls over
financial reporting are effective, and would preclude our independent auditors from issuing an unqualified opinion that our internal controls over financial reporting are effective. In addition, disclosures of this type in our SEC reports
could cause investors to lose confidence in the accuracy and completeness of our financial reporting and may negatively affect the trading price of our Ordinary shares, and we could be subject to
sanctions or investigations by regulatory authorities. Moreover, effective internal controls are necessary to produce reliable financial reports and to prevent fraud. If we have deficiencies in our disclosure controls and procedures or
internal controls over financial reporting, it could negatively impact our business, results of operations and reputation.
We incur increased costs as a result of operating as a public company, and our management is required to devote substantial time to compliance
initiatives and corporate governance practices.
As a public company, we incur significant legal, accounting and other expenses that we did not incur as a private company. The Sarbanes-Oxley Act, the
Dodd-Frank Wall Street Reform and Consumer Protection Act, the listing requirements of Nasdaq and other applicable securities rules and regulations impose various requirements on public companies, including establishment and maintenance of
effective disclosure and financial controls and corporate governance practices. Our management and other personnel continue to devote a substantial amount of time to these compliance initiatives. Moreover, these rules and regulations will
continue to increase our legal and financial compliance costs and will make some activities more time-consuming and costly. The risks associated with non-compliance may make it more difficult for
us to attract and retain qualified directors and may increase costs of director and officer liability insurance.
We continue to evaluate these rules and regulations and cannot predict or estimate the amount of additional costs we may incur or the timing of such costs. These rules and
regulations are often subject to varying interpretations, in many cases due to their lack of specificity, and, as a result, their application in practice may evolve over time as new guidance is provided by regulatory and governing bodies. This
could result in continuing uncertainty regarding compliance matters and higher costs necessitated by ongoing revisions to disclosure and governance practices.
We are required to comply with the SEC’s rules implementing Sections 302 and 404 of the Sarbanes-Oxley Act, which requires management to certify financial and
other information in our annual reports and provide an annual management report on the effectiveness of control over financial reporting. In 2022, we were required to make our first annual assessment of our internal control over financial reporting pursuant to Section 404(a). In addition, pursuant to Section 404(b), we are
required to include in the annual reports that we file with the SEC an attestation report on our internal control over financial reporting issued by our independent registered public accounting firm. To achieve
compliance with Section 404, we engaged in a process to document and evaluate our internal control over financial reporting, which is both costly and challenging. To maintain compliance, we will need to
continue to dedicate internal resources, potentially engage outside consultants and adopt a detailed work plan to assess and document the adequacy of internal control over financial reporting, continue steps to improve control processes as
appropriate, validate through testing that controls are functioning as documented and implement a continuous reporting and improvement process for internal control over financial reporting.
If we identify one or more material weaknesses, it could result in an adverse reaction in the financial markets due to a loss of confidence in the reliability
of our financial statements. As a result, the market price of our Ordinary shares could be negatively affected, and we could become subject to litigation including shareholder suits or investigations by
the stock exchange on which our securities are listed, the SEC or other regulatory authorities, which could require additional financial and management resources.
Risks Related to Our Ordinary shares
Our share price may be volatile, and you may lose all or part of your investment.
The market price of our Ordinary shares could be highly volatile and may fluctuate substantially as a result of many
factors, including:
| • |
actual or anticipated fluctuations in our results of operations;
|
| • |
variance in our financial performance from the expectations of market analysts or others;
|
| • |
announcements by us or our competitors of significant business developments, changes in significant customers, acquisitions or expansion plans;
|
| • |
our involvement in litigation;
|
| • |
our sale of Ordinary shares or other securities in the future;
|
| • |
market conditions in our industry;
|
| • |
changes in key personnel;
|
| • |
the trading volume of our Ordinary shares;
|
| • |
changes in the estimation of the future size and growth rate of our markets; and
|
| • |
general economic and market conditions.
|
In addition, the stock markets have experienced extreme price and volume fluctuations. Broad market and industry factors may materially harm the market price
of our Ordinary shares, regardless of our operating performance. In the past, following periods of volatility in the market price of a company’s securities, securities class action litigation has often been instituted against that company. If we were involved in any similar litigation we could incur substantial costs and our management’s attention
and resources could be diverted.
An active trading market for our Ordinary shares may not be sustained to provide adequate liquidity.
An active trading market may not be sustained for our Ordinary shares. The lack of an active market may impair your
ability to sell your shares at the time you wish to sell them or at a price that you consider reasonable. An inactive market may also impair our ability to raise capital by selling Ordinary shares and may
impair our ability to acquire other companies by using our shares as consideration.
The market price of our Ordinary shares could be negatively affected by future issuances or sales of
our Ordinary shares.
As of December 31, 2023, we have 295,670,620 Ordinary shares outstanding. Sales by us or our shareholders of a substantial number of Ordinary shares, the issuance of Ordinary shares as consideration for
acquisitions, or the perception that these sales might occur, could cause the market price of our Ordinary shares to decline or could impair our ability to raise capital through a future sale of, or pay
for acquisitions using, our equity securities.
If any of our large shareholders or members of our management were to sell substantial amounts of our Ordinary shares
and/or Warrants in the public markets, or the market perceives that such sales may occur, this could have the effect of increasing the volatility in, and put significant downward pressure on, the trading
price of our Ordinary shares and/or Warrants. Any such volatility or decrease in the trading price of our Ordinary shares and/or
Warrants could also adversely affect our ability to raise capital through an issue of equity securities in the future.
We do not expect to pay any dividends in the foreseeable future.
We have never declared or paid any dividends on our Ordinary shares. We do not anticipate paying any dividends in the
foreseeable future. We currently intend to retain future earnings, if any, to finance operations and expand our business.
Our board of directors has sole discretion over whether to pay dividends. If our board of directors decides to pay dividends, the form, frequency and amount
will depend upon our future operations and earnings, capital requirements and surplus, general financial condition, contractual restrictions and other factors that our directors may deem relevant. In addition, the Israeli Companies
Law, 5759-1999, or Companies Law, imposes restrictions on our ability to declare and pay dividends. Payment of dividends may also be subject to Israeli withholding taxes.
If securities or industry analysts cease to publish research or reports about our business, or if
they issue an adverse or misleading opinion regarding our stock, our stock price and trading volume could decline.
The trading market for our Ordinary shares is influenced by the research and reports that industry or securities
analysts publish about us or our business. If any of the analysts who cover us issue an adverse or misleading opinion regarding us, our business model, our intellectual property or our share performance, or if our results of
operations fail to meet the expectations of analysts, our share price would likely decline. If one or more of these analysts cease coverage of our Company or fail to publish reports on us regularly, our visibility in the financial markets could
decrease, which in turn could cause our Ordinary Share price or trading volume to decline.
We may issue additional Ordinary shares or other equity securities without your approval, which would
dilute your ownership interests and may depress the market price of our Ordinary shares.
We may issue additional Ordinary shares or other equity securities in the future in connection with, among other things,
future capital raising and transactions and future acquisitions, without your approval in many circumstances. Such issuance of additional Ordinary shares or other equity securities would have the
following effects:
| • |
Our existing shareholders’ proportionate ownership interest in Taboola may decrease;
|
| • |
the amount of cash available per share, including for payment of dividends in the future, may decrease;
|
| • |
the relative voting strength of each previously outstanding ordinary share may be diminished; and
|
| • |
the trading price of our Ordinary shares may decline.
|
Risks Related to the Warrants
We may redeem your unexpired Warrants prior to their exercise at a time that is disadvantageous to
you, thereby making your Warrants worth less.
Under the terms of the public Warrants, we may exercise the redemption right even if we are unable to register or
qualify the underlying securities for sale under all applicable state securities laws. Redemption of the outstanding Warrants could force holders (i) to exercise the Warrants and pay the exercise price therefor at a time when it may be disadvantageous to do so, (ii) to sell the Warrants at the then-current market price when the holder might otherwise wish to hold
its Warrants or (iii) to accept the nominal redemption price which, at the time the outstanding Warrants are called for redemption, is likely to be substantially less
than the market value of the Warrants. The Warrants exchanged for ION warrants that were issued in a private placement, as part
of the Business Combination, are not expected to be redeemable by Taboola so long as they are held by the Sponsors or their permitted transferees.
There can be no assurance that our Warrants received by holders of ION warrants in the Business
Combination will be in the money at the time they become exercisable or otherwise, and they may expire worthless.
The exercise price of our Warrants issued in exchange for the outstanding ION warrants is $11.50 per ordinary share. There can be no assurance that our Warrants will be in the money following the time they become exercisable and prior to their expiration, and as such, the Warrants may expire worthless.
Risks Relating to Our Incorporation and Location in Israel
Conditions in Israel, including the war in Israel, could have a material adverse effect on our business and operations.
We are incorporated under the laws of the State of Israel, and our principal research and development facilities, including our major data centers, are located in Israel.
Accordingly, political, economic and military conditions in Israel directly affect our business. Since the State of Israel was established in 1948, a number of armed conflicts have occurred between Israel and its Arab neighbors.
As has been widely publicly reported, in October 2023 war was declared in Israel. Although we are a company formed under the laws of the State of Israel and have a significant presence there,
we are a global company with operations in multiple countries. We maintain a business continuity plan and have taken the steps designed to maintain our operations in light of the war in Israel. As of the date of this Annual Report, our
operations have not been materially adversely affected by the war.
We cannot predict the duration or severity of the war in Israel or how it will evolve, including any possible escalation or expansion of the war or other hostilities with other countries or
groups, any of which could exacerbate geopolitical tensions and have economic implications. In connection with the war in Israel, several hundred thousand Israeli military reservists were called to immediate service. Certain of our employees
and consultants in Israel have been called, and additional ones may be called, for service. Although some military reservists have since been released, they may be called up for additional reserve duty, depending on developments in the war and
those persons may be absent for an extended period of time. In addition, due to the war or other hostilities our facilities could be damaged and our operations could be otherwise disrupted, which can impact our ability to deliver products and
services in a timely manner to meet our contractual obligations towards customers. Any of the foregoing and related risks and uncertainties could have a material adverse effect on our business and operations.
Further, the State of Israel and Israeli companies have been from time to time subjected to economic boycotts. Several countries, principally in the Middle East, still restrict doing business
with Israel and Israeli companies, and additional countries may impose restrictions on doing business with Israel and Israeli companies if hostilities in Israel or political instability in the region continues or increases. Any hostilities
involving Israel or the interruption or curtailment of trade between Israel and its present trading partners, or significant downturn in the economic or financial condition of Israel, could adversely affect our operations and product
development, and could cause our sales to decrease.
Prior to the outbreak of war in October 2023, the Israeli government pursued extensive changes to Israel’s judicial system. In response to the foregoing developments, many individuals,
organizations and institutions, within and outside of Israel, have voiced concerns over the potential negative impacts of such changes and the controversy surrounding them on the business and financial environment in Israel. Such negative
impacts may include, among others, a downgrade in Israel’s sovereign credit rating, increased interest rates, currency fluctuations, inflation, civil unrest and volatility in securities markets, which could adversely affect the conditions in
which we operate in Israel and potentially deter foreign investors and organizations from investing or transacting business in Israel. If any of the foregoing risks were to materialize, it may have an adverse effect on our business, our results
of operations and our ability to raise additional funds.
Investors’ rights and responsibilities as our shareholders will be governed by Israeli law, which may differ in some respects from the rights and
responsibilities of shareholders of non-Israeli companies.
We were incorporated under Israeli law and the rights and responsibilities of our shareholders are governed by our articles of association and Israeli law. These rights and
responsibilities differ in some respects from the rights and responsibilities of shareholders of U.S. and other non-Israeli corporations. In particular, a shareholder of an Israeli company has a duty to act in good faith and in a customary
manner in exercising its rights and performing its obligations towards the company and other shareholders and to refrain from abusing its power in the company, including, among other things, in voting at the general meeting of shareholders on
certain matters, such as an amendment to the company’s articles of association, an increase of the company’s authorized share capital, a merger of the company and approval of related party transactions that require shareholder approval. A
shareholder also has a general duty to refrain from discriminating against other shareholders. In addition, a controlling shareholder or a shareholder who knows that it possesses the power to determine the outcome of a shareholders’ vote or to
appoint or prevent the appointment of an office holder in the company has a duty to act in fairness towards the company. These provisions may be interpreted to impose additional obligations and liabilities on our shareholders that are not
typically imposed on shareholders of U.S. corporations.
Provisions of Israeli law and our amended and restated articles of association may delay, prevent or make undesirable an acquisition of all or a
significant portion of our shares or assets.
Provisions of Israeli law and our amended and restated articles of association could have the effect of delaying or preventing a change in control and may
make it more difficult for a third-party to acquire us or our shareholders to elect different individuals to our board of directors, even if doing so would be considered to be beneficial by some of our shareholders, and may limit the price
that investors may be willing to pay in the future for our Ordinary shares. Among other things:
| • |
Israeli corporate law regulates mergers and requires that a tender offer be effected when more than a specified percentage of shares in a company are purchased;
|
| • |
Israeli corporate law requires special approvals for certain transactions involving directors, officers or significant shareholders and regulates other matters that may be relevant to
these types of transactions;
|
| • |
Israeli corporate law does not provide for shareholder action by written consent for public companies, thereby requiring all shareholder actions to be taken at a general meeting of
shareholders;
|
| • |
our amended and restated articles of association divide our directors into three classes, each of which is elected once every three years;
|
| • |
our amended and restated articles of association generally requires that 33⅓% of our outstanding shares entitled to vote to be present in person or by proxy to constitute a quorum;
|
| • |
our amended and restated articles of association generally require a vote of the holders of a majority of our outstanding Ordinary shares entitled to vote present and voting on the matter at a general
meeting of shareholders (referred to as simple majority), and the amendment of a limited number of provisions, such as the provision empowering our board of directors to determine the size of the board, the provision dividing our
directors into three classes, the provision that sets forth the procedures and the requirements that must be met in order for a shareholder to require the Company to include a matter on the agenda for a general meeting of the
shareholders and the provisions relating to the election and removal of members of our board of directors and empowering our board of directors to fill vacancies on the board, require a vote of the holders of 65% of our outstanding
Ordinary shares entitled to vote at a general meeting;
|
| • |
our amended and restated articles of association do not permit a director to be removed except by a vote of the holders of at least 65% of our outstanding shares entitled to vote at a
general meeting of shareholders; and
|
| • |
our amended and restated articles of association provide that director vacancies may be filled by our board of directors.
|
Further, Israeli tax considerations may make potential transactions undesirable to us or some of our shareholders whose country of residence does not have a
tax treaty with Israel granting tax relief to such shareholders from Israeli tax. For example, Israeli tax law does not recognize tax-free share exchanges to the same extent as U.S. tax law. With respect to mergers, Israeli tax law allows for
tax deferral in certain circumstances but makes the deferral contingent on the fulfillment of numerous conditions, including, a holding period of two years from the date of the transaction during which certain sales and dispositions of shares
of the participating companies are restricted. Moreover, with respect to certain share swap transactions, the tax deferral is limited in time, and when such
time expires, the tax becomes payable even if no disposition of the shares has occurred.
Our amended and restated articles of association provide that unless we consent otherwise, the competent courts of Tel Aviv, Israel shall be the sole
and exclusive forum for substantially all disputes between Taboola and its shareholders under the Companies Law and the Israeli Securities Law, which could limit its shareholders ability to brings claims and proceedings against, as well as
obtain favorable judicial forum for disputes with Taboola, its directors, officers and other employees.
Unless we agree otherwise, the competent courts of Tel Aviv, Israel shall be the exclusive forum for (i) any derivative action or proceeding brought on behalf
of Taboola, (ii) any action asserting a claim of breach of fiduciary duty owed by any our director, officer or other employee to Taboola or our shareholders, or (iii) any action asserting a claim arising pursuant to any provision of the
Companies Law or the Israeli Securities Law, 1968, or Israeli Securities Law. Such exclusive forum provision in our amended and restated articles of association will not relieve Taboola of its duties to
comply with federal securities laws and the rules and regulations thereunder, and our shareholders will not be deemed to have waived Taboola’s compliance with these laws, rules and regulations. This exclusive forum provision may limit a
shareholders’ ability to bring a claim in a judicial forum of its choosing for disputes with Taboola or its directors or other employees which may discourage lawsuits against Taboola, its directors, officers and employees. The foregoing
exclusive forum provision is intended to apply to claims arising under Israeli Law and would not apply to claims for which the federal courts of the United States would have exclusive jurisdiction, whether by law or pursuant to our amended
and restated articles of association, including claims under the Securities Act for which there is a separate exclusive forum provision in our amended and restated articles of association.
General Risks
Fluctuations in the exchange rates of foreign currencies could result in currency transaction losses that negatively impact our financial results.
We currently have sales denominated in currencies other than the US dollar. In addition, we incur a portion of our operating expenses in Brazilian Reals, British pounds, Euro, Israeli shekels,
Japanese Yen and Thai baht, among others. Any fluctuation in the exchange rates of these foreign currencies could negatively impact our business, financial condition and results of operations. In 2022, we instituted a foreign currency cash flow
hedging program to address possible exposure arising from expected expenses to be paid in NIS. We hedged a portion of our anticipated NIS denominated payroll of Israeli employees for a period of one to twelve months with forward contracts and
other derivative instruments. In the future we may pursue additional currency hedging, and may modify or terminate those arrangements from time to time. We intend to enter into these transactions only to hedge underlying risk reasonably related
to our business and not for speculative purposes. There can be no assurance that any such activities will be effective or beneficial to us in whole or in part for several reasons including lack of experience, costs or illiquid markets. In
addition, it is difficult to predict the effect hedging activities would have on our results of operations, and hedging activities can themselves result in losses.
In periods of economic uncertainty, businesses may delay or reduce their spending on advertising, we are exposed to the credit risk of some of our clients and
customers as well as increased cost of operation in Israel, any of which could materially harm our business.
Inflation, which persisted throughout 2023, has adversely affected us by increasing the costs of equipment and labor needed to operate our business and could continue to adversely affect us in
future periods. Unstable inflation conditions make it difficult for us and our clients to accurately forecast and plan future business activities, and could cause our clients to reduce or delay their advertising spending with us. Historically,
economic downturns, including conditions such as inflation, recessions, or other changes in economic conditions have resulted in overall reductions in advertising spending, and businesses may curtail spending both on advertising in general and
on solutions such as ours. We cannot predict the timing, strength or duration of any economic slowdown or recovery. Any macroeconomic deterioration in the future could impair our revenue and results of operations.
Our exposure to credit risks relating to our financing activities may increase if our customers are adversely affected by periods of economic uncertainty, including inflation, recession,
pandemic, or other changes in economic conditions, or a global economic downturn. These may significantly impact our operating results and financial condition
Historically, credit losses with respect to accounts receivable have generally not been significant. However, we do not require collateral from Advertisers and our normal practice is to allow a
period of time before an Advertiser is required to pay us for our services. In addition, although we may seek to reduce the credit exposures of our accounts receivable by credit limits and credit insurance for certain customers, there can be no
assurance that any of our efforts to mitigate credit risks will be successful.
Economic downturns and political and market conditions beyond our control could adversely affect our business, financial condition and results of
operations.
Our business depends on the overall demand for advertising and on the economic health of our current and prospective Advertisers.
Economic downturns or instability in political or market conditions may cause current or new Advertisers to reduce their advertising budgets. Adverse economic conditions and general uncertainty about
economic recovery are likely to affect our business prospects. This could expose us to increased credit risk on Advertiser insertion orders, which, in turn, could negatively impact our business, financial
condition and results of operations.
In addition, continued geopolitical turmoil in many parts of the world have, and may continue to, put pressure on global economic conditions, which could lead
to reduced spending on advertising. The Russian invasion of Ukraine has significantly amplified existing geopolitical tensions among Russia, Ukraine, Europe, the West and China. We cannot predict how the
war in Ukraine will evolve, but any escalation or expansion of the conflict into other countries, particularly in Europe, would exacerbate geopolitical tensions and could lead to political and/or economic response from the U.S., the E.U. and
other countries, which may adversely impact economic conditions. In particular, Russia’s military incursion and the resulting sanctions have and could continue to adversely affect global energy and financial markets and thus could adversely
impact our operations and the price of our Ordinary shares. The extent and duration of the military action, the response thereto, including resulting sanctions, and resulting future market disruptions,
are impossible to predict, but could be significant. Additionally, any such disruptions, resulting sanctions or other actions (including cyberattacks) may magnify the impact of other risk factors discussed in this Annual Report.
We may require additional capital to support growth, and such capital might not be available on terms acceptable to us, if at all. This could hamper our
growth and adversely affect our business.
We intend to continue to make investments to support our business growth and may require additional funds to respond to business challenges, including the need to develop
new features or enhance our platform, improve our operating infrastructure or acquire complementary businesses and technologies. Accordingly, we may need to engage in public or private equity, equity-linked or debt financings to secure
additional funds. If we raise additional funds through future issuances of equity or convertible debt securities, our existing shareholders could suffer significant dilution, and any new equity securities we issue could have rights, preferences
and privileges superior to those of our existing shareholders. Any debt financing that we secure in the future could involve restrictive covenants relating to our capital raising activities and other financial and operational matters, including
the ability to pay dividends. This may make it more difficult for us to obtain additional capital and to pursue business opportunities, including potential acquisitions. We may not be able to obtain additional financing on terms favorable to
us, if at all. If we are unable to obtain adequate financing on terms satisfactory to us when we require it, our ability to continue to support our business growth and respond to business challenges could be significantly impaired, and our
business could be adversely affected.
We are exposed to the risk of natural disasters, political events, war, terrorism and the emergence of another pandemic, each of which could disrupt our business and adversely affect our results of operations.
Events beyond our control could have an adverse effect on our business, financial condition, results of operations and cash flows. Disruption to our
platform resulting from natural disasters, political events, war, terrorism, pandemics or other reasons could impair our ability to continue to provide uninterrupted platform service to our Advertisers
and digital properties. For example, Russia’s invasion of Ukraine, and the responses taken and which may be taken by the U.S., NATO, other countries,
multinational companies and others have created global security concerns that could have a lasting adverse impact on regional and global economies, and in turn, may lead to reduced spending on advertising and
adversely affect our results of operations. Similarly, disruptions in the operations of our key third-parties, such as data centers, servers or other technology providers, could have a material adverse
effect on our business.
While we have disaster recovery arrangements in place, they have not been tested under actual disasters or similar events and may not effectively permit us to continue to
provide our platform. If any of these events were to occur to our business, our business, results of operations, or financial condition could be adversely affected.
Expansion of current and new partners and clients in our existing international markets is important to our long-term success, and our limited
experience in operating our business in certain locations increases the risk that our international operations will not be successful.
As of December 31, 2023, we have offices in Israel, the United States, the United Kingdom, Brazil, Turkey, Thailand,
India, Japan, China, South Korea, Taiwan, Australia, Mexico, Germany, Spain, France, Italy, and Hungary. Expansion into new international markets requires additional management attention and resources in
order to tailor our solutions to the unique aspects of each country. In addition, we face the following additional risks associated with our expansion into international locations:
| • |
challenges caused by distance, language and cultural differences;
|
| • |
longer payment cycles in some countries;
|
| • |
credit risk and higher levels of payment fraud;
|
| • |
compliance with applicable foreign laws and regulations, including laws and regulations with respect to privacy, data protection, consumer protection, spam and content, and the risk
of penalties to our users and individual members of management if our practices are deemed to be out of compliance;
|
| • |
unique or different market dynamics or business practices;
|
| • |
currency exchange rate fluctuations or inflation;
|
| • |
foreign exchange controls;
|
| • |
political and economic instability and export restrictions;
|
| • |
potentially adverse tax consequences; and
|
| • |
higher costs associated with doing business internationally.
|
These risks could harm our international expansion efforts, which could have a materially adverse effect on our business, financial condition or results of operations.
| ITEM 1B: |
UNRESOLVED STAFF COMMENTS
|
None.
| ITEM 1C: |
CYBERSECURITY
|
Cybersecurity Risk Management
At Taboola, cybersecurity risk management is an integral part of our overall enterprise risk management program. We have developed and implemented a cybersecurity risk management program
intended to protect the confidentiality, integrity, and availability of our critical systems and information.
Our cybersecurity risk management program is based on ISO 27001 standards, which provide a framework and guidelines for implementing and managing an information security system, handling
cybersecurity threats and incidents, including threats and incidents relevant to our business, and facilitates coordination across different departments of our Company. Since 2019, Taboola has held an ISO 27001 certification which is audited
annually. This framework includes steps for assessing the severity of a cybersecurity threat, identifying the source of a cybersecurity threat including whether the cybersecurity threat is associated with a third-party service provider,
implementing cybersecurity countermeasures and mitigation strategies and informing management and our board of directors, as appropriate, of material risks from cybersecurity threats and incidents. As part of this framework, we’ve incorporated
third-party service provider cyber qualification processes and supply chain risk management. Our cybersecurity team regularly engages external cybersecurity consultants for risk assessment, security testing and system enhancements. In
addition, we provide employees annual cybersecurity training and also provide cybersecurity training for new hires.
Our board of directors has overall oversight responsibility for our risk management and is charged with oversight of our cybersecurity risk management program. The board of directors is
responsible for ensuring that management has processes in place designed to identify and evaluate cybersecurity risks to which the Company is exposed and implement processes and programs to manage cybersecurity risks and mitigate cybersecurity
incidents.
Management is responsible for identifying, considering and assessing material cybersecurity risks on an ongoing basis, establishing processes to ensure that such potential cybersecurity risk
exposures are monitored, putting in place appropriate mitigation measures and maintaining cybersecurity programs. Our cybersecurity programs are under the direction of our Vice President, Information Technology & Cybersecurity, or VP
Cybersecurity, who together with our cybersecurity team, monitors the prevention, detection, mitigation, and remediation of cybersecurity incidents. Our VP Cybersecurity and members of the cyber security team hold multiple industry recognized
cyber security certifications and together have decades of experience, including industry, military and government cyber experience. The Company’s VP Cybersecurity updates the board of directors on the Company’s cybersecurity programs, material
cybersecurity risks and mitigation strategies and provides cyber security reports at least annually that cover, among other topics, third-party assessments of the Company’s cybersecurity programs, developments in cybersecurity and updates to
the Company’s cybersecurity programs and mitigation strategies.
In 2023, we did not identify any cybersecurity threats that have materially affected or are reasonably likely to materially affect our business strategy, results of operations, or financial
condition. However, despite our efforts, we cannot eliminate all risks from cybersecurity threats, or provide assurances that we have not experienced any undetected cybersecurity incidents. For more information about these risks, refer to Part
1, Item 1A, “Risk Factors” in this Annual Report.
| ITEM 2: |
PROPERTIES
|
Our corporate headquarters is in New York City and our core research and development team is in Tel Aviv. We maintain offices in major cities around the
world to serve our geographically diverse client base. Additionally, we operate data centers in the United States, Israel, Hong Kong, Singapore and Netherlands and have twelve data centers which are operated under collocation agreements with nine third-party data center providers. Certain of our real property and other leases are further described in Notes 9, 12, 18 and 20 of Notes to Consolidated Financial Statements elsewhere in this Annual Report.
We lease all of our facilities. We do not own any real property. We believe our current facilities are adequate to meet our immediate needs.
| ITEM 3: |
LEGAL PROCEEDINGS
|
From time to time we are a party to various litigation matters incidental to the conduct of our business. We are not presently party to any legal proceedings the
resolution of which we believe would have a material adverse effect on our consolidated business prospects, financial condition, liquidity, results of operation, cash flows or capital levels.
| ITEM 4: |
MINE SAFETY DISCLOSURES
|
Not applicable.
PART II
| ITEM 5: |
MARKET FOR REGISTRANT’S COMMON EQUITY, RELATED STOCKHOLDER MATTERS AND ISSUER PURCHASES OF EQUITY SECURITIES
|
Market for Registrants Ordinary shares and Warrants
Our Ordinary shares and Warrants began trading on the Nasdaq Global Market under the symbols “TBLA” and “TBLAW,” respectively, on June 30, 2021. Prior to this, no public market existed for our
Ordinary shares.
Based on a review of the information provided to us by our transfer agent, as of February 22, 2024, there were 329 registered holders of our Ordinary shares. The number of registered holders
does not represent the actual number of beneficial owners of our Ordinary shares because the shares of Ordinary shares are frequently held in “street name” by securities dealers and others for the benefit of individual owners who have the
right to vote and/or dispositive power with respect to their shares.
Dividend Policy
We have never declared or paid any dividends on our Ordinary shares. We do not anticipate paying any dividends in the
foreseeable future. We currently intend to retain future earnings, if any, to finance operations and expand our business. Our board of directors has sole discretion whether to pay dividends. If our board of directors decides to pay
dividends, the form, frequency and amount will depend upon our future operations and earnings, capital requirements and surplus, general financial condition, contractual restrictions and other factors that our directors may deem relevant.
The Companies Law imposes restrictions on our ability to declare and pay dividends and payment of dividends may be subject to Israeli withholding taxes.
Purchases of Equity Securities by the Issuer and Affiliated Purchasers
The following table provides information about Ordinary shares repurchased pursuant to our Buyback Program for the three months ended December 31, 2023:
|
Period
|
(a) Total
Number of
Shares
Purchased
|
(b)
Average
Price Paid
Per Share
(1)
|
(c) Total Number
of Shares
Purchased as Part
of Publicly
Announced
Program
|
(d) Approximate
Dollar Value of
Shares that May Yet
Be Purchased Under
the Plan or Program
(2)
|
||||||||||||
|
October 1 - October 31, 2023
|
2,951,932
|
$
|
3.69
|
2,951,932
|
$
|
6,102,530
|
||||||||||
|
November 1 - November 30, 2023
|
2,795,492
|
$
|
3.81
|
2,795,492
|
$
|
35,451,079
|
||||||||||
|
December 1 - December 31, 2023
|
2,820,132
|
$
|
3.76
|
2,820,132
|
$
|
24,853,884
|
||||||||||
| (1) |
Excludes broker and transaction fees.
|
| (2) |
On May 10, 2023, the Company announced a share buyback program for the repurchase of up to $40.0 million of our outstanding Ordinary shares, with no expiration date (the “Buyback Program”). On November 7, 2023, the Board authorized
up to an additional $40.0 million of buybacks under the Buyback Program. Subsequent to December 31, 2023, in February 2024, our board of directors authorized up to $100.0 million for use under the Buyback Program, including any
remaining authority from the November 2023 board of directors authorization, subject to obtaining any required Israeli court approvals. The Buyback Program permits us to purchase our Ordinary shares from time to time in the open market,
including through trading plans intended to comply with Rule 10b5-1 under the Exchange Act, in privately negotiated transactions or otherwise. The timing and amount of any share buybacks will be subject to market conditions and other
factors determined by the Company. The Company may suspend, modify or discontinue the program at any time in its sole discretion without prior notice.
|
Shareholder Return Performance Presentation
This performance graph shall not be deemed “soliciting material” or to be “filed” with the Securities and Exchange Commission, or the SEC, for purposes of Section 18 of the Exchange Act, or
otherwise subject to the liabilities under that Section, and shall not be deemed to be incorporated by reference into any of our filings under the Securities Act.
The graph below compares the cumulative total shareholder return on our Ordinary shares from June 30, 2021 (the date our Ordinary shares commenced trading on the NASDAQ) through December
31, 2023 with the cumulative total return on the NASDAQ Composite Index and S&P SmallCap 600 Communication Services Index. All values assume a $100 initial investment and data for the NASDAQ Composite Index and S&P SmallCap 600
Communication Services Index assume reinvestment of dividends. The comparisons are based on historical data and are not indicative of, nor intended to forecast, the future performance of our Ordinary shares.
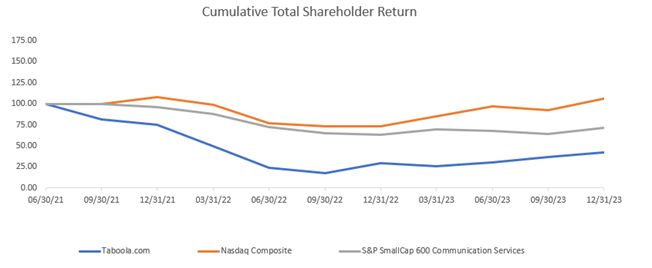
| ITEM 6: |
[RESERVED]
|
| ITEM 7: |
MANAGEMENT’S DISCUSSION AND ANALYSIS OF FINANCIAL CONDITION AND RESULTS OF OPERATION
|
You should read the following discussion and analysis of our financial condition and results of operations together with Taboola’s audited consolidated financial statements and the related
notes appearing elsewhere in this Annual Report. Some of the information contained in this discussion and analysis is set forth elsewhere in this Annual Report, including information with respect to Taboola’s plans and strategy for Taboola’s
business, and includes forward-looking statements that involve risks and uncertainties. As a result of many factors, including those factors set forth in the section titled “Risk Factors” and “Cautionary Note Regarding Forward-Looking
Statements,” Taboola’s actual results could differ materially from the results described in or implied by the forward-looking statements contained in the following discussion and analysis. Throughout this section, unless otherwise noted or the
context requires otherwise, “we,” “us,” “our” and the “Company” refer to Taboola and its consolidated subsidiaries, and in references to monetary amounts, “dollars” and “$” refer to U.S. Dollars, and “NIS” refers to New Israeli Shekels
Overview
Taboola is a technology company that powers recommendations across the Open Web with an artificial intelligence, or AI-based, algorithmic engine that we have developed since the Company began
operations in 2007. Taboola has also expanded more directly into e-Commerce, allowing its partners with digital properties the ability to use its platforms to display advertising suited to the audiences of those partners’ web sites or other
digital services.
We think of ourselves as a search engine, but in reverse — instead of expecting people to search for information, we recommend information to people or enable our partners to use our
technology. You’ve seen us before: we partner with websites, devices, and mobile apps, which we collectively refer to as digital properties, to recommend editorial content and advertisements on the Open Web, outside of the closed ecosystems
of the walled gardens such as Facebook, Google, and Amazon.
Digital properties use our technology platforms to achieve their business goals, such as driving new audiences to their sites and apps, or increasing engagement on site — and we don’t charge
them for these services. We also provide a meaningful monetization opportunity to digital properties by surfacing paid recommendations by Advertisers. Unlike walled gardens, we are a business-to-business, or B2B, company with no competing
consumer interests. We only interact with consumers through our partners’ digital properties, hence we do not compete with our partners for user attention. Our motivations are aligned. When our partners win, we win, and we grow together.
We empower Advertisers to leverage our proprietary AI-powered recommendation platform to reach targeted audiences utilizing effective, native ad formats across digital properties. We generate
revenues primarily when people (consumers) click on, purchase from or, in some cases, view the ads that appear within our partners’ digital experiences via our recommendation platform. Advertisers pay us for those clicks, purchases or
impressions, and we share the resulting revenue with the digital properties who display those ads and generate those clicks and downstream consumer actions.
Our powerful recommendation platform was built to address a technology challenge of significant complexity: predicting which recommendations users would be interested in, without explicit
intent data or social media profiles. Search advertising platforms have access, at a minimum, to users’ search queries which indicate intent, while social media advertising platforms have access to rich personal profiles created by users. In
contrast, we base our recommendations on an extensive dataset of context and user behavior derived from the intersection of thousands of digital properties and millions of recommended items, including ads and editorial content.
For more information about ex-TAC Gross Profit, Adjusted EBITDA and Non-GAAP Net Income, see “Operating and Financial Review and Prospects —Non-GAAP Financial Measures.”
For more information about ex-TAC Gross Profit, Adjusted EBITDA and Non-GAAP Net Income, see “Management’s Business Discussion and Analysis of Financial
Condition and Results of Operations- Non-GAAP Financial Measures.”
2023 Accomplishments and Growth Initiatives
2023 was an investment year for Taboola’s growth. We successfully launched Maximize Conversions, our first offering in our AI-bidding technology suite that should significantly improve
advertiser success and yield on our platform; successfully onboarded Yahoo’s global native supply onto the Taboola network; and launched technology that advances our eCommerce, Taboola News and Header Bidder offerings.
Additional Developments and Growth Initiatives
Notable new and renewed publisher wins in 2023 included Gannett, Time, Nexstar Media, Barstool Sports, G/O Media, Cambium Media, Futura, Disney, Unidad Editorial, BBC, One India, The Print,
Bangkok Post, A360 Media, Postmedia, NDTV, and Cox Media.
Taboola News had a spectacular growth year in 2023, where revenue grew to over $100 million. In Q3, we also rolled out a new partnership with realme, the world’s fastest-growing smartphone
brand. Under the partnership, realme is using Taboola News to power recommendations within all devices for audiences in Europe, and Southeast Asia. In 2023, we introduced new features to our Generative AI technology, called Taboola Generative
AI Admaker, which allows advertisers to edit existing creative automatically, instead of just creating images from scratch. As of now, around 30% of ad creatives from self service advertisers are made with our Gen AI.
Key Factors and Trends Affecting our Performance
We believe that our performance and future success depend on several factors that present significant opportunities for us but also pose risks and
challenges, including those discussed below and those referred to in Part I, Item 1A,“Risk Factors.”
Business and Macroeconomic Conditions
Global economic and geopolitical conditions have been increasingly volatile due to factors such as inflation, rising interest rates, supply chain disruptions and the wars in Israel and
Ukraine. The economic uncertainty resulting from these factors negatively impacted advertising demand and our yields in 2022 in particular. Further, the impacts of inflation, which persisted throughout 2023, has increased the costs of
equipment and labor needed to operate our business. These factors negatively impacted our business in 2022 and 2023, leading to a lower revenue and Adjusted EBITDA run rate entering 2024. These factors appear to have stabilized in 2023 and we
do not currently project additional impact from them in 2024, though we continue to monitor macroeconomic conditions closely.
Maintaining and Growing Our Digital Property Partners
We engage with a diverse network of digital property partners, substantially all of which have contracts with us containing either an evergreen term or an exclusive partnership with us for
multi-year terms at inception. These agreements typically require that our code be integrated on the digital property web page because of the nature of providing both editorial and paid recommendations. This
means that in the vast majority of our business, we do not bid for ad placements, as traditionally happens in the advertising technology space, but rather see all users that visit the pages on which we appear. Due to our multi-year
exclusive contracts and high retention rates, our supply is relatively consistent and predictable. We had approximately 12,000, 15,000 and 16,000 digital property
partners in the fourth quarter of 2023, 2022 and 2021, respectively. In 2023, we saw a decrease in the number of long-tail digital property partners on our network, partially due to our own
efforts to clean up our network and reduce low performing networks. Despite the decrease in the number of digital property partners on the network, our overall volume of page views went up over 10% from Q4 2021 to Q4 2023, demonstrating that
the decrease in the number of digital property partners in our network was driven by smaller digital property partners and more than offset by the addition of larger digital property partners.
Historically, we have had a strong record of growing the revenue generated from our digital property partners. We grow our digital property partner relationships
in four ways. First, we grow the revenue from these partnerships by increasing our yield over time. We do this by improving our algorithms, expanding our Advertiser base and increasing the amount of
data that helps target our ads. Second, we continuously innovate with new product offerings and features that increase revenue. Third, we innovate by launching new advertising formats. Fourth, we work closely with our digital property
partners to find new placements and page types where we can help them drive more revenue.
For the majority of our digital properties partners, we have two primary models for sharing revenue with digital property partners. The most common model is a
straight revenue share model. In this model, we agree to pay our partner a percentage of the revenue that we generate from advertisements placed on their digital properties. The second model includes guarantees. Under this model, we pay our
partners the greater of a fixed percentage of the revenue we generate and a guaranteed amount per thousand page views. In the past, we have and may continue to be required to make significant payments under these guarantees.
Growing Our Advertiser Client Base
We have a large network of Advertisers, across multiple verticals. We had approximately 17,000, 18,000 and 15,000 Advertiser clients working with us directly, or through advertising agencies, worldwide during the fourth quarters of 2023,
2022 and 2021, respectively. The decline from 2022 to 2023 was primarily driven by a channel partner that had a large number of small advertisers that they reduced in
2023. A large portion of our revenue comes from Advertisers with specific performance goals, such as obtaining subscribers for email newsletters or acquiring leads for
product offerings. These performance Advertisers use our service when they obtain a sufficient return on ad spend to justify their ad spend. We grow the revenue from performance Advertisers in three ways. First, we improve the performance of our network by developing new product features, improving our algorithms and optimizing our supply. Second, we secure increased budgets from existing Advertisers by offering new ad formats and helping them achieve additional goals. Third, we grow our overall Advertiser base by bringing on new Advertisers that we have not worked with previously.
Improving Network Yield
One way that we grow our revenue is by increasing the yield on our network, which is a general term for the revenue that we make per advertising placement.
Because we generally fill close to 100% of advertising impressions available, yield is generally not affected by changing fill rates, but rather is impacted in four ways. First, we increase our yield by improving the algorithms that select
the right ad for a particular user in a particular context. These algorithms are based on Deep Learning technology and are a key competitive advantage. Second, we continuously innovate and develop new
product offerings and features for Advertisers, which help increase their success rates on our network and improve yield. Third, as we grow our Advertiser base and
mix of Advertisers, including adding Advertisers able to pay higher rates, our yields increase because of increasing competitive pressure in our auction. Finally,
we increase our yield by optimizing the way we work with digital properties, including changing formats and placements. Increasing yield drives higher revenues on all digital property partners. Increasing yield also generally increases
margins for ex-TAC Gross Profit, a non-GAAP measure, for those digital property partners to whom we are paying guarantees. In periods of slower growth or periods of economic stress advertising demand may decline causing a decrease
in yields despite our efforts.
Product and Research & Development
We view research and development expenditures as investments that help grow our business over time. These investments, which are primarily in the form of employee
salaries and related expenditures and hardware infrastructure, can be broken into two categories. This first category includes product innovations that extend the capabilities of our current product offerings and help us expand into
completely new markets. This includes heavy investment in AI (specifically Deep Learning) in the form of server purchases and expenses for data scientists. This category of investment is important to maintain the growth of the business but
can also generally be adjusted up or down based on management’s perception of the potential value of different investment options. The second category of investments are those that are necessary to maintain our core business. These
investments include items such as purchasing servers and other infrastructure necessary to handle increasing loads of recommendations that need to be served, as well as the people necessary to maintain the value delivered to our customers and
digital property partners, such as investments in code maintenance for our existing products. This type of investment scales at a slower rate than the growth of our core business.
Managing Seasonality
The global advertising industry has historically been characterized by seasonal trends that also apply to the digital advertising
ecosystem in which we operate. In particular, advertisers have historically spent relatively more in the fourth quarter of the calendar year to coincide with the year-end holiday shopping season, and
relatively less in the first quarter. We expect these seasonality trends to continue, and our operating results will be affected by those trends with revenue and margins being seasonally strongest in the fourth quarter and seasonally
weakest in the first quarter.
Privacy Trends and Government Regulation
We are subject to U.S. and international laws and regulations regarding privacy, data protection, digital advertising
and the collection of user data. In addition, large Internet and technology companies such as Google and Apple are making their own decisions as to how to protect consumer privacy, which impacts the entire digital ecosystem. Because we
power editorial recommendations, digital properties typically embed our code directly on their web pages. This makes us less susceptible to impact by many of these regulations and industry trends because we are able to drop first party
cookies. In addition, because of this integration on our partners’ pages, we have rich contextual information to use to further refine the targeting of our recommendations.
Key Financial and Operating Metrics
We regularly monitor a number of metrics in order to measure our current performance and project our future performance. These metrics aid us in developing and refining
our growth strategies and making strategic decisions.
|
(dollars in thousands, except per share data)
|
Year ended
December 31,
|
|||||||||||
|
2023
|
2022
|
2021
|
||||||||||
|
Revenues
|
$
|
1,439,685
|
$
|
1,401,150
|
$
|
1,378,458
|
||||||
|
Gross profit
|
$
|
425,558
|
$
|
464,253
|
$
|
441,071
|
||||||
|
Net loss
|
$
|
(82,040
|
)
|
$
|
(11,975
|
)
|
$
|
(24,948
|
)
|
|||
|
EPS diluted (1)
|
$
|
(0.24
|
)
|
$
|
(0.05
|
)
|
$
|
(0.26
|
)
|
|||
|
Ratio of net loss to gross profit
|
(19.3
|
%)
|
(2.6
|
%)
|
(5.7
|
%)
|
||||||
|
Cash flow provided by operating activities
|
$
|
84,373
|
$
|
53,484
|
$
|
63,521
|
||||||
|
Cash, cash equivalents, short-term deposits and investments
|
$
|
181,833
|
$
|
262,807
|
$
|
319,319
|
||||||
|
|
||||||||||||
|
Non-GAAP Financial Data (2)
|
||||||||||||
|
ex-TAC Gross Profit
|
$
|
535,819
|
$
|
569,642
|
$
|
518,863
|
||||||
|
Adjusted EBITDA
|
$
|
98,677
|
$
|
156,676
|
$
|
179,464
|
||||||
|
Non-GAAP Net Income (3)
|
$
|
32,580 |
$
|
91,382
|
$
|
113,586
|
||||||
|
Ratio of Adjusted EBITDA to ex-TAC Gross Profit
|
18.4
|
%
|
27.5
|
%
|
34.6
|
%
|
||||||
|
Free Cash Flow
|
$
|
52,240
|
$
|
18,570
|
$
|
24,451
|
||||||
| (1) |
The weighted-average shares used in the computation of the diluted EPS for the year ended December 31, 2023 includes 45,198,702 Non-voting Ordinary shares.
|
| (2) |
Refer to “Non-GAAP Financial Measures” below for an explanation and reconciliation to GAAP metrics.
|
| (3) |
Year ended December 31, 2021 has been adjusted to include the impact of foreign currency exchange rates to be consistent with current period presentation.
|
Non-GAAP Financial Measures
We are presenting the following non-GAAP financial measures because we use them, among other things, as key measures for our management and board of
directors in managing our business and evaluating our performance. We believe they also provide supplemental information that may be useful to investors. The use of these measures may improve comparability of our results over time by
adjusting for items that may vary from period to period or not be representative of our ongoing operations.
These non-GAAP measures are subject to significant limitations, including those identified below. In addition, other companies may use similarly titled
measures but calculate them differently, which reduces their usefulness as comparative measures. Non-GAAP measures should not be considered in isolation or as a substitute for GAAP measures. They should be considered as supplementary
information in addition to GAAP operating, liquidity and financial performance measures.
ex-TAC Gross Profit
We calculate ex-TAC Gross Profit as gross profit adjusted to add back other cost of revenues.
We believe that ex-TAC Gross Profit is useful because traffic acquisition cost, or TAC, is what we must pay digital properties to obtain the right to place advertising on their websites, and
we believe focusing on ex-TAC Gross Profit better reflects the profitability of our business. We use ex-TAC Gross Profit as part of our business planning, for example in decisions regarding the timing and amount of investments in areas such
as infrastructure.
Limitations on the use of ex-TAC Gross Profit include the following:
| • |
Traffic acquisition cost is a significant component of our cost of revenues but is not the only component; and
|
| • |
ex-TAC Gross Profit is not comparable to our gross profit and by definition ex-TAC Gross Profit presented for any period will be higher than our gross profit for that period.
|
The following table provides a reconciliation of revenues and gross
profit to ex-TAC Gross Profit:
|
Year ended
December 31,
|
||||||||||||
|
2023
|
2022
|
2021
|
||||||||||
|
(dollars in thousands)
|
||||||||||||
|
Revenues
|
$
|
1,439,685
|
$
|
1,401,150
|
$
|
1,378,458
|
||||||
|
Traffic acquisition cost
|
903,866
|
831,508
|
859,595
|
|||||||||
|
Other cost of revenues
|
110,261
|
105,389
|
77,792
|
|||||||||
|
Gross profit
|
$
|
425,558
|
$
|
464,253
|
$
|
441,071
|
||||||
|
Add back: Other cost of revenues
|
110,261
|
105,389
|
77,792
|
|||||||||
|
ex-TAC Gross Profit
|
$
|
535,819
|
$
|
569,642
|
$
|
518,863
|
||||||
Adjusted EBITDA and Ratio of Adjusted EBITDA to ex-TAC Gross Profit
We calculate Adjusted EBITDA as net income (loss) before finance income (expenses), net, income tax expenses, depreciation and amortization, further adjusted to exclude share-based
compensation including Connexity holdback compensation expenses and other noteworthy income and expense items such as M&A costs and restructuring costs which may vary from period-to-period.
We believe that Adjusted EBITDA is useful because it allows us and others to measure our performance without regard to items such as share-based compensation expense, depreciation and
amortization, and interest expense and other items that can vary substantially depending on our financing and capital structure, and the method by which assets are acquired. We use Adjusted EBITDA and GAAP financial measures for planning
purposes, including the preparation of our annual operating budget, as a measure of performance and the effectiveness of our business strategies, and in communications with our board of directors. We may also use Adjusted EBITDA as a metric
for determining payment of cash or other incentive compensation.
Limitations on the use of Adjusted EBITDA include the following:
| • |
Although depreciation expense is a non-cash charge, the assets being depreciated may have to be replaced in the future, and Adjusted EBITDA does not reflect cash capital expenditure requirements for such replacements or for new
capital expenditure requirements;
|
| • |
Adjusted EBITDA excludes share-based compensation expense, which has been, and will continue to be for the foreseeable future, a significant recurring expense for our business and an important part of our compensation strategy;
|
| • |
Adjusted EBITDA does not reflect, to the extent applicable for a period presented: (1) changes in, or cash requirements for, our working capital needs; (2) interest expense, or the cash requirements necessary to service interest or
if applicable principal payments on debt, which reduces cash available to us; or (3) tax payments that may represent a reduction in cash available to us; and
|
| • |
The expenses and other items that we exclude in our calculation of Adjusted EBITDA may differ from the expenses and other items, if any, that other companies may exclude from Adjusted EBITDA when they report their operating results.
|
The following table provides a reconciliation of net income (loss) to Adjusted EBITDA:
|
Year ended
December 31,
|
||||||||||||
|
2023
|
2022
|
2021
|
||||||||||
|
(dollars in thousands)
|
||||||||||||
|
Net loss
|
$
|
(82,040
|
)
|
$
|
(11,975
|
)
|
$
|
(24,948
|
)
|
|||
|
Adjusted to exclude the following:
|
|
|
|
|||||||||
|
Finance (income) expenses, net
|
12,804
|
(9,213
|
)
|
(11,293
|
)
|
|||||||
|
Income tax expenses
|
5,499
|
7,523
|
22,976
|
|||||||||
|
Depreciation and amortization
|
96,512
|
91,221
|
53,111
|
|||||||||
|
Share-based compensation expenses (1)
|
53,749
|
63,830
|
124,235
|
|||||||||
|
Restructuring expenses (2)
|
—
|
3,383
|
—
|
|||||||||
|
Holdback compensation expenses (3)
|
10,582
|
11,091
|
3,722
|
|||||||||
|
M&A and other costs (4)
|
1,571
|
816
|
11,661
|
|||||||||
|
Adjusted EBITDA
|
$
|
98,677
|
$
|
156,676
|
$
|
179,464
|
||||||
| (1) |
For the year ended December 31, 2021, a substantial majority is share-based compensation expenses related to going public.
|
| (2) |
Costs associated with the Company’s cost restructuring program implemented in September 2022.
|
| (3) |
Represents share-based compensation due to holdback of Ordinary shares issuable under compensatory arrangements relating to Connexity acquisition.
|
| (4) |
For the year ended December 31, 2021, relates to the acquisition of ION Acquisition Corp. 1 Ltd., the acquisition of Connexity and going public, and for 2023, includes one-time costs related to the Commercial agreement.
|
We calculate Ratio of Adjusted EBITDA to ex-TAC Gross Profit as Adjusted EBITDA divided by ex-TAC Gross Profit.
We believe that the Ratio of Adjusted EBITDA to ex-TAC Gross Profit is useful because TAC is what we must pay digital properties to obtain the right to place advertising on their websites,
and we believe focusing on ex-TAC Gross Profit better reflects the profitability of our business.
The following table provides a reconciliation of ratio of net income (loss) to gross profit and Ratio of Adjusted EBITDA to ex-TAC Gross Profit:
|
Year ended
December 31,
|
||||||||||||
|
2023
|
2022
|
2021
|
||||||||||
|
(dollars in thousands)
|
||||||||||||
|
Gross profit
|
$
|
425,558
|
$
|
464,253
|
$
|
441,071
|
||||||
|
Net loss
|
$
|
(82,040
|
)
|
$
|
(11,975
|
)
|
$
|
(24,948
|
)
|
|||
|
Ratio of net loss to gross profit
|
(19.3
|
%)
|
(2.6
|
%)
|
(5.7
|
%)
|
||||||
|
ex-TAC Gross Profit
|
$
|
535,819
|
$
|
569,642
|
$
|
518,863
|
||||||
|
Adjusted EBITDA
|
$
|
98,677
|
$
|
156,676
|
$
|
179,464
|
||||||
|
Ratio of Adjusted EBITDA margin to ex-TAC Gross Profit
|
18.4
|
%
|
27.5
|
%
|
34.6
|
%
|
||||||
Non-GAAP Net Income (Loss)
We calculate Non-GAAP Net Income (Loss) as net income (loss) adjusted to exclude revaluation of our Warrants liability, share-based compensation expense including Connexity holdback
compensation expenses, M&A costs and amortization of acquired intangible assets, foreign currency exchange rate gains (losses), net, and other noteworthy items that change from period to period and related tax effects.
We believe that Non-GAAP Net Income (Loss) is useful because it allows us and others to measure our operating performance and trends without regard to items such as the revaluation of our
Warrants liability, share-based compensation expense, cash and non-cash M&A costs including amortization of acquired intangible assets, foreign currency exchange rate (gains) losses, net and other noteworthy items that change from period
to period and related tax effects. These items can vary substantially depending on our share price, acquisition activity, the method by which assets are acquired and other factors.
Limitations on the use of Non-GAAP Net Income (Loss) include the following:
| • |
Non-GAAP Net Income (Loss) excludes share-based compensation expense, which has been, and will continue to be for the foreseeable future, a significant recurring expense for our business and an important part of our compensation
strategy;
|
| • |
Non-GAAP Net Income (Loss) will generally be more favorable than our net income (loss) for the same period due to the nature of the items being excluded from its calculation; and
|
| • |
Non-GAAP Net Income (Loss) is a performance measure and should not be used as a measure of liquidity.
|
The following table provides a reconciliation of net income (loss) to Non-GAAP Net Income (Loss) for the periods shown*:
|
Year ended
December 31,
|
||||||||||||
|
2023
|
2022
|
2021
|
||||||||||
|
(dollars in thousands)
|
||||||||||||
|
Net loss
|
$
|
(82,040
|
)
|
$
|
(11,975
|
)
|
$
|
(24,948
|
)
|
|||
|
Amortization of acquired intangibles
|
63,888
|
63,557
|
23,007
|
|||||||||
|
Share-based compensation expenses (1)
|
53,749
|
63,830
|
124,235
|
|||||||||
|
Restructuring expenses (2)
|
—
|
3,383
|
—
|
|||||||||
|
Holdback compensation expenses (3)
|
10,582
|
11,091
|
3,722
|
|||||||||
|
M&A and other costs (4)
|
1,571
|
816
|
11,661
|
|||||||||
|
Revaluation of Warrants
|
(627
|
)
|
(24,471
|
)
|
(22,656
|
)
|
||||||
|
Foreign currency exchange rate losses (gains) (5)
|
(946
|
)
|
(1,377
|
)
|
4,625
|
|||||||
|
Income tax effects (6)
|
(13,597
|
)
|
(13,472
|
)
|
(6,060
|
)
|
||||||
|
Non-GAAP Net Income
|
$
|
32,580
|
$
|
91,382
|
$
|
113,586
|
||||||
| (1) |
For the year ended December 31, 2021, a substantial majority is share-based compensation expenses related to going public.
|
| (2) |
Costs associated with the Company’s cost restructuring program implemented in September 2022.
|
| (3) |
Represents share-based compensation due to holdback of Ordinary shares issuable under compensatory arrangements relating to Connexity acquisition.
|
| (4) |
For the year ended December 31, 2021, relates to the acquisition of ION Acquisition Corp. 1 Ltd., the acquisition of Connexity and going public, and for 2023, includes one-time costs related to the Commercial agreement.
|
| (5) |
Represents foreign currency exchange rate gains or losses related to the remeasurement of monetary assets and liabilities to the Company’s functional currency using exchange rates in effect at the end of the reporting period.
|
| (6) |
For the year ended December 31, 2021, includes non recurring GAAP tax expense of $4.4 million related to voluntary utilization of an Israeli tax program which provided an incentive for Israeli companies to release certain previously
tax-exempted earnings at a reduced tax rate. See Note 17 of Notes to the Consolidated Financial Statements in this Annual Report.
|
Free Cash Flow
We calculate Free Cash Flow as Net cash flow provided by operating activities minus purchases of property, plant and equipment, including capitalized internal-use software. We expect our Free
Cash Flow to fluctuate in future periods as we invest in our business to support our plans for growth.
We believe that Free Cash Flow is useful to provide management and others with information about the amount of cash generated from our operations that can be used for strategic initiatives,
including investing in our business, making strategic acquisitions, and strengthening our balance sheet. We expect our Free Cash Flow to fluctuate in future periods as we invest in our business to support our plans for growth.
Limitations on the use of Free Cash Flow include the following:
| • |
it should not be inferred that the entire Free Cash Flow amount is available for discretionary expenditures. For example, cash is still required to satisfy other working capital needs, including short-term investment policy,
restricted cash, repayment of loan.
|
| • |
Free Cash Flow has limitations as an analytical tool, and it should not be considered in isolation or as a substitute for analysis of other GAAP financial measures, such as net cash provided by operating activities; and
|
| • |
This metric does not reflect our future contractual commitments.
|
The following table provides a reconciliation of net cash provided by operating activities to Free Cash Flow:
|
Year ended
December 31,
|
||||||||||||
|
2023
|
2022
|
2021
|
||||||||||
|
(dollars in thousands)
|
||||||||||||
|
Net cash provided by operating activities
|
$
|
84,373
|
$
|
53,484
|
$
|
63,521
|
||||||
|
Purchase of property and equipment, including capitalized internal-use software
|
(32,133
|
)
|
(34,914
|
)
|
(39,070
|
)
|
||||||
|
Free Cash Flow
|
$
|
52,240
|
$
|
18,570
|
$
|
24,451
|
||||||
Components of Our Results of Operations
Revenues
All of our Revenues are generated from Advertisers with whom we enter into commercial arrangements, defining the terms of our service and the basis for our charges. Generally, our charges are
based on a CPC, CPM or CPA basis. For campaigns priced on a CPC basis, we recognize these Revenues when a user clicks on an advertisement we deliver. For campaigns priced on a CPM basis, we recognize these Revenues when an advertisement is
displayed. For campaigns priced on a performance-based CPA basis, the Company generates revenue when a user makes an acquisition.
Cost of revenues
Our cost of revenue primarily includes traffic acquisition cost and also includes other cost of revenue.
Traffic acquisition cost
Traffic acquisition cost, or TAC, consists primarily of cost related to digital property compensation for placing our platform on their digital property and cost for advertising impressions
purchased from real-time advertising exchanges and other third parties. Traffic acquisition cost also includes up-front payments, incentive payments, or bonuses paid to the digital property partners, which are amortized over the shorter of
respective contractual terms and the economic benefit period of the digital property arrangement. For the majority of our digital properties partners, we have two primary compensation models for digital properties. The most common model is a
revenue share model. In this model, we agree to pay a percentage of our revenue generated from advertisements placed on the digital properties. The second model includes guarantees. Under this model, we pay the greater of a percentage of the
revenue generated or a committed guaranteed amount per thousand page views (“Minimum guarantee model”). Actual compensation is settled on a monthly basis. Expenses under both the revenue share model as well as the Minimum guarantee model are
recorded as incurred, based on actual revenues generated by us at the respective month.
Other cost of revenues
Other cost of revenues includes data center and related costs, depreciation expense related to hardware supporting our platform, amortization expense related to capitalized internal-use
software and acquired technology, digital and services taxes, personnel costs, and allocated facilities costs. Personnel costs include salaries, bonuses, share-based compensation, and employee benefit costs, and are primarily attributable to
our operations group, which supports our platform and our Advertisers.
Gross profit
Gross profit, calculated as revenues less cost of revenues, has been, and will continue to be, affected by various factors, including fluctuations in the amount and mix of revenue and the
amount and timing of investments to expand our digital properties partners and Advertisers base. We hope to increase both our Gross profit in absolute dollars and as a percentage of revenue through enhanced operational efficiency and
economies of scale.
Research and development
Research and development expenses consist primarily of personnel costs, including salaries, bonuses, share-based compensation and employee benefits costs, allocated facilities costs,
professional services and depreciation. We expect research and development expenses to increase in future periods to support our growth, including continuing to invest in optimization, accuracy and reliability of our platform and other
technology improvements to support and drive efficiency in our operations. These expenses may vary from period to period as a percentage of revenue, depending primarily upon when we choose to make more significant investments.
Sales and marketing
Sales and marketing expenses consist of payroll and other personnel related costs, including salaries, share-based compensation, employee benefits, and travel for our sales and marketing
departments, advertising and promotion, rent and depreciation and amortization expenses, particularly related to the acquired intangibles. We expect to increase selling and marketing expenses to support the overall growth in our business.
General and administrative
General and administrative expenses consist of payroll and other personnel related costs, including salaries, share-based compensation, employee benefits and expenses for executive
management, legal, finance and others. In addition, general and administrative expenses include fees for professional services and occupancy costs. We expect our general and administrative expense to increase as we scale up headcount with the
growth of our business, and as a result of operating as a public company, including compliance with the rules and regulations of the SEC, legal, audit, additional insurance expenses, investor relations activities, and other administrative and
professional services.
Finance income (expenses), net
Finance income (expenses), net, primarily consists of interest income (expense) including amortization of loan and credit facility issuance costs, Warrants liability fair value adjustments,
gains (losses) from foreign exchange fluctuations and bank fees.
Income tax benefit (expenses)
The statutory corporate tax rate in Israel was 23% for 2023, 2022 and 2021, although we are entitled to certain tax benefits under Israeli law. See Note 17 of Notes to the Consolidated
Financial Statements in this Annual Report.
Pursuant to the Israeli Law for Encouragement of Capital Investments-1959 (the “Investments Law”) and its various amendments, under which we have been granted “Privileged Enterprise”
status, we were granted a tax exemption status for the years 2018 and 2019.
For 2021 and subsequent tax years, we adopted The “Preferred Technology Enterprises” (“PTE”) Incentives Regime (Amendment 73 to the Investment Law) granting a 12% tax rate in central Israel
on income deriving from benefited intangible assets, subject to a number of conditions being fulfilled, including a minimal amount or ratio of annual research and development expenditure and research and development employees, as well as
having at least 25% of annual income derived from exports to large markets. PTE is defined as an enterprise which meets the aforementioned conditions and for which total consolidated revenues of its parent company and all subsidiaries are
less than NIS 10 billion.
In the fourth quarter of 2021, the Company utilized a special program initiated by the Israeli Tax Authority allowing Israeli companies to voluntarily release tax-exempted earnings at a
reduced tax rate which resulted in GAAP tax expense of $4.4 million.
As of December 31, 2023, we have an accumulated tax loss carry-forward of approximately $64.1 million in Israel and $1.5 million federal tax in the U.S. Those tax losses can be offset
indefinitely. Non-Israeli subsidiaries are taxed according to the tax laws in their respective jurisdictions.
The following section discusses our financial condition and results of operations for the year ended December 31, 2023 compared to the year ended December 31, 2022. For a discussion of our
financial condition and results of operations for the year ended December 31, 2022 compared to the year ended December 31, 2021, refer to Part II, Item 7, “Management’s Discussion and Analysis of Financial
Condition and Results of Operations”, in our Annual Report of Form 10-K for the fiscal year ended December 31, 2022, filed with the Securities and Exchange Commission on March 13, 2023.
The following table provides consolidated statements of loss data for the periods indicated:
|
(dollars in thousands)
|
Year ended
December 31,
|
2023 vs 2022
|
||||||||||||||
|
2023
|
2022
|
$ Change
|
% Change
|
|||||||||||||
|
Revenues
|
$
|
1,439,685
|
$
|
1,401,150
|
$
|
38,535
|
2.8
|
%
|
||||||||
|
Cost of revenues:
|
||||||||||||||||
|
Traffic acquisition cost
|
903,866
|
831,508
|
72,358
|
8.7
|
%
|
|||||||||||
|
Other cost of revenues
|
110,261
|
105,389
|
4,872
|
4.6
|
%
|
|||||||||||
|
Total cost of revenues
|
1,014,127
|
936,897
|
77,230
|
8.2
|
%
|
|||||||||||
|
Gross profit
|
425,558
|
464,253
|
(38,695
|
)
|
(8.3
|
%)
|
||||||||||
|
Operating expenses:
|
||||||||||||||||
|
Research and development
|
136,255
|
129,276
|
6,979
|
5.4
|
%
|
|||||||||||
|
Sales and marketing
|
246,342
|
246,803
|
(461
|
)
|
(0.2
|
%)
|
||||||||||
|
General and administrative
|
106,698
|
101,839
|
4,859
|
4.8
|
%
|
|||||||||||
|
Total operating expenses
|
489,295
|
477,918
|
11,377
|
2.4
|
%
|
|||||||||||
|
Operating loss
|
(63,737
|
)
|
(13,665
|
)
|
(50,072
|
)
|
366.4
|
%
|
||||||||
|
Finance income (expenses), net
|
(12,804
|
)
|
9,213
|
(22,017
|
)
|
(239.0
|
%)
|
|||||||||
|
Loss before income taxes expenses
|
(76,541
|
)
|
(4,452
|
)
|
(72,089
|
)
|
1619.2
|
%
|
||||||||
|
Income tax expenses
|
(5,499
|
)
|
(7,523
|
)
|
2,024
|
(26.9
|
%)
|
|||||||||
|
Net loss
|
$
|
(82,040
|
)
|
$
|
(11,975
|
)
|
$
|
(70,065
|
)
|
585.1
|
%
|
|||||
Comparison of the Years Ended December 31, 2023 and 2022
Revenues increased by $38.5 million, or 2.8%, for the year ended December 31, 2023 compared to the year ended December 31, 2022. New digital property partners contributed approximately $221.6
million of new Revenues on a 12-month run rate basis calculated based on their first full month on the network. Existing digital property partners, including the growth of new digital property partners (beyond the revenue contribution
determined based on the run-rate revenue generated by the partners when they are first on-boarded) decreased by approximately $183.0 million. This decrease was primarily driven by a decline in advertiser rates during 2022, partially mitigated
by growth in our Taboola News and eCommerce businesses.
Cost of revenues increased by $77.2 million, or 8.2%, for the year ended December 31, 2023 compared to the year ended December 31, 2022. Most of the increase in Cost of revenues was driven by
Traffic acquisition cost, which increased by $72.4 million, or 8.7%, for the year ended December 31, 2023 compared to the year ended December 31, 2022. The cost of guarantees (total payments due under guarantee arrangements in excess of
amounts the Company would otherwise be required to pay under revenue sharing arrangements) as a percentage of traffic acquisition costs were approximately 19% and 10% for the years ended December 31, 2023 and December 31, 2022, respectively.
Gross profit decreased by $38.7 million, or 8.3%, for the year ended December 31, 2023 compared to the year ended December 31, 2022.
Ex-TAC Gross Profit, a non-GAAP measure, decreased by $33.8 million, or 5.9%, for the year ended December 31, 2023 compared to the year ended December 31, 2022, primarily due to a decrease in
ex-TAC Gross Profit from existing digital property partners principally caused by yield compression that occurred in 2022. This was partially offset by ex-TAC Gross Profit from new digital property partners on a 12-month run rate basis.
Other cost of revenues increased by $4.9 million, or 4.6%, for the year ended December 31, 2023 compared to the year ended December 31, 2022, primarily attributed to $5.7 million in
depreciation and amortization expenses, an increase of $1.3 million in related to other data and information system costs, offset by $1.9 million in employee related cost.
Research and development expenses increased by $7.0 million, or 5.4%, for the year ended December 31, 2023 compared to the year ended December 31, 2022, primarily attributable to an increase
of $4.9 million in employee and subcontractors related costs and an increase of $2.2 million in servers and software related cost.
Sales and marketing expenses decreased by $0.5 million, or 0.2%, for the year ended December 31, 2023 compared to the year ended December 31, 2022. The decrease is mainly attributed to a
decrease of $6.2 million in share-based compensation expenses, decrease of $2.5 million in sales and marketing events costs and a decrease of $1.5 million in professional fees, partially offset by an increase of $8.6 million in employee and
subcontractors related costs and an increase of $2.1 million in travel and rent expenses.
General and administrative expenses increased by $4.9 million, or 4.8%, for the year ended December 31, 2023 compared to the year ended December 31, 2022, primarily attributed to an increase
of $4.9 million in employee and subcontractor related costs, an increase of $2.3 million in credit losses, offset by $3.0 million in legal consultants expenses related to regulatory matters and insurance expenses.
Finance income (expenses), net decreased by $22.0 million for the year ended December 31, 2023 compared to the year ended December 31, 2022, mainly attributable to $23.8 million Warrants
liability devaluation, recorded in the year ended December 31, 2022, partially offset by a decrease of $2.3 million in interest expenses.
Income (loss) before income taxes decreased by $72.1 million, for the year ended December 31, 2023 compared to the year ended December 31, 2022, as a result of the factors described above.
Tax expense decreased by $2.0 million, or 26.9%, for the year ended December 31, 2023 compared to the year ended December 31, 2022 primarily attributed to the decrease on our current income
tax expenses.
Liquidity and Capital Resources
Our primary cash needs are for working capital, personnel costs, contractual obligations, including payments to digital property partners, office leases and software and information
technology costs, capital expenditures for servers and capitalized software development, payment of interest and required principal payments on our long-term loan and other commitments. We fund these cash needs primarily from cash generated
from operations, as well as from cash and cash equivalents on our balance sheet when required. We generated cash from operations for the years ended December
31, 2023, 2022, and 2021 of $84.4 million, $53.5 million, and $63.5 million, respectively.
As part of our growth strategy, we have made and expect to continue to make significant investments in research and development and in our technology
platform. We also plan to selectively consider possible future acquisitions that are attractive opportunities we deem strategic and value-enhancing. To fund our growth, depending on the magnitude
and timing of our growth investments and the size and structure of any possible future acquisition, we may supplement our available cash from operations with issuances of equity or debt securities and/or make other borrowings, which could
be material.
As of December 31, 2023 and 2022, we had $181.8 million and $262.8 million of cash, cash equivalents and short-term investments, respectively, and $5.7 million and $4.8 million in short and long-term restricted deposits, respectively, used, mainly, as security for our lease commitments. Cash and
cash equivalents consist of cash in banks and highly liquid marketable securities investments and money market account and funds, with an original maturity of three months or less at the date of purchase and are readily convertible to known
amounts of cash. Short-term investments generally consist of U.S. government treasuries, commercial paper, corporate debt securities, and U.S. agency bonds.
We believe that this, together with net proceeds from our engagements with Advertisers and digital property partners, will provide us with sufficient liquidity to meet our working capital and
capital expenditure needs for at least the next 12 months. In the future, we may be required to obtain additional equity or debt financing in order to support our continued capital expenditures and operations. In the event that additional
financing is required from outside sources, we may not be able to raise it on terms acceptable to us or at all. If we are unable to raise additional capital or generate cash flows necessary to expand our operations and invest in new
technologies, this could reduce our ability to compete successfully and harm our business, growth, and results of operations.
On August 9, 2022 we entered into an incremental revolving credit facility amendment to our existing senior secured credit agreement (the “Amended Credit Agreement”). The Amended Credit
Agreement provides for borrowings in an aggregate principal amount of up to $90 million (the “Revolving Facility”). The proceeds of the Revolving Facility can be used to finance working capital needs and general corporate purposes. Borrowings
under the Revolving Facility are subject to customary borrowing conditions and will bear interest at a variable annual rate based on Term SOFR or Base Rate plus a fixed margin. The Amended Credit Agreement also contains customary
representations, covenants and events of default as well as a financial covenant, which places a limit on our allowable net leverage ratio. As of December 31, 2023, we had no outstanding borrowings under the Revolving Facility.
In the years ended December 31, 2023 and 2022 we voluntarily prepaid the principal amount of debt outstanding under our long-term loan of $79.3 million and $61.3 million, respectively. We
will consider the repurchase and retirement of additional debt based on, among other factors, our working capital and capital expenditures needs, liquidity position and possible alternative uses of cash.
As of December 31, 2023, the remaining future principal payments related to our long-term loan, following the prepayment, were $152.7 million.
In May 2023, our board of directors authorized a share buyback program for the repurchase of up to $40.0 million of the Company’s outstanding Ordinary shares, with no expiration date (the
“Buyback Program”). In November 2023, our board of directors authorized up to an additional $40.0 million of buybacks under the Buyback Program. As permitted by the Buyback Program, share
repurchases may be made from time to time, in privately negotiated transactions or in the open market, including through trading plans intended to comply with Rule 10b5-1, at the discretion of our management and as permitted by securities
laws and other legal requirements, including Rule 10b-18 of the Exchange Act. The Buyback Program does not obligate the Company to repurchase any specific number of shares and may be discontinued, modified or suspended at any time.
The Buyback Program commenced in June 2023 and during the year ended December 31, 2023, we repurchased 15.2 million Ordinary shares at an average price of $3.62 per share (excluding broker
and transaction fees of $0.4 million). As of December 31, 2023 the Company had remaining authorization to repurchase shares up to an aggregate amount of $24.9 million, which has been mostly utilized subsequent to the balance sheet date.
Subsequent to December 31, 2023, in February 2024, our board of directors authorized up to $100.0 million for use under the Buyback Program, including any remaining authority from the
November 2023 board of directors authorization, subject to obtaining any required Israeli court approvals.
See Part II, Item 5. Market for Registrant’s Common Equity, Related Stockholder Matters and Issuer Purchases of Equity Securities and Note 15 of Notes to the Consolidated Financial
Statements in this Annual report.
Our future capital requirements and the adequacy of available funds will depend on many factors, including the risks and uncertainties set forth under Part I, Item 1A, “Risk Factors.”
Cash Flows
The following table summarizes our cash flows for the periods indicated:
|
Year ended
December 31,
|
||||||||||||
|
2023
|
2022
|
2021
|
||||||||||
|
(dollars in thousands)
|
||||||||||||
|
Cash Flow Data:
|
||||||||||||
|
Net cash provided by operating activities
|
$
|
84,373
|
$
|
53,484
|
$
|
63,521
|
||||||
|
Net cash provided by (used in) investing activities
|
59,640
|
(139,561
|
)
|
(620,460
|
)
|
|||||||
|
Net cash provided by (used in) financing activities
|
(134,614
|
)
|
(62,873
|
)
|
631,127
|
|||||||
|
Exchange rate differences on balances of cash and cash equivalents
|
816
|
(4,476
|
)
|
2,320
|
||||||||
|
Increase (decrease) in cash and cash equivalents
|
$
|
10,215
|
$
|
(153,426
|
)
|
$
|
76,508
|
|||||
Operating Activities
During the year ended December 31, 2023, Net cash provided by operating activities of $84.4 million was related to our net loss of $82.0 million adjusted by positive adjustments of non-cash
charges of $161.7 million and net cash inflows of $4.7 million provided by changes in working capital.
The $161.7 million of non-cash charges primarily consisted of depreciation and amortization of $96.5 million and share-based compensation expense related to vested equity awards of $64.3
million.
The $4.7 million increase in cash resulting from changes in working capital primarily consisted of a $36.6 million increase in trade payables, $25.2 million increase in accrued expenses and
other current liabilities and other long-term liabilities and $5.9 million decrease in prepaid expenses and other current assets and long-term prepaid expenses, partially offset by a $49.6 million increase in trade receivables, net and $15.5
million decrease in deferred taxes, net.
During the year ended December 31, 2022, Net cash provided by operating activities of $53.5 million was related to our net loss of $12.0 million adjusted by positive adjustments of non-cash charges of $147.5 million and net cash outflows of $82.0 million provided by changes in working capital.
The $147.5 million of non-cash charges primarily consisted of depreciation and amortization of $91.2 million and share-based compensation expense related to vested equity awards of $74.9
million, partially offset by $24.5 million of Warrants liability devaluation.
The $82.0 million decrease in cash resulting from changes in working capital primarily consisted of a $21.9 million decrease in accrued expenses and other current liabilities and other
long-term liabilities, $17.3 million decrease in deferred taxes, net, $16.8 million decrease in trade payables, $11.2 million increase in trade receivables and $10.8 million increase in prepaid expenses and other current assets and long-term
prepaid expenses.
Investing Activities
During the year ended December 31, 2023, Net cash provided by investing activities was $59.6 million, primarily consisting of $114.5 million proceeds from maturities of short-term
investments, partially offset by $32.1 million purchase of property and equipment, including capitalized internal-use software and $22.0 million purchase of short-term investments.
During the year ended December 31, 2022, Net cash used for investing activities was $139.6 million, primarily consisting of $126.4 million purchase of short-term investments, $34.9 million
purchase of property and equipment, including capitalized internal-use software and $8.0 million cash paid in connection with acquisitions, net of cash acquired, partially offset by $29.6 million proceeds from maturities of short-term
investments.
Financing Activities
During the year ended December 31, 2023, Net cash used in financing activities was $134.6 million, primarily consisting of $82.3 million repayment of our long-term loan and $55.5 million
repurchase of Ordinary shares, partially offset by $7.0 million received from exercised options and vested RSUs.
During the year ended December 31, 2022, Net cash used in financing activities was $62.9 million, primarily consisting of $64.3 million repayment of our long-term loan and $5.8 million
payments of tax withholdings for share-based compensation expenses partially offset by $8.4 million received from exercised options and vested RSUs.
Contractual Obligations
The following table discloses aggregate information about material contractual obligations and the periods in which they are due as of December 31, 2023. Future events could cause actual
payments to differ from these estimates.
|
Contractual Obligations by Period
|
||||||||||||||||||||||||
|
2024
|
2025
|
2026
|
2027
|
2028
|
Thereafter
|
|||||||||||||||||||
|
(dollars in thousands)
|
||||||||||||||||||||||||
|
Debt Obligations
|
$
|
3,000
|
$
|
3,000
|
$
|
3,000
|
$
|
3,000
|
$
|
140,735
|
—
|
|||||||||||||
|
Operating Leases (1)
|
22,828
|
17,926
|
14,454
|
10,164
|
5,613
|
8,264
|
||||||||||||||||||
|
Non-cancellable purchase obligations (2)
|
23,644
|
2,196
|
1,200
|
88
|
—
|
—
|
||||||||||||||||||
|
Total Contractual Obligations
|
$
|
49,472
|
$
|
23,122
|
$
|
18,654
|
$
|
13,252
|
$
|
146,348
|
$
|
8,264
|
||||||||||||
| (1) |
Represents future minimum lease commitments under non-cancellable operating lease agreements.
|
| (2) |
Primarily represents non-cancellable amounts for contractual commitments in respect of software and information technology.
|
The commitment amounts in the table above are associated with contracts that are enforceable and legally binding and that specify all significant terms, including fixed or minimum services to
be used, fixed, minimum or variable price provisions, and the approximate timing of the actions under the contracts. The table does not include obligations under agreements that we can cancel without a significant penalty. The table above
does not reflect any reduction for prepaid obligations as of December 31, 2023. As of December 31, 2023, we have a provision related to unrecognized tax benefit liabilities totaling $8.2 million and other provisions related to severance pay
and contribution plans, which have been excluded from the table above as we do not believe it is practicable to make reliable estimates of the periods in which payments for these obligations will be made.
Other Commercial Commitments
In the ordinary course of our business, we enter into agreements with certain digital properties, under which, in some cases we agree to pay them a guaranteed amount, generally per thousand
page views on a monthly basis. These agreements could cause a gross loss on digital property accounts in which the guarantee is higher than the actual revenue generated. These contracts generally range in duration from 2 to 5 years, though
some can be shorter or longer. These contracts are not included in the table above.
Recent Accounting Pronouncements
See the section titled “Summary of Significant Accounting Policies” in Note 2 of Notes to the Consolidated Financial Statements in this Annual Report for more information.
Critical Accounting Estimates
Our discussion and analysis of financial condition results of operations are based upon our consolidated financial statements included elsewhere in this report. The preparation of our
consolidated financial statements in accordance with GAAP requires us to make estimates and assumptions that affect the reported amounts of assets, liabilities, revenue and expenses. We base our estimates on past experience and other
assumptions that we believe are reasonable under the circumstances and we evaluate these estimates on an ongoing basis. Actual results may differ from those estimates.
Our critical accounting policies are those that materially affect our consolidated financial statements and involve difficult, subjective or complex
judgments by management. A thorough understanding of these critical accounting policies is essential when reviewing our consolidated financial statements. We believe that the critical accounting policies listed below involve the most
difficult management decisions because they require the use of significant estimates and assumptions as described above.
Please see Note 2 of Notes to the Consolidated Financial Statements included in this Annual Report for a summary of significant accounting policies and the effect on our financial statements.
Revenue Recognition
We recognize revenues when we transfer control of promised services directly to our customers, which we collectively refer to as our Advertisers, in an amount that reflects the consideration
to which we expect to be entitled to in exchange for those services.
The determination of whether revenue should be reported gross of amounts billed to Advertisers (gross basis) or net of payments to digital properties partners (net basis) requires significant
judgment and is based on management assessment of whether we are acting as the principal or an agent in the transaction. In this assessment, we consider if we obtain control of the specified goods or services before they are transferred to
the customer, as well as other indicators such as the party primarily responsible for fulfillment, inventory risk, and discretion in establishing price. The assessment of whether we are considered the principal or the agent in a transaction
could impact our revenue and cost of revenue recognized on the consolidated statements of income (loss).
Internal-Use Software Development Costs
Costs incurred to develop internal-use software are capitalized and amortized over the estimated useful life of the software, which is generally three years. In accordance with ASC 350-40,
“Internal-Use Software”, capitalization of costs to develop internal-use software begins when preliminary development efforts are successfully completed, we have committed project funding and it is probable that the project will be completed,
and the software will be used as intended. Costs related to the design or maintenance of internal-use software are expensed as incurred.
We periodically review internal-use software costs to determine whether the projects will be completed, placed in service, removed from service, or replaced by other internally developed or
third-party software. If the asset is not expected to provide any future benefit, the asset is retired, and any unamortized cost is expensed.
When events or changes in circumstances require, we assess the likelihood of recovering the cost of internal-use software. If the net book value is not expected to be fully recoverable,
internal-use software would be impaired to its fair value. Measurement of any impairment loss is based on the excess of the carrying value of the asset over the fair value.
Share-Based Compensation
We recognize the cost of share-based awards granted to employees and directors based on the estimated grant-date fair value of the awards. We elected to recognize share-based compensation
costs on a straight-line method for awards subject to graded vesting based only on a service condition and the accelerated method for awards that are subject to a performance condition. The compensation expense associated with performance
based RSUs is adjusted based on the probability of achieving performance targets. Forfeitures are accounted for as they occur.
For additional information regarding share-based compensation and the assumptions used for determining the fair value of Share options awards, refer to Note 2 and Note 15 of Notes to the
Consolidated Financial Statements in this Annual Report.
Accounting for business combinations requires us to make significant estimates and assumptions in determining the fair values of assets acquired and liabilities assumed, especially with
respect to intangible assets. Critical estimates in valuing the acquired intangible assets include, but are not limited to, the appropriate valuation methodology and the prospective financial information underlying the valuation, e.g.,
projected revenues, revenues growth rates, operating margins including the appropriate weighted-average cost of capital. Although we believe the assumptions and estimates we have made in the past have been reasonable and appropriate, they are
based, in part, on historical experience and information obtained from management of the acquired companies and are inherently uncertain.
Goodwill
Goodwill represents the excess of the aggregate fair value of the consideration transferred in a business combination over the fair value of the assets acquired, net of liabilities assumed.
We determine the estimated fair values of assets acquired and liabilities assumed after review and consideration of relevant information including discounted cash flows, quoted market prices, and estimates made by management.
Goodwill is not amortized, but is subject to impairment testing. We test goodwill for impairment as of December 31 of each year, or more frequently if events or changes in circumstances
indicate that this asset may be impaired.
For the purposes of impairment testing, we have determined that we have one reporting unit. When performing the annual goodwill impairment testing, we either conduct a qualitative assessment
to determine whether it is more likely than not that the asset is impaired, or we elect to bypass this qualitative assessment and perform a quantitative test for impairment. Under the qualitative assessment, we consider both positive and
negative factors, including macroeconomic conditions, industry events, financial performance and other changes, and make a determination of whether it is more likely than not that the fair value of goodwill is less than its carrying amount.
If, after assessing the qualitative factors, we determine it is more likely than not the asset is impaired, we then perform a quantitative test in which the estimated fair value of the reporting unit is compared with its carrying amount,
including goodwill. If a quantitative analysis is necessary, we compare the fair value of our reporting unit to our carrying value. We determine the estimated fair value based on a different approach including income approach (discounted cash
flows) and market approach (EV to EBITDA). Market approach and income approach are common measures used to value businesses in our industry. If the estimated fair value exceeds carrying value, goodwill is considered not to be impaired and no
additional steps are necessary. However, if the carrying amount exceeds estimated fair value, an impairment loss is recognized in an amount equal to the excess, limited to the amount of goodwill allocated to the reporting unit.
The annual evaluation of goodwill requires the use of estimates about future operating results, valuation multiples, and discount rates to determine their fair value. Changes in these
assumptions can materially affect these estimates. Thus, to the extent the revenues volumes deteriorate in the near future, discount rates increase significantly, or we do not meet our projected performance, we could have impairments to
record in the next twelve months, and such impairments could be material.
Impairment of long-lived assets
We assess the recoverability of our long-lived assets, whenever events or changes in circumstances indicate that their carrying value may not be recoverable, in accordance with ASC 360,
“Property, Plant and Equipment”.
Recoverability of a long-lived asset is measured by comparing the carrying value of the asset group to the projected undiscounted cash flows over their remaining lives. If the carrying value
exceeds the projected undiscounted cash flows, an impairment loss is recognized. Impairment equals the amount by which the carrying value exceeds estimated fair value. An impairment loss is charged to consolidated statements of income (loss)
in the period in which management determines such impairment.
The preparation of cash flow projections for use in any impairment indicators test or fair value analysis requires management to make critical estimates, judgments and assumptions with
regards to estimated future cash flows, as they are, by their nature, subjective and actual results may differ materially from such estimates. Cash flow estimates are unpredictable and inherently uncertain, since they are based on the current
regulatory, political and economic climates, recent operating information and projections. Such estimates could be negatively impacted by changes in federal, state or local regulations, economic downturns, competition, events affecting
various forms of travel and access to our properties, and other factors. If our estimates of future cash flows are not met or if there are changes in significant assumptions and judgments used in the estimation process, we may have to record
impairment charges in the future.
Income Taxes
We are subject to income taxes in Israel, the U.S., and other foreign jurisdictions. Significant judgment is required in determining the provision for income taxes and income tax assets and
liabilities, including evaluating uncertainties in the application of accounting principles and complex tax laws. We recognize and measure benefits for uncertain tax positions using a two-step approach. The first step is to determine whether
it is more likely than not that a tax position will be sustained upon examination, including the resolution of any related appeals or litigation based on the technical merits of that position. The second step is to measure a tax position that
meets the more-likely-than-not threshold to determine the amount of benefit to be recognized in the financial statements. We evaluate uncertain tax positions on a quarterly basis, based upon a number of factors, including changes in facts or
circumstances, changes in tax law, correspondence with tax authorities during the course of audits, and effective settlement of audit issues.
Significant judgment is also required in determining any valuation allowance against deferred tax assets. In assessing whether it is more likely than not that some portion or all of the
deferred tax assets will not be realized, we consider all available evidence, including projected future taxable income, tax planning strategies, and past operating results. In the event that we change our determination, we will adjust our
valuation allowance with a corresponding impact to the provision for income taxes in the period in which such determination is made.
| ITEM 7A: |
QUANTITATIVE AND QUALITATIVE DISCLOSURES ABOUT MARKET RISK
|
Market risk represents the risk of loss that may impact our financial position because of adverse changes in financial market prices and rates. Our market risk exposure is primarily a result
of exposure resulting from potential changes in inflation, exchange rates or interest rates. We do not hold financial instruments for trading purposes. We are also subject to the credit risk of counterparties to our various commercial
agreements.
Foreign Currency Exchange Risk
A 10% increase or decrease of the NIS, Euro, British pound sterling, or the Japanese yen against the U.S. dollar would have impacted the consolidated statements of loss as follows:
|
Operating income (loss) impact
Year ended
December 31,
|
||||||||||||||||||||||||
|
2023
|
2022
|
2021
|
||||||||||||||||||||||
|
(dollars in thousands)
|
||||||||||||||||||||||||
|
+10%
|
|
-10%
|
|
+10%
|
|
-10%
|
|
+10%
|
|
-10%
|
|
|||||||||||||
|
NIS/USD
|
$
|
1,054
|
$
|
(1,054
|
)
|
$
|
(5,168
|
)
|
$
|
5,168
|
$
|
(7,542
|
)
|
$
|
7,542
|
|||||||||
|
EUR/USD
|
$
|
923
|
$
|
(923
|
)
|
$
|
4,177
|
$
|
(4,177
|
)
|
$
|
5,886
|
$
|
(5,886
|
)
|
|||||||||
|
GBP/USD
|
$
|
(663
|
)
|
$
|
663
|
$
|
(4,143
|
)
|
$
|
4,143
|
$
|
(4,685
|
)
|
$
|
4,685
|
|||||||||
|
JPY/USD
|
$
|
997
|
$
|
(997
|
)
|
$
|
1,881
|
$
|
(1,881
|
)
|
$
|
1,966
|
$
|
(1,966
|
)
|
|||||||||
To reduce the impact of foreign exchange risks associated with forecasted future cash flows related to payroll expenses and other personnel related costs denominated in NIS and their
volatility, we have established a hedging program and use derivative financial instruments, specifically foreign currency forward contracts, call and put options, to manage exposure to foreign currency risks. These derivative instruments are
designated as cash flow hedges.
Our cash, cash equivalents, and short-term investments are held mainly for working capital purposes. The primary objectives of our investment activities are the preservation of capital and
the fulfillment of liquidity needs. We do not enter into investments for trading or speculative purposes. Such interest-earning instruments carry a degree of interest rate risk. Changes in interest rates affect the interest earned on our cash
and cash equivalents and short-term investments, and the market value of those securities.
Interest rate risk is the risk that the value or yield of fixed-income investments may decline if interest rates change.
As of December 31, 2023, we had $152.7 million of outstanding borrowings under our long-term loan with a variable interest rate. See Liquidity and Capital Resources for information regarding
our incremental revolving credit facility amendment.
Fluctuations in interest rates may impact the level of interest expense recorded on future borrowings. We do not enter into derivative financial instruments, including interest rate swaps, to
effectively hedge the effect of interest rate changes or for speculative purposes.
Inflation Risk
We do not believe that inflation has had a material effect on our business, financial condition, or results of operations, other than its impact on the general economy. However, if our
costs, in particular labor, sales and marketing, information system, technology and utilities costs, were to become subject to significant inflationary pressures, we might not be able to effectively mitigate such higher costs. Our inability
or failure to do so could adversely affect our business, financial condition, and results of operations.
Credit Risk
Credit risk with respect to accounts receivable is generally not significant, as we routinely assess the creditworthiness of our partners and Advertisers. Historically, we generally have not
experienced any material losses related to receivables from Advertisers during the years ended December 31, 2023, 2022 and 2021. We do not require collateral. Due to these factors, no additional credit risk beyond amounts provided for
collection losses is believed by management to be probable in our accounts receivable. In addition, we try to reduce the credit exposures of our accounts receivable by credit limits and credit insurance for many of our customers. However,
there can be no assurance that our efforts to identify potential credit risks will be successful.
Our cash, cash equivalents and restricted deposits are invested in major banks mostly in the United States, United Kingdom and Israel. In the United States and United Kingdom, our deposits
are maintained with commercial banks, which are insured by the U.S. Federal Deposit Insurance Corporation (“FDIC”) and Financial Services Compensation Scheme (“FSCS”), which is authorized by the Bank of England (acting in its capacity as the
Prudential Regulation Authority), respectively. In Israel, commercial banks do not have government-sponsored deposit insurance. As of December 31, 2023, we maintained cash balances with U.S. and United Kingdom banks that significantly exceed
FDIC and FSCS insurance limits and expect we will continue to do so. As of December 31, 2023, we have not experienced credit losses related to these balances. We regularly monitor bank financial strength and other factors in determining where
to maintain cash deposits but may not be able to fully mitigate the risk of possible bank failures.
Our short-term investments, which were $5.7 million as of December 31, 2023, are investments in marketable securities with high credit ratings as required by our investment policy and are not
insured or guaranteed.
Our derivatives expose us to credit risk to the extent that the counterparties may be unable to meet the terms of the agreement. We seek to mitigate such risk by limiting our counterparties
to major financial institutions and by spreading the risk across a number of major financial institutions. However, failure of one or more of these financial institutions is possible and could result in losses.
We have provided a summary of our significant accounting policies, estimates and judgments in Note 2 of Notes to the Consolidated Financial Statements in this Annual Report. The following
critical accounting discussion pertains to accounting policies management believes are most critical to the portrayal of our historical financial condition and results of operations and that require significant, difficult, subjective or
complex judgments. Other companies in similar businesses may use different estimation policies and methodologies, which may impact the comparability of our financial condition, results of operations and cash flows to those of other companies.
| ITEM 8: | FINANCIAL STATEMENTS AND SUPPLEMENTARY DATA |
TABOOLA.COM LTD.
CONSOLIDATED FINANCIAL STATEMENTS
AS OF DECEMBER 31, 2023
INDEX
- - - - - - - - - - - - - - - - -
 |
Kost Forer Gabbay & Kasierer
144 Menachem Begin Road, Building A,
Tel-Aviv 6492102, Israel
|
Tel: +972-3-6232525
Fax: +972-3-5622555
ey.com
|
To the Shareholders and the Board of Directors of Taboola.com Ltd.
Opinion on the Financial Statements
We have audited the accompanying consolidated balance
sheets of Taboola.com Ltd. (the “Company”) as of December 31, 2023 and 2022, the related consolidated statements of loss, comprehensive loss, convertible preferred shares and shareholders’ equity and cash flows for each of the three years in the
period ended December 31, 2023, and the related notes (collectively referred to as the “consolidated financial statements”). In our opinion, the consolidated financial statements present fairly, in all material respects, the financial position of
the Company at December 31, 2023 and 2022, and the results of its operations and its cash flows for each of the three years in the period ended December 31, 2023, in conformity with U.S. generally accepted accounting principles.
We also have audited, in accordance with the standards of the Public Company Accounting Oversight Board (United States) (PCAOB), the Company’s
internal control over financial reporting as of December 31, 2023, based on criteria established in Internal Control-Integrated Framework issued by the Committee of Sponsoring Organizations of the Treadway Commission (2013 framework), and our
report dated February 28, 2024, expressed an unqualified opinion thereon.
Basis for Opinion
These financial statements are the responsibility of the Company’s management. Our responsibility is to express an opinion on the Company’s
financial statements based on our audits. We are a public accounting firm registered with the PCAOB and are required to be independent with respect to the Company in accordance with the U.S. federal securities laws and the applicable rules and
regulations of the Securities and Exchange Commission and the PCAOB.
We conducted our audits in accordance with the standards of the PCAOB. Those standards require that we plan and perform the audit to obtain
reasonable assurance about whether the financial statements are free of material misstatement, whether due to error or fraud. Our audits included performing procedures to assess the risks of material misstatement of the financial statements,
whether due to error or fraud, and performing procedures that respond to those risks. Such procedures included examining, on a test basis, evidence regarding the amounts and disclosures in the financial statements. Our audits also included
evaluating the accounting principles used and significant estimates made by management, as well as evaluating the overall presentation of the financial statements. We believe that our audits provide a reasonable basis for our opinion.
Critical Audit Matter
The critical audit matter communicated below is a matter arising from the current period audit of the financial statements that was communicated
or required to be communicated to the audit committee and that: (1) relates to accounts or disclosures that are material to the financial statements and (2) involved our especially challenging, subjective or complex judgments. The communication
of the critical audit matter does not alter in any way our opinion on the consolidated financial statements, taken as a whole, and we are not, by communicating the critical audit matter below, providing a separate opinion on the critical audit
matter or on the accounts or disclosures to which it relates.
|
Revenue Recognition-principle versus agent
|
||
|
Description of the Matter
|
As described in Note 2 to the consolidated financial statements, the Company follows the guidance provided in ASC 606, Revenue from Contracts with Customers, for determining whether the Company is the principal or an agent in arrangements with its customers. This
determination depends on the facts and circumstances of each arrangement and, in some instances, involves significant judgment. The Company has determined that it acts as principal in the majority of its arrangements because it has the
ability to control and direct the specified ad placements before they are transferred to the customers. The Company further concluded that (i) it is primarily responsible for fulfilling the promise to provide the service in the
arrangement; and (ii) it has latitude in establishing the contract price with the advertisers. In addition, the Company has inventory risk on a portion of its multi-year agreement with digital properties. For those revenue arrangements
where the Company acts as an agent, revenues are recognized on a net basis.
Auditing the Company’s determination of whether revenue should be reported gross of amounts billed to advertisers (gross basis) or net of
payments to digital properties partners (net basis) requires a high degree of auditor judgment due to the subjectivity in determining whether the Company is principal in its arrangements. These judgments have a significant impact on the
presentation and disclosure of the Company’s revenue in its financial statements.
|
|
How We Addressed the Matter in Our Audit
|
Our audit procedures related to the Company’s revenue transactions included, among others, testing the design and operating effectiveness
of management’s controls over the determination of principal versus agent recognition in its arrangements with advertisers and digital properties vendors for traffic acquisition, evaluating the Company’s assessment of the indicators of
control over the promised service, which included determining whether the Company was primarily responsible for fulfilling the promised service, has discretion in establishing pricing and has inventory risk on a portion of its contracts
with digital properties. We also reviewed on a sample basis, the arrangement terms, both with customers and digital properties vendors for traffic acquisition and assessed the impact of those terms and attributes on revenue
presentation. In addition, we assessed the appropriateness of the related disclosures in the consolidated financial statements.
|
/s/ Kost Forer Gabbay & Kasierer
A Member of EY Global
We have served as the Company’s auditor since 2014.
Tel-Aviv, Israel
February 28, 2024
|
|
Kost Forer Gabbay & Kasierer
144 Menachem Begin Road, Building A,
Tel-Aviv 6492102, Israel
|
Tel: +972-3-6232525
Fax: +972-3-5622555
ey.com |
Report of Independent Registered Public Accounting Firm
To the Shareholders and the Board of Directors of Taboola.com Ltd.
Opinion on Internal Control Over Financial Reporting
We have audited Taboola.com Ltd’s. internal control over financial reporting as of December 31, 2023, based on criteria established in
Internal Control—Integrated Framework issued by the Committee of Sponsoring Organizations of the Treadway Commission (2013 framework), (the COSO criteria). In our opinion, Taboola.com Ltd. (the “Company”) maintained, in all material respects,
effective internal control over financial reporting as of December 31, 2023, based on the COSO criteria.
We also have audited, in accordance with the standards of the Public Company Accounting Oversight Board (United States) (PCAOB), the consolidated
balance sheets of the Company as of December 31, 2023 and 2022, the related consolidated statements of loss, comprehensive loss, convertible preferred shares and shareholders’ equity and cash flows for each of the three years in the period ended
December 31, 2023, and the related notes and our report dated February 28, 2024, expressed an unqualified opinion thereon.
Basis for Opinion
The Company’s management is responsible for maintaining
effective internal control over financial reporting and for its assessment of the effectiveness of internal control over financial reporting included in the accompanying Management’s Annual Report on Internal Control over Financial Reporting. Our
responsibility is to express an opinion on the Company’s internal control over financial reporting based on our audit. We are a public accounting firm registered with the PCAOB and are required to be independent with respect to the Company in
accordance with the U.S. federal securities laws and the applicable rules and regulations of the Securities and Exchange Commission and the PCAOB.
We conducted our audit in accordance with the standards of the PCAOB. Those standards require that we plan and perform the audit to obtain
reasonable assurance about whether effective internal control over financial reporting was maintained in all material respects.
Our audit included obtaining an understanding of internal control over financial reporting, assessing the risk that a material weakness exists,
testing and evaluating the design and operating effectiveness of internal control based on the assessed risk, and performing such other procedures as we
considered necessary in the circumstances. We believe that our audit provides a reasonable basis for our opinion.
Definition and Limitations of Internal Control Over Financial Reporting
A company’s internal control over financial reporting is a process designed to provide reasonable assurance regarding the reliability of
financial reporting and the preparation of financial statements for external purposes in accordance with generally accepted accounting principles. A company’s internal control over financial reporting includes those policies and procedures that
(1) pertain to the maintenance of records that, in reasonable detail, accurately and fairly reflect the transactions and dispositions of the assets of the company; (2) provide reasonable assurance that transactions are recorded as necessary to
permit preparation of financial statements in accordance with generally accepted accounting principles, and that receipts and expenditures of the company are being made only in accordance with authorizations of management and directors of the
company; and (3) provide reasonable assurance regarding prevention or timely detection of unauthorized acquisition, use, or disposition of the company’s assets that could have a material effect on the financial statements.
Because of its inherent limitations, internal control over financial reporting may not prevent or detect misstatements. Also, projections of any
evaluation of effectiveness to future periods are subject to the risk that controls may become inadequate because of changes in conditions, or that the degree of compliance with the policies or procedures may deteriorate.
/s/ Kost Forer Gabbay & Kasierer
A Member of EY Global
U.S. dollars in thousands, except share and per share data
| December 31, | December 31, | |||||||
|
2023
|
2022
|
|||||||
|
ASSETS
|
||||||||
|
CURRENT ASSETS
|
||||||||
|
Cash and cash equivalents
|
$
|
|
$
|
|
||||
| Short-term investments | ||||||||
|
Restricted deposits
|
|
|
||||||
|
Trade receivables (net of allowance for credit losses of $
|
|
|
||||||
|
Prepaid expenses and other current assets
|
|
|
||||||
|
Total current assets
|
|
|
||||||
|
NON-CURRENT ASSETS
|
||||||||
|
Long-term prepaid expenses
|
|
|
||||||
|
Commercial agreement asset
|
||||||||
|
Restricted deposits
|
|
|
||||||
|
Deferred tax assets, net
|
|
|
||||||
|
Operating lease right of use assets
|
|
|
||||||
|
Property and equipment, net
|
|
|
||||||
|
Intangible assets, net
|
|
|
||||||
|
Goodwill
|
|
|
||||||
|
Total non-current assets
|
|
|
||||||
|
Total assets
|
$
|
|
$
|
|
||||
|
LIABILITIES AND SHAREHOLDERS’ EQUITY
|
||||||||
|
CURRENT LIABILITIES
|
||||||||
|
Trade payables (Note 19)
|
$
|
|
$
|
|
||||
|
Short-term operating lease liabilities
|
|
|
||||||
|
Accrued expenses and other current liabilities
|
|
|
||||||
|
Current maturities of long-term loan
|
|
|
||||||
|
Total current liabilities
|
|
|
||||||
|
LONG-TERM LIABILITIES
|
||||||||
|
Long-term loan, net of current maturities
|
||||||||
|
Long-term operating lease liabilities
|
||||||||
|
Warrants liability
|
||||||||
|
Deferred tax liabilities, net
|
||||||||
|
Other long-term liabilities
|
||||||||
|
Total long-term liabilities
|
|
|
||||||
|
COMMITMENTS AND CONTINGENCIES (Note 18)
|
||||||||
|
SHAREHOLDERS’ EQUITY
|
||||||||
|
Ordinary shares with
|
|
|
||||||
|
Non-voting Ordinary shares with
|
||||||||
|
Treasury Ordinary shares, at cost -
|
( |
) | ||||||
|
Additional paid-in capital
|
|
|
||||||
|
Accumulated other comprehensive income (loss)
|
|
(
|
)
|
|||||
| Accumulated deficit | ( |
) | ( |
) | ||||
|
Total shareholders’ equity
|
|
|
||||||
|
Total liabilities and shareholders’ equity
|
$
|
|
$
|
|
||||
The accompanying notes are an integral part of these consolidated financial statements.
U.S. dollars in thousands, except share and per share data
|
Year ended
December 31,
|
||||||||||||
|
2023
|
2022
|
2021
|
||||||||||
|
Revenues (Note 19)
|
$ | $ | $ | |||||||||
|
Cost of revenues:
|
||||||||||||
|
Traffic acquisition cost (Note 19)
|
||||||||||||
|
Other cost of revenues
|
||||||||||||
|
Total cost of revenues
|
||||||||||||
|
Gross profit
|
||||||||||||
|
Operating expenses:
|
||||||||||||
|
Research and development
|
||||||||||||
|
Sales and marketing
|
||||||||||||
|
General and administrative
|
||||||||||||
|
Total operating expenses
|
||||||||||||
|
Operating loss
|
( |
) | ( |
) | ( |
) | ||||||
|
Finance income (expenses), net
|
( |
) | ||||||||||
|
Loss before income taxes expenses
|
(
|
)
|
(
|
)
|
(
|
)
|
||||||
|
Income tax expenses
|
(
|
)
|
(
|
)
|
(
|
)
|
||||||
|
Net loss
|
$
|
(
|
)
|
$
|
(
|
)
|
$
|
(
|
)
|
|||
| Less: Undistributed earnings allocated to participating securities |
( |
) | ||||||||||
| Net loss attributable to Ordinary and Non-voting Ordinary shares |
$ | ( |
) | $ | ( |
) | $ | ( |
) | |||
|
Net loss per share attributable to Ordinary and Non-voting Ordinary shareholders, basic and diluted
|
$ | ( |
) | $ | ( |
) | $ | ( |
) | |||
The accompanying notes are an integral part of these consolidated financial statements.
U.S. dollars in thousands
|
Year ended
December 31,
|
||||||||||||
|
2023
|
2022
|
2021
|
||||||||||
|
Net loss
|
$
|
(
|
)
|
$
|
(
|
)
|
$
|
(
|
)
|
|||
|
Other comprehensive income (loss):
|
||||||||||||
|
Unrealized gains (losses) on available-for-sale marketable securities, net
|
|
(
|
)
|
|
||||||||
|
Unrealized gains (losses) on derivative instruments, net
|
|
(
|
)
|
|
||||||||
|
Other comprehensive income (loss)
|
|
(
|
)
|
|
||||||||
|
Comprehensive loss
|
$
|
(
|
)
|
$
|
(
|
)
|
$
|
(
|
)
|
|||
The accompanying notes are an integral part of these consolidated financial statements.
U.S. dollars in thousands, except share and per share data
|
Convertible Preferred
shares
|
Non-voting
Ordinary shares
|
Ordinary shares
|
Treasury
Ordinary
|
Additional
paid-in
|
Accumulated
other
comprehensive
|
Accumulated
|
Total
Shareholders’
|
|||||||||||||||||||||||||||||||||||||
|
Number
|
Amount
|
Number | Amount |
Number
|
Amount
|
shares |
capital
|
income (loss) |
deficit
|
equity
|
||||||||||||||||||||||||||||||||||
|
Balance as of January 1, 2021
|
|
$
|
|
$ |
|
$
|
|
$ |
$
|
|
$ |
$
|
(
|
)
|
$
|
|
||||||||||||||||||||||||||||
|
Issuance of Ordinary shares as part of the Merger and PIPE transaction
|
— | — | — | — | — | — | — | — | ||||||||||||||||||||||||||||||||||||
|
Conversion of Preferred shares to Ordinary shares
|
( |
) | ( |
) | — | — | — | — | — | — | ||||||||||||||||||||||||||||||||||
|
Issuance of Ordinary shares related to business combination
|
— | — | — | — | — | — | — | — | ||||||||||||||||||||||||||||||||||||
|
Share-based compensation expenses
|
— | — | — | — | — | — | — | — | — | |||||||||||||||||||||||||||||||||||
|
Exercise of options and vested RSUs
|
— | — | — | — | — | — | — | — | ||||||||||||||||||||||||||||||||||||
|
Payments of tax withholding for share-based compensation
|
— | — | — | — | — | — | — | ( |
) | — | — | ( |
) | |||||||||||||||||||||||||||||||
|
Net loss
|
—
|
—
|
— | — |
—
|
—
|
— |
—
|
— |
(
|
)
|
(
|
)
|
|||||||||||||||||||||||||||||||
|
Balance as of December 31, 2021
|
|
$
|
|
$ |
|
$
|
|
$ |
$
|
|
$ |
$
|
(
|
)
|
$
|
|
||||||||||||||||||||||||||||
|
Share-based compensation expenses
|
—
|
—
|
— | — |
—
|
—
|
— |
|
— |
—
|
|
|||||||||||||||||||||||||||||||||
|
Exercise of options and vested RSUs
|
— | — | — | — | — | — | — |
—
|
||||||||||||||||||||||||||||||||||||
|
Connexity issuance of Holdback
|
— | — | — | — | — | — | — | — | — | |||||||||||||||||||||||||||||||||||
|
Payments of tax withholding for share-based compensation
|
—
|
—
|
— | — |
—
|
—
|
— | ( |
) | — | — | ( |
) | |||||||||||||||||||||||||||||||
|
Other comprehensive loss
|
— | — | — | — | — | — | — | — | ( |
) | — | ( |
) | |||||||||||||||||||||||||||||||
|
Net loss
|
—
|
—
|
— | — |
—
|
—
|
— |
—
|
— |
(
|
)
|
(
|
)
|
|||||||||||||||||||||||||||||||
|
Balance as of December 31, 2022
|
|
$
|
|
— | $ |
— |
|
$
|
|
$ |
— |
$
|
|
$ | ( |
) |
$
|
(
|
)
|
$
|
|
|||||||||||||||||||||||
|
Share-based compensation expenses
|
—
|
—
|
— | — |
—
|
—
|
— |
|
— |
—
|
|
|||||||||||||||||||||||||||||||||
|
Repurchase of Ordinary shares
|
— | — | — | — | ( |
) | — | ( |
) | — | — | — | ( |
) | ||||||||||||||||||||||||||||||
|
Exercise of options and vested RSUs
|
—
|
—
|
— | — |
|
—
|
— |
|
— |
—
|
|
|||||||||||||||||||||||||||||||||
|
Connexity issuance of Holdback
|
— | — | — | — | — | — | — | — | — | |||||||||||||||||||||||||||||||||||
|
Issuance of Ordinary shares and Non-voting Ordinary shares related to Commercial agreement
|
— | — | — | — | — | — | — | |||||||||||||||||||||||||||||||||||||
|
Payments of tax withholding for share-based compensation
|
— | — | — | — | — | — | — | ( |
) | — | — | ( |
) | |||||||||||||||||||||||||||||||
|
Other comprehensive income
|
— | — | — | — | — | — | — | — | — | |||||||||||||||||||||||||||||||||||
|
Net loss
|
—
|
—
|
— | — |
—
|
—
|
— |
—
|
— |
(
|
)
|
(
|
)
|
|||||||||||||||||||||||||||||||
|
Balance as of December 31, 2023
|
|
$
|
|
$ |
|
$
|
|
$ | ( |
) |
$
|
|
$ |
$
|
(
|
)
|
$
|
|
||||||||||||||||||||||||||
The accompanying notes are an integral part of these consolidated financial statements.
|
Year ended
December 31,
|
||||||||||||
|
2023
|
2022
|
2021
|
||||||||||
|
Cash flows from operating activities
|
||||||||||||
|
Net loss
|
$
|
(
|
)
|
$
|
(
|
)
|
$
|
(
|
)
|
|||
|
Adjustments to reconcile net loss to net cash flows provided by operating activities:
|
||||||||||||
|
Depreciation and amortization
|
|
|
|
|||||||||
|
Share-based compensation expenses
|
|
|
|
|||||||||
|
Net loss (gain) from financing expenses
|
(
|
)
|
|
(
|
)
|
|||||||
|
Revaluation of the Warrants liability
|
(
|
)
|
(
|
)
|
(
|
)
|
||||||
|
Amortization of loan and credit facility issuance costs
|
||||||||||||
|
Amortization of premium and accretion of discount on short-term investments, net
|
( |
) | ( |
) | ||||||||
|
Loss from disposal of property and equipment
|
|
|
||||||||||
|
Change in operating assets and liabilities:
|
||||||||||||
|
Increase in trade receivables, net
|
(
|
)
|
(
|
)
|
(
|
)
|
||||||
|
Decrease (increase) in prepaid expenses and other current assets and long-term prepaid expenses
|
|
(
|
)
|
(
|
)
|
|||||||
|
Increase (decrease) in trade payables
|
|
(
|
)
|
|
||||||||
|
Increase (decrease) in accrued expenses and other current liabilities and other long-term liabilities
|
|
(
|
)
|
|
||||||||
|
Decrease in deferred taxes, net
|
(
|
)
|
(
|
)
|
(
|
)
|
||||||
|
Change in operating lease right of use assets
|
|
|
|
|||||||||
|
Change in operating lease liabilities
|
(
|
)
|
(
|
)
|
(
|
)
|
||||||
|
Net cash provided by operating activities
|
|
|
|
|||||||||
|
Cash flows from investing activities
|
||||||||||||
|
Purchase of property and equipment, including capitalized internal-use software
|
(
|
)
|
(
|
)
|
(
|
)
|
||||||
|
Cash paid in connection with acquisitions, net of cash acquired
|
|
(
|
)
|
(
|
)
|
|||||||
|
Proceeds from (investment in) restricted deposits
|
(
|
)
|
|
|
||||||||
|
Proceeds from maturities of short-term investments
|
||||||||||||
|
Purchase of short-term investments
|
( |
) | ( |
) | ||||||||
|
Net cash provided by (used in) investing activities
|
|
(
|
)
|
(
|
)
|
|||||||
|
Cash flows from financing activities
|
||||||||||||
|
Exercise of options and vested RSUs
|
|
|
|
|||||||||
|
Issuance of Ordinary shares, net of offering costs
|
|
|
|
|||||||||
|
Payment of tax withholding for share-based compensation expenses
|
(
|
)
|
(
|
)
|
(
|
)
|
||||||
|
Repurchase of Ordinary shares
|
( |
) | ||||||||||
|
Proceeds from long-term loan, net of debt issuance costs
|
|
|
|
|||||||||
|
Repayment of long-term loan
|
(
|
)
|
(
|
)
|
(
|
)
|
||||||
|
Costs associated with entering into a revolving credit facility
|
( |
) | ||||||||||
|
Issuance of Warrants
|
||||||||||||
|
Net cash provided by (used in) financing activities
|
(
|
)
|
(
|
)
|
|
|||||||
|
Exchange rate differences on balances of cash and cash equivalents
|
|
(
|
)
|
|
||||||||
|
Increase (decrease) in cash and cash equivalents
|
|
(
|
)
|
|
||||||||
|
Cash and cash equivalents - at the beginning of the period
|
|
|
|
|||||||||
|
Cash and cash equivalents - at the end of the period
|
$
|
|
$
|
|
$
|
|
||||||
The accompanying notes are an integral part of these consolidated financial statements.
CONSOLIDATED STATEMENTS OF CASH FLOWS
U.S. dollars in thousands
|
Year ended
December 31,
|
||||||||||||
|
2023
|
2022
|
2021
|
||||||||||
|
Supplemental disclosures of cash flow information:
|
||||||||||||
|
Cash paid during the year for:
|
||||||||||||
|
Income taxes
|
$
|
|
$
|
|
$
|
|
||||||
|
Interest
|
$
|
|
$
|
|
$
|
|
||||||
|
Non-cash investing and financing activities:
|
||||||||||||
|
Purchase of property and equipment, including capitalized internal-use software
|
$ | $ | $ | |||||||||
|
Share-based compensation included in capitalized internal-use software
|
$ | $ | $ | |||||||||
|
Creation of operating lease right-of-use assets
|
$ | $ | $ | |||||||||
|
Fair value of Ordinary shares issued as consideration of the acquisition
|
$ | $ | $ | |||||||||
|
Issuance of Ordinary shares and Non-voting Ordinary shares related to Commercial agreement
|
$ |
$ |
$ |
|||||||||
The accompanying notes are an integral part of these consolidated financial statements.
90
| NOTE 1:- |
GENERAL
|
|
a.
|
Taboola.com Ltd. (together with its subsidiaries, the “Company” or “Taboola”) was incorporated under the laws of the state of Israel on September 3, 2006. |
Taboola is a technology company that powers recommendations across the
Open Web with an artificial intelligence-based, algorithmic engine developed since the Company began operations in 2007. Taboola partners with websites, devices, and mobile apps (collectively referred to as “digital properties”), to
recommend editorial content and advertisements on the Open Web. Digital properties use Taboola’s technology platforms to achieve their business goals, such as driving new audiences to their sites and apps or increasing engagement with
existing audiences. Taboola also provides monetization opportunities to digital properties by surfacing paid recommendations by advertisers. Taboola is a business-to-business company with no competing consumer interests. Taboola empowers
advertisers to leverage its proprietary AI-powered recommendation platform to reach targeted audiences utilizing effective, native ad-formats across digital properties. As part of the Company e-Commerce offerings, it also syndicates its
retailer advertisers’ monetized product listings and links (clickable advertisements) into commerce content-oriented consumer experiences on both the Open Web and within the dominant traditional ad platforms. Taboola generates revenues when
people (consumers) click on, purchase from or, in some cases, view the ads that appear within its recommendation platform. The Company’s customers are the advertisers, merchants and affiliate networks that advertise on the Company’s
platform (“Advertisers”). Advertisers pay Taboola for those clicks, purchases or impressions, and Taboola shares a portion of the resulting revenue with the digital properties who display those ads.
|
b.
|
On June 29, 2021 (the “Transaction Date”) one of Taboola’s subsidiaries merged with and into ION Acquisition Corp. 1 Ltd. (“ION”), with ION continuing as the surviving company and becoming Taboola’s direct, wholly-owned subsidiary, which was accounted for as a recapitalization, with no goodwill or other intangible assets recorded, in accordance with U.S. GAAP (the “Business Combination”). The Business Combination was consummated under a merger agreement with ION dated January 25, 2021 (the “Merger Agreement”). |
As result of the Business Combination, the Company’s Ordinary shares, no par value per share (the “Ordinary shares”) and Public
Warrants (as defined in our Annual Report on Form 20-F for the year ended December 31, 2021 filed with the SEC on March 24, 2022), and together with the Private Warrants (as defined therein, the “Warrants”) began trading on The Nasdaq Global
Market LLC on June 30, 2021, among other things.
|
c.
|
In September 2021, the Company entered into a registration rights agreement under which the Company agreed, in accordance with the terms of the registration right agreement, to register the Company’s Ordinary shares issued to the Seller (as defined in Note 7) for resale under the Securities Act of 1933, as amended. |
|
d.
|
In November 2022, the Company announced it entered into a
|
91
| NOTE 1:- |
GENERAL (Cont.)
|
The Company accounts for the consideration paid to Yahoo (the “Commercial agreement asset”) as an up-front payment for Traffic
acquisition costs paid to the digital property partner, which is amortized over the shorter of respective contractual terms and the economic benefit period of the digital property arrangement.
The Company and Yahoo are still in the Commercial agreement transition period (as defined in the Commercial agreement),
consequently the exclusivity period has not begun. For the year ended December 31, 2023, the Company did not record amortization expenses of the Commercial agreement asset.
The Non-voting Ordinary shares are not entitled to vote on or receive notices with respect to any matter pursuant to our Articles and are
not entitled to vote or to be counted for purposes of determining whether any vote required under the Articles has been approved by the requisite percentage of voting securities or to be counted towards any quorum required pursuant to the
Articles. Except with respect to the voting rights and to the rights to receive notice of meetings of the shareholders, the Non-voting Ordinary shares have rights identical to the rights of Ordinary shares. In connection with the
transaction, the Company and Yahoo entered into an Investor Rights Agreement, under which, inter alia, Yahoo is entitled, in certain circumstances, to cause the Company to register the Ordinary shares issued to Yahoo for resale under the
Securities Act of 1933, as amended.
| NOTE 2:- |
SIGNIFICANT ACCOUNTING POLICIES
|
Basis of Presentation
The accompanying consolidated financial
statements have been prepared in accordance with United States Generally Accepted Accounting Principles (“U.S. GAAP”) and are denominated in U.S. dollars.
Principles of Consolidation
The consolidated financial statements include the accounts of the Company and its wholly owned
subsidiaries. All intercompany balances and transactions have been eliminated in consolidation.
Use of Estimates
The preparation of the consolidated financial statements in conformity with the U.S. GAAP requires management to make estimates and assumptions that affect the reported amounts of assets and liabilities and disclosure of
contingent assets and liabilities at the dates of the consolidated financial statements, and the reported amounts of revenues and expenses during the reporting period and accompanying notes. Actual results could differ from those estimates.
The Company’s management regularly evaluates its estimates, primarily those related to: (1) revenue recognition criteria, including the determination of revenue reporting as gross versus net in the Company’s revenue
arrangements, (2) allowances for credit losses, (3) operating lease assets and liabilities, including the incremental borrowing rate and terms and provisions of each lease, (4) the useful lives of its Commercial agreement asset, property and
equipment and capitalized software development costs, (5) income taxes, (6) assumptions used in the option pricing models to determine the fair value of share-based compensation (7) the fair value of financial assets and liabilities, including
the fair value of marketable securities, Private Warrants and derivative instruments (8) the fair value of acquired intangible assets and goodwill annual impairment test, and (9) the recognition and disclosure of contingent liabilities.
92
| NOTE 2:- |
SIGNIFICANT ACCOUNTING POLICIES (Cont.)
|
These estimates are based on historical data and experience, as well as various other factors that management believes to be reasonable under the circumstances; the results of which form the basis for making judgments about
the carrying value of assets and liabilities that are not readily apparent from other sources.
As of December 31, 2023, the impacts to the Company’s business due to geopolitical developments, such as the wars in Israel and Ukraine and other active or possible hostilities, and macroeconomic factors, such as rising
interest rates, inflation and changes in foreign currency exchange rates, continue to evolve. As events continue to evolve and additional information becomes available, the Company’s estimates may change materially in future periods.
Functional Currency
The Company’s functional currency is the U.S. dollars (“dollars”), as majority of the Company’s revenues and costs of
revenues are denominated in dollars. Accordingly, foreign currency assets and liabilities are remeasured into dollars at the end-of-period exchange rates except for non-monetary assets and liabilities, which are measured at historical exchange
rates. Revenue and expenses are remeasured each day at the exchange rate in effect on the day the transaction occurred or the average exchange rate in the month in accordance with ASC 830, “Foreign Currency Matters”. Gains or losses from foreign
currency exchange rate re-measurement and settlements are included in finance income (expenses), net in the consolidated statements of income (loss).
Cash and cash equivalents
Cash and cash equivalents consist of cash in banks and highly liquid marketable securities investments, money market account
and funds, commercial paper and corporate debt securities, with an original maturity of three months or less at the date of purchase and are readily convertible to known amounts of cash.
Restricted Deposits
The Company’s restricted deposits primarily consist of bank deposits collateralizing the Company’s operating leases.
Fair Value Measurements
Fair value is defined as the exchange price that would be received from the sale of an asset or paid to transfer a liability,
considering the principal or most advantageous market in which it would transact and assumptions that market participants would use when pricing the asset or liability, in an orderly transaction between market participants at the measurement date.
The Company measures financial assets and liabilities at fair value at each reporting period using a fair value hierarchy which requires the Company to maximize the use of observable inputs and minimize the use of unobservable inputs when measuring
fair value. A financial instrument’s classification within the fair value hierarchy is based upon the lowest level of input that is significant to the fair value measurement.
93
| NOTE 2:- |
SIGNIFICANT ACCOUNTING POLICIES (Cont.)
|
Three levels of inputs may be used to measure fair value:
| Level 1 - |
Observable inputs that reflect quoted prices (unadjusted) for identical assets or liabilities in active markets.
|
| Level 2 - |
Includes other inputs that are directly or indirectly observable in the marketplace.
|
| Level 3 - |
Unobservable inputs which are supported by little or no market activity.
|
Financial instruments consist of cash equivalents, restricted deposits, short-term investments, trade receivables, prepaid
expenses and other current assets, trade payables, accrued expenses and other current liabilities, Warrants liability and derivative financial instruments. Short-term investments, Warrants liability and derivative financial instruments are stated
at fair value on a recurring basis. Cash equivalents, restricted deposits, trade receivables, prepaid expenses and other current assets, trade payables, accrued expenses and other current liabilities, are stated at their carrying value, which
approximates their fair value due to the short time to the expected receipt or payment date.
Derivative Financial Instruments
The Company enters into foreign currency forward and put and
call option contracts with financial institutions to protect itself against the
foreign exchange risks, mainly exposure to changes in the exchange rate of the New Israeli Shekel (“NIS”) against the U.S. dollar that are associated with forecasted future cash flows related to salary expenses, for up to twelve months, as
part of the Company’s risk management strategy. The Company does not enter into derivative transactions for trading or speculative purposes.
In accordance with ASC 815, “Derivatives and Hedging”, the Company recognizes all derivatives on the consolidated balance
sheets at fair value. The accounting for changes in the fair value (i.e., gains or losses) of a derivative instrument depends on their intended use and their designation.
For derivative instruments that hedge the exposure to variability in expected future cash flows that are designated as cash
flow hedge, changes in the fair value of these derivatives are recorded in accumulated other comprehensive income (loss) as a component of shareholders’ equity in the consolidated balance sheets until the forecasted transaction occurs. Upon
occurrence, the Company reclassifies the related gains or losses on the derivative to the same financial statement line item in the consolidated statements of income (loss) to which the derivative relates. In case the Company discontinues cash
flow hedges, it records the related amount in finance income (expenses), net, on the consolidated statements of income (loss).
The Company accounts for its derivative financial instruments as either prepaid expenses and other current assets or accrued
expenses and other current liabilities in the consolidated balance sheets at their fair value.
Short-term investments
The Company’s short-term investments consist of marketable securities. The Company classifies its marketable securities as
available-for-sale at the time of purchase and reevaluates such classification at each balance sheet date. The Company may sell these securities at any time for use in current operations even if they have not yet reached maturity. As a result,
the Company classifies its marketable securities, including those with maturities beyond 12 months, as current assets in the consolidated balance sheets.
The Company carries these securities at fair value and records unrealized gains and losses, net of taxes, in accumulated
other comprehensive income (loss) as a component of shareholders’ equity, except for changes in allowance for expected credit losses, which are recorded in finance income (expenses), net.
94
| NOTE 2:- |
SIGNIFICANT ACCOUNTING POLICIES (Cont.)
|
The Company periodically evaluates its available-for-sale debt securities for impairment. If the amortized cost of an
individual security exceeds its fair value, the Company considers its intent to sell the security or whether it is more likely than not that it will be required to sell the security before recovery of its amortized basis. If either of these
criteria are met, the Company writes down the security to its fair value and records the impairment charge in finance income (expenses), net, in the consolidated statements of income (loss).
If neither of these criteria are met, the Company determines whether credit loss exists. Credit loss is estimated by
considering changes to the rating of the security by a rating agency, any adverse conditions specifically related to the security, as well as other factors.
Realized gains and losses on available-for-sale marketable securities are included in the consolidated statements of income
(loss).
Trade Receivables and Allowance for Credit Losses
Trade receivables are recorded at the invoiced amount and amounts for which revenue has been recognized but not invoiced, net
of allowance for credit losses. Payment terms and conditions vary by contract type, although terms generally include a requirement to pay within 30 days of the invoice.
The Company’s expected loss allowance methodology for accounts receivable is developed using historical collection experience
and current and future economic and market conditions.
The estimate of the amount that may not be collected is based on the geographic location, aging and customer financial
condition. Additionally, specific allowance amounts are established to record the appropriate provision for customers that have a higher probability of default. The Company writes-off receivables when they are deemed uncollectible, having exhausted
all collection efforts.
Concentrations of Credit Risk
Financial instruments that potentially subject the Company to concentrations of credit risk consist principally of cash, cash
equivalents, restricted deposits, short-term investments, trade receivables and other current assets, and derivative instruments.
The
Company’s cash, cash equivalents and restricted deposits are invested in major banks mostly in the United States, the United Kingdom and Israel. The Company maintains cash and cash equivalents with diverse financial institutions and monitors the
amount of credit exposure to each financial institution. In the United States and United Kingdom, the Company deposits are maintained with commercial banks, which are insured by the U.S. Federal Deposit Insurance Corporation (“FDIC”) and Financial
Services Compensation Scheme (“FSCS”), which is authorized by the Bank of England (acting in its capacity as the Prudential Regulation Authority), respectively. In Israel, commercial banks do not have government-sponsored deposit insurance. As of
December 31, 2023, we maintained cash balances with U.S. and United Kingdom banks that significantly exceed FDIC and FSCS insurance limits and expect we will continue to do so. As of December 31, 2023, the Company has not experienced credit losses
related to these balances.
The Company’s short-term investments are investments in marketable securities with high credit ratings as required by the
Company’s investment policy and are not insured or guaranteed.
95
| NOTE 2:- |
SIGNIFICANT ACCOUNTING POLICIES (Cont.)
|
The Company’s trade receivables are geographically diversified and derived mainly from sales in the United States, Israel,
Germany and United Kingdom. Concentration of credit risk with respect to trade receivables is limited by credit limits, ongoing credit evaluation and account monitoring procedures. The Company performs ongoing credit evaluations of its accounts
receivables and establishes an allowance for expected losses as necessary.
As of December 31, 2023 and 2022, no 10 % or more of accounts receivable. No 10 %
of total revenue for the periods presented.
The Company’s derivatives expose it to credit risk to the extent that the counterparties may be unable to meet the terms of
the agreement. The Company seeks to mitigate such risk by limiting its counterparties to major financial institutions and by spreading the risk across a number of major financial institutions.
Deferred Offering Costs
Deferred offering costs consist primarily of
accounting, legal, and other fees related to the Company’s Merger agreement. Following consummation of the Merger agreement and related transactions, the deferred offering costs were reclassified to shareholders’ equity and recorded against the
proceeds from the transaction. The Company capitalized $2,096
Leases
The Company accounts for its leases under ASU 2016-02, “Leases”. The Company determines if an arrangement is or contains a lease at inception. The Company has elected not to recognize short-term leases on
the balance sheet, nor separate lease and non-lease components and currently does not have any finance leases.
The operating lease operating lease right of use assets, or ROU assets, and related lease liability are initially measured at the present value of the future lease payments discounted using the Company’s
incremental borrowing rate, because the rate implicit in the Company’s leases is not readily determinable. The Company’s incremental borrowing rate is estimated to approximate the interest rate on similar terms and payments and in economic
environments where the leased asset is located.
Some of the Company’s leases contain one or more options to
extend. The exercise of lease renewal options is typically at the Company’s sole discretion. The Company considers various factors such as market conditions and the terms of any renewal options that may exist to determine whether it is
reasonably certain to exercise the options to extend the lease.
Some of the real estate leases
contain variable lease payments, including payments based on a Consumer Price Index (“CPI”). Variable lease payments based on a CPI are initially measured using the index in effect at lease adoption, and will not be subsequently adjusted, unless
the liability is reassessed for other reasons. Additional payments based on the change in a CPI are recorded as a period expense when incurred.
96
| NOTE 2:- |
SIGNIFICANT ACCOUNTING POLICIES (Cont.)
|
Property and Equipment
Property and equipment are stated at cost, net of accumulated depreciation. Depreciation is calculated using the
straight-line method over the estimated useful lives of the assets at the following annual rates:
|
Years
|
|||
|
Computer equipment and software
|
|||
|
Internal-use software
|
|||
|
Office furniture and equipment
|
|
||
|
Leasehold improvements
|
Over the shorter of expected lease
term or estimated useful life
|
Internal-Use Software Development Costs
According to ASC 350-40 the Company capitalizes certain internal-use software development costs associated with creating and enhancing
internal-use software related to its platform and technology infrastructure. These costs include personnel and related employee benefits expenses for employees who are directly associated with and who devote time to software projects, and
services consumed in developing or obtaining the software.
Capitalized internal-use software is included in property and equipment, net in the consolidated balance sheets. Software development costs that
do not meet the criteria for capitalization are expensed as incurred and recorded in research and development expenses in the consolidated statements of income (loss).
Software development activities generally consist of three stages, (i) the planning stage, (ii) the application and infrastructure development
stage, and (iii) the post implementation stage. Costs incurred in the planning and post implementation stages of software development, including costs associated with the post configuration training and repairs and maintenance of the developed
technologies, are expensed as incurred. Costs incurred in the application and infrastructure development stages, including significant enhancements and upgrades, are capitalized. Capitalization ends once a project is substantially complete, and
the software and technologies are ready for their intended purpose.
Internal-use software development costs are amortized using a straight-line method over the estimated useful life of three years , commencing when the software is ready for its intended use.
Business Combinations
The Company records acquisitions based on the fair value of the consideration transferred and then allocates the purchase
price to the identifiable assets acquired and liabilities assumed based on their respective fair values as of the acquisition date.
The excess of the value of consideration
transferred over the aggregate fair value of those net assets is recorded as goodwill. Any identified definite lived intangible assets will be amortized over their estimated useful lives and any identified intangible assets with indefinite
useful lives and goodwill will not be amortized but will be tested for impairment at least annually. When determining the fair value of assets acquired and liabilities assumed, management makes significant estimates and assumptions,
including the selection of valuation methodologies, estimates of future revenues and cash flows, discount rates, especially with respect to intangible assets.
97
| NOTE 2:- |
SIGNIFICANT ACCOUNTING POLICIES (Cont.)
|
Critical estimates in valuing certain intangible assets
include, but are not limited to, future expected cash flows from customer relationships, merchant/network affiliate relationships, publisher relationships, technology, tradenames and discount rates. The Company estimates fair value based upon
assumptions that are believed to be reasonable, but which are inherently uncertain and unpredictable and, as a result, actual results may differ from estimates.
Upon the conclusion of the measurement period or final
determination of the fair value of assets acquired or liabilities assumed, whichever comes first, any subsequent adjustments are recorded to the Company’s consolidated statements of income (loss).
Acquisition-related transaction costs are not included as a
component of consideration transferred, but are accounted for as an expense in the period in which the costs are incurred.
Intangible Assets
Intangible assets consist of identifiable intangible assets that the Company has acquired from previous business combinations. Intangible assets
are recorded at fair value, net of accumulated amortization. The Company amortizes its intangible assets reflecting the pattern in which the economic benefits of the intangible assets are consumed. When a pattern cannot be reliably determined,
the Company uses a straight-line amortization method. Each period the Company evaluates the estimated remaining useful lives of its intangible assets and whether events or changes in circumstances require a revision to the remaining period of
amortization.
The estimated useful lives of the Company’s intangible assets are as follows:
|
Years
|
|||
|
Merchant / Network affiliate relationships
|
|
||
|
Publisher relationships
|
|
||
|
Tradenames
|
|
||
|
Technology
|
|
||
|
Customer relationships
|
|
Impairment of Long-Lived Assets
The Company assesses the recoverability of its long-lived assets, whenever events or changes in circumstances indicate that
their carrying value may not be recoverable, in accordance with ASC 360, “Property, Plant and Equipment”. Recoverability of a long-lived asset is measured by comparing the carrying value of the asset group to the projected undiscounted cash flows
over their remaining lives. If the carrying value exceeds the projected undiscounted cash flows, an impairment loss is recognized. Impairment equals the amount by which the carrying value exceeds estimated fair value. An impairment loss is
charged to consolidated statements of income (loss) in the period in which management determines such impairment.
There was no
98
| NOTE 2:- |
SIGNIFICANT ACCOUNTING POLICIES (Cont.)
|
Goodwill
Goodwill represents the excess of the aggregate fair value of the consideration transferred in a business combination over the fair value of the assets acquired, net of liabilities assumed. Goodwill is not amortized, but is subject to
impairment testing at the reporting unit level conducted annually on December 31, or more frequently if events or changes in circumstances indicate that goodwill may be impaired. The Company identified a single reporting unit for the purpose of
goodwill impairment testing.
There was no
Segment Information
The Company operates in one
Revenue Recognition
Under ASC 606, “Revenues from Contracts with Customers”, the Company recognizes revenue when its customer obtains control of
promised goods or services in an amount that reflects the consideration that the Company expects to receive in exchange for those goods or services. To determine revenue recognition for contracts that are within the scope of the standard, the
Company performs the following five steps:
|
(i)
|
Identify the contract with a customer;
|
| (ii) |
Identify the performance obligations in the contract, including whether they are distinct in the context of the contract;
|
| (iii) |
Determine the transaction price, including the constraint on variable consideration;
|
| (iv) |
Allocate the transaction price to the performance obligations in the contract;
|
| (v) |
Recognize revenue as the Company satisfies the performance obligations.
|
The Company generates revenues when people click on, purchase from or, in some cases, view the ads that appear within its recommendation platform.
The Company’s customers are the advertisers, merchants and affiliate networks that advertise on the Company’s platform (collectively, “Advertisers”). Advertisers pay Taboola for those clicks, purchases or impressions and Taboola generally shares
the resulting revenue with the digital properties who display those ads.
Advertisers accept the Company’s terms of service upon signature on an IO (insertion order) or any applicable form and registration to the
platform.
|
-
|
For campaigns priced on a cost-per-click (“CPC”) basis, the Company bills the customers and recognizes revenues when a user clicks on an advertisement displayed. |
| - |
For campaigns priced on a cost-per-thousand impression basis (“CPM”), the Company bills the customers and recognizes revenues based on the number of times an advertisement is displayed to a user. |
|
-
|
For campaigns priced on a performance-based cost-per-action (“CPA”) basis, the Company bills the customers and recognizes revenues when a user makes an acquisition. |
99
| NOTE 2:- |
SIGNIFICANT ACCOUNTING POLICIES (Cont.)
|
The determination of whether revenue should be reported gross of amounts billed to Advertisers (gross basis) or net of
payments to digital properties partners (net basis) requires significant judgment and is based on management assessment of whether the Company is acting as the principal or an agent in the transaction. The Company has determined that in certain
arrangements it acts as principal because it has the ability to direct the services to its customers, while in others it does not.
On revenues presented on a gross basis the Company has contracts with its digital properties that provide exclusivity and cover multiple years at inception. These
agreements typically require that the Company’s code be integrated on the digital property web page. Thus, in the vast majority of the Company’s business, it does not bid for an ad placement, but rather it controls the specified pages before
they are transferred to the customer, sees all users that visit the respective pages and is able to run a predictive auction and direct the ad placement to the relevant customer. The Company further concluded that (i) the Company is primarily
responsible for fulfilling the promise to provide the service in the arrangement and controls what recommendations to place; (ii) the Company has latitude in establishing the contract price with the advertisers, and (iii) the Company has
inventory risk on a portion of its multi-year agreement with digital properties. Therefore, based on these and other factors, the Company reports revenue earned on a gross basis.
For those revenue arrangements where the Company does not control the advertising inventory before it is transferred to its Advertisers, does not have inventory risks as the Company does not purchase the advertising
inventory upfront or has limited discretion in establishing prices, the Company believes it acts as an agent and recognizes revenue and related costs incurred on a net basis.
Trade receivables are
recorded at the amount of gross billings the Company is responsible to collect, trade payables, representing liabilities towards digital properties, are recorded at the amount payable to publishers.
Practical Expedients
The Company does not disclose the value of unsatisfied performance obligations for (i) contracts with an original
expected length of one year or less and (ii) contracts for which the Company recognizes revenue at the amount to which it has the right to invoice for services performed.
The Company generally expenses sales commissions when incurred because the amortization period would have been one year
or less. These costs are recorded within sales and marketing expenses.
Cost of Revenues
The Company’s cost of revenue primarily includes Traffic acquisition costs and other cost of revenue.
Traffic acquisition cost. Traffic acquisition cost, or TAC, consists primarily of cost related to digital property
compensation for placing Taboola’s platform on their digital property and cost for advertising impressions purchased from real-time advertising exchanges and other third parties. Traffic acquisition cost also includes up-front payments,
incentive payments, or bonuses paid to the digital property partners, which are amortized over the shorter of respective contractual terms and the economic benefit period of the digital property arrangement. Taboola has two primary compensation models for digital properties. The most common model is a revenue share model. In this model, Taboola agrees to pay a fixed
percentage of the revenue that it generates from advertisements placed on the digital properties.
100
| NOTE 2:- |
SIGNIFICANT ACCOUNTING POLICIES (Cont.)
|
The second model includes guarantees. Under this model, Taboola mostly
pays a greater of a fixed percentage of the revenue generated and a committed guaranteed amount per thousand page views (“Minimum guarantee model”). Actual compensation is settled on a monthly basis. Expenses under both the revenue share model as
well as the Minimum guarantee model are recorded as incurred, based on actual revenues generated by Taboola at the respective month.
Other cost of revenue. Other cost of revenue primarily consists of data center and related costs, depreciation expense related to hardware supporting Taboola’s platform, amortization expense related to
capitalized internal-use software and acquired intangibles, personnel costs, and allocated facilities costs. Personnel costs include salaries, bonuses, share-based compensation, and employee benefit costs, and are primarily attributable to the
operations group, which supports the Company’s platform and clients.
Research and Development
Research and development expenses consist primarily of personnel costs, including
salaries, bonuses, share-based compensation and employee benefits costs, allocated facilities costs, professional services and depreciation.
Warrants Liability
The Company evaluated the Public Warrants and Private Warrants (collectively: “Warrants”) in accordance with ASC 815-40,
‘‘Derivatives and Hedging — Contracts in Entity’s Own Equity’’, and concluded that a provision in the Warrants Agreement related to certain tender or exchange offers, as well as provisions that provided for potential changes to the settlement
amounts dependent upon the characteristics of the holder of the warrant, preclude the Warrants from being accounted for as components of equity.
As the Warrants meet the definition of a derivative as contemplated in ASC 815 and are not eligible for an exception from
derivative accounting, the Warrants are recorded as derivative liabilities in the consolidated balance sheets and measured at fair value at inception (on June 29, 2021, the date of the Business Combination) and at each reporting period in
accordance with ASC 820, ‘‘Fair Value Measurement’’, with changes in fair value presented within finance income (expense), net in the consolidated statements of loss in the period of change.
The Company established the initial fair value for the Warrants as of June 29, 2021, the date of the Business Combination,
using a quoted price for the Public Warrants and a Black-Scholes simulation model for the Private Warrants. The Private Warrants were classified as Level 3 at the initial measurement date due to the use of unobservable inputs.
The key inputs into the Black-Scholes model for the Private Warrants as of December 31, 2023 and 2022, were as follows:
| Input | December 31, |
|||||||
| |
2023
|
2022 |
||||||
|
Risk-free interest rate
|
|
%
|
|
%
|
||||
|
Expected term (years)
|
|
|
||||||
|
Expected volatility
|
|
%
|
|
%
|
||||
|
Exercise price
|
$
|
|
$
|
|
||||
|
Underlying stock price
|
$
|
|
$
|
|
||||
101
| NOTE 2:- |
SIGNIFICANT ACCOUNTING POLICIES (Cont.)
|
The Company’s use of a Black-Scholes model required the use of subjective assumptions:
| ● |
The risk-free interest rate assumption was interpolated based on constant maturity U.S. Treasury rates over a term commensurate with the expected term of the Private Warrants.
|
| ● |
The expected term was based on the maturity of the Private Warrants of
|
| ● |
The expected share volatility assumption was based on the implied volatility from a set of comparable publicly-traded companies as determined based on size and proximity.
|
Share-Based Compensation
Share-based compensation expense related to share-based awards is recognized based on the fair value of the awards granted and
recognized as an expense over the requisite service period for share options and RSUs. The Company elects the straight-line recognition method for awards subject to graded vesting based only on a service condition and implements the accelerated
method for awards that are subject to a performance condition. The compensation expense associated with performance based RSUs is adjusted based on the probability of achieving performance targets. Forfeitures are accounted for as they occur.
The fair value of each option award is estimated on the grant date using the Black-Scholes option pricing model. The
Black-Scholes option pricing model requires the input of highly subjective assumptions, including the fair value of the underlying ordinary shares, the expected term of the award, the expected volatility of the price of the Company’s ordinary
shares, risk-free interest rates, and the expected dividend yield of ordinary shares. The fair value of each RSU award is based on the fair value of the underlying ordinary shares on the grant date. The assumptions used to determine the fair value
of the share awards represent management’s best estimates. These estimates involve inherent uncertainties and the application of management’s judgment.
The fair value of each option award is estimated using the following assumptions:
|
Year ended
December 31,
|
||||||||
|
2022
|
2021
|
|||||||
|
Volatility
|
|
%
|
|
%
|
||||
|
Risk-free interest rate
|
|
%
|
|
%
|
||||
|
Dividend yield
|
|
%
|
|
%
|
||||
|
Expected term (in years)
|
|
|||||||
The Company did not grant options awards during the year ended
December 31, 2023.
These assumptions and estimates were determined as follows:
Fair Value of Ordinary Shares. For
periods after the Company’s shares began trading on June 30, 2021, the fair value of the shares is determined by the closing price of the Company’s Ordinary shares as reported on the date of grant. For periods prior to the public listing, the
fair value was determined by the Company’s board of directors, with input from management and valuation reports prepared by independent third-party valuation specialists.
102
| NOTE 2:- |
SIGNIFICANT ACCOUNTING POLICIES (Cont.)
|
Risk-Free Interest Rate. The risk-free rate for the expected term of the options is based on the yields of the U.S. Treasury securities with maturities appropriate for the expected term of employee share option awards.
Expected
Term. The expected term represents the period that options are expected to be outstanding. The Company determines the expected term using the simplified method. The simplified method
deems the term to be the average of the time-to-vesting and the contractual life of the options.
Expected Volatility. Since the Company has a limited trading history of its Ordinary shares, the expected volatility is derived from the average historical share volatilities based on peer group public companies that the
Company considers to be comparable to its own business over a period equivalent to the option’s expected term.
Expected
Dividend Yield. The Company has never declared or paid any cash dividends and does not presently plan to pay cash dividends in the foreseeable future. As a result, an expected
dividend yield of zero percent was used.
Income taxes
The Company is subject to income taxes in Israel, the U.S., and other foreign jurisdictions. These foreign jurisdictions may
have different statutory rates than in Israel. Income taxes are accounted for in accordance with ASC 740, “Income Taxes”. Deferred tax assets and liabilities are recognized for the future tax consequences attributable to differences between the
financial statements carrying amounts of existing assets and liabilities and their respective tax basis as well as operating loss and tax credit carryforwards. Deferred tax assets and liabilities are measured using enacted tax rates expected to
apply to taxable income in the years in which those temporary differences are expected to be recovered or settled.
The financial effect of changes in tax laws or rates is accounted for in the period of enactment. Valuation allowances are
provided when necessary to reduce deferred tax assets to the amount expected to be realized.
The Company recognizes income tax benefits from uncertain tax positions only if it believes that it is more likely than not
that the tax position will be sustained upon examination by the taxing authorities based on the technical merits of the position. The tax benefits recognized in the financial statements from such uncertain tax positions are then measured based on
the largest benefit that is more likely than not to be realized upon the ultimate settlement. Although the Company believes that it has adequately reserved for its uncertain tax positions, it can provide no assurance that the final tax outcome of
these matters will not be materially different. The Company makes adjustments to these reserves when facts and circumstances change, such as the closing of a tax audit or the refinement of an estimate. To the extent that the final tax outcome of
these matters is different from the amounts recorded, such differences will affect the provision for income taxes in the period in which such determination is made. The Company classifies interest and penalties on income taxes (which includes
uncertain tax positions) as taxes on income.
103
| NOTE 2:- |
SIGNIFICANT ACCOUNTING POLICIES (Cont.)
|
Loss Contingency
The Company evaluates the likelihood of an unfavorable outcome in legal or regulatory proceedings to which it is a party and
records a loss contingency when it is probable that a liability has been incurred and the amount of the loss can be reasonably estimated. These judgments are subjective, based on the status of such legal or regulatory proceedings, the merits of
the Company’s defenses and consultation with corporate and external legal counsel. Actual outcomes may differ materially from the Company’s estimates. Legal costs associated with the proceedings are expensed as incurred.
Treasury
Ordinary Shares
The Company may repurchase its Ordinary shares from time to time in the open market, or in other transactions, and holds such shares as treasury Ordinary shares. The Company presents the cost to repurchase treasury Ordinary shares as a separate component and as a reduction of shareholders’ equity.
The Company may reissue treasury Ordinary shares from time to time for various corporate purposes, including in connection with compensatory awards.
Net income (loss) Per Share Attributable to Ordinary and Non-voting Ordinary Shareholders
The Company calculates basic net income
(loss) per share by dividing the net income (loss) by the weighted-average number of Ordinary shares and Non-voting Ordinary shares outstanding during the period. Diluted net income (loss) per share is computed by giving effect to all potentially
dilutive securities outstanding for the period. Diluted net loss per share was the same as basic net loss per share in periods when the effects of potentially dilutive securities were anti-dilutive.
For periods before the Company’s shares
began trading on June 30, 2021, the Company calculated basic net income (loss) per share using the two-class method required for participating securities. The Company considered its convertible preferred shares to be participating securities as
the holders of the convertible preferred shares would be entitled to dividends that would be distributed to the holders of ordinary shares, on a pro-rata basis assuming conversion of all convertible preferred shares into ordinary shares. These
participating securities did not contractually require the holders of such shares to participate in the Company’s losses. As such, net loss for the periods presented was not allocated to the Company’s participating securities.
Reclassification
Certain amounts
in the corresponding periods have been reclassified to conform with the current year’s presentation. Such reclassifications did not affect net loss, changes in the convertible preferred shares and shareholders’ equity or cash flows.
104
| NOTE 2:- |
SIGNIFICANT ACCOUNTING POLICIES (Cont.)
|
Recently Issued Accounting Pronouncements
In December 2023, the FASB issued ASU 2023-09 “Income Taxes (Topics 740): Improvements to Income Tax Disclosures”, which
expands the disclosure requirements for income taxes, primarily related to the rate reconciliation and income taxes paid. This ASU is effective for the fiscal years beginning after December 15, 2024. Early adoption permitted. The Company does not expect the adoption of this guidance will have a significant impact on its consolidated financial statement and related disclosures and will adopt the
guidance effective January 1, 2025.
In November 2023, the FASB issued
ASU 2023-07, “Segment Reporting (Topic 280): Improvements to Reportable Segment Disclosures”, which expands the annual and interim disclosure requirements for public company reportable segments, primarily through enhanced information about the
significant expenses. This ASU is effective for fiscal years beginning after December 15, 2023, and for interim periods within fiscal years beginning after December 15, 2024. Early adoption permitted. The Company is currently evaluating the
impact of this guidance on its consolidated financial statements and related disclosures.
105
| NOTE 3:- |
CASH AND CASH EQUIVALENTS
|
The following table presents for each reported period, the breakdown of cash and cash equivalents:
|
December 31,
|
||||||||
|
2023
|
2022
|
|||||||
|
Cash
|
$
|
|
$
|
|
||||
|
Money market accounts and funds
|
|
|
||||||
|
Time deposits
|
|
|
||||||
|
Total Cash and cash equivalents
|
$
|
|
$
|
|
||||
| NOTE 4:- |
FAIR VALUE MEASUREMENTS
|
The Company evaluates assets and liabilities subject to fair value measurements on a recurring basis to determine the
appropriate level to classify them for each reporting period. The Company did not have any transfers between fair value measurements levels in the years ended December 31, 2023, 2022 and 2021.
The following table sets forth the Company’s assets and liabilities that were measured at fair value as of December 31, 2023
and 2022, by level within the fair value hierarchy:
| |
Fair value measurements
as of
|
|||||||||
| Description |
Fair Value
Hierarchy
|
December 31,
2023
|
December 31,
2022
|
|||||||
|
Assets:
|
||||||||||
|
Cash equivalents:
|
||||||||||
|
Money market accounts and funds
|
Level 1
|
$ | $ | |||||||
|
Short-term investments:
|
||||||||||
|
Corporate debt securities
|
Level 2
|
$ | $ | |||||||
|
Commercial paper
|
Level 2
|
$ | $ | |||||||
|
U.S. government treasuries
|
Level 2
|
$ | $ | |||||||
|
U.S. agency bonds
|
Level 2 | $ | $ | |||||||
|
Derivative instruments asset:
|
||||||||||
|
Derivative instruments designated as cash flow hedging instruments
|
Level 2 |
$ | $ | |||||||
|
Liabilities:
|
||||||||||
|
Warrants liability:
|
||||||||||
|
Public Warrants
|
Level 1 | $ | ( |
) | $ | ( |
) | |||
|
Private Warrants
|
Level 3 | $ | ( |
) | $ | ( |
) | |||
|
Derivative instruments liability:
|
||||||||||
|
Derivative instruments designated as cash flow hedging instruments
|
Level 2 | $ | $ | ( |
) | |||||
The Company classifies its money market accounts and funds as Level 1 based on quoted market prices in active markets.
The Company classifies its short-term investments and derivative instruments within Level 2 as they are valued using inputs other than
quoted prices which are directly or indirectly observable in the market, including readily-available pricing sources for the identical underlying security which may not be actively traded.
106
| NOTE 4:- |
FAIR VALUE MEASUREMENTS (Cont.)
|
The Company measures the fair value for Warrants by using a quoted price for the Public Warrants, which are classified as Level 1, and a
Black-Scholes simulation model for the Private Warrants, which are classified as Level 3, due to the use of unobservable inputs.
The following table presents the changes in the fair value of Warrants liability:
|
Input
|
Private
Warrants
|
Public
Warrants
|
Total
Warrants
|
|||||||||
|
Fair value as of December 31, 2022
|
$
|
|
$
|
|
$
|
|
||||||
| Change from private to public holdings |
( |
) | ||||||||||
|
Change in fair value
|
|
(
|
)
|
(
|
)
|
|||||||
|
Fair value as of December 31, 2023
|
$
|
|
$
|
|
$
|
|
||||||
| NOTE 5:- |
SHORT-TERM INVESTMENTS
|
The following is a summary of available-for-sale marketable securities:
|
December 31, 2023
|
||||||||||||||||
|
Amortized
Cost
|
Gross
Unrealized
Gains
|
Gross
Unrealized
Losses
|
Fair
Value
|
|||||||||||||
|
Corporate debt securities
|
$
|
|
$
|
|
$ | ( |
) |
$
|
|
|||||||
|
Commercial paper
|
|
|
( |
) |
|
|||||||||||
|
Total
|
$
|
|
$
|
|
$ | ( |
) |
$
|
|
|||||||
|
December 31, 2022
|
||||||||||||||||
|
Amortized
Cost
|
Gross
Unrealized
Gains
|
Gross
Unrealized
Losses
|
Fair
Value
|
|||||||||||||
|
U.S. government treasuries
|
$
|
|
$
|
|
$
|
(
|
)
|
$
|
|
|||||||
|
Corporate debt securities
|
|
|
(
|
)
|
|
|||||||||||
|
U.S. agency bonds
|
|
|
(
|
)
|
|
|||||||||||
|
Commercial paper
|
|
|
(
|
)
|
|
|||||||||||
|
Total
|
$
|
|
$
|
|
$
|
(
|
)
|
$
|
|
|||||||
As of December 31, 2023 and 2022, the unrealized losses related to marketable securities (which were accumulated in a period of less than 12
months) were not due to credit losses, and therefore, the Company did not record an allowance for credit losses for its available-for-sale marketable securities.
As of December 31, 2023, all of the Company’s available-for-sale marketable securities were due within one year.
107
| NOTE 6:- |
DERIVATIVE INSTRUMENTS AND HEDGING ACTIVITIES
|
The Company records all cash flow hedging instruments on the consolidated balance sheets at fair value. The fair values of outstanding derivative instruments designated as cash flow hedging instruments were as follows:
|
December 31,
|
||||||||
|
2023
|
2022
|
|||||||
|
Prepaid expenses and other current assets
|
$
|
|
$
|
|
||||
|
Accrued expenses and other current liabilities
|
$
|
|
$
|
|
||||
As of December 31, 2023 and 2022, the notional amounts of the Company’s derivative instruments designated as cash flow hedging instruments
outstanding in U.S. dollars amounted to $39,347 and $38,669 , respectively.
The Company had no derivative instruments or hedging activities as of December 31, 2021.
Effect of Foreign Currency Contracts on the Consolidated Statements of loss
The effect of foreign currency contracts designated as cash flow hedge on the consolidated statements of loss, for the years ended December
31, 2023 and 2022, were as follows:
| |
Year ended
December 31,
|
|||||||
|
2023
|
2022
|
|||||||
|
|
$
|
|
$
|
|
||||
|
|
|
|
||||||
|
|
|
|
||||||
|
|
|
|
||||||
|
|
$
|
|
$
|
|
||||
Effect of Foreign Currency Contracts on Accumulated Other Comprehensive Income (Loss)
Net unrealized gains (losses) of foreign currency contracts designated as cash flow hedging instruments are recorded in
accumulated other comprehensive income (loss).
The changes
in unrealized gains (losses) on the Company’s derivative instruments recorded in accumulated other comprehensive income (loss) were as follows:
|
Year ended
December 31,
|
||||||||
|
2023
|
2022
|
|||||||
|
Unrealized losses on derivative instruments, beginning of period
|
$
|
(
|
)
|
$
|
|
|||
|
Changes in fair value of derivative instruments
|
(
|
)
|
(
|
)
|
||||
|
Reclassification of losses recognized in the consolidated statements of loss from accumulated other comprehensive income (loss)
|
|
|
||||||
|
Unrealized gains (losses) on derivative instruments, end of period
|
$
|
|
$
|
(
|
)
|
|||
All net deferred gains in accumulated other comprehensive income (loss) as of December 31, 2023, are expected to be recognized over the next twelve months as operating
expenses in the same financial statement line item in the consolidated statements of loss to which the derivative relates.
108
| NOTE 7:- |
BUSINESS COMBINATION
|
Connexity
On September 1, 2021, the Company completed the acquisition of Shop Holding Corporation (“Connexity”) (the “Connexity
Acquisition”), an independent e-Commerce media platform in the open web, from Shop Management, LLC (“Seller”). Connexity is a technology and data-driven integrated marketing services company focused on the e-commerce ecosystem. Through a focus on
performance-based retail marketing, Connexity enables retailers and brands to understand their consumers better, acquire new customers at a lower cost, and increase sales from their target consumers. Connexity offers a comprehensive range of
marketing services to online retailers and brands in the U.S. and Europe, including syndicated product listings, search marketing, and customer insights. Connexity corporate headquarters is in Santa Monica, California, and the Company also
maintains an office in Karlsruhe, Germany.
In accordance with the acquisition method of accounting, the total purchase price for the Connexity Acquisition was $753,217 , comprised of $593,894 in cash
and $157,689 based on the fair value of 17,328,049
shares of the Company’s Ordinary shares
on the closing date and additional subsequent payment of $1,634 made during 2022 (of which $431 were accrued in December 2021).
During the year ended December 31, 2022, the Company performed final settlement of net working capital transactions that resulted in a net decrease of $374 in Goodwill.
The Company incurred acquisition-related transaction costs of $6,432 during the year ended December 31, 2021, which were included in general and administrative expenses in the consolidated statements of loss.
The Company also committed to issue 3,681,030 of the Company’s Ordinary shares to certain Connexity employees (the “Holdback
agreement”), to be released to those employees over the period of three years after the acquisition date, subject to their continued
service and expensed over the applicable service periods.
In the years ended
December 31, 2023 and 2022, pursuant to the Holdback agreement, the Company issued 1,162,800 Ordinary shares and 1,227,010 Ordinary shares, respectively.
In addition, pursuant to
the purchase agreement, the Company issued approximately $40,000 of RSUs to Connexity employees in accordance with the
terms of the Company’s equity plan. These RSUs are expected to vest and be expensed over a 4 -5 year service period.
The
following table summarizes the final fair value of assets acquired and liabilities assumed:
|
Cash and cash equivalents
|
$
|
|
||
|
Other current assets
|
|
|||
|
Intangible assets
|
|
|||
|
Goodwill
|
|
|||
|
Other noncurrent assets
|
|
|||
|
Total assets acquired
|
|
|||
|
Current liabilities
|
|
|||
|
Deferred tax liability, net
|
|
|||
|
Total liabilities assumed
|
|
|||
|
Total purchase consideration
|
$
|
|
109
| NOTE 7:- |
BUSINESS COMBINATION (Cont.)
|
Goodwill represents the purchase price paid in excess of the fair value of net tangible and intangible assets acquired,
and is attributable primarily to expected synergies, economies of scale and the assembled workforce of Connexity. Goodwill is not deductible for income tax purposes.
The following table presents components of the identified intangible
assets acquired and their estimated useful lives as of date of acquisition:
|
|
|
Useful life
|
||||||
| Fair value |
(In years) |
|||||||
|
Merchant/Network affiliate relationships (1)
|
$
|
|
|
|||||
|
Technology (1)
|
|
|
||||||
|
Publisher relationships (2)
|
|
|
||||||
|
Tradenames (2)
|
|
|
||||||
|
Total Intangible assets acquired
|
$
|
|
||||||
___________________________________________
|
(1)
|
|
|
(2)
|
The results of operations of Connexity have been included in the consolidated financial statements since the
acquisition date of September 1, 2021. Connexity revenue included in the Company’s consolidated statement of operations from September 1, 2021, through December 31, 2021, was $37,692 . There is no practical way to determine net income attributable to Connexity due to integration.
The following unaudited pro forma combined financial information table presents the results of operations of the Company and
Connexity as if the acquisition of Connexity have been completed on January 1, 2020. The unaudited pro forma financial information includes adjustments primarily related to amortization of the acquired intangible assets, recognition
of transaction costs and bonuses, recognition of share-based compensation associated with RSU grants to Connexity employees and the holdback consideration, as noted above.
The unaudited pro forma results have been prepared for illustrative purposes only and are not necessarily indicative of
what the actual results of operations of the Company and Connexity, combined, would have been due to any synergies, economies of scale and the assembled workforce of Connexity.
|
Year ended
December 31,
|
||||||||
|
Unaudited
|
||||||||
|
2021
|
2020
|
|||||||
|
Revenues
|
$
|
|
$
|
|
||||
|
Net income (loss)
|
$
|
(
|
)
|
$
|
(
|
)
|
||
Gravity
R&D Zrt.
In July 2022, the Company completed the acquisition of Gravity R&D Zrt. (“Gravity R&D”) a privately-held company based in Budapest, Hungary, which provides personalization
recommendation services, for a total consideration of $7,035 , net of cash acquired. As part of a purchase price allocation, $1,780 was attributed to identified intangible assets and $5,925 to goodwill. Goodwill is not deductible for income tax purposes.
110
| NOTE 7:- |
BUSINESS COMBINATION (Cont.)
|
In 2022, total acquisition-related transaction costs of $742 were incurred in relation to the acquisition, which were recognized as an expense and included in general and administrative expenses in the consolidated statements of loss.
The results of Gravity R&D operations were consolidated in the Company’s consolidated financial statements commencing on the date of the
acquisition and were immaterial to the Company’s results of operations for the year ended December 31, 2022. Pro forma information has not been provided, since the impact of Gravity R&D’s financial results were immaterial to the revenue and net
loss of the Company.
| NOTE 8:- |
PREPAID EXPENSES AND OTHER CURRENT ASSETS
|
|
December 31,
|
||||||||
|
2023
|
2022
|
|||||||
|
Prepaid expenses
|
$
|
|
$
|
|
||||
|
Government institutions
|
|
|
||||||
| Derivative instruments |
||||||||
|
Other current asset
|
|
|
||||||
| Total prepaid expenses and other current assets |
$
|
|
$
|
|
||||
| NOTE 9:- |
PROPERTY AND EQUIPMENT, NET
|
Property and equipment, net consist of the following:
|
December 31,
|
||||||||
|
2023
|
2022
|
|||||||
|
Computer and equipment and software
|
$
|
|
$
|
|
||||
|
Internal-use software
|
|
|
||||||
|
Leasehold improvements
|
|
|
||||||
|
Office furniture and equipment
|
|
|
||||||
| Property and equipment, gross |
|
|
||||||
|
Less accumulated depreciation
|
(
|
)
|
(
|
)
|
||||
|
Property and equipment, net
|
$
|
|
$
|
|
||||
The Company capitalized internal-use software costs of $14,431
and $14,954 for the years ended December 31, 2023 and 2022, respectively. The Company’s capitalized internal-use software amortization is
included in cost of revenues in the Company’s consolidated statements of loss and totaled to $12,446 , $5,422 and $1,923 for the years ended
December 31, 2023, 2022 and 2021, respectively.
Total depreciation expenses (including amortization of internal-use software) for the years ended December 31, 2023, 2022 and
2021, were $32,624 , $27,664
and $30,104 , respectively.
For the years ended December 31, 2023, 2022 and 2021, the Company wrote off fully depreciated property and equipment, which
were no longer in use, with a cost basis of $6,599 , $2,393 and $0 , respectively.
111
| NOTE 10:- |
GOODWILL AND INTANGIBLE ASSETS, NET
|
Goodwill
The following table represents the changes in the carrying amounts of the Company’s total goodwill:
|
|
Carrying
Amount
|
|||
|
Balance as of December 31, 2021
|
$
|
|
||
|
Purchase accounting adjustment (1)
|
(
|
)
|
||
|
Additions from acquisition (2)
|
|
|||
|
Balance as of December 31, 2022
|
|
|||
|
Purchase accounting adjustment (2)
|
|
|||
|
Balance as of December 31, 2023
|
$
|
|
||
__________________________________________
|
(1)
|
|
|
(2)
|
|
Intangible Assets, Net
Definite-lived intangible assets, net consist of the following:
| December 31, 2023 |
Gross Fair
Value
|
Accumulated
Amortization
|
Net Book
Value
|
Weighted-Average
Remaining Useful
Life
(In years)
|
||||||||||||
|
Merchant/Network affiliate relationships
|
$
|
|
$
|
(
|
)
|
$
|
|
|||||||||
|
Technology
|
|
(
|
)
|
|
||||||||||||
|
Publisher relationships
|
|
(
|
)
|
|
||||||||||||
|
Tradenames
|
|
(
|
)
|
|
||||||||||||
|
Customer relationship
|
|
(
|
)
|
|
||||||||||||
|
Total
|
$
|
|
$
|
(
|
)
|
$
|
|
|||||||||
| December 31, 2022 |
Gross Fair
Value
|
Accumulated
Amortization
|
Net Book
Value
|
Weighted-Average
Remaining Useful
Life
(In years)
|
||||||||||||
|
Merchant/Network affiliate relationships
|
$ | $ | ( |
) | $ | |||||||||||
|
Technology
|
|
(
|
)
|
|
||||||||||||
|
Publisher relationships
|
( |
) | ||||||||||||||
|
Tradenames
|
( |
) | ||||||||||||||
|
Customer relationship
|
|
(
|
)
|
|
||||||||||||
|
Total
|
$
|
|
$
|
(
|
)
|
$
|
|
|||||||||
Amortization expenses for intangible assets were $63,888 , $63,557 and $23,007 for the years ended December 31, 2023, 2022 and 2021, respectively.
The estimated future amortization expense of definite-lived intangible assets as of December 31, 2023, is as follows:
|
Year Ending December 31,
|
||||
|
2024
|
$
|
|
||
|
2025
|
|
|||
|
2026
|
|
|||
|
2027
|
|
|||
| Total |
$
|
|
||
112
| NOTE 11:- |
ACCRUED EXPENSES AND OTHER CURRENT LIABILITIES
|
|
December 31,
|
||||||||
|
2023
|
2022
|
|||||||
|
Employees and related benefits
|
$ | $ | ||||||
|
Accrued expenses
|
||||||||
| Government authorities |
||||||||
|
Advances from customers
|
|
|
||||||
|
Accrued vacation pay
|
|
|
||||||
|
Derivative instruments
|
||||||||
|
Other
|
|
|
||||||
| Total accrued expenses and other current liabilities |
$
|
|
$
|
|
||||
| NOTE 12:- |
LEASES
|
The main operating lease expenses include leases of office locations, data centers and vehicles. The lease terms of the Company’s operating leases
generally range from 2 years to 11
years, with various expiration dates through 2033.
The following table presents supplemental information related to the operating leases:
|
December 31,
|
||||||||
|
2023
|
2022
|
|||||||
|
Weighted average remaining operating lease term in years
|
|
|
||||||
|
Weighted average discount rate of operating leases
|
|
%
|
|
%
|
||||
The Company lease agreements generally do not contain any material residual value guarantees or material restrictive covenants.
The components of lease expense related to leases for the years ended December 31, 2023,
2022 and 2021, were as follows:
|
Year ended
December 31,
|
||||||||||||
| |
2023
|
2022
|
2021 |
|||||||||
|
Components of lease expense:
|
||||||||||||
|
Operating lease cost
|
$
|
|
$
|
|
$ | |||||||
|
Short-term lease cost and variable lease cost
|
|
|
||||||||||
|
Sublease income
|
( |
) | ( |
) | ||||||||
Maturities of lease liabilities as of December 31, 2023, were as follows:
|
Amount
|
||||
| Year Ending December 31, |
||||
|
2024
|
$
|
|
||
|
2025
|
|
|||
|
2026
|
|
|||
|
2027
|
|
|||
|
2028
|
|
|||
|
Thereafter
|
|
|||
|
Total undiscounted lease payments
|
$
|
|
||
|
Less: imputed interest
|
(
|
)
|
||
|
Present value of lease liabilities
|
$
|
|
||
113
| NOTE 13:- |
FINANCING ARRANGEMENTS
|
Long-term loan
Concurrently with the closing of the Connexity Acquisition, on September 1, 2021, the Company entered into a $300,000 senior secured term loan credit agreement (the “Credit Agreement”), among the Company, Taboola Inc., a wholly-owned Company’s subsidiary
(the “Borrower”), the lenders party thereto and JPMorgan Chase Bank, N.A., as administrative agent. The Credit Agreement provides for borrowings in an aggregate principal amount of up to $300,000 (the “Facility”).
The Facility was fully drawn at closing, net of issuance expenses of $11,250 , and the proceeds were used by the Company to finance a portion of the Connexity Acquisition.
The
Facility is subject to customary borrowing conditions. The Credit Agreement was amended on June 12, 2023, to replace LIBOR with SOFR and accordingly the Facility bears interest at a variable annual rate based on Term SOFR or Base Rate plus a
fixed margin. The Facility will mature on the th anniversary of the closing date and amortizes at a rate of 1.00 % per annum payable in equal quarterly
installments, with the remaining principal amount due at maturity.
The Facility is mandatorily prepayable with a portion of the net cash proceeds of certain dispositions of assets, a portion
of Taboola’s excess cash flow and the proceeds of incurrences of indebtedness not permitted under the Credit Agreement.
The Credit Agreement also contains customary representations, covenants and events of default. Failure to meet the
covenants beyond applicable grace periods could result in acceleration of outstanding borrowings and/or termination of the Facility. As of December 31, 2023, the Company was in compliance with the Facility covenants.
In the years ended December 31, 2023 and 2022 the Company voluntarily prepaid the principal amount of the outstanding debt
under the Credit Agreement of $79,250 and $61,265 , respectively.
As of December 31, 2023, the total future principal payments related to Facility loan are as follows:
|
Amount
|
||||
|
Year Ending December 31,
|
||||
|
2024
|
$ |
|
||
|
2025
|
|
|||
|
2026
|
|
|||
|
2027
|
|
|||
|
2028
|
|
|||
|
Total
|
$
|
|
||
The Facility is guaranteed by the Company and all of its wholly-owned material subsidiaries, subject to certain exceptions
set forth in the Credit Agreement (collectively, the “Guarantors”). The obligations of the Borrower and the Guarantors are secured by substantially all the assets of the Borrower and the Guarantors including stock of subsidiaries, subject to
certain exceptions set forth in the Credit Agreement.
The total interest expenses, including issuance costs amortization, recognized in connection with the long-term loan, were
$19,885 and $18,675 ,
for the years ended December 31, 2023 and 2022, respectively. The long-term loan interest and issuance costs amortization, included as interest expenses, are recognized through the remaining term of the Credit Agreement using the effective
interest rate.
114
|
NOTE 13:-
|
FINANCING ARRANGEMENTS (Cont.)
|
Revolving Credit Agreement
On August 9, 2022, the Company amended its Credit Agreement to provide for a five-year senior secured revolving credit facility (the “Revolving Credit Agreement”), among the Company, Taboola Inc., a wholly-owned Company’s subsidiary (the
“Borrower”), and the lenders party thereto, with Citibank N.A., as lead arranger and JPMorgan Chase Bank, N.A., as administrative agent. The Revolving Credit Agreement provides for revolving loans in an aggregate committed principal amount of
up to $90,000 (the “Revolving Loans”).
Certain representations, events of default and covenants of the Revolving Credit Agreement are substantially the same as
those in the Credit Agreement. However, the Revolving Credit Agreement contains a financial covenant requiring the Company to maintain a Total Net Leverage Ratio (as defined in the Credit Agreement) as at the last day of each fiscal quarter.
Borrowings under the Revolving Credit Agreement are subject to customary conditions and will bear interest at a variable annual rate based on Term SOFR or Base Rate plus a fixed margin. The lenders under the Credit Agreement and the lenders
under the Revolving Credit Agreement are secured by the same collateral, including substantially all the assets of the Borrower and the Guarantors (as defined in the Credit Agreement) including shares of subsidiaries, subject to certain
exceptions in the governing documents.
The proceeds of any Revolving Loans may be used for the working capital, capital expenditures and other general corporate
purposes of Taboola and its subsidiaries and may also be used for Restricted Payments, Investments (including permitted acquisitions) and Restricted Debt Payments (each, as defined in the Credit Agreement) to the extent permitted under the
Credit Agreement.
As of December 31, 2023, the Company was in compliance with the financial covenants and had no outstanding borrowings under the Revolving Credit Agreement.
As of December 31, 2023 and 2022, deferred financing costs associated with entering into the Revolving Credit Agreement in
the total amount of $893 and $1,147 ,
respectively, were included in short-term and long-term prepaid expenses in the Company’s consolidated balance sheet.
The deferred financing costs are amortized on a straight-line basis over the term of the Revolving Credit Agreement. For
the years ended December 31, 2023 and 2022, deferred financing costs amortization amounted to $254 and $98 , respectively.
115
| NOTE 14:- |
RESTRUCTURING
|
In September 2022, the
Company announced and implemented a cost restructuring program impacting approximately 6 % of the Company’s global headcount. This strategic reduction was intended to manage the Company’s
operating expenses in response to market conditions and ongoing business prioritization efforts.
The restructuring expenses recognized in the consolidated statements of loss for the year
ended December 31, 2022, primarily consisting of one-time incremental employee termination benefits and other costs related to Company’s business prioritization, were as follows:
|
Year ended
December 31,
2022
|
||||
|
Cost of revenues
|
$
|
|
||
|
Research and development
|
|
|||
|
Sales and marketing
|
|
|||
|
General and administrative
|
|
|||
|
Total restructuring expenses recognized in the consolidated statements of loss
|
$
|
|
||
As of December 31, 2022, $88
related to restructuring expenses were included in “Accrued expenses and other current liabilities” in the consolidated balance sheet, and were subsequently paid in 2023.
| NOTE 15:- |
SHAREHOLDERS’ EQUITY AND SHARE INCENTIVE PLANS
|
Share capital
Holders of Ordinary shares have the right to receive notice of, and to participate in, all general meetings of the Company, where each Ordinary share shall have one vote. Each holder has the right to receive dividends, if any, in proportion to their respective Ordinary share holdings. In the event of Taboola’s
liquidation, after satisfaction of liabilities to creditors, Company assets will be distributed to the holders of its Ordinary shares in proportion to their shareholdings.
On December 30, 2022, in connection with the Yahoo transaction, the Company’s shareholders approved an amendment and restatement to the Articles to include a Non-voting Ordinary share class with an authorized share capital of
Share Incentive Plans
| a. |
During the years 2007, 2016, 2017 and 2020, the Company adopted several share incentive plans (together the “Legacy Plans”) to provide incentives to the Company’s employees, directors, consultants and/or contractors. In June 2021,
immediately following the effective date of the registration statement on Form F-4, the Company adopted (i) the 2021 Share Incentive Plan (the “2021 Plan”, and together with the Legacy Plans, the “Plans”) and (ii) the Employee Stock
Purchase Plan (the “ESPP”). Following the effectiveness of the 2021 Plan, the Company ceased making awards under the Legacy Plans, although previously granted awards under the Legacy Plans remain outstanding.
|
116
| NOTE 15:- |
SHAREHOLDERS’ EQUITY AND SHARE INCENTIVE PLANS (Cont.)
|
Under the Plans, the Company’s employees, directors, consultants and/or contractors are or were eligible to be granted equity-related awards, including options to acquire the Company’s Ordinary shares, restricted share
units (“RSUs”) and restricted shares.
The equity related awards generally vest over
As of December 31, 2023, the maximum number of the Company’s Ordinary shares available for issuance under the 2021 Plan is equal to the sum of (i) 31,932,902 Ordinary shares, (ii) any shares subject to awards under the Legacy Plans which have expired, or were canceled, terminated, forfeited or settled in cash in lieu of issuance of
shares or become unexercisable without having been exercised, and (iii) an annual increase on the first day of each year beginning in 2022 and on January 1 of each calendar year thereafter during the term of the 2021 Plan, equal to the lesser
of (A) 5 % of the outstanding shares on the last day of the immediately preceding calendar year and (B) such amount as determined by
the Company’s board of directors if so determined prior to January 1 of a calendar year.
As of December 31, 2023, the maximum number of the Company’s Ordinary shares available for issuance under the ESPP shall not exceed in the aggregate 6,386,580 Ordinary shares. The ESPP share pool will be increased on the first day of each fiscal year during the term of the ESPP in an amount equal to the lesser of (i) 6,386,580 the Company’s ordinary shares, (ii) 2 %
of the total number of shares of the Ordinary shares outstanding (on a fully diluted basis) on the last day of the immediately preceding fiscal year, and (iii) such amount as determined by the Company’s board of directors if so determined
prior to January 1 of a calendar year. As of December 31, 2023, the ESPP has not been activated and no Ordinary shares had been
issued under the ESPP, therefore in the last two years the Company’s board of directors decided to disable the automatic enlargement feature included in the ESPP, as described above.
| b. |
On November 21, 2023, the
Company received the approval of the Israeli court for its motion to extend, to May 16, 2024, its former motion to allow the Company to utilize the net issuance mechanism to satisfy tax withholding obligations related to equity-based
compensation on behalf of its directors, officers and other employees and possible future share repurchases (the “Program”) of up to $
|
For
the years ended December 31, 2023, 2022 and 2021, the Company utilized the net issuance mechanism in connection with equity-based compensation for certain Office Holders, which resulted in a tax withholding payment by the Company of $3,804 , $5,751 and $6,152 , respectively, which were recorded as a reduction of additional paid-in capital.
117
| NOTE 15:- |
SHAREHOLDERS’ EQUITY AND SHARE INCENTIVE PLANS (Cont.)
|
|
|
c. |
The following is a summary of share option activity and related
information for the year ended December 31, 2023 (including employees, directors, officers and consultants of the Company):
|
|
Outstanding
Share
Options
|
Weighted
Average
Exercise
Price
|
Weighted
Average
Remaining
Contractual
Life (Years)
|
Aggregate
Intrinsic
Value
|
|||||||||||||
|
Balance as of December 31, 2022
|
|
$
|
|
|
$
|
|
||||||||||
|
Exercised
|
(
|
)
|
|
|
|
|||||||||||
|
Forfeited
|
(
|
)
|
|
|||||||||||||
|
Balance as of December 31, 2023
|
|
$
|
|
|
$
|
|
||||||||||
|
Exercisable as of December 31, 2023
|
|
$
|
|
|
$
|
|
||||||||||
During the
year ended December 31, 2023, the Company did no t grant options (see Note 2).
The aggregate
intrinsic value in the table above represents the total intrinsic value that would have been received by the option holders had all option holders exercised their options on the last date of the period.
The
weighted-average grant date fair value of options granted during the years ended December 31, 2022 and 2021, was $3.07 and $9.32 , respectively.
The total
intrinsic value of options exercised during the years ended December 31, 2023, 2022 and 2021, was $11,866 , $26,473 and $49,224 , respectively.
As of
December 31, 2023, unrecognized share-based compensation cost related to unvested share options was $13,614 , which is expected to be
recognized over a weighted-average period of 1.45 years.
|
|
d. |
The following is a summary of the RSU activity and related
information for the year ended December 31, 2023:
|
|
Outstanding
Restricted shares
Unit
|
Weighted
Average Grant
Date Fair Value
|
|||||||
|
Balance as of December 31, 2022
|
|
$
|
|
|||||
|
Granted
|
|
|
||||||
|
Vested (1)
|
(
|
)
|
|
|||||
|
Forfeited
|
(
|
)
|
|
|||||
|
Balance as of December 31, 2023
|
|
$
|
|
|||||
____________________________________________
(1) A portion of the shares that vested were netted out to satisfy the tax obligations of the recipients. During the year ended December 31, 2023, a total of 1,164,891 RSUs were canceled to satisfy tax obligations, resulting in net issuance of 1,164,873 Ordinary shares.
The total
release date fair value of RSUs was $36,221 , for the year ended December 31, 2023.
The
weighted-average grant date fair value of RSUs granted during the years ended December 31 2023, 2022 and 2021, was $3.54 , $5.47 and $9.53 , respectively.
As of December 31, 2023, unrecognized share-based compensation cost related to unvested RSUs was $98,807 , which is expected to be recognized over a weighted-average period of 2.5
years.
118
| NOTE 15:- |
SHAREHOLDERS’ EQUITY AND SHARE INCENTIVE PLANS (Cont.)
|
The total
share-based compensation expense related to all of the Company’s share-based awards recognized for the years ended December 31, 2023, 2022 and 2021, were comprised as follows:
|
Year ended
December 31,
|
||||||||||||
|
2023
|
2022
|
2021
|
||||||||||
|
Cost of revenues
|
$
|
|
$
|
|
$
|
|
||||||
|
Research and development
|
|
|
|
|||||||||
|
Sales and marketing
|
|
|
|
|||||||||
|
General and administrative
|
|
|
|
|||||||||
|
Total share-based compensation expense
|
$
|
|
$
|
|
$
|
|
||||||
Restricted shares
In October 2020, the Company granted
If the Triggering Event is not consummated by such date, the RSUs are forfeited. The Triggering Event occurred on June 30, 2021, as a result of the Company’s shares
becoming publicly traded on that date.
The
time-based vesting condition for 6,598,489 RSUs was considered to have been satisfied as of the date of grant, and the remainder
satisfies the time-based condition on a monthly basis over 24 months from the date of grant, conditioned on continued service to the
Company. Of the options granted, 1,441,162 options were fully vested as of the grant date, 1,858,083 vested in a lump sum on December 31, 2021, and the remainder vest on a monthly basis over 24 months from the date of grant, conditioned on continued service to the Company.
Share Buyback Program
In May 2023, the Company’s board of
directors authorized a share buyback program for the repurchase of up to $40,000 of the Company’s outstanding Ordinary shares, with
no expiration date (the “Buyback Program”). In November 2023, the Company’s board of directors authorized up to an additional $40,000
of buybacks under the Buyback Program. As permitted by the Buyback Program, share repurchases may be made from time to time, in privately negotiated transactions or in the open market, including through trading plans, at the discretion of the
Company’s management and as permitted by securities laws and other legal requirements.
The Buyback Program does not obligate the Company to repurchase any specific number of shares and may be discontinued, modified or suspended at any time. The Buyback Program commenced in June 2023 and during the year ended December 31,
2023, the Company repurchased 15,240,471 Ordinary shares at an average price of $3.62 per share (excluding broker and transaction fees of $367 ).
As of December 31, 2023, the Company had remaining authorization to repurchase up to an aggregate amount of $24,854 , which has been
mostly utilized subsequent to the balance sheet date.
Subsequent to December 31, 2023, in February 2024, the Company’s board of directors authorized up to $
119
| NOTE 16:- |
EMPLOYEES CONTRIBUTION PLAN
|
| a. |
Pursuant to Israel’s Severance Pay Law, Israeli employees are entitled to severance pay equal to
|
| b. |
The Company offers a 401(k) Savings plan in the U.S. that qualifies as a deferred salary arrangement under Section 401(k) of the Internal Revenue Code (the “401(k) Plan”). Under the 401(k) Plan, participating
employees can contribute up to
|
| NOTE 17:- |
INCOME TAXES
|
|
Tax rates
|
Ordinary taxable income in Israel is subject to a corporate tax rate of 23 %. However, the effective tax rate payable by a company that derives income from a Preferred Technological Enterprise (as discussed below) may be considerably lower. Non-Israeli
subsidiaries are taxed according to the tax laws in their jurisdictions.
|
Tax benefits applicable to the Company
|
The Law for the Encouragement of Industry (Taxes), 1969:
The Law for the Encouragement of Industry (Taxes), 1969 (the “Encouragement of Industry Law”), provides several tax benefits for “Industrial
Companies”. Pursuant to the Encouragement of Industry Law, a company qualifies as an Industrial Company if it is a resident of Israel, the enterprise should be located in Israel and at least 90% of its income in any tax year (exclusive of income
from government loans, capital gains, interest and dividends) is generated from an “Industrial Enterprise” that it owns. An Industrial Enterprise is defined as an enterprise whose principal activity, in a given tax year, is industrial activity.
An Industrial Company is entitled to certain tax benefits, including: (i) a deduction of the cost of purchases of patents, know-how and certain
other intangible property rights (other than goodwill) used for the development or promotion of the Industrial Enterprise in equal amounts over a period of eight years, beginning from the year in which such rights were first used, (ii) the right to
elect to file consolidated tax returns, under certain conditions, with additional Israeli Industrial Companies controlled by it, and (iii) the right to deduct expenses related to public offerings in equal amounts over a period of three years
beginning from the year of the offering.
Eligibility for benefits under the Encouragement of Industry Law is not contingent upon the approval of any governmental authority. The Company
believes that it currently qualifies as an industrial company within the definition of the Encouragement of Industry Law.
120
| NOTE 17:- |
INCOME TAXES (Cont.)
|
Tax benefits under the Law for the Encouragement of Capital Investments, 1959:
Pursuant to the Israeli Law for Encouragement of Capital Investments, 1959 (the “Investments Law”) and its various amendments, the Company has been
granted a “Privileged Enterprise” status. The Company has utilized a tax exemption status for the years 2018 and 2019.
The benefits available to a Privileged Enterprise in Israel relate only to taxable income attributable to the specific investment program and are
conditioned upon terms stipulated in the Investments Law. If the Company does not fulfill these conditions, in whole or in part, the benefits can be revoked, and the Company may be required to refund the benefits, in an amount linked to the Israeli
consumer price index plus interest.
Tax exempt earnings are subject to claw back of the corporate tax return when they are distributed as dividend.
On November 15, 2021, the Investments Law was amended in order, inter alia, to encourage companies to voluntarily elect for an immediate payment
of corporate tax on previously tax-exempted earnings which were earned pursuant to Approved and Privileged Enterprises (the “Amendment”). The Amendment provides a reduced corporate tax payment on Exempt Earnings accumulated until December 30,
2020, that were not yet distributed as a dividend, all subject to certain qualifying terms and conditions.
The Company had $45,244 in
tax-exempt earnings attributable to the Privileged Enterprise programs. The Company elected to utilize the Amendment in December 2021 and paid the reduced corporate income tax in the amount of approximately $4,355 . As a result of the election, as of December 31, 2021 the Company released all of its previously tax-exempt earnings and they are no longer
subject to claw back of corporate taxes upon future dividend distribution.
The Technological Enterprise Incentives Regime (Amendment 73 to the Investments Law):
The Company applies various benefits allotted to it under the revised Investments Law as per Amendment 73 to the Investments Law regimes through
regulations that have come into effect from January 1, 2017. Applicable benefits under the new regime include:
| ● |
Introduction of a benefit regime for “Preferred Technology Enterprises” (“PTE”), granting a 12% tax rate in central Israel on income deriving from benefited intangible assets, subject
to a number of conditions being fulfilled, including a minimal amount or ratio of annual research and development expenditure and research and development employees, as well as having at least 25% of annual income derived from exports to
large markets. PTE is defined as an enterprise which meets the aforementioned conditions and for which total consolidated revenues of its parent company and all subsidiaries are less than NIS 10 billion.
A “Special Preferred Technological Enterprise” (“SPTE”) from which total consolidated revenues of the Group of which the Company is a member exceeds NIS 10 billion in the tax year will
be subject to tax at a rate of 6% on preferred income from the enterprise, regardless of the enterprise’s geographical location.
|
| ● |
A 12% capital gains tax rate on the sale of a preferred intangible asset to a foreign affiliated enterprise, provided that the asset was initially purchased from a foreign resident at
an amount of NIS 200 million or more.
|
121
| NOTE 17:- |
INCOME TAXES (Cont.)
|
| ● |
A withholding tax rate of 20% for dividends paid from PTE income (with an exemption from such withholding tax applying to dividends paid to an Israeli company) may be reduced to 4% on
dividends paid to a foreign resident company, subject to certain conditions regarding percentage of foreign ownership of the distributing entity.
|
The Company is eligible for PTE status which is implemented commencing 2021 and believes it is eligible for its tax benefits.
In 2023, the Company received a Tax Ruling from the Israeli Tax Authority that its activity is an industrial activity and is eligible for the status of a PTE, provided that the Company meets the requirements under the tax
ruling. As of December 31, 2023, management believes that the Company meets the aforementioned conditions.
|
U.S. Tax
|
On December 22, 2017, the Tax Cuts and Jobs Act (P.L. 115-97) (“TCJA”) was enacted, making significant changes to the U.S. tax law. Changes include,
but are not limited to, a corporate income tax rate decrease from 35 % to 21 %, effective for tax years beginning January 1, 2018 and the transition of U.S. international taxation from a worldwide tax system to a modified territorial system, with a one-time
mandatory transition tax on U.S. shareholder’s share of post-1986 earnings of all foreign corporations in which it owns at least 10 % and
created new taxes on certain foreign-sourced earnings and certain related-party payments - the Global Intangible Low Taxed Income (“GILTI”). Furthermore, changes introduced by the Tax Act to Section 174 of the Internal Revenue Code, that came into
effect on January 1, 2022, require taxpayers to amortize research and development expenditures over five years (if expensed by a U.S. entity) or fifteen years (if expensed by non-U.S. entities), thereby increasing taxable income and payable tax.
In addition to lowering the statutory corporate income tax rate from 35 % to 21 %, and among other U.S. international tax provisions, the TCJA
introduced the Base Erosion Anti-abuse Tax (“BEAT”) which applies a minimum tax on multinational corporations by requiring companies subject to the BEAT to pay the greater of their regular tax liability (less certain credits, including foreign tax
credits) or 10 % for taxable years beginning in 2019 (12.5 % after 2026) of a modified tax base which adds back certain related party payments. The BEAT comparison to the standard corporate income tax must be done each year if the taxpayer’s
“base erosion” related party payments exceed 3 % of total deductions on its U.S. tax return (“base erosion percentage” is generally the
aggregate amount of base erosion tax benefits divided by aggregate amount of all allowable deductions).
The BEAT applies to “applicable taxpayers” making “base erosion payments” (deductible payments) to foreign related parties. “Applicable taxpayers”
are U.S. corporations with average annual gross receipts for the 3-taxable-year period ending with the preceding taxable year are at least $500,000. Taboola Inc. is an “applicable taxpayer” for BEAT purposes in 2023.
122
| NOTE 17:- |
INCOME TAXES (Cont.)
|
|
Pillar two
|
In December 2021, the Organization for Economic Co-operation and Development Inclusive Framework on Base Erosion Profit Shifting released
Model Global Anti-Base Erosion rules (“Model Rules”) under Pillar Two. The Model Rules set forth the “common approach” for a global minimum tax rate at 15% for multinational enterprises with a turnover of more than Euros 750 million. Rules under
Pillar Two were effective from January 1, 2024.
The Company is currently evaluating the impact of adopting Pillar Two rules on its consolidated financial statements. In certain jurisdictions, information required for the assessment is still being gathered and, therefore, the assessment is
not complete. Based on the transitional CbCR safe harbor tests carried out so far, Taboola Group has identified potential impact to Pillar Two top-up taxes on profits earned in Australia, Korea and Thailand. The potential impact comes from the
constituent entities in these jurisdictions where according to the transitional CbCR safe harbor tests, the simplified effective tax rate is below 15%. Quantitative information to indicate the impact to Pillar Two top-up taxes is currently not
known or reasonably estimable. Taboola continues to progress on the assessment and expects to complete the assessment during the year 2024.
|
|
a. |
The components of the loss before taxes were as follows:
|
|
Year ended
December 31,
|
||||||||||||
|
2023
|
2022
|
2021
|
||||||||||
|
Israel
|
$
|
(
|
)
|
$
|
(
|
)
|
$
|
(
|
)
|
|||
|
Foreign
|
(
|
)
|
|
|
||||||||
|
Total
|
$
|
(
|
)
|
$
|
(
|
)
|
$
|
(
|
)
|
|||
|
|
b. |
Taxes on income (tax benefit) are comprised as follows:
|
|
Year ended
December 31,
|
||||||||||||
|
2023
|
2022
|
2021
|
||||||||||
|
Current:
|
||||||||||||
|
Israel
|
$
|
|
$
|
|
$
|
|
||||||
|
Foreign
|
|
|
|
|||||||||
|
Total current income tax expense
|
|
|
|
|||||||||
|
Deferred:
|
||||||||||||
|
Israel
|
|
|
|
|||||||||
|
Foreign
|
(
|
)
|
(
|
)
|
(
|
)
|
||||||
|
Total deferred income tax benefit
|
(
|
)
|
(
|
)
|
(
|
)
|
||||||
|
Total income taxes
|
$
|
|
$
|
|
$
|
|
||||||
123
| NOTE 17:- |
INCOME TAXES (Cont.)
|
A reconciliation of the Company’s theoretical income tax expense to actual income tax expense is as follows:
|
Year ended
December 31,
|
||||||||||||
|
2023
|
2022
|
2021
|
||||||||||
|
Loss before taxes on
income, as reported in the consolidated statements of loss
|
$
|
(
|
)
|
$
|
(
|
)
|
$
|
(
|
)
|
|||
|
Statutory tax rate in Israel
|
|
%
|
|
%
|
|
%
|
||||||
|
Preferred Technology Enterprise
|
(
|
%)
|
(
|
%)
|
(
|
%)
|
||||||
|
Permanent difference - nondeductible expenses
|
(
|
%)
|
|
%
|
(
|
%)
|
||||||
|
Change in valuation allowance
|
(
|
%)
|
(
|
%)
|
(
|
%)
|
||||||
|
Income taxes at a rate other than the Israel statutory tax rate
|
( |
%) | ( |
%) | ( |
%) | ||||||
|
Release of tax-exempt profits under preferred enterprise tax
regime
|
( |
%) | ||||||||||
| Prior year taxes |
% | % | % | |||||||||
| Uncertain tax positions |
( |
%) | ( |
%) | ( |
%) | ||||||
|
Other
|
|
%
|
|
%
|
(
|
%)
|
||||||
|
Effective tax rate
|
(
|
%)
|
(
|
%)
|
(
|
%)
|
||||||
Deferred tax assets and liabilities:
Deferred taxes reflect the net tax effects of temporary differences between the carrying amounts of assets and liabilities for
financial reporting purposes and the amounts used for income tax purposes. As of December 31, 2023 and 2022, the deferred tax assets and liabilities presented in the balance sheet are comprised as follow:
|
December 31,
|
||||||||
|
2023
|
2022
|
|||||||
|
Deferred tax assets
|
$
|
|
$
|
|
||||
|
Deferred tax liabilities
|
$ |
(
|
)
|
$ |
(
|
)
|
||
124
| NOTE 17:- |
INCOME TAXES (Cont.)
|
As of December 31, 2023, and 2022 the Company’s deferred taxes were in respect of the following:
|
December 31,
|
||||||||
|
2023
|
2022
|
|||||||
|
Operating lease liabilities
|
$ | $ | ||||||
| Research and development | ||||||||
| Share-based compensation expenses | ||||||||
|
Tax credit carry forward
|
||||||||
|
Reserves and allowances
|
|
|
||||||
|
Carry forward tax losses
|
||||||||
|
Issuance and transaction expenses
|
||||||||
|
Intangible assets, net
|
||||||||
|
Other
|
||||||||
|
Deferred tax assets before valuation allowance
|
|
|
||||||
|
Valuation allowance
|
(
|
)
|
(
|
)
|
||||
|
Deferred tax assets
|
|
|
||||||
|
Intangible assets, net
|
(
|
)
|
(
|
)
|
||||
|
Operating lease right of use assets
|
(
|
)
|
(
|
)
|
||||
|
Property and equipment, net
|
(
|
)
|
(
|
)
|
||||
| Capitalized research and development |
( |
) | ||||||
|
Other
|
(
|
)
|
(
|
)
|
||||
|
Deferred tax liabilities
|
(
|
)
|
(
|
)
|
||||
|
Deferred tax liabilities, net
|
$
|
(
|
)
|
$
|
(
|
)
|
||
A valuation allowance is provided when it is more likely than not that the deferred tax assets will not be realized. The
Company has established a valuation allowance to offset certain deferred tax assets on December 31, 2023 and 2022, due to the uncertainty of realizing future tax benefits from its net operating loss carryforwards and other deferred tax assets.
As of December 31, 2023, the Company has an accumulated tax loss carry-forward of approximately $64,062 in Israel, which does not have an expiration date, and $1,533 federal tax in the U.S. which can be offset in accordance with the limitation as desribed in Section 382 of the code due to U.S. subsidiary’s prior “change in ownership”. The annual limitation may result in
the expiration of net operating losses before utilization.
As of December 31, 2023, $149,887
of undistributed earnings held by the Company’s foreign subsidiaries are designated as indefinitely reinvested. If these earnings were re-patriated to Israel, they would be subject to income taxes and to an adjustment for foreign tax credits and
foreign withholding taxes in the amount of $13,006 . The Company did not recognize deferred taxes liabilities on undistributed earnings of
its foreign subsidiaries, as the Company intends to indefinitely reinvest those earnings.
A reconciliation of the beginning and ending balance of total unrecognized tax positions is as follows:
|
Year ended
December 31,
|
||||||||
|
2023
|
2022
|
|||||||
|
Unrecognized tax position, beginning of year
|
$
|
|
$
|
|
||||
|
Increase (decrease) related to prior years’ tax positions (1)
|
|
(
|
)
|
|||||
|
Increase related to current year tax positions
|
|
|
||||||
|
Decrease due to lapses of statutes of limitations
|
(
|
)
|
(
|
)
|
||||
|
Unrecognized tax position, end of year
|
$
|
|
$
|
|
||||
___________________________________________
|
(1)
|
|
125
| NOTE 17:- |
INCOME TAXES (Cont.)
|
As of December 31, 2023, the total amount of gross uncertain tax benefits was $8,216 , out of which an amount of $8,129 , if recognized, would
affect the Company’s effective tax rate. The Company operates in multiple jurisdictions throughout the world, and its tax returns are periodically audited or subject to review by both domestic and foreign authorities. The Company currently does not
expect uncertain tax positions to change significantly over the next 12 months, except in the case of settlements with tax authorities, the likelihood and timing of which is difficult to estimate.
As of December 31, 2023 and 2022, unrecognized tax benefit in the amount of $87 and $81 , was presented net of deferred tax assets.
Tax assessments:
The Company has final tax assessments in Israel through 2018, in the UK through 2018, and in the US through 2019.
| NOTE 18:- |
COMMITMENTS AND CONTINGENCIES
|
Commercial Commitments
In the ordinary course of the business, the Company enters into agreements with certain digital properties, under which, in
some cases it agrees to pay them a guaranteed amount, generally per thousand page views on a monthly basis. These agreements could cause a gross loss on digital property accounts in which the guarantee is higher than the actual revenue generated.
These contracts generally range in duration from 2 to 5 years, though some can be shorter or longer.
Non-cancelable Purchase Obligations
In the normal course of business, the Company enters into non-cancelable purchase commitments with various parties to purchase
primarily software and IT related-based services. As of December 31, 2023, the Company had outstanding non-cancelable purchase obligations in the amount of $27,128 .
Legal Proceedings
| a. |
In April 2021, the Company became aware that the Antitrust Division of the U.S. Department of Justice is conducting a criminal investigation of hiring activities in the Company’s industry, including the
Company. The Company cooperated with the Antitrust Division.
In
July 2023, the Company was notified in writing by the Antitrust Division of the U.S. Department of Justice that it was no longer a subject or target of the previously disclosed criminal investigation of hiring activities in the
Company’s industry, including the Company.
|
| b. |
In the ordinary course of business, the Company may be subject from time to time to various proceedings, lawsuits, disputes, or claims. The Company investigates these claims as they arise and record a
provision, as necessary. Provisions are reviewed and adjusted to reflect the impact of negotiations, estimated settlements, legal rulings, advice of legal counsel and other information and events pertaining to a particular matter.
Although claims are inherently unpredictable, the Company is currently not aware of any matters that, it believes would individually, or in the aggregate, have a material adverse effect on its business, financial position, results of
operations, or cash flows.
|
126
| NOTE 19:- |
RELATED PARTY TRANSACTIONS
|
The Company is a party to certain transaction-related agreements with Yahoo, pursuant to which the Company issued 39,525,691 Ordinary shares and 45,198,702
Non-voting Ordinary shares to Yahoo, and granting Yahoo the right to appoint one representative to the Company’s board of directors,
resulting in Yahoo to become a principal shareholder effective the Transaction closing on January 17, 2023 (see Note 1b).
The Company and its affiliates are parties to several agreements in the ordinary course of business with Yahoo and its affiliates. In connection with these agreements, for the year ended December 31, 2023, the
Company recorded revenues from Yahoo in the amount of $40,902 . In addition, the Company recorded traffic acquisition costs related to
Yahoo for the year ended December 31, 2023, in the amount of $45,183 , respectively. Traffic acquisition costs noted herein are
unaffiliated with the Yahoo revenues recorded for this period.
As of December 31, 2023, in regards to Yahoo, the Company’s balances of trade receivables were $12,297 ,
and its balances of trade payables were $38,657 , associated with the revenues presented on a gross and net basis.
The Company and Yahoo, pursuant to the Omnibus Agreement entered into on November 28, 2022,
each agreed to pay certain expenses in connection with the transaction and each party agreed to reimburse the other for some or all of these expenses. Under these arrangements, the Company recognized $3,650 , of expenses, net for the year ended December 31, 2023.
| NOTE 20:- |
GEOGRAPHIC INFORMATION
|
The
following table represents total revenue by geographic area based on the Advertisers’ billing address:
|
|
|
Year ended
December 31,
|
|
|||||||||
|
|
|
2023
|
|
|
2022
|
|
|
2021
|
|
|||
|
Israel
|
|
$
|
|
|
|
$
|
|
|
|
$
|
|
|
|
United States
|
|
|
|
|
|
|
|
|
|
|
|
|
|
United Kingdom
|
|
|
|
|
|
|
|
|
|
|
|
|
|
Germany
|
|
|
|
|
|
|
|
|
|
|
|
|
|
Rest of the world
|
|
|
|
|
|
|
|
|
|
|
|
|
|
Total
|
|
$
|
|
|
|
$
|
|
|
|
$
|
|
|
The following table represents the Company’s
long-lived assets (1), net by geographic area:
|
|
|
December 31,
|
|
|||||
|
|
|
2023
|
|
|
2022
|
|
||
|
Israel
|
|
$
|
|
|
|
$
|
|
|
|
United States
|
|
|
|
|
|
|
|
|
|
United Kingdom
|
|
|
|
|
|
|
|
|
|
Rest of the world
|
|
|
|
|
|
|
|
|
|
Total
|
|
$
|
|
|
|
$
|
|
|
___________________________________________
(1) Long-lived assets are comprised of property and equipment, net and operating lease right-of-use assets
127
| NOTE 21:- |
NET LOSS PER SHARE ATTRIBUTABLE TO
ORDINARY AND NON-VOTING ORDINARY SHAREHOLDERS
|
|
Year ended
December 31,
|
||||||||||||||||||||||||
|
2023
|
2022
|
2021
|
||||||||||||||||||||||
|
Ordinary
shares
|
Non-voting
Ordinary
shares
|
Ordinary
shares
|
Non-voting
Ordinary
shares
|
Ordinary shares
|
Non-voting
Ordinary
shares
|
|||||||||||||||||||
|
Numerator:
|
||||||||||||||||||||||||
|
Net loss attributable to Ordinary shareholders, basic and diluted
|
$ | ( |
) | $ | ( |
) | $ | ( |
) |
$
|
|
$ | ( |
) | $ | |||||||||
|
Denominator:
|
||||||||||||||||||||||||
|
Weighted-average shares used in computing net loss per share attributable to Ordinary shareholders, basic and diluted
|
||||||||||||||||||||||||
|
Net loss per share attributable to Ordinary and Non-voting Ordinary shareholders, basic and diluted
|
$ | ( |
) | $ | ( |
) | $ | ( |
) |
$
|
|
$ | ( |
) |
$
|
|
||||||||
The
potential number of Ordinary shares that were excluded from the computation of diluted net loss per share attributable to Ordinary shareholders for the periods presented because including them would have been anti-dilutive is as follows:
|
|
|
Year ended
December 31,
|
|
|||||||||
|
|
|
|
2023
|
|
|
|
2022
|
|
|
|
2021
|
|
|
RSUs
|
|
|
|
|
|
|
|
|
|
|
|
|
|
Outstanding share options
|
|
|
|
|
|
|
|
|
|
|
|
|
|
Warrants
|
|
|
|
|
|
|
|
|
|
|
|
|
|
Issuable Ordinary shares related to business combination under holdback arrangement
|
|
|
|
|
|
|
|
|
|
|
|
|
|
Total
|
|
|
|
|
|
|
|
|
|
|
|
|
| ITEM 9: |
CHANGES IN AND DISAGREEMENTS WITH ACCOUNTANTS
|
None.
| ITEM 9A: |
CONTROLS AND PROCEDURES
|
Evaluation of Disclosure Controls and Procedures
We maintain disclosure controls and procedures (as that term is defined in Rules 13a-15(e) and 15d-15(e) under the Securities Exchange Act of 1934, as amended) that are designed to ensure that
information required to be disclosed in the Company’s reports under the Exchange Act is recorded, processed, summarized and reported within the time periods specified in the SEC’s rules and forms and that such information is accumulated and
communicated to our management, including our Chief Executive Officer and Chief Financial Officer, as appropriate, to allow timely decisions regarding required disclosures. Any controls and procedures, no matter how well designed and operated,
can provide only reasonable assurance of achieving the desired control objectives. Our management, with the participation of our Chief Executive Officer and Chief Financial Officer, has evaluated the effectiveness of the design and operation of
our disclosure controls and procedures as of December 31, 2023. Based upon that evaluation, our Chief Executive Officer and Chief Financial Officer concluded that, as of December 31, 2023, our disclosure controls and procedures were effective
to accomplish their objectives at the reasonable assurance level.
Management’s Annual Report on Internal Control over Financial Reporting
Our management is responsible for establishing and maintaining adequate internal control over financial reporting (as defined in Rules 13a-15(f) and
15d-15(f) under the Exchange Act). Our internal control over financial reporting is a process designed to provide reasonable assurance regarding the reliability of financial reporting and the preparation of
financial statements for external purposes in accordance with U.S generally accepted accounting principles. Our internal control over financial reporting includes those policies and procedures that (i) pertain to the maintenance of records
that, in reasonable detail, accurately and fairly reflect the transactions and dispositions of the assets of the Company; (ii) provide reasonable assurance that transactions are recorded as necessary to permit preparation of financial
statements in accordance with generally accepted accounting principles, and that receipts and expenditures of the Company are being made only in accordance with authorizations of management and directors of the Company; and (iii) provide
reasonable assurance regarding prevention or timely detection of unauthorized acquisition, use, or disposition of the Company’s assets that could have a material effect on the financial statements.
Under the supervision and with the participation of our management, including our principal executive officers and principal financial officer, we conducted
an evaluation of the effectiveness of our internal control over financial reporting as of December 31, 2023, based on the criteria set forth by the Committee of Sponsoring Organizations of the
Treadway Commission (COSO) in Internal Control—Integrated Framework (2013). Based on this evaluation, management concluded that our
internal control over financial reporting was effective as of December 31, 2023.
The effectiveness of our internal control over financial reporting as of December 31, 2023 has been audited by Kost Forer Gabbay & Kasierer, A Member of Ernst & Young Global, an
independent registered public accounting firm, as stated in their report which is included in Part II, Item 8 of this Annual Report on Form 10-K.
Changes in Internal Control over Financial Reporting
There were no changes in our internal controls over financial reporting (as such term is defined in Rules 13a-15(f) and 15d-15(f) under the Securities Exchange Act) that occurred during the
quarter ended December 31, 2023 that have materially affected, or are reasonably likely to materially affect, our internal control over financial reporting.
| ITEM 9C. |
DISCLOSURE REGARDING FOREIGN JURISDICTIONS THAT PREVENT INSPECTIONS
|
None.
PART III
The information required to be disclosed by this item is incorporated herein by reference to the 2024 Proxy Statement, which we expect to file with the SEC within 120 days after the end of
our fiscal year ended December 31, 2023.
We have adopted a Code of Conduct that applies to all our employees, officers and directors. Our Code of Conduct addresses, among other things, competition and fair dealing, gifts and
entertainment, conflicts of interest, international business laws, financial matters and external reporting, company assets, confidentiality and corporate opportunity requirements and the process for reporting violations of the Code of
Conduct.
We will disclose on our website any amendment to, or waiver from, a provision of our Code of Conduct that applies to our directors or executive officers to the extent required under the
rules of the SEC or the Nasdaq. Our Code of Business Conduct is available on our website at https://investors.taboola.com/corporate-governance/governance-overview.
The information required to be disclosed by this item is incorporated herein by reference to the 2024 Proxy Statement, which we expect to file with the SEC within 120 days after the end of
our fiscal year ended December 31, 2023.
| ITEM 12. |
SECURITY OWNERSHIP OF CERTAIN BENEFICIAL OWNERS AND MANAGEMENT AND RELATED SHAREHOLDER MATTERS
|
The information required to be disclosed by this item is incorporated herein by reference to the 2024 Proxy Statement, which we expect to file with the SEC within 120 days after the end of
our fiscal year ended December 31, 2023.
| ITEM 13. |
CERTAIN RELATIONSHIPS AND RELATED TRANSACTIONS, AND DIRECTOR INDEPENDENCE
|
The information required to be disclosed by this item is incorporated herein by reference to the 2024 Proxy Statement, which we expect to file with the SEC within 120 days after the end of
our fiscal year ended December 31, 2023.
| ITEM 14. |
PRINCIPAL ACCOUNTING FEES AND SERVICES
|
The information required to be disclosed by this item is incorporated herein by reference to the 2024 Proxy
Statement, which we expect to file with the SEC within 120 days after the end of our fiscal year ended December 31, 2023.
We have filed the following documents as part of this Form 10-K:
1. Consolidated Financial Statements:
| 83 | |
| 85 | |
| 86 | |
| 87 | |
| 88 | |
| 89 |
|
| 91 |
2. All schedules have been omitted because they are not required, not applicable, not present in amounts sufficient to require submission of the schedule, or the required information is otherwise included.
3. Exhibits
Exhibit Index
|
|
|
|
Incorporated by Reference
|
|||||||||
|
Exhibit No.
|
Exhibit Description
|
Form
|
File No.
|
Exhibit
|
Filing Date
|
Filed
/Furnished
Herewith
|
||||||
|
|
3.1
|
|
8-K
|
|
001-40566
|
|
3.1
|
|
January 17, 2023
|
|
|
|
|
|
4.1
|
|
|
|
|
|
|
|
|
|
*
|
|
|
|
4.2
|
|
F-4
|
|
333-255684
|
|
4.5
|
|
April 30, 2021
|
|
|
|
|
|
4.3
|
|
F-4
|
|
333-255684
|
|
4.6
|
|
April 30, 2021
|
|
|
|
|
|
10.1††
|
|
F-4
|
|
333-255684
|
|
10.10
|
|
April 30, 2021
|
|
|
|
|
|
10.2††
|
|
20-F
|
|
001-40566
|
|
4.5
|
|
March 24, 2022
|
|
|
|
|
|
10.3††
|
|
|
|
|
|
|
|
|
|
*
|
|
|
|
10.4††
|
|
F-4
|
|
333-255684
|
|
10.8
|
|
April 30, 2021
|
|
|
|
|
|
10.5††
|
|
F-4
|
|
333-255684
|
|
10.9
|
|
April 30, 2021
|
|
|
|
|
|
10.6†
|
|
F-1/A
|
|
333-257879
|
|
2.3
|
|
September 1, 2021
|
|
|
|
|
|
10.7
|
|
F-4
|
|
333-255684
|
|
4.10
|
|
April 30, 2021
|
|
|
|
|
|
10.8
|
|
6-K
|
|
001-40566
|
|
99.2
|
|
September 1, 2021
|
|
|
|
|
|
10.9
|
|
6-K
|
|
001-40566
|
|
99.3
|
|
September 1, 2021
|
|
|
|
|
|
10.10†
|
|
6-K
|
|
001-40566
|
|
99.1
|
|
August 22, 2022
|
|
|
|
|
|
10.11†
|
|
10-Q
|
|
001-40566
|
|
10.2
|
|
August 9, 2023
|
|
|
|
|
|
10.12†
|
|
8-K
|
|
001-40566
|
|
10.1
|
|
January 17, 2023
|
|
|
|
|
|
10.13†
|
|
8-K
|
|
001-40566
|
|
10.2
|
|
January 17, 2023
|
|
|
|
|
|
10.14††
|
|
10-K
|
|
001-40566
|
|
10.12
|
|
March 13, 2023
|
|
|
|
|
|
10.15††
|
|
10-Q
|
|
001-40566
|
|
10.1
|
|
August 9, 2023
|
|
|
|
|
|
10.16#††
|
|
10-K
|
|
001-40566
|
|
10.14
|
|
March 13, 2023
|
|
|
|
|
|
10.17††
|
|
10-K
|
|
001-40566
|
|
10.15
|
|
March 13, 2023
|
|
|
|
|
|
10.18††
|
|
10-K
|
|
001-40566
|
|
10.16
|
|
March 13, 2023
|
|
|
|
|
|
10.19††
|
|
10-K
|
|
001-40566
|
|
10.17
|
|
March 13, 2023
|
|
|
|
|
|
10.20††
|
|
10-K
|
|
001-40566
|
|
10.18
|
|
March 13, 2023
|
|
|
|
|
|
10.21††
|
|
|
|
|
|
|
|
|
|
*
|
|
|
|
21
|
|
|
|
|
|
|
|
|
|
*
|
|
|
|
23
|
|
|
|
|
|
|
|
|
|
*
|
|
|
|
31.1
|
|
|
|
|
|
|
|
|
|
*
|
|
|
|
31.2
|
|
|
|
|
|
|
|
|
|
*
|
|
|
|
32
|
|
|
|
|
|
|
|
|
|
*
|
|
|
|
97
|
|
|
|
|
|
|
|
|
|
*
|
|
|
|
101.INS
|
Inline XBRL Instance Document
|
|
|
|
|
|
|
|
|
|
|
|
|
101.SCH
|
Inline XBRL Taxonomy Extension Schema Document
|
|
|
|
|
|
|
|
|
|
|
|
|
101.CAL
|
Inline XBRL Taxonomy Extension Calculation Linkbase Document
|
|
|
|
|
|
|
|
|
|
|
|
|
101.DEF
|
Inline XBRL Taxonomy Extension Definition Linkbase Document
|
|
|
|
|
|
|
|
|
|
|
|
|
101.LAB
|
Inline XBRL Taxonomy Extension Label Linkbase Document
|
|
|
|
|
|
|
|
|
|
|
|
|
101.PRE
|
Inline XBRL Taxonomy Extension Presentation Linkbase Document
|
|
|
|
|
|
|
|
|
|
|
|
|
104
|
Cover Page Interactive Data File (embedded with the Inline XBRL document)
|
|
|
|
|
|
|
|
|
|
|
* Filed herewith.
** Furnished herewith.
# Certain confidential portions (indicated by brackets and asterisks) have been omitted from this exhibit.
† Certain schedules and exhibits to this Exhibit omitted pursuant to Regulation S-K Item 601(b)(2). The Registrant agrees to furnish supplementally a copy of any omitted schedule or exhibit
to the SEC upon request.
†† Indicates a management contract or compensatory plan.
Certain agreements filed as exhibits to this Annual Report contain representations and warranties that the parties thereto made to each other. These representations and warranties have been
made solely for the benefit of the other parties to such agreements and may have been qualified by certain information that has been disclosed to the other parties to such agreements and that may not be reflected in such agreements. In
addition, these representations and warranties may be intended as a way of allocating risks among parties if the statements contained therein prove to be incorrect, rather than as actual statements of fact. Accordingly, there can be no reliance
on any such representations and warranties as characterizations of the actual state of facts. Moreover, information concerning the subject matter of any such representations and warranties may have changed since the date of such agreements.
Not applicable.
Unless otherwise stated or unless the context otherwise requires, the terms “Company,” “the registrant,” “our company,” “the company,” “we,” “us,” “our,” “ours,” and “Taboola” refer to Taboola.com Ltd., a
company organized under the laws of the State of Israel, and its consolidated subsidiaries. In this Annual Report:
“Advertisers” means advertisers, merchants, affiliate networks and their respective brands and agencies.
“Board” means the Taboola.com Ltd. Board of Directors.
“Business Combination” means the merger pursuant to the Merger Agreement, whereby Merger Sub merged with and into ION, with ION surviving the merger, and the other transactions contemplated
by the Merger Agreement, which we consummated on June 29, 2021.
“Connexity” means, Shop Holding Corporation, a Delaware corporation
“Effective Time” means the effective time of the closing of the Business Combination.
“Investors’ Rights Agreement” means the Amended and Restated Investors’ Rights Agreement, effective as of the Effective Time, pursuant to which each of the Sponsors, and certain of Taboola’s
shareholders were granted certain resale registration rights with respect to any Ordinary shares or Warrants.
“ION” means ION Acquisition Corp. 1 Ltd., a Cayman Islands exempted company.
“Merger Agreement” means the agreement and plan of merger, dated as of January 25, 2021, by and among ION, Taboola and Merger Sub.
“Merger Sub” means Toronto Sub Ltd., a Cayman Islands exempted company and wholly owned subsidiary of the Company.
“Non-voting Ordinary shares” means each non-voting ordinary share of Taboola, no par value per share, originally issued in connection with the Yahoo partnership and not entitled to
vote, except in limited circumstances as provided in Taboola’s Amended and Restated Articles of Association.
“Ordinary shares” means each ordinary share of Taboola, no par value per share, listed on NASDAQ and entitled to vote.
“Sponsors” means ION Holdings 1, LP and ION Co-Investment LLC.
“Taboola” means Taboola.com Ltd., a company organized under the laws of the State of Israel and its consolidated subsidiaries.
“Warrants” means warrants of Taboola issued to ION warrant holders and the Ordinary shares underlying such warrants.
All references in this Annual Report to “Israeli currency” and “NIS” refer to New Israeli Shekels, the terms “dollar,” “USD” or “$” refer to U.S. dollars and the terms “€” or “euro” refer to
the currency introduced at the start of the third stage of European economic and monetary union pursuant to the treaty establishing the European Community, as amended.
Pursuant to the requirements of Section 13 or 15(d) of the Securities Exchange Act of 1934, the registrant has duly caused this report to be signed on its behalf by the undersigned, on February 28, 2024, hereunto duly authorized.
|
By:
|
/s/ Stephen C. Walker
|
|
|
Name: Stephen C. Walker
|
||
|
Title: Chief Financial Officer
|
||
Pursuant to the requirements of the Securities Exchange Act of 1934, this report has been signed below on February 28, 2024 by the following persons on behalf of the registrant and in the capacities indicated.
|
Signature
|
Title
|
||
|
/s/ Adam Singolda
|
Chief Executive Officer and Director
|
||
|
/s/ Stephen C. Walker
|
Chief Financial Officer
|
||
|
/s/ Zvi Limon
|
Chairman of the Board
|
||
|
/s/ Deirdre Bigley
|
Director
|
||
|
/s/ Lynda Clarizio
|
Director
|
||
|
/s/ Monica Mijaleski
|
Director
|
||
|
/s/ Nechemia J. Peres
|
Director
|
||
|
/s/ Richard Scanlon
|
Director
|
||
|
/s/ Erez Shachar
|
Director
|
||
|
/s/ Gilad Shany
|
Director
|
135