UNITED STATES
SECURITIES AND EXCHANGE COMMISSION
Washington, D.C. 20549
FORM
(Mark One)
ANNUAL REPORT PURSUANT TO SECTION 13 OR 15(d) OF THE SECURITIES EXCHANGE ACT OF 1934 |
For the fiscal year ended
OR
TRANSITION REPORT PURSUANT TO SECTION 13 OR 15(d) OF THE SECURITIES EXCHANGE ACT OF 1934 |
For the transition period from to
Commission File Number
(Exact name of registrant as specified in its charter)
(State or other jurisdiction of incorporation or organization) |
(I.R.S. Employer Identification No.) |
(Address of principal executive offices) |
(Zip Code) |
Registrant’s telephone number, including area code: (
Securities registered pursuant to Section 12(b) of the Act:
Title of each class |
|
Trading Symbol(s) |
|
Name of each exchange on which registered |
|
|
Securities registered pursuant to Section 12(g) of the Act: None
Indicate by check mark if the registrant is a well-known seasoned issuer, as defined in Rule 405 of the Securities Act. Yes ☐
Indicate by check mark if the registrant is not required to file reports pursuant to Section 13 or Section 15(d) of the Act. Yes ☐
Indicate by check mark whether the registrant: (1) has filed all reports required to be filed by Section 13 or 15(d) of the Securities Exchange Act of 1934 during the preceding 12 months (or for such shorter period that the registrant was required to file such reports), and (2) has been subject to such filing requirements for the past 90 days.
Indicate by check mark whether the registrant has submitted electronically every Interactive Data File required to be submitted pursuant to Rule 405 of Regulation S-T (§232.405 of this chapter) during the preceding 12 months (or for such shorter period that the registrant was required to submit such files).
Indicate by check mark whether the registrant is a large accelerated filer, an accelerated filer, a non-accelerated filer, a smaller reporting company, or an emerging growth company. See the definitions of “large accelerated filer,” “accelerated filer,” “smaller reporting company,” and “emerging growth company” in Rule 12b-2 of the Exchange Act.
Large accelerated filer |
|
☐ |
|
|
☒ |
|
|
|
|
|
|||
Non-accelerated filer |
|
☐ |
|
Smaller reporting company |
|
|
|
|
|
|
|
|
|
Emerging growth company |
|
|
|
|
|
|
If an emerging growth company, indicate by check mark if the registrant has elected not to use the extended transition period for complying with any new or revised financial accounting standards provided pursuant to Section 13(a) of the Exchange Act.
Indicate by check mark whether the registrant has filed a report on and attestation to its management’s assessment of the effectiveness of its internal control over financial reporting under Section 404(b) of the Sarbanes-Oxley Act (15 U.S.C. 7262(b)) by the registered public accounting firm that prepared or issued its audit report.
If securities are registered pursuant to Section 12(b) of the Act, indicate by check mark whether the financial statements of the registrant included in the filing reflect the correction of an error to previously issued financial statements.
Indicate by check mark whether any of those error corrections are restatements that required a recovery analysis of incentive-based compensation received by any of the registrant’s executive officers during the relevant recovery period pursuant to §240.10D-1(b). ☐
Indicate by check mark whether the registrant is a shell company (as defined in Rule 12b-2 of the Act). YES ☐ NO
As of June 30, 2023, the aggregate market value of the registrant's common stock and non-voting common stock held by non-affiliates was approximately $
As of March 6, 2024, the number of shares of registrant’s common stock outstanding was
Documents Incorporated by Reference
Portions of the registrant's Definitive Proxy Statement relating to the 2024 Annual Meeting of Shareholders are incorporated by reference into Part III of this Annual Report on Form 10-K.
Table of Contents
|
|
Page |
PART I |
|
|
Item 1. |
3 |
|
Item 1A. |
19 |
|
Item 1B. |
42 |
|
Item 1C. |
42 |
|
Item 2. |
43 |
|
Item 3. |
44 |
|
Item 4. |
44 |
|
|
|
|
PART II |
|
|
Item 5. |
45 |
|
Item 6. |
46 |
|
Item 7. |
Management’s Discussion and Analysis of Financial Condition and Results of Operations |
47 |
Item 7A. |
64 |
|
Item 8. |
64 |
|
Item 9. |
Changes in and Disagreements With Accountants on Accounting and Financial Disclosure |
65 |
Item 9A. |
65 |
|
Item 9B. |
65 |
|
Item 9C. |
Disclosure Regarding Foreign Jurisdictions that Prevent Inspections |
65 |
|
|
|
PART III |
|
|
Item 10. |
66 |
|
Item 11. |
66 |
|
Item 12. |
Security Ownership of Certain Beneficial Owners and Management and Related Stockholder Matters |
66 |
Item 13. |
Certain Relationships and Related Transactions, and Director Independence |
66 |
Item 14. |
66 |
|
|
|
|
PART IV |
|
|
Item 15. |
67 |
|
Item 16. |
69 |
Important Notice about Information in this Annual Report
Unless we state otherwise or the context otherwise requires, references in this Annual Report on Form 10-K to “we,” “our,” “us,” “ourselves,” “the Company,” “Third Coast,” and “TCBX” refer to Third Coast Bancshares, Inc., a Texas corporation, and its consolidated subsidiaries. All references to “Third Coast Bank”, “the Bank”, or “our Bank” refer to Third Coast Bank, SSB, a Texas state savings bank and our wholly owned bank subsidiary. All references to “TCCC” and “Third Coast Commercial Capital” refer to Third Coast Commercial Capital, Inc., a Texas corporation and wholly owned subsidiary of the Bank.
The information contained in this Annual Report on Form 10-K is accurate only as of the date of this Annual Report on Form 10-K and as of the dates specified herein.
1
CAUTIONARY NOTE REGARDING FORWARD-LOOKING STATEMENTS
This Annual Report on Form 10-K contains “forward-looking statements” within the meaning of Section 27A of the Securities Act of 1933, as amended (the “Securities Act”), and Section 21E of the Securities Exchange Act of 1934, as amended (the “Exchange Act”). These forward-looking statements reflect our current views with respect to, among other things, future events and our financial performance. These statements are often, but not always, made through the use of words or phrases such as “may,” “should,” “could,” “predict,” “potential,” “believe,” “will likely result,” “expect,” “continue,” “will,” “anticipate,” “seek,” “estimate,” “intend,” “plan,” “projection,” “would” and “outlook,” or the negative version of those words or other comparable words or phrases of a future or forward-looking nature. These forward-looking statements are not historical facts, and are based on current expectations, estimates and projections about our industry, management’s beliefs and certain assumptions made by management, many of which, by their nature, are inherently uncertain and beyond our control. Accordingly, we caution you that any such forward-looking statements are not guarantees of future performance and are subject to risks, assumptions and uncertainties that are difficult to predict. Although we believe that the expectations reflected in these forward-looking statements are reasonable as of the date made, actual results may prove to be materially different from the results expressed or implied by the forward-looking statements.
There are or will be important factors that could cause our actual results to differ materially from those indicated in these forward-looking statements, including, but not limited to, the following:
If one or more events related to these or other risks or uncertainties materialize, or if our underlying assumptions prove to be incorrect, actual results may differ materially from what we anticipate. Accordingly, you should not place undue reliance on any such forward-looking statements. Any forward-looking statement speaks only as of the date on which it is made, and we do not undertake any obligation to publicly update or review any forward-looking statement, whether as a result of new information, future developments or otherwise, except as otherwise required by applicable laws. New factors emerge from time to time, and it is not possible for us to predict which will arise. In addition, we cannot assess the impact of each factor on our business or the extent to which any factor, or combination of factors, may cause actual results to differ materially from those contained in any forward-looking statements. For additional information with respect to factors that could cause actual results to differ from the expectations stated in the forward-looking statements, see "Risk Factors" under Part I—Item 1A of this Annual Report on Form 10-K.
2
PART I
Item 1. Business.
General
We are a bank holding company with headquarters in Humble, Texas that operates through our wholly owned subsidiary, the Bank, and the Bank’s wholly owned subsidiary, TCCC. We focus on providing commercial banking solutions to small and medium-sized businesses and professionals with operations in our markets. Our market expertise, coupled with a deep understanding of our customers’ needs, allows us to deliver tailored financial products and services. We currently operate fifteen branches in the Greater Houston, Dallas-Fort Worth, and Austin-San Antonio markets, and one branch in Detroit, Texas. We have experienced significant organic growth since commencing banking operations in 2008 as well as growth through our merger with Heritage Bancorp, Inc. As of December 31, 2023, we had, on a consolidated basis, total assets of $4.40 billion, total loans of $3.64 billion, total deposits of $3.80 billion and total shareholders' equity of $412.0 million.
On August 16, 2023, the Bank filed an application with the Texas Department of Banking (the “TDB”) to convert from a Texas state savings bank to a Texas banking association and has notified the Texas Department of Savings and Mortgage Lending (the “TDSML”), the Federal Reserve and the Federal Deposit Insurance Corporation (the “FDIC”) of the same. The Bank has received all necessary approvals to the conversion application, and the conversion is expected to become effective on March 13, 2024. Following the conversion, the Bank will be regulated by the TDB and will continue to be a member of the Federal Reserve System and regulated by the Federal Reserve.
Market Area
We currently operate primarily in three distinct but complementary metropolitan markets, the Greater Houston market, the Dallas-Fort Worth market, and the Austin-San Antonio market. We have eight branches in the Greater Houston market, including six branches located in the Houston – The Woodlands – Sugar Land, Texas Metropolitan Statistical Area (“MSA”) and two branches in the neighboring Beaumont MSA. We have three branches in the Dallas-Fort Worth market, with one location in the North Dallas area, one in Plano, and one in Fort Worth. We also have four branches in the Austin-San Antonio market, with one location in Georgetown, one in La Vernia, one in Nixon, and one in San Antonio. In addition, we have one branch in Detroit, Texas, located approximately 120 miles northeast of Dallas, Texas. We believe our footprint positions us for continued growth in and around the markets we serve.
Competition
The banking business is highly competitive, and our profitability depends upon our ability to compete with other banks and non-bank financial institutions located in each of our markets for lending opportunities, deposit funds, bankers and acquisition candidates. Our banking competitors in our target markets include various community banks and national and regional banks. We compete with other commercial banks, savings associations, credit unions, finance companies and money market mutual funds operating in our markets.
We are subject to vigorous competition in all aspects of our business from banks, savings banks, savings and loan associations, finance companies, credit unions and other providers of financial services, such as money market mutual funds, brokerage firms, consumer finance companies, asset-based non-bank lenders, insurance companies and certain other non-financial entities, including retail stores which may maintain their own credit programs and certain governmental organizations which may offer more favorable financing than we can. Many of the banks and other financial institutions with which we compete have significantly greater financial resources, marketing capability and name recognition than us and operate on a local, statewide, regional or nationwide basis.
Our business has capitalized on our team-oriented culture and diverse product and service offerings to successfully execute our high-touch, relationship driven approach to banking. We strive to know our customers better than our competition and believe our greatest opportunities for organic growth stem from the ability of our relationship managers to provide a greater level of attentiveness to customers and prospects than larger banks and our peers. As a result of consolidation among Texas metropolitan banks, we believe we are one of the few remaining locally-based banks in our markets that are dedicated to providing personalized service to small and medium-sized businesses with sophisticated banking needs.
Lending Activities
Lending limits. Our lending activities are subject to a variety of lending limits imposed by state and federal law. In general, we are subject to a legal limit on loans to a single borrower equal to 25% of the Bank’s Tier 1 capital. This limit increases or decreases as the Bank’s capital increases or decreases. As of December 31, 2023, our legal lending limit was $126.3 million, and our largest relationship was $51.0 million. In order to ensure compliance with legal lending limits and in accordance with our strong risk management culture, we maintain internal lending limits that are significantly less than the legal lending limits. We are able to sell
3
participations in our larger loans to other financial institutions, which allows us to manage the risk involved in these loans and to meet the lending needs of our customers requiring extensions of credit in excess of these limits.
Credit Department. The Bank’s credit department is overseen by the Bank’s Chief Credit Officer. The credit department consists of the following areas: Underwriting, Loan Monitoring, Special Assets, and Credit Analytics. Underwriters provide analytical and underwriting services in support of the loan officers developing their respective loan portfolios. The Bank’s underwriters are further trained to be our future lending officers. Loan monitoring specialists review borrower financial reports to determine compliance with covenants and borrowing bases. The Special Assets Officer works to minimize losses in the resolution of problem loan workouts, foreclosures and the disposition of other real estate owned. Credit administration personnel prepare and the Chief Credit Officer provides in-depth credit administration reporting to the Bank’s board of directors on a monthly and quarterly basis to aid the Bank’s board of directors in monitoring and adjusting the Bank’s loan focus as it grows.
Loan Review. The Bank has developed an internal loan risk rating system which utilizes risk rating worksheets based upon the type of loan and collateral. Currently, the Bank has risk rating worksheets within the community bank vertical for commercial and industrial loans, individual loans, non-owner occupied real estate loans, owner-occupied real estate loans, and 1-4 family construction loans. The middle market/corporate vertical has a risk rating worksheet tailored to its type of credits. The builder finance vertical has a risk rating worksheet for homebuilder lines and risk rating worksheet for acquisition and development loans. Risk rating worksheets are completed for substantially all new loan and renewal requests. In addition, an annual loan review form is completed on real estate loans of $2 million or greater, given that these loans tend to have longer terms than loans that are not secured by real estate. The loan officer will prepare the annual loan review form that updates the credit file with new financials, review of the collateral status, and provide any meaningful commentary that documents changes in the borrower’s overall condition. Upon completion of the annual loan review form, the loan officer must present the form to the Regional Credit Officer for final review, appropriate grade change if needed and then approval to place in the credit file for future reference. We believe this process gives the Chief Credit Officer and executive management strong insight into the underlying performance of the Bank’s loan portfolio, allowing for accurate and proper real-time grading of the loan portfolio.
The Bank also has a Special Assets Committee, which generally meets monthly to review loans graded substandard or worse, past due loans, overdrafts, and other real estate owned, and considers and approves other loan grade changes. On a quarterly basis, the meeting includes the review of loans graded special mention. For all loans graded special mention or worse, the loan officer is required to complete a problem asset report, which is submitted to the Special Assets Committee.
Additionally, we employ, from time to time, an external third-party loan review team to review up to a 40% penetration of the Bank’s entire loan portfolio. This review will generally include all large loan relationships, insider loans, and criticized loans.
Deposits
Our core deposits include checking accounts, money market accounts, savings accounts, a variety of certificates of deposit and individual retirement accounts. To attract deposits, we employ a relationship-based marketing approach in our primary service areas and feature a broad product line and competitive offerings. Many of our depositors are residents and businesses located in the markets we serve. We obtain these deposits through in-person, direct mailing, and digital marketing solicitation by our branch staff, lenders, officers, directors, and marketing department.
We also employ a national wholesale deposit strategy to attract and maintain large, relatively low-cost stable deposits through a number of core, fiduciary, and institutional deposit programs. In addition to traditional bank products and services, the deposit strategy includes the utilization of customer digital solutions to broaden the reach of our customer base.
Other Banking Services
We offer a broad array of financial products and services that we believe are easy to use and easy to understand. Our customers enjoy traditional bank products such as checking, savings, money markets, and CD accounts, as well as a full range of competitive banking services including retail and commercial online banking platforms, mobile banking apps, debit cards, credit cards, a suite of treasury management solutions, merchant card services and customer digital solutions.
Investments
As of December 31, 2023, our investment portfolio consisted of U.S. government and agency securities, mortgage-backed securities, agency collateralized mortgage obligations, and corporate bonds classified as available for sale. In the future, we may invest in, among other things, U.S. Treasury bills and notes, as well as in securities of federally sponsored agencies, such as Federal Home Loan Bank (“FHLB”) bonds. We may also invest in federal funds, negotiable certificates of deposit, banker’s acceptances, and tax-free bonds. No investment in any of those instruments will exceed any applicable limitation imposed by law or regulation. The Bank’s Asset Liability and Investment Committee (“ALCO”) reviews the investment portfolio on an ongoing basis in order to ensure that the investments conform to our internal policy set by our board of directors.
4
Borrowings
To supplement our core deposits, we maintain borrowings consisting of advances from the FHLB of Dallas, a holding company line of credit with a third-party lender, and subordinated notes issued to certain qualified institutional buyers and institutional accredited investors. At December 31, 2023, we had no FHLB advances, borrowings under the line of credit totaled $38.9 million, or 1.0% of total liabilities, and subordinated notes totaled $80.6 million, or 2.0% of total liabilities. At December 31, 2023, we had $11.1 million available to be drawn on the line of credit with a third-party lender.
Information Technology Systems
We have made significant investments in our information technology systems for our banking and lending operations and treasury management activities. We believe information technology system investments are important to enhance our capabilities to offer new products and overall customer experience, to provide scale for future growth and acquisitions, and to increase controls and efficiencies in our back office operations. We outsource our core data processing services to a nationally recognized bank software vendor providing us with capabilities to support the continued growth of the Bank. Our internal network and e-mail systems are maintained in-house. We leverage the capabilities of a third-party service provider to provide the technical expertise around network design and architecture that is required for us to operate as an effective and efficient organization. We actively manage our business continuity plan, and we follow recommendations outlined by the Federal Financial Institutions Examination Council to ensure that we have effectively identified our risks and documented contingency plans for key functions and systems including providing for back up sites for all critical applications. We also perform tests to ensure the adequacy of these contingency plans.
The majority of our other systems, including our electronic funds transfer, transaction processing and online banking services, are also hosted by the vendor to whom we outsource our core data processing services. The scalability of this infrastructure is designed to support our growth strategy. These critical business applications and processes are included in the business continuity plans referenced above.
Enterprise Risk Management
We place significant emphasis on risk mitigation as an integral component of our organizational culture. We believe that our emphasis on risk management is manifested in our asset quality statistics and in our history of low charge-offs and losses on deposit-related services due to debit card, ACH or wire fraud. With respect to our lending philosophy, our risk management focuses on structuring credits to provide for multiple sources of repayment, coupled with strong underwriting and monitoring undertaken by the Bank’s experienced officers and credit policy personnel.
Our risk mitigation techniques include weekly Officers' Loan Committee and Directors’ Loan Committee meetings where loan approvals and pricing are reviewed and discussed for relationships under $10 million and $10 million and over, respectively. In addition, the Bank’s board of directors reviews the allowance for credit losses methodology and level, loan concentrations, and portfolio composition reports on a quarterly basis. The Special Assets Committee also meets monthly to discuss criticized assets and set action plans for those borrowers who display deteriorating financial condition, to monitor those relationships and to implement corrective measures on a timely basis to minimize losses. We also perform an annual stress test on our loan portfolio, in which we evaluate the impact on the portfolio of declining economic conditions.
We also focus on risk management in numerous other areas throughout our organization, including asset/liability management, regulatory compliance and strategic and operational risk. We have implemented an extensive asset/liability management process, and utilize a well-known and experienced third-party to run our interest rate risk model on a quarterly basis.
We also annually engage an experienced third-party to review and assess our controls with respect to technology, as well as to perform penetration and vulnerability testing to assist us in managing the risks associated with information security.
5
SUPERVISION AND REGULATION
The following is a general summary of the material aspects of certain statutes and regulations that are applicable to us. These summary descriptions are not complete, and you should refer to the full text of the statutes, regulations, and corresponding guidance for more information. These statutes and regulations are subject to change, and additional statutes, regulations, and corresponding guidance may be adopted. We are unable to predict these future changes or the effects, if any, that these changes could have on our business or our revenues.
General
We are extensively regulated under U.S. federal and state law. As a result, our growth and earnings performance may be affected not only by management decisions and general economic conditions, but also by federal and state statutes and by the regulations and policies of various bank regulatory agencies, including the TDSML, the Federal Reserve, the FDIC and the Consumer Financial Protection Bureau (the “CFPB”). Furthermore, tax laws administered by the Internal Revenue Service, or the IRS, and state taxing authorities, accounting rules developed by the Financial Accounting Standards Board, or FASB, securities laws administered by the Securities and Exchange Commission (the “SEC”), and state securities authorities and anti-money laundering, or AML, laws enforced by the U.S. Department of the Treasury, or the Treasury, also impact our business. The effect of these statutes, regulations, regulatory policies and rules are significant to our financial condition and results of operations. Further, the nature and extent of future legislative, regulatory or other changes affecting financial institutions are impossible to predict with any certainty.
On August 16, 2023, the Bank filed an application with the TDB to convert from a Texas state savings bank to a Texas banking association and has notified the TDSML, the Federal Reserve and the FDIC of the same. The Bank has received all necessary approvals to the conversion application, and the conversion is expected to be consummated on March 13, 2024. Following the conversion, the Bank will be regulated by the TDB and the Federal Reserve. The Company will continue to be regulated by the Federal Reserve. Accordingly, where appropriate in the following discussion, we note any differences between the laws and regulations governing a Texas state savings bank and a Texas banking association.
Federal and state banking laws impose a comprehensive system of supervision, regulation and enforcement on the operations of banks, their holding companies and their affiliates. These laws are intended primarily for the protection of depositors, customers and the Deposit Insurance Fund, or the DIF, rather than for shareholders. Federal and state laws, and the related regulations of the bank regulatory agencies, affect, among other things, the scope of business, the kinds and amounts of investments banks may make, reserve requirements, capital levels relative to operations, the nature and amount of collateral for loans, the establishment of branches, the ability to merge, consolidate and acquire, dealings with insiders and affiliates and the payment of dividends.
This supervisory and regulatory framework subjects banks and bank holding companies to regular examination by their respective regulatory agencies, which results in examination reports and ratings that, while not publicly available, can affect the conduct and growth of their businesses. These examinations consider not only compliance with applicable laws and regulations, but also capital levels, asset quality and risk, management’s ability and performance, earnings, liquidity and various other factors. These regulatory agencies have broad discretion to impose restrictions and limitations on the operations of a regulated entity where the agencies determine, among other things, that such operations are unsafe or unsound, fail to comply with applicable law or are otherwise inconsistent with laws and regulations or with the supervisory policies of these agencies.
The following is a summary of the material elements of the supervisory and regulatory framework applicable to the Company and the Bank. It does not describe all of the statutes, regulations and regulatory policies that apply, nor does it restate all of the requirements of those that are described. The descriptions are qualified in their entirety by reference to the particular statutory and regulatory provision.
Financial Services Industry Reform
On July 21, 2010, the Dodd-Frank Wall Street Reform and Consumer Protection Act, or the Dodd-Frank Act, was signed into law. The Dodd-Frank Act imposed significant regulatory and compliance requirements, including the changing roles of credit rating agencies, the imposition of increased capital, leverage, and liquidity requirements, and numerous other provisions designed to improve supervision and oversight of, and strengthen safety and soundness within, the financial services sector.
Additionally, the Dodd-Frank Act established a new framework of authority to conduct systemic risk oversight within the financial system to be distributed among new and existing federal regulatory agencies, including the Financial Stability Oversight Council, the Federal Reserve, the Office of the Comptroller of the Currency (the “OCC”) and the FDIC.
On May 24, 2018, the Economic Growth, Regulatory Relief, and Consumer Protection Act, or the EGRRCPA, was enacted. The EGRRCPA repealed or modified several provisions of the Dodd-Frank Act and included a number of burden reduction measures for community banks, including, among other things: (i) designating mortgages held in portfolio as “qualified mortgages” for banks with less than $10 billion in assets, subject to certain documentation and product limitations; (ii) exempting banks with less than $10 billion in assets (and total trading assets and trading liabilities of 5% or less of total assets) from Volcker Rule requirements relating to proprietary trading; (iii) simplifying capital calculations for banks with less than $10 billion in assets by requiring federal banking
6
agencies to establish a community bank leverage ratio of tangible equity to average consolidated assets of not less than 8% or more than 10%, and providing that banks that maintain tangible equity in excess of such ratio will be deemed to be in compliance with risk-based capital and leverage requirements; (iv) assisting smaller banks with obtaining stable funding by providing an exception for reciprocal deposits from FDIC restrictions on acceptance of brokered deposits; (v) raising the eligibility for use of short-form Call Reports from $1 billion to $5 billion in assets; (vi) clarifying definitions pertaining to high-volatility commercial real estate, or HVCRE, which require higher capital allocations, so that only loans with increased risk are subject to higher risk weightings; and (vii) directing the Federal Reserve to raise the asset threshold under the Small Bank Holding Company and Savings and Loan Holding Company Policy Statement from $1 billion to $3 billion.
Regulatory Capital Requirements and Capital Adequacy
The federal banking agencies require that banking organizations meet several risk-based capital adequacy requirements. These risk-based capital adequacy requirements are intended to provide a measure of capital adequacy that reflects the perceived degree of risk associated with a banking organization’s operations, both for transactions reported on the banking organization’s balance sheet as assets and for transactions that are recorded as off-balance sheet items, such as letters of credit and recourse arrangements. In 2013, the federal bank regulatory agencies issued final rules, or the Basel III Capital Rules, establishing a new comprehensive capital framework for banking organizations. The Basel III Capital Rules implement the Basel Committee on Banking Supervision’s December 2010 framework for strengthening international capital standards and certain provisions of the Dodd-Frank Act. The Basel III Capital Rules became effective on January 1, 2015.
The Basel III Capital Rules require the Bank to comply with four minimum capital standards: (1) a tier 1 capital to total consolidated assets ratio of at least 4.0%; (2) a common equity tier 1, or CET1, capital to risk-weighted assets ratio of at least 4.5%; (3) a tier 1 capital to risk-weighted assets ratio of at least 6.0%; and (4) a total capital to risk-weighted assets ratio of at least 8.0%. CET1 capital is generally comprised of common shareholders’ equity and retained earnings. Tier 1 capital is generally comprised of CET1 capital and “additional tier 1 capital,” which generally includes certain noncumulative perpetual preferred stock and related surplus and minority interests in equity accounts of consolidated subsidiaries. Total capital includes tier 1 capital (CET1 capital plus additional tier 1 capital) and tier 2 capital. Tier 2 capital is generally comprised of capital instruments and related surplus meeting specified requirements, and may include cumulative preferred stock and long-term perpetual preferred stock, mandatory convertible securities, intermediate preferred stock and subordinated debt. Also included in tier 2 capital is the allowance limited to a maximum of 1.25% of risk-weighted assets and, for institutions that have exercised an opt-out election regarding the treatment of Accumulated Other Comprehensive Income, or AOCI, up to 45% of net unrealized gains on available-for-sale equity securities with readily determinable fair market values. Institutions that have not exercised the AOCI opt-out have AOCI incorporated into CET1 capital (including unrealized gains and losses on available-for-sale-securities). We determined to opt-out of this requirement. The calculation of all types of regulatory capital is subject to deductions and adjustments specified in the regulations.
The Basel III Capital Rules also establish a “capital conservation buffer” of 2.5% above the regulatory minimum risk-based capital requirements. An institution is subject to limitations on certain activities, including payment of dividends, share repurchases and discretionary bonuses to executive officers, if its capital level is below the buffered ratio.
The minimum capital ratios under the Basel III Capital Rules as applicable to the Bank after the full phase-in period of the capital conservation buffer are summarized in the table below.
|
|
Minimum Ratio for Capital Adequacy Purposes |
|
Additional Capital Conservation Buffer |
|
Minimum Ratio with Capital Conservation Buffer |
Total risk-based capital ratio (total capital to risk-weighted assets) |
|
8.00% |
|
2.50% |
|
10.50% |
Tier 1 risk-based capital ratio (tier 1 capital to risk-weighted assets) |
|
6.00% |
|
2.50% |
|
8.50% |
CET 1 risk-based capital ratio (CET 1 capital to risk-weighted assets) |
|
4.50% |
|
2.50% |
|
7.00% |
Tier 1 leverage ratio (tier 1 capital to average assets) |
|
4.00% |
|
- |
|
4.00% |
In determining the amount of risk-weighted assets for purposes of calculating risk-based capital ratios, a banking organization’s assets, including certain off-balance sheet assets (e.g., recourse obligations, direct credit substitutes, residual interests), are multiplied by a risk weight factor assigned by the regulations based on perceived risks inherent in the type of asset. As a result, higher levels of capital are required for asset categories believed to present greater risk. For example, a risk weight of 0% is assigned to cash and U.S. government securities, a risk weight of 50% is generally assigned to prudently underwritten first lien 1-4 family residential mortgages, a risk weight of 100% is assigned to commercial and consumer loans, a risk weight of 150% is assigned to certain past due loans and a risk weight of between 0% to 600% is assigned to permissible equity interests, depending on certain specified factors.
7
The Basel III Capital Rules increased the risk weights for a variety of asset classes, including certain commercial real estate mortgages. Additional aspects of the Basel III Capital Rules’ risk-weighting requirements include:
|
• |
|
assigning exposures secured by single-family residential properties to either a 50% risk weight for first-lien mortgages that meet prudent underwriting standards or a 100% risk weight category for all other mortgages; |
|
• |
|
providing for a 20% credit conversion factor for the unused portion of a commitment with an original maturity of one year or less that is not unconditionally cancellable (increased from 0% under the previous risk-based capital rules); |
|
• |
|
assigning a 150% risk weight to all exposures that are nonaccrual or 90 days or more past due (increased from 100% under the previous risk-based capital rules), except for those secured by single-family residential properties, which will be assigned a 100% risk weight, consistent with the previous risk-based capital rules; |
|
• |
|
applying a 150% risk weight instead of a 100% risk weight for certain HVCRE acquisition, development, and construction loans; and |
|
• |
|
applying a 250% risk weight to the portion of mortgage servicing rights and deferred tax assets arising from temporary differences that could not be realized through net operating loss carrybacks that are not deducted from CET1 capital (increased from 100% under the previous risk-based capital rules). |
As of December 31, 2023, the Company's and the Bank’s capital ratios exceeded the minimum capital ratio requirements under the Basel III Capital Rules.
On September 17, 2019, the FDIC finalized a rule that provides certain banking organizations with the option to elect out of complying with the Basel III Capital Rules. Under the rule, a qualifying community banking organization, or a QCBO, would be eligible to elect the community bank leverage ratio, or CBLR, framework. A QCBO is defined as a banking organization that is not an advanced approaches banking organization and that has:
|
• |
|
a leverage ratio of greater than 9%; |
|
• |
|
total consolidated assets of less than $10 billion; |
|
• |
|
total off-balance sheet exposures (excluding derivatives other than sold credit derivatives and unconditionally cancellable commitments) of 25% or less of total consolidated assets; and |
|
• |
|
total trading assets and trading liabilities of 5% or less of total consolidated assets. |
A QCBO that elects to use the CBLR framework and that maintains a leverage ratio of greater than 9% is considered to have satisfied the risk-based and leverage capital requirements in the Basel III Capital Rules and to have met the well-capitalized ratio requirements under the Federal Deposit Insurance Act, described below. The final rule became effective as of January 1, 2020. The Company did not elect to opt in to the CBLR framework.
In July 2023, the federal banking regulators proposed revisions to the Basel III Capital Rules to implement the Basel Committee’s 2017 standards and make other changes to the Basel III Capital Rules. The proposal introduces revised credit, equity and operational risks, as well as credit valuation adjustment and market risks, requirements. Because we have less than $100 billion in assets, the revised capital requirements of the proposed rule would not apply to the Company or the Bank.
Prompt Corrective Action
The Federal Deposit Insurance Act requires federal banking agencies to take “prompt corrective action” with respect to depository institutions that do not meet minimum capital requirements. For purposes of prompt corrective action, the law establishes five capital tiers: “well-capitalized,” “adequately capitalized,” “undercapitalized,” “significantly undercapitalized,” and “critically undercapitalized.” A depository institution’s capital tier depends on its capital levels and certain other factors established by regulation. The applicable FDIC regulations have been amended to incorporate the increased capital requirements required by the Basel III Capital Rules that became effective on January 1, 2015. Under the amended regulations, an institution is deemed to be “well-capitalized” if it has a total risk-based capital ratio of 10.0% or greater, a tier 1 risk-based capital ratio of 8.0% or greater, a CET1 capital ratio of 6.5% or greater and a leverage ratio of 5.0% or greater.
At each successively lower capital category, a bank is subject to increased restrictions on its operations. For example, a bank is generally prohibited from making capital distributions and paying management fees to its holding company if doing so would make the bank “undercapitalized.” Asset growth and branching restrictions apply to undercapitalized banks, which are required to submit written capital restoration plans meeting specified requirements (including a guarantee by the parent holding company, if any). “Significantly undercapitalized” banks are subject to broad regulatory restrictions, including among other things, capital directives, forced mergers, restrictions on the rates of interest they may pay on deposits, restrictions on asset growth and activities, and prohibitions on paying bonuses or increasing compensation to senior executive officers without FDIC approval. “Critically undercapitalized” are subject to even more severe restrictions, including, subject to a narrow exception, the appointment of a conservator or receiver within 90 days after becoming critically undercapitalized.
The appropriate federal banking agency may determine (after notice and opportunity for a hearing) that the institution is in an unsafe or unsound condition or deems the institution to be engaging in an unsafe or unsound practice. The appropriate agency is also permitted to require an adequately capitalized or undercapitalized institution to comply with the supervisory provisions as if the
8
institution were in the next lower category (but not treat a significantly undercapitalized institution as critically undercapitalized) based on supervisory information other than the capital levels of the institution.
The capital classification of a bank affects the frequency of regulatory examinations, the bank’s ability to engage in certain activities and the deposit insurance premium paid by the bank. A bank’s capital category is determined solely for the purpose of applying prompt correct action regulations and the capital category may not accurately reflect the bank’s overall financial condition or prospects.
As of December 31, 2023, the Bank met the requirements for being deemed “well-capitalized” for purposes of the prompt corrective action regulations.
Enforcement Powers of Federal and State Banking Agencies
The federal bank regulatory agencies have broad enforcement powers, including the power to terminate deposit insurance, impose substantial fines and other civil and criminal penalties, and appoint a conservator or receiver for financial institutions. Failure to comply with applicable laws and regulations could subject us and our officers and directors to administrative sanctions and potentially substantial civil money penalties. In addition to the grounds discussed above under “—Prompt Corrective Action,” the appropriate federal bank regulatory agency may appoint the FDIC as conservator or receiver for a depository institution (or the FDIC may appoint itself, under certain circumstances) if any one or more of a number of circumstances exist, including, without limitation, the fact that the depository institution is undercapitalized and has no reasonable prospect of becoming adequately capitalized, fails to become adequately capitalized when required to do so, fails to submit a timely and acceptable capital restoration plan or materially fails to implement an accepted capital restoration plan. The TDSML, until the consummation of the conversion of the Bank to a Texas banking association, and, thereafter, the TDB also has broad enforcement powers over us, including the power to impose orders, remove officers and directors, impose fines and appoint supervisors and conservators.
The Company
General. As a registered bank holding company, the Company is subject to regulation and supervision by the Federal Reserve under the Bank Holding Company Act of 1956, as amended, or the BHCA. Under the BHCA, the Company is subject to periodic examination by the Federal Reserve. The Company is required to file with the Federal Reserve periodic reports of its operations and such additional information as the Federal Reserve may require.
Acquisitions, Activities and Change in Control. The BHCA generally requires the prior approval by the Federal Reserve for any merger involving a bank holding company or a bank holding company’s acquisition of more than 5% of a class of voting securities of any additional bank or bank holding company or to acquire all or substantially all of the assets of any additional bank or bank holding company. In reviewing applications seeking approval of merger and acquisition transactions, the Federal Reserve considers, among other things, the competitive effect and public benefits of the transactions, the capital position and managerial resources of the combined organization, the risks to the stability of the U.S. banking or financial system, the applicant’s performance record under the CRA and the effectiveness of all organizations involved in the merger or acquisition in combating money laundering activities. In addition, failure to implement or maintain adequate compliance programs could cause bank regulators not to approve an acquisition where regulatory approval is required or to prohibit an acquisition even if approval is not required.
Subject to certain conditions (including deposit concentration limits established by the BHCA and the Dodd-Frank Act), the Federal Reserve may allow a bank holding company to acquire banks located in any state of the United States. In approving interstate acquisitions, the Federal Reserve is required to give effect to applicable state law limitations on the aggregate amount of deposits that may be held by the acquiring bank holding company and its insured depository institution affiliates in the state in which the target bank is located (provided that those limits do not discriminate against out-of-state depository institutions or their holding companies) and state laws that require that the target bank have been in existence for a minimum period of time (not to exceed five years) before being acquired by an out-of-state bank holding company. Furthermore, in accordance with the Dodd-Frank Act, bank holding companies must be well-capitalized and well-managed in order to complete interstate mergers or acquisitions. For a discussion of the capital requirements, see “Regulatory Capital Requirements and Capital Adequacy” above.
Federal law also prohibits any person or company from acquiring “control” of an FDIC-insured depository institution or its holding company without prior notice to the appropriate federal bank regulator. “Control” is conclusively presumed to exist upon the acquisition of 25% or more of the outstanding voting securities of a bank or bank holding company, but may arise under certain circumstances between 5.00% and 24.99% ownership.
Permitted Activities. The BHCA generally prohibits the Company from controlling or engaging in any business other than that of banking, managing and controlling banks or furnishing services to banks and their subsidiaries. This general prohibition is subject to a number of exceptions. The principal exception allows bank holding companies to engage in, and to own shares of companies engaged in, certain businesses found by the Federal Reserve prior to November 11, 1999 to be “so closely related to banking as to be a proper incident thereto.” This authority would permit the Company to engage in a variety of banking-related businesses, including the ownership and operation of a savings association, or any entity engaged in consumer finance, equipment leasing, the operation of a computer service bureau (including software development) and mortgage banking and brokerage. The BHCA generally does not place
9
territorial restrictions on the domestic activities of non-bank subsidiaries of bank holding companies. The Federal Reserve has the power to order any bank holding company or its subsidiaries to terminate any activity or to terminate its ownership or control of any subsidiary when the Federal Reserve has reasonable grounds to believe that continuing such activity, ownership or control constitutes a serious risk to the financial soundness, safety or stability of any bank subsidiary of the bank holding company.
Additionally, bank holding companies that meet certain eligibility requirements prescribed by the BHCA and elect to operate as financial holding companies may engage in, or own shares in companies engaged in, a wider range of non-banking activities, including securities and insurance underwriting and sales, merchant banking and any other activity that the Federal Reserve, in consultation with the Secretary of the Treasury, determines by regulation or order is financial in nature or incidental to any such financial activity or that the Federal Reserve determines by order to be complementary to any such financial activity and does not pose a substantial risk to the safety or soundness of depository institutions or the financial system generally. The Company has not elected to be a financial holding company, and we have not engaged in any activities determined by the Federal Reserve to be financial in nature or incidental or complementary to activities that are financial in nature.
If the Company should elect to become a financial holding company, the Company and the Bank must be well-capitalized, well-managed, and have a least a satisfactory Community Reinvestment Act, or CRA, rating. If the Company were to become a financial holding company and the Federal Reserve subsequently determined that the Company, as a financial holding company, is not well-capitalized or well-managed, the Company would have a period of time during which to achieve compliance, but during the period of noncompliance, the Federal Reserve may place any limitations on the Company that the Federal Reserve believed to be appropriate. Furthermore, if the Company became a financial holding company and the Federal Reserve subsequently determined that the Bank, as a financial holding company subsidiary, had not received a satisfactory CRA rating, the Company would not be able to commence any new financial activities or acquire a company that engages in such activities.
Source of Strength. Federal Reserve policy historically required bank holding companies to act as a source of financial and managerial strength to their subsidiary banks. The Dodd-Frank Act codified this policy as a statutory requirement. Under this requirement the Company is expected to commit resources to support the Bank, including at times when the Company may not be in a financial position to provide it. The Company must stand ready to use its available resources to provide adequate capital to the Bank during periods of financial stress or adversity. The Company must also maintain the financial flexibility and capital raising capacity to obtain additional resources for assisting the Bank. The Company’s failure to meet its source of strength obligations may constitute an unsafe and unsound practice or a violation of the Federal Reserve’s regulations or both. The source of strength obligation most directly affects bank holding companies where a bank holding company’s subsidiary bank fails to maintain adequate capital levels. Any capital loans by a bank holding company to the subsidiary bank are subordinate in right of payment to deposits and to certain other indebtedness of the subsidiary bank. The BHCA provides that in the event of a bank holding company’s bankruptcy any commitment by a bank holding company to a federal bank regulatory agency to maintain the capital of its subsidiary bank will be assumed by the bankruptcy trustee and entitled to priority of payment.
Safe and Sound Banking Practices. Bank holding companies and their non-banking subsidiaries are prohibited from engaging in activities that represent unsafe and unsound banking practices or that constitute a violation of law or regulations. Under certain conditions the Federal Reserve may conclude that certain actions of a bank holding company, such as a payment of a cash dividend, would constitute an unsafe and unsound banking practice. The Federal Reserve also has the authority to regulate the debt of bank holding companies, including the authority to impose interest rate ceilings and reserve requirements on such debt. Under certain circumstances the Federal Reserve may require a bank holding company to file written notice and obtain its approval prior to purchasing or redeeming its equity securities, unless certain conditions are met.
Anti-tying Restrictions. Bank holding companies and their affiliates are prohibited from tying the provision of certain services, such as extensions of credit, to other nonbanking services offered by the bank holding company or its affiliates.
Dividend Payments, Stock Redemptions and Repurchases. The Company’s ability to pay dividends to its shareholders is affected by both general corporate law considerations and the regulations and policies of the Federal Reserve applicable to bank holding companies, including the Basel III Capital Rules. Generally, a Texas corporation may not make distributions to its shareholders if (i) after giving effect to the dividend, the corporation would be insolvent, or (ii) the amount of the dividend exceeds the surplus of the corporation. Dividends may be declared and paid in a corporation’s own treasury shares that have been reacquired by the corporation out of surplus. Dividends may be declared and paid in a corporation’s own authorized but unissued shares out of the surplus of the corporation upon the satisfaction of certain conditions.
It is the Federal Reserve’s policy that bank holding companies should generally pay dividends on common stock only out of income available over the past year, and only if prospective earnings retention is consistent with the organization’s expected future needs and financial condition. It is also the Federal Reserve’s policy that bank holding companies should not maintain dividend levels that undermine their ability to be a source of strength to its banking subsidiaries. Additionally, the Federal Reserve has indicated that bank holding companies should carefully review their dividend policy and has discouraged payment ratios that are at maximum allowable levels unless both asset quality and capital are very strong. The Federal Reserve possesses enforcement powers over bank holding companies and their nonbank subsidiaries to prevent or remedy actions that represent unsafe or unsound practices or
10
violations of applicable statutes and regulations. Among these powers is the ability to proscribe the payment of dividends by banks and bank holding companies.
Bank holding companies must consult with the Federal Reserve before redeeming any equity or other capital instrument included in tier 1 or tier 2 capital prior to stated maturity, if such redemption could have a material effect on the level or composition of the organization’s capital base. In addition, bank holding companies are unable to repurchase shares equal to 10% or more of its net worth if it would not be well-capitalized (as defined by the Federal Reserve) after giving effect to such repurchase. Bank holding companies experiencing financial weaknesses, or that are at significant risk of developing financial weaknesses, must consult with the Federal Reserve before redeeming or repurchasing common stock or other regulatory capital instruments.
The Bank
General. The Bank is currently a Texas state savings bank and state member bank of the Federal Reserve. Upon consummation of the conversion of the Bank to a Texas banking association, the Bank will no longer be a Texas state savings bank and will be a Texas banking association regulated by the TDB and the Federal Reserve. As such, the Bank is currently subject to examination, supervision and regulation by the TDSML and the Federal Reserve and following the consummation of the conversion will be subject to examination, supervision and regulation by the TDB and the Federal Reserve. The TDSML, which is the chartering authority for Texas state savings banks, supervises and regulates all areas of the Bank’s operations including, without limitation, the making of loans, the issuance of securities, the conduct of the Bank’s corporate affairs, the satisfaction of capital adequacy requirements, the payment of dividends and the establishment or closing of banking offices. The Federal Reserve, as the Bank’s primary federal regulator, also supervises and regulates the Bank’s operations and periodically examines the Bank’s operational safety and soundness and compliance with federal law. The TDSML and the Federal Reserve have the power to enforce compliance with applicable banking statutes and regulations. Those regulations include requirements to maintain reserves against deposits, restrictions on the nature and amount of loans that may be made and the interest that may be charged on loans, and restrictions relating to investments and other activities of the Bank. In addition, the Bank’s deposit accounts are insured by the FDIC up to applicable limits. This gives the FDIC additional enforcement authority over the Bank, such as the ability to terminate the Bank’s deposit insurance under certain circumstances.
As a Texas state savings bank and a Texas banking association following the consummation of the conversion, the Bank is empowered by statute, subject to the limitations contained in those statutes, to take and pay interest on savings and time deposits, to accept demand deposits, to make loans on residential and other real estate, to make consumer and commercial loans, to invest, with certain limitations, in equity securities and in debt obligations of banks and corporations, and to provide various other banking services for the benefit of the Bank’s clients. Various state consumer laws and regulations also affect the operations of the Bank, including state usury laws and consumer credit laws.
The Texas Finance Code further provides that, subject to the limitations established by rule of the Texas Finance Commission, a Texas state savings bank may make any loan or investment or engage in any activity permitted under state law for a bank or savings and loan association or under federal law for a federal savings and loan association, savings bank or national bank if such institution’s principal office is located in Texas. This provision is commonly referred to as the “Expansion of Powers” provision of the Texas Finance Code applicable to Texas state savings banks.
Under federal law, a Texas state savings bank is treated as a state bank. The Federal Deposit Insurance Corporation Improvement Act of 1991 (the “FDICIA”) provides that no state bank or subsidiary thereof may engage as a principal in any activity not permitted for national banks, unless the institution complies with applicable capital requirements and the FDIC determines that the activity poses no significant risk to the DIF.
Qualified Thrift Lender Test. As a Texas state savings bank, the Bank is required to meet a Qualified Thrift Lender test to avoid certain restrictions on its activities. Specifically, Texas state savings banks are required to maintain at least 50% of their portfolio assets in qualified thrift investments as defined by 12 U.S.C. § 1467a(m)(4)(C) and other assets determined by the commissioner of the TDSML under rules adopted by the Finance Commission, to be substantially equivalent to qualified thrift investments or which further residential lending or community development. Following the consummation of the conversion to a Texas banking association, the Bank will cease to be subject to the Qualified Thrift Lender test.
Depositor Preference. In the event of the “liquidation or other resolution” of an insured depository institution, the claims of depositors of the institution, including the claims of the FDIC as subrogee of insured depositors, and certain claims for administrative expenses of the FDIC as a receiver, will have priority over other general unsecured claims against the institution. If an insured depository institution fails, insured and uninsured depositors, along with the FDIC, will have priority in payment ahead of unsecured, non-deposit creditors including the parent bank holding company with respect to any extensions of credit they have made to that insured depository institution.
Brokered Deposit Restrictions. Well-capitalized institutions are not subject to limitations on brokered deposits, while adequately capitalized institutions are able to accept, renew or roll over brokered deposits only with a waiver from the FDIC and subject to certain
11
restrictions on the yield paid on such deposits. Undercapitalized institutions are generally not permitted to accept, renew or roll over brokered deposits. As of December 31, 2023, the Bank was eligible to accept brokered deposits without a waiver from the FDIC.
Deposit Insurance. FDIC-insured depository institutions are required to pay deposit insurance assessments to the FDIC to fund the DIF. The amount of a particular institution’s deposit insurance assessment is based on that institution’s risk classification under an FDIC risk-based assessment system. The FDIC’s method for determining the assessment rate for a bank with less than $10 billion in assets is generally based on a formula using financial data and assigned Uniform Financial Institutions Rating System ratings. While in the past an insured depository institution’s assessment base was determined by its deposit base, amendments to the Federal Deposit Insurance Act revised the assessment base so that it is calculated using average consolidated total assets minus average tangible equity.
Additionally, the Dodd-Frank Act raised the minimum designated reserve ratio of the DIF from 1.15% to 1.35% of the estimated amount of total insured deposits and eliminated the requirement that the FDIC pay dividends to depository institutions when the reserve ratio exceeds certain thresholds. The DIF reserve ratio reached 1.36 percent on September 30, 2018, exceeding the statutorily required minimum reserve ratio of 1.35 percent ahead of the September 30, 2020, deadline under the Dodd-Frank Act.
At least semi-annually, the FDIC updates its loss and income projections for the DIF and, if needed, may increase or decrease the assessment rates following notice and comment on proposed rulemaking. As a result, the Bank’s FDIC deposit insurance premiums could increase. During the year ended December 31, 2023, the Bank paid $2.5 million in FDIC deposit insurance premiums.
Audits. For insured institutions with total assets of $1.0 billion or more, financial statements prepared in accordance with generally accepted accounting principles, or GAAP, management’s certifications signed by our and the Bank’s chief executive officer and chief accounting or financial officer concerning management’s responsibility for the financial statements, and an attestation by the auditors regarding the Bank’s internal controls must be submitted. For institutions with total assets of more than $3.0 billion, independent auditors may be required to review quarterly financial statements. The FDICIA requires that the Bank have an independent audit committee, consisting of outside directors only, or that we have an audit committee that is entirely independent. The committees of such institutions must include members with experience in banking or financial management, must have access to outside counsel and must not include representatives of large customers. The Bank’s audit committee consists entirely of independent directors.
FICO Assessments. In addition to paying basic deposit insurance assessments, insured depository institutions must pay Financing Corporation, or FICO, assessments. FICO is a mixed-ownership governmental corporation chartered by the former Federal Home Loan Bank Board to recapitalize the former Federal Savings and Loan Insurance Corporation. FICO issued 30-year non-callable bonds of approximately $8.1 billion. The last of the remaining FICO bonds matured in September 2019. Since 1996, federal legislation requires that all FDIC-insured depository institutions pay assessments to cover interest payments on FICO’s outstanding obligations. During the year ended December 31, 2023, the Bank paid no FICO assessments.
Examination Assessments. Texas state savings banks are required to pay assessments to the TDSML to fund its operations. During the year ended December 31, 2023, the Bank paid examination assessments to the TDSML totaling $216,000.
Capital Requirements. Banks are generally required to maintain minimum capital ratios. For a discussion of the capital requirements applicable to the Bank, see “Regulatory Capital Requirements and Capital Adequacy” above.
Bank Reserves. The Federal Reserve requires all depository institutions to maintain reserves against some transaction accounts (primarily NOW and Super NOW checking accounts). The balances maintained to meet the reserve requirements imposed by the Federal Reserve may be used to satisfy liquidity requirements. An institution may borrow from the Federal Reserve “discount window” as a secondary source of funds if the institution meets the Federal Reserve’s credit standards.
Liquidity Requirements. Historically, regulation and monitoring of bank and bank holding company liquidity has been addressed as a supervisory matter, without required formulaic measures. The Basel III liquidity framework requires banks and bank holding companies to measure their liquidity against specific liquidity tests. The federal banking agencies adopted final Liquidity Coverage Ratio rules in September 2014 and proposed Net Stable Funding Ratio rules in May 2016. These rules introduced two liquidity related metrics: Liquidity Coverage Ratio is intended to require financial institutions to maintain sufficient high-quality liquid resources to survive an acute stress scenario that lasts for one month; and Net Stable Funding Ratio is intended to require financial institutions to maintain a minimum amount of stable sources relative to the liquidity profiles of the institution’s assets and contingent liquidity needs over a one-year period.
While the Liquidity Coverage Ratio and the proposed Net Stable Funding Ratio rules apply only to the largest banking organizations in the country, certain elements may filter down and become applicable to or expected of all insured depository institutions and bank holding companies.
Dividend Payments. The primary source of funds for the Company is dividends from the Bank. The prior approval of the Federal Reserve is required if the total of all dividends declared by a state-chartered member bank in any calendar year would exceed the sum of the bank’s net profits for that year and its retained net profits for the preceding two calendar years, less any required transfers to surplus or to fund the retirement of preferred stock. Federal law also prohibits a state-chartered, member bank from paying dividends
12
that would be greater than the bank’s undivided profits. The Bank is also subject to limitations under Texas state law regarding the level of dividends that may be paid. Under the foregoing dividend restrictions, and while maintaining its “well capitalized” status, the Bank could pay aggregate dividends of approximately $76.3 million to us, without obtaining affirmative governmental approvals, at December 31, 2023. This amount is not necessarily indicative of amounts that may be paid or available to be paid in future periods.
The Bank is also subject to certain restrictions on the payment of dividends as a result of the requirement that the Bank maintain an adequate level of capital in accordance with federal laws and regulations and with guidelines promulgated from time to time by the federal banking agencies.
The present and future dividend policy of the Bank is subject to the discretion of its board of directors. In determining whether to pay dividends to the Company and, if made, the amount of the dividends, the board of directors of the Bank considers many of the same factors discussed above. The Bank cannot guarantee that it will have the financial ability to pay dividends to the Company, or if dividends are paid, that they will be sufficient for the Company to make distributions to shareholders. The Bank is not obligated to pay dividends.
Transactions with Affiliates. The Bank is subject to sections 23A and 23B of the Federal Reserve Act, or the Affiliates Act, and the Federal Reserve’s implementing Regulation W. An affiliate of a bank is any company or entity that controls, is controlled by or is under common control with the bank. Accordingly, transactions between the Company, the Bank and any non-bank subsidiaries will be subject to a number of restrictions. The Affiliates Act imposes restrictions and limitations on the Bank from making extensions of credit to, or the issuance of a guarantee or letter of credit on behalf of, the Company or other affiliates, the purchase of, or investment in, stock or other securities thereof, the taking of such securities as collateral for loans and the purchase of assets of the Company or other affiliates. Such restrictions and limitations prevent the Company or other affiliates from borrowing from the Bank unless the loans are secured by marketable obligations of designated amounts. Furthermore, such secured loans and investments by the Bank to or in the Company or to or in any other non-banking affiliate are limited, individually, to 10% of the Bank’s capital and surplus, and such transactions are limited in the aggregate to 20% of the Bank’s capital and surplus. All such transactions, as well as contracts entered into between the Bank and affiliates, must be on terms that are no less favorable to the Bank than those that would be available from non-affiliated third parties. Federal Reserve policies also forbid the payment by bank subsidiaries of management fees which are unreasonable in amount or exceed the fair market value of the services rendered or, if no market exists, actual costs plus a reasonable profit.
Financial Subsidiaries. Under the Gramm-Leach-Bliley Act, or the GLBA, subject to certain conditions imposed by their respective banking regulators, national and state-chartered banks are permitted to form “financial subsidiaries” that may conduct financial activities or activities incidental thereto, thereby permitting bank subsidiaries to engage in certain activities that previously were impermissible. The GLBA imposes several safeguards and restrictions on financial subsidiaries, including that the parent bank’s equity investment in the financial subsidiary be deducted from the bank’s assets and tangible equity for purposes of calculating the bank’s capital adequacy. In addition, the GLBA imposed new restrictions on transactions between a bank and its financial subsidiaries similar to restrictions applicable to transactions between banks and non-bank affiliates.
Loans to Directors, Executive Officers and Principal Shareholders. The authority of the Bank to extend credit to its directors, executive officers and principal shareholders, including their immediate family members and corporations and other entities that they control, is subject to substantial restrictions and requirements under the Federal Reserve’s Regulation O, as well as the Sarbanes-Oxley Act of 2002, or the Sarbanes-Oxley Act. These statutes and regulations impose limits on the amount of loans the Bank may make to directors and other insiders and require that the loans must be made on substantially the same terms, including interest rates and collateral, as prevailing at the time for comparable transactions with persons not affiliated with the Company or the Bank, that the Bank must follow credit underwriting procedures at least as stringent as those applicable to comparable transactions with persons who are not affiliated with the Company or the Bank, and that the loans must not involve a greater than normal risk of non-payment or include other features not favorable to the Bank. Furthermore, the Bank must periodically report all loans made to directors and other insiders to the bank regulators.
Limits on Loans to One Borrower. The Bank is subject to limits on the amount of loans it can make to one borrower. With certain limited exceptions, loans and extensions of credit from the Bank to any borrower (including certain related entities of the borrower) at any one time may not exceed 25% of the tier 1 capital of the Bank. The Bank may lend an additional amount if the loan is fully secured by certain types of collateral, like bonds or notes of the United States. Certain types of loans are exempted from the lending limits, including loans secured by segregated deposits held by the Bank.
Safety and Soundness Standards / Risk Management. The federal banking agencies have adopted guidelines establishing operational and managerial standards to promote the safety and soundness of federally insured depository institutions. The guidelines set forth standards for internal controls, information systems, internal audit systems, loan documentation, credit underwriting, interest rate exposure, asset growth, compensation, fees and benefits, asset quality and earnings.
In general, the safety and soundness guidelines prescribe the goals to be achieved in each area, and each institution is responsible for establishing its own procedures to achieve those goals. If an institution fails to comply with any of the standards set forth in the guidelines, the financial institution’s primary federal regulator may require the institution to submit a plan for achieving and maintaining compliance. If a financial institution fails to submit an acceptable compliance plan, or fails in any material respect to
13
implement a compliance plan that has been accepted by its primary federal regulator, the regulator is required to issue an order directing the institution to cure the deficiency. Until the deficiency cited in the regulator’s order is cured, the regulator may restrict the financial institution’s rate of growth, require the financial institution to increase its capital, restrict the rates the institution pays on deposits or require the institution to take any action the regulator deems appropriate under the circumstances. Noncompliance with the standards established by the safety and soundness guidelines may also constitute grounds for other enforcement action by the federal bank regulatory agencies, including cease and desist orders and civil money penalty assessments.
During the past decade, the bank regulatory agencies have increasingly emphasized the importance of sound risk management processes and strong internal controls when evaluating the activities of the financial institutions they supervise. Properly managing risks has been identified as critical to the conduct of safe and sound banking activities and has become even more important as new technologies, product innovation and the size and speed of financial transactions have changed the nature of banking markets. The agencies have identified a spectrum of risks facing a banking institution including, but not limited to, credit, market, liquidity, operational, legal and reputational risk. In particular, recent regulatory pronouncements have focused on operational risk, which arises from the potential that inadequate information systems, operational problems, breaches in internal controls, fraud or unforeseen catastrophes will result in unexpected losses. New products and services, third party risk management and cybersecurity are critical sources of operational risk that financial institutions are expected to address in the current environment. The Bank is expected to have active board and senior management oversight; adequate policies, procedures and limits; adequate risk measurement, monitoring and management information systems; and comprehensive internal controls.
Branching Authority. Deposit-taking banking offices of the Bank must be approved by the Federal Reserve and the TDSML, which consider a number of factors including financial history, capital adequacy, earnings prospects, character of management, needs of the community and consistency with corporate power. The Dodd-Frank Act permits insured state banks to engage in interstate branching if the laws of the state where the new banking office is to be established would permit the establishment of the banking office if it were chartered by a bank in such state. Finally, the Company may also establish banking offices in other states by merging with banks or by purchasing banking offices of other banks in other states, subject to certain restrictions.
Interstate Deposit Restrictions. The Riegle-Neal Interstate Banking and Branching Efficiency Act of 1994, or the Riegle-Neal Act, together with the Dodd-Frank Act, relaxed prior branching restrictions under federal law by permitting, subject to regulatory approval, banks to establish branches in states where the laws permit banks chartered in such states to establish branches.
Section 109 of the Riegle-Neal Act prohibits a bank from establishing or acquiring a branch or branches outside of its home state primarily for the purpose of deposit production. To determine compliance with Section 109, the appropriate federal banking agency first compares a bank’s estimated statewide loan-to-deposit ratio to the estimated host state loan-to-deposit ratio. If a bank’s statewide loan-to-deposit ratio is at least one-half of the published host state loan-to-deposit ratio, the bank has complied with Section 109. A second step is conducted if a bank’s estimated statewide loan-to-deposit ratio is less than one-half of the published ratio for that state. The second step requires the appropriate agency to determine whether the bank is reasonably helping to meet the credit needs of the communities served by the bank’s interstate branches. A bank that fails both steps is in violation of Section 109 and subject to sanctions by the appropriate agency. Those sanctions may include requiring the bank’s interstate branches in the non-compliant state be closed or not permitting the bank to open new branches in the non-compliant state.
Community Reinvestment Act. The CRA is intended to encourage insured depository institutions, while operating safely and soundly, to help meet the credit needs of their communities. The CRA specifically directs the federal bank regulatory agencies, in examining insured depository institutions, to assess their record of helping to meet the credit needs of their entire community, including low and moderate income neighborhoods, consistent with safe and sound banking practices. The CRA further requires the agencies to take a financial institution’s record of meeting its community credit needs into account when evaluating applications for, among other things, domestic branches, consummating mergers or acquisitions or holding company formations.
The federal banking agencies have adopted regulations which measure a bank’s compliance with its CRA obligations on a performance based evaluation system. This system bases CRA ratings on an institution’s actual lending service and investment performance rather than the extent to which the institution conducts needs assessments, documents community outreach or complies with other procedural requirements. The ratings range from a high of “outstanding” to a low of “substantial noncompliance.” The Bank had a CRA rating of “satisfactory” as of its most recent CRA assessment.
In October 2023, the Federal Reserve, the FDIC and the OCC, issued a joint final rule to modernize the CRA regulatory framework. The final rule is intended, among other things, to adapt to changes in the banking industry, including internet and the expanded role of mobile and online banking, and to tailor performance standards to account for differences in bank size, and business models. The final rule introduces new tests under which the performance of banks with over $2 billion in assets will be assessed. The new rule also includes data collection and reporting requirements, some of which are applicable only to banks with over $10 billion in assets. Most provisions of the final rule will become effective on January 1, 2026, and the data reporting requirements will become effective on January 1, 2027.
Anti-Money Laundering and the Office of Foreign Assets Control Regulation. The Uniting and Strengthening America by Providing Appropriate Tools Required to Intercept and Obstruct Terrorism Act of 2001, or the USA PATRIOT Act, is designed to deny terrorists and criminals the ability to obtain access to the U.S. financial system and has significant implications for depository
14
institutions, brokers, dealers and other businesses involved in the transfer of money. The USA PATRIOT Act substantially broadened the scope of United States AML laws and regulations by imposing significant compliance and due diligence obligations, created new crimes and penalties and expanded the extra territorial jurisdiction of the United States. Financial institutions are also prohibited from entering into specified financial transactions and account relationships, must use enhanced due diligence procedures in their dealings with certain types of high risk customers and must implement a written customer identification program. Financial institutions must take certain steps to assist government agencies in detecting and preventing money laundering and report certain types of suspicious transactions. Regulatory authorities routinely examine financial institutions for compliance with these obligations and failure of a financial institution to maintain and implement adequate programs to combat money laundering and terrorist financing, or to comply with the USA PATRIOT Act or its regulations, could have serious legal and reputational consequences for the institution, including causing applicable bank regulatory authorities not to approve merger or acquisition transactions when regulatory approval is required or to prohibit such transactions even if approval is not required. Regulatory authorities have imposed cease and desist orders and civil money penalties against institutions found to be in violation of these obligations.
Among other requirements, the USA PATRIOT Act and implementing regulations require banks to establish AML programs that include, at a minimum:
|
• |
|
internal policies, procedures and controls designed to implement and maintain the bank’s compliance with all of the requirements of the USA PATRIOT Act, the BSA and related laws and regulations; |
|
• |
|
systems and procedures for monitoring and reporting suspicious transactions and activities; |
|
• |
|
a designated compliance officer; |
|
• |
|
employee training; |
|
• |
|
an independent audit function to test the AML program; |
|
• |
|
procedures to verify the identity of each customer upon the opening of accounts; and |
|
• |
|
heightened due diligence policies, procedures and controls applicable to certain foreign accounts and relationships. |
Additionally, the USA PATRIOT Act requires each financial institution to develop a customer identification program, or the CIP, as part of its AML program. The key components of the CIP are identification, verification, government list comparison, notice and record retention. The purpose of the CIP is to enable the financial institution to determine the true identity and anticipated account activity of each customer. To make this determination, among other things, the financial institution must collect certain information from customers at the time they enter into the customer relationship with the financial institution. This information must be verified within a reasonable time through documentary and non-documentary methods. Furthermore, all customers must be screened against any CIP-related government lists of known or suspected terrorists. Financial institutions are also required to comply with various reporting and recordkeeping requirements. The Federal Reserve and the FDIC consider an applicant’s effectiveness in combating money laundering, among other factors, in connection with an application to approve a bank merger or acquisition of control of a bank or bank holding company.
Likewise, the Treasury Department's Office of Foreign Assets Control, or OFAC, administers and enforces economic and trade sanctions against targeted foreign countries and regimes under authority of various laws, including designated foreign countries, nationals and others. OFAC publishes lists of specially designated targets and countries. Financial institutions are responsible for, among other things, blocking accounts of, and transactions with, such targets and countries, prohibiting unlicensed trade and financial transactions with them and reporting blocked transactions after their occurrence.
Failure of a financial institution to maintain and implement adequate AML and OFAC programs, or to comply with all of the relevant laws or regulations, could have serious legal and reputational consequences for the institution.
Concentrations in Commercial Real Estate. The federal banking agencies have promulgated guidance governing financial institutions with concentrations in commercial real estate lending. The guidance provides that a bank has a concentration in commercial real estate lending if (i) total reported loans for construction, land development, and other land represent 100% or more of total capital or (ii) total reported loans secured by multifamily and non-farm nonresidential properties (excluding loans secured by owner-occupied properties) and loans for construction, land development, and other land represent 300% or more of total capital and the bank’s commercial real estate loan portfolio has increased 50% or more during the prior 36 months. If a concentration is present, management must employ heightened risk management practices that address the following key elements: including board and management oversight and strategic planning, portfolio management, development of underwriting standards, risk assessment and monitoring through market analysis and stress testing, and maintenance of increased capital levels as needed to support the level of commercial real estate lending. On December 18, 2015, the federal banking agencies jointly issued a “statement on prudent risk management for commercial real estate lending.”
Consumer Protection Laws and Regulations. The Bank is subject to numerous federal laws and regulations intended to protect consumers in transactions with the Bank, including but not limited to the Electronic Fund Transfer Act, the Equal Credit Opportunity Act, the Fair Housing Act, the Expedited Funds Availability Act, the Fair Credit Reporting Act, the Fair Debt Collection Practices Act, the Military Lending Act, the Real Estate Procedures Act of 1974, the S.A.F.E. Mortgage Licensing Act of 2008, the Servicemembers Civil Relief Act, the Truth in Lending Act, the Truth in Savings Act and laws prohibiting unfair, deceptive or abusive acts and practices in connection with consumer financial products and services. Many states and local jurisdictions have consumer
15
protection laws analogous, and in addition, to those enacted under federal law. These laws and regulations mandate certain disclosure requirements and regulate the manner in which financial institutions must deal with customers when taking deposits, making loans and conducting other types of transactions. Failure to comply with these laws and regulations could give rise to regulatory sanctions, customer rescission and registration rights, action by state and local attorneys general and civil or criminal liability.
Rulemaking authority for most federal consumer protection laws was transferred from the federal banking regulators to the CFPB on July 21, 2011. The CFPB also has broad authority to prohibit unfair, deceptive and abusive acts and practices and to investigate and penalize financial institutions that violate this prohibition. The CFPB has examination and primary enforcement authority with respect to depository institutions with $10 billion or more in assets. Smaller institutions are subject to rules promulgated by the CFPB but continue to be examined and supervised by federal banking regulators for consumer compliance purposes. The creation of the CFPB by the Dodd-Frank Act has led to enhanced enforcement of consumer financial protection laws.
Incentive Compensation Guidance
The federal bank regulatory agencies have issued comprehensive guidance intended to ensure that the incentive compensation policies of banking organizations do not undermine the safety and soundness of those organizations by encouraging excessive risk-taking. The incentive compensation guidance sets expectations for banking organizations concerning their incentive compensation arrangements and related risk-management, control and governance processes. The incentive compensation guidance, which covers all employees that have the ability to materially affect the risk profile of an organization, either individually or as part of a group, is based upon three primary principles: (1) balanced risk-taking incentives; (2) compatibility with effective controls and risk management; and (3) strong corporate governance. Any deficiencies in compensation practices that are identified may be incorporated into the organization’s supervisory ratings, which can affect its ability to make acquisitions or take other actions. In addition, under the incentive compensation guidance, a banking organization’s federal supervisor may initiate enforcement action if the organization’s incentive compensation arrangements pose a risk to the safety and soundness of the organization. Further, the Basel III Capital Rules limit discretionary bonus payments to bank executives if the institution’s regulatory capital ratios fail to exceed certain thresholds. Although the federal bank regulatory agencies proposed additional rules in 2016 related to incentive compensation for all banks with more than $1 billion in assets, those rules have not yet been finalized. The scope and content of the U.S. banking regulators’ policies on executive compensation are continuing to develop and are likely to continue evolving in the near future.
The Dodd-Frank Act requires public companies to include, at least once every three years, a separate non-binding “say-on-pay” vote in their proxy statement by which shareholders may vote on the compensation of the public company’s named executive officers. In addition, if such public companies are involved in a merger, acquisition, or consolidation, or if they propose to sell or dispose of all or substantially all of their assets, shareholders have a right to an advisory vote on any golden parachute arrangements in connection with such transaction (frequently referred to as “say-on-golden parachute” vote). Although we will be exempt from these requirements while we are an emerging growth company, other provisions of the Dodd-Frank Act may impact our corporate governance. For instance, the SEC adopted rules prohibiting the listing of any equity security of a company that does not have a compensation committee consisting solely of independent directors, subject to certain exceptions. In addition, the Dodd-Frank Act requires the SEC to adopt rules requiring all exchange-traded companies to adopt claw-back policies for incentive compensation paid to executive officers in the event of accounting restatements based on material non-compliance with financial reporting requirements. The scope and content of the U.S. banking regulators’ policies on executive compensation are continuing to develop and are likely to continue evolving in the near future.
In August 2022, the SEC adopted the final “pay versus performance” rule mandated by the Dodd-Frank Act. Among other disclosure requirements, the rule requires public companies (other than emerging growth companies, registered investment companies and foreign private issuers) to disclose the relationships among named executive officer compensation “actually paid,” total shareholder return and certain financial performance measures that the company uses to link compensation to company performance for its five most recent fiscal years. The rule will not apply to the Company while it is an emerging growth company and, accordingly, management anticipates that the rule will first apply to disclosures in the Company’s proxy statement for the 2027 Annual Meeting of Shareholders.
In October 2022, the SEC adopted a final rule directing national securities exchanges and associations, including the Nasdaq Stock Market LLC, to implement listing standards that require listed companies to adopt policies mandating the recovery or “clawback” of excess incentive-based compensation earned by a current or former executive officer during the three fiscal years preceding the date the listed company is required to prepare an accounting restatement, including to correct an error that would result in a material misstatement if the error were corrected in the current period or left uncorrected in the current period. In October 2023, the Company adopted a compensation recovery policy to address the SEC final rule. The policy is included in this Form 10-K as Exhibit 97.1.
Financial Privacy
The federal bank regulatory agencies have adopted rules that limit the ability of banks and other financial institutions to disclose non-public information about consumers to non-affiliated third parties. These limitations require disclosure of privacy policies to consumers and, in some circumstances, allow consumers to prevent disclosure of certain personal information to a non-affiliated third
16
party. These regulations affect how consumer information is transmitted through financial services companies and conveyed to outside vendors. In addition, consumers may also prevent disclosure of certain information among affiliated companies that is assembled or used to determine eligibility for a product or service, such as that shown on consumer credit reports and asset and income information from applications. Consumers also have the option to direct banks and other financial institutions not to share information about transactions and experiences with affiliated companies for the purpose of marketing products or services.
Impact of Monetary Policy
The monetary policy of the Federal Reserve has a significant effect on the operating results of financial or bank holding companies and their subsidiaries. Among the tools available to the Federal Reserve to affect the money supply are open market transactions in U.S. government securities, changes in the discount rate on member bank borrowings and changes in reserve requirements against member bank deposits. These tools are used in varying combinations to influence overall growth and distribution of bank loans, investments and deposits, and their use may affect interest rates charged on loans or paid on deposits.
Impact of Current Laws and Regulations
The cumulative effect of these laws and regulations, while providing certain benefits, adds significantly to the cost of our operations and thus may have a negative impact on our profitability. There has also been a notable expansion in recent years of financial service providers that are not subject to the examination, oversight and other rules and regulations to which we are subject. Those providers, because they are not so highly regulated, may have a competitive advantage over us and may continue to draw large amounts of funds away from traditional banking institutions, with a continuing adverse effect on the banking industry in general.
Future Legislation and Regulatory Reform
In recent years, regulators have increased their focus on the regulation of financial institutions. From time to time, various legislative and regulatory initiatives are introduced in Congress and state legislatures. New regulations and statutes are regularly proposed that contain wide-ranging proposals for altering the structures, regulations and competitive relationships of financial institutions operating in the United States. We cannot predict whether or in what form any proposed regulation or statute will be adopted or the extent to which our business may be affected by any new regulation or statute. Future legislation, regulation and policies and the effects of such legislation, regulation and policies, may have a significant influence on our operations and activities, financial condition, results of operations, growth plans or future prospects and the overall growth and distribution of loans, investments and deposits. Such legislation, regulation and policies have had a significant effect on the operations and activities, financial condition, results of operations, growth plans and future prospects of commercial banks in the past and are expected to continue to do so.
Human Capital
The Company's success depends on its ability to attract and retain highly qualified management and other skilled employees. The Company focuses on identifying and selecting the best candidates for positions based on their qualifications and skill set. Locating candidates with the necessary qualifications can be difficult and competition for these individuals is often intense. The Company invests in its workforce by offering competitive wages and benefits, continually working to create a strong company culture, and nurturing its talent through training and retention programs.
The Company believes a diverse, equitable and inclusive workforce is critical to its success. The Company is committed to attracting, retaining and promoting top quality talent regardless of sex, sexual orientation, gender identity, race, color, national origin, age, religion and physical ability. The Company is dedicated to creating an environment where its employees feel inspired to do their best work. The Company is committed to providing a diverse, equitable and inclusive organization where everyone feels valued and respected for their unique capabilities and where everyone is engaged in the Company's strategic vision of continued strong growth.
During 2022, the Company furthered its commitment to diversity, equity and inclusion by providing unconscious bias training for managers and staff, launching a Women in Banking employee resource group, and establishing the Company's Diversity Council, and the Company focused on increasing participation in the Women in Banking employee resource group and Diversity Council in 2023. Through the Diversity Council, the Company plans to foster an environment of respect and acceptance as well as build awareness and education regarding diversity issues, among other initiatives. Each of the Council members brings diverse, professional experiences that support the group's mission.
As of December 31, 2023, the Company employed 365 employees.
AVAILABLE INFORMATION
The Company’s website address is currently www.tcbssb.com and following the consummation of the conversion, it will change to www.thirdcoast.bank. The Company makes available free of charge on or through its website, under the investors tab, its annual reports on Form 10-K, quarterly reports on Form 10-Q, current reports on Form 8-K and all amendments to those reports filed or
17
furnished pursuant to Section 13(a) or 15(d) of the Securities Exchange Act of 1934, as amended, or the Exchange Act, as soon as reasonably practicable after such materials are electronically filed with or furnished to the SEC. Information contained on the Company’s website is not incorporated by reference into this Annual Report on Form 10-K and is not part of this or any other report that the Company files with or furnishes to the SEC. The SEC maintains an internet site that contains reports, proxy statements and other information that the Company files with or furnishes to the SEC and these reports may be accessed at https://www.sec.gov.
Additionally, our corporate governance policies, including the charters of the Audit, Compensation and Corporate Governance and Nominating Committees, and our Code of Business Conduct and Ethics, Whistleblower Policy and Corporate Governance Guidelines may also be found under the “Investors” tab of our website. A written copy of each of the foregoing corporate governance documents is available upon request. Except as explicitly provided, information furnished by the Company and information on, or accessible through, the SEC’s or the Company’s website is not incorporated into this Annual Report on Form 10-K or our other securities filings and is not part of them.
18
Item 1A. Risk Factors.
Our business and results of operations are subject to numerous risks and uncertainties, many of which are beyond our control. The material risks and uncertainties that management believes affect the Company are described below. Additional risks and uncertainties that management is not aware of, or that management currently deems immaterial, may also impair the Company’s business operations. This report is qualified in its entirety by these risk factors. If any of the following risks actually occur, our business, financial condition and results of operations could be materially and adversely affected. If this were to happen, the value of our securities could decline significantly, and you could lose all or part of your investment. Some statements in the following risk factors constitute forward-looking statements. Please refer to "Cautionary Note Regarding Forward-Looking Statements" elsewhere in this Annual Report on Form 10-K.
Summary of Risk Factors
The following is a summary of the principal risks that we believe could adversely affect our business, financial condition or results of operations:
Risks Related to our Business and Operations
Risks Related to the Economy and our Industry
19
Risks Related to Cybersecurity, Third-Parties and Technology
Risks Related to the Regulation of Our Industry
Risks Related to an Investment in Our Common Stock
Risks Related to Our Business and Operations
We are subject to interest rate risk and fluctuations in interest rates may adversely affect our earnings.
Changes in interest rates could have an adverse effect on our net interest income and could have a material adverse effect on our business, financial condition and results of operations. Many factors outside our control impact interest rates, including governmental monetary policies, inflation, recession, changes in unemployment, the money supply and international economic conditions and volatility and instability in domestic and foreign financial markets.
The majority of our banking assets and liabilities are monetary in nature and subject to risk from changes in interest rates. Like most financial institutions, our earnings are significantly dependent on our net interest income. Different types of assets and liabilities may react differently and at different times to market rate changes. We may periodically experience “gaps” in the interest rate sensitivities of our assets and liabilities, meaning that either our interest-bearing liabilities will be more sensitive to changes in market interest rates than our interest-earning assets, or vice versa. In either event, if market interest rates should move contrary to our position, this “gap” will negatively impact our earnings. The impact on earnings is more adverse when short-term interest rates increase more than long-term interest rates or when long-term interest rates decrease more than short-term interest rates.
Interest rate increases often result in larger payment requirements for our borrowers, which increase the potential for default. At the same time, the marketability of the property securing a loan may be adversely affected by any reduced demand resulting from higher interest rates. An increase in interest rates can adversely impact the ability of borrowers to pay the principal or interest on loans and may lead to an increase in loans on nonaccrual status and a reduction of interest income recognized. Further, when we place a loan on nonaccrual status, we reverse any accrued but unpaid interest receivable, which decreases interest income. At the same time, we
20
continue to have a cost to fund the loan, which is reflected as interest expense, without any interest income to offset the associated funding expense.
In a low interest rate environment, loan customers often pursue long-term fixed rate credits, which could adversely affect our earnings and net interest margin if rates increase. If short-term interest rates remain at low levels for a prolonged period and longer-term interest rates fall, we could experience net interest margin compression as our interest-earning assets would continue to reprice downward while our interest-bearing liability rates could fail to decline in tandem.
Interest rate increases may also reduce the demand for loans and increase competition for deposits. Changes in interest rates also can affect the value of loans, securities and other assets.
Our largest deposit relationships currently make up a material percentage of our deposits and the withdrawal of deposits by our largest depositors could force us to fund our business through more expensive and less stable sources.
As of December 31, 2023, our fifteen largest depositors (including related entities, but excluding brokered deposits) accounted for $1.52 billion in deposits, or approximately 40.0% of our total deposits. Further, our brokered deposit account balance was $499.9 million, or approximately 13.1% of our total deposits, as of December 31, 2023, and $168.2 million, or 4.4% of our total deposits, was through one brokered deposit relationship as of December 31, 2023.
Withdrawals of deposits by any one of our largest depositors or by one of our related customer groups could force us to rely more heavily on borrowings and other sources of funding for our business and withdrawal demands, adversely affecting our net interest margin and results of operations. We may also be forced, as a result of any withdrawal of deposits, to rely more heavily on other, potentially more expensive and less stable funding sources. Consequently, the occurrence of any of these events could have a material adverse effect on our business, financial condition and results of operations.
We may not be able to grow or maintain our deposit base, which could adversely impact our funding costs.
Our principal sources of liquidity include earnings, deposits, repayment by clients of loans we have made to them, and the proceeds from sales by us of our equity and debt securities or from borrowings that we may obtain. In addition, from time to time, we borrow from the FHLB of Dallas. Our future growth will largely depend on our ability to grow and maintain our deposit base, which we may not be able to achieve. As of December 31, 2023, we had a loan to deposit ratio of 95.7%. The account and deposit balances can decrease when clients perceive alternative investments, such as the stock market or real estate, as providing a better risk/return tradeoff. If clients move money out of bank deposits and into investments (or similar deposit products at other institutions that may provide a higher rate of return), we could lose a relatively low cost source of funds, increasing our funding costs and reducing our net interest income and net income. Additionally, any loss of funds could result in lower loan originations, which could materially negatively impact our growth strategy and results of operations.
We may not be able to implement our expansion strategy, which may adversely affect our ability to maintain our historical earnings trends.
Our expansion strategy focuses on organic growth, supplemented by strategic acquisitions and expansion of the Bank’s banking location network, or de novo branching. We may not be able to execute on aspects of our expansion strategy, which may impair our ability to sustain our historical rate of growth or prevent us from growing at all. More specifically, we may not be able to generate sufficient new loans and deposits within acceptable risk and expense tolerances, obtain the personnel or funding necessary for additional growth or find suitable acquisition candidates. Various factors, such as economic conditions and competition with other financial institutions, may impede or prohibit the growth of our operations, the opening of new banking locations and the consummation of acquisitions. Further, we may be unable to attract and retain experienced bankers, which could adversely affect our growth. The success of our strategy also depends on our ability to effectively manage growth, which is dependent upon a number of factors, including our ability to adapt our credit, operational, technology and governance infrastructure to accommodate expanded operations. If we fail to implement one or more aspects of our strategy, we may be unable to maintain our historical earnings trends, which could have a material adverse effect on our business, financial condition and results of operations.
We may not be able to manage the risks associated with our anticipated growth and expansion through de novo branching, which could have a material adverse effect on our business, financial condition and results of operations.
Our business strategy includes evaluating strategic opportunities to grow through de novo branching, and we believe that banking location expansion has been meaningful to our growth since inception. De novo branching carries with it certain potential risks, including significant startup costs and anticipated initial operating losses; an inability to gain regulatory approval; an inability to secure the services of qualified senior management to operate the de novo banking locations and successfully integrate and promote our corporate culture; poor market reception for de novo banking locations established in markets where we do not have a preexisting reputation; challenges posed by local economic conditions; challenges associated with securing attractive locations at a reasonable cost; and the additional strain on management resources and internal systems and controls. Failure to adequately manage the risks associated with our anticipated growth through de novo branching could have a material adverse effect on our business, financial condition and results of operations.
21
We rely heavily on our executive management team and other key employees, and we could be adversely affected by the unexpected loss of their services.
Our success depends in large part on the performance of our executive management team and other key personnel, as well as on our ability to attract, motivate and retain highly qualified senior and middle management and other skilled employees. Competition for qualified employees is intense, and the process of locating key personnel with the combination of skills, attributes and business relationships required to execute our business plan may be lengthy. We may not be successful in retaining our key employees, and the unexpected loss of services of one or more of our key personnel could have an adverse effect on our business because of their skills, knowledge of and business relationships within our primary markets, years of industry experience and the difficulty of promptly finding qualified replacement personnel. If the services of any of our key personnel should become unavailable for any reason, we may not be able to identify and hire qualified persons on terms acceptable to us, or at all, which could have a material adverse effect on our business, financial condition, results of operations and future prospects.
We may not be able to adequately measure and limit our credit risk, which could lead to unexpected losses.
The business of lending is inherently risky, including risks that the principal of or interest on any loan will not be repaid timely or at all or that the value of any collateral supporting the loan will be insufficient to cover our outstanding exposure. These risks may be affected by the strength of the borrower’s business sector and local, regional and national market and economic conditions. Many of our loans are made to small- to medium-sized businesses that may be less able to withstand competitive, economic and financial pressures than larger borrowers. Our risk management practices, such as monitoring the concentration of our loans within specific industries and our credit approval practices, may not adequately reduce credit risk, and our credit administration personnel, policies and procedures may not adequately adapt to changes in economic or any other conditions affecting customers and the quality of our loan portfolio. A failure to effectively measure and limit the credit risk associated with our loan portfolio could lead to unexpected losses and have a material adverse effect on our business, financial condition and results of operations.
Our allowance for credit losses may prove to be insufficient to absorb potential losses in our loan portfolio, which may adversely affect our business, financial condition and results of operations.
We maintain an allowance for credit losses that represents management’s judgment of probable losses and risks inherent in our loan portfolio. As of December 31, 2023, our allowance for credit losses related to our loan portfolio totaled $37.0 million, which represents approximately 1.02% of our total loans. The allowance for credit losses on loans is calculated in accordance with ASC 326, and represents management's best estimate of current expected credit losses on loans considering available information, from internal and external sources, relevant to assessing collectability over the loans' contractual terms, adjusted for expected prepayments when appropriate. Relevant available information includes historical credit loss experience, current conditions and reasonable and supportable forecasts. While historical credit loss experience provides the basis for the estimation of expected credit losses, adjustments to historical loss information may be made for differences in current portfolio-specific risk characteristics, environmental conditions or other relevant factors. The allowance for credit losses is measured on a collective basis for portfolios of loans when similar risk characteristics exist. Expected credit losses for collateral dependent loans, including loans where the borrower is experiencing financial difficulty but foreclosure is not probable, are based on the fair value of the collateral at the reporting date, adjusted for selling costs as appropriate.
The provision for credit losses related to loans reflects the totality of actions taken on all loans for a particular period including any necessary increases or decreases in the allowance related to changes in credit loss expectations associated with specific loans or pools of loans. Portions of the allowance may be allocated for specific credits; however, the entire allowance is available for any credit that, in management’s judgment, should be charged off. While management utilizes its best judgment and information available, the ultimate appropriateness of the allowance is dependent upon a variety of factors beyond our control, including the performance of our loan portfolio, the economy, changes in interest rates and the view of the regulatory authorities toward loan classifications.
Determining the amount of the allowance requires significant judgment and the use of subjective measurements, including management’s assessment of overall portfolio quality. The Company maintains the allowance at an amount the Company believes is sufficient to provide for estimated current expected credit losses in the Company’s loan portfolio, and fluctuations in the provision for credit losses may result from management’s assessment of the adequacy of the allowance. Changes in these estimates and assumptions are possible and may have a material impact on the Company’s allowance, and therefore the Company’s financial position, liquidity or results of operations.
Additional loan losses will likely occur in the future and may occur at a rate greater than we have previously experienced or than we anticipate. We may be required to make additional provisions for credit losses to further supplement our allowance for credit losses, due either to our management’s decision or as a regulatory requirement. In addition, bank regulatory agencies will periodically review our allowance for credit losses and the value attributed to nonaccrual loans or to real estate acquired through foreclosure. Such regulatory agencies may require us to recognize future charge-offs, which could have a material adverse effect on our business, financial condition, and results of operations.
22
The amount of nonperforming and classified assets may increase significantly, resulting in additional losses and costs and expenses that will negatively affect our operations and financial condition.
Our nonperforming assets include nonperforming loans and assets acquired through foreclosure. Nonperforming loans include nonaccrual loans, loans past due 90 days or more, and loans renegotiated or restructured because of a debtor’s financial difficulties and performing under the new terms. Loans are generally placed on nonaccrual status if any of the following events occur: (a) the classification of a loan as nonaccrual internally or by regulatory examiners; (b) delinquency on principal for 90 days or more unless we are in the process of collection; (c) a balance remains after repossession of collateral; (d) notification of bankruptcy; or (e) we determine that nonaccrual status is appropriate. At December 31, 2023, we had $17.3 million of nonperforming assets, or 0.39% of total assets.
Should the amount of nonperforming assets or classified assets increase in the future, we may incur losses and the costs and expenses to maintain such assets can be expected to increase and potentially negatively affect earnings. An increase in the level of nonperforming assets increases our risk profile and may impact the capital levels regulators believe are appropriate considering the ensuing risk profile. An additional increase in losses due to such assets could have a material adverse effect on our business, financial condition and results of operations.
Nonperforming assets take significant time and resources to resolve and adversely affect our results of operations and financial condition.
Nonperforming assets adversely affect our net income in various ways. We generally do not record interest income on other real estate owned, or OREO, or on nonperforming loans, thereby adversely affecting our income and increasing loan administration costs. When we take collateral in foreclosures and similar proceedings, we are required to mark the related asset to the then fair value of the collateral, which may ultimately result in a loss. An increase in the level of nonperforming assets increases our risk profile and may impact the capital levels regulators believe are appropriate in light of the ensuing risk profile. While we seek to reduce problem assets through loan workouts, restructurings, and otherwise, decreases in the value of the underlying collateral, or in these borrowers’ performance or financial condition, whether or not due to economic and market conditions beyond our control, could have a material effect on our business, financial condition and results of operations. In addition, the resolution of nonperforming assets requires significant commitments of time from management, which may materially and adversely impact their ability to perform their other responsibilities. We may not experience future increases in the value of nonperforming assets.
The small- to medium-sized businesses that we lend to may have fewer resources to endure adverse business developments, which may impair our borrowers’ ability to repay loans.
We focus some of our business development and marketing strategy on small- to medium-sized businesses. Small- to medium-sized businesses frequently have smaller market shares than their competition, may be more vulnerable to economic downturns, often need substantial additional capital to expand or compete and may experience substantial volatility in operating results, any of which may impair a borrower’s ability to repay a loan. In addition, the success of a small- and medium-sized business often depends on the management skills, talents and efforts of a small group of people, and the death, disability or resignation of one or more of these people could have an adverse effect on the business and its ability to repay its loan. If our borrowers are unable to repay their loans, our business, financial condition and results of operations could be adversely affected.
A portion of our loan portfolio is comprised of commercial loans secured by receivables, inventory, equipment or other commercial collateral, which we refer to generally as commercial and industrial loans, and the deterioration in value of which could expose us to credit losses.
As of December 31, 2023, commercial and industrial loans represented approximately $1.26 billion, or 34.7%, of our gross loans. In general, these loans are collateralized by general business assets, including, among other things, accounts receivable, inventory and equipment, and most are backed by a personal guaranty of the borrower or principal. These commercial and industrial loans are typically larger in amount than loans to individuals and, therefore, have the potential for larger losses on a single loan basis. Additionally, the repayment of commercial and industrial loans is subject to the ongoing business operations of the borrower. The collateral securing such loans generally includes movable property such as equipment and inventory, which may decline in value more rapidly than we anticipate; thus exposing us to increased credit risk. In addition, a portion of our customer base, including customers in the energy and real estate business, may be in industries which are particularly sensitive to commodity prices or market fluctuations, such as energy and real estate prices. Accordingly, negative changes in commodity prices and real estate values and liquidity could impair the value of the collateral securing these loans. Significant adverse changes in the economy or local market conditions or adverse weather events in the markets in which our commercial and industrial lending customers operate could cause rapid declines in loan collectability and the values associated with general business assets resulting in inadequate collateral coverage that may expose us to credit losses and could adversely affect our business, financial condition and results of operations.
Our commercial real estate and real estate construction and development loan portfolio exposes us to credit risks that may be greater than the risks related to other types of loans.
As of December 31, 2023, approximately $1.11 billion, or 30.4%, of our gross loans were nonresidential real estate loans (including owner-occupied commercial real estate loans) and approximately $693.6 million, or 19.1%, of our total loans were
23
construction and development loans. These loans typically involve repayment dependent upon income generated, or expected to be generated, by the property securing the loan in amounts sufficient to cover operating expenses and debt service. The availability of such income for repayment may be adversely affected by changes in the economy or local market conditions. Owner-occupied commercial real estate is generally less dependent upon income generated directly from the property but still carries risks from the successful operation of the underlying business or adverse economic conditions. These loans expose a lender to greater credit risk than loans secured by other types of collateral because the collateral securing these loans is typically more difficult to liquidate due to the fluctuation of real estate values. Additionally, non-owner occupied commercial real estate loans generally involve relatively large balances to single borrowers or related groups of borrowers. Unexpected deterioration in the credit quality of our non-owner occupied commercial real estate loan portfolio could require us to increase our allowance for loan losses, which would reduce our profitability and could have a material adverse effect on our business, financial condition and results of operations.
Construction and development loans also involve risks because loan funds are secured by a project under construction and the project is of uncertain value prior to its completion. It can be difficult to accurately evaluate the total funds required to complete a project, and construction and development lending often involves the disbursement of substantial funds with repayment dependent, in part, on the success of the ultimate project rather than the ability of a borrower or guarantor, if any, to repay the loan. If we are forced to foreclose on a project prior to completion, we may be unable to recover the entire unpaid portion of the loan. In addition, we may be required to fund additional amounts to complete a project, incur taxes, maintenance and compliance costs for a foreclosed property and may have to hold the property for an indeterminate period of time, any of which could adversely affect our business, financial condition and results of operations.
Because a significant portion of our loan portfolio is comprised of real estate loans, negative changes in the economy affecting real estate values and liquidity could impair the value of collateral securing our real estate loans and result in loan and other losses.
As of December 31, 2023, approximately $2.18 billion, or 59.9%, of our gross loans were loans with real estate as a primary component of collateral. The market value of real estate can fluctuate significantly in a short period of time. As a result, adverse developments affecting real estate values and the liquidity of real estate in our primary markets or in Texas generally could increase the credit risk associated with our loan portfolio, and could result in losses that adversely affect credit quality, financial condition and results of operations. Negative changes in the economy affecting real estate values and liquidity in our market areas could significantly impair the value of property pledged as collateral on loans and affect our ability to sell the collateral upon foreclosure without a loss or additional losses. Collateral may have to be sold for less than the outstanding balance of the loan, which could result in losses on such loans. Such declines and losses could have a material adverse effect on our business, financial condition and results of operations. If real estate values decline, it is also more likely that we would be required to increase our allowance for loan losses, which could adversely affect our business, financial condition and results of operations. In addition, adverse weather events, including hurricanes and flooding, can cause damages to the property pledged as collateral on loans, which could result in additional losses upon a foreclosure.
Our largest loan relationships currently make up a material percentage of our total loan portfolio.
As of December 31, 2023, our ten largest loan relationships (including related entities) totaled approximately $352.4 million in loans, or 9.7% of the total loan portfolio. The concentration risk associated with having a small number of large loan relationships is that, if one or more of these relationships were to become delinquent or suffer default, we could be at serious risk of material losses. The allowance for loan losses may not be adequate to cover losses associated with any of these relationships, and any loss or increase in the allowance would negatively affect our earnings and capital. Even if the loans are collateralized, the large increase in classified assets could harm our reputation with our regulators and inhibit our ability to execute our business plan.
Appraisals and other valuation techniques we use in evaluating and monitoring loans secured by real property, other real estate owned and repossessed personal property may not accurately describe the net value of the asset.
In considering whether to make a loan secured by real property, we generally require an appraisal of the property. However, an appraisal is only an estimate of the value of the property at the time the appraisal is made, and, as real estate values may change significantly in relatively short periods of time (especially in periods of heightened economic uncertainty), this estimate may not accurately describe the net value of the real property collateral after the loan is made. As a result, we may not be able to realize the full amount of any remaining indebtedness when we foreclose on and sell the relevant property. In addition, we rely on appraisals and other valuation techniques to establish the value of our OREO, and personal property that we acquire through foreclosure proceedings and to determine certain loan impairments. If any of these valuations are inaccurate, our combined and consolidated financial statements may not reflect the correct value of our OREO, and our allowance for loan losses may not reflect accurate loan impairments. This could have a material adverse effect on our business, financial condition or results of operations. As of December 31, 2023, we held no OREO or repossessed property and equipment.
24
We engage in lending secured by real estate and may be forced to foreclose on the collateral and own the underlying real estate, subjecting us to the costs and potential risks associated with the ownership of the real property, and consumer protection initiatives or changes in state or federal law may substantially raise the cost of foreclosure or prevent us from foreclosing at all.
Since we originate loans secured by real estate, we may have to foreclose on the collateral property to protect our investment and may thereafter own and operate such property, in which case we would be exposed to the risks inherent in the ownership of real estate. As of December 31, 2023, we held no OREO. The amount that we, as a mortgagee, may realize after a default is dependent upon factors outside of our control, including, but not limited to general or local economic condition, environmental cleanup liability, assessments, interest rates, real estate tax rates, operating expenses of the mortgaged properties, ability to obtain and maintain adequate occupancy of the properties, zoning laws, governmental and regulatory rules, and natural disasters. Our inability to manage the amount of costs or size of the risks associated with the ownership of real estate, or write-downs in the value of other real estate owned, could have a material adverse effect on our business, financial condition and results of operations.
Additionally, consumer protection initiatives or changes in state or federal law, including initiatives or changes implemented in response to the COVID-19 pandemic, may substantially increase the time and expense associated with the foreclosure process or prevent us from foreclosing at all. While Texas foreclosure laws have historically been favorable to lenders, a number of states in recent years have either considered or adopted foreclosure reform laws that make it substantially more difficult and expensive for lenders to foreclose on properties in default, and we cannot be certain that Texas will not adopt similar legislation in the future. Additionally, federal regulators have prosecuted a number of mortgage servicing companies for alleged consumer law violations. If new state or federal laws or regulations are ultimately enacted that significantly raise the cost of foreclosure or raise outright barriers, such cost barriers could have a material adverse effect on our business, financial condition and results of operation.
SBA lending is an important part of our business. Our SBA lending program is dependent upon the federal government and our status as a participant in the SBA’s Preferred Lenders Program, and we face specific risks associated with SBA loans.
We participate in the SBA’s Preferred Lenders Program. As an SBA Preferred Lender, we are able to provide our clients with access to SBA loans without being subject to the potentially lengthy SBA approval process necessary for lenders that are not SBA Preferred Lenders. The SBA periodically reviews the lending operations of participating management. When weaknesses are identified, the SBA may request corrective actions or impose enforcement actions, including revocation of our Preferred Lender status. If we lose our status as a Preferred Lender, we may lose some or all of our customers to lenders who are SBA Preferred Lenders, which could adversely affect our business, financial condition and results of operations.
On occasion, we may sell the guaranteed portion of our SBA 7(a) loans in the secondary market. If we sell the guaranteed portion of our SBA 7(a) loans, we will incur credit risk on the unguaranteed portion of the loans, and if a customer defaults on the unguaranteed portion of a loan, we would share any loss and recovery related to the loan pro-rata with the SBA.
The laws, regulations and standard operating procedures that are applicable to SBA loan products may change in the future. We cannot predict the effects of these changes on our business and profitability. Because government regulation greatly affects the business and financial results of all commercial banks and bank holding companies and especially our organization, changes in the laws, regulations and procedures applicable to SBA loans could adversely affect our ability to operate profitably. In addition, the aggregate amount of SBA 7(a) and 504 loan guarantees by the SBA must be approved each fiscal year by the federal government. We cannot predict the amount of SBA 7(a) loan guarantees in any given fiscal year. If the federal government were to reduce the amount of SBA loan guarantees, such reduction could adversely impact our SBA lending program.
The SBA may not honor its guarantees if we do not originate loans in compliance with SBA guidelines.
As of December 31, 2023, SBA 7(a) loans totaled $66.6 million and comprised 1.8% of our loan portfolio. SBA lending programs typically guarantee 75% of the principal on an underlying loan. If the SBA establishes that a loss on an SBA guaranteed loan is attributable to significant technical deficiencies in the manner in which the loan was originated, funded or serviced by us, the SBA may seek recovery of the principal loss related to the deficiency from us notwithstanding that a portion of the loan was guaranteed by the SBA, which could adversely affect our business, financial condition and results of operations. While we follow the SBA’s underwriting guidelines, our ability to do so depends on the knowledge and diligence of our employees and the effectiveness of controls we have established. If our employees do not follow the SBA guidelines in originating loans and if our loan review and audit programs fail to identify and rectify such failures, the SBA may reduce or, in some cases, refuse to honor its guarantee obligations and we may incur losses as a result.
Our commercial finance clients, particularly with respect to our commercial finance and asset-based lending product lines, may lack the operating history, cash flows or balance sheet necessary to support other financing options and may expose us to additional credit risk, especially if our additional controls for such products are ineffective in mitigating such additional risks.
A significant portion of our loan portfolio consists of commercial finance products. Some of these commercial finance products, particularly asset-based loans and our factored receivables (which totaled $26.5 million, or 0.7% of loans, as of December 31, 2023), arise out of relationships with clients who lack the operating history, cash flows or balance sheet necessary to qualify for more traditional bank financing options. We attempt to control for the additional credit risk in these relationships through credit management processes employed in connection with these transactions. However, if such controls are ineffective in controlling this
25
additional risk or if we fail to follow the procedures we have established for managing this additional risk, we could be exposed to additional losses with respect to such product lines that could have an adverse effect on our business, financial condition and results of operations.
Our asset-based lending and commercial finance products may expose us to an increased risk of fraud.
We rely on the structural features embedded in our asset-based lending and commercial finance products to mitigate the credit risk associated with such products. With respect to our asset-based loans, we limit our lending to a percentage of the customer’s borrowing base assets that we believe can be readily liquidated in the event of financial distress of the borrower. With respect to our commercial finance products, we purchase the underlying invoices of our customers and become the direct payee under such invoices, thus transferring the credit risk in such transactions from our customers to the underlying account debtors on such invoices. In the event one or more of our customers fraudulently represents the existence or valuation of borrowing base assets in the case of an asset-based loan, or the existence or validity of an invoice we purchase in the case of a commercial finance transaction, we may advance more funds to such customer than we otherwise would and lose the benefit of the structural protections of our products with respect to such advances. In such event we could be exposed to material additional losses with respect to such loans or commercial finance products. Although we believe we have controls in place to monitor and detect fraud with respect to our asset-based lending and commercial finance products, there is no guarantee such controls will be effective. Losses from such fraudulent activity could have a material impact on our business, financial condition and results of operations.
New lines of business or new products and services may subject us to additional risks.
From time to time, we may implement or may acquire new lines of business or offer new products and services within existing lines of business. There are substantial risks and uncertainties associated with these efforts, particularly in instances where the markets are not fully developed. In developing and marketing new lines of business and new products and services, we may invest significant time and resources. We may not achieve target timetables for the introduction and development of new lines of business and new products or services and price and profitability targets may not prove feasible. External factors, such as regulatory compliance obligations, competitive alternatives and shifting market preferences, may also impact the successful implementation of a new line of business or a new product or service. Furthermore, any new line of business or new product or service could have a significant impact on the effectiveness of our system of internal controls. Failure to successfully manage these risks in the development and implementation of new lines of business or new products or services could have a material adverse effect on our business, results of operations and financial condition.
If we fail to maintain effective internal control over financial reporting, we may not be able to report our financial results accurately and timely, in which case our business may be harmed, investors may lose confidence in the accuracy and completeness of our financial reports, we could be subject to regulatory penalties and the price of our common stock may decline.
Our management is responsible for establishing and maintaining adequate internal control over financial reporting and for evaluating and reporting on that system of internal control. Our internal control over financial reporting is a process designed to provide reasonable assurance regarding the reliability of financial reporting and the preparation of financial statements for external purposes in accordance with generally accepted accounting principles. As a public company, we are required to comply with the Sarbanes-Oxley Act and other rules that govern public companies. In particular, we are required to certify our compliance with Section 404 of the Sarbanes-Oxley Act, which requires us to furnish annually a report by management on the effectiveness of our internal control over financial reporting. In addition, unless we remain an emerging growth company and elect additional transitional relief available to emerging growth companies, our independent registered public accounting firm will be required to report on the effectiveness of our internal control over financial reporting.
We will continue to periodically test and update, as necessary, our internal control systems, including our financial reporting controls. Our actions, however, may not be sufficient to result in an effective internal control environment, and any future failure to maintain effective internal control over financial reporting could impair the reliability of our financial statements which in turn could harm our business, impair investor confidence in the accuracy and completeness of our financial reports, impair our access to the capital markets, and cause the price of our common stock to decline and subject us to regulatory penalties.
We are dependent on the use of data and modeling in our management’s decision-making, and faulty data or modeling approaches could negatively impact our decision-making ability or possibly subject us to regulatory scrutiny in the future.
The use of statistical and quantitative models and other quantitative analyses is endemic to bank decision-making, and the employment of such analyses is becoming increasingly widespread in our operations. Liquidity stress testing, interest rate sensitivity analysis, and the identification of possible violations of anti-money laundering regulations are all examples of areas in which we are dependent on models and the data that underlies them. The use of statistical and quantitative models is also becoming more prevalent in regulatory compliance. While we are not currently subject to annual Dodd-Frank Act stress testing (DFAST) and the Comprehensive Capital Analysis and Review (CCAR) submissions, we anticipate that model-derived testing may become more extensively implemented by regulators in the future.
We anticipate data-based modeling will penetrate further into bank decision-making, particularly risk management efforts, as the capacities developed to meet rigorous stress testing requirements can be employed more widely and in differing applications. While
26
we believe these quantitative techniques and approaches improve our decision-making, they also create the possibility that faulty data or flawed quantitative approaches could negatively impact our decision-making ability or, if we become subject to regulatory stress testing in the future, adverse regulatory scrutiny. Further, because of the complexity inherent in these approaches, misunderstanding or misuse of their outputs could similarly result in suboptimal decision-making.
We have pledged all of the stock of the Bank as collateral for a loan and if the lender forecloses, you could lose your investment.
We have pledged all of the stock of the Bank as collateral for our senior debt - line of credit. As of December 31, 2023, the line of credit had an outstanding balance of approximately $38.9 million. If we were to default, the lender could foreclose on the Bank’s stock and we would lose our principal asset. In that event, if the value of the Bank’s stock is less than the amount of the indebtedness, you could lose the entire amount of your investment.
A lack of liquidity could impair our ability to fund operations and could have a material adverse effect on our business, financial condition and results of operations.
Liquidity is essential to our business. Liquidity risk is the potential that we will be unable to meet our obligations as they become due because of an inability to liquidate assets or obtain adequate funding. We require sufficient liquidity to meet customer loan requests, customer deposit maturities and withdrawals, payments on our debt obligations as they come due and other cash commitments under both normal operating conditions and other unpredictable circumstances, including events causing industry or general financial market stress. We rely on our ability to generate deposits and effectively manage the repayment and maturity schedules of our loans and investment securities, respectively, to ensure that we have adequate liquidity to fund our operations. An inability to raise funds through deposits, borrowings, the sale of our investment securities, the sale of loans, and other sources could have a substantial negative effect on our liquidity. Our most important source of funds is deposits. As of December 31, 2023, approximately $3.33 billion, or 87.5%, of our total deposits were noninterest-bearing deposits, negotiable order of withdrawal, or NOW, savings and money market accounts. Historically our savings, money market deposit accounts, NOW and demand accounts have been stable sources of funds. However, these deposits are subject to potentially dramatic fluctuations in availability or price due to factors that may be outside of our control, such as a loss of confidence by customers in us or the banking sector generally, customer perceptions of our financial health and general reputation, increasing competitive pressures from other financial services firms for consumer or corporate customer deposits, changes in interest rates and returns on other investment classes. As a result, there could be significant outflows of deposits within short periods of time or significant changes in pricing necessary to maintain current customer deposits or attract additional deposits, increasing our funding costs and reducing our net interest income and net income.
As of December 31, 2023, the $475.9 million remaining balance of deposits consisted of certificates of deposit, of which $392.8 million, or 10.3% of our total deposits, were due to mature within one year. Historically, a majority of our certificates of deposit are renewed upon maturity as long as we pay competitive interest rates. These customers are, however, interest-rate conscious and may move funds into higher-yielding investment alternatives. If customers transfer money out of the Bank’s deposits and into other investments such as money market funds, we would lose a relatively low-cost source of funds, increasing our funding costs and reducing our net interest income and net income.
Other primary sources of funds consist of cash flows from operations and our ability to borrow from the FHLB. We also may borrow funds from third-party lenders, such as other financial institutions. Our access to funding sources in amounts adequate to finance or capitalize our activities, or on terms that are acceptable to us, could be impaired by factors that affect us directly or the financial services industry or economy in general, such as disruptions in the financial markets or negative views and expectations about the prospects for the financial services industry. Our access to funding sources could also be affected by a decrease in the level of our business activity as a result of a downturn in the Texas economy or by one or more adverse regulatory actions against us.
A failure to maintain adequate liquidity could adversely impact our ability to originate loans, invest in securities, meet our expenses, or fulfill obligations such as repaying our borrowings or meeting deposit withdrawal demands, any of which could, in turn, have a material adverse effect on our business, financial condition and results of operations.
We may need to raise additional capital in the future, and such capital may not be available when needed or at all.
We may need to raise additional capital, in the form of additional debt or equity, in the future to have sufficient capital resources and liquidity to meet our commitments and fund our business needs and future growth, particularly if the quality of our assets or earnings were to deteriorate significantly. Our ability to raise additional capital, if needed, will depend on, among other things, conditions in the capital markets at that time, which are outside of our control, and our financial condition. Economic conditions and a loss of confidence in financial institutions may increase our cost of funding and limit access to certain customary sources of capital or make such capital only available on unfavorable terms, including interbank borrowings, repurchase agreements and borrowings from the discount window of the Federal Reserve. We may not be able to obtain capital on acceptable terms—or at all. Any occurrence that may limit our access to the capital markets, such as a decline in the confidence of debt purchasers, depositors of our Bank or counterparties participating in the capital markets or other disruption in capital markets, may adversely affect our capital costs and our ability to raise capital and, in turn, our liquidity. Further, if we need to raise capital in the future, we may have to do so when many other financial institutions are also seeking to raise capital and would then have to compete with those institutions for investors. An
27
inability to raise additional capital on acceptable terms when needed could have a material adverse effect on our business, financial condition and results of operations.
The borrowing needs of our clients may increase, especially in a challenging economic environment, which could result in increased borrowing against our contractual obligations to extend credit.
A commitment to extend credit is a formal agreement to lend funds to a client as long as there is no violation of any condition established under the agreement. The actual borrowing needs of our clients under these credit commitments have historically been lower than the contractual amount of the commitments. A significant portion of these commitments expire without being drawn upon. Because of the credit profile of our clients, we typically have a substantial amount of total unfunded credit commitments, which is not reflected on our balance sheet. As of December 31, 2023, we had $1.38 billion in unfunded credit commitments and standby letters of credit to our clients. Actual borrowing needs of our clients may exceed our expectations, especially in a challenging economic environment when our clients’ companies may be more dependent on our credit commitments due to the lack of available credit elsewhere, the increasing costs of credit, or the limited availability of financings from venture firms. This could adversely affect our liquidity, which could impair our ability to fund operations and meet obligations as they become due and could have a material adverse effect on our business, financial condition and results of operations. See “Risk Factors—Risks Related to Our Business and Operations—A lack of liquidity could impair our ability to fund operations and could have a material adverse effect on our business, financial condition and results of operations.”
We face strong competition from financial services companies and other companies that offer banking services.
We operate in the highly competitive financial services industry and face significant competition for customers from financial institutions located both within and beyond our principal markets. We compete with commercial banks, savings banks, credit unions, nonbank financial services companies and other financial institutions operating within or near the areas we serve. Additionally, certain large banks headquartered outside of our markets and large community banking institutions target the same customers we do. In addition, as customer preferences and expectations continue to evolve, technology has lowered barriers to entry and made it possible for banks to expand their geographic reach by providing services over the internet and mobile devices and for nonbanks to offer products and services traditionally provided by banks, such as automatic transfer and automatic payment systems. The banking industry has experienced rapid changes in technology, and, as a result, our future success may depend in part on our ability to address our customers’ needs by using technology. Customer loyalty can be influenced by a competitor’s new products, especially offerings that could provide cost savings or a higher return to the customer. Increased lending activity of competing banks can also lead to increased competitive pressures on loan rates and terms for high-quality credits. We may not be able to compete successfully with other financial institutions in our markets, and we may have to pay higher interest rates to attract deposits, accept lower yields to attract loans and pay higher wages for new employees, resulting in lower net interest margins and reduced profitability.
Many of our nonbank competitors are not subject to the same extensive regulations that govern our activities and may have greater flexibility in competing for business. The financial services industry could become even more competitive as a result of legislative, regulatory and technological changes and continued consolidation. In addition, some of our current commercial banking customers may seek alternative banking sources as they develop needs for credit facilities larger than we may be able to accommodate. Our inability to compete successfully in the markets in which we operate could have a material adverse effect on our business, financial condition or results of operations.
We could be adversely affected by the soundness of other financial institutions.
Financial services institutions are interrelated as a result of trading, clearing, counterparty or other relationships. We have exposure to many different industries and counterparties, and routinely execute transactions with counterparties in the financial services industry, including commercial banks, brokers and dealers, investment banks and other institutional clients. Many of these transactions expose us to credit risk in the event of a default by a counterparty or client. In addition, our credit risk may be exacerbated when our collateral cannot be foreclosed upon or is liquidated at prices not sufficient to recover the full amount of the credit or derivative exposure due. Any such losses could adversely affect our business, financial condition and results of operations.
Negative public opinion regarding our company or failure to maintain our reputation in the communities we serve could adversely affect our business and prevent us from growing our business.
Our reputation within the communities we serve is critical to our success. We believe we have set ourselves apart from our competitors by building strong personal and professional relationships with our customers and being active members of the communities we serve. As such, we strive to enhance our reputation by recruiting, hiring and retaining employees who share our core values of being an integral part of the communities we serve and delivering superior service to our customers. If our reputation is negatively affected by the actions of our employees or otherwise, we may be less successful in attracting new talent and customers or may lose existing customers, and our business, financial condition and results of operations could be adversely affected. Further, negative public opinion can expose us to litigation and regulatory action and delay and impede our efforts to implement our expansion strategy, which could further adversely affect our business, financial condition and results of operations.
28
We may not be able to overcome the integration and other risks associated with acquisitions, which could have a material adverse effect on our ability to implement our business strategy.
Although we plan to continue to grow our business organically and through de novo branching, we also intend to pursue acquisition opportunities that we believe will be accretive to our earnings per share, enhance our existing market presence, expand our markets of operation or strengthen our balance sheet, with an emphasis on the acquisition of banks with a strong deposit franchise and high-quality funding profiles to augment our core deposit base. Our acquisition activities could be material to our business and involve a number of risks, including the following:
|
• |
|
intense competition from other banking organizations and other acquirers for potential target companies; |
|
• |
|
market pricing for desirable acquisitions resulting in returns that are less attractive than we have traditionally sought to achieve; |
|
• |
|
incurring time and expense associated with identifying and evaluating potential acquisitions and negotiating potential transactions, resulting in our attention being diverted from the operation of our existing business; |
|
• |
|
using inaccurate estimates and judgments to evaluate credit, operations, management and market risks with respect to the target institution or assets; |
|
• |
|
failure to achieve expected revenues, earnings or synergies from an acquisition; |
|
• |
|
potential exposure to unknown or contingent liabilities of banks and businesses we acquire, including compliance and regulatory issues; |
|
• |
|
the time and expense required to integrate the operations and personnel of the combined businesses; |
|
• |
|
experiencing higher operating expenses relative to operating income from the new operations and the failure to achieve expected cost savings; |
|
• |
|
losing key employees and customers; |
|
• |
|
reputational issues if the target’s management does not align with our culture and values; |
|
• |
|
significant problems relating to the conversion of the financial and customer data of the target; |
|
• |
|
integration of acquired customers into our financial and customer product systems; |
|
• |
|
risks of impairment to goodwill and other acquired assets; or |
|
• |
|
regulatory timeframes for review of applications, which may limit the number and frequency of transactions we may be able to consummate. |
Depending on the condition of any institution or assets or liabilities that we may acquire, that acquisition may, at least in the near term, adversely affect our capital and earnings and, if not successfully integrated with our organization, may continue to have such effects over a longer period. We may not be successful in overcoming these risks or any other problems encountered in connection with pending or potential acquisitions, and any acquisition we may consider will be subject to prior regulatory approval. Our inability to overcome these risks could have an adverse effect on our ability to implement our business strategy, which, in turn, could have a material adverse effect on our business, financial condition and results of operations.
The accuracy of our financial statements and related disclosures could be affected if the judgments, assumptions or estimates used in our critical accounting policies are inaccurate.
The preparation of financial statements and related disclosures in conformity with GAAP requires us to make judgments, assumptions and estimates that affect the amounts reported in our consolidated financial statements and accompanying notes. Our critical accounting policies, which are included in the section captioned “Management’s Discussion and Analysis of Financial Condition and Results of Operations—Critical Accounting Policies” in this Annual Report on Form 10-K, describe those significant accounting policies and methods used in the preparation of our consolidated financial statements that we consider “critical” because they require judgments, assumptions and estimates that materially affect our consolidated financial statements and related disclosures. As a result, if future events or regulatory views concerning such analysis differ significantly from the judgments, assumptions and estimates in our critical accounting policies, those events or assumptions could have a material impact on our consolidated financial statements and related disclosures, in each case resulting in our needing to revise or restate prior period financial statements, cause damage to our reputation and the price of our common stock, and adversely affect our business, financial condition and results of operations.
There could be material changes to our financial statements and disclosures if there are changes in accounting standards or regulatory interpretations of existing standards.
From time to time the FASB or the SEC change the financial accounting and reporting standards that govern the preparation of our financial statements. Such changes may result in us being subject to new accounting and reporting standards or change existing accounting and reporting standards. In addition, the bodies that interpret the accounting standards (such as banking regulators or outside auditors) may change their interpretations or positions on how new or existing standards should be applied. These changes may be beyond our control, can be hard to predict and can materially impact how we record and report our financial condition and results of operations. In some cases, we could be required to apply a new standard, revise an existing standard or change the application of an existing standard in such a way that financial statements for periods previously reported are revised. Such changes could materially change our financial statements and related disclosures and, depending on the nature of the revision, could cause
29
damage to our reputation and the price of our common stock and adversely affect our business, financial condition and results of operations.
We are subject to certain operational risks, including, but not limited to, customer, employee or third-party fraud and data processing system failures and errors.
Because we are a financial institution, employee errors and employee or customer misconduct could subject us in particular to financial losses or regulatory sanctions and seriously harm our reputation. Misconduct by our employees could include hiding unauthorized activities from us, improper or unauthorized activities on behalf of our customers or improper use of confidential information each of which can be particularly damaging for financial institutions. It is not always possible to prevent employee errors and misconduct, and the precautions we take to prevent and detect this activity may not be effective in all cases. Employee errors could also subject us to financial claims for negligence.
We maintain a system of internal controls to mitigate operational risks, including data processing system failures and errors and customer or employee fraud, as well as insurance coverage designed to protect us from material losses associated with these risks, including losses resulting from any associated business interruption. If our internal controls fail to prevent or detect an occurrence, or if any resulting loss is not insured or exceeds applicable insurance limits, it could adversely affect our business, financial condition and results of operations.
We depend on the accuracy and completeness of information provided to us by our borrowers and counterparties and any misrepresented or fraudulent information could adversely affect our business, results of operations and financial condition.
In deciding whether to approve loans or to enter into other transactions with borrowers and counterparties, we rely on information furnished to us by, or on behalf of, borrowers and counterparties, including financial statements, credit reports and other financial information. We also rely on representations of borrowers and counterparties as to the accuracy and completeness of that information and, with respect to financial statements, on reports of independent auditors. If any of this information is intentionally or negligently misrepresented or fraudulent and such misrepresentation or fraud is not detected prior to loan funding, the value of the loan may be significantly lower than expected and we may be subject to regulatory action. Whether a misrepresentation is made by the loan applicant, another third party, or one of our employees, we generally bear the risk of loss associated with the misrepresentation or fraud. Our controls and processes may not have detected, or may not detect all, misrepresented or fraudulent information in our loan originations or from our business clients. Any such misrepresented or fraudulent information could adversely affect our business, financial condition and results of operations.
We may be subject to environmental liabilities in connection with the real properties we own and the foreclosure on real estate assets securing our loan portfolio.
In the course of our business, we may purchase real estate in connection with our acquisition and expansion efforts, or we may foreclose on and take title to real estate or otherwise be deemed to be in control of property that serves as collateral on loans we make. As a result, we could be subject to environmental liabilities with respect to those properties. We may be held liable to a governmental entity or to third parties for property damage, personal injury, investigation and clean-up costs incurred by these parties in connection with environmental contamination, or we may be required to investigate or clean up hazardous or toxic substances or chemical releases at a property. The costs associated with investigation or remediation activities could be substantial. In addition, if we are the owner or former owner of a contaminated site, we may be subject to common law claims by third parties based on damages and costs resulting from environmental contamination emanating from the property.
The cost of removal or abatement may substantially exceed the value of the affected properties or the loans secured by those properties, we may not have adequate remedies against the prior owners or other responsible parties and we may not be able to resell the affected properties either before or after completion of any such removal or abatement procedures. If material environmental problems are discovered before foreclosure, we generally will not foreclose on the related collateral or will transfer ownership of the loan to a subsidiary formed for such purpose. It should be noted, however, that the transfer of the property or loans to a subsidiary may not protect us from environmental liability. Furthermore, despite these actions on our part, the value of the property as collateral will generally be substantially reduced or we may elect not to foreclose on the property and, as a result, we may suffer a loss upon collection of the loan. Any significant environmental liabilities could have a material adverse effect on our business, financial condition and results of operations.
We are subject to claims and litigation pertaining to intellectual property in addition to other litigation in the ordinary course of business.
Banking and other financial services companies, such as our Company, rely on technology companies to provide information technology products and services necessary to support their day-to-day operations. Technology companies frequently enter into litigation based on allegations of patent infringement or other violations of intellectual property rights. In addition, patent holding companies seek to monetize patents they have purchased or otherwise obtained. Competitors of our vendors, or other individuals or companies, may from time to time claim to hold intellectual property sold to us by our vendors. Such claims may increase in the future as the financial services sector becomes more reliant on information technology vendors. The plaintiffs in these actions frequently seek injunctions and substantial damages.
30
Regardless of the scope or validity of such patents or other intellectual property rights, or the merits of any claims by potential or actual litigants, we may have to engage in protracted litigation. Such litigation is often expensive, time-consuming, disruptive to our operations and distracting to management. If we are found to infringe one or more patents or other intellectual property rights, we may be required to pay substantial damages or royalties to a third party. In certain cases, we may consider entering into licensing agreements for disputed intellectual property, although no assurance can be given that such licenses can be obtained on acceptable terms or that litigation will not occur. These licenses may also significantly increase our operating expenses. If legal matters related to intellectual property claims were resolved against us or settled, we could be required to make payments in amounts that could have a material adverse effect on our business, financial condition and results of operations.
In addition to litigation relating to intellectual property, we are regularly involved in litigation matters in the ordinary course of business. While we believe that these litigation matters should not have a material adverse effect on our business, financial condition, results of operations or future prospects, we may be unable to successfully defend or resolve any current or future litigation matters, in which case those litigation matters could have a material adverse effect on our business, financial condition and results of operations.
Recent negative developments affecting the banking industry, and resulting media coverage, have eroded customer confidence in the banking system.
The recent high-profile bank failures involving Silicon Valley Bank, Signature Bank and First Republic Bank have generated significant market volatility among publicly traded bank holding companies and, in particular, regional banks like the Bank. These market developments have negatively impacted customer confidence in the safety and soundness of regional banks. As a result, customers may choose to maintain deposits with larger financial institutions or invest in higher yielding short-term fixed income securities, all of which could materially adversely impact the Bank’s liquidity, loan funding capacity, net interest margin, capital and results of operations. While the Department of the Treasury, the Federal Reserve, and the FDIC have made statements ensuring that depositors of these recently failed banks would have access to their deposits, including uninsured deposit accounts, there is no guarantee that such actions will be successful in restoring customer confidence in regional banks and the banking system more broadly.
Any regulatory examination scrutiny or new regulatory requirements arising from the recent events in the banking industry could increase the Company’s expenses and affect the Company’s operations.
The Company and the Bank anticipate increased regulatory scrutiny and new regulations directed towards banks of similar size to the Bank, designed to address the recent negative developments in the banking industry, all of which may increase the Company’s costs of doing business and reduce its profitability. Among other things, there may be an increased focus by both regulators and investors on deposit composition and the level of uninsured deposits. As a result, the Bank could face increased scrutiny or be viewed as higher risk by regulators and the investor community. The Bank’s level of uninsured customer deposits as a percentage of non-brokered deposits was 32.7% at December 31, 2023.
Risks Related to the Economy and Our Industry
Inflationary pressures and rising prices may affect our results of operations and financial condition.
Inflation rose in 2022 at levels not seen for over 40 years, and inflationary pressures continued in 2023 and are expected to continue into 2024. Inflation could lead to increased costs to our customers, making it more difficult for them to repay their loans or other obligations increasing our credit risk. In general, the impact of inflation on the banking industry differs significantly from that of other industries in which a large portion of total resources are invested in fixed assets such as property, plant and equipment. Assets and liabilities of financial institutions are primarily all monetary in nature, and therefore are principally impacted by interest rates rather than changing prices. While the general level of inflation underlies most interest rates, interest rates react more to changes in the expected rate of inflation and to changes in monetary and fiscal policy. Sustained high inflation could result in market volatility and higher interest rates.
Sustained higher interest rates by the Federal Reserve may be needed to tame persistent inflationary price pressures, which could depress asset prices and weaken economic activity. A deterioration in economic conditions in the United States and our markets could result in an increase in loan delinquencies and non-performing assets, decreases in loan collateral values and a decrease in demand for our products and services, all of which, in turn, would adversely affect our business, financial condition and results of operations.
Our business is concentrated in, and largely dependent upon, the continued growth and welfare of our primary markets of the Greater Houston market, Dallas-Fort Worth market, and Austin-San Antonio market, and adverse economic conditions in these markets could negatively impact our operations and customers.
Our business, financial condition and results of operations are affected by changes in the economic conditions of our primary markets of the Greater Houston market, Dallas-Fort Worth market, and Austin-San Antonio market. Our success depends to a significant extent upon the business activity, population, income levels, employment trends, deposits and real estate activity in our primary markets. Economic conditions within our primary markets, and the state of Texas in general, are influenced by, among other things, real estate prices and commodity prices, including the price of oil and gas specifically. Although our customers’ business and financial interests may extend well beyond our primary markets, adverse conditions that affect our primary markets could reduce our
31
growth rate, affect the ability of our customers to repay their loans, affect the value of collateral underlying our loans, affect our ability to attract deposits and generally affect our business, financial condition, results of operations and future prospects. Due to our geographic concentration within our primary markets, we may be less able than other larger regional or national financial institutions to diversify our credit risks across multiple markets.
Our primary markets are susceptible to natural disasters and other catastrophes that could negatively impact the economies of our markets, our operations or our customers, any of which could have a material adverse effect on our business, financial condition and results of operations.
A significant portion of our business is generated from the Greater Houston market, which is susceptible to damage by hurricanes, such as Hurricane Harvey, which struck the Greater Houston market in 2017, and Hurricane Laura, which struck the Greater Houston market in 2020. We are also subject to tornadoes, floods, droughts and other natural disasters and adverse weather. In addition to natural disasters, man-made events, such as acts of terror and governmental response to acts of terror, malfunction of the electronic grid and other infrastructure breakdowns, could adversely affect economic conditions in our primary markets. These catastrophic events can disrupt our operations, cause widespread property damage, and severely depress the local economies in which we operate. If the economies in our primary markets experience an overall decline as a result of a catastrophic event, demand for loans and our other products and services could be reduced. In addition, the rates of delinquencies, foreclosures, bankruptcies and losses on loan portfolios may increase substantially after events such as hurricanes, as uninsured property losses or sustained job interruption or loss may materially impair the ability of borrowers to repay their loans. Moreover, the value of real estate or other collateral that secures the loans could be materially and adversely affected by a catastrophic event. A natural disaster or other catastrophic event could, therefore, result in decreased revenue and loan losses that have a material adverse effect on our business, financial condition and results of operations.
Climate change, and related legislative and regulatory initiatives, have the potential to disrupt our business and adversely impact the operations and creditworthiness of our customers.
Climate change may lead to more frequent and more extreme weather events, such as prolonged droughts or flooding, hurricanes, wildfires and extreme seasonal weather, which could disrupt operations at one or more of our locations and our ability to provide financial products and services to our customers. Such events could also have a negative effect on the financial status and creditworthiness of our customers, which may decrease revenues and business activities from those customers and increase the credit risk associated with loans and other credit exposures to such customers. In addition, weather disasters, shifts in local climates and other disruptions related to climate change may adversely affect the value of real properties securing our loans, which could diminish the value of our loan portfolio. Such events may also cause reductions in regional and local economic activity that may have an adverse effect on our customers, which could limit our ability to raise and invest capital in these areas and communities, each of which could have a material adverse effect on our financial condition and results of operations.
Political and social attention to the issue of climate change has increased. The federal and state legislatures and regulatory agencies have proposed legislative and regulatory initiatives seeking to mitigate the effects of climate change. These agreements and measures may result in the imposition of taxes and fees, the required purchase of emission credits, and the implementation of significant operational changes. In addition, the federal banking agencies may address climate-related issues in their agendas in various ways, including by increasing supervisory expectations with respect to banks’ risk management practices, accounting for the effects of climate change in stress testing scenarios and systemic risk assessments, revising expectations for credit portfolio concentrations based on climate-related factors, and encouraging investment by banks in climate-related initiatives and lending to communities disproportionately impacted by the effects of climate change. We may incur compliance, operating, maintenance and remediation costs.
Increasing scrutiny and evolving expectations from customers, regulators, investors, and other stakeholders with respect to our environmental, social and governance practices may impose additional costs on us or expose us to new or additional risks.
Companies are facing increasing scrutiny from customers, regulators, investors, and other stakeholders related to their environmental, social and governance (“ESG”) practices and disclosure. Investor advocacy groups, investment funds and influential investors are also increasingly focused on these practices, especially as they relate to the environment, health and safety, diversity, labor conditions and human rights. Increased ESG related compliance costs could result in increases to our overall operational costs. Failure to adapt to or comply with regulatory requirements or investor or stakeholder expectations and standards could negatively impact our reputation, ability to do business with certain partners, and our stock price. New government regulations could also result in new or more stringent forms of ESG oversight and expanding mandatory and voluntary reporting, diligence, and disclosure.
We could recognize losses on investment securities held in our securities portfolio, particularly if interest rates increase or economic and market conditions deteriorate.
While we invest a significant majority of our total assets in loans and currently invest a small portion of our total assets in investment securities, we may in the future invest a larger portion of our assets in investment securities with the objective of providing a source of liquidity, providing an appropriate return on funds invested, managing interest rate risk, meeting pledging requirements and meeting regulatory capital requirements. Factors beyond our control can significantly and adversely influence the fair value of
32
securities in our portfolio. For example, fixed-rate securities are generally subject to decreases in market value when interest rates rise. Additional factors include, but are not limited to, rating agency downgrades of the securities, defaults by the issuer or individual borrowers with respect to the underlying securities, and instability in the credit markets. Any of the foregoing factors could cause other-than-temporary impairment in future periods and result in realized losses. The process for determining whether impairment is other-than-temporary usually requires difficult, subjective judgments about the future financial performance of the issuer and any collateral underlying the security in order to assess the probability of receiving all contractual principal and interest payments on the security. Although we have not recognized other-than-temporary impairment related to our investment portfolio as of December 31, 2023, changing economic and market conditions affecting interest rates, the financial condition of issuers of the securities and the performance of the underlying collateral, among other factors, may cause us to recognize realized and/or unrealized losses in future periods, which could have a material adverse effect on our business, financial condition and results of operations.
Market conditions and economic trends may adversely affect the banking industry and could adversely affect our business, financial condition and results of operations in the future.
Market conditions and economic trends nationally and locally, such as uncertain regulatory conditions, real estate and commodity prices, and changing interest rates could adversely impact our business, financial condition and results of operations. We have direct exposure to the real estate markets in Texas and thus are impacted by declines in real estate values. In addition, while we have limited direct exposure to the oil and gas industry, the economy of the state of Texas is influenced by and financial institutions may be negatively affected by, among other things, volatility in the real estate and oil and gas industries. Our markets are also susceptible to hurricanes and other natural disasters and adverse weather conditions.
Our ability to assess the creditworthiness of customers and to estimate the losses inherent in our loan portfolio is made more complex by market and economic conditions. A national economic downturn or deterioration of conditions in our markets could adversely affect our borrowers and cause losses beyond those that are provided for in our allowance for loan losses and lead to the following consequences:
Risks Related to Cybersecurity, Third-Parties and Technology
We depend on our information technology and telecommunications systems of third parties, and any systems failures, interruptions or data breaches involving these systems could adversely affect our operations and financial condition.
Our business depends on the successful and uninterrupted functioning of our information technology and telecommunications systems including with third-party servicers and financial intermediaries. We outsource many of our major systems. Specifically, we rely on third parties for certain services, including, but not limited to, core systems processing, website hosting, internet services, monitoring our network and other processing services. The failure of these systems, a cybersecurity breach involving any of our third-party service providers, or the termination or change in terms of a third-party software license or service agreement on which any of these systems is based, could interrupt our operations. Because our information technology and telecommunications systems interface with and depend on third-party systems, we could experience service denials if demand for such services exceeds capacity or such third-party systems fail or experience interruptions. Replacing vendors or addressing other issues with our third-party service providers could entail significant delay, expense and disruption of service.
As a result, if these third-party service providers experience difficulties, are subject to cybersecurity breaches, or terminate their services, and we are unable to replace them with other service providers, particularly on a timely basis, our operations could be interrupted. If an interruption were to continue for a significant period of time, our business, financial condition and results of operations could be adversely affected. Even if we are able to replace third-party service providers, it may be at a higher cost to us, which could adversely affect our business, financial condition and results of operations.
In addition, the Bank’s primary federal regulator, the Federal Reserve, has issued guidance outlining the expectations for third-party service provider oversight and monitoring by financial institutions. The federal banking agencies, including the Federal Reserve, have recently issued enforcement actions against financial institutions for failure in oversight of third-party providers and violations of federal banking law by such providers when performing services for financial institutions. Accordingly, our operations could be interrupted if any of our third-party service providers experience difficulty, are subject to cybersecurity breaches, terminate their services or fail to comply with banking regulations, which could adversely affect our business, financial condition and results of operations. In addition, our failure to adequately oversee the actions of our third-party service providers could result in regulatory actions against the Bank, which could adversely affect our business, financial condition and results of operations.
33
The occurrence of fraudulent activity, breaches of our information security, and cybersecurity attacks could adversely affect our ability to conduct our business, manage our exposure to risk or expand our businesses, result in the disclosure or misuse of confidential or proprietary information, increase our costs to maintain and update our operational and security systems and infrastructure, and adversely impact our results of operations, liquidity and financial condition, as well as cause legal or reputational harm.
As a financial institution, we are susceptible to fraudulent activity, information security breaches and cybersecurity-related incidents that may be committed against us, our clients, or third parties with whom we interact and that may result in financial losses or increased costs to us or our clients, disclosure or misuse of confidential information belonging to us or personal or confidential information belonging to our clients, misappropriation of assets, litigation, or damage to our reputation. Our industry has seen increases in electronic fraudulent activity, hacking, security breaches, sophisticated social engineering and cyber-attacks within the financial services industry, including in the commercial banking sector, as cyber-criminals have been targeting commercial bank and brokerage accounts on an increasing basis.
Our business is highly dependent on the security and efficacy of our infrastructure, computer and data management systems, as well as those of third parties with whom we interact or on whom we rely. Our business relies on the secure processing, transmission, storage and retrieval of confidential, proprietary and other information in our computer and data management systems and networks, and in the computer and data management systems and networks of third parties. In addition, to access our network, products and services, our customers and other third parties may use personal mobile devices or computing devices that are outside of our network environment and are subject to their own cybersecurity risks. All of these factors increase our risks related to cyber-threats and electronic disruptions.
In addition to well-known risks related to fraudulent activity, which take many forms, such as check “kiting” or fraud, wire fraud, and other dishonest acts, information security breaches and cybersecurity-related incidents have become a material risk in the financial services industry. These threats may include fraudulent or unauthorized access to data processing or data storage systems used by us or by our clients, electronic identity theft, “phishing”, account takeover, denial or degradation of service attacks, and malware or other cyber-attacks. These electronic viruses or malicious code are typically designed to, among other things:
|
• |
|
obtain unauthorized access to confidential information belonging to us or our clients and customers; |
|
• |
|
manipulate or destroy data; |
|
• |
|
disrupt, sabotage or degrade service on a financial institution’s systems; and |
|
• |
|
steal money. |
In recent periods, several governmental agencies and large corporations, including financial service organizations and retail companies, have suffered major data breaches, in some cases exposing not only their confidential and proprietary corporate information, but also sensitive financial and other personal information of their clients and their employees or other third-parties, and subjecting those agencies and corporations to potential fraudulent activity and their clients and other third-parties to identity theft and fraudulent activity in their credit card and banking accounts. Therefore, security breaches and cyber-attacks can cause significant increases in operating costs, including the costs of compensating clients and customers for any resulting losses they may incur and the costs and capital expenditures required to correct the deficiencies in and strengthen the security of data processing and storage systems.
Unfortunately, it is not always possible to anticipate, detect or recognize these threats to our systems, or to implement effective preventative measures against all breaches, whether those breaches are malicious or accidental. Cybersecurity risks for banking organizations have significantly increased in recent years and have been difficult to detect before they occur because of the following, among other reasons:
|
• |
|
the proliferation of new technologies, and the use of the Internet and telecommunications technologies to conduct financial transactions; |
|
• |
|
these threats arise from numerous sources, not all of which are in our control, including among others human error, fraud or malice on the part of employees or third parties, accidental technological failure, electrical or telecommunication outages, failures of computer servers or other damage to our property or assets, natural disasters or severe weather conditions, health emergencies or pandemics, or outbreaks of hostilities or terrorist acts; |
|
• |
|
the techniques used in cyber-attacks change frequently and may not be recognized until launched or until well after the breach has occurred; |
|
• |
|
the increased sophistication and activities of organized crime groups, hackers, terrorist organizations, hostile foreign governments, disgruntled employees or vendors, activists and other external parties, including those involved in corporate espionage; |
|
• |
|
the vulnerability of systems to third parties seeking to gain access to such systems either directly or using equipment or security passwords belonging to employees, customers, third-party service providers or other users of our systems; and |
|
• |
|
our frequent transmission of sensitive information to, and storage of such information by, third parties, including our vendors and regulators, and possible weaknesses that go undetected in our data systems notwithstanding the testing we conduct of those systems. |
34
While we invest in systems and processes that are designed to detect and prevent security breaches and cyber-attacks and we conduct periodic tests of our security systems and processes, we may not succeed in anticipating or adequately protecting against or preventing all security breaches and cyber-attacks from occurring. Even the most advanced internal control environment may be vulnerable to compromise. Targeted social engineering attacks are becoming more sophisticated and are extremely difficult to prevent. Additionally, the existence of cyber-attacks or security breaches at third parties with access to our data, such as vendors, may not be disclosed to us in a timely manner. As cyber-threats continue to evolve, we may be required to expend significant additional resources to continue to modify or enhance our protective measures or to investigate and remediate any information security vulnerabilities or incidents.
As is the case with non-electronic fraudulent activity, cyber-attacks or other information or security breaches, whether directed at us or third parties, may result in a material loss or have material consequences. Furthermore, the public perception that a cyber-attack on our systems has been successful, whether or not this perception is correct, may damage our reputation with customers and third parties with whom we do business. Although we have not experienced any material fraudulent activity, breaches of our information security or cybersecurity attacks, a successful penetration or circumvention of system security could cause us negative consequences, including loss of customers and business opportunities, disruption to our operations and business, misappropriation or destruction of our confidential information and/or that of our customers, or damage to our customers’ and/or third parties’ computers or systems, and could expose us to additional regulatory scrutiny and result in a violation of applicable privacy laws and other laws, litigation exposure, regulatory fines, penalties or intervention, loss of confidence in our security measures, reputational damage, reimbursement or other compensatory costs, additional compliance costs, and could adversely impact our results of operations, liquidity and financial condition.
We have a continuing need for technological change and we may not have the resources to effectively implement new technology or we may experience operational challenges when implementing new technology or technology needed to compete effectively with larger institutions may not be available to us on a cost effective basis.
The financial services industry is undergoing rapid technological changes with frequent introductions of new technology-driven products and services. In addition to better serving customers, the effective use of technology increases efficiency and enables financial institutions to reduce costs. Our future success will depend, at least in part, upon our ability to address the needs of our customers by using technology to provide products and services that will satisfy customer demands for convenience as well as to create additional efficiencies in our operations as we continue to grow and expand our products and service offerings. We may experience operational challenges as we implement these new technology enhancements or products, which could impair our ability to realize the anticipated benefits from such new technology or require us to incur significant costs to remedy any such challenges in a timely manner.
Many of our larger competitors have substantially greater resources to invest in technological improvements. Third-parties upon which we rely for our technology needs may not be able to develop on a cost effective basis systems that will enable us to keep pace with such developments. As a result, they may be able to offer additional or superior products compared to those that we will be able to provide, which would put us at a competitive disadvantage. We may lose customers seeking new technology-driven products and services to the extent we are unable to provide such products and services. Accordingly, the ability to keep pace with technological change is important and the failure to do so could adversely affect our business, financial condition and results of operations.
Risks Related to the Regulation of Our Industry
We operate in a highly regulated environment and the laws and regulations that govern our operations, corporate governance, executive compensation and accounting principles, or changes in them, or our failure to comply with them, could adversely affect us.
Banking is highly regulated under federal and state law. As such, we are subject to extensive regulation, supervision and legal requirements that govern almost all aspects of our operations. These laws and regulations are not intended to protect our shareholders. Rather, these laws and regulations are intended to protect customers, depositors, the DIF and the overall financial stability of the United States. These laws and regulations, among other matters, prescribe minimum capital requirements, impose limitations on the business activities in which we can engage, limit the dividends or distributions that the Bank can pay to us, restrict the ability of institutions to guarantee our debt and impose certain specific accounting requirements on us that may be more restrictive and may result in greater or earlier charges to earnings or reductions in our capital than GAAP would require. Compliance with laws and regulations can be difficult and costly, and changes to laws and regulations often impose additional operating costs. Our failure to comply with these laws and regulations, even if the failure follows good faith effort or reflects a difference in interpretation, could subject us to restrictions on our business activities, enforcement actions and fines and other penalties, any of which could adversely affect our results of operations, regulatory capital levels and the price of our securities. Further, any new laws, rules and regulations, such as the Dodd-Frank Act, could make compliance more difficult or expensive or otherwise adversely affect our business, financial condition and results of operations.
35
The ongoing implementation of the Dodd-Frank Act could adversely affect our business, financial condition, and results of operations.
On July 21, 2010, the Dodd-Frank Act was signed into law, and the process of implementation is ongoing. The Dodd-Frank Act imposes significant regulatory and compliance changes on many industries, including ours. There remains significant uncertainty surrounding the manner in which the provisions of the Dodd-Frank Act will ultimately be implemented by the various regulatory agencies and the full extent of the impact of the requirements on our operations is unclear. The changes resulting from the Dodd-Frank Act may impact the profitability of our business activities, require changes to certain of our business practices, require the development of new compliance infrastructure, impose upon us more stringent capital, liquidity and leverage requirements or otherwise adversely affect our business. These changes may also require us to invest significant management attention and resources to evaluate and make any changes necessary to comply with new statutory and regulatory requirements. Failure to comply with the new requirements or with any future changes in laws or regulations could adversely affect our business, financial condition and results of operations.
Banking agencies periodically conduct examinations of our business, including compliance with laws and regulations, and our failure to comply with any supervisory actions to which we are or become subject as a result of such examinations could adversely affect us.
As part of the bank regulatory process, the TDSML until the consummation of the conversion of the Bank to a Texas banking association, and thereafter, the TDB, and the Federal Reserve periodically conduct examinations of our business, including compliance with laws and regulations. If, as a result of an examination, one of these banking agencies were to determine that the financial condition, capital resources, asset quality, earnings prospects, management, liquidity, asset sensitivity, risk management or other aspects of any of our operations have become unsatisfactory, or that our Company, the Bank or their respective management were in violation of any law or regulation, it may take a number of different remedial actions as it deems appropriate. These actions include the power to enjoin “unsafe or unsound” practices, to require affirmative actions to correct any conditions resulting from any violation or practice, to issue an administrative order that can be judicially enforced, to direct an increase in our capital levels, to restrict our growth, to assess civil monetary penalties against us, the Bank or their respective officers or directors, to remove officers and directors and, if it is concluded that such conditions cannot be corrected or there is an imminent risk of loss to depositors, to terminate the Bank’s deposit insurance. If we become subject to such regulatory actions, our business, financial condition, results of operations and reputation could be adversely affected.
Basel III established a stricter regulatory capital framework that requires banking organizations to hold more and higher-quality capital to act as a financial cushion to absorb losses and help banking organizations better withstand periods of financial stress. The final rule increased capital ratios for all banking organizations and introduced a “capital conservation buffer” which is in addition to each capital ratio. If a banking organization fails to exceed its capital conservation buffer, it may be restricted in its ability to pay dividends and discretionary bonus payments to its executive officers. The final rule assigned a higher risk weight (150%) to exposures that are more than 90 days past due or are on nonaccrual status and to certain commercial real estate facilities that finance the acquisition, development or construction of real property. The final rule also required unrealized gains and losses on certain “available for sale” securities holdings to be included for purposes of calculating regulatory capital requirements unless a one-time opt-out is exercised. We exercised this opt-out right in our March 31, 2015 quarterly financial filing. As of December 31, 2023, we met all of these new requirements, including the full capital conservation buffer.
Although we currently cannot predict the specific impact and long-term effects that the Dodd-Frank Act, Basel III and associated rulemaking will have on our Company and the banking industry more generally, the Company will be required to maintain higher regulatory capital levels which could impact our operations, net income and ability to grow. Furthermore, the Company’s failure to comply with current or future minimum capital requirements could result in our regulators taking formal or informal actions against us which could restrict our future growth or operations.
Conversion to a Texas banking association will subject the Bank to new and potentially heightened examination and reporting requirements that may increase our costs of operations and compliance.
On August 16, 2023, the Bank filed an application with the TDB to convert from a Texas state savings bank to a Texas banking association and has notified the TDSML, the Federal Reserve and the FDIC of the same. The Bank has received all necessary approvals to the conversion application, and the conversion is expected to be consummated on March 13, 2024. As a result of the conversion, the Bank will be subject to new and potentially heightened examination and reporting requirements that may increase our costs of operations and compliance.
Many of our new activities and expansion plans require regulatory approvals, and failure to obtain them may restrict our growth.
We intend to complement and expand our business by pursuing strategic acquisitions of financial institutions and other complementary businesses, and expansion of the Bank’s banking location network, or de novo branching. Generally, we must receive federal and state regulatory approvals before we can acquire a depository institution or related business insured by the FDIC, or before we open a de novo branch. In determining whether to approve a proposed acquisition, banking regulators will consider, among other factors, the effect of the acquisition on competition, our financial condition, our future prospects, and the impact of the proposal on
36
U.S. financial stability. The regulators also review current and projected capital ratios and levels, the competence, experience and integrity of management and its record of compliance with laws and regulations, the convenience and needs of the communities to be served (including the acquiring institution’s record of compliance under CRA) and the effectiveness of the acquiring institution in combating money laundering activities. Such regulatory approvals may not be granted on terms that are acceptable to us, or at all. We may also be required to sell banking locations as a condition to receiving regulatory approval, which condition may not be acceptable to us or, if acceptable to us, may reduce the benefit of any acquisition.
We are subject to laws regarding the privacy, information security and protection of personal information and any violation of these laws or another incident involving personal, confidential or proprietary information of individuals could damage our reputation and otherwise adversely affect our operations and financial condition.
Our business requires the collection and retention of large volumes of customer data, including personally identifiable information in various information systems that we maintain and in those maintained by third parties with whom we contract to provide data services. We also maintain important internal company data such as personally identifiable information about our employees and information relating to our operations. We are subject to complex and evolving laws and regulations governing the privacy and protection of personal information of individuals (including customers, employees, suppliers and other third parties). For example, our business is subject to the Gramm-Leach-Bliley Act which, among other things: (i) imposes certain limitations on our ability to share nonpublic personal information about our customers with nonaffiliated third parties; (ii) requires that we provide certain disclosures to customers about our information collection, sharing and security practices and afford customers the right to “opt out” of any information sharing by us with nonaffiliated third parties (with certain exceptions); and (iii) requires that we develop, implement and maintain a written comprehensive information security program containing appropriate safeguards based on our size and complexity, the nature and scope of our activities, and the sensitivity of customer information we process, as well as plans for responding to data security breaches. Various state and federal banking regulators and states have also enacted data security breach notification requirements with varying levels of individual, consumer, regulatory or law enforcement notification in certain circumstances in the event of a security breach. Ensuring that our collection, use, transfer and storage of personal information complies with all applicable laws and regulations can increase our costs.
Furthermore, we may not be able to ensure that all of our clients, suppliers, counterparties and other third parties have appropriate controls in place to protect the confidentiality of the information that they exchange with us, particularly where such information is transmitted by electronic means. If personal, confidential or proprietary information of customers or others were to be mishandled or misused (in situations where, for example, such information was erroneously provided to parties who are not permitted to have the information, or where such information was intercepted or otherwise compromised by third parties), we could be exposed to litigation or regulatory sanctions under personal information laws and regulations. Concerns regarding the effectiveness of our measures to safeguard personal information, or even the perception that such measures are inadequate, could cause us to lose customers or potential customers for our products and services and thereby reduce our revenues. Accordingly, any failure or perceived failure to comply with applicable privacy or data protection laws and regulations may subject us to inquiries, examinations and investigations that could result in requirements to modify or cease certain operations or practices or in significant liabilities, fines or penalties, and could damage our reputation and otherwise adversely affect our operations and financial condition.
Financial institutions, such as the Bank, face a risk of noncompliance and enforcement action with the Bank Secrecy Act and other anti-money laundering statutes and regulations.
The Bank Secrecy Act, the USA PATRIOT Act, and other laws and regulations require financial institutions, among other duties, to institute and maintain an effective anti-money laundering program and file suspicious activity and currency transaction reports as appropriate. The Financial Crimes Enforcement Network established by the U.S. Department of the Treasury, or the Treasury Department, to administer the Bank Secrecy Act, is authorized to impose significant civil money penalties for violations of those requirements and has recently engaged in coordinated enforcement efforts with the individual federal banking regulators, as well as the U.S. Department of Justice, Drug Enforcement Administration and the Internal Revenue Service. There is also increased scrutiny of compliance with the sanctions programs and rules administered and enforced by OFAC.
In order to comply with regulations, guidelines and examination procedures in this area, we have dedicated significant resources to our anti-money laundering program. If our policies, procedures and systems are deemed deficient, we could be subject to liability, including fines and regulatory actions such as restrictions on our ability to pay dividends and the inability to obtain regulatory approvals to proceed with certain aspects of our business plans, including acquisitions and de novo branching.
We are subject to numerous laws designed to protect consumers, including the Community Reinvestment Act and fair lending laws, and failure to comply with these laws could lead to a wide variety of sanctions.
The CRA, the Equal Credit Opportunity Act, the Fair Housing Act and other fair lending laws and regulations impose nondiscriminatory lending requirements on financial institutions. The Consumer Financial Protection Bureau, or CFPB, the U.S. Department of Justice and other federal agencies are responsible for enforcing these laws and regulations. The CFPB was created under the Dodd-Frank Act to centralize responsibility for consumer financial protection with broad rulemaking authority to administer and carry out the purposes and objectives of federal consumer financial laws with respect to all financial institutions that offer financial products and services to consumers. The CFPB is also authorized to prescribe rules applicable to any covered person or
37
service provider, identifying and prohibiting acts or practices that are “unfair, deceptive, or abusive” in connection with any transaction with a consumer for a consumer financial product or service, or the offering of a consumer financial product or service. In recent years there has been an increase in the frequency of enforcement actions brought by federal banking regulators, such as the CFPB, dealing with consumer compliance matters such as indirect auto lending, fair lending, account fees, loan servicing and other products and services provided to customers. The ongoing broad rulemaking and enforcement powers of the CFPB have the potential to have a significant impact on the operations of financial institutions offering consumer financial products or services. The CFPB has indicated that it may propose new rules on overdrafts and other consumer financial products or services, which could have a material adverse effect on our business, financial condition and results of operations if any such rules limit our ability to provide such financial products or services.
A successful regulatory challenge to an institution’s performance under the CRA, fair lending laws or regulations, or consumer lending laws and regulations could result in a wide variety of sanctions, including damages and civil money penalties, injunctive relief, restrictions on mergers and acquisitions activity, restrictions on expansion, and restrictions on entering new business lines. Private parties may also have the ability to challenge an institution’s performance under fair lending laws in private class action litigation. Such actions could have a material adverse effect on our business, financial condition and results of operations.
Failure to comply with economic and trade sanctions or with applicable anti-corruption laws could have a material adverse effect on our business, financial condition and results of operations.
OFAC administers and enforces economic and trade sanctions against targeted foreign countries and regimes, under authority of various laws, including designated foreign countries, nationals and others. We are responsible for, among other things, blocking accounts of, and transactions with, such persons and countries, prohibiting unlicensed trade and financial transactions with them and reporting blocked transactions after their occurrence. Through our Company and the Bank, and our agents and employees, we are subject to the Foreign Corrupt Practices Act, or the FCPA, which prohibits offering, promising, giving, or authorizing others to give anything of value, either directly or indirectly, to a non-U.S. government official in order to influence official action or otherwise gain an unfair business advantage. The Company is also subject to applicable anti-corruption laws in the jurisdictions in which it may operate. The Company has implemented policies, procedures, and internal controls that are designed to comply with economic and trade sanctions or with applicable anti-corruption laws, including the FCPA. Failure to comply with economic and trade sanctions or with applicable anti-corruption laws, including the FCPA, could have serious legal and reputational consequences for us.
Federal, state and local consumer lending laws may restrict our ability to originate certain mortgage loans or increase our risk of liability with respect to such loans and could increase our cost of doing business.
Federal, state and local laws have been adopted that are intended to eliminate certain lending practices considered “predatory.” These laws prohibit practices such as steering borrowers away from more affordable products, selling unnecessary insurance to borrowers, repeatedly refinancing loans and making loans without a reasonable expectation that the borrowers will be able to repay the loans irrespective of the value of the underlying property. It is our policy not to make predatory loans, but these laws create the potential for liability with respect to our lending and loan investment activities. They increase our cost of doing business and, ultimately, may prevent us from making certain loans and cause us to reduce the average percentage rate or the points and fees on loans that we do make.
The expanding body of federal, state and local regulations and/or the licensing of loan servicing, collections or other aspects of our business and our sales of loans to third parties may increase the cost of compliance and the risks of noncompliance and subject us to litigation.
We service most of our own loans, and loan servicing is subject to extensive regulation by federal, state and local governmental authorities, as well as various laws and judicial and administrative decisions imposing requirements and restrictions on those activities. The volume of new or modified laws and regulations has increased in recent years and, in addition, some individual municipalities have begun to enact laws that restrict loan servicing activities, including delaying or temporarily preventing foreclosures or forcing the modification of certain mortgages. If regulators impose new or more restrictive requirements, we may incur additional significant costs to comply with such requirements, which may further adversely affect us. In addition, were we to be subject to regulatory investigation or regulatory action regarding our loan modification and foreclosure practices, our financial condition and results of operations could be adversely affected.
In addition, we have sold loans to third-parties. In connection with these sales, we make or have made various representations and warranties, breaches of which may result in a requirement that we repurchase the loans, or otherwise make whole or provide other remedies to counterparties. These aspects of our business or our failure to comply with applicable laws and regulations could possibly lead to: civil and criminal liability; loss of licensure; damage to our reputation in the industry; fines and penalties and litigation, including class action lawsuits; and administrative enforcement actions. Any of these outcomes could materially and adversely affect us.
The Federal Reserve may require us to commit capital resources to support the Bank.
As a matter of policy, the Federal Reserve expects a bank holding company to act as a source of financial and managerial strength to a subsidiary bank and to commit resources to support such subsidiary bank. The Dodd-Frank Act codified the Federal
38
Reserve’s policy on serving as a source of financial strength. Under the “source of strength” doctrine, the Federal Reserve may require a bank holding company to make capital injections into a troubled subsidiary bank and may charge the bank holding company with engaging in unsafe and unsound practices for failure to commit resources to such a subsidiary bank. A capital injection may be required at times when the holding company may not have the resources to provide and therefore may be required to borrow the funds or raise capital. Any loans by a holding company to its subsidiary bank are subordinate in right of payment to deposits and to certain other indebtedness of such subsidiary bank. In the event of a bank holding company’s bankruptcy, the bankruptcy trustee will assume any commitment by the holding company to a federal bank regulatory agency to maintain the capital of a subsidiary bank. Moreover, bankruptcy law provides that claims based on any such commitment will be entitled to a priority of payment over the claims of the institution’s general unsecured creditors, including the holders of its note obligations. Thus, any borrowing by us in order to make the required capital injection becomes more difficult and expensive and will adversely impact our financial condition, results of operations, or future prospects.
Monetary policies and regulations of the Federal Reserve could adversely affect our business, financial condition and results of operations.
In addition to being affected by general economic conditions, our earnings and growth are affected by the policies of the Federal Reserve. An important function of the Federal Reserve is to regulate the U.S. money supply and credit conditions. Among the instruments used by the Federal Reserve to implement these objectives are open market purchases and sales of securities by the Federal Reserve, adjustments of both the discount rate and the federal funds rate and changes in reserve requirements against bank deposits. These instruments are used in varying combinations to influence overall economic growth and the distribution of credit, bank loans, investments and deposits. Their use also affects interest rates charged on loans or paid on deposits.
The monetary policies and regulations of the Federal Reserve have had a significant effect on the operating results of commercial banks in the past and are expected to continue to do so in the future. Although we cannot determine the effects of such policies on us at this time, such policies could adversely affect our business, financial condition and results of operations.
Risks Related to an Investment in Our Common Stock
An active trading market for our common stock may not be sustained.
We completed the initial public offering of our common stock and the Company’s common stock began trading on the Nasdaq Global Select Market in November 2021. An active trading market for shares of our common stock may not be sustained. If an active trading market is not sustained, you may have difficulty selling your shares of our common stock at an attractive price, or at all. Consequently, you may not be able to sell your shares of common stock at or above an attractive price at the time that you would like to sell.
The market price of our common stock may be subject to substantial fluctuations, which may make it difficult for you to sell your shares at the volume, prices and times desired.
The market price of our common stock may be highly volatile, which may make it difficult for you to resell your shares at the volume, prices and times desired. There are many factors that may affect the market price and trading volume of our common stock, including, without limitation:
|
• |
|
actual or anticipated fluctuations in our operating results, financial condition or asset quality; |
|
• |
|
changes in economic or business conditions; |
|
• |
|
the effects of, and changes in, trade, monetary and fiscal policies, including the interest rate policies of the Federal Reserve; |
|
• |
|
publication of research reports about us, our competitors, or the financial services industry generally, or changes in, or failure to meet, securities analysts’ estimates of our financial and operating performance, or lack of research reports by industry analysts or ceasing of coverage; |
|
• |
|
operating and stock price performance of companies that investors deemed comparable to us; |
|
• |
|
additional or anticipated sales of our common stock or other securities by us or our existing shareholders; |
|
• |
|
additions or departures of key personnel; |
|
• |
|
perceptions in the marketplace regarding our competitors or us, including the perception that investment in Texas is unattractive or less attractive during periods of low oil prices; |
|
• |
|
significant acquisitions or business combinations, strategic partnerships, joint ventures or capital commitments by or involving our competitors or us; |
|
• |
|
other economic, competitive, governmental, regulatory and technological factors affecting our operations, pricing, products and services; and |
|
• |
|
other news, announcements or disclosures (whether by us or others) related to us, our competitors, our primary markets or the financial services industry. |
The stock market and, in particular, the market for financial institution stocks have experienced substantial fluctuations in recent years, which in many cases have been unrelated to the operating performance and prospects of particular companies. In addition,
39
significant fluctuations in the trading volume in our common stock may cause significant price variations to occur. Increased market volatility may materially and adversely affect the market price of our common stock, which could make it difficult to sell your shares at the volume, prices and times desired.
The market price of our common stock could decline significantly due to actual or anticipated issuances or sales of our common stock in the future.
Actual or anticipated issuances or sales of substantial amounts of our common stock could cause the market price of our common stock to decline significantly and make it more difficult for us to sell equity or equity-related securities in the future at a time and on terms that we deem appropriate. The issuance of any shares of our common stock in the future also would, and equity-related securities could, dilute the percentage ownership interest held by shareholders prior to such issuance. Our first amended and restated certificate of formation, as amended (our “certificate of formation”), authorizes us to issue up to 50,000,000 shares of our common stock and 3,500,000 shares of non-voting common stock. Subject to certain limitations set forth in our certificate of formation, holders of our non-voting common stock are permitted to convert, or upon our written request shall convert, each of their shares of non-voting common stock into one share of common stock, and each share of non-voting common stock will automatically convert into one share of common stock under certain circumstances described in our certificate of formation. In general, all shares of our common stock outstanding are freely tradable, except that certain shares owned by our “affiliates” (as that term is defined in Rule 144 under the Securities Act) and shares purchased in our private placement in 2021 may be resold only in compliance with the certain limitations. We filed a registration statement on Form S-8 under the Securities Act in December 2021 to register an aggregate of approximately 1,437,624 shares of common stock issued or reserved for issuance under our equity incentive plans. We may issue all of these shares without any action or approval by our shareholders, and these shares, once issued (including upon exercise of outstanding options), will be available for sale into the public market, subject to the restrictions described above, if applicable, for affiliate holders.
In addition, we may issue shares of common stock or other securities from time to time as consideration for future acquisitions and investments and pursuant to compensation and incentive plans. If any such acquisition or investment is significant, the number of shares of our common stock, or the number or aggregate principal amount, as the case may be, of other securities that we may issue may in turn be substantial. We may also grant registration rights covering those shares of our common stock or other securities in connection with any such acquisitions and investments.
We cannot predict the size of future issuances of our common stock or the effect, if any, that future issuances and sales of our common stock will have on the market price of our common stock. Sales of substantial amounts of our common stock (including shares of our common stock issued in connection with an acquisition or under a compensation or incentive plan), or the perception that such sales could occur, may adversely affect prevailing market prices for our common stock and could impair our ability to raise capital through future sales of our securities.
Our management and board of directors have significant control over our business.
As of December 31, 2023, our directors and executive officers beneficially owned an aggregate of 1,291,824 shares, or approximately 9.23%, of our common stock. Consequently, our management and board of directors may be able to significantly affect our affairs and policies, including the outcome of the election of directors and the potential outcome of other matters submitted to a vote of our shareholders, such as mergers, the sale of substantially all of our assets and other extraordinary corporate matters. This influence may also have the effect of delaying or preventing changes of control or changes in management, or limiting the ability of our other shareholders to approve transactions that they may deem to be in the best interests of our Company. The interests of these insiders could conflict with the interests of our other shareholders, including you.
We may incur additional debt or issue new debt securities, which would be senior to our common stock and may cause the market price of our common stock to decline.
At December 31, 2023, we had $80.6 million of subordinated debentures and $38.9 million outstanding on the line of credit senior debt. In addition, at December 31, 2023, we had 69,400 shares of Series A Convertible Non-Cumulative Preferred Stock (“Series A Preferred Stock”) outstanding. In the future, we may increase our capital resources by incurring additional borrowings or making offerings of debt or equity securities, which may include senior or additional subordinated notes, classes of preferred shares or common shares. Holders of our common stock are not entitled to preemptive rights or other protections against dilution. Preferred shares and debt, if issued, have a preference on liquidating distributions or a preference on dividend or interest payments that could limit our ability to make a distribution to the holders of our common stock. Future issuances and sales of parity preferred stock, or the perception that such issuances and sales could occur, may also cause prevailing market prices for the series of preferred stock and our common stock to decline and may adversely affect our ability to raise additional capital in the financial markets at times and prices favorable to us. Further issuances of our common stock could be dilutive to holders of our common stock.
We may issue shares of preferred stock in the future, which could make it difficult for another company to acquire us or could otherwise adversely affect holders of our common stock, which could depress the price of our common stock.
Our certificate of formation authorizes us to issue up to 1,000,000 shares of one or more series of preferred stock, and at December 31, 2023, we had 69,400 shares of Series A Preferred Stock outstanding. Our board of directors has the authority to determine the preferences, limitations and relative rights of shares of preferred stock and to fix the number of shares constituting any
40
series and the designation of such series, without any further vote or action by our shareholders. Our preferred stock could be issued with voting, liquidation, dividend and other rights superior to the rights of our common stock. The potential issuance of preferred stock may delay or prevent a change in control of us, discourage bids for our common stock at a premium over the market price, and materially adversely affect the market price and the voting and other rights of the holders of our common stock.
We are dependent upon the Bank for cash flow, and the Bank’s ability to make cash distributions is restricted.
Our primary tangible asset is the stock of the Bank. As such, we depend upon the Bank for cash distributions (through dividends on the Bank’s common stock) that we use to pay our operating expenses, satisfy our obligations and, if determined by our board of directors, to pay dividends on our common stock. Federal statutes, regulations and policies restrict the Bank’s ability to make cash distributions to us. These statutes and regulations require, among other things, that the Bank maintain certain levels of capital in order to pay a dividend. Further, bank regulatory agencies have the ability to restrict the Bank’s payment of dividends by supervisory action. If the Bank is unable to pay dividends to us, we will not be able to satisfy our obligations or pay dividends on our common stock.
Our corporate organizational documents and provisions of federal and state law to which we are subject contain certain provisions that could have an anti-takeover effect and may delay, make more difficult or prevent an attempted acquisition that you may favor or an attempted replacement of our incumbent board of directors or management.
Our certificate of formation and our first amended and restated bylaws (our “bylaws”) may have an anti-takeover effect and may delay, discourage or prevent an attempted acquisition or change of control or a replacement of our board of directors or management. Our governing documents include provisions that:
|
• |
|
empower our board of directors, without shareholder approval, to issue our preferred stock, the terms of which, including voting power, are to be set by our board of directors; |
|
• |
|
include a classified board of directors, with directors of each class serving a three-year term; |
|
• |
|
eliminate cumulative voting in elections of directors; |
|
• |
|
provide our board of directors with the exclusive right to alter, amend or repeal our bylaws or to adopt new bylaws; |
|
• |
|
require the request of holders of at least 50% of the issued and outstanding shares of our capital stock entitled to vote at a meeting to call a special shareholders’ meeting; |
|
• |
|
require any shareholder derivative suit or shareholder claim against an officer or director of breach of fiduciary duty or violation of the Texas Business Organizations Code, or the TBOC, certificate of formation, or bylaws to be brought in Harris County in the State of Texas, subject to certain exceptions as described below; |
|
• |
|
require shareholders that wish to bring business before annual or special meetings of shareholders, or to nominate candidates for election as directors at annual or special meetings of shareholders, to provide timely advanced notice of their intent in writing; and |
|
• |
|
enable our board of directors to increase, at any annual, regular or special meetings of directors, the number of persons serving as directors and to fill up to two vacancies created as a result of the increase by a majority vote of the directors between two successive annual shareholder meetings. |
In addition, certain provisions of Texas law, including a provision which restricts certain business combinations between a Texas corporation and certain affiliated shareholders, may delay, discourage or prevent an attempted acquisition or change in control. Furthermore, banking laws impose notice, approval, and ongoing regulatory requirements on any shareholder or other party that seeks to acquire direct or indirect “control” of an FDIC-insured depository institution or its holding company. These laws include the Bank Holding Company Act of 1956, as amended, and the Change in Bank Control Act. These laws could delay or prevent an acquisition.
Our bylaws include an exclusive forum provision, which could limit a shareholder’s ability to obtain a favorable judicial forum for disputes with us or our directors, officers or other employees.
Our bylaws require that, unless we consent in writing to the selection of an alternative forum, any state court located in Harris County in the state of Texas, or a Harris County State Court, shall be the sole and exclusive forum for any shareholder (including a beneficial owner) to bring (i) any derivative action or proceeding brought on behalf of the Company, (ii) any action asserting a claim of breach of a fiduciary duty owed by any director, officer or other employee of the Company to the Company or its shareholders, (iii) any action asserting a claim against the Company, its directors, officers or employees arising pursuant to any provision of the TBOC, our certificate of formation or our bylaws, or (iv) any action asserting a claim against the Company, its directors, officers or employees governed by the internal affairs doctrine, and, if brought outside of Texas, the shareholder bringing the suite will be deemed to have consented to service of process on such shareholder's counsel, except for, as to each of (i) through (iv) above, any action (A) as to which the Harris County State Court determines that there is an indispensable party not subject to the jurisdiction of the Harris County State Court (and the indispensable party does not consent to the personal jurisdiction of the Harris County State Court within ten days following such determination), (B) which is vested in the exclusive jurisdiction of a court or forum other than the Harris County State Court, (C) for which the Harris County State Court does not have subject matter jurisdiction, or (D) arising under the Securities Act as to which the Harris County State Court and the United States District Court for the Southern District of Texas, Houston Division shall have concurrent jurisdiction.
41
Section 27 of the Exchange Act creates exclusive federal jurisdiction over all suits brought to enforce any duty or liability created by the Exchange Act or the rules and regulations thereunder, and the exclusive forum provision of our bylaws will not apply to suits brought to enforce a duty or liability created by the Exchange Act or any other claim for which the federal courts have exclusive jurisdiction. Section 22 of the Securities Act creates concurrent jurisdiction for federal and state courts over all suits brought to enforce any duty or liability created by the Securities Act or the rules and regulations thereunder. Accordingly, there is uncertainty as to whether a court would enforce such an exclusive forum provision as written in connection with claims arising under the Securities Act, and our shareholders will not be deemed to have waived our compliance with the federal securities laws and the rules and regulations thereunder. Any person or entity purchasing or otherwise acquiring any interest in any security of the Company shall be deemed to have notice of and consented to the exclusive forum provision of our bylaws.
The exclusive forum provision in our bylaws may limit our shareholders’ ability to obtain a favorable judicial forum for disputes with us. In addition, shareholders who do bring a claim in a Harris County State Court could face additional litigation costs in pursuing any such claim, particularly if they do not reside in or near Harris County, Texas. Furthermore, if a court were to find the exclusive forum provision contained in our bylaws to be inapplicable or unenforceable in an action, we may incur additional costs associated with resolving such action in other jurisdictions, which could adversely affect our business, operating results and financial condition.
The return on your investment in our common stock is uncertain.
An investor in our common stock may not realize a substantial return on his or her investment, or may not realize any return at all. Further, as a result of the uncertainty and risks associated with our operations, many of which are described in section “Item 1A. Risk Factors” of this Form 10-K, it is possible that an investor could lose his or her entire investment.
An investment in our common stock is not an insured deposit and is subject to risk of loss.
Shares of our common stock are not savings accounts, deposits or other obligations of our bank or nonbank subsidiaries and are not insured or guaranteed by the FDIC or any other government agency. An investor in our common stock must be capable of affording the loss of your entire investment.
Item 1B. Unresolved Staff Comments.
None.
Item 1C. Cybersecurity
Risk Management and Strategy
Our risk management program is designed to identify, assess, and mitigate risks across various aspects of our Company, including financial, operational, regulatory, reputational, and legal. Cybersecurity is a critical component of this program, given the increasing reliance on technology and potential of cybersecurity threats. Our Chief Information Security Officer (“CISO”) is primarily responsible for this cybersecurity program component and is a key member of the risk management organization, reporting directly to the Chief Risk Officer and as discussed below, periodically to the Risk Committee of our board of directors.
The program is based on the National Institute of Standards and Technology Cybersecurity Framework (“NIST CSF”). The NIST CSF framework provides the basis to evaluate our program for completeness and helps to ensure that the various components of the program are at a level that reduces cybersecurity risk to levels within the Company’s risk appetite, taking into account the current threat and regulatory environment. Key components of the cybersecurity program include:
42
The Company engages reputable third parties to conduct various risk assessments on a regular basis, including but not limited to maturity assessments and various testing. Following a defense-in-depth strategy, the Company leverages both in-house resources and third-party service providers to implement and maintain processes and controls to manage the identified risks.
Notwithstanding our defensive measures and processes, the threat posed by cyber-attacks is severe, and we may not be successful in preventing or mitigating all cybersecurity incidents that could have a material adverse effect on the Company. However, as of the date of this Form 10-K, the Company is not aware of any cybersecurity threats or incidents that have materially affected or are reasonably likely to materially affect the Company, including its business strategy, results of operations, or financial condition that are required to be reported in this Form 10-K. For further discussion, please see Item 1A. “Risk Factors” for a discussion of cybersecurity risks.
Governance
Board of Directors Oversight
The Risk Committee of our board of directors is responsible for overseeing our information security and technology programs, including management’s actions to identify, assess, mitigate, and remediate or prevent material cybersecurity issues and risks. The Risk Committee of our board of directors reviews and approves our information security and technology budgets and strategies annually. Additionally, the Risk Committee of our board of directors reviews quarterly reports regarding the information security program and technology program, key enterprise cybersecurity initiatives, and other matters relating to cybersecurity processes.
Management Oversight
Our CISO is accountable for managing our enterprise information security department and overseeing our information security program. The CISO reports directly to the Chief Risk Officer. The CISO’s responsibilities include cybersecurity risk assessment, defense operations, incident response, vulnerability assessment, threat intelligence, identity access governance, third-party risk management, and business resilience. The CISO has over 20 years of experience in cybersecurity across the U.S Government, Department of Defense contracting, and financial services industry. Prior to joining the Company, the CISO served as the Deputy CISO for a major domestic financial services institution. We have protocols by which certain cybersecurity incidents that meet established reporting thresholds are escalated internally and, where appropriate, reported to senior leadership and the Risk Committee and/or the Board in a timely manner.
Item 2. Properties.
Our principal offices and headquarters are located at 20202 Highway 59 North, Suite 190, Humble, Texas 77338. All of our branches are located in Texas. We own our headquarters and our branch locations in Pearland, Lake Jackson, Nixon, La Vernia, and Detroit, and we lease the remaining locations. We believe that the leases to which we are subject are generally on terms consistent with prevailing market terms. We also believe that our facilities are in good condition and are adequate to meet our operating needs for the foreseeable future. The following table sets forth a list of our branches as of the date of this Annual Report on Form 10-K.
Location |
|
Address |
|
Owned/Leased |
Beaumont |
|
229 Dowlen Road, Suite C, Beaumont, Texas 77706 |
|
Leased |
Conroe |
|
1336 League Line Road, Suite 100, Conroe, Texas 77304 |
|
Leased |
Dallas |
|
8235 Douglas Avenue, Suite 100, Dallas, Texas 75225 |
|
Leased |
Detroit |
|
12038 US Highway 82 West, Detroit, Texas 75436 |
|
Owned |
Fort Worth |
|
1400 W 7th Street, Suite 100, Fort Worth, Texas 76102 |
|
Leased |
Galleria |
|
1800 West Loop South, Suite 100, Houston, Texas 77027 |
|
Leased |
Georgetown |
|
200 E 8th Street, Suite 102, Georgetown, Texas 78626 |
|
Leased |
Humble |
|
20202 Highway 59 North, Humble, Texas 77338 |
|
Owned |
Kingwood |
|
1910 W Lake Houston Pkwy, Kingwood, Texas 77339 |
|
Owned |
La Vernia |
|
13809 West Highway 87, La Vernia, Texas 78121 |
|
Owned |
Lake Jackson |
|
85 Oak Drive, Lake Jackson, Texas 77566 |
|
Owned |
Mid County |
|
2901 Turtle Creek Drive, Suite 115, Port Arthur, Texas 77642 |
|
Leased |
Nixon |
|
200 North Nixon Avenue, Nixon, Texas 78140 |
|
Owned |
Pearland |
|
1850 Pearland Parkway, Pearland, Texas, 77581 |
|
Owned |
Plano |
|
5000 Legacy, Suite 120, Plano, Texas 75024 |
|
Leased |
San Antonio |
|
420 Broadway, Suite 2101, San Antonio, Texas 78205 |
|
Leased |
In addition, we lease non-branch offices in Austin, Copperfield, Fort Worth, Katy, Memorial City and The Woodlands, Texas.
43
Item 3. Legal Proceedings.
We are not currently subject to any material legal proceedings. We are from time to time subject to claims and litigation arising in the ordinary course of business. These claims and litigation may include, among other things, allegations of violation of banking and other applicable regulations, competition law, labor laws and consumer protection laws, as well as claims or litigation relating to intellectual property, securities, breach of contract and tort. We intend to defend ourselves vigorously against any pending or future claims and litigation.
At this time, management believes that the likelihood is remote that the impact of such proceedings, either individually or in the aggregate, would have a material adverse effect on our consolidated results of operations, financial condition or cash flows. However, one or more unfavorable outcomes in any claim or litigation against us could have a material adverse effect for the period in which they are resolved. In addition, regardless of their merits or their ultimate outcomes, such matters are costly, divert management’s attention and may materially and adversely affect our reputation, even if resolved in our favor.
Item 4. Mine Safety Disclosures.
Not applicable.
44
PART II
Item 5. Market for Registrant’s Common Equity, Related Stockholder Matters and Issuer Purchases of Equity Securities.
Market Information for Common Stock
Shares of the Company's common stock are traded on the Nasdaq Global Select Market under the symbol “TCBX”.
Holders of Record
As of December 31, 2023, there were approximately 528 holders of record of the Company's common stock. Additionally, a greater number of holders of the Company's common stock are “street name” or beneficial holders, whose shares are held by banks, brokers and other financial institutions.
Securities Authorized for Issuance under Equity Compensation Plans
Refer to Part III—Item 12 for information regarding securities authorized for issuance under our equity compensation plans.
Issuer Purchases of Equity Securities
The following table sets forth information regarding our repurchase of our common stock during the three months ended December 31, 2023:
|
|
Total Number of Shares Purchased(a) |
|
|
Average Price Paid Per Share |
|
|
Total Number of Shares Purchased as Part of Publicly Announced Plans or Programs |
|
|
Maximum Number of Shares that May Yet be Purchased Under the Plans or Programs |
|
||||
October 1, 2023 - October 31, 2023 |
|
|
604 |
|
|
$ |
16.49 |
|
|
|
— |
|
|
|
— |
|
November 1, 2023 - November 30, 2023 |
|
|
— |
|
|
$ |
— |
|
|
|
— |
|
|
|
— |
|
December 1, 2023 - December 31, 2023 |
|
|
— |
|
|
$ |
— |
|
|
|
— |
|
|
|
— |
|
(a) Represents shares of common stock transferred to us in order to satisfy tax withholding obligations incurred upon the vesting of restricted stock awards.
45
Performance Graph
The following performance graph compares the cumulative total shareholder return on the Company’s common stock for the period beginning at the close of trading on November 9, 2021 (the end of the first day of trading of TCBX common stock on the Nasdaq Global Select Market) and the last trading date of each year from 2021 to 2023, with the cumulative total return of the Russell 2000 Index (RUT) and the NASDAQ Bank Index (IXBK) for the same periods. Cumulative total return is computed by dividing the difference between the Company's share price at the end and the beginning of the measurement period by the share price at the beginning of the measurement period. The performance graph assumes $100 is invested on November 9, 2021, in the Company’s common stock and each of the indices. Historical stock price performance for the Company’s common stock is not necessarily indicative of future stock performance. This performance graph and related information shall not be deemed “soliciting material” or to be “filed” with the SEC for purposes of Section 18 of the Exchange Act, or incorporated by reference into any future SEC filing, except as shall be expressly set forth by specific reference in such filing.
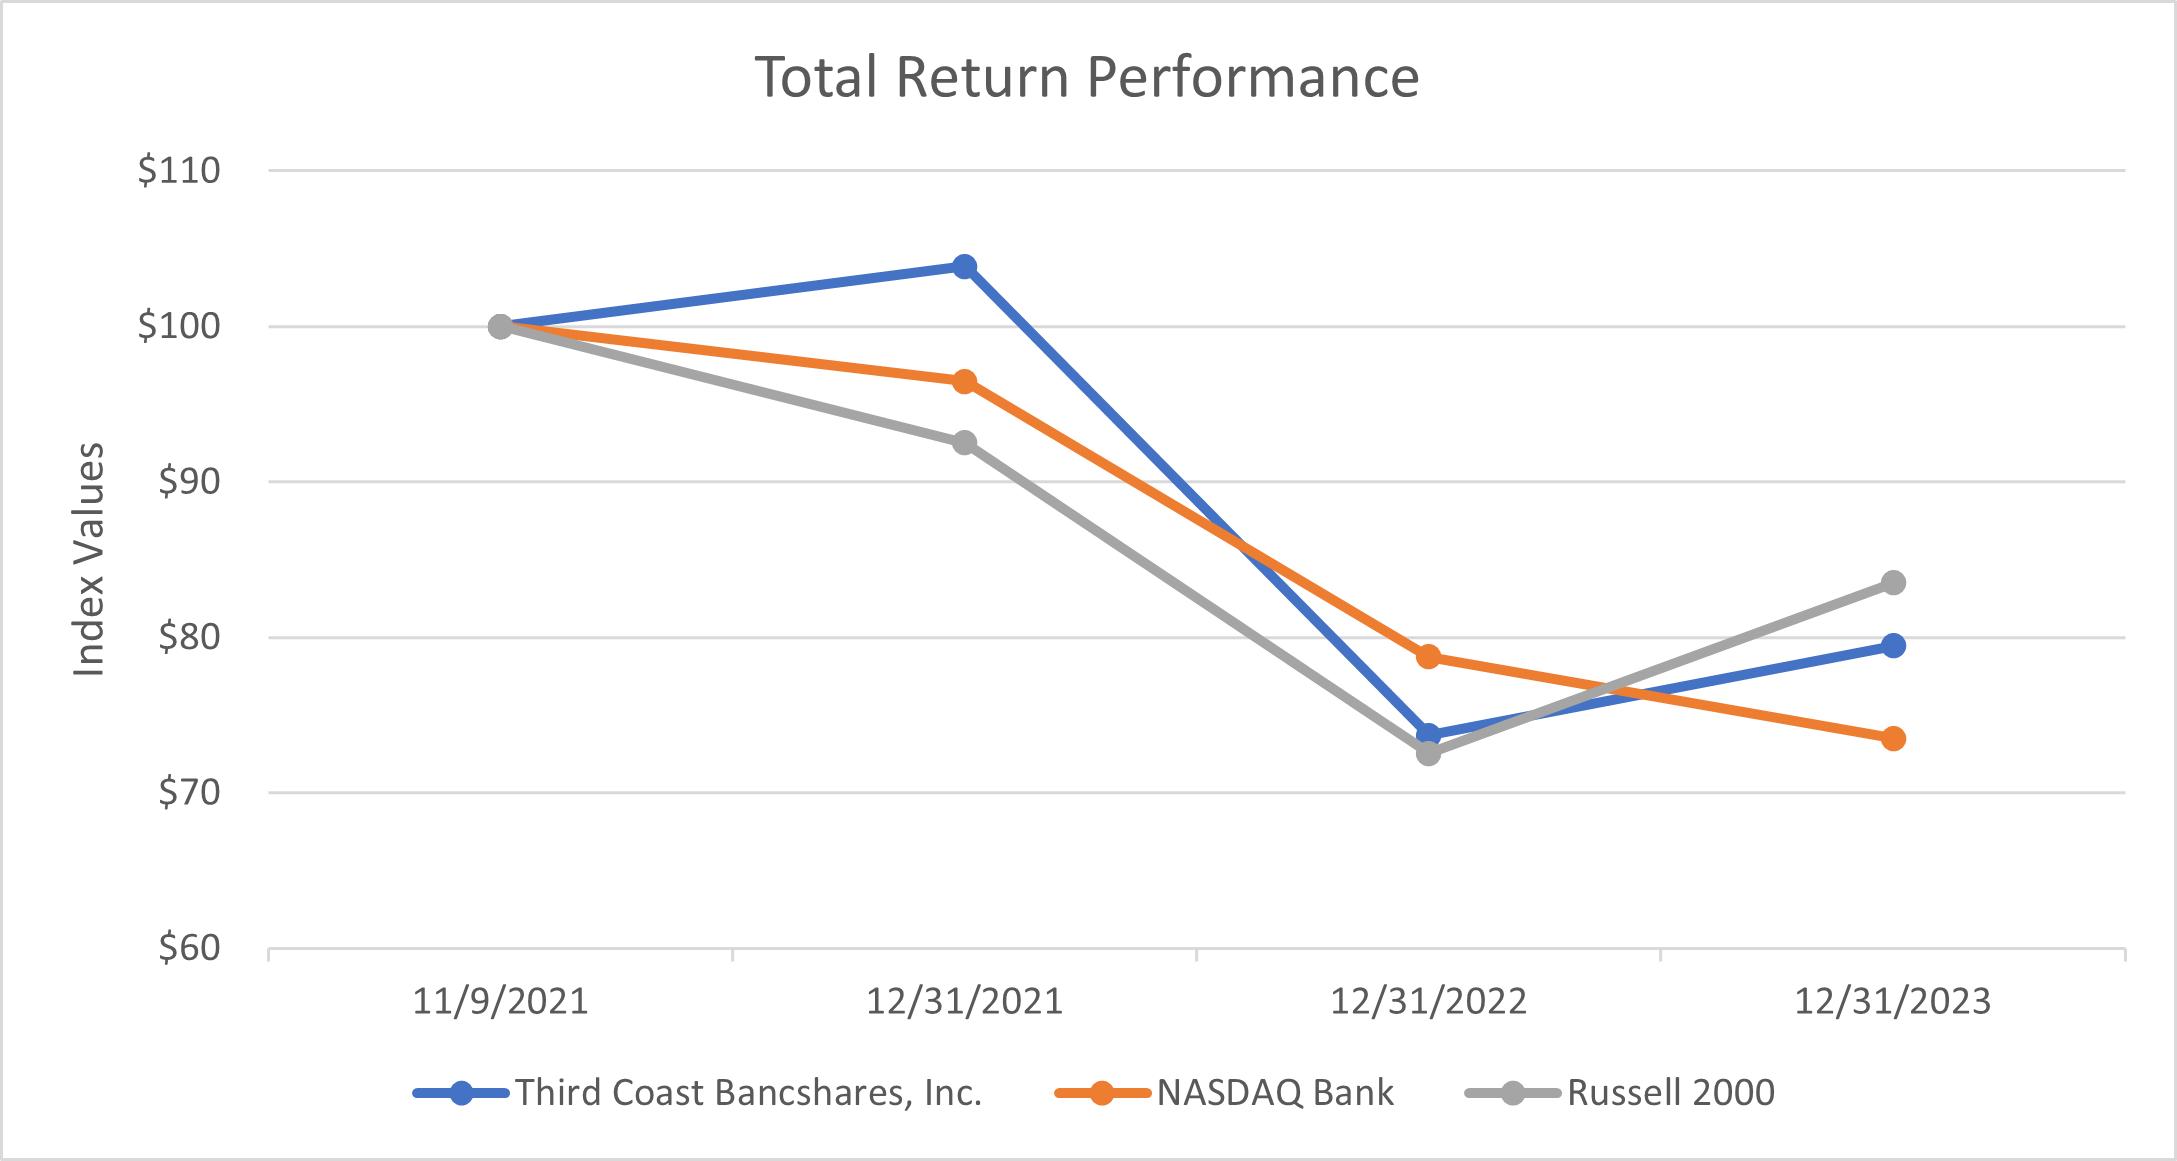
|
|
11/9/2021 |
|
|
12/31/2021 |
|
|
12/31/2022 |
|
|
12/31/2023 |
|
||||
Third Coast Bancshares, Inc. |
|
$ |
100.00 |
|
|
$ |
103.88 |
|
|
$ |
73.69 |
|
|
$ |
79.45 |
|
NASDAQ Bank |
|
$ |
100.00 |
|
|
$ |
96.48 |
|
|
$ |
78.76 |
|
|
$ |
73.51 |
|
Russell 2000 |
|
$ |
100.00 |
|
|
$ |
92.50 |
|
|
$ |
72.56 |
|
|
$ |
83.51 |
|
Item 6. [Reserved]
46
Item 7. Management’s Discussion and Analysis of Financial Condition and Results of Operations.
The following discussion and analysis of our financial condition and results of operations should be read in conjunction with our consolidated financial statements and the accompanying notes thereto included in this Annual Report on Form 10-K (this “Form 10-K”). Unless we state otherwise or the context otherwise requires, references in this Form 10-K to “we,” “our,” “us,” and the “Company” refer to Third Coast Bancshares, Inc., a Texas corporation, and its consolidated subsidiaries, references in this Form 10-K to the “Bank” refer to Third Coast Bank, SSB, a Texas state savings bank and our wholly owned bank subsidiary, and references in this Form 10-K to “TCCC” refer to Third Coast Commercial Capital, Inc., a Texas corporation and wholly owned subsidiary of the Bank.
The following discussion contains “forward-looking statements” that reflect our future plans, estimates, beliefs and expected performance. We caution that assumptions, expectations, projections, intentions or beliefs about future events may, and often do, vary from actual results and the differences can be material. See “Cautionary Note Regarding Forward-Looking Statements” and the risk factors and other cautionary statements described under the heading “Risk Factors” included in Item 1A of this Form 10-K. We do not undertake any obligation to publicly update any forward-looking statements except as otherwise required by applicable law.
Overview
We are a bank holding company headquartered in Humble, Texas and operated through our wholly owned subsidiary, the Bank, and the Bank’s wholly owned subsidiary, TCCC. We focus on providing commercial banking solutions to small- and medium-sized businesses and professionals with operations in our markets. Our market expertise, coupled with a deep understanding of our customers’ needs, allows us to deliver tailored financial products and services. We currently operate sixteen branches, with eight branches in the Greater Houston market, three branches in the Dallas-Fort Worth market, four branches in the Austin-San Antonio market, and one branch in Detroit, Texas. As of December 31, 2023, we had, on a consolidated basis, total assets of $4.40 billion, total loans of $3.64 billion, total deposits of $3.80 billion and total shareholders’ equity of $412.0 million.
As a bank holding company that operates through one segment, community banking, we generate most of our revenue from interest on loans, and customer service and loan fees. We incur interest expense on deposits and other borrowed funds, as well as noninterest expense, such as salaries and employee benefits and occupancy expenses. We analyze our ability to maximize income generated from interest-earning assets and control the interest expenses of our liabilities, measured as net interest income, through our net interest margin and net interest spread. Net interest income is the difference between interest income on interest-earning assets, such as loans and interest-bearing time deposits in other banks, and interest expense on interest-bearing liabilities, such as deposits and borrowings, which are used to fund those assets. Net interest margin is a ratio calculated as net interest income divided by average interest-earning assets. Net interest spread is the difference between average rates earned on interest-earning assets and average rates paid on interest-bearing liabilities.
Changes in market interest rates and the interest rates we earn on interest-earning assets or pay on interest-bearing liabilities, as well as in the volume and types of interest-earning assets, interest-bearing liabilities and noninterest-bearing liabilities, are usually the largest drivers of periodic changes in net interest spread, net interest margin and net interest income. Fluctuations in market interest rates are driven by many factors, including governmental monetary policies, inflation, deflation, macroeconomic developments, changes in unemployment, the money supply, political and international conditions and conditions in domestic and foreign financial markets. Periodic changes in the volume and types of loans in our loan portfolio are affected by, among other factors, economic and competitive conditions in Texas, as well as developments affecting the real estate, technology, financial services, insurance, transportation, manufacturing and energy sectors within our target markets and throughout the state of Texas.
Conversion to State Bank
On October 26, 2023, the Bank was notified that the Federal Reserve Bank of Dallas granted approval of our application to convert to a state bank under the name of Third Coast Bank. On January 11, 2024, the Bank was notified that the TDB and the TDSML had approved the conversion. The effective date of the conversion is expected to be March 13, 2024.
Completion of $69.4 Million Preferred Stock Private Placement
On September 30, 2022, the Company completed a private placement of (i) 69,400 shares of a new series of preferred stock designated Series A Convertible Non-Cumulative Preferred Stock, par value $1.00 per share, with a liquidation preference of $1,000 per share (the “Series A Preferred Stock”), and (ii) warrants to purchase an aggregate of 175,000 shares of the Company’s common stock (or, at the election of the warrant holder in accordance with the terms of the warrant agreement, Series B Convertible Perpetual Preferred Stock, par value $1.00 per share, or non-voting common stock, par value $1.00 per share, of the Company) at an exercise price equal to $22.50 per share, for aggregate gross proceeds of $69.4 million before deducting placement fees and offering expenses. Aggregate net proceeds were $66.2 million after deducting placement fees and offering expenses of $3.2 million.
The securities sold in the private placement were sold only to accredited investors and were issued without registration under the Securities Act of 1933, as amended (the “Securities Act”), in reliance upon the exemption provided under Section 4(a)(2) of the
47
Securities Act and Regulation D promulgated thereunder as securities offered and sold only to accredited investors (as defined in Rule 501(a) of Regulation D under the Securities Act) in a transaction not involving any public offering.
During the years ended December 31, 2023 and 2022, the Company declared cash dividends of $68.25 and $20.44 per share, respectively, on the Series A Preferred Stock.
Subordinated Notes Offering
On March 31, 2022, the Company entered into Subordinated Note Purchase Agreements (the “Note Purchase Agreements”) with certain qualified institutional buyers and institutional accredited investors (the “Purchasers”) pursuant to which the Company issued and sold $82.3 million in aggregate principal amount of its 5.500% Fixed-to-Floating Rate Subordinated Notes due 2032 (the “Notes”) in a private placement transaction in reliance on exemptions from the registration requirements of the Securities Act, pursuant to Section 4(a)(2) of the Securities Act and Regulation D thereunder. The Notes were issued by the Company to the Purchasers at a price equal to 100% of their face amount. The Note Purchase Agreements contain certain customary representations, warranties and covenants made by the Company, on the one hand, and the Purchasers, severally and not jointly, on the other hand. The Notes are intended to qualify as Tier 2 capital for regulatory capital purposes.
The Notes were issued under an Indenture, dated as of March 31, 2022 (the “Indenture”), by and between the Company and UMB Bank, N.A., as trustee. The Notes will mature on April 1, 2032. From and including March 31, 2022, to, but excluding, April 1, 2027 or the date of early redemption, the Company will pay interest on the Notes semi-annually in arrears on April 1 and October 1 of each year, commencing on October 1, 2022, at a fixed interest rate of 5.500% per annum. From and including April 1, 2027, to, but excluding, the maturity date or the date of early redemption (the “Floating Rate Period”), the Company will pay interest on the Notes at a floating interest rate. The floating interest rate will be reset quarterly, and the interest rate for any Floating Rate Period shall be equal to the then-current Three-Month Term Secured Overnight Financing Rate (“SOFR”) plus 315 basis points for each quarterly interest period during the Floating Rate Period. Interest payable on the Notes during the Floating Rate Period will be paid quarterly in arrears on January 1, April 1, July 1 and October 1, of each year, commencing on July 1, 2027. Notwithstanding the foregoing, in the event that Three-Month Term SOFR (or such other applicable benchmark rate) is less than zero, then Three-Month Term SOFR (or such other applicable benchmark rate) rate shall be deemed to be zero.
On March 31, 2022, in connection with the issuance and sale of the Notes, the Company entered into Registration Rights Agreements (the “Registration Rights Agreements”) with the Purchasers. Under the terms of the Registration Rights Agreements, the Company agreed to take certain actions to provide for the exchange of the Notes for subordinated notes that are registered under the Securities Act and have substantially the same terms as the Notes. The exchange offer under the Registration Rights Agreement was completed on July 19, 2022.
The Company may, at its option, redeem the Notes (i) in whole or in part beginning with the interest payment date on April 1, 2027, and on any interest payment date thereafter, or (ii) in whole, but not in part, upon the occurrence of a “Tier 2 Capital Event,” a “Tax Event,” or “Investment Company Event” (each as defined in the Indenture). The redemption price for any redemption is 100% of the principal amount of the Notes, plus accrued and unpaid interest thereon to, but excluding, the date of redemption. Any redemption of the Notes will be subject to the receipt of the approval of the Board of Governors of the Federal Reserve System (the “Federal Reserve”) to the extent then required under applicable laws or regulations, including capital adequacy rules or regulations.
There is no right of acceleration of maturity of the Notes in the case of default in the payment of principal of, or interest on, the Notes or in the performance of any other obligation of the Company under the Notes or the Indenture. The Indenture provides that holders of the Notes may accelerate payment of indebtedness only upon the Company’s bankruptcy, insolvency, reorganization, receivership or other similar proceedings.
The Notes are general unsecured, subordinated obligations of the Company and rank junior to all of its existing and future Senior Indebtedness (as defined in the Indenture), including all of its general creditors. The Notes will be equal in right of payment with any of the Company’s existing and future subordinated indebtedness, and will be senior to the Company’s obligations relating to any junior subordinated debt securities. In addition, the Notes are effectively subordinated to all secured indebtedness of the Company, including without limitation, the Bank's liabilities to depositors in connection with deposits in the Bank, to the extent of the value of the collateral securing such indebtedness.
In connection with the above offering, the Company incurred approximately $2.1 million in debt issuance costs which will be amortized to interest expense on a straight-line basis over the ten-year life of the note. As of December 31, 2023, the Company had $82.3 million in outstanding principal and $1.7 million in unamortized debt issuance costs.
48
Results of Operations
This section provides a comparative discussion of the Company’s results of operations for the two-year period ended December 31, 2023, unless otherwise specified. See “Item 7 – Management's Discussion and Analysis of Financial Condition and Results of Operations” in our Annual Report on Form 10-K for the year ended December 31, 2022 for a discussion of 2022 versus 2021 results.
Our results of operations depend substantially on net interest income and noninterest income. Other factors contributing to our results of operations include our level of our noninterest expenses, such as salaries and employee benefits, occupancy and equipment and other miscellaneous operating expenses. See the analysis of the material fluctuations in the related discussions that follow.
|
For the Year Ended December 31, |
|
|
For the Year Ended December 31, |
|
||||||||||||||||||||||||||
(Dollars in thousands) |
2023 |
|
|
2022 |
|
|
Increase |
2022 |
|
|
2021 |
|
|
Increase |
|
||||||||||||||||
Interest income |
$ |
266,544 |
|
|
$ |
153,946 |
|
|
$ |
112,598 |
|
|
|
73.1 |
% |
|
$ |
153,946 |
|
|
$ |
100,615 |
|
|
$ |
53,331 |
|
|
|
53.0 |
% |
Interest expense |
|
127,019 |
|
|
|
37,492 |
|
|
|
89,527 |
|
|
|
238.8 |
% |
|
|
37,492 |
|
|
|
10,062 |
|
|
|
27,430 |
|
|
|
272.6 |
% |
Net interest income |
|
139,525 |
|
|
|
116,454 |
|
|
|
23,071 |
|
|
|
19.8 |
% |
|
|
116,454 |
|
|
|
90,553 |
|
|
|
25,901 |
|
|
|
28.6 |
% |
Provision for credit losses |
|
6,320 |
|
|
|
12,200 |
|
|
|
(5,880 |
) |
|
|
(48.2 |
)% |
|
|
12,200 |
|
|
|
9,923 |
|
|
|
2,277 |
|
|
|
22.9 |
% |
Noninterest income |
|
8,205 |
|
|
|
7,223 |
|
|
|
982 |
|
|
|
13.6 |
% |
|
|
7,223 |
|
|
|
4,878 |
|
|
|
2,345 |
|
|
|
48.1 |
% |
Noninterest expense |
|
99,798 |
|
|
|
88,309 |
|
|
|
11,489 |
|
|
|
13.0 |
% |
|
|
88,309 |
|
|
|
71,025 |
|
|
|
17,284 |
|
|
|
24.3 |
% |
Income before income taxes |
|
41,612 |
|
|
|
23,168 |
|
|
|
18,444 |
|
|
|
79.6 |
% |
|
|
23,168 |
|
|
|
14,483 |
|
|
|
8,685 |
|
|
|
60.0 |
% |
Income tax expense |
|
8,211 |
|
|
|
4,509 |
|
|
|
3,702 |
|
|
|
82.1 |
% |
|
|
4,509 |
|
|
|
3,059 |
|
|
|
1,450 |
|
|
|
47.4 |
% |
Net income |
$ |
33,401 |
|
|
$ |
18,659 |
|
|
$ |
14,742 |
|
|
|
79.0 |
% |
|
$ |
18,659 |
|
|
$ |
11,424 |
|
|
$ |
7,235 |
|
|
|
63.3 |
% |
Net Interest Income
Our operating results depend primarily on our net interest income, calculated as the difference between interest income on interest-earning assets, such as loans and securities, and interest expense on interest-bearing liabilities, such as deposits and borrowings. Fluctuations in market interest rates impact the yield and rates paid on interest-earning assets and interest-bearing liabilities, respectively. Changes in the amount and type of interest-earning assets and interest-bearing liabilities also impact our net interest income. To evaluate net interest income, we measure and monitor (1) yields on our loans and other interest-earning assets, (2) the costs of our deposits and other funding sources, (3) our net interest spread and (4) our net interest margin. Because noninterest-bearing sources of funds, such as noninterest-bearing deposits and shareholders’ equity, also fund interest-earning assets, net interest margin includes the benefit of these noninterest-bearing sources.
Year ended December 31, 2023 vs. Year ended December 31, 2022
Net interest income increased $23.1 million, or 19.8%, during the year ended December 31, 2023, compared to the year ended December 31, 2022 primarily due to interest income from loan growth and increased loan rates offset by an increase in interest expense from increased rates paid on deposits. Average loans were $3.37 billion for the year ended December 31, 2023 compared to $2.69 billion for the year ended December 31, 2022 with the increase primarily due to loan growth in commercial and industrial loans, construction and development real estate loans, and commercial real estate loans. Average yield on loans was 7.39% for the year ended December 31, 2023 compared to 5.43% for the year ended December 31, 2022. The increase was the result of increases in the Prime Rate during 2022 and 2023. The Prime Rate increased from 3.25% at January 1, 2022 to 8.50% at December 31, 2023. Interest expense related to interest bearing deposit accounts was $115.0 million and $30.7 million for the years ended December 31, 2023 and 2022, respectively. Interest expense related to notes payable and FHLB advances was $12.0 million for the year ended December 31, 2023 compared to $6.8 million for the year ended December 31, 2022. The average cost of interest-bearing deposits was 4.13% for the year ended December 31, 2023 and 1.29% for the year ended December 31, 2022. For the year ended December 31, 2023, net interest margin and net interest spread were 3.73% and 2.86%, respectively, compared to 3.82% and 3.57%, respectively, for the year ended December 31, 2022.
49
The following table presents an analysis of net interest income and net interest spread for the periods indicated, including average outstanding balances for each major category of interest-earning assets and interest-bearing liabilities, the interest earned or paid on such amounts, and the average rate earned or paid on such assets or liabilities, respectively. The table also sets forth the net interest margin on average total interest-earning assets for the same periods.
|
|
For the Year Ended December 31, |
|
|||||||||||||||||||||||||||||||||
|
|
2023 |
|
|
2022 |
|
|
2021 |
|
|||||||||||||||||||||||||||
(Dollars in thousands) |
|
Average |
|
|
Interest |
|
|
Average |
|
|
Average |
|
|
Interest |
|
|
Average |
|
|
Average |
|
|
Interest |
|
|
Average |
|
|||||||||
Assets |
|
|
|
|
|
|
|
|
|
|
|
|
|
|
|
|
|
|
|
|
|
|
|
|
|
|
|
|||||||||
Interest-earnings assets: |
|
|
|
|
|
|
|
|
|
|
|
|
|
|
|
|
|
|
|
|
|
|
|
|
|
|
|
|||||||||
Investment securities |
|
$ |
197,286 |
|
|
$ |
8,313 |
|
|
|
4.21 |
% |
|
$ |
129,507 |
|
|
$ |
3,925 |
|
|
|
3.03 |
% |
|
$ |
31,251 |
|
|
$ |
1,043 |
|
|
|
3.34 |
% |
Loans, gross |
|
|
3,366,180 |
|
|
|
248,911 |
|
|
|
7.39 |
% |
|
|
2,694,428 |
|
|
|
146,425 |
|
|
|
5.43 |
% |
|
|
1,646,591 |
|
|
|
98,886 |
|
|
|
6.01 |
% |
Federal funds sold and other interest- |
|
|
181,782 |
|
|
|
9,320 |
|
|
|
5.13 |
% |
|
|
223,781 |
|
|
|
3,596 |
|
|
|
1.61 |
% |
|
|
267,983 |
|
|
|
686 |
|
|
|
0.26 |
% |
Total interest-earning assets |
|
|
3,745,248 |
|
|
|
266,544 |
|
|
|
7.12 |
% |
|
|
3,047,716 |
|
|
|
153,946 |
|
|
|
5.05 |
% |
|
|
1,945,825 |
|
|
|
100,615 |
|
|
|
5.17 |
% |
Less allowance for credit losses |
|
|
(36,750 |
) |
|
|
|
|
|
|
|
|
(25,600 |
) |
|
|
|
|
|
|
|
|
(14,198 |
) |
|
|
|
|
|
|
||||||
Total interest-earning assets, net of |
|
|
3,708,498 |
|
|
|
|
|
|
|
|
|
3,022,116 |
|
|
|
|
|
|
|
|
|
1,931,627 |
|
|
|
|
|
|
|
||||||
Noninterest-earning assets |
|
|
188,514 |
|
|
|
|
|
|
|
|
|
178,135 |
|
|
|
|
|
|
|
|
|
132,825 |
|
|
|
|
|
|
|
||||||
Total assets |
|
$ |
3,897,012 |
|
|
|
|
|
|
|
|
$ |
3,200,251 |
|
|
|
|
|
|
|
|
$ |
2,064,452 |
|
|
|
|
|
|
|
||||||
Liabilities and Shareholders’ Equity |
|
|
|
|
|
|
|
|
|
|
|
|
|
|
|
|
|
|
|
|
|
|
|
|
|
|
|
|||||||||
Interest-bearing liabilities: |
|
|
|
|
|
|
|
|
|
|
|
|
|
|
|
|
|
|
|
|
|
|
|
|
|
|
|
|||||||||
Interest-bearing deposits |
|
$ |
2,785,605 |
|
|
$ |
115,044 |
|
|
|
4.13 |
% |
|
$ |
2,377,079 |
|
|
$ |
30,696 |
|
|
|
1.29 |
% |
|
$ |
1,421,757 |
|
|
$ |
8,526 |
|
|
|
0.60 |
% |
Notes payable |
|
|
113,552 |
|
|
|
7,657 |
|
|
|
6.74 |
% |
|
|
77,317 |
|
|
|
4,605 |
|
|
|
5.96 |
% |
|
|
22,329 |
|
|
|
1,091 |
|
|
|
4.89 |
% |
FHLB advances |
|
|
79,546 |
|
|
|
4,318 |
|
|
|
5.43 |
% |
|
|
81,083 |
|
|
|
2,191 |
|
|
|
2.70 |
% |
|
|
56,442 |
|
|
|
445 |
|
|
|
0.79 |
% |
Total interest-bearing liabilities |
|
|
2,978,703 |
|
|
|
127,019 |
|
|
|
4.26 |
% |
|
|
2,535,479 |
|
|
|
37,492 |
|
|
|
1.48 |
% |
|
|
1,500,528 |
|
|
|
10,062 |
|
|
|
0.67 |
% |
Noninterest-bearing deposits |
|
|
473,558 |
|
|
|
|
|
|
|
|
|
313,972 |
|
|
|
|
|
|
|
|
|
383,747 |
|
|
|
|
|
|
|
||||||
Other liabilities |
|
|
47,527 |
|
|
|
|
|
|
|
|
|
27,115 |
|
|
|
|
|
|
|
|
|
9,547 |
|
|
|
|
|
|
|
||||||
Total liabilities |
|
|
3,499,788 |
|
|
|
|
|
|
|
|
|
2,876,566 |
|
|
|
|
|
|
|
|
|
1,893,822 |
|
|
|
|
|
|
|
||||||
Shareholders’ equity, including ESOP |
|
|
397,224 |
|
|
|
|
|
|
|
|
|
323,685 |
|
|
|
|
|
|
|
|
|
170,630 |
|
|
|
|
|
|
|
||||||
Total liabilities and shareholders’ equity |
|
$ |
3,897,012 |
|
|
|
|
|
|
|
|
$ |
3,200,251 |
|
|
|
|
|
|
|
|
$ |
2,064,452 |
|
|
|
|
|
|
|
||||||
Net interest income |
|
|
|
|
$ |
139,525 |
|
|
|
|
|
|
|
|
$ |
116,454 |
|
|
|
|
|
|
|
|
$ |
90,553 |
|
|
|
|
||||||
Net interest spread(1) |
|
|
|
|
|
|
|
|
2.86 |
% |
|
|
|
|
|
|
|
|
3.57 |
% |
|
|
|
|
|
|
|
|
4.50 |
% |
||||||
Net interest margin(2) |
|
|
|
|
|
|
|
|
3.73 |
% |
|
|
|
|
|
|
|
|
3.82 |
% |
|
|
|
|
|
|
|
|
4.65 |
% |
||||||
The following table presents information regarding the dollar amount of changes in interest income and interest expense for the periods indicated for each major component of interest-earning assets and interest-bearing liabilities and distinguishes between the changes attributable to changes in volume and changes attributable to changes in interest rates. For purposes of this table, changes attributable to both rate and volume that cannot be segregated have been allocated to rate.
|
|
For the Year Ended |
|
|
For the Year Ended |
|
||||||||||||||||||
|
|
Increase (Decrease) |
|
|
Total |
|
|
Increase (Decrease) |
|
|
Total |
|
||||||||||||
(Dollars in thousands) |
|
Volume |
|
|
Rate |
|
|
(Decrease) |
|
|
Volume |
|
|
Rate |
|
|
(Decrease) |
|
||||||
Interest-earning assets: |
|
|
|
|
|
|
|
|
|
|
|
|
|
|
|
|
|
|
||||||
Investment securities |
|
$ |
2,054 |
|
|
$ |
2,334 |
|
|
$ |
4,388 |
|
|
$ |
3,279 |
|
|
$ |
(397 |
) |
|
$ |
2,882 |
|
Loans, gross |
|
|
36,505 |
|
|
|
65,981 |
|
|
|
102,486 |
|
|
|
62,928 |
|
|
|
(15,389 |
) |
|
|
47,539 |
|
Federal funds sold and other interest-earning assets |
|
|
(675 |
) |
|
|
6,399 |
|
|
|
5,724 |
|
|
|
(113 |
) |
|
|
3,023 |
|
|
|
2,910 |
|
Total increase (decrease) in interest income |
|
$ |
37,884 |
|
|
$ |
74,714 |
|
|
$ |
112,598 |
|
|
$ |
66,094 |
|
|
$ |
(12,763 |
) |
|
$ |
53,331 |
|
Interest-bearing liabilities: |
|
|
|
|
|
|
|
|
|
|
|
|
|
|
|
|
|
|
||||||
Interest-bearing deposits |
|
$ |
5,275 |
|
|
$ |
79,073 |
|
|
$ |
84,348 |
|
|
$ |
5,729 |
|
|
$ |
16,441 |
|
|
$ |
22,170 |
|
Notes payable |
|
|
2,158 |
|
|
|
894 |
|
|
|
3,052 |
|
|
|
2,687 |
|
|
|
827 |
|
|
|
3,514 |
|
FHLB advances |
|
|
(42 |
) |
|
|
2,169 |
|
|
|
2,127 |
|
|
|
194 |
|
|
|
1,552 |
|
|
|
1,746 |
|
Total increase in interest expense |
|
$ |
7,391 |
|
|
$ |
82,136 |
|
|
$ |
89,527 |
|
|
$ |
8,610 |
|
|
$ |
18,820 |
|
|
$ |
27,430 |
|
Increase (decrease) in net interest income |
|
$ |
30,493 |
|
|
$ |
(7,422 |
) |
|
$ |
23,071 |
|
|
$ |
57,484 |
|
|
$ |
(31,583 |
) |
|
$ |
25,901 |
|
50
Provision for Credit Losses
Provision for credit losses is determined by management as the amount to be added to the allowance for credit losses account for various types of financial instruments, including loans, securities and off-balance sheet credit exposures, to bring the allowances to a level which, in management's best estimate, is necessary to absorb expected credit losses over the lives of the respective financial instruments. Prior to the January 1, 2023 adoption of ASC 326, the provision for credit losses was an expense we used to maintain an allowance for credit losses for loans at a level which was deemed appropriate by management to absorb known and inherent losses on existing loans.
The provision for credit losses for the year ended December 31, 2023 was $6.3 million compared to $12.2 million for the year ended December 31, 2022. The provision for credit losses for the year ended December 31, 2023 related primarily to provisioning for new loans and commitments. No provision for credit losses for securities was recorded for the year ended December 31, 2023.
As of December 31, 2023, the allowance for credit losses for loans totaled $37.0 million, or 1.02% of total loans, compared to $30.4 million, or 0.98% of total loans, as of December 31, 2022. At December 31, 2023, the allowance for credit losses for unfunded loan commitments was $2.4 million. No allowance for credit losses for unfunded loan commitments was recorded as of December 31, 2022. No allowance for credit losses for securities was recorded as of December 31, 2023 and 2022.
See the sections captioned “Allowance for Credit Losses” and “Securities” elsewhere in this discussion for additional information regarding the provision for credit losses related to loans, off-balance sheet credit exposures and securities.
Noninterest Income
Our primary sources of recurring noninterest income are service charges and fees on deposit accounts, gains from the sale of SBA loans and securities, earnings from bank-owned life insurance (“BOLI”) and our investment in the Small Business Investment Company, and derivative fees.
The following table presents, for the periods indicated, the major categories of noninterest income:
|
|
For the Year Ended December 31, |
|
|
For the Year Ended December 31, |
|
||||||||||||||||||||||||||
(Dollars in thousands) |
|
2023 |
|
|
2022 |
|
|
Increase (Decrease) |
|
|
2022 |
|
|
2021 |
|
|
Increase |
|
||||||||||||||
Noninterest Income: |
|
|
|
|
|
|
|
|
|
|
|
|
|
|
|
|
|
|
|
|
|
|
|
|
||||||||
Service charges and fees |
|
$ |
3,233 |
|
|
$ |
2,714 |
|
|
$ |
519 |
|
|
|
19.1 |
% |
|
$ |
2,714 |
|
|
$ |
2,367 |
|
|
$ |
347 |
|
|
|
14.7 |
% |
Gain on sale of investment securities available-for-sale |
|
|
482 |
|
|
|
— |
|
|
|
482 |
|
|
|
100.0 |
% |
|
|
— |
|
|
|
— |
|
|
|
— |
|
|
|
— |
|
Gain on sale of SBA loans |
|
|
440 |
|
|
|
950 |
|
|
|
(510 |
) |
|
|
(53.7 |
)% |
|
|
950 |
|
|
|
586 |
|
|
|
364 |
|
|
|
62.1 |
% |
Earnings on bank-owned life insurance |
|
|
2,101 |
|
|
|
1,312 |
|
|
|
789 |
|
|
|
60.1 |
% |
|
|
1,312 |
|
|
|
567 |
|
|
|
745 |
|
|
|
131.4 |
% |
Derivative fees |
|
|
763 |
|
|
|
1,259 |
|
|
|
(496 |
) |
|
|
(39.4 |
)% |
|
|
1,259 |
|
|
|
820 |
|
|
|
439 |
|
|
|
53.5 |
% |
Other |
|
|
1,186 |
|
|
|
988 |
|
|
|
198 |
|
|
|
20.0 |
% |
|
|
988 |
|
|
|
538 |
|
|
|
450 |
|
|
|
83.6 |
% |
Total noninterest income |
|
$ |
8,205 |
|
|
$ |
7,223 |
|
|
$ |
982 |
|
|
|
13.6 |
% |
|
$ |
7,223 |
|
|
$ |
4,878 |
|
|
$ |
2,345 |
|
|
|
48.1 |
% |
Year ended December 31, 2023 vs. Year ended December 31, 2022
The increase in noninterest income of $982,000 for the year ended December 31, 2023, compared to the year ended December 31, 2022, was primarily due to increases in service charges and BOLI and Small Business Investment Company income offset by decreases in gains recognized on the sales of the guaranteed portion of SBA loans and derivative related fee income. In addition, the Company recognized $482,000 in gains on the sale of investment securities during the year ended December 31, 2023.
Noninterest Expense
Generally, noninterest expense is composed of all employee expenses and costs associated with operating our facilities, obtaining and retaining customer relationships and providing bank services. The largest component of noninterest expense is salaries and employee benefits. Noninterest expense also includes operational expenses, such as occupancy expenses, depreciation and amortization of our facilities and our furniture, fixtures and office equipment, legal and professional fees, data processing and network expenses, regulatory fees, including FDIC assessments, advertising and marketing expenses, and loan operations related expenses.
51
The following table presents, for the periods indicated, the major categories of noninterest expense:
|
|
For the Year Ended December 31, |
|
|
For the Year Ended December 31, |
|
||||||||||||||||||||||||||
(Dollars in thousands) |
|
2023 |
|
|
2022 |
|
|
Increase |
|
|
2022 |
|
|
2021 |
|
|
Increase |
|
||||||||||||||
Noninterest Expense: |
|
|
|
|
|
|
|
|
|
|
|
|
|
|
|
|
|
|
|
|
|
|
|
|
||||||||
Salaries and employee benefits |
|
$ |
62,217 |
|
|
$ |
56,510 |
|
|
$ |
5,707 |
|
|
|
10.1 |
% |
|
$ |
56,510 |
|
|
$ |
48,642 |
|
|
$ |
7,868 |
|
|
|
16.2 |
% |
Net occupancy and equipment expenses |
|
|
11,285 |
|
|
|
8,526 |
|
|
|
2,759 |
|
|
|
32.4 |
% |
|
|
8,526 |
|
|
|
5,367 |
|
|
|
3,159 |
|
|
|
58.9 |
% |
Other: |
|
|
|
|
|
|
|
|
|
|
|
|
|
|
|
|
|
|
|
|
|
|
|
|
||||||||
Legal and professional fees |
|
|
7,783 |
|
|
|
6,987 |
|
|
|
796 |
|
|
|
11.4 |
% |
|
|
6,987 |
|
|
|
5,293 |
|
|
|
1,694 |
|
|
|
32.0 |
% |
Data processing and network expenses |
|
|
4,735 |
|
|
|
3,947 |
|
|
|
788 |
|
|
|
20.0 |
% |
|
|
3,947 |
|
|
|
3,060 |
|
|
|
887 |
|
|
|
29.0 |
% |
Advertising and marketing expenses |
|
|
2,627 |
|
|
|
1,912 |
|
|
|
715 |
|
|
|
37.4 |
% |
|
|
1,912 |
|
|
|
1,889 |
|
|
|
23 |
|
|
|
1.2 |
% |
Regulatory assessments |
|
|
2,598 |
|
|
|
3,464 |
|
|
|
(866 |
) |
|
|
(25.0 |
)% |
|
|
3,464 |
|
|
|
1,101 |
|
|
|
2,363 |
|
|
|
214.6 |
% |
Software purchases and maintenance |
|
|
2,375 |
|
|
|
1,012 |
|
|
|
1,363 |
|
|
|
134.7 |
% |
|
|
1,012 |
|
|
|
852 |
|
|
|
160 |
|
|
|
18.8 |
% |
Loan operations |
|
|
673 |
|
|
|
988 |
|
|
|
(315 |
) |
|
|
(31.9 |
)% |
|
|
988 |
|
|
|
1,963 |
|
|
|
(975 |
) |
|
|
(49.7 |
)% |
Telephone and communications |
|
|
510 |
|
|
|
496 |
|
|
|
14 |
|
|
|
2.8 |
% |
|
|
496 |
|
|
|
595 |
|
|
|
(99 |
) |
|
|
(16.6 |
)% |
Loss on sale of other real estate owned |
|
|
— |
|
|
|
350 |
|
|
|
(350 |
) |
|
|
(100.0 |
)% |
|
|
350 |
|
|
|
344 |
|
|
|
6 |
|
|
|
1.7 |
% |
Other expenses |
|
|
4,995 |
|
|
|
4,117 |
|
|
|
878 |
|
|
|
21.3 |
% |
|
|
4,117 |
|
|
|
1,919 |
|
|
|
2,198 |
|
|
|
114.5 |
% |
Total noninterest expense |
|
$ |
99,798 |
|
|
$ |
88,309 |
|
|
$ |
11,489 |
|
|
|
13.0 |
% |
|
$ |
88,309 |
|
|
$ |
71,025 |
|
|
$ |
17,284 |
|
|
|
24.3 |
% |
Year ended December 31, 2023 vs. Year ended December 31, 2022
The increase in noninterest expense of $11.5 million for the year ended December 31, 2023, compared to the year ended December 31, 2022, was primarily due to increases in salaries and employee benefits expense, net occupancy and equipment expenses, software purchases and maintenance, legal and professional expenses, and other noninterest expenses.
Salaries and employee benefits are the largest component of noninterest expense and include payroll expense, the cost of incentive compensation, benefit plans, health insurance and payroll taxes. Salaries and employee benefits were $62.2 million for the year ended December 31, 2023, an increase of $5.7 million, or 10.1%, compared to $56.5 million for the same period in 2022. The increase was due to our investment in additional personnel, annual wage increases and severance costs related to workforce reductions in the third quarter of 2023. For the year ended December 31, 2023, the average number of employees was 370 compared an average number of employees of 352 for the year ended December 31, 2022.
Net occupancy and equipment expenses were $11.3 million and $8.5 million for the years ended December 31, 2023 and 2022, respectively. This category includes building, leasehold, furniture, fixtures and equipment depreciation and software amortization totaling $4.9 million and $3.7 million for the years ended December 31, 2023 and 2022, respectively. In addition, the increase was also due to costs associated with branches that opened in the second and fourth quarter of 2022 and additional lease space at several of our locations.
The Company's software-related expenditures, including software purchases and maintenance, amounted to $2.4 million and $1.0 million for the years ended December 31, 2023, and 2022, respectively. The increase in these expenses is attributed to the investment made towards adopting new and advanced technology and software in 2023, aimed at achieving greater efficiency in lending and deposit processes.
Legal and professional fees were $7.8 million and $7.0 million for the years ended December 31, 2023 and 2022, respectively. The increase was primarily due to increased audit and accounting fees related to the Company's growth and increased legal fees related to corporate business, loan collections and new products.
Other noninterest expenses were $5.0 million and $4.1 million for the years ended December 31, 2023 and 2022, respectively. Other expenses includes insurance, director fees, fraud losses, franchise taxes, deposit related fees, and other miscellaneous expenses. The Company incurred $526,000 in ACH, debit card and check fraud losses for the year ended December 31, 2023. In addition, the Company had increases in insurance costs, franchise taxes, board of director related expenses, and deposit related fees during 2023.
Income Tax Expense
The amount of income tax expense we incur is impacted by the amounts of our pre-tax income, tax-exempt income and other nondeductible expenses. Deferred tax assets and liabilities are reflected at current income tax rates in effect for the period in which the deferred tax assets and liabilities are expected to be realized or settled. As changes in tax laws or rates are enacted, deferred tax assets and liabilities are adjusted through the provision for income taxes. Valuation allowances are established when necessary to reduce deferred tax assets to the amount expected to be realized.
52
Income tax expense and effective tax rates for the periods shown below were as follows:
|
|
Year Ended December 31, |
|
|||||||||
(Dollars in thousands) |
|
2023 |
|
|
2022 |
|
|
2021 |
|
|||
Income tax expense |
|
$ |
8,211 |
|
|
$ |
4,509 |
|
|
$ |
3,059 |
|
Effective tax rate |
|
|
19.7 |
% |
|
|
19.5 |
% |
|
|
21.1 |
% |
Year ended December 31, 2023 vs. Year ended December 31, 2022
For the years ended December 31, 2023 and 2022, income tax expense totaled $8.2 million and $4.5 million, respectively. Our effective tax rates remained consistent at 19.7% and 19.5% for the years ended December 31, 2023 and 2022, respectively.
Financial Condition
Total assets were $4.40 billion as of December 31, 2023 compared to $3.77 billion as of December 31, 2022. The increase of $622.9 million, or 16.5%, was primarily due to organic loan growth and the increase in cash and cash equivalents. The increases were primarily funded by the growth in demand deposits.
Loan Portfolio
Our primary source of income is derived through interest earned on loans to small- to medium-sized businesses, commercial companies, professionals and individuals located in our primary market areas. A substantial portion of our loan portfolio consists of commercial and industrial loans and real estate loans secured by commercial real estate properties located in our primary market areas. Our loan portfolio represents the highest yielding component of our earning assets.
As of December 31, 2023, total loans were $3.64 billion, an increase of $531.2 million, or 17.1%, compared to $3.11 billion as of December 31, 2022. Commercial and industrial loans, construction and development real estate loans, and commercial real estate loans accounted for most of the loan growth for the year ended December 31, 2023. Total loans as a percentage of deposits were 95.7% and 96.0% as of December 31, 2023 and 2022, respectively. Total loans as a percentage of assets were 82.8% and 82.4% as of December 31, 2023 and 2022, respectively.
The following table summarizes our loan portfolio by type of loan as of the dates indicated:
|
|
As of December 31, |
|
|||||||||||||
|
|
2023 |
|
|
2022 |
|
||||||||||
(Dollars in thousands) |
|
Amount |
|
|
Percent |
|
|
Amount |
|
|
Percent |
|
||||
Real estate: |
|
|
|
|
|
|
|
|
|
|
|
|
||||
Commercial real estate: |
|
|
|
|
|
|
|
|
|
|
|
|
||||
Non-farm non-residential owner occupied |
|
$ |
520,822 |
|
|
|
14.3 |
% |
|
$ |
493,791 |
|
|
|
15.9 |
% |
Non-farm non-residential non-owner occupied |
|
|
586,626 |
|
|
|
16.1 |
% |
|
|
506,012 |
|
|
|
16.3 |
% |
Residential |
|
|
342,589 |
|
|
|
9.4 |
% |
|
|
308,775 |
|
|
|
9.9 |
% |
Construction, development and other |
|
|
693,553 |
|
|
|
19.1 |
% |
|
|
567,851 |
|
|
|
18.3 |
% |
Farmland |
|
|
30,396 |
|
|
|
0.8 |
% |
|
|
22,820 |
|
|
|
0.7 |
% |
Commercial and industrial |
|
|
1,263,077 |
|
|
|
34.7 |
% |
|
|
1,058,910 |
|
|
|
34.1 |
% |
Consumer |
|
|
2,555 |
|
|
|
0.1 |
% |
|
|
3,872 |
|
|
|
0.1 |
% |
Municipal and other |
|
|
199,170 |
|
|
|
5.5 |
% |
|
|
145,520 |
|
|
|
4.7 |
% |
Total loans |
|
$ |
3,638,788 |
|
|
|
100.0 |
% |
|
$ |
3,107,551 |
|
|
|
100.0 |
% |
Commercial Real Estate Loans. Commercial real estate loans are underwritten primarily based on cash flows of the borrower and, secondarily, the value of the underlying collateral. These loans may be more adversely affected by conditions in the real estate markets or in the general economy. The properties securing the portfolio are located primarily throughout our markets and are generally diverse in terms of type. This diversity helps reduce the exposure to adverse economic events that affect any single industry.
Owner-occupied commercial real estate loans are a key component of our lending strategy to owner-operated businesses, representing a large percentage of our total commercial real estate loans. Owner-occupied commercial real estate loans increased $27.0 million, or 5.5%, to $520.8 million as of December 31, 2023 from $493.8 million as of December 31, 2022.
Non-owner-occupied commercial real estate loans are loans for income producing properties and are generally for retail strip centers, office buildings, self-storage facilities, and multi and single tenant office warehouses, all within our markets. Non-owner-occupied commercial real estate loans increased $80.6 million, or 15.9%, to $586.6 million as of December 31, 2023 from $506.0 million as of December 31, 2022.
The increases in commercial real estate loans were due to the addition of several lenders and increased productivity of existing lenders in response to market demand.
Residential Real Estate Loans. Residential real estate loans consists of 1-4 family residential loans and multi-family residential loans. Our 1-4 family residential loan portfolio is comprised of owner-occupied and investor owned loans secured by 1-4 family
53
homes. Our multi-family residential loan portfolio is comprised of loans secured by properties deemed multi-family, which includes apartment buildings. Our current multifamily loans are to operators who we believe are seasoned and successful and possess quality alternative repayment sources. Residential real estate loans increased $33.8 million, or 11.0%, to $342.6 million as of December 31, 2023 from $308.8 million as of December 31, 2022.
Construction, Development and Other Loans. Construction and development loans are comprised of loans used to fund construction, land acquisition and land development. The properties securing the portfolio are primarily in our Texas markets and are generally diverse in terms of type. Our builder finance group provides traditional homebuilder lines secured by lots and single-family homes, and land acquisition and development loans. This group also finances bond anticipation notes and lines of credit to large national institutional tier-one funds that invest equity in various real estate assets. Construction, development and other loans increased $125.7 million, or 22.1%, to $693.6 million as of December 31, 2023 from $567.9 million as of December 31, 2022 due primarily to the additional productivity from the builder finance group.
Commercial and Industrial Loans. Commercial and industrial loans are underwritten after evaluating and understanding the borrower's ability to operate profitably and effectively. These loans are primarily made based on the borrower's ability to service the debt from income. Most commercial and industrial loans are secured by the assets being financed or other business assets, such as accounts receivable or inventory, and generally include personal guarantees. Our commercial and industrial loan portfolio consists of loans principally to retail trade, service, and manufacturing firms located in our market areas.
In addition, the commercial and industrial loan category includes factored receivables. TCCC provides working capital solutions for small- to medium-sized businesses throughout the United States. TCCC provides working capital financing through the purchase of accounts receivables. Our factored receivables portfolio consists primarily of customers in the transportation, energy services and service industries. At December 31, 2023 and 2022, outstanding factored receivables were $26.5 million and $28.0 million, respectively.
Commercial and industrial loans increased $204.2 million, or 19.3%, to $1.26 billion as of December 31, 2023 from $1.06 billion as of December 31, 2022. The increase was primarily a result of increased productivity of existing lenders in response to market demand.
Other Loan Categories. Other categories of loans included in our loan portfolio include farmland loans, lease financing, Bond Anticipation Notes (BANs), consumer loans, and agricultural loans made to farmers and ranchers relating to their operations. None of these categories of loans represents a material portion of our total loan portfolio.
The contractual maturity ranges of loans in our loan portfolio and the amount of such loans with fixed and floating interest rates in each maturity range as of the date indicated are summarized in the following table:
|
|
As of December 31, 2023 |
|
|||||||||||||||||
(Dollars in thousands) |
|
One Year |
|
|
One Through |
|
|
Five Years Through Fifteen Years |
|
|
After Fifteen Years |
|
|
Total |
|
|||||
Real estate: |
|
|
|
|
|
|
|
|
|
|
|
|
|
|
|
|||||
Commercial real estate: |
|
|
|
|
|
|
|
|
|
|
|
|
|
|
|
|||||
Non-farm non-residential owner occupied |
|
$ |
26,630 |
|
|
$ |
208,029 |
|
|
$ |
213,492 |
|
|
$ |
72,671 |
|
|
$ |
520,822 |
|
Non-farm non-residential non-owner occupied |
|
|
44,083 |
|
|
|
395,672 |
|
|
|
116,147 |
|
|
|
30,724 |
|
|
|
586,626 |
|
Residential |
|
|
155,524 |
|
|
|
86,707 |
|
|
|
57,532 |
|
|
|
42,826 |
|
|
|
342,589 |
|
Construction, development and other |
|
|
139,007 |
|
|
|
520,003 |
|
|
|
17,646 |
|
|
|
16,897 |
|
|
|
693,553 |
|
Farmland |
|
|
5,362 |
|
|
|
18,528 |
|
|
|
5,283 |
|
|
|
1,223 |
|
|
|
30,396 |
|
Commercial and industrial |
|
|
708,620 |
|
|
|
471,239 |
|
|
|
78,488 |
|
|
|
4,730 |
|
|
|
1,263,077 |
|
Consumer |
|
|
457 |
|
|
|
1,764 |
|
|
|
334 |
|
|
|
— |
|
|
|
2,555 |
|
Municipal and other |
|
|
122,823 |
|
|
|
76,347 |
|
|
|
— |
|
|
|
— |
|
|
|
199,170 |
|
Total loans |
|
$ |
1,202,506 |
|
|
$ |
1,778,289 |
|
|
$ |
488,922 |
|
|
$ |
169,071 |
|
|
$ |
3,638,788 |
|
Amounts with fixed rates |
|
$ |
273,934 |
|
|
$ |
558,777 |
|
|
$ |
27,276 |
|
|
$ |
9,133 |
|
|
$ |
869,120 |
|
Amounts with floating rates |
|
$ |
928,572 |
|
|
$ |
1,219,512 |
|
|
$ |
461,646 |
|
|
$ |
159,938 |
|
|
$ |
2,769,668 |
|
Nonperforming Assets
Nonperforming assets include nonaccrual loans, loans that are accruing over 90 days past due, restructured loans - accruing, and foreclosed assets. Effective January 1, 2023, the Company adopted the provisions of ASU 2022-02, which discontinued the recognition and measurement guidance previously required on troubled debt restructurings. Therefore, restructure loans included in nonperforming assets as of December 31, 2023 exclude any loan modifications that are performing but would have previously required disclosure as troubled debt restructurings. Generally, loans are placed on nonaccrual status when they become more than 90 days past due and/or collection of principal or interest is in doubt.
54
The following table presents information regarding nonperforming assets at the dates indicated:
|
|
As of December 31, |
|
|||||
(Dollars in thousands) |
|
2023 |
|
|
2022 |
|
||
Nonaccrual loans(1) |
|
$ |
16,649 |
|
|
$ |
10,963 |
|
Loans > 90 days and still accruing |
|
|
670 |
|
|
|
518 |
|
Restructured loan—accruing |
|
|
— |
|
|
|
780 |
|
Total nonperforming loans |
|
$ |
17,319 |
|
|
$ |
12,261 |
|
Other real estate owned and repossessed assets |
|
|
— |
|
|
|
— |
|
Total nonperforming assets |
|
$ |
17,319 |
|
|
$ |
12,261 |
|
Ratio of nonaccrual loans to total loans |
|
|
0.46 |
% |
|
|
0.35 |
% |
Ratio of nonperforming loans to total loans |
|
|
0.48 |
% |
|
|
0.39 |
% |
Ratio of nonperforming loans to total assets |
|
|
0.39 |
% |
|
|
0.32 |
% |
Ratio of nonperforming assets to total assets |
|
|
0.39 |
% |
|
|
0.32 |
% |
Ratio of nonperforming loans to total loans plus OREO |
|
|
0.48 |
% |
|
|
0.39 |
% |
Ratio of allowance for credit losses to nonaccrual loans |
|
|
222.37 |
% |
|
|
276.85 |
% |
We had $17.3 million in nonperforming assets as of December 31, 2023 compared to $12.3 million as of December 31, 2022. As of December 31, 2023, the nonperforming assets to total assets remained low at 0.39%, compared to 0.32% as of December 31, 2022.
The following table summarizes our nonaccrual loans by category as of the dates indicated:
|
|
As of December 31, |
|
|||||
(Dollars in thousands) |
|
2023 |
|
|
2022 |
|
||
Nonaccrual loans by category: |
|
|
|
|
|
|
||
Real estate: |
|
|
|
|
|
|
||
Commercial real estate |
|
|
|
|
|
|
||
Non-farm non-residential owner occupied |
|
$ |
1,211 |
|
|
$ |
1,699 |
|
Non-farm non-residential non-owner occupied |
|
|
1,235 |
|
|
|
296 |
|
Residential |
|
|
2,938 |
|
|
|
513 |
|
Construction, development and other |
|
|
247 |
|
|
|
45 |
|
Commercial and industrial |
|
|
11,018 |
|
|
|
8,390 |
|
Consumer |
|
|
— |
|
|
|
20 |
|
Total nonaccrual loans |
|
$ |
16,649 |
|
|
$ |
10,963 |
|
Risk Gradings
As part of the on-going monitoring of the credit quality of the Company's loan portfolio and methodology for calculating the allowance for credit losses, management assigns and tracks risk gradings as indicated below that are used as credit quality indicators.
The following table summarizes the internal ratings of our loans as of the dates indicated:
|
|
As of December 31, 2023 |
|
|||||||||||||||||
(Dollars in thousands) |
|
Pass |
|
|
Special |
|
|
Substandard |
|
|
Doubtful |
|
|
Total |
|
|||||
Real estate: |
|
|
|
|
|
|
|
|
|
|
|
|
|
|
|
|||||
Commercial real estate: |
|
|
|
|
|
|
|
|
|
|
|
|
|
|
|
|||||
Non-farm non-residential owner occupied |
|
$ |
510,811 |
|
|
$ |
5,517 |
|
|
$ |
4,494 |
|
|
$ |
— |
|
|
$ |
520,822 |
|
Non-farm non-residential non-owner occupied |
|
|
580,981 |
|
|
|
4,409 |
|
|
|
1,236 |
|
|
|
— |
|
|
|
586,626 |
|
Residential |
|
|
338,619 |
|
|
|
538 |
|
|
|
3,432 |
|
|
|
— |
|
|
|
342,589 |
|
Construction, development and other |
|
|
692,098 |
|
|
|
1,208 |
|
|
|
247 |
|
|
|
— |
|
|
|
693,553 |
|
Farmland |
|
|
29,547 |
|
|
|
— |
|
|
|
849 |
|
|
|
— |
|
|
|
30,396 |
|
Commercial and industrial |
|
|
1,213,303 |
|
|
|
35,672 |
|
|
|
13,780 |
|
|
|
322 |
|
|
|
1,263,077 |
|
Consumer |
|
|
2,555 |
|
|
|
— |
|
|
|
— |
|
|
|
— |
|
|
|
2,555 |
|
Municipal and other |
|
|
199,170 |
|
|
|
— |
|
|
|
— |
|
|
|
— |
|
|
|
199,170 |
|
Gross loans |
|
$ |
3,567,084 |
|
|
$ |
47,344 |
|
|
$ |
24,038 |
|
|
$ |
322 |
|
|
$ |
3,638,788 |
|
55
|
|
As of December 31, 2022 |
|
|||||||||||||||||
(Dollars in thousands) |
|
Pass |
|
|
Special |
|
|
Substandard |
|
|
Doubtful |
|
|
Total |
|
|||||
Real estate: |
|
|
|
|
|
|
|
|
|
|
|
|
|
|
|
|||||
Commercial real estate: |
|
|
|
|
|
|
|
|
|
|
|
|
|
|
|
|||||
Non-farm non-residential owner occupied |
|
$ |
487,633 |
|
|
$ |
1,885 |
|
|
$ |
4,273 |
|
|
$ |
— |
|
|
$ |
493,791 |
|
Non-farm non-residential non-owner occupied |
|
|
498,987 |
|
|
|
228 |
|
|
|
6,797 |
|
|
|
— |
|
|
$ |
506,012 |
|
Residential |
|
|
307,881 |
|
|
|
— |
|
|
|
894 |
|
|
|
— |
|
|
$ |
308,775 |
|
Construction, development and other |
|
|
559,186 |
|
|
|
8,620 |
|
|
|
45 |
|
|
|
— |
|
|
$ |
567,851 |
|
Farmland |
|
|
22,820 |
|
|
|
— |
|
|
|
— |
|
|
|
— |
|
|
$ |
22,820 |
|
Commercial and industrial |
|
|
1,051,365 |
|
|
|
2,252 |
|
|
|
5,293 |
|
|
|
— |
|
|
$ |
1,058,910 |
|
Consumer |
|
|
3,852 |
|
|
|
— |
|
|
|
20 |
|
|
|
— |
|
|
$ |
3,872 |
|
Municipal and other |
|
|
145,520 |
|
|
|
— |
|
|
|
— |
|
|
|
— |
|
|
|
145,520 |
|
Gross loans |
|
$ |
3,077,244 |
|
|
$ |
12,985 |
|
|
$ |
17,322 |
|
|
$ |
— |
|
|
$ |
3,107,551 |
|
Allowance for Credit Losses on Loans
In accordance with ASC 326 which the Company adopted January 1, 2023, the allowance for credit losses on loans is estimated and recognized upon origination of the loan based on current expected credit losses. The amount of the allowance for credit losses represents management's best estimate of current expected credit losses on the Company's loans considering available information, from internal and external sources, relevant to assessing the exposure to credit loss over the contractual term of the loan. Relevant available information includes historical credit loss experience, current conditions and reasonable and supportable forecasts. While historical credit loss experience provides the basis for the estimation of expected credit losses, adjustments to historical loss information may be made for differences in current portfolio-specific risk characteristics, environmental conditions or other relevant factors. While management utilizes its best judgment and information available, the ultimate adequacy of our allowance for credit losses is dependent upon a variety of factors beyond our control, including the performance of our loan portfolios, the economy, changes in interest rates and the view of the regulatory authorities toward classification of assets. On January 1, 2023, we recorded an increase of $4.0 million to the allowance for credit losses for the cumulative effect of adopting ASC 326 for our loan portfolio. For additional information on adoption of ASC 326, see “—Critical Accounting Policies—Allowance for Credit Losses” below and “Part II—Item 8. Financial Statements and Supplementary Data—Note 1– Nature of Operations and Summary of Significant Accounting Policies” and “—Note 3 – Loans and Allowance for Credit Losses.”
Prior to the adoption of ASC 326, we maintained an allowance for credit losses that represented management’s best estimate of the loan losses and risks inherent in our loan portfolio. The amount of the allowance for credit losses was not an indicator that charge-offs in future periods would necessarily occur in those amounts. In determining the allowance for credit losses, we estimated losses on specific loans, or groups of loans, where the probable loss could be identified and reasonably determined. The balance of the allowance for credit losses was based on internally assigned risk classifications of loans, historical loan loss rates, changes in the nature and volume of our loan portfolio, overall portfolio quality, industry or borrower concentrations, delinquency trends, current economic factors and the estimated impact of current economic conditions on certain historical loan loss rates, among other factors.
As of December 31, 2023, the allowance for credit losses on loans totaled $37.0 million, or 1.02% of total loans. As of December 31, 2022, the allowance for credit losses on loans totaled $30.4 million, or 0.98% of total loans. The increase in our allowance for credit losses on loans of $6.7 million, or 22.0%, was primarily due to $4.0 million from the impact of ASC 326 adoption and the $3.9 million provision for credit losses on loans recorded for the year ended December 31, 2023 offset by net charge-offs of $1.2 million for the year ended December 31, 2023.
56
The following tables present as of and for the periods indicated, an analysis of the allowance for credit losses and other related data:
|
|
For Year Ended December 31, |
|
|||||
(Dollars in thousands) |
|
2023 |
|
|
2022 |
|
||
Allowance for credit loss at beginning of period |
|
$ |
30,351 |
|
|
$ |
19,295 |
|
Impact of ASC 326 adoption |
|
|
4,000 |
|
|
|
— |
|
Provision for credit loss on loans |
|
|
3,908 |
|
|
|
12,200 |
|
Charge-offs: |
|
|
|
|
|
|
||
Commercial and industrial |
|
|
(1,824 |
) |
|
|
(1,214 |
) |
Consumer |
|
|
(19 |
) |
|
|
(18 |
) |
Municipal and other |
|
|
(20 |
) |
|
|
— |
|
Total charge-offs |
|
|
(1,863 |
) |
|
|
(1,232 |
) |
Recoveries: |
|
|
|
|
|
|
||
Commercial and industrial |
|
|
626 |
|
|
|
72 |
|
Consumer |
|
|
— |
|
|
|
13 |
|
Municipal and other |
|
|
— |
|
|
|
3 |
|
Total recoveries |
|
|
626 |
|
|
|
88 |
|
Net charge-offs |
|
|
(1,237 |
) |
|
|
(1,144 |
) |
Allowance for credit losses at end of period |
|
$ |
37,022 |
|
|
$ |
30,351 |
|
Ratio of allowance for credit loss to total loans |
|
|
1.02 |
% |
|
|
0.98 |
% |
Ratio of net charge-offs to average loans |
|
|
0.04 |
% |
|
|
0.04 |
% |
The allowance for credit losses by loan category as of the dates indicated was as follows:
|
|
As of December 31, |
|
|||||||||||||
|
|
2023 |
|
|
2022 |
|
||||||||||
(Dollars in thousands) |
|
Amount |
|
|
% Loans in Each Category |
|
|
Amount |
|
|
% Loans in Each Category |
|
||||
Real estate: |
|
|
|
|
|
|
|
|
|
|
|
|
||||
Commercial real estate: |
|
|
|
|
|
|
|
|
|
|
|
|
||||
Non-farm non-residential owner occupied |
|
$ |
4,311 |
|
|
|
14.3 |
% |
|
$ |
3,773 |
|
|
|
15.9 |
% |
Non-farm non-residential non-owner occupied |
|
|
5,541 |
|
|
|
16.1 |
% |
|
|
5,741 |
|
|
|
16.3 |
% |
Residential |
|
|
2,341 |
|
|
|
9.4 |
% |
|
|
1,064 |
|
|
|
9.9 |
% |
Construction, development and other |
|
|
5,853 |
|
|
|
19.1 |
% |
|
|
3,053 |
|
|
|
18.3 |
% |
Farmland |
|
|
244 |
|
|
|
0.8 |
% |
|
|
82 |
|
|
|
0.7 |
% |
Commercial and industrial |
|
|
17,617 |
|
|
|
34.7 |
% |
|
|
16,269 |
|
|
|
34.1 |
% |
Consumer |
|
|
14 |
|
|
|
0.1 |
% |
|
|
6 |
|
|
|
0.1 |
% |
Municipal and other |
|
|
1,101 |
|
|
|
5.5 |
% |
|
|
363 |
|
|
|
4.7 |
% |
|
|
$ |
37,022 |
|
|
|
100.0 |
% |
|
$ |
30,351 |
|
|
|
100.0 |
% |
Securities
Our investment portfolio consists of state and municipal securities, mortgage-backed securities, agency collateralized mortgage obligations, U.S. treasury bonds, and corporate bonds classified as available for sale. The carrying value of such securities is adjusted for unrealized gain or loss, and any gain or loss is reported on an after-tax basis as a component of other comprehensive income in shareholders’ equity.
Management assesses securities in its investment portfolio for impairment on a quarterly basis or when events or circumstances suggest that the carrying amount of an investment may be impaired. In accordance with ASC 326, available-for-sale securities are evaluated as of each reporting date when the fair value is less than amortized cost, and credit losses are to be calculated individually using a discounted cash flow method through which management compares the present value of the expected cash flows with the amortized costs. An allowance for credit losses is established to reflect the credit loss component of the decline in fair value.
Factors management considers in assessing whether a discounted cash flow method evaluation is needed for a security whose fair value is less than amortized costs include: (1) management will assess whether it intends to sell, or if it is more likely than not it will be required to sell, the security before recovery of the amortized cost basis; (2) the length of time (duration) and the extent (severity) to which the market value has been less than costs; (3) the financial condition and near-term prospects of the issuer, including any specific events which may influence the operations of the issuer, such as changes in technology that impair the earnings potential of the investment or the discontinuance of a segment of the business that may affect the future earnings potential; and (4) changes in the rating of the security by a rating agency. Based on management's analysis, an allowance for credit losses for the security portfolio was not deemed to be needed as of December 31, 2023.
57
The following table summarizes the amortized cost and estimated fair value of our investment securities as of the dates shown:
|
|
As of December 31, |
|
|||||||||||||
|
|
2023 |
|
|
2022 |
|
||||||||||
(Dollars in thousands) |
|
Amortized |
|
|
Estimated |
|
|
Amortized |
|
|
Estimated |
|
||||
Investment securities available for sale: |
|
|
|
|
|
|
|
|
|
|
|
|
||||
U.S. government and agency securities |
|
$ |
4,017 |
|
|
$ |
3,991 |
|
|
$ |
— |
|
|
$ |
— |
|
State and municipal securities |
|
|
— |
|
|
|
— |
|
|
|
422 |
|
|
|
417 |
|
Mortgage-backed securities and collateralized mortgage |
|
|
77,703 |
|
|
|
78,533 |
|
|
|
23,522 |
|
|
|
22,881 |
|
U.S. Treasury bonds |
|
|
— |
|
|
|
— |
|
|
|
100,567 |
|
|
|
98,518 |
|
Corporate bonds |
|
|
100,371 |
|
|
|
95,563 |
|
|
|
57,607 |
|
|
|
54,251 |
|
|
|
$ |
182,091 |
|
|
$ |
178,087 |
|
|
$ |
182,118 |
|
|
$ |
176,067 |
|
As of December 31, 2023, the carrying amount of the security portfolio was $178.1 million compared to $176.1 million as of December 31, 2022, an increase of $2.0 million, or 1.1%. Investment securities represented 4.1% and 4.7% of total assets as of December 31, 2023 and 2022, respectively.
The mortgage-backed securities held include agency collateralized mortgage obligations, Fannie Mae, Freddie Mac, and Ginnie Mae securities. We do not hold any preferred stock, corporate equity, collateralized debt obligations, collateralized loan obligations, structured investment vehicles, private label collateralized mortgage obligations, subprime, Alt-A or second lien elements in our investment portfolio. As of December 31, 2023 and 2022, our investment portfolio did not contain any securities that are directly backed by subprime or Alt-A mortgages.
The contractual maturity of a mortgage-backed security is the date at which the last underlying mortgage matures. The contractual maturities of the mortgage-backed securities held range from 2026 to 2053 and are not a reliable indicator of the expected life because borrowers have the right to prepay their obligations at any time. Mortgage-backed securities are typically issued with stated principal amounts and are backed by pools of mortgage loans and other loans with varying maturities. The terms of the underlying mortgages and loans may vary significantly due to the ability of a borrower to prepay. Monthly pay downs on mortgage-backed securities tend to cause the average life of the securities to be much different than the stated contractual maturity. During a period of increasing interest rates, fixed rate mortgage-backed securities do not tend to experience heavy prepayments of principal, and, consequently, the average life of the security is typically lengthened. If interest rates begin to fall, prepayments may increase, thereby shortening the estimated life of the security. Therefore, schedules of maturities for mortgage-backed securities have been excluded from this disclosure.
The amortized cost and estimated fair value of securities available for sale at December 31, 2023, by contractual maturity, are shown below:
|
|
As of December 31, 2023 |
|
|||||
(Dollars in thousands) |
|
Amortized Cost |
|
|
Estimated Fair Value |
|
||
Due in one year or less |
|
$ |
2,905 |
|
|
$ |
2,937 |
|
Due from one year to five years |
|
|
9,340 |
|
|
|
9,547 |
|
Due from five years to ten years |
|
|
83,068 |
|
|
|
77,960 |
|
Over ten years |
|
|
9,075 |
|
|
|
9,110 |
|
|
|
|
104,388 |
|
|
|
99,554 |
|
Mortgage-backed securities and collateralized mortgage obligations |
|
|
77,703 |
|
|
|
78,533 |
|
Total available for sale |
|
$ |
182,091 |
|
|
$ |
178,087 |
|
The weighted average life of our investment portfolio was 7.47 years and 3.11 years as of December 31, 2023 and 2022, respectively.
Deposits
Total deposits as of December 31, 2023 were $3.80 billion, an increase of $567.0 million, or 17.5%, compared to $3.24 billion as of December 31, 2022. The increase was primarily due to growth in our national wholesale deposits through our core, fiduciary and institutional deposit programs, continued growth in our primary market areas, and the increase in commercial lending relationships for which we also seek deposit balances.
Noninterest-bearing deposits as of December 31, 2023 were $459.6 million, a decrease of $26.6 million, or 5.5%, compared to $486.1 million as of December 31, 2022. Total interest-bearing account balances as of December 31, 2023 were $3.34 billion, an increase of $593.6 million, or 21.6%, from $2.75 billion as of December 31, 2022. The decrease in noninterest-bearing deposits and increase in interest-bearing account balances were primarily due to our customers transferring balances from their noninterest-bearing accounts to their interest-bearing accounts as rates increased during 2023.
58
The components of deposits as of the dates shown below were as follows:
|
|
As of December 31, |
|
|||||||||||||
|
|
2023 |
|
|
2022 |
|
||||||||||
(Dollars in thousands) |
|
Amount |
|
|
Percent |
|
|
Amount |
|
|
Percent |
|
||||
Noninterest-bearing demand deposits |
|
$ |
459,553 |
|
|
|
12.1 |
% |
|
$ |
486,114 |
|
|
|
15.0 |
% |
Interest-bearing deposits |
|
|
2,842,668 |
|
|
|
74.7 |
% |
|
|
2,498,325 |
|
|
|
77.2 |
% |
Savings |
|
|
24,998 |
|
|
|
0.7 |
% |
|
|
35,677 |
|
|
|
1.1 |
% |
Time deposits |
|
|
475,929 |
|
|
|
12.5 |
% |
|
|
216,030 |
|
|
|
6.7 |
% |
Total deposits |
|
$ |
3,803,148 |
|
|
|
100.0 |
% |
|
$ |
3,236,146 |
|
|
|
100.0 |
% |
The following table sets forth the Company’s estimated uninsured time deposits by time remaining until maturity as of the dates indicated:
|
As of December 31, |
|
|
(Dollars in thousands) |
2023 |
|
|
Three months or less |
$ |
91,431 |
|
Over three months through six months |
|
65,599 |
|
Over six months through twelve months |
|
79,335 |
|
Over twelve months |
|
73,240 |
|
Total |
$ |
309,605 |
|
The estimated amount of uninsured deposits at December 31, 2023 was $1.08 billion.
The following table presents the average balances and average rates paid on deposits for the periods indicated:
|
|
Year Ended December 31, |
|
|||||||||||||
|
|
2023 |
|
|
2022 |
|
||||||||||
(Dollars in thousands) |
|
Average |
|
|
Average |
|
|
Average |
|
|
Average |
|
||||
Noninterest-bearing deposits |
|
$ |
473,558 |
|
|
|
— |
|
|
$ |
313,972 |
|
|
|
— |
|
Interest-bearing demand deposits |
|
|
2,332,972 |
|
|
|
4.14 |
% |
|
|
2,103,071 |
|
|
|
1.36 |
% |
Savings |
|
|
29,282 |
|
|
|
0.51 |
% |
|
|
36,166 |
|
|
|
0.29 |
% |
Time deposits |
|
|
423,351 |
|
|
|
4.30 |
% |
|
|
237,842 |
|
|
|
0.82 |
% |
Total interest-bearing deposits |
|
|
2,785,605 |
|
|
|
4.13 |
% |
|
|
2,377,079 |
|
|
|
1.29 |
% |
Total deposits |
|
$ |
3,259,163 |
|
|
|
3.53 |
% |
|
$ |
2,691,051 |
|
|
|
1.14 |
% |
The ratio of average noninterest-bearing deposits to average total deposits for the years ended December 31, 2023 and 2022 was 14.5% and 11.7%, respectively.
Borrowings
We have the ability to utilize advances from the FHLB and other borrowings to supplement deposits used to fund our lending and investment activities.
|
|
As of December 31, |
|
|||||
(Dollars in thousands) |
|
2023 |
|
|
2022 |
|
||
FHLB borrowings |
|
$ |
- |
|
|
$ |
- |
|
Line of Credit - Senior Debt |
|
|
38,875 |
|
|
|
30,875 |
|
Note Payable - Subordinated Debt |
|
|
80,553 |
|
|
|
80,348 |
|
Total borrowings |
|
$ |
119,428 |
|
|
$ |
111,223 |
|
Federal Home Loan Bank (FHLB) Advances. The FHLB allows us to borrow on a blanket floating lien status collateralized by FHLB stocks, real estate loans and investment securities. As of December 31, 2023 and 2022, total borrowing capacity available under this arrangement was $565.1 million and $719.1 million, respectively. The Company had no FHLB advances outstanding at December 31, 2023 and 2022. Our cost of FHLB advances was 5.43% for the year ended December 31, 2023 and 2.70% for the year ended December 31, 2022. In addition, letters of credit with the FHLB in the amount of $463.1 million and $290.3 million were outstanding at December 31, 2023 and 2022, respectively. The letters of credit are used to collateralize public fund deposit accounts in excess of FDIC insurance limits and have expirations ranging from January 2024 through July 2025 as of December 31, 2023.
Line of Credit - Senior Debt. On September 10, 2022, our $30.9 million revolving line of credit facility matured and was renewed and increased to $50.0 million with payment terms similar to the payment terms of the previous agreement. Prior to maturity, the note bore interest at The Wall Street Journal US Prime Rate, as such changes from time to time, with a floor rate of 4.00% per annum. Interest was payable quarterly on the 10th day of March, June, September and December through maturity date. Upon
59
renewal, the note bears interest at The Wall Street Journal US Prime Rate, as such changes from time to time, plus 0.50%, with a floor rate of 5.00% per annum. Interest is payable quarterly on the 10th day of March, June, September and December through maturity date of September 10, 2024. All principal and unpaid interest is due at maturity. The note is secured by 100% of the outstanding stock of the Bank and is senior in rights to the subordinated debt described below. At December 31, 2023, the outstanding balance of the note was $38.9 million.
Note Payable - Subordinated Debt. On March 31, 2022, the Company issued and sold $82.3 million in aggregate principal amount of the Notes. As of December 31, 2023, the outstanding balance was $80.6 million, net of $1.7 million in unamortized debt issuance costs. For additional information on our Note Payable - Subordinated Debt, see Note 7 – FHLB Advances and Other Borrowings in the accompanying notes to the consolidated financial statements included elsewhere in this report.
Our cost of notes payable was 6.74% and 5.96% for the years ended December 31, 2023 and 2022, respectively.
Federal Reserve Borrower-in-Custody (BIC) Loan Pledge Arrangement. In June 2023, the Federal Reserve Bank approved the Company to begin pledging, on a blanket floating lien status, its commercial and industrial loans under a Borrower-in-Custody arrangement. The arrangement provides the Company with the ability to secure collateralized contingency funding from the Discount Window of the Federal Reserve Bank of Dallas. As of December 31, 2023, total borrowing capacity under this arrangement was $1.2 billion. There were no advances outstanding at December 31, 2023.
Federal Funds Lines of Credit. At December 31, 2023 and 2022, the Company had federal funds lines of credit with commercial banks that provide for availability to borrow up to an aggregate of $36.5 million. The Company had no advances outstanding under these lines at December 31, 2023 and 2022.
Liquidity and Capital Resources
Liquidity
Liquidity involves our ability to raise funds to support asset growth and acquisitions or reduce assets to meet deposit withdrawals and other payment obligations, to maintain reserve requirements and otherwise to operate on an ongoing basis and manage unexpected events.
For the year ended December 31, 2023, liquidity needs were primarily met by core deposits, loan maturities, amortizing loan portfolios, brokered deposits, and borrowings. For the year ended December 31, 2022, liquidity needs were primarily met by core deposits, loan maturities, amortizing loan portfolios, brokered deposits, borrowings, and proceeds from issuance of stock.
At December 31, 2023, the Company had borrowing capacity available under FHLB advances of $565.1 million, line of credit - senior debt of $11.1 million, the Federal Reserve Bank of Dallas Discount Window of $1.2 billion, and federal funds lines of credit of $36.5 million. At December 31, 2022, the Company had borrowing capacity under FHLB advances of $719.1 million, line of credit - senior debt of $19.1 million, and federal funds lines of credit of $36.5 million.
The following table illustrates, during the periods presented, the composition of our funding sources and the average assets in which those funds are invested as a percentage of average total assets for the periods indicated. Average assets were $3.90 billion for the year ended December 31, 2023 and $3.20 billion for the year ended December 31, 2022.
|
For the Year Ended December 31, |
|
|||||
|
2023 |
|
|
2022 |
|
||
Sources of Funds: |
|
|
|
|
|
||
Deposits: |
|
|
|
|
|
||
Noninterest-bearing |
|
12.2 |
% |
|
|
9.8 |
% |
Interest-bearing |
|
71.5 |
% |
|
|
74.3 |
% |
FHLB advances |
|
2.0 |
% |
|
|
2.5 |
% |
Notes payable |
|
2.9 |
% |
|
|
2.4 |
% |
Other liabilities |
|
1.2 |
% |
|
|
0.9 |
% |
Shareholders’ equity, including ESOP-owned shares |
|
10.2 |
% |
|
|
10.1 |
% |
Total |
|
100.0 |
% |
|
|
100.0 |
% |
Uses of Funds: |
|
|
|
|
|
||
Loans, net |
|
85.5 |
% |
|
|
83.4 |
% |
Securities (available for sale and held to maturity) |
|
5.0 |
% |
|
|
3.9 |
% |
Federal funds sold and other interest-earning assets |
|
4.7 |
% |
|
|
7.0 |
% |
Other noninterest-earning assets |
|
4.8 |
% |
|
|
5.7 |
% |
Total |
|
100.0 |
% |
|
|
100.0 |
% |
Average noninterest-bearing deposits to average deposits |
|
14.5 |
% |
|
|
11.7 |
% |
Average total loans to average deposits |
|
103.3 |
% |
|
|
100.1 |
% |
Our primary source of funds is deposits, and our primary use of funds is loans. We do not expect a change in the primary source or use of our funds in the foreseeable future.
60
As of December 31, 2023, we had $1.35 billion in outstanding commitments to extend credit and $26.9 million in commitments associated with outstanding standby and commercial letters of credit. As of December 31, 2022, we had $1.15 billion in outstanding commitments to extend credit and $21.7 million in commitments associated with outstanding standby and commercial letters of credit. Since commitments associated with letters of credit and commitments to extend credit may expire unused, the total outstanding may not necessarily reflect the actual future cash funding requirements.
As of December 31, 2023 and 2022, we had no exposure to future cash requirements associated with known uncertainties or capital expenditure of a material nature. As of December 31, 2023, we had cash and cash equivalents of $411.8 million, compared to $332.0 million as of December 31, 2022.
Capital Resources
Total shareholders’ equity increased to $412.0 million as of December 31, 2023, compared to $381.8 million as of December 31, 2022, an increase of $30.2 million, or 7.9%. This increase was primarily the result of the $33.4 million in net income and $3.0 million, net of tax, other comprehensive income offset by the $3.2 million, net of tax, allowance for credit loss adjustment from the adoption of ASC 326 and $4.7 million of dividends declared on the Series A Preferred Stock.
Capital management consists of providing equity and other instruments that qualify as regulatory capital to support current and future operations. Banking regulators view capital levels as important indicators of an institution’s financial soundness. We are required to comply with certain risk-based capital adequacy guidelines issued by the Federal Reserve and the FDIC.
As of December 31, 2023 and 2022, the Bank was in compliance with all applicable regulatory capital requirements, and the Bank was classified as “well capitalized” for purposes of the FDIC’s prompt corrective action regulations. As we deploy our capital and continue to grow our operations, our regulatory capital levels may decrease depending on our level of earnings. However, we expect to monitor and control our growth in order to remain in compliance with all regulatory capital standards applicable to us.
The Company began reporting ratios beginning March 31, 2023 in accordance with the regulatory framework. The following table presents the regulatory capital ratios for the Company and Bank as of the dates indicated.
|
|
Actual December 31, |
|
|
|
|
|
|||
|
|
2023 |
|
2022 |
|
Minimum Capital Requirement |
|
Minimum Capital Requirement with Capital Buffer |
|
Minimum To Be Well Capitalized |
Third Coast Bancshares, Inc. |
|
|
|
|
|
|
|
|
|
|
Tier 1 leverage capital (to average assets) |
|
9.23% |
|
N/A |
|
4.00% |
|
4.00% |
|
N/A |
Common equity tier 1 capital (to risk weighted assets) |
|
8.06% |
|
N/A |
|
4.50% |
|
7.00% |
|
N/A |
Tier 1 capital (to risk weighted assets) |
|
9.70% |
|
N/A |
|
6.00% |
|
8.50% |
|
N/A |
Total capital (to risk weighted assets) |
|
12.66% |
|
N/A |
|
8.00% |
|
10.50% |
|
N/A |
Third Coast Bank, SSB |
|
|
|
|
|
|
|
|
|
|
Tier 1 leverage capital (to average assets) |
|
11.91% |
|
13.11% |
|
4.00% |
|
4.00% |
|
5.00% |
Common equity tier 1 capital (to risk weighted assets) |
|
12.52% |
|
12.95% |
|
4.50% |
|
7.00% |
|
6.50% |
Tier 1 capital (to risk weighted assets) |
|
12.52% |
|
12.95% |
|
6.00% |
|
8.50% |
|
8.00% |
Total capital (to risk weighted assets) |
|
13.49% |
|
13.79% |
|
8.00% |
|
10.50% |
|
10.00% |
Use of Derivatives to Manage Interest Rate and Other Risks
In the ordinary course of business, we enter into derivative transactions to manage various risks and to accommodate the business requirements of our customers.
Cash Flow Hedges
As part of its hedging strategy, the Company entered into two five-year pay-fixed interest rate swap agreements during December 2023. The instruments have notional amounts of $100 million each with pay-fixed interest rates of 3.718% and 3.473%, respectively. The instruments are designated as cash flow hedges, and changes in fair value are recognized in other comprehensive income. The facilities are scheduled to mature on December 6, 2028 and December 21, 2028, respectively.
During March 2023 and as part of our hedging strategy, we entered into a five-year pay-fixed interest rate swap agreement with a notional amount of $200 million. The facility, which was scheduled to mature on March 31, 2028, was discontinued on May 26, 2023, and a gain of $5.0 million was recognized by the Company. The gain is being accreted from other comprehensive income (loss), net of deferred taxes, into interest expense through the maturity date of the contract.
During July 2022, we entered into a five-year pay-fixed interest rate swap agreement with a notional amount of $200 million on its floating rate deposits. The facility, which was designated as a cash flow hedge, was discontinued on August 24, 2022, and a gain on the terminated hedge of $3.0 million was recognized by the Company. The gain is being accreted from other comprehensive income (loss), net of deferred taxes, into interest expense through the maturity date of the contract, or July 9, 2027.
61
On February 18, 2021, a $100.0 million pay-fixed interest rate swap facility designated as a cash flow hedge was discontinued and a gain on the terminated hedge of $945,000 was recognized by the Company. The gain is being accreted from other comprehensive income (loss), net of deferred taxes, into interest expense through the maturity date of the contract, or September 4, 2025.
For the years ended December 31, 2023 and 2022, approximately $1.7 million and $401,000, respectively, was reclassified out of accumulated other comprehensive income and recognized as a reduction of interest expense on discontinued hedges.
Fair Value Hedges
We also offer certain interest rate swap products directly to our qualified commercial banking customers. These financial instruments are not designated as hedging instruments. The interest rate swap derivative positions relate to transactions in which we enter into an interest rate swap with a customer, while at the same time entering into an offsetting interest rate swap with another financial institution. An interest rate swap transaction allows customers to effectively convert a variable rate loan to a fixed rate. In connection with each swap, we agree to pay interest on a notional amount at a variable interest rate and receive interest from the customer on a similar notional amount at a fixed interest rate. At the same time, we agree to pay another financial institution the same fixed interest rate on the same notional amount and receive the same variable interest rate on the same notional amount.
Because we act as an intermediary for our customer, changes in the fair value of the underlying derivative contracts are designed to offset each other and would not significantly impact our operating results except in certain situations where there is a significant deterioration in the customer’s credit worthiness or that of the counterparties. At December 31, 2023, no such deterioration was determined by management.
We also offer one-way interest rate swap products to our customers. Under this type of arrangement, we extend a conventional fixed-rate loan to the borrower and then subsequently hedge the interest rate risk of that loan by entering into a swap for our own balance sheet to convert the fixed-rate loan to a synthetic floating rate asset. These types of swaps lock in our spread over our cost of funds for the life of the loan.
For some of our loan participation facilities, we enter into Risk Participation Agreements with other banks in order to hedge or share a portion of the risk of borrower default related to the interest rate swap on a participated loan.
All derivatives are carried at fair value in either other assets or other liabilities in the accompanying consolidated balance sheets. At December 31, 2023, the Company's derivative assets and liabilities totaled $8.8 million and $10.7 million, respectively.
For additional information regarding derivatives, see Note 17 – Derivative Financial Instruments in the accompanying notes to the consolidated financial statements included elsewhere in this report.
Interest Rate Sensitivity and Market Risk
As a financial institution, our primary component of market risk is interest rate volatility. Our asset liability and funds management policy provides management with the guidelines for effective funds management, and we have established a measurement system for monitoring our net interest rate sensitivity position. We have historically managed our sensitivity position within our established guidelines.
Fluctuations in interest rates will ultimately impact both the level of income and expense recorded on most of our assets and liabilities, and the market value of all interest-earning assets and interest-bearing liabilities, other than those which have a short term to maturity. Interest rate risk is the potential of economic losses due to future interest rate changes. These economic losses can be reflected as a loss of future net interest income and/or a decrease in current fair market values. The objective is to measure the effect on net interest income and to adjust the balance sheet to minimize the inherent risk while at the same time maximizing income.
We manage our exposure to interest rates by structuring our balance sheet in the ordinary course of business. We do not enter into instruments such as leveraged derivatives, financial options, financial future contracts or forward delivery contracts for the purpose of reducing interest rate risk. Based upon the nature of our operations, we are not subject to foreign exchange or commodity price risk. We do not own any trading assets.
Our exposure to interest rate risk is managed by the Bank's ALCO, in accordance with policies approved by the Bank’s board of directors. The committee formulates strategies based on appropriate levels of interest rate risk. In determining the appropriate level of interest rate risk, the committee considers the impact on earnings and capital on the current outlook on interest rates, potential changes in interest rates, regional economies, liquidity, business strategies and other factors. The committee meets regularly to review, among other things, the sensitivity of assets and liabilities to interest rate changes, the book and market values of assets and liabilities, unrealized gains and losses, purchase and sale activities, commitments to originate loans and the maturities of investments and borrowings. Additionally, the committee reviews liquidity, cash flow flexibility, maturities of deposits and consumer and commercial deposit activity. Management employs methodologies to manage interest rate risk, which include an analysis of relationships between interest-earning assets and interest-bearing liabilities and an interest rate shock simulation model.
62
We use interest rate risk simulation models and shock analyses to test the interest rate sensitivity of net interest income and fair value of equity, and the impact of changes in interest rates on other financial metrics. Contractual maturities and re-pricing opportunities of loans are incorporated in the model, as are prepayment assumptions, maturity data and call options within the investment portfolio. The average life of our non-maturity deposit accounts are updated annually and are incorporated into the model. The assumptions used are inherently uncertain and, as a result, the model cannot precisely measure future net interest income or precisely predict the impact of fluctuations in market interest rates on net interest income. Actual results will differ from the model’s simulated results due to timing, magnitude and frequency of interest rate changes as well as changes in market conditions and the application and timing of various management strategies.
On a monthly basis, we run simulation models including a static balance sheet. The models test the impact on net interest income and fair value of equity from changes in market interest rates under various scenarios. Under the static model, rates are shocked instantaneously and ramped rate changes over a 12-month horizon based upon parallel and non-parallel yield curve shifts. Parallel shock scenarios assume instantaneous parallel movements in the yield curve compared to a flat yield curve scenario. In addition to the monthly reports, we also run various scenarios based on market trends and management analysis needs. These special reports include stress test reports, reports to test the deposit decay rates and growth reports based on budget. Our internal policy regarding internal rate risk simulations currently specifies that for instantaneous parallel shifts of the yield curve, estimated net income at risk for the subsequent one-year period should not decline by more than 25.0% for a 200 basis point shift and 35.0% for a 300 basis point shift.
The following tables summarize the simulated change in net interest income and fair value of equity over a 12-month horizon as of the dates indicated:
|
As of December 31, |
||||||
|
2023 |
|
2022 |
||||
Change in Interest Rates |
Percent Change in Net Interest Income |
|
Percent Change in Fair Value of Equity |
|
Percent Change in Net Interest Income |
|
Percent Change in Fair Value of Equity |
+ 300 |
(0.35)% |
|
(5.91)% |
|
9.99% |
|
11.90% |
+ 200 |
(0.23)% |
|
(3.39)% |
|
6.64% |
|
8.27% |
+ 100 |
(0.09)% |
|
(1.35)% |
|
3.31% |
|
4.31% |
Base |
— |
|
— |
|
— |
|
— |
–100 |
0.05% |
|
0.35% |
|
(3.32)% |
|
(2.46)% |
The results are primarily due to behavior of demand, money market and savings deposits during such rate fluctuations. We have found that, historically, interest rates on these deposits change more slowly than changes in the discount and federal funds rates. This assumption is incorporated into the simulation model and is generally not fully reflected in a gap analysis.
Critical Accounting Policies
Our financial reporting and accounting policies conform to GAAP. The preparation of financial statements in conformity with GAAP requires management to make estimates and assumptions that affect the reported amounts of assets and liabilities and disclosure of contingent assets and liabilities at the date of the consolidated financial statements and the reported amounts of revenues and expenses during the reporting period. Actual results could differ from those estimates.
Our accounting policies are integral to understanding our results of operations. Our accounting policies are described in greater detail in Note 1 – Nature of Operations and Summary of Significant Accounting Policies, in the notes to our consolidated financial statements included elsewhere in this Form 10-K. We believe that of our accounting policies, the following may involve a higher degree of judgment and complexity:
Allowance for Credit Losses. The allowance for credit losses on loans is a contra-asset valuation account, calculated in accordance with ASC 326, that is deducted from the amortized cost basis of loans to present the net amount expected to be collected. The amount of the allowance represents management's best estimate of current expected credit losses on loans considering available information, from internal and external sources, relevant to assessing collectability over the loans' contractual terms, adjusted for expected prepayments when appropriate. Relevant available information includes historical credit loss experience, current conditions and reasonable and supportable forecasts. While historical credit loss experience provides the basis for the estimation of expected credit losses, adjustments to historical loss information may be made for differences in current portfolio-specific risk characteristics, environmental conditions or other relevant factors. The allowance for credit losses is measured on a collective basis for portfolios of loans when similar risk characteristics exist. Expected credit losses for collateral dependent loans, including loans where the borrower is experiencing financial difficulty but foreclosure is not probable, are based on the fair value of the collateral at the reporting date, adjusted for selling costs as appropriate.
The provision for credit losses related to loans reflects the totality of actions taken on all loans for a particular period including any necessary increases or decreases in the allowance related to changes in credit loss expectations associated with specific loans or pools of loans. Portions of the allowance may be allocated for specific credits; however, the entire allowance is available for any credit
63
that, in management’s judgment, should be charged off. While management utilizes its best judgment and information available, the ultimate appropriateness of the allowance is dependent upon a variety of factors beyond our control, including the performance of our loan portfolio, the economy, changes in interest rates and the view of the regulatory authorities toward loan classifications.
Determining the amount of the allowance is considered a critical accounting estimate, as it requires significant judgment and the use of subjective measurements, including management’s assessment of overall portfolio quality. The Company maintains the allowance at an amount the Company believes is sufficient to provide for estimated current expected credit losses in the Company’s loan portfolio at each balance sheet date, and fluctuations in the provision for credit losses may result from management’s assessment of the adequacy of the allowance. Changes in these estimates and assumptions are possible and may have a material impact on the Company’s allowance, and therefore the Company’s financial position, liquidity or results of operations.
Transfers of Financial Assets. Management accounts for the transfers of financial assets as sales when control over the assets has been surrendered. Control is surrendered when the assets have been isolated, a transferee obtains the right to pledge or exchange the transferred assets and there is no agreement to repurchase the assets before their maturity. Management believes the loan participations sold subject to this guidance met the condition to be treated as a sale.
Goodwill and Core Deposit Intangibles. Goodwill represents the excess of cost over fair value of net assets acquired in a business combination. Goodwill is not amortized and is evaluated for impairment at least annually and on an interim basis if an event triggering impairment may have occurred.
Core deposit intangibles are acquired customer relationships arising from bank acquisitions and are amortized on a straight-line basis over their estimated useful life. Core deposit intangibles are tested for impairment whenever events or changes in circumstances indicate the carrying amount of assets may not be recoverable from future undiscounted cash flows.
Emerging Growth Company
The Company qualifies as an “emerging growth company” under the Jumpstart Our Business Startups Act. As an emerging growth company, the Company has taken advantage of reduced reporting and other requirements that are otherwise generally applicable to public companies. Emerging growth companies are:
The Company will lose its emerging growth company status upon the earliest of : (i) the last day of the fiscal year in which the Company has $1.235 billion or more in annual revenues; (ii) the date on which the Company becomes a “large accelerated filer” (the fiscal year end on which the total market value of the Company's common equity securities held by non-affiliates is $700 million or more as of June 30); (iii) the date on which the Company issues more than $1.0 billion of non-convertible debt over a three-year period; or (iv) December 31, 2026, which is the end of the fiscal year in which the fifth anniversary of the Company's initial public offering occurs.
Recently Issued Accounting Pronouncements
See “Part II—Item 8. Financial Statements and Supplementary Data—Note 1 – Nature of Operations and Summary of Significant Accounting Policies.”
Item 7A. Quantitative and Qualitative Disclosures About Market Risk.
See “Part II—Item 7. Management’s Discussion and Analysis of Financial Condition and Results of Operations—Interest Rate Sensitivity and Market Risk” for a discussion of how the Company manages market risk.
Item 8. Financial Statements and Supplementary Data.
The Company's financial statements and accompanying notes are included in Part IV—Item 15. Exhibit and Financial Statement Schedules.
64
Item 9. Changes in and Disagreements With Accountants on Accounting and Financial Disclosure.
None.
Item 9A. Controls and Procedures.
Evaluation of Disclosure Controls and Procedures
Management, with the participation of the Company’s Chairman, President and Chief Executive Officer and its Chief Financial Officer, evaluated the effectiveness of the design and operation of the Company’s disclosure controls and procedures (as defined in Rule l3a-l5(e) and 15d-15(e) promulgated under the Exchange Act) as of December 31, 2023. Based on this evaluation, the Company’s Chairman, President and Chief Executive Officer and Chief Financial Officer concluded that the Company’s disclosure controls and procedures were effective as of December 31, 2023.
Changes in Internal Control Over Financial Reporting
There was no change in the Company’s internal control over financial reporting (as such term is defined in Rules 13a-15(f) and 15d-15(f) under the Exchange Act) identified during the quarter ended December 31, 2023 that materially affected, or is reasonably likely to materially affect, the Company’s internal control over financial reporting.
Report on Management's Assessment of Internal Control Over Financial Reporting.
Management of the Company is responsible for establishing and maintaining adequate internal control over financial reporting (as defined in Rules 13a-15(f) and 15d-15(f) under the Exchange Act). The Company’s internal control system is a process designed to provide reasonable assurance regarding the preparation and fair presentation of published financial statements in accordance with
GAAP. All internal control systems, no matter how well designed, have inherent limitations and can only provide reasonable assurance with respect to financial reporting.
As of December 31, 2023, management assessed the effectiveness of the Company’s internal control over financial reporting based on the criteria for effective internal control over financial reporting established in “Internal Control—Integrated Framework,” issued by the Committee of Sponsoring Organizations, or COSO, of the Treadway Commission in 2013. This assessment included controls over the preparation of the schedules equivalent to the basic financial statements in accordance with the instructions for the Consolidated Financial Statements for Bank Holding Companies (Form FR Y-9C) to meet the reporting requirements of Section 112 of the FDICIA. Management’s assessment determined that the Company maintained effective internal controls over financial reporting as of December 31, 2023.
This Annual Report on Form 10-K does not include an attestation report of the Company’s registered public accounting firm due to a transition period established by rules of the SEC for an emerging growth company.
Item 9B. Other Information.
During the three months ended December 31, 2023,
Item 9C. Disclosure Regarding Foreign Jurisdictions that Prevent Inspections.
None.
65
PART III
Item 10. Directors, Executive Officers and Corporate Governance.
The information required by this Item is incorporated herein by reference to our Definitive Proxy Statement for the 2024 Annual Meeting of Shareholders to be filed with the SEC within 120 days after our fiscal year end (the “Proxy Statement”).
In accordance with Item 406 of Regulation S-K, we have adopted a code of business conduct and ethics that applies to Company executives, directors and employees. The code of business conduct and ethics is posted on our website at www.tcbssb.com under “Investors.” Within the time period required by the SEC, we will post on our website any amendment to the code of ethics and any waiver applicable to our principal executive officer, principal financial officer, and principal accounting officer or controller.
Item 11. Executive Compensation.
The information required by this Item is incorporated herein by reference to our Proxy Statement to be filed with the SEC within 120 days after our fiscal year end.
Item 12. Security Ownership of Certain Beneficial Owners and Management and Related Stockholder Matters.
The information required by this Item is incorporated herein by reference to our Proxy Statement to be filed with the SEC within 120 days after our fiscal year end.
Item 13. Certain Relationships and Related Transactions, and Director Independence.
The information required by this Item is incorporated herein by reference to our Proxy Statement to be filed with the SEC within 120 days after our fiscal year end.
Item 14. Principal Accountant Fees and Services.
The information required by this Item is incorporated herein by reference to our Proxy Statement to be filed with the SEC within 120 days after our fiscal year end.
66
PART IV
Item 15. Exhibit and Financial Statement Schedules.
All supplemental schedules to the consolidated financial statements have been omitted as inapplicable or because the required information is included in the Company’s consolidated financial statements or the notes thereto included in this Annual Report on Form 10-K.
Exhibit Index
Exhibit Number |
|
Description |
3.1 |
|
|
3.2 |
|
|
3.3 |
|
|
3.4 |
|
|
3.5 |
|
|
4.1 |
|
|
4.2* |
|
|
4.3 |
|
|
4.4 |
|
|
4.5 |
|
|
10.1† |
|
|
10.2† |
|
|
10.3† |
|
|
10.4† |
|
|
10.5 |
|
|
10.6 |
|
|
10.7 |
|
|
10.8 |
|
|
10.9† |
|
|
10.10† |
|
67
10.11† |
|
|
10.12† |
|
|
10.13† |
|
|
10.14† |
|
|
10.15† |
|
|
10.16† |
|
|
10.17† |
|
|
10.18† |
|
|
10.19† |
|
|
10.20† |
|
|
10.21† |
|
|
10.22 |
|
|
10.23 |
|
|
10.24 |
|
|
10.25 |
|
|
10.26 |
|
|
10.27 |
|
|
10.28† |
|
|
10.29† |
|
|
10.30† |
|
|
21.1* |
|
|
23.1* |
|
|
24.1* |
|
|
31.1* |
|
|
31.2* |
|
|
32.1** |
|
68
32.2** |
|
|
97.1* |
|
Third Coast Bancshares, Inc. Compensation Recovery Policy dated October 19, 2023. |
101.INS |
|
Inline XBRL Instance Document – the instance document does not appear in the Interactive Data File because XBRL tags are embedded within the Inline XBRL document. |
101.SCH |
|
Inline XBRL Taxonomy Extension Schema With Embedded Linkbase Documents. |
104 |
|
Cover Page Interactive Data File (embedded within the Inline XBRL document). |
* Filed herewith.
** These exhibits are furnished herewith and shall not be deemed “filed” for purposes of Section 18 of the Exchange Act, or otherwise subject to the liability of that section, and shall not be deemed to be incorporated by reference into any filing under the Securities Act or the Exchange Act.
† Indicates a management contract or compensatory plan.
# Schedules and exhibits have been omitted pursuant to Item 601(a)(5) of Regulation S-K. A copy of any omitted schedule or exhibit will be furnished to the SEC upon request; provided, however, that the parties may request confidential treatment pursuant to Rule 24b-2 of the Exchange Act for any document so furnished.
Item 16. Form 10-K Summary
None.
69
SIGNATURES
Pursuant to the requirements of Section 13 or 15(d) of the Securities Exchange Act of 1934, the registrant has duly caused this report to be signed on its behalf by the undersigned, thereunto duly authorized.
|
|
Third Coast Bancshares, Inc. |
|
|
|
|
|
Date: March 7, 2024 |
|
By: |
/s/ Bart O. Caraway |
|
|
|
Bart O. Caraway |
|
|
|
Chairman, President and Chief Executive Officer |
POWER OF ATTORNEY
Each person whose signature appears below appoints Bart O. Caraway and R. John McWhorter, and each of them, any of whom may act without the joinder of the other, as his true and lawful attorneys-in-fact and agents, with full power of substitution and resubstitution, for him and in his name, place and stead, in any and all capacities, to sign any and all amendments to this Annual Report on Form 10-K, and to file the same, with all exhibits thereto, and all other documents in connection therewith, with the Securities and Exchange Commission, granting unto said attorneys-in-fact and agents full power and authority to do and perform each and every act and thing requisite and necessary to be done, as fully to all intents and purposes as he might or would do in person, hereby ratifying and confirming all that said attorneys-in-fact and agents or any of them or their or his substitute or substitutes, may lawfully do or cause to be done by virtue hereof.
Pursuant to the requirements of the Securities Exchange Act of 1934, this report has been signed below by the following persons on behalf of the registrant in the capacities and on the dates indicated.
Name |
|
Title |
|
Date |
|
|
|
|
|
/s/ Bart O. Caraway |
|
Chairman, President and Chief Executive Officer |
|
March 7, 2024 |
Bart O. Caraway |
|
(Principal Executive Officer) |
|
|
|
|
|
|
|
/s/ R. John McWhorter |
|
Chief Financial Officer |
|
March 7, 2024 |
R. John McWhorter |
|
(Principal Financial and Accounting Officer) |
|
|
|
|
|
|
|
/s/ Carolyn Bailey |
|
Director |
|
March 7, 2024 |
Carolyn Bailey |
|
|
|
|
|
|
|
|
|
/s/ Martin Basaldua |
|
Director |
|
March 7, 2024 |
Martin Basaldua |
|
|
|
|
|
|
|
|
|
/s/ Dennis Bonnen |
|
Director |
|
March 7, 2024 |
Dennis Bonnen |
|
|
|
|
|
|
|
|
|
/s/ W. Donald Brunson |
|
Director |
|
March 7, 2024 |
W. Donald Brunson |
|
|
|
|
|
|
|
|
|
/s/ Troy A. Glander |
|
Director |
|
March 7, 2024 |
Troy A. Glander |
|
|
|
|
|
|
|
|
|
/s/ Shelton J. McDonald |
|
Director |
|
March 7, 2024 |
Shelton J. McDonald |
|
|
|
|
|
|
|
|
|
/s/David Phelps |
|
Director |
|
March 7, 2024 |
David Phelps |
|
|
|
|
|
|
|
|
|
/s/ Tony Scavuzzo |
|
Director |
|
March 7, 2024 |
Tony Scavuzzo |
|
|
|
|
|
|
|
|
|
/s/ Joseph L. Stunja |
|
Director |
|
March 7, 2024 |
Joseph L. Stunja |
|
|
|
|
|
|
|
|
|
/s/ Reagan Swinbank |
|
Director |
|
March 7, 2024 |
Reagan Swinbank |
|
|
|
|
70
INDEX TO CONSOLIDATED FINANCIAL STATEMENTS
|
Page |
|
|
Report of Independent Registered Public Accounting Firm (PCAOB ID: |
F-2 |
Consolidated Balance Sheets as of December 31, 2023 and December 31, 2022 |
F-3 |
F-4 |
|
F-5 |
|
F-6 |
|
F-7 |
|
F-9 |
F-1
Report of Independent Registered Public Accounting Firm
To the Board of Directors and Shareholders of
Third Coast Bancshares, Inc.
Opinion on the Financial Statements
We have audited the consolidated balance sheets of Third Coast Bancshares, Inc. (the “Company”) as of December 31, 2023 and 2022, and the related consolidated statements of income, comprehensive income, changes in shareholders’ equity, and cash flows for each of the years in the three-year period ended December 31, 2023, and the related notes to the consolidated financial statements. In our opinion, the accompanying consolidated financial statements present fairly, in all material respects, the financial position of the Company as of December 31, 2023 and 2022, and the results of their operations and their cash flows for each of the years in the three-year period ended December 31, 2023, in conformity with accounting principles generally accepted in the United States of America.
Basis for Opinion
These consolidated financial statements are the responsibility of the Company’s management. Our responsibility is to express an opinion on these consolidated financial statements based on our audits. We are a public accounting firm registered with the Public Company Accounting Oversight Board (United States) (“PCAOB”) and are required to be independent with respect to the Company in accordance with the U.S. federal securities laws and the applicable rules and regulations of the Securities and Exchange Commission and the PCAOB.
We conducted our audits in accordance with the standards of the PCAOB. Those standards require that we plan and perform the audits to obtain reasonable assurance about whether the consolidated financial statements are free of material misstatement, whether due to error or fraud. The Company is not required to have, nor were we engaged to perform, an audit of its internal control over financial reporting. As part of our audits we are required to obtain an understanding of internal control over financial reporting, but not for the purpose of expressing an opinion on the effectiveness of the entity’s internal control over financial reporting. Accordingly, we express no such opinion.
Our audits included performing procedures to assess the risks of material misstatement of the consolidated financial statements, whether due to error or fraud, and performing procedures that respond to those risks. Such procedures included examining, on a test basis, evidence regarding the amounts and disclosures in the consolidated financial statements. Our audits also included evaluating the accounting principles used and significant estimates made by management, as well as evaluating the overall presentation of the consolidated financial statements. We believe that our audits provide a reasonable basis for our opinion.
/s/ Whitley Penn LLP
We have served as the Company’s auditor since 2009.
March 7, 2024
F-2
THIRD COAST BANCSHARES, INC. AND SUBSIDIARY
Consolidated Balance Sheets
|
|
December 31, |
|
|||||
(Dollars in thousands, except share and per share data) |
|
2023 |
|
|
2022 |
|
||
ASSETS |
|
|
|
|
|
|
||
Cash and cash equivalents: |
|
|
|
|
|
|
||
Cash and due from banks |
|
$ |
|
|
$ |
|
||
Federal funds sold |
|
|
|
|
|
|
||
Total cash and cash equivalents |
|
|
|
|
|
|
||
Investment securities available-for-sale |
|
|
|
|
|
|
||
Loans, net of allowance for credit losses of $ |
|
|
|
|
|
|
||
Accrued interest receivable |
|
|
|
|
|
|
||
Premises and equipment, net |
|
|
|
|
|
|
||
Bank-owned life insurance |
|
|
|
|
|
|
||
Non-marketable equity securities, at cost |
|
|
|
|
|
|
||
Deferred tax asset, net |
|
|
|
|
|
|
||
Derivative assets |
|
|
|
|
|
|
||
Right-of-use asset - operating leases |
|
|
|
|
|
|
||
Core Deposit Intangible, net |
|
|
|
|
|
|
||
Goodwill |
|
|
|
|
|
|
||
Other assets |
|
|
|
|
|
|
||
Total assets |
|
$ |
|
|
$ |
|
||
LIABILITIES AND SHAREHOLDERS' EQUITY |
|
|
|
|
|
|
||
Deposits: |
|
|
|
|
|
|
||
Noninterest bearing |
|
$ |
|
|
$ |
|
||
Interest bearing |
|
|
|
|
|
|
||
Total deposits |
|
|
|
|
|
|
||
Accrued interest payable |
|
|
|
|
|
|
||
Derivative liabilities |
|
|
|
|
|
|
||
Lease liability - operating leases |
|
|
|
|
|
|
||
Other liabilities |
|
|
|
|
|
|
||
Line of credit - Senior Debt |
|
|
|
|
|
|
||
Note payable - Subordinated Debt, net |
|
|
|
|
|
|
||
Total liabilities |
|
|
|
|
|
|
||
Shareholders' equity: |
|
|
|
|
|
|
||
Preferred stock, $ |
|
|
|
|
|
|
||
Series A Convertible Non-Cumulative Preferred Stock, $ |
|
|
|
|
|
|
||
Series B Convertible Perpetual Preferred Stock, $ |
|
|
— |
|
|
|
— |
|
Common stock, $ |
|
|
|
|
|
|
||
Common stock - non-voting, $ |
|
|
— |
|
|
|
— |
|
Additional paid-in capital |
|
|
|
|
|
|
||
Retained earnings |
|
|
|
|
|
|
||
Accumulated other comprehensive income (loss) |
|
|
|
|
|
( |
) |
|
Treasury stock: at cost; |
|
|
( |
) |
|
|
( |
) |
Total shareholders' equity |
|
|
|
|
|
|
||
Total liabilities & shareholders' equity |
|
$ |
|
|
$ |
|
||
The accompanying notes are an integral part of these consolidated financial statements.
F-3
THIRD COAST BANCSHARES, INC. AND SUBSIDIARY
Consolidated Statements of Income
|
|
For the Years Ended December 31, |
|
|||||||||
(Dollars in thousands, except share and per share data) |
|
2023 |
|
|
2022 |
|
|
2021 |
|
|||
Interest income: |
|
|
|
|
|
|
|
|
|
|||
Loans, including fees |
|
$ |
|
|
$ |
|
|
$ |
|
|||
Investment securities available-for-sale |
|
|
|
|
|
|
|
|
|
|||
Federal funds sold and other |
|
|
|
|
|
|
|
|
|
|||
Total interest income |
|
|
|
|
|
|
|
|
|
|||
Interest expense: |
|
|
|
|
|
|
|
|
|
|||
Deposit accounts |
|
|
|
|
|
|
|
|
|
|||
FHLB advances and other borrowings |
|
|
|
|
|
|
|
|
|
|||
Total interest expense |
|
|
|
|
|
|
|
|
|
|||
Net interest income |
|
|
|
|
|
|
|
|
|
|||
Provision for credit losses |
|
|
|
|
|
|
|
|
|
|||
Net interest income after provision for credit losses |
|
|
|
|
|
|
|
|
|
|||
Noninterest income: |
|
|
|
|
|
|
|
|
|
|||
Services charges and fees |
|
|
|
|
|
|
|
|
|
|||
Gain on sale of investment securities available-for-sale |
|
|
|
|
|
— |
|
|
|
— |
|
|
Gain on sales of SBA loans |
|
|
|
|
|
|
|
|
|
|||
Earnings on bank-owned life insurance |
|
|
|
|
|
|
|
|
|
|||
Derivative fees |
|
|
|
|
|
|
|
|
|
|||
Other |
|
|
|
|
|
|
|
|
|
|||
Total noninterest income |
|
|
|
|
|
|
|
|
|
|||
Noninterest expense: |
|
|
|
|
|
|
|
|
|
|||
Salaries and employee benefits |
|
|
|
|
|
|
|
|
|
|||
Data processing and network expense |
|
|
|
|
|
|
|
|
|
|||
Occupancy and equipment expense |
|
|
|
|
|
|
|
|
|
|||
Legal and professional |
|
|
|
|
|
|
|
|
|
|||
Loan operations |
|
|
|
|
|
|
|
|
|
|||
Advertising and marketing |
|
|
|
|
|
|
|
|
|
|||
Telephone and communications |
|
|
|
|
|
|
|
|
|
|||
Software purchases and maintenance |
|
|
|
|
|
|
|
|
|
|||
Regulatory assessments |
|
|
|
|
|
|
|
|
|
|||
Loss on sale of other real estate owned |
|
|
— |
|
|
|
|
|
|
|
||
Other |
|
|
|
|
|
|
|
|
|
|||
Total noninterest expense |
|
|
|
|
|
|
|
|
|
|||
Net income before income tax expense |
|
|
|
|
|
|
|
|
|
|||
Income tax expense |
|
|
|
|
|
|
|
|
|
|||
Net income |
|
|
|
|
|
|
|
|
|
|||
Preferred stock dividends declared |
|
|
|
|
|
|
|
|
— |
|
||
Net income available to common shareholders |
|
$ |
|
|
$ |
|
|
$ |
|
|||
Earnings per common share: |
|
|
|
|
|
|
|
|
|
|||
Basic earnings per share |
|
$ |
|
|
$ |
|
|
$ |
|
|||
Diluted earnings per share |
|
$ |
|
|
$ |
|
|
$ |
|
|||
The accompanying notes are an integral part of these consolidated financial statements.
F-4
THIRD COAST BANCSHARES, INC. AND SUBSIDIARY
Consolidated Statements of Comprehensive Income
|
|
For the Years Ended December 31, |
|
|||||||||
(Dollars in thousands) |
|
2023 |
|
|
2022 |
|
|
2021 |
|
|||
Net income |
|
$ |
|
|
$ |
|
|
$ |
|
|||
Other comprehensive income (loss): |
|
|
|
|
|
|
|
|
|
|||
Unrealized gain (loss) on securities: |
|
|
|
|
|
|
|
|
|
|||
Unrealized holding gain (loss) arising during the period |
|
|
|
|
|
( |
) |
|
|
|
||
Reclassification for net gains realized through the sales of securities |
|
|
( |
) |
|
|
— |
|
|
|
— |
|
Income tax benefit (expense) |
|
|
( |
) |
|
|
|
|
|
( |
) |
|
Other comprehensive income (loss) on securities |
|
|
|
|
|
( |
) |
|
|
|
||
Unrealized gain (loss) on derivatives: |
|
|
|
|
|
|
|
|
|
|||
Unrealized holding loss arising during the period |
|
|
( |
) |
|
|
— |
|
|
|
( |
) |
Gain on termination of derivative instruments |
|
|
|
|
|
|
|
|
|
|||
Reclassification adjustment for accretion of gain on terminated cash flow hedges recorded in interest expense during the period |
|
|
( |
) |
|
|
( |
) |
|
|
( |
) |
Income tax expense |
|
|
( |
) |
|
|
( |
) |
|
|
( |
) |
Other comprehensive income on derivatives |
|
|
|
|
|
|
|
|
|
|||
Total other comprehensive income (loss) |
|
|
|
|
|
( |
) |
|
|
|
||
Total comprehensive income |
|
$ |
|
|
$ |
|
|
$ |
|
|||
The accompanying notes are an integral part of these consolidated financial statements.
F-5
THIRD COAST BANCSHARES, INC. AND SUBSIDIARY
Consolidated Statements of Changes in Shareholders' Equity
|
|
|
|
|
|
|
|
|
|
|
|
|
|
|
|
|
|
|
|
Accumulated |
|
|
|
|
|
Less: |
|
|
|
|
||||||||||
|
|
|
|
|
|
|
|
|
|
|
|
|
|
Additional |
|
|
|
|
|
Other |
|
|
|
|
|
ESOP- |
|
|
|
|
||||||||||
|
|
Preferred Stock |
|
|
Common Stock |
|
|
Paid in |
|
|
Retained |
|
|
Comprehensive |
|
|
Treasury |
|
|
Owned |
|
|
|
|
||||||||||||||||
(Dollars in thousands) |
|
Series A |
|
|
Series B |
|
|
Voting |
|
|
Non-Voting |
|
|
Capital |
|
|
Earnings |
|
|
Income (Loss) |
|
|
Stock |
|
|
Shares |
|
|
Total |
|
||||||||||
Balance, January 1, 2021 |
|
$ |
— |
|
|
$ |
— |
|
|
$ |
|
|
$ |
— |
|
|
$ |
|
|
$ |
|
|
$ |
|
|
$ |
( |
) |
|
$ |
( |
) |
|
$ |
|
|||||
Net income |
|
|
— |
|
|
|
— |
|
|
|
— |
|
|
|
— |
|
|
|
— |
|
|
|
|
|
|
— |
|
|
|
— |
|
|
|
— |
|
|
|
|
||
Share-based compensation |
|
|
— |
|
|
|
— |
|
|
|
— |
|
|
|
— |
|
|
|
|
|
|
— |
|
|
|
— |
|
|
|
— |
|
|
|
— |
|
|
|
|
||
Warrants exercised |
|
|
— |
|
|
|
— |
|
|
|
|
|
|
— |
|
|
|
|
|
|
— |
|
|
|
— |
|
|
|
— |
|
|
|
— |
|
|
|
|
|||
Stock options exercised |
|
|
— |
|
|
|
— |
|
|
|
|
|
|
— |
|
|
|
|
|
|
— |
|
|
|
— |
|
|
|
— |
|
|
|
— |
|
|
|
|
|||
Common stock issued from initial public offering |
|
|
— |
|
|
|
— |
|
|
|
|
|
|
— |
|
|
|
|
|
|
— |
|
|
|
— |
|
|
|
— |
|
|
|
— |
|
|
|
|
|||
Common stock issued from private placement offering |
|
|
— |
|
|
|
— |
|
|
|
|
|
|
— |
|
|
|
|
|
|
— |
|
|
|
— |
|
|
|
— |
|
|
|
— |
|
|
|
|
|||
Issuance of common stock to ESOP |
|
|
— |
|
|
|
— |
|
|
|
|
|
|
— |
|
|
|
|
|
|
— |
|
|
|
— |
|
|
|
— |
|
|
|
( |
) |
|
|
— |
|
||
Terminated ESOP put option |
|
|
— |
|
|
|
— |
|
|
|
— |
|
|
|
— |
|
|
|
— |
|
|
|
— |
|
|
|
— |
|
|
|
— |
|
|
|
|
|
|
|
||
Restricted stock grants |
|
|
— |
|
|
|
— |
|
|
|
|
|
|
— |
|
|
|
( |
) |
|
|
— |
|
|
|
— |
|
|
|
— |
|
|
|
— |
|
|
|
— |
|
|
Net change in fair value of ESOP shares |
|
|
— |
|
|
|
— |
|
|
|
— |
|
|
|
— |
|
|
|
— |
|
|
|
— |
|
|
|
— |
|
|
|
— |
|
|
|
( |
) |
|
|
( |
) |
Net redemption of treasury stock |
|
|
— |
|
|
|
— |
|
|
|
— |
|
|
|
— |
|
|
|
— |
|
|
|
— |
|
|
|
— |
|
|
|
( |
) |
|
|
— |
|
|
|
( |
) |
Other comprehensive income, net of tax |
|
|
— |
|
|
|
— |
|
|
|
— |
|
|
|
— |
|
|
|
— |
|
|
|
— |
|
|
|
|
|
|
— |
|
|
|
— |
|
|
|
|
||
Balance, December 31, 2021 |
|
$ |
— |
|
|
$ |
— |
|
|
$ |
|
|
$ |
— |
|
|
$ |
|
|
$ |
|
|
$ |
|
|
$ |
( |
) |
|
$ |
— |
|
|
$ |
|
|||||
Net income |
|
|
— |
|
|
|
— |
|
|
|
— |
|
|
|
— |
|
|
|
— |
|
|
|
|
|
|
— |
|
|
|
— |
|
|
|
— |
|
|
|
|
||
Share-based compensation |
|
|
— |
|
|
|
— |
|
|
|
— |
|
|
|
— |
|
|
|
|
|
|
— |
|
|
|
— |
|
|
|
— |
|
|
|
— |
|
|
|
|
||
Stock options exercised |
|
|
— |
|
|
|
— |
|
|
|
|
|
|
— |
|
|
|
|
|
|
— |
|
|
|
— |
|
|
|
— |
|
|
|
— |
|
|
|
|
|||
Preferred stock issued - private placement |
|
|
|
|
|
— |
|
|
|
— |
|
|
|
— |
|
|
|
|
|
|
— |
|
|
|
— |
|
|
|
— |
|
|
|
— |
|
|
|
|
|||
Issuance of common stock to ESOP |
|
|
— |
|
|
|
— |
|
|
|
|
|
|
— |
|
|
|
|
|
|
— |
|
|
|
— |
|
|
|
— |
|
|
|
— |
|
|
|
|
|||
Restricted stock grants |
|
|
— |
|
|
|
— |
|
|
|
|
|
|
— |
|
|
|
( |
) |
|
|
— |
|
|
|
— |
|
|
|
— |
|
|
|
— |
|
|
|
— |
|
|
Other comprehensive loss, net of tax |
|
|
— |
|
|
|
— |
|
|
|
— |
|
|
|
— |
|
|
|
— |
|
|
|
— |
|
|
|
( |
) |
|
|
— |
|
|
|
— |
|
|
|
( |
) |
Preferred dividends declared - Series A, $ |
|
|
|
|
|
|
|
|
— |
|
|
|
|
|
|
— |
|
|
|
( |
) |
|
|
— |
|
|
|
— |
|
|
|
— |
|
|
|
( |
) |
|||
Balance, December 31, 2022 |
|
$ |
|
|
$ |
— |
|
|
$ |
|
|
$ |
— |
|
|
$ |
|
|
$ |
|
|
$ |
( |
) |
|
$ |
( |
) |
|
$ |
— |
|
|
$ |
|
|||||
Adoption of ASC 326, allowance for credit loss adjustment, net of tax |
|
|
— |
|
|
|
— |
|
|
|
— |
|
|
|
— |
|
|
|
— |
|
|
|
( |
) |
|
|
— |
|
|
|
— |
|
|
|
— |
|
|
|
( |
) |
Net income |
|
|
— |
|
|
|
— |
|
|
|
— |
|
|
|
— |
|
|
|
— |
|
|
|
|
|
|
— |
|
|
|
— |
|
|
|
— |
|
|
|
|
||
Share-based compensation |
|
|
— |
|
|
|
— |
|
|
|
— |
|
|
|
— |
|
|
|
|
|
|
— |
|
|
|
— |
|
|
|
— |
|
|
|
— |
|
|
|
|
||
Warrants exercised |
|
|
— |
|
|
|
— |
|
|
|
|
|
|
— |
|
|
|
|
|
|
— |
|
|
|
— |
|
|
|
— |
|
|
|
— |
|
|
|
|
|||
Stock options exercised |
|
|
— |
|
|
|
— |
|
|
|
|
|
|
— |
|
|
|
( |
) |
|
|
— |
|
|
|
— |
|
|
|
— |
|
|
|
— |
|
|
|
— |
|
|
Restricted stock grants |
|
|
— |
|
|
|
— |
|
|
|
|
|
|
— |
|
|
|
( |
) |
|
|
— |
|
|
|
— |
|
|
|
— |
|
|
|
— |
|
|
|
— |
|
|
Restricted stock forfeited or withheld to satisfy tax obligations |
|
|
— |
|
|
|
— |
|
|
|
( |
) |
|
|
— |
|
|
|
( |
) |
|
|
— |
|
|
|
— |
|
|
|
— |
|
|
|
— |
|
|
|
( |
) |
Other comprehensive income, net of tax |
|
|
— |
|
|
|
— |
|
|
|
— |
|
|
|
— |
|
|
|
— |
|
|
|
— |
|
|
|
|
|
|
— |
|
|
|
— |
|
|
|
|
||
Preferred dividends declared - Series A, $ |
|
|
|
|
|
|
|
|
— |
|
|
|
|
|
|
— |
|
|
|
( |
) |
|
|
— |
|
|
|
— |
|
|
|
— |
|
|
|
( |
) |
|||
Balance, December 31, 2023 |
|
$ |
|
|
$ |
— |
|
|
$ |
|
|
$ |
— |
|
|
$ |
|
|
$ |
|
|
$ |
|
|
$ |
( |
) |
|
$ |
— |
|
|
$ |
|
||||||
The accompanying notes are an integral part of these consolidated financial statements.
F-6
THIRD COAST BANCSHARES, INC. AND SUBSIDIARY
Consolidated Statements of Cash Flows
|
|
For the Years Ended December 31, |
|
|||||||||
(Dollars in thousands) |
|
2023 |
|
|
2022 |
|
|
2021 |
|
|||
Cash flows from operating activities: |
|
|
|
|
|
|
|
|
|
|||
Net income |
|
$ |
|
|
$ |
|
|
$ |
|
|||
Adjustments to reconcile net income to net cash provided by operating activities: |
|
|
|
|
|
|
|
|
|
|||
Provision for credit losses |
|
|
|
|
|
|
|
|
|
|||
Changes in deferred tax, net |
|
|
( |
) |
|
|
( |
) |
|
|
( |
) |
Share based compensation expense |
|
|
|
|
|
|
|
|
|
|||
Gain on sale of investment securities available-for-sale |
|
|
( |
) |
|
|
— |
|
|
|
— |
|
Gain on sale of SBA loans |
|
|
( |
) |
|
|
( |
) |
|
|
( |
) |
Loss on sale of other real estate owned |
|
|
— |
|
|
|
|
|
|
|
||
(Accretion) amortization of premium on securities, net |
|
|
( |
) |
|
|
|
|
|
|
||
Accretion of gain on terminated cash flow hedges |
|
|
( |
) |
|
|
( |
) |
|
|
( |
) |
Accretion of SBA Paycheck Protection Program fees |
|
|
( |
) |
|
|
( |
) |
|
|
( |
) |
Amortization of subordinated debt origination costs |
|
|
|
|
|
|
|
|
— |
|
||
Depreciation, amortization and accretion |
|
|
( |
) |
|
|
( |
) |
|
|
( |
) |
Earnings on bank-owned life insurance |
|
|
( |
) |
|
|
( |
) |
|
|
( |
) |
Proceeds from sale of loans held for sale |
|
|
— |
|
|
|
— |
|
|
|
|
|
Net change in operating leases |
|
|
|
|
|
|
|
|
— |
|
||
Net change in derivative assets and liabilities |
|
|
|
|
|
|
|
|
— |
|
||
Changes in operating assets and liabilities: |
|
|
|
|
|
|
|
|
|
|||
Accrued interest receivable and other assets |
|
|
( |
) |
|
|
( |
) |
|
|
|
|
Accrued interest payable and other liabilities |
|
|
|
|
|
|
|
|
|
|||
Net cash provided by operating activities |
|
|
|
|
|
|
|
|
|
|||
Cash flows from investing activities: |
|
|
|
|
|
|
|
|
|
|||
Net decrease (increase) in interest bearing deposits in other banks |
|
|
— |
|
|
|
|
|
|
( |
) |
|
Net purchase of non-marketable equity securities |
|
|
( |
) |
|
|
( |
) |
|
|
( |
) |
Investment securities available-for-sale activity: |
|
|
|
|
|
|
|
|
|
|||
Purchases |
|
|
( |
) |
|
|
( |
) |
|
|
( |
) |
Sales |
|
|
|
|
|
— |
|
|
|
— |
|
|
Maturities, calls and principal paydowns |
|
|
|
|
|
|
|
|
|
|||
Proceeds from termination of derivative instruments |
|
|
|
|
|
|
|
|
|
|||
Net originations on loans held for investment |
|
|
( |
) |
|
|
( |
) |
|
|
( |
) |
Net additions to bank premises and equipment |
|
|
( |
) |
|
|
( |
) |
|
|
( |
) |
Proceeds from disposal of fixed assets |
|
|
— |
|
|
|
|
|
|
— |
|
|
Proceeds from sales of foreclosed assets |
|
|
— |
|
|
|
— |
|
|
|
|
|
Purchase of bank owned life insurance |
|
|
( |
) |
|
|
( |
) |
|
|
— |
|
Net cash used in investing activities |
|
|
( |
) |
|
|
( |
) |
|
|
( |
) |
Cash flows from financing activities: |
|
|
|
|
|
|
|
|
|
|||
Net increase in deposits |
|
|
|
|
|
|
|
|
|
|||
Net repayment of FHLB Advances |
|
|
— |
|
|
|
( |
) |
|
|
( |
) |
Net proceeds from subordinated debt issuance |
|
|
— |
|
|
|
|
|
|
— |
|
|
Net repayment of subordinated notes payable - related party |
|
|
— |
|
|
|
— |
|
|
|
( |
) |
Net proceeds from (repayment of) line of credit - senior debt |
|
|
|
|
|
|
|
|
( |
) |
||
Net proceeds from issuance of preferred stock - private placement |
|
|
— |
|
|
|
|
|
|
— |
|
|
Net proceeds from issuance of common stock - private placement |
|
|
— |
|
|
|
— |
|
|
|
|
|
Net proceeds from issuance of common stock - initial public offering |
|
|
— |
|
|
|
— |
|
|
|
|
|
Issuance of common stock to ESOP |
|
|
— |
|
|
|
|
|
|
|
||
Proceeds from stock warrants exercised |
|
|
|
|
|
— |
|
|
|
|
||
Forfeiture of restricted stock grants withheld to satisfy tax obligations |
|
|
( |
) |
|
|
— |
|
|
|
— |
|
Proceeds from stock options exercised |
|
|
— |
|
|
|
|
|
|
|
||
Dividends paid on Series A preferred stock |
|
|
( |
) |
|
|
( |
) |
|
|
— |
|
Net redemption of treasury stock |
|
|
— |
|
|
|
— |
|
|
|
( |
) |
Net cash provided by financing activities |
|
|
|
|
|
|
|
|
|
|||
Change in cash and cash equivalents |
|
|
|
|
|
|
|
|
|
|||
Cash and cash equivalents at beginning of period |
|
|
|
|
|
|
|
|
|
|||
Cash and cash equivalents at end of period |
|
$ |
|
|
$ |
|
|
$ |
|
|||
The accompanying notes are an integral part of these consolidated financial statements.
F-7
THIRD COAST BANCSHARES, INC. AND SUBSIDIARY
Consolidated Statements of Cash Flows
|
|
For the Years Ended December 31, |
|
|||||||||
(Dollars in thousands) |
|
2023 |
|
|
2022 |
|
|
2021 |
|
|||
Supplemental Disclosures of Cash Flow Information: |
|
|
|
|
|
|
|
|
|
|||
Cash paid for interest |
|
$ |
|
|
$ |
|
|
$ |
|
|||
Cash paid for income taxes |
|
$ |
|
|
$ |
|
|
$ |
|
|||
Supplemental Disclosure of Noncash Investing and Financing Activities: |
|
|
|
|
|
|
|
|
|
|||
Right of use lease assets obtained in exchange for operating lease liabilities |
|
$ |
|
|
$ |
|
|
$ |
— |
|
||
Net increase in fair value of ESOP-owned shares |
|
$ |
— |
|
|
$ |
— |
|
|
$ |
( |
) |
Terminated ESOP put option |
|
$ |
— |
|
|
$ |
— |
|
|
$ |
|
|
The accompanying notes are an integral part of these consolidated financial statements.
F-8
THIRD COAST BANCSHARES, INC. AND SUBSIDIARY
Notes to consolidated Financial Statements
December 31, 2023 and 2022
Nature of Operations
Third Coast Bancshares, Inc. (“Bancshares”), through its subsidiary, Third Coast Bank, SSB, a Texas state savings bank (the “Bank”), and the Bank’s subsidiary, Third Coast Commercial Capital, Inc. (“TCCC”), (collectively known as the “Company,” “we,” “us” or “our”), provide general consumer and commercial banking services through
Basis of Presentation
The consolidated financial statements have been prepared in conformity with accounting principles generally accepted in the United States of America (“GAAP”), reporting practices prescribed by the financial services industry, and pursuant to the rules and regulations of the Securities and Exchange Commission (the “SEC”). In the opinion of management, all adjustments that were recurring in nature and considered necessary have been included for fair presentation of the Company’s financial position and results of operations.
The accompanying consolidated financial statements include the accounts of Bancshares, the Bank, and TCCC. All significant intercompany transactions and balances have been eliminated in consolidation.
The Company has evaluated subsequent events for potential recognition and/or disclosure through the date the consolidated financial statements were issued.
Use of Estimates
The preparation of financial statements in conformity with GAAP requires management to make estimates and assumptions that affect the reported amounts of assets and liabilities and the disclosure of contingent assets and liabilities at the date of the consolidated financial statements and of the reported amounts of revenues and expenses during the reporting period. Accordingly, actual results could differ from those estimates. Material estimates that are included in the financial statements include the allowance for credit losses, the valuation of goodwill and other intangible assets and the fair value of financial instruments.
Cash and Cash Equivalents
Cash and cash equivalents include cash, deposits with other financial institutions that have initial maturities of less than 90 days when acquired by the Company and federal funds sold.
Investment Securities Available-For-Sale
Investment securities available-for-sale consist of bonds, notes, and debentures that are not classified as trading securities or held-to-maturity securities. Investment securities available-for-sale are held for indefinite periods of time and carried at fair value, with the unrealized holding gains and losses reported as a component of other comprehensive income (loss), net of tax. Management determines the appropriate classification of investment securities at the time of purchase.
Loans
Loans are stated at the amount of unpaid principal, reduced by unearned income and an allowance for credit losses (“ACL”). Interest on loans is recognized using the effective interest method and includes amortization of deferred loan origination fees and costs over the life of the loans.
The accrual of interest on loans is discontinued when there is a clear indication that the borrower’s cash flow may not be sufficient to meet payments as they become due, which is generally when a loan is 90 days past due. When a loan is placed on non-accrual status, all previously accrued and unpaid interest is reversed. Interest income is subsequently recognized on a cash basis as long as the remaining book balance of the asset is deemed to be collectible. If collectability is questionable, then cash payments are applied to principal. A loan is placed back on accrual status when both principal and interest are current and it is probable that the Company will be able to collect all amounts due (both principal and interest) according to the terms of the loan agreement.
From time to time, the Company modifies its loan agreement with a borrower. The loan refinancing and restructuring guidance is considered for each loan modified to determine whether a modification results in a new loan or a continuation of an existing loan. In
F-9
THIRD COAST BANCSHARES, INC. AND SUBSIDIARY
Notes to consolidated Financial Statements
December 31, 2023 and 2022
some cases, the loan may be considered restructured if the borrower is experiencing financial difficulties and the loan has been modified. Loan modifications to borrowers experiencing financial difficulty may be in the form of principal forgiveness, an interest rate reduction, an other-than-insignificant payment delay, or a term extension or a combination thereof, among other things.
The Company has certain lending policies and procedures in place that are designed to maximize loan income with an acceptable level of risk. Management reviews and approves these policies and procedures on a regular basis and makes changes as appropriate. Management receives frequent reports related to loan originations, quality, concentrations, delinquencies, non-performing, and potential problem loans. Diversification in the loan portfolio is a means of managing risk associated with fluctuations in economic conditions, both by type of loan and geography.
Commercial loans are underwritten after evaluating and understanding the borrower’s ability to operate profitably and effectively. Underwriting standards are designed to determine whether the borrower possesses sound business ethics and practices and to evaluate current and projected cash flows to determine the ability of the borrower to repay their obligations as agreed. Commercial loans are primarily made based on the identified cash flows of the borrower and, secondarily, on the underlying collateral provided by the borrower. Most commercial loans are secured by the assets being financed or other business assets, such as accounts receivable or inventory, and include personal guarantees.
Real estate loans are also subject to underwriting standards and processes similar to commercial and agricultural loans. These loans are underwritten primarily based on projected cash flows and, secondarily, as loans secured by real estate. The repayment of real estate loans is generally largely dependent on the successful operation of the property securing the loans or the business conducted on the property securing the loan. Real estate loans may be more adversely affected by conditions in the real estate markets or in the general economy. The properties securing the Company’s real estate portfolio are generally diverse in terms of type and geographic location primarily throughout the Greater Houston, Dallas, and Austin-San Antonio metropolitan areas. This diversity helps reduce the exposure to adverse economic events that affect any single market or industry. Generally, real estate loans are owner occupied which further reduces the Company’s risk.
Agricultural loans are subject to underwriting standards and processes similar to commercial loans. Agricultural loans are primarily made based on the identified cash flows of the borrower and, secondarily, on the underlying collateral provided by the borrower. Most agricultural loans are secured by the agriculture related assets being financed, such as farmland, cattle, or equipment, and include personal guarantees.
The Company utilizes methodical credit standards and analysis to supplement its policies and procedures in underwriting consumer loans. The Company’s loan policy addresses types of consumer loans that may be originated and the collateral, if secured, which must be perfected. The relatively smaller individual dollar amounts of consumer loans that are spread over numerous individual borrowers also minimizes the Company’s risk.
Allowance for Credit Losses
As further discussed below, we adopted Accounting Standards Update (“ASU”) 2016-13, “Financial Instruments - Credit Losses (Topic 326): Measurement of Credit Losses on Financial Instruments,” on January 1, 2023. Accounting Standards Codification (“ASC”) Topic 326 (“ASC 326”) replaced the previous “incurred loss” model for measuring credit losses, which encompassed allowances for current known and inherent losses within the portfolio, with an “expected loss” model, which encompasses allowances for losses expected to be incurred over the life of the portfolio. The new current expected credit loss (“CECL”) model requires the measurement of all expected credit losses for financial assets measured at amortized cost and certain off-balance sheet credit exposures based on historical experience, current conditions, and reasonable and supportable forecasts. In connection with the adoption of ASC 326, we revised certain accounting policies and implemented certain accounting policy elections. The revised accounting policies are described below.
Allowance For Credit Losses - Available-for-Sale Securities: For available-for-sale securities in an unrealized loss position, we first assess whether (i) we intend to sell or (ii) it is more likely than not that we will be required to sell the security before recovery of its amortized cost basis. If either case is affirmative, any previously recognized allowances are charged-off and the security's amortized cost is written down to fair value through income. If neither case is affirmative, the security is evaluated to determine whether the decline in fair value has resulted from credit losses or other factors. In making this assessment, management considers the extent to which fair value is less than amortized cost, any changes to the rating of the security by a rating agency and any adverse conditions specifically related to the security, among other factors. If this assessment indicates that a credit loss exists, the present value of cash flows expected to be collected from the security are compared to the amortized cost basis of the security. If the present value of cash flows expected to be collected is less than the amortized cost basis, a credit loss exists and an allowance for credit losses is recorded for the credit loss, limited by the amount that the fair value is less than the amortized cost basis. Any impairment that has not been recorded through an allowance for credit losses is recognized in other comprehensive income. Adjustments to the allowance are reported in our income statement as a component of provision for credit loss expense. Management has made the accounting policy election to exclude accrued interest receivable on available-for-sale securities from the estimate of credit losses. Available-for-sale securities are charged-off against the allowance or, in the absence of any allowance,
F-10
THIRD COAST BANCSHARES, INC. AND SUBSIDIARY
Notes to consolidated Financial Statements
December 31, 2023 and 2022
written down through income when deemed uncollectible by management or when either of the aforementioned criteria regarding intent or requirement to sell is met. Further information regarding our policies and methodology used to estimate the allowance for credit losses on available-for-sale securities is presented in Note 2 – Investment Securities Available-for-Sale.
Prior to the adoption of ASU 2016-13, declines in the fair value of available-for-sale securities below their cost that were deemed to be other than temporary were reflected in earnings as realized losses. In estimating other-than-temporary impairment losses prior to January 1, 2023, management considered, among other things, (i) the length of time and the extent to which the fair value had been less than cost, (ii) the financial condition and near-term prospects of the issuer and (iii) the intent and our ability to retain our investment in the issuer for a period of time sufficient to allow for any anticipated recovery in fair value.
Allowance for Credit Losses - Loans: The allowance for credit losses on loans is a contra-asset valuation account, calculated in accordance with ASC 326, that is deducted from the amortized cost basis of loans to present management's best estimate of the net amount expected to be collected. Loans are charged-off against the allowance when deemed uncollectible by management. Expected recoveries do not exceed the aggregate of amounts previously charged-off and expected to be charged-off. Adjustments to the allowance are reported in our income statement as a component of provision for credit loss expense. Management has made the accounting policy election to exclude accrued interest receivable on loans from the estimate of credit losses. Further information regarding our policies and methodology used to estimate the allowance for credit losses on loans is presented in Note 3 – Loans and Allowance for Credit Losses.
Allowance For Credit Losses - Off-Balance Sheet Credit Exposures: The allowance for credit losses on off-balance sheet credit exposures is a liability account, calculated in accordance with ASC 326, representing expected credit losses over the contractual period for which we are exposed to credit risk resulting from a contractual obligation to extend credit. No allowance is recognized if we have the unconditional right to cancel the obligation. The allowance is reported as a component of other liabilities in our consolidated balance sheets. Adjustments to the allowance are reported in our income statement as a component of provision for credit loss expense. Further information regarding our policies and methodology used to estimate the allowance for credit losses on off-balance sheet credit exposures is presented in Note 10 – Financial Instruments with Off-Balance Sheet Risk.
Servicing Assets
Certain Small Business Administration (“SBA”) loans are originated and intended for sale in the secondary market. They are carried at the lower of cost or estimated fair value in the aggregate. Net unrealized losses, if any, are recognized through a valuation allowance by charges to income. Gains or losses recognized upon the sale of loans are determined on a specific identification basis and are included in non-interest income. SBA loan transfers are accounted for as sales when control over the loan has been surrendered. Control over such loans is deemed to be surrendered when (i) the assets have been isolated from the Company, (ii) the transferee obtains the right (free of conditions that constrain it from taking advantage of that right) to pledge or exchange the transferred assets, and (iii) the Company does not maintain effective control over the transferred assets through an agreement to repurchase them before their maturity.
The Company applies guidance issued by the FASB that clarifies the accounting and reporting standards for transfers and servicing of financial assets and extinguishments of liabilities, in which, after a transfer of financial assets, an entity recognizes the financial and servicing assets it controls and liabilities it has incurred, derecognizes financial assets when control has been surrendered, and derecognizes liabilities when extinguished. To calculate the gain or loss on sale of loans, the Company’s investment in the loan is allocated among the retained portion of the loan, the servicing retained, the interest-only strip and the sold portion of the loan, based on the relative fair value of each portion. The gain or loss on the sold portion of the loan is recognized based on the difference between the sale proceeds and the allocated investment. As a result of the relative fair value allocation, the carrying value of the retained portion is discounted, with the discount accreted to interest income over the life of the loan.
Servicing assets are amortized over an estimated life using a method that is in proportion to the estimated future servicing income. In the event future prepayments exceed management’s estimates and future cash flows are inadequate to cover the servicing asset, additional amortization would be recognized. The portion of servicing fees in excess of the contracted servicing fees is reflected as interest-only strips receivable, which are classified as available for sale and are carried at fair value. At December 31, 2023 and 2022, the Company was servicing loans previously sold of approximately $
Premises and Equipment
Buildings, leasehold improvements, furniture and fixtures, and equipment are carried at cost, less accumulated depreciation, computed principally by the straight-line method based on the estimated useful lives of the related asset. Land is not depreciated. Major replacements and betterments are capitalized while maintenance and repairs are charged to expense when incurred. Gains or losses on dispositions are reflected in income as incurred. A small portion of building floor space is currently leased out to tenants and recognized in income when earned.
F-11
THIRD COAST BANCSHARES, INC. AND SUBSIDIARY
Notes to consolidated Financial Statements
December 31, 2023 and 2022
Operating Leases
The Company leases certain office space and stand-alone buildings and equipment which are recognized as operating lease right-of-use assets and operating lease liabilities in the consolidated balance sheets. Lease liabilities represent the Company's liability to make lease payments under these leases on a discounted basis and are amortized on a straight-line basis over the lease term for each related lease agreement. Right-of-use assets represent the Company's right to use, or control the use of, leased assets for their lease term and are amortized over the lease term of the related lease agreement. See further discussion of Accounting Standards Update (“ASU”) 2016-02, Leases (Topic 842) below. The Company does not recognize short-term operating leases on the consolidated balance sheets. A short-term lease has a term of 12 months or less and does not have a purchase option that is likely to be exercised.
Other Real Estate Owned
Other real estate owned represents properties acquired through or in lieu of loan foreclosure and are initially recorded at fair value less estimated costs to sell. Any write-down to fair value at the time of transfer to other real estate owned is charged to the allowance for credit losses. Costs of improvements are capitalized, whereas costs relating to holding other real estate owned and subsequent adjustments to the value are expensed. Operating and holding expenses of such properties, net of related income, are included in loan operations and other real estate owned expense on the accompanying consolidated statements of income. Gains or losses on dispositions are reflected in income as incurred. At December 31, 2023 and 2022, the Company had no other real estate owned.
Bank-Owned Life Insurance
The Company has purchased life insurance policies on certain employees. These bank-owned life insurance (“BOLI”) policies are recorded in the accompanying consolidated balance sheets at their cash surrender values. Income from these policies and changes in the cash surrender values are reported in the accompanying consolidated statements of income.
Non-Marketable Securities
The Company has restricted non-marketable securities which represent investment in Federal Home Loan Bank (“FHLB”) stock, Federal Reserve Bank (“FRB”) stock and Texas Independent Bank (“TIB”) stock. These investments are not readily marketable and are carried at cost, which approximates fair value. As a member of the FHLB, FRB and TIB systems, the Company is required to maintain minimum level of investments in stock, based on the level of borrowings and other factors. Both cash and stock dividends are reported as income.
Goodwill and Core Deposit Intangibles
Goodwill represents the excess of cost over fair value of net assets acquired in a business combination. Goodwill is not amortized and is evaluated for impairment at least annually and on an interim basis if an event triggering impairment may have occurred.
Core deposit intangibles are acquired customer relationships arising from bank acquisitions and are amortized on a straight-line basis over their estimated useful life of ten years. Core deposit intangibles are tested for impairment whenever events or changes in circumstances indicate the carrying amount of assets may not be recoverable from future undiscounted cash flows.
Derivative Financial Instruments
Derivatives are recorded on our consolidated balance sheets as assets and liabilities measured at their fair value. The accounting for increases and decreases in the value of derivatives depends upon the use of the derivatives and whether the derivatives qualify for hedge accounting. At inception of the derivative, we designate the derivative as one of two types based on our intention and belief as to the likely effectiveness as a hedge. These two types are (1) a hedge of the fair value of a recognized asset or liability (“Fair Value Hedge”), and (2) a hedge of a forecasted transaction or the variability of cash flows to be received or paid related to a recognized asset or liability (“Cash Flow Hedge”).
For certain Fair Value Hedges, the gain or loss on the derivative, as well as the offsetting loss or gain on the hedged item, are recognized in noninterest income or expense in our consolidated statements of income. Fair Value Hedge instruments offered by the Company which are included in noninterest income or expense include pass-through interest rate swap products to qualified commercial banking customers. Under this type of contract, the Company enters into an interest rate swap contract with a customer, while at the same time entering into an offsetting interest rate swap contract with a financial institution counterparty. Changes in the fair value of the underlying derivatives are designed to offset each other so they would not significantly impact the Company's operating results.
The Company also enters into Risk Participation Agreements (“RPAs”) with other banks, primarily to share a portion of the risk of borrower default related to the interest rate swap on certain participated loans. Gains or losses on these types of derivatives are also included in noninterest income in our consolidated statements of income.
A one-way interest rate swap is another type of Fair Value Hedge instrument offered to our customers. Under this type of arrangement, the Company extends a conventional fixed-rate loan to the borrower and then subsequently hedges the interest rate risk of that loan by entering into a swap for its own balance sheet to convert the fixed-rate loan to a synthetic floating rate asset. These types of swaps lock
F-12
THIRD COAST BANCSHARES, INC. AND SUBSIDIARY
Notes to consolidated Financial Statements
December 31, 2023 and 2022
in the Company's spread over its cost of funds for the life of the loan. The gain or loss on this type of derivative is included in interest income in our consolidated statements of income.
For a Cash Flow Hedge, the gain or loss on the derivative is reported in other comprehensive income (loss) and is reclassified into earnings in the same periods during which the hedged transaction affects earnings. Cash Flow Hedge instruments include pay-fixed interest rate swap agreements with a financial institution counterparty.
Net cash settlements on cash flow hedges are recorded in interest expense in the consolidated statements of income. Net cash settlements on one-way swap derivatives are recorded in interest income in the consolidated statements of income. Net cash settlements on pass-through interest rate swaps and RPAs are reported in noninterest income in the consolidated statements of income. Cash flows on hedges are classified in the cash flow statement the same as the items being hedged.
When a cash flow hedge is discontinued but the hedged cash flows or forecasted transactions are still expected to occur, gains and/or losses accumulated in other comprehensive income are amortized into earnings over the same period which the hedged transaction will affect earnings.
We formally document the relationship between derivatives and hedged items, as well as the risk-management objective and the strategy for undertaking hedge transactions, at the inception of the hedging relationship. This documentation includes linking Cash Flow Hedges to specific assets and liabilities on the Consolidated Statements of Financial Condition or to forecasted transactions. See Note 17 – Derivative Financial Instruments.
Business Combinations
The Company applies the acquisition method of accounting for business combinations. Under the acquisition method, the acquiring entity in a business combination recognizes 100% of the assets acquired and liabilities assumed at their acquisition date fair values. Management utilizes valuation techniques appropriate for the asset or liability being measured in determining these fair values. Any excess of the purchase price over amounts allocated to assets acquired, including identifiable intangible assets, and liabilities assumed is recorded as goodwill. Adjustments identified during the measurement period are recognized in the reporting period in which the adjustment amounts are determined. Acquisition related costs are expensed as incurred.
Comprehensive Income
Comprehensive income includes all changes in shareholders’ equity during a period, except those resulting from transactions with shareholders. Other than net income, comprehensive income includes the net effect of changes in the fair value of securities available-for-sale and certain derivative instruments designated as cash flow hedges.
Revenues from Contracts with Customers
The Company’s revenues from services such as deposit related fees, wire transfer fees, interchange fees on debit cards, ATM fees, and merchant fee income are presented within the service charges and fees category in the accompanying consolidated statements of income and are recognized as revenue as the Company satisfies its obligation to the customer.
Advertising and Marketing Expenses
Advertising and marketing expenses consist of the Company’s advertising in its local market area and are expensed as incurred. For the years ended December 31, 2023, 2022 and 2021, advertising and marketing expenses were $
Income Taxes
The Company files a consolidated income tax return with its subsidiary. Federal income tax expense or benefit is allocated on a separate return basis.
Deferred tax assets and liabilities are reflected at currently enacted income tax rates applicable to the period in which the deferred tax assets and liabilities are expected to be realized or settled. As changes in tax laws or rates are enacted, deferred tax assets and liabilities are adjusted through the provision for income taxes. Valuation allowances are established when necessary to reduce deferred tax assets to the amount expected to be realized.
Share-Based Compensation
Compensation expense for stock options is based on the fair value of the award on the measurement date, which, for the Company, is the date of the grant and is recognized ratably over the service period of the award. The fair value of stock options is estimated using the Black-Scholes option-pricing model.
F-13
THIRD COAST BANCSHARES, INC. AND SUBSIDIARY
Notes to consolidated Financial Statements
December 31, 2023 and 2022
Basic and Diluted Earnings Per Common Share
Earnings per common share is computed in accordance with ASC Topic 260, “Earnings Per Share.” Basic earnings per common share is computed by dividing net earnings allocated to common stock by the weighted-average number of common shares outstanding during the applicable period. Diluted earnings per common share is computed by using the net earnings allocated to common stock plus dividends on dilutive convertible preferred stock, divided by the sum of 1) the weighted-average number of shares determined for the basic earnings per common share computation, 2) the dilutive effect of stock compensation using the treasury stock method, and 3) the dilutive effect of convertible preferred stock using the if-converted method. A reconciliation of the weighted-average shares used in calculating basic earnings per common share and the weighted average common shares used in calculating diluted earnings per common share for the reported periods is provided in Note 16 – Earnings Per Common Share.
Reclassification
Certain amounts in prior period consolidated financial statements may have been reclassified to conform to current period presentation. These reclassifications are immaterial and have no effect on net income, total assets or shareholders’ equity.
Recently Adopted Accounting Standards: ASU 2016-02 - Leases
The Company
Recently Adopted Accounting Standards: ASU 2016-13 - Current Expected Credit Losses
In June 2016, the FASB issued ASU 2016-13, “Financial Instruments-Credit Losses (Topic 326), Measurement of Credit Losses on Financial Instruments.” ASU 2016-13 is effective for fiscal years beginning after December 15, 2022. ASU 2016-13 is intended to replace the incurred loss model for loans and other financial assets with an expected loss model, which is known as the current expected credit loss, or CECL, model. The change is intended to provide financial statement users with more decision-useful information about the expected credit losses on financial instruments and other commitments to extend credit. The measurement of expected credit losses under the CECL methodology is applicable to financial assets measured at amortized cost, including loan receivables and held-to-maturity debt securities. It also applies to off-balance sheet credit exposures such as loan commitments, standby letters of credit, financial guarantees, and other similar instruments. ASC 326 also made changes to the accounting for available-for-sale debt securities, specifically requiring credit losses for available-for-sale debt securities to be presented as an allowance rather than a write-down on available-for-sale debt securities.
The Company
F-14
THIRD COAST BANCSHARES, INC. AND SUBSIDIARY
Notes to consolidated Financial Statements
December 31, 2023 and 2022
The following table illustrates the impact of ASC 326 on the allowance for credit losses by loan category at the January 1, 2023 adoption date:
|
|
January 1, 2023 |
|
|||||||||
(Dollars in thousands) |
|
Post-ASC 326 Adoption |
|
|
Pre-ASC 326 Adoption |
|
|
Impact of ASC 326 Adoption |
|
|||
Real estate loans: |
|
|
|
|
|
|
|
|
|
|||
Non-farm non-residential owner occupied |
|
$ |
|
|
$ |
|
|
$ |
|
|||
Non-farm non-residential non-owner occupied |
|
|
|
|
|
|
|
|
|
|||
Residential |
|
|
|
|
|
|
|
|
|
|||
Construction, development & other |
|
|
|
|
|
|
|
|
|
|||
Farmland |
|
|
|
|
|
|
|
|
|
|||
Commercial & industrial |
|
|
|
|
|
|
|
|
( |
) |
||
Consumer |
|
|
|
|
|
|
|
|
|
|||
Municipal and other |
|
|
|
|
|
|
|
|
|
|||
|
|
$ |
|
|
$ |
|
|
$ |
|
|||
Recently Adopted Accounting Standards: ASU 2022-02 - Troubled Debt Restructurings and Vintage Disclosures
The Company
The amendments of this update also require that an entity disclose current-period gross write-offs by year of origination for financing receivables and net investments in leases within the scope of Subtopic 326-20, “Financial Instruments-Credit Losses-Measured at Amortized Cost.” Gross write-off information must be included in the vintage disclosures and include the amortized cost basis of the financing receivable by credit-quality indicator and the class of the financing receivable by year or origination. See Note 3 - Loans and Allowance for Credit Losses for the vintage disclosures.
Recently Issued Accounting Standards - Not Yet Adopted
In December 2023, the FASB issued ASU 2023-09, "Income Taxes (Topic 720), Improvements to Income Tax Disclosures." ASU 2023-09 is effective for fiscal years beginning after December 15, 2024. ASU 2023-09 requires disaggregated information about a reporting entity's effective tax rate reconciliation as well as information on income taxes paid. The standard is intended to benefit investors by providing more detailed income tax disclosures that would be useful in making capital allocation decisions.
Investment securities have been classified in the consolidated balance sheets according to management’s intent. Management assesses securities in its investment portfolio for impairment on a quarterly basis or when events or circumstances suggest that the carrying amount of an investment may be impaired. In accordance with ASC 326, available-for-sale securities are evaluated as of each reporting date when the fair value is less than amortized cost, and credit losses are to be calculated individually using a discounted cash flow method through which management compares the present value of the expected cash flows with the amortized costs. An allowance for credit losses is established to reflect the credit loss component of the decline in fair value.
Factors management considers in assessing whether a discounted cash flow method evaluation is needed for a security whose fair value is less than amortized costs include: (1) management will assess whether it intends to sell, or if it is more likely than not it will be required to sell, the security before recovery of the amortized cost basis; (2) the length of time (duration) and the extent (severity) to which the market value has been less than costs; (3) the financial condition and near-term prospects of the issuer, including any specific events which may influence the operations of the issuer, such as changes in technology that impair the earnings potential of the investment or the discontinuance of a segment of the business that may affect the future earnings potential; and (4) changes in the rating of the security by a rating agency.
F-15
THIRD COAST BANCSHARES, INC. AND SUBSIDIARY
Notes to consolidated Financial Statements
December 31, 2023 and 2022
The carrying amount of securities and their approximate fair values as of December 31, 2023 and 2022 are as follows:
|
|
December 31, 2023 |
|
|||||||||||||
(Dollars in thousands) |
|
Amortized |
|
|
Gross |
|
|
Gross |
|
|
Estimated |
|
||||
Investment securities available-for-sale: |
|
|
|
|
|
|
|
|
|
|
|
|
||||
U.S. government and agency securities |
|
$ |
|
|
$ |
— |
|
|
$ |
|
|
$ |
|
|||
Mortgage-backed securities and collateralized mortgage obligations |
|
|
|
|
|
|
|
|
|
|
|
|
||||
Corporate bonds |
|
|
|
|
|
|
|
|
|
|
|
|
||||
|
|
$ |
|
|
$ |
|
|
$ |
|
|
$ |
|
||||
|
|
December 31, 2022 |
|
|||||||||||||
(Dollars in thousands) |
|
Amortized |
|
|
Gross |
|
|
Gross |
|
|
Estimated |
|
||||
Investment securities available-for-sale: |
|
|
|
|
|
|
|
|
|
|
|
|
||||
State and municipal securities |
|
$ |
|
|
$ |
— |
|
|
$ |
|
|
$ |
|
|||
Mortgage-backed securities and collateralized mortgage obligations |
|
|
|
|
|
|
|
|
|
|
|
|
||||
U.S. Treasury bonds |
|
|
|
|
|
— |
|
|
|
|
|
|
|
|||
Corporate bonds |
|
|
|
|
|
|
|
|
|
|
|
|
||||
|
|
$ |
|
|
$ |
|
|
$ |
|
|
$ |
|
||||
Mortgage-backed securities are typically issued with stated principal amounts and are backed by pools of mortgages that have loans with varying maturities. The characteristics of the underlying pool of mortgages, such as prepayment risk, are passed on to the certificate holder. Accordingly, the term of mortgage-backed securities approximates the term of the underlying mortgages and can vary significantly due to prepayments. Therefore, schedules of maturities for mortgage-backed securities have been excluded from the below disclosure.
The amortized cost and estimated fair value of securities available for sale at December 31, 2023, by contractual maturity, are shown below.
|
|
December 31, 2023 |
|
|||||
|
|
Investment Securities |
|
|||||
(Dollars in thousands) |
|
Amortized |
|
|
Estimated |
|
||
Due in one year or less |
|
$ |
|
|
$ |
|
||
Due from one year to five years |
|
|
|
|
|
|
||
Due from five to ten years |
|
|
|
|
|
|
||
Over ten years |
|
|
|
|
|
|
||
|
|
|
|
|
|
|
||
Mortgage-backed securities and collateralized mortgage obligations |
|
|
|
|
|
|
||
|
|
$ |
|
|
$ |
|
||
F-16
THIRD COAST BANCSHARES, INC. AND SUBSIDIARY
Notes to consolidated Financial Statements
December 31, 2023 and 2022
The following table summarizes securities with unrealized losses at December 31, 2023 and 2022, aggregated by major security type and length of time in a continuous unrealized loss position:
|
|
December 31, 2023 |
|
|||||||||||||
(Dollars in thousands) |
|
Less Than 12 |
|
|
Greater Than 12 |
|
|
Total |
|
|
Estimated |
|
||||
Investment securities available-for-sale: |
|
|
|
|
|
|
|
|
|
|
|
|
||||
U.S. government and agency securities |
|
$ |
|
|
$ |
— |
|
|
$ |
|
|
$ |
|
|||
Mortgage-backed securities and collateralized mortgage obligations |
|
|
— |
|
|
|
|
|
|
|
|
|
|
|||
Corporate bonds |
|
|
|
|
|
|
|
|
|
|
|
|
||||
|
|
$ |
|
|
$ |
|
|
$ |
|
|
$ |
|
||||
|
|
|
|
|
|
|
|
|
|
|
|
|
||||
|
|
December 31, 2022 |
|
|||||||||||||
(Dollars in thousands) |
|
Less Than 12 |
|
|
Greater Than 12 |
|
|
Total |
|
|
Estimated |
|
||||
Investment securities available-for-sale: |
|
|
|
|
|
|
|
|
|
|
|
|
||||
State and municipal securities |
|
$ |
|
|
$ |
— |
|
|
$ |
|
|
$ |
|
|||
Mortgage-backed securities and collateralized mortgage obligations |
|
|
|
|
|
— |
|
|
|
|
|
|
|
|||
U.S. Treasury bonds |
|
|
|
|
|
— |
|
|
|
|
|
|
|
|||
Corporate bonds |
|
|
|
|
|
— |
|
|
|
|
|
|
|
|||
|
|
$ |
|
|
$ |
— |
|
|
$ |
|
|
$ |
|
|||
There were
There were
Proceeds from the sales of securities and their gross gains for the year ended December 31, 2023 were $
F-17
THIRD COAST BANCSHARES, INC. AND SUBSIDIARY
Notes to consolidated Financial Statements
December 31, 2023 and 2022
Loans in the accompanying consolidated balance sheets consisted of the following:
|
|
December 31, |
|
|||||
(Dollars in thousands) |
|
2023 |
|
|
2022 |
|
||
Real estate loans: |
|
|
|
|
|
|
||
Non-farm non-residential owner occupied |
|
$ |
|
|
$ |
|
||
Non-farm non-residential non-owner occupied |
|
|
|
|
|
|
||
Residential |
|
|
|
|
|
|
||
Construction, development & other |
|
|
|
|
|
|
||
Farmland |
|
|
|
|
|
|
||
Commercial & industrial |
|
|
|
|
|
|
||
Consumer |
|
|
|
|
|
|
||
Municipal and other |
|
|
|
|
|
|
||
|
|
|
|
|
|
|
||
Allowance for credit losses |
|
|
( |
) |
|
|
( |
) |
Loans, net |
|
$ |
|
|
$ |
|
||
Total loans are presented net of unaccreted discounts and deferred fees net of deferred costs totaling $
Non-accrual and Past Due Loans
Loans are considered past due if the required principal and interest payments have not been received as of the date such payments were due. As mentioned in Note 1, the accrual of interest on loans is discontinued when there is a clear indication that the borrower’s cash flow may not be sufficient to meet payments as they become due, which is generally when a loan is 90 days past due.
Non-accrual loans and accruing loans past due more than 90 days segregated by class of loans were as follows:
|
|
December 31, |
|
|||||||||||||
|
|
2023 |
|
|
2022 |
|
||||||||||
(Dollars in thousands) |
|
Non-accrual |
|
|
Accruing loans |
|
|
Non-accrual |
|
|
Accruing loans |
|
||||
Real estate loans: |
|
|
|
|
|
|
|
|
|
|
|
|
||||
Non-farm non-residential owner occupied |
|
$ |
|
|
$ |
— |
|
|
$ |
|
|
$ |
|
|||
Non-farm non-residential non-owner occupied |
|
|
|
|
|
— |
|
|
|
|
|
|
— |
|
||
Residential |
|
|
|
|
|
— |
|
|
|
|
|
|
— |
|
||
Construction, development & other |
|
|
|
|
|
— |
|
|
|
|
|
|
— |
|
||
Commercial & industrial |
|
|
|
|
|
|
|
|
|
|
|
|
||||
Consumer |
|
|
— |
|
|
|
— |
|
|
|
|
|
|
— |
|
|
|
|
$ |
|
|
$ |
|
|
$ |
|
|
$ |
|
||||
Of the non-accrual loans disclosed above, $
As of December 31, 2023, 2022, and 2021, the amount of income that would have been accrued for loans on non-accrual was approximately $
F-18
THIRD COAST BANCSHARES, INC. AND SUBSIDIARY
Notes to consolidated Financial Statements
December 31, 2023 and 2022
An age analysis of past due loans, segregated by class of loans, were as follows:
|
|
December 31, 2023 |
|
|||||||||||||||||||||
(Dollars in thousands) |
|
30-59 |
|
|
60-89 |
|
|
Over 90 |
|
|
Total |
|
|
Total |
|
|
Total |
|
||||||
Real estate loans: |
|
|
|
|
|
|
|
|
|
|
|
|
|
|
|
|
|
|
||||||
Non-farm non-residential |
|
$ |
— |
|
|
$ |
— |
|
|
$ |
|
|
$ |
|
|
$ |
|
|
$ |
|
||||
Non-farm non-residential |
|
|
— |
|
|
|
|
|
|
|
|
|
|
|
|
|
|
|
|
|||||
Residential |
|
|
|
|
|
|
|
|
|
|
|
|
|
|
|
|
|
|
||||||
Construction, |
|
|
|
|
|
|
|
|
|
|
|
|
|
|
|
|
|
|
||||||
Farmland |
|
|
— |
|
|
|
— |
|
|
|
— |
|
|
|
— |
|
|
|
|
|
|
|
||
Commercial & industrial |
|
|
|
|
|
|
|
|
|
|
|
|
|
|
|
|
|
|
||||||
Consumer |
|
|
|
|
|
— |
|
|
|
— |
|
|
|
|
|
|
|
|
|
|
||||
Municipal and other |
|
|
|
|
|
— |
|
|
|
— |
|
|
|
|
|
|
|
|
|
|
||||
|
|
$ |
|
|
$ |
|
|
$ |
|
|
$ |
|
|
$ |
|
|
$ |
|
||||||
|
|
December 31, 2022 |
|
|||||||||||||||||||||
(Dollars in thousands) |
|
30-59 |
|
|
60-89 |
|
|
Over 90 |
|
|
Total |
|
|
Total |
|
|
Total |
|
||||||
Real estate loans: |
|
|
|
|
|
|
|
|
|
|
|
|
|
|
|
|
|
|
||||||
Non-farm non-residential |
|
$ |
|
|
$ |
— |
|
|
$ |
|
|
$ |
|
|
$ |
|
|
$ |
|
|||||
Non-farm non-residential |
|
|
|
|
|
— |
|
|
|
|
|
|
|
|
|
|
|
|
|
|||||
Residential |
|
|
|
|
|
— |
|
|
|
|
|
|
|
|
|
|
|
|
|
|||||
Construction, |
|
|
|
|
|
— |
|
|
|
|
|
|
|
|
|
|
|
|
|
|||||
Farmland |
|
|
— |
|
|
|
— |
|
|
|
— |
|
|
|
— |
|
|
|
|
|
|
|
||
Commercial & industrial |
|
|
|
|
|
|
|
|
|
|
|
|
|
|
|
|
|
|
||||||
Consumer |
|
|
— |
|
|
|
— |
|
|
|
|
|
|
|
|
|
|
|
|
|
||||
Municipal and other |
|
|
|
|
|
— |
|
|
|
— |
|
|
|
|
|
|
|
|
|
|
||||
|
|
$ |
|
|
$ |
|
|
$ |
|
|
$ |
|
|
$ |
|
|
$ |
|
||||||
Restructured Loans and Loan Modifications
Pursuant to the
F-19
THIRD COAST BANCSHARES, INC. AND SUBSIDIARY
Notes to consolidated Financial Statements
December 31, 2023 and 2022
The table below presents the amortized cost basis of loans at period end that were both experiencing financial difficulty and modified during the year ended December 31, 2023, by class and type of modification. The percentage of the amortized cost basis of loans that were modified to borrowers in financial distress as compared to the amortized cost basis of each class of financing receivable is also presented.
|
|
December 31, 2023 |
|
|||||||||||||||||||||
|
|
Loan modifications |
|
|||||||||||||||||||||
(Dollars in thousands) |
|
Number |
|
|
Post- |
|
|
Principal forgiveness |
|
|
Adjusted |
|
|
Payment |
|
|
Combined |
|
||||||
Real estate loans: |
|
|
|
|
|
|
|
|
|
|
|
|
|
|
|
|
|
|
||||||
Commercial & industrial |
|
|
|
|
$ |
|
|
|
— |
|
|
|
— |
|
|
$ |
|
|
$ |
|
||||
|
|
|
|
|
|
|
|
|
|
|
|
|
|
|
|
|
|
|
||||||
On an ongoing basis, the performance of modified loans for borrowers experiencing financial difficulty is monitored for subsequent payment default. Payment default is recognized when the borrower is 90 days or more past due. As of December 31, 2023, there were
Impaired Loans
Prior to the adoption of ASC Topic 326 on January 1, 2023, loans were reported as impaired when, based on then current information and events, it was probable the Company would be unable to collect all amounts due in accordance with the original contractual terms of the loan agreement, including scheduled principal and interest payments. If a loan was impaired, a specific valuation allowance was allocated, if necessary, so that the loan was reported net, at the fair value of collateral if repayment was expected solely from the collateral. The following tables present impaired loans by class of loans as of December 31, 2022 as determined under ASC 310 prior to adoption of ASC 326:
|
|
December 31, 2022 |
|
|||||||||||||||||||||
(Dollars in thousands) |
|
Unpaid |
|
|
Recorded |
|
|
Recorded |
|
|
Total |
|
|
Related |
|
|
Average |
|
||||||
Real estate loans: |
|
|
|
|
|
|
|
|
|
|
|
|
|
|
|
|
|
|
||||||
Non-farm non-residential |
|
$ |
|
|
$ |
|
|
$ |
— |
|
|
$ |
|
|
$ |
— |
|
|
$ |
|
||||
Non-farm non-residential |
|
|
|
|
|
|
|
|
— |
|
|
|
|
|
|
— |
|
|
|
|
||||
Residential |
|
|
|
|
|
|
|
|
— |
|
|
|
|
|
|
— |
|
|
|
|
||||
Construction, |
|
|
|
|
|
|
|
|
— |
|
|
|
|
|
|
— |
|
|
|
|
||||
Commercial & industrial |
|
|
|
|
|
|
|
|
|
|
|
|
|
|
|
|
|
|
||||||
Consumer |
|
|
|
|
|
|
|
|
— |
|
|
|
|
|
|
— |
|
|
|
|
||||
|
|
$ |
|
|
$ |
|
|
$ |
|
|
$ |
|
|
$ |
|
|
$ |
|
||||||
Interest payments received on impaired loans are recorded as interest income unless collections of the remaining recorded investment are doubtful, at which time payments received are recorded as reductions of principal. Interest income collected on impaired loans was approximately $
Credit Quality Indicators
Credit Quality Indicators. From a credit risk standpoint, the Company classifies its loans in one of six categories: (i) pass, (ii) special mention, (iii) substandard, (iv) purchased credit deteriorated, (v) doubtful, or (vi) loss.
The classifications of loans reflect a judgment about the risks of default and loss associated with the loan. The Company reviews the ratings on credits monthly. Ratings are adjusted to reflect the degree of risk and loss that is felt to be inherent in each credit as of each monthly reporting period. The Company’s methodology is structured so that specific allocations are increased in accordance with deterioration in credit quality (and a corresponding increase in risk and loss) or decreased in accordance with improvement in credit quality (and a corresponding decrease in risk and loss).
F-20
THIRD COAST BANCSHARES, INC. AND SUBSIDIARY
Notes to consolidated Financial Statements
December 31, 2023 and 2022
(i) The Company has several pass credit grades that are assigned to loans based on varying levels of credits, ranging from credits that are secured by cash or marketable securities, to watch credits that have all the characteristics of an acceptable credit risk but warrant more than the normal level of supervision.
(ii) Special mention loans are loans that still show sufficient cash flow to service their debt but show a declining financial trend with potential cash flow shortages if trends continue. This category should be treated as a temporary grade. If cash flow deteriorates further to become negative, then a substandard grade should be given. If cash flow trends begin to improve then an upgrade back to pass would be justified. Nonfinancial reasons for rating a credit special mention include management problems, pending litigation, an ineffective loan agreement or other material structure weakness.
(iii) A substandard loan has material weakness in the primary repayment source such as insufficient cash flow from operations to service the debt. However, other weaknesses such as limited paying capacity of the obligor or the collateral pledged could justify a substandard grade. Substandard loans must have a well-defined weakness, or weaknesses that jeopardize the liquidation of the debt.
(iv) Credits purchased from third parties are recorded at their estimated fair value at the acquisition date and are classified as PCD loans if the loans reflect credit deterioration since origination and it is probable at acquisition that the Company will be unable to collect all contractually required payments. See Note 1 – Nature of Operations and Summary of Significant Accounting Policies - Certain Acquired Loans.
(v) A loan classified as doubtful has all the weaknesses of a substandard loan with the added characteristic that the weaknesses make collection or liquidation in full, on the basis of currently existing facts, conditions, and values, highly questionable and improbable. A doubtful loan has a high probability of total or substantial loss, but because of specific pending events that may strengthen the asset, its classification as loss is deferred. Doubtful borrowers are usually in default, lack adequate liquidity or capital, and lack the resources necessary to remain an operating entity. Because of high probability of loss, non-accrual status is required on doubtful loans.
(vi) Loans classified as loss are considered uncollectible and of such little value that their continuance as banking assets are not warranted. This classification does not mean that the asset has absolutely no recovery or salvage value, but rather that it is not practical or desirable to defer writing off this basically worthless asset even though partial recovery may be affected in the future. With loans classified as loss, the underlying borrowers are often in bankruptcy, have formally suspended debt repayments, or have otherwise ceased normal business operations. Once an asset is classified as loss, there is little prospect of collecting either its principal or interest. When access to collateral, rather than the value of the collateral, is a problem, a less severe classification may be appropriate. However, the Company does not maintain an asset on the balance sheet if realizing its value would require long-term litigation or other lengthy recovery efforts. Losses are to be recorded in the period an obligation becomes uncollectible.
The following tables summarize the Company’s internal ratings of its loans:
|
|
December 31, 2023 |
|
|||||||||||||||||
(Dollars in thousands) |
|
Pass |
|
|
Special |
|
|
Substandard |
|
|
Doubtful |
|
|
Total |
|
|||||
Real estate loans: |
|
|
|
|
|
|
|
|
|
|
|
|
|
|
|
|||||
Non-farm non-residential |
|
$ |
|
|
$ |
|
|
$ |
|
|
$ |
— |
|
|
$ |
|
||||
Non-farm non-residential |
|
|
|
|
|
|
|
|
|
|
|
— |
|
|
|
|
||||
Residential |
|
|
|
|
|
|
|
|
|
|
|
— |
|
|
|
|
||||
Construction, |
|
|
|
|
|
|
|
|
|
|
|
— |
|
|
|
|
||||
Farmland |
|
|
|
|
|
— |
|
|
|
|
|
|
— |
|
|
|
|
|||
Commercial & industrial |
|
|
|
|
|
|
|
|
|
|
|
|
|
|
|
|||||
Consumer |
|
|
|
|
|
— |
|
|
|
— |
|
|
|
— |
|
|
|
|
||
Municipal and other |
|
|
|
|
|
— |
|
|
|
— |
|
|
|
— |
|
|
|
|
||
|
|
$ |
|
|
$ |
|
|
$ |
|
|
$ |
|
|
$ |
|
|||||
F-21
THIRD COAST BANCSHARES, INC. AND SUBSIDIARY
Notes to consolidated Financial Statements
December 31, 2023 and 2022
|
|
December 31, 2022 |
|
|||||||||||||||||
(Dollars in thousands) |
|
Pass |
|
|
Special |
|
|
Substandard |
|
|
Doubtful |
|
|
Total |
|
|||||
Real estate loans: |
|
|
|
|
|
|
|
|
|
|
|
|
|
|
|
|||||
Non-farm non-residential |
|
$ |
|
|
$ |
|
|
$ |
|
|
$ |
— |
|
|
$ |
|
||||
Non-farm non-residential |
|
|
|
|
|
|
|
|
|
|
|
— |
|
|
|
|
||||
Residential |
|
|
|
|
|
— |
|
|
|
|
|
|
— |
|
|
|
|
|||
Construction, |
|
|
|
|
|
|
|
|
|
|
|
— |
|
|
|
|
||||
Farmland |
|
|
|
|
|
— |
|
|
|
— |
|
|
|
— |
|
|
|
|
||
Commercial & industrial |
|
|
|
|
|
|
|
|
|
|
|
— |
|
|
|
|
||||
Consumer |
|
|
|
|
|
— |
|
|
|
|
|
|
— |
|
|
|
|
|||
Municipal and other |
|
|
|
|
|
— |
|
|
|
— |
|
|
|
— |
|
|
|
|
||
|
|
$ |
|
|
$ |
|
|
$ |
|
|
$ |
— |
|
|
$ |
|
||||
F-22
THIRD COAST BANCSHARES, INC. AND SUBSIDIARY
Notes to consolidated Financial Statements
December 31, 2023 and 2022
The following tables summarize the Company's loans by risk grades, loan class and vintage, at December 31, 2023 and 2022. Gross charge-offs by origination year and loan class are also presented for the years ended December 31, 2023 and 2022.
|
|
Term Loans Amortized Cost Basis by Origination Year |
|
|
Revolving Loans Amortized |
|
|
|
|
|||||||||||||||||||||||
(Dollars in thousands) |
|
2023 |
|
|
2022 |
|
|
2021 |
|
|
2020 |
|
|
2019 |
|
|
Prior Years |
|
|
Cost Basis |
|
|
Total |
|
||||||||
December 31, 2023: |
|
|
|
|
|
|
|
|
|
|
|
|
|
|
|
|
|
|
|
|
|
|
|
|
||||||||
Real estate loans: |
|
|
|
|
|
|
|
|
|
|
|
|
|
|
|
|
|
|
|
|
|
|
|
|
||||||||
Non-farm non-residential |
|
|
|
|
|
|
|
|
|
|
|
|
|
|
|
|
|
|
|
|
|
|
|
|
||||||||
Pass |
|
$ |
|
|
$ |
|
|
$ |
|
|
$ |
|
|
$ |
|
|
$ |
|
|
$ |
|
|
$ |
|
||||||||
Special Mention |
|
|
|
|
|
|
|
|
|
|
|
— |
|
|
|
— |
|
|
|
— |
|
|
|
— |
|
|
|
|
||||
Substandard |
|
|
|
|
|
|
|
|
|
|
|
— |
|
|
|
|
|
|
|
|
|
|
|
|
|
|||||||
Total Non-farm non-residential owner-occupied |
|
$ |
|
|
$ |
|
|
$ |
|
|
$ |
|
|
$ |
|
|
$ |
|
|
$ |
|
|
$ |
|
||||||||
Non-farm non-residential |
|
|
|
|
|
|
|
|
|
|
|
|
|
|
|
|
|
|
|
|
|
|
|
|
||||||||
Pass |
|
$ |
|
|
$ |
|
|
$ |
|
|
$ |
|
|
$ |
|
|
$ |
|
|
$ |
|
|
$ |
|
||||||||
Special Mention |
|
|
|
|
|
— |
|
|
|
— |
|
|
|
|
|
|
— |
|
|
|
— |
|
|
|
— |
|
|
|
|
|||
Substandard |
|
|
— |
|
|
|
|
|
|
— |
|
|
|
— |
|
|
|
— |
|
|
|
|
|
|
— |
|
|
|
|
|||
Total Non-farm non-residential non owner-occupied |
|
$ |
|
|
$ |
|
|
$ |
|
|
$ |
|
|
$ |
|
|
$ |
|
|
$ |
|
|
$ |
|
||||||||
Residential |
|
|
|
|
|
|
|
|
|
|
|
|
|
|
|
|
|
|
|
|
|
|
|
|
||||||||
Pass |
|
$ |
|
|
$ |
|
|
$ |
|
|
$ |
|
|
$ |
|
|
$ |
|
|
$ |
|
|
$ |
|
||||||||
Special Mention |
|
|
|
|
|
— |
|
|
|
— |
|
|
|
|
|
|
— |
|
|
|
— |
|
|
|
— |
|
|
|
|
|||
Substandard |
|
|
|
|
|
|
|
|
|
|
|
— |
|
|
|
— |
|
|
|
|
|
|
— |
|
|
|
|
|||||
Total Residential |
|
$ |
|
|
$ |
|
|
$ |
|
|
$ |
|
|
$ |
|
|
$ |
|
|
$ |
|
|
$ |
|
||||||||
Construction, development & other |
|
|
|
|
|
|
|
|
|
|
|
|
|
|
|
|
|
|
|
|
|
|
|
|
||||||||
Pass |
|
$ |
|
|
$ |
|
|
$ |
|
|
$ |
|
|
$ |
|
|
$ |
|
|
$ |
|
|
$ |
|
||||||||
Special Mention |
|
|
— |
|
|
|
— |
|
|
|
|
|
|
— |
|
|
|
— |
|
|
|
— |
|
|
|
— |
|
|
|
|
||
Substandard |
|
|
|
|
|
— |
|
|
|
— |
|
|
|
— |
|
|
|
— |
|
|
|
|
|
|
— |
|
|
|
|
|||
Total Construction, development & other |
|
$ |
|
|
$ |
|
|
$ |
|
|
$ |
|
|
$ |
|
|
$ |
|
|
$ |
|
|
$ |
|
||||||||
Farmland |
|
|
|
|
|
|
|
|
|
|
|
|
|
|
|
|
|
|
|
|
|
|
|
|
||||||||
Pass |
|
$ |
|
|
$ |
|
|
$ |
|
|
$ |
|
|
$ |
|
|
$ |
|
|
$ |
|
|
$ |
|
||||||||
Substandard |
|
|
— |
|
|
|
|
|
|
— |
|
|
|
— |
|
|
|
— |
|
|
|
— |
|
|
|
— |
|
|
|
|
||
Total Farmland |
|
$ |
|
|
$ |
|
|
$ |
|
|
$ |
|
|
$ |
|
|
$ |
|
|
$ |
|
|
$ |
|
||||||||
Commercial & industrial |
|
|
|
|
|
|
|
|
|
|
|
|
|
|
|
|
|
|
|
|
|
|
|
|
||||||||
Pass |
|
$ |
|
|
$ |
|
|
$ |
|
|
$ |
|
|
$ |
|
|
$ |
|
|
$ |
|
|
$ |
|
||||||||
Special Mention |
|
|
|
|
|
|
|
|
|
|
|
|
|
|
|
|
|
|
|
|
|
|
|
|
||||||||
Substandard |
|
|
|
|
|
|
|
|
|
|
|
|
|
|
|
|
|
|
|
|
|
|
|
|
||||||||
Doubtful |
|
|
— |
|
|
|
— |
|
|
|
— |
|
|
|
— |
|
|
|
|
|
|
— |
|
|
|
— |
|
|
|
|
||
Total Commercial & industrial |
|
$ |
|
|
$ |
|
|
$ |
|
|
$ |
|
|
$ |
|
|
$ |
|
|
$ |
|
|
$ |
|
||||||||
Current period gross charge-offs |
|
$ |
— |
|
|
$ |
— |
|
|
$ |
— |
|
|
$ |
( |
) |
|
$ |
( |
) |
|
$ |
( |
) |
|
$ |
— |
|
|
$ |
( |
) |
Consumer |
|
|
|
|
|
|
|
|
|
|
|
|
|
|
|
|
|
|
|
|
|
|
|
|
||||||||
Pass |
|
$ |
|
|
$ |
|
|
$ |
|
|
$ |
|
|
$ |
|
|
$ |
|
|
$ |
|
|
$ |
|
||||||||
Total Consumer |
|
$ |
|
|
$ |
|
|
$ |
|
|
$ |
|
|
$ |
|
|
$ |
|
|
$ |
|
|
$ |
|
||||||||
Current period gross charge-offs |
|
$ |
— |
|
|
$ |
— |
|
|
$ |
— |
|
|
$ |
— |
|
|
$ |
— |
|
|
$ |
( |
) |
|
$ |
— |
|
|
$ |
( |
) |
Municipal and other |
|
|
|
|
|
|
|
|
|
|
|
|
|
|
|
|
|
|
|
|
|
|
|
|
||||||||
Pass |
|
$ |
|
|
$ |
|
|
$ |
|
|
$ |
|
|
$ |
|
|
$ |
|
|
$ |
|
|
$ |
|
||||||||
Total Municipal and other |
|
$ |
|
|
$ |
|
|
$ |
|
|
$ |
|
|
$ |
|
|
$ |
|
|
$ |
|
|
$ |
|
||||||||
Current period gross charge-offs |
|
$ |
( |
) |
|
$ |
( |
) |
|
$ |
( |
) |
|
$ |
( |
) |
|
$ |
— |
|
|
$ |
— |
|
|
$ |
— |
|
|
$ |
( |
) |
Total Loans |
|
$ |
|
|
$ |
|
|
$ |
|
|
$ |
|
|
$ |
|
|
$ |
|
|
$ |
|
|
$ |
|
||||||||
Total Charge-Offs |
|
$ |
( |
) |
|
$ |
( |
) |
|
$ |
( |
) |
|
$ |
( |
) |
|
$ |
( |
) |
|
$ |
( |
) |
|
$ |
— |
|
|
$ |
( |
) |
F-23
THIRD COAST BANCSHARES, INC. AND SUBSIDIARY
Notes to consolidated Financial Statements
December 31, 2023 and 2022
|
|
Term Loans Amortized Cost Basis by Origination Year |
|
|
Revolving Loans Amortized |
|
|
|
|
|||||||||||||||||||||||
(Dollars in thousands) |
|
2022 |
|
|
2021 |
|
|
2020 |
|
|
2019 |
|
|
2018 |
|
|
Prior Years |
|
|
Cost Basis |
|
|
Total |
|
||||||||
December 31, 2022: |
|
|
|
|
|
|
|
|
|
|
|
|
|
|
|
|
|
|
|
|
|
|
|
|
||||||||
Real estate loans: |
|
|
|
|
|
|
|
|
|
|
|
|
|
|
|
|
|
|
|
|
|
|
|
|
||||||||
Non-farm non-residential |
|
|
|
|
|
|
|
|
|
|
|
|
|
|
|
|
|
|
|
|
|
|
|
|
||||||||
Pass |
|
$ |
|
|
$ |
|
|
$ |
|
|
$ |
|
|
$ |
|
|
$ |
|
|
$ |
|
|
$ |
|
||||||||
Special Mention |
|
|
— |
|
|
|
|
|
|
— |
|
|
|
— |
|
|
|
— |
|
|
|
— |
|
|
|
— |
|
|
|
|
||
Substandard |
|
|
|
|
|
|
|
|
— |
|
|
|
|
|
|
|
|
|
|
|
|
— |
|
|
|
|
||||||
Total Non-farm non-residential owner-occupied |
|
$ |
|
|
$ |
|
|
$ |
|
|
$ |
|
|
$ |
|
|
$ |
|
|
$ |
|
|
$ |
|
||||||||
Non-farm non-residential |
|
|
|
|
|
|
|
|
|
|
|
|
|
|
|
|
|
|
|
|
|
|
|
|
||||||||
Pass |
|
$ |
|
|
$ |
|
|
$ |
|
|
$ |
|
|
$ |
|
|
$ |
|
|
$ |
|
|
$ |
|
||||||||
Special Mention |
|
|
— |
|
|
|
— |
|
|
|
|
|
|
— |
|
|
|
— |
|
|
|
— |
|
|
|
— |
|
|
|
|
||
Substandard |
|
|
|
|
|
|
|
|
— |
|
|
|
|
|
|
— |
|
|
|
|
|
|
— |
|
|
|
|
|||||
Total Non-farm non-residential non owner-occupied |
|
$ |
|
|
$ |
|
|
$ |
|
|
$ |
|
|
$ |
|
|
$ |
|
|
$ |
|
|
$ |
|
||||||||
Residential |
|
|
|
|
|
|
|
|
|
|
|
|
|
|
|
|
|
|
|
|
|
|
|
|
||||||||
Pass |
|
$ |
|
|
$ |
|
|
$ |
|
|
$ |
|
|
$ |
|
|
$ |
|
|
$ |
|
|
$ |
|
||||||||
Substandard |
|
|
— |
|
|
|
|
|
|
— |
|
|
|
— |
|
|
|
— |
|
|
|
|
|
|
— |
|
|
|
|
|||
Total Residential |
|
$ |
|
|
$ |
|
|
$ |
|
|
$ |
|
|
$ |
|
|
$ |
|
|
$ |
|
|
$ |
|
||||||||
Construction, development & other |
|
|
|
|
|
|
|
|
|
|
|
|
|
|
|
|
|
|
|
|
|
|
|
|
||||||||
Pass |
|
$ |
|
|
$ |
|
|
$ |
|
|
$ |
|
|
$ |
|
|
$ |
|
|
$ |
|
|
$ |
|
||||||||
Special Mention |
|
|
— |
|
|
|
|
|
|
— |
|
|
|
— |
|
|
|
— |
|
|
|
— |
|
|
|
— |
|
|
|
|
||
Substandard |
|
|
|
|
|
— |
|
|
|
— |
|
|
|
— |
|
|
|
— |
|
|
|
|
|
|
— |
|
|
|
|
|||
Total Construction, development & other |
|
$ |
|
|
$ |
|
|
$ |
|
|
$ |
|
|
$ |
|
|
$ |
|
|
$ |
|
|
$ |
|
||||||||
Farmland |
|
|
|
|
|
|
|
|
|
|
|
|
|
|
|
|
|
|
|
|
|
|
|
|
||||||||
Pass |
|
$ |
|
|
$ |
|
|
$ |
|
|
$ |
|
|
$ |
|
|
$ |
|
|
$ |
|
|
$ |
|
||||||||
Total Farmland |
|
$ |
|
|
$ |
|
|
$ |
|
|
$ |
|
|
$ |
|
|
$ |
|
|
$ |
|
|
$ |
|
||||||||
Commercial & industrial |
|
|
|
|
|
|
|
|
|
|
|
|
|
|
|
|
|
|
|
|
|
|
|
|
||||||||
Pass |
|
$ |
|
|
$ |
|
|
$ |
|
|
$ |
|
|
$ |
|
|
$ |
|
|
$ |
|
|
$ |
|
||||||||
Special Mention |
|
|
|
|
|
|
|
|
|
|
|
— |
|
|
|
— |
|
|
|
|
|
|
— |
|
|
|
|
|||||
Substandard |
|
|
|
|
|
|
|
|
|
|
|
|
|
|
|
|
|
|
|
|
— |
|
|
|
|
|||||||
Total Commercial & industrial |
|
$ |
|
|
$ |
|
|
$ |
|
|
$ |
|
|
$ |
|
|
$ |
|
|
$ |
|
|
$ |
|
||||||||
Current period gross charge-offs |
|
$ |
— |
|
|
$ |
— |
|
|
$ |
— |
|
|
$ |
— |
|
|
$ |
— |
|
|
$ |
( |
) |
|
$ |
( |
) |
|
$ |
( |
) |
Consumer |
|
|
|
|
|
|
|
|
|
|
|
|
|
|
|
|
|
|
|
|
|
|
|
|
||||||||
Pass |
|
$ |
|
|
$ |
|
|
$ |
|
|
$ |
|
|
$ |
|
|
$ |
|
|
$ |
|
|
$ |
|
||||||||
Substandard |
|
|
— |
|
|
|
— |
|
|
|
— |
|
|
|
— |
|
|
|
— |
|
|
|
|
|
|
— |
|
|
|
|
||
Total Consumer |
|
$ |
|
|
$ |
|
|
$ |
|
|
$ |
|
|
$ |
|
|
$ |
|
|
$ |
|
|
$ |
|
||||||||
Municipal and other |
|
|
|
|
|
|
|
|
|
|
|
|
|
|
|
|
|
|
|
|
|
|
|
|
||||||||
Pass |
|
$ |
|
|
$ |
|
|
$ |
|
|
$ |
|
|
$ |
|
|
$ |
— |
|
|
$ |
|
|
$ |
|
|||||||
Total Municipal and other |
|
$ |
|
|
$ |
|
|
$ |
|
|
$ |
|
|
$ |
|
|
$ |
— |
|
|
$ |
|
|
$ |
|
|||||||
Current period gross charge-offs |
|
$ |
— |
|
|
$ |
( |
) |
|
$ |
— |
|
|
$ |
— |
|
|
$ |
— |
|
|
$ |
— |
|
|
$ |
— |
|
|
$ |
( |
) |
Total Loans |
|
$ |
|
|
$ |
|
|
$ |
|
|
$ |
|
|
$ |
|
|
$ |
|
|
$ |
|
|
$ |
|
||||||||
Total Charge-Offs |
|
$ |
— |
|
|
$ |
( |
) |
|
$ |
— |
|
|
$ |
— |
|
|
$ |
— |
|
|
$ |
( |
) |
|
$ |
( |
) |
|
$ |
( |
) |
Allowance for Credit Losses
The allowance for credit losses on loans is a contra-asset valuation account, calculated in accordance with ASC 326, that is deducted from the amortized cost basis of loans to present the net amount expected to be collected. The amount of the allowance represents management's best estimate of current expected credit losses on loans considering available information, from internal and external sources, relevant to assessing collectability over the loans' contractual terms, adjusted for expected prepayments when appropriate. The contractual term excludes expected extensions, renewals and modifications unless (i) management has a reasonable expectation that a loan to an individual borrower that is experiencing financial difficulty will be modified or (ii) such extension or renewal options are not unconditionally cancellable by us and, in such cases, the borrower is likely to meet applicable conditions and likely to request extension or renewal. Relevant available information includes historical credit loss experience, current conditions and reasonable and supportable forecasts, including U.S. Unemployment, GDP and Case-Shiller U.S National Home Price Index. While historical credit loss experience provides the basis for the estimation of expected credit losses, adjustments to historical loss information may be made for differences in current portfolio-specific risk characteristics, environmental conditions or other relevant factors. The allowance for credit losses is measured on a collective basis for portfolios of loans when similar risk characteristics exist.
F-24
THIRD COAST BANCSHARES, INC. AND SUBSIDIARY
Notes to consolidated Financial Statements
December 31, 2023 and 2022
Credit loss expense related to loans reflects the totality of actions taken on all loans for a particular period including any necessary increases or decreases in the allowance related to changes in credit loss expectations associated with specific loans or pools of loans. Portions of the allowance may be allocated for specific credits; however, the entire allowance is available for any credit that, in management’s judgment, should be charged off. While management utilizes its best judgment and information available, the ultimate appropriateness of the allowance is dependent upon a variety of factors beyond our control, including the performance of our loan portfolio, the economy, changes in interest rates and the view of the regulatory authorities toward loan classifications.
In calculating the allowance for credit losses, most loans are segmented into pools based upon similar characteristics and risk profiles. Common characteristics and risk profiles include the type/purpose of loan, underlying collateral, geographical similarity and historical/expected credit loss patterns. In developing these loan pools for the purposes of modeling expected credit losses, we also analyzed the degree of correlation in how loans within each portfolio respond when subjected to varying economic conditions and scenarios as well as other portfolio stress factors. For modeling purposes, we use loan call report codes to identify the pools of loans with similar risk characteristics. Loans that do not share risk characteristics are evaluated for expected credit losses on an individual basis and excluded from the collective evaluation. We periodically reassess each pool to ensure the loans within the pool continue to share similar characteristics and risk profiles and to determine whether further segmentation is necessary.
We have elected to use the discounted cash flow (“DCF”) method for estimating accumulated credit losses for all loans except for consumer loans and leases. The DCF method allows for an effective incorporation of reasonable and supportable forecasts that can be applied in a consistent and objective manner. The method also aligns well with other calculations outside the accumulated credit loss estimations which mitigate model risk in other areas such as fair value or exit price notion calculations, interest rate risk calculations, profitability analysis, asset-liability management, and other forms of cash flow analysis. We have elected to use the weighted-average remaining maturity (“WARM”) method for consumer loans and leases. The long-term average loss rate is calculated and applied on a quarterly basis for the remaining life of the pool. Adjustments for economic expectations are made in the qualitative portion of the calculation. The long-term average loss rate is derived using peer data derived from the call report.
There may be certain financial assets for which the expectation of credit loss is zero after evaluating historical loss information, making necessary adjustments for current conditions and reasonable and supportable forecasts, and considering any collateral or guarantee arrangements that are not free-standing contracts. A loan that is fully secured by cash or cash equivalents, such as certificates of deposit issued by the lending institution, would likely have zero credit loss expectations. Similarly, the guaranteed portion of a Small Business Administration (SBA) loan or security purchased on the secondary market through the SBA’s fiscal and transfer agent would likely have zero credit loss expectations because these financial assets are unconditionally guaranteed by the U.S. government. Currently, the Company deducts the SBA guaranteed portion of financial assets from the individual asset balance.
Management qualitatively adjusts model results for risk factors that are not considered within our modeling processes but are nonetheless relevant in assessing the expected credit losses within our loan pools. These qualitative factors (“Q-Factor”) and other qualitative adjustments may increase or decrease management's estimate of expected credit losses by a calculated percentage or amount based upon the estimated level of risk. The various risks that may be considered in making Q-Factor and other qualitative adjustments include, among other things, the impact of (i) changes in lending policies and procedures, including changes in underwriting standards and practices for collections, write-offs, and recoveries, (ii) actual and expected changes in international, national, regional, and local economic and business conditions and developments that affect the collectability of the loan pools, (iii) changes in the nature and volume of the loan pools and in the terms of the underlying loans, (iv) changes in the experience, ability, and depth of our lending management and staff, (v) changes in volume and severity of past due financial assets, the volume of non-accrual assets, and the volume and severity of adversely classified or graded assets, (vi) changes in the quality of our credit review function, (vii) changes in the value of the underlying collateral for loans that are non-collateral dependent, (viii) the existence, growth, and effect of any concentrations of credit and (ix) other factors such as the regulatory, legal and technological environments; competition; and events such as natural disasters or health pandemics.
In some cases, management may determine that an individual loan exhibits unique risk characteristics which differentiate the loan from other loans within our loan pools. In such cases, the loans are evaluated for expected credit losses on an individual basis and excluded from the collective evaluation. Specific allocations of the allowance for credit losses are determined by analyzing the borrower’s ability to repay amounts owed, collateral deficiencies, the relative risk grade of the loan and economic conditions affecting the borrower’s industry, among other things. A loan is considered to be collateral dependent when, based upon management's assessment, the borrower is experiencing financial difficulty and repayment is expected to be provided substantially through the operation or sale of the collateral. In such cases, expected credit losses are based on the fair value of the collateral at the measurement date, adjusted for estimated selling costs if satisfaction of the loan depends on the sale of the collateral. The fair value of real estate collateral supporting collateral dependent loans is evaluated using a methodology that is consistent with the Uniform Standards of Professional Appraisal Practice. The fair value of collateral supporting non-real estate loans is based on an “as is” valuation.
F-25
THIRD COAST BANCSHARES, INC. AND SUBSIDIARY
Notes to consolidated Financial Statements
December 31, 2023 and 2022
The following table presents the qualitative and quantitative details of the allowance for credit losses on loans by portfolio segment as of December 31, 2023:
(Dollars in thousands) |
|
Non-farm non-residential |
|
|
Non-farm non-residential |
|
|
Residential |
|
|
Construction, development & other |
|
|
Farmland |
|
|
Commercial & industrial |
|
|
Consumer |
|
|
Municipal and other |
|
|
Total |
|
|||||||||
Modeled expected credit losses |
|
$ |
|
|
$ |
|
|
$ |
|
|
$ |
|
|
$ |
|
|
$ |
|
|
$ |
|
|
$ |
|
|
$ |
|
|||||||||
Q-Factor and other qualitative adjustments |
|
|
|
|
|
|
|
|
|
|
|
|
|
|
|
|
|
|
|
|
|
|
|
|
|
|
|
|||||||||
Specific allocations |
|
|
|
|
|
|
|
|
— |
|
|
|
— |
|
|
|
— |
|
|
|
|
|
|
— |
|
|
|
— |
|
|
|
|
||||
|
|
$ |
|
|
$ |
|
|
$ |
|
|
$ |
|
|
$ |
|
|
$ |
|
|
$ |
|
|
$ |
|
|
$ |
|
|||||||||
Management believes the allowance for credit losses is adequate to cover expected credit losses on loans at December 31, 2023 and 2022.
The following tables detail the activity in the allowance for credit losses by portfolio segment for the years ended December 31, 2023, 2022 and 2021:
|
|
For the Year Ended December 31, 2023 |
|
|||||||||||||||||||||
(Dollars in thousands) |
|
Beginning |
|
|
CECL adoption adjustment |
|
|
Provision for credit losses on loans |
|
|
Charge-offs |
|
|
Recoveries |
|
|
Ending |
|
||||||
Real estate loans: |
|
|
|
|
|
|
|
|
|
|
|
|
|
|
|
|
|
|
||||||
Non-farm non-residential |
|
$ |
|
|
$ |
|
|
$ |
( |
) |
|
$ |
— |
|
|
$ |
— |
|
|
$ |
|
|||
Non-farm non-residential |
|
|
|
|
|
|
|
|
( |
) |
|
|
— |
|
|
|
— |
|
|
|
|
|||
Residential |
|
|
|
|
|
|
|
|
|
|
|
— |
|
|
|
— |
|
|
|
|
||||
Construction, development & other |
|
|
|
|
|
|
|
|
|
|
|
— |
|
|
|
— |
|
|
|
|
||||
Farmland |
|
|
|
|
|
|
|
|
|
|
|
— |
|
|
|
— |
|
|
|
|
||||
Commercial & industrial |
|
|
|
|
|
( |
) |
|
|
|
|
|
( |
) |
|
|
|
|
|
|
||||
Consumer |
|
|
|
|
|
|
|
|
|
|
|
( |
) |
|
|
— |
|
|
|
|
||||
Municipal and other |
|
|
|
|
|
|
|
|
|
|
|
( |
) |
|
|
— |
|
|
|
|
||||
|
|
$ |
|
|
$ |
|
|
$ |
|
|
$ |
( |
) |
|
$ |
|
|
$ |
|
|||||
|
|
For the Year Ended December 31, 2022 |
|
|||||||||||||||||
(Dollars in thousands) |
|
Beginning |
|
|
Provision for credit losses on loans |
|
|
Charge-offs |
|
|
Recoveries |
|
|
Ending |
|
|||||
Real estate loans: |
|
|
|
|
|
|
|
|
|
|
|
|
|
|
|
|||||
Non-farm non-residential |
|
$ |
|
|
$ |
|
|
$ |
— |
|
|
$ |
— |
|
|
$ |
|
|||
Non-farm non-residential |
|
|
|
|
|
( |
) |
|
|
— |
|
|
|
— |
|
|
|
|
||
Residential |
|
|
|
|
|
|
|
|
— |
|
|
|
— |
|
|
|
|
|||
Construction, development & other |
|
|
|
|
|
|
|
|
— |
|
|
|
— |
|
|
|
|
|||
Farmland |
|
|
|
|
|
|
|
|
— |
|
|
|
— |
|
|
|
|
|||
Commercial & industrial |
|
|
|
|
|
|
|
|
( |
) |
|
|
|
|
|
|
||||
Consumer |
|
|
|
|
|
|
|
|
( |
) |
|
|
|
|
|
|
||||
Municipal and other |
|
|
|
|
|
|
|
|
— |
|
|
|
|
|
|
|
||||
|
|
$ |
|
|
$ |
|
|
$ |
( |
) |
|
$ |
|
|
$ |
|
||||
F-26
THIRD COAST BANCSHARES, INC. AND SUBSIDIARY
Notes to consolidated Financial Statements
December 31, 2023 and 2022
|
|
For the Year Ended December 31, 2021 |
|
|||||||||||||||||
(Dollars in thousands) |
|
Beginning |
|
|
Provision for |
|
|
Charge-offs |
|
|
Recoveries |
|
|
Ending |
|
|||||
Real estate loans: |
|
|
|
|
|
|
|
|
|
|
|
|
|
|
|
|||||
Non-farm non-residential |
|
$ |
|
|
$ |
|
|
$ |
— |
|
|
$ |
— |
|
|
$ |
|
|||
Non-farm non-residential |
|
|
|
|
|
|
|
|
— |
|
|
|
— |
|
|
|
|
|||
Residential |
|
|
|
|
|
( |
) |
|
|
— |
|
|
|
— |
|
|
|
|
||
Construction, development & other |
|
|
|
|
|
|
|
|
— |
|
|
|
— |
|
|
|
|
|||
Farmland |
|
|
|
|
|
|
|
|
— |
|
|
|
— |
|
|
|
|
|||
Commercial & industrial |
|
|
|
|
|
|
|
|
( |
) |
|
|
|
|
|
|
||||
Consumer |
|
|
|
|
|
( |
) |
|
|
— |
|
|
|
|
|
|
|
|||
Municipal and other |
|
|
|
|
|
|
|
|
( |
) |
|
|
|
|
|
|
||||
|
|
$ |
|
|
$ |
|
|
$ |
( |
) |
|
$ |
|
|
$ |
|
||||
The following tables summarize the allocation of the allowance for credit losses, by portfolio segment, for loans evaluated both individually and collectively for expected credit losses as of December 31, 2023 and 2022:
|
|
December 31, 2023 |
|
|||||||||
|
|
Period end amounts of ACL allocated to loans |
|
|||||||||
(Dollars in thousands) |
|
Individually |
|
|
Collectively |
|
|
Total |
|
|||
Real estate loans: |
|
|
|
|
|
|
|
|
|
|||
Non-farm non-residential owner occupied |
|
$ |
|
|
$ |
|
|
$ |
|
|||
Non-farm non-residential non-owner occupied |
|
|
|
|
|
|
|
|
|
|||
Residential |
|
|
— |
|
|
|
|
|
|
|
||
Construction, development & other |
|
|
— |
|
|
|
|
|
|
|
||
Farmland |
|
|
— |
|
|
|
|
|
|
|
||
Commercial & industrial |
|
|
|
|
|
|
|
|
|
|||
Consumer |
|
|
— |
|
|
|
|
|
|
|
||
Municipal and other |
|
|
— |
|
|
|
|
|
|
|
||
|
|
$ |
|
|
$ |
|
|
$ |
|
|||
|
|
December 31, 2022 |
|
|||||||||
|
|
Period end amounts of ACL allocated to loans |
|
|||||||||
(Dollars in thousands) |
|
Individually |
|
|
Collectively |
|
|
Total |
|
|||
Real estate loans: |
|
|
|
|
|
|
|
|
|
|||
Non-farm non-residential owner occupied |
|
$ |
— |
|
|
$ |
|
|
$ |
|
||
Non-farm non-residential non-owner occupied |
|
|
— |
|
|
|
|
|
|
|
||
Residential |
|
|
— |
|
|
|
|
|
|
|
||
Construction, development & other |
|
|
— |
|
|
|
|
|
|
|
||
Farmland |
|
|
— |
|
|
|
|
|
|
|
||
Commercial & industrial |
|
|
|
|
|
|
|
|
|
|||
Consumer |
|
|
— |
|
|
|
|
|
|
|
||
Municipal and other |
|
|
— |
|
|
|
|
|
|
|
||
|
|
$ |
|
|
$ |
|
|
$ |
|
|||
F-27
THIRD COAST BANCSHARES, INC. AND SUBSIDIARY
Notes to consolidated Financial Statements
December 31, 2023 and 2022
The company’s recorded investment in loans related to the balance in the allowance for credit losses on the basis of the Company’s expected credit loss methodology is as follows at December 31, 2023 and 2022:
|
|
December 31, 2023 |
|
|||||||||
|
|
Loans evaluated for credit losses: |
|
|||||||||
(Dollars in thousands) |
|
Individually |
|
|
Collectively |
|
|
Total |
|
|||
Real estate loans: |
|
|
|
|
|
|
|
|
|
|||
Non-farm non-residential owner occupied |
|
$ |
|
|
$ |
|
|
$ |
|
|||
Non-farm non-residential non-owner occupied |
|
|
|
|
|
|
|
|
|
|||
Residential |
|
|
|
|
|
|
|
|
|
|||
Construction, development & other |
|
|
|
|
|
|
|
|
|
|||
Farmland |
|
|
— |
|
|
|
|
|
|
|
||
Commercial & industrial |
|
|
|
|
|
|
|
|
|
|||
Consumer |
|
|
— |
|
|
|
|
|
|
|
||
Municipal and other |
|
|
— |
|
|
|
|
|
|
|
||
|
|
$ |
|
|
$ |
|
|
$ |
|
|||
|
|
December 31, 2022 |
|
|||||||||
|
|
Loans evaluated for credit losses: |
|
|||||||||
(Dollars in thousands) |
|
Individually |
|
|
Collectively |
|
|
Total |
|
|||
Real estate loans: |
|
|
|
|
|
|
|
|
|
|||
Non-farm non-residential owner occupied |
|
$ |
|
|
$ |
|
|
$ |
|
|||
Non-farm non-residential non-owner occupied |
|
|
|
|
|
|
|
|
|
|||
Residential |
|
|
|
|
|
|
|
|
|
|||
Construction, development & other |
|
|
|
|
|
|
|
|
|
|||
Farmland |
|
|
— |
|
|
|
|
|
|
|
||
Commercial & industrial |
|
|
|
|
|
|
|
|
|
|||
Consumer |
|
|
|
|
|
|
|
|
|
|||
Municipal and other |
|
|
— |
|
|
|
|
|
|
|
||
|
|
$ |
|
|
$ |
|
|
$ |
|
|||
A loan is considered to be collateral dependent when, based upon management's assessment, the borrower is experiencing financial difficulty and repayment is expected to be provided substantially through the operation or sale of the collateral. In such cases, expected credit losses are based on the fair value of the collateral at the measurement date, adjusted for estimated selling costs if satisfaction of the loan depends on the sale of the collateral.
The following table presents the amortized cost basis of collateral dependent loans which have been assessed individually for credit losses:
|
|
December 31, 2023 |
|
|||||||||||||
(Dollars in thousands) |
|
Real Estate |
|
|
Business Assets |
|
|
Other |
|
|
Total |
|
||||
Real estate loans: |
|
|
|
|
|
|
|
|
|
|
|
|
||||
Non-farm non-residential owner occupied |
|
$ |
|
|
$ |
— |
|
|
$ |
— |
|
|
$ |
|
||
Non-farm non-residential non-owner occupied |
|
|
|
|
|
— |
|
|
|
— |
|
|
|
|
||
Residential |
|
|
|
|
|
— |
|
|
|
— |
|
|
|
|
||
Construction, development & other |
|
|
|
|
|
— |
|
|
|
— |
|
|
|
|
||
Commercial & industrial |
|
|
|
|
|
|
|
|
|
|
|
|
||||
|
|
$ |
|
|
$ |
|
|
$ |
|
|
$ |
|
||||
F-28
THIRD COAST BANCSHARES, INC. AND SUBSIDIARY
Notes to consolidated Financial Statements
December 31, 2023 and 2022
Premises and equipment in the accompanying consolidated balance sheets consisted of the following:
|
|
Estimated |
|
December 31, |
|
|||||
(Dollars in thousands) |
|
Useful Life |
|
2023 |
|
|
2022 |
|
||
Building and building improvements |
|
|
$ |
|
|
$ |
|
|||
Land |
|
|
|
|
|
|
|
|
||
Equipment |
|
|
|
|
|
|
|
|||
Leasehold improvements |
|
|
|
|
|
|
|
|||
Furniture and fixtures |
|
|
|
|
|
|
|
|||
Construction in process |
|
|
|
|
|
|
|
|
||
|
|
|
|
|
|
|
|
|
||
Accumulated depreciation |
|
|
|
|
( |
) |
|
|
( |
) |
|
|
|
|
$ |
|
|
$ |
|
||
Depreciation expense for the years ended December 31, 2023, 2022 and 2021 amounted to $
Deposits in the accompanying consolidated balance sheets consisted of the following:
|
|
December 31, |
|
|||||
(Dollars in thousands) |
|
2023 |
|
|
2022 |
|
||
Transaction accounts: |
|
|
|
|
|
|
||
Noninterest bearing demand accounts |
|
$ |
|
|
$ |
|
||
Interest bearing demand accounts |
|
|
|
|
|
|
||
Savings |
|
|
|
|
|
|
||
Total transaction accounts |
|
|
|
|
|
|
||
Time deposits |
|
|
|
|
|
|
||
Total deposits |
|
$ |
|
|
$ |
|
||
The aggregate amount of time deposits in denominations of $250,000 or more totaled $
Scheduled maturities of time deposits at December 31, 2023 are as follows:
(Dollars in thousands) |
|
Maturities by Year |
|
|
2024 |
|
$ |
|
|
2025 |
|
|
|
|
2026 |
|
|
|
|
2027 |
|
|
|
|
2028 and thereafter |
|
|
|
|
|
|
$ |
|
|
At December 31, 2023 and 2022, the aggregate amount of demand deposit overdrafts that were reclassified as loans was approximately $
Deposits received from related parties at December 31, 2023 and 2022, totaled approximately $
During the years ended December 31, 2023, 2022 and 2021, the Company recorded income tax provision expense of $
F-29
THIRD COAST BANCSHARES, INC. AND SUBSIDIARY
Notes to consolidated Financial Statements
December 31, 2023 and 2022
The provision for income taxes consisted of the following:
|
|
December 31, |
|
|||||||||
(Dollars in thousands) |
|
2023 |
|
|
2022 |
|
|
2021 |
|
|||
Current income tax expense |
|
$ |
|
|
$ |
|
|
$ |
|
|||
Deferred income tax benefit |
|
|
( |
) |
|
|
( |
) |
|
|
( |
) |
Income tax expense as reported |
|
$ |
|
|
$ |
|
|
$ |
|
|||
A reconciliation of reported income tax expense to the amount computed by the Company's statutory income tax rate of
|
|
December 31, |
|
|||||||||
(Dollars in thousands) |
|
2023 |
|
|
2022 |
|
|
2021 |
|
|||
Income tax expense computed at statutory rate |
|
$ |
|
|
$ |
|
|
$ |
|
|||
Share-based compensation |
|
|
|
|
|
|
|
|
|
|||
Bank-owned life insurance |
|
|
( |
) |
|
|
( |
) |
|
|
( |
) |
Non-deductible meals, entertainment, and dues |
|
|
|
|
|
|
|
|
|
|||
Tax-exempt income |
|
|
( |
) |
|
|
( |
) |
|
|
( |
) |
Section 291 depreciation recapture |
|
|
|
|
|
|
|
|
|
|||
Other, net |
|
|
( |
) |
|
|
( |
) |
|
|
( |
) |
Income tax expense as reported |
|
$ |
|
|
$ |
|
|
$ |
|
|||
A summary of deferred taxes is presented below:
|
|
December 31, |
|
|||||
(Dollars in thousands) |
|
2023 |
|
|
2022 |
|
||
Deferred tax assets: |
|
|
|
|
|
|
||
Allowance for credit losses |
|
$ |
|
|
$ |
|
||
Accrued expenses |
|
|
|
|
|
|
||
Stock options and restricted stock |
|
|
|
|
|
|
||
Phantom stock |
|
|
|
|
|
— |
|
|
Loan purchase mark-to-market |
|
|
|
|
|
|
||
Deferred loan origination fees |
|
|
|
|
|
|
||
Net unrealized loss on investment securities available-for-sale |
|
|
|
|
|
|
||
Non-accrual interest |
|
|
|
|
|
|
||
Other |
|
|
|
|
|
|
||
Total deferred tax assets |
|
|
|
|
|
|
||
Deferred tax liabilities: |
|
|
|
|
|
|
||
Premises and equipment |
|
|
|
|
|
|
||
Goodwill and core deposit intangibles |
|
|
|
|
|
|
||
Investments |
|
|
|
|
|
|
||
Unrealized gain on derivatives |
|
|
|
|
|
|
||
Prepaid expenses and other |
|
|
|
|
|
|
||
Total deferred tax liabilities |
|
|
|
|
|
|
||
Net deferred tax asset |
|
$ |
|
|
$ |
|
||
GAAP prescribes a recognition threshold and a measurement attribute for the financial statement recognition and measurement of a tax position taken or expected to be taken in a tax return. Benefits from tax positions should be recognized in the consolidated financial statements only when it is more likely than not that the tax position will be sustained upon examination by the appropriate taxing authority that would have full knowledge of all relevant information. A tax position that meets the more-likely-than-not recognition threshold is measured at the largest amount of cumulative benefit that is greater than fifty percent likely of being realized upon ultimate settlement. Tax positions that previously failed to meet the more-likely-than-not recognition threshold should be recognized in the first subsequent financial reporting period in which that threshold is met. Previously recognized tax positions that no longer meet the more-likely-than-not recognition threshold should be derecognized in the first subsequent financial reporting period in which that threshold is no longer met. GAAP also provides guidance on the accounting for and disclosure of unrecognized tax benefits, interest and penalties.
F-30
THIRD COAST BANCSHARES, INC. AND SUBSIDIARY
Notes to consolidated Financial Statements
December 31, 2023 and 2022
FHLB Borrowings
The FHLB allows the Company to borrow on a blanket floating lien status collateralized by FHLB stock and real estate loans. As of December 31, 2023 and 2022, total borrowing capacity available under this arrangement was $
Line of Credit - Senior Debt
On September 10, 2022, the Company's $
Note Payable - Subordinated Debt
On March 31, 2022, the Company entered into Subordinated Note Purchase Agreements (the “Note Purchase Agreements”) with certain qualified institutional buyers and institutional accredited investors (the “Purchasers”) pursuant to which the Company issued and sold $
The Notes were issued under an Indenture, dated as of March 31, 2022 (the “Indenture”), by and between the Company and UMB Bank, N.A., as trustee. The Notes will mature on
On March 31, 2022, in connection with the issuance and sale of the Notes, the Company entered into Registration Rights Agreements with the Purchasers. Under the terms of the Registration Rights Agreements, the Company agreed to take certain actions to provide for the exchange of the Notes for subordinated notes that are registered under the Securities Act and have substantially the same terms as the Notes. The exchange offer under the Registration Rights Agreement was completed on July 19, 2022.
The Company may, at its option, redeem the Notes (i) in whole or in part beginning with the interest payment date on
There is no right of acceleration of maturity of the Notes in the case of default in the payment of principal of, or interest on, the Notes or in the performance of any other obligation of the Company under the Notes or the Indenture. The Indenture provides that holders of the Notes may accelerate payment of indebtedness only upon the Company’s bankruptcy, insolvency, reorganization, receivership or other similar proceedings.
F-31
THIRD COAST BANCSHARES, INC. AND SUBSIDIARY
Notes to consolidated Financial Statements
December 31, 2023 and 2022
The Notes are general unsecured, subordinated obligations of the Company and rank junior to all of its existing and future Senior Indebtedness (as defined in the Indenture), including all of its general creditors. The Notes will be equal in right of payment with any of the Company’s existing and future subordinated indebtedness and will be senior to the Company’s obligations relating to any junior subordinated debt securities. In addition, the Notes are effectively subordinated to all secured indebtedness of the Company, including without limitation, the Bank’s liabilities to depositors in connection with deposits in the Bank, to the extent of the value of the collateral securing such indebtedness.
In connection with the above offering, the Company incurred approximately $
Federal Reserve Borrower-in-Custody (BIC) Loan Pledge Arrangement
During June 2023, the Federal Reserve Bank approved the Company to begin pledging, on a blanket floating lien status, its commercial and industrial loans under a Borrower-in-Custody arrangement. The arrangement provides the Company with the ability to secure collateralized contingency funding from the Discount Window of the Federal Reserve Bank of Dallas. As of December 31, 2023, total borrowing capacity under this arrangement was $
Federal Funds Lines of Credit
At December 31, 2023 and 2022, the Company had federal funds lines of credit with commercial banks that provide for availability to borrow up to an aggregate of $
2013 Stock Option Plan
In 2008 upon shareholder approval, the Bank adopted the 2008 Stock Option Plan. In 2013 upon formation of Third Coast Bancshares, Inc., the Company adopted the 2013 Stock Option Plan (the “2013 Plan”). All outstanding options from the 2008 Stock Option Plan were grandfathered into the 2013 Plan. The 2013 Plan permits the grant of stock options for up to
2019 Omnibus Incentive Plan
On May 29, 2019, the Company’s shareholders approved the Third Coast Bancshares, Inc. 2019 Omnibus Incentive Plan (the “2019 Plan”), which was previously approved by the Company’s board of directors. Under the 2019 Plan, the Company may issue stock options, stock appreciation rights, restricted stock, restricted stock units, stock bonuses, other stock-based awards, cash awards, and dividend equivalents. On May 20, 2021, the Company’s shareholders approved an amendment to the plan such that the maximum number of shares reserved for issuance under the Plan was increased by an additional
2017 Non-Employee Director Stock Option Plan
In December 2017, the Bank adopted the 2017 Non-Employee Director Stock Option Plan (the “Director Plan”). The Director Plan originally authorized the grant of stock options for up to
F-32
THIRD COAST BANCSHARES, INC. AND SUBSIDIARY
Notes to consolidated Financial Statements
December 31, 2023 and 2022
exceed
2020 Heritage Stock Option Plan
On January 1, 2020, the Company acquired a stock option plan which originated under Heritage Bancorp, Inc. as part of a merger of the two companies. The options granted to employees must be exercised within
Stock Options
During the year ended December 31, 2023, the Company granted stock options under the 2019 Plan to certain directors, executive officers and other key employees of the Company. These options vest ratably over
The fair value of each option award is estimated on the grant date using the Black-Scholes option-pricing model with the following assumptions used for the options granted during the year ended December 31, 2023: risk-free interest rate ranging from
For the years ended December 31, 2023, 2022 and 2021, the Company recognized stock-based compensation expense of approximately $
A summary of stock option activity for years ended December 31, 2023 and 2022 is presented below:
|
|
December 31, |
|
|||||||||||||
|
|
2023 |
|
|
2022 |
|
||||||||||
|
|
Shares |
|
|
Weighted |
|
|
Shares |
|
|
Weighted |
|
||||
Outstanding at beginning of period |
|
|
|
|
$ |
|
|
|
|
|
$ |
|
||||
Granted during the period |
|
|
|
|
|
|
|
|
|
|
|
|
||||
Forfeited during the period |
|
|
( |
) |
|
|
|
|
|
( |
) |
|
|
|
||
Exercised during the period |
|
|
( |
) |
|
|
|
|
|
( |
) |
|
|
|
||
Outstanding at the end of period |
|
|
|
|
$ |
|
|
|
|
|
$ |
|
||||
Options exercisable at end of period |
|
|
|
|
$ |
|
|
|
|
|
$ |
|
||||
Weighted-average grant date fair value of options |
|
|
|
|
$ |
|
|
|
|
|
$ |
|
||||
F-33
THIRD COAST BANCSHARES, INC. AND SUBSIDIARY
Notes to consolidated Financial Statements
December 31, 2023 and 2022
A summary of weighted average remaining life is presented below:
|
|
December 31, |
|
|||||||||||||||||||||
|
|
2023 |
|
|
2022 |
|
||||||||||||||||||
Exercise Price |
|
Options Outstanding |
|
|
Weighted |
|
|
Options Exercisable |
|
|
Options Outstanding |
|
|
Weighted |
|
|
Options |
|
||||||
$ |
|
|
|
|
|
|
|
|
|
|
|
|
|
|
|
|
|
|
||||||
$ |
|
|
|
|
|
|
|
|
|
|
|
|
|
|
|
|
|
|
||||||
$ |
|
|
|
|
|
|
|
|
|
|
|
|
|
|
|
|
|
|
||||||
|
|
|
|
|
|
|
|
|
|
|
|
|
|
|
|
|
|
|
||||||
Shares issued in connection with stock compensation awards are issued from available authorized shares.
The total intrinsic value of outstanding in-the-money stock options and outstanding in-the-money exercisable stock options was $
The intrinsic value of stock options exercised during the years ended December 31, 2023, 2022 and 2021 was approximately $
A summary of the activity in the Company’s nonvested shares is as follows:
|
|
December 31, |
|
|||||||||||||
|
|
2023 |
|
|
2022 |
|
||||||||||
|
|
Shares |
|
|
Weighted |
|
|
Shares |
|
|
Weighted |
|
||||
Nonvested at January 1, |
|
|
|
|
$ |
|
|
|
|
|
$ |
|
||||
Granted during the period |
|
|
|
|
|
|
|
|
|
|
|
|
||||
Vested during the period |
|
|
( |
) |
|
|
|
|
|
( |
) |
|
|
|
||
Forfeited during the period |
|
|
( |
) |
|
|
|
|
|
( |
) |
|
|
|
||
Nonvested at end of period |
|
|
|
|
$ |
|
|
|
|
|
$ |
|
||||
For the year ended December 31, 2021, the weighted-average grant date fair value of options granted and vested during the period was $
Warrants
The Company had fully vested stock warrants issued in connection with the organization of the Company during 2013, which were exercisable over a
In connection with the preferred stock private placement on September 30, 2022, the Company issued warrants to purchase an aggregate of
F-34
THIRD COAST BANCSHARES, INC. AND SUBSIDIARY
Notes to consolidated Financial Statements
December 31, 2023 and 2022
A summary of the Company’s stock warrant activity is presented below:
|
|
December 31, |
|
|||||||||||||
|
|
2023 |
|
|
2022 |
|
||||||||||
|
|
Shares |
|
|
Weighted |
|
|
Shares |
|
|
Weighted |
|
||||
Outstanding at beginning of period |
|
|
|
|
$ |
|
|
|
|
|
$ |
|
||||
Granted |
|
|
— |
|
|
|
— |
|
|
|
|
|
|
|
||
Exercised |
|
|
( |
) |
|
|
|
|
|
— |
|
|
|
— |
|
|
Outstanding at end of period |
|
|
|
|
$ |
|
|
|
|
|
$ |
|
||||
Exercisable at end of period |
|
|
|
|
$ |
|
|
|
|
|
$ |
|
||||
Restricted Stock Awards
The Company granted restricted stock awards (“RSAs”) to certain directors, executive officers and employees of the Company. Restricted stock is common stock with certain restrictions that relate to trading and the possibility of forfeiture. Holders of restricted stock have full voting rights. Generally, the awards vest ratably over a -to-
A summary of the activity for non-vested RSAs for the years ended December 31, 2023 and 2022 is presented below:
|
|
December 31, |
|
|||||||||||||
|
|
2023 |
|
|
2022 |
|
||||||||||
|
|
Shares |
|
|
Weighted |
|
|
Shares |
|
|
Weighted |
|
||||
Nonvested at beginning of period |
|
|
|
|
$ |
|
|
|
|
|
$ |
|
||||
Granted during the period |
|
|
|
|
|
|
|
|
|
|
|
|
||||
Vested during the period |
|
|
( |
) |
|
|
|
|
|
( |
) |
|
|
|
||
Forfeited during the period |
|
|
( |
) |
|
|
|
|
|
( |
) |
|
|
|
||
Nonvested at the end of period |
|
|
|
|
$ |
|
|
|
|
|
$ |
|
||||
Operating Leases
The Company leases certain office space, and stand-alone buildings and equipment which are recognized as right-of-use (“ROU”) operating lease assets and operating lease liabilities and are included in the consolidated balance sheets. Lease liabilities represent the Company's liability to make lease payments under these leases, on a discounted basis. For leases with renewal options available, the Company evaluates each lease to determine if exercise of the renewal option is reasonably certain. As of December 31, 2023, the Company's operating lease ROU asset and operating lease liability totaled $
In order to calculate its ROU assets and lease liabilities, ASC Topic 842 requires the Company to use the rate of interest implicit in the lease when readily determinable. If the rate implicit in the lease is not readily determinable, the Company is required to use its incremental borrowing rate, which is the rate of interest the Company would have to pay to borrow on a collateralized basis over a similar term in a similar economic environment. The Company was unable to determine the implicit interest rate in any of the leases and therefore used its incremental borrowing rate.
As of December 31, 2023, the weighted-average discount rate for the Company's operating leases was
F-35
THIRD COAST BANCSHARES, INC. AND SUBSIDIARY
Notes to consolidated Financial Statements
December 31, 2023 and 2022
Lease costs for the period shown below were as follows:
|
|
December 31, |
|
|||||||||
(Dollars in thousands) |
|
2023 |
|
|
2022 |
|
|
2021 |
|
|||
Operating lease cost |
|
$ |
|
|
$ |
|
|
$ |
|
|||
Short-term lease cost |
|
|
|
|
|
|
|
|
— |
|
||
Total lease cost |
|
$ |
|
|
$ |
|
|
$ |
|
|||
Total operating lease expense for the years ended December 31, 2023, 2022 and 2021 was $
A schedule of the Company's lease liabilities by contractual maturity for operating leases with initial or remaining terms in excess of one year for each year through 2028 and thereafter is presented below:
(Dollars in thousands) |
|
Operating Lease Maturities |
|
|
2024 |
|
$ |
|
|
2025 |
|
|
|
|
2026 |
|
|
|
|
2027 |
|
|
|
|
2028 and thereafter |
|
|
|
|
Total undiscounted lease liability |
|
|
|
|
Less: Discount on cash flows |
|
|
( |
) |
Leases signed, but not yet commenced |
|
|
( |
) |
Total operating lease liability |
|
$ |
|
|
The Company is a party to financial instruments with off-balance sheet risk in the normal course of business to meet the financing needs of its customers. These financial instruments include commitments to extend credit and standby letters of credit. Those instruments involve, to varying degrees, elements of credit and interest rate risk in excess of the amount recognized in the balance sheet.
The Company’s exposure to credit loss in the event of nonperformance by the other party to the financial instrument for unfunded lines of credit, commitments to extend credit and standby letters of credit is represented by the contractual notional amount of these instruments. The Company generally uses the same credit policies in making commitments and conditional obligations as it does for on-balance sheet instruments.
The following financial instruments were outstanding whose contract amounts represent credit risk:
|
|
December 31, |
|
|||||
(Dollars in thousands) |
|
2023 |
|
|
2022 |
|
||
Commitments to extend credit |
|
$ |
|
|
$ |
|
||
Standby letters of credit |
|
|
|
|
|
|
||
Total |
|
$ |
|
|
$ |
|
||
Commitments to extend credit are agreements to lend to a customer as long as there is no violation of any condition established in the contract. Commitments generally have fixed expiration dates or other termination clauses and may require payment of a fee. Since many of the commitments may expire without being drawn upon, the total commitment amounts do not necessarily represent future cash requirements. Management evaluates each customer’s credit-worthiness on a case-by-case basis. The amount of collateral obtained, if deemed necessary upon extension of credit, is based on management’s credit evaluation of the borrower.
Standby letters of credit are conditional commitments issued by the Bank to guarantee the performance of a customer to a third party. Standby letters of credit generally have fixed expiration dates or other termination clauses and may require payment of a fee. The credit risk involved in issuing letters of credit is essentially the same as that involved in extending loan facilities to customers. The Bank's policy for obtaining collateral and the nature of such collateral is essentially the same as that involved in making commitments to extend credit.
F-36
THIRD COAST BANCSHARES, INC. AND SUBSIDIARY
Notes to consolidated Financial Statements
December 31, 2023 and 2022
The allowance for credit losses on off-balance-sheet credit exposures is a liability account, calculated in accordance with ASC 326, representing expected credit losses over the contractual period for which we are exposed to credit risk resulting from a contractual obligation to extend credit. Off-balance sheet credit exposures primarily consist of amounts available under outstanding lines of credit and letters of credit detailed in the table above, less those obligations which the Company has the unconditional right to cancel. No allowance is recognized if the issuer has an unconditional right to cancel the obligation. The amount of the allowance represents management's best estimate of expected credit losses on commitments expected to be funded over the contractual life of the commitment. At December 31, 2023, the allowance for credit losses related to off-balance sheet exposures was $
GAAP defines fair value as the price that would be received to sell an asset or paid to transfer a liability in an orderly transaction between market participants. A fair value measurement assumes that the transaction to sell the asset or transfer the liability occurs in the principal market for the asset or liability or, in the absence of a principal market, the most advantageous market for the asset or liability. The price in the principal (or most advantageous) market used to measure the fair value of the asset or liability shall not be adjusted for transaction costs. An orderly transaction is a transaction that assumes exposure to the market for a period prior to the measurement date to allow for marketing activities that are usual and customary for transactions involving such assets and liabilities; it is not a forced transaction. Market participants are buyers and sellers in the principal market that are (i) independent, (ii) knowledgeable, (iii) able to transact and (iv) willing to transact.
GAAP requires the use of valuation techniques that are consistent with the market approach, the income approach and/or the cost approach. The market approach uses prices and other relevant information generated by market transactions involving identical or comparable assets and liabilities. The income approach uses valuation techniques to convert future amounts, such as cash flows or earnings, to a single present amount on a discounted basis. The cost approach is based on the amount that currently would be required to replace the service capacity of an asset (replacement costs). Valuation techniques should be consistently applied. Inputs to valuation techniques refer to the assumptions that market participants would use in pricing the asset or liability. Inputs may be observable, meaning those that reflect the assumptions market participants would use in pricing the asset or liability developed based on market data obtained from independent sources, or unobservable, meaning those that reflect the reporting entity’s own assumptions about the assumptions market participants would use in pricing the asset or liability developed based on the best information available in the circumstances. In that regard, the authoritative guidance establishes a fair value hierarchy for valuation inputs that gives the highest priority to quoted prices in active markets for identical assets or liabilities and the lowest priority to unobservable inputs.
The fair value hierarchy is as follows:
In general, fair value is based upon quoted market prices, where available. If such quoted market prices are not available, fair value is based upon internally developed models that primarily use, as inputs, observable market-based parameters. Valuation adjustments may be made to ensure that financial instruments are recorded at fair value. While management believes the Company’s valuation methodologies are appropriate and consistent with other market participants, the use of different methodologies or assumptions to determine the fair value of certain financial instruments could result in a different estimate of fair value at the reporting date.
Financial assets and financial liabilities measured at fair value on a recurring and nonrecurring basis include the following:
Investment Securities Available-for-sale. Investment securities classified as available-for-sale are reported at fair value utilizing Level 2 inputs. For these securities, the Company obtains fair value measurements from an independent pricing service. The fair value measurements consider observable data that may include dealer quotes, market spreads, cash flows, the U.S. Treasury yield curve, live trading levels, trade execution data, market consensus prepayments speeds, credit information, and the bond’s terms and conditions, among other things.
F-37
THIRD COAST BANCSHARES, INC. AND SUBSIDIARY
Notes to consolidated Financial Statements
December 31, 2023 and 2022
Loans Held for Sale. Loans held for sale are reported at aggregate cost which has been deemed to be the equivalent of fair value using Level 3 inputs.
Loans Evaluated Individually for Expected Credit Losses. Individually evaluated loans are reported at the estimated fair value of the underlying collateral. Collateral values are estimated using Level 2 inputs based on observable market data or independent appraisals using Level 3 inputs.
Derivative Instruments. The estimated fair value of interest rate derivative positions are obtained from a pricing service that provides the swaps’ unwind value using Level 2 inputs.
There were
The following table summarizes financial assets and financial liabilities measured at fair value on a recurring basis, segregated by the level of the valuation inputs within the fair value hierarchy utilized to measure fair value as of December 31, 2023 and 2022:
|
|
Fair Value Measurements Using |
|
|
|
|
||||||||||
(Dollars in thousands) |
|
Level 1 Inputs |
|
|
Level 2 Inputs |
|
|
Level 3 Inputs |
|
|
Total Fair Value |
|
||||
At December 31, 2023: |
|
|
|
|
|
|
|
|
|
|
|
|
||||
Investment securities available-for-sale: |
|
|
|
|
|
|
|
|
|
|
|
|
||||
U.S. government and agency securities |
|
$ |
— |
|
|
$ |
|
|
$ |
— |
|
|
$ |
|
||
Mortgage-backed securities and collateralized mortgage obligations |
|
|
— |
|
|
|
|
|
|
— |
|
|
|
|
||
Corporate bonds |
|
|
— |
|
|
|
|
|
|
— |
|
|
|
|
||
Total investment securities available-for-sale |
|
$ |
— |
|
|
$ |
|
|
$ |
— |
|
|
$ |
|
||
Derivative assets: |
|
|
|
|
|
|
|
|
|
|
|
|
||||
Pass-through interest rate swaps |
|
$ |
— |
|
|
$ |
|
|
$ |
— |
|
|
$ |
|
||
Risk participation agreements |
|
|
— |
|
|
|
|
|
|
— |
|
|
|
|
||
Pay-fixed interest rate swaps |
|
|
— |
|
|
|
|
|
|
— |
|
|
|
|
||
Total derivative assets |
|
$ |
— |
|
|
$ |
|
|
$ |
— |
|
|
$ |
|
||
Derivative liabilities: |
|
|
|
|
|
|
|
|
|
|
|
|
||||
Cash flow hedges |
|
$ |
— |
|
|
$ |
|
|
$ |
— |
|
|
$ |
|
||
Interest rate swaps |
|
$ |
— |
|
|
$ |
|
|
$ |
— |
|
|
$ |
|
||
Risk participation agreements |
|
|
— |
|
|
|
|
|
|
— |
|
|
|
|
||
Pay-fixed interest rate swaps |
|
|
— |
|
|
|
|
|
|
— |
|
|
|
|
||
Total derivative liabilities |
|
$ |
— |
|
|
$ |
|
|
$ |
— |
|
|
$ |
|
||
|
|
Fair Value Measurements Using |
|
|
|
|
||||||||||
(Dollars in thousands) |
|
Level 1 Inputs |
|
|
Level 2 Inputs |
|
|
Level 3 Inputs |
|
|
Total Fair Value |
|
||||
At December 31, 2022: |
|
|
|
|
|
|
|
|
|
|
|
|
||||
Investment securities available-for-sale: |
|
|
|
|
|
|
|
|
|
|
|
|
||||
State and municipal securities |
|
$ |
— |
|
|
$ |
|
|
$ |
— |
|
|
$ |
|
||
Mortgage-backed securities and collateralized mortgage obligations |
|
|
— |
|
|
|
|
|
|
— |
|
|
|
|
||
U.S. Treasury bonds |
|
|
— |
|
|
|
|
|
|
— |
|
|
|
|
||
Corporate bonds |
|
|
— |
|
|
|
|
|
|
— |
|
|
|
|
||
Total investment securities available-for-sale |
|
$ |
— |
|
|
$ |
|
|
$ |
— |
|
|
$ |
|
||
Derivative assets: |
|
|
|
|
|
|
|
|
|
|
|
|
||||
Interest rate swaps |
|
$ |
— |
|
|
$ |
|
|
$ |
— |
|
|
$ |
|
||
Total derivative assets |
|
$ |
— |
|
|
$ |
|
|
$ |
— |
|
|
$ |
|
||
Derivative liabilities: |
|
|
|
|
|
|
|
|
|
|
|
|
||||
Interest rate swaps |
|
$ |
— |
|
|
$ |
|
|
$ |
— |
|
|
$ |
|
||
Risk participation agreements |
|
|
— |
|
|
|
|
|
|
— |
|
|
|
|
||
Total derivative liabilities |
|
$ |
— |
|
|
$ |
|
|
$ |
— |
|
|
$ |
|
||
Certain financial assets and financial liabilities are measured at fair value on a nonrecurring basis, that is, the instruments are not measured at fair value on an ongoing basis but are subject to fair value adjustments in certain circumstances (for example, when there is evidence of impairment). Financial assets and financial liabilities measured at fair value on a non-recurring basis include the following at December 31, 2023 and 2022:
F-38
THIRD COAST BANCSHARES, INC. AND SUBSIDIARY
Notes to consolidated Financial Statements
December 31, 2023 and 2022
Loans Evaluated Individually for Expected Credit Losses. At December 31, 2023, collateral dependent loans with carrying values of $
Non-financial assets measured at fair value on a non-recurring basis include certain foreclosed assets which, upon initial recognition, were remeasured and reported at fair value through a charge-off to the allowance for credit losses and certain foreclosed assets which, subsequent to their initial recognition, were remeasured at fair value through a write-down included in current earnings. The fair value of a foreclosed asset is estimated using Level 2 inputs based on observable market data or Level 3 inputs based on customized discounting criteria. The Company had
For the Company, as for most financial institutions, substantially all its assets and liabilities are considered financial instruments as defined. Many of the Company’s financial instruments, however, lack an available trading market as characterized by a willing buyer and willing seller engaging in an exchange transaction.
The estimated fair value amounts of financial instruments have been determined by the Company using available market information and appropriate valuation methodologies. However, considerable judgment is required to interpret data to develop the estimates of fair value. Accordingly, the estimates presented herein are not necessarily indicative of the amounts the Company could realize in a current market exchange. The use of different market assumptions and/or estimation methodologies may have a material effect on the estimated fair value amounts. In addition, reasonable comparability between financial institutions may not be likely due to the wide range of permitted valuation techniques and numerous estimates that must be made given the absence of active secondary markets for many of the financial instruments. This lack of uniform valuation methodologies also introduces a greater degree of subjectivity to these estimated fair values.
Financial instruments with stated maturities have been valued using a present value discounted cash flow with a discount rate approximating current market rates for similar assets and liabilities. Financial instrument assets with variable rates and financial instrument liabilities with no stated maturities have an estimated fair value equal to both the amount payable on demand and the carrying value.
The carrying value and the estimated fair value of the Company’s contractual off-balance sheet unfunded lines of credit, loan commitments and letters of credit are generally priced at market at the time of funding.
The estimated fair values and carrying values of all financial instruments under current authoritative guidance, segregated by the level of the valuation inputs within the fair value hierarchy utilized to measure fair value are as follows:
|
December 31, 2023 |
|
|
December 31, 2022 |
|
||||||||||
(Dollars in thousands) |
Carrying |
|
|
Estimated |
|
|
Carrying |
|
|
Estimated |
|
||||
Financial assets |
|
|
|
|
|
|
|
|
|
|
|
||||
Level 2 inputs |
|
|
|
|
|
|
|
|
|
|
|
||||
Cash and cash equivalents |
$ |
|
|
$ |
|
|
$ |
|
|
$ |
|
||||
Investment securities available-for-sale |
|
|
|
|
|
|
|
|
|
|
|
||||
Non-marketable securities |
|
|
|
|
|
|
|
|
|
|
|
||||
Accrued interest receivable |
|
|
|
|
|
|
|
|
|
|
|
||||
Bank-owned life insurance |
|
|
|
|
|
|
|
|
|
|
|
||||
Derivative assets |
|
|
|
|
|
|
|
|
|
|
|
||||
|
$ |
|
|
$ |
|
|
$ |
|
|
$ |
|
||||
Level 3 inputs |
|
|
|
|
|
|
|
|
|
|
|
||||
Loans, net |
$ |
|
|
$ |
|
|
$ |
|
|
$ |
|
||||
Financial liabilities |
|
|
|
|
|
|
|
|
|
|
|
||||
Level 2 inputs |
|
|
|
|
|
|
|
|
|
|
|
||||
Deposits |
$ |
|
|
$ |
|
|
$ |
|
|
$ |
|
||||
Accrued interest payable |
|
|
|
|
|
|
|
|
|
|
|
||||
Note payable and line of credit |
|
|
|
|
|
|
|
|
|
|
|
||||
Derivative liabilities |
|
|
|
|
|
|
|
|
|
|
|
||||
|
$ |
|
|
$ |
|
|
$ |
|
|
$ |
|
||||
F-39
THIRD COAST BANCSHARES, INC. AND SUBSIDIARY
Notes to consolidated Financial Statements
December 31, 2023 and 2022
The Company’s principal business activities are with customers primarily located within Texas. Such customers are normally also depositors of the Company. In addition, the Company employs a national wholesale deposit strategy to attract and maintain large, relatively low-cost stable deposits through a number of core, fiduciary and institutional deposit programs.
The distribution of commitments to extend credit approximates the distribution of loans outstanding. The contractual amounts of credit related financial instruments such as commitments to extend credit and credit card arrangements represent the amounts of potential accounting loss should the contract be fully drawn upon, the customer default, and the value of any existing collateral become worthless.
At December 31, 2023 and 2022, the Company had federal funds sold aggregating approximately $
In 2009, the Company adopted the Third Coast Bank, SSB 401(k) Plan (the “Plan”) covering substantially all employees. Employees may elect to defer a percentage of their compensation subject to certain limits based on federal tax laws. The Company may make a discretionary match of employees’ contributions based on a percentage of salary contributed by participants.
Effective January 1, 2018, discretionary contributions made by the Company were invested in the common stock of the Company in accordance with the Third Coast Bank, SSB Employee Stock Ownership Plan (“ESOP”), which was established and became effective on January 1, 2018 for the exclusive benefit of the participants and their beneficiaries. Benefits under the ESOP generally were distributed in the form of cash. In addition, until the Company’s common stock was actively traded on an established securities market, the participant could demand (in accordance with the terms of the ESOP and applicable laws) that the Company repurchase shares of common stock distributed to the participant at the estimated fair value. This put option terminated upon the consummation of the Company's initial public offering (“IPO”) and listing of its common stock on the Nasdaq Global Select Market in November 2021.
Prior to the IPO, the fair value of shares of common stock held by the ESOP was deducted from permanent shareholders’ equity in the consolidated balance sheets, and was reflected in a line item below liabilities and above shareholders’ equity. This presentation was necessary in order to recognize the put option within the ESOP, consistent with SEC guidelines, because the Company was not publicly traded. At December 31, 2021, the $
ESOP Plan Merged Into 401-K Plan
Effective July 1, 2022, the Company merged the ESOP into the Plan, herein known as the Third Coast Bank, SSB 401(k) and Employee Stock Ownership Plan (the “Merged Plan”). In connection with the plan merger on July 1, 2022, the Company registered an aggregate of
For the years ended December 31, 2023 and 2022, Company contributions to the Merged Plan were approximately $
For the year ended December 31, 2021, Company contributions to the ESOP, and administrative expenses related to the ESOP and the Plan were approximately $
Phantom Stock Appreciation Plan
On May 3, 2023, the Board of Directors approved the Third Coast Bancshares, Inc. Phantom Stock Appreciation Plan (the “Phantom Stock Plan”). Under the Phantom Stock Plan, participants are granted phantom stock units (“PSUs”) which vest ratably over a three-year period through March 15, 2026. The PSU confers to the participant the benefits of owning stock without the actual ownership or transfer of shares. Each stock unit entitles the participant to receive, upon vesting of each PSU, an amount equal to the sum of (a) the opening value and (b) the bonus amounts applicable to each PSU, as calculated pursuant to the terms of the Phantom Stock Plan and the Award Agreement. Settlement is payable to participants within
F-40
THIRD COAST BANCSHARES, INC. AND SUBSIDIARY
Notes to consolidated Financial Statements
December 31, 2023 and 2022
The Phantom Stock Plan is an unfunded plan whereby benefits are paid by the Company from its general assets, and participants have the rights of a general, unsecured creditor against the Company for any payments due hereunder. If a participant ceases, for any reason other than death or disability, to be a service provider, then the participant forfeits all rights to his or her outstanding PSUs. If the participant ceases to be a service provider due to the participant’s death or disability, then all unvested PSUs become fully vested on the date the participant ceases to be a service provider. For the year ended December 31, 2023, the Company had expensed $
During the normal course of business, the Company may enter into transactions with significant stockholders, directors and principal officers and their affiliates (collectively referred to herein as “related parties”). It is the Company’s policy that all such transactions are on substantially the same terms as those prevailing at the time for comparable transactions with third parties. At December 31, 2023 and 2022, the aggregate amount of loans to related parties was approximately $
Amendment to Certificate of Formation
On May 25, 2023, the shareholders of the Company approved the amendment and restatement (the “Amendment”) of Article VI of the Company's first amended and restated certificate of formation to authorize a new class of non-voting common stock, par value $
Preferred Stock
On September 30, 2022, the Company adopted resolutions creating Series A Convertible Non-Cumulative Preferred Stock (“Series A Preferred Stock”) and Series B Convertible Perpetual Preferred Stock, with
Preferred Stock - Private Placement
On September 30, 2022, the Company completed a private placement of (i)
The securities sold in the private placement were sold only to accredited investors and were issued without registration under the Securities Act, in reliance upon the exemption provided under Section 4(a)(2) of the Securities Act and Regulation D promulgated thereunder as securities offered and sold only to accredited investors (as defined in Rule 501(a) of Regulation D under the Securities Act) in a transaction not involving any public offering. Officers and directors of the Company purchased $
Regulatory Matters
The Bank is subject to various regulatory capital requirements administered by the federal banking agencies. Failure to meet minimum capital requirements can initiate certain mandatory (and possibly additional discretionary) actions by regulators that, if undertaken, could have a direct material effect on the Company’s consolidated financial statements. Under capital adequacy guidelines and the regulatory framework for prompt corrective action, the Bank must meet specific capital guidelines that involve quantitative measures of the Bank’s assets, liabilities, and certain off-balance sheet items as calculated under regulatory accounting practices. The Bank’s capital amounts and classification are also subject to qualitative judgments by the regulators about components, risk weightings and other factors.
Quantitative measures established by regulation to ensure capital adequacy require the Bank to maintain minimum amounts and ratios (set forth in the table below) of total, Tier 1 capital, and Common Equity Tier 1 capital (as defined in the regulations) to risk-weighted
F-41
THIRD COAST BANCSHARES, INC. AND SUBSIDIARY
Notes to consolidated Financial Statements
December 31, 2023 and 2022
assets (as defined), and of Tier 1 capital (as defined) to average assets (as defined). Management believes, as of December 31, 2023 and 2022 the Bank meets all capital adequacy requirements to which it is subject.
Financial institutions are categorized as well capitalized or adequately capitalized, based on minimum total risk-based, Tier 1 risk-based and Tier 1 leverage ratios as set forth in the tables below. As shown below, the Bank’s capital ratios exceed the regulatory definition of well capitalized as of December 31, 2023 and 2022. Based upon the information in its most recently filed call report, the Bank continues to meet the capital ratios necessary to be well capitalized under the regulatory framework for prompt corrective action.
There are no conditions or events since December 31, 2023, that management believes have changed the Bank’s category.
A comparison of the Bank’s actual capital amounts and ratios to required capital amounts and ratios are presented in the following table. The Company began reporting ratios beginning March 31, 2023 in accordance with the regulatory framework. Capital levels required to be well capitalized are based upon prompt corrective action regulations, as amended, to reflect the changes under the Basel III Capital Rules.
|
|
Actual |
|
|
For Capital Adequacy |
|
|
To Be Well Capitalized |
|
|||||||||||||||||||
(Dollars in thousands) |
|
Amount |
|
|
Ratio |
|
|
Amount |
|
|
Ratio |
|
|
Amount |
|
|
Ratio |
|
||||||||||
THIRD COAST BANCSHARES, INC. |
|
|
|
|
|
|
|
|
|
|
|
|
|
|
|
|
|
|
|
|
|
|
||||||
(Consolidated) |
|
|
|
|
|
|
|
|
|
|
|
|
|
|
|
|
|
|
|
|
|
|
||||||
As of December 31, 2023: |
|
|
|
|
|
|
|
|
|
|
|
|
|
|
|
|
|
|
|
|
|
|
||||||
Total capital (to risk weighted assets) |
|
$ |
|
|
|
% |
|
≥ |
$ |
|
|
≥ |
|
% |
|
|
N/A |
|
|
|
N/A |
|
||||||
Tier 1 capital (to risk weighted assets) |
|
$ |
|
|
|
% |
|
≥ |
$ |
|
|
≥ |
|
% |
|
|
N/A |
|
|
|
N/A |
|
||||||
Tier 1 capital (to average assets) |
|
$ |
|
|
|
% |
|
≥ |
$ |
|
|
≥ |
|
% |
|
|
N/A |
|
|
|
N/A |
|
||||||
Common equity tier 1 (to risk weighted assets) |
|
$ |
|
|
|
% |
|
≥ |
$ |
|
|
≥ |
|
% |
|
|
N/A |
|
|
|
N/A |
|
||||||
THIRD COAST BANK, SSB |
|
|
|
|
|
|
|
|
|
|
|
|
|
|
|
|
|
|
|
|
|
|
||||||
As of December 31, 2023: |
|
|
|
|
|
|
|
|
|
|
|
|
|
|
|
|
|
|
|
|
|
|
||||||
Total capital (to risk weighted assets) |
|
$ |
|
|
|
% |
|
≥ |
$ |
|
|
≥ |
|
% |
|
≥ |
$ |
|
|
≥ |
|
% |
||||||
Tier 1 capital (to risk weighted assets) |
|
$ |
|
|
|
% |
|
≥ |
$ |
|
|
≥ |
|
% |
|
≥ |
$ |
|
|
≥ |
|
% |
||||||
Tier 1 capital (to average assets) |
|
$ |
|
|
|
% |
|
≥ |
$ |
|
|
≥ |
|
% |
|
≥ |
$ |
|
|
≥ |
|
% |
||||||
Common equity tier 1 (to risk weighted assets) |
|
$ |
|
|
|
% |
|
≥ |
$ |
|
|
≥ |
|
% |
|
≥ |
$ |
|
|
≥ |
|
% |
||||||
As of December 31, 2022: |
|
|
|
|
|
|
|
|
|
|
|
|
|
|
|
|
|
|
|
|
|
|
||||||
Total capital (to risk weighted assets) |
|
$ |
|
|
|
% |
|
≥ |
$ |
|
|
≥ |
|
% |
|
≥ |
$ |
|
|
≥ |
|
% |
||||||
Tier 1 capital (to risk weighted assets) |
|
$ |
|
|
|
% |
|
≥ |
$ |
|
|
≥ |
|
% |
|
≥ |
$ |
|
|
≥ |
|
% |
||||||
Tier 1 capital (to average assets) |
|
$ |
|
|
|
% |
|
≥ |
$ |
|
|
≥ |
|
% |
|
≥ |
$ |
|
|
≥ |
|
% |
||||||
Common equity tier 1 (to risk weighted assets) |
|
$ |
|
|
|
% |
|
≥ |
$ |
|
|
≥ |
|
% |
|
≥ |
$ |
|
|
≥ |
|
% |
||||||
Basic earnings per common share is computed by dividing net earnings allocated to common stock by the weighted-average number of common shares outstanding during the applicable period. Diluted earnings per common share is computed by using the net earnings allocated to common stock plus dividends on dilutive convertible preferred stock, divided by the sum of 1) the weighted-average number of shares determined for the basic earnings per common share computation, 2) the dilutive effect of stock compensation using the treasury stock method, and 3) the dilutive effect of convertible preferred stock using the if-converted method. At December 31, 2022, the dilutive effects of convertible preferred stock were excluded from diluted earnings per share due to their anti-dilutive effects on the computation.
F-42
THIRD COAST BANCSHARES, INC. AND SUBSIDIARY
Notes to consolidated Financial Statements
December 31, 2023 and 2022
The following table presents a reconciliation of net income available to common shareholders and the number of shares used in the calculation of basic and diluted earnings per common share shown on the consolidated statements of income.
|
|
For the Years Ended December 31, |
|
|||||||||
(Dollars in thousands, except share and per share data) |
|
2023 |
|
|
2022 |
|
|
2021 |
|
|||
Net income |
|
$ |
|
|
$ |
|
|
$ |
|
|||
Less dividends declared, Preferred Series A stock |
|
|
|
|
|
|
|
|
— |
|
||
Net income available to common shareholders |
|
$ |
|
|
$ |
|
|
$ |
|
|||
Weighted-average shares outstanding for basic earnings per common share |
|
|
|
|
|
|
|
|
|
|||
Dilutive effect of stock compensation |
|
|
|
|
|
|
|
|
|
|||
Dilutive effect of Preferred Series A stock |
|
|
|
|
|
— |
|
|
|
— |
|
|
Weighted-average shares outstanding for diluted earnings per common share |
|
|
|
|
|
|
|
|
|
|||
Basic earnings per share |
|
$ |
|
|
$ |
|
|
$ |
|
|||
Diluted earnings per share |
|
$ |
|
|
$ |
|
|
$ |
|
|||
Cash Flow Hedges
As part of its hedging strategy, the Company entered into two
During March 2023 and as part of its hedging strategy, the Company entered into a
During July 2022 and as part of its hedging strategy, the Company entered into a
On February 18, 2021, a $
For the years ended December 31, 2023, 2022 and 2021, approximately $
Fair Value Hedges
The Company offers certain interest rate swap products directly to its qualified commercial banking customers. These financial instruments are not designated as hedging instruments. The interest rate swap derivative positions relate to transactions in which the Company enters into an interest rate swap with a customer, while at the same time entering into an offsetting interest rate swap with another financial institution. An interest rate swap transaction allows customers to effectively convert a variable rate loan to a fixed rate. In connection with each swap, the Company agrees to pay interest on a notional amount at a variable interest rate and receive interest from the customer on a similar notional amount at a fixed interest rate. At the same time, the Company agrees to pay another financial institution the same fixed interest rate on the same notional amount and receive the same variable interest rate on the same notional amount.
Because the Company acts as an intermediary for its customer, changes in the fair value of the underlying derivative contracts are designed to offset each other and would not significantly impact the Company’s operating results except in certain situations where there is a significant deterioration in the customer’s credit worthiness or that of the counterparties. At December 31, 2023, no such deterioration was determined by management.
F-43
THIRD COAST BANCSHARES, INC. AND SUBSIDIARY
Notes to consolidated Financial Statements
December 31, 2023 and 2022
The Company also offers one-way interest rate swap products to its customers. Under this type of arrangement, the Company extends a conventional fixed-rate loan to the borrower and then subsequently hedges the interest rate risk of that loan by entering into a swap for its own balance sheet to convert the fixed-rate loan to a synthetic floating rate asset. These types of swaps lock in the Company's spread over its cost of funds for the life of the loan.
For some of its loan participation facilities, the Company enters into RPAs with other banks in order to hedge or share a portion of the risk of borrower default related to the interest rate swap on a participated loan.
All derivatives are carried at fair value in either derivative assets or derivative liabilities in the accompanying consolidated balance sheets. At December 31, 2023, the Company's derivative assets and liabilities each totaled $
The following tables provide the outstanding notional balances and fair values of outstanding derivative positions at December 31, 2023 and 2022.
(Dollars in thousands) |
|
Outstanding |
|
|
Asset |
|
|
Liability |
|
|
Pay |
|
Receive |
|
Remaining |
|
||||
December 31, 2023 |
|
|
|
|
|
|
|
|
|
|
|
|
|
|
|
|
||||
Cash flow hedges: |
|
|
|
|
|
|
|
|
|
|
|
|
|
|
|
|
||||
Pay-fixed interest rate swap |
|
$ |
|
|
$ |
— |
|
|
$ |
|
|
|
USD Fed |
|
|
|
||||
Total cash flow hedges |
|
|
|
|
|
— |
|
|
|
|
|
|
|
|
|
|
|
|||
Fair value hedges: |
|
|
|
|
|
|
|
|
|
|
|
|
|
|
|
|
||||
Risk participation agreements purchased |
|
$ |
|
|
$ |
— |
|
|
$ |
|
|
— |
|
|
|
|
||||
Risk participation agreements sold |
|
|
|
|
|
|
|
|
|
|
— |
|
|
|
|
|||||
Commercial loan one-way interest rate swaps |
|
|
|
|
|
|
|
|
|
|
|
— |
|
|
|
|||||
Commercial loan pass-through interest rate swaps: |
|
|
|
|
|
|
|
|
|
|
|
|
|
|
|
|
||||
Loan customer counterparty |
|
|
|
|
|
|
|
|
|
|
— |
|
|
|
|
|||||
Financial institution counterparty |
|
|
|
|
|
|
|
|
|
|
|
— |
|
|
|
|||||
Total fair value hedges |
|
|
|
|
|
|
|
|
|
|
|
|
|
|
|
|
||||
Total derivatives |
|
$ |
|
|
$ |
|
|
$ |
|
|
|
|
|
|
|
|
||||
(Dollars in thousands) |
|
Outstanding |
|
|
Asset |
|
|
Liability |
|
|
Pay |
|
Receive |
|
Remaining |
|
||||
December 31, 2022 |
|
|
|
|
|
|
|
|
|
|
|
|
|
|
|
|
||||
Fair value hedges: |
|
|
|
|
|
|
|
|
|
|
|
|
|
|
|
|
||||
Risk participation agreements purchased |
|
$ |
|
|
$ |
— |
|
|
$ |
— |
|
|
— |
|
|
|
|
|||
Risk participation agreements sold |
|
|
|
|
|
— |
|
|
|
|
|
— |
|
|
|
|
||||
Commercial loan pass-through interest rate swaps: |
|
|
|
|
|
|
|
|
|
|
|
|
|
|
|
|
||||
Loan customer counterparty |
|
|
|
|
|
— |
|
|
|
|
|
— |
|
|
|
|
||||
Financial institution counterparty |
|
|
|
|
|
|
|
|
— |
|
|
|
— |
|
|
|
||||
Total fair value hedges |
|
|
|
|
|
|
|
|
|
|
|
|
|
|
|
|
||||
Total derivatives |
|
$ |
|
|
$ |
|
|
$ |
|
|
|
|
|
|
|
|
||||
(1)
(2)
Amortization expense of the core deposit intangible (“CDI”) was approximately $
F-44
THIRD COAST BANCSHARES, INC. AND SUBSIDIARY
Notes to consolidated Financial Statements
December 31, 2023 and 2022
Scheduled amortization of CDI at December 31, 2023 are as follows:
(Dollars in thousands) |
|
CDI |
|
|
2024 |
|
$ |
|
|
2025 |
|
|
|
|
2026 |
|
|
|
|
2027 |
|
|
|
|
2028 and thereafter |
|
|
|
|
|
|
$ |
|
|
19. Contingencies
Litigation
In the normal course of business, the Company is involved in various legal proceedings. In the opinion of management, all liability resulting from such proceedings is not considered material and has been accounted for in the consolidated financial statements.
The following balance sheets, statements of income and statements of cash flows for Third Coast Bancshares, Inc. should be read in conjunction with the consolidated financial statements and the notes thereto.
Condensed Balance Sheets of the Company (Parent company only) for the periods presented are as follows:
(Dollars in thousands) |
|
December 31, |
|
|||||
ASSETS |
|
2023 |
|
|
2022 |
|
||
Cash and cash equivalents |
|
$ |
|
|
$ |
|
||
Investment in subsidiary |
|
|
|
|
|
|
||
Other assets |
|
|
|
|
|
|
||
Total assets |
|
$ |
|
|
$ |
|
||
LIABILITIES AND SHAREHOLDERS' EQUITY |
|
|
|
|
|
|
||
Other borrowings |
|
$ |
|
|
$ |
|
||
Other liabilities |
|
|
|
|
|
|
||
Total liabilities |
|
|
|
|
|
|
||
Shareholders' equity: |
|
|
|
|
|
|
||
Series A Convertible Non-Cumulative Preferred Stock |
|
|
|
|
|
|
||
Series B Convertible Perpetual Preferred Stock |
|
|
— |
|
|
|
— |
|
Common stock |
|
|
|
|
|
|
||
Common stock - non-voting |
|
|
— |
|
|
|
— |
|
Additional paid-in capital |
|
|
|
|
|
|
||
Retained earnings |
|
|
|
|
|
|
||
Accumulated other comprehensive income (loss) |
|
|
|
|
|
( |
) |
|
Treasury stock: at cost |
|
|
( |
) |
|
|
( |
) |
Total shareholders' equity |
|
|
|
|
|
|
||
Total liabilities & shareholders' equity |
|
$ |
|
|
$ |
|
||
F-45
THIRD COAST BANCSHARES, INC. AND SUBSIDIARY
Notes to consolidated Financial Statements
December 31, 2023 and 2022
Condensed Statements of Income and Comprehensive Income of the Company (Parent company only) for the periods are as follows:
|
|
For the Years Ended December 31, |
|
|||||||||
(Dollars in thousands) |
|
2023 |
|
|
2022 |
|
|
2021 |
|
|||
Interest expense: |
|
|
|
|
|
|
|
|
|
|||
Interest on notes payable |
|
$ |
|
|
$ |
|
|
$ |
|
|||
Total interest expense |
|
|
|
|
|
|
|
|
|
|||
Noninterest expense: |
|
|
|
|
|
|
|
|
|
|||
Legal and professional |
|
|
|
|
|
|
|
|
|
|||
Other |
|
|
|
|
|
|
|
|
|
|||
Total noninterest expense |
|
|
|
|
|
|
|
|
|
|||
Loss before income tax expense and equity in undistributed earnings of subsidiaries |
|
|
( |
) |
|
|
( |
) |
|
|
( |
) |
Income tax benefit |
|
|
|
|
|
|
|
|
|
|||
Loss before equity in undistributed earnings of subsidiaries |
|
|
( |
) |
|
|
( |
) |
|
|
( |
) |
Equity in undistributed earnings of subsidiaries |
|
|
|
|
|
|
|
|
|
|||
Net income |
|
$ |
|
|
$ |
|
|
$ |
|
|||
Comprehensive income |
|
$ |
|
|
$ |
|
|
$ |
|
|||
Condensed Statements of Cash Flows of the Company (Parent company only) for the periods presented are as follows:
|
|
For the Years Ended December 31, |
|
|||||||||
(Dollars in thousands) |
|
2023 |
|
|
2022 |
|
|
2021 |
|
|||
Cash flows from operating activities: |
|
|
|
|
|
|
|
|
|
|||
Net income |
|
$ |
|
|
$ |
|
|
$ |
|
|||
Adjustments to reconcile net income to net cash used in operating activities: |
|
|
|
|
|
|
|
|
|
|||
Equity in undistributed net income of subsidiaries |
|
|
( |
) |
|
|
( |
) |
|
|
( |
) |
Amortization of subordinated debt issuance costs |
|
|
|
|
|
|
|
|
— |
|
||
Net change in other assets |
|
|
( |
) |
|
|
( |
) |
|
|
( |
) |
Net change in other liabilities |
|
|
|
|
|
|
|
|
( |
) |
||
Net cash used in operating activities |
|
|
( |
) |
|
|
( |
) |
|
|
( |
) |
Cash flows from investing activities: |
|
|
|
|
|
|
|
|
|
|||
Capital investment in subsidiaries |
|
|
— |
|
|
|
( |
) |
|
|
( |
) |
Net cash used in investing activities |
|
|
— |
|
|
|
( |
) |
|
|
( |
) |
Cash flows from financing activities: |
|
|
|
|
|
|
|
|
|
|||
Repayment of subordinated notes payable - related party |
|
|
— |
|
|
|
— |
|
|
|
( |
) |
Proceeds from (repayment of) line of credit - senior debt |
|
|
|
|
|
|
|
|
( |
) |
||
Net proceeds from subordinated debt issuance |
|
|
— |
|
|
|
|
|
|
— |
|
|
Net proceeds from issuance of preferred stock |
|
|
— |
|
|
|
|
|
|
— |
|
|
Net proceeds from issuance of common stock |
|
|
— |
|
|
|
|
|
|
|
||
Dividends paid on Series A preferred stock |
|
|
( |
) |
|
|
( |
) |
|
|
— |
|
Proceeds from stock warrants exercised |
|
|
|
|
|
— |
|
|
|
|
||
Proceeds from stock options exercised |
|
|
— |
|
|
|
|
|
|
|
||
Net redemption of treasury stock |
|
|
— |
|
|
|
— |
|
|
|
( |
) |
Net cash provided by financing activities |
|
|
|
|
|
|
|
|
|
|||
Change in cash and cash equivalents |
|
|
( |
) |
|
|
|
|
|
|
||
Cash and cash equivalents at beginning of period |
|
|
|
|
|
|
|
|
|
|||
Cash and cash equivalents at end of period |
|
$ |
|
|
$ |
|
|
$ |
|
|||
F-46
THIRD COAST BANCSHARES, INC. AND SUBSIDIARY
Notes to consolidated Financial Statements
December 31, 2023 and 2022
The summary quarterly financial information set forth below for each of the last eight quarters has been derived from the Company's unaudited interim consolidated financial statements and other financial information. The summary historical quarterly financial information includes all adjustments consisting of normal recurring accruals that the Company considers necessary for a fair presentation of the financial position and the results of operations for the periods.
The information below is only a summary and should be read in conjunction with “Management's Discussion and Analysis of Financial Condition and Results of Operations” and the consolidated historical financial statements and the related notes thereto included in this Annual Report on Form 10-K.
|
|
For the Quarters Ended December 31, 2023 |
|
|||||||||||||
(Dollars in thousands) |
|
Q4 |
|
|
Q3 |
|
|
Q2 |
|
|
Q1 |
|
||||
Selected income statement data: |
|
|
|
|
|
|
|
|
|
|
|
|
||||
Interest income |
|
$ |
|
|
$ |
|
|
$ |
|
|
$ |
|
||||
Interest expense |
|
|
|
|
|
|
|
|
|
|
|
|
||||
Net interest income |
|
|
|
|
|
|
|
|
|
|
|
|
||||
Provision for credit losses |
|
|
|
|
|
|
|
|
|
|
|
|
||||
Net interest income after provision for credit losses |
|
|
|
|
|
|
|
|
|
|
|
|
||||
Noninterest income |
|
|
|
|
|
|
|
|
|
|
|
|
||||
Noninterest expense |
|
|
|
|
|
|
|
|
|
|
|
|
||||
Income before income tax expense |
|
|
|
|
|
|
|
|
|
|
|
|
||||
Income tax expense |
|
|
|
|
|
|
|
|
|
|
|
|
||||
Net income |
|
$ |
|
|
$ |
|
|
$ |
|
|
$ |
|
||||
|
|
For the Quarters Ended December 31, 2022 |
|
|||||||||||||
(Dollars in thousands) |
|
Q4 |
|
|
Q3 |
|
|
Q2 |
|
|
Q1 |
|
||||
Selected income statement data: |
|
|
|
|
|
|
|
|
|
|
|
|
||||
Interest income |
|
$ |
|
|
$ |
|
|
$ |
|
|
$ |
|
||||
Interest expense |
|
|
|
|
|
|
|
|
|
|
|
|
||||
Net interest income |
|
|
|
|
|
|
|
|
|
|
|
|
||||
Provision for credit losses |
|
|
|
|
|
|
|
|
|
|
|
|
||||
Net interest income after provision for credit losses |
|
|
|
|
|
|
|
|
|
|
|
|
||||
Noninterest income |
|
|
|
|
|
|
|
|
|
|
|
|
||||
Noninterest expense |
|
|
|
|
|
|
|
|
|
|
|
|
||||
Income before income tax expense |
|
|
|
|
|
|
|
|
|
|
|
|
||||
Income tax expense |
|
|
|
|
|
|
|
|
|
|
|
|
||||
Net income |
|
$ |
|
|
$ |
|
|
$ |
|
|
$ |
|
||||
22. Subsequent Events
Conversion to State Bank
On October 26, 2023, the Bank was notified that the Federal Reserve Bank of Dallas granted approval of our application to convert to a state bank under the name of Third Coast Bank. On January 11, 2024, the Bank was notified that the Texas Department of Banking and the Texas Department of Savings and Mortgage Lending had approved the conversion. The effective date of the conversion is expected to be March 13, 2024.
F-47