UNITED STATES
SECURITIES AND EXCHANGE COMMISSION
Washington, D.C. 20549
FORM
OR
For the fiscal year ended
OR
OR
Date of event requiring this shell company report _____________________
For the transition period from _______ to _______
Commission file number
(Exact name of Registrant as specified in its charter)
(Jurisdiction of incorporation or organization)
(Address of principal executive offices)
(
(Name, Telephone, E-mail and/or Facsimile number and Address of Company Contact Person)
Securities registered or to be registered pursuant to Section 12(b) of the Act.
Title of each class |
Trading Symbol(s) |
Name of each exchange on which registered |
Securities registered or to be registered pursuant to Section 12(g) of the Act: None
Securities for which there is a reporting obligation pursuant to Section 15(d) of the Act: None
Indicate the number of outstanding shares of each of the issuer’s classes of capital or common stock as of the close of the period covered by the annual report.
Indicate by check mark if the registrant is a well-known seasoned issuer, as defined in Rule 405 of the Securities Act.
If this report is an annual or transition report, indicate by check mark if the registrant is not required to file reports pursuant to Section 13 or 15(d) of the Securities Exchange Act of 1934. Yes ☐
Indicate by check mark whether the registrant (1) has filed all reports required to be filed by Section 13 or 15(d) of the Securities Exchange Act of 1934 during the preceding 12 months (or for such shorter period that the registrant was required to file such reports), and (2) has been subject to such filing requirements for the past 90 days.
Indicate by check mark whether the registrant has submitted electronically, every Interactive Data File required to be submitted pursuant to Rule 405 of Regulation S-T (§232.405 of this chapter) during the preceding 12 months (or for such shorter period that the registrant was required to submit such files).
Indicate by check mark whether the registrant is a large accelerated filer, an accelerated filer, or a non-accelerated filer, or an emerging growth company. See definitions of “accelerated filer”, “large accelerated filer” and “emerging growth company” in Rule 12b-2 of the Exchange Act.:
If an emerging growth company, indicate by check mark if the registrant has elected not to use the extended transition period for complying with any new or revised financial accounting standards provided pursuant to Section 13(a) of the Exchange Act. ☐
Indicate by check mark whether the registrant has filed a report on and attestation to its management’s assessment of the effectiveness of its internal control over financial reporting under Section 404(b) of the Sarbanes-Oxley Act (15 U.S.C. 7262(b)) by the registered public accounting firm that prepared or issued its audit report.
If securities are registered pursuant to Section 12(b) of the Act, indicate by check mark whether the financial statements of the registrant included in the filing reflect the correction of an error to previously issued financial statements. ☐
Indicate by check mark whether any of those error corrections are restatements that required a recovery analysis of incentive-based compensation received by any of the registrant’s executive officers during the relevant recovery period pursuant to §240.10D-1(b). ☐
Indicate by check mark which basis of accounting the registrant has used to prepare the financial statements included in this filing:
If “Other” has been checked in response to the previous question, indicate by check mark which financial statement item the registrant has elected to follow. Item 17☐ Item 18☐
If this is an annual report, indicate by check mark whether the registrant is a shell company (as defined in Rule 12b-2 of the Exchange Act). Yes
Auditor Firm Id: |
Auditor Name: |
Auditor Location: |
TABLE OF CONTENTS
|
|
Page |
||
Information Regarding Forward-Looking Statements; Cautionary Language |
|
1 |
||
Part I |
|
|
||
Item 1. |
|
|
2 |
|
Item 2. |
|
|
2 |
|
Item 3. |
|
|
2 |
|
Item 4. |
|
|
29 |
|
Item 4A. |
|
|
40 |
|
Item 5. |
|
|
41 |
|
Item 6. |
|
|
54 |
|
Item 7. |
|
|
59 |
|
Item 8. |
|
|
63 |
|
Item 9. |
|
|
64 |
|
Item 10. |
|
|
64 |
|
Item 11. |
|
|
73 |
|
Item 12. |
|
|
74 |
|
PART II |
|
|
||
Item 13. |
|
|
75 |
|
Item 14. |
|
Material Modifications to the Rights of Security Holders and Use of Proceeds |
|
75 |
Item 15. |
|
|
75 |
|
Item 16. |
|
|
76 |
|
Item 16A. |
|
|
76 |
|
Item 16B. |
|
|
76 |
|
Item 16C. |
|
|
77 |
|
Item 16D. |
|
|
77 |
|
Item 16E. |
|
Purchases of Equity Securities by the Issuer and Affiliated Purchasers |
|
77 |
Item 16F. |
|
|
79 |
|
Item 16G. |
|
|
79 |
|
Item 16H. |
|
|
81 |
|
Item 16I. |
|
Disclosure Regarding Foreign Jurisdictions that Prevent Inspections |
|
81 |
PART III |
|
|
|
|
Item 17. |
|
|
82 |
|
Item 18. |
|
|
82 |
|
Item 19. |
|
|
82 |
|
|
|
|
113 |
|
In this Annual Report on Form 20-F, unless indicated otherwise, references to: (1) “Textainer,” “TGH,” “the Company,” “we,” “us” and “our” refer, as the context requires, to Textainer Group Holdings Limited, which is the registrant and the issuer of the class of common and preferred shares that has been registered pursuant to Section 12(b) of the Securities Exchange Act of 1934, as amended, or Textainer Group Holdings Limited and its subsidiaries; (2) “TEU” refers to a “Twenty-Foot Equivalent Unit,” which is a unit of measurement used in the container shipping industry to compare shipping containers of various lengths to a standard 20′ dry freight container, thus a 20′ container is one TEU and a 40′ container is two TEU; (3) “CEU” refers to a Cost Equivalent Unit, which is a unit of measurement based on the approximate cost of a container relative to the cost of a standard 20′ dry freight container, so the cost of a standard 20′ dry freight container is one CEU; the cost of a 40′ dry freight container is 1.6 CEU; the cost of a 40′ high cube dry freight container (9′6″ high) is 1.7 CEU; and the cost of a 40’ high cube refrigerated container is 8.0 CEU; (4) “our owned fleet” means the containers we own; (5) “our managed fleet” means the containers we manage that are owned by other Container Investors; (6) “our fleet” and “our total fleet” mean our owned fleet plus our managed fleet plus any containers we lease from other lessors; and (7) “Container Investors” means the owners of the containers in our managed fleet.
Dollar amounts in this Annual Report on Form 20-F are expressed in thousands, unless otherwise indicated.
INFORMATION REGARDING FORWARD-LOOKING STATEMENTS; CAUTIONARY LANGUAGE
This Annual Report on Form 20-F, including the sections entitled Item 3, “Key Information -- Risk Factors,” and Item 5, “Operating and Financial Review and Prospects,” contains forward-looking statements within the “safe harbor” provisions of the U.S. Private Securities Litigation Reform Act of 1995. Forward-looking statements include all statements that are not statements of historical facts and may relate to, but are not limited to, expectations or estimates of future operating results or financial performance, capital expenditures, introduction of new products, regulatory compliance, plans for growth and future operations, as well as assumptions relating to the foregoing. In some cases, you can identify forward-looking statements by terminology such as “may,” “will,” “should,” “could,” “expect,” “plan,” “anticipate,” “believe,” “estimate,” “predict,” “intend,” “potential,” “continue” or the negative of these terms or other similar terminology.
Although we do not make forward-looking statements unless we believe we have a reasonable basis for doing so, we cannot guarantee their accuracy, and actual results may differ materially from those we anticipated due to a number of uncertainties, many of which cannot be foreseen. Our actual results could differ materially from those anticipated in these forward-looking statements for many reasons, including, among others, the risks we face that are described in the section entitled Item 3, “Key Information -- Risk Factors” and elsewhere in this Annual Report on Form 20-F.
We believe that it is important to communicate our future expectations to potential investors, shareholders and other readers. However, there may be events in the future that we are not able to accurately predict or control and that may cause actual events or results to differ materially from the expectations expressed in or implied by our forward-looking statements. The risk factors listed in Item 3, “Key Information -- Risk Factors,” as well as any cautionary language in this Annual Report on Form 20-F, provide examples of risks, uncertainties and events that may cause our actual results to differ materially from the expectations we describe in our forward-looking statements. Before you decide to buy, hold or sell our common shares, you should be aware that the occurrence of the events described in Item 3, “Key Information -- Risk Factors” and elsewhere in this Annual Report on Form 20-F could negatively impact our business, cash flows, results of operations, financial condition and share price. Potential investors, shareholders and other readers should not place undue reliance on our forward-looking statements.
Forward-looking statements regarding our present plans or expectations involve risks and uncertainties relative to return expectations and related allocation of resources and changing economic or competitive conditions which could cause actual results to differ from present plans or expectations, and such differences could be material. Similarly, forward-looking statements regarding our present expectations for operating results and cash flow involve risks and uncertainties related to factors such as utilization rates, per diem rates, container prices, demand for containers by container shipping lines, supply, the magnitude and duration of the COVID-19 pandemic, the Russia-Ukraine war and other factors discussed under Item 3, “Key Information -- Risk Factors” or elsewhere in this Annual Report on Form 20-F, which could also cause actual results to differ from present plans. Such differences could be material.
All future written and oral forward-looking statements attributable to us or any person acting on our behalf are expressly qualified in their entirety by the cautionary statements contained or referred to in this section. New risks and uncertainties arise from time to time, and we cannot predict those events or how they may affect us. We assume no obligation to, and do not plan to, update any forward-looking statements after the date of this Annual Report on Form 20-F as a result of new information, future events or developments, except as required by federal securities laws. You should read this Annual Report on Form 20-F and the documents that we reference and have filed as exhibits with the understanding that we cannot guarantee future results, levels of activity, performance or achievements and that actual results may differ materially from what we expect.
Industry data and other statistical information used in this Annual Report on Form 20-F are based on independent publications, reports by market research firms or other published independent sources. Good faith estimates are used for some data that is derived from our review of internal surveys and the independent sources listed above. Although we believe these sources are reliable, we have not independently verified the information.
In this Annual Report on Form 20-F, unless otherwise specified, all monetary amounts are in U.S. dollars. To the extent that any monetary amounts are not denominated in U.S. dollars, they have been translated into U.S. dollars in accordance with our accounting policies as described in Item 18, “Financial Statements” in this Annual Report on Form 20-F.
1
PART I
ITEM 1. IDENTITY OF DIRECTORS, SENIOR MANAGEMENT AND ADVISERS
Not applicable.
ITEM 2. OFFER STATISTICS AND EXPECTED TIMETABLE
Not applicable.
ITEM 3. KEY INFORMATION
Not applicable.
Not applicable.
An investment in our common or preferred shares involves a high degree of risk. You should carefully consider the following risk factors, together with the other information contained elsewhere in this Annual Report on Form 20-F, including our financial statements and the related notes thereto, before you decide to buy, hold or sell our common or preferred shares. Any of the risk factors we describe below could adversely affect our business, cash flows, results of operations and financial condition. The market price of our common or preferred shares could decline and you may lose some or all of your investment if one or more of these risks and uncertainties develop into actual events.
Summary of Risks Related to the Company and Investment in our Shares
The following is a summary of the risks related to our Company and your investment in our shares. You are encouraged to review all of the risk factors that follow for more detailed information and discussion of how these risks and other risks related to our company and shares may impact us:
2
Risks Related to Our Business and Industry Which May be Beyond Our Control
The demand and pricing for leased containers depends on many factors beyond our control.
Substantially all of our revenue derives from activities related to the leasing, managing and selling of containers. Our ability to continue successfully leasing containers to container shipping lines, earning management fees on leased containers, selling used containers and sourcing capital required to purchase new and used containers depends, in part, upon the continued demand to lease containers and purchase used containers.
3
Demand for leased containers depends largely on the rate of growth of world trade and economic growth, with worldwide consumer demand being the most critical factor affecting this growth. Demand for leased containers is also driven by our customers’ “lease vs. buy” decisions. In the past, economic downturns in the U.S., Europe, Asia and countries with consumer-oriented economies have resulted in a reduction in the rate of growth of world trade and demand by container shipping lines for leased containers and it is likely that any future downturns would have similar results. Thus, a decrease in world trade can and has adversely affected our utilization and per diem rates and led to reduced revenue and increased operating expenses (such as storage and repositioning costs) and can have an adverse effect on our financial performance. We cannot predict whether, or when, such downturns will occur or the severity or duration of any downturn. Other material factors affecting demand for leased containers, utilization and per diem rates include the following:
Many of these and other factors affecting the container industry are inherently unpredictable and beyond our control. These factors will vary over time, often quickly and unpredictably, and any change in one or more of these factors may have a material adverse effect on our business and results of operations. In addition, many of these factors also influence the decision by container shipping lines to lease or buy containers. Should one or more of these factors influence container shipping lines to buy a larger percentage of the containers they operate, our utilization rate and/or per diems could decrease, resulting in decreased revenue and increased storage and repositioning costs, which would harm our business, results of operations and financial condition.
4
Global economic weakness has in the past and may in the future materially and negatively impact our business, results of operations, cash flows, financial condition and future prospects.
The continued sustainability of international economic growth is uncertain particularly due to the ongoing Novel Coronavirus pandemic which created severe economic contractions and rebounds from 2020 to 2022. The Novel Coronavirus pandemic increased container trade demand and shipping lines’ financial performance; however the continued strength and duration of this demand is uncertain as the congestion and economic stimulus that dramatically increased freight rates have normalized and lease rates and new and used container prices have declined.
Uncertainties relating to Novel Coronavirus include the duration of the outbreak, the countries impacted by the outbreak, recurrence or changes in the scope of the outbreak, and actions that may be taken to contain or treat its impact, by governments and others, including vaccine and medical prevention and treatment developments, declarations of states of emergency, business closures, manufacturing restrictions and a prolonged period of travel and/or other similar restrictions and limitations. Disruptions from the Novel Coronavirus or reduced container and/or container trade demand following heavy container investment during the initial outbreak of COVID-19 may lead to increased future credit concerns regarding our customers, reduced container demand, lower utilization of our fleet, lower lease rates, lower sale prices for our used containers, disruptions in the capital markets, increased risk of non-compliance with our debt covenants and operational and business process disruptions for us and our customers.
Any slowdown or reversal of the U.S. and global trade growth due to the Novel Coronavirus or otherwise could heighten a number of material risks to our business, results of operations, cash flows and financial condition, as well as our future prospects, including the following:
Lease and/or utilization rates may decrease, which could adversely affect our business, results of operations and financial condition.
We compete mostly on the pricing and the availability of containers. Lease rates for our containers depend on a large number of factors, including the following:
Most of these factors are beyond our control. From late 2018 until the middle of 2020 steel prices, container prices and lease rates generally declined and demand for new containers also declined given trade disputes and the emergence of the Novel Coronavirus pandemic. From the middle of 2020 until early 2022, steel prices, container prices and lease rates all materially escalated as cargo and container demand increased. In 2021, record levels of containers were produced at very high prices to satisfy industry demand and the demand created from congestion and trade disruptions. Container demand and
5
trade congestion were reduced in 2022 with approximately half as many containers produced in 2022 than in 2021. The resolution of trade disruptions, moderation in demand for goods upon the mitigation of the Novel Coronavirus pandemic and lower steel prices has caused container prices and lease rates to decline. In addition, lease rates can be negatively impacted by, among other things, the entrance of new leasing companies or container factories, overproduction of new containers by factories and the over-buying by shipping lines, leasing companies and tax-driven container investors. If future market lease rates decrease or return to historically low levels, revenues generated by our fleet will be adversely affected, which will harm our business, results of operations, cash flows and financial condition. Container utilization rates for us and our competitors increased in 2020 and are currently at very high levels by historical standards. If future container returns increase or utilization rates decrease, revenues generated by our fleet will be adversely affected, which will harm our business, results of operations, cash flows and financial condition.
Reductions in the prices of new containers would harm our business, results of operations and financial condition.
Lease rates for new containers are positively but not exclusively correlated to the price of new containers, which is positively correlated with the price of steel, a major component used in the manufacture of new containers. In the past five years, prices for new standard 20’ dry freight containers have moved in a wide range, with prices ranging between $1,598 and $3,790 during this time. Our average new container cost per CEU decreased in 2022 compared to 2021 as container prices decreased due to lower steel costs, lower container demand and reduced prices from factories. Container prices increased from 2016 to late 2018 and then declined until early 2020 when increases resumed and prices were at historically high levels in 2021. If new container prices decline, the lease rates achievable when older, off-lease containers are leased out will also decrease and the prices obtained for containers sold at the end of their useful lives may also decrease. From late 2018 until early 2020, we generally saw new container pricing and lease rates decline, and these trends reversed for the rest of 2020 and through 2021. In 2022 new container prices and lease rates declined with a low level of market activity in the second half of the year. A decline in new container prices causes low market lease rates and low resale values for containers, which have and may in the future adversely affect our business, results of operations and financial condition, even if low new container prices allow us to purchase new containers at a lower cost.
We derive a substantial portion of our lease rental income from a limited number of container lessees, and the loss of, or reduction in business, by any of these container lessees could harm our business, results of operations and financial condition.
We have derived, and believe that we will continue to derive, a significant portion of lease rental income and cash flow from a limited number of container lessees. Lease revenues from our 20 largest container lessees represented approximately $715 million or 88.3% of the total lease rental income during 2022. Our three largest customers in 2022 were Mediterranean Shipping Company S.A., which accounted for $198 million or 24.4%, CMA-CGM S.A., which accounted for $95 million or 11.7%, and COSCO Shipping Lines, which accounted for $87 million or 10.8% of our total lease rental income. Due to the ongoing consolidation in the shipping line industry, our 20 largest container lessees are becoming an increasing percentage of our total revenue, with correspondingly increased concentration of credit risk. Given the high concentration of our customer base, a default by any of our largest customers would result in a major reduction in leasing revenue, large repossession expenses, potentially large lost equipment charges and a material adverse impact on our performance and financial condition.
The use of very large container ships (18,000 TEU+) on the major trade lanes may lead to further industry consolidation and shipping line alliance participation, and even greater reliance by us on our largest customers, and may negatively impact the performance of smaller and mid-size shipping lines. Several of the largest shipping lines have invested heavily in these very large ships and reportedly have achieved meaningful unit cost advantages and increased market share on the major trade lanes. In response, some smaller shipping lines have started to exit the major trade lanes, while others are seeking to form closer operating partnerships. Additionally, shipping lines have used some of their substantial profits from 2020 to 2022 to purchase significant numbers of new and used container ships. The delivery of significant new ship capacity without trade growth or the retirement of older ships could result in substantial overcapacity, lower freight rates, lower shipping line profits and increased credit risk for us.
6
Consolidation, shipping line alliances, and concentration in the container shipping industry could decrease the demand for leased containers or warrant regulatory actions.
We primarily lease containers to container shipping lines. The container shipping lines have historically relied on a large number of leased containers to satisfy their needs. The shipping industry has been consolidating for a number of years, and further consolidation is possible. Historically, shipping lines have also formed a number of alliances to share vessel space and the creation of new alliances and changes in the membership of each alliance is ongoing. Consolidation of major container shipping lines and growth of alliances could create efficiencies and decrease the demand that container shipping lines have for leased containers because they may be able to fulfill a larger portion of their needs through their owned container fleets. Consolidation could also create concentration of credit risk if the number of our container lessees decreases. If shipping line alliances are effective at making shipping lines more efficient, this could reduce the demand for containers. The growth of alliances may add pressure to those shipping lines that do not join an alliance as they may find it more difficult to cost effectively serve shippers needs and/or shippers may choose to only ship cargo with alliances due to solvency concerns or otherwise. Shifts and changes in shipping line alliances may also cause industry disruption and may change competitive dynamics which could adversely impact shipping lines and potentially adversely impact our business. Additionally, large container shipping lines with significant resources could choose to manufacture or purchase their own containers, which would decrease their demand for leased containers and could harm our business, results of operations and financial condition. Significant increases in freight rates during the COVID-19 pandemic have attracted scrutiny of the shipping industry by regulators. United States and international antitrust regulators have announced increased resources devoted to investigating possible collusion or anti-competitive behavior by shipping lines. Penalties on the industry or increased regulation of the industry may adversely affect our customers, impact their financial resources and/or reduce the demand for shipping containers which could negatively impact our operations and results.
The demand for leased containers is partially tied to international trade. If this demand were to decrease due to increased barriers to trade, or for any other reason, it could reduce demand for intermodal container leasing, which would harm our business, results of operations and financial condition.
A substantial portion of our containers are used in trade involving goods being shipped from the People’s Republic of China (the “PRC” or “China”) and other Asian countries to the United States, Europe, Latin America or other regions and within Asia. The willingness and ability of international consumers to purchase foreign goods is dependent on political support, in the United States, Europe, Latin America and other countries, for an absence of government-imposed barriers to international trade in goods and services. For example, international consumer demand for foreign goods is related to price; if the price differential between foreign goods and domestically-produced goods were to decrease due to increased tariffs on foreign goods, strengthening in the applicable foreign currencies relative to domestic currencies, rising wages, increasing input or energy costs or other factors, demand for foreign goods could decrease, which could result in reduced demand for intermodal container leasing. A similar reduction in demand for intermodal container leasing could result from an increased use of quotas or other technical barriers to restrict trade. In 2018, a number of major trading economies implemented, and increased tariffs and other trade restrictions and significant renegotiations of existing trade agreements commenced. This continued in 2019 with partial resolutions of certain disputes seen at the end of that year. If these trade restrictions and tariffs continue or increase it may materially impact container demand and change trade patterns. The Novel Coronavirus pandemic initially decreased trade demand but cargo growth resumed in mid-2020 particularly for consumer goods and medical supplies. The long term impact of the Novel Coronavirus on trade and cargo demand is uncertain.
The Russia-Ukraine war may negatively impact international trade and our business.
The Russian military operation in Ukraine that commenced on February 24, 2022 has resulted in significant economic sanctions and trade controls on Russia with certain countries restricting shipments to or from Russian ports and limitations on Russian banks and entities ability to access international payment systems. The Company has approximately $17 million in net book value of owned containers on lease to a customer that conducts a significant amount of its trading with Russia. If the situation continues, worsens, or if countries impose additional economic sanctions or other business restrictions, including sanctions on countries that are supporting Russia or refusing to sanction Russian parties, international trade may be negatively impacted and container trade and demand for our containers may decrease and our business and results of operation could be harmed.
7
Asian economic instability could reduce demand for leasing, which would harm our business, results of operations and financial condition.
Many of our customers are substantially dependent upon shipments of goods exported from Asia. From time to time, there have been health scares, such as the Novel Coronavirus outbreak in China in early 2020, Severe Acute Respiratory Syndrome and avian flu, financial turmoil, natural disasters, and political instability in Asia. In the past, these events have adversely affected our container lessees and the general demand for shipping and have led to reduced demand for leased containers or otherwise caused adverse effects on us. Ongoing or future events such as these may have similar or worse impacts on our business. Any reduction in demand for leased containers would harm our business, results of operations and financial condition.
Risks Inherent to Our Business and Industry
We face risks associated with re-leasing containers after their initial long-term lease.
We estimate the useful lives of our standard dry freight containers to be 13 to 14 years, open-top and flat-rack containers to be 14 to 16 years, refrigerated containers to be 12 years and tank containers to be 20 years. When we purchase newly produced containers, we typically lease them out under long-term leases with terms of 5 or more years at a lease rate that is correlated to the price paid for the container and prevailing interest rates. As containers leased under term leases are not leased out for their full economic life, we face risks associated with re-leasing containers after their initial long-term lease. If prevailing container lease rates decline significantly between the time a container is initially leased out and when its initial long-term lease expires, or if overall demand for containers declines, we may be unable to earn a similar lease rate from the re-leasing of containers when their initial term leases expire which could materially adversely impact our results and financial performance.
Gains and losses associated with the disposition or trading of used equipment may fluctuate and adversely affect our business, results of operations and financial condition.
We regularly sell used containers at the end of their useful lives in marine service or when we believe it maximizes the projected financial return, considering the location, sale price, cost of repair, possible repositioning expenses, earnings prospects and remaining useful life. The realized residual value of these containers affects our profitability. The volatility of the residual values of used containers may be significant. These values depend upon, among other factors, demand for used containers for secondary purposes, comparable new container costs, used container availability, condition and location of the containers, and market conditions. Most of these factors are outside of our control. Additionally, if shipping lines or our leasing company competitors determine to sell their used containers at a younger age than we believe to be the useful life of our equipment, our containers may be more difficult to sell or may sell for less than containers that were more recently manufactured.
Gains or losses on the disposition of used container equipment and the sales fees earned on the disposition of managed containers fluctuate and may be significant if we sell large quantities of used containers. Low disposal prices and the high volume of containers being disposed of can cause an elevated level of container impairments to occur. Continued low disposal prices and/or high disposal volumes could harm our business, results of operations and financial condition. Additionally, even in periods of high disposal prices, if we have limited numbers of older containers returned from shipping lines available to sell, we may be limited in our ability to benefit from periods of high disposal prices. See Item 5, “Operating and Financial Review and Prospects” for a discussion of our gains or losses on the disposition of used container equipment.
In addition to disposing of our fleet’s used containers at the end of their useful life, we opportunistically purchase used containers for resale from our shipping line customers and other sellers. Shipping lines either enter into trading arrangements with us at the time they are ready to dispose of older containers or enter into purchase leaseback transactions with us where they sell us older containers and then lease them back until the shipping line is ready to dispose of the containers. We face resale price risk with both transactions since by the time the container is provided to us from the shipping line the prevailing prices for older containers may have declined from the value we assumed at the time of purchase.
8
If the supply of trading equipment becomes limited because these sellers develop other means for disposing of their equipment or develop their own sales network, our equipment trading revenues and our profitability could be negatively impacted. If selling prices rapidly deteriorate and we are holding a large inventory that was purchased when prices for trading equipment were higher or if prices decline over the life of our purchase leaseback transactions, then our gross margins from trading and the sale of containers acquired through purchase leaseback transactions will decline or become negative.
Lessee defaults have and may harm our business, results of operations and financial condition by decreasing revenue and increasing storage, repositioning, collection, insurance, and recovery expenses.
Our containers are leased to numerous container lessees. Lessees are required to pay rent and to indemnify us for damage to or loss of containers. Lessees may default in paying rent and performing other obligations under their leases. A delay or diminution in amounts received under the leases (including leases on our managed containers), or a default in the performance of maintenance or other lessee obligations under the leases could adversely affect our business, results of operations and financial condition and our ability to make payments on our debt.
We experienced lessee defaults, including the default of Hanjin in 2016, which severely negatively impacted our financial performance, and we believe that there is the continued risk of lessee defaults in the future. Historically, efforts to maintain high freight rates on the major trade lanes generally have not been sustainable for long periods of time. Excess vessel capacity due to new ship production, including the production of very large ships, and the re-activation of previously laid up vessels may be a factor in the future, especially if older vessels are not scrapped. Major shipping lines had record profits during 2020 to 2022 given the trade demand increase that commenced in the middle of 2020, however reliable information about the financial position and resources of many shipping lines can be difficult to obtain and all shipping lines may not benefit equally from the higher trade demand. Excess vessel capacity and continued new vessel deliveries, especially the delivery of very large vessels, may cause freight rate pressure to return in the future and substantial numbers of new ships were ordered by shipping lines since the commencement of the COVID-19 pandemic. Additionally, the commencement of various tariff and trade restriction actions between major trading nations in 2018 which continued and accelerated in 2019 has increased uncertainty about container trade growth and demand and may increase default risk if tariff actions return and/or increase. While certain trade disputes were resolved at the end of 2019, the duration of these tariff actions may have altered trade patterns and may have lasting impacts on container demand. The Novel Coronavirus pandemic has added to uncertainty about container trade demand, freight rates and our lessees' financial performance. Freight rates have normalized since the peaks seen earlier in the pandemic as congestion and demand have moderated and our lessees historical financial performance may not continue. Additionally, shipping lines’ expenses for vessels and containers have significantly increased since the commencement of the Novel Coronavirus pandemic and many of these are fixed long term costs that may be difficult to service with lower freight rates and/or reduced trade demand. As a result, we continue to face heightened risk that our financial performance and cash flow could be severely affected by defaults by our customers.
When lessees default, we may fail to recover all of our containers, and the containers that we do recover may be recovered in locations where we will not be able to quickly re-lease or sell them on commercially acceptable terms. In recovery actions we must locate the containers and often need to pay accrued storage and handling charges to depots and terminals, which may include debts incurred by the defaulting shipping line. We also may have to reposition these containers to other places where we can re-lease or sell them, which could be expensive, depending on the locations and distances involved. Following repositioning, we may need to repair the containers and pay container depots for storage until the containers are re-leased. These recovery and repair costs, and repositioning costs generally are reflected in our financial statements under container lessee default expense, net, and direct container expense – owned fleet, respectively. Accordingly, the amount of our bad debt expense may not capture the total adverse financial impact on us from a shipping line’s default. While we previously maintained insurance to cover some defaults, recent premium increases, large deductible amounts, and significant policy exclusions made the coverage uneconomic and we determined to let our coverage lapse in 2021. In 2015 and 2016 we filed significant insurance claims for lessee defaults we experienced. As a result of these insurance claims, potential future insurance claims or changes in the perceived risk of providing default insurance, such insurance might not be available to us in the future on commercially reasonable terms or at all. If we resume insurance, in any insurance claim our insurers may not agree with our determination that we have suffered an insured loss or our calculation of the amount of the insured loss. Any such future defaults could harm our business, results of operations and financial condition.
Historically we have recovered a very high percentage of the containers from defaulted lessees. However, in past years we encountered defaults from several smaller lessees and lessees in locations where recoveries did not track to our historical experience and significant losses were incurred. These losses were due to a number of containers being unrecoverable as the
9
containers were not in the control of the lessee or the containers were detained by depots or terminals that demanded storage charges in excess of the value of the detained containers after accounting for repair and repositioning costs. Additionally, in certain recent insolvencies, even when we have recovered the containers, they have generally been in very poor condition which limits their ability to be re-leased and reduces their disposal value, both of which add to the ultimate cost of the default. If a material amount of future recoveries from defaulted lessees continue to deviate from our historical recovery experience, our financial performance and cash flow could be severely adversely affected.
Certain liens may arise on our containers.
Depot operators, manufacturers, repairmen, terminals, ship owners and transporters do come into possession of our containers from time to time and have amounts due to them from the lessees or sublessees of the containers. In the event of nonpayment of those charges by the lessees or sublessees, we may be delayed in, or entirely barred from, repossessing the containers, or be required to make payments or incur expenses to discharge the lien to take possession of our containers.
Risks Related to our Debt and Leverage
Our indebtedness reduces our financial flexibility and could impede our ability to operate.
We have historically operated with, and anticipate continuing to operate with, a significant amount of debt. As of December 31, 2022, we had outstanding indebtedness of $5,540 million under our debt facilities. All of our outstanding indebtedness is secured debt collateralized primarily by our container assets and finance leases. There is no assurance that we will be able to refinance our outstanding indebtedness on terms that we can afford or at all. If we are unable to refinance our outstanding indebtedness, or if we are unable to increase the amount of our borrowing capacity, it could limit our ability to grow our business and our liquidity.
The amount of our indebtedness, and the terms of the related indebtedness (including interest rates and covenants), could have important consequences for us, including the following:
We may not generate sufficient cash flow from operations to service and repay our debt and related obligations and have sufficient funds left over to achieve or sustain profitability in our operations, meet our working capital and capital expenditure needs and/or compete successfully in our industry. An uncured event of default in some or all of our debt facilities could cause some or all of our entities to be declared bankrupt or liquidated.
10
We will require a significant amount of cash to service and repay our outstanding indebtedness, fund future capital expenditures, and our ability to generate cash depends on many factors beyond our control.
Our ability to make payments on and repay our indebtedness and to fund planned capital expenditures will depend on our ability to generate cash in the future. Our business primarily generates cash from our container assets. Our lenders, rating agencies and the investors in our asset-backed debt securities look to the historical and anticipated performance of our container assets when deciding whether to lend to us and the terms for such lending. It is possible that:
The terms of our debt facilities impose, and the terms of any future indebtedness may impose, significant operating, financial and other restrictions on us and our subsidiaries.
Restrictions imposed by our secured debt facilities, revolving credit facilities, term loan and bonds may limit or prohibit, among other things, our ability to:
We are also required to comply with certain financial covenants. These restrictions could adversely affect our ability to finance our future operations or capital needs and pursue available business opportunities. A breach of any of these financial covenants and restrictions, due to weaker financial performance, reduced asset values or otherwise could result in a default in respect of the related indebtedness. If a default occurs, the relevant lenders could elect to declare the indebtedness, together with accrued interest and fees, to be immediately due and payable and proceed against any collateral securing that indebtedness, which will constitute substantially all of our container assets and finance leases. Certain covenants limit our ability to borrow amounts secured by containers leased to a defaulted or bankrupt customer, compliance with such covenants may require repayment of amounts borrowed or limit future borrowings and compliance with these covenants may be difficult in the event of an insolvency of a large customer. If needed in the future, we may be unable to obtain covenant amendments and waivers from our lenders and some or all of our indebtedness could be in default. Additionally, covenant amendments and waivers may limit our ability to access additional funds for container investment and the cost and expense of covenant amendments, waivers and/or refinancing may limit our available funds for container investment.
If we are unable to enter into interest rate swaps and caps on reasonable commercial terms or if a counterparty under our interest rate swap and cap agreements defaults, our exposure associated with our variable rate debt could increase.
We have typically funded a significant portion of the purchase price of new containers through borrowings under our revolving credit facilities and our secured debt facilities and intend to use borrowings under our revolving credit facilities and our secured debt facilities for such funding in the future. As of December 31, 2022, $2,607 million in aggregate principal amount under our revolving debt facilities are subject to variable interest rates. We have entered into various interest rate
11
swap agreements to mitigate our exposure associated with variable rate debt. The swap agreements involve payments by us to counterparties at fixed rates in return for receipts based upon variable rates indexed to the Secured Overnight Financing Rate (“SOFR”), the replacement rate to London Inter Bank Offered Rate (“LIBOR”). There can be no assurance that interest rate swaps and caps will be available in the future, or if available, will be on terms satisfactory to us. Moreover, our interest rate swap agreements are subject to counterparty credit exposure, which is defined as the ability of a counterparty to perform its financial obligations under a derivative contract. While we monitor our counterparties’ credit ratings on an on-going basis, we cannot be certain that they will stay in compliance with the related derivative agreements and not default in the future. If we are unable to obtain interest rate swaps and caps or if a counterparty under our interest rate swap and cap agreements defaults, our exposure associated with our variable rate debt could increase.
Even with hedged variable rate debt and fixed rate debt, we face interest rate risk.
We generally hedge and fix our overall debt exposure to have a maturity similar to the average remaining lease term of our long-term lease contracts. However, if during the duration of our hedging, interest rates increase but lease rate per diems do not also increase, as our hedges expire our financial performance may decline due to higher interest rates not being offset by higher per diems. If this occurs, we may not be able to generate sufficient cash flows to service our debt obligations and/or we may breach our debt covenants, all of which would materially and adversely impact us. Additionally, in recent years we have entered into long term finance and operating leases that have a duration of longer than seven years and we do not believe that hedging the debt associated with the entire duration of these leases is economic. If interest rates materially increase in the later years of these leases and the debt associated with these leases remains unhedged our results may be adversely affected.
We own a large number of containers in our fleet and are subject to significant ownership risk and increasing our owned fleet entails increasing our debt, which could result in financial instability.
Ownership of containers entails greater risk than management of containers for container investors. In 2022, the percentage of containers in our fleet that we own increased from 93% at the beginning of the year to 94% at the end of the year. In December 2019, we purchased the fleet of containers we previously managed for Leased Assets Pool Company Limited, an affiliate of Trencor and this increased our owned fleet percentage in 2019. In 2021, we purchased the 49.9% of TAP Funding Limited that we did not own, which further increased our owned fleet percentage in 2021. The increased number of containers in our owned fleet increases our exposure to financing costs, financing risks, changes in per diem rates, re-leasing risk, changes in utilization rates, lessee defaults, repositioning costs, storage expenses, impairment charges and changes in sales prices upon the disposition of containers. The number of containers in our owned fleet fluctuates over time as we purchase new containers, sell containers into the secondary resale market, add third party container investors and/or acquire other fleets.
If we continue to increase the number of containers in our owned fleet, we will likely have more capital at risk and may need to maintain higher debt balances. Additional borrowings may not be available under our revolving credit facilities or our secured debt facilities, and we may not be able to refinance these facilities, if necessary, on commercially reasonable terms or at all. We may need to raise additional debt or equity capital in order to fund our business, expand our sales activities and/or respond to competitive pressures. We may not have access to the capital resources we desire or need to fund our business or may not have access on attractive terms. These factors, among others, may reduce our profitability and adversely affect our plans to maintain the container ownership portion of our business.
We Face Operational and Competitive Risks
We may incur significant costs to reposition our containers, which could harm our business, results of operations and financial condition.
When lessees return containers to locations where supply exceeds demand and when lessees default and we recover containers, we sometimes reposition containers to higher demand areas. Repositioning expenses vary depending on geographic location, distance, freight rates and other factors, and may not be fully covered by drop-off charges collected from the previous lessee of the containers or pick-up charges paid by the new lessee. We seek to limit the number of and impose surcharges on containers returned to low demand locations. Market conditions, however, may not enable us to continue such practices. In addition, we may not be able to accurately anticipate which locations will be characterized by higher or lower
12
demand in the future, and our current contracts will not protect us from repositioning costs if locations that we expect to be higher demand locations turn out to be lower demand locations at the time the containers are returned. For example, the vast majority of our long-term leases require that a high percentage of the containers are returned in Asia, primarily in China. If long-term trade patterns change, it may not be economically desirable to have the bulk of our containers returned in China at the end of long-term leases. Any such increases in costs to reposition our containers could harm our business, results of operations and financial condition.
A contraction or slowdown in containerized cargo growth or negative containerized cargo growth would lead to a surplus of containers and a lack of storage space, which could negatively impact us.
We depend on third party depot operators to repair and store our equipment in port areas throughout the world. Growth in the world’s container fleet has significantly outpaced growth in depot capacity and even in the current period of historically high utilization, we continue to experience limited depot capacity in certain major port cities. Additionally, the land occupied by depots is increasingly being considered prime real estate, as it is coastal land in or near major cities, and this land may be developed into other uses or there may be increasing restrictions on depot operations by local communities. This trend has already caused depot storage costs to increase and could further increase depots’ costs and in some cases force depots to relocate to sites further from the port areas. If these changes affect a large number of our depots, or if we experience a period of lower container utilization, it could significantly increase the cost of maintaining and storing our off-hire containers. Additionally, if depot space is unavailable, we may be unable to accept returned containers from lessees, which may cause us to breach our lease agreements. The current period of very high container utilization may further add financial stress to third party depots as they are receiving limited amounts for storing containers. This financial stress could cause depot closures and further exacerbate the risks we face from limited container storage space.
If we are unable to lease our new containers shortly after we purchase them, our business, results of operations, cash flows and financial condition may be harmed.
Lease rates for new containers are positively correlated to the fluctuations in the price of new containers, which is positively correlated with the price of steel, a major component used in the manufacture of new containers. If we are unable to lease the new containers that we purchase within a short period of time of such purchase, the market price of new containers and the corresponding market lease rates for new containers may decrease, regardless of the higher cost of the previously purchased containers. Additionally, if we believe new container prices are attractive, we may purchase more containers than we have immediate demand for if we expect container prices or lease rates may rise. If prices do not rise or new container demand weakens, we may be unable to lease this speculative inventory on attractive terms or at all. Declines in new container prices, lease rates, or the inability to lease new containers could harm our business, results of operations and financial condition.
Consolidation of container manufacturers or the disruption of manufacturing for the major manufacturers could result in higher new container prices and/or decreased supply of new containers. Any material increase in the cost or reduction in the supply of new containers could harm our business, results of operations and financial condition.
We currently purchase substantially all our containers from manufacturers based in the PRC. If it were to become more expensive for us to procure containers in the PRC or to transport these containers at a low cost from the manufacturer to the locations where they are needed by our container lessees because of changes in exchange rates between the U.S. Dollar and Chinese Yuan, consolidation among container suppliers, increased tariffs imposed by the U.S. or other governments, changing trade patterns, increased fuel costs, increased labor costs, or for any other reason, we may have to seek alternative sources of supply and we may not be able to make alternative arrangements quickly enough to meet our container needs, and the alternative arrangements may increase our costs.
The availability and price of containers depend significantly on the demand, available capacity and bargaining position of the major container manufacturers. Three major manufacturers have approximately 80% of that industry’s market share. Additionally, one of the major container manufacturers is under common ownership with a large container lessor, which may impact our ability to competitively source containers from this manufacturer. This market structure and the commodity inputs used in manufacturing have led to significant variability in container prices. In particular, the increased focus on environmental matters in China may reduce the supply (and increase the cost) of steel and other raw materials used in our containers and the mandatory use of water borne paint by all container factories in China has already increased the cost of containers and created container production constraints. If an increased cost of purchasing containers is not matched by a
13
corresponding increase in lease rates, or if we have difficulty in sourcing containers, our business, results of operations and financial condition would be harmed.
Sustained reduction in the production of new containers could harm our business, results of operations and financial condition.
Container manufacturing shutdowns in China in the wake of the financial crisis drastically reduced the production of standard dry freight containers from the fourth quarter of 2008 through the end of 2009, combined with continued retirement of older containers in the ordinary course, led to a decline in the world container fleet of approximately 4% in 2009, creating a shortage of containers. During the period of shutdowns, container manufacturers lost up to 60% of their skilled work force and had limited production capacity in 2010 as they had to hire and train a new skilled work force. Although manufacturers resumed production in 2011 and have continued steady production, if there is a sustained reduction in the production of new containers due to the Novel Coronavirus or otherwise, it could impact our ability to expand our fleet, which could harm our business, results of operations and financial condition.
We face extensive competition in the container leasing industry.
We may be unable to compete favorably in the highly competitive container leasing and container management businesses. We compete with a relatively small number of major leasing companies, many smaller lessors, companies, and financial institutions offering finance leases, and promoters of container ownership and leasing as a tax-efficient investment. Some of these competitors may have greater financial resources and access to capital than we do. Additionally, some of these competitors may have large, underutilized inventories of containers, which could, if leased, lead to significant downward pressure on per diem rates, margins, and prices of containers. Competition among container leasing companies depends upon many factors, including, among others: per diem rates; supply reliability; lease terms, including lease duration, drop-off restrictions and repair provisions; customer service; and the location, availability, quality, and individual characteristics of containers. In recent years, several container leasing companies have acquired other container lessors and we may face increased competition from these merged firms. Following the completion of each consolidation, the new entity may face further pressure for fleet growth and may compete even more aggressively, causing further declines in rental rates available from container leases. New entrants into the leasing business may be attracted by the historically high rate of containerized trade growth, access to the capital markets and low pricing for containers. New entrants may be willing to offer pricing or other terms that we are unwilling or unable to match. Additionally, the management agreements under which we manage containers for other parties do not restrict these container investors from having other container fleets managed by competing leasing companies or from directly competing with us.
Our lessees may decide to buy, rather than lease their containers.
We, like other suppliers of leased containers, are dependent upon decisions by shipping lines to lease rather than to buy their container equipment. Shipping lines own a significant amount of the world’s intermodal containers and effectively compete with us. In part due to constraints on their financing and need to allocate capital to new ship purchases, scrubber installations for low sulphur emissions compliance and port terminals, in recent years, shipping lines have generally reduced their purchases of new containers. However, following several years of record profits, in 2022 shipping lines increased the percentage of containers that they purchased rather than leased. In 2022, we believe that approximately 40% of all shipping containers were purchased by leasing companies. In 2022 and 2021, shipping lines continued to report historic profitability and they may have additional financial resources in the future to allocate to container purchases. Should shipping lines decide to buy a larger percentage of the containers they operate, our utilization rate would decrease, resulting in decreased leasing revenues, increased storage costs and increased repositioning costs. A decrease in the portion of leased containers would also reduce our investment opportunities and significantly constrain our growth.
Use of counterfeit and improper refrigerant in refrigeration machines for refrigerated containers could cause irreparable damage to the refrigeration machines, death, or personal injury, and materially impair the value of our refrigerated container fleet.
In past years, there were a limited number of reports of counterfeit and improper refrigerant gas being used to service refrigeration machines in depots primarily in Asia. The use of this counterfeit gas has led to the explosion of several refrigeration machines. Several of these incidents resulted in personal injury or death, and in all cases, the counterfeit gas led to irreparable damage to the refrigeration machines.
14
Safer testing procedures were developed and implemented by refrigeration manufacturers and industry participants in order to determine whether counterfeit or improper gas was used to service a refrigeration machine. However, there can be no assurance that these procedures will prove to continue to be reliable and cost effective. If industry procedures and tests are not proven safe and effective or if the use of such counterfeit and improper refrigerant recurs and is widespread or other counterfeit refrigerant issues emerge in the future, the value of our refrigerated container fleet and our ability to lease refrigerated containers could be materially impaired and could therefore have a material adverse effect on our financial condition, results of operations and cash flows. Additionally, we might be subject to claims for damages by parties injured by contaminated refrigeration machinery operated by our lessees which may materially adversely affect us.
Risks Arising From the International Operations
The international nature of the container shipping industry exposes us to numerous risks.
We are subject to risks inherent in conducting business across national boundaries, any one of which could adversely impact our business. These risks include:
One or more of these factors or other related factors may impair our current or future international operations and, as a result, harm our business, results of operations and financial condition.
15
Our results of operations are subject to changes resulting from the political and economic policies of the PRC and economic activity in the PRC.
A substantial portion of our containers are leased out from locations in the PRC. The main manufacturers of containers are also located in the PRC. The political and economic policies of the PRC and the level of economic activity in the PRC may have a significant impact on our company and our financial performance.
Changes in the political leadership of the PRC may have a significant effect on laws and policies that impact economic growth and trade and the corresponding need for containers to ship goods from the PRC, including the introduction of measures to control inflation, changes in the rate or method of taxation, and the imposition of additional restrictions on currency conversion, remittances abroad, and foreign investment. Moreover, economic reforms and growth in the PRC have been more successful in certain provinces than in others, and the continuation of or increases in such disparities could affect the political or social stability of the PRC. Furthermore, the current high level of debt by some companies in China may lead to defaults which may not be supported by the Chinese government. In recent years the rate of economic growth in the PRC has declined. Additionally, government policies that reduce the emphasis on manufacturing and increase priorities for domestic consumption and services may alter trade patterns and dampen demand for containers. Chinese government environmental policies and practices may reduce steel production which would impact container costs and may limit factory production, which could impact trade growth and container demand.
A large number of our shipping line customers are domiciled either in the PRC (including Hong Kong) or in Taiwan. In 2022, approximately 19% of our total lease billing was attributable to shipping line customers that were either domiciled in the PRC (including Hong Kong) or in Taiwan. Substantially, all container manufacturing facilities from which we purchased our containers in 2022 are located in the PRC. A reduced rate of economic growth, changes to economic or trade policy or political instability in either the PRC or Taiwan could have a negative effect on our major customers, our ability to obtain containers and correspondingly, our results of operations and financial condition.
The legal systems in the PRC and other jurisdictions have inherent uncertainties that could limit the legal protections available to us and even if legal judgments are obtained, collection may be difficult.
We currently purchase substantially all our containers from manufacturers based in the PRC. In addition, a substantial portion of our containers are leased out from locations in the PRC. California law governs almost all of these agreements. However, disputes or settlements arising out of these agreements may need to be enforced in the PRC. The PRC legal system is based on written statutes. Prior court decisions may be cited for reference but have limited precedential value. Since 1979, PRC legislation and regulations have significantly enhanced the protections afforded to various forms of foreign investments in the PRC. However, since these laws and regulations are relatively new and the PRC legal system continues to evolve, the interpretations of many laws, regulations and rules are not always uniform and may be subject to considerable discretion, variation, or influence by external forces unrelated to the legal merits of a particular matter. The enforcement of these laws, regulations, and rules involves uncertainties that may limit remedies available to us. Any litigation or arbitration in the PRC may be protracted and may result in substantial costs and diversion of resources and management attention. In addition, the PRC may enact new laws or amend current laws that may be detrimental to us, which may have a material adverse effect on our business operations. If we are unable to enforce any legal rights that we may have under our contracts or otherwise in the PRC, our ability to compete and our results of operations could be harmed.
In addition, as our containers are used in trade involving goods being shipped to locations throughout the world, it is not possible to predict, with any degree of certainty, the jurisdictions in which enforcement proceedings may be commenced. Litigation and enforcement proceedings have inherent uncertainties in any jurisdiction and are expensive. These uncertainties are enhanced in countries that have less developed legal systems where the interpretation of laws and regulations is not consistent, may be influenced by factors other than legal merits and may be cumbersome, time-consuming and even more expensive. For example, repossession from defaulting lessees may be difficult and more expensive in jurisdictions whose laws do not confer the same security interests and rights to creditors and lessors as those in the United States and where the legal system is not as well developed. Additionally, even if we are successful in obtaining judgments against defaulting lessees, these lessees may have limited owned assets and/or heavily encumbered assets and the collection and enforcement of a monetary judgment may be unsuccessful. As a result, the remedies available and the relative success and expedience of collection and enforcement proceedings with respect to the containers in various jurisdictions cannot be predicted.
16
Because substantially all of our revenues are generated in U.S. dollars, but a significant portion of our expenses are incurred in other currencies, exchange rate fluctuations could have an adverse impact on our results of operations.
The U.S. dollar is our primary operating currency. Almost all of our revenues are denominated in U.S. dollars, and approximately 72% of our direct container expenses - owned fleet were denominated in U.S. dollars for the year ended December 31, 2022. Accordingly, a significant amount of our expenses is incurred in currencies other than the U.S. dollar. This difference could lead to fluctuations in net income due to changes in the value of the U.S. dollar relative to the other currencies. During 2022, 2021 and 2020, 28%, 21% and 28%, respectively, of our direct container expenses – owned fleet were paid in different foreign currencies. A decrease in the value of the U.S. dollar against non-U.S. currencies in which our expenses are incurred translates into an increase in those expenses in U.S. dollar terms, which would decrease our net income. While the prices of the used containers we trade or dispose are primarily quoted and billed in U.S. dollars, declines in the currencies where these containers are sold relative to the U.S. dollar can serve to reduce the market prices for used containers, which will decrease our net income. We do not engage in foreign currency hedging activities which might reduce the volatility associated with exchange rates.
Terrorist attacks, the threat of such attacks or the outbreak of war and hostilities could negatively impact our operations and profitability and may expose us to liability.
Terrorist attacks and the threat of such attacks have contributed to economic instability in the U.S. and elsewhere, and further acts or threats of terrorism, violence, war, or hostilities could similarly affect world trade and the industries in which we and our container lessees operate. For example, worldwide containerized trade dramatically decreased in the immediate aftermath of the September 11, 2001 terrorist attacks in the U.S., which affected demand for leased containers. In addition, terrorist attacks, threats of terrorism, violence, war, or hostilities may directly impact ports, depots, our facilities or those of our suppliers or container lessees and could impact our sales and our supply chain. A severe disruption to the worldwide ports system and flow of goods could result in a reduction in the level of international trade and lower demand for our containers.
Our lease agreements require our lessees to indemnify us for all costs, liabilities and expenses arising out of the use of our containers, including property damage to the containers, damage to third-party property and personal injury. However, our lessees may not have adequate resources to honor their indemnity obligations after a terrorist attack. Accordingly, we may not be protected from liability (and expenses in defending against claims of liability) arising from a terrorist attack.
Risks Related to Our Business Operations
We rely on our proprietary information technology systems to conduct our business. If these systems fail to perform their functions adequately, or if we experience an interruption in their operation, our business, results of operations and financial condition could be harmed.
The efficient operation of our business is highly dependent on our proprietary information technology systems. We rely on our systems to record transactions, such as repair and depot charges, purchases and disposals of containers and movements associated with each of our owned or managed containers. We use the information provided by these systems in our day-to-day business decisions in order to effectively manage our lease portfolio, reduce costs and improve customer service. We also rely on these systems for the accurate tracking of the performance of our managed fleet for each container investor. In 2020, we commenced efforts to replace several legacy computer systems that are central to our business operations, and we implemented our new enterprise resource planning “ERP” system in 2022 to enhance the efficiency and effectiveness of our internal administrative activities and certain financial accounting and reporting processes. The failure of our systems to perform as we expect, or any failure to successfully replace our legacy systems, could disrupt our business, adversely affect our results of operations and cause our relationships with lessees and container investors to suffer. Our information technology systems are vulnerable to damage or interruption from circumstances beyond our control, including fire, natural disasters, power loss and computer systems failures and viruses or cyber-attacks. Even though we have developed redundancies and other contingencies to mitigate any disruptions to our information technology systems, these redundancies and contingencies may not completely prevent interruptions to our information technology systems. In recent years we have moved various information technology systems and data to cloud-based storage providers and software vendors. We face additional risks
17
from relying on third parties to store, process and manage our data and software. Any such interruptions could harm our business, results of operations and financial condition.
Cyber-attacks and/or information technology security breaches on us or our customers could materially and adversely affect us.
If we, our customers or other third parties with which we do business were to fall victim to successful cyber-attacks or experience other cybersecurity incidents that cause system failure, downtime, or the loss of sensitive data, we may incur substantial costs and suffer other negative consequences. Our ability to handle the delivery and return of containers, lease billing, and the sale of older containers is dependent on the stable operation of our information technology systems. Our customers’ ability to generate revenue and make timely payments to us is similarly dependent on the stable operation of their information technology systems. Successful breaches, employee malfeasance, or human or technological error could result in, for example, unauthorized access to, disclosure, modification, misuse, loss, or destruction of company, customer, or other third-party data or systems; theft of sensitive, regulated, or confidential data; the loss of access to critical data or systems through ransomware, destructive attacks, or other means; and business delays, service or system disruptions or denials of service.
Cybersecurity incidents have increased in number and severity, and it is expected that these trends will continue. Should the Company be affected by such an incident, we may incur substantial costs and suffer other negative consequences, which may include substantial remediation costs, such as liability for stolen assets or information, repairs of system damage, and incentives to customers or business partners in an effort to maintain relationships after an attack, as well as litigation and legal risks.
We face risks from our tank container management agreement with Trifleet Leasing (The Netherlands) B.V.
We entered into a tank container management agreement with Trifleet Leasing (The Netherlands) B.V. (“Trifleet”) in June 2013. Under this agreement, we invest funds with Trifleet for the purchase and leasing of tank containers. Trifleet is our exclusive manager for investments in tank containers. Intermodal tank containers are used for the transport and storage of liquid foodstuffs, chemicals, and gases. This is a specialized market subject to a number of regulations and strict operating procedures. As Trifleet is investing funds on our behalf in tank containers, our return on any investments under this management agreement are highly reliant on their skill and performance, as well as the overall investment climate for tank containers. While we approve of the amounts committed under the management agreement, Trifleet selects the lessees, negotiates lease terms, determines equipment specifications, negotiates equipment orders and supervises production, and is responsible for all other management activities including customer billing, equipment return, re-leasing, maintenance, and repairs. If Trifleet or the tank container market does not perform as we anticipate, we may not receive adequate returns on our investment and our results could be materially impacted. Additionally, given the nature of tank containers and their cargos, our ownership of tank containers could expose us to different and additional risks than we generally face as the owner and lessor of dry freight and refrigerated containers. While lessees, Trifleet and ourselves all maintain insurance, and lessees agree to accept liability for claims caused by the operation of tank containers, this may still be inadequate to shield us from costs and liability from any claims arising from tank containers that we own pursuant to the Trifleet management agreement. In December 2020, Trifleet was purchased by GATX Corporation, a publicly traded company that primarily leases railcars. Given the sale of Trifleet, we may face additional risks in the continued performance of our tank investments managed by Trifleet and in our continued relationship with Trifleet.
If our insurance is inadequate or if we are unable to obtain insurance, we may experience losses.
Under all of our leases, our lessees are generally responsible for loss of or damage to a container beyond ordinary wear and tear, and they are required to purchase insurance to cover any other liabilities. Our depots are also required to maintain insurance and indemnify us against losses. We also maintain our own insurance to cover our containers when they are not on-hire to lessees or when the lessee fails to have adequate primary coverage, and third-party liability insurance for both on-hire and off-hire containers. In addition, we previously maintained insurance that, after satisfying significant deductibles, would cover loss of revenue as a result of default under most of our leases, as well as the recovery cost or replacement value of most of our containers. Given the high premium, significant deductible, and policy exclusions in this policy, we determined to lapse our coverage since 2021. Lessees’ and depots’ insurance policies and indemnity rights may not protect us against losses. Our own insurance may prove to be inadequate or have too high deductibles to prevent against losses or in the future coverage may be unavailable or uneconomic, and losses could arise from a lack of insurance coverage.
18
The U.S. government has special contracting requirements that create additional risks.
In January 2019, we were informed that the U.S. Transportation Command Directorate of Acquisition (“USTranscom”) had issued a multi-vendor contract that included us as one of the vendors selected to supply leased marine containers and intermodal equipment to the U.S. Military. As a multi-vendor contract, there is no guarantee that the U.S. Military will accept our bids to supply containers and related services. Thus, expected revenues from the USTranscom contract are difficult to predict and may not materialize or prove profitable. If we do not perform in accordance with the terms of the USTranscom contract, we may receive a poor performance report that would be considered by the U.S. Military in making any future awards.
In contracting with the U.S. Military, we are subject to U.S. government contract laws, regulations and other requirements that impose risks not generally found in commercial contracts. For example, U.S. government contracts require contractors to comply with a number of socio-economic requirements and to submit periodic reports regarding compliance, are subject to audit and modification by the U.S. government in its sole discretion, and impose certain requirements relating to software and/or technical data that, if not followed, could result in the inadvertent grant to the U.S. government of broader licenses to use and disclose such software or data than intended.
These laws, regulations and contract provisions also permit, under certain circumstances, the U.S. government unilaterally to:
In addition, the U.S. Military may terminate the USTranscom contract either for its convenience at any time or if we default by failing to perform in accordance with the contract schedule and terms. Termination for convenience provisions generally enable the contractor to recover only those costs incurred or committed, and settlement expenses and profit on the work completed prior to termination. Termination for default provisions do not permit these recoveries and make the contractor liable for excess costs incurred by the U.S. Military in procuring undelivered items from another source.
In addition, the U.S. government could bring criminal and civil charges against us based on intentional or unintentional violations of the representations and certifications that we have made in the USTranscom contract. Although adjustments arising from U.S. government audits and reviews have not seriously harmed our business in the past, future audits and reviews could cause adverse effects. We could also suffer serious harm to our reputation if allegations of impropriety were to be made against us.
We may choose to pursue acquisitions or joint ventures that could present unforeseen integration obstacles or costs and we face risks from our joint venture.
We may pursue acquisitions and joint ventures. Acquisitions involve a number of risks and present financial, managerial and operational challenges, including:
In addition, we may encounter unforeseen obstacles or costs in the integration of acquired businesses. Also, the presence of one or more material liabilities of an acquired company that are unknown to us at the time of acquisition may have a
19
material adverse effect on our business. Acquisitions or joint ventures may not be successful, and we may not realize any anticipated benefits from acquisitions or joint ventures.
Our senior executives are critical to the success of our business and any inability to retain them or recruit and successfully integrate new personnel could harm our business, results of operations and financial condition.
Our senior management has a solid history in the container leasing industry. We rely on this knowledge and experience in our strategic planning and in our day-to-day business operations. Our success depends in large part upon our ability to retain our senior management, the loss of one or more of whom could have a material adverse effect on our business.
Our success also depends on our ability to retain our experienced sales force and technical personnel as well as recruit new skilled sales, marketing, and technical personnel. Competition for these individuals in our industry is intense and we may not be able to successfully recruit, train or retain qualified personnel. If we fail to retain and recruit the necessary personnel, our business, and our ability to obtain new container lessees and provide acceptable levels of customer service could suffer. We have “at will” employment agreements with all of our executive officers.
The lack of an international title registry for containers increases the risk of ownership disputes.
Although the Bureau International des Containers registers and allocates a four letter prefix to every container in accordance with ISO standard 6346 (Freight container coding, identification and marking) to identify the owner/operator and each container has a unique prefix and serial number, there is no internationally recognized system of recordation or filing to evidence our title to containers nor is there an internationally recognized system for filing security interests in containers. Although this has not occurred to date, the lack of a title recordation system with respect to containers could result in disputes with lessees, end-users, or third parties who may improperly claim ownership of containers.
We may incur costs associated with cargo security regulations, which may adversely affect our business, results of operations and financial condition.
We may be subject to regulations promulgated in various countries, including the U.S., seeking to protect the integrity of international commerce and prevent the use of containers for international terrorism or other illicit activities. For example, the Container Security Initiative, the Customs-Trade Partnership Against Terrorism and Operation Safe Commerce are among the programs administered by the U.S. Department of Homeland Security that are designed to enhance security for cargo moving throughout the international transportation system by identifying existing vulnerabilities in the supply chain and developing improved methods for ensuring the security of containerized cargo entering and leaving the U.S. Moreover, the International Convention for Safe Containers, 1972, as amended, adopted by the International Maritime Organization, applies to containers, and seeks to maintain a high level of safety of human life in the transport and handling of containers by providing uniform international safety regulations. As these regulations develop and change, we may incur compliance costs due to the acquisition of new, compliant containers and/or the adaptation of existing containers to meet new requirements imposed by such regulations. Additionally, certain companies are currently developing or may in the future develop products designed to enhance the security of containers transported in international commerce. Regardless of the existence of current or future government regulations mandating the safety standards of intermodal shipping containers, our competitors may adopt such products, or our container lessees may require that we adopt such products. In responding to such market pressures, we may incur increased costs, which could have a material adverse effect on our business, results of operations and financial condition.
Environmental liability and regulations may adversely affect our business, results of operations and financial condition.
We are subject to federal, state, local and foreign laws and regulations relating to the protection of the environment, including those governing the discharge of pollutants to air, ground and water, the management and disposal of hazardous substances and wastes and the cleanup of contaminated sites. We could incur substantial costs, including cleanup costs, fines and costs arising out of third-party claims for property or natural resource damage and personal injury, as a result of violations of or liabilities under or compliance with environmental laws and regulations in connection with our or our lessees’ current or historical operations. Under some environmental laws in the U.S. and certain other countries, the owner or operator of a container may be liable for environmental damage, cleanup, or other costs in the event of a spill or discharge of material from
20
the container without regard to the fault of the owner or operator. While we typically maintain certain limited liability insurance and typically require lessees to provide us with indemnity against certain losses, the insurance coverage may not be sufficient to protect against any or all liabilities and such indemnities may not be sufficient, or available, to protect us against losses arising from environmental damage. Moreover, our lessees may not have adequate resources, or may refuse to honor their indemnity obligations and our insurance coverage is subject to large deductibles, coverage limits and significant exclusions.
Environmental regulations also impact container production and operation, including regulations on the use of chemical refrigerants due to their ozone depleting and global warming effects. Our refrigerated containers currently use R134A refrigerant. While R134A does not contain chlorofluorocarbons (“CFCs”), the European Union (“EU”) instituted regulations to phase out the use of R134A in automobile air conditioning systems which began in 2011 due to concern that the release of R134A into the atmosphere may contribute to global warming. While the European Union regulations do not currently restrict the use of R134A in refrigerated containers or trailers, it is possible that the phase out of R134A in automobile air conditioning systems will be extended to containers in the future and our operations could be impacted. It has been proposed that R134A usage in containers be banned beginning in 2025, although the final decision has not been made as of yet.
Container production also raises environmental concerns. The floors of dry freight containers are plywood typically made from tropical hardwoods. Due to concerns regarding de-forestation and climate change, many countries have implemented severe restrictions on the cutting and export of this wood. Accordingly, container manufacturers have switched a significant portion of production to alternatives such as birch, bamboo, and other farm grown wood and users are also evaluating alternative designs that would limit the amount of plywood required and are also considering possible synthetic materials. New woods or other alternatives have not proven their durability over the typical life of a dry freight container, and if they cannot perform as well as the hardwoods have historically, the future repair and operating costs for these containers may be impacted. The insulation foam in the walls of certain refrigerated containers requires the use of a blowing agent that contains CFCs. Manufacturers are phasing out the use of this blowing agent in manufacturing, however, if future regulations prohibit the use or servicing of containers with insulation manufactured with this blowing agent, we could be forced to incur large retrofitting expenses and these containers might bring lower rental rates and disposal prices. EU regulations currently restrict the sale or use of refrigerated containers manufactured with the CFC containing blowing agent and strict enforcement of these regulations could impact our ability to lease or sell these refrigerated containers in EU countries. The container industry in China historically used solvent-based paint systems. Regulations in China for the container industry required stopping the use of solvent-based paint systems in 2017, due to the restrictions on volatile organic compounds used in solvent-based paints. To comply with the regulations, new water borne paint systems were developed and are being used by container manufacturers. The use of water borne paint systems has required significant factory investment and it is problematic to apply water borne paint during the winter in colder parts of China. The conversion to water borne paint impacts factory capacity, increases the cost of containers and requires greater investment by us in container inspection and factory supervision. The industry does not have significant years of experience with water borne paint and the long term durability of water borne paint may not be the same as solvent based paint which could impact the useful life and resale value of containers with water borne paint.
We are subject to certain U.S. laws that may impact our international operations and any investigation or determination that we violated these laws may affect our business and operations adversely.
As a Bermuda corporation that has an indirect wholly-owned U.S. subsidiary with operations in the U.S., our U.S. operations are subject to certain U.S. laws that may also impact our international operations. We are subject to the regulations imposed by the Foreign Corrupt Practices Act, which generally prohibits U.S. companies and their intermediaries from making improper payments to foreign officials for the purpose of obtaining or keeping business. We are also subject to U.S. Executive Orders and U.S. Treasury sanctions regulations restricting or prohibiting business dealings in or with certain nations and with certain specially designated nationals (individuals and legal entities). Any determination or investigation into violations of these laws and regulations could have a material adverse effect on our business, financial condition, results of operations and cash flows.
We could face litigation involving our management of containers for container investors.
We manage containers for container investors under management agreements that are negotiated with each container investor. We make no assurances to container investors that they will make any amount of profit on their investment or that our management activities will result in any particular level of income or return of their initial capital. Although our
21
management agreements contain contractual protections and indemnities that are designed to limit our exposure to such litigation, such provisions may not be effective, and we may be subject to a significant loss in a successful litigation by a container investor.
Tax Risks Related to Our Business and Investment in Our Common and Preferred Shares
U.S. investors in our company could suffer adverse tax consequences if we are characterized as a passive foreign investment company for U.S. federal income tax purposes.
Based upon the nature of our business activities, we could become classified as a passive foreign investment company (“PFIC”) for U.S. federal income tax purposes. Such characterization could result in adverse U.S. tax consequences to direct or indirect U.S. investors in our common and preferred shares. For example, if we are a PFIC, our U.S. investors could become subject to increased tax liabilities under U.S. tax laws and regulations and could become subject to burdensome reporting requirements. The determination of whether or not we are a PFIC is made on an annual basis and depends on the composition of our income and assets from time to time. Specifically, for any taxable year we will be classified as a PFIC for U.S. tax purposes if either:
In applying these tests, we are treated as owning or generating directly our pro rata share of the assets and income of any corporation in which we own at least 25% by value. In addition, the composition of our income and assets will be affected by how, and how quickly, we spend the cash we have raised.
Under the PFIC rules, unless a U.S. investor is permitted to and does elect otherwise under the Internal Revenue Code, such U.S. investor would be liable to pay U.S. federal income tax at the then prevailing income tax rates on ordinary income plus interest upon excess distributions and upon any gain from the disposition of our common and preferred shares, as if the excess distribution or gain had been recognized ratably over the investor’s holding period for our common and preferred shares. Based on the composition of our income, valuation of our assets, and our election to treat certain of our subsidiaries as disregarded entities for U.S. federal income tax purposes, we do not believe we were a PFIC for any period after our initial public offering (“IPO”) date and we do not expect that we should be treated as a PFIC for our current taxable year. However, there can be no assurance at all in this regard. Because the PFIC determination is highly fact intensive and made at the end of each taxable year, it is possible that we may be a PFIC for the current or any future taxable year or that the U.S. Internal Revenue Service (“IRS”) may challenge our determination concerning our PFIC status.
We may become subject to unanticipated tax liabilities that may have a material adverse effect on our results of operations.
Textainer Group Holdings Limited is a Bermuda company, and we believe that a significant portion of the income derived from our operations will not be subject to tax in Bermuda, which currently has no corporate income tax, or in many other countries in which we conduct activities or in which our customers or containers are located. However, this belief is based on the anticipated nature and conduct of our business, which may change. It is also based on our understanding of our position under the tax laws of the countries in which we have assets or conduct activities. This position is subject to review and possible challenge by taxing authorities and to possible changes in law that may have retroactive effect.
A portion of our income is treated as effectively connected with our conduct of a trade or business within the U.S., and is accordingly subject to U.S. federal income tax. It is possible that the IRS may challenge that a greater portion of our income is effectively connected income that should be subject to U.S. federal income tax.
Our results of operations could be materially and adversely affected if we become subject to a significant amount of unanticipated tax liabilities.
22
Our U.S. subsidiaries may be treated as personal holding companies for U.S. federal tax purposes now or in the future.
Any of our direct or indirect U.S. subsidiaries could be subject to additional U.S. tax on a portion of its income if it is considered to be a personal holding company (“PHC”) for U.S. federal income tax purposes. This status depends on whether more than 50% of the subsidiary’s shares by value could be deemed to be owned (taking into account constructive ownership rules) by five or fewer individuals and whether 60% or more of the subsidiary’s adjusted ordinary gross income consists of “personal holding company income,” which includes certain forms of passive and investment income. The PHC rules do not apply to non-U.S. corporations. We believe that none of our U.S. subsidiaries should be considered PHCs. In addition, we intend to cause our U.S. subsidiaries to manage their affairs in a manner that reduces the possibility that they will meet the 60% income threshold. However, because of the lack of complete information regarding our ultimate share ownership (i.e., particularly as determined by constructive ownership rules), our U.S. subsidiaries may become PHCs in the future and, in that event, the amount of U.S. federal income tax that would be imposed could be material.
Changes in tax laws or their application could adversely affect the results of our operations.
Our worldwide operations are taxed under the laws of the jurisdictions in which we operate. However, the integrated nature of our worldwide operations can produce conflicting claims from revenue authorities in different countries as to the profits to be taxed in the individual countries, including disputes relating to transfer pricing. Some of the jurisdictions in which we operate have double tax treaties with other foreign jurisdictions, which provide a framework for mitigating the impact of double taxation on our revenues and capital gains. However, mechanisms developed to resolve such conflicting claims are largely uncertain and can be expected to be very lengthy in coming to a final determination in the applicable jurisdictions.
In recent years, tax authorities around the world have increased their scrutiny of company tax filings and have become more rigid in exercising any discretion they may have. As part of this, the Organization for Economic Co-operation and Development (“OECD”) has proposed a number of tax law changes under its Base Erosion and Profit Shifting (“BEPS”) Action Plans to address issues of transparency, coherence and substance.
These OECD tax reform initiatives also need local country implementation, including in Bermuda and the U.S., which may result in significant changes to established tax principles. In response to EU efforts to investigate the tax policies of non-EU jurisdictions, effective December 31, 2018 Bermuda adopted the Economic Substance Act of 2018, which requires that Bermuda registered entities engaged in certain relevant activities (which include finance, leasing and shipping) maintain sufficient economic substance and activities in Bermuda. The failure to comply with the Economic Substance Act may result in fines and penalties and ultimately the striking off of an entity from the Bermuda corporate register. We may be unable to comply with the Economic Substance Act or compliance with the act may materially adversely impact our operations and results. Penalties for noncompliance could adversely affect our operations and results.
On March 27, 2020, the US Coronavirus Aid, Relief, and Economic Security Act (“CARES”) of 2020 was signed into law. For applicable impacted years, the CARES Act introduced measures such as (1) additional carryback years as well as the elimination of the 80% taxable income limitation on net operating losses (“NOL”) usage; (2) enhanced interest deductibility on 163(j) business interest expense (raising adjusted taxable income deduction limit threshold from 30% to 50%); (3) accelerated alternative minimum tax credit refunds; (4) retroactive technical correction of qualified improvement property costs recovery period; (5) enhanced deductibility of charitable contributions from 10% of taxable income limitation to 25%; and (6) introduced payroll tax deferral programs and loan forgiveness programs (Paycheck Protection Program). None of these measures have a material impact on the Company’s tax situation.
Increases in income tax rates or other changes in tax laws, including changes in how existing tax laws are interpreted or enforced, may adversely affect our financial performance. For example, numerous countries have agreed to a statement in support of the OECD model rules that propose a partial global profit reallocation and a global minimum tax rate of 15% and European Union member states have recently agreed to implement the global minimum tax. There can be no assurance that other individual countries will adopt these changes, or that once adopted by any country, that these changes will not have adverse effects on our financial performance.
In general, such tax reform efforts, including with respect to tax base or rate, transfer pricing, intercompany dividends, cross border transactions, controlled corporations, and limitations on tax relief allowed on the interest on intercompany debt,
23
will require us to continually assess our organizational structure against tax policy trends, and could lead to an increased risk of international tax disputes and an increase in our effective tax rate, and could adversely affect our financial results.
Our ability to use our net operating losses to offset future taxable income may be subject to certain limitations.
We have significant net operating loss carry-forwards in the United States. As of December 31, 2022, we had net operating loss carry-forwards relating to U.S. federal income taxes; $69,807 which will begin to expire from December 31, 2032 through December 31, 2037 if not utilized and $6,943 has no expiration date.
In the United States, utilization of these net operating loss carry-forwards for federal income tax purposes may be subject to an annual limitation if there is an ownership change within the meaning of Section 382 of the Internal Revenue Code (“Section 382”). In general, an ownership change within the meaning of Section 382 occurs if a transaction or series of transactions over a three-year period result in a cumulative change of more than 50% in the beneficial ownership of a company’s stock. We do not believe we have a limitation on the ability to utilize our net operating loss carry-forwards under Section 382 as of December 31, 2022. However, issuances, sales and/or exchanges of our stock (including, potentially, relatively small transactions and transactions beyond our control) occurring after December 31, 2022, taken together with prior transactions with respect to our stock over a three-year period, could trigger an ownership change under Section 382 in the future and therefore a limitation on our ability to utilize our net operating loss carryforwards. Any such limitation could cause some loss carryforwards to expire before we would be able to utilize them to reduce taxable income in future periods, possibly resulting in a substantial income tax expense or write down of our tax assets or both.
The calculation of our income tax expense requires judgment and the use of estimates.
We periodically assess tax positions based on current tax developments, including enacted statutory, judicial, and regulatory guidance. In analyzing our overall tax position, consideration is given to the amount and timing of recognizing income tax liabilities and benefits. In applying the tax and accounting guidance to the facts and circumstances, income tax balances are adjusted appropriately through the income tax provision. We account for income tax positions on uncertainties by recognizing the effect of income tax positions only if those positions are more likely than not of being sustained and maintain reserves for income tax positions we believe are not more likely than not of being sustained. Recognized income tax positions are measured at the largest amount that is greater than 50% likely of being realized. However, due to the judgment required in estimating those reserves, actual amounts paid, if any, could differ from these estimates.
Risks Related to Our Common Shares, Preferred Shares and Public Listings
Any dividends paid in the future could be reduced or eliminated.
We eliminated our common share dividend payment in the fourth quarter of 2016. In the fourth quarter of 2021, we announced the commencement of dividends on our common shares. While common share dividends have been reinstated, any future dividend could again be eliminated or reduced. The declaration, amount and payment of future dividends are at the discretion of our board of directors and will be dependent on our future operating results and the cash requirements of our business. There are a number of factors that can affect our ability to pay dividends and there is no guarantee that we will pay dividends in any given year, in each quarter of a year, or pay any specific amount of dividends. In addition, we will not pay dividends in the event we are not allowed to do so under Bermuda law, are in default under (or such payment would cause a default under) TL’s revolving credit facilities or term loan, or if such payment would cause us to breach any of our covenants. These covenants include certain financial covenants, which would be directly affected by the payment of dividends, such as a maximum ratio of consolidated funded debt to consolidated tangible net worth (which amount would decrease by the amount of any dividend paid). The reduction, suspension or elimination of dividends may negatively affect the market price of our common and preferred shares. Furthermore, since we are a holding company, substantially all the assets shown on our consolidated balance sheet are held by our subsidiaries. Accordingly, our earnings and cash flow and our ability to pay dividends are largely dependent upon the earnings and cash flows of our subsidiaries and the distribution or other payment of such earnings to us in the form of dividends as permitted under our lending agreements.
24
We face risks from our share repurchase program.
In September 2019, we announced a share repurchase program to repurchase up to $25 million of our shares; the program has been increased several times and currently is authorized to repurchase up to a total of $450 million of our shares. Purchases under this program are at our discretion and we may not purchase all $450 million of shares authorized under the program. This program may be increased, reduced, or terminated at any time by us. Share repurchases may reduce our financial flexibility, limit our ability to reduce debt, limit our ability to continue or increase our dividend program and may reduce our funds available for container investments. Using funds to repurchase shares could cause our debt to equity ratio to increase and may impair our ability to comply with the financial covenants in our debt agreements. Share repurchases may also reduce the number of shares available for other investors to purchase in the market which could add to share price volatility for our stock. We face these and other risks related to share repurchases. During 2022, 2021 and 2020, the Company repurchased 5,636,772, 2,426,725 and 6,736,493 shares, respectively, for a total amount of approximately $179 million, $72 million and $69 million, respectively.
The market price and trading volume of our common and preferred shares, which may be affected by market conditions beyond our control, have been volatile and could continue to remain volatile.
The market price of our common and preferred shares has been and may continue to be highly volatile and subject to wide fluctuations. In addition, the trading volume in our common and preferred shares has fluctuated and may continue to fluctuate, causing significant price variations to occur. Since our initial public offering, our common shares have fluctuated from an intra-day low of $4.23 per share to an intra-day high of $43.96 per share. If the market price of the shares declines significantly, the value of an investment in our shares would decline. The market price of our common and/or preferred shares may fluctuate or decline significantly in the future. Some of the factors that could negatively affect the price of our common or preferred shares or result in fluctuations in the price or trading volume of our common or preferred shares include:
Recently and in the past, the stock market has experienced extreme price and volume fluctuations. These market fluctuations could result in extreme volatility in the trading price of our common or preferred shares, which could cause a decline in the value of your investment in our common or preferred shares. In addition, the trading price of our common or preferred shares could decline for reasons unrelated to our business or financial results, including in reaction to events that affect other companies in our industry even if those events do not directly affect us. You should also be aware that price volatility may be greater if the public float and trading volume of our common or preferred shares are low.
25
We face risks related to our dual listing on the Johannesburg Stock Exchange and our relationship with Trencor.
Trencor Limited, a company traded on the Johannesburg Stock Exchange (the “JSE”) in South Africa, owned approximately 47.5% of our issued and outstanding common shares as of December 31, 2018. In December 2019 we commenced a secondary, or dual, listing of our common shares on the JSE under the symbol “TXT”. Promptly following our dual listing, Trencor distributed approximately 24.3 million of its shares in the Company to Trencor’s own shareholders and these shares are now trading on the JSE. In June 2020, Trencor distributed its remaining 3.0 million shares in the Company to Trencor’s own shareholders and those shares trade on the JSE. Following the June 2020 distribution of shares, Trencor no longer holds any shares in the Company. One of our ten directors is also a director of Trencor, and this director owes fiduciary duties to each company and may have conflicts of interest in matters involving or affecting us as well as Trencor. Any sale or transfer of some or all of the common shares owned by large South African shareholders could adversely affect our share price.
While our primary listing remains on the New York Stock Exchange, or NYSE, and we follow the corporate governance requirements applicable to a Bermuda company listed as a foreign private issuer on the NYSE, holders of our TXT shares on the JSE, may seek to impose on us some or all of the corporate governance practices applicable to South African companies which may result in constraints on management and may involve significant costs. These include the King IV Report on Corporate Governance, a document accepted by the JSE and promulgated by the South African Institute of Directors which, among other things, suggests that corporations in their corporate decision-making consider the following stakeholders in addition to the owners of shares: parties who contract with the enterprise; parties who have a non-contractual nexus with the enterprise (including civil society and the environment); and the state.
Any future issuance of securities by us on the JSE would be subject to compliance with JSE rules and subject to review by the JSE and possibly South African exchange control regulations. These requirements could restrict or limit our ability to issue new shares in South Africa. If a significant percentage of our shares remain on the JSE, limits on our ability to issue new equity in South Africa could materially impact our ability to access capital for growth and negatively impact our business.
If we are unwilling or unable to comply with the current or future continuing listing requirements of the JSE we may have our shares delisted from the JSE. The JSE is the primary stock exchange in South Africa and there are restrictions on South African investors holding securities outside South Africa, including on the NYSE. A delisting from the JSE might cause significant sales of our common shares and negatively impact the price of our common shares on the NYSE. If we wish to voluntarily delist our shares from the JSE we may be required to provide a cash tender offer to all holders on the JSE and we may be unwilling or financially unable to do so, which could limit our ability to avoid negative share price impacts from any delisting of our common shares on the JSE.
We are a holding company with no material direct operations and rely on our operating subsidiaries to provide us with funds necessary to meet our financial obligations and to pay dividends.
We are a holding company with no material direct operations. Our principal assets are the equity interests we directly or indirectly hold in our operating subsidiaries, which own our operating assets. As a result, we are dependent on loans, dividends, and other payments from our subsidiaries to generate the funds necessary to meet our financial obligations and to pay dividends on our common and preferred shares. Our subsidiaries are legally distinct from us and may be prohibited or restricted from paying dividends or otherwise making funds available to us under certain conditions or lending covenants. If we are unable to obtain funds from our subsidiaries, we may be unable to, or our board may exercise its discretion not to pay dividends on our common or preferred shares.
It may not be possible for investors to enforce U.S. judgments against us.
We and all of our direct and indirect subsidiaries, except Textainer Equipment Management (U.S.) Limited and Textainer Equipment Management (U.S.) II LLC, are incorporated in jurisdictions outside the U.S. A substantial portion of our assets and those of our subsidiaries are located outside of the U.S. In addition, several of our directors are non-residents of the U.S., and all or a substantial portion of the assets of these non-residents are located outside the U.S. As a result, it may be difficult or impossible for U.S. investors to serve process within the U.S. upon us, our non-U.S. subsidiaries, or our directors, or to enforce a judgment against us for civil liabilities in U.S. courts. In addition, you should not assume that courts in the countries in which we or our subsidiaries are incorporated or where our assets or the assets of our subsidiaries are located would enforce judgments of U.S. courts obtained in actions against us or our subsidiaries based upon the civil liability provisions of applicable U.S. federal and state securities laws, or would enforce, in original actions, liabilities against us or our subsidiaries based on those laws.
26
We are a foreign private issuer and, as a result, under NYSE rules, we are not required to comply with certain corporate governance requirements.
As a foreign private issuer, we are permitted by the NYSE to comply with Bermuda corporate governance practice in lieu of complying with certain NYSE corporate governance requirements. This means that we are not required to comply with NYSE requirements that:
Our board of directors has adopted an audit committee charter, a compensation committee charter and a corporate governance and nominating committee charter. Additionally, we have a company code of conduct, corporate governance guidelines, conduct performance evaluations of our board and committees, and have obtained shareholder approval for our equity compensation plan. Our board of directors consists of a majority of independent directors and our Board committees consist solely of independent directors. However, we may use some of the exemptions available to a foreign private issuer. Accordingly, our shareholders may not have the same protections afforded to shareholders of companies that are subject to all of the NYSE corporate governance requirements.
Required public company corporate governance and financial reporting practices and policies have increased our costs, and we may be unable to provide the required financial information in a timely and reliable manner.
Our management may not be able to continue to meet the regulatory compliance and reporting requirements that are applicable to us as a public company. This result may subject us to adverse regulatory consequences and could lead to a negative reaction in the financial markets due to a loss of confidence in the reliability of our financial statements. If we do not maintain compliance with the requirements of Section 404 of the Sarbanes-Oxley Act of 2002, or if we or our independent registered public accounting firm identify deficiencies in our internal controls over financial reporting that are deemed to be material weaknesses, we could suffer a loss of investor confidence in the reliability of our financial statements, which could cause the market price of our shares to decline.
In addition, if we fail to maintain effective controls and procedures, we may be unable to provide the required financial information in a timely and reliable manner or otherwise comply with the standards applicable to us as a public company. Any failure by us to timely provide the required financial information could materially and adversely impact our financial condition and the market value of our shares. Furthermore, testing and maintaining internal controls can divert our management’s attention from other matters that are important to our business. These regulations have increased our legal and financial compliance costs, we expect the regulations to make it more difficult to attract and retain qualified officers and directors, particularly to serve on our audit and risk committee, and make some activities more difficult, time consuming and costly.
27
Future sales of a large number of our securities into the public market, or the expectation of such sales, could cause the market price of our common or preferred shares to decline significantly.
Sales of substantial amounts of common securities into the public market, or the perception that such sales will occur, may cause the market price of our common or preferred shares to decline significantly. In September 2012, we completed a sale of 8,625,000 common shares, including 2,500,000 common shares offered by a selling shareholder, Halco. The price of our shares could be negatively impacted if we undertake additional offerings to sell securities. In addition, at our 2019 Annual General Meeting our shareholders approved an amendment and restatement of the 2015 Share Incentive Plan as the 2019 Share Incentive Plan and to increase the maximum number of our common shares issuable pursuant to such plan by 2,500,000 shares and to extend the term of such plan for ten years from the date of the annual meeting of shareholders. The common shares to be issued pursuant to awards under our 2019 Share Incentive Plan have been registered on registration statements on Form S-8 filed with the Securities Exchange Commission and, when issued, will be freely tradable under the Securities Act of 1933.
We have provisions in our bye-laws and in our preferred shares that may discourage a change of control.
Bermuda law and our bye-laws contain provisions that could make it more difficult for a third party to acquire us without the consent of our board of directors. These include provisions:
These provisions may make it difficult and expensive for a third party to pursue a tender offer, change in control or takeover attempt that is opposed by our management and/or our board of directors. Public shareholders who might desire to participate in these types of transactions may not have an opportunity to do so. Additionally on a change of control, subject to certain conditions, preferred shareholders have the right to convert some or all preferred shares to common shares. These provisions could substantially impede the ability of public shareholders to benefit from a change in control or change our management and board of directors and, as a result, may adversely affect the market price of our common shares and your ability to realize any potential change of control premium.
As a shareholder of our company, you may have greater difficulties in protecting your interests than as a shareholder of a U.S. or South African corporation.
The Companies Act 1981 of Bermuda, as amended (the “Companies Act”), applies to our company and differs in material respects from laws generally applicable to U.S. or South African corporations and their shareholders. Taken together with the provisions of our bye-laws, some of these differences may result in you having greater difficulties in protecting your interests as a shareholder of our company than you would have as a shareholder of a U.S. corporation listed on NYSE or a South Africa corporation listed on the JSE. This affects, among other things, the circumstances under which transactions involving an interested director are voidable, whether an interested director can be held accountable for any benefit realized in a transaction with our company, what approvals are required for business combinations by our company with a large shareholder or a wholly-owned subsidiary, what rights you may have as a shareholder to enforce specified provisions of the Companies Act or our bye-laws, and the circumstances under which we may indemnify our directors and officers.
28
Our bye-laws restrict shareholders from bringing legal action against our officers and directors.
Our bye-laws contain a broad waiver by our shareholders of any claims or right of action, both individually and on our behalf, against any of our officers or directors. The waiver applies to any action taken by an officer or director, or the failure of an officer or director to take any action, in the performance of his or her duties, except with respect to any matter involving any fraud or dishonesty on the part of the officer or director. This waiver limits the right of shareholders to assert claims against our officers and directors unless the act or failure to act involves fraud.
ITEM 4. INFORMATION ON THE COMPANY
Our business began operations in 1979. We reorganized our business in 1993 and incorporated Textainer Group Holdings Limited under the laws of Bermuda as a holding company of a group of corporations involved in the purchase, ownership, management, leasing and disposal of a fleet of intermodal containers. Textainer Group Holdings Limited is incorporated with an indefinite duration under registration number EC18896.
Textainer Group Holdings Limited’s common shares are primary listed on the NYSE under the symbol “TGH”. The Company’s common shares are secondary listed on the JSE in Johannesburg, South Africa under the symbol “TXT”. Textainer Group Holdings Limited’s headquarters office is located at Century House, 16 Par-La-Ville Road, Hamilton HM 08 Bermuda and our telephone number is (441) 296-2500. Our agent in the United States is Daniel W. Cohen, Textainer Group Holdings Limited, c/o Textainer Equipment Management (U.S.) Limited, 650 California Street, 16th Floor, San Francisco, CA 94108.
At December 31, 2022, Textainer Group Holdings Limited had two directly owned subsidiaries:
Our internet website address is www.textainer.com. The information contained on, or that can be accessed through, our website is not incorporated into and is not intended to be a part of this Annual Report on Form 20-F.
See Item 5, “Operating and Financial Review and Prospects” for further information regarding recent developments in our business.
Our Company
We are one of the world’s largest lessors of intermodal containers based on fleet size, with a total fleet of approximately 2.7 million containers, representing 4.4 million TEU. Containers are an integral component of intermodal trade, providing a secure and cost-effective method of transportation because they can be used to transport freight by ship, rail or truck, making it possible to move cargo from point of origin to final destination without repeated unpacking and repacking.
We lease containers to approximately 200 shipping lines and other lessees, including all of the world’s leading international shipping lines, as measured by the total TEU capacity of their container vessels. We believe that our scale, global presence, customer service, market knowledge and long history with our customers have made us one of the most
29
reliable suppliers of leased containers. We have a long track record in the industry, operating since 1979, and have developed long-standing relationships with key industry participants.
We operate our business in three core segments.
Our container lessees use containers for their global trade utilizing many worldwide trade routes. The Company earns its revenue from these international carriers when the containers are on lease. Our total revenues primarily consist of leasing revenues derived from the lease of owned and managed containers. The most important driver of our profitability is the extent to which revenues on our owned fleet and management fee income exceed our operating costs. The key drivers of our revenues are fleet size, rental rates and utilization.
Our operating costs primarily consist of depreciation, direct costs related to the operations of our owned and managed fleet, and interest expense. Our lessees are generally responsible for loss of or damage to a container beyond ordinary wear and tear, and they are required to purchase insurance to cover any other liabilities.
Industry Overview
Containers
Containers are built in accordance with standard dimensions and weight specifications established by the International Organization for Standardization (“ISO”). The industry-standard measurement unit is the Twenty-Foot Equivalent Unit (“TEU”), which compares the length of a container to a standard 20′ container. For example, a 20′ container is equivalent to one TEU and a 40′ container is equivalent to two TEU. Standard dry freight containers are typically 8′ wide, come in lengths of 20′, 40′ or 45′ and are either 8′6″ or 9′6″ high. The principal types of containers are described as follows:
30
Containers provide a secure and cost-effective method of transportation because they can be used in multiple modes of transportation, making it possible to move cargo from a point of origin to a final destination without repeated unpacking and repacking. As a result, containers reduce transit time and freight and labor costs, as they permit faster loading and unloading of shipping vessels and more efficient transportation of cargo than traditional break bulk shipping methods. The protection provided by containers also reduces damage, loss and theft of cargo during shipment. While the useful life of containers varies based upon the damage and normal wear and tear suffered by the container, we estimate that our useful life for a standard dry freight container used in intermodal transportation is on average 13 to 14 years. Some shipping lines have recently indicated that they intend to keep their containers for longer than 13 to 14 years.
Container Leasing
Container leasing companies primarily lease containers to container shipping lines. Container shipping lines own and lease containers for their use and have historically relied on leased containers to satisfy their needs. Leasing containers provide shipping lines with an alternative source of financing such as their need to allocate capital to new ship purchases, low sulphur emissions compliance and port terminals. The Container Census & Leasing Review and Forecast of the Container Equipment Fleet (2022/2023 Annual Report), published by Drewry Maritime Research, estimates that as of December 2021, leasing companies owned approximately 51% of the total worldwide container fleet of approximately 49.9 million TEU. We estimated that leasing companies owned approximately 50% of the total worldwide container fleet, as of end of 2022.
Although there was a reduction in container capital expenditures in 2022 following the surge in new container production and ordering in 2021 by both leasing companies and shipping lines, depot container inventory is still at a low level as evidenced by the continued high utilization rates throughout the industry. Given the uncertainty and variability of export volumes and the fact that shipping lines have difficulty in accurately forecasting their container requirements at different ports, the availability of containers for lease significantly reduces a shipping line’s need to purchase and maintain excess container inventory. Leasing allows shipping lines to adjust their container fleets both seasonally and over time and helps balance their trade flows. In addition, the flexibility provided by leasing also allow shipping lines to manage the availability and location of containers and increase their ability to meet peak demand requirements.
The container shipping market and hence the demand for containers, is mainly driven by the rate of trade growth in global GDP and changes in per capita income as this influences consumption. Lease rates for new containers are positively but not exclusively correlated to the price of new containers, which is positively correlated with the price of steel, a major component used in the manufacture of new containers. The shipping business has been characterized by cyclical swings due in part to lengthy periods of excess or scarce vessel capacity. We believe that these sustained periods of vessel supply/demand imbalances are mainly a function of the multi-year ordering and production cycle associated with the manufacture of new vessels, which requires shipping lines to estimate market growth many years into the future, and the shipping line industry’s shift to the use of significantly larger vessels. Container leasing companies are partially insulated from the risks of these shipping cycles by the relatively short production time associated with the manufacture of new containers. Lead times for new container orders are typically only a few months, so the rate of new container ordering can be quickly adjusted to reflect unexpected market changes.
Competitive Strengths and Business Strategies
One of the Largest Container Lessors in the Industry and Be the Most Reliable Supplier of Quality Containers.
We operate one of the world’s largest fleets of leased intermodal containers. We provide our services worldwide via a network of regional and area offices and independent depots. Our consistent presence in the market buying and selling containers provides us with broad market intelligence, and valuable insight into the demand patterns of our shipping line customers and resale container buyers.
31
We continue to provide superior equipment and ensure that it is available in the right location and at the right time. Having one of the world’s largest container fleets, we are in a strong position to be the most reliable supplier of dry freight containers to meet the demands of shipping lines.
Proven Ability to Grow Our Fleet Over Time and Continue to Pursue Attractive Container Related Acquisition Opportunities.
Our ability to invest in our fleet has allowed us to become one the world’s largest container lessors. We have demonstrated our ability to increase the size of our container fleet by purchasing containers from manufacturers and by acquiring existing container fleets or their management rights from former competitors and from our managed fleet with container investors. We endeavor to make regular purchases of containers to replace older containers and increase the size of our fleet. As one of the largest buyers of new containers, we have developed strong relationships with container manufacturers. These relationships, along with our large volume buying power and solid financial structure, enable us to reliably purchase containers during periods of high demand and grow our market share with our existing customers.
Ability to Generate Attractive Returns Throughout the Container Life-Cycle and Focus on Maintaining High Levels of Utilization.
One of our strengths is our ability to generate attractive revenue streams throughout the economic life of a container in marine service and upon resale of the container at the end of its marine service life. At the end of a lease’s initial term, we generally have the ability to either negotiate an extension of the lease term or to take back the container and re-lease or sell it in order to maximize the container’s return. We focus on renewing or extending our long-term container leases beyond their expiration dates, typically from three to five or more years from the start of the lease. In addition, we attempt to negotiate favorable return provisions on all leases and maintain an active presence in the master and spot lease markets. This flexibility, coupled with our international coverage, organization and resources, allows us to deploy containers to those markets where we can re-lease or sell them on comparatively attractive terms in order to optimize our returns and the residual value of our fleet.
We believe that the long-term nature of our lease portfolio, as well as the presence of both owned and managed containers in our fleet, provides us with a more predictable source of revenues and operating cash flow and higher operating margins over time, enabling us to manage and grow our business more effectively. We will prioritize profitability with attractive yields on our assets through our disciplined focus on optimal lease pricing, longer-term leases and portfolio management, and by maintaining a low-cost structure.
Operations
We operate our business through a network of regional and area offices and independent depots. We maintain three regional offices as follows:
Regional vice presidents are in charge of regional leasing and operations. Marketing directors and assistants located in the regional and area offices handle day-to-day marketing and collection activities. Our operations include a global sales force, container operations group, container resale group and logistics services group. Our headquarters office is in Hamilton, Bermuda. Our administrative office is located in San Francisco, California.
Our Container Fleet
As of December 31, 2022, we operated 4,425,300 TEU. We attempt to continually invest in our container fleet each year in an effort to replace the older containers being retired from marine service and to build our fleet size. We purchased an average of approximately 420,000 TEU of new containers per year over the past five years and have been one of the largest buyers of new containers over the same period. Our ability to invest in our fleet on a consistent basis has been instrumental in becoming one of the world’s largest container lessors. The containers that we lease are either owned outright by us or
32
owned by third parties and managed by us. The table below summarizes the composition of our owned and managed fleets, in TEU and CEU, by type of containers as of December 31, 2022:
|
|
TEU |
|
|
CEU |
|
||||||||||||||
|
|
Owned |
|
Managed |
|
Total |
|
|
Owned |
|
Managed |
|
Total |
|
||||||
Standard dry freight |
|
|
3,898,769 |
|
|
269,985 |
|
|
4,168,754 |
|
|
|
3,443,081 |
|
|
239,552 |
|
|
3,682,633 |
|
Refrigerated |
|
|
195,372 |
|
|
6,709 |
|
|
202,081 |
|
|
|
785,200 |
|
|
27,076 |
|
|
812,276 |
|
Other specialized |
|
|
49,013 |
|
|
5,452 |
|
|
54,465 |
|
|
|
77,799 |
|
|
7,812 |
|
|
85,611 |
|
Total fleet |
|
|
4,143,154 |
|
|
282,146 |
|
|
4,425,300 |
|
|
|
4,306,080 |
|
|
274,440 |
|
|
4,580,520 |
|
Percent of total fleet |
|
|
93.6 |
% |
|
6.4 |
% |
|
100.0 |
% |
|
|
94.0 |
% |
|
6.0 |
% |
|
100.0 |
% |
The amounts in the table above did not change significantly from December 31, 2022 to the date of this Annual Report on Form 20-F.
Our containers are designed to meet a number of criteria outlined by the ISO. The standard criteria include the size of the container and the gross weight rating of the container. This standardization ensures that the widest possible number of transporters can use containers and it facilitates container and vessel sharing by the shipping lines. The standardization of the container is also an important element of the container leasing business since we can operate one fleet of containers that can be used by all of our customers.
Maintenance and repair of our containers is performed by independent depots that we retain in major port areas and inland locations. Such depots also handle and inspect containers that are either picked up or redelivered by lessees, and store containers that are not leased.
Our Leases
Most of our revenues are derived from leasing our owned fleet and managed fleet of containers to our core shipping line customers. The majority of our container leases are structured as operating leases, though we also provide customers with finance leases. Regardless of lease type, we seek to exceed our targeted return on our owned and managed containers over the life of each container by managing container utilization, lease rates, drop-off restrictions and the disposal process. We lease containers under three different types of operating leases (term leases, master leases and spot leases) and also under finance leases.
The following table provides a summary of our total on-hire container fleet by lease type as of December 31, 2022:
|
|
Percent of Total On-Hire Fleet |
|
|||||
Lease Portfolio |
|
TEU |
|
|
CEU |
|
||
Term leases (included units on-hire under expired term leases) |
|
|
70.4 |
% |
|
|
70.9 |
% |
Finance leases |
|
|
27.4 |
% |
|
|
26.7 |
% |
Master leases |
|
|
1.4 |
% |
|
|
1.7 |
% |
Spot leases |
|
|
0.8 |
% |
|
|
0.7 |
% |
Total |
|
|
100.0 |
% |
|
|
100.0 |
% |
Term leases
Term leases (also referred to as long-term leases) provide a customer with a specified number of containers for a specified period, typically for 5 or more years, with an associated set of pick-up and drop-off conditions. Our term leases generally require our lessees to maintain all units on lease for the duration of the lease. Term leases also include lifecycle leases, under which lessees will lease containers until they reach a pre-specified age which is typically near the end of their useful lives rather than for a specified period. Once containers under lifecycle leases are returned to us, they are generally sold due to the age of the containers. Term leases provide us with enhanced cash flow certainty due to their extended duration but carry lower per diem rates than other lease types.
As of December 31, 2022, our term leases had an average remaining duration of 4 years, assuming no leases are renewed. However, we believe that many of our customers will renew leases for containers that are less than sale age at the expiration of the lease. In addition, for leases that are not extended our containers typically remain on-hire at the contractual
33
per diem rate for an additional ten months beyond the end of the contractual lease term. For additional information about the minimum future rentals under the long-term leases for our owned and managed fleet at December 31, 2022, see Note 4 “Leases” in Item 18, “Financial Statements” in this Annual Report on Form 20-F.
Finance Leases
Finance leases provide our lessees with an alternative method to finance their container acquisitions. Finance leases are long-term in nature, typically ranging from three to thirteen years and require relatively little customer service attention. They ordinarily require fixed payments over a defined period and provide lessees with a right to purchase the subject containers for a nominal amount at the end of the lease term. Per diem rates include an element of repayment of capital and, therefore, typically are higher than rates charged under other leases. Finance leases require the lessee to keep the containers on lease for the entire term of the lease. As of December 31, 2022, our finance leases had an average remaining term of 10 years.
Master leases
Master leases provide a framework of terms and conditions pursuant to which lessees can lease containers on an as-needed basis for unspecified periods of time. Master lease terms and conditions are valid for a set period, typically one year, and provide the lessee with greater flexibility than is typical in term leases. Under our master leases, lessees know in advance their per diem rates and drop-off locations, subject to monthly drop-off location limits. In addition, under these master lease agreements, the lessee is generally not committed to leasing a minimum number of containers from us during the lease term and may generally return the containers to us at any time, subject to certain restrictions. Due to their flexibility and duration, master leases command higher per diem rates than term leases.
Spot leases
Spot leases provide the customer with containers for a relatively short lease period with fixed pick-up and drop-off locations. Spot leases are generally used to position a container to a desired location for subsequent lease or sale.
Lease Agreements
In general, our lease agreements consist of two basic elements, a master terms and conditions agreement (“Master Agreement”), and a lease schedule. Lease schedules contain the business terms (including daily rate, term duration and drop-off schedule, among other things) for specific leasing transactions, while Master Agreements outline the general rights and obligations of the lessor and lessee under all of the lease schedules covered by the Master Agreement. For most customers, we have a small number of Master Agreements (often one) and a large number of lease schedules.
Our standard Master Agreements generally require the lessees to pay rentals, depot charges, taxes and other charges when due, to maintain the containers in good condition and repair, to return the containers in good condition in accordance with the return conditions set forth in the Master Agreement, to use the containers in compliance with all laws, and to pay us for the value of the containers as determined under the terms of the agreements if the container is lost or destroyed. The default clause gives us certain legal remedies in the event that the lessee is in breach of the lease.
Maintenance, Repair and Damage Protection
Under all of our leases, our lessees are generally responsible for loss of or damage to a container beyond ordinary wear and tear, and they are required to purchase insurance to cover any other liabilities. Any damage must be repaired at the expense of the lessee according to standardized guidelines promulgated by the Institute of International Container Lessors (“IICL”). Lessees are also required to obtain insurance to cover loss of the equipment on lease, public liability and property damage insurance as well as indemnify us from claims related to their usage of the leased containers.
In some cases, a Damage Protection Plan (“DPP”) is provided whereby the lessee pays us a fee to assume a portion of the financial burden of repairs up to a pre-negotiated amount. A lessee may pay the DPP fee over the term of the lease in the form of a higher per-diem rate (which is recognized as earned over the term of the lease) or a fixed one-time lump sum payment upon the return of a container in exchange for not being charged for certain damages at the end of the lease term. We do not recognize DPP revenue and related expense over the lease term for customers who are billed at the end of the lease term under the DPP or for other lessees who do not participate in the DPP. Based on past history, there is uncertainty as to collectability of these amounts from lessees who are billed at the end of the lease term because the amounts due under the DPP are typically re-negotiated at the end of the lease term or the lease term is extended. Maintenance is monitored through
34
inspections at the time that a container is leased out and returned. We also maintain our own insurance to cover our containers when they are not on-hire to lessees or when the lessee fails to have adequate primary coverage, and third-party liability insurance for both on-hire and off-hire containers.
Management Services
We earn management fees from management of the container investor’s containers, which include the leasing, repair, repositioning and storage of the managed fleet pursuant to management agreements with container investors. Typically, the terms of the management agreements are for the expected economic useful life in marine service of the containers subject to the agreement. Our management fees from leasing services are calculated as a percentage of net operating income of the containers. Our information technology (“IT”) systems track revenues and operating expenses attributable to specific containers and the container investors receive payments based on the net operating income of their own containers. Net operating income is calculated as the lease payment and any other revenue attributable to a container, minus operating expenses related to that container (but not depreciation or financing expenses of the container investor). The container investors are responsible for the direct container expenses incurred in the operation of the managed fleet.
The management fee percentage generally varies based upon the type of lease and the terms of the management agreement. Management fee percentages for long-term leases are generally lower than management fee percentages for master or spot leases because less daily involvement by management personnel is required to manage long-term leases. Fees to manage containers typically include acquisition fees of 1% to 2.5% of the purchase price; daily management fees of 8% to 12% of net operating income; and disposal fees of 5% to 10% of cash proceeds when containers are sold. If operating expenses were to exceed revenues, the container investors would be obligated to pay the excess or we would deduct the excess, including our management fee, from future net operating income.
We continue to serve as a long-standing supplier of leased marine containers and chassis to the U.S. Military since 2003 through our contract with the U.S. Transportation Command Directorate of Acquisition (“USTranscom”). Unlike our shipping line customers, who pick up from and return containers to container depots, for the U.S. Military we are required to arrange transportation from a container depot to a military facility upon lease out and to pick up a container at a military facility and return it to a container depot when the lease period has ended. This requires us to arrange for movement of the empty containers by truck, rail and/or vessel. In January 2019, the USTranscom had issued a multi-vendor contract that included us as one of three vendors. The new contract covers a base year starting on March 1, 2019, with four option years running through February 29, 2024 and we have received the contact extension for the final year (or fourth option year) for the period March 1, 2023 to February 29, 2024.
Resale of Containers
We sell containers to optimize their residual value in multiple markets, including locations with low lease-out demand. Our Resale Division sells off-hire containers from our fleet at the end, typically about 13 years, of their useful lives in marine service or when we believe it is financially attractive for us to do so, considering the location, sale price, cost of repair, and possible repositioning expenses. In addition, we buy new trading containers and used trading containers from shipping lines and other third parties that we then lease or resell. We generally sell containers to depots, domestic storage companies, freight forwarders (who often use the containers for one-way trips into less developed countries) and other purchasers of used containers. Our Resale Division has a team of container sales and operations specialists in five offices globally that manage the sale process for these used containers.
Re-leasing, Logistics and Depot Management
We believe that managing the period after termination of our containers’ first lease is one of the most important aspects of our business. The container shipping industry is characterized by large regional trade imbalances, with loaded containers generally flowing from export-oriented economies in Asia to North America and Western Europe. Because of these trade imbalances, container shipping lines have an incentive to return leased containers in North America and Western Europe to avoid the cost of shipping empty containers back to Asia. Successful management of the deployment of our containers after
35
they come off their first lease requires disciplined re-leasing capabilities, logistics management, depot management, careful cost control and profitable disposals of used containers.
Re-leasing
Since our leases allow our lessees to return their containers, we typically lease a container several times during its life. New containers can usually be leased with a limited sales and customer service infrastructure because initial leases for new containers typically cover large volumes of units and are fairly standardized transactions. Used containers, on the other hand, are typically leased in smaller transactions that are structured to accommodate pick-ups and returns in a variety of locations. Our utilization rates depend in part on our re-leasing capabilities. Factors that affect our ability to re-lease used containers include the size of our lessee base, ability to anticipate lessee needs, their presence in relevant geographic locations and the level of service we provide our lessees. We believe that our global presence and long-term relationships with our container lessees provide us an advantage in re-leasing our containers relative to many of our smaller competitors.
Logistics
Other methods of reducing off-lease risks include:
Depot Management
As of December 31, 2022, we managed our container fleet through approximately 400 independent container depot facilities in approximately 200 locations. Depot facilities are generally responsible for repairing containers when they are returned by lessees and for storing the containers while they are off-hire. Our operations group is responsible for managing our depot relationships and periodically visiting the depot facilities to conduct quality assurance audits to control costs and ensure repairs meet industry standards. Our container repair standards and processes are generally managed in accordance with standards and procedures specified by the IICL. At the time that containers are returned by lessees, the depot arranges an inspection of the containers to assess the repairs required to return the containers to acceptable IICL condition. In general, lessees are responsible for the lessee damage portion of the repair costs, such as dents in the container and debris left in the container, and we are responsible for normal wear and tear.
We occasionally supplement our internal operations group with the use of independent inspection agents. We are in regular communication with our depot partners through the use of electronic data interchange (“EDI”) and/or e-mail. The electronic exchange of container activity information with each depot is conducted via the internet, and majority of our depots are able to report container activity and damage detail via EDI. Most of the depot agency agreements follow a standard form and generally provide that the depot will be liable for loss or damage of off-hire containers and, in the event of loss, will pay us the previously agreed loss value of the applicable containers. The agreements require the depots to maintain insurance against container loss or damage and we carry insurance to cover the risk when a depot’s insurance proves insufficient.
36
Credit Controls
We monitor our customers’ performance and our lease exposures on an on-going basis. Our credit committee sets different maximum credit exposure limits depending on our relationship and previous experience with each customer lessee and container sales customer. Credit criteria may include, but are not limited to, trade route, country, social and political climate, assessments of financial performance including net worth and profitability, asset ownership, bank and trade credit references, credit bureau reports, operational history and financial strength. Our marketing and resale staff are also responsible for monitoring collections, which positively contributes to our strong collection and credit approval process through our staff’s close communication with our customers. Our credit management processes are aided by the long payment experience we have with most of our customer lessees and container sales customers, our broad network of long-standing relationships in the container shipping industry that provides current information about customer lessees’ and container sales customers’ market reputations and our focus on collections.
We historically have high recovery rates for containers in default situations and the re-marketability of our container fleet reduces our losses resulting from lessee defaults. From 2015 through 2022, we recovered on average, 85% of the containers that were the subject of defaulted contracts where we had completed the recovery process and had at least 1,000 CEU on lease to the customer. The growth in the container shipping industry also helps reduce the risk of customer defaults since the core assets of a poorly performing shipping line, its ships and containers, have historically been needed to meet the demand for world containerized trade. In addition, the law in several major port locations is highly favorable to creditors and many of our large customers call on ports that will allow us to arrest, or seize, the customers’ ships or fuel storage bunkers, or repossess our containers if the customer is in default under our container leases. We previously maintained insurance that covered certain costs typically incurred such as repairs and repositioning when containers are recovered after a default. However, after a major bankruptcy in the shipping industry in 2016, the availability of credit insurance protection became much more limited. While we previously maintained insurance to cover some defaults, premium increases, large deductible amounts and significant policy exclusions made the coverage uneconomic and we determined to lapse our coverage since 2021.
Marketing and Customer Service
Our global sales and customer service force is responsible for developing and maintaining relationships with senior management staff at our shipping line customers, negotiating lease contracts and maintaining day-to-day coordination with operations staff. This close customer communication often assists us in negotiating lease contracts that satisfy both our financial return requirements and our customers’ operating needs. It also makes us more likely to be aware of our customers’ potential equipment shortages and makes our customers more likely to be aware of our available container inventories. We have marketing and customer service personnel in North America, Asia, Australia, Europe and in Africa. Our senior sales people have considerable industry experience and we believe that the quality of our customer relationships and the level of communication with our customers represent an important advantage for us.
Customers
Our customers are mainly international shipping lines, but we also lease containers to freight forwarding companies and the U.S. Military. Our scale, long presence in the business and reliability as a supplier of containers in locations where our customers need them has resulted in very strong relationships with our shipping line customers. Our top 20 customers, as measured by revenues, have on average been our customers for around 30 years, and include almost all of the world’s largest shipping lines, as measured by container vessel fleet size. Our top 20 and top 5 customers accounted for approximately 88.3% and 60.8%, respectively, of our total fleet’s 2022 lease rental income. Our three largest customers in 2022 accounted for $198 million or 24.4%, $95 million or 11.7% and $87 million or 10.8% of our total fleet’s 2022 lease rental income. A default by any of our major customers could have a material adverse impact on our business, results from operations and financial condition.
Proprietary Information Technology
We have developed proprietary IT systems that allow us to monitor container status and offer our customers a high level of service. Our systems include internet-based updates regarding container availability and booking status. Our systems record the status of and provide the accounting and billing for each of our containers individually by container number. We
37
also have the ability to produce complete management reports for each portfolio of equipment we own and manage. This makes us a preferred candidate to quickly assume management of competitors’ container fleets. We also maintain proprietary technology in support of our military business.
In addition, our systems allow our business partners to conduct certain business with us through our website, www.textainer.com. These systems allow customers to check our container inventories, review design specifications, request bookings for container pick-ups, create redelivery bookings and review and approve repair bills. Our website also allows depots to download recent statements for self-billing activity and to check the status of containers.
Suppliers
We have long relationships with all of our major suppliers. We currently purchase all of our containers in the PRC. There are currently three major manufacturers, in addition to few smaller manufacturers, of dry freight standard and specialized containers. Our operations staff reviews the designs for our containers and periodically audits the production facilities of our suppliers. In addition, we use our Asian operations group and occasionally third-party inspectors to visit factories when our containers are being produced to provide an extra layer of quality control. Nevertheless, defects in our containers do sometimes occur. We work with the manufacturers to correct these defects, and our manufacturers have generally honored their warranty obligations in such cases.
Competition
We compete with at least five other major container leasing companies in addition to many smaller lessors, companies and financial institutions offering finance leases, and promoters of container ownership and leasing as a tax-efficient investment. It is common for our shipping line customers to utilize several leasing companies to meet their container needs.
Other lessors compete with us in many ways, including pricing, lease flexibility and supply reliability, as well as the location, availability, quality and individual characteristics of their containers and customer service. While we are forced to compete aggressively on price, we emphasize our supply reliability and high level of customer service to our customers. We invest heavily to ensure container availability in higher demand locations. We dedicate a large part of our organization to building customer relationships, maintaining close day-to-day coordination with customers’ operating staff and have developed powerful and user-friendly systems that allow our customers to transact business with us through the internet. We believe that our close customer relationships, experienced staff, reputation for market leadership, scale efficiencies and proprietary systems provide important competitive advantages.
Legal Proceedings
From time to time we are a party to litigation matters arising in connection with the normal course of our business. While we cannot predict the outcome of these matters, in the opinion of our management, any liability arising from these matters will not have a material adverse effect on our business. Nevertheless, unexpected adverse future events, such as an unforeseen development in our existing proceedings, new claims brought against us or changes in our current insurance arrangements could result in liabilities that have a material adverse impact on our business.
Environmental Responsibility
We are subject to federal, state, local and foreign laws and regulations relating to the protection of the environment, including those governing the discharge of pollutants to air and water, the management and disposal of hazardous substances and wastes and the cleanup of contaminated sites. While we maintain certain limited liability insurance coverage as well as require our lessees to provide us with indemnity against certain losses, the insurance coverage may not be sufficient to protect us against losses arising from environmental damage and/or systems or services we may be required to install.
Container shipping has been a key element in furthering world trade and related economic development. Containerization and the use of ever larger vessels have a significantly lower environmental footprint than other forms of shipping such as air freight. Additionally, at the end of container’s useful life at sea, they are not sent to landfills and have a myriad of additional uses, including as construction sheds, static storage and as shelter or housing. Containers used for these purposes have a positive environmental benefit by reducing the need to use new materials to create these storage or housing solutions.
38
In addition to environmental regulations affecting container movement, shipping, movement and spillage, environmental regulations also impact container production and operation, including regulations on the use of chemical refrigerants (i.e., CFC’s and solvent-based paints) due to their ozone depleting and global warming effects, and regulations on the cutting and export of hardwood due to concerns regarding de-forestation and climate change. These environmental regulations may impact the future repair and operating costs for these containers, and we could be required to incur large retrofitting expenses for our refrigerated containers. To comply with new regulations, water borne paint systems have been developed and are being used by container manufacturers. The conversion to water borne paint may impact factory capacity, increase the cost of containers and require greater investment by us in container inspection and factory supervision.
We are an active member in industry groups such as the International Institute of Container Lessors that participate in industry projects such as the evaluation and development of more environmentally friendly container flooring that use bamboo rather than endangered hardwoods. We worked closely with container factories and others in the industry to complete the shift to container flooring that uses farmed wood, such as larch, birch, eucalyptuses and bamboo and we are also supporting industry efforts to implement a floor design which would reduce approximately 30% of the wood content (by substituting steel for wood). We support industry efforts to explore other flooring materials such as orientated strand board and the use of recycled materials. We have also worked with and supported our container suppliers’ transition to the use of waterborne paint that does not use harmful solvents in the drying process. This occurred about five years ago for dry freight containers and the transition recently occurred for refrigerated containers.
For further discussions, see Item 3, “Key Information -- Risk Factors – Environmental liability and regulations may adversely affect our business, results of operations and financial condition.”
Regulation
We may be subject to regulations promulgated in various countries, including the U.S., seeking to protect the integrity of international commerce and prevent the use of containers for international terrorism or other illicit activities. As these regulations develop and change, we may incur increased compliance costs due to the acquisition of new, compliant containers and/or the adaptation of existing containers to meet any new requirements imposed by such regulations. For further discussions, see Item 3, “Key Information -- Risk Factors – We may incur costs associated with cargo security regulations, which may adversely affect our business, results of operations and financial condition”. We may also be affected by legal or regulatory responses to potential global climate change. Please see Item 3, “Key Information -- Risk Factors – Environmental liability and regulations may adversely affect our business, results of operations and financial condition.”.
Human Capital Management
We seek to attract, retain, and develop the best talent available in order to drive our continued success and achieve our business goals. Our management team has a solid history in the industry with extensive experience in sourcing, leasing, financing, selling and managing containers. As of December 31, 2022, our global workforce was comprised of approximately 162 employees located in 14 regional and area offices in 13 different countries. We are not a party to any collective bargaining agreements. Our employment policies and procedures are designed to provide a work environment that is responsive to and supportive of each employee’s objectives and we provide competitive compensation and benefits, and meaningful recognition programs to inspire outstanding team and individual performance. As an equal employment opportunity employer, we have protections in place for all protected groups through our Code of Business Conduct and Ethics. We strive for an inclusive, safe, and respectful work environment that fosters employee growth and development.
39
Our current corporate structure as of February 14, 2023 is as follows:
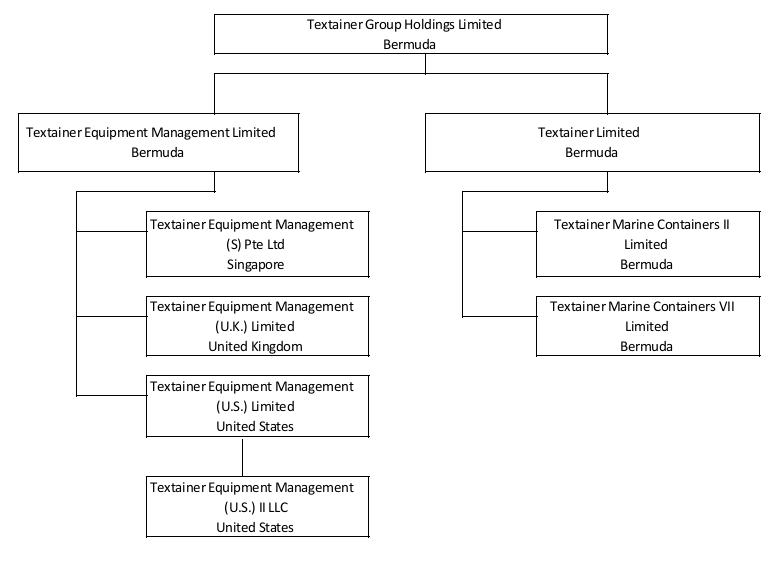
We maintain an office in Bermuda, where Textainer Group Holdings Limited is incorporated. We have 14 offices including our head office in Bermuda, our administrative office in San Francisco, California and offices in Cranford, New Jersey; New Malden, United Kingdom; Hamburg, Germany; Durban, South Africa; Yokohama, Japan; Seoul, South Korea; Taipei, Taiwan; Singapore; Sydney, Australia; Port Kelang, Malaysia; Hong Kong; and Shanghai, China.
We lease our office space in Bermuda, the U.S., United Kingdom and Singapore and have exclusive agents that secure office space for us in our other locations. The lease for our Bermuda office expires in August 2023, the lease for our San Francisco office expires in May 2027, the lease for our Cranford, New Jersey office expires in January 2025, the lease for our New Malden, United Kingdom office expires in December 2024 and our lease for our Singapore office expires in July 2024. In addition, we have non-exclusive agents who represent us in India, Indonesia, Republic of the Philippines, Sri Lanka, and Thailand. We believe that our current facilities are adequate to meet current requirements and that additional or substitute space will be available as needed to accommodate our expected growth.
ITEM 4A. UNRESOLVED STAFF COMMENTS
Not applicable.
40
ITEM 5. OPERATING AND FINANCIAL REVIEW AND PROSPECTS
The following Operating and Financial Review and Prospects should be read in conjunction with our audited consolidated financial statements and related notes included elsewhere in this Annual Report on Form 20-F. In addition to historical consolidated financial information, the following discussion contains forward-looking statements that reflect our plans, estimates and beliefs. Our actual results may differ materially from those contained in or implied by any forward-looking statements. See “Information Regarding Forward-Looking Statements; Cautionary Language.” Factors that could cause or contribute to these differences include those discussed below and elsewhere in this Annual Report on Form 20-F, particularly in Item 3, “Key Information-- Risk Factors.”
Dollar amounts in this section of this Annual Report on Form 20-F are expressed in thousands of U.S. dollars unless otherwise indicated.
For the discussion of the financial condition and results of operations for the years ended December 31, 2021 compared to the year ended December 31, 2020, refer to Item 5 “Operating and Financial Review and Prospects - Operating Results” and “- Liquidity and Capital Resources” in our Form 20-F for the fiscal year ended December 31, 2021 filed with the U.S. Securities and Exchange Commission on March 17, 2022, which discussion is incorporated herein by reference.
Overview
Operating since 1979, we are one of the world’s largest lessors of intermodal containers based on fleet size, with a total fleet of approximately 2.7 million containers, representing 4.4 million TEU. During 2022: (i) we invested in approximately $803 million of containers for our fleet, (ii) our utilization averaged 99.4% in 2022 compared to 99.8% in 2021, and (iii) we repurchased approximately 5.6 million shares of our common shares.
Our business comprises of three reportable segments for financial reporting purposes: Container Ownership, Container Management and Container Resale. Our total revenues primarily consist of leasing revenues derived from the leasing of our owned and managed containers and other non-leasing fees received for managing containers owned by third parties, equipment resale and military management. For further details of our business overview, see Item 4, “Information on the Company.”
Market Overview
The COVID-19 pandemic has had significant impacts on global economies. The decrease in global trade volumes and economic activity due to the COVID-19 pandemic led to disruptions in global shipping and reduced container demand during the first half of 2020. However, cargo volumes and leasing demand rebounded since the start of the second half of 2020, and continued into 2022, as the pandemic stabilized, and demand for consumer goods and supply chain congestion have caused freight volumes to increase versus the first half of 2020. Global geopolitical stress from factors including the ongoing Russia-Ukraine war, as well as inflation due to higher energy prices and increased consumer demand and monetary policy during the pandemic, have led to fears of recession. Additionally, increased U.S. interest rates and the resulting stronger U.S. Dollar have contributed to global economic stress and recession concerns. This global economic stress has at least partially contributed to risk of a market recession as global demand for consumer goods and associated trade volumes stopped growing and have begun to experience some signs of decline.
We invested heavily in new containers during 2021 and the first half of 2022 in response to strong container demand, which has been subdued starting in the second half of 2022 following the prior historic container production in 2021. Container drop-offs, comprising of primarily sales-age containers and which had been subdued, started to increase in line with the reduced global shipping congestion. We currently believe these disruptions will ultimately normalize, but we have strongly benefited from the increased global containerized trade disruptions that have emerged since the second half of 2020 and throughout 2022 and containers purchased during this period were committed to very attractive leases with very long lease durations. While uncertainty remains on how the pandemic evolves, the implications from the ongoing Russia-Ukraine war and other geopolitical and economic stress, and the currently lower container demand environment, our balance sheet and liquidity are healthy and we have never had such a portfolio of secured long-term contracts. As we look out to the coming months, we see a continuation of this uncertainty with a likely reduction of our current high gain on container sales, but we remain well-positioned to respond to the current market environment. While container utilization may continue to gradually decrease, it should remain elevated compared to historic levels. For additional information regarding the risk and uncertainties
41
that we could encounter as a result of the COVID-19 pandemic, the Russia-Ukraine war and related global conditions, see Item 3, “Key Information - Risk Factors” and elsewhere in this Annual Report on Form 20-F.
Key Factors Affecting Our Performance
We believe there are a number of key factors that have affected, and are likely to continue to affect, our operating performance. These key factors include the following, among others:
For further details of these and other factors which may affect our business and results of operations, see Item 3, “Key Information-- Risk Factors.”
Key Operating Metrics
The most important driver of our profitability is the extent to which our leasing revenues exceed our operating costs. The key drivers of our leasing revenues are fleet size, lease rates, and utilization. Our operating costs primarily consist of depreciation, direct costs related to the operations of our owned and managed fleet, and interest expense. Our profitability is also driven by the gains or losses we realize on the sale of our containers.
Fleet Size. Our total fleet consists of containers that we own, and containers owned by other container investors that we manage. We purchased approximately $803 million and $2.0 billion during 2022 and 2021, respectively, of containers for our fleet. The size of our fleet increased in 2021 as we heavily invested in new containers in response to strong container demand, virtually all of which are currently on lease with tenors in excess of 12 years. The table below summarizes the composition of our total fleet, in TEU and CEU, by type of container as of December 31, 2022, 2021 and 2020. TEU and CEU are standard industry measures of container size and relative value and are used to measure the quantity of containers that make up our revenue earning assets:
|
|
Total Fleet in TEU |
|
|
Total Fleet in CEU |
|
||||||||||||||
|
|
2022 |
|
2021 |
|
2020 |
|
|
2022 |
|
2021 |
|
2020 |
|
||||||
Standard dry freight |
|
|
4,168,754 |
|
|
4,060,296 |
|
|
3,522,809 |
|
|
|
3,682,633 |
|
|
3,593,693 |
|
|
3,139,487 |
|
Refrigerated |
|
|
202,081 |
|
|
203,413 |
|
|
191,593 |
|
|
|
812,276 |
|
|
818,224 |
|
|
772,458 |
|
Other specialized |
|
|
54,465 |
|
|
58,658 |
|
|
59,651 |
|
|
|
85,611 |
|
|
91,587 |
|
|
93,015 |
|
Total fleet |
|
|
4,425,300 |
|
|
4,322,367 |
|
|
3,774,053 |
|
|
|
4,580,520 |
|
|
4,503,504 |
|
|
4,004,960 |
|
42
Lease Revenue. We generate lease rental income by leasing our owned container fleet and managed container fleet to container shipping lines and other customers. Lease rental income on operating lease contracts comprises daily per diem rental charges due under the lease agreements and on finance lease contracts represents interest income earned under finance lease contracts, together with payments for other charges set forth in the leases, such as handling fees, drop-off charges and pick-up charges and credits (together “geography revenue”) and charges for a DPP. For further details of our types of leases, see Item 4, “Information of the Company—Business Overview.”
Lease rental income is affected by per diem rates. The per diem rate for a lease is set at the time we enter into a lease agreement. Our long-term per diem rate for new containers has historically been strongly influenced by new container pricing (which in turn is heavily influenced by the cost of container manufacturing inputs such as steel, paint, wood, labor and other components), interest rates, the balance of supply and demand for containers at a particular time and location, our estimate of the residual value of the container at the end of its useful life in marine service, type of the container being leased, container purchasing activities by container shipping lines and competitors, and efficiencies in container utilization by container shipping lines. Average per diem rates for containers in our owned fleet and in the portfolios of containers comprising our managed fleet change slowly in response to changes in new container prices because existing lease agreements can only be re-priced upon expiration of the lease. Container prices have moderated in 2022 from the record levels that prevailed in 2021. Average lease rates of our containers on operating leases increased by 3.2% in 2022 compared to 2021, primarily reflecting the favorable current market environment and impact of higher new container prices. Our finance lease income increased during 2022 compared to 2021, primarily due to growth of our fleet on finance leases by approximately 4.4% (as a percentage of our total fleet in TEU on hire during the period) which was driven by the strong demand of containers.
Utilization. Utilization is a key performance indicator that demonstrates how much of our equipment is on lease at a point in time or over a period of time. We measure utilization on the basis of CEU on lease, dividing the actual number of CEU days on-hire by actual CEU days available for lease. We calculate containers available for lease by excluding containers that have been manufactured for us but have not yet been delivered to a lessee and containers designated as held for sale units. Our utilization is primarily a function of our current lease structure, overall level of container demand, the location of our available containers and prevailing lease terms by location. The location of available containers is critical because containers available in high-demand locations are more readily leased and are typically leased on more favorable terms than containers available in low-demand locations.
Our average utilization during 2022 and 2021 were higher compared to historic levels due to trade volumes and global supply-chain disruptions that have continued to drive container demand. The following table summarizes our average total fleet utilization (CEU basis) for the years ended December 31, 2022, 2021 and 2020:
|
|
2022 |
|
|
2021 |
|
|
2020 |
|
|||
Average utilization |
|
|
99.4 |
% |
|
|
99.8 |
% |
|
|
96.6 |
% |
Container Sales. Containers are generally sold at the end of their useful lives in marine service or when we believe it is financially attractive for us to do so, considering the location, sale price, cost of repair and possible repositioning expenses. In addition, we purchase new trading containers and used containers from third parties, primarily shipping lines, and resell these containers to a wide variety of buyers. Disposal volumes were higher during 2022 compared to 2021 due to increased inventory of containers available for sale. Sales prices of our containers decreased in 2022 compared to 2021 primarily due to an increase in availability of sale containers and a decrease in new container prices in 2022.
Operating Expenses. Storage, handling, maintenance, repositioning, agency costs, insurance expenses and other direct container expenses are operating costs of our fleet. Storage and handling expenses occur when our customers drop off containers at depots around the world. Storage and handling expenses vary significantly by location. Other direct container expenses include maintenance expenses, which are the result of normal wear and tear on the containers, and repositioning expenses, which are incurred when we contract to move containers from locations where our inventories exceed actual or expected demand to locations with higher demand. Storage, handling, maintenance, repositioning, and other direct container expenses are directly related to the number of containers in our fleet and inversely related to our utilization rate for those containers. As utilization decreases, we typically have higher storage, handling, maintenance and repositioning expenses.
Our operating costs primarily consist of depreciation expense on our owned fleet. We depreciate our standard dry freight containers over a period of 13 to 14 years, refrigerated containers over a period of 12 years, tank containers over a
43
period of 20 years and open top and flat rack containers over a period of 14 to 16 years, on a straight-line basis to a fixed residual value. We regularly assess both the estimated useful life of our containers and the expected residual values, and, when warranted, adjust our depreciation estimates accordingly. Depreciation expense will vary over time based upon the size and the purchase price of containers in our owned fleet.
Interest Expense. Interest expense increased $29,980 from 2021 to 2022 due to an increase in average effective interest rate and a higher average debt balance from funding increased container investment of our owned fleet.
A. Operating Results
Comparison of the Years Ended December 31, 2022 and 2021
The following table summarizes our revenues and gain on sale of owned fleet containers, net for the years ended December 31, 2022 and 2021 and changes between those periods:
|
|
Year Ended December 31, |
|
|
|
|
||||||
|
|
2022 |
|
|
2021 |
|
|
Variance |
|
|||
|
|
(Dollars in thousands) |
|
|
|
|
||||||
Operating leases - owned fleet |
|
$ |
609,558 |
|
|
$ |
589,045 |
|
|
$ |
20,513 |
|
Operating leases - managed fleet |
|
|
49,635 |
|
|
|
56,037 |
|
|
|
(6,402 |
) |
Finance leases and container leaseback financing receivable |
|
|
150,821 |
|
|
|
105,648 |
|
|
|
45,173 |
|
Total lease rental income |
|
$ |
810,014 |
|
|
$ |
750,730 |
|
|
$ |
59,284 |
|
|
|
|
|
|
|
|
|
|
|
|||
Management fees - non-leasing |
|
$ |
2,812 |
|
|
$ |
3,360 |
|
|
$ |
(548 |
) |
|
|
|
|
|
|
|
|
|
|
|||
Trading container sales proceeds |
|
$ |
23,791 |
|
|
$ |
32,045 |
|
|
$ |
(8,254 |
) |
Cost of trading containers sold |
|
|
(21,939 |
) |
|
|
(21,285 |
) |
|
|
(654 |
) |
Trading container margin |
|
$ |
1,852 |
|
|
$ |
10,760 |
|
|
$ |
(8,908 |
) |
|
|
|
|
|
|
|
|
|
|
|||
Gain on sale of owned fleet containers, net |
|
$ |
76,947 |
|
|
$ |
67,229 |
|
|
$ |
9,718 |
|
|
|
|||||||||||
|
|
|||||||||||
Total lease rental income - increased $59,284 from 2021 to 2022 primarily due to an increase of $45,173 in the growth of our fleet on finance leases and an increase of $2,893 in the total operating fleet that was available for lease. The organic growth of the fleet was boosted by the procurement of containers in the first half of the year and the continued impact of containers purchased in 2021. Additionally, an increase of $20,061 in average per diem rental rates of our total operating fleet primarily reflecting the favorable current market environment and the impact of higher new container prices. However, this increase was partially offset by a $5,865 settlement received in 2021 from a previously insolvent customer related to unrecognized lease rental income from prior periods and a $3,048 decrease due to lower utilization caused by decreased demand from the peak of 2021.
Management fees – non-leasing decreased $548 from 2021 to 2022 primarily due to a decrease of $398 in sales commissions, which was mainly due to a reduction in the managed fleet size as of result of our purchase of certain containers of a managed fleet in 2021 and the disposal of certain older and sales-age managed containers in 2021, and lower container sales prices as a result of market normalization.
Trading container margin decreased $8,908 from 2021 to 2022; $7,354 of the decrease resulted from a reduction in per unit margin due to lower resale prices as a result of market normalization and $1,554 of the decrease resulted from a reduction in unit sales volume due to our limited inventory of trading containers available for sale.
Gain on sale of owned fleet containers, net, increased $9,718 from 2021 to 2022; $33,446 of the increase was due to higher container sales volume from redeliveries of predominantly older and sales-age containers of our owned fleet where the lease contracts had expired, partially offset by a $22,564 decrease in average gain per container sold due to lower resale prices as a result of market normalization and a $1,164 decrease in day-one gain on sales-type leases.
44
The following table summarizes our total operating expenses for the years ended December 31, 2022 and 2021 and changes between those periods:
|
|
Year Ended December 31, |
|
|
|
||||||||
|
|
2022 |
|
|
2021 |
|
|
Variance |
|
|
|||
|
|
(Dollars in thousands) |
|
|
|
|
|
||||||
Direct container expense - owned fleet |
|
$ |
31,980 |
|
|
$ |
23,384 |
|
|
$ |
8,596 |
|
|
Distribution expense to managed fleet container investors |
|
|
44,150 |
|
|
|
50,360 |
|
|
|
(6,210 |
) |
|
Depreciation and amortization |
|
|
292,828 |
|
|
|
284,115 |
|
|
|
8,713 |
|
|
General and administrative expense |
|
|
48,349 |
|
|
|
46,462 |
|
|
|
1,887 |
|
|
Bad debt expense (recovery), net |
|
|
740 |
|
|
|
(1,285 |
) |
|
|
2,025 |
|
|
Container lessee default expense (recovery), net |
|
|
1,179 |
|
|
|
(1,088 |
) |
|
|
2,267 |
|
|
Total operating expenses |
|
$ |
419,226 |
|
|
$ |
401,948 |
|
|
$ |
17,278 |
|
|
|
|
|
|
|
|
|
|
|
|
|
|||
Direct container expense – owned fleet increased $8,596 from 2021 to 2022 primarily due to a $6,222 increase in maintenance and handling expense and a $2,816 increase in storage expense, resulting from a higher level of drop off activity.
Distribution expense to managed fleet container investors decreased $6,210 from 2021 to 2022 primarily due to a decrease in lease rental income of the managed fleet resulting from a reduction in the managed fleet size as of result of our purchase of certain containers of a managed fleet in 2021 and the disposal of certain older and sales-age managed containers in 2021.
Depreciation and amortization expense increased $8,713 from 2021 to 2022. Amortization represents the amortization of amounts paid to acquire the rights to manage the container fleets. $8,364 of the increase was due to a net increase in the size of our owned depreciable fleet and $2,710 of the increase was due to a net increase in writing down the value of containers held for sale to their estimated fair value less cost to sell, resulting from mark to market value adjustments on certain containers held for sale, partially offset by a decrease of $2,361 in amortization expense primarily due to our purchase of certain containers of a managed fleet in the third quarter of 2021 and the certain managed containers becoming fully amortized in the fourth quarter of 2021.
General and administrative expense increased $1,887 from 2021 to 2022 primarily due to a $2,110 increase in technology expense and a $799 increase in professional fees, mainly resulting from the successful implementation of our ERP system effective January 2022, and a $744 increase in travel expenses resulting from the easing of COVID-19 travel restrictions, partially offset by a $2,414 decrease in compensation and benefit costs, largely due to higher incentive payouts in the prior year.
Bad debt expense (recovery), net, changed from a recovery of $1,285 in 2021 to an expense of $740 in 2022 primarily due to an increase in the estimates for credit loss reserve on our net investment in finance leases and container leaseback financing receivable, driven by an increase in the finance lease and leaseback financing receivable and an increase in the estimated credit loss rates during 2022 due to a forecasted economic slowdown compared to a reduction in the estimated credit loss rates during 2021 due to a forecasted economic recovery.
Container lessee default expense (recovery), net for 2022 and 2021 amounted to an expense of $1,179 and a recovery of $1,088, respectively, which is summarized in the below table,
|
|
Year Ended December 31, |
|
|||||
|
|
2022 |
|
|
2021 |
|
||
|
|
(Dollars in thousands) |
|
|||||
Cost to recover containers with insolvent lessees |
|
$ |
71 |
|
|
$ |
3,781 |
|
Charge for written off containers that were deemed unlikely to be |
|
|
1,935 |
|
|
|
2,793 |
|
Gain associated with recoveries, net of container recovery costs, |
|
|
— |
|
|
|
(7,662 |
) |
Cash distribution from a prior bankruptcy lessee defaulted in 2013 |
|
|
(802 |
) |
|
|
|
|
Other |
|
|
(25 |
) |
|
|
— |
|
Container lessee default expense (recovery), net |
|
$ |
1,179 |
|
|
$ |
(1,088 |
) |
45
The following table summarizes other income (expenses) and income tax expense for the years ended December 31, 2022 and 2021 and changes between those periods:
|
|
Year Ended December 31, |
|
|
|
|
||||||
|
|
2022 |
|
|
2021 |
|
|
Variance |
|
|||
|
|
(Dollars in thousands) |
|
|
|
|
||||||
Interest expense |
|
$ |
(157,249 |
) |
|
$ |
(127,269 |
) |
|
$ |
(29,980 |
) |
Debt termination expense |
|
|
— |
|
|
|
(15,209 |
) |
|
|
15,209 |
|
Realized loss on financial instruments, net |
|
|
(91 |
) |
|
|
(5,634 |
) |
|
|
5,543 |
|
Unrealized (loss) gain on financial instruments, net |
|
|
(502 |
) |
|
|
4,409 |
|
|
|
(4,911 |
) |
Other, net |
|
|
2,406 |
|
|
|
(367 |
) |
|
|
2,773 |
|
Net other expense |
|
$ |
(155,436 |
) |
|
$ |
(144,070 |
) |
|
$ |
(11,366 |
) |
|
|
|
|
|
|
|
|
|
|
|||
Income tax expense |
|
$ |
(7,539 |
) |
|
$ |
(1,773 |
) |
|
$ |
(5,766 |
) |
Interest expense increased $29,980 from 2021 to 2022; $23,408 of the increase resulted from an increase in the average debt balance of $879,521 due to the procurement of containers for organic fleet growth and $6,572 of the increase resulted from an increase in average interest rates of 0.12 percentage points, mainly attributed to market rate increases on the unhedged component of our debt.
Debt termination expense for 2021 amounted to $15,209, which included $10,631 loan termination expense and $1,235 write-off of unamortized debt issuance costs resulting from the early redemption of Textainer Marine Containers VI Limited (“TMCL VI”) Term Loan and $2,857 on the write-off of unamortized debt issuance costs of the early redemption of 2019-1 Bonds.
Realized loss on financial instruments included amounts for our marketable securities and derivative instruments. Realized loss on marketable securities for 2022 and 2021 amounted to $91 and $226, respectively, which was related to certain of the shares of marketable equity securities of a lessee that we received in the second quarter of 2021 for a bankruptcy settlement that were sold. Realized loss on derivative instruments, net for 2021 amounted to $5,408. During the second and third quarters of 2021, we early terminated all of our interest rate swaps that were not designated as cash flow hedges. See Note 8 "Derivative instruments" in Item 18, “Financial Statements” in this Annual Report on Form 20-F for further information.
Unrealized (loss) gain on financial instruments included amounts for our marketable securities and derivative instruments. Unrealized loss on marketable securities for 2022 and 2021 amounted to $502 and $811, respectively, which was related to a fair value change in the marketable equity securities of a lessee that we received in the second quarter of 2021 for a bankruptcy settlement. Unrealized gain on derivative instruments, net for 2021 amounted to $5,220. During the second and third quarters of 2021, we early terminated all of our interest rate swaps that were not designated as cash flow hedges. See Note 8 "Derivative instruments" in Item 18, “Financial Statements” in this Annual Report on Form 20-F for further information.
Other, net increased $2,773 from 2021 to 2022 primarily due to a $3,138 increase in interest income predominantly resulted from an increase in average interest rates, partially offset by a $330 decrease related to the re-measurement at each period end of the cash balances that are denominated in currencies other than our functional currency.
Income tax expense increased $5,766 from 2021 to 2022 primarily due to an increase in pre-tax income, a decreased proportion of the Company’s income generated in lower tax jurisdictions in 2022 and an increase in tax for existing uncertain tax positions. See Note 6 “Income Taxes” to our consolidated financial statements in Item 18, “Financial Statements” in this Annual Report on Form 20-F for further information.
46
Segment Information
For further discussion, see Note 1 “Nature of Business and Summary of Significant Accounting Policies” and Note 9 “Segment Information” to our consolidated financial statements in Item 18, “Financial Statements” in this Annual Report on Form 20-F.
The following table summarizes our income before income taxes attributable to each of our business segments for the years ended December 31, 2022 and 2021 (before inter-segment eliminations) and changes between those periods:
|
|
Year Ended December 31, |
|
|
||||||||
|
|
2022 |
|
|
2021 |
|
|
Variance |
|
|||
|
|
(Dollars in thousands) |
|
|
||||||||
Container ownership |
|
$ |
266,224 |
|
|
$ |
239,857 |
|
|
$ |
26,367 |
|
Container management |
|
|
39,938 |
|
|
|
46,706 |
|
|
|
(6,768 |
) |
Container resale |
|
|
16,666 |
|
|
|
19,166 |
|
|
|
(2,500 |
) |
Other |
|
|
(6,802 |
) |
|
|
(4,845 |
) |
|
|
(1,957 |
) |
Eliminations |
|
|
937 |
|
|
|
(14,823 |
) |
|
|
15,760 |
|
Income before income tax |
|
$ |
316,963 |
|
|
$ |
286,061 |
|
|
$ |
30,902 |
|
Income before income taxes attributable to the Container Ownership segment increased $26,367 from 2021 to 2022. The following table summarizes the variances included within this increase:
|
|
From 2021 to 2022 |
|
|
|
Increase in lease rental income - owned fleet |
|
$ |
62,935 |
|
|
Decrease in debt termination expense |
|
|
15,209 |
|
|
Increase in gain on sale of owned fleet containers, net |
|
|
9,522 |
|
|
Decrease in realized loss on derivative instruments, net |
|
|
5,408 |
|
|
Increase in interest income |
|
|
1,866 |
|
|
Increase in interest expense |
|
|
(29,768 |
) |
|
Increase in direct container expense |
|
|
(20,523 |
) |
|
Increase in depreciation expense |
|
|
(9,127 |
) |
|
Decrease in unrealized gain on derivative instruments, net |
|
|
(5,220 |
) |
|
Changed from container lessee default recovery, net to container lessee default expense, net |
|
|
(2,267 |
) |
|
Change from bad debt recovery, net to bad debt expense, net |
|
|
(1,852 |
) |
|
Other |
|
|
184 |
|
|
|
|
$ |
26,367 |
|
|
Income before income taxes attributable to the Container Management segment decreased $6,768 from 2021 to 2022. The following table summarizes the variances included within this decrease:
|
|
From 2021 to 2022 |
|
|
|
Decrease in distribution expense to managed fleet container investors |
|
$ |
6,210 |
|
|
Increase in interest income |
|
|
1,238 |
|
|
Decrease in amortization expense |
|
|
972 |
|
|
Decrease in management fees |
|
|
(8,108 |
) |
|
Decrease in lease rental income - managed fleet |
|
|
(6,402 |
) |
|
Increase in general and administrative expense |
|
|
(674 |
) |
|
Other |
|
|
(4 |
) |
|
|
|
$ |
(6,768 |
) |
|
Income before income taxes attributable to the Container Resale segment decreased $2,500 from 2021 to 2022. The following table summarizes the variances included within this decrease:
47
|
|
From 2021 to 2022 |
|
|
|
Increase in management fees |
|
$ |
5,059 |
|
|
Decrease in amortization expense |
|
|
1,389 |
|
|
Decrease in gain on container trading, net |
|
|
(8,906 |
) |
|
Other |
|
|
(42 |
) |
|
|
|
$ |
(2,500 |
) |
|
Loss before income taxes attributable to Other activities unrelated to our reportable business segments increased $1,957 from 2021 to 2022 primarily due to increases in general and administrative expense and in foreign currency exchange loss.
Segment eliminations changed from a net loss of $14,823 for the year ended December 31, 2021 to a net income of $937 for the year ended December 31, 2022. This change consisted of a $14,590 decrease in acquisition fees received by our Container Management segment from our Container Ownership segment and a $1,170 increase in amortization related to capitalized acquisition fees received by our Container Management segment from our Container Ownership segment, respectively. Our Container Ownership segment capitalizes acquisition fees billed by our Container Management segment as part of containers, net and records lease rental income and depreciation expense to amortize the acquisition fees over the lease terms and useful lives of the containers, respectively, which is eliminated in consolidation.
Currency
Almost all of our revenues are denominated in U.S. dollars and our direct container expenses and operating expenses were substantially denominated in U.S. dollars. We pay our non-U.S. employees in local currencies and certain operating expenses are denominated in foreign currencies. During 2022, 2021 and 2020, $8,879 or 28%, $5,024 or 21%, and $15,225 or 28%, respectively, of the Company’s direct container expenses – owned fleet were paid in foreign currencies. Our operations in locations outside of the U.S. have some exposure to foreign currency fluctuations, and trade growth and the direction of trade flows can be influenced by large changes in relative currency values. In accordance with its policy, the Company does not hedge these container expenses as there are no significant payments made in any one foreign currency. For further detail on foreign currencies, see Note 1 “Nature of Business and Summary of Significant Accounting Policies” to our consolidated financial statements in Item 18, “Financial Statements” in this Annual Report on Form 20-F).
B. Liquidity and Capital Resources
As of December 31, 2022, we had cash and cash equivalents (including restricted cash) of $267,409. For the year ended December 31, 2022, cash provided by operating activities, together with the proceeds from container leaseback financing receivable and proceeds from sale of containers and fixed assets was $1,011,396. In addition, we had $792,701 of maximum borrowing capacity remaining under our debt facilities as of December 31, 2022. We have successfully utilized a wide variety of debt financing alternatives to fund our growth, including revolving credit facilities, term loans and bonds payable. We believe this diversity of debt funding, combined with our access to the public equity markets, provides us with an advantage in terms of both cost and availability of capital, versus our smaller competitors and also some of our shipping line customers. It is likely that we will generate sufficient operating cash flow to meet these ongoing obligations in the foreseeable future.
Our principal sources of liquidity have been our cash flows from operations including the sale of containers and borrowings under debt facilities. Our cash inflows from operations are affected by the utilization rate of our fleet and the per diem rates of our leases, whereas the cash inflows from proceeds for the sale of containers are affected by market demand for used containers and our available inventory of containers for sale. Our cash outflows are affected by payments and expenses primarily related to our purchasing of containers, required principal and interest payments on our debt obligations, and any dividends and share repurchases. Also, see our discussion in Note 10 “Commitments and Contingencies” to our consolidated financial statements in Item 18, “Financial Statements” in this Annual Report on Form 20-F, which may place demands on our short-term liquidity.
Assuming that our lenders remain solvent, and lessees meet their lease payment obligations, we currently believe that our existing cash and cash equivalents, cash flows generated from operations, proceeds from the sale of containers and borrowing availability under our debt facilities are sufficient to meet our working capital needs and other capital and liquidity
48
requirements for the next twelve months. We will continue to monitor our liquidity and the credit markets in light of the global economic uncertainty and financial market conditions caused by the pandemic, the ongoing Russia-Ukraine war and other ongoing geopolitical and economic stress. However, we cannot predict with any certainty the impact on the Company of any further disruptions in the credit environment.
Capital Expenditures and Commitments
As of December 31, 2022, we had container contracts payable to manufacturers of $6,648. During 2022, we paid $940,188 for containers and fixed assets, including for containers under leaseback financing receivable, and we have $3,800 of total purchase commitments for future container investments for delivery in 2023. Our capital requirements are primarily financed through cash flows from operations and our debt facilities. The timing of our debt refinancing will depend on our level of future purchases of containers, the size of our debt facilities in the future, and prevailing conditions in the debt markets.
As of December 31, 2022, we had $9,963 of future payment obligations related to our office operating leases, of which $2,334 is due within the next twelve months (for further detail, see Note 4 “Leases” to our consolidated financial statements in Item 18, “Financial Statements” in this Annual Report on Form 20-F).
As of December 31, 2022, we had no off-balance sheet arrangements that have or are reasonably likely to have a current or future effect on our financial condition, change in financial condition, revenues or expenses, results of operations, liquidity, capital expenditures or capital resources that is material to investors.
Dividends
During 2022, we paid $19,875 of cash dividends to our preferred shareholders. As of December 31, 2022, we have cumulative undeclared and unpaid preferred dividends of $854.
During 2022, our board of directors declared a $0.25 quarterly cash dividend per common share for a total aggregate amount of $46,235 to our common shareholders.
Share Repurchase Program
Since the inception of the program in 2019, we repurchased an aggregate total of $328,403 under our share repurchase program, of which $179,092 were repurchased during 2022 (for further detail, see Item 16E, “Purchases of Equity Securities by the Issuer and Affiliated Purchasers”).
Description of Indebtedness
As of December 31, 2022, the total outstanding principal balance on our debt facilities was $5,539,803, of which $385,836 are due within the next twelve months. Final maturities on these debt facilities are between December 2026 and August 2046. As of December 31, 2022, approximately 90% of our debt facilities have either fixed interest rates or floating interest rates that have been synthetically fixed through interest rate swap agreements. From time to time, we may issue additional debt in order to raise capital for future requirements. For further discussions and detail on the estimated future principal payments on our debt obligations, see Note 7 “Debt” to our consolidated financial statements in Item 18, “Financial Statements” in this Annual Report on Form 20-F.
As of December 31, 2022, our estimated future aggregate interest payments on debt obligations amounted to $970,991 (including amounts due within the next twelve months of $218,940), and our estimated future aggregate interest receivables on net interest rate swap receivables amounted to $215,266 (including amounts due within the next twelve months of $55,087).
49
As of December 31, 2022, we had the following outstanding borrowings and borrowing capacities per debt facility (in thousands):
Facility: |
Current |
|
Additional |
|
Total |
|
Available |
|
Current and |
|
|||||
TL Revolving Credit Facility |
$ |
1,367,858 |
|
$ |
532,142 |
|
$ |
1,900,000 |
|
$ |
272,748 |
|
$ |
1,640,606 |
|
TL 2019 Term Loan |
|
127,293 |
|
|
— |
|
$ |
127,293 |
|
|
— |
|
|
127,293 |
|
TL 2021-1 Term loan |
|
60,315 |
|
|
— |
|
|
60,315 |
|
|
— |
|
|
60,315 |
|
TL 2021-2 Term Loan |
|
192,201 |
|
|
— |
|
|
192,201 |
|
|
— |
|
|
192,201 |
|
TMCL II Secured Debt Facility |
|
1,239,441 |
|
|
260,559 |
|
|
1,500,000 |
|
|
34,977 |
|
|
1,274,418 |
|
TMCL VII 2020-1 Bonds (1) |
|
332,413 |
|
|
— |
|
|
332,413 |
|
|
— |
|
|
332,413 |
|
TMCL VII 2020-2 Bonds (1) |
|
476,279 |
|
|
— |
|
|
476,279 |
|
|
— |
|
|
476,279 |
|
TMCL VII 2020-3 Bonds (1) |
|
175,750 |
|
|
— |
|
|
175,750 |
|
|
— |
|
|
175,750 |
|
TMCL VII 2021-1 Bonds (1) |
|
467,880 |
|
|
— |
|
|
467,880 |
|
|
— |
|
|
467,880 |
|
TMCL VII 2021-2 Bonds (1) |
|
564,373 |
|
|
— |
|
|
564,373 |
|
|
— |
|
|
564,373 |
|
TMCL VII 2021-3 Bonds (1) |
|
536,000 |
|
|
— |
|
|
536,000 |
|
|
— |
|
|
536,000 |
|
Total (2) |
$ |
5,539,803 |
|
$ |
792,701 |
|
$ |
6,332,504 |
|
$ |
307,725 |
|
$ |
5,847,528 |
|
Debt Covenants
All of our debt facilities are secured by specific pools of containers and related assets owned by the Company. TGH also acts as an unconditional guarantor of the TL Revolving Credit Facility, the TL 2019 Term Loan, the TL 2021-1 Term Loan, and the TL 2021-2 Term Loan. In addition to customary events of default as defined in our credit agreements and indenture and various restrictive financial covenants, the Company’s debt facilities also contain other various debt covenants and borrowing base minimums. The TL Revolving Credit Facility, TL 2019 Term Loan, TL 2021-1 Term Loan, and TL 2021-2 Term Loan also contain cross default provisions that may result in an acceleration of principal repayment under these debt facilities if an uncured default condition were to exist.
The debt agreements are the obligations of our subsidiaries and related debt covenants may be calculated at the consolidated or subsidiary level. We are subject to financial covenants such as those related to leverage, interest coverage, container sales proceeds ratio, net income and debt levels, including limitations on certain liens, indebtedness and investments.
50
The table below reflects the key covenants for the Company that cover the majority of our debt agreements as of December 31, 2022:
Financial Covenant |
|
TGH |
|
TL |
|
TEML |
Consolidated leverage ratio |
|
Shall not exceed 3.80:1 |
|
Shall not exceed 3.80:1 |
|
— |
Consolidated fixed charge coverage ratio |
|
Shall not be less than 1.20:1 |
|
— |
|
— |
Consolidated interest coverage ratio |
|
— |
|
Shall not be less than 4.00:1 |
|
— |
Consolidated funded debt |
|
— |
|
— |
|
Shall not exceed $1,000 |
Consolidated tangible net worth |
|
Shall not be less than $1,230,215 plus 50% of TGH’s net income |
|
— |
|
— |
Annual after-tax profit |
|
— |
|
— |
|
Shall not be less than $2,000 |
All of the Company’s debt facilities also contain restrictive covenants on borrowing base minimums. As of December 31, 2022, we were in compliance with all of the applicable debt covenants.
Cash Flow
The following table summarizes our cash flow information for the years ended December 31, 2022 and 2021:
|
|
Year Ended December 31, |
|
|
|
|
||||||
|
|
2022 |
|
|
2021 |
|
|
Variance |
|
|||
|
|
(Dollars in thousands) |
|
|
|
|
||||||
Net cash provided by operating activities |
|
$ |
752,519 |
|
|
$ |
611,783 |
|
|
$ |
140,736 |
|
Net cash used in investing activities |
|
|
(681,311 |
) |
|
|
(1,930,129 |
) |
|
|
1,248,818 |
|
Net cash (used in) provided by financing activities |
|
|
(86,246 |
) |
|
|
1,395,832 |
|
|
|
(1,482,078 |
) |
Operating Activities
Net cash provided by operating activities increased $140,736 from 2021 to 2022. The increase in net cash provided by operating activities was due to a $33,332 increase in net income adjusted for depreciation and other non-cash items and a $107,404 increase in net working capital adjustments. The increase in net working capital adjustment provided by operating activities was primarily due to an increase of $88,387 in receipt of payments on finance leases, net of income earned, a decrease of $11,187 in accounts receivable primarily caused by the timing of collections, partially offset by a $19,370 decrease in other liabilities mostly due to a decrease in deferred revenue.
Investing Activities
Net cash used in investing activities decreased $1,248,818 from 2021 to 2022 primarily due to a $1,163,677 decrease in payments for container purchases, including containers under leaseback financing receivables.
51
Financing Activities
Net cash used in financing activities was $86,246 in 2022, and net cash provided by financing activities was $1,395,832 in 2021. The net decrease by $1,482,078 from 2021 to 2022 was primarily due to a decrease of $1,080,084 in net borrowings, a $106,872 increase in purchases of treasury shares under our share repurchase program, a $43,850 increase in cash dividend payments to preferred and common shareholders, and net proceeds received in 2021 of $290,550 from the preferred shares offering, partially offset by cash paid in 2021 of $21,500 for the purchase of noncontrolling interest.
C. Research and Development, Patents and Licenses, etc.
We do not carry out research and development activities and our business and profitability are not materially dependent upon any patents or licenses. We have registered “TEXTAINER,” “TEX” and “tex” (logo) in the U.S. Patent and Trademark Office and in the patent and trademark agencies of thirteen countries as trademarks.
D. Trend Information
Please see Item 5, “Operating and Financial Review and Prospects – Liquidity and Capital Resources” for a description of identifiable trends, demands, commitments, events or uncertainties that will result in, or that are reasonably likely to result in, our liquidity either increasing or decreasing at present or in the foreseeable future. Other than as disclosed elsewhere in this Annual Report, we are not aware of any trends, uncertainties, demands, commitments or events that are reasonably likely to have a material effect on our revenues, net income, profitability, liquidity or capital resources, or that would cause reported financial information not necessarily to be indicative of future operating results or financial condition.
E. Critical Accounting Estimates
The preparation of financial statements in conformity with U.S. GAAP requires management to use judgment in making estimates and assumptions that affect the reported amounts and disclosures as of the date of the financial statements. We have identified the estimates below as among those critical to our business operations and the understanding of our results of operations. We evaluate our estimates on an ongoing basis, and our estimates and judgments are based on historical experience, various other assumptions that we believe are reasonable under the circumstances and the relevant information available at the end of each period. These estimates may change as new events occur and additional information is obtained. Actual results could differ from these estimates under different assumptions or conditions.
Container Leasing Equipment
Depreciation. When we acquire containers, we record the cost of the container on our balance sheet. Capitalized costs for new container leasing equipment include the manufactured cost, inspection, delivery and associated transportation costs incurred in moving the container from the manufacturer to the containers’ first destined port. We depreciate the container using the straight-line method over its estimated useful life (which represents the number of years we expect to be able to lease the container to shipping lines) to its estimated residual value (which represents the amount we estimate we will recover upon the sale or other disposition of the equipment at the end of its useful life as a shipping container). Depreciation on container leasing equipment commences on the date of initial on-hire. Our estimates of useful life are based on our actual historical experience with our fleet, and our estimates of residual value are based on a number of factors including average selling prices.
We review our depreciation policies, including estimates of useful lives and residual values, on a regular basis to determine whether a change in estimates of useful lives and residual values is warranted.
We completed our 2022 annual depreciation policy review during the second half of the year and concluded no change was necessary. To perform the assessment for our estimated residual value, we analyzed sales data over a minimum of a ten-year period which reflected the cyclical nature of the global economic environment and more specifically, our industry, and assessed whether the average selling prices fall within a reasonable range compared to current residual values. We believe a ten-year length of time includes sufficient periods of high and low used container prices to allow us to more accurately predict future residual values. If the ten-year period was outside of the range of a container type, we evaluated the trend in average selling prices over three, five, and seven-year periods to corroborate the trend in the ten-year period. To perform the
52
assessment for our estimated useful lives, we also analyzed the average age at disposal for containers sold over the same ten-year period data used for our analysis of residual values. We then performed a peer comparison to evaluate if there were significant differences between the residual values of our containers as compared to peer within the industry.
Valuation of Container Leasing Equipment. On a quarterly basis, we evaluate our containers held for use in our leasing operation to determine whether there has been any event such as a decline in results of operations or residual values that would cause the book value of our containers held for use to be impaired. We performed an annual quantitative impairment assessment of our containers held for use as of December 31, 2022 to corroborate that there were no impairment triggers by comparing the total expected undiscounted cash flows of each asset group to its carrying value. When testing for impairment, the evaluation is performed at the lowest level of identifiable cash flows which we have determined to be groups of containers based on equipment type. The estimated undiscounted cash flows are based on historical lease operating revenue, expenses and residual values, adjusted to reflect current market conditions. The key assumptions used to determine future undiscounted cash flows are expected utilization, remaining useful lives, expected future lease rates, and expected sales prices of used containers.
Impairment exists when the estimated future undiscounted cash flows to be generated by an asset group are less than the net book value of that asset group. When an impairment exists, containers held for use are written down to their estimated fair value and the amount of the write down is recorded in depreciation expense. As of December 31, 2022, the estimated undiscounted future cash flows exceeded the carrying value of our container leasing equipment held for use in our leasing operations. There were no key indicators of impairment, and we did not record any impairment charges related to our container leasing equipment held for use in our leasing operations for the years ended December 31, 2022, 2021 and 2020.
Containers Held for Sale
We also evaluate all off-lease containers to determine whether the containers will be repaired and returned to service or sold based upon what we estimate will be the best economic alternative. If we designate a container as held for sale, depreciation on the container ceases, and the container is reported at the lower of (1) its recorded value or (2) the amount we expect to receive upon sale (less the estimated cost to sell the container). Containers held for sale are evaluated for impairment on a quarterly basis based on sale prices for similar types of equipment in the locations in which the containers are stored. When we are required to write down the cost basis of its containers identified for sale to fair value less cost to sell, we measures the fair value of its containers identified for sale under a Level 2 input. We rely on the recent sales prices for identical or similar assets in markets, by geography, that are active. We records impairments to write down the value of containers identified for sale to their estimated fair value less cost to sell.
Any write-down of containers held for sale is reflected in our statement of operations as an expense. If a large number of containers are designated as held for sale or prices for used containers drop, impairment charges for containers held for sale may increase which would result in decreased net income. Subsequent additions or reductions to the fair values of these written down assets are recorded as adjustments to the carrying value of the equipment held for sale. Any subsequent increase in fair value is recognized as a reversal to container impairment but not in excess of the cumulative loss previously recognized. During the years ended December 31, 2022, 2021 and 2020, we recorded container impairment charges (reversals) of $2,325, $(385) and $11,094, respectively, to write down the value of containers held for sale to their estimated fair value less cost to sell, net of reversals of previously recorded impairments on containers held for sale, due to rising used container prices. We continue to monitor the performance of our container fleet and evaluate the key factors driving market conditions and assess the assumptions used in our impairment testing analysis should market conditions warrant a reassessment.
For further discussion on critical accounting estimates, significant accounting policies and recent accounting pronouncements, see Note 1 “Nature of Business and Summary of Significant Accounting Policies” to our consolidated financial statements in Item 18, “Financial Statements” in this Annual Report on Form 20-F.
53
ITEM 6. DIRECTORS, SENIOR MANAGEMENT AND EMPLOYEES
The following table sets forth information regarding our executive officers and directors as of February 14, 2023. Our board of directors is elected annually on a staggered basis and each director holds office for three years or until his successor has been duly elected, except in the event of his death, resignation, removal or earlier termination of his office. Our bye-laws provide for, among other things, the election of our board of directors on a staggered basis. The business address of each of our executive officers and non-management directors is Century House, 16 Par-La-Ville Road, Hamilton HM 08, Bermuda.
David M. Nurek, Robert D. Pedersen and Grace Tang are designated Class III directors, to hold office until our 2023 annual general meeting of shareholders. Olivier Ghesquiere, James Earl and Cynthia Hostetler are designated Class II directors, to hold office until our 2024 annual general meeting of shareholders, and Jeremy Bergbaum, Dudley R. Cottingham, Hyman Shwiel and Lisa P. Young are designated Class I directors, to hold office until our 2025 annual general meeting of shareholders. Directors may be re-elected when their term of office expires.
Executive Officers and Directors |
|
Age |
|
Position |
Hyman Shwiel (1) |
|
78 |
|
Chairman |
Olivier Ghesquiere |
|
56 |
|
Director, President and Chief Executive Officer |
Dudley R. Cottingham (1)(2) |
|
71 |
|
Director |
David M. Nurek (2)(3) |
|
73 |
|
Director |
Robert D. Pedersen (3) |
|
63 |
|
Director |
Grace Tang (1) |
|
63 |
|
Director |
James Earl (1)(2) |
|
66 |
|
Director |
Cynthia Hostetler (1)(3) |
|
60 |
|
Director |
Jeremy Bergbaum (1)(3) |
|
67 |
|
Director |
Lisa P. Young (1)(2) |
|
60 |
|
Director |
Michael K. Chan |
|
60 |
|
Executive Vice President and Chief Financial Officer |
Certain biographical information about each of these individuals is set forth below.
Directors
Hyman Shwiel has been a member of our board of directors since September 2007. Mr. Shwiel was a partner with Ernst & Young LLP for 25 years. He served during that period in various roles, including Area Managing Partner and as National Director of Enterprise and Professional Risk. Upon his retirement in 2005, he became a consultant to Ernst & Young until 2007. Mr. Shwiel holds a C.T.A. and a M.B.A. from the University of Cape Town and is a Chartered Accountant (South Africa) and a CPA.
Olivier Ghesquiere was appointed President and Chief Executive Officer and to our board of directors in August 2018. Mr. Ghesquiere served as our Executive Vice President – Leasing from January 2017 to August 2018, responsible for worldwide sales and marketing related activities and operations. Mr. Ghesquiere served as our Senior Vice President – Marketing and Sales since December 2015. Mr. Ghesquiere worked at Groupe Ermewa S.A. as Chief Operating Officer and then Chief Executive Officer from January 2009 through February 2015 where he was responsible for growing the railcar and locomotive fleet to become the second largest in Europe. During that time Mr. Ghesquiere was also Chairman of Eurotainer SA for which he was the Managing Director from April 2004 through December 2008 where he developed their tank container business focusing on higher value segments of the market. Mr. Ghesquiere has served as Vice Chairman and Chairman of the International Tank Container Organization (ITCO) leasing committee from 2006 through 2010. Mr. Ghesquiere holds a degree in Applied Economics from the Louvain School of Management, Belgium.
54
Dudley R. Cottingham has been a member of our board of directors since December 1993 and served as assistant Secretary and/or secretary between December 1993 and October 2007. He has also served in the past as president of certain of our subsidiaries and continues to serve as a director of our Bermuda subsidiaries. Mr. Cottingham has over 35 years of experience in public accounting for a variety of international and local clients. He is a director and the audit committee Chairman of Bermuda Press (Holdings) Ltd., a newspaper publishing and commercial printing company listed on the Bermuda Stock Exchange and is Chairman of the listing committee of the Bermuda Stock Exchange. He is Chairman and an Investment and Operational Committee member of the Aurum Funds which are listed on the Bermuda Stock Exchange. He was a managing director of and was formerly a partner of Arthur Morris & Company Limited, a provider of audit and accounting services for international clients, since 1982. Mr. Cottingham is currently a consultant and had served as vice president and director of Continental Management Ltd., a Bermuda company providing corporate representation, administration and management services, since 1982 and was a director of Continental Trust Corporation Ltd., a Bermuda company that provides corporate and individual trust administration services, since 1994. He is a director of Morris, Cottingham & Co. Ltd. and their other group companies in Turks & Caicos Islands. Mr. Cottingham is a Chartered Accountant.
David M. Nurek has been a member of our board of directors since September 2007. Mr. Nurek was appointed as an alternate director of Trencor in November 1992 and as a non-executive member of its board of directors in July 1995. He is Chairman of Trencor and a member of Trencor’s audit, remuneration, social and ethics, risk and governance committees. In August 2019, Mr. Nurek retired from his position as an executive of Investec Bank Limited, a subsidiary of Investec Limited, which is listed on the JSE. Investec Limited has entered into a dual listed company structure with Investec plc, which is quoted on the London Stock Exchange (collectively, the “Investec Group”). He was the regional Chairman of Investec Limited’s various businesses in the Western Cape, South Africa, and also the Investec Group’s worldwide head of legal risk. Prior to joining Investec Limited in June 2000, Mr. Nurek served as Chairman of the South African legal firm Sonnenberg Hoffmann & Galombik, which has since changed its name to Edward Nathan Sonnenbergs Inc. Mr. Nurek serves as a non-executive on the boards of directors of various listed and unlisted companies in South Africa and holds a Diploma in Law and a Graduate Diploma in Company Law from the University of Cape Town and completed a Program of Instruction for Lawyers at Harvard Law School and a Leadership in Professional Services Firms program at Harvard Business School.
Robert D. Pedersen has been a member of our board of directors since April 2017. Mr. Pedersen was appointed President and Chief Executive Officer of TEML, our management company, in October 2011 and retired on March 31, 2017. Mr. Pedersen served as our Executive Vice President responsible for worldwide sales and marketing related activities and operations since January 2006. Mr. Pedersen was Senior Vice President of our leasing group from 1999 to 2005. From 1991 to 1999, Mr. Pedersen held several positions within our company, and from 1978 through 1991, he worked in various capacities for Klinge Cool, a manufacturer of refrigerated container cooling units, XTRA, a container lessor, and Maersk Line, a container shipping line. Mr. Pedersen is a graduate of the A.P. Moller Shipping and Transportation Program and the Merkonom Business School in Copenhagen, where he majored in Company Organization.
Grace Tang has been a member of our board of directors since August 2020. Ms. Tang was a partner with PwC for 22 years until her retirement in 2020. She served on the Board of Partners of the PwC China, Hong Kong, Taiwan and Singapore firms. She served as the leader of the Industrial Products sector and also the multinational client practice in China where she assisted domestic Chinese and international clients. Ms. Tang serves as an instructor of the Master of Business Administration and Master of Professional Accounting degree programs at the Peking University. Ms. Tang is a US certified public accountant, a member of the American Institute of Certified Public Accountants, and a fellow of the Hong Kong Institute of Certified Public Accountants. Ms. Tang has a B.S. from the University of Utah and an M.B.A. from Utah State University.
James Earl has been a member of our board of directors since May 2021. Mr. Earl was an executive with GATX Corporation, a publicly traded lessor of railcars, from 1988 to 2018, ultimately serving as Executive Vice President, President of its Rail International division and CEO of GATX’s American Steamship Company. Previously Mr. Earl held management positions with the Soo Line Railroad and Southern Pacific Transportation Company. Mr. Earl serves on the Board of Directors of Harsco Corporation, a NYSE listed global market leader providing environmental solutions for industrial and specialty waste streams, and innovative technologies for the rail sector. Mr. Earl has a B.S. from Washington University in St. Louis and an M.B.A. from the Wharton School at the University of Pennsylvania.
Cynthia Hostetler has been a member of our board of directors since May 2021. Ms. Hostetler serves as a Trustee of Invesco Ltd. and is a member of the boards of TriLinc Global Fund, an impact investment company, Vulcan Materials Company, an NYSE listed producer of construction aggregates and Resideo Technologies, Inc., an NYSE listed manufacturer and distributor of security, energy efficiency and control systems for homes. Ms. Hostetler also has served on the board of
55
the Investment Company Institute since 2018. From 2001 to 2009, Ms. Hostetler served as Head of Investment Funds and Private Equity at the Overseas Private Investment Corporation (OPIC). She also served on the Board of Directors of Edgen Group, a global energy infrastructure company, prior to its acquisition by Sumitomo and the Board of Directors of Genesse & Wyoming, Inc. prior to its sale. Additionally, she has served as President and a member of the Board of Directors of First Manhattan Bancorporation, a bank holding company in the Midwest. She began her career as a corporate lawyer with Simpson Thacher & Bartlett in New York. Ms. Hostetler has a J.D. from the University of Virginia and a B.A. from Southern Methodist University.
Jeremy Bergbaum has been a member of our board of directors since May 2022. At the end of 2021, Mr. Bergbaum retired from EXISF Worldwide Inc., the largest lessor of intermodal tank containers and a Berkshire Hathaway company. Mr. Bergbaum was with EXSIF and its predecessor companies for over 29 years and served as President of EXSIF for 21 years. During this time EXSIF grew its fleet to over 75,000 TEU with a book value of over $1 billion. Mr. Bergbaum is a founding member of the International Tank Container Organization (ITCO) and served as its first President.
Lisa P. Young has been a member of our board of directors since May 2022. Ms. Young was with Ernst & Young LLP for 36 years, including 24 years as a partner until her retirement in June of 2021. She served in several roles during this period, including as Senior Global Client Service Partner for several of the firm’s largest public company clients and additionally as Americas Professional Practice Partner and Global Capital Markets Partner in EY’s National Office. Ms. Young serves on the Board of Directors and Audit Committee of the Board of Accelus, Inc., a company focused on minimally invasive spine surgery technology. Ms. Young is a Certified Public Accountant and holds a BBA in Finance and Accounting from Texas Tech University.
Executive Officers
For certain biographical information about Olivier Ghesquiere, see “Directors” above.
Michael K. Chan was appointed Executive Vice President and Chief Financial Officer (CFO) in September 2018. Mr. Chan served as our Vice President and Senior Vice President of Finance from April 2017 through August 2018, responsible for overseeing treasury, investor relations, accounting, financial reporting, and financial planning and analysis. Mr. Chan also served as a Controller from 1994 to 2006. Prior to re-joining the company in 2017, Mr. Chan was CFO at Ygrene Energy Fund from 2015 to 2017, a market-leading specialty finance company, where he raised nearly $1 billion in capital and achieved the industry’s first AAA rating on the company’s senior notes. From 2011 to 2015, Mr. Chan worked as Senior Director of Treasury and Capital Markets for The Cronos Group, a leading global container leasing company which was acquired by Shenzhen Stock Exchange listed Bohai Leasing Company. Before that, Mr. Chan held the CFO position at The Chartres Lodging Group from 2006 to 2011, where he was instrumental in executing key acquisitions and sales for the hotel investment and asset management company. Mr. Chan joined Coopers & Lybrand in 1989, now PricewaterhouseCoopers (PwC) and held the position of Audit Manager. Mr. Chan is a member of the American Institute of Certified Public Accountants (AICPA) and holds a B.S. in Business Administration – Accounting from California State University East Bay.
56
Board of Directors
Our board of directors currently consists of ten members. Our bye-laws provide that our board of directors shall consist of five to twelve directors, as the board of directors may determine from time to time.
Executive Compensation
The aggregate direct compensation we paid to our two senior executives (CEO and CFO) as a group for the year ended December 31, 2022 was approximately $4,157, which included approximately $1,598 in STIP bonuses paid in 2022 (representing STIP earned for calendar year 2021 but paid in early 2022), approximately $1,353 in restricted stock awards that vested in 2022 from grants made in prior years, and approximately $17 funds set aside or accrued to provide for retirement or similar benefits. This amount does not include expenses we incurred for other payments, including dues for professional and business associations, business travel, health insurance and other expenses, which amounted to approximately $154. We did not pay our senior executives who also serve as directors any separate compensation for their directorship during 2022, other than reimbursements for travel expenses. During 2022, our executive officers as a group were granted 89,406 performance-based restricted share units and 32,308 time-based restricted share units through our 2019 Share Incentive Plan.
Director Compensation
The aggregate direct compensation we paid to our directors who are not officers for their services as directors as a group for the year ended December 31, 2022 was approximately $1,869, which included approximately $1,104 in restricted stock awards granted in 2022. This amount does not include $1,094 in restricted stock awards value that vested in 2022 from grants made in prior year. Each director who is not an officer is entitled to a base annual cash retainer of $60 (with the exception of the Chairman of the Board who receives an additional base annual cash retainer of $30) plus a restricted stock grant valued at $120 on the date of grant (with the exception of the Chairman of the Board who receives an additional restricted stock grant value of $24). This grant vests in full one year after grant. During 2022, our non-executive directors as a group were granted 34,362 time-based restricted share units through our 2019 Share Incentive Plan.
Additionally, members of our Audit and Risk Committee receive an additional annual fee of $15 and members of all other Committees receive an additional annual fee of $10. The head of the Audit and Risk Committee receives an additional annual fee of $15 and the head of all other Committees receive an additional annual fee of $10. Directors were also reimbursed for expenses incurred to attend board or committee meetings which amounted to approximately $104 during 2022.
2019 Share Incentive Plan
The 2019 Plan provides for the grant of share options, restricted shares, restricted share units, share appreciation rights and dividend equivalent rights, collectively referred to as “awards.” We may grant incentive share options only to our employees or employees of any parent or subsidiary of Textainer Group Holdings Limited. Awards other than incentive share options may be granted to our employees, directors and consultants or the employees, directors and consultants of any parent or subsidiary of Textainer Group Holdings Limited.
Our board of directors or a committee designated by our board of directors, referred to as the “plan administrator,” administers the 2019 Plan, including selecting the award recipients, determining the number of shares to be subject to each award, the types of awards, the value and timing of awards, determining the exercise or purchase price of each award and determining the vesting and exercise periods of each award. Awards under the plan may vest upon the passage of time or upon the attainment of certain performance criteria.
Unless terminated sooner, the 2019 Plan will automatically terminate in 2029. The board of directors will have authority to amend or terminate the 2019 Plan. To the extent necessary to comply with applicable provisions of federal securities laws, state corporate and securities laws, the Code, the rules of any applicable stock exchange or national market system, and the rules of any non-U.S. jurisdiction applicable to awards granted to residents therein, we will obtain shareholder approval of any such amendment to the 2019 Plan in such a manner and to such a degree as required.
2022 Short-Term Incentive Program (STIP)
57
Annually, our board of directors or the Compensation Committee set objective performance criteria when determining the annual short-term incentive bonuses to be awarded to our executive officers and employees. The Compensation Committee believes that our STIP, which provides an annual cash bonus to all employees, including employees of our dedicated agents and our executive officers, based on performance relative to Company and individual achievement goals provides executives’ incentives to increase shareholder value and helps ensure that we attract and retain talented personnel. Under the STIP program for 2022, all eligible employees received an incentive award based on their respective job classification and our return on equity and adjusted net income.
Employment with Executive Officers and Directors
We have entered into employment agreements with our executive officers. Each of these employment agreements contains provisions requiring us to make certain severance payments in case the executive officer is terminated without cause. Employment is at-will for each of our executive officers and their employment may be terminated at any time for any reason. Other than as disclosed above, none of our directors has service contracts with us or any of our subsidiaries providing for benefits upon termination of employment.
Our corporate governance practices are in compliance with, and are not prohibited by, the laws of Bermuda. Therefore, we are exempt from many of the NYSE corporate governance practices, other than the establishment of a formal audit committee satisfying the requirements of Rule 10A-3 under the Exchange Act and notification of non-compliance with NYSE listing requirements pursuant to Rule 10A-3 promulgated under the Exchange Act. For further discussion on the practices that we follow in lieu of the NYSE’s corporate governance rules, see Part II Item 16G, “Corporate Governance” in this Annual Report on Form 20-F.
See Item 4, “Information of the Company” for information regarding our human capital management.
See Item 7, “Major Shareholders and Related Party Transactions” for information regarding director and senior management ownership of our common shares.
58
The following table shown the beneficial ownership of our common shares on December 31, 2022 by:
For the purposes of the following table, beneficial ownership of our common shares is determined in accordance with the rules of the SEC and generally includes any common shares over which a person exercises sole or shared voting or investment power. The percentage of beneficial ownership of our common shares is based on 43,634,655 common shares were issued and outstanding on December 31, 2022. We do not believe that we are directly or indirectly owned or controlled by any foreign government. The voting rights of our common shares held by major shareholders are the same as the voting rights of shares held by all other common shareholders. We are unaware of any arrangement that might result in a change of control of the Company.
|
|
Number of Common Shares |
|
|||||
Holders |
|
Shares (8) |
|
|
% (1) |
|
||
5% or More Shareholders |
|
|
|
|
|
|
||
MandG Investment Managers (Pty) Ltd. (2) |
|
|
5,444,481 |
|
|
|
12.5 |
% |
Dimensional Fund Advisors LP (3) |
|
|
3,521,116 |
|
|
|
8.1 |
% |
Coronation Asset Management (Pty) Ltd. (4) |
|
|
3,504,546 |
|
|
|
8.0 |
% |
Donald Smith & Co., Inc. (5) |
|
|
2,755,426 |
|
|
|
6.3 |
% |
|
|
|
|
|
|
|
||
Directors and Executive Officers |
|
|
|
|
|
|
||
Olivier Ghesquiere |
|
|
418,215 |
|
|
|
1.0 |
% |
Robert D. Pedersen |
|
|
165,416 |
|
|
* |
|
|
Michael K. Chan |
|
|
151,389 |
|
|
* |
|
|
Hyman Shwiel |
|
|
53,710 |
|
|
* |
|
|
Dudley R. Cottingham (6) |
|
|
50,132 |
|
|
* |
|
|
David M. Nurek (7) |
|
|
47,132 |
|
|
* |
|
|
James Earl |
|
|
7,887 |
|
|
* |
|
|
Cynthia Hostetler |
|
|
7,887 |
|
|
* |
|
|
Grace Tang |
|
|
6,331 |
|
|
* |
|
|
Jeremy Bergbaum |
|
|
4,098 |
|
|
* |
|
|
Lisa Young |
|
|
3,735 |
|
|
* |
|
|
Current directors and executive officers (11 persons) as a group |
|
|
915,932 |
|
|
|
2.1 |
% |
59
* Less than 1%.
60
|
Grant Date |
|
||||||||||||||||||||||||||||
|
11/14/2013 |
|
11/19/2014 |
|
5/18/2017 |
|
11/30/2017 |
|
11/30/2018 |
|
11/30/2019 |
|
10/1/2020 |
|
10/5/2021 |
|
5/26/2022 |
|
10/3/2022 |
|
||||||||||
Share options |
|
|
|
|
|
|
|
|
|
|
|
|
|
|
|
|
|
|
|
|
||||||||||
Exercise price |
$ |
38.36 |
|
$ |
34.14 |
|
$ |
9.75 |
|
$ |
22.95 |
|
$ |
11.15 |
|
$ |
9.13 |
|
N/A |
|
N/A |
|
N/A |
|
N/A |
|
||||
Expiration date |
11/14/2023 |
|
11/19/2024 |
|
5/18/2027 |
|
11/30/2027 |
|
11/30/2028 |
|
11/30/2029 |
|
N/A |
|
N/A |
|
N/A |
|
N/A |
|
||||||||||
Olivier Ghesquiere |
|
— |
|
|
— |
|
|
— |
|
|
17,760 |
|
|
40,000 |
|
|
40,000 |
|
|
— |
|
|
— |
|
|
— |
|
|
— |
|
Michael K. Chan |
|
— |
|
|
— |
|
|
2,500 |
|
|
4,750 |
|
|
20,000 |
|
|
18,276 |
|
|
— |
|
|
— |
|
|
— |
|
|
— |
|
Robert D. Pedersen |
|
26,000 |
|
|
13,910 |
|
|
— |
|
|
— |
|
|
— |
|
|
— |
|
|
— |
|
|
— |
|
|
— |
|
|
— |
|
Performance restricted share units |
|
|
|
|
|
|
|
|
|
|
|
|
|
|
|
|
|
|
|
|
||||||||||
Olivier Ghesquiere |
|
— |
|
|
— |
|
|
— |
|
|
— |
|
|
— |
|
|
— |
|
|
72,957 |
|
|
46,841 |
|
|
— |
|
|
70,517 |
|
Michael K. Chan |
|
— |
|
|
— |
|
|
— |
|
|
— |
|
|
— |
|
|
— |
|
|
21,887 |
|
|
13,383 |
|
|
— |
|
|
18,889 |
|
Restricted share units |
|
|
|
|
|
|
|
|
|
|
|
|
|
|
|
|
|
|
|
|
||||||||||
Olivier Ghesquiere |
|
— |
|
|
— |
|
|
— |
|
|
— |
|
|
— |
|
|
10,000 |
|
|
7,424 |
|
|
9,915 |
|
|
— |
|
|
25,482 |
|
Michael K. Chan |
|
— |
|
|
— |
|
|
— |
|
|
— |
|
|
— |
|
|
5,000 |
|
|
2,227 |
|
|
2,832 |
|
|
— |
|
|
6,826 |
|
Hyman Shwiel |
|
— |
|
|
— |
|
|
— |
|
|
— |
|
|
— |
|
|
— |
|
|
— |
|
|
— |
|
|
4,482 |
|
|
— |
|
Robert D. Pedersen |
|
— |
|
|
— |
|
|
— |
|
|
— |
|
|
— |
|
|
— |
|
|
— |
|
|
— |
|
|
3,735 |
|
|
— |
|
Dudley R. Cottingham |
|
— |
|
|
— |
|
|
— |
|
|
— |
|
|
— |
|
|
— |
|
|
— |
|
|
— |
|
|
3,735 |
|
|
— |
|
David M. Nurek |
|
— |
|
|
— |
|
|
— |
|
|
— |
|
|
— |
|
|
— |
|
|
— |
|
|
— |
|
|
3,735 |
|
|
— |
|
Grace Tang |
|
— |
|
|
— |
|
|
— |
|
|
— |
|
|
— |
|
|
— |
|
|
— |
|
|
— |
|
|
3,735 |
|
|
— |
|
James Earl |
|
— |
|
|
— |
|
|
— |
|
|
— |
|
|
— |
|
|
— |
|
|
— |
|
|
— |
|
|
3,735 |
|
|
— |
|
Cynthia Hostetler |
|
— |
|
|
— |
|
|
— |
|
|
— |
|
|
— |
|
|
— |
|
|
— |
|
|
— |
|
|
3,735 |
|
|
— |
|
Jeremy Bergbaum |
|
— |
|
|
— |
|
|
— |
|
|
— |
|
|
— |
|
|
— |
|
|
— |
|
|
— |
|
|
3,735 |
|
|
— |
|
Lisa Young |
|
— |
|
|
— |
|
|
— |
|
|
— |
|
|
— |
|
|
— |
|
|
— |
|
|
— |
|
|
3,735 |
|
|
— |
|
As of December 31, 2022, an aggregate of 43,261,485 of our outstanding common shares were held by Cede & Company, which includes an aggregate of 14,524,911 of our outstanding common shares that trade under secondary, or dual, listing on the JSE. The shares held by Cede & Company, a nominee of the Depository Trust Company (“DTC”), include common shares beneficially owned by holders in the United States and by non-U.S. beneficial owners. As of December 31, 2022, based on information available to the Company, 46,397 of our outstanding common shares were held in Bermuda, our domicile and headquarter country, by 1 holder of record. We do not register the jurisdiction of all beneficial owners as this information is not always available. Specifically, the number of beneficial owners in the United States, or in many regions outside the United States, is not known to the Company and cannot be ascertained from public filings. The actual number of beneficial owners is greater than the number of shareholders of record because a large portion of our outstanding common shares are held in street name by brokers and other nominees.
We, or one of our subsidiaries, as permitted by Bermuda law, may enter into a contract in which our directors or officers are directly or indirectly interested if the director or officer discloses his interest to our board of directors at the first opportunity at a meeting of directors or in writing. In order to prevent risks of conflicts of interest or the appearance of conflicts of interest, all of our directors and employees are subject to our code of business conduct and ethics which require, among other things, that any potential transaction between us and an employee or director, their relatives and closely connected persons and certain entities in which they, their relatives or closely connected persons have an interest be reviewed by the audit and risk committee.
For further detail of our transactions with our tank container manager, Trifleet Leasing (The Netherlands) B.V., see Note 3 “Transactions with Affiliates and Container Investors” to our consolidated financial statements in Item 18, “Financial Statements” in this Annual Report on Form 20-F.
61
Loans to Executive Officers
Currently, there are no loans outstanding to our directors or executive officers, nor will we extend loans to our directors or executive officers in the future, in compliance with the requirements of Section 402 of the Sarbanes-Oxley Act of 2002 and Section 13(k) of the Securities Exchange Act of 1934, as amended.
Indemnification of Officers and Directors
We have entered into indemnification agreements with each of our directors and executive officers to give such directors and officers, as well as their immediate family members, additional contractual assurances regarding the scope of indemnification set forth in our bye-laws, and to provide additional procedural protections which may, in some cases, be broader than the specific indemnification provisions contained in our bye-laws. The indemnification agreements may require us, among other things, to indemnify such directors and officers, as well as their immediate family members, against liabilities that may arise by reason of their status or service as directors or officers and to advance expenses as a result of any proceeding against them as to which they could be indemnified.
Relationships and Agreements with Trencor Limited
Trencor Limited, a company traded on the Johannesburg Stock Exchange (the “JSE”) in South Africa, owned approximately 47.5% of our issued and outstanding common shares as of December 31, 2018. On December 11, 2019, we commenced a secondary, or dual, listing of our common shares on the JSE in Johannesburg, South Africa under the symbol “TXT”. Promptly following our dual listing, Trencor distributed approximately 24.3 million of its shares in the Company to Trencor’s own shareholders and these shares are now trading on the JSE. As of December 31, 2019, Trencor held 5.3% or 3.0 million of the Company’s common shares.
In June 2020, Trencor distributed its remaining 3.0 million of our common shares to Trencor’s own shareholders and these shares are now trading on the JSE. Following the June 2020 distribution of shares, Trencor no longer holds any shares in the Company. David M. Nurek is a member of the Company’s board of directors and the board of directors of Trencor.
In September 2020, the Company received $330 from Trencor in exchange for the early distribution of escrow funds that were held under the escrow agreement in relation to our acquisition of LAPCO in December 2019.
In 2020, Trencor paid $145 for accounting services performed by the Company’s personnel to assist Trencor with the conversion of the Company’s financial information from U.S. GAAP to IFRS. The Company did not receive any fees from Trencor for such accounting services in 2022 and 2021.
Transactions with Continental Management Ltd.
A member of our board of directors, Dudley R. Cottingham, is a consultant for Continental Management Ltd (“Continental”). Continental is a Bermuda company that provides corporate representation, administration, and management services. In 2020, the Company incurred $43 primarily for professional services rendered by Continental. There were no such professional services incurred in 2022 and 2021.
Not applicable.
62
ITEM 8. FINANCIAL INFORMATION
Financial Statements
Our audited consolidated financial statements which are comprised of our consolidated balance sheets as of December 31, 2022 and 2021 and the related consolidated statements of operations, comprehensive income, shareholders’ equity and cash flows for each of the years in the three-year period ended December 31, 2022 and the notes to those statements and the report of independent registered public accounting firm thereon, are included under Item 18, “Financial Statements” of this Annual Report on Form 20-F. Also, see Item 5, “Operating and Financial Review and Prospects” for additional financial information.
Legal Proceedings
See Item 4, “Information on the Company – Business Overview—Legal Proceedings” for information on our legal proceedings which may have, or have had in the recent past, significant effects on our financial position or profitability.
Dividend Policy
In the fourth quarter of 2021, we announced the commencement of dividends on our common shares. During 2022, our board of directors approved and declared quarterly cash dividends of $0.25 per share on our issued and outstanding common shares for a total aggregate amount of $46,235. Additionally, our board of directors approved and declared quarterly preferred cash dividends on our Series A Preferred Shares and Series B Preferred Shares. For further detail of our dividends, see Note 12 “Shareholders’ Equity” to our consolidated financial statements in Item 18, “Financial Statements” in this Annual Report on Form 20-F.
Our board of directors has adopted a dividend policy which reflects its judgment that our shareholders would be better served if we distributed to them, at the discretion of our board of directors, a part of the total shareholder return, balancing near term cash needs for potential acquisitions or other growth opportunities, rather than retaining such excess cash or using such cash for other purposes.
We are not required to pay common share dividends, and our common shareholders do not have contractual or other rights, to receive dividends. Our preferred shareholders are entitled to a cumulative quarterly preferred dividend, when declared by our board of directors. Each series of preferred shares rank senior to the common shares with respect to dividend rights. If we fail to pay preferred dividends for six or more quarterly periods (whether or not consecutive), preferred shareholders will be entitled to elect two additional directors to the board of directors and the size of the board of directors will be increased to accommodate such election. Such right to elect two directors will continue until such time as there are no accumulated and unpaid preferred dividends in arrears. The timing and amount of future dividends will be at the discretion of our board of directors and will be dependent on our future operating results and the cash requirements of our business. There are a number of factors that can affect our ability to pay dividends and there is no guarantee that we will pay dividends in any given period. See Item 3, “Key Information – Risk Factors,” for a discussion of these factors. Our board of directors may decide, in its discretion, at any time, to decrease the amount of dividends, otherwise modify or repeal the dividend policy or discontinue entirely the payment of dividends.
In addition, we will not pay dividends in the event we are not allowed to do so under Bermuda law, are in default under (or such payment would cause a default under) the revolving credit facility of TL, or if such payment would cause us to breach any of our covenants. These covenants include certain financial covenants, which would be directly affected by the payment of dividends, such as a minimum tangible net worth level (which level would decrease by the amount of any dividend paid) and a maximum ratio of consolidated funded debt to consolidated tangible net worth (which amount would decrease by the amount of any dividend paid). Please see Item 5, “Operating and Financial Review and Prospects—Liquidity and Capital Resources” for a description of these covenants. Furthermore, since we are a holding company, substantially all of the assets shown on our consolidated balance sheet are held by our subsidiaries. Accordingly, our earnings and cash flow and our ability to pay dividends are largely dependent upon the earnings and cash flows of our subsidiaries and the distribution or other payment of such earnings to us in the form of dividends.
In 2014, we began calculating our earnings and profits under U.S. federal income tax principles for purposes of determining whether distributions exceed our current and accumulated earnings and profits. We report each quarter on our website at www.textainer.com whether that quarter’s distribution exceeds our current accumulated earnings and profits. The
63
taxability of the dividends does not impact our corporate tax position. You should consult with a tax advisor to determine the proper tax treatment of these distributions.
Except as disclosed in the Annual Report on Form 20-F, no significant changes have occurred since December 31, 2022, which is the date of our audited consolidated financial statements included in this Annual Report on Form 20-F.
ITEM 9. THE OFFER AND LISTING
Trading Markets
Our common shares have been primary listed on the NYSE under the symbol “TGH” since October 10, 2007. Prior to that time, there was no public market for our common shares. Our common shares are secondary or dual listed on the JSE in Johannesburg, South Africa under the symbol “TXT” since December 2019.
In April 2021, our depositary shares, each representing a 1/1,000th interest in a share of our 7.00% Series A Fixed-to-Floating Rate Cumulative Redeemable Perpetual Preference Shares, began trading on the NYSE under the symbol “TGH PRA”. In August 2021, our depositary shares, each representing a 1/1,000th interest in a share of our 6.25% Series B Fixed Rate Cumulative Redeemable Perpetual Preference Shares, began trading on NYSE under the symbol “TGH PRB”.
Transfer Agent
The transfer agent and registrar for our common shares is Computershare Shareholder Services, Inc. and its fully owned subsidiary Computershare Trust Company, N.A., having its principal office at 250 Royall Street, Canton, MA 02021. Computershare Investor Services (PTY) LTD and Computershare (PTY) LTD provide administration services and act as the nominee registrar for the common shares traded on the JSE. The address of Computershare Investor Services (PTY) LTD and Computershare (PTY) LTD is 15 Biermann Avenue, Rosebank 2196, South Africa.
Not applicable.
See Item 9, “Offer and Listing Details – Trading Markets” above.
Not applicable.
Not applicable.
Not applicable.
ITEM 10. ADDITIONAL INFORMATION
Not applicable.
64
We are an exempted company incorporated under the laws of Bermuda. We are registered with the Registrar of Companies in Bermuda under registration number EC18896. We were incorporated on December 3, 1993 under the name Textainer Group Holdings Limited, prior to that time our business was based in Panama. Our headquarters office is located at 16 Par-La-Ville Road, Hamilton HM 08 Bermuda.
We incorporate by reference into this Annual Report on Form 20-F the description of our memorandum of association and our bye-laws contained in “Description of Share Capital” of our Registration Statement on Form F-1 filed with the SEC on September 26, 2007. Such information is a summary which does not purport to be complete and is qualified in its entirety by reference to our memorandum of association and our bye-laws, copies of which have been filed as Exhibits 3.1 and 3.2, respectively, to such Registration Statement.
We have not entered into any material contracts during the two years immediately preceding the date of this Annual Report on Form 20-F other than contracts entered into in the ordinary course of business and other than those described in Item 4, “Information on the Company—History and Development of the Company—Significant Events” or elsewhere in this Annual Report on Form 20-F.
Our common shares are secondary or dual listed on the JSE in Johannesburg, South Africa under the symbol “TXT”. South Africa’s exchange control regulations provide for restrictions on exporting capital from South Africa and transactions between South African residents (including corporations) and non-residents are subject to these exchange controls. While the South African government has, to some extent, relaxed exchange controls in recent years, it is difficult to predict whether or how it will further relax or abolish exchange control measures in the future.
The following discussion is a summary of the material Bermuda and U.S. federal income tax consequences of an investment in our common and preferred shares. This discussion is not exhaustive of all possible tax considerations. In particular, this discussion does not address the tax consequences under state, local, and other national (e.g., non-Bermuda and non-U.S.) tax laws. Accordingly, we urge you to consult your own tax advisor regarding your particular tax circumstances and the tax consequences under state, local, and other national tax laws. The following discussion is based upon laws and relevant interpretations thereof in effect as of the date hereof, all of which are subject to change, possibly with retroactive effect.
Bermuda Tax Consequences
The following is a summary of the material Bermuda tax consequences of an investment in our common and preferred shares. The following discussion is not exhaustive of all possible tax considerations. We urge you to consult your own tax advisor regarding your particular tax circumstances.
Taxation of the Companies
We and our Bermuda subsidiaries have obtained an assurance from the Bermuda Minister of Finance under the Exempted Undertakings Tax Protection Act 1966 that, if any legislation is enacted in Bermuda imposing any tax computed on profits or income, or computed on any capital asset, gain, or appreciation, or any tax in the nature of estate duty or inheritance tax, then such tax will not until March 31, 2035 be applicable to us or any of our operations, or to any of our shares, debentures, or other obligations, except insofar as such tax applies to persons ordinarily resident in Bermuda or is payable by us in respect of real property owned or leased by us in Bermuda. As an exempted company, we are required to pay an annual Bermuda government fee based on our assessable capital.
65
Taxation of Holders
Currently, there is no Bermuda income or profits tax, withholding tax, capital gains tax, capital transfer tax, estate duty or inheritance tax payable by our shareholders in respect of our common and preferred shares. The issue, transfer, or redemption of our common and preferred shares is not currently subject to stamp duty.
United States Federal Income Tax Consequences
The following is a summary of the material U.S. federal income tax consequences of an investment in our common and preferred shares. The following discussion is not exhaustive of all possible tax considerations. This summary is based upon the Code, regulations promulgated under the Code by the U.S. Treasury Department (including proposed and temporary regulations), rulings, current administrative interpretations and official pronouncements of the IRS, and judicial decisions, all as currently available and all of which are subject to differing interpretations or to change, possibly with retroactive effect. Any such change could materially and adversely affect the tax consequences described below. No assurance can be given that the IRS will not assert, or that a court will not sustain, a position contrary to any of the tax consequences described below.
This summary does not address all aspects of U.S. federal income taxation that may be important to a particular holder in light of its investment or tax circumstances or to holders subject to special tax rules, such as banks; financial institutions; insurance companies; dealers in stocks, securities, or currencies; traders in securities that elect to use a mark-to-market method of accounting for their securities holdings; tax-exempt organizations; real estate investment trusts; regulated investment companies; qualified retirement plans, individual retirement accounts, and other tax-deferred accounts; certain former citizens or long-term residents of the U.S.; persons subject to the alternative minimum tax; persons holding common and preferred shares as part of a straddle, hedge, conversion transaction, or other integrated transaction; persons who acquired common shares pursuant to the exercise of any employee share option or otherwise as compensation for services; persons actually or constructively holding 10% or more of our voting shares; and U.S. Holders (as defined below) whose functional currency is other than the U.S. dollar.
This discussion is not a comprehensive description of all of the U.S. federal tax consequences that may be relevant with respect to an investment in common and preferred shares. We urge you to consult your own tax advisor regarding your particular circumstances and the U.S. federal income and estate tax consequences to you of owning and disposing of common and preferred shares, as well as any tax consequences arising under the laws of any state, local, foreign or other tax jurisdiction and the possible effects of changes in U.S. federal or other tax laws.
This summary is directed solely to persons who hold their common and preferred shares as capital assets within the meaning of Section 1221 of the Code, which includes property held for investment. For purposes of this discussion, the term “U.S. Holder” means a beneficial owner of common and preferred shares that is any of the following:
The term “Non-U.S. Holder” means a beneficial owner of common and preferred shares that is not a U.S. Holder or an entity treated as a partnership for U.S. federal income tax purposes. As described in “—Taxation of Non-U.S. Holders” below, the tax consequences to a Non-U.S. Holder may differ substantially from the tax consequences to a U.S. Holder.
If a partnership (including for this purpose any entity treated as a partnership for U.S. federal income tax purposes) is a beneficial owner of common and preferred shares, the U.S. federal income tax consequences to a partner in the partnership will depend on the status of the partner and the activities of the partnership. A holder of common and preferred shares that is a partnership and the partners in such partnership should consult their own tax advisors regarding the U.S. federal income tax consequences of an investment in common and preferred shares.
66
Taxation of the Companies
Textainer and Non-U.S. Subsidiaries
A non-U.S. corporation deemed to be engaged in a trade or business within the U.S. is subject to U.S. federal income tax on income which is treated as effectively connected with the conduct of that trade or business. Such income tax, if imposed, is based on effectively connected income computed in a manner similar to the manner in which the income of a domestic corporation is computed, except that a foreign corporation will be entitled to deductions and credits for a taxable year only if it timely files a U.S. federal income tax return for that year. In addition, a non-U.S. corporation may be subject to the U.S. federal branch profits tax on the portion of its effectively connected earnings and profits, with certain adjustments, deemed repatriated out of the U.S. Currently, the maximum U.S. federal income tax rates are 21% for a corporation’s effectively connected income and 30% for the branch profits tax.
A portion of our income is treated as effectively connected with the conduct of a trade or business within the U.S., and such effectively connected income is subject to U.S. federal income tax. U.S. federal income tax returns have been filed declaring such effectively connected income.
The determination of whether a person is engaged in a U.S. trade or business is based on a highly factual analysis. In general, there is no clear test as to the nature and scope of activities that constitute being engaged in a U.S. trade or business, and it is unclear how a court would construe the existing authorities with respect to our activities. Accordingly, it is possible that the IRS could assert that a significantly greater portion of our income than we currently report is derived from the conduct of a U.S. trade or business and therefore, is effectively connected income that is subject to U.S. federal income tax.
In addition to U.S. federal income tax on income associated with a U.S. trade or business, we are also subject to a 30% U.S. withholding tax imposed on the gross amount of certain “fixed or determinable annual or periodic gains, profits and income” derived from sources within the U.S. (such as rents, dividends and interest on investments), to the extent such amounts are not effectively connected income. This 30% U.S. withholding tax is subject to reduction by applicable treaties. Distributions by our U.S. subsidiaries to us are expected to be subject to this 30% U.S. withholding tax.
U.S. Subsidiaries
Our U.S. subsidiaries are subject to U.S. federal income tax on their worldwide income subject to reduction by allowable foreign tax credits. Certain foreign sourced income earned by the U.S. subsidiaries may be taxed at a rate lower than 21%.
Transfer Pricing
Under U.S. federal income tax laws, transactions among taxpayers that are owned or controlled directly or indirectly by the same interests generally must be at arm’s-length terms. The IRS may distribute, apportion, or allocate gross income, deductions, credits, or allowances between or among such taxpayers if it determines that such transactions are not at arm’s-length terms and that such distribution, apportionment, or allocation is necessary in order to clearly reflect the income of any of such taxpayers. Additionally, if we have not met the requirements of the new CBC Regulations (effective for our taxable years beginning on or after June 30, 2016), we may become subject to penalties and the IRS may pursue a further investigation or audit of our operations, which may result in an adjustment to our transfer pricing policies as described in the immediately preceding sentence. In such a situation, we may incur increased tax liability, possibly materially, thereby reducing our profitability and cash flows.
Taxation of U.S. Holders
The discussion in “—Distributions on Common and Preferred Shares” and “—Dispositions of Common and Preferred Shares” below assumes that we will not be treated as a passive foreign investment company (“PFIC”) for U.S. federal income tax purposes. For a discussion of the rules that apply if we are treated as a PFIC, see “—Passive Foreign Investment Company” below.
67
Distributions on Common and Preferred Shares
General. Subject to the discussion in “—Passive Foreign Investment Company” below, if you actually or constructively receive a distribution on shares, you must include the distribution in gross income as a taxable dividend on the date of your receipt of the distribution, but only to the extent of our current or accumulated earnings and profits, as calculated under U.S. federal income tax principles. Such amount must be included without reduction for any foreign taxes withheld. Dividends paid by us will not be eligible for the dividends received deduction allowed to corporations with respect to dividends received from certain domestic corporations. Dividends paid by us may or may not be eligible for preferential rates applicable to qualified dividend income, as described below. In addition, certain non-corporate U.S. Holders may be subject to an additional 3.8% Medicare tax on dividend income whether or not it is “qualified dividend income.” See “—Medicare Tax” below.
To the extent a distribution exceeds our current and accumulated earnings and profits, it will be treated first as a non-taxable return of capital to the extent of your adjusted tax basis in the shares, and thereafter as capital gain. Preferential tax rates for long-term capital gain may be applicable to non-corporate U.S. Holders. In addition, certain non-corporate U.S. Holders may be subject to an additional 3.8% Medicare tax on capital gain. See “—Medicare Tax” below.
Qualified Dividend Income. With respect to non-corporate U.S. Holders (i.e., individuals, trusts, and estates), the maximum individual U.S. federal income tax rate applicable to “qualified dividend income” (“QDI”) generally is 20%. Among other requirements, dividends will be treated as QDI if either (i) our shares are readily tradable on an established securities market in the U.S., or (ii) we are eligible for the benefits of a comprehensive income tax treaty with the U.S. which includes an information exchange program and which is determined to be satisfactory by the Secretary of the U.S. Treasury. The income tax treaty between the U.S. and Bermuda (the jurisdiction of our incorporation) does not qualify for these purposes. However, subject to the discussion below, under “—Passive Foreign Investment Company—Mark-to-Market Election,” we expect that under current administrative guidance, our shares are “readily tradable” on an established securities market as a result of being listed on the NYSE.
In addition, for dividends to be treated as QDI, we must not be a PFIC (as discussed below) for either the taxable year in which the dividend was paid or the preceding taxable year. We do not believe that we were a PFIC for our prior taxable year and we intend to conduct our business so that we should not be treated as a PFIC for our current taxable year or any future taxable year. However, because the PFIC determination is highly fact intensive and made at the end of each taxable year, it is possible that we may be a PFIC for the current or any future taxable year. Please see the discussion under “—Passive Foreign Investment Company” below. Additionally, in order to qualify for QDI treatment, you generally must have held the shares for more than 60 days during the 121-day period beginning 60 days prior to the ex-dividend date. However, your holding period will be reduced for any period during which the risk of loss is diminished.
Since the QDI rules are complex, you should consult your own tax advisor regarding the availability of the preferential tax rates for dividends paid on shares.
In-Kind Distributions. Generally, distributions to you of new shares or rights to subscribe for new shares that are received as part of a pro rata distribution to all of our shareholders will not be subject to U.S. federal income tax. The adjusted tax basis of the new shares or rights so received will be determined by allocating your adjusted tax basis in the old shares between the old shares and the new shares or rights received, based on their relative fair market values on the date of distribution. However, in the case of a distribution of rights to subscribe for shares, the adjusted tax basis of the rights will be zero if the fair market value of the rights is less than 15% of the fair market value of the old shares on the date of distribution and you do not make an election to determine the adjusted tax basis of the rights by allocation as described above. Your holding period for the new shares or rights should include the holding period for the old shares on which the distribution was made.
Foreign Tax Credits. Subject to certain conditions and limitations, any foreign taxes paid on or withheld from distributions from us and not refundable to you may be credited against your U.S. federal income tax liability or, alternatively, may be deducted from your taxable income. This election is made on a year-by-year basis and applies to all foreign taxes paid by you or withheld from you that year.
Distributions will constitute foreign source income for foreign tax credit limitation purposes. The foreign tax credit limitation is calculated separately with respect to two specific classes of income. For this purpose, distributions characterized
68
as dividends distributed by us are expected to constitute “passive category income” or, in the case of certain U.S. Holders, “general category income.” Special limitations may apply if a dividend is treated as QDI (as defined above).
Since the rules governing foreign tax credits are complex, you should consult your own tax advisor regarding the availability of foreign tax credits in your particular circumstances.
Dispositions of Common and Preferred Shares
Subject to the discussion in “—Passive Foreign Investment Company” below, you will recognize taxable gain or loss on the sale or other taxable disposition of shares equal to the difference between the U.S. dollar value of (i) the amount realized on the disposition (i.e., the amount of cash plus the fair market value of any property received), and (ii) your adjusted tax basis in the shares. Such gain or loss will be capital gain or loss.
If you have held the shares for more than one year at the time of disposition, such capital gain or loss will be long-term capital gain or loss. Preferential tax rates for long-term capital gain apply for non-corporate U.S. Holders. The maximum rate for individuals on net long-term capital gain is currently 20%. In the case of a corporation, capital gains are taxed at the same rate as ordinary income, the maximum rate for which is currently 35%. If you have held the shares for one year or less, such capital gain or loss will be short-term capital gain or loss taxable as ordinary income. The deductibility of capital losses is subject to limitations. In addition, certain U.S. persons, including individuals, estates and trusts, will be subject to an additional 3.8% Medicare tax on capital gain income. See “—Medicare Tax” below.
Any gain or loss recognized on the disposition of shares is not expected to give rise to foreign source income for U.S. foreign tax credit purposes.
You should consult your own tax advisor regarding the U.S. federal income tax consequences if you receive currency other than U.S. dollars upon the disposition of shares.
Passive Foreign Investment Company
We will be a PFIC under Section 1297 of the Code if, for a taxable year, either (a) 75% or more of our gross income for such taxable year is passive income (the “income test”) or (b) 50% or more of the average percentage, generally determined by fair market value, of our assets during such taxable year either produce passive income or are held for the production of passive income (the “asset test”). “Passive income” includes, for example, dividends, interest, certain rents and royalties, certain gains from the sale of stock and securities, and certain gains from commodities transactions. However, rents meeting certain requirements are treated as derived from the conduct of an active trade or business and are not treated as passive income.
Certain “look through” rules apply for purposes of the income and asset tests described above. If we own, directly or indirectly, 25% or more of the total value of the outstanding shares of another corporation, we will be treated as if we (a) held directly a proportionate share of the other corporation’s assets, and (b) received directly a proportionate share of the other corporation’s income. In addition, passive income does not include any interest, dividends, rents, or royalties that are received or accrued by us from a “related person” (as defined in Section 954(d)(3) of the Code), to the extent such items are properly allocable to income of such related person that is not passive income.
Under the income and asset tests, whether or not we are a PFIC will be determined annually based upon the composition of our income and the composition and valuation of our assets, all of which are subject to change. In analyzing whether we should be treated as a PFIC, we are relying on the amount and character of our projected revenues and the amount and character of our projected capital expenditures, the valuation of our assets, and our election to treat certain of our subsidiaries as disregarded entities for U.S. federal income tax purposes. If the amount and character of our actual revenues and capital expenditures do not match our projections, we may be a PFIC. In these calculations, we have valued our intangible assets based on our market capitalization, determined using the market price of our shares. Such market price may fluctuate. If our market capitalization is less than anticipated or subsequently declines, this will decrease the value of our intangible assets and we may be a PFIC. Furthermore, we have made a number of assumptions regarding the value of our intangible assets. We believe our valuation approach is reasonable. However, it is possible that the IRS could challenge the valuation of our intangible assets, which may result in our being a PFIC.
69
We do not believe that we were a PFIC for our prior taxable year and we intend to conduct our business so that we should not be treated as a PFIC for our current taxable year or any future taxable year. However, because the PFIC determination is highly fact intensive and made at the end of each taxable year, it is possible that we may be a PFIC for the current or any future taxable year or that the IRS may challenge our determination concerning our PFIC status.
Default PFIC Rules under Section 1291 of the Code. If we are a PFIC, the U.S. federal income tax consequences to a U.S. Holder of an investment in shares will depend on whether such U.S. Holder is permitted to make and makes (i) an election to treat us as a qualified electing fund (“QEF”) under Section 1295 of the Code (a “QEF Election”) or (ii) a mark-to-market election under Section 1296 of the Code (a “Mark-to-Market Election”). A U.S. Holder owning shares while we were or are a PFIC that has not made either a QEF Election or a Mark-to-Market Election will be referred to in this summary as a “Non-Electing U.S. Holder.”
If you are a Non-Electing U.S. Holder, you will be subject to the default tax rules of Section 1291 of the Code with respect to:
Under these default tax rules:
In addition, notwithstanding any election you may make, dividends that you receive from us will not be eligible for the preferential tax rates applicable to QDI (as discussed above in “—Distributions on Common and Preferred Shares”) if we are a PFIC either in the taxable year of the distribution or the preceding taxable year, but will instead be taxable at rates applicable to ordinary income.
Special rules for Non-Electing U.S. Holders will apply to determine U.S. foreign tax credits with respect to foreign taxes imposed on distributions on shares.
If we are a PFIC for any taxable year during which you hold shares, we will continue to be treated as a PFIC with respect to you for all succeeding years during which you hold shares, regardless of whether we actually continue to be a PFIC.
QEF Election. We currently do not intend to prepare or provide you with certain tax information that would permit you to make a QEF Election to avoid the adverse tax consequences associated with owning PFIC stock.
Mark-to-Market Election. U.S. Holders may make a Mark-to-Market Election, but only if the shares are marketable stock. The shares will be “marketable stock” as long as they remain listed on the NYSE and are regularly traded. Shares are “regularly traded” for any calendar year during which it is traded (other than in de minimis quantities) on at least fifteen days during each calendar quarter. There can be no assurances, however, that our shares will be treated, or continue to be treated, as regularly traded.
70
If you make a Mark-to-Market Election, you generally will not be subject to the default rules of Section 1291 of the Code discussed above. Rather, you will be required to recognize ordinary income for any increase in the fair market value of the shares for each taxable year that we are a PFIC. You will also be allowed to deduct as an ordinary loss any decrease in the fair market value to the extent of net marked-to-market gain previously included in prior years. Your adjusted tax basis in the shares will be adjusted to reflect the amount included or deducted.
The Mark-to-Market Election will be effective for the taxable year for which the election is made and all subsequent taxable years, unless the shares cease to be marketable stock or the IRS consents to the revocation of the election. You should consult your own tax advisor regarding the availability of, and procedure for making, a Mark-to-Market Election.
Since the PFIC rules are complex, you should consult your own tax advisor regarding them and how they may affect the U.S. federal income tax consequences of an investment in shares.
Medicare Tax
Certain U.S. persons, including individuals, estates and trusts, may be required to pay an additional 3.8% on, among other things, dividends and capital gains from the sale or disposition of Shares. For individuals, the additional Medicare tax applies to the lesser of (i) “net investment income” or (ii) the excess of “modified adjusted gross income” over $200,000 ($250,000 if married and filing jointly or $125,000 if married and filing separately). “Net investment income” generally equals the taxpayer’s gross investment income reduced by the deductions that are allocable to such income. U.S. Holders likely will not be able to credit foreign taxes against the 3.8% Medicare tax. You should consult your tax advisors regarding the implications of the additional Medicare tax resulting from your ownership and disposition of our shares.
Information Reporting and Backup Withholding
Information reporting requirements will apply to distributions on shares or proceeds from the disposition of shares paid within the U.S. (and, in certain cases, outside the U.S.) to a U.S. Holder unless such U.S. Holder is an exempt recipient, such as a corporation. Furthermore, backup withholding (currently at 28%) may apply to such amounts unless such U.S. Holder (i) is an exempt recipient that, if required, establishes its right to an exemption, or (ii) provides its taxpayer identification number, certifies that it is not currently subject to backup withholding, and complies with other applicable requirements. A U.S. Holder may avoid backup withholding if it furnishes a properly completed IRS Form W-9 and is able to make the required certifications.
Backup withholding is not an additional tax. Rather, amounts withheld under the backup withholding rules may be credited against your U.S. federal income tax liability. Furthermore, you may obtain a refund of any excess amounts withheld by filing an appropriate claim for refund with the IRS and furnishing any required information in a timely manner.
Information Reporting Regarding PFICs and Specified Foreign Financial Assets
If we are a PFIC, all U.S. Holders may be required to file annual tax returns (including on Form 8621) containing such information as the U.S. Treasury requires.
U.S. Holders who are individuals will be subject to reporting obligations with respect to their shares if they do not hold their shares in an account maintained by a financial institution and the aggregate value of their shares and certain other “specified foreign financial assets” exceeds $50,000. Significant penalties can apply if a U.S. Holder is required to disclose its shares under these rules and fails to do so.
In the event a U.S. Holder does not file the information reports described above relating to ownership of a PFIC or disclosure of specified foreign financial assets, the statute of limitations on the assessment and collection of U.S. federal income taxes of such U.S. holder for the related tax year will not close before such report is filed.
71
If you are a U.S. Holder, you are urged to consult with your own tax advisor regarding the application of the PFIC and specified foreign financial assets information reporting requirements and related statute of limitations tolling provisions with respect to our shares.
Taxation of Non-U.S. Holders
Distributions on Common and Preferred Shares
Subject to the discussion in “—Information Reporting and Backup Withholding” below, as a Non-U.S. Holder, you generally will not be subject to U.S. federal income tax, including withholding tax, on distributions received on shares, unless the distributions are effectively connected with a trade or business that you conduct in the U.S. and (if an applicable income tax treaty so requires) attributable to a permanent establishment that you maintain in the U.S.
If distributions are effectively connected with a U.S. trade or business and (if applicable) attributable to a U.S. permanent establishment, you will be subject to tax on such distributions in the same manner as a U.S. Holder, as described in “Taxation of U.S. Holders – Distributions on Common and Preferred Shares” above. In addition, any such distributions received by a corporate Non-U.S. Holder may also, under certain circumstances, be subject to an additional “branch profits tax” at a 30% rate or such lower rate as may be specified by an applicable income tax treaty.
Dispositions of Common and Preferred Shares
Subject to the discussion in “—Information Reporting and Backup Withholding” below, as a Non-U.S. Holder, you generally will not be subject to U.S. federal income tax, including withholding tax, on any gain recognized on a sale or other taxable disposition of shares, unless (i) the gain is effectively connected with a trade or business that you conduct in the U.S. and (if an applicable income tax treaty so requires) attributable to a permanent establishment that you maintain in the U.S., or (ii) you are an individual and are present in the U.S. for at least 183 days in the taxable year of the disposition, and certain other conditions are met.
If you meet the test in clause (i) above, you generally will be subject to tax on any gain that is effectively connected with your conduct of a trade or business in the U.S. in the same manner as a U.S. Holder, as described in “Taxation of U.S. Holders – Dispositions of Common and Preferred Shares” above. Effectively connected gain realized by a corporate Non-U.S. Holder may also, under certain circumstances, be subject to an additional “branch profits tax” at a 30% rate or such lower rate as may be specified by an applicable income tax treaty.
If you meet the test in clause (ii) above, you generally will be subject to tax at a 30% rate on the amount by which your U.S. source capital gain exceeds your U.S. source capital loss during the taxable year.
Information Reporting and Backup Withholding
Payments to Non-U.S. Holders of distributions on, or proceeds from the disposition of, shares are generally exempt from information reporting and backup withholding. However, a Non-U.S. Holder may be required to establish that exemption by providing certification of non-U.S. status on an appropriate IRS Form W-8.
Backup withholding is not an additional tax. Rather, amounts withheld under the backup withholding rules may be credited against your U.S. federal income tax liability. Furthermore, you may obtain a refund of any excess amounts withheld by filing an appropriate claim for refund with the IRS and furnishing any required information in a timely manner.
Not applicable.
72
Not applicable.
Whenever a reference is made in this Annual Report on Form 20-F to any contract, agreement or other document, the reference may not be complete, and you should refer to the copy of that contract, agreement or other document filed as an exhibit to one of our previous SEC filings. The SEC maintains an internet website that contains reports, proxy and other information regarding issuers that file electronically with the SEC. You can read our SEC filings, including this annual report, at the SEC’s website at http://www.sec.gov. You may also read and copy any document we file with the SEC at its public reference facilities at 100 F Street N.E., Washington, D.C. 20549. You may also obtain copies of these documents at prescribed rates by writing to the Public Reference Section of the SEC at 100 F Street N.E., Washington, D.C. 20549. Please call the SEC at 1-800-SEC-0330 for further information on the operation of the public reference facilities. Copies of reports and other information may also be inspected in the offices of the NYSE, 20 Broad Street, New York, New York 10005.
Not applicable.
ITEM 11. QUANTITATIVE AND QUALITATIVE DISCLOSURES ABOUT MARKET RISK
Quantitative and Qualitative Disclosures About Market Risk
Market risk represents the risk of changes in value of a financial instrument, derivative or non-derivative, caused by fluctuations in foreign exchange rates and interest rates. Changes in these factors could cause fluctuations in our results of operations and cash flows. We are exposed to the market risks described below.
Foreign Exchange Rate Risk. Although we have significant foreign-based operations, the U.S. dollar is our primary operating currency. Thus, substantially all of our revenue and the majority of our expenses in 2022, 2021 and 2020 was denominated in U.S. dollars. We do not hedge these container expenses as there are no significant payments made in any one foreign currency. Foreign exchange fluctuations did not materially impact our financial results in those periods.
Interest Rate Risk. We have entered into various interest rate swap agreements to mitigate our exposure associated with our variable rate debt. The swap agreements involve payments by us to counterparties at fixed rates in return for receipts based upon variable rates indexed to SOFR. We also utilized forward starting interest rate swap agreements to reduce the impact of interest rate changes on anticipated future debt issuances. We may also utilize interest rate cap agreements, which place a ceiling on the Company’s exposure to rising interest rates, to manage interest rate risk exposure. All of our derivative agreements are with highly rated financial institutions. Credit exposures are measured based on the market value of outstanding derivative instruments.
As of December 31, 2022, all of our interest rate swap agreements are designated as cash flow hedges for accounting purposes, and any unrealized gains or losses related to the changes in fair value are recognized in accumulated comprehensive income and re-classed to interest expense as they are realized. Our valuation reflects our credit standing and the credit standing of the counterparties to the interest rate swaps. The valuation technique we utilized to calculate the fair value of the interest rate swaps was the income approach. This approach represents the present value of future cash flows based upon current market expectations.
The notional amount of the interest rate swap agreements was $2,071,125 as of December 31, 2022, with expiration dates between February 2023 and November 2032, and fixed pay rates between -0.02% and 3.84%. We also have a forward starting interest rate swap agreement in a notional amount of $100,000 with an effective date of February 28, 2024, a fixed pay rate at 1.96% and an expiration date of February 28, 2034. The net fair value of all these agreements was an asset of $149,244 as of December 31, 2022.
73
The notional amount of the interest rate cap agreement was $100,000 as of December 31, 2022, with a fixed cap rate at 6.33%, and expiration date of March 31, 2023.
As of December 31, 2022, approximately 90% of our debt is either fixed or hedged using derivative instruments which helps mitigate the impact of changes in short-term interest rates. It is estimated that a 1% increase in interest rates on our unhedged debt would result in a net increase of $5,362 in interest expense over the next twelve months.
ITEM 12. DESCRIPTION OF SECURITIES OTHER THAN EQUITY SECURITIES
Not applicable.
74
PART II
ITEM 13. DEFAULTS, DIVIDEND ARREARAGES AND DELINQUENCIES
None.
ITEM 14. MATERIAL MODIFICATIONS TO THE RIGHTS OF SECURITY HOLDERS AND USE OF PROCEEDS
None.
ITEM 15. CONTROLS AND PROCEDURES
Our management, with the participation of our Chief Executive Officer and Chief Financial Officer, evaluated the effectiveness of our “disclosure controls and procedures” (as defined in Rules 13a-15€ and 15d-15(e) under the Exchange Act) as of December 31, 2022.
The “disclosure controls and procedures” means our controls and other procedures that are designed to provide reasonable assurance that the information required to be disclosed by us in the reports that we filed or submitted to the SEC, such as this Annual Report on Form 20-F, was (1) recorded, processed, summarized and reported within the time periods specified in the SEC’s rules and forms and (2) accumulated and communicated to our management, including our Chief Executive Officer and Chief Financial Officer, to allow timely decisions regarding required disclosures. In designing and evaluating the disclosure controls and procedures, management recognizes that any controls and procedures, no matter how well designed and operated, can provide only reasonable assurance of achieving the desired control objectives, and management is required to apply its judgment in evaluating the cost-benefit relationship of possible controls and procedures. Based upon that evaluation, it was concluded that, as of such date, the disclosure controls and procedures were effective as of December 31, 2022.
Our management is responsible for establishing and maintaining adequate internal control over financial reporting. Management, including our Chief Executive Officer and Chief Financial Officer under the oversight of our Board of Directors, assessed the effectiveness of our internal control over financial reporting as of December 31, 2022. In making this assessment, management used the criteria for effective internal control over financial reporting described in “Internal Control-Integrated Framework (2013),” issued by the Committee of Sponsoring Organizations of the Treadway Commission (COSO). Based on this assessment, our management concluded that our internal control over financial reporting was effective for the year ended December 31, 2022.
All internal control systems and procedures, no matter how well designed, have inherent limitations. Therefore, even those internal control systems and procedures determined to be effective may not prevent or detect misstatements and can provide only reasonable assurance with respect to financial statement preparation and presentation. Also, projections of any evaluation of effectiveness to future periods are subject to the risk that controls may become inadequate because of changes in conditions, or that the degree of compliance with the policies or procedures may deteriorate.
Our internal control over financial reporting as of December 31, 2022 has been audited by Deloitte & Touche LLP, an independent registered public accounting firm, as stated in their report, which is included under Item 18, “Financial Statements” on page F-3 in this Annual Report on Form 20-F.
In January 2022, we implemented a new enterprise resource planning (“ERP”) system to enhance the efficiency and operational functionality of our internal administrative activities and certain financial accounting and reporting processes. The new ERP system is our system of financial records from January 1, 2022, forward. As a result of the newly implemented
75
ERP system, management had to design, implement and operate new information technology general controls and process-level controls and made changes to existing process-level controls during the year to ensure that we have adequate internal controls in place.
Other than the changes to controls arising from the implementation of the new ERP system, there were no other changes in our internal control over financial reporting as defined in Rules 13a-15(f) and 15(d)-15(f)) under the Exchange Act that occurred during the year ended December 31, 2022 that have materially affected, or are reasonably likely to materially affect, our internal control over financial reporting.
ITEM 16. [RESERVED]
ITEM 16A. AUDIT COMMITTEE FINANCIAL EXPERT
In accordance with NYSE rules, we have an audit and risk committee responsible for advising the board regarding the selection of independent auditors and evaluating our internal controls. As a foreign private issuer, we are not required to comply with NYSE requirements that our audit and risk committee has a minimum of three members and that all of our audit and risk committee members satisfy the NYSE’s requirements for independence. Our audit and risk committee has seven members, Mr. Cottingham, Mr. Earl, Ms. Tang, Ms. Hostetler, Mr. Bergbaum, Ms. Young and Mr. Shwiel. Our Board of Directors determined that all members of the Audit and Risk Committee are independent as that term is defined in Rule 10A-3 under the Exchange Act. The board affirmatively determined that Mr. Shwiel, Mr. Cottingham, Ms. Young and Ms. Tang are audit committee financial experts. Mr. Shwiel is also the Chairman of our board of directors. Our board of directors has adopted an audit committee charter effective October 9, 2007.
ITEM 16B. CODE OF ETHICS
We have adopted the Textainer Group Holdings Limited Code of Business Conduct and Ethics (the “Code of Business Conduct and Ethics”), which covers members of our board of directors and all of our employees (including our principal executive officer, principal financial officer, principal accounting officer or controller, and persons performing similar functions).
The Code of Business Conduct and Ethics addresses, among other things, the following items:
During 2022, no waivers or amendments were made to the Code of Business Conduct and Ethics for any of our directors or executive officers. We have posted the text of the Code of Business Conduct and Ethics on our website at www.textainer.com.
76
ITEM 16C. PRINCIPAL ACCOUNTANT FEES AND SERVICES
Our audit and risk committee pre-approves all services provided by our principal accountants, Deloitte & Touche LLP. All of the services and fees described below were reviewed and pre-approved by our audit and risk committee. Our audit and risk committee has delegated to the Chairman of the audit and risk committee certain limited authority to grant pre-approvals. These decisions to pre-approve a service must be presented to the full audit and risk committee at its next scheduled meeting.
The following is a summary of the fees billed to us by our principal accountants, Deloitte & Touche LLP and KPMG LLP for professional services rendered for 2022 and 2021, respectively:
Fee Category |
|
2022 Fees |
|
|
2021 Fees (1) |
|
||
Audit Fees |
|
$ |
1,780 |
|
|
$ |
1,979 |
|
Audit-Related Fees |
|
|
— |
|
|
|
555 |
|
Tax Fees |
|
|
— |
|
|
|
40 |
|
Total Fees |
|
$ |
1,780 |
|
|
$ |
2,574 |
|
(1) Includes fees that were paid to KPMG LLP in 2022 in respect of 2021.
Audit Fees—Consists of fees billed for professional services rendered for the audit of our financial statements and services that are normally provided by our principal accountants in connection with statutory and regulatory filings or engagements.
Audit-Related Fees—Consists of fees for assurance and related services, including services associated with compliance reporting on our certain specific lender requirements and preferred shares offerings, other than those described above as Audit Fees.
Tax Fees—Consists of fees billed for professional services for tax compliance, tax advice and tax planning.
ITEM 16D. EXEMPTIONS FROM THE LISTING STANDARDS FOR AUDIT COMMITTEES
The disclosure required by Rule 10A-3(b)(1)(iv)(D) under the Exchange Act regarding exemption from the listing standards for audit committee is not applicable to the Company’s audit and risk committee.
ITEM 16E. PURCHASES OF EQUITY SECURITIES BY THE ISSUER AND AFFILIATED PURCHASERS
In 2019, our board of directors approved a share repurchase program of up to $25,000 of the Company’s common shares, in 2020 the board of directors approved an increase of another $75,000 to this program, in 2021 the program was further increased by $100,000, and in 2022 the program was further increased by $250,000. Under the program, the Company may purchase its common shares from time to time in the open market, in privately negotiated transactions or such other manner as will comply with applicable laws and regulations. The authorization did not obligate us to acquire a specific number of shares during any period, but it may be modified, suspended or terminated at any time at the discretion of the Company’s board of directors.
77
The table below is a summary of the shares repurchased by us and the average price paid per share (excluding commissions) during the year ended December 31, 2022. All shares were repurchased in the open market pursuant to the share repurchase program.
|
|
Issuer Purchases of Common Shares |
|
|||||||||||||
Period |
|
Total number of shares purchased (4) |
|
|
Average price paid per shares |
|
|
Total number of |
|
|
Approximate dollar |
|
||||
January 1, 2022 through January 31, 2022 |
|
|
313,412 |
|
|
$ |
37.46 |
|
|
|
313,412 |
|
|
$ |
39,394 |
|
February 1, 2022 through February 28, 2022 |
|
|
308,657 |
|
|
$ |
38.41 |
|
|
|
308,657 |
|
|
$ |
27,539 |
|
March 1, 2022 through March 31, 2022 |
|
|
335,620 |
|
|
$ |
37.88 |
|
|
|
335,620 |
|
|
$ |
14,825 |
|
April 1, 2022 through April 30, 2022 (1) |
|
|
295,888 |
|
|
$ |
34.70 |
|
|
|
295,888 |
|
|
$ |
54,558 |
|
May 1, 2022 through May 31, 2022 |
|
|
421,144 |
|
|
$ |
32.27 |
|
|
|
421,144 |
|
|
$ |
40,967 |
|
June 1, 2022 through June 30, 2022 |
|
|
700,787 |
|
|
$ |
30.30 |
|
|
|
700,787 |
|
|
$ |
19,730 |
|
July 1, 2022 through July 31, 2022 (2) |
|
|
404,739 |
|
|
$ |
28.44 |
|
|
|
404,739 |
|
|
$ |
108,220 |
|
August 1, 2022 through August 31, 2022 |
|
|
521,235 |
|
|
$ |
33.02 |
|
|
|
521,235 |
|
|
$ |
91,010 |
|
September 1, 2022 through September 30, 2022 |
|
|
792,023 |
|
|
$ |
29.46 |
|
|
|
792,023 |
|
|
$ |
67,681 |
|
October 1, 2022 through October 31, 2022 (3) |
|
|
883,622 |
|
|
$ |
28.56 |
|
|
|
883,622 |
|
|
$ |
142,447 |
|
November 1, 2022 through November 30, 2022 |
|
|
398,510 |
|
|
$ |
30.24 |
|
|
|
398,510 |
|
|
$ |
130,397 |
|
December 1, 2022 through December 31, 2022 |
|
|
261,135 |
|
|
$ |
30.31 |
|
|
|
261,135 |
|
|
$ |
122,481 |
|
Total |
|
|
5,636,772 |
|
|
$ |
31.69 |
|
|
|
5,636,772 |
|
|
|
|
|
78
ITEM 16F. CHANGE IN REGISTRANT’S CERTIFYING ACCOUNTANT
We conducted a comprehensive, competitive process to determine our independent registered public accounting firm for the year ending December 31, 2022. Pursuant to the results of this process, on February 17, 2022, our Board of Directors approved the decision to change auditors and replace KPMG upon completion of its remaining engagement responsibilities. This change became effective upon issuance by KPMG of its reports on our consolidated financial statements as of and for the year ended December 31, 2021 and the effectiveness of internal control over financial reporting as of December 31, 2021 included in the filing of our 2021 annual report on Form 20-F dated March 17, 2022. The Board of Directors also approved the engagement of Deloitte & Touche LLP (“Deloitte”) as our independent registered public accounting firm for the year ended December 31, 2022 which occurred after the replacement of KPMG was effective.
KPMG’s audit reports on our consolidated financial statements as of and for the years ended December 31, 2021 and 2020 did not contain an adverse opinion or a disclaimer of opinion and were not qualified or modified as to uncertainty, audit scope or accounting principles except as follows:
KPMG’s report on the consolidated financial statements of Textainer Group Holdings Limited and subsidiaries for the year ended December 31, 2020, contained a separate paragraph stating, “As discussed in Note 1 to the consolidated financial statements, the Company has changed its method of accounting for leases as of January 1, 2019 due to the adoption of Accounting Standards Update No. 2016-02, Leases (Topic 842)”.
During the years ended December 31, 2021 and 2020 and the subsequent interim period through March 17, 2022, there were (i) no disagreements between us and KPMG on any matter of accounting principles or practices, financial statement disclosure, or auditing scope or procedure, any of which, if not resolved to KPMG’s satisfaction, would have caused KPMG to make reference thereto in their reports, and (ii) no reportable events pursuant to Item 16F(a)(1)(v) of the instructions to Form 20-F.
During the years ended December 31, 2021 and 2020 and the subsequent interim period through March 17, 2022, neither we nor anyone on our behalf has consulted with Deloitte regarding (i) the application of accounting principles to a specific transaction, either completed or proposed, or the type of audit opinion that might be rendered on our consolidated financial statements, and neither a written report nor oral advice was provided to us that Deloitte concluded was an important factor considered by us in reaching a decision as to any accounting, auditing, or financial reporting issue, (ii) any matter that was the subject of a disagreement pursuant to Item 16F(a)(1)(iv) of the instructions to Form 20-F, or (iii) any reportable event pursuant to Item 16F(a)(1)(v) of the instructions to Form 20-F.
The Company provided KPMG with a copy of this disclosure and requested that KPMG furnish a letter addressed to the Securities and Exchange Commission stating whether or not it agrees with the statements made herein. A copy of KPMG’s letter, dated March 17, 2022, was furnished as Exhibit 99.1 to the Form 20-F dated March 17, 2022.
ITEM 16G. CORPORATE GOVERNANCE
Our corporate governance practices are in compliance with, and are not prohibited by, the laws of Bermuda. Therefore, we are exempt from many of the NYSE corporate governance practices, other than the establishment of a formal audit committee satisfying the requirements of Rule 10A-3 under the Exchange Act and notification of non-compliance with NYSE listing requirements pursuant to Rule 10A-3 promulgated under the Exchange Act. The practices that we follow in lieu of the NYSE’s corporate governance rules are described below.
79
80
ITEM 16H. MINE SAFETY DISCLOSURE
None.
ITEM 16I. DISCLOSURE REGARDING FOREIGN JURISDICTION THAT PREVENT INSPECTIONS
None.
81
PART III
ITEM 17. FINANCIAL STATEMENTS
See Item 18 “Financial Statements” below for information regarding our financial statements and additional information.
ITEM 18. FINANCIAL STATEMENTS
Reference is made to pages F-1 through F-47 and is incorporated herein by reference.
INDEX TO FINANCIAL STATEMENTS
|
|
Page |
Audited Consolidated Financial Statements |
|
|
|
F-1 |
|
Consolidated Balance Sheets as of December 31, 2022 and 2021 |
|
F-5 |
Consolidated Statements of Operations for the Years Ended December 31, 2022, 2021 and 2020 |
|
F-6 |
Consolidated Statements of Comprehensive Income for the Years Ended December 31, 2022, 2021 and 2020 |
|
F-7 |
Consolidated Statements of Shareholders’ Equity for the Years Ended December 31, 2022, 2021 and 2020 |
|
F-8 |
Consolidated Statements of Cash Flows for the Years Ended December 31, 2022, 2021 and 2020 |
|
F-10 |
|
F-11 |
|
Financial Statement Schedules |
|
|
|
F-46 |
|
|
F-49 |
ITEM 19. EXHIBITS
The exhibits filed as part of this Annual Report on Form 20-F are listed in the Exhibit Index.
82
REPORT OF INDEPENDENT REGISTERED PUBLIC ACCOUNTING FIRM
To the shareholders and the Board of Directors of Textainer Group Holdings Limited
Opinion on the Financial Statements
We have audited the accompanying consolidated balance sheet of Textainer Group Holdings Limited and subsidiaries (the “Company”) as of December 31, 2022, the related consolidated statements of operations, comprehensive income, shareholders’ equity, and cash flows for the year then ended, and the related notes and the schedules listed in the Index at Item 18 (collectively referred to as the “financial statements”). In our opinion, the financial statements present fairly, in all material respects, the financial position of the Company as of December 31, 2022, and the results of its operations and its cash flows for the year then ended, in conformity with accounting principles generally accepted in the United States of America.
We have also audited, in accordance with the standards of the Public Company Accounting Oversight Board (United States) (PCAOB), the Company's internal control over financial reporting as of December 31, 2022, based on criteria established in Internal Control — Integrated Framework (2013) issued by the Committee of Sponsoring Organizations of the Treadway Commission and our report dated February 14, 2023, expressed an unqualified opinion on the Company's internal control over financial reporting.
Basis for Opinion
These financial statements are the responsibility of the Company’s management. Our responsibility is to express an opinion on the Company's financial statements based on our audit. We are a public accounting firm registered with the PCAOB and are required to be independent with respect to the Company in accordance with the U.S. federal securities laws and the applicable rules and regulations of the Securities and Exchange Commission and the PCAOB.
We conducted our audit in accordance with the standards of the PCAOB. Those standards require that we plan and perform the audit to obtain reasonable assurance about whether the financial statements are free of material misstatement, whether due to error or fraud. Our audit included performing procedures to assess the risks of material misstatement of the financial statements, whether due to error or fraud, and performing procedures that respond to those risks. Such procedures included examining, on a test basis, evidence regarding the amounts and disclosures in the financial statements. Our audit also included evaluating the accounting principles used and significant estimates made by management, as well as evaluating the overall presentation of the financial statements. We believe that our audit provides a reasonable basis for our opinion.
Critical Audit Matter
The critical audit matter communicated below is a matter arising from the current-period audit of the financial statements that was communicated or required to be communicated to the audit committee and that (1) relates to accounts or disclosures that are material to the financial statements and (2) involved our especially challenging, subjective, or complex judgments. The communication of critical audit matters does not alter in any way our opinion on the financial statements, taken as a whole, and we are not, by communicating the critical audit matter below, providing a separate opinion on the critical audit matter or on the accounts or disclosures to which it relates.
Containers, Net of Accumulated Depreciation – Estimated Residual Values – Refer to Note 1 to the financial statements
Critical Audit Matter Description
As of December 31, 2022,containers, net of accumulated depreciation, was $4,365 million. Containers are recorded at cost and depreciated using the straight-line method over their estimated useful lives to an estimated residual value.
The estimated residual value represents the amount the Company estimates that it will recover upon the sale or other disposition of the containers at the end of their useful lives as shipping containers. The estimates of residual value are based on a number of factors including average selling prices. The Company reviews the estimated residual values on a regular basis to determine whether a change in their estimates of residual values is warranted. To perform the assessment of estimated residual value, the Company analyzed sales data over a period of time that it believes is reflective of the cyclical nature of the global economic environment and the industry and assessed whether the average selling prices fall within a reasonable range compared to current residual values.
We identified the estimated residual values of containers, net of accumulated depreciation as a critical audit matter because of the significant estimates and assumptions management makes in evaluating whether current estimated residual values are reasonable. This
F-1
required a high degree of auditor judgment when performing audit procedures to evaluate the reasonableness of management’s estimated residual values of containers.
How the Critical Audit Matter Was Addressed in the Audit
Our audit procedures related to the estimated residual values of containers included the following, among others:
/s/ Deloitte & Touche LLP
San Francisco, California
February 14, 2023
We have served as the Company's auditor since 2022.
F-2
REPORT OF INDEPENDENT REGISTERED PUBLIC ACCOUNTING FIRM
To the shareholders and the Board of Directors of Textainer Group Holdings Limited
Opinion on Internal Control over Financial Reporting
We have audited the internal control over financial reporting of Textainer Group Holdings Limited and subsidiaries (the “Company”) as of December 31, 2022, based on criteria established in Internal Control — Integrated Framework (2013) issued by the Committee of Sponsoring Organizations of the Treadway Commission (COSO). In our opinion, the Company maintained, in all material respects, effective internal control over financial reporting as of December 31, 2022, based on criteria established in Internal Control — Integrated Framework (2013) issued by COSO.
We have also audited, in accordance with the standards of the Public Company Accounting Oversight Board (United States) (PCAOB), the consolidated financial statements as of and for the year ended December 31, 2022, of the Company and our report dated February 14, 2023, expressed an unqualified opinion on those financial statements.
Basis for Opinion
The Company’s management is responsible for maintaining effective internal control over financial reporting and for its assessment of the effectiveness of internal control over financial reporting, included in the accompanying Management’s Annual Report on Internal Control Over Financial Reporting. Our responsibility is to express an opinion on the Company’s internal control over financial reporting based on our audit. We are a public accounting firm registered with the PCAOB and are required to be independent with respect to the Company in accordance with the U.S. federal securities laws and the applicable rules and regulations of the Securities and Exchange Commission and the PCAOB.
We conducted our audit in accordance with the standards of the PCAOB. Those standards require that we plan and perform the audit to obtain reasonable assurance about whether effective internal control over financial reporting was maintained in all material respects. Our audit included obtaining an understanding of internal control over financial reporting, assessing the risk that a material weakness exists, testing and evaluating the design and operating effectiveness of internal control based on the assessed risk, and performing such other procedures as we considered necessary in the circumstances. We believe that our audit provides a reasonable basis for our opinion.
Definition and Limitations of Internal Control over Financial Reporting
A company’s internal control over financial reporting is a process designed to provide reasonable assurance regarding the reliability of financial reporting and the preparation of financial statements for external purposes in accordance with generally accepted accounting principles. A company’s internal control over financial reporting includes those policies and procedures that (1) pertain to the maintenance of records that, in reasonable detail, accurately and fairly reflect the transactions and dispositions of the assets of the company; (2) provide reasonable assurance that transactions are recorded as necessary to permit preparation of financial statements in accordance with generally accepted accounting principles, and that receipts and expenditures of the company are being made only in accordance with authorizations of management and directors of the company; and (3) provide reasonable assurance regarding prevention or timely detection of unauthorized acquisition, use, or disposition of the company’s assets that could have a material effect on the financial statements.
Because of its inherent limitations, internal control over financial reporting may not prevent or detect misstatements. Also, projections of any evaluation of effectiveness to future periods are subject to the risk that controls may become inadequate because of changes in conditions, or that the degree of compliance with the policies or procedures may deteriorate.
/s/ Deloitte & Touche LLP
San Francisco, California
February 14, 2023
F-3
Report of Independent Registered Public Accounting Firm
To the Shareholders and Board of Directors
Textainer Group Holdings Limited:
Opinion on the Consolidated Financial Statements
We have audited the accompanying consolidated balance sheet of Textainer Group Holdings Limited and subsidiaries (the Company) as of December 31, 2021, the related consolidated statements of operations, comprehensive income, shareholders’ equity, and cash flows for each of the years in the two‑year period ended December 31, 2021, and the related notes and financial statement schedules I to II (collectively, the consolidated financial statements). In our opinion, the consolidated financial statements present fairly, in all material respects, the financial position of the Company as of December 31, 2021, and the results of its operations and its cash flows for each of the years in the two‑year period ended December 31, 2021, in conformity with U.S. generally accepted accounting principles.
Basis for Opinion
These consolidated financial statements are the responsibility of the Company’s management. Our responsibility is to express an opinion on these consolidated financial statements based on our audits. We are a public accounting firm registered with the Public Company Accounting Oversight Board (United States) (PCAOB) and are required to be independent with respect to the Company in accordance with the U.S. federal securities laws and the applicable rules and regulations of the Securities and Exchange Commission and the PCAOB.
We conducted our audits in accordance with the standards of the PCAOB. Those standards require that we plan and perform the audit to obtain reasonable assurance about whether the consolidated financial statements are free of material misstatement, whether due to error or fraud. Our audits included performing procedures to assess the risks of material misstatement of the consolidated financial statements, whether due to error or fraud, and performing procedures that respond to those risks. Such procedures included examining, on a test basis, evidence regarding the amounts and disclosures in the consolidated financial statements. Our audits also included evaluating the accounting principles used and significant estimates made by management, as well as evaluating the overall presentation of the consolidated financial statements. We believe that our audits provide a reasonable basis for our opinion.
We served as the Company’s auditor from 1987 to 2022.
/s/ KPMG LLP
San Francisco, California
March 17, 2022
F-4
TEXTAINER GROUP HOLDINGS LIMITED AND SUBSIDIARIES
Consolidated Balance Sheets
December 31, 2022 and 2021
(All currency expressed in United States dollars in thousands, except share data)
|
|
2022 |
|
|
2021 |
|
||
Assets |
|
|
|
|
|
|
||
Current assets: |
|
|
|
|
|
|
||
Cash and cash equivalents |
|
$ |
|
|
$ |
|
||
Marketable securities |
|
|
|
|
|
— |
|
|
Accounts receivable, net of allowance of $ |
|
|
|
|
|
|
||
Net investment in finance leases, net of allowance of $ |
|
|
|
|
|
|
||
Container leaseback financing receivable, net of allowance of $ |
|
|
|
|
|
|
||
Trading containers |
|
|
|
|
|
|
||
Containers held for sale |
|
|
|
|
|
|
||
Prepaid expenses and other current assets |
|
|
|
|
|
|
||
Due from affiliates, net |
|
|
|
|
|
|
||
Total current assets |
|
|
|
|
|
|
||
Restricted cash |
|
|
|
|
|
|
||
Marketable securities |
|
|
— |
|
|
|
|
|
Containers, net of accumulated depreciation of $ |
|
|
|
|
|
|
||
Net investment in finance leases, net of allowance of $ |
|
|
|
|
|
|
||
Container leaseback financing receivable, net of allowance of $ |
|
|
|
|
|
|
||
Derivative instruments |
|
|
|
|
|
|
||
Deferred taxes |
|
|
|
|
|
|
||
Other assets |
|
|
|
|
|
|
||
Total assets |
|
$ |
|
|
$ |
|
||
Liabilities and Equity |
|
|
|
|
|
|
||
Current liabilities: |
|
|
|
|
|
|
||
Accounts payable and accrued expenses |
|
$ |
|
|
$ |
|
||
Container contracts payable |
|
|
|
|
|
|
||
Other liabilities |
|
|
|
|
|
|
||
Due to container investors, net |
|
|
|
|
|
|
||
Debt, net of unamortized costs of $ |
|
|
|
|
|
|
||
Total current liabilities |
|
|
|
|
|
|
||
Debt, net of unamortized costs of $ |
|
|
|
|
|
|
||
Derivative instruments |
|
|
— |
|
|
|
|
|
Income tax payable |
|
|
|
|
|
|
||
Deferred taxes |
|
|
|
|
|
|
||
Other liabilities |
|
|
|
|
|
|
||
Total liabilities |
|
|
|
|
|
|
||
Equity: |
|
|
|
|
|
|
||
Textainer Group Holdings Limited shareholders' equity: |
|
|
|
|
|
|
||
Cumulative redeemable perpetual preferred shares, $ |
|
|
|
|
|
|
||
Common shares, $ |
|
|
|
|
|
|
||
Treasury shares, at cost, |
|
|
( |
) |
|
|
( |
) |
Additional paid-in capital |
|
|
|
|
|
|
||
Accumulated other comprehensive income |
|
|
|
|
|
|
||
Retained earnings |
|
|
|
|
|
|
||
Total shareholders’ equity |
|
|
|
|
|
|
||
Total liabilities and shareholders’ equity |
|
$ |
|
|
$ |
|
||
The accompanying notes to the consolidated financial statements are an integral part of these statements.
F-5
TEXTAINER GROUP HOLDINGS LIMITED AND SUBSIDIARIES
Consolidated Statements of Operations
Years ended December 31, 2022, 2021 and 2020
(All currency expressed in United States dollars in thousands, except per share amounts)
|
|
2022 |
|
|
2021 |
|
|
2020 |
|
|||
Revenues: |
|
|
|
|
|
|
|
|
|
|||
Operating leases - owned fleet (1) |
|
$ |
|
|
$ |
|
|
$ |
|
|||
Operating leases - managed fleet (1) |
|
|
|
|
|
|
|
|
|
|||
Finance leases and container leaseback financing receivable - owned fleet (1) |
|
|
|
|
|
|
|
|
|
|||
Total lease rental income |
|
|
|
|
|
|
|
|
|
|||
|
|
|
|
|
|
|
|
|
|
|||
Management fees - non-leasing |
|
|
|
|
|
|
|
|
|
|||
|
|
|
|
|
|
|
|
|
|
|||
Trading container sales proceeds |
|
|
|
|
|
|
|
|
|
|||
Cost of trading containers sold |
|
|
( |
) |
|
|
( |
) |
|
|
( |
) |
Trading container margin |
|
|
|
|
|
|
|
|
|
|||
|
|
|
|
|
|
|
|
|
|
|||
Gain on sale of owned fleet containers, net |
|
|
|
|
|
|
|
|
|
|||
|
|
|
|
|
|
|
|
|
|
|||
Operating expenses: |
|
|
|
|
|
|
|
|
|
|||
Direct container expense - owned fleet |
|
|
|
|
|
|
|
|
|
|||
Distribution expense to managed fleet container investors |
|
|
|
|
|
|
|
|
|
|||
Depreciation and amortization (1) |
|
|
|
|
|
|
|
|
|
|||
General and administrative expense |
|
|
|
|
|
|
|
|
|
|||
Bad debt expense (recovery), net |
|
|
|
|
|
( |
) |
|
|
( |
) |
|
Container lessee default expense (recovery), net |
|
|
|
|
|
( |
) |
|
|
( |
) |
|
Total operating expenses |
|
|
|
|
|
|
|
|
|
|||
Income from operations |
|
|
|
|
|
|
|
|
|
|||
Other (expense) income: |
|
|
|
|
|
|
|
|
|
|||
Interest expense |
|
|
( |
) |
|
|
( |
) |
|
|
( |
) |
Debt termination expense |
|
|
— |
|
|
|
( |
) |
|
|
( |
) |
Realized loss on financial instruments, net |
|
|
( |
) |
|
|
( |
) |
|
|
( |
) |
Unrealized (loss) gain on financial instruments, net |
|
|
( |
) |
|
|
|
|
|
( |
) |
|
Other, net |
|
|
|
|
|
( |
) |
|
|
|
||
Net other expense |
|
|
( |
) |
|
|
( |
) |
|
|
( |
) |
Income before income taxes |
|
|
|
|
|
|
|
|
|
|||
Income tax (expense) benefit |
|
|
( |
) |
|
|
( |
) |
|
|
|
|
Net income |
|
|
|
|
|
|
|
|
|
|||
Less: Dividends on preferred shares |
|
|
|
|
|
|
|
|
— |
|
||
Less: Net income attributable to the noncontrolling interest |
|
|
— |
|
|
|
— |
|
|
|
|
|
Net income attributable to common shareholders |
|
$ |
|
|
$ |
|
|
$ |
|
|||
|
|
|
|
|
|
|
|
|
|
|||
Net income attributable to common shareholders per share: |
|
|
|
|
|
|
|
|
|
|||
Basic |
|
$ |
|
|
$ |
|
|
$ |
|
|||
Diluted |
|
$ |
|
|
$ |
|
|
$ |
|
|||
Weighted average shares outstanding (in thousands): |
|
|
|
|
|
|
|
|
|
|||
Basic |
|
|
|
|
|
|
|
|
|
|||
Diluted |
|
|
|
|
|
|
|
|
|
|||
The accompanying notes to the consolidated financial statements are an integral part of these statements.
F-6
TEXTAINER GROUP HOLDINGS LIMITED AND SUBSIDIARIES
Consolidated Statements of Comprehensive Income
Years ended December 31, 2022, 2021 and 2020
(All currency expressed in United States dollars in thousands)
|
|
2022 |
|
|
2021 |
|
|
2020 |
|
|||
Net income |
|
$ |
|
|
$ |
|
|
$ |
|
|||
Other comprehensive income (loss), before tax: |
|
|
|
|
|
|
|
|
|
|||
Change in derivative instruments designated as cash flow hedges |
|
|
|
|
|
|
|
|
( |
) |
||
Reclassification of realized (gain) loss on derivative instruments |
|
|
( |
) |
|
|
|
|
|
|
||
Foreign currency translation adjustments |
|
|
( |
) |
|
|
( |
) |
|
|
|
|
Comprehensive income, before tax |
|
|
|
|
|
|
|
|
|
|||
Income tax (expense) benefit related to items of other comprehensive |
|
|
( |
) |
|
|
( |
) |
|
|
|
|
Comprehensive income, after tax |
|
|
|
|
|
|
|
|
|
|||
Less: Dividends on preferred shares |
|
|
|
|
|
|
|
|
— |
|
||
Less: Comprehensive income attributable to the noncontrolling |
|
|
— |
|
|
|
— |
|
|
|
|
|
Comprehensive income attributable to common shareholders |
|
$ |
|
|
$ |
|
|
$ |
|
|||
The accompanying notes to the consolidated financial statements are an integral part of these statements.
F-7
TEXTAINER GROUP HOLDINGS LIMITED AND SUBSIDIARIES
Years ended December 31, 2022, 2021 and 2020
(All currency expressed in United States dollars in thousands, except share data)
|
|
|
|
|
|
|
|
|
|
|
|
|
|
|
|
|
|
|
|
|
|
|
Accumulated |
|
|
|
|
|
Total |
|
|
|
|
|
|
|
||||||||||||
|
|
|
|
|
|
|
|
|
|
|
|
|
|
|
|
|
|
|
|
Additional |
|
|
other |
|
|
|
|
|
Textainer Group |
|
|
|
|
|
|
|
||||||||||||
|
|
Preferred shares |
|
|
Common shares |
|
|
Treasury shares |
|
|
paid-in |
|
|
comprehensive |
|
|
Retained |
|
|
Holdings Limited |
|
|
Noncontrolling |
|
|
Total |
|
|||||||||||||||||||||
|
|
Shares |
|
|
Amount |
|
|
Shares |
|
|
Amount |
|
|
Shares |
|
|
Amount |
|
|
capital |
|
|
(loss) income |
|
|
earnings |
|
|
shareholders' equity |
|
|
interest |
|
|
equity |
|
||||||||||||
Balances, December 31, 2019 |
|
|
— |
|
|
$ |
— |
|
|
|
|
|
$ |
|
|
|
( |
) |
|
$ |
( |
) |
|
$ |
|
|
$ |
( |
) |
|
$ |
|
|
$ |
|
|
$ |
|
|
$ |
|
|||||||
Cumulative adjustment for adoption of ASU 2016-13 |
|
|
— |
|
|
|
— |
|
|
|
— |
|
|
|
— |
|
|
|
— |
|
|
|
— |
|
|
|
— |
|
|
|
— |
|
|
|
( |
) |
|
|
( |
) |
|
|
( |
) |
|
|
( |
) |
Purchase of treasury shares |
|
|
— |
|
|
|
— |
|
|
|
— |
|
|
|
— |
|
|
|
( |
) |
|
|
( |
) |
|
|
— |
|
|
|
— |
|
|
|
— |
|
|
|
( |
) |
|
|
— |
|
|
|
( |
) |
Restricted share units vested |
|
|
— |
|
|
|
— |
|
|
|
|
|
|
|
|
|
— |
|
|
|
— |
|
|
|
( |
) |
|
|
— |
|
|
|
— |
|
|
|
— |
|
|
|
— |
|
|
|
— |
|
||
Exercise of share options |
|
|
— |
|
|
|
— |
|
|
|
|
|
|
|
|
|
— |
|
|
|
— |
|
|
|
|
|
|
— |
|
|
|
— |
|
|
|
|
|
|
— |
|
|
|
|
|||||
Share-based compensation expense |
|
|
— |
|
|
|
— |
|
|
|
— |
|
|
|
— |
|
|
|
— |
|
|
|
— |
|
|
|
|
|
|
— |
|
|
|
— |
|
|
|
|
|
|
— |
|
|
|
|
|||
Net income |
|
|
— |
|
|
|
— |
|
|
|
— |
|
|
|
— |
|
|
|
— |
|
|
|
— |
|
|
|
— |
|
|
|
— |
|
|
|
|
|
|
|
|
|
|
|
|
|
||||
Other comprehensive income (loss): |
|
|
|
|
|
|
|
|
|
|
|
|
|
|
|
|
|
|
|
|
|
|
|
|
|
|
|
|
|
|
|
|
|
|
|
|
||||||||||||
Change in derivative instruments designated |
|
|
— |
|
|
|
— |
|
|
|
— |
|
|
|
— |
|
|
|
— |
|
|
|
— |
|
|
|
— |
|
|
|
( |
) |
|
|
— |
|
|
|
( |
) |
|
|
— |
|
|
|
( |
) |
Reclassification of realized loss on derivative |
|
|
— |
|
|
|
— |
|
|
|
— |
|
|
|
— |
|
|
|
— |
|
|
|
— |
|
|
|
— |
|
|
|
|
|
|
— |
|
|
|
|
|
|
— |
|
|
|
|
|||
Foreign currency translation adjustments |
|
|
— |
|
|
|
— |
|
|
|
— |
|
|
|
— |
|
|
|
— |
|
|
|
— |
|
|
|
— |
|
|
|
|
|
|
— |
|
|
|
|
|
|
— |
|
|
|
|
|||
Income tax benefit related to items of other |
|
|
— |
|
|
|
— |
|
|
|
— |
|
|
|
— |
|
|
|
— |
|
|
|
— |
|
|
|
— |
|
|
|
|
|
|
— |
|
|
|
|
|
|
— |
|
|
|
|
|||
Total other comprehensive loss |
|
|
|
|
|
|
|
|
|
|
|
|
|
|
|
|
|
|
|
|
|
|
|
|
|
|
|
|
|
|
|
|
|
|
|
( |
) |
|||||||||||
Balances, December 31, 2020 |
|
|
— |
|
|
|
— |
|
|
|
|
|
|
|
|
|
( |
) |
|
|
( |
) |
|
|
|
|
|
( |
) |
|
|
|
|
|
|
|
|
|
|
|
|
|||||||
Issuance of preferred shares, net of offering expenses |
|
|
|
|
|
|
|
|
— |
|
|
|
— |
|
|
|
— |
|
|
|
— |
|
|
|
( |
) |
|
|
— |
|
|
|
— |
|
|
|
|
|
|
— |
|
|
|
|
||||
Restricted share units vested |
|
|
— |
|
|
|
— |
|
|
|
|
|
|
|
|
|
— |
|
|
|
— |
|
|
|
( |
) |
|
|
— |
|
|
|
— |
|
|
|
— |
|
|
|
— |
|
|
|
— |
|
||
Exercise of share options |
|
|
— |
|
|
|
— |
|
|
|
|
|
|
|
|
|
— |
|
|
|
— |
|
|
|
|
|
|
— |
|
|
|
— |
|
|
|
|
|
|
— |
|
|
|
|
|||||
Purchase of treasury shares |
|
|
— |
|
|
|
— |
|
|
|
— |
|
|
|
— |
|
|
|
( |
) |
|
|
( |
) |
|
|
— |
|
|
|
— |
|
|
|
— |
|
|
|
( |
) |
|
|
— |
|
|
|
( |
) |
Share-based compensation expense |
|
|
— |
|
|
|
— |
|
|
|
— |
|
|
|
— |
|
|
|
— |
|
|
|
— |
|
|
|
|
|
|
— |
|
|
|
— |
|
|
|
|
|
|
— |
|
|
|
|
|||
Purchase of noncontrolling interest |
|
|
— |
|
|
|
— |
|
|
|
— |
|
|
|
— |
|
|
|
— |
|
|
|
— |
|
|
|
|
|
|
— |
|
|
|
— |
|
|
|
|
|
|
( |
) |
|
|
( |
) |
||
Preferred shares dividends declared |
|
|
— |
|
|
|
— |
|
|
|
— |
|
|
|
— |
|
|
|
— |
|
|
|
— |
|
|
|
— |
|
|
|
— |
|
|
|
( |
) |
|
|
( |
) |
|
|
— |
|
|
|
( |
) |
Dividends declared to common shareholders ($ |
|
|
— |
|
|
|
— |
|
|
|
— |
|
|
|
— |
|
|
|
— |
|
|
|
— |
|
|
|
— |
|
|
|
— |
|
|
|
( |
) |
|
|
( |
) |
|
|
— |
|
|
|
( |
) |
Net income |
|
|
— |
|
|
|
— |
|
|
|
— |
|
|
|
— |
|
|
|
— |
|
|
|
— |
|
|
|
— |
|
|
|
— |
|
|
|
|
|
|
|
|
|
— |
|
|
|
|
|||
Other comprehensive income (loss): |
|
|
|
|
|
|
|
|
|
|
|
|
|
|
|
|
|
|
|
|
|
|
|
|
|
|
|
|
|
|
|
|
|
|
|
|
||||||||||||
Change in derivative instruments designated |
|
|
— |
|
|
|
— |
|
|
|
— |
|
|
|
— |
|
|
|
— |
|
|
|
— |
|
|
|
— |
|
|
|
|
|
|
— |
|
|
|
|
|
|
— |
|
|
|
|
|||
Reclassification of realized loss on derivative |
|
|
— |
|
|
|
— |
|
|
|
— |
|
|
|
— |
|
|
|
— |
|
|
|
— |
|
|
|
— |
|
|
|
|
|
|
— |
|
|
|
|
|
|
— |
|
|
|
|
|||
Foreign currency translation adjustments |
|
|
— |
|
|
|
— |
|
|
|
— |
|
|
|
— |
|
|
|
— |
|
|
|
— |
|
|
|
— |
|
|
|
( |
) |
|
|
— |
|
|
|
( |
) |
|
|
— |
|
|
|
( |
) |
Income tax expense related to items of other |
|
|
— |
|
|
|
— |
|
|
|
— |
|
|
|
— |
|
|
|
— |
|
|
|
— |
|
|
|
— |
|
|
|
( |
) |
|
|
— |
|
|
|
( |
) |
|
|
— |
|
|
|
( |
) |
Total other comprehensive income |
|
|
|
|
|
|
|
|
|
|
|
|
|
|
|
|
|
|
|
|
|
|
|
|
|
|
|
|
|
|
|
|
|
|
|
|
||||||||||||
Balances, December 31, 2021 |
|
|
|
|
|
|
|
|
|
|
|
|
|
|
( |
) |
|
|
( |
) |
|
|
|
|
|
|
|
|
|
|
|
|
|
|
— |
|
|
|
|
|||||||||
Restricted share units vested |
|
|
— |
|
|
|
— |
|
|
|
|
|
|
|
|
|
— |
|
|
|
— |
|
|
|
( |
) |
|
|
— |
|
|
|
— |
|
|
|
— |
|
|
|
— |
|
|
|
— |
|
||
Exercise of share options |
|
|
— |
|
|
|
— |
|
|
|
|
|
|
|
|
|
— |
|
|
|
— |
|
|
|
|
|
|
— |
|
|
|
— |
|
|
|
|
|
|
— |
|
|
|
|
|||||
Purchase of treasury shares |
|
|
— |
|
|
|
— |
|
|
|
— |
|
|
|
— |
|
|
|
( |
) |
|
|
( |
) |
|
|
— |
|
|
|
— |
|
|
|
— |
|
|
|
( |
) |
|
|
— |
|
|
|
( |
) |
Share-based compensation expense |
|
|
— |
|
|
|
— |
|
|
|
— |
|
|
|
— |
|
|
|
— |
|
|
|
— |
|
|
|
|
|
|
— |
|
|
|
— |
|
|
|
|
|
|
— |
|
|
|
|
|||
Preferred shares dividends declared |
|
|
— |
|
|
|
— |
|
|
|
— |
|
|
|
— |
|
|
|
— |
|
|
|
— |
|
|
|
— |
|
|
|
— |
|
|
|
( |
) |
|
|
( |
) |
|
|
— |
|
|
|
( |
) |
Dividends declared to common shareholders ($ |
|
|
— |
|
|
|
— |
|
|
|
— |
|
|
|
— |
|
|
|
— |
|
|
|
— |
|
|
|
— |
|
|
|
— |
|
|
|
( |
) |
|
|
( |
) |
|
|
— |
|
|
|
( |
) |
Net income |
|
|
— |
|
|
|
— |
|
|
|
— |
|
|
|
— |
|
|
|
— |
|
|
|
— |
|
|
|
— |
|
|
|
— |
|
|
|
|
|
|
|
|
|
— |
|
|
|
|
|||
Other comprehensive income (loss): |
|
|
|
|
|
|
|
|
|
|
|
|
|
|
|
|
|
|
|
|
|
|
|
|
|
|
|
|
|
|
|
|
|
|
|
|
||||||||||||
Change in derivative instruments designated |
|
|
— |
|
|
|
— |
|
|
|
— |
|
|
|
— |
|
|
|
— |
|
|
|
— |
|
|
|
— |
|
|
|
|
|
|
— |
|
|
|
|
|
|
— |
|
|
|
|
|||
Reclassification of realized gain on derivative |
|
|
— |
|
|
|
— |
|
|
|
— |
|
|
|
— |
|
|
|
— |
|
|
|
— |
|
|
|
— |
|
|
|
( |
) |
|
|
— |
|
|
|
( |
) |
|
|
— |
|
|
|
( |
) |
Foreign currency translation adjustments |
|
|
— |
|
|
|
— |
|
|
|
— |
|
|
|
— |
|
|
|
— |
|
|
|
— |
|
|
|
— |
|
|
|
( |
) |
|
|
— |
|
|
|
( |
) |
|
|
— |
|
|
|
( |
) |
Income tax expense related to items of other |
|
|
— |
|
|
|
— |
|
|
|
— |
|
|
|
— |
|
|
|
— |
|
|
|
— |
|
|
|
— |
|
|
|
( |
) |
|
|
— |
|
|
|
( |
) |
|
|
— |
|
|
|
( |
) |
Total other comprehensive income |
|
|
|
|
|
|
|
|
|
|
|
|
|
|
|
|
|
|
|
|
|
|
|
|
|
|
|
|
|
|
|
|
|
|
|
|
||||||||||||
Balances, December 31, 2022 |
|
|
|
|
$ |
|
|
|
|
|
$ |
|
|
|
( |
) |
|
$ |
( |
) |
|
$ |
|
|
$ |
|
|
$ |
|
|
$ |
|
|
$ |
— |
|
|
$ |
|
|||||||||
The accompanying notes to the consolidated financial statements are an integral part of these statements.
F-8
TEXTAINER GROUP HOLDINGS LIMITED AND SUBSIDIARIES
Consolidated Statements of Cash Flows
Years ended December 31, 2022, 2021 and 2020
(All currency expressed in United States dollars in thousands)
|
|
2022 |
|
|
2021 |
|
|
2020 |
|
|||
Cash flows from operating activities: |
|
|
|
|
|
|
|
|
|
|||
Net income |
|
$ |
|
|
$ |
|
|
$ |
|
|||
Adjustments to reconcile net income to net cash provided by operating activities: |
|
|
|
|
|
|
|
|
|
|||
Depreciation and amortization (1) |
|
|
|
|
|
|
|
|
|
|||
Bad debt expense (recovery), net |
|
|
|
|
|
( |
) |
|
|
( |
) |
|
Container write-off (recovery) from lessee default, net |
|
|
|
|
|
( |
) |
|
|
( |
) |
|
Unrealized loss (gain) on financial instruments, net |
|
|
|
|
|
( |
) |
|
|
|
||
Amortization of unamortized debt issuance costs and accretion of bond discounts |
|
|
|
|
|
|
|
|
|
|||
Debt termination expense |
|
|
— |
|
|
|
|
|
|
|
||
Gain on sale of owned fleet containers, net |
|
|
( |
) |
|
|
( |
) |
|
|
( |
) |
Share-based compensation expense |
|
|
|
|
|
|
|
|
|
|||
Changes in operating assets and liabilities: |
|
|
|
|
|
|
|
|
|
|||
Accounts receivable, net |
|
|
|
|
|
( |
) |
|
|
|
||
Trading containers, net |
|
|
|
|
|
( |
) |
|
|
|
||
Receipt of payments on finance leases, net of income earned |
|
|
|
|
|
|
|
|
|
|||
Interest portion of container leaseback financing receivable |
|
|
( |
) |
|
|
|
|
|
( |
) |
|
Prepaid expenses and other current assets |
|
|
( |
) |
|
|
( |
) |
|
|
|
|
Due from affiliates, net |
|
|
( |
) |
|
|
( |
) |
|
|
|
|
Receipt of marketable securities from a lessee |
|
|
— |
|
|
|
( |
) |
|
|
— |
|
Proceeds from sale of marketable securities |
|
|
|
|
|
|
|
|
— |
|
||
Other assets |
|
|
|
|
|
|
|
|
|
|||
Accounts payable and accrued expenses |
|
|
|
|
|
( |
) |
|
|
|
||
Other liabilities |
|
|
( |
) |
|
|
|
|
|
( |
) |
|
Due to container investors, net |
|
|
( |
) |
|
|
( |
) |
|
|
( |
) |
Settlement of interest rate swaps |
|
|
— |
|
|
|
( |
) |
|
|
— |
|
Long-term income tax payable |
|
|
|
|
|
|
|
|
|
|||
Deferred taxes, net |
|
|
|
|
|
|
|
|
( |
) |
||
Total adjustments |
|
|
|
|
|
|
|
|
|
|||
Net cash provided by operating activities |
|
|
|
|
|
|
|
|
|
|||
Cash flows from investing activities: |
|
|
|
|
|
|
|
|
|
|||
Purchase of containers |
|
|
( |
) |
|
|
( |
) |
|
|
( |
) |
Payments on container leaseback financing receivable |
|
|
( |
) |
|
|
( |
) |
|
|
( |
) |
Proceeds from sale of containers |
|
|
|
|
|
|
|
|
|
|||
Receipt of principal payments on container leaseback financing receivable |
|
|
|
|
|
|
|
|
|
|||
Other |
|
|
( |
) |
|
|
( |
) |
|
|
( |
) |
Net cash used in investing activities |
|
|
( |
) |
|
|
( |
) |
|
|
( |
) |
Cash flows from financing activities: |
|
|
|
|
|
|
|
|
|
|||
Proceeds from debt |
|
|
|
|
|
|
|
|
|
|||
Payments on debt |
|
|
( |
) |
|
|
( |
) |
|
|
( |
) |
Payment of debt issuance costs |
|
|
( |
) |
|
|
( |
) |
|
|
( |
) |
Proceeds from container leaseback financing liability, net |
|
|
— |
|
|
|
|
|
|
— |
|
|
Principal repayments on container leaseback financing liability, net |
|
|
( |
) |
|
|
( |
) |
|
|
( |
) |
Issuance of preferred shares, net of underwriting discount |
|
|
— |
|
|
|
|
|
|
— |
|
|
Purchase of treasury shares |
|
|
( |
) |
|
|
( |
) |
|
|
( |
) |
Issuance of common shares upon exercise of share options |
|
|
|
|
|
|
|
|
|
|||
Dividends paid on common shares |
|
|
( |
) |
|
|
( |
) |
|
|
— |
|
Dividends paid on preferred shares |
|
|
( |
) |
|
|
( |
) |
|
|
— |
|
Purchase of noncontrolling interest |
|
|
— |
|
|
|
( |
) |
|
|
— |
|
Other |
|
|
— |
|
|
|
( |
) |
|
|
— |
|
Net cash (used in) provided by financing activities |
|
|
( |
) |
|
|
|
|
|
|
||
Effect of exchange rate changes |
|
|
( |
) |
|
|
( |
) |
|
|
|
|
Net change in cash, cash equivalents and restricted cash |
|
|
( |
) |
|
|
|
|
|
( |
) |
|
Cash, cash equivalents and restricted cash, beginning of the year |
|
|
|
|
|
|
|
|
|
|||
Cash, cash equivalents and restricted cash, end of the year |
|
$ |
|
|
$ |
|
|
$ |
|
|||
Supplemental disclosures of cash flow information: |
|
|
|
|
|
|
|
|
|
|||
Cash paid for interest expense and realized loss and settlement of derivative instruments |
|
$ |
|
|
$ |
|
|
$ |
|
|||
Income taxes paid |
|
$ |
|
|
$ |
|
|
$ |
|
|||
Supplemental disclosures of noncash operating activities: |
|
|
|
|
|
|
|
|
|
|||
Right-of-use asset for leased properties |
|
$ |
— |
|
|
$ |
|
|
$ |
|
||
Supplemental disclosures of noncash investing activities: |
|
|
|
|
|
|
|
|
|
|||
(Decrease) increase in accrued container purchases |
|
$ |
( |
) |
|
$ |
( |
) |
|
$ |
|
|
Containers placed in finance leases |
|
$ |
|
|
$ |
|
|
$ |
|
|||
The accompanying notes to the consolidated financial statements are an integral part of these statements.
F-10
TEXTAINER GROUP HOLDINGS LIMITED AND SUBSIDIARIES
Notes to Consolidated Financial Statements
December 31, 2022, 2021 and 2020
(All currency expressed in U.S. dollars in thousands, except per share amounts)
(1) Nature of Business and Summary of Significant Accounting Policies
Textainer Group Holdings Limited (“TGH”) is incorporated in Bermuda. TGH is the holding company of a group of companies, consisting of TGH and its subsidiaries (collectively, the “Company”), involved in the purchase, management, leasing and resale of a fleet of marine cargo containers. The Company also manages and provides administrative support to the third-party owners’ (the “Container Investors”) container fleets.
The Company conducts its business activities in three main areas: Container Ownership, Container Management and Container Resale. These activities are described below (also see Note 9 “Segment Information”).
Container Ownership
The Company’s containers consist primarily of standard dry freight containers, but also include refrigerated and other special-purpose containers. These owned containers are financed through retained earnings; revolving credit facilities, secured debt facilities and term loans provided by banks; bonds payable to investors; and a public offering of TGH’s common and preferred shares. Expenses related to lease rental income of the owned fleet primarily include direct container expenses, depreciation expense and interest expense.
Container Management
The Company manages, on a worldwide basis, a fleet of containers for and on behalf of the Container Investors. All rental operations are conducted worldwide in the name of the Company who, as agent for the Container Investors, acquires and sells containers, enters into leasing agreements and depot service agreements, bills and collects lease rentals from the lessees, disburses funds to depots for container handling, and remits net amounts, less management fees and commissions, to the Container Investors.
Fees earned by the Company under the management agreements are typically a percentage of net operating income of each Container Investor’s fleet and consist of fees for leasing services related to the management of the containers, sales commissions and net acquisition fees earned on the acquisition of containers. Lease rental income and expenses arising from the operation of the managed fleet are presented on a gross basis, whereby revenue billed to shipping lines and expenses incurred and distributions to the container investors of the managed fleet are presented in the Company’s consolidated statements of operations. Accounts receivable and vendor payables arising from direct container operations of the managed containers are presented on a gross basis in the Company’s consolidated balance sheets. See Note 2 “Managed Container Fleet” for information on the managed fleet containers.
Container Resale
The Company buys and subsequently resells containers (trading containers) from third parties. Container sales revenue represents the proceeds on the sale of containers purchased for resale. Cost of containers sold represents the cost of equipment purchased for resale that were sold as well as the related selling costs. The Company earns sales commissions related to the sale of the containers that it manages.
The consolidated financial statements of the Company include TGH and all of its wholly-owned subsidiaries. All significant intercompany accounts and balances have been eliminated in consolidation. The Company determines whether it has a controlling financial interest in an entity by evaluating whether the entity is a variable interest entity or a voting interest entity. If it is determined that the Company does not have a variable interest in the entity, no further analysis is required, and the Company does not consolidate the entity. There were
F-11
Managed Containers
The Company enters into container management agreements with Container Investors. The fees earned by the Company for managing container portfolios on behalf of Container Investors are commensurate with the level of effort required to provide those management services and the Company does not have the obligation to absorb losses or the right to receive benefits that may be significant to the Container Investors. As such, the Company is not the primary beneficiary and does not consolidate the Container Investors. Managed containers which are owned by Container Investors are not assets of the Company and are not included in the consolidated financial statements, except for certain managed containers that the Company is deemed to own with associated container leaseback financial liability of the Company in accordance with Topic 842, Leases (see Note 1(a) “Nature of Operations” and Note 2 “Managed Container Fleet”).
Owned Containers
The majority of the container equipment included in the accompanying consolidated financial statements is owned by Textainer Limited (“TL”), Textainer Marine Containers II Limited (“TMCL II”) and Textainer Marine Containers VII Limited (“TMCL VII”), all Bermuda companies and all of which were wholly-owned subsidiaries of the Company as of December 31, 2022 and 2021. As of December 31, 2022 and 2021, all owned containers are pledged as collateral for debt.
The Company's container leasing equipment and accounts receivable subject it to potential credit risk. Credit risk is mitigated by the Company's assessment of the creditworthiness of container shipping lines and the ongoing monitoring of the customers’ financial condition, credit history and outstanding accounts receivable balances (see Note 1 (g) “Allowance for Credit Losses” for further discussions on the Company’s ongoing credit review of lessees). The Company’s customers are mainly international shipping lines, which transport goods on international trade routes. Once the containers are on-hire with a lessee, the Company does not track their location. The domicile of the lessee is not indicative of where the lessee is transporting the containers. The Company’s business risk in its geographic concentration lies with the creditworthiness of the lessees rather than the location of the containers or the domicile of the lessees.
Total lease rental income, as reported in the consolidated statements of operations, comprises revenue earned from leases on containers in the Company’s total fleet, including revenue earned from leases on containers in its managed fleet.
|
|
|
|
|
|
|
|
|
|
|||
Total Lease Rental Income |
|
2022 |
|
|
2021 |
|
|
2020 |
|
|||
Customer A |
|
|
% |
|
|
% |
|
|
% |
|||
Customer B |
|
|
% |
|
|
% |
|
|
% |
|||
Customer C |
|
|
% |
|
|
% |
|
|
% |
|||
Other financial instruments that are exposed to concentrations of credit risk are cash and cash equivalents, restricted cash balances, and derivatives (see Note 1 (e) "Cash and Cash Equivalents and Restricted Cash" and Note 8 "Derivative Instruments" for further discussions). The Company believes no significant concentration risk exists with respect to its cash and cash equivalents and restricted cash balances. The Company does not anticipate any non-performance by the derivative counterparties.
F-12
The preparation of consolidated financial statements in conformity with accounting principles generally accepted in the United States of America requires the Company’s management to make estimates and assumptions that affect the reported amounts of assets and liabilities and disclosure of contingent assets and liabilities at the date of the consolidated financial statements and the reported amounts of revenues and expenses during the reporting period. The Company’s management evaluates its estimates on an ongoing basis, including those significantly related to the container leasing equipment, containers held for sale, allowance for credit losses, income taxes and accruals.
These estimates are based on historical experience and on various other assumptions that are believed to be reasonable under the circumstances, the results of which form the basis for making judgments regarding the carrying values of assets and liabilities. Actual results could differ from those estimates under different assumptions or conditions.
Cash and cash equivalents are comprised of interest-bearing deposits or money market securities with original maturities of
The components of the Company’s revenue as presented in the consolidated statements of operations and in Note 9 “Segment Information” are as follows:
Lease Rental Income
Lease rental income arises principally from leasing containers to various international shipping lines and includes all rental charges billed to the lessees. Lease rental income from owned fleet comprises rental income for the container fleet owned by the Company. Lease rental income from managed fleet comprises rental income for the container fleet owned by the Container Investors. For lease accounting purposes, the management agreements with these Container Investors are deemed to convey to the Company the right to control the use of the managed containers and are therefore accounted for as “operating leases - managed fleet” as reported in the consolidated statements of operations (see Note 2 “Managed Container Fleet” for further information).
Revenue is recorded when earned according to the terms of the container lease contracts with customers. Revenue is earned and recognized evenly over the period that the equipment is on lease. These contracts are typically for terms of or more years and are generally classified as operating leases. Where minimum lease payments vary over the lease term, revenue is recognized on a straight-line basis over the term of the lease. Lease rental income comprises daily per diem rental charges due under the lease agreements, together with payments for other charges set forth in the leases, such as handling fees, drop-off charges, pick-up charges, and charges for a damage protection plan.
Under long-term lease agreements, containers are usually leased from the Company for periods of or more years. Under master lease agreements, the lessee is not committed to leasing a minimum number of containers from the Company during the lease term and may generally return the containers to the Company at any time, subject to certain restrictions in the lease agreement. Under long-term lease and master lease agreements, revenue is earned and recognized evenly over the period that the equipment is on lease.
F-13
Under finance leases, the containers are usually leased from the Company for the remainder of the container’s useful life and ordinarily provide lessees with a right to purchase the subject containers for a nominal amount at the end of the lease term. Finance lease income is recognized using the effective interest method, which generates a constant rate of interest over the period of the lease.
Under sales-type leaseback arrangements that are accounted for as financing transactions, the Company recorded a container leaseback financing receivable in the amount paid for the purchased containers that were leased back to the seller-lessees. Payments made by the seller-lessees are recorded as a reduction to the container leaseback financing receivable and as interest income. Interest income is recognized using the effective interest method, which generates a constant rate of interest over the period of the arrangement.
The Company’s container leases generally do not include step-rent provisions, nor do they depend on indices or rates. The Company recognizes revenue on container leases that include lease concessions in the form of free-rent periods using the straight-line method over the minimum terms of the leases.
The Company will cease recognition of lease revenue if and when a container lessee defaults in making timely payments and when determined that future lease payments are not likely to be collected from the lessee (see Note 1 (f) “Allowance for Credit Losses” for further discussions on the Company’s ongoing credit review of lessees).
Management Fees - Non-leasing
Under the Company’s management service agreements with Container Investors, fees are earned for the acquisition and sale of containers under management (see Note 2 “Managed Container Fleet” for further information). Acquisition fees from purchases of containers for managed fleet are deferred and recognized as earned on a straight-line basis over the deemed lease term.
Trading Container Margin
The Company’s trading container sales proceeds arise from the resale of new and used trading containers that were acquired for resale to a wide variety of buyers. The related expenses represent the cost of trading containers sold as well as other selling costs that are recognized as incurred. Revenue is recorded when control of the containers is transferred to the customer, which typically occurs upon delivery to, or pick-up by, the customer and when collectability is reasonably assured.
Accounts receivable, net investment in finance leases and container leaseback financing receivable are stated at amortized cost net of allowance for credit losses. Subsequent changes in the estimated allowance for credit losses are recognized in “bad debt expense (recovery), net” in the consolidated statements of operations (see Note 5 “Allowance for Credit Losses” for further information).
Accounts Receivables
The Company maintains allowances, if necessary, for doubtful accounts against accounts receivables resulting from the inability of its lessees to make required payments related to billed amounts under the operating leases, finance leases, container leaseback financing receivable and for sales of owned fleet containers and trading containers. The allowance is developed based on two components: (1) specific reserves for receivables for which management believes full collection is doubtful; and (2) a general reserve for estimated losses inherent in the receivables based upon historical trends and age of the balances. These allowances are based on an ongoing review of the creditworthiness, but not limited to, each lessee’s payment history, management’s current assessment of the financial condition of the Company’s lessees, their ability to make their required payments and the recoverability. The Company considers an account past due when a payment has not been received in accordance with the terms
F-14
of the lease agreement, and if the financial condition of the Company’s lessees deteriorates resulting in an impairment of their ability to make payments, additional allowances may be required.
Accounts receivables are generally written off after an analysis is completed which indicates that collection of the full balance is remote. Changes in economic conditions or other events may necessitate additions or deductions to the allowance for doubtful accounts. The allowance is intended to provide for losses inherent in the owned and managed fleet’s accounts receivable and requires the application of estimates and judgments as to the outcome of collection efforts and the realization of collateral, among other things.
Net Investment in Finance Leases and Container Leaseback Financing Receivables
The Company maintains allowances for credit losses against net investment in finance leases and container leaseback financing receivable related to unbilled amounts under the finance leases and the sales-type leaseback arrangements accounted for as financing receivable. The Company estimates its potential future expected credit losses based on historical losses from lessee defaults, current economic conditions and reasonable and supportable forecasts that may affect the collectability of the reported amount. The Company monitors its container lessees’ performance and its lease exposures on an ongoing basis. The Company evaluates its exposure by portfolio with similar risk characteristics based on the creditworthiness, external credit data and overall credit quality of its lessees.
The Company’s internal risk rating categories are “Tier 1” for the lowest level of risk which are typically the large international shipping lines with strong financial and asset base; “Tier 2” for moderate level of risk which includes lessees which are well-established in the market; and “Tier 3” for the highest level of risk which includes smaller shipping lines or lessees that exhibit high volatility in payments on a regular basis.
Direct container expense – owned fleet represents the operating costs arising from the containers owned by the Company and includes storage, handling, maintenance and repair, repositioning, agent, and insurance expense. These costs are recognized when incurred.
The Company’s distribution amounts to Container Investors for the managed fleet includes the net operating income of each Container Investor’s fleet, reduced by associated lease management fees earned and retained by the Company. This amount is also reduced by expenses related to the operation of the managed containers which are presented on a gross basis in the consolidated statements of operations. Expenses related to the operation of the managed containers such as storage, handling, repairs, repositioning, agent, insurance expense and general and administrative expenses are recognized when incurred.
A functional currency is determined for each of the Company’s entities based on the currency of the primary economic environment in which the entity operates. The Company’s functional currency is the U.S. dollar, excluding its foreign subsidiaries Textainer Equipment Management (United Kingdom) Limited and Textainer Equipment Management (Singapore) Pte Ltd. Assets and liabilities denominated in a currency other than the entity’s functional currency are re-measured into its functional currency at the balance sheet date with a gain or loss recognized in current year net income. Foreign currency exchange gains or losses that arise from exchange
F-15
rate changes on transactions denominated in a foreign currency are recognized in net income as incurred. Foreign currency exchange losses, reported in “direct container expense – owned fleet” in the consolidated statements of operations were $
The Company also has certain cash accounts that are denominated in currencies other than the Company's functional currency, which are remeasured at each balance sheet date at the exchange rates in effect as of those dates. The (losses) gains due to changes in exchange rates from remeasurement were $(
Fixed assets are recorded at cost and depreciated on a straight-line basis over the estimated useful lives of such property, furniture and equipment, ranging from to
Implementation costs associated with cloud-based hosting arrangement that is a service contract are capitalized when incurred during the application development phase. As of December 31, 2022 and 2021, the Company’s aggregate capitalized implementation costs amounted to $
Capitalized costs for container leasing equipment include the container cost payable to the manufacturer, inspection, delivery and the associated transportation costs incurred in moving the Company’s containers from the manufacturer to the containers’ first destined port. Container leasing equipment are depreciated using the straight-line method over their estimated useful lives to an estimated residual value. Used containers are depreciated based upon their remaining useful lives at the date of acquisition to an estimated residual value. Repair and maintenance costs that do not extend the useful lives of the container leasing equipment are recognized in “direct container expense - owned fleet” in the consolidated statements of operations at the time the costs are incurred.
The Company evaluates the estimated residual values and remaining estimated useful lives on a regular basis to determine whether a change in its estimates of useful lives and residual values is warranted. To perform this assessment, the Company analyzed sales data over a minimum of a
F-16
The Company estimates the useful lives and residual values of its container leasing equipment to be as follows:
|
|
As of December 31, 2022 and 2021 |
|
|||||
|
|
Estimated useful |
|
|
Residual |
|
||
|
|
life (years) |
|
|
Value |
|
||
Dry containers other than open top and flat rack |
|
|
|
|
|
|
||
20' |
|
|
|
|
$ |
|
||
40' |
|
|
|
|
$ |
|
||
40' high cube |
|
|
|
|
$ |
|
||
45' high cube |
|
|
|
|
$ |
|
||
Refrigerated containers: |
|
|
|
|
|
|
||
20' |
|
|
|
|
$ |
|
||
20' high cube |
|
|
|
|
$ |
|
||
40' high cube |
|
|
|
|
$ |
|
||
Open top and flat rack containers: |
|
|
|
|
|
|
||
20' folding flat rack |
|
|
|
|
$ |
|
||
40' folding flat rack |
|
|
|
|
$ |
|
||
20' open top |
|
|
|
|
$ |
|
||
40' open top |
|
|
|
|
$ |
|
||
Tank containers |
|
|
|
|
|
|||
The cost, accumulated depreciation and net book value of the Company’s container leasing equipment by equipment type as of December 31, 2022 and 2021 were as follows:
|
|
2022 |
|
|
2021 |
|
||||||||||||||||||
|
|
Cost |
|
|
Accumulated |
|
|
Net Book |
|
|
Cost |
|
|
Accumulated |
|
|
Net Book |
|
||||||
Dry containers other than |
|
|
|
|
|
|
|
|
|
|
|
|
|
|
|
|
|
|
||||||
20' |
|
$ |
|
|
$ |
( |
) |
|
$ |
|
|
$ |
|
|
$ |
( |
) |
|
$ |
|
||||
40' |
|
|
|
|
|
( |
) |
|
|
|
|
|
|
|
|
( |
) |
|
|
|
||||
40' high cube |
|
|
|
|
|
( |
) |
|
|
|
|
|
|
|
|
( |
) |
|
|
|
||||
45' high cube |
|
|
|
|
|
( |
) |
|
|
|
|
|
|
|
|
( |
) |
|
|
|
||||
Refrigerated containers: |
|
|
|
|
|
|
|
|
|
|
|
|
|
|
|
|
|
|
||||||
20' |
|
|
|
|
|
( |
) |
|
|
|
|
|
|
|
|
( |
) |
|
|
|
||||
20' high cube |
|
|
|
|
|
( |
) |
|
|
|
|
|
|
|
|
( |
) |
|
|
|
||||
40' high cube |
|
|
|
|
|
( |
) |
|
|
|
|
|
|
|
|
( |
) |
|
|
|
||||
Open top and flat rack |
|
|
|
|
|
|
|
|
|
|
|
|
|
|
|
|
|
|
||||||
20' folding flat |
|
|
|
|
|
( |
) |
|
|
|
|
|
|
|
|
( |
) |
|
|
|
||||
40' folding flat |
|
|
|
|
|
( |
) |
|
|
|
|
|
|
|
|
( |
) |
|
|
|
||||
20' open top |
|
|
|
|
|
( |
) |
|
|
|
|
|
|
|
|
( |
) |
|
|
|
||||
40' open top |
|
|
|
|
|
( |
) |
|
|
|
|
|
|
|
|
( |
) |
|
|
|
||||
Tank containers |
|
|
|
|
|
( |
) |
|
|
|
|
|
|
|
|
( |
) |
|
|
|
||||
Total Containers |
|
$ |
|
|
$ |
( |
) |
|
$ |
|
|
$ |
|
|
$ |
( |
) |
|
$ |
|
||||
See Note 2 “Managed Container Fleet” for information on the managed fleet containers included above.
Impairment of Container Leasing Equipment
The Company reviews its container leasing equipment for impairment whenever events or circumstances indicate that the carrying amount of such assets may not be recoverable. The Company compares the carrying value of the container leasing equipment to the expected future undiscounted cash flows for the purpose of assessing the recoverability of the recorded amounts. If the carrying value exceeds expected future undiscounted
F-17
cash flows, the assets are reduced to fair value. There was
Write-Off (Recoveries) of Container Leasing Equipment due to Lessees in Default
The Company evaluates the recoverability of the recorded amounts of container leasing equipment that are unlikely to be recovered from lessees in default. The Company recorded impairment charges during the years ended December 31, 2022, 2021 and 2020 of $
Impairment of Containers Held for Sale
Containers identified as being available for sale are valued at the lower of carrying value or fair value, less costs to sell. The Company records impairment to write-down the value of containers held for sale to their estimated fair value, less cost to sell, under observable (Level 2) market inputs. The fair value was estimated based on recent gross sales proceeds for sales of similar types of containers in the locations in which the containers are stored. When containers are sold or otherwise retired, the cost and related accumulated depreciation are removed, and any resulting gain or loss is recognized.
Subsequent additions or reductions to the fair values of these written down assets are recorded as adjustments to the carrying value of the containers held for sale. The carrying value of containers held for sale that have been impaired and written down to their estimated fair value less cost to sell was $
During the years ended December 31, 2022, 2021 and 2020, the Company recorded the following net gain on sale of containers, included in “gain on sale of owned fleet containers, net” in the consolidated statements of operations:
|
2022 |
|
|
2021 |
|
|
2020 |
|
|
|||||||||||||||
|
Units |
|
|
Amount |
|
|
Units |
|
|
Amount |
|
|
Units |
|
|
Amount |
|
|
||||||
Gain on sale of previously written |
|
|
|
$ |
|
|
|
|
|
$ |
|
|
|
|
|
$ |
|
|
||||||
Gain on sale of owned fleet |
|
|
|
|
|
|
|
|
|
|
|
|
|
|
|
|
|
|
||||||
Gain on sale of owned fleet |
|
|
|
$ |
|
|
|
|
|
$ |
|
|
|
|
|
$ |
|
|
||||||
Gain on sale of owned fleet containers, net
The Company also generally sells containers at the end of their useful lives or when it is financially attractive to do so. The gain on sale of owned fleet containers is the excess of the sale price over the carrying value for these units at the time of sale. Revenue is recorded when control of the containers is transferred to the customer, which typically occurs upon delivery to, or pick-up by, the customer and when collectability is reasonably assured.
F-18
Gain on sale of owned fleet containers, net, also includes gains (losses) recognized at the inception of sales-type leases of our owned fleet, representing the excess (deficiency) of the estimated fair value of containers placed on sales-type leases over (below) their book value.
One of the Company’s customers became bankrupt in 2019. In 2021, the bankruptcy settlement agreement related to the restructuring of the previously insolvent customer was finalized. As a result of the assessment of the previously insolvent customer’s restructuring and successful exit from bankruptcy, the Company recorded a container loss recovery of $
The Company uses the asset and liability method to account for income taxes. Deferred tax assets and liabilities are recognized for the future tax consequences attributable to differences between the financial statement carrying amounts of existing assets and liabilities and their respective tax bases and operating loss. Deferred tax assets and liabilities are measured using enacted tax rates expected to apply to taxable income in the years in which those temporary differences are expected to be recovered or settled. The effect on deferred tax assets and liabilities of a change in the tax rates is recognized in income in the period that includes the enactment date. A valuation allowance is recorded when the realization of a deferred tax asset is deemed to be unlikely.
The Company also accounts for income tax positions only if those positions are more likely than not of being sustained. Recognized income tax positions are measured at the largest amount that is greater than
The Company records interest and penalties related to unrecognized tax benefits in income tax expense.
The Company capitalizes costs directly associated with the issuance or modification of its debt and the balance of the debt issuance costs, net of amortization, are netted against the debt recorded in the consolidated balance sheets.
Debt issuance costs are amortized using the interest rate method and the straight-line method over the general terms of the related fixed principal payment debt and the related revolving debt facilities, respectively, and the amortization is recorded as “interest expense” in the consolidated statements of operations. In 2022, 2021 and 2020, debt issuance costs of $
The Company has entered into various interest rate swap agreements to mitigate its exposure associated with its variable rate debt. The swap agreements involve payments by the Company to counterparties at fixed rates in return for receipts based upon variable rates indexed to the Secured Overnight Financing Rate (“SOFR”), which was the Company’s replacement rate due to London Inter Bank Offered Rate (“LIBOR”) transition. The fair value of the derivative instruments is measured at each balance sheet date and is reflected on a gross basis on the
F-19
consolidated balance sheets. The Company establishes criteria for both the designation and effectiveness of hedging activities. A derivative instrument qualifies for hedge accounting if the Company expects it to be highly effective in offsetting the underlying hedged exposure and the Company fulfills the hedge documentation requirements. Formal hedge documentation is prepared for all derivative instruments designated as hedges, including a description of the hedged item, the hedging instrument, and the risk being hedged. As of December 31, 2022 and 2021, all of the Company’s derivative instruments are designated as cash flow hedges for accounting purposes (see Note 8 “Derivative Instruments” for further discussions).
The Company estimates the fair value of all employee share options, restricted share units (“RSU”) and performance restricted share units (“PSU”) awarded under its 2019 Share Incentive Plan (the “2019 Plan”) on the grant date. The Company uses the Black-Scholes-Merton (“Black-Scholes”) option-pricing model to determine the estimated fair value for share options. The Company uses the fair market value of the Company’s common shares on the grant date, discounted for estimated dividends that will not be received by the employees during the vesting period, for determining the estimated fair value for time based RSUs. For PSUs or market based restricted share units that were granted with a market condition, the Company uses the Monte-Carlo simulation valuation model. See Note 11 “Share-Based Compensation” for further discussions.
The Company discloses the effect of its foreign currency translation adjustment, change in fair value of cash flow hedging derivative instruments, and reclassification of realized gain or loss on cash flow hedging instruments as components of “other comprehensive income” in the Company’s consolidated statements of comprehensive income.
Fair value represents the price that would be received to sell the asset or paid to transfer the liability in an orderly transaction between market participants at the measurement date. The Company utilizes a fair value hierarchy that prioritizes the inputs to valuation techniques used to measure fair value into three broad levels. The following is a brief description of those levels:
F-20
As of December 31, 2022 and 2021, the carrying amounts of cash and cash equivalents, restricted cash, accounts receivable and payable, due from affiliates, net, container contracts payable, and due to container investors, net, approximate their fair values due to the short-term nature of these financial instruments. See Note 1 (m) “Containers”, Note 4 “Leases”, Note 7 “Debt” and Note 8 “Derivative Instruments” for further discussions on fair value of containers held for sale, fair value of net investment in finance leases and container leaseback financing receivable, fair value of debt, and fair value of derivative instruments, respectively.
Fair Value of Marketable Equity Securities
Certain prior period amounts for the years ended December 31, 2021 and 2020 have been reclassified to conform to the current period presentation as discussed below:
The changes in the presentation have no impact on “total lease rental income”, “total operating expenses”, and “net income”.
In March 2020, the FASB issued Accounting Standards Update No. 2020-04, Reference Rate Reform (“Topic 848”): Facilitation of the Effects of Reference Rate Reform on Financial Reporting (“ASU 2020-04”). In January 2021, the FASB also issued Accounting Standards Update No 2021-01, Reference Rate Reform: Scope (“ASU 2021-01”), which expands the scope of Topic 848. In December 2022, the FASB also issued Accounting Standards Update No 2022-06, Reference Rate Reform: Deferral of the Sunset Date of Topic 848 (“ASU 2022-06”), which defers the sunset date from December 31, 2022 to December 31, 2024. The amendments provide optional guidance for a limited time to ease the potential burden in accounting for reference rate reform. As of December 31, 2022, the Company completed its amendment of all variable rate debt agreements and interest rate swap contracts due to replacement of LIBOR to SOFR. The adoption of this guidance did not have an impact on the Company’s consolidated financial statements.
In July 2021, the FASB issued Accounting Standards Update No. 2021-05, Leases (Topic 842), Lessors – Certain Leases with Variable Lease Payments (“ASU 2021-05”). The amendment provides guidance to clarify
F-21
lessor’s accounting for certain leases with variable lease payments by amending the lessor lease classification requirements under Topic 842. ASU 2021-05 requires a lessor to classify and account for a lease with variable lease payments that do not depend on a reference index or a rate as an operating lease if both of the following criteria are met: 1) The lease would have been classified as a sales-type lease or a direct financing lease in accordance with the classification criteria in Topic 842; and 2) The lessor would have otherwise recognized a day-one loss. The Company adopted ASU 2021-05 effective January 1, 2022 on a prospective basis. Based on the nature of the Company’s finance leases, the adoption of this guidance did not have an impact on the Company’s consolidated financial statements.
In March 2022, the FASB issued Accounting Standards Update No. 2022-02, Financial Instruments – Credit Losses (Topic 326), Troubled Debt Restructurings and Vintage Disclosures (“ASU 2022-02”). The amendment eliminates the accounting guidance for troubled debt restructurings by creditors in Topic 310 - Receivables and amends the disclosure requirements for restructurings involving borrowers that are experiencing financial difficulty under ASU 2016-13, Financial Instruments – Credit Losses (Topic 326), Measurement of Credit Losses on Financial Instruments, which was adopted by the Company on the effective date of January 1, 2020. ASU 2022-02 requires disclosure of current period gross write-offs by year of origination for financing receivables and net investment in finance leases and must be included in the vintage disclosure of the amortized cost basis of financing receivables and net investment in finance leases by credit quality indicator and by year of origination as required by ASU 2016-13. ASU 2022-02 is effective for fiscal years beginning after December 15, 2022, with early adoption permitted. The Company will adopt ASU 2022-02 effective January 1, 2023 on a prospective basis and expects no impact on the Company’s consolidated financial statements other than the enhanced disclosure requirements.
(2) Managed Container Fleet
As part of the Company’s on-going business operation, the Company from time to time purchases containers on behalf of Container Investors. The Company enters into management agreements with the Container Investors whereby the Company, as agent for the Container Investors, purchases and leases out these containers and manages all of the Container Investors’ rights and obligations in respect of such containers and leases. The acquisition of these containers is funded entirely by the Container Investors and all risks and rewards of ownership of these containers vest and remain exclusively with the Container Investors. The Container Investors have no rights or recourse against the Company in the event of physical loss or damage, failure to lease out, any lessee default or any other risk in respect of the containers.
The Container Investors pay the Company an acquisition fee for acquiring containers on their behalf at the time of acquisition and a fee for management services, including services associated with ultimately disposing of the containers on behalf of the Container Investors.
Lease rental income and expenses from the managed fleet owned by Container Investors are reported on a gross basis. Lease rental income from managed fleet represents rental charges billed to the ultimate lessees for the managed fleet, including charges for handling fees, drop-off charges, pick-up charges, and charges for a damage protection plan that is set forth in the leases.
Management fees from non-leasing services are earned for acquiring new managed containers and sales commissions are earned from sales of the managed containers on behalf of the Container Investors, which are generally calculated as a fixed percentage of the cost of the managed containers purchased and the proceeds from the sale of the managed containers, respectively.
Under the Company’s fleet management agreements for managed containers, the Company is responsible for providing the leasing services to the customers and responsible for directing and integrating third-party vendors to fulfill its performance obligations. Therefore, it was determined that the management agreements with these Container Investors are deemed to convey to the Company the right to control the use of the managed containers and are therefore accounted for as a lease. See Note 1 (f) “Accounting Policies and Recent Accounting Pronouncements – Revenue Recognition” for further information.
F-22
Containers - December 31, 2018 and Prior
Distribution expense to managed fleet container investors represents direct container expenses of the managed containers and the amounts distributed to the Container Investors, reduced by associated lease management fees earned and retained by the Company.
Managed containers in the Company’s managed fleet on or before December 31, 2018 are not included in the Company’s container leasing equipment in the Company’s consolidated balance sheet as of December 31, 2022 and 2021.
Container Purchases On or After January 1, 2019
Distribution expense to managed fleet container investors represents direct container expenses of the managed containers.
From an accounting perspective, in accordance with Topic 842 - Leases which was effective January 1, 2019 for the Company and under the management arrangements, the Company is deemed to control the containers owned by the Container Investors before they are leased out. Furthermore, the deemed leaseback is considered a sales-type lease under Topic 842, with the Company as lessee and the Container Investors as lessors.
The Company is deemed to own certain of the managed containers purchased by the Company on or after January 1, 2019 for and on behalf of Container Investors, notwithstanding the contractual management relationship which the Company has with the Container Investors. Accordingly, such managed containers are included in “containers, net” in the Company’s consolidated balance sheets as of December 31, 2022 and 2021 and depreciated using the straight-line method over their estimated useful lives to an estimated dollar residual value per the Company’s depreciation policy (see Note 1 (m) “Accounting Policies and Recent Accounting Pronouncements – Containers”). The purchase consideration paid by the Container Investors for such containers is reported as a deemed financial liability of the Company. Subsequent net operating income distributions made by the Company to the Container Investors are recorded as a reduction to the financial liability and as interest expense using the effective interest method. The net book value for these managed containers and the associated financial liability will reduce over time and will be removed upon container sale, irrespective of the amount realized in such sale.
As of December 31, 2022 and 2021, the Company’s container leaseback financial liability to the Container Investors amounted to $
The Company’s container leasing equipment includes such managed containers in the consolidated balance sheets as of December 31, 2022 and 2021, which consisted of the following:
|
|
2022 |
|
|
2021 |
|
||||||||||||||||||
|
|
Cost |
|
|
Accumulated |
|
|
Net Book |
|
|
Cost |
|
|
Accumulated |
|
|
Net Book |
|
||||||
Containers - owned fleet |
|
$ |
|
|
$ |
( |
) |
|
$ |
|
|
$ |
|
|
$ |
( |
) |
|
$ |
|
||||
Containers - managed fleet |
|
|
|
|
|
( |
) |
|
|
|
|
|
|
|
|
( |
) |
|
|
|
||||
Total containers |
|
$ |
|
|
$ |
( |
) |
|
$ |
|
|
$ |
|
|
$ |
( |
) |
|
$ |
|
||||
F-23
I
|
|
2022 |
|
|
2021 |
|
|
2020 |
|
|||
Lease rental income - managed fleet |
|
$ |
|
|
$ |
|
|
$ |
|
|||
Less: distribution expense to managed fleet |
|
|
( |
) |
|
|
( |
) |
|
|
( |
) |
Less: depreciation and interest expense on managed |
|
|
( |
) |
|
|
( |
) |
|
|
( |
) |
|
|
|
|
|
|
|
|
|
|
|||
Management fees from non-leasing services |
|
|
|
|
|
|
|
|
|
|||
Total |
|
$ |
|
|
$ |
|
|
$ |
|
|||
|
|
|
|
|
|
|
|
|
|
|||
The Company’s consolidated balance sheets also include the accounts receivable from the lessees of the managed fleet which are uncollected lease billings related to the containers managed by the Company for the Container Investors. Amounts billed under leases for the managed fleet (“sub-leases”) are recorded in accounts receivable with a corresponding credit to due to container investors. As sub-lessor, the Company is required to remit accounts receivable from lessees of the managed fleet to the Container Investors once paid in accordance with the terms of the management agreements. The Company’s consolidated balance sheets also include the prepaid expenses and accounts payable and accrued expenses related to the containers managed by the Company for the Container Investors.
|
|
2022 |
|
|
2021 |
|
||
Accounts receivable, net - owned fleet |
|
$ |
|
|
$ |
|
||
Accounts receivable, net - managed fleet |
|
|
|
|
|
|
||
Total accounts receivable, net |
|
$ |
|
|
$ |
|
||
|
|
|
|
|
|
|
||
Prepaid expenses and other current assets - owned fleet |
|
$ |
|
|
$ |
|
||
Prepaid expenses and other current assets - managed fleet |
|
|
|
|
|
|
||
Total prepaid expenses and other current assets |
|
$ |
|
|
$ |
|
||
|
|
|
|
|
|
|
||
Accounts payable and accrued expenses - owned fleet |
|
$ |
|
|
$ |
|
||
Accounts payable and accrued expenses - managed fleet |
|
|
|
|
|
|
||
Total accounts payable and accrued expenses |
|
$ |
|
|
$ |
|
||
|
|
|
|
|
|
|
||
Container contracts payable - owned fleet |
|
$ |
|
|
$ |
|
||
Total container contracts payable |
|
$ |
|
|
$ |
|
||
(3) Transactions with Affiliates and Container Investors
Due from affiliates, net of $
F-24
There was
|
|
2022 |
|
|
2021 |
|
||
Accounts receivable, net - managed fleet |
|
$ |
|
|
$ |
|
||
Prepaid expenses and other current assets - managed fleet |
|
|
|
|
|
|
||
Accounts payable and accrued expenses - managed fleet |
|
|
( |
) |
|
|
( |
) |
|
|
|
|
|
|
|
||
Distributions due to container investors on lease rentals collected, net of |
|
|
|
|
|
|
||
Due to container investors, net |
|
$ |
|
|
$ |
|
||
(4) Leases
The Company’s lease rental income during 2022, 2021 and 2020 were as follows:
|
2022 |
|
2021 |
|
2020 |
|
|||||||||||||||||||||
|
Owned |
|
Managed |
|
Total |
|
Owned |
|
Managed |
|
Total |
|
Owned |
|
Managed |
|
Total |
|
|||||||||
$ |
|
$ |
|
$ |
|
$ |
|
$ |
|
$ |
|
$ |
|
$ |
|
$ |
|
||||||||||
Interest income on net |
|
|
|
— |
|
|
|
|
|
|
— |
|
|
|
|
|
|
— |
|
|
|
||||||
Interest income on container |
|
|
|
— |
|
|
|
|
|
|
— |
|
|
|
|
|
|
— |
|
|
|
||||||
Variable lease revenue |
|
|
|
|
|
|
|
|
|
|
|
|
|
|
|
|
|
|
|||||||||
Total lease rental income |
$ |
|
$ |
|
$ |
|
$ |
|
$ |
|
$ |
|
$ |
|
$ |
|
$ |
|
|||||||||
Variable lease revenue includes other charges set forth in the leases, such as handling fees, pick-up and drop-off charges and charges for damage protection plan.
For finance leases, the net selling gain (loss) recognized at lease commencement, representing the difference between the estimated fair value of containers placed on these leases and their net book value, in the amount of $
Operating Leases
The following is a schedule, by year, of future minimum lease payments receivable under the long-term leases for the owned and managed container fleet as of December 31, 2022:
|
Owned |
|
|
Managed |
|
|
Total |
|
|||
Year ending December 31: |
|
|
|
|
|
|
|
|
|||
2023 |
$ |
|
|
$ |
|
|
$ |
|
|||
2024 |
|
|
|
|
|
|
|
|
|||
2025 |
|
|
|
|
|
|
|
|
|||
2026 |
|
|
|
|
|
|
|
|
|||
2027 |
|
|
|
|
|
|
|
|
|||
2028 and thereafter |
|
|
|
|
|
|
|
|
|||
Total future minimum lease payments receivable |
$ |
|
|
$ |
|
|
$ |
|
|||
F-25
Container Leaseback Financing Receivable
The Company’s container leaseback financing receivable pertains to containers purchased that were leased back to the seller-lessees through a sales-type leaseback arrangement that are accounted for as financing transactions.
The following table represents the components of the container leaseback financing receivable as of December 31, 2022 and 2021:
|
|
2022 |
|
|
2021 |
|
||
Future minimum payments receivable |
|
$ |
|
|
$ |
|
||
Less: unearned income |
|
|
( |
) |
|
|
( |
) |
Container leaseback financing receivable (1) |
|
|
|
|
|
|
||
Less: Allowance for credit losses |
|
|
( |
) |
|
|
( |
) |
Container leaseback financing receivable, net (2) |
|
$ |
|
|
$ |
|
||
Amounts due within one year |
|
|
|
|
|
|
||
Amounts due beyond one year |
|
|
|
|
|
|
||
Container leaseback financing receivable, net |
|
$ |
|
|
$ |
|
||
Net Investment in Finance Leases
The following table represents the components of the net investment in finance leases as of December 31, 2022 and 2021:
|
|
2022 |
|
|
2021 |
|
||
Future minimum lease payments receivable |
|
$ |
|
|
$ |
|
||
Residual value of containers |
|
|
|
|
|
|
||
Less: unearned income |
|
|
( |
) |
|
|
( |
) |
Net investment in finance leases (1) |
|
|
|
|
|
|
||
Less: Allowance for credit losses |
|
|
( |
) |
|
|
( |
) |
Net investment in finance leases, net (2) |
|
$ |
|
|
$ |
|
||
Amounts due within one year |
|
|
|
|
|
|
||
Amounts due beyond one year |
|
|
|
|
|
|
||
Net investment in finance leases, net |
|
$ |
|
|
$ |
|
||
(1)
(2)
F-26
The following is a schedule by year of future minimum lease payments receivable under container leaseback financing receivable and net investment in finance leases as of December 31, 2022:
Year ending December 31: |
Container Leaseback Financing Receivable |
|
Net Investment in Finance Leases |
|
Total |
|
|||
2023 |
$ |
|
$ |
|
$ |
|
|||
2024 |
|
|
|
|
|
|
|||
2025 |
|
|
|
|
|
|
|||
2026 |
|
|
|
|
|
|
|||
2027 |
|
|
|
|
|
|
|||
2028 and thereafter |
|
|
|
|
|
|
|||
Total future minimum lease payments receivable |
$ |
|
$ |
|
$ |
|
|||
Right-of-use (“ROU”) lease assets and lease liabilities are recognized for the Company’s office space leases at the commencement date based on the present value of lease payments over the lease term. The Company does not recognize a related ROU asset and lease liability for short-term leases having a lease term of twelve months or less. As of December 31, 2022 and 2021, ROU operating lease assets amounted to $
Operating lease expense is recognized on a straight-line basis over the lease term and is reported in “general and administrative expense” in the consolidated statements of operations.
|
|
2022 |
|
|
2021 |
|
|
2020 |
|
|||
Operating lease cost |
|
$ |
|
|
$ |
|
|
$ |
|
|||
Short-term and variable lease cost |
|
|
|
|
|
|
|
|
|
|||
Total rent expense |
|
$ |
|
|
$ |
|
|
$ |
|
|||
|
|
|
|
|
|
|
|
|
|
|||
Cash paid for amounts included in the measurement of lease liabilities |
|
$ |
|
|
$ |
|
|
$ |
|
|||
|
|
|
|
|
|
|
|
|
|
|||
Future minimum lease payment obligations under the Company’s noncancelable operating leases at December 31, 2022 were as follows:
|
|
|
||
Year ending December 31: |
|
|
|
|
2023 |
|
$ |
|
|
2024 |
|
|
|
|
2025 |
|
|
|
|
2026 |
|
|
|
|
2027 |
|
|
|
|
2028 and thereafter |
|
|
— |
|
Total minimum lease payments |
|
|
|
|
Less imputed interest |
|
|
( |
) |
Total present value of operating lease liabilities |
|
$ |
|
|
F-27
(5) Allowance for Credit Losses
The Company’s allowance for credit losses is estimated based on historical losses, current economic conditions, and ongoing review of the credit worthiness, but not limited to, each lessee’s payment history, lessee credit ratings, management’s current assessment of each lessee’s financial condition and the recoverability.
Accounts Receivable
The allowance for credit losses included in accounts receivable, net, amounted to $
Net Investment in Finance Leases and Container Leaseback Financing Receivable
The allowance for credit losses related to unbilled amounts under finance leases and included in net investment in finance leases, net, amounted to $
As of December 31, 2022, the Company’s net investment in finance leases and container leaseback financing receivable are primarily comprised of the largest shipping lines under “Tier 1” risk rating which represented
The following table presents the net investment in finance leases and container leaseback financing receivable by internal credit rating category and year of origination as of December 31, 2022:
|
Year Ended December 31, 2022 |
|
2021 |
|
2020 |
|
2019 |
|
2018 |
|
Prior |
|
Total |
|
|||||||
Tier 1 |
$ |
|
$ |
|
$ |
|
$ |
|
$ |
|
$ |
|
$ |
|
|||||||
Tier 2 |
|
|
|
|
|
|
|
|
|
|
|
|
|
|
|||||||
Tier 3 |
|
|
|
|
|
|
|
|
|
|
|
|
|
|
|||||||
Net investment in finance leases |
$ |
|
$ |
|
$ |
|
$ |
|
$ |
|
$ |
|
$ |
|
|||||||
|
|
|
|
|
|
|
|
|
|
|
|
|
|
|
|||||||
Tier 1 |
$ |
|
$ |
|
$ |
|
$ |
|
$ |
— |
|
$ |
— |
|
$ |
|
|||||
Tier 2 |
|
— |
|
|
|
|
— |
|
|
|
|
— |
|
|
— |
|
|
|
|||
Container leaseback financing receivable |
$ |
|
$ |
|
$ |
|
$ |
|
$ |
— |
|
$ |
— |
|
$ |
|
|||||
(6) Income Taxes
The Company is not subject to taxation in its country of incorporation; however, the Company is subject to taxation in certain other jurisdictions due to the nature of the Company’s operations.
|
|
2022 |
|
|
2021 |
|
|
2020 |
|
|||
Current |
|
|
|
|
|
|
|
|
|
|||
Bermuda |
|
$ |
|
|
$ |
|
|
$ |
|
|||
Foreign |
|
|
|
|
|
|
|
|
|
|||
|
|
|
|
|
|
|
|
|
|
|||
Deferred |
|
|
|
|
|
|
|
|
|
|||
Bermuda |
|
|
|
|
|
|
|
|
|
|||
Foreign |
|
|
|
|
|
|
|
|
( |
) |
||
|
|
|
|
|
|
|
|
|
( |
) |
||
|
|
$ |
|
|
$ |
|
|
$ |
( |
) |
||
F-28
The components of income before income taxes and noncontrolling interest were as follows:
|
|
2022 |
|
|
2021 |
|
|
2020 |
|
|||
Bermuda sources |
|
$ |
— |
|
|
$ |
— |
|
|
$ |
— |
|
Foreign sources |
|
|
|
|
|
|
|
|
|
|||
|
|
$ |
|
|
$ |
|
|
$ |
|
|||
A reconciliation of the differences between the Bermuda statutory income tax rate and the effective tax rate as provided in the consolidated statements of operations is as follows:
|
|
2022 |
|
|
2021 |
|
|
2020 |
|
|||||||||||||||
Bermuda tax rate |
|
$ |
— |
|
|
|
% |
|
$ |
— |
|
|
|
% |
|
$ |
— |
|
|
|
% |
|||
Foreign tax rate |
|
|
|
|
|
% |
|
|
|
|
|
% |
|
|
( |
) |
|
|
( |
)% |
||||
Tax uncertainties |
|
|
|
|
|
% |
|
|
|
|
|
% |
|
|
|
|
|
% |
||||||
|
|
$ |
|
|
|
% |
|
$ |
|
|
|
% |
|
$ |
( |
) |
|
|
( |
)% |
||||
The components of income tax expense and effective tax rate were as follows:
|
|
2022 |
|
|
2021 |
|
|
2020 |
|
|||||||||||||||
Income before income tax and noncontrolling interests |
|
$ |
|
|
|
|
|
$ |
|
|
|
|
|
$ |
|
|
|
|
||||||
|
|
|
|
|
|
|
|
|
|
|
|
|
|
|
|
|
|
|
||||||
Tax uncertainties |
|
$ |
|
|
|
% |
|
$ |
|
|
|
% |
|
$ |
|
|
|
% |
||||||
Foreign taxes |
|
|
|
|
|
|
|
|
|
|
|
|
|
|
|
|
|
|
||||||
Stock base compensation |
|
|
( |
) |
|
|
( |
)% |
|
|
( |
) |
|
|
( |
)% |
|
|
( |
) |
|
|
( |
)% |
162(m) officers' compensation |
|
|
|
|
|
% |
|
|
|
|
|
% |
|
|
|
|
|
% |
||||||
Adjustment for prior years |
|
|
|
|
|
% |
|
|
( |
) |
|
|
( |
)% |
|
|
|
|
|
% |
||||
Foreign derived intangible income |
|
|
( |
) |
|
|
( |
)% |
|
|
( |
) |
|
|
( |
)% |
|
|
( |
) |
|
|
( |
)% |
Valuation allowance |
|
|
— |
|
|
|
— |
|
|
|
( |
) |
|
|
( |
)% |
|
|
|
|
|
% |
||
Foreign rate difference |
|
|
|
|
|
% |
|
|
|
|
|
% |
|
|
( |
) |
|
|
( |
)% |
||||
Other |
|
|
( |
) |
|
|
( |
)% |
|
|
|
|
|
% |
|
|
|
|
|
% |
||||
|
|
|
|
|
|
% |
|
|
|
|
|
% |
|
|
( |
) |
|
|
( |
)% |
||||
|
|
$ |
|
|
|
% |
|
$ |
|
|
|
% |
|
$ |
( |
) |
|
|
( |
)% |
||||
The tax effects of temporary differences that give rise to significant portions of the deferred tax assets and deferred tax liabilities at December 31, 2022 and 2021 are presented below:
|
|
2022 |
|
|
2021 |
|
||
Deferred tax assets |
|
|
|
|
|
|
||
Net operating loss carryforwards |
|
$ |
|
|
$ |
|
||
Other |
|
|
( |
) |
|
|
|
|
|
|
|
|
|
|
|
||
Valuation allowance |
|
|
— |
|
|
|
— |
|
Deferred tax assets |
|
|
|
|
|
|
||
Deferred tax liabilities |
|
|
|
|
|
|
||
Containers, net |
|
|
|
|
|
|
||
Other |
|
|
— |
|
|
|
— |
|
Deferred tax liabilities |
|
|
|
|
|
|
||
Net deferred tax liabilities |
|
$ |
|
|
$ |
|
||
F-29
In assessing the extent to which deferred tax assets are realizable, the Company’s management considers whether it is more likely than not that the deferred tax assets will be realized. The ultimate realization of deferred tax assets is dependent upon the generation of future taxable income during the periods in which those temporary differences become deductible. The Company’s management considers the projected future reversal of taxable temporary items for making this assessment. Based upon the projections for the reversal of taxable temporary items over the periods in which the deferred tax assets are deductible, as well as the estimated usage of deferred tax assets to offset against 2022 and 2021 taxable income, the Company’s management believes it is more likely than not the Company will realize the benefits of these deductible differences in 2022 and 2021, thus
On March 27, 2020, the U.S. government enacted the Coronavirus Aid, Relief and Economic Security Act ("CARES Act"). The enactment of the CARES Act does not result in any material adjustments to the Company’s provision for income taxes.
The Company has U.S. federal net operating loss carry-forwards of $
The accompanying consolidated financial statements do not reflect the income taxes that would be payable to foreign taxing jurisdictions if the earnings of a group of corporations operating in those jurisdictions were to be transferred out of such jurisdictions, because such earnings are intended to be permanently reinvested in those countries. At December 31, 2022, cumulative earnings of approximately $
The Company’s foreign tax returns, including the United States, State of California, State of New Jersey, State of Texas, Malaysia, Singapore, and United Kingdom, are subject to examination by the various tax authorities. The Company’s foreign tax returns are no longer subject to examinations by taxing authorities for years before 2015, except for its United States and State of California tax returns which are no longer subject to examinations for years before 2011 and 2008, respectively.
A reconciliation of the beginning and ending unrecognized tax benefit amounts for 2022 and 2021 are as follows:
Balance at December 31, 2020 |
|
$ |
|
|
Increases related to prior year tax positions |
|
|
|
|
Increases related to current year tax positions |
|
|
|
|
Lapse of statute of limitations |
|
|
( |
) |
Balance at December 31, 2021 |
|
$ |
|
|
Decreases related to prior year tax positions |
|
|
( |
) |
Increases related to current year tax positions |
|
|
|
|
Lapse of statute of limitations |
|
|
( |
) |
Balance at December 31, 2022 |
|
$ |
|
F-30
If the unrecognized tax benefits of $
Interest and penalty expense recorded during 2022, 2021 and 2020 amounted to $
(7) Debt
The following represents the Company’s debt obligations as of December 31, 2022 and 2021:
|
2022 |
|
2021 |
|
|
||||||||
|
Outstanding |
|
Average Interest |
|
Outstanding |
|
Average Interest |
|
Final Maturity |
||||
TL Revolving Credit Facility |
$ |
|
|
% |
$ |
|
|
% |
|||||
TL 2019 Term Loan |
|
|
|
% |
|
|
|
% |
|||||
TL 2021-1 Term loan |
|
|
|
% |
|
|
|
% |
|||||
TL 2021-2 Term Loan |
|
|
|
% |
|
|
|
% |
|||||
TMCL II Secured Debt Facility (1) |
|
|
|
% |
|
|
|
% |
|||||
TMCL VII 2020-1 Bonds |
|
|
|
% |
|
|
|
% |
|||||
TMCL VII 2020-2 Bonds |
|
|
|
% |
|
|
|
% |
|||||
TMCL VII 2020-3 Bonds |
|
|
|
% |
|
|
|
% |
|||||
TMCL VII 2021-1 Bonds |
|
|
|
% |
|
|
|
% |
|||||
TMCL VII 2021-2 Bonds |
|
|
|
% |
|
|
|
% |
|||||
TMCL VII 2021-3 Bonds |
|
|
|
% |
|
|
|
% |
|||||
Total debt outstanding (2) |
|
|
|
|
|
|
|
|
|
||||
Unamortized debt premiums and discounts |
|
( |
) |
|
|
|
( |
) |
|
|
|
||
Debt, net of unamortized costs |
$ |
|
|
|
$ |
|
|
|
|
||||
Debt, net of unamortized costs - current |
$ |
|
|
|
$ |
|
|
|
|
||||
Debt, net of unamortized costs - non-current |
$ |
|
|
|
$ |
|
|
|
|
||||
F-31
The Company hedges the risks associated with fluctuations in interest rates on a portion of its floating-rate debt by entering into interest rate swap agreements that convert a portion of its floating-rate debt to a fixed rate basis, thereby reducing the impact of interest rate changes on future interest expense.
|
Balance Outstanding |
|
Contractual Weighted Average Interest Rate |
|
Excluding impact of derivative instruments: |
|
|
|
|
Fixed-rate debt |
$ |
|
||
Floating-rate debt |
|
|
||
|
|
|
|
|
Including impact of derivative instruments: |
|
|
|
|
Fixed-rate debt |
|
|
||
Hedged floating-rate debt |
|
|
||
Total fixed and hedged debt |
|
|
||
Unhedged floating-rate debt |
|
|
||
Total |
$ |
|
||
The Company’s debt facilities are secured by specific pools of containers and related assets owned by the Company. The Company’s debt agreements contain various restrictive financial and other covenants related to leverage, interest coverage, fixed charge coverage, container sales proceeds ratio, net income and debt levels and consolidated tangible net worth, including limitations on certain liens, indebtedness and investments. TL's revolving credit facility and term loans also contain limitation on loan and dividend payment to TGH. All of the Company’s debt facilities contain restrictive covenants on borrowing base minimums.
Under the terms of the debt agreements, the total outstanding principal may not exceed an amount that is calculated as the total of the eligible containers designated to the respective facility multiplied by a certain advance rate, plus the restricted cash amount (the “Asset Base”). For secured debt and revolving credit facilities, the total outstanding principal may not exceed the lesser of the commitment amount or the Asset Base. TGH and its subsidiaries were in compliance with these restrictive covenants as of December 31, 2022.
Secured Debt Facility
TMCL II has a securitization facility (the “TMCL II Secured Debt Facility”) that provides for an aggregate commitment amount of up to $
The TMCL II Secured Debt Facility has a conversion date and final maturity date of and , respectively, with interest rate during the revolving period of daily SOFR plus a spread of
Revolving Credit Facility
TL has a revolving credit facility (the “TL Revolving Credit Facility”) that provides for an aggregate commitment amount of up to $
In August 2022, TL entered into an amendment of the TL Revolving Credit Facility which increased the aggregate commitment amount from $
The TL Revolving Credit Facility contains cross default provisions that may result in an acceleration of principal repayment under the debt facility if an uncured default condition were to exist. TGH acts as an unconditional guarantor of the TL Revolving Credit Facility.
F-32
Term Loans
TL 2019 Term Loan. TL has a $
TL 2021-1 Term Loan. TL has a $
TL 2021-2 Term Loan. TL has a $
The TL Term Loans contain cross default provisions that may result in an acceleration of principal repayment under the debt facility if an uncured default condition were to exist. TGH acts as an unconditional guarantor of the TL Term Loans.
Bonds Payable
TMCL VII 2020-1 Bonds. TMCL VII issued $
TMCL VII 2020-2 Bonds. TMCL VII issued $
TMCL VII 2020-3 Bonds. TMCL VII issued $
TMCL VII 2021-1 Bonds. TMCL VII issued $
TMCL VII 2021-2 Bonds. TMCL VII issued $
TMCL VII 2021-3 Bonds. TMCL VII issued $
F-33
Estimated Future Principal Payments
The following is a schedule of future scheduled repayments, by year, and borrowing capacities, as of December 31, 2022:
|
Twelve months ending December 31, |
|
Available |
|
Current |
|
|||||||||||||||||||||
|
2023 |
|
2024 |
|
2025 |
|
2026 |
|
2027 |
|
2028 and |
|
Total |
|
as limited by the |
|
as limited by the |
|
|||||||||
TL Revolving Credit Facility |
$ |
— |
|
$ |
— |
|
$ |
|
$ |
|
$ |
|
$ |
— |
|
$ |
|
$ |
|
$ |
|
||||||
TL 2019 Term Loan |
|
|
|
|
|
|
|
|
|
— |
|
|
— |
|
|
|
|
— |
|
|
|
||||||
TL 2021-1 Term loan |
|
|
|
|
|
|
|
|
|
|
|
|
|
|
|
— |
|
|
|
||||||||
TL 2021-2 Term Loan |
|
|
|
|
|
|
|
|
|
|
|
|
|
|
|
— |
|
|
|
||||||||
TMCL II Secured Debt Facility (1) |
|
|
|
|
|
|
|
|
|
|
|
|
|
|
|
|
|
|
|||||||||
TMCL VII 2020-1 Bonds (2) |
|
|
|
|
|
|
|
|
|
|
|
|
|
|
|
— |
|
|
|
||||||||
TMCL VII 2020-2 Bonds (2) |
|
|
|
|
|
|
|
|
|
|
|
|
|
|
|
— |
|
|
|
||||||||
TMCL VII 2020-3 Bonds (2) |
|
|
|
|
|
|
|
|
|
|
|
|
|
|
|
— |
|
|
|
||||||||
TMCL VII 2021-1 Bonds (2) |
|
|
|
|
|
|
|
|
|
|
|
|
|
|
|
— |
|
|
|
||||||||
TMCL VII 2021-2 Bonds (2) |
|
|
|
|
|
|
|
|
|
|
|
|
|
|
|
— |
|
|
|
||||||||
TMCL VII 2021-3 Bonds (2) |
|
|
|
|
|
|
|
|
|
|
|
|
|
|
|
— |
|
|
|
||||||||
Total (3) |
$ |
|
$ |
|
$ |
|
$ |
|
$ |
|
$ |
|
$ |
|
$ |
|
$ |
|
|||||||||
(8) Derivative Instruments
The Company has entered into several derivative agreements with several banks to reduce the impact of changes in interest rates associated with its variable rate debt. Interest rate swap agreements involve payments by the Company to counterparties at fixed rate interest payments in return for receipts based on floating-rate amounts. The Company has also utilized forward starting interest rate swap agreements to reduce the impact of interest rate changes on anticipated future debt issuances. The Company has also utilized interest rate cap agreements, which place a ceiling on the Company’s exposure to rising interest rates, to manage interest rate risk exposure.
The counterparties to the Company’s interest rate swap agreements are highly rated financial institutions. In the unlikely event that the counterparties fail to meet the terms of the interest rate swap agreements, the Company’s exposure is limited to the interest rate differential on the notional amount at each monthly settlement period over the life of the agreements. The Company monitors its counterparties’ credit ratings on an on-going basis and does not anticipate any non-performance by the counterparties. The Company does not have any master netting arrangements with its counterparties.
The Company has utilized the income approach to measure at each balance sheet date the fair value of its derivative instruments on a recurring basis using observable (Level 2) market inputs. This approach represents the present value of future cash flows based upon current market expectations. The Company presents the fair value of derivative instruments, which are inclusive of counterparty risk, on a gross basis as separate line items on the consolidated balance sheets.
During the year ended December 31, 2021, the Company early terminated a total notional amount of $
F-34
interest for the cancellation. As of December 31, 2022 and 2021, all of the Company’s interest rate swaps were designated as cash flow hedges for accounting purposes.
The following table summarizes the Company’s derivative instruments as of December 31, 2022:
|
|
Notional |
|
|
Derivative instruments |
|
amount |
|
|
Interest rate swap contracts with several banks that were indexed to daily SOFR, with fixed rates between - |
|
$ |
|
|
Interest rate cap contract with a bank that was indexed to daily SOFR, with fixed cap rate of |
|
|
|
|
Total notional amount as of December 31, 2022 (1) (2) |
|
$ |
|
|
The following table summarizes the fair value of derivative instruments on the consolidated balance sheets as of December 31, 2022 and 2021:
|
|
Fair Values of Derivative Instruments |
|
|
|
|
Assets (liabilities), net |
|
|
Balance at December 31, 2020 |
|
$ |
( |
) |
Change in derivative instruments designated as cash flow hedges |
|
|
|
|
Reclassification of realized loss on derivative instruments |
|
|
|
|
Unrealized gain on derivative instruments not designated as cash flow hedges |
|
|
|
|
Cash settlements on early termination on interest rate swaps not designated as |
|
|
|
|
Balance at December 31, 2021 |
|
|
|
|
Change in derivative instruments designated as cash flow hedges |
|
|
|
|
Reclassification of realized gain on derivative instruments |
|
|
( |
) |
Balance at December 31, 2022 |
|
$ |
|
|
Over the next twelve months, the Company expects to reclassify an estimated net gain of $
F-35
The following table summarizes the pre-tax impact of derivative instruments on the consolidated statements of operations and comprehensive income during the years ended December 31, 2022, 2021 and 2020:
|
|
|
|
2022 |
|
|
2021 |
|
|
2020 |
|
|||
Derivative instruments |
|
Financial Statement Line Item |
|
|
|
|
|
|
|
|
|
|||
Non-designated |
|
Realized loss on financial instruments, net |
|
$ |
— |
|
|
$ |
( |
) |
|
$ |
( |
) |
Non-designated |
|
Unrealized gain (loss) on financial instruments, net |
|
$ |
— |
|
|
$ |
|
|
$ |
( |
) |
|
Designated |
|
Other comprehensive income (loss) |
|
$ |
|
|
$ |
|
|
$ |
( |
) |
||
Designated |
|
Interest income (expense) |
|
$ |
|
|
$ |
( |
) |
|
$ |
( |
) |
|
(9) Segment Information
The Company operates in
|
|
Container |
|
|
Container |
|
|
Container |
|
|
|
|
|
|
|
|
|
|
||||||
2022 |
|
Ownership |
|
|
Management |
|
|
Resale |
|
|
Other |
|
|
Eliminations |
|
|
Totals |
|
||||||
Total lease rental income |
|
$ |
|
|
$ |
|
|
$ |
— |
|
|
$ |
— |
|
|
$ |
|
|
$ |
|
||||
Management fees - non-leasing |
|
$ |
— |
|
|
$ |
|
|
$ |
|
|
$ |
— |
|
|
$ |
— |
|
|
$ |
|
|||
Inter-segment management fees |
|
$ |
— |
|
|
$ |
|
|
$ |
|
|
$ |
— |
|
|
$ |
( |
) |
|
$ |
— |
|
||
Trading container margin |
|
$ |
— |
|
|
$ |
— |
|
|
$ |
|
|
$ |
— |
|
|
$ |
— |
|
|
$ |
|
||
Gain on sale of owned fleet |
|
$ |
|
|
$ |
— |
|
|
$ |
— |
|
|
$ |
— |
|
|
$ |
|
|
$ |
|
|||
Depreciation and amortization |
|
$ |
|
|
$ |
|
|
$ |
— |
|
|
$ |
— |
|
|
$ |
( |
) |
|
$ |
|
|||
Container lessee default expense, |
|
$ |
|
|
$ |
— |
|
|
$ |
— |
|
|
$ |
— |
|
|
$ |
— |
|
|
$ |
|
||
Interest expense |
|
$ |
|
|
$ |
|
|
$ |
— |
|
|
$ |
— |
|
|
$ |
— |
|
|
$ |
|
|||
Realized loss on financial |
|
$ |
— |
|
|
$ |
|
|
$ |
— |
|
|
$ |
— |
|
|
$ |
— |
|
|
$ |
|
||
Unrealized loss on financial |
|
$ |
— |
|
|
$ |
|
|
$ |
— |
|
|
$ |
— |
|
|
$ |
— |
|
|
$ |
|
||
Segment income (loss) before |
|
$ |
|
|
$ |
|
|
$ |
|
|
$ |
( |
) |
|
$ |
|
|
$ |
|
|||||
Income tax expense |
|
$ |
|
|
$ |
|
|
$ |
— |
|
|
$ |
— |
|
|
$ |
— |
|
|
$ |
|
|||
Total assets |
|
$ |
|
|
$ |
|
|
$ |
|
|
$ |
|
|
$ |
( |
) |
|
$ |
|
|||||
Purchase of containers and |
|
$ |
|
|
$ |
|
|
$ |
— |
|
|
$ |
— |
|
|
$ |
— |
|
|
$ |
|
|||
Payments on container leaseback |
|
$ |
|
|
$ |
— |
|
|
$ |
— |
|
|
$ |
— |
|
|
$ |
— |
|
|
$ |
|
||
F-36
|
|
Container |
|
|
Container |
|
|
Container |
|
|
|
|
|
|
|
|
|
|
||||||
2021 |
|
Ownership |
|
|
Management |
|
|
Resale |
|
|
Other |
|
|
Eliminations |
|
|
Totals |
|
||||||
Total lease rental income |
|
$ |
|
|
$ |
|
|
$ |
— |
|
|
$ |
— |
|
|
$ |
— |
|
|
$ |
|
|||
Management fees - non-leasing |
|
$ |
— |
|
|
$ |
|
|
$ |
|
|
$ |
— |
|
|
$ |
— |
|
|
$ |
|
|||
Inter-segment management fees |
|
$ |
— |
|
|
$ |
|
|
$ |
|
|
$ |
— |
|
|
$ |
( |
) |
|
$ |
— |
|
||
Trading container margin |
|
$ |
— |
|
|
$ |
— |
|
|
$ |
|
|
$ |
— |
|
|
$ |
— |
|
|
$ |
|
||
Gain on sale of owned fleet |
|
$ |
|
|
$ |
— |
|
|
$ |
— |
|
|
$ |
— |
|
|
$ |
— |
|
|
$ |
|
||
Depreciation and amortization |
|
$ |
|
|
$ |
|
|
$ |
— |
|
|
$ |
— |
|
|
$ |
( |
) |
|
$ |
|
|||
Container lessee default recovery, |
|
$ |
|
|
$ |
— |
|
|
$ |
— |
|
|
$ |
— |
|
|
$ |
— |
|
|
$ |
|
||
Interest expense |
|
$ |
|
|
$ |
|
|
$ |
— |
|
|
$ |
— |
|
|
$ |
— |
|
|
$ |
|
|||
Debt termination expense |
|
$ |
|
|
$ |
— |
|
|
$ |
— |
|
|
$ |
— |
|
|
$ |
— |
|
|
$ |
|
||
Realized loss on financial |
|
$ |
|
|
$ |
|
|
$ |
— |
|
|
$ |
— |
|
|
$ |
— |
|
|
$ |
|
|||
Unrealized gain (loss) on financial |
|
$ |
|
|
$ |
( |
) |
|
$ |
— |
|
|
$ |
— |
|
|
$ |
— |
|
|
$ |
|
||
Segment income (loss) before |
|
$ |
|
|
$ |
|
|
$ |
|
|
$ |
( |
) |
|
$ |
( |
) |
|
$ |
|
||||
Income tax expense |
|
$ |
|
|
$ |
|
|
$ |
— |
|
|
$ |
— |
|
|
$ |
— |
|
|
$ |
|
|||
Total assets |
|
$ |
|
|
$ |
|
|
$ |
|
|
$ |
|
|
$ |
( |
) |
|
$ |
|
|||||
Purchase of containers and |
|
$ |
|
|
$ |
|
|
$ |
— |
|
|
$ |
— |
|
|
$ |
— |
|
|
$ |
|
|||
Payments on container leaseback |
|
$ |
|
|
$ |
— |
|
|
$ |
— |
|
|
$ |
— |
|
|
$ |
— |
|
|
$ |
|
||
F-37
|
|
Container |
|
|
Container |
|
|
Container |
|
|
|
|
|
|
|
|
|
|
||||||
2020 |
|
Ownership |
|
|
Management |
|
|
Resale |
|
|
Other |
|
|
Eliminations |
|
|
Totals |
|
||||||
Total lease rental income |
|
$ |
|
|
$ |
|
|
$ |
— |
|
|
$ |
— |
|
|
$ |
— |
|
|
$ |
|
|||
Management fees - non-leasing |
|
$ |
|
|
$ |
|
|
$ |
|
|
$ |
— |
|
|
$ |
— |
|
|
$ |
|
||||
Inter-segment management fees |
|
$ |
— |
|
|
$ |
|
|
$ |
|
|
$ |
— |
|
|
$ |
( |
) |
|
$ |
— |
|
||
Trading container margin |
|
$ |
— |
|
|
$ |
— |
|
|
$ |
|
|
$ |
— |
|
|
$ |
— |
|
|
$ |
|
||
Gain on sale of owned fleet |
|
$ |
|
|
$ |
— |
|
|
$ |
— |
|
|
$ |
— |
|
|
$ |
— |
|
|
$ |
|
||
Depreciation and amortization |
|
$ |
|
|
$ |
|
|
$ |
— |
|
|
$ |
— |
|
|
$ |
( |
) |
|
$ |
|
|||
Container lessee default recovery, |
|
$ |
|
|
$ |
— |
|
|
$ |
— |
|
|
$ |
— |
|
|
$ |
— |
|
|
$ |
|
||
Interest expense |
|
$ |
|
|
$ |
|
|
$ |
— |
|
|
$ |
— |
|
|
$ |
— |
|
|
$ |
|
|||
Debt termination expense |
|
$ |
|
|
$ |
— |
|
|
$ |
— |
|
|
$ |
— |
|
|
$ |
— |
|
|
$ |
|
||
Realized loss on financial |
|
$ |
|
|
$ |
— |
|
|
$ |
— |
|
|
$ |
— |
|
|
$ |
— |
|
|
$ |
|
||
Unrealized loss on financial |
|
$ |
|
|
$ |
— |
|
|
$ |
— |
|
|
$ |
— |
|
|
$ |
— |
|
|
$ |
|
||
Segment income (loss) before |
|
$ |
|
|
$ |
|
|
$ |
|
|
$ |
( |
) |
|
$ |
( |
) |
|
$ |
|
||||
Income tax benefit (expense) |
|
$ |
|
|
$ |
( |
) |
|
$ |
— |
|
|
$ |
— |
|
|
$ |
|
|
$ |
|
|||
Total assets |
|
$ |
|
|
$ |
|
|
$ |
|
|
$ |
|
|
$ |
( |
) |
|
$ |
|
|||||
Purchase of containers and |
|
$ |
|
|
$ |
|
|
$ |
— |
|
|
$ |
— |
|
|
$ |
— |
|
|
$ |
|
|||
Payments on container leaseback |
|
$ |
|
|
$ |
— |
|
|
$ |
— |
|
|
$ |
— |
|
|
$ |
— |
|
|
$ |
|
||
General and administrative expenses are allocated to the reportable business segments based on direct overhead costs incurred by those segments. Amounts reported in the “Other” column represent activity unrelated to the active reportable business segments. Amounts reported in the “Eliminations” column represent inter-segment management fees between the Container Management and the Container Resale segments and the Container Ownership segment.
F-38
Geographic Segment Information
The Company’s container lessees use containers for their global trade utilizing many worldwide trade routes. The Company earns its revenue from international carriers when the containers are on hire. Substantially all of the Company’s leasing related revenue is denominated in U.S. dollars. As all of the Company’s containers are used internationally, where no single container is domiciled in one particular place for a prolonged period of time, all of the Company’s long-lived assets are considered to be international with no single country of use.
The following table represents the geographic allocation of total lease rental income and management fees from non-leasing services during the years ended December 31, 2022, 2021 and 2020 based on customers’ and Container Investors’ primary domicile:
|
|
Years ended December 31, |
|
|||||||||
|
|
2022 |
|
|
2021 |
|
|
2020 |
|
|||
Total lease rental income: |
|
|
|
|
|
|
|
|
|
|||
Asia |
|
$ |
|
|
$ |
|
|
$ |
|
|||
Europe |
|
|
|
|
|
|
|
|
|
|||
North / South America |
|
|
|
|
|
|
|
|
|
|||
Bermuda |
|
|
— |
|
|
|
— |
|
|
|
— |
|
All other international |
|
|
|
|
|
|
|
|
|
|||
|
|
$ |
|
|
$ |
|
|
$ |
|
|||
Management fees, non-leasing: |
|
|
|
|
|
|
|
|
|
|||
Europe |
|
$ |
|
|
$ |
|
|
$ |
|
|||
Bermuda |
|
|
|
|
|
|
|
|
|
|||
North / South America |
|
|
|
|
|
|
|
|
|
|||
Asia |
|
|
— |
|
|
|
|
|
|
|
||
All other international |
|
|
|
|
|
|
|
|
|
|||
|
|
$ |
|
|
$ |
|
|
$ |
|
|||
The following table represents the geographic allocation of trading container sales proceeds and gain on sale of owned fleet containers, net during the years ended December 31, 2022, 2021 and 2020 based on the location of sale:
|
|
Years ended December 31, |
|
|||||||||
|
|
2022 |
|
|
2021 |
|
|
2020 |
|
|||
Trading container sales proceeds: |
|
|
|
|
|
|
|
|
|
|||
Asia |
|
$ |
|
|
$ |
|
|
$ |
|
|||
North / South America |
|
|
|
|
|
|
|
|
|
|||
Europe |
|
|
|
|
|
|
|
|
|
|||
Bermuda |
|
|
— |
|
|
|
— |
|
|
|
— |
|
All other international |
|
|
— |
|
|
|
|
|
|
|
||
|
|
$ |
|
|
$ |
|
|
$ |
|
|||
Gain on sale of owned fleet containers, net: |
|
|
|
|
|
|
|
|
|
|||
Asia |
|
$ |
|
|
$ |
|
|
$ |
|
|||
North / South America |
|
|
|
|
|
|
|
|
|
|||
Europe |
|
|
|
|
|
|
|
|
|
|||
Bermuda |
|
|
— |
|
|
|
— |
|
|
|
— |
|
All other international |
|
|
— |
|
|
|
— |
|
|
|
— |
|
|
|
$ |
|
|
$ |
|
|
$ |
|
|||
F-39
(10) Commitments and Contingencies
Restricted interest-bearing cash accounts were established by the Company as additional collateral for outstanding borrowings under certain of the Company’s debt facilities. Restricted cash at December 31, 2022 and 2021 consisted of the following:
|
|
2022 |
|
|
2021 |
|
||
Trust accounts |
|
$ |
|
|
$ |
|
||
Other restricted cash accounts |
|
|
|
|
|
|
||
Total restricted cash |
|
$ |
|
|
$ |
|
||
Trust accounts
The Company maintains certain interest-bearing bank accounts (“Trust Accounts”) pursuant to certain debt agreements for the deposits of net cash proceeds collected from leasing and containers disposition after certain expenses. The cash in the Trust Accounts can only be used to pay the Company’s debt, interest and other certain related expenses. After such payments, any remaining cash in the Trust Accounts is transferred to certain unrestricted bank accounts of the Company and is included in cash and cash equivalents on the consolidated balance sheets.
Other restricted cash accounts
The Company established certain interest-bearing bank accounts pursuant to certain debt agreements to maintain an amount equal to certain outstanding debt balances and a projected interest expense for a specified number of months.
At December 31, 2022, the Company had commitments to purchase containers to be delivered subsequent to December 31, 2022 in the total amount of $
The Company is the subject of, or party to, pending or threatened legal proceedings arising in the ordinary course of its business. Based upon information presently available, the Company does not expect any liability arising from these matters to have a material effect on the Company’s consolidated financial condition, results of operations or cash flows.
The amounts distributed to the Container Investors are variable payments based upon the net operating income for each managed container (see Note 2 “Managed Container Fleet”). There are
(11) Share-Based Compensation
The Company’s 2019 Share Incentive Plan (“2019 Plan”) provided for the grant of share options, restricted share units, performance restricted share units and restricted shares to the Company’s employees, executives and directors. At December 31, 2022,
Share-based compensation expense of $
F-40
Share Options
Share options are granted at exercise prices equal to the fair market value of the shares on the grant date. Each employee’s options vest in increments of
|
|
Share options |
|
|
Weighted |
|
||
Balances, December 31, 2019 |
|
|
|
|
$ |
|
||
Options exercised during the period |
|
|
( |
) |
|
$ |
|
|
Options expired during the period |
|
|
( |
) |
|
$ |
|
|
Options forfeited during the period |
|
|
( |
) |
|
$ |
|
|
Balances, December 31, 2020 |
|
|
|
|
$ |
|
||
Options exercised during the period |
|
|
( |
) |
|
$ |
|
|
Options expired during the period |
|
|
( |
) |
|
$ |
|
|
Options forfeited during the period |
|
|
( |
) |
|
$ |
|
|
Balances, December 31, 2021 |
|
|
|
|
$ |
|
||
Options exercised during the period |
|
|
( |
) |
|
$ |
|
|
Options expired during the period |
|
|
( |
) |
|
$ |
|
|
Balances, December 31, 2022 |
|
|
|
|
$ |
|
||
Options exercisable at December 31, 2022 |
|
|
|
|
$ |
|
||
Options vested and expected to vest at December 31, 2022 |
|
|
|
|
$ |
|
||
As of December 31, 2022, $
The weighted average contractual life of options exercisable and outstanding as of December 31, 2022 was
Restricted Share Units (“RSU”) and Performance Restricted Share Units (“PSU”)
RSU awards granted to employees prior to 2020 have a vesting period of
The Company granted PSU awards to certain executives starting 2020, which are subject to both service and market vesting conditions. The PSU awards will vest at the end of a
F-41
The following tables summarizes the activity of RSU and PSU awards for the years ended December 31, 2022, 2021 and 2020:
|
|
RSU |
|
|
PSU (1) |
|
|
Total |
|
|
Weighted |
|
||||
Balances, December 31, 2019 |
|
|
|
|
|
— |
|
|
|
|
|
$ |
|
|||
Share units granted |
|
|
|
|
|
|
|
|
|
|
$ |
|
||||
Share units vested |
|
|
( |
) |
|
|
— |
|
|
|
( |
) |
|
$ |
|
|
Share units forfeited |
|
|
( |
) |
|
|
— |
|
|
|
( |
) |
|
$ |
|
|
Balances, December 31, 2020 |
|
|
|
|
|
|
|
|
|
|
$ |
|
||||
Share units granted |
|
|
|
|
|
|
|
|
|
|
$ |
|
||||
Share units vested |
|
|
( |
) |
|
|
( |
) |
|
|
( |
) |
|
$ |
|
|
Share units forfeited |
|
|
( |
) |
|
|
— |
|
|
|
( |
) |
|
$ |
|
|
Balances, December 31, 2021 |
|
|
|
|
|
|
|
|
|
|
$ |
|
||||
Share units granted |
|
|
|
|
|
|
|
|
|
|
$ |
|
||||
Share units vested |
|
|
( |
) |
|
|
— |
|
|
|
( |
) |
|
$ |
|
|
Share units forfeited |
|
|
( |
) |
|
|
— |
|
|
|
( |
) |
|
$ |
|
|
Balances, December 31, 2022 |
|
|
|
|
|
|
|
|
|
|
$ |
|
||||
Total share units outstanding and expected to vest at December 31, 2022 |
|
|
|
|
|
|
|
|
|
|
$ |
|
||||
|
|
|
|
|
|
|
|
|
|
|
|
|
||||
As of December 31, 2022, $
|
|
2022 |
|
|
2021 |
|
|
2020 |
|
|||
Risk-free interest rates |
|
|
% |
|
|
% |
|
|
% |
|||
Expected common share price volatilities |
|
|
% |
|
|
% |
|
|
% |
|||
The risk-free interest rate is based on the
(12) Shareholders’ Equity
Share Repurchase Program
In 2019, the Company’s board of directors approved a share repurchase program to repurchase up to $
F-42
authorization did not obligate the Company to acquire a specific number of shares during any period, but it may be modified, suspended or terminated at any time at the discretion of the Company’s board of directors.
During the year ended December 31, 2022, the Company repurchased
Preferred Shares
The following table summarizes the Company’s preferred share issuances (the “Series”):
Preferred Share Offering |
|
Date of Issuance |
|
Number of Depositary Shares Issued and Outstanding (1) |
|
|
Liquidation Preference |
|
|
Underwriting Discounts |
|
|
Net Proceeds |
|
||||
|
|
|
|
|
$ |
|
|
$ |
|
|
$ |
|
||||||
|
|
|
|
|
|
|
|
|
|
|
|
|
||||||
Total |
|
|
|
|
|
|
$ |
|
|
$ |
|
|
$ |
|
||||
Preferred Share Dividends
Dividends on each Series of preferred shares accrue daily and are cumulative from and including the date of original issuance and are payable quarterly in arrears on the 15th day of March, June, September and December of each year, when declared by the Company’s board of directors. Dividends accrue at the stated annual rate of the
F-43
$
The Company’s board of directors approved and declared the following quarterly preferred cash dividends during the years ended December 31, 2022 and 2021 on its issued and outstanding preferred shares:
|
|
2022 |
|
|
2021 |
|
||||||||||
Preferred Share Offering |
|
Aggregate Payment |
|
|
Per Depositary Share Payment (1) |
|
|
Aggregate Payment |
|
|
Per Depositary Share Payment (1) (2) |
|
||||
Series A |
|
$ |
|
|
$ |
|
|
$ |
|
|
$ |
|
||||
Series B |
|
$ |
|
|
$ |
|
|
$ |
|
|
$ |
|
||||
Total |
|
$ |
|
|
|
|
|
$ |
|
|
|
|
||||
As of December 31, 2022, the Company had cumulative undeclared and unpaid preferred dividends of $
Common Share Dividends
As of December 31, 2022, the Company’s board of directors approved and declared a quarterly cash dividend of $
(13) Earnings Per Share
Basic earnings per share (“EPS”) is computed by dividing net income attributable to common shareholders by the weighted average number of shares outstanding during the applicable period. Diluted EPS reflects the potential dilution that could occur if all outstanding share options were exercised for, and all outstanding RSUs and PSUs were converted into, common shares. Potentially dilutive share options, RSUs and PSUs that were anti-dilutive under the treasury stock method were excluded from the computation of diluted EPS.
A reconciliation of the numerator and denominator of basic EPS with that of diluted EPS during 2022, 2021 and 2020 is presented as follows:
Share amounts in thousands |
|
2022 |
|
|
2021 |
|
|
2020 |
|
|||
Numerator: |
|
|
|
|
|
|
|
|
|
|||
Net income attributable to common shareholders |
|
$ |
|
|
$ |
|
|
$ |
|
|||
Denominator: |
|
|
|
|
|
|
|
|
|
|||
Weighted average common shares outstanding - basic |
|
|
|
|
|
|
|
|
|
|||
Dilutive share options, RSU and PSU |
|
|
|
|
|
|
|
|
|
|||
Weighted average common shares outstanding - diluted |
|
|
|
|
|
|
|
|
|
|||
Net income attributable to common shareholders per common share |
|
|
|
|
|
|
|
|
|
|||
Basic |
|
$ |
|
|
$ |
|
|
$ |
|
|||
Diluted |
|
$ |
|
|
$ |
|
|
$ |
|
|||
|
|
|
|
|
|
|
|
|
|
|||
Share options, RSU and PSU excluded from the computation of diluted EPS because they were anti-dilutive |
|
|
|
|
|
|
|
|
|
|||
F-44
(14) Subsequent Events
In February 2023, the Company’s board of directors approved and declared a quarterly preferred cash dividend on its issued and outstanding preferred shares, payable on March 15, 2023, to holders of record as of March 3, 2023. The dividend declared on Series A Preferred Shares and Series B Preferred Shares were $
In February 2023, the Company’s board of directors approved and declared a cash dividend of $
F-45
TEXTAINER GROUP HOLDINGS LIMITED AND SUBSIDIARIES
SCHEDULE I - CONDENSED STATEMENTS OF COMPREHENSIVE INCOME
Parent Company Information
Years Ended December 31, 2022, 2021 and 2020
(All currency expressed in United States dollars in thousands)
|
|
2022 |
|
|
2021 |
|
|
2020 |
|
|||
Operating expenses: |
|
|
|
|
|
|
|
|
|
|||
General and administrative expense |
|
$ |
|
|
$ |
|
|
$ |
|
|||
Total operating expenses |
|
|
|
|
|
|
|
|
|
|||
Loss from operations |
|
|
( |
) |
|
|
( |
) |
|
|
( |
) |
Other income: |
|
|
|
|
|
|
|
|
|
|||
Equity in net income of subsidiaries |
|
|
|
|
|
|
|
|
|
|||
Other, net |
|
|
( |
) |
|
|
( |
) |
|
|
|
|
Net other income |
|
|
|
|
|
|
|
|
|
|||
Income before income tax |
|
|
|
|
|
|
|
|
|
|||
Income tax benefit (expense) |
|
|
— |
|
|
|
— |
|
|
|
— |
|
Net income |
|
|
|
|
|
|
|
|
|
|||
Less: Dividends on preferred shares |
|
|
|
|
|
|
|
|
— |
|
||
Net income attributable to common shareholders |
|
$ |
|
|
$ |
|
|
$ |
|
|||
Net income attributable to common shareholders per share: |
|
|
|
|
|
|
|
|
|
|||
Basic |
|
$ |
|
|
$ |
|
|
$ |
|
|||
Diluted |
|
$ |
|
|
$ |
|
|
$ |
|
|||
Weighted average shares outstanding (in thousands): |
|
|
|
|
|
|
|
|
|
|||
Basic |
|
|
|
|
|
|
|
|
|
|||
Diluted |
|
|
|
|
|
|
|
|
|
|||
Other comprehensive income (loss), before tax: |
|
|
|
|
|
|
|
|
|
|||
Change in derivative instruments designated as cash flow hedges |
|
|
|
|
|
|
|
|
( |
) |
||
Reclassification of realized (gain) loss on derivative instruments |
|
|
( |
) |
|
|
|
|
|
|
||
Foreign currency translation adjustments |
|
|
( |
) |
|
|
( |
) |
|
|
|
|
Comprehensive income, before tax |
|
|
|
|
|
|
|
|
|
|||
Income tax (expense) benefit related to items of other |
|
|
( |
) |
|
|
( |
) |
|
|
|
|
Comprehensive income, after tax |
|
|
|
|
|
|
|
|
|
|||
Less: Dividends on preferred shares |
|
|
|
|
|
|
|
|
— |
|
||
Comprehensive income attributable to common shareholders |
|
$ |
|
|
$ |
|
|
$ |
|
|||
F-46
TEXTAINER GROUP HOLDINGS LIMITED AND SUBSIDIARIES
SCHEDULE I - CONDENSED BALANCE SHEETS
Parent Company Information
December 31, 2022 and 2021
(All currency expressed in United States dollars in thousands)
|
|
2022 |
|
|
2021 |
|
||
Assets |
|
|
|
|
|
|
||
Current assets: |
|
|
|
|
|
|
||
Cash and cash equivalents |
|
$ |
|
|
$ |
|
||
Prepaid expenses and other current assets |
|
|
|
|
|
|
||
Due from affiliates, net |
|
|
|
|
|
|
||
Total current assets |
|
|
|
|
|
|
||
Restricted cash |
|
|
|
|
|
— |
|
|
Investments in subsidiaries |
|
|
|
|
|
|
||
Total assets |
|
$ |
|
|
$ |
|
||
Liabilities and Shareholders’ Equity |
|
|
|
|
|
|
||
Current liabilities: |
|
|
|
|
|
|
||
Accounts payable and accrued expenses |
|
$ |
|
|
$ |
|
||
Shareholders’ equity: |
|
|
|
|
|
|
||
Preferred shares |
|
|
|
|
|
|
||
Common shares |
|
|
|
|
|
|
||
Treasury shares |
|
|
( |
) |
|
|
( |
) |
Additional paid-in capital |
|
|
|
|
|
|
||
Accumulated other comprehensive income |
|
|
|
|
|
|
||
Retained earnings |
|
|
|
|
|
|
||
Total shareholders’ equity |
|
|
|
|
|
|
||
Total liabilities and shareholders’ equity |
|
$ |
|
|
$ |
|
||
F-47
TEXTAINER GROUP HOLDINGS LIMITED AND SUBSIDIARIES
SCHEDULE I - CONDENSED STATEMENTS OF CASH FLOWS
Parent Company Information
Years ended December 31, 2022, 2021 and 2020
(All currency expressed in United States dollars in thousands)
|
|
2022 |
|
|
2021 |
|
|
2020 |
|
|||
Cash flows from operating activities: |
|
|
|
|
|
|
|
|
|
|||
Net income |
|
$ |
|
|
$ |
|
|
$ |
|
|||
Adjustments to reconcile net income to net cash provided by |
|
|
|
|
|
|
|
|
|
|||
Equity in net income of subsidiaries |
|
|
( |
) |
|
|
( |
) |
|
|
( |
) |
Dividends received from subsidiaries |
|
|
|
|
|
|
|
|
|
|||
Share-based compensation |
|
|
|
|
|
|
|
|
|
|||
Decrease (increase) in: |
|
|
|
|
|
|
|
|
|
|||
Prepaid expenses and other current assets |
|
|
|
|
|
( |
) |
|
|
( |
) |
|
Increase (decrease) in: |
|
|
|
|
|
|
|
|
|
|||
Accounts payable and accrued expenses |
|
|
( |
) |
|
|
|
|
|
( |
) |
|
Total adjustments |
|
|
( |
) |
|
|
( |
) |
|
|
|
|
Net cash provided by operating activities |
|
|
|
|
|
|
|
|
|
|||
Cash flows from investing activities: |
|
|
|
|
|
|
|
|
|
|||
Investments in subsidiaries |
|
|
|
|
|
( |
) |
|
|
( |
) |
|
Net cash provided by (used in) investing activities |
|
|
|
|
|
( |
) |
|
|
( |
) |
|
Cash flows from financing activities: |
|
|
|
|
|
|
|
|
|
|||
Issuance of preferred shares, net of underwriting discount |
|
|
— |
|
|
|
|
|
|
— |
|
|
Purchase of treasury shares |
|
|
( |
) |
|
|
( |
) |
|
|
( |
) |
Issuance of common shares upon exercise of share options |
|
|
|
|
|
|
|
|
|
|||
Dividends paid on common shares |
|
|
( |
) |
|
|
( |
) |
|
|
— |
|
Dividends paid on preferred shares |
|
|
( |
) |
|
|
( |
) |
|
|
— |
|
Due to (from) affiliates, net |
|
|
|
|
|
|
|
|
( |
) |
||
Other |
|
|
— |
|
|
|
( |
) |
|
|
— |
|
Net cash (used in) provided by financing activities |
|
|
( |
) |
|
|
|
|
|
( |
) |
|
Effect of exchange rate changes |
|
|
( |
) |
|
|
( |
) |
|
|
|
|
Net change in cash, cash equivalents and restricted cash |
|
|
( |
) |
|
|
( |
) |
|
|
|
|
Cash, cash equivalents and restricted cash, beginning of the year |
|
|
|
|
|
|
|
|
|
|||
Cash, cash equivalents and restricted cash, end of the year |
|
$ |
|
|
$ |
|
|
$ |
|
|||
F-48
Schedule II
TEXTAINER GROUP HOLDINGS LIMITED AND SUBSIDIARIES
Valuation Accounts
Years ended December 31, 2022, 2021 and 2020
(All currency expressed in United States dollars in thousands)
|
|
|
|
|
|
|
|
|
|
|
|
|
||||
|
|
|
|
|
|
|
|
|
|
|
|
|
||||
|
|
Balance at Beginning of Year |
|
|
Additions Charged to Expense (Recovery) |
|
|
Deductions |
|
|
Balance at End of Year |
|
||||
December 31, 2020 |
|
|
|
|
|
|
|
|
|
|
|
|
||||
Accounts receivable, allowance for doubtful accounts |
|
$ |
|
|
$ |
( |
) |
|
$ |
( |
) |
|
$ |
|
||
Net investment in finance leases, allowance for credit losses |
|
$ |
|
|
$ |
|
|
$ |
— |
|
|
$ |
|
|||
Container leaseback financing receivable, allowance for |
|
$ |
|
|
$ |
|
|
$ |
— |
|
|
$ |
|
|||
December 31, 2021 |
|
|
|
|
|
|
|
|
|
|
|
|
||||
Accounts receivable, allowance for doubtful accounts |
|
$ |
|
|
$ |
( |
) |
|
$ |
( |
) |
|
$ |
|
||
Net investment in finance leases, allowance for credit losses |
|
$ |
|
|
$ |
( |
) |
|
$ |
— |
|
|
$ |
|
||
Container leaseback financing receivable, allowance for |
|
$ |
|
|
$ |
( |
) |
|
$ |
— |
|
|
$ |
|
||
December 31, 2022 |
|
|
|
|
|
|
|
|
|
|
|
|
||||
Accounts receivable, allowance for doubtful accounts |
|
$ |
|
|
$ |
|
|
$ |
( |
) |
|
$ |
|
|||
Net investment in finance leases, allowance for credit losses |
|
$ |
|
|
$ |
|
|
$ |
— |
|
|
$ |
|
|||
Container leaseback financing receivable, allowance for |
|
$ |
|
|
$ |
|
|
$ |
— |
|
|
$ |
|
|||
F-49
ITEM 19. EXHIBITS
The following exhibits are filed as part of this Annual Report on Form 20-F:
Exhibit Number |
|
Description of Document |
|
|
|
1.1 |
|
Memorandum of Association of Textainer Group Holdings Limited (1) |
|
|
|
1.2 |
|
|
|
|
|
2.1 |
|
|
|
|
|
4.1 |
|
|
|
|
|
4.2 |
|
|
|
|
|
4.3 |
|
|
|
|
|
4.4* |
|
|
|
|
|
4.5* |
|
|
|
|
|
4.6* |
|
2019 Share Incentive Plan (as amended and restated effective May 23, 2019) (9) |
|
|
|
4.7* |
|
|
|
|
|
4.8† |
|
|
|
|
|
4.9 |
|
|
|
|
|
4.10 |
|
|
|
|
|
4.11 |
|
|
|
|
|
4.12† |
|
|
|
|
|
8.1† |
|
|
|
|
|
12.1† |
|
|
|
|
|
12.2† |
|
|
|
|
|
111
Exhibit Number |
|
Description of Document |
13.1† |
|
|
|
|
|
13.2† |
|
|
|
|
|
15.1† |
|
|
|
|
|
15.2† |
|
|
|
|
|
101.INS† |
|
Inline XBRL Instance Document |
|
|
|
101.SCH† |
|
Inline XBRL Taxonomy Extension Schema Document |
|
|
|
101.CAL† |
|
Inline XBRL Taxonomy Extension Calculation Linkbase Document |
|
|
|
101.DEF† |
|
Inline XBRL Taxonomy Definition Linkbase Document |
|
|
|
101.LAB† |
|
Inline XBRL Taxonomy Extension Label Linkbase Document |
|
|
|
101.PRE† |
|
Inline XBRL Taxonomy Extension Presentation Linkbase Document |
104 |
|
Cover Page Interactive Data File (embedded within the Inline XBRL document) |
† Filed herewith.
* Indicates management contract or compensatory plan.
112
SIGNATURES
The registrant hereby certifies that it meets all of the requirements for filing on Form 20-F and that it has duly caused and authorized the undersigned to sign this Annual Report on its behalf.
Textainer Group Holdings Limited |
|
/s/ Olivier Ghesquiere |
Olivier Ghesquiere |
President and Chief Executive Officer |
|
/s/ Michael K. Chan |
Michael K. Chan |
Executive Vice President and Chief Financial Officer |
February 14, 2023
113