UNITED STATES
SECURITIES AND EXCHANGE COMMISSION
Washington, DC 20549
___________________________________________
FORM 10-K
FOR THE FISCAL YEAR ENDED JANUARY 31 , 2024
Commission File No. 001-33866
___________________________________________
(Exact name of registrant as specified in its charter)
644 East Beaton Drive
| (State or Other Jurisdiction of Incorporation or Organization) | (IRS Employer Identification No.) | ||||
(Address of Principal Executive Offices)
(Registrant's telephone number, including area code)
Securities registered pursuant to Section 12(b) of the Act:
| Title of each class | Trading Symbol(s) | Name of each exchange on which registered | ||||||
Securities registered pursuant to Section 12(g) of the Act: None
___________________________________________
Indicate by check mark if the registrant is a well-known seasoned issuer, as defined in Rule 405 of the Securities Act. Yes o No x
Indicate by check mark if the registrant is not required to file reports pursuant to Section 13 or Section 15(d) of the Act. Yes o No x
Indicate by check mark whether the registrant (1) has filed all reports required to be filed by Section 13 or 15(d) of the Securities Exchange Act of 1934 during the preceding 12 months (or for such shorter period that the registrant was required to file such reports), and (2) has been subject to such filing requirements for the past 90 days. Yes x No o
Indicate by check mark whether the registrant has submitted electronically every Interactive Data File required to be submitted pursuant to Rule 405 of Regulation S-T (§232.405 of this chapter) during the preceding 12 months (or for such shorter period that the registrant was required to submit such files). Yes x No o
Indicate by check mark whether the registrant is a large accelerated filer, an accelerated filer, a non-accelerated filer, a smaller reporting company, or an emerging growth company. See definitions of "large accelerated filer," "accelerated filer," "smaller reporting company," and "emerging growth company" in Rule 12b-2 of the Exchange Act. (Check one):
| Large accelerated filer | o | x | ||||||||||||
| Non-accelerated filer | o | Smaller reporting company | ||||||||||||
| Emerging Growth Company | ||||||||||||||
If an emerging growth company, indicate by check mark if the registrant has elected not to use the extended transition period for complying with any new or revised financial accounting standards provided pursuant to Section 13(a) of the Exchange Act. o
Indicate by check mark whether the registrant has filed a report on and attestation to its management’s assessment of the effectiveness of its internal control over financial reporting under Section 404(b) of the Sarbanes-Oxley Act (15 U.S.C. 7262(b)) by the registered public accounting firm that prepared or issued its audit report. x
If securities are registered pursuant to Section 12(b) of the Act, indicate by check mark whether the financial statements of the registrant included in the filing reflect the correction of an error to previously issued financial statements. o
Indicate by check mark whether any of those error corrections are restatements that required a recovery analysis of incentive-based compensation received by any of the registrant’s executive officers during the relevant recovery period pursuant to §240.10D-1(b). o
Indicate by check mark whether the registrant is a shell company (as defined in Rule 12b-2 of the Act). Yes o No x
The aggregate market value of our common stock held by non-affiliates as of July 31, 2023, the last business day of our most recently completed second fiscal quarter, was approximately $645.0 million (based on the last sale price of $31.92 per share on such date as reported on the Nasdaq Global Select Market).
The number of shares outstanding of the registrant's common stock as of March 25, 2024 was 22,848,792 shares.
DOCUMENTS INCORPORATED BY REFERENCE
Portions of the definitive proxy statement for the registrant's 2024 Annual Meeting of Stockholders are incorporated by reference into Items 10, 11, 12, 13 and 14 of Part III of this report. The definitive proxy statement for the registrant’s 2024 Annual Meeting of Stockholders will be filed with the U.S. Securities and Exchange Commission within 120 days after the end of the fiscal year to which this report relates.
Table of Contents
| Page No. | ||||||||
i
ITEM 1. BUSINESS
Our Company
Titan Machinery Inc. and its subsidiaries (collectively, "Titan Machinery," the "Company," "we," or "our") own and operate a network of full service agricultural and construction equipment stores in the United States, Europe and Australia. We have been an authorized dealer of CNH Industrial N.V. or its U.S. subsidiaries (collectively referred to in this Form 10-K as "CNH Industrial") since our inception in 1980. CNH Industrial is a leading manufacturer and supplier of agricultural and construction equipment, which includes the Case IH Agriculture, New Holland Agriculture, Case Construction and New Holland Construction brands. Based upon information provided to us by CNH Industrial, we are the largest retail dealer of Case IH Agriculture equipment in the world, one of the largest retail dealers of Case Construction equipment in North America and one of the largest retail dealers of New Holland Agriculture and New Holland Construction equipment in the United States. In addition to the CNH Industrial brands, we sell and service equipment supplied by a variety of other manufacturers and distributors.
We operate our business in four reportable segments, Agriculture, Construction, Europe (formerly known as "International"), and Australia, within which we engage in four principal business activities:
•new and used equipment sales;
•parts sales;
•equipment repair and maintenance services; and
•equipment rental and other activities.
We offer our customers a one-stop solution by providing equipment and parts sales, equipment repair and maintenance services, and rental functions in each store. Our full service approach provides us with multiple points of customer contact and cross-selling opportunities. We believe our mix of principal business activities, as well as our broad geographic footprint, provide us with crop, weather and market diversification. This diversification helps to lower our overall exposure to adverse economic cycles that affect particular geographic markets or segments. We also believe our scale, customer service, centralized resources, and experienced management team provide us with a competitive advantage in many of our local markets.
Throughout our 43-year operating history, we have built an extensive network of 94 full service stores in the United States, 39 stores in Europe and 15 stores in Australia. Our Agriculture stores in the U.S. are located in Idaho, Iowa, Kansas, Minnesota, Missouri, Montana, Nebraska, North Dakota, South Dakota, Washington, Wisconsin, and Wyoming and include several highly productive farming regions, such as the Red River Valley in eastern North Dakota and northwestern Minnesota, portions of the corn belt in Iowa, eastern South Dakota and southern Minnesota, the I-80 corridor region in Nebraska, which sits on top of the Ogallala Aquifer, and the Snake River Valley in eastern Idaho. Our Construction stores are located in Colorado, Iowa, Minnesota, Nebraska, North Dakota, South Dakota, and Wisconsin. Internationally, the Company's European stores are located in the countries of Bulgaria, Germany, Romania, and Ukraine, and our Australian stores are located in the states of New South Wales, South Australia, and Victoria in Southeastern Australia.
We have a history of growth through acquisitions. Those acquisitions vary from single dealerships to larger dealership groups with locations in multiple states. Since January 1, 2003, we have completed over 60 acquisitions located in 15 U.S. states, four European countries, and three Australian states, along with establishing a new network of dealership locations in Ukraine. We believe that there will continue to be opportunities for dealership consolidation in the future, and we expect that acquisitions will continue to be a component of our long-term growth strategy.
Products and Services
Within each of our segments, we have four principal sources of revenue: new and used equipment sales, parts sales, equipment repair and maintenance services, and equipment rental and other business activities.
1
New and Used Equipment Sales
We sell new agricultural and construction equipment manufactured under the CNH Industrial family of brands as well as equipment from a variety of other manufacturers. We also sell used equipment, which is primarily acquired through trade-ins from our customers. The agricultural equipment we sell and service includes machinery and attachments for uses ranging from large-scale commercial farming to home and garden purposes. The construction equipment we sell and service includes heavy construction machinery, light industrial machinery for commercial and residential construction, and road and highway construction machinery. Equipment sales generate cross-selling opportunities by populating our markets with equipment that will be in need of service and parts. Equipment revenue represented 77.8%, 77.5% and 75.4% of total revenue for the fiscal years ended January 31, 2024, 2023 and 2022.
Parts Sales
We maintain an extensive in-house parts inventory to provide timely parts and repair and maintenance support to our customers. Our parts sales provide a revenue stream that is less sensitive to economic cycles than our equipment sales. Parts revenue represented 14.9%, 14.8% and 15.6% of total revenue for the fiscal years ended January 31, 2024, 2023 and 2022.
Equipment Repair and Maintenance Services
We provide set-up and repair and maintenance services, including warranty repairs, for our customers' equipment. Our stores have service shops staffed by trained service technicians. In addition, our technicians are able to make off-site repairs at customer locations. We provide proactive and comprehensive customer service by maintaining service histories for each piece of equipment owned by our customers, maintaining 24/7 service hours in times of peak equipment usage, providing on-site repair services, scheduling off-season maintenance activities with customers, notifying customers of periodic service requirements and providing training programs to customers in order to educate them on standard maintenance requirements. Our aftermarket repair and maintenance services have historically provided a high-margin and stable source of revenue through changing economic cycles. Service revenue represented 5.7%, 5.9% and 6.8% of total revenue for the fiscal years ended January 31, 2024, 2023 and 2022.
Equipment Rental and Other Business Activities
We rent equipment to our customers, primarily in the Construction segment, for periods ranging from a few days to seasonal rentals. We manage the size, quality, age and composition of our rental fleet and closely monitor and analyze customer demand and rate trends. We service our rental fleet through our on-site parts and services team and market our rental equipment through our retail sales force. Our rental activities create cross-selling opportunities in equipment sales, including rent-to-own purchase options on our non-fleet rentals.
We provide ancillary equipment support activities such as equipment transportation, Global Positioning System ("GPS") signal subscriptions and other precision farming products, farm data management products, and CNH Industrial finance and insurance products.
Equipment rental and other revenue represented 1.6%, 1.8% and 2.2% of total revenue for the fiscal years ended January 31, 2024, 2023 and 2022.
Industry Overview
Agricultural Equipment Industry
Agricultural equipment is purchased primarily by farmers and commercial entities, such as cooperatives, that provide services to farmers for the production of crops used for food, fiber, feed grain and feedstock for renewable energy. Agricultural equipment is also purchased for "lifestyle farms", home and garden applications, and maintenance of commercial, residential and government properties. Deere & Company ("Deere"), CNH Industrial, AGCO Corporation ("AGCO"), and Kubota Corporation ("Kubota"), are the largest global manufacturers of agricultural equipment, and they each manufacture a full line of equipment and parts that supply the primary machinery requirements of farmers and other users of agricultural equipment. In addition to the major manufacturers, several short-line manufacturers produce specialized equipment that satisfies various niche requirements of end users. Agricultural equipment manufacturers typically grant dealers in the United States defined sales and marketing territories with designated store locations to distribute their products.
2
We believe there are many factors that influence demand for agricultural equipment, parts, and repair and maintenance services, including net farm income, commodity markets, production yields, tariffs and trade policies, interest rates, government policies, European Union subvention funds and individual European country subsidies, tax policies, local growing conditions, and general economic conditions. Any of these conditions can change materially in a short time period, creating volatility in demand for our products and services. U.S federal legislation, such as the 2018 Farm Bill and its subsequent extensions, attempts to stabilize the agriculture industry through various policies including (i) commodity programs consisting of direct, counter-cyclical and price support payments to farmers; (ii) conservation programs; (iii) crop insurance programs; and (iv) disaster relief programs. The Farm Management Deposit scheme is used by farmers in Australia to help deal with uneven income flows by making deposits during more profitable years and receiving repayments during years with lower profitability. We believe that these various federal policies reduce financial volatility in the agriculture industry and assist farmers in continuing to operate their farms during economic down cycles and through the adverse headwinds caused by trade policies and tariffs.
Construction Equipment Industry
Construction equipment is purchased primarily for use in commercial, residential and infrastructure construction, as well as for agriculture, demolition, energy production and forestry operations. Caterpillar, Inc., Deere, Komatsu Ltd., the Volvo Group, Terex Corporation, Doosan, and CNH Industrial are some of the largest global manufacturers of construction and industrial equipment. The market for construction equipment is segmented across multiple categories including earth moving, lifting, light industrial, asphalt and paving, and concrete and aggregate equipment. As with agricultural equipment, distribution of construction equipment in the United States is accomplished primarily through manufacturer authorized dealers.
CNH Industrial and industry reports show that demand for construction equipment in our markets is driven by several factors, including (i) public spending on roads, highways, sewer and water projects, and other public works projects; (ii) public and private expenditures for the energy, mining, and forestry industries; (iii) business conditions in the agriculture industry; and (iv) general economic and market conditions of the construction sector for residential and commercial buildings.
Business Strengths
We believe the following attributes are important factors in our ability to compete effectively and to achieve our long-term financial objectives:
Centralized Inventory Management
We believe our significant scale enables us to centrally manage our inventory, permitting us to more effectively manage inventory levels at each store while still providing a significant breadth of equipment and parts inventories to our customers throughout our footprint. Moreover, our floorplan financing capacity enables us to opportunistically purchase and carry inventory to satisfy market demands.
Superior Customer Service at the Local Level
Our centralization of numerous administrative functions better positions our employees in the field to focus on customer service. We believe that the following capabilities enable us to better service our customers:
•our ability to staff a large number of highly-trained service technicians across our network of stores, which makes it possible to schedule repair services on short notice without affecting our technician utilization rates;
•our ability to staff and leverage product and application specialists across our network of stores, which makes it possible to offer valuable pre-sale and aftermarket services, including equipment training, best practices education and precision farming technology support; and
•our ability to innovate and lead our industry through initiatives such as precision farming and farm data management products and services, which provide our customers with the latest advances in technology and operating practices.
We spend significant time and resources training our employees to effectively service our customers in each of our local markets. Our training program involves active participation in all manufacturer-sponsored training programs, the use of industry experts for customized training programs, and a centralized training team to assist in training programs and the integration of newly-acquired dealerships. We partner with many technical colleges to offer scholarships and sponsor students who we plan to eventually employ as service technicians. We also offer a federally regulated and approved service technician apprenticeship program that provides our employees with the opportunity to obtain a national, industry recognized credential through full-time on-the-job-training with us.
3
Ability to Act on Acquisition Opportunities
We believe that our experienced management team and access to capital enable us to be opportunistic in responding to accretive growth opportunities, primarily arising from the continued consolidation of the equipment dealer network.
Professional Centralized Marketing Systems
Our centralized shared resource group based in our corporate headquarters includes a professional marketing team that supports all aspects of brand and solution awareness, customer analytics and targeting, and lead generation through multichannel campaigns that typically incorporate digital marketing (email, website, search, display, social and syndication), direct mail, and regional and local advertising and sponsorships. Our marketing functions also drive increased customer engagement and loyalty by administering a consistent customer Net Promoter Score process and through participation in trade shows and industry events and communication and coordination for local store open houses, service clinics, equipment demonstrations, product showcases and customer appreciation outings.
Ability to Attract and Retain Superior Employees
We recognize that attracting and retaining talented employees is essential to achieving outstanding company performance. We strive to develop our employees through a structured training program and to invest in our employees’ development. In addition, we have robust compensation tools that allow us to react to rapidly changing market conditions and reward employees for high performance. We believe that our efforts in these areas will enable us to attract and retain superior employees necessary for us to be successful in our industry. See “Human Capital”.
Diverse and Stable Customer Base Reduces Market Risk
Our large geographic footprint covering thirteen U.S. states, four European countries and three Australian states provides a diversified customer base. We believe that this diverse customer base reduces the potential impact of risks associated with customer concentration and fluctuations in local market conditions. During fiscal 2024, none of our customers accounted for more than 1.0% of our total revenue. Revenue from customers located outside of the United States is primarily included in our Europe and Australia segments, which represented 13.8%, 13.5% and 18.6% of total consolidated revenue during fiscal 2024, 2023 and 2022, respectively.
Experienced Management Team
Our executive team is led by Bryan Knutson, our Chief Executive Officer who was appointed on February 1, 2024, and has over 20 years of industry experience at our Company ranging from equipment sales to executive positions. David Meyer, Chief Executive Officer up to February 1, 2024, has over 40 years of industry experience as a founder of our Company and will serves as the Company’s Executive Chairman during the 2025 fiscal year. Robert Larsen, Chief Financial Officer, has 15 years of industry and other finance leadership experience having worked at CNH Industrial, Raven Industries, and PricewaterhouseCoopers prior to joining the Company. Our other executive team members, managers in the field, and equipment sales consultants also have extensive knowledge and experience in our industry. We compensate, develop and review our managers and sales employees based on an approach that aligns their incentives with the goals and objectives of our Company, including achievement of revenue, profitability, market share and balance sheet objectives. We believe the strength of our management team assists in our success in the marketplace.
Growth Strategy
We pursue the following growth strategies:
Increasing Same-Store Sales and Market Share
Increasing same-store sales and market share are among our top priorities. This type of growth enhances our current period sales revenue and increases our potential future revenue given the potential for recurring parts and service business during the life of the sold equipment. We seek to generate growth in same-store sales and market share through the following:
•employing significant marketing and advertising programs, including targeted direct mailings, Titan website efforts, internet based marketing, advertising with targeted local media outlets, participation in and sponsorship of trade shows and industry events, regular direct mail advertising, and by hosting open houses, service clinics, equipment demonstrations, product showcases and customer appreciation outings.
•supporting and providing customers with training on evolving technologies, such as precision farming and farm data management, which can be difficult for small dealers to make available;
4
•maintaining state-of-the-art service facilities, mobile service trucks and trained service technicians to maximize our customers’ equipment uptime through preventative maintenance programs and seasonal 24/7 service support; and
•centrally managing our inventory to optimize the availability of equipment and parts for our customers.
Strategic Acquisitions
Since January 1, 2003, we have completed over 60 acquisitions located in 15 U.S. states, four European countries and three Australian states. In addition, we have added dealership locations in Ukraine through new start-up operations. The agricultural and construction equipment dealership industries are fragmented and consist of many relatively small, independent businesses serving discrete local markets. We believe a favorable climate for dealership consolidation will continue to exist in the future due to several factors, including the competitiveness of our industry, increased dealer capitalization requirements, increased sophistication and complexity of equipment and related technologies, increased expectations from our customers and our equipment suppliers, and the lack of succession alternatives for many current owners. We intend to pursue acquisitions with the objectives of consolidating distribution within our existing footprint, entering new markets, and strengthening our competitive position. We expect that strategic acquisitions will continue to be a component of our long-term growth strategy.
We regularly assess the acquisition landscape, evaluating potential acquisitions in terms of availability and alignment to our long-term growth strategy. Typically, in an acquisition, we have acquired only the working capital and fixed assets that we believe are necessary to run an efficient store, and we do not generally assume any indebtedness. On occasion, we have acquired all of the outstanding equity of a company. Acquisitions are typically financed with available cash balances, floorplan payable line of credit capacity, and long-term debt.
The consent of CNH Industrial is required to acquire any CNH Industrial dealership. Additionally, the consent of our lender group, consisting of a number of national and regional banks (the “Bank Syndicate”), is required for acquisitions over certain thresholds or other criteria as defined in our credit agreement.
Suppliers
CNH Industrial—Case IH Agriculture, Case Construction, New Holland Agriculture and New Holland Construction
CNH Industrial is a publicly-traded, global leader in the agricultural and construction equipment industries. In 2023, CNH Industrial generated $22.1 billion in revenue from its equipment operations. CNH Industrial is the world’s second largest manufacturer of agricultural equipment, manufacturing the Case IH Agriculture and New Holland Agriculture brands of equipment. Case IH Agriculture, recognized by the red color of its equipment, possesses over 170 years of farm equipment heritage. New Holland Agriculture, recognized by the blue color of its tractors and the yellow color of its harvesting and hay equipment, has over 120 years of farm equipment industry experience. The Case Construction and New Holland Construction brands are also owned and operated by CNH Industrial.
In fiscal 2024, CNH Industrial supplied approximately 75% of the new equipment sold in our Agriculture segment, 81% of the new equipment sold in our Construction segment, 51% of the new equipment sold in our Europe segment and 58% of the new equipment sold in our Australia segment. In addition, CNH Industrial provides financing and insurance products and services to our end-user customers through its affiliate CNH Industrial Capital America, LLC (“CNH Industrial Capital”).
Our relationship with CNH Industrial is more than a typical supply relationship; it is strategic for both our Company and CNH Industrial. In that regard, we believe that it is in each company’s interest to maintain and develop the longstanding strong relationship we share.
Dealership Agreements
We have separate dealership agreements with CNH Industrial to sell and service the Case IH Agriculture, New Holland Agriculture, Case Construction and New Holland Construction brands (collectively the “CNH Industrial Dealer Agreements”). Separate CNH Industrial Dealer Agreements exist for each of our North American stores or store complexes, for each of the European countries in which we operate and for our Australian operations. The structure of the North American, European and Australian agreements are very similar. Except as noted, the following discussion describes each of the North American CNH Industrial Dealer Agreements.
5
Our Case IH commercial sprayer application distribution rights were granted to us in connection with our acquisition of Heartland Ag in fiscal year 2023. For our full-line distribution dealer locations, these distribution rights are granted through amendments to our full-line dealer agreements adding floaters and sprayers as authorized products permitted to be sold to commercial application customers. For our non-full-line dealer locations, our distribution rights are set forth in new Case IH dealer agreements granting us distribution rights to sell floaters and sprayers to commercial application customers. For purposes of this Form 10-K, the granted distribution rights for the commercial application sprayers and floaters in territories without full-line dealer locations are referred to as the “Non-Full-Line Footprint Commercial Application Distribution Rights”.
Each of the CNH Industrial Dealer Agreements assigns to us a geographically defined area of primary responsibility, providing us with distribution and product support rights within the identified territory for specific equipment products. Although the dealer appointment is non-exclusive, in each territory there is typically only one dealer responsible for retail sales to end-users and for after-sales product support of the equipment. If we sell certain CNH Industrial construction equipment outside of our designated sales and service areas, CNH Industrial has the right to require that we pay sales and service fees for purposes of compensating the dealer assigned to such territory. We are authorized to display and use CNH Industrial trademarks and trade names at our stores, with certain restrictions.
Under our CNH Industrial Dealer Agreements, we have both the right and obligation to sell CNH Industrial equipment and related parts and products and to provide customers with repair services. The CNH Industrial Dealer Agreements impose various dealer standards on us regarding the location and appearance of facilities, satisfactory levels of new equipment and parts inventories, the training of personnel, adequate business enterprise and information technology systems, adequate working capital, a maximum adjusted debt to tangible net worth ratio, development of annual sales and marketing goals, and furnishing of monthly and annual financial information to CNH Industrial. We must obtain the approval or consent of CNH Industrial in the event of proposed fundamental changes to our ownership, governance or business structure (defined as “change in control” events) including, among other things, (i) a merger, consolidation or reorganization, unless securities representing more than 50% of the total combined voting power of the successor corporation are immediately owned, directly or indirectly, by persons that owned our securities prior to the transaction; (ii) a sale of all or substantially all of our assets; (iii) any transaction or series of transactions resulting in a person or affiliated group acquiring 30% or more of the combined voting power of our securities or, in the case of a competitor of CNH Industrial, acquiring 20% or more of the combined voting power of our securities; (iv) a substantial disposition of shares of our common stock by certain named executives; (v) certain significant changes in the composition of our Board of Directors (the “Board”); and (vi) replacement of our Chief Executive Officer. The CNH Industrial Dealer Agreements do not establish mandatory minimum or maximum retail pricing for our equipment, parts, or service offerings.
The Case IH Agricultural dealership agreement and the Case Construction dealership agreement have fixed terms expiring on December 31, 2027, and renew automatically for successive 5-year terms unless either party notifies the other party of its intention not to renew or otherwise exercises its termination rights under the agreement. The New Holland dealership agreement is a 12-month agreement, with automatic 1-year renewals unless either party notifies the other party of its intention not to renew or otherwise exercises its termination rights under the agreement. The Non-Full-Line Commercial Application Distribution Rights expire on August 1, 2030, at which time these distribution rights are ceded back to Case IH, unless the term thereof is further extended by the parties.
If we sell a portion of our commercial sprayer application business related to the Non-Full-Line Commercial Application Distribution Rights prior to the expiration date of August 1, 2030 (or such later date as agreed to by the parties), then we are required to pay to CNH Industrial the sales consideration paid by such buyer for the applicable commercial application distribution rights; provided that Titan would receive sales consideration from the buyer in an amount not less than the fair value of the facilities, fixed assets, current assets, and other investments applicable to the location and market being sold. If we acquire a Case IH full-line dealer location within any of the territories for which we then possess the Non-Footprint Commercial Application Distribution Rights, as part of its approval process, Case IH may require Titan to pay an agreed upon amount for the inclusion of the commercial application sprayer distribution rights in the new dealer agreement for the acquired location.
6
CNH Industrial has the right to terminate its dealer agreements with us immediately in certain circumstances, including in the event of (i) our insolvency or bankruptcy, (ii) a material breach by us of the provisions of a CNH Industrial Dealer Agreement or (iii) our failure to secure the consent of CNH Industrial prior to the occurrence of a “change in control” event. The CNH Industrial Dealer Agreements governing Case Construction equipment grant CNH Industrial the right to terminate these CNH Industrial Dealer Agreements for any reason upon 120 days prior written notice. In addition, we have the right to terminate any of the CNH Industrial Dealer Agreements at any time, with or without cause, upon 60 days prior written notice. Subject to protections provided under state dealer protection laws, in the event that CNH Industrial offers a new dealer agreement or an amendment to the existing CNH Industrial Dealer Agreements to all authorized CNH Industrial dealers located in the state, CNH Industrial is permitted to terminate our existing CNH Industrial Dealer Agreements for stores located in that state upon at least 180 days prior written notice if we refuse or otherwise fail to enter into such new agreements or amendments. In addition, to the extent CNH Industrial determines that we are not meeting our obligations under the CNH Industrial Dealer Agreement with respect to a particular product, CNH Industrial may, upon 60 days prior written notice to us, remove such product from the authorized product list allowed to be sold or serviced by us. In the event of termination of any of the CNH Industrial Dealer Agreements, CNH Industrial is obligated to repurchase the inventory of the CNH Industrial brand applicable to the agreement being terminated. The CNH Industrial Dealer Agreements generally do not include non-compete provisions that apply during or after the term of such agreements or limit our operations apart from our designated CNH Industrial dealership store locations. Our CNH Industrial Dealer Agreements for Case Construction equipment, absent consent of CNH Industrial, restrict our ability to sell competing products (new equipment and parts) of other manufacturers at our Case dealership store locations during the term of such agreements. Our CNH Industrial Dealer Agreements require us to operate any material business activities not related to sales of CNH Industrial products or services to customers in agricultural, construction, industrial or similar markets separately from our CNH Industrial dealership business.
CNH Industrial and other equipment suppliers frequently provide to its dealers interest free financing on equipment purchases. The interest free periods are for varying terms but generally less than 6 months. Generally, payment for parts purchased from CNH Industrial entities is due within 30 days. CNH Industrial makes available to us any floorplan programs, parts return programs, sales or incentive programs or similar plans or programs it offers to its other dealers and provides us with promotional items and marketing materials.
The CNH Industrial Dealer Agreements for our international operations, with the exception of Ukraine and Australia, grant to us exclusive territories. In both Europe and Australia, we are restricted in our ability to sell competing products in our assigned territories. Our CNH Industrial Dealer Agreements for our European and Australian operations do not have a fixed term. CNH Industrial can terminate these agreements immediately in certain circumstances constituting cause, and for any reason upon 24 months’ prior written notice in Europe and consistent with franchise law notice requirements in Australia.
Other Suppliers
In addition to products supplied by CNH Industrial, we sell a variety of new equipment and parts supplied by other manufacturers. These products tend to address specialized niche markets and complement the CNH Industrial products we sell by filling gaps in the CNH Industrial line of products. We believe our offering of products for specialized niche markets supports our goal of being a one-stop solution for our customers’ equipment needs at each of our stores. Approximately 29% of our total new equipment sales in fiscal 2024 resulted from sales of products manufactured by companies other than CNH Industrial, with our single largest manufacturer other than CNH Industrial representing approximately 3% of our total new equipment sales during fiscal 2024. The terms of our arrangements with these other suppliers vary, but most of the dealership agreements contain termination provisions allowing the supplier to terminate the agreement after a specified notice period, which is typically 30 days. Payment and financing practices with these other suppliers are similar to those practices described above with respect to CNH Industrial.
Customers
Our North America agriculture customers vary from small, single machine owners to large farming operations to large commercial application operations, primarily in the states of Idaho, Iowa, Kansas, Missouri, Minnesota, Montana, Nebraska, North Dakota, South Dakota, Washington, Wisconsin, and Wyoming. In fiscal 2024, no single agriculture customer accounted for more than 2.0% of our Agriculture revenue.
Our construction customers include a wide range of construction contractors, public utilities, forestry, energy companies, farmers, municipalities and maintenance contractors, primarily in the states of Colorado, Iowa, Minnesota, Nebraska, North Dakota, South Dakota, and Wisconsin. They vary in size from small, single machine owners to large firms. In fiscal 2024, no single construction equipment customer accounted for more than 3.0% of our Construction revenue.
7
Our European customers vary from small, single machine owners to large farming operations, primarily in the countries of Bulgaria, Germany, Romania, and Ukraine. We also sell Case Construction equipment in Bulgaria and Romania. In fiscal 2024, no single European customer accounted for more than 1.0% of our Europe revenue.
Our Australian customers vary from small, single machine owners to large farming operations, primarily in the states of New South Wales, South Australia, and Victoria. In fiscal 2024, no single Australian customer accounted for more than 4.0% of our Australia revenue.
Floorplan Payable Financing
The cost of floorplan payable financing is an important factor affecting our financial results. CNH Industrial Capital offers floorplan payable financing to CNH Industrial dealers to finance the purchase of inventory from CNH Industrial and for used equipment inventory purchased on trade-ins from our customers. CNH Industrial Capital provides this financing in part to enable dealers to carry representative inventories of equipment and encourage the purchase of goods by dealers in advance of seasonal retail demand. CNH Industrial Capital charges variable market rates of interest based on the prime rate on balances outstanding after any interest-free periods and receives a security interest in inventory and other assets. Interest-free periods are generally four months in duration for both new and used agriculture and construction equipment. As of January 31, 2024, we had a $875.0 million floorplan credit facility with CNH Industrial Capital.
In addition to the CNH Industrial Capital floorplan line of credit, as of January 31, 2024, we also had a $275.0 million wholesale floorplan line of credit under the Bank Syndicate Agreement, and a $80.0 million credit facility with DLL Finance LLC that can be used to finance inventory purchases. In addition, we have other lines of credit offered by various financial institutions as well as floorplan payable financing programs offered by manufacturers and suppliers, or their third party lenders, from which we purchase equipment inventory.
Sales and Marketing
We currently market our products and services through:
•our sales employees, who operate out of our network of local stores and call on customers in the markets surrounding each store;
•our store parts managers and service managers, who provide our customers with comprehensive after-market support;
•our website, including a parts e-commerce website
•local and regional advertising efforts, including broadcast, cable, direct mail, print and web-based media, and social media channels; and
•alternative channels, such as auctions, for selling our aged equipment inventories.
Equipment Sales Consultants and Centralized Support
Our equipment sales employees (who we refer to as “equipment sales consultants”) perform a variety of functions, such as servicing customers at our stores, calling on existing customers, and soliciting new business at farming, construction and industrial sites. We develop customized marketing programs for our sales force by analyzing each customer group for profitability, buying behavior and product selection. All members of our sales force are expected to participate in internal and external manufacturer-sponsored training sessions to develop product and application knowledge, sales techniques and financial acumen. Our shared resources group provides centralized sales and marketing support for our field operations, and coordinates centralized media buys, strategic planning, sales support, training, and manages advertising reimbursement opportunities from our suppliers. In addition, we enable our regional and area managers and their sales teams to develop localized sales and marketing strategies.
Parts Sales Managers and Service Managers
Our parts sales managers and service managers at our stores are involved in our efforts to market our parts and service offerings, taking advantage of our seasonal marketing campaigns in parts and service sales. Much of our focus on aftermarket campaigns is promoting proactive equipment inspections designed to spot and address mechanical issues before they result in costly downtime. Other proactive aftermarket initiatives include offering extended warranty and equipment maintenance packages with the equipment we sell. We believe these efforts result in improved customer experience and reduced cost of ownership for our customers as well as securing a steady and reliable stream of aftermarket sales.
8
Website
Our website, www.titanmachinery.com, is the central hub for all our marketing campaigns. We have built a large amount of content related to the equipment we sell and service, the technology used by our customers in conjunction with the equipment, and information about our Company and what we have to offer prospective employees. Used equipment inventories are one of the most highly trafficked sections of our website. Customers can search and view equipment based on type, manufacturer, price and/or store location. Pictures and descriptions of each piece of equipment are displayed, along with the equipment specifications, price and store location. Parts manufactured by the CNH Industrial brands and other suppliers are marketed and can be purchased directly through our website. Other sales and financing programs are also marketed through our website. Customers can view construction rental equipment rates and specifications on the website and submit rental requests by completing a simple form. All external job openings are listed as well as detailed information about our apprenticeship and internship programs, tech school sponsorships and other student programs. Finally, our website provides dealer locator search functions and contact information for the various departments at each of our stores.
Print, Broadcast and Web-Based Advertising Campaigns
Each year we initiate numerous targeted direct mail, print and broadcast advertising and marketing campaigns. CNH Industrial and other suppliers periodically provide us with advertising funds, which we primarily use to promote new and used equipment, parts, proactive service offerings including uptime inspections and preventative maintenance, and financing programs.
Channels for Selling Aged or Excess Equipment Inventory
In certain circumstances, we sell aged equipment inventories through the use of alternative channels such as onsite and online auctions.
Competition
The agricultural and construction equipment sales and distribution industries are highly competitive and fragmented. Our competitors range from multi-location, regional operators to single-location dealers and include dealers and distributors of competing equipment brands, including Deere, Caterpillar, Kubota, and the AGCO brands, as well as other dealers and distributors of the CNH Industrial family of brands. Competition among equipment dealers, whether they offer agricultural or construction products or both, is primarily based on the price, value, reputation, quality and design of the products, technology, customer service including repair and maintenance service provided by the dealer, the availability of equipment and parts, and the proximity of stores. While we believe we compete favorably on each of these competitive factors, our sales and margins may be impacted by (i) aggressive pricing competition by equipment manufacturers or their dealers, (ii) our ability to obtain higher service margins based on our service quality and reputation, and (iii) our ability to attract new and retain existing customers based on the availability and quality of the products we offer and our local relationships and reputation.
We are one of the established regional-scale agricultural and construction equipment dealers in the United States. The number of other agricultural and construction equipment dealers operating on a regional scale is limited. Our primary regional-scale competitors include RDO Equipment Co., Butler Machinery Company, Ziegler Inc., Brandt Holdings Co., Wagner Equipment Co., 21st Century Equipment, LLC, AKRS Equipment Solutions, Inc., C & B Operations, LLC, and Van Wall Equipment, Inc.
Corporate Information
We were incorporated as a North Dakota corporation in 1980 and reincorporated in Delaware in December 2007 prior to our initial public offering. Our executive offices are located at 644 East Beaton Drive, West Fargo, ND 58078-2648. Our telephone number is (701) 356-0130. We maintain a website at www.titanmachinery.com. We make available, free of charge, copies of our annual report on Form 10-K (the "Form 10-K"), quarterly reports on Form 10-Q, current reports on Form 8-K and amendments to those reports filed or furnished pursuant to Section 13(a) or 15(d) of the Securities Exchange Act of 1934, as amended (the “Exchange Act”), on our website, www.titanmachinery.com, as soon as reasonably practicable after filing such material electronically or otherwise furnishing it to the Securities and Exchange Commission ("SEC"). We are not including the information on our website as a part of, or incorporating it by reference into, this Form 10-K.Our SEC filings are also available at www.sec.gov.
9
Intellectual Property
We have registered trademarks for certain names and designs used in our business and have trademark applications pending for certain others. We operate our North American and European stores under the Titan Machinery name, and plan to convert our Australian stores to the Titan brand in the near future. Case IH, Case and New Holland are registered trademarks of CNH Industrial, which we are authorized to use pursuant to the terms of the CNH Industrial Dealer Agreements. We also license trademarks and trade names from other suppliers of equipment to us.
Product Warranties
Product warranties for new equipment and parts are provided by the original equipment manufacturer (“OEM”). The term and scope of these warranties vary greatly by OEM and by product. At the time equipment is purchased, we also offer customers the option of purchasing extended warranty protection provided by the OEM or through various third-party warranty providers. We are paid by the OEM for repairs we perform on equipment under warranty. We generally sell used equipment "as is" and without OEM warranty unless the original warranty period has not expired and is transferable. We also offer extended warranty programs on certain used equipment through various third-party warranty providers.
Seasonality & Weather
The agricultural and construction equipment businesses are highly seasonal, which causes our quarterly results and our cash flow to fluctuate during the year. Our customers generally purchase and rent equipment in preparation for, or in conjunction with, their busy seasons. For farmers, the busy seasons are the planting and harvesting seasons. For construction customers, the busy season is typically the second and third quarters of our fiscal year for much of our footprint, subject to weather conditions. Our parts and service revenues are typically highest during our customers' busy seasons as well, due to the increased use of their equipment during this time, which generates the need for more parts and service work. Weather conditions impact the timing of our customers' busy times, which may cause our quarterly financial results to differ between fiscal years. In addition, the fourth quarter typically is a significant period for equipment sales in the U.S. because of our customers’ year-end tax planning considerations, the timing of dealer incentives and the increase in availability of funds from completed harvests and construction projects.
Seasonal weather trends, particularly severe wet or dry conditions, can have a significant impact on regional agricultural and construction market performance by affecting crop production yields and the ability to undertake construction projects. Weather conditions that adversely affect the agricultural or construction markets would have a negative effect on the demand for our products and services.
In addition, numerous external factors such as credit markets, government subsidies, commodity prices, production yields, input costs, and other circumstances may disrupt normal purchasing practices and buyer sentiment, further contributing to the seasonal fluctuations.
Human Capital
We recognize that our success is highly dependent upon the talents and dedication of our employees, an inclusive and engaged workforce composed of individuals with diverse backgrounds and ideas, and the maintenance of a healthy and safe work environment.
Employee Recruitment and Inclusion
We strive to attract the best talent from a variety of sources to meet the current and future needs of our business. We have established relationships with many high schools, trade schools and colleges across our footprint, which we utilize as a source for entry-level talent. We also actively look to the armed forces for opportunities to hire hard-working, responsible veterans. Additionally, we believe it is incumbent upon all of our managers to continuously monitor their local markets for experienced individuals who might be successful additions to our organization. We seek a workforce that reflects the communities in which we operate, and strive to create diverse, equal and inclusive workplaces where our employees have the opportunity to achieve their full potential. Our Compensation Committee annually reviews our diversity and inclusion strategy which includes various initiatives across our footprint to recruit minorities, women, and veterans, as we attempt to diversify our workforce. We also strive to build a culture of inclusion that leverages the strengths of all of our employees. From new hire orientation to management and leadership training, we are focused on developing global mindsets, breaking unconscious biases and demonstrating the business case for diversity across the Company.
10
Compensation Programs and Employee Benefits
We conduct regular assessments of our pay and benefit practices. Our compensation programs are designed to attract, retain, motivate and reward employees who must operate in a highly competitive, fast-paced environment. In general, our compensation programs consist of competitive, market-based salaries or hourly rates, commissions for employees in front-line customer facing sales roles, cash performance bonuses, long-term equity-based incentives for eligible employees, health, dental, and vision insurance benefits, an employee wellness program to promote and reward healthy lifestyles, health savings and flexible spending accounts, a 401(k) plan, paid time off, family leave, an employee assistance program which provides mental health and wellness services, tuition assistance, and other benefit programs. Programs and benefits differ for our international operations for various reasons, such as national and local legal requirements, economic conditions, and market practices.
Training and Development
We devote significant resources to staff training and development, including tuition assistance for career-enhancing academic programs. Our training and development programs are designed to facilitate the development and advancement of talent from within our organization to ensure we continuously fill our ranks with qualified employees for critical positions in the organization. Employees are supported for growth within their current positions through technical and skill-specific training. They are also offered development programs that can assist employees with movement into leadership positions or transitioning to other positions within the Company. Members of our training and development team collaborate with employees from our various operations teams to identify our strategic training needs and prioritize the development of appropriate training content.
Employee Engagement and Retention
We conduct periodic comprehensive employee surveys designed to monitor overall employee engagement and identify actions that can be taken to improve our employees’ motivation and job satisfaction. Data collected in the periodic employee surveys is used to track progress against our internal goals and identify areas of interest and concern for our employees. Our performance review process also stresses employee engagement by providing employees and managers a format to discuss more intentionally how an employee fits into a particular role, a team, and the Company as a whole. Through these performance review discussions, employees can see the bigger picture of how their individual positions and teamwork tie together to impact the Company and ultimately our shareholders.
Management continually monitors employee turnover data, which is supplemented with additional data from exit surveys, to assist in determining the reasons for voluntary employee terminations. The turnover rate of our service technicians is also monitored closely by management, as the retention of skilled service technicians is critical to our success. Demand for service technicians across the country is very high, and turnover in this role is also traditionally high for all equipment dealers.
Health and Safety
Employee health and safety is of paramount importance to us. We strongly believe that a safe work environment will help us gain a competitive advantage, and that doing what is right, honest and ethical is essential to developing trust with our partners. Through proactive management, training, and employee accountability, we strive to embed safety into every level of our Company. This includes providing a safe place to work, safety training relevant to the employee's position, and following all safety and environmental regulations. Our tiered safety/risk management program promotes active employee engagement at all levels across our footprint. Our program is overseen by our Human Resources Department and managed at the enterprise level by our EHS Manager and assisting team who in turn directly collaborate with individual store coordinators to communicate new policies and directives, respond to questions and incidents, conduct mandatory monthly safety meetings, and provide on-site training. We ensure that safety performance data is tracked, aggregated, and reviewed on an ongoing basis across our organization. Our risk/management team collects data on recordable injury rates, serious injury rates, and near misses from each of our facilities, and engages in a root cause analysis and identifies corrective action to prevent future occurrences. The results are shared with employees at respective store locations, and the data is reviewed monthly by the executive leadership team and shared with the Board on a quarterly basis.
Performance Management
We have developed an employee performance management program that is consistently applied throughout our U.S. operations. The core goal of our performance management process is to develop and maintain a high-performing organization that is positioned to meet our business objectives. Our performance management program focuses on enabling staff employees and their managing supervisors to gain alignment through:
•structured, role specific goals that align with business objectives and our Company values giving our employees clear insight into how their position impacts their team, location and the Company
11
•clear, organization-wide expectations that managers and staff employees monitor progress of their performance and goals with regular coaching sessions, periodic evaluations; and
•semi-annual performance discussions that allow for employees and their supervisors to have effective conversations regarding contributions to their role, teamwork, customer experience and professional development opportunities.
Commitment to Core Values and Ethical Culture
Our employees are guided by our corporate core values of: “Our People”, “Integrity”, “Excellence”, and “Teamwork.” We promote these values from the top down. In every business decision and transaction, we expect our employees and business partners to do the right thing by conducting business with integrity, while complying with all laws, rules and standards of conduct that apply to our Company in the many countries where we do business. In addition, we promote a commitment to ethics and compliance through our Code of Ethics and Business Conduct that addresses issues such as protection and proper use of Company assets, compliance with applicable laws and regulations, accuracy and preservation of records, accounting and financial reporting, conflicts of interest, and insider trading. We regularly train our employees on these policies and expect their full compliance.
Community Engagement
We are committed to being a good neighbor and supporting the communities where we are located. We encourage our employees to share the same commitment, and we assist them in this mission by offering annual paid volunteer time to support charities and community service projects. We also offer annual paid time off for employees who are active volunteers in their local fire departments or first responder programs.
Employees
As of January 31, 2024, we employed 3,338 people on a full-time basis, 2,282 in the U.S., 721 in Europe and 335 in Australia, and an additional 266 part-time employees. We do not regularly use independent contractors in our business operations. To date, we have not experienced any work stoppages as a result of labor disputes, and we consider our relationship with our employees to be good. Our employees are not covered by a collective bargaining agreement.
Environmental and Other Governmental Regulation
We are subject to a wide range of environmental laws and regulations, including those governing discharges into water, air emissions, storage of petroleum substances and chemicals, handling and disposal of solid and hazardous wastes, remediation of various types of contamination, and otherwise relating to health, safety and protection of the environment.
Our business involves the generation, use, handling, and disposal of hazardous or toxic substances and wastes and the use of above ground and underground storage tanks (ASTs and USTs). Operations involving the management of wastes and the use of ASTs and USTs are subject to requirements of the Resource Conservation and Recovery Act, analogous state statutes, and their implementing regulations. Pursuant to these laws, federal and state environmental agencies have established approved methods for handling, storing, treating, transporting, and disposing of regulated substances and wastes with which we must comply.
We also are subject to laws and regulations governing responses to any releases of contamination at or from our facilities or at facilities that receive our hazardous wastes for treatment or disposal. The federal Comprehensive Environmental Response, Compensation and Liability Act and similar state statutes, can impose strict and joint and several liability for cleanup costs on those that are considered to have contributed to the release of a "hazardous substance."
We also are subject to the federal Clean Water Act, analogous state statutes, and their implementing regulations which, among other things, prohibit discharges of pollutants into regulated waters without permits, require containment of potential discharges of oil or hazardous substances, and require preparation of spill contingency plans.
Global climate concerns related to greenhouse gas emissions have led to varying degrees of international and domestic legislative and regulatory responses. While the Australian government is further investigating the potential adoption of increased disclosures related to climate change and mitigation efforts, the European Union (EU) recently adopted the European Sustainability Reporting Standards (ESRS) and the Corporate Sustainability Reporting Directive (CSRD) that will require robust disclosure of certain social and environmental information and data. We expect to be subject to these disclosure requirements for our European entities starting in 2026 and must include our non-European operations starting in 2029. In addition, the SEC recently adopted enhanced disclosure requirements for public companies regarding climate change risks and we expect to be subject to these new SEC climate change disclosure rules starting in 2026.
12
We have incurred, and will continue to incur, costs and capital expenditures to comply with these environmental laws and regulations. We believe that our operations currently are conducted in substantial compliance with all applicable regulations. None of our dealerships has been subject to any material liabilities in the past, nor do we know of any fact or condition that would result in any material liabilities being incurred in the future.
In addition to the environmental regulations discussed above, we are subject to numerous federal, state, and local laws regulating the conduct of our business, including those relating to sales and marketing, taxation, employment practices, working conditions, data privacy, and corruption. The foreign countries and domestic states that we operate in, subject us to a significant number of regulatory jurisdictions. We believe that we are currently in material compliance with laws and regulations applicable to our business operations.
ITEM 1A. RISK FACTORS
The following risks should be considered in conjunction with Item 7, Management's Discussion and Analysis of Financial Condition and Results of Operations, including the risks and uncertainties described in the forward-looking statements, and our financial statements and the related notes appearing under Item 8, Financial Statements and Supplementary Data, of this Form 10-K. The following is a cautionary discussion of risks, uncertainties and assumptions that we believe are material to our business. These risks may affect our operating results and, individually or in the aggregate, could cause our actual results to differ materially from past and projected future results. Some of these risks and uncertainties could affect particular revenue sources or segments, while others could affect our full business. Although risks are organized by headings, and each risk is discussed separately, many are interrelated. Except as required by applicable law, we undertake no obligation to publicly update forward-looking statements, whether as a result of new information, future events, or otherwise. You should, however, consult any subsequent disclosures we make from time to time in materials filed with the SEC.
Risks Related to our Reliance on CNH Industrial
We are substantially dependent upon CNH Industrial, our primary supplier of equipment and parts inventory.
The substantial majority of our business involves the sale and distribution of new equipment and aftermarket parts supplied by CNH Industrial and the servicing of equipment manufactured by CNH Industrial. In fiscal 2024, CNH Industrial supplied approximately 75% of the new equipment sold in our Agriculture segment, 81% of the new equipment sold in our Construction segment, 51% of the new equipment sold in our Europe segment and 58% of the new equipment sold in our Australia segment, and supplied a significant portion of our parts inventory. The success of our stores, and our business as a whole, is dependent on CNH Industrial in several key respects.
First, we rely on CNH Industrial for new equipment and parts inventory. Our ability to maintain or grow market share is dependent on CNH Industrial’s ability to design, manufacture, allocate and deliver to our stores at the right time high quality and desirable products that compare favorably to those of our principal competitors in terms of price, quality, functionality, features, connected and digital solutions, and autonomy. Supply chain issues, labor disputes such as strikes, and labor shortages have in the past, and could in the future, diminish the manufacturing output of CNH Industrial's plants, resulting in our stores not receiving inventories in the expected or required quantities and timelines necessary to satisfy customer demand. Any failure of CNH Industrial to offer competitive products, or delays in bringing strategic new products to market or delivery of ordered products to our stores could have a material adverse effect on our business, results of operations and financial condition.
Second, CNH Industrial supports our business by providing inventory financing, financial assistance and marketing support including the following:
•Floorplan payable financing for the purchase of a substantial portion of our equipment inventory;
•Retail financing used by many of our customers to purchase CNH Industrial equipment from us;
•Incentive, financing, and discount programs offered from time to time that enable us to price our products more competitively; and
•Promotional and marketing activities on national, regional and local levels.
Our financial performance is dependent on CNH Industrial's continued commitment to these offerings, at a level that allows us to be competitive in our markets.
Third, CNH Industrial provides product warranties and, in some cases, extended warranties to our customers. Our stores perform warranty work for equipment under these product warranties, and we direct bill CNH Industrial as opposed to invoicing the customer. At any particular time, we have significant receivables from CNH Industrial for warranty work performed. CNH Industrial’s commitment to its product warranties is important to both our market share success and our warranty related parts and service revenue.
13
CNH Industrial may be adversely impacted by global economic conditions and economic downturns, industry declines, natural disasters, labor strikes or similar disruptions, changes in interest rates, energy prices, inflation, financial performance and liquidity concerns, supply shortages or rising raw materials costs, failed strategic initiatives, or other adverse events. Our business, results of operations, and financial condition could be materially adversely affected as a result of any event that has a materially adverse effect on CNH Industrial.
Furthermore, our financial performance and future success are highly dependent on the overall reputation, brand and success of CNH Industrial in the agricultural and construction equipment manufacturing industries, including its ability to maintain a competitive position in product innovation, product quality, and product pricing.
The terms of our CNH Industrial dealer agreements subject us to restrictions that may adversely impact our business.
We have entered into CNH Industrial Dealer Agreements under which we sell CNH Industrial’s branded agricultural and construction equipment, along with aftermarket parts and repair services. Subject to applicable state statutes that may govern the dealer-manufacturer legal relationship, CNH Industrial may terminate our CNH Industrial Dealer Agreements immediately in certain circumstances, following written notice and cure periods for certain breaches of the agreement, and for any reason under our Case Construction agreement following 120 days' prior written notice. If CNH Industrial were to terminate all or any of its CNH Industrial Dealer Agreements with us, our business would be severely harmed.
Furthermore, CNH Industrial may unilaterally change its operating practices under the terms of the CNH Industrial Dealer Agreements to, among other things, change or authorize additional dealers in our sales and service areas, change its distribution system to the detriment of its dealers like us, limit our product offerings, and change pricing or delivery terms. If CNH Industrial were to change the terms of our CNH Industrial Dealer Agreements or its operating practices in a manner that adversely affects us, our business and results of operations would be harmed.
Our CNH Industrial Dealer Agreements impose significant obligations and restrictions on us.
Under our CNH Industrial Dealer Agreements, we are obligated to actively promote the sale of CNH Industrial equipment within our designated geographic areas of responsibility, fulfill the product warranty obligations of CNH Industrial (subject to CNH Industrial’s payment to us of the agreed upon reimbursement), maintain adequate facilities and workforce to service the needs of our customers, maintain equipment and parts inventories at the level deemed necessary by CNH Industrial to meet sales goals as stated in the annual business plan mutually agreed upon by us and CNH Industrial, maintain adequate working capital, and maintain stores only in authorized locations.
Consent of CNH Industrial is required for certain material changes in our ownership, governance or business structure, including the acquisition by any person or group of persons of 30% or more of our outstanding stock or 20% or more of our outstanding stock if the acquiring person or group is a competitor of CNH Industrial. This requirement may have the effect of discouraging a sale or other change in control of the Company, including transactions that may be in the best interests of our stockholders.
The acquisition of additional CNH Industrial geographic areas of responsibility and store locations in our Agriculture, Construction, Europe and Australia segments requires the consent of CNH Industrial under our CNH Industrial Dealer Agreements. CNH Industrial may decline, in its sole discretion, to consent to any acquisition of an additional CNH Industrial store location we may pursue. If CNH Industrial is unwilling to consent to any future proposed acquisition of additional dealerships, our ability to execute our acquisition strategy and grow our business may be impaired.
Our CNH Industrial Dealer Agreements require us to operate any material business activities not related to sales of CNH Industrial products or services to customers in agricultural, construction, industrial or similar markets separately from our CNH Industrial dealership business. In addition, our CNH Industrial Dealer Agreements for domestic Case Construction equipment and our CNH Industrial Dealer Agreements for international Case Construction equipment prohibit us from carrying other suppliers' products (new equipment and parts) at our domestic and international Case Construction stores that are competitive with CNH Industrial's products, unless consented to by CNH Industrial. These restrictions may discourage or prevent us from pursuing activities that we believe will grow our business.
Risks Related to Economic Conditions Affecting our Customers' Demand for our Products and Services
Our agriculture equipment sales are significantly affected by net farm income, which is influenced by factors over which we have no control.
Farmers' capital expenditures often follow a cyclical pattern, with increased equipment purchases typically occurring during boom cycles spurred by high net farm income and strong farmer balance sheets. Net farm income is influenced by factors such as:
14
•the price of agricultural commodities and the ability to competitively export agricultural commodities;
•the cost of farm inputs including value of land, seed, fertilizer, fuel, labor and other inputs;
•the demand for food products and other products made with farm commodities such as biofuels;
▪the availability of stocks from previous harvests; and
•agricultural policies, including aid and subsidies to agricultural enterprises provided by governments, policies impacting commodity prices or limiting the export or import of commodities, and alternative fuel mandates.
In addition to macroeconomic drivers of net farm income, local growing conditions also influence farmers’ buying sentiment. Therefore, droughts, excess rain, hail, and other unfavorable climatic conditions affecting certain geographic regions will adversely impact the local farmers’ buying sentiment.
The nature of the agricultural industry is such that a downturn in equipment demand can occur suddenly, resulting in negative impacts on dealers in the form of declining revenues, reduced or negative profit margins, excess new and used equipment inventories, lower inventory turns, and increased floorplan interest expenses. These downturns may be prolonged, and during these periods, our revenues and profitability could be harmed, including severely.
Demand for our parts and repair services, although not as cyclical as equipment purchases, also can be negatively affected in agricultural industry downturns and in regions affected by adverse weather or growing conditions, which result in fewer acres planted or harvested.
Our construction equipment sales are affected by several market factors over which we have no control.
Our construction equipment customers primarily operate in the natural resource, construction, transportation, agriculture, manufacturing, industrial processing and utilities industries. The construction equipment market is influenced by factors such as:
•the amount and timing of public infrastructure spending;
•the level of new residential and non-residential construction; and
•the amount of capital spending in oil and gas, forestry, agriculture and mining.
The construction industry in many of our geographical areas has experienced periodic, and sometimes prolonged, economic down cycles. During these downturns, our revenues and profitability could be adversely impacted.
Inflationary increases to cost of equipment combined with higher interest rates may negatively impact our customers' equipment purchasing decisions.
Many of our customers finance their equipment purchases. The ability to obtain affordable financing is an important part of a customer's decision to purchase agricultural or construction equipment. Periods of elevated inflation and increased interest rates will increase financing costs and installment payment obligations of our customers, which may make equipment purchases less affordable for customers and impact or delay purchasing decisions and, as a result, our revenue and profitability may decrease.
Risks Related to the Competitive Conditions of the Equipment Distribution Industry
The equipment distribution market is subject to sudden supply-demand imbalances arising from factors over which we have no control, which can affect our equipment sales and margins.
Over-production of equipment by one or more manufacturers, or a sudden reduction in demand for equipment, can dramatically disrupt the equipment market, cause downward pressure on our equipment profit margins and increase our carrying costs of higher inventory levels. Customer leasing arrangements in the agriculture and construction equipment industries may also impact the level of industry-wide equipment inventory supplies. When leased equipment comes off lease, there may be an increase in the availability of late-model used equipment, which can create a used equipment inventory over-supply condition and put pressure on our used equipment sales and margins, and have an adverse effect on values of our used equipment inventory and rental fleet equipment. Similarly, rental house companies engage in regular sales of rental fleet units, which can further disrupt the supply-demand balance in the used equipment department. We have no control over or ability to significantly influence any of the foregoing factors affecting the equipment distribution markets.
15
Our industry is highly competitive.
The agricultural and construction equipment distribution (including parts and service) and rental industries are highly competitive and fragmented, with large numbers of companies operating on a regional or local basis. Historically, our competitors have competed aggressively on the basis of pricing or inventory availability, resulting in decreased margins on our sales to the extent we choose to match our competitors' pricing. To the extent we choose not to match or remain within a reasonable range of our competitors' pricing, we may lose sales and market share. In addition, to the extent CNH Industrial's equipment manufacturer competitors (such as Deere, Caterpillar, Komatsu, Volvo Group, and AGCO) provide their dealers with more innovative or higher quality products, lower cost products, better customer financing, or have more effective marketing programs, or the CNH Industrial reputation is tarnished in the marketplace or with our customers, our ability to compete and our results of operations could be adversely affected. In addition, e-commerce companies selling parts have negatively impacted dealers' parts sales and margins, and we expect that this competitive pressure will continue to increase in the future.
The recent agreements of equipment manufacturers, including CNH Industrial, to provide farmers and independent repair shops access to diagnostic tools, combined with an enactment of proposed right to repair legislation, could negatively impact our repair services business.
Proposed state and federal legislation has been introduced, including in states in our footprint, that generally would require the manufacturers of products to provide the purchaser and/or independent repair technicians with documents, diagnostic software, and other information that would allow the equipment to be repaired without having it returned to the dealer for repair. Separately, the American Farm Bureau Federation and CNH Industrial brands, Case IH and New Holland, signed a memorandum of understanding in March 2023 (the “Memorandum of Understanding”) that allows farmers and independent repair shops to access CNH Industrial's brand manuals, tools, product guides and information to self-diagnose and self-repair machines, as well as provides support from CNH Industrial brands for farmers and independent repair shops to directly purchase diagnostic tools. The Memorandum of Understanding follows a similar format as agreed to by Deere in January 2023 which, in turn, follows the auto industry format. It is difficult to predict the long-term impact that right to repair legislation, if enacted in any area of our footprint, or the Memorandum of Understanding, will have on our repair services business.
Risks Related to Supply Chain
Our business has been adversely impacted by supply chain distributions.
Our business has been adversely impacted by supply chain disruptions which has caused variability and unpredictability in lead times. Starting in calendar year 2020, our suppliers experienced significant disruptions in upstream supply chain production and shipping delays. This caused lead times from our suppliers to extend beyond normal time frames. Recently, these disruptions have largely been mitigated and lead times have condensed back down to normal levels. When lead times condense, our manufacturers may be able to produce and deliver more of our orders in a shorter period of time than originally anticipated, causing variability in our inventory balances from quarter to quarter or year over year.
Risks of International Operations
Our international operations expose us to risks and uncertainties.
We currently operate dealership locations in Bulgaria, Germany, Romania, Ukraine and Australia. In fiscal 2024, total Europe and Australia segment revenues were 13.8% of our consolidated total revenue. As of January 31, 2024, total Europe and Australia segment assets were 25.4% of our consolidated total assets.
Our operations in international markets subject us to risks and uncertainties arising from the differing legal, political, social and regulatory environments and economic conditions in the countries in which we operate. These risks include:
•difficulties in implementing our business model in foreign markets and operating our business across a significant number of different time zones;
•costs and diversion of domestic management attention related to oversight of international operations;
•unexpected adverse changes in export duties, currency or payment controls that impact our ability to repatriate funds from the country, quotas and tariffs and difficulties in obtaining import licenses;
•cyclicality of demand in European Union member states for agricultural equipment, based on availability of European Union government subsidy programs and tax incentives;
•unexpected adverse changes in foreign laws or regulatory requirements;
16
•compliance with a variety of tax regulations, foreign laws and regulations;
•compliance with the U.S. Foreign Corrupt Practices Act of 1977, as amended, and other U.S. laws that apply to the international operations of U.S. companies which may be difficult and costly to implement and monitor, can create competitive disadvantages if our competitors are not subject to such laws, and which, if violated, may result in substantial financial and reputational harm;
•fluctuations in foreign currency exchange rates to which we are exposed may adversely affect the results of our operations, the value of our foreign assets and liabilities and our cash flows;
•the laws of the European countries in which we operate, unlike U.S. states, do not include specific dealer protection laws and, therefore, we may be more susceptible to actions of suppliers that are adverse to our interests such as termination of our dealer agreements for any reason or installing additional dealers in our designated territories; and
•geopolitical or economic instability in the regions in which we operate, including the impact of the Russian invasion of Ukraine.
The Russian-Ukraine conflict has presented significant challenges and risks for our Ukraine operations.
The Russian military occupation of Ukraine has significantly disrupted our Ukrainian operations. While all of our Ukrainian stores are open, the outcome of the Russian military operation remains unclear, and we cannot predict the impact this conflict will have on our Ukrainian operations. In fiscal 2024, revenues of our Ukrainian subsidiary were 1% of the Company total Revenue and as of January 31, 2024, the assets of our Ukraine subsidiary were 2% of the Company’s total Net Assets. The military conflict and related political instability, if it intensifies, may make it impossible for us to effectively operate our Ukraine dealerships, which may result in our decision to cease operations in Ukraine. This would result in asset write-offs and a loss in revenues and profits. See additional information in Note 1 to the Consolidated Financial Statements at Item 8, Financial Statements and Supplementary Data, of this Form 10-K. Even if we continue operations, the military conflict has significantly impacted, and we expect that it will continue to impact, our customers' liquidity and purchasing decisions for our products and services. If no crops are planted or a growing season is negatively impacted, this occurrence will limit our Ukrainian subsidiary's ability to generate cash and repay outstanding debt, and as a result of imposed currency exchange controls and other restrictions, restrict our ability to manage our cash held in Ukraine and our investment in our Ukrainian business. The military intervention has disrupted our Ukrainian work force, with certain employees being called to active military duty and other employees leaving the country and working remotely. Additional risks related to our operations in Ukraine, likely made more acute by the impact of the military conflict, include further devaluation of the local currency, increased interest rates and increased inflation.
These factors, in addition to others, have negatively impacted our Ukrainian subsidiary's financial condition and results of operations in fiscal year 2024 and may continue to impact our business in Ukraine in future periods, including on a more acute basis.
17
Risks Related to Financial Matters
Our financial performance is dependent on our ability to effectively manage our inventory.
Our dealership network requires substantial inventories of equipment and parts to be maintained at each store and Company-wide to facilitate sales to customers on a timely basis. Our equipment inventory has traditionally represented a significant portion of our total assets. We need to maintain a proper balance of new and used equipment to assure satisfactory inventory turnover and to minimize floorplan financing costs.
Our orders for the purchase of new equipment and parts are based primarily on projected demand. If actual sales are materially less than our forecasts, for example because of a significant drop in net farm income, weather disruptions in our agricultural growing regions, or a construction industry recession, we would experience an over-supply of new equipment and parts inventory. An over-supply of new equipment inventory will generally cause downward pressure on our product sale prices and margins, decrease our inventory turns, and increase our floorplan financing expenses.
Our used equipment is generally acquired as trade-ins from customers in connection with equipment sales to those customers. Equipment inventories are stated at the lower of cost or net realizable value. Adjustments to market value of inventory are recognized as a cost of sales, negatively impacting earnings, in the periods in which they occur. Our estimates of net realizable value for our used equipment, as determined at the time of the trade-in or in connection with an acquisition of a new dealership, may prove to be inaccurate, given the potential for sudden changes in market conditions and other factors beyond our control. Moving from our normal retail marketing channel to more aggressive marketing channels for specific pieces or categories of equipment inventory, particularly as equipment inventory ages, will generally result in lower sales prices. Pricing and other terms of sale of used equipment can be significantly adversely affected by the limited market for certain types of used equipment.
Our level of indebtedness could limit our financial and operational flexibility.
As of January 31, 2024, our indebtedness included floorplan payable financing, real estate mortgage financing arrangements that are secured by real estate assets and other long-term debt. In addition, we have obligations under our lease agreements for many of our store locations and corporate headquarters. Our level of indebtedness could have important consequences. For example, it could:
•increase our vulnerability to adverse economic and industry conditions;
•limit our flexibility in planning for, or reacting to, changes in our business and the industry in which we operate; and
•limit our ability to obtain additional financing for working capital, capital expenditures, acquisitions or general corporate purposes.
We expect to use cash flow from operations and borrowings under our credit facilities to fund our operations, debt service and capital expenditures. However, our cash flow and ability to borrow depends on our future performance, which will be affected by financial, business, economic and other factors, many of which may be beyond our control.
The credit agreements governing our indebtedness restrict our ability to engage in certain corporate and financial transactions, and require us to satisfy financial covenants.
The credit agreements governing our indebtedness contain covenants that, among other things, may limit or place conditions on our ability to:
•incur more debt;
•make investments;
•create liens;
•merge, consolidate, or make certain acquisitions;
•transfer and sell assets, or divest of dealership stores;
•pay dividends or repurchase stock; and
•issue equity instruments.
18
Our credit facilities with CNH Industrial Capital, DLL Finance, and certain of our real estate lenders require us to satisfy a net leverage ratio and fixed charge coverage ratio on an ongoing basis, measured at the end of each fiscal quarter. Under the Bank Syndicate Agreement, if our excess availability (i.e., borrowing base capacity less outstanding loan balance and certain reserves) falls below a certain threshold, we become subject to a minimum fixed charge coverage ratio. Our ability to borrow under these credit agreements depends upon compliance with these financial covenants.
Our failure to satisfy any covenant, absent a waiver or amendment, would cause us to be in default under our credit facilities and would enable our lenders to accelerate payment of the outstanding indebtedness. Each of our credit agreements include cross-default provisions which state that certain types of defaults under any other indebtedness agreement will also constitute a default under that credit agreement. If an event of default occurred, and the lender demanded accelerated payment, we may not be able to satisfy a pay-off request, whether through internal funds or new financing.
Our variable rate indebtedness exposes us to interest rate risk.
A substantial portion of our floorplan and working capital borrowings, including the credit facilities with CNH Industrial Capital, the Bank Syndicate, DLL Finance, and our international floorplan facilities are at variable rates of interest and expose us to interest rate risk. As such, our results of operations are sensitive to movements in interest rates. There are many economic factors outside our control that have in the past and may, in the future, impact rates of interest including publicly announced indices that underlie the interest obligations related to a certain portion of our debt. Factors that impact interest rates include governmental monetary policies, inflation, recession, changes in unemployment, the money supply, and international instability impacting domestic and foreign financial markets. Any increases in interest rates could have an adverse effect on our results of operations.
We are in the process of implementing a new enterprise resource planning (“ERP”) system, and problems with the design or implementation of this ERP system could interfere with our business and operations.
We are engaged in the implementation of a new ERP system. The ERP system is designed to accurately maintain our books and records and provide information to management important to the operation of our business. Our ERP transition has required, and will continue to require, the investment of significant human and financial resources. We have, and may continue to experience, challenges as we work toward the completion of the ERP conversion. Beyond cost and scheduling, potential flaws in the implementation of an ERP system may pose risks to the Company’s ability to operate successfully and efficiently, including our ability to prepare timely and accurate SEC filings. If we are unable to successfully implement the new ERP system as planned, our financial position, results of operations and cash flows could be negatively impacted.
Moreover, if the ERP system does not effectively collect, store, process, and report relevant data for the operation of our business (whether due to equipment malfunction or constraints, software deficiencies, cybersecurity attack, and/or human error), our ability to effectively plan, forecast, and execute our business plan and comply with applicable laws and regulations will be impaired, perhaps materially. Any such impairment could materially and adversely affect our financial condition, results of operations, cash flows and the timeliness with which we report our internal and external operating results.
The agricultural and construction equipment industries are highly seasonal, which can cause significant fluctuations in our results of operations and cash flow.
The agricultural and construction equipment businesses are highly seasonal, which causes our quarterly results and cash flows to fluctuate during the year. Farmers generally purchase agricultural equipment and service work in preparation for, or in conjunction with, the planting and harvesting seasons. Construction equipment customers’ purchases of equipment and service work, as well as rental of equipment, are also seasonal in our stores located in colder climates where construction work slows significantly in the winter months. In addition, the fourth quarter typically is a significant period for equipment sales in the U.S. because of our customers’ year-end tax planning considerations, the timing of dealer incentives and the increase in availability of farmers’ funds from completed harvests and construction customers' funds from completed projects. Also, numerous external factors such as credit markets, commodity prices, weather conditions, and other circumstances may disrupt normal purchasing practices and customers’ sentiment, further contributing to the seasonal fluctuations.
We are exposed to customer credit risks.
We extend credit to our customers for parts and service work, rental charges, and also for some equipment sales in our domestic and international operations. If we are unable to manage these credit risk issues adequately, or if a large number of customers experience financial difficulties at the same time, our credit losses could increase above historical levels and our operating results would be adversely affected. Delinquencies and credit losses generally would be expected to increase if there was a worsening of economic conditions in any of our reporting segments.
19
Our rental operations subject us to risks including increased maintenance costs as our rental fleet ages, increased costs of new replacement equipment we use in our fleet, and losses upon disposition of rental fleet units.
Our rental fleet margins are materially impacted by utilization of fleet assets, which is seasonal and can fluctuate materially due to weather and economic factors. If our rental equipment ages, the costs of maintaining that equipment, if not timely replaced, will likely increase. The cost of new equipment for use in our rental fleet could also increase due to increased material costs for our suppliers or other factors beyond our control. Furthermore, changes in customer demand could cause some of our existing equipment to become obsolete and require us to purchase new equipment at increased costs.
Upon the sale of a rental fleet unit, we include in operating income the difference between the sales price and the depreciated value of the equipment sold. The market value of any given piece of rental equipment could be less than its depreciated value at the time it is sold. The market value of used rental equipment depends on several factors, including:
•market prices for like equipment;
•hours and condition of the equipment;
•time of year that the equipment is sold;
•the supply of used equipment in the market; and
•general economic conditions.
Any significant decline in the selling prices for used rental equipment, or increased costs resulting from our rental operations, could have an adverse effect on our results of operations and cash flows.
Tax Rates and New Tax Legislation - Changes in tax rates or the adoption of new tax legislation may affect our results of operations, cash flows and financial condition.
The Company is subject to taxes in the U.S. and a number of foreign jurisdictions where it conducts business. The Company’s effective tax rate has been and may continue to be affected by changes in the mix of earnings in jurisdictions with differing statutory tax rates, changes in the valuation of deferred tax assets, and changes in tax laws or their interpretation, such as the 15% global minimum tax under the Organization for Economic Cooperation and Development ("OECD") Pillar Two, Global Anti-Base Erosion Rules. In addition, the U.S. government could adopt changes to international trade agreements, tariffs, taxes and other related regulations. If the Company’s effective tax rate were to increase, or if the ultimate determination of the Company’s taxes owed is for an amount in excess of amounts previously accrued, the Company’s results of operations, cash flows and financial condition could be adversely affected.
Climate and Weather Risks
Weather conditions may negatively impact the agricultural and construction equipment markets and affect our financial results.
Weather conditions, particularly severe floods and droughts, can have a significant adverse effect on growing conditions and on regional agricultural and construction markets. Adverse weather conditions may result in fewer acres being planted or harvested by farmers, reduced crop yields on those acres that are planted, and in delays or cancellations of construction projects. This in turn could result in lower demand for our agricultural and construction equipment and services and adversely affect our results of operation. Many scientific reports predict that severe weather events can be expected to become more frequent as a result of global climate change. Furthermore, the long-term impacts of climate change, whether involving physical risks (such as the extreme weather conditions discussed above) or transition risks (such as regulatory changes discussed below) are expected to be widespread and unpredictable. As severe weather events become increasingly common, our or our customers’ operations may be disrupted, which could result in increased operational costs or reduced demand for our products and services and extended periods of disruptions could have an adverse effect on our results of operations. In addition, climate change may also reduce the availability or increase the cost of insurance for weather-related events as well as impact the global economy, including as a result of disruptions to supply chains. We anticipate that climate change-related risks will increase over time.
20
New or more stringent greenhouse gas emission standards designed to address climate change could increase costs of the equipment we purchase from our suppliers and increase our customers’ costs of operations.
There is global scientific consensus that emissions of greenhouse gases (GHG) continue to alter the composition of Earth’s atmosphere in ways that are affecting and are expected to continue to affect the global climate. These considerations have led to certain regulatory responses, including but not limited to the EU Corporate Sustainability Reporting Directive ("CSRD") and the SEC recently finalized rules requiring public companies to make disclosures regarding climate risks and related matters. We expect to be subject to the CSRD and new SEC disclosure rules beginning in 2026. The associated compliance costs are currently uncertain, we expect that they will be substantial. Various stakeholders, including legislators and regulators, shareholders and non-governmental organizations, as well as companies in many business sectors are continuing to look for ways to reduce GHG emissions.
The regulation of GHG emissions from the equipment we sell could result in additional manufacturing costs to our suppliers who, in turn, will likely pass along those costs to us. We may not be successful in passing along the equipment price increases to our customers, which could impact our results of operation and margins. To the extent that we attempt to pass along price increases to our customers, the increased costs of equipment may negatively affect their purchasing decisions or result in their decision to purchase equipment from a different brand.
Moreover, the GHG regulations could increase other input costs for our customers, such as fuel and fertilizer, and impose indirect compliance-related costs on our customers. These economic impacts could negatively impact our customers’ purchasing decisions.
Because the impact of any future GHG legislative, regulatory or product standard requirements is dependent on the timing and design of mandates or standards, we are unable to predict with any specificity their potential impact at this time.
Risks of our Growth Strategy
If our acquisition plans are unsuccessful, we may not achieve our planned long-term revenue growth.
Our ability to grow through the acquisition of additional CNH Industrial geographic areas of responsibility and store locations or other businesses will be dependent upon the availability of suitable acquisition candidates at acceptable values, our ability to compete effectively for available acquisition candidates and the availability of capital to complete the acquisitions. We may not successfully identify suitable targets, or if we do, we may not be able to close the transactions, or if we close the transactions, they may not be profitable. In addition, CNH Industrial's consent is required for the acquisition of any CNH Industrial dealership, and the consent of our lenders may be required for certain acquisitions. CNH Industrial typically evaluates management, historical performance, and capitalization of a prospective acquirer in determining whether to consent to the sale of a CNH Industrial dealership. We may not obtain the consent of CNH Industrial or our lenders for certain acquisitions we may propose.
Our acquisitions may not be successful.
There are risks associated with acquisitions of new dealerships. These risks include incurring significantly higher than anticipated capital expenditures and operating expenses; unexpected liabilities; synergies, economies of scale and cost reductions not occurring as anticipated; failing to integrate the operations and personnel of the acquired dealerships; employee attrition at the acquired business; disrupting our ongoing business; diluting the effectiveness of our management; failing to maintain uniform standards, controls and policies; and impairing relationships with employees and customers as a result of changes in management. To the extent we do not successfully avoid or overcome the risks or problems related to acquisitions, our results of operations and financial condition could be adversely affected. Future acquisitions also may have a significant impact on our financial position and capital needs, and could cause substantial fluctuations in our quarterly and yearly results of operations or result in a diversion of management's time and attention from our core business. Acquisitions could include significant intangible assets and goodwill. If the acquisitions giving rise to these intangible assets are unsuccessful, this may result in future impairment charges that would reduce our stated earnings.
Human Capital Risks
Our business success depends on attracting and retaining qualified personnel.
Our success in executing our operating and strategic plans depends on the efforts and abilities of our management team and key employees, including the managers of our field operations and our country managers in our international operations. The failure to attract and retain members of our management team and key employees will harm us.
21
In recent years, the equipment industry has experienced a shortage of qualified service technicians. If this trend worsens and we are not able to hire and retain qualified service technicians at acceptable levels, our ability to satisfy customers' service needs would be negatively impacted. Moreover, the technician shortage may increase our service technician compensation expense, and reduce our gross margins on service work.
In addition, in recent years it has been increasingly difficult to hire and retain employees, which we believe is primarily attributable to market conditions which in turn has created increased competition in labor markets. Difficulties in hiring and retaining employees and heightened competition for employees may impact our ability to serve customers, increase our costs, and impair our efficiency and effectiveness and our ability to pursue growth opportunities.
Labor organizing activities could negatively impact us.
Although none of our employees are covered by a collective bargaining agreement, there have been attempts to unionize our store personnel. The unionization of all or a substantial portion of our workforce could result in work slowdowns or stoppages, increased overall costs, reduced operating margins and reduced efficiency of our operations at the affected locations, and reduced flexibility in running our business competitively.
Liability Risks
Selling and renting agricultural and construction equipment, selling parts, and providing repair services subject us to liability risks that could adversely affect our financial condition and reputation.
Products sold, rented or serviced by us may expose us to potential liabilities for personal injury or property damage claims that arise from the use of those products. Our commercial liability insurance may not be adequate to cover significant product liability claims, or we may not be able to secure such insurance on economically reasonable terms. An uninsured or partially insured claim for which indemnification from the manufacturer is not available could have a material adverse effect on our financial condition or results of operations. Furthermore, if any significant claims are made against us or against CNH Industrial or any of our other suppliers, our business may be adversely affected by any related negative publicity or any adverse impact on the reputation or brand of any of our suppliers, including CNH Industrial.
Stock Price Volatility
Our common stock price has fluctuated significantly and may continue to do so in the future.
The price at which our common stock trades may be volatile and could be subject to significant fluctuations in response to our operating results and financial condition as set forth in our earnings releases, guidance estimates released by agricultural or construction equipment manufacturers that serve the markets in which we operate, announcements by our competitors, analyst recommendations, our ability to meet or exceed analysts’ or investors’ expectations, fluctuations in the price of crop commodities and natural resources, the condition of the financial markets, and other factors. Quarterly fluctuations resulting from the seasonality of our business may cause our results of operations and cash flows to underperform in relation to the expectations of financial analysts or investors, which may cause volatility or decreases in our stock price.
22
Data Security Risks
Security breaches and other disruptions could compromise our information systems and expose us to liability, which would cause our business and reputation to suffer.
The efficient operation of our business is dependent on our information technology systems. We use information technology systems to record, process and summarize financial information and results of operations for internal reporting purposes and to comply with regulatory financial reporting, legal and tax requirements. Additionally, in the ordinary course of our business, we collect and store sensitive data, including proprietary business information of our customers and suppliers, as well as personally identifiable information of our customers and employees, in our data centers and on our networks. The secure operation of these information technology networks and the systems of the third parties with whom we do business and the processing and maintenance of information is critical to our operations. Despite the security measures and business continuity plans, put in place by us and our third party providers, our information technology and infrastructure may be vulnerable to damage, disruptions or shutdowns due to attacks by hackers or breaches due to employee error or malfeasance or other disruptions arising from power outages, telecommunication failures, terrorist acts, including state-sponsored cyberterrorism targeted at the U.S., natural disasters, or other catastrophic events. The occurrence of these events could compromise our networks or the networks of our third-party providers, and the information stored there could be accessed, publicly disclosed, lost or stolen. In addition, the rapid evolution and increased adoption of artificial intelligence technologies and the potential for abuse of these technologies by bad actors amplifies these concerns. Any such access, disclosure or other loss of information could result in legal claims or proceedings, liability or regulatory penalties under laws that protect the privacy of personally identifiable information, disrupt our operations, and damage our reputation, which could adversely affect our business, results of operations, and financial condition. In particular, given our Europe segment operations, the European Union General Data Protection Regulation imposes stringent data protection requirements and provides significant penalties for noncompliance. In addition, as security threats continue to evolve and increase in frequency and sophistication, we may need to invest additional resources to protect the security of our systems.
We maintain cyber risk insurance, but this insurance may not be sufficient to cover all of our losses from any future breaches of our systems, and we cannot guarantee that applicable insurance will be available to us in the future on economically reasonable terms or at all. While we have experienced cybersecurity incidents in the past, to date, none have materially impacted the Company or our financial position, results of operations and/or cash flows.
ITEM 1B. UNRESOLVED STAFF COMMENTS
None.
ITEM 1C. CYBERSECURITY
Cybersecurity Risk Management and Strategy
We have implemented a cybersecurity governance program intended to assess, identify, and manage risks from threats to the security of our information, systems, and network. Our risk-based measures aim to proactively manage threats and prove the effectiveness of our internal controls.
Our cybersecurity governance program adopted the Center for Internet Security Critical Security Framework as the structure to help detect and mitigate threats through risk-based controls designed to protect Titan Machinery’s information, systems, and network.
We continuously review and seek to enhance our program as risks evolve and compliance requirements change. We use our internal security team and engage third-party cybersecurity companies. Together we conduct periodical assessments and ongoing enhancements to our cybersecurity posture and identify and remediate risks from cyber threats. The assessment includes reviewing third-party service providers periodically and before new engagements.
Security awareness training is provided to educate employees about cybersecurity threats and help them understand their responsibility in identifying, mitigating, and reporting security concerns or threats.
Along with other significant risks for the Company, we have sought to integrate cybersecurity into our enterprise risk management framework, by tracking key risk indicators, emerging risks and changes to the risk mitigation plan to achieve desired results.
Cybersecurity Governance
The Board is aware of the critical nature of managing risks associated with cybersecurity threats. The Audit Committee is responsible for board-level oversight of cybersecurity risk. The Audit Committee reports back to the full Board about cybersecurity and other areas within their responsibility.
23
Our cybersecurity governance program is led by our Vice President of Information Technology (“VP of IT”). The VP of IT is informed about and monitors the prevention, detection, mitigation, and remediation efforts through regular communication and reporting from professionals on the security team. Our VP of IT has been assessing and managing cybersecurity risk for the company since 2015. In total, our VP of IT has over 20 years of IT industry experience in various roles.
Team members who support our cybersecurity governance program have relevant education and industry experience. The team provides regular reports to senior management and other relevant teams on various cybersecurity threats, assessments, and findings.
Our VP of IT semi-annually and on an ad-hoc basis presents directly to the Audit Committee on cybersecurity initiatives, efforts, and security risks. The Audit Committee reports to the Board at minimum semi-annually the cybersecurity initiatives, efforts and security risks. In addition, we have an Incident Response Policy in place to inform senior management and the Board of material issues related to cybersecurity matters and to develop an appropriate response plan.
While we have experienced cybersecurity incidents in the past, to date, none have materially impacted the Company or our financial position, results of operations and/or cash flows. However, the risks from cybersecurity threats and incidents continue to increase, and the preventative actions we have taken and continue to take to reduce the risk of cybersecurity threats and incidents may not successfully protect against all such threats and incidents. We continue to invest in cybersecurity and the resiliency of our networks and to enhance our internal controls and processes, which are designed to help protect our systems and infrastructure, and the information they contain. For more information regarding the risks we face from cybersecurity threats, please see Item 1A, Risk Factors, under the heading “Security breaches and other disruptions could compromise our information systems and expose us to liability, which would cause our business and reputation to suffer.”
24
ITEM 2. PROPERTIES
Equipment Stores
As of January 31, 2024, we operated 148 full service agricultural and construction equipment stores globally in the following locations:
| Agriculture Segment | Construction Segment | Europe Segment | Australia Segment | Total | |||||||||||||||||||||||||
| United States | |||||||||||||||||||||||||||||
| North Dakota | 12 | 4 | — | — | 16 | ||||||||||||||||||||||||
| Minnesota | 15 | 3 | — | — | 18 | ||||||||||||||||||||||||
| Iowa | 12 | 3 | — | — | 15 | ||||||||||||||||||||||||
| Nebraska | 14 | 2 | — | — | 16 | ||||||||||||||||||||||||
| South Dakota | 11 | 2 | — | — | 13 | ||||||||||||||||||||||||
| Colorado | — | 3 | — | — | 3 | ||||||||||||||||||||||||
| Idaho | 6 | — | — | — | 6 | ||||||||||||||||||||||||
| Kansas | 1 | — | — | — | 1 | ||||||||||||||||||||||||
| Missouri | 1 | — | — | — | 1 | ||||||||||||||||||||||||
| Montana | 1 | — | — | — | 1 | ||||||||||||||||||||||||
| Washington | 1 | — | — | — | 1 | ||||||||||||||||||||||||
| Wisconsin | 1 | 1 | — | — | 2 | ||||||||||||||||||||||||
| Wyoming | 1 | — | — | — | 1 | ||||||||||||||||||||||||
| European Countries | |||||||||||||||||||||||||||||
| Bulgaria | — | — | 8 | — | 8 | ||||||||||||||||||||||||
| Germany | — | — | 7 | — | 7 | ||||||||||||||||||||||||
| Romania | — | — | 14 | — | 14 | ||||||||||||||||||||||||
| Ukraine | — | — | 10 | — | 10 | ||||||||||||||||||||||||
| Australian States | |||||||||||||||||||||||||||||
| New South Wales | — | — | — | 1 | 1 | ||||||||||||||||||||||||
| South Australia | — | — | — | 4 | 4 | ||||||||||||||||||||||||
| Victoria | — | — | — | 10 | 10 | ||||||||||||||||||||||||
| Total | 76 | 18 | 39 | 15 | 148 | ||||||||||||||||||||||||
Store Lease Arrangements
As of January 31, 2024, we leased 76 store facilities with lease arrangements expiring at various dates through April 30, 2042. Many of our lease agreements include fair market value purchase options, rights of first refusal, lease term extension options, or month-to-month or year-to-year automatic renewal provisions at the conclusion of the original lease period. A majority of the leases provide for fixed monthly rental payments and require us to pay the real estate taxes on the properties for the lease periods. We are generally responsible for utilities and maintenance of the leased premises. All of the leases require that we maintain public liability, property casualty, and personal property insurance on each of the leased premises. The leases generally require us to indemnify the lessor in connection with any claims arising from the leased premises during our occupation of the property.
We believe our owned and leased facilities are adequate to meet our current and anticipated needs.
In recent years, we have been strategically purchasing real estate of certain dealership locations, and have financed those purchases using long term debt. We currently own the store facilities for 68 U.S. dealership locations, six European dealership locations and one Australian dealership location. We have incurred debt financing and have been granted mortgages on most of those owned facilities in connection with incurring such debt financing. The remainder of our U.S. and international store locations are leased from third parties.
25
As part of our due diligence review prior to a dealership acquisition, we evaluate the adequacy, suitability and condition of the related real estate. Our evaluation typically includes a Phase I environmental study, and if deemed necessary, a Phase II environmental study of the real property to determine whether there are any environmental concerns. If any environmental concerns exist, we generally require that such concerns be addressed prior to acquisition of the dealership real estate.
Headquarters
We currently lease and occupy approximately 48,000 square feet in West Fargo, North Dakota for our headquarters and this lease expires on January 31, 2028. We continually review our location needs, including the adequacy of our headquarters space, to ensure our space is sufficient to support our operations. We believe there is ample opportunity for expansion in our West Fargo headquarters facility if necessary.
ITEM 3. LEGAL PROCEEDINGS
We are, from time to time, subject to claims and suits arising in the ordinary course of business. Such claims have, in the past, generally been covered by insurance. Management believes the resolution of other legal matters will not have a material effect on our financial condition, results of operation or cash flow, although the ultimate outcome of any such actions is not assured. Furthermore, our insurance may not be adequate to cover all liabilities that may arise out of claims brought against us.
ITEM 4. MINE SAFETY DISCLOSURES
Not applicable.
26
INFORMATION ABOUT OUR EXECUTIVE OFFICERS
The names, ages and positions of our executive officers are as follows:
| Name | Age | Position | ||||||||||||
| Bryan Knutson | 45 | Chief Executive Officer and President | ||||||||||||
| Robert Larsen | 38 | Chief Financial Officer and Treasurer | ||||||||||||
| David Meyer | 70 | Executive Chairman | ||||||||||||
Bryan Knutson became our Chief Executive Officer in February 2024. Bryan leverages his more than 20 years of progressive experience in sales, operations, and leadership at Titan Machinery to deliver significant value for the Company’s customers and stockholders. Bryan has been with Titan Machinery since 2002, and has performed at the highest levels as an Equipment Sales Consultant (ESC), Store Manager, Complex Manager, and held Senior Field positions including Valley Region Manager and Vice President of Titan Machinery’s North American Agriculture Equipment Business. He joined the executive leadership team in 2017 as the Company’s Chief Operating Officer and was promoted to President and Chief Operating Officer in 2022. In addition to involvement in several industry organizations, Bryan is past chairman and currently on the Board of Directors of the Pioneer Equipment Dealers Association representing Member Equipment Dealers in Minnesota, North Dakota and South Dakota and has served long tenures on both the Case IH Agriculture and Case Construction Dealer Advisory Boards.
Robert Larsen became our Chief Financial Officer in December 2022. Prior to joining us, he served as the Head of Finance for CNH Industrial’s team focused on precision technology. Prior to joining CNH Industrial, Mr. Larsen held various positions at Raven Industries starting in 2016, including Director of Finance, Director of Investor Relations and various other roles. Mr. Larsen began his career as an accountant with PricewaterhouseCoopers LLP and is a Certified Public Accountant.
David Meyer is our Executive Chairman of our Board of Directors. David co-founded Titan Machinery in 1980 on the principle of best-in-class product support, and as an early pioneer of dealer consolidation, saw the benefits of consolidating dealership resources to leverage scale, equipment and parts inventories, training, and other industry expertise to provide world-class equipment support to all our agricultural and construction customers. David served as Chief Executive Officer from 1985 until transitioning to the Executive Chairman role in February 2024. Prior to incorporating Titan in 1980, David was a partner in a JI Case/New Holland Dealership with locations in Lisbon and Wahpeton, North Dakota. Prior to that, he worked for JI Case Company. David has served on both the Case Construction and CaseIH Agriculture Dealer Advisory Boards. He is two-term past chairman and board member of the North Dakota Implement Dealers Association.
PART II
ITEM 5. MARKET FOR REGISTRANT'S COMMON EQUITY, RELATED STOCKHOLDER MATTERS AND ISSUER PURCHASES OF EQUITY SECURITIES
MARKET INFORMATION
Our common stock is listed for trading on the Nasdaq Stock Market and trades under the symbol "TITN". As of March 25, 2024, there were approximately 695 record holders of our common stock, which excludes holders whose stock is held either in nominee name or street name brokerage accounts.
DIVIDENDS
We have not historically paid any dividends on our common stock. Payment of future cash dividends, if any, will be at the discretion of the Board after taking into account various factors, including our financial condition, operating results, current and anticipated cash needs, outstanding indebtedness and plans for expansion and restrictions imposed by lenders, if any.
UNREGISTERED SALES OF EQUITY SECURITIES
We did not have any unregistered sales of equity securities during the fiscal quarter ended January 31, 2024.
SECURITIES AUTHORIZED FOR ISSUANCE UNDER EQUITY COMPENSATION PLANS
For information on securities authorized for issuance under our equity compensation plans, refer to Item 12, Security Ownership of Certain Beneficial Owners and Management and Related Stockholder Matters, of this Form 10-K.
27
REPURCHASES
We did not engage in any repurchases of our common stock during the fiscal quarter ended January 31, 2024.
STOCK PERFORMANCE GRAPH
The following graph compares the cumulative total return for the last trading day of our last five fiscal years on a $100 investment (assuming dividend reinvestment) on January 31, 2019, the last trading day before our fifth preceding fiscal year, in each of our common stock, the Russell 2000 Index and the S&P 500 Retail Index.
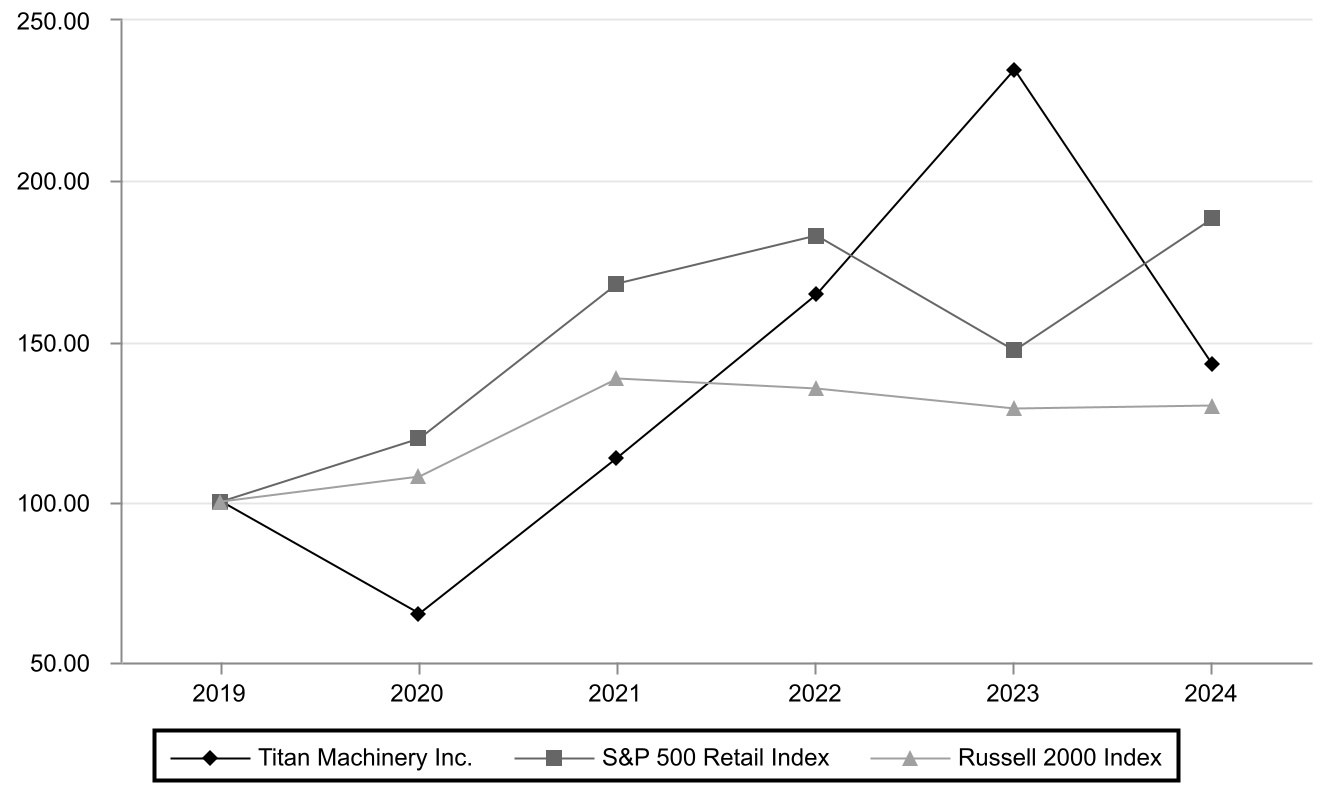
| January 31, | |||||||||||||||||||||||||||||||||||
| 2019 | 2020 | 2021 | 2022 | 2023 | 2024 | ||||||||||||||||||||||||||||||
| Titan Machinery Inc. | $ | 100.00 | $ | 65.15 | $ | 113.66 | $ | 164.35 | $ | 234.47 | $ | 142.64 | |||||||||||||||||||||||
| S&P 500 Retail Index | 100.00 | 119.51 | 167.91 | 182.83 | 147.04 | 188.29 | |||||||||||||||||||||||||||||
| Russell 2000 Index | 100.00 | 107.65 | 138.30 | 135.28 | 128.85 | 129.87 | |||||||||||||||||||||||||||||
ITEM 6. [RESERVED]
28
ITEM 7. MANAGEMENT'S DISCUSSION AND ANALYSIS OF FINANCIAL CONDITION AND RESULTS OF OPERATIONS
You should read the following discussion and analysis of our financial condition and results of operations together with our financial statements and the related notes appearing under Item 8, Financial Statements and Supplementary Data, of this Form 10-K. Some of the information contained in this discussion and analysis or set forth elsewhere in this annual report, including information with respect to our plans and strategy for our business and expected financial results, includes forward-looking statements that involve risks and uncertainties. You should review the "Information Regarding Forward-Looking Statements" in this Item 7 and "Risk Factors" presented under Item 1A for a discussion of important factors that could cause actual results to differ materially from the results described in or implied by the forward-looking statements contained in the following discussion and analysis in this annual report.
A discussion of changes in our Financial Results and Cash Flow Comparisons from fiscal year 2022 to fiscal year 2023 has been omitted from this Form 10-K, but may be found in Item 7 of Part II of our Annual Report on Form 10-K for the fiscal year ended January 31, 2023, filed with the SEC on March 30, 2023.
BUSINESS DESCRIPTION
We own and operate a network of full service agricultural and construction equipment stores in the United States, Europe, and Australia. Based upon information provided to us by CNH Industrial N.V. or its U.S. subsidiary CNH Industrial America, LLC, collectively referred to in this Form 10-K as CNH Industrial, we are the largest retail dealer of Case IH Agriculture equipment in the world, one of the largest retail dealers of Case Construction equipment in North America and one of the largest retail dealers of New Holland Agriculture and New Holland Construction equipment in the U.S. We operate our business through four reportable segments: Agriculture, Construction, Europe and Australia. Within each segment, we have four principal sources of revenue: new and used equipment sales, parts sales, service, and equipment rental and other activities.
The agricultural equipment we sell and service includes machinery and attachments for uses ranging from large-scale farming to home and garden use. The construction equipment we sell and service includes heavy construction machinery, light industrial machinery for commercial and residential construction, road and highway construction machinery, energy, and forestry operations equipment. We offer our customers a one-stop solution for their equipment needs through:
•new and used equipment sales;
•parts sales;
•equipment repair and maintenance services; and
•equipment rental and other activities.
The new equipment and parts we sell are supplied primarily by CNH Industrial. According to its public reports, CNH Industrial is a leading manufacturer and supplier of agricultural and construction equipment based on the number of units sold, primarily through the Case IH Agriculture, New Holland Agriculture, Case Construction and New Holland Construction brands. Sales of new CNH Industrial products accounted for approximately 71% of our new equipment revenue in fiscal 2024, with our single largest manufacturer other than CNH Industrial representing approximately 3% of our total new equipment revenue in fiscal 2024. We acquire used equipment for resale primarily through trade-ins from our customers and in some cases through selective purchases. We sell parts and provide in-store and on-site repair and maintenance services. We rent equipment and provide other ancillary services such as equipment transportation, GPS signal subscriptions, farm data management systems, precision farming equipment, and finance and insurance products.
Throughout our 43-year operating history, we have built an extensive, geographically contiguous network of 94 full service stores located in the United States, 39 in Europe and 15 in Australia. We have a history of growth through acquisitions, including over 60 acquisitions in 15 U.S. states, four European countries and three Australian states since January 1, 2003. We believe that there will continue to be opportunities for dealership consolidation in the future, and we expect that acquisitions will continue to be a component of our long-term growth strategy.
Certain External Factors Affecting our Business
We are subject to a number of factors that affect our business including those factors discussed in the sections in this Form 10-K entitled Item 1A, "Risk Factors" and "Information Regarding Forward-Looking Statements." Certain of these external factors include, but are not limited to, the following:
29
Russia/Ukraine Geopolitical Conflict
Since the onset of the active conflict in February 2022, most of Titan Machinery Ukraine's customers have been able to continue their work, although at a reduced capacity and schedule. The Company's business systems in Ukraine have continued to function but have been, and could continue to be, negatively impacted in the future. To date, the impact of this conflict has not been and is not expected to be material to Titan Machinery’s consolidated business operations and financial performance. However, the full impact of the conflict remains uncertain and will depend on future developments, including the severity and duration of the conflicts and their impact on regional and global economic conditions. The Company will continue to monitor the ongoing conflict between Russia and Ukraine as it is highly complex and continues to evolve.
Macroeconomic and Industry Factors
Our Agriculture and International businesses are primarily driven by the demand for agricultural equipment for use in the production of food, fiber, feed grain and renewable energy. Agriculture industry factors such as changes in agricultural commodity prices and net farm income, have an effect on our customers' sentiment and their ability to secure financing for equipment purchases. Macroeconomic and industry factors that affect commodity prices and net farm income include changing worldwide demand for agriculture commodities, crop yields and supply disruptions caused by weather patterns and crop diseases, crop stock levels, production costs, and changing U.S. dollar foreign currency exchange rates. Based on U.S. Department of Agriculture ("USDA") publications, the most recent estimate of net farm income for calendar year 2023 decreased 16% compared to calendar year 2022. The commodity prices of corn and soybeans, which are the predominant crops in our Agriculture store footprint, were at or near record prices in fiscal 2023 but decreased during fiscal 2024. Based on its February 2024 report, the USDA projected net farm income for calendar year 2024 to decrease 25.5%, as compared to calendar year 2023, but remain in line with the average inflation adjusted net farm income for the previous 20 years.
Our Construction business is primarily impacted by the demand for construction equipment for use in private and government commercial, residential, and infrastructure construction; demolition; maintenance; energy and forestry operations. Industry reports show that demand for construction equipment in our markets is driven by several factors, one of which is public infrastructure spending, including roads and highways, sewer and water. Any growth in federal allocations to public infrastructure spending over the next few years should positively impact our future results of operations. Likewise, any decline in federal allocations to public infrastructure spending over the next few years should negatively impact our future results of operations.
Seasonality & Weather
The agricultural and construction equipment businesses are highly seasonal, which causes our quarterly results and our available cash flow to fluctuate during the year. Our customers generally purchase and rent equipment in preparation for, or in conjunction with, their busy seasons, which for farmers are the planting and harvesting seasons; and which for Construction customers are typically the second and third quarters of our fiscal year for much of our Construction footprint. Our parts and service revenues are typically highest during our customers' busy seasons as well, due to the increased use of their equipment during this time, which generates the need for more parts and service work. However, weather conditions impact the timing of our customers' busy times, which may cause greater than expected fluctuations in our quarterly financial results year over year. In addition, the fourth quarter typically is a significant period for equipment sales in the U.S. because of our customers’ year-end tax planning considerations, the timing of dealer incentives and the increase in availability of funds from completed harvests and construction projects.
Seasonal weather trends, particularly severe wet or dry conditions, can have a significant impact on regional agricultural and construction market performance by affecting crop production and the ability to undertake construction projects. Weather conditions that adversely affect the agricultural or construction markets decrease the demand for our products and services.
In addition, numerous external factors such as credit markets, government subsidies, commodity prices, production yields, input costs, and other circumstances may disrupt normal purchasing practices and buyer sentiment, further contributing to the seasonal fluctuations.
Dependence on our Primary Supplier
The majority of our business involves the distribution and servicing of equipment manufactured by CNH Industrial. In fiscal 2024, CNH Industrial supplied approximately 71% of our new equipment revenue on a consolidated basis and 75%, 81%, 51%, and 58% in our Agriculture, Construction, Europe, and Australia segments, respectively, and represented a significant portion of our parts revenue. Thus, we believe the following factors have a significant impact on our operating results:
•CNH Industrial’s product offerings, reputation and market share;
•CNH Industrial’s product prices and incentive and discount programs;
30
•CNH Industrial's supply of inventory and ability to match demand levels and delivery timelines;
•CNH Industrial's offering of floorplan payable financing for the purchase of a substantial portion of our inventory; and
•CNH Industrial's offering of financing and leasing used by our customers to purchase CNH Industrial equipment from us.
Credit Market Changes
Changes in credit markets can affect our customers' ability and willingness to make capital expenditures, including purchasing our equipment. Tight credit markets, a low level of liquidity in many financial markets, and extreme volatility in fixed income, credit, currency and equity markets have the potential to adversely affect our business. Such disruptions in the overall economy and financial markets and the related reduction in consumer confidence in the economy, slow activity in the capital markets, negatively affect access to credit on commercially acceptable terms, and may adversely impact our customers' access to credit and the terms of any such credit. However, if retail interest rates continue to rise, our business may be negatively affected by customers who find financing purchases of our equipment less attractive due to higher borrowing costs.
Our business is also particularly dependent on our access to credit markets to manage inventory and finance acquisitions. We cannot predict what future changes will occur in credit markets or how these changes will impact our business.
Inflation
Inflationary pressures have led to rising inventory and supply costs as well as increased labor costs. To date, in those instances in which we have experienced cost increases, we have been able to increase selling prices to offset much of the increases and expect to continue to do so in the future.
Significant Items Impacting Our Financial Position and Results of Operations
J.J. O’Connor & Sons Pty. Ltd. Acquisition
On October 2, 2023, we acquired all of the outstanding equity interests of J.J. O’Connor & Sons Pty. Ltd. ("O’Connors"). The acquired business consisted of 15 CaseIH dealership locations and one parts center in the states of New South Wales, South Australia, and Victoria in Southeastern Australia. O'Connors has been a successful Case IH complex, and our acquisition of this entity provides the Company with the opportunity to expand our international presence into the large, well-established Australian agriculture market. Total cash consideration paid for O'Connors was $66.5 million, which was financed through available cash resources and line of credit availability. The 15 O’Connors store locations are included within our new Australia segment.
Heartland Acquisition
On August 1, 2022, we acquired all of the outstanding equity interests of three entities, Heartland Agriculture, LLC, Heartland Solutions, LLC, and Heartland Leveraged Lender, LLC, (collectively referred to as "Heartland Companies"). The acquired business consisted of 12 CaseIH commercial application agriculture locations, in the states of Idaho, Iowa, Kansas, Minnesota, Missouri, Montana, Nebraska, North Dakota, South Dakota, Washington, and Wisconsin. Our acquisition of these entities provides the Company with the opportunity for synergies due to overlap of our footprints, which allows us to package deals that include both commercial application equipment as well as other agricultural and construction equipment to commercial customers within our core footprint. Total cash consideration paid for the Heartland Companies was $94.4 million, which was financed through available cash resources and line of credit availability. The 12 Heartland Companies store locations are included within our Agriculture segment.
31
Key Financial Metrics
In addition to tracking our sales and expenses to evaluate our operational performance, we also monitor the following key financial metrics. The results of some of these metrics are discussed further throughout the Management's Discussion and Analysis of Financial Condition and Results of Operations section of this Form 10-K.
Inventory Turnover
Inventory turnover measures the rate at which inventory is sold during the year. We calculate it by dividing cost of sales on equipment for the last twelve months by the average of the month-end balances of our equipment and parts inventories for the same twelve-month period. We believe that inventory turnover is an important management metric in evaluating the efficiency at which we are managing and selling our inventories.
Same-Store Results
Same-store results for any period represent results of operations by stores that were part of our Company for the entire comparable period in the preceding fiscal year. We do not distinguish relocated or newly-expanded stores in this same-store analysis.
Absorption
Absorption is an industry term that refers to the percentage of an equipment dealer's operating expense covered by the combined gross profit from parts, service and rental fleet activity. We calculate absorption by dividing our gross profit from sales of parts, service and rental fleet by our operating expenses, less commission expense on equipment sales, plus interest expense on floorplan payables and rental fleet debt. We believe that absorption is an important management metric because during economic down cycles our customers tend to postpone new and used equipment purchases while continuing to run, maintain and repair their existing equipment. Thus, operating at a high absorption rate enables us to operate profitably throughout economic down cycles.
Dollar Utilization
Dollar utilization is a measurement of asset performance and profitability used in the rental industry. We calculate the dollar utilization of our rental fleet equipment by dividing the rental revenue earned on our rental fleet by the average gross carrying value of our rental fleet (comprised of original equipment costs plus additional capitalized costs) for that period. While our rental fleet has variable expenses related to repairs and maintenance, its primary expense for depreciation is fixed. Low dollar utilization of our rental fleet has a negative impact on gross profit margin and gross profit dollars due to the fixed depreciation component. However, high dollar utilization of our rental fleet has a positive impact on gross profit margin and gross profit dollars.
Key Financial Statement Components
Revenue
•Equipment: We derive equipment revenue from the sale of new and used agricultural and construction equipment.
•Parts: We derive parts revenue from the sale of parts for brands of equipment that we sell, other makes of equipment, and other types of equipment and related components. Our parts sales provide us with a relatively stable revenue stream that is less sensitive to the economic cycles that affect our equipment sales.
•Service: We derive service revenue from repair and maintenance services to our customers' equipment. Our repair and maintenance services provide a high-margin, relatively stable source of revenue through changing economic cycles.
•Rental and other: We derive other revenue from equipment rentals and ancillary equipment support activities such as equipment transportation, GPS signal subscriptions and reselling financial and insurance products.
Cost of Revenue
•Equipment: Cost of equipment revenue is the lower of the acquired cost or the net realizable value of the specific piece of equipment sold.
•Parts: Cost of parts revenue is the lower of the acquired cost or the market value of the parts sold, based on average costing.
•Service: Cost of service revenue represents costs attributable to services provided for the maintenance and repair of customer-owned equipment and equipment then on-rent by customers.
32
•Rental and other: Costs of other revenue represent costs associated with equipment rental, such as depreciation, maintenance and repairs, as well as costs associated with providing transportation, hauling, parts freight, GPS subscriptions and damage waivers, including, among other items, drivers' wages, truck depreciation, fuel costs, shipping costs and our costs related to damage waiver policies.
Operating Expenses
Our operating expenses include sales and marketing expenses, sales commissions (which generally are based upon equipment gross profit margins), payroll and employee benefit costs, insurance expenses, professional fees, property rental and related costs, property and other taxes, administrative overhead, and depreciation associated with property and equipment (other than rental and trucking equipment).
Floorplan Interest
The cost of financing inventory is an important factor affecting our results of operations. Floorplan payable financing from CNH Industrial Capital, the Bank Syndicate Agreement, DLL Finance and various credit facilities related to our foreign subsidiaries represent the primary sources of financing for equipment inventories. CNH Industrial regularly offers interest-free periods as well as additional incentives and special offers. As of January 31, 2024, 47.9% of our floorplan payable financing was non-interest bearing.
Other Interest Expense
Interest expense represents the interest on our debt instruments, other than floorplan payable financing facilities. This includes long-term debt used to finance the purchase of real estate and vehicles.
33
Results of Operations
Comparative financial data for each of our four sources of revenue for fiscal 2024 and 2023 are presented below. The results include the acquisitions made during these periods. The year-to-year comparison included below is not necessarily indicative of future results. Information regarding segment revenue and income (loss) before income taxes is presented for each fiscal year following our discussion of the consolidated results of operations. Additional information regarding our segments is included in Note 21 of our consolidated financial statements.
| Year Ended January 31, | |||||||||||
| 2024 | 2023 | ||||||||||
| (dollars in thousands) | |||||||||||
| Equipment | |||||||||||
| Revenue | $ | 2,145,316 | $ | 1,711,559 | |||||||
| Cost of revenue | 1,864,558 | 1,477,539 | |||||||||
| Gross profit | $ | 280,758 | $ | 234,020 | |||||||
| Gross profit margin | 13.1 | % | 13.7 | % | |||||||
| Parts | |||||||||||
| Revenue | $ | 410,841 | $ | 327,196 | |||||||
| Cost of revenue | 279,921 | 220,418 | |||||||||
| Gross profit | $ | 130,920 | $ | 106,778 | |||||||
| Gross profit margin | 31.9 | % | 32.6 | % | |||||||
| Service | |||||||||||
| Revenue | $ | 157,315 | $ | 129,803 | |||||||
| Cost of revenue | 53,981 | 46,208 | |||||||||
| Gross profit | $ | 103,334 | $ | 83,595 | |||||||
| Gross profit margin | 65.7 | % | 64.4 | % | |||||||
| Rental and other | |||||||||||
| Revenue | $ | 44,973 | $ | 40,748 | |||||||
| Cost of revenue | 28,631 | 25,302 | |||||||||
| Gross profit | $ | 16,342 | $ | 15,446 | |||||||
| Gross profit margin | 36.3 | % | 37.9 | % | |||||||
The following table sets forth our statements of operations data expressed as a percentage of revenue for the fiscal years indicated.
| Year Ended January 31, | |||||||||||
| 2024 | 2023 | ||||||||||
| Revenue | |||||||||||
| Equipment | 77.8 | % | 77.5 | % | |||||||
| Parts | 14.9 | % | 14.8 | % | |||||||
| Service | 5.7 | % | 5.9 | % | |||||||
| Rental and other | 1.6 | % | 1.8 | % | |||||||
| Total Revenue | 100.0 | % | 100.0 | % | |||||||
| Total Cost of Revenue | 80.7 | % | 80.1 | % | |||||||
| Gross Profit Margin | 19.3 | % | 19.9 | % | |||||||
| Operating Expenses | 13.1 | % | 13.6 | % | |||||||
| Income from Operations | 6.2 | % | 6.3 | % | |||||||
| Other Income (Expense) | (0.7) | % | (0.2) | % | |||||||
| Income Before Income Taxes | 5.5 | % | 6.1 | % | |||||||
| Provision for Income Taxes | 1.4 | % | 1.5 | % | |||||||
| Net Income | 4.1 | % | 4.6 | % | |||||||
34
Fiscal Year Ended January 31, 2024 Compared to Fiscal Year Ended January 31, 2023
Consolidated Results
Revenue
| Year Ended January 31, | Increase/ | Percent | |||||||||||||||||||||
| 2024 | 2023 | (Decrease) | Change | ||||||||||||||||||||
| (dollars in thousands) | |||||||||||||||||||||||
| Equipment | $ | 2,145,316 | $ | 1,711,559 | $ | 433,757 | 25.3 | % | |||||||||||||||
| Parts | 410,841 | 327,196 | 83,645 | 25.6 | % | ||||||||||||||||||
| Service | 157,315 | 129,803 | 27,512 | 21.2 | % | ||||||||||||||||||
| Rental and other | 44,973 | 40,748 | 4,225 | 10.4 | % | ||||||||||||||||||
| Total Revenue | $ | 2,758,445 | $ | 2,209,306 | $ | 549,139 | 24.9 | % | |||||||||||||||
The increase in total revenue for fiscal 2024, as compared to fiscal 2023, was primarily the result of Company-wide same-store sales increase of 10.1% over the prior fiscal year and our acquisitions of the Heartland Companies, Pioneer Farm Equipment Co. (“Pioneer”), and O'Connors, completed in August 2022, February 2023, and October 2023, respectively. The same-store sales increase was primarily driven by equipment sales, which benefited from improved availability of inventory and the sustained high demand of both agriculture and construction equipment. In addition, parts and service same-store sales also grew in fiscal 2024 compared to fiscal 2023.
Gross Profit
| Year Ended January 31, | Increase/ | Percent | |||||||||||||||||||||
| 2024 | 2023 | (Decrease) | Change | ||||||||||||||||||||
| (dollars in thousands) | |||||||||||||||||||||||
| Gross Profit | |||||||||||||||||||||||
| Equipment | $ | 280,758 | $ | 234,020 | $ | 46,738 | 20.0 | % | |||||||||||||||
| Parts | 130,920 | 106,778 | 24,142 | 22.6 | % | ||||||||||||||||||
| Service | 103,334 | 83,595 | 19,739 | 23.6 | % | ||||||||||||||||||
| Rental and other | 16,342 | 15,446 | 896 | 5.8 | % | ||||||||||||||||||
| Total Gross Profit | $ | 531,354 | $ | 439,839 | $ | 91,515 | 20.8 | % | |||||||||||||||
| Gross Profit Margin | |||||||||||||||||||||||
| Equipment | 13.1 | % | 13.7 | % | (0.6) | % | (4.4) | % | |||||||||||||||
| Parts | 31.9 | % | 32.6 | % | (0.7) | % | (2.1) | % | |||||||||||||||
| Service | 65.7 | % | 64.4 | % | 1.3 | % | 2.0 | % | |||||||||||||||
| Rental and other | 36.3 | % | 37.9 | % | (1.6) | % | (4.2) | % | |||||||||||||||
| Total Gross Profit Margin | 19.3 | % | 19.9 | % | (0.6) | % | (3.0) | % | |||||||||||||||
| Gross Profit Mix | |||||||||||||||||||||||
| Equipment | 52.8 | % | 53.2 | % | (0.4) | % | (0.8) | % | |||||||||||||||
| Parts | 24.6 | % | 24.3 | % | 0.3 | % | 1.2 | % | |||||||||||||||
| Service | 19.4 | % | 19.0 | % | 0.4 | % | 2.1 | % | |||||||||||||||
| Rental and other | 3.2 | % | 3.5 | % | (0.3) | % | (8.6) | % | |||||||||||||||
| Total Gross Profit Mix | 100.0 | % | 100.0 | % | |||||||||||||||||||
Gross profit increased 20.8% or $91.5 million from fiscal 2023 to fiscal 2024, primarily due to higher revenue and gross profit from our equipment, parts, and service business. Gross profit margin decreased from 19.9% in fiscal 2023 to 19.3% in fiscal 2024. The decrease in gross profit margin is primarily the result of a partial normalization of equipment gross profit margin as the supply of many product categories has caught up with demand.
Our Company-wide absorption rate declined to 79.2% for fiscal 2024 as compared to 82.7% during fiscal 2023. The lower absorption rate in fiscal 2024 compared to fiscal 2023, was primarily impacted by a significant rise in floorplan interest expense in fiscal 2024, the fiscal 2023 absorption rate was also favorably impacted by a gain of $1.4 million recognized on the divestiture of our consumer products store in North Dakota in the first quarter of fiscal 2023.
35
Operating Expenses
| Year Ended January 31, | Increase/ | Percent | |||||||||||||||||||||
| 2024 | 2023 | (Decrease) | Change | ||||||||||||||||||||
| (dollars in thousands) | |||||||||||||||||||||||
| Operating Expenses | $ | 362,509 | $ | 301,516 | $ | 60,993 | 20.2 | % | |||||||||||||||
| Operating Expenses as a Percentage of Revenue | 13.1 | % | 13.6 | % | (0.5) | % | (3.7) | % | |||||||||||||||
Operating expenses for fiscal 2024 increased $61.0 million, as compared to fiscal 2023. The increase in operating expenses was primarily due to acquisitions that have occurred in the last eighteen months as well as variable expenses associated with increased sales. In fiscal 2024, operating expenses as a percentage of revenue decreased to 13.1% from 13.6% in fiscal 2023. The decrease in operating expenses as a percentage of total revenue was due to the increase in total revenue in fiscal 2024 compared to fiscal 2023, which positively affected our ability to leverage our fixed operating costs.
Other Income (Expense)
| Year Ended January 31, | Increase/ | Percent | |||||||||||||||||||||
| 2024 | 2023 | (Decrease) | Change | ||||||||||||||||||||
| (dollars in thousands) | |||||||||||||||||||||||
| Interest and other income (expense) | $ | 3,300 | $ | 3,862 | $ | (562) | (14.6) | % | |||||||||||||||
| Floorplan interest expense | (13,802) | (1,875) | 11,927 | 636.1 | % | ||||||||||||||||||
| Other interest expense | (7,303) | (5,069) | 2,234 | 44.1 | % | ||||||||||||||||||
The decrease in interest and other income (expense) compared to fiscal 2023 was primarily the result of changes in foreign currency fluctuations. The increase in floorplan interest expense for fiscal 2024, as compared to fiscal 2023, was primarily due to increased interest-bearing borrowings, resulting from higher inventory levels, as well as a higher interest rate environment. The increase in other interest expense in fiscal 2024 is the result of an increased amount of long term debt resulting from real estate purchased via acquisition or the buyout of previously leased facilities in fiscal 2023 and 2024.
Provision for Income Taxes
| Year Ended January 31, | Percent | ||||||||||||||||||||||
| 2024 | 2023 | Increase | Change | ||||||||||||||||||||
| (dollars in thousands) | |||||||||||||||||||||||
| Provision for Income Taxes | $ | 38,599 | $ | 33,373 | $ | 5,226 | 15.7 | % | |||||||||||||||
Our effective tax rate increased from 24.7% in fiscal 2023 to 25.6% in fiscal 2024. The effective tax rate for each of the years ended January 31, 2024 and 2023, is subject to variation primarily due to the impact of items related to the vesting of share-based compensation, limitation on the tax deductibility of officers' compensation and the mix of domestic and foreign income.
36
Segment Results
| Year Ended January 31, | Increase/ | Percent | |||||||||||||||||||||
| 2024 | 2023 | (Decrease) | Change | ||||||||||||||||||||
| (dollars in thousands) | |||||||||||||||||||||||
| Revenue | |||||||||||||||||||||||
| Agriculture | $ | 2,044,263 | $ | 1,601,720 | $ | 442,543 | 27.6 | % | |||||||||||||||
| Construction | 332,463 | 308,457 | 24,006 | 7.8 | % | ||||||||||||||||||
| Europe | 311,910 | 299,129 | 12,781 | 4.3 | % | ||||||||||||||||||
| Australia | 69,809 | — | 69,809 | *N/M | |||||||||||||||||||
| Total | $ | 2,758,445 | $ | 2,209,306 | $ | 549,139 | 24.9 | % | |||||||||||||||
| Income Before Income Taxes | |||||||||||||||||||||||
| Agriculture | $ | 121,072 | $ | 102,733 | $ | 18,339 | 17.9 | % | |||||||||||||||
| Construction | 18,346 | 18,569 | (223) | (1.2) | % | ||||||||||||||||||
| Europe | 16,487 | 20,197 | (3,710) | (18.4) | % | ||||||||||||||||||
| Australia | 4,115 | — | 4,115 | *N/M | |||||||||||||||||||
| Segment income before income taxes | 160,020 | 141,499 | 18,521 | 13.1 | % | ||||||||||||||||||
| Shared Resources | (8,980) | (6,258) | (2,722) | 43.5 | % | ||||||||||||||||||
| Total | $ | 151,040 | $ | 135,241 | $ | 15,799 | 11.7 | % | |||||||||||||||
*N/M = Not Meaningful | |||||||||||||||||||||||
Agriculture
Agriculture segment revenue for fiscal 2024 increased 27.6%, or $442.5 million, compared to the same period last year. The higher revenue was driven primarily by the acquisitions of the Heartland Companies and Pioneer in August 2022 and February 2023, respectively, as well as an increase in same-store sales of 12.1%. The same-store sales increase was primarily driven by equipment sales, which benefited from improved availability of inventory and the sustained high demand for new and used equipment. In addition, same-store sales for parts and service also grew in fiscal 2024 compared to fiscal 2023.
Agriculture segment income before income taxes for fiscal 2024 improved by $18.3 million, or 17.9%, compared to fiscal 2023. The improvement in segment results was primarily the result of higher revenue partially offset by higher operating expenses due to variable expenses associated with increased sales.
Construction
Construction segment revenue for fiscal 2024 increased 7.8%, or $24.0 million, compared to fiscal 2023. When accounting for the divestitures of the North Dakota consumer products store in March 2022, same-store sales increased 8.3%. Construction activity in our footprint sustained at healthy levels, which was the primary factor in the same-store sales growth.
The Construction segment income before income taxes was $18.3 million for fiscal 2024 compared to income of $18.6 million for the prior year. The decline in segment results was primarily due to the $1.4 million gain on our consumer products store in the first quarter of fiscal 2023 which was mostly offset by an increase in same-store sales, in fiscal 2024. The dollar utilization of our rental fleet decreased from 30.2% in fiscal 2023 to 29.3% in fiscal 2024.
Europe
Europe segment revenue for fiscal 2024 increased 4.3%, or $12.8 million, compared to fiscal 2023. Revenue, net of the effect of foreign currency fluctuations, was up 2.1% or $6.2 million compared to fiscal 2023. The increase in revenue was primarily related to pricing increases in fiscal 2024 compared to fiscal 2023.
Our Europe segment income before income taxes was $16.5 million for fiscal 2024, compared to $20.2 million for fiscal 2023. The decrease in segment pre-tax income was primarily the result of increased operating expenses.
Australia
We entered into the Australian market in October 2023 with the O'Connor acquisition. Australia segment revenue for fiscal 2024 was $69.8 million. Our Australia segment income before income taxes was $4.1 million for fiscal 2024.
37
Shared Resources/Eliminations
We incur centralized expenses/income at our general corporate level, which we refer to as “Shared Resources,” and then allocate most of these net expenses to our segments. Since these allocations are set early in the year, and a portion is planned to be unallocated, unallocated balances may occur and cause a difference in reported shared resource expense. Shared Resource loss before income taxes was $9.0 million for fiscal 2024 compared to $6.3 million for fiscal 2023.
Liquidity and Capital Resources
Sources of Liquidity
Our primary sources of liquidity are cash reserves, cash generated from operations, and borrowings under our floorplan payable and other credit facilities. We expect these sources of liquidity to be sufficient to fund our working capital requirements, acquisitions, capital expenditures and other investments in our business, service our debt, pay our tax and lease obligations and other commitments and contingencies, and meet any seasonal operating requirements for the foreseeable future, provided, however, that our borrowing capacity under our credit agreements is dependent on compliance with various financial covenants as further described in Note 8, Floorplan Payable/Lines of Credit, of the Notes to our Consolidated Financial Statements included in this Form 10-K. We have worked in the past, and will continue to work in the future if necessary, with our lenders to implement satisfactory modifications to these financial covenants when appropriate for the business conditions confronted by us.
Equipment Inventory and Floorplan Payable Credit Facilities
Floorplan payable balances reflect the amount owed for new equipment inventory purchased from a manufacturer and used equipment inventory, which is primarily purchased through trade-in on equipment sales, net of unamortized debt issuance costs incurred for floorplan credit facilities. Certain manufacturers from which we purchase new equipment inventory offer financing on these purchases, either offered directly from the manufacturers or through the manufacturers’ captive finance affiliate. CNH Industrial's captive finance subsidiary, CNH Industrial Capital, also provides financing of used equipment inventory. We also have floorplan payable balances with non-manufacturer lenders for new and used equipment inventory. Borrowings and repayments on manufacturer floorplan facilities are reported as operating cash flows, while borrowings and repayments on non-manufacturer floorplan facilities are reported as financing cash flows in our consolidated statements of cash flows.
As of January 31, 2024, we had floorplan payable lines of credit for equipment purchases totaling $1.4 billion, which includes a $875.0 million credit facility with CNH Industrial Capital, a $275.0 million floorplan payable line under the Bank Syndicate Agreement, a $80.0 million credit facility with DLL Finance, and additional credit facilities related to our foreign subsidiaries. Available borrowing capacity under these lines of credit are reduced by amounts outstanding under such facilities, borrowing base calculations and amount of standby letters of credit outstanding with respect to the Bank Syndicate Agreement, and certain acquisition-related financing arrangements with respect to the CNH Industrial Capital credit facility. As of January 31, 2024, the Company was in compliance with the financial covenants under its credit agreements. Additional details on each of these credit facilities are disclosed in Note 8 to our consolidated financial statements included in this Form 10-K.
As of January 31, 2024, the Company was not subject to the fixed charge ratio covenant under the Bank Syndicate Agreement as our adjusted excess availability plus eligible cash collateral (as defined in the Bank Syndicate Agreement) was not less than 15% of the total amount of the credit facility. Please refer to Note 8, Floorplan Payable/Lines of Credit, of the Notes to our Consolidated Financial Statement included in Item 8, Financial Statements and Supplementary Data, of this Form 10-K for further information regarding the Company's line of credit.
Our equipment inventory turnover decreased to 2.2 times for fiscal 2024 compared to 3.3 times for fiscal 2023. Our equipment inventory balance increased 104.4% from January 31, 2023 to January 31, 2024. The decrease in equipment turnover was primarily due to the increase in average equipment inventory in fiscal 2024 as compared to fiscal 2023 as we were coming off very low inventory levels in fiscal 2023, due to allocation restrictions implemented by our suppliers. Our equity in equipment inventory, which reflects the portion of our equipment inventory balance that is not financed by floorplan payables, decreased to 18.2% as of January 31, 2024, from 51.7% as of January 31, 2023. The decrease in our equity in equipment inventory is primarily due to the stocking of new equipment inventories as availability has improved, as well as drawing on our floorplan loan with the Bank Syndicate in conjunction with the O'Connors acquisition.
38
Long-Term Debt Facilities
As of January 31, 2024, we had a $75.0 million working capital line of credit under the Bank Syndicate Agreement (the "Revolver Loan"). The Revolver Loan is used to finance our working capital requirements and fund certain capital expenditures, as needed. As of January 31, 2024, the Company did not have a need to utilize any of the Revolver Loan, as such the outstanding balance was zero. The Company works with various lenders to finance the purchase of real estate we currently lease or are acquiring through an acquisition. The Company may also decide in the future to finance a portion of our rental fleet as well as our capital expenditures using long-term debt from various lenders.
Adequacy of Capital Resources
Our primary uses of cash have been to fund our operating activities, including the purchase of inventory and providing for other working capital needs; meeting our debt service requirements; making payments due under our various leasing arrangements; and funding capital expenditures, including the purchase of rental fleet assets. The primary factor affecting our ability to generate cash and to meet cash requirements, is our operating performance as impacted by (i) industry factors, (ii) competition, (iii) general economic conditions, (iv) the timing and extent of acquisitions, and (v) business and other factors including those identified in Item 1A, Risk Factors, and discussed in this Form 10-K.
Our ability to service our debt will depend upon our ability to generate necessary cash. This will in turn depend on our operating performance, general economic conditions, and financial, competitive, business and other factors, some of which are beyond our immediate control, and future acquisition activity. Based on our current operational performance, we believe our cash flow from operations, available cash, and available borrowings under our existing credit facilities will be adequate to meet our liquidity needs beyond the next 12 months.
In fiscal 2024, we used $10.8 million in cash for rental fleet purchases and $51.5 million in cash for property and equipment purchases and financed $17.9 million in property and equipment purchases with long-term debt and finance leases. The property and equipment purchases in fiscal 2024 primarily related to improvements to, or purchases of, real estate assets and the purchase of vehicles. In fiscal 2023, we used $10.0 million in cash for rental fleet purchases, $27.2 million in cash for property and equipment purchases, and financed $6.4 million in property and equipment purchases with long-term debt. The property and equipment purchases in fiscal 2023 primarily related to the purchase of vehicles, trucks and real estate. We expect our cash expenditures for property and equipment, exclusive of rental fleet purchases, for fiscal 2025 to be approximately $50.0 million and expect cash expenditures for our rental fleet for fiscal 2025 to be approximately $10.0 million. The actual amount of our fiscal 2025 capital expenditures will depend upon factors such as general economic conditions, growth prospects for our industry and our decisions regarding financing and leasing options. We currently expect to finance property and equipment purchases with borrowings under our existing credit facilities, financing with long-term debt, with available cash or with cash flow from operations. We may need to incur additional debt if we pursue any future acquisitions.
There can be no assurances, however, that our business will generate sufficient cash flow from operations or that future borrowings will be available under the credit facilities with the Bank Syndicate, CNH Industrial Capital and DLL Finance in amounts sufficient to allow us to service our indebtedness and to meet our other commitments. If we are unable to generate sufficient cash flow from operations or to obtain sufficient future borrowings, we may be required to seek one or more alternatives such as refinancing or restructuring our indebtedness, selling material assets or operations or seeking to raise additional debt or equity capital. There can be no assurances that we will be able to succeed with one of these alternatives on commercially reasonable terms, if at all. In addition, if we pursue strategic acquisitions, we may require additional equity or debt financing to consummate the transactions, and we cannot give absolute assurance that we will succeed in obtaining this financing on favorable terms or at all. If we incur additional indebtedness to finance any of these transactions, this may place increased demands on our cash flow from operations to service the resulting increased debt. Our existing debt agreements contain restrictive covenants that may restrict our ability to adopt any of these alternatives. Any non-compliance by us under the terms of our debt agreements could result in an event of default which, if not cured, could result in the acceleration of our debt. We have met all financial covenants under these credit agreements as of January 31, 2024. If anticipated operating results create the likelihood of a future covenant violation, we would seek to work with our lenders on an appropriate modification or amendment to our financing arrangements.
We enter into contractual obligations in the ordinary course of business that may require future cash payments. Such obligations include, but are not limited to, debt arrangements, leasing arrangements, and costs related to Information Technology ("IT"), including ERP expenses. The Notes to the Consolidated Financial Statements provide additional information in regard to Long Term Debt (Note 10) and Leases (Note 13). Other purchase obligations consist primarily of IT related expenses with estimated cash payments of $4.1 million for fiscal 2025, as well as a combined $0.7 million for fiscal 2026, 2027, and 2028.
39
Cash Flow
Cash Flow (Used For) Provided By Operating Activities
Net cash used for operating activities in fiscal 2024 was $32.3 million compared to net cash provided by operating activities of $10.8 million in fiscal 2023. This decrease in operating cash flow was driven by an increase in inventories and partially offset by an increase in floorplan lines of credit from manufacturers, timing and collections of accounts receivable and higher net income for fiscal year 2024.
Cash Flow Used For Investing Activities
Net cash used for investing activities is primarily comprised of cash used for property and equipment purchases, including rental fleet purchases, and for business acquisitions.
Net cash used for investing activities was $163.4 million in fiscal 2024, compared to $134.1 million in fiscal 2023. The primarily driver was due to an increase of $25.2 million in cash used for purchases of property and equipment and increase of $7.1 million in acquisition activity compared to prior year.
Cash Flow Provided By Financing Activities
Net cash provided by financing activities was $188.6 million in fiscal 2024, compared to $22.0 million in fiscal 2023. the increase in net cash provided by financing activities was the result of increased non-manufacturer floorplan payables in fiscal 2024, as the Company drew on its Bank Syndicate Agreement floorplan loan in fiscal 2024, to finance higher inventory levels.
Critical Accounting Policies and Use of Estimates
In the preparation of financial statements prepared in conformity with U.S. generally accepted accounting principles, we are required to make estimates and judgments that affect the reported amounts of assets, liabilities, revenues, expenses and the related disclosures. While we believe the estimates and judgments we use in preparing our financial statements are appropriate, they are subject to future events and uncertainties regarding their outcome and therefore actual results may materially differ from these estimates. We describe in Note 1, Business Activity and Significant Accounting Polices, of the Notes to our Consolidated Financial Statements the significant accounting policies used in preparing the consolidated financial statements. We consider the following items in our consolidated financial statements to require significant estimation or judgment.
Revenue Recognition
Equipment revenue transactions include the sale of agricultural and construction equipment and often include both cash and noncash consideration received from our customers, with noncash consideration in the form of used, trade-in, equipment assets. The amount of revenue recognized in the sale transaction is dependent on the value assigned to the trade-in asset. Significant judgment is required to estimate the value of trade-in assets. We assign value based on the estimated selling price for that piece of equipment in the applicable market, less a gross profit amount to be realized at the time the trade-in asset is sold and an estimate of any reconditioning work required to ready the asset for sale. We estimate future selling prices of trade-in assets using various external industry data and relevant internal information, and consider the impact of various factors including model year, hours of use, overall condition, and other equipment specifications. Our estimates of the value of trade-in assets are impacted by changing market values of used equipment and the availability of relevant and reliable third-party data. In instances in which relevant third-party information is not available, the value assigned to trade-in equipment is dependent on internal judgments.
Inventories
New and used equipment inventories are stated at the lower of cost or net realizable value, determined for each piece of equipment (specific identification). Net realizable value is the estimated selling price in the ordinary course of business, less reasonably predictable costs of completion, disposal, and transportation. The majority of our used equipment inventory is acquired through trade-ins from our customers and is initially measured and recognized based on the estimated future selling price of the equipment, less a gross profit amount to be realized when the trade-in asset is sold and an estimate of any reconditioning work required to ready the asset for sale. Subsequent to the initial recognition, all new and used equipment inventories are subject to lower of cost or net realizable value assessments. We estimate net realizable value using internal information, management judgment and third-party data that considers various factors including age and condition of equipment, hours of use and market conditions. Generally, used equipment prices are more volatile to changes in market conditions than prices for new equipment due to incentive programs that may be offered by manufacturers to assist in the sale of new equipment. We review our equipment inventory values and adjust them whenever the carrying amount exceeds the estimated net realizable value.
40
Parts inventories are valued at the lower of average cost or net realizable value. We estimate net realizable value of our parts inventories based on various factors including aging and sales history of each type of parts inventory.
Impairment of Long-Lived Assets
Our long-lived assets consist primarily of property and equipment and operating lease assets. We review these assets for potential impairment whenever events or circumstances indicate that the carrying value may not be recoverable. Recoverability is measured by comparing the estimated future undiscounted cash flows of such assets to their carrying values. If the estimated undiscounted cash flows exceed the carrying value, the carrying value is considered recoverable and no impairment recognition is required. However, if the sum of the undiscounted cash flows is less than the carrying value of the asset, the second step of the impairment analysis must be performed to measure the amount of the impairment, if any. The second step of the impairment analysis compares the estimated fair value of the long-lived asset to its carrying value and any amount by which the carrying value exceeds the fair value is recognized as an impairment charge.
When reviewing long-lived assets for impairment, we group long-lived assets with other assets and liabilities at the lowest level for which identifiable cash flows are largely independent of the cash flows of other assets and liabilities. Long-lived assets deployed and used by individual store locations are reviewed for impairment at the individual store level. Other long-lived assets shared across stores within a segment or shared across segments are reviewed for impairment on a segment or consolidated level as appropriate.
During our 2024 fiscal year, we determined that events or circumstances were present that may indicate that the carrying amount of certain of our store long-lived assets might not be recoverable. The events or circumstances which indicated that certain of our store long-lived assets might not be recoverable included a current period operating loss combined with historical losses and anticipated future operating losses within certain of our stores, or an expectation that a long-lived asset (or asset group) will be disposed of before the end of its previously estimated useful life. In light of these circumstances, we performed step one of the impairment analysis for these assets, which have a combined carrying value of $11.0 million, to determine if the asset values are recoverable. In all cases, our analyses indicated that the carrying values are recoverable based on our estimates of future undiscounted cash flows under step one of the impairment analysis.
Our impairment analyses require significant judgment, including identification of the grouping of long-lived and other assets and liabilities for impairment testing, estimates of future cash flows arising from these groups of assets and liabilities, and estimates of the remaining useful lives of the long-lived assets being evaluated. Our estimates inherently include a degree of uncertainty and are impacted by macroeconomic and industry conditions, the competitive environment and other factors. Adverse changes in any of these factors in future periods could result in impairment charges in future periods which could materially impact our results of operations and financial position.
Goodwill
Goodwill represents the excess of cost over the fair value of net assets of businesses acquired and is allocated to our reporting units at the time of the acquisition. We analyze goodwill on an annual basis and when an event occurs or circumstances change that may reduce the fair value of a reporting unit below its carrying amount. We have the option of first analyzing qualitative factors to determine whether it is more likely than not that the fair value of any reporting unit is less than its carrying amount. However, we may elect to perform a quantitative goodwill impairment test in lieu of the qualitative test. An entity must recognize an impairment charge for the amount by which the carrying amount exceeds the reporting unit’s fair value. Subsequent reversal of goodwill impairment charges is not permitted.
When we perform a qualitative goodwill test, we analyze qualitative factors to determine whether it is more likely than not that the fair value of a reporting unit is less than its carrying amount as a basis for determining whether it is necessary to perform the quantitative goodwill impairment test. If the qualitative test indicates there may be an impairment, we perform the quantitative test, which measures the amount of the goodwill impairment, if any. To perform the quantitative test, we calculate the fair value of each reporting unit, primarily utilizing the income approach. The income approach is based on discounted cash flow models that use reporting unit estimates for forecasted future financial performance, including revenues, margins, operating expenses, capital expenditures, depreciation, amortization, tax and discount rates. These estimates are developed as part of our planning process based on assumed growth rates, along with historical data and various internal estimates. Projected future cash flows are then discounted to a present value employing a discount rate that properly accounts for the estimated risk-adjusted weighted-average cost of capital relevant to each reporting unit.
We perform our annual goodwill impairment analysis as of December 31 and when an event occurs or circumstances change that may reduce the fair value of a reporting unit below its carrying amount.
In 2024, we elected to perform the qualitative test on all reporting units with the exception of our German reporting unit, which management decided to perform a quantitative assessment. Our test indicated that there is no goodwill impairment in any of our reporting units as of our annual assessment date.
41
We had goodwill of $64.1 million and $30.6 million at January 31, 2024 and 2023, respectively.
Income Taxes
In determining our provision for income taxes, we must make certain judgments and estimates, including an assessment of the realizability of our deferred tax assets. In evaluating our ability to realize the benefit of our deferred tax assets we consider all available positive and negative evidence, including our historical operating results and our expectation of future taxable income, the availability to implement prudent tax-planning strategies, and the carryforward periods over which the assets may be realized. These assumptions require significant judgment and estimation.
The initial recognition of, and any changes in, a deferred tax asset valuation allowance are recorded to the provision for income taxes and impacts our effective tax rate. Our assessment of the need for, and magnitude of, valuation allowances for our deferred tax assets may be impacted by changes in tax laws, our assumptions regarding the ability to generate future taxable income and the availability of tax-planning strategies. Changes in any of these factors could lead to a change in the recognized valuation allowance which may impact our future results of operations and financial position.
New Accounting Pronouncements
Refer to Note 1, Business Activity and Significant Accounting Polices, of the Notes to our Consolidated Financial Statements for a description of new accounting pronouncements recently adopted or not yet adopted and the impact or anticipated impact of such pronouncements to our consolidated financial statements.
Information Regarding Forward-Looking Statements
The Private Securities Litigation Reform Act of 1995 provides a "safe harbor" for forward-looking statements within the meaning of Section 27A of the Securities Act of 1933, as amended, and Section 21E of the Exchange Act. We include "forward-looking" information in this Form 10-K, including this Item 7, as well as in other materials filed or to be filed by us with the SEC (as well as information included in oral statements or other written statements made or to be made by us).
This Form 10-K contains forward-looking statements that involve risks and uncertainties. In some cases, you can identify forward-looking statements by the following words: "anticipate," "believe," "continue," "could," "estimate," "expect," "intend," "may," "ongoing," "plan," "potential," "predict," "project," "should," "will," "would," or the negative of these terms or other comparable terminology, although not all forward-looking statements contain these words. These statements involve known and unknown risks, uncertainties and other factors that may cause our or our industry's actual results, levels of activity, performance or achievements to be materially different from the information expressed or implied by these forward-looking statements. Forward-looking statements are only predictions and are not guarantees of performance. These statements are based on our management's beliefs and assumptions, which in turn are based on currently available information. Our forward-looking statements in this Form 10-K generally relate to the following:
•our beliefs and intentions with respect to our growth strategies, including growth through strategic acquisitions, the types of acquisition targets we intend to pursue, the availability of suitable acquisition targets, the industry climate for dealer consolidation, and our ability to implement our growth strategies;
•our beliefs with respect to factors that will affect demand and seasonality of purchasing in the agricultural and construction industries;
•our beliefs with respect to our primary supplier (CNH Industrial) of equipment and parts inventory;
•our beliefs with respect to the equipment market, our competitors and our competitive advantages;
•our beliefs with respect to the impact of U.S federal government policies on the agriculture economy;
•our beliefs with respect to the impact of commodity prices for crops, fossil fuels and other commodities on our operating results;
•our beliefs with respect to the impact of government regulations;
•our beliefs with respect to our business strengths and the diversity of our customer base;
•our plans and beliefs with respect to real property used in our business;
•our plans and beliefs regarding future sales, sales mix, and marketing activities;
•our beliefs and assumptions regarding the payment of dividends;
•our beliefs and assumptions regarding valuation reserves, equipment inventory balances, fixed operating expenses, and absorption rate;
42
•our beliefs and expectations regarding the impact of the Russia-Ukraine military conflict on our Ukrainian operations;
•our beliefs and assumptions with respect to our rental equipment operations;
•our beliefs with respect to our employee relations;
•our assumptions, beliefs and expectations with respect to past and future market conditions, including interest rates, and public infrastructure spending, new environmental standards, and the impact these conditions will have on our operating results;
•our beliefs with respect to the impact of our credit agreements, including future interest expense, limits on corporate transactions, financial covenant compliance, and ability to negotiate amendments or waivers, if needed;
•our beliefs with respect to the impact of increase or decrease in applicable foreign exchange rates;
•our plans and assumptions for future capital expenditures and rental fleet purchases;
•our cash needs, sources of liquidity, and the adequacy of our working capital.
While we believe that the forward-looking statements in this Form 10-K are reasonable, such statements are only predictions and are not guarantees of performance. These statements are based on our management's beliefs and assumptions, which in turn are based on currently available information. Important assumptions relating to the forward-looking statements include, among others, assumptions regarding demand for our products, the expansion of product offerings geographically, the timing and cost of planned capital expenditures, competitive conditions and general economic conditions. These assumptions could prove inaccurate. Forward-looking statements also involve known and unknown risks and uncertainties, which could cause actual results that differ materially from those contained in any forward-looking statement. All written and oral forward-looking statements attributable to us, or persons acting on our behalf, are expressly qualified in their entirety by the cautionary statements as well as other cautionary statements that are made from time to time in our other filings with the SEC and public communications. You should evaluate all forward-looking statements made in this Form 10-K in the context of these risks and uncertainties. Many of these factors are beyond our ability to control or predict. Such factors include, but are not limited to, the following:
•the impact of the Russian-Ukraine military conflict on our operations in Ukraine;
•assumptions regarding our cash needs and the amount of inventory we need on hand;
•general economic conditions and construction activity in the markets where we operate;
•our dependence on CNH Industrial, our primary supplier of equipment and parts inventory, and our relationships with other equipment suppliers;
•the terms of the CNH Industrial dealer agreements that subject us to restrictions that may adversely impact our business and growth;
•the risks associated with our international operations;
•risks resulting from the implementation or design of our new ERP system;
•risks resulting from the impact of the enactment of "right to repair" legislation;
•the impact of security breaches and other disruptions to our information system;
•our level of indebtedness and ability to comply with the terms of agreements governing our indebtedness;
•the risks associated with the expansion of our business;
•the risks resulting from outbreaks or other public health crises;
•risks related to our ability to attract, train, and develop key employees necessary for our success;
•the potential inability to integrate any businesses we acquire;
•competitive pressures;
•significant fluctuations in the price of our common stock;
•risks related to our dependence on our information technology systems and the impact of potential breaches and other disruptions;
•compliance with laws and regulations; and
•other factors discussed under Item 1A, Risk Factors, or elsewhere in this Form 10-K.
43
You should read the risk factors and the other cautionary statements made in this Form 10-K as being applicable to all related forward-looking statements wherever they appear in this Form 10-K. We cannot assure you that the forward-looking statements in this Form 10-K will prove to be accurate. Furthermore, if our forward-looking statements prove to be inaccurate, the inaccuracy may be material. In light of the significant uncertainties in these forward-looking statements, you should not regard these statements as a representation or warranty by us or any other person that we will achieve our objectives and plans in any specified timeframe, if at all. Other than as required by law, we undertake no obligation to update these forward-looking statements, even though our situation may change in the future.
44
ITEM 7A. QUANTITATIVE AND QUALITATIVE DISCLOSURES ABOUT MARKET RISK
We are exposed to various market risks, including changes in interest rates and foreign currency exchange rates. Market risk is the potential loss arising from adverse changes in market rates and prices such as interest rates and foreign currency exchange rates.
Interest Rate Risk
Exposure to changes in interest rates results from borrowing activities used to fund operations. For fixed rate debt, interest rate changes affect the fair value of financial instruments but do not impact earnings or cash flows. Conversely, for floating rate debt, interest rate changes generally do not affect the fair market value but do impact future earnings and cash flows, assuming other factors are held constant. We have both fixed and floating rate financing. Some of our floating rate credit facilities contain minimum rates of interest to be charged. Based upon our interest-bearing balances and interest rates as of January 31, 2024, holding other variables constant, a one percentage point increase in interest rates for the next 12-month period would decrease pre-tax earnings and cash flow by approximately $3.9 million. Conversely, a one percentage point decrease in interest rates for the next 12-month period would result in an increase to pre-tax earnings and cash flow of approximately $3.9 million. At January 31, 2024, we had total floorplan payables outstanding of $893.8 million, of which $386.0 million was interest-bearing at variable interest rates and $507.7 million was non-interest bearing. In addition, at January 31, 2024, we had total long-term debt outstanding and finance lease liabilities of $122.1 million, primarily all of which is fixed rate debt.
Foreign Currency Exchange Rate Risk
Our foreign currency exposures arise as the result of our foreign operations. We are exposed to transactional foreign currency exchange rate risk through our foreign entities holding assets and liabilities denominated in currencies other than their functional currency. In addition, the Company is exposed to foreign currency transaction risk as a result of certain intercompany financing transactions. The Company attempts to manage its transactional foreign currency exchange rate risk through the use of derivative financial instruments, primarily foreign exchange forward contracts, or through natural hedging instruments. Based upon balances and exchange rates as of January 31, 2024, holding other variables constant, we believe that a hypothetical 10% increase or decrease in all applicable foreign exchange rates would not have a material impact on our results of operations or cash flows. As of January 31, 2024, our Ukrainian subsidiary had $1.0 million of net monetary liabilities denominated in Ukrainian hryvnia (UAH). We have attempted to minimize our net monetary asset position through reducing overall asset levels in Ukraine and through borrowing in UAH which serves as a natural hedging instrument offsetting our net UAH denominated assets. Many of the currency and payment controls the National Bank of Ukraine imposed in February 2022, have been relaxed, making it more practicable to manage our UAH exposure. However, the continuation of the Russia/Ukraine conflict could lead to more significant UAH devaluations, similar to the 24% devaluation that occurred in July 2022, or more stringent payment controls in the future. The inability to fully manage our net monetary asset position and continued UAH devaluations for an extended period of time, could have a significant adverse impact on our results of operations and cash flows.
In addition to transactional foreign currency exchange rate risk, we are also exposed to translational foreign currency exchange rate risk as we translate the results of operations and assets and liabilities of our foreign operations from their functional currency to the U.S. dollar. As a result, our results of operations, cash flows and net investment in our foreign operations may be adversely impacted by fluctuating foreign currency exchange rates. We believe that a hypothetical 10% increase or decrease in all applicable foreign exchange rates, holding all other variables constant, would not have a material impact on our results of operations or cash flows.
45
ITEM 8. FINANCIAL STATEMENTS AND SUPPLEMENTARY DATA
The Consolidated Balance Sheets of the Company as of January 31, 2024 and 2023, and the related Consolidated Statements of Operations, Comprehensive Income, Stockholders' Equity, and Cash Flows for the years ended January 31, 2024, 2023 and 2022, and the notes thereto, have been audited by Deloitte & Touche LLP, an independent registered public accounting firm.
INDEX TO CONSOLIDATED FINANCIAL STATEMENTS
| Page | |||||
| Titan Machinery Inc.—Financial Statements | |||||
| Audited Consolidated Financial Statements | |||||
Report of Independent Registered Public Accounting Firm (PCAOB ID No. | |||||
| Report of Independent Registered Public Accounting Firm | |||||
| Consolidated Balance Sheets as of January 31, 2024 and 2023 | |||||
| Consolidated Statements of Operations for the fiscal years ended January 31, 2024, 2023 and 2022 | |||||
| Consolidated Statements of Comprehensive Income for the fiscal years ended January 31, 2024, 2023 and 2022 | |||||
| Consolidated Statements of Stockholders' Equity for the fiscal years ended January 31, 2024, 2023 and 2022 | |||||
| Consolidated Statements of Cash Flows for the fiscal years ended January 31, 2024, 2023 and 2022 | |||||
| Notes to Consolidated Financial Statements | |||||
46
REPORT OF INDEPENDENT REGISTERED PUBLIC ACCOUNTING FIRM
To the stockholders and Board of Directors of Titan Machinery Inc.
Opinion on the Financial Statements
We have audited the accompanying consolidated balance sheets of Titan Machinery Inc. and subsidiaries (the "Company") as of January 31, 2024, and 2023, the related consolidated statements of operations, comprehensive income, stockholders’ equity, and cash flows, for each of the three years in the period ended January 31, 2024, and the related notes and the schedule listed in the Index at Part IV, Item 15 (collectively referred to as the "financial statements"). In our opinion, the financial statements present fairly, in all material respects, the financial position of the Company as of January 31, 2024, and 2023, and the results of its operations and its cash flows for each of the three years in the period ended January 31, 2024, in conformity with accounting principles generally accepted in the United States of America.
We have also audited, in accordance with the standards of the Public Company Accounting Oversight Board (United States) (PCAOB), the Company's internal control over financial reporting as of January 31, 2024, based on criteria established in Internal Control — Integrated Framework (2013) issued by the Committee of Sponsoring Organizations of the Treadway Commission and our report dated April 3, 2024, expressed an unqualified opinion on the Company's internal control over financial reporting.
Basis for Opinion
These financial statements are the responsibility of the Company's management. Our responsibility is to express an opinion on the Company's financial statements based on our audits. We are a public accounting firm registered with the PCAOB and are required to be independent with respect to the Company in accordance with the U.S. federal securities laws and the applicable rules and regulations of the Securities and Exchange Commission and the PCAOB.
We conducted our audits in accordance with the standards of the PCAOB. Those standards require that we plan and perform the audit to obtain reasonable assurance about whether the financial statements are free of material misstatement, whether due to error or fraud. Our audits included performing procedures to assess the risks of material misstatement of the financial statements, whether due to error or fraud, and performing procedures that respond to those risks. Such procedures included examining, on a test basis, evidence regarding the amounts and disclosures in the financial statements. Our audits also included evaluating the accounting principles used and significant estimates made by management, as well as evaluating the overall presentation of the financial statements. We believe that our audits provide a reasonable basis for our opinion.
Critical Audit Matter
The critical audit matter communicated below is a matter arising from the current-period audit of the financial statements that was communicated or required to be communicated to the audit committee and that (1) relates to accounts or disclosures that are material to the financial statements and (2) involved our especially challenging, subjective, or complex judgments. The communication of critical audit matters does not alter in any way our opinion on the financial statements, taken as a whole, and we are not, by communicating the critical audit matter below, providing a separate opinion on the critical audit matter or on the accounts or disclosures to which it relates.
Inventories – Valuation of Used Equipment Inventories — Refer to Notes 1 and 5 to the financial statements
Critical Audit Matter Description
The majority of the Company’s used equipment inventories are acquired through trade-ins from customers. Used equipment acquired through a trade-in or during business combinations is recorded at fair value less a normal gross profit margin. The Company determines fair value for the traded-in equipment through internal and third-party data that considers various factors including the age and condition of the equipment, hours of use, and market conditions. The Company’s used equipment inventories are stated at the lower of cost (specific identification) or net realizable value. Net realizable value is the estimated selling price in the ordinary course of business, less reasonably predictable costs of completion, disposal, and transportation. The Company periodically subjects used equipment inventories to lower of cost or net realizable value assessments and adjusts carrying values when such values exceed estimated net realizable value. The Company estimates net realizable value using internal and third-party data that considers various factors including the age and condition of the equipment, hours of use, and market conditions.
Given the significant judgments made by management to determine the initial fair value and subsequent net realizable value of used equipment inventories, performing audit procedures to evaluate these judgments to determine the valuation of used equipment inventories required a high degree of auditor judgment and an increased extent of effort.
47
How the Critical Audit Matter Was Addressed in the Audit
Our audit procedures related to management’s judgments regarding the valuation of used equipment inventories included the following, among others:
•We tested the effectiveness of controls over the valuation of used equipment inventories, including the reasonableness of various factors including the age and condition of the equipment, hours of use, and market conditions, used to determine the net realizable value of the equipment.
•We tested the effectiveness of controls over the internal and external data used to determine the valuation of used equipment inventories.
•We evaluated the reasonableness of management’s judgments utilized to determine the fair value or net realizable value of the used equipment inventories by:
•Evaluating the reasonableness and consistency of the methodology and assumptions used by management to determine fair value or net realizable value, as applicable.
•Testing the underlying determination of the fair value or net realizable value by obtaining documentation containing the age of the equipment and hours of use and comparing it to comparable internal and external data.
•Performing a retrospective lookback analysis of management’s process by comparing the actual selling prices of used equipment inventories units sold in the current year to the selling prices estimated by management for those units in the prior year, as applicable.
/s/ DELOITTE & TOUCHE LLP
April 3, 2024
We have served as the Company's auditor since 2013.
48
REPORT OF INDEPENDENT REGISTERED PUBLIC ACCOUNTING FIRM
To the Stockholders and the Board of Directors of Titan Machinery Inc.
Opinion on Internal Control over Financial Reporting
We have audited the internal control over financial reporting of Titan Machinery Inc. and subsidiaries (the “Company”) as of January 31, 2024, based on criteria established in Internal Control — Integrated Framework (2013) issued by the Committee of Sponsoring Organizations of the Treadway Commission (COSO). In our opinion, the Company maintained, in all material respects, effective internal control over financial reporting as of January 31, 2024, based on criteria established in Internal Control — Integrated Framework (2013) issued by COSO.
We have also audited, in accordance with the standards of the Public Company Accounting Oversight Board (United States) (PCAOB), the consolidated financial statements as of and for the year ended January 31, 2024, of the Company and our report dated April 3, 2024, expressed an unqualified opinion on those financial statements.
As detailed in Management’s Report on Internal Control Over Financial Reporting, management excluded from its assessment the internal control over financial reporting at J.J. O’Connor & Sons Pty. Ltd. (“O’Connors”), which was acquired on October 2, 2023, and whose financial statements constitute 11.3% of total assets and 2.3% of total revenue of the consolidated financial statement amounts as of and for the year ended January 31, 2024. Accordingly, our audit did not include the internal control over financial reporting for O’Connors.
Basis for Opinion
The Company’s management is responsible for maintaining effective internal control over financial reporting and for its assessment of the effectiveness of internal control over financial reporting, included in the accompanying Management’s Report on Internal Control Over Financial Reporting. Our responsibility is to express an opinion on the Company’s internal control over financial reporting based on our audit. We are a public accounting firm registered with the PCAOB and are required to be independent with respect to the Company in accordance with the U.S. federal securities laws and the applicable rules and regulations of the Securities and Exchange Commission and the PCAOB.
We conducted our audit in accordance with the standards of the PCAOB. Those standards require that we plan and perform the audit to obtain reasonable assurance about whether effective internal control over financial reporting was maintained in all material respects. Our audit included obtaining an understanding of internal control over financial reporting, assessing the risk that a material weakness exists, testing and evaluating the design and operating effectiveness of internal control based on the assessed risk, and performing such other procedures as we considered necessary in the circumstances. We believe that our audit provides a reasonable basis for our opinion.
Definition and Limitations of Internal Control over Financial Reporting
A company’s internal control over financial reporting is a process designed to provide reasonable assurance regarding the reliability of financial reporting and the preparation of financial statements for external purposes in accordance with generally accepted accounting principles. A company’s internal control over financial reporting includes those policies and procedures that (1) pertain to the maintenance of records that, in reasonable detail, accurately and fairly reflect the transactions and dispositions of the assets of the company; (2) provide reasonable assurance that transactions are recorded as necessary to permit preparation of financial statements in accordance with generally accepted accounting principles, and that receipts and expenditures of the company are being made only in accordance with authorizations of management and directors of the company; and (3) provide reasonable assurance regarding prevention or timely detection of unauthorized acquisition, use, or disposition of the company’s assets that could have a material effect on the financial statements.
Because of its inherent limitations, internal control over financial reporting may not prevent or detect misstatements. Also, projections of any evaluation of effectiveness to future periods are subject to the risk that controls may become inadequate because of changes in conditions, or that the degree of compliance with the policies or procedures may deteriorate.
/s/ DELOITTE & TOUCHE LLP
Minneapolis, Minnesota
April 3, 2024
49
TITAN MACHINERY INC.
CONSOLIDATED BALANCE SHEETS
AS OF JANUARY 31, 2024 AND 2023
(in thousands, except per share data)
| January 31, 2024 | January 31, 2023 | ||||||||||
| Assets | |||||||||||
| Current Assets | |||||||||||
| Cash | $ | $ | |||||||||
| Receivables, net of allowance for expected credit losses | |||||||||||
| Inventories | |||||||||||
| Prepaid expenses and other | |||||||||||
| Total current assets | |||||||||||
| Noncurrent Assets | |||||||||||
| Property and equipment, net of accumulated depreciation | |||||||||||
| Operating lease assets | |||||||||||
| Deferred income taxes | |||||||||||
| Goodwill | |||||||||||
| Intangible assets, net of accumulated amortization | |||||||||||
| Other | |||||||||||
| Total noncurrent assets | |||||||||||
| Total Assets | $ | $ | |||||||||
| Liabilities and Stockholders' Equity | |||||||||||
| Current Liabilities | |||||||||||
| Accounts payable | $ | $ | |||||||||
| Floorplan payable | |||||||||||
| Current maturities of long-term debt | |||||||||||
| Current maturities of operating leases | |||||||||||
| Deferred revenue | |||||||||||
| Accrued expenses and other | |||||||||||
| Total current liabilities | |||||||||||
| Long-Term Liabilities | |||||||||||
| Long-term debt, less current maturities | |||||||||||
| Operating lease liabilities | |||||||||||
| Deferred income taxes | |||||||||||
| Other long-term liabilities | |||||||||||
| Total long-term liabilities | |||||||||||
| Commitments and Contingencies (Note 12) | |||||||||||
| Stockholders' Equity | |||||||||||
Common stock, par value $ | |||||||||||
| Additional paid-in-capital | |||||||||||
| Retained earnings | |||||||||||
| Accumulated other comprehensive income (loss) | ( | ||||||||||
| Total stockholders' equity | |||||||||||
| Total Liabilities and Stockholders' Equity | $ | $ | |||||||||
See Notes to Consolidated Financial Statements
50
TITAN MACHINERY INC.
CONSOLIDATED STATEMENTS OF OPERATIONS
YEARS ENDED JANUARY 31, 2024, 2023 AND 2022
(in thousands, except per share data)
| 2024 | 2023 | 2022 | |||||||||||||||
| Revenue | |||||||||||||||||
| Equipment | $ | $ | $ | ||||||||||||||
| Parts | |||||||||||||||||
| Service | |||||||||||||||||
| Rental and other | |||||||||||||||||
| Total Revenue | |||||||||||||||||
| Cost of Revenue | |||||||||||||||||
| Equipment | |||||||||||||||||
| Parts | |||||||||||||||||
| Service | |||||||||||||||||
| Rental and other | |||||||||||||||||
| Total Cost of Revenue | |||||||||||||||||
| Gross Profit | |||||||||||||||||
| Operating Expenses | |||||||||||||||||
| Impairment of Intangible and Long-Lived Assets | |||||||||||||||||
| Income from Operations | |||||||||||||||||
| Other Income (Expense) | |||||||||||||||||
| Interest and other income | |||||||||||||||||
| Floorplan interest expense | ( | ( | ( | ||||||||||||||
| Other interest expense | ( | ( | ( | ||||||||||||||
| Income Before Income Taxes | |||||||||||||||||
| Provision for Income Taxes | |||||||||||||||||
| Net Income | $ | $ | $ | ||||||||||||||
| Earnings per Share: | |||||||||||||||||
| Basic | $ | $ | $ | ||||||||||||||
| Diluted | $ | $ | $ | ||||||||||||||
| Weighted Average Common Shares: | |||||||||||||||||
| Basic | |||||||||||||||||
| Diluted | |||||||||||||||||
See Notes to Consolidated Financial Statements
51
TITAN MACHINERY INC.
CONSOLIDATED STATEMENTS OF COMPREHENSIVE INCOME
YEARS ENDED JANUARY 31, 2024, 2023 AND 2022
(in thousands)
| 2024 | 2023 | 2022 | |||||||||||||||
| Net Income | $ | $ | $ | ||||||||||||||
| Other Comprehensive Income (Loss) | |||||||||||||||||
| Foreign currency translation adjustments | ( | ( | |||||||||||||||
| Comprehensive Income | $ | $ | $ | ||||||||||||||
See Notes to Consolidated Financial Statements
52
TITAN MACHINERY INC.
CONSOLIDATED STATEMENTS OF STOCKHOLDERS' EQUITY
YEARS ENDED JANUARY 31, 2024, 2023 AND 2022
(in thousands)
| Common Stock | Additional Paid-In Capital | Retained Earnings | Accumulated Other Comprehensive Income (Loss) | Total Stockholders' Equity | |||||||||||||||||||||||||||||||
| Shares Outstanding | Amount | ||||||||||||||||||||||||||||||||||
| BALANCE, JANUARY 31, 2021 | $ | — | $ | $ | $ | ( | $ | ||||||||||||||||||||||||||||
| Common stock issued on grant of restricted stock, net of restricted stock forfeitures and restricted stock withheld for employee withholding tax | — | ( | — | — | ( | ||||||||||||||||||||||||||||||
| Stock-based compensation expense | — | — | — | — | |||||||||||||||||||||||||||||||
Cumulative-effect adjustment of adopting ASC 326, Financial Instruments - Credit Losses | — | — | — | — | ( | ||||||||||||||||||||||||||||||
| Net income | — | — | — | — | |||||||||||||||||||||||||||||||
| Other comprehensive loss | — | — | — | — | ( | ( | |||||||||||||||||||||||||||||
| BALANCE, JANUARY 31, 2022 | — | ( | |||||||||||||||||||||||||||||||||
| Common stock issued on grant of restricted stock, net of restricted stock forfeitures and restricted stock withheld for employee withholding tax | — | ( | — | — | ( | ||||||||||||||||||||||||||||||
| Stock-based compensation expense | — | — | — | — | |||||||||||||||||||||||||||||||
| Net income | — | — | — | — | |||||||||||||||||||||||||||||||
| Other comprehensive loss | — | — | — | — | ( | ( | |||||||||||||||||||||||||||||
| BALANCE, JANUARY 31, 2023 | — | ( | |||||||||||||||||||||||||||||||||
| Common stock issued on grant of restricted stock, net of restricted stock forfeitures and restricted stock withheld for employee withholding tax | — | ( | — | — | ( | ||||||||||||||||||||||||||||||
| Stock-based compensation expense | — | — | — | — | |||||||||||||||||||||||||||||||
| Net income | — | — | — | — | |||||||||||||||||||||||||||||||
| Other comprehensive income | — | — | — | — | |||||||||||||||||||||||||||||||
| BALANCE, JANUARY 31, 2024 | $ | — | $ | $ | $ | $ | |||||||||||||||||||||||||||||
See Notes to Consolidated Financial Statements
53
TITAN MACHINERY INC.
CONSOLIDATED STATEMENTS OF CASH FLOWS
YEARS ENDED JANUARY 31, 2024, 2023 AND 2022
(in thousands)
| 2024 | 2023 | 2022 | |||||||||||||||
| Operating Activities | |||||||||||||||||
| Net income | $ | $ | $ | ||||||||||||||
| Adjustments to reconcile net income to net cash provided by operating activities | |||||||||||||||||
| Depreciation and amortization | |||||||||||||||||
| Impairment of goodwill, intangible assets and long lived assets | |||||||||||||||||
| Deferred income taxes | |||||||||||||||||
| Stock-based compensation expense | |||||||||||||||||
| Noncash interest expense | |||||||||||||||||
| Gain on sale of property and equipment | ( | ( | ( | ||||||||||||||
| Other, net | |||||||||||||||||
| Changes in assets and liabilities, net of effects of acquisitions | |||||||||||||||||
| Receivables | ( | ( | |||||||||||||||
| Prepaid expenses and other assets | 615 | 4,619 | (24,638) | ||||||||||||||
| Inventories | ( | ( | |||||||||||||||
| Manufacturer floorplan payable | |||||||||||||||||
| Deferred revenue | ( | ( | |||||||||||||||
| Accounts payable, accrued expenses and other and other long-term liabilities | ( | ( | ( | ||||||||||||||
| Net Cash (Used for) Provided by Operating Activities | ( | ||||||||||||||||
| Investing Activities | |||||||||||||||||
| Rental fleet purchases | ( | ( | ( | ||||||||||||||
| Property and equipment purchases (excluding rental fleet) | ( | ( | ( | ||||||||||||||
| Proceeds from sale of property and equipment | |||||||||||||||||
| Acquisition consideration, net of cash acquired | ( | ( | ( | ||||||||||||||
| Other, net | ( | ( | |||||||||||||||
| Net Cash Used for Investing Activities | ( | ( | ( | ||||||||||||||
| Financing Activities | |||||||||||||||||
| Net change in non-manufacturer floorplan payable | ( | ||||||||||||||||
| Proceeds from long-term debt borrowings | |||||||||||||||||
| Principal payments on long-term debt and finance leases | ( | ( | ( | ||||||||||||||
| Other, net | ( | ( | ( | ||||||||||||||
| Net Cash Provided by (Used for) Financing Activities | ( | ||||||||||||||||
| Effect of Exchange Rate Changes on Cash | ( | ( | |||||||||||||||
| Net Change in Cash | ( | ( | |||||||||||||||
| Cash at Beginning of Period | |||||||||||||||||
| Cash at End of Period | $ | $ | $ | ||||||||||||||
| Supplemental Disclosures of Cash Flow Information | |||||||||||||||||
| Cash paid during the period | |||||||||||||||||
| Income taxes, net of refunds | $ | $ | $ | ||||||||||||||
| Interest | $ | $ | $ | ||||||||||||||
Supplemental Disclosures of Noncash Investing and Financing Activities | |||||||||||||||||
| Net property and equipment financed with long-term debt, capital leases, accounts payable and accrued liabilities | $ | $ | $ | ||||||||||||||
| Long-term debt to acquire finance leases | $ | $ | $ | ||||||||||||||
| Net transfer of assets from (to) property and equipment to (from) inventories | $ | ( | $ | ( | $ | ||||||||||||
See Notes to Consolidated Financial Statements
54
NOTE 1 - BUSINESS ACTIVITY AND SIGNIFICANT ACCOUNTING POLICIES
Nature of Business
Titan Machinery Inc. and its subsidiaries (collectively, the "Company") are engaged in the retail sale, service and rental of agricultural and construction machinery through its stores in the United States, Europe, and Australia. The Company's North American stores are located in Colorado, Idaho, Iowa, Kansas, Minnesota, Missouri, Montana, Nebraska, North Dakota, South Dakota, Washington, Wisconsin and Wyoming, its European stores are located in Bulgaria, Germany, Romania, and Ukraine, and its Australian stores are located in New South Wales, South Australia, and Victoria.
Seasonality
The agricultural and construction equipment businesses are highly seasonal, which causes the Company's quarterly results and cash flows to fluctuate during the year. The Company's customers generally purchase and rent equipment in preparation for, or in conjunction with, their busy seasons, which for farmers are the planting and harvesting seasons, and for construction customers is dependent on weather seasons in their respective regions, which is typically the second and third quarters of the Company's fiscal year for much of its Construction footprint. The Company's parts and service revenues are also typically highest during its customers' busy seasons, due to the increased use of their equipment during this time, which generates the need for more parts and service work. However, weather conditions impact the timing of our customers' busy times, which may cause the Company's quarterly financial results to differ between fiscal years. In addition, the fourth quarter typically is a significant period for equipment sales in the United States because of our customers’ year-end tax planning considerations, the timing of dealer incentives and the increase in availability of funds from completed harvests and construction projects.
Principles of Consolidation
The consolidated financial statements include the accounts of the Company and its wholly-owned subsidiaries. All significant accounts, transactions and profits between the consolidated companies have been eliminated in consolidation.
The Company's foreign subsidiaries have fiscal years ending on December 31 of each year, consistent with statutory reporting requirements in each of the respective countries. The accounts of the Company's foreign subsidiaries are consolidated as of December 31 of each year. No events or transactions occurred related to these subsidiaries in January 2024 that would have materially affected the consolidated financial position, results of operations or cash flows.
Estimates
The preparation of financial statements in conformity with accounting principles generally accepted in the United States of America requires management to make estimates and assumptions that affect the reported amounts of assets and liabilities and disclosure of contingent assets and liabilities at the date of the consolidated financial statements and the reported amounts of revenue and expenses during the reporting period. Actual results could differ from those estimates, particularly related to realization of inventory, impairment of long-lived assets, goodwill, indefinite-lived intangible assets, collectability of receivables, and income taxes.
Concentrations of Credit Risk
The Company's sales are to agricultural and construction equipment customers principally in the U.S. states in which it has stores as well as in the European countries and Australian states in which its stores are located. The Company extends credit to its customers in the ordinary course of business and monitors its customers' financial condition to minimize its risks associated with trade receivables; however, the Company does not generally require collateral on trade receivables.
The Company's cash balances are maintained in bank deposit accounts, which, at times, are in excess of federally insured limits.
Concentrations in Operations
The Company currently purchases new equipment, rental equipment and the related parts from a limited number of manufacturers. Although no change in suppliers is anticipated, the occurrence of such a change could cause a possible loss of sales and adversely affect operating results. The Company is the holder of authorized dealerships granted by CNH Industrial America, LLC and CNHI International SA (collectively referred to "CNH Industrial") whereby it has the right to act as an authorized dealer for the entity's equipment at specified locations. The dealership authorizations and floorplan payable facilities can be canceled by the respective entity if the Company does not observe certain established guidelines and covenants.
55
In addition, the Company believes that the following factors related to concentrations in suppliers, and in particular CNH Industrial, have a significant impact on its operating results:
•CNH Industrial's product offerings, reputation and market share;
•CNH Industrial's product prices and incentive and discount programs;
•Supply of inventory from CNH Industrial and ability to match demand levels and delivery timelines;
•CNH Industrial provides floorplan payable financing for the purchase of a substantial portion of the Company's inventory; and
•CNH Industrial provides a significant percentage of the financing and lease financing used by the Company's customers to purchase CNH Industrial equipment from the Company.
Revenue Recognition
Revenues are recognized when control of the promised goods or services is transferred to the customer, in an amount that reflects the consideration the Company expects to collect in exchange for those goods or services. Shipping and handling costs are recorded as cost of revenue. Sales, value added and other taxes collected from the Company's customers concurrent with the Company's revenue activities are excluded from revenue.
Equipment Revenue. Equipment revenue transactions include the sale of new and used agricultural and construction equipment. The Company satisfies its performance obligations and recognizes revenue at a point in time, primarily upon the delivery of the product. Once a product is delivered, the customer has physical possession of the asset, can direct the use of the asset, and has the significant risks and rewards of ownership of the asset. Equipment transactions often include both cash and non-cash consideration. Cash consideration is paid directly by the Company's customers or by third-party financial institutions financing the Company's customer transactions. Non-cash consideration is in the form of trade-in equipment assets. The Company assigns a value to trade-in assets by estimating a future selling price, which the Company estimates based on relevant internal and third-party data, less a gross profit amount to be realized at the time the trade-in asset is sold and an estimate of any reconditioning work required to ready the asset for sale. Both cash and non-cash consideration may be received prior to or after the Company's performance obligation is satisfied. Any consideration received prior to the satisfaction of the Company's performance obligation is recognized as deferred revenue. Receivables recognized for amounts not paid at the time our performance obligation is satisfied, including amounts due from third-party financial institutions, generally do not have established payment terms but are collected in relatively short time periods.
Parts Revenue. We sell a broad range of maintenance and replacement parts for both equipment that we sell and other types of equipment. The Company satisfies its performance obligation and recognizes revenue at a point in time, upon delivery of the product to the customer. Once a product is delivered, the Company has a present right to payment, the customer has physical possession of the asset, can direct the use of the asset, and has the significant risks and rewards of ownership of the asset. In many cases, customers tender payment at the time of delivery. Balances not paid at the time of delivery are typically due in full within 30 days. Most parts are sold with a thirty-day right of return or exchange. Historically, parts returns have not been material.
Parts revenue also includes the retail value of parts inventories consumed during the course of customer repair and maintenance services and services provided under manufacturer warranties. As further described below, we recognize revenue from these activities over time.
Service Revenue. We provide repair and maintenance services, including repairs performed under manufacturer warranties, for our customer’s equipment. We recognize service and associated parts revenue of our repair and maintenance services over time as we transfer control of these goods and services over time. The Company recognizes revenue over time in the amount to which we have the right to invoice the customer, as such an amount corresponds to the value of our performance completed to date. Generally, the Company has the right to invoice the customer for labor hours incurred and parts inventories consumed during the performance of the service arrangement. Customer invoicing most often occurs at the conclusion of our repair and maintenance services. Accordingly, we recognize unbilled receivables for the amount of unbilled labor hours incurred and parts inventories consumed under our repair and maintenance arrangements. Upon customer invoicing, unbilled receivables are reclassified to receivables. In many cases, customers tender payment at the completion of our work and the creation of the invoice. Balances not paid at the time of invoicing are typically due in full within 30 days.
56
Rental and Other Revenue. We rent equipment to our customers on a short-term basis for periods ranging from a few days to a few months. Rental revenue is recognized on a straight-line basis over the period of the related rental agreement. Revenue from rental equipment delivery and pick-up services is recognized when the service is performed. Other revenues primarily consist of fees charged in connection with short-haul equipment delivery and pick-up services, in which revenue is recognized at a point in time when the service is completed, and Global Positioning System ("GPS") signal subscriptions, in which revenue is recognized on a straight-line basis over the subscription period.
Manufacturer Incentives and Discounts
The Company receives various manufacturer incentives and discounts, which are based on a variety of factors. Discounts and incentives related to the purchase of inventory are recognized as a reduction of inventory prices and recognized as a reduction of cost of revenue when the related inventory is sold. Other incentives, reflecting reimbursement of qualifying expenses, are recognized as a reduction of the related expense when earned.
Receivables and Credit Policy
Trade accounts receivable due from customers are uncollateralized customer obligations due under normal trade terms requiring payment within 30 to 90 days from the invoice date. Balances unpaid after the due date based on trade terms are considered past due and begin to accrue interest. Payments of trade receivables are allocated to the specific invoices identified on the customer's remittance advice or, if unspecified, are applied to the earliest unpaid invoices. Trade accounts receivable due from manufacturers relate to warranty work, discount programs and incentive programs. Trade accounts receivable due from finance companies primarily consist of contracts in transit with finance companies and balances due from credit card companies. These receivables do not generally have established payment terms but are collected in relatively short time periods. Unbilled receivables primarily represent unbilled labor hours incurred and parts inventories consumed during the performance of service arrangements for our customers at the Company's retail rates.
The carrying amount of trade receivables is reduced by a valuation allowance that reflects management's best estimate of the amounts that will not be collected. Management reviews aged receivable balances and estimates the portion, if any, of the balance that will not be collected. Account balances are charged off after all appropriate means of collection have been exhausted and the potential for recovery is considered remote.
Inventories
57
Property and Equipment
Property and equipment is carried at cost less accumulated depreciation and amortization. Depreciation and amortization are computed on a straight-line basis over the estimated useful life of each asset, as summarized below:
| Buildings and leasehold improvements | Lesser of | ||||
| Machinery and equipment | |||||
| Furniture and fixtures | |||||
| Vehicles | |||||
| Rental fleet | |||||
Depreciation for income tax reporting purposes is computed using accelerated methods.
Goodwill
Intangible Assets
Intangible assets with a finite life consist of customer relationships and covenants not to compete, and are carried at cost less accumulated amortization. The Company amortizes the cost of identified intangible assets on a straight-line basis over the expected period of benefit, which generally range from five to ten years for customer relationships and the contractual term for covenants not to compete, which range from three to five years.
Impairment of Long-Lived Assets
The Company's long-lived assets consist of its property and equipment. These assets are reviewed for potential impairment when events or circumstances indicate that the carrying value may not be recoverable. Recoverability is measured by comparing the estimated future undiscounted cash flows of such assets to their carrying values. If the estimated undiscounted cash flows exceed the carrying value, the carrying value is considered recoverable and no impairment recognition is required. However, if the sum of the undiscounted cash flows is less than the carrying value of the asset, the estimated fair value of the long-lived asset is compared to its carrying value and any amount by which the carrying value exceeds the fair value is recognized as an impairment charge.
58
When reviewing long-lived assets for impairment, we group long-lived assets with other assets and liabilities at the lowest level for which identifiable cash flows are largely independent of the cash flows of other assets and liabilities. Long-lived assets deployed and used by individual store locations are reviewed for impairment at the individual store level. Other long-lived assets shared across stores within a segment or shared across segments are reviewed for impairment on a segment or consolidated level as appropriate.
During the year ended January 31, 2024, the Company determined that certain events or circumstances, including a current period operating loss combined with historical losses and anticipated future operating losses, within certain of its stores was an indication that the long-lived assets of these stores may not be recoverable. The aggregate carrying value of such assets totaled $11.0 million. In light of these circumstances, the Company performed a long-lived asset impairment analysis for these assets and concluded that the carrying value was recoverable. Accordingly, the Company did not recognize any impairment charges in the year ended January 31, 2024.
We performed similar impairment analyses at the end of fiscal 2023 and 2022. The Company did not recognize impairment charges during the year ended January 31, 2023. The Company recognized impairment charges totaling $0.4 million on long-lived assets during the year ended January 31, 2022, which was related to the Europe segment. All impairment charges recognized are included in the Impairment of Intangible and Long-Lived Assets line item in the consolidated statements of operations.
Construction of Leased Assets and Sale-Leaseback Accounting
The Company, from time to time, performs construction projects on its store locations, which are recorded as property and equipment in the consolidated balance sheet during the construction period. Upon completion, these assets are either placed in service, at which point the depreciation of the asset commences, or are part of a sale-leaseback transaction with a third-party buyer/lessor. In certain other situations, the Company enters into build-to-suit construction projects with third-party lessors. Under the applicable lease accounting rules, certain forms of lessee involvement in the construction of the leased asset deem the Company to be the owner of the leased asset during the construction period and requires capitalization of the lessor's total project costs on the consolidated balance sheet with the recognition of a corresponding financing obligation. Upon completion of a project for which the constructed assets are sold to a buyer/lessor or the completion of a capitalized build-to suit construction project, the Company performs a sale-leaseback analysis to determine if the asset and related financing obligation can be derecognized from the consolidated balance sheet. Certain provisions in a number of our lease agreements, primarily provisions regarding repurchase options, are deemed to be continuing involvement in the sold asset which precludes sale recognition. In such cases, the asset remains on the consolidated balance sheet under property and equipment and the proceeds received in the sale-leaseback transaction are recognized as a financing obligation within long-term debt in the consolidated balance sheet. Both the asset and the financing obligation are amortized over the lease term. In instances in which the Company has no continuing involvement in the sold asset, the criteria for sale recognition are met and the asset and any related financing obligation are derecognized from the consolidated balance sheet, and the lease is analyzed for proper accounting treatment as either an operating or finance lease.
Derivative Instruments
In the normal course of business, the Company is subject to risk from adverse fluctuations in foreign currency exchange rates. The Company may manage its market risk exposures through a program that includes the use of derivative instruments, primarily foreign exchange forward contracts. The Company's objective in managing its exposure to market risk is to minimize the impact on earnings, cash flows and the consolidated balance sheet. The Company does not use derivative instruments for trading or speculative purposes.
59
Income Taxes
The Company uses the asset and liability method to account for income taxes. Under this method, deferred tax assets and liabilities are recognized for the expected future tax consequences of differences between the carrying amounts of assets and liabilities and their respective tax bases. Deferred tax assets are reduced by a valuation allowance when it is more likely than not that a portion or all of the deferred tax assets will not be realized. Changes in valuation allowances are included in its provision for income taxes in the period of the change. Deferred tax assets and liabilities are netted by taxing jurisdiction and presented as either a net asset or liability position, as applicable, on the consolidated balance sheets.
The Company recognizes the financial statement benefit of income tax positions only if those positions are more likely than not of being sustained. Recognized income tax positions are measured as the largest amount that has a greater than 50% likelihood of being realized. Changes in the recognition or measurement of such positions are reflected in its provision for income taxes in the period of the change. The Company's policy is to recognize interest and penalties related to income tax matters within its provision for income taxes.
Advertising Costs
Costs incurred for producing and distributing advertising are expensed as incurred. Advertising expense amounted to $3.1 million, $2.9 million and $2.5 million for the years ended January 31, 2024, 2023 and 2022, respectively.
Stock-Based Compensation
Comprehensive Income and Foreign Currency Matters
For the Company, comprehensive income (loss) represents net income adjusted for foreign currency translation adjustments. For the Company's foreign subsidiaries in which their local currency is their functional currency, assets and liabilities are translated into U.S. dollars at the balance sheet date exchange rate. Income and expenses are translated at average exchange rates for the year. Foreign currency translation adjustments are recorded directly as other comprehensive income (loss), a component of stockholders' equity. For the Company's foreign subsidiaries in which the local currency is not the functional currency, prior to translation into U.S. dollars, amounts must first be remeasured from the local currency into the functional currency. Nonmonetary assets and liabilities are remeasured at historical exchange rates and monetary assets and liabilities are remeasured at the balance sheet date exchange rate. Income and expenses are remeasured at average exchange rates for the year. Foreign currency remeasurement adjustments are included in the statement of operations.
The Company recognized, in interest and other income in its consolidated statements of operations, a net foreign currency transaction gain (loss) of $1.0 million, $(1.2 ) million, and $(0.1 ) million for the years ended January 31, 2024, 2023, and 2022 respectively.
Business Combinations
The Company accounts for business combinations by allocating the purchase price amongst the assets acquired, including identifiable intangible assets, and liabilities assumed based on the fair values of the acquired assets and assumed liabilities. The acquisition accounting is finalized during the measurement period, which may not exceed one year from the date of acquisition. During the measurement period the Company's accounting for the business combination transaction may be based on estimates due to various unknown factors present at the date of acquisition.
Fair Value Measurements
Fair value is defined as the price that would be received for an asset or paid to transfer a liability (an exit price) in the principal or most advantageous market for the asset or liability in an orderly transaction between market participants. Three levels of inputs may be used to measure fair value:
Level 1—Values derived from unadjusted quoted prices in active markets for identical assets and liabilities.
Level 2—Values derived from observable inputs other than quoted prices that are observable for the asset or liability, either directly or indirectly, including quoted prices for similar assets or liabilities in active markets, or quoted prices for identical or similar assets in markets that are not active.
60
Level 3—Values derived from unobservable inputs for which there is little or no market data available, thereby requiring the reporting entity to develop its own assumptions.
In instances where the determination of the fair value measurement is based on inputs from different levels of the fair value hierarchy, the level in the fair value hierarchy within which the entire fair value measurement falls is based on the lowest level input that is significant to the fair value measurement in its entirety.
Segment Reporting
Recent Accounting Guidance
Accounting guidance not yet adopted
In November 2023, the Financial Accounting Standards Board ("FASB") issued Accounting Standard Update ("ASU") No. 2023-07, Segment Reporting (Topic 280): Improvements to Reportable Segment Disclosures, which updates reportable segment disclosure requirements primarily through enhanced disclosures about significant segment expenses. The amendments are effective for fiscal years beginning after December 15, 2023, and for interim periods within fiscal years beginning after December 15, 2024. Early adoption is permitted. The amendments should be applied retrospectively to all prior periods presented in the financial statements. The Company is currently evaluating the provisions of the amendments and the impact on its future consolidated statements.
In December 2023, the FASB issued ASU 2023-09, Income Taxes (Topic 740): Improvements to Income Tax Disclosures, which requires additional income tax disclosures in the rate reconciliation table for federal, state and foreign income taxes, in addition to more details about the reconciling items in some categories when items meet a certain quantitative threshold. ASU 2023-09 is effective for annual periods beginning after December 15, 2024 with early adoption permitted. The Company is currently evaluating the provisions of the amendments and the impact on its future consolidated statements.
In March 2024, the SEC adopted new rules that will require registrants to provide certain climate-related information in their registration statements and annual reports. The rules require information about a registrant's climate-related risks that are reasonably likely to have a material impact on its business, results of operations, or financial condition. The required information about climate-related risks will also include disclosure of a registrant's greenhouse gas emissions. In addition, the rules will require registrants to present certain climate-related financial metrics in their audited financial statements. The Company is currently evaluating the rules and the impact on its future consolidated statements.
Recently Adopted Accounting Guidance
In September 2022, FASB issued ASU No. 2022-04, Supplier Finance Programs (Subtopic 405-50): Disclosure of Supplier Finance Program Obligations. This new standard requires that the buyer in a supplier finance program discloses information about the key terms of the program, outstanding confirmed amounts as of the end of the period, a rollforward of such amounts during each annual period, and a description of where in the financial statements outstanding amounts are presented. This ASU is effective for fiscal years beginning after December 15, 2022, including interim periods within those fiscal years, except for the disclosure of rollforward information, which is effective for fiscal years beginning after December 15, 2023. Entities must apply the amendments of this ASU retrospectively to all periods in which a balance sheet is presented, with the exception of the amendment on disclosure of rollforward information, which entities only need to apply prospectively. On February 1, 2023, the Company adopted ASU No. 2022-04 to our consolidated financial statements.
The Company has agreements with financial institutions to facilitate the purchase of inventory from designated suppliers under certain terms and conditions. Under these agreements, the Company receives extended payment terms and agrees to pay the financial institution a stated amount of confirmed invoices from its designated suppliers. The Company may incur interest in accordance with the terms of the agreements. Additionally, the Company has no involvement in establishing the terms or conditions of the arrangements between its suppliers and the financial institution.
The amounts outstanding under these agreements as of January 31, 2024 and 2023 were $47.0 million and $13.0 million, respectively, and are presented as Floorplan payable on the Company's consolidated balance sheets.
61
NOTE 2 - EARNINGS PER SHARE
Earnings Per Share ("EPS")
The Company uses the two-class method to calculate basic and diluted EPS. Unvested restricted stock awards are considered participating securities because they entitle holders to non-forfeitable rights to dividends during the vesting term. Under the two-class method, earnings of the Company are allocated between common stockholders and these participating securities based on the weighted-average number of shares of common stock and participating securities outstanding during the relevant period.
Basic EPS is computed by dividing net income attributable to Titan Machinery Inc. common stockholders by the weighted-average number of shares of common stock outstanding during the relevant period. Diluted EPS is computed by dividing net income attributable to Titan Machinery Inc. common stockholders by the weighted-average number of shares of common stock outstanding after adjusting for potential dilution related to the conversion of all dilutive securities into common stock. All potentially dilutive securities were included in the computation of diluted EPS for years with net income. All anti-dilutive securities were excluded from the computation of diluted EPS.
The following table sets forth the calculation of basic and diluted EPS:
| Year Ended January 31, | |||||||||||||||||
| 2024 | 2023 | 2022 | |||||||||||||||
| (in thousands, except per share data) | |||||||||||||||||
| Numerator | |||||||||||||||||
| Net income | $ | $ | $ | ||||||||||||||
| Allocation to participating securities | ( | ( | ( | ||||||||||||||
| Net income attributable to Titan Machinery Inc. common stockholders | $ | $ | $ | ||||||||||||||
| Denominator | |||||||||||||||||
| Basic weighted-average common shares outstanding | |||||||||||||||||
Plus: incremental shares from assumed vesting of restricted stock units | |||||||||||||||||
| Diluted weighted-average common shares outstanding | |||||||||||||||||
| Earnings per Share: | |||||||||||||||||
| Basic | $ | $ | $ | ||||||||||||||
| Diluted | $ | $ | $ | ||||||||||||||
62
NOTE 3 - REVENUE
The following tables present our revenue disaggregated by revenue source and segment for the years ended January 31, 2024, 2023 and 2022:
| Year Ended January 31, 2024 | |||||||||||||||||||||||||||||
| Agriculture | Construction | Europe | Australia | Total | |||||||||||||||||||||||||
| (in thousands) | |||||||||||||||||||||||||||||
| Equipment | $ | $ | $ | $ | 54,743 | $ | |||||||||||||||||||||||
| Parts | 11,912 | ||||||||||||||||||||||||||||
| Service | 2,878 | ||||||||||||||||||||||||||||
| Other | 276 | ||||||||||||||||||||||||||||
| Revenue from contracts with customers | 69,809 | ||||||||||||||||||||||||||||
| Rental | — | ||||||||||||||||||||||||||||
| Total revenues | $ | $ | $ | $ | 69,809 | $ | |||||||||||||||||||||||
| Year Ended January 31, 2023 | |||||||||||||||||||||||
| Agriculture | Construction | Europe | Total | ||||||||||||||||||||
| (in thousands) | |||||||||||||||||||||||
| Equipment | $ | $ | $ | $ | |||||||||||||||||||
| Parts | |||||||||||||||||||||||
| Service | |||||||||||||||||||||||
| Other | |||||||||||||||||||||||
| Revenue from contracts with customers | |||||||||||||||||||||||
| Rental | |||||||||||||||||||||||
| Total revenues | $ | $ | $ | $ | |||||||||||||||||||
| Year Ended January 31, 2022 | |||||||||||||||||||||||
| Agriculture | Construction | Europe | Total | ||||||||||||||||||||
| (in thousands) | |||||||||||||||||||||||
| Equipment | $ | $ | $ | $ | |||||||||||||||||||
| Parts | |||||||||||||||||||||||
| Service | |||||||||||||||||||||||
| Other | |||||||||||||||||||||||
| Revenue from contracts with customers | |||||||||||||||||||||||
| Rental | |||||||||||||||||||||||
| Total revenues | $ | $ | $ | $ | |||||||||||||||||||
Deferred revenue from contracts with customers totaled $114.6 million and $118.1 million as of January 31, 2024 and January 31, 2023, respectively. Our deferred revenue most often increases in the fourth quarter of each fiscal year, due to a higher level of customer down payments or prepayments. During the year ended January 31, 2024, the Company recognized substantially all of the revenue that was included in the deferred revenue balance as of January 31, 2023.
The following is a summary of deferred revenue as of January 31, 2024 and January 31, 2023:
| January 31, 2024 | January 31, 2023 | ||||||||||
| (in thousands) | |||||||||||
| Deferred revenue from contracts with customers | $ | $ | |||||||||
| Deferred revenue from rental and other contracts | |||||||||||
| $ | $ | ||||||||||
63
No material amount of revenue was recognized during the year ended January 31, 2024 from performance obligations satisfied in previous periods. The Company has elected as a practical expedient to not disclose the value of unsatisfied performance obligations for (i) contracts with an original expected length of service of one year or less, and (ii) contracts for which we recognize revenue at the amount to which we have the right to invoice for services performed. The contracts for which the practical expedient has been applied include (i) equipment revenue transactions, which do not have a stated contractual term, but are short-term in nature, and (ii) service revenue transactions, which also do not have a stated contractual term but are generally completed within 30 days and for such contracts we recognize revenue over time at the amount to which we have the right to invoice for services completed to date.
NOTE 4 - RECEIVABLES
The Company provides an allowance for expected credit losses on its nonrental receivables. To measure the expected credit losses, receivables have been grouped based on shared credit risk characteristics as shown in the table below.
Trade and unbilled receivables from contracts with customers have credit risk and the allowance is determined by applying expected credit loss percentages to aging categories based on historical experience that are updated at least annually. The rates may also be adjusted to the extent future events are expected to differ from historical results. Given that the credit terms for these receivables are short-term, changes in credit loss percentages due to future events may not occur on a frequent basis. In addition, the allowance is adjusted based on information obtained by continued monitoring of individual customer credit.
Trade receivables from finance companies, other receivables due from manufacturers, and other receivables have not historically resulted in any credit losses to the Company. These receivables are short-term in nature and deemed to be of good credit quality and have no need for any allowance for expected credit losses. Management continually monitors these receivables and should information be obtained that identifies potential credit risk, an adjustment to the allowance would be made if deemed appropriate.
Trade and unbilled receivables from rental contracts are primarily in the United States and are specifically excluded from the accounting guidance in determining an allowance for expected losses. The Company provides an allowance for these receivables based on historical experience and using credit information obtained from continued monitoring of customer accounts.
| January 31, 2024 | January 31, 2023 | ||||||||||
| (in thousands) | |||||||||||
| Trade and unbilled receivables from contracts with customers | |||||||||||
| Trade receivables due from customers | $ | $ | |||||||||
| Unbilled receivables | |||||||||||
| Less allowance for expected credit losses | |||||||||||
| Short-term receivables due from finance companies | |||||||||||
| Trade and unbilled receivables from rental contracts | |||||||||||
| Trade receivables | |||||||||||
| Unbilled receivables | |||||||||||
| Less allowance for expected credit losses | |||||||||||
| Other receivables | |||||||||||
| Due from manufacturers | |||||||||||
| Other | |||||||||||
| Receivables, net of allowance for expected credit losses | $ | $ | |||||||||
64
Following is a summary of allowance for credit losses on trade and unbilled accounts receivable by segment:
| Agriculture | Construction | Europe | Australia | Total | |||||||||||||||||||||||||
| (in thousands) | |||||||||||||||||||||||||||||
| Balance at January 31, 2022 | $ | $ | $ | $ | — | $ | |||||||||||||||||||||||
| Current expected credit loss provision | — | ||||||||||||||||||||||||||||
| Write-offs charged against allowance | — | ||||||||||||||||||||||||||||
| Credit loss recoveries collected | — | ||||||||||||||||||||||||||||
| Foreign exchange impact | — | — | ( | — | ( | ||||||||||||||||||||||||
| Balance at January 31, 2023 | — | ||||||||||||||||||||||||||||
| Current expected credit loss provision | 56 | ||||||||||||||||||||||||||||
| Write-offs charged against allowance | — | ||||||||||||||||||||||||||||
| Credit loss recoveries collected | — | ||||||||||||||||||||||||||||
| Foreign exchange impact | — | — | 3 | ||||||||||||||||||||||||||
| Balance at January 31, 2024 | $ | $ | $ | $ | 59 | $ | |||||||||||||||||||||||
The following table presents impairment losses on receivables arising from sales contracts with customers and receivables arising from rental contracts:
| Year Ended January 31, | |||||||||||
| 2024 | 2023 | ||||||||||
| (in thousands) | |||||||||||
| Impairment losses on: | |||||||||||
| Receivables from sales contracts with customers | $ | $ | |||||||||
| Receivables from rental contracts | |||||||||||
| $ | $ | ||||||||||
NOTE 5 - INVENTORIES
| January 31, 2024 | January 31, 2023 | ||||||||||
| (in thousands) | |||||||||||
| New equipment | $ | $ | |||||||||
| Used equipment | |||||||||||
| Parts and attachments | |||||||||||
| Work in process | |||||||||||
| $ | $ | ||||||||||
65
NOTE 6 - PROPERTY AND EQUIPMENT
| January 31, 2024 | January 31, 2023 | ||||||||||
| (in thousands) | |||||||||||
| Rental fleet equipment | $ | $ | |||||||||
| Machinery and equipment | |||||||||||
| Vehicles | |||||||||||
| Furniture and fixtures | |||||||||||
| Land, buildings, and leasehold improvements | |||||||||||
| Less accumulated depreciation | |||||||||||
| $ | $ | ||||||||||
The Company includes depreciation expense related to its rental fleet and its trucking fleet, for hauling equipment, in Cost of Revenue, which was $8.7 million, $8.2 million, and $8.6 million for the years ended January 31, 2024, 2023 and 2022, respectively. All other depreciation expense is included in Operating Expenses, which totaled $21.3 million, $15.9 million, and $12.2 million for the years ended January 31, 2024, 2023 and 2022, respectively. The Company had assets related to sale-leaseback financing obligations and finance leases associated with real estate of store locations, which are included in the land, buildings and leasehold improvements balance above. Such assets had gross carrying values totaling $18.4 million and $18.8 million, and accumulated amortization balances totaling $9.7 million and $8.6 million, as of January 31, 2024 and 2023, respectively.
NOTE 7 - INTANGIBLE ASSETS AND GOODWILL
Definite-Lived Intangible Assets
The following is a summary of definite-lived intangible assets as of January 31, 2024 and 2023:
| January 31, 2024 | January 31, 2023 | ||||||||||||||||||||||||||||||||||
| Cost | Accumulated Amortization | Net | Cost | Accumulated Amortization | Net | ||||||||||||||||||||||||||||||
| (in thousands) | (in thousands) | ||||||||||||||||||||||||||||||||||
| Covenants not to compete | $ | $ | ( | $ | $ | $ | ( | $ | |||||||||||||||||||||||||||
| Customer relationships | ( | ( | |||||||||||||||||||||||||||||||||
| $ | $ | ( | $ | $ | $ | ( | $ | ||||||||||||||||||||||||||||
Intangible asset amortization expense was $0.7 0.2 million for the each of the years ended January 31, 2023 and 2022. The covenants not to compete and customer relationships assets for the year ended January 31, 2024 have a weighted-average amortization period of 4.7 years and 6.9 years, respectively. As of January 31, 2024, future amortization expense is expected to be as follows:
| Fiscal years ending January 31, | Amount | ||||
| (in thousands) | |||||
| 2025 | $ | ||||
| 2026 | |||||
| 2027 | |||||
| 2028 | |||||
| 2029 | |||||
| Thereafter | |||||
| $ | |||||
66
Indefinite-Lived Intangible Assets
The Company's indefinite-lived intangible assets consist of distribution rights assets. Changes in the carrying amount of distribution rights during the years ended January 31, 2024 and 2023 are as follows:
| Agriculture | Construction | Australia | Total | ||||||||||||||||||||
| (in thousands) | |||||||||||||||||||||||
| Balance, January 31, 2022 | $ | $ | $ | — | $ | ||||||||||||||||||
| Arising from business combinations | — | — | |||||||||||||||||||||
| Balance, January 31, 2023 | $ | $ | $ | — | $ | ||||||||||||||||||
| Arising from business combinations | — | — | 21,470 | ||||||||||||||||||||
| Foreign currency translation | — | — | 1,372 | ||||||||||||||||||||
| Balance, January 31, 2024 | $ | $ | $ | 22,842 | $ | ||||||||||||||||||
The Company performs at least an annual impairment testing of its indefinite-lived distribution rights intangible assets. Under the impairment test, the fair value of distribution rights intangible assets is estimated based on a multi-period excess earnings model, an income approach. This model allocates future estimated earnings of the store/complex amongst working capital, fixed assets and other intangible assets of the store/complex and any remaining earnings (the "excess earnings") are allocated to the distribution rights intangible assets. The earnings allocated to the distribution rights are then discounted to arrive at the present value of the future estimated excess earnings, which represents the estimated fair value of the distribution rights intangible asset. The discount rate applied reflects the Company's estimate of the weighted-average cost of capital of comparable companies plus an additional risk premium to reflect the additional risk inherent in the distribution right asset. The results of the Company's annual distribution rights impairment test for the year ended January 31, 2024, indicated no impairment.
During the years ended January 31, 2024 and 2023, no impairment charges were recognized in association with indefinite-lived intangible assets. During the year ended January 31, 2022, the Company recognized $1.1 million of impairment charges associated with its distribution rights in its German reporting unit.
The Company had gross indefinite-lived intangible assets of $42.2 million and accumulated impairments of $ as of January 31, 2024.
Goodwill
Changes in the carrying amount of goodwill during the years ended January 31, 2024 and 2023 are as follows:
| Agriculture | Europe | Australia | Total | ||||||||||||||||||||
| (in thousands) | |||||||||||||||||||||||
| Balance, January 31, 2022 | $ | $ | $ | — | $ | ||||||||||||||||||
| Arising from business combinations | — | — | |||||||||||||||||||||
| Balance, January 31, 2023 | $ | $ | $ | — | $ | ||||||||||||||||||
| Arising from business combinations | 471 | 24,261 | |||||||||||||||||||||
| Foreign currency translation | 1,550 | ||||||||||||||||||||||
| Balance, January 31, 2024 | $ | $ | $ | 25,811 | $ | ||||||||||||||||||
The Company performs an annual impairment testing of goodwill as of December 31st of each year. For the year ended January 31, 2024, the Company performed a qualitative (Step 0) assessment and we concluded the that it was more likely than not that the fair value of the reporting units under the Agriculture and Australia reporting units exceeded its carrying value. Therefore, we were not required to perform a quantitative analysis. However, management elected to perform a quantitative analysis for the goodwill in our German reporting unit, within our Europe segment. which was completed for the year ended January 31, 2023. Under the quantitative impairment test, the fair value of the reporting unit was estimated using an income approach and it was determined that the fair value exceeded the carrying value, so no impairment was recognized. During the years ended January 31, 2024, 2023 and 2022, the Company did not recognize any impairment charges.
67
The gross goodwill balance was $65.6 million and $32.1 million as of January 31, 2024 and 2023, respectively. The accumulated goodwill impairment loss was $1.5 million as of January 31, 2024 and 2023.
NOTE 8 - FLOORPLAN PAYABLE/LINES OF CREDIT
Floorplan payable balances reflect amounts owed to manufacturers for equipment inventory purchases and amounts outstanding under our various floorplan line of credit facilities. In the consolidated statements of cash flows, the Company reports cash flows associated with manufacturer floorplan financing as operating cash flows and cash flows associated with non-manufacturer floorplan financing as financing cash flows.
As of January 31, 2024, the Company had floorplan lines of credit totaling $1.4 billion, which is primarily comprised of three significant floorplan lines of credit: (i) a $875.0 million credit facility with CNH Industrial, (ii) a $275.0 million line of credit with a group of banks (the "Bank Syndicate"), and (iii) a $80.0 million credit facility with DLL Finance LLC (“DLL Finance”).
CNH Industrial Floorplan Payable Line of Credit
As of January 31, 2024, the Company had a $875.0 million credit facility with CNH Industrial, of which $640.0 million is available for U.S. domestic financing, $140.0 million is available for Australian financing, and $95.0 million is available for European financing.
The U.S. domestic financing facility offers financing for new and used equipment inventories. Available borrowings under this credit facility are reduced by outstanding floorplan payable balances and other acquisition-related financing arrangements with CNH Industrial. This credit facility charges interest at the prime rate plus or minus an agreed upon percentage, but not less than zero, for the financing of new and used equipment inventories and rental fleet assets. CNH Industrial offers periods of reduced interest rates and interest-free periods. Repayment terms vary, but generally payments are made from sales proceeds or rental revenue generated from the related inventories or rental fleet assets. Balances under the outstanding CNH Industrial U.S. domestic credit facility are secured by the inventory or rental fleet purchased with the floorplan proceeds. The European financing facility offers financing for new equipment inventories. Available borrowings under this credit facility are reduced by outstanding floorplan payable balances. Amounts outstanding are generally due approximately 75 days after the date of invoice by CNH Industrial. Generally, no interest is charged on outstanding balances. However, in certain international markets the Company receives extended terms from CNH Industrial similar to what we receive domestically with reduced interest and interest free periods. Amounts outstanding under European financing facility are secured by the inventory purchased with the floorplan proceeds. The Australian financing facility offers financing for new and used equipment inventories. Available borrowings under the credit facility are reduced by outstanding floorplan payable balances. CNH Industrial offers periods of reduced interest rates and interest-free periods. Repayment terms vary, but generally payments are made from sales proceeds. The credit facility charges interest at the CNH Industrial prime rate plus or minus an agreed upon spread, but not less than zero, for the financing of new and used equipment inventories and rental fleet assets. Amounts outstanding under the Australian financing facility are secured by the inventory purchased with the floorplan proceeds.
The CNH Industrial credit facility contains financial covenants that impose a maximum level of adjusted debt to tangible net worth of 3.50 :1.00 and minimum fixed charge coverage ratio of 1.10 :1.00. It also contains various restrictive covenants that require prior consent of CNH Industrial if the Company desires to engage in any acquisition of, consolidation or merger with, any other business entity in which the Company is not the surviving company; create subsidiaries; move any collateral outside of the U.S.; or sell, rent, lease or otherwise dispose or transfer any of the collateral, other than in the ordinary course of business. CNH Industrial’s consent is also required for the acquisition of any CNH Industrial dealership. In addition, the CNH Industrial credit facility restricts the Company's ability to incur any liens upon any substantial part of the assets. The credit facility automatically renews on August 31st of each year unless earlier terminated by either party. As of January 31, 2024, the Company was in compliance with the adjusted debt to tangible net worth and fixed charge coverage ratio financial covenants under this credit facility.
68
Bank Syndicate Credit Agreement - Floorplan Payable and Working Capital Lines of Credit
As of January 31, 2024, the Company had a $350.0 million credit facility under a Third Amended and Restated Credit Agreement (the "Bank Syndicate Agreement"), consisting of a $275.0 million floorplan facility (the "Floorplan Loan") and a $75.0 million operating line (the "Revolver Loan"). The amounts available under the Bank Syndicate Agreement are subject to borrowing base calculations and reduced by outstanding standby letters of credit and certain reserves. The Bank Syndicate Agreement includes a variable interest rate on outstanding balances, charges a 0.25 % non-usage fee on the average monthly unused amount, and requires monthly payments of accrued interest. The default loan type is a Secured Overnight Financing Rate ("SOFR") Rate Loan and only if the Company actively selects a Base Rate Loan would the Base Rate Loan be used. The SOFR Rate is based upon one-month, three-month, or six-month SOFR, as chosen by the Company, plus an applicable margin, plus 11.4 basis points for one-month, 26.2 basis points for three-month, and 42.8 basis points for six-month loans. In no event shall the SOFR Rate be less than zero. The Base Rate is the greater of (a) the prime rate of interest announced, from time to time, by Bank of America; (b) the Federal Funds Rate plus 0.5 %, or (c) the one-month SOFR Rate plus 1 % plus applicable margin, plus 11.4 basis points. In no event shall the Base Rate be less than zero. The applicable margin rate is determined based on excess availability under the Bank Syndicate Agreement and ranges from 0.5% to 1.0% for Base Rate Loans.
The Bank Syndicate Agreement does not obligate the Company to maintain financial covenants, except in the event that excess availability (each as defined in the Bank Syndicate Agreement) is less than 15% of the lower of the borrowing base or the size of the maximum credit line, at which point the Company is required to maintain a fixed charge coverage ratio of at least 1.10 :1.00. Based on our excess availability and cash collateral, we were not subject to the fixed charge coverage ratio as of January 31, 2024. The Bank Syndicate Agreement includes various restrictions on the Company and its subsidiaries' activities, including, under certain conditions, limitations on the Company’s ability to make certain cash payments including for cash dividends and stock repurchases, issuance of equity instruments, acquisitions and divestitures, and entering into new indebtedness transactions. As of January 31, 2024, under these provisions of the Bank Syndicate Agreement, the Company had an unrestricted dividend availability of approximately $80.4 million. The Bank Syndicate Agreement matures on April 3, 2025.
The Floorplan Loan is used to finance equipment inventory purchases. Amounts outstanding are recorded as floorplan payables, within current liabilities on the consolidated balance sheets, as the Company intends to repay amounts borrowed within one year.
The Revolver Loan is used to finance rental fleet equipment and for general working capital requirements of the Company. Amounts outstanding are typically recorded as long-term debt, within long-term liabilities on the consolidated balance sheets, as the Company does not have the obligation to repay amounts borrowed within one year. As of January 31, 2024 and 2023, the Company did not have a need to utilize the revolver loan as the balance was zero for both periods.
DLL Finance Floorplan Payable Line of Credit
As of January 31, 2024, the Company had a $80.0 million credit facility with DLL Finance, of which $60.0 million is available for domestic financing and $20.0 million is available for financing in certain of our European markets. The DLL Finance credit facility may be used to purchase or refinance new and used equipment inventory. Amounts outstanding for domestic financing bear interest on outstanding balances of one-month SOFR plus an applicable margin between 3.00 % and 6.00%. Amounts outstanding for European financing bear interest on outstanding balances of three-month EURIBOR plus an applicable margin of 2.10 % to 2.50 %. The credit facility allows for increase, decrease or termination of the facility by DLL Finance in its sole discretion at any time. The credit facility contains financial covenants that impose a maximum net leverage ratio of 3.50:1.00 and a minimum fixed charge coverage ratio of 1.10 :1.00. The credit facility also requires the Company to obtain prior consent from DLL Finance if the Company desired to engage in any acquisition meeting certain financial thresholds. The balances outstanding with DLL Finance are secured by the inventory or rental fleet purchased with the floorplan proceeds. Repayment terms vary by individual notes, but generally payments are made from sales proceeds or rental revenue from the related inventories or rental fleet assets. As of January 31, 2024, the Company was in compliance with the net leverage ratio and fixed charge coverage ratio financial covenants under this credit facility.
Other Lines of Credit
The Company’s other lines of credit include various floorplan and working capital lines of credit primarily offered by non-manufacturer financing entities. Interest charged on outstanding borrowings are generally variable rates, such as EURIBOR and BBSY and include interest margins. Outstanding balances are generally secured by inventory and other current assets. In most cases these lines of credit have a one-year maturity, with an annual review process to extend the maturity date for an additional one-year period.
69
Summary of Outstanding Amounts
As of January 31, 2024 and 2023, the Company’s outstanding balance of floorplan payables and lines of credit consisted of the following:
| January 31, 2024 | January 31, 2023 | ||||||||||
| (in thousands) | |||||||||||
| CNH Industrial | $ | $ | |||||||||
| Bank Syndicate Agreement Floorplan Loan | 162,845 | 35,550 | |||||||||
| DLL Finance | |||||||||||
| Other outstanding balances with manufacturers and non-manufacturers | |||||||||||
| $ | $ | ||||||||||
NOTE 9 - ACCRUED EXPENSES & OTHER
| January 31, 2024 | January 31, 2023 | ||||||||||
| (in thousands) | |||||||||||
| Compensation | $ | $ | |||||||||
| Sales, payroll, real estate and value added taxes | |||||||||||
| Insurance | |||||||||||
| Other | |||||||||||
| $ | $ | ||||||||||
NOTE 10 - LONG-TERM DEBT
The following is a summary of long-term debt:
| Year Ended January 31, | ||||||||||||||||||||||||||
| Description | Maturity Dates | Interest Rates | 2024 | 2023 | ||||||||||||||||||||||
| (in thousands) | ||||||||||||||||||||||||||
| Mortgage loans, secured | Various through May 2039 | $ | $ | |||||||||||||||||||||||
| Sale-leaseback financing obligations | Various through December 2030 | |||||||||||||||||||||||||
| Vehicle loans, secured | Various through December 2029 | |||||||||||||||||||||||||
| Other | Various through July 2039 | 1.2% to | ||||||||||||||||||||||||
| Total debt | ||||||||||||||||||||||||||
| Less: current maturities | ||||||||||||||||||||||||||
| Long-term debt, net | $ | $ | ||||||||||||||||||||||||
Long-term debt maturities are as follows:
| Years Ending January 31, | Amounts | ||||
| (in thousands) | |||||
| 2025 | $ | ||||
| 2026 | |||||
| 2027 | |||||
| 2028 | |||||
| 2029 | |||||
| Thereafter | |||||
| $ | |||||
70
NOTE 11 - DERIVATIVE INSTRUMENTS
The Company holds derivative instruments for the purpose of minimizing exposure to fluctuations in foreign currency exchange rates to which the Company is exposed in the normal course of its operations.
Derivative Instruments Not Designated as Hedging Instruments
The Company periodically uses foreign currency forward contracts to hedge the effects of fluctuations in exchange rates on outstanding intercompany loans. The Company does not formally designate and document such derivative instruments as hedging instruments; however, the instruments are an effective economic hedge of the underlying foreign currency exposure. Both the gain or loss on the derivative instrument and the offsetting gain or loss on the underlying intercompany loan are recognized in earnings immediately, thereby eliminating or reducing the impact of foreign currency exchange rate fluctuations on net income. The Company's foreign currency forward contracts generally have one to three-month maturities. The notional value of outstanding foreign currency contracts as of January 31, 2024 was $25.3 million and there were no foreign currency forward contracts outstanding as of January 31, 2023.
As of January 31, 2024, and 2023, the fair value of the Company's outstanding derivative instruments was not material. Derivative instruments recognized as assets are recorded in Prepaid expenses and other in the consolidated balance sheets, and derivative instruments recognized as liabilities are recorded in Accrued expenses and other in the consolidated balance sheets.
The following table sets forth the gains and (losses) recognized in income related to the Company’s derivative instruments for the years ended January 31, 2024, 2023 and 2022.
| Year Ended January 31, | |||||||||||||||||
| 2024 | 2023 | 2022 | |||||||||||||||
| (in thousands) | |||||||||||||||||
| Derivatives Not Designated as Hedging Instruments: | |||||||||||||||||
| Foreign currency contracts (a) | $ | ( | $ | $ | ( | ||||||||||||
| Total Derivatives | $ | ( | $ | $ | ( | ||||||||||||
NOTE 12 - CONTINGENCIES
Litigation
The Company is engaged in proceedings incidental to the normal course of business. Due to their nature, such legal proceedings involve inherent uncertainties, including but not limited to, court rulings, negotiations between affected parties and governmental intervention. Based upon the information available to the Company and discussions with legal counsel, it is the Company's opinion that the outcome of the various legal actions and claims that are incidental to its business will not have a material impact on the financial position, results of operations or cash flows. Such matters, however, are subject to many uncertainties, and the outcome of any matter is not predictable with assurance.
Insurance
The Company has insurance policies with varying deductibility levels for property and casualty losses and is insured for losses in excess of these deductibles on a per claim and aggregate basis. The Company is primarily self-insured for health care claims for eligible participating employees. The Company has stop-loss coverage to limit its exposure to significant claims on a per claim and annual aggregate basis. The Company determines its liabilities for claims, including incurred but not reported losses, based on all relevant information, including actuarial estimates of claim liabilities.
Other Matters
The Company is the lessee under many real estate leases, in which it agrees to indemnify the lessor from certain liabilities arising as a result of the use of the leased premises, including environmental liabilities. Additionally, from time to time, the Company enters into agreements with third parties in connection with the sale of assets in which it agrees to indemnify the purchaser from certain liabilities or costs arising in connection with the assets. Also, in the ordinary course of business in connection with purchases or sales of goods and services, the Company enters into agreements that may contain indemnification provisions. In the event that an indemnification claim is asserted, the Company's liability would be limited by the terms of the applicable agreement. See additional information on operating lease commitments in Note 13.
71
NOTE 13 - LEASES
As Lessee
The Company, as lessee, leases certain of its dealership locations, office space, equipment and vehicles under operating and financing classified leasing arrangements. The Company has elected to not record leases with a lease term at commencement of 12 months or less on the consolidated balance sheet; such leases are expensed on a straight-line basis over the lease term. Many real estate lease agreements require the Company to pay the real estate taxes on the properties during the lease term and require that the Company maintains property insurance on each of the leased premises. Such payments are deemed to be variable lease payments, as the amounts may change during the term of the lease. Certain leases include renewal options that can extend the lease term for periods of one to ten years. Most real estate leases grant the Company a right of first refusal or other options to purchase the real estate, generally at fair market value, either during the lease term or at its conclusion. In most cases, the Company has not included these renewal and purchase options within the measurement of the right-of-use lease asset and lease liability. Most often the Company cannot readily determine the interest rate implicit in the lease and thus applies its incremental borrowing rate to capitalize the right-of-use asset and lease liability. We estimate our incremental borrowing rate by incorporating considerations of lease term, asset class and lease currency and geographical market. Our lease agreements do not contain any material non-lease components, residual value guarantees or material restrictive covenants.
The Company subleases a small number of real estate assets to third parties, primarily dealership locations for which we have ceased operations. All sublease arrangements are classified as operating leases.
The components of lease expense were as follows:
| Year Ended January 31, | ||||||||||||||||||||||||||
| Classification | 2024 | 2023 | 2022 | |||||||||||||||||||||||
| (in thousands) | ||||||||||||||||||||||||||
| Finance lease cost: | ||||||||||||||||||||||||||
| Amortization of leased assets | Operating expenses | $ | $ | $ | ||||||||||||||||||||||
| Interest on lease liabilities | Other interest expense | |||||||||||||||||||||||||
| Operating lease cost | Operating expenses and rental and other cost of revenue | |||||||||||||||||||||||||
| Short-term lease cost | Operating expenses | |||||||||||||||||||||||||
| Variable lease cost | Operating expenses | |||||||||||||||||||||||||
| Sublease income | Interest and other income | ( | ( | ( | ||||||||||||||||||||||
| $ | $ | $ | ||||||||||||||||||||||||
72
Right-of-use lease assets and lease liabilities consist of the following:
| Classification | January 31, 2024 | January 31, 2023 | ||||||||||||||||||
| (in thousands) | ||||||||||||||||||||
| Assets | ||||||||||||||||||||
| Operating lease assets | Operating lease assets | $ | $ | |||||||||||||||||
Financing lease assets(a) | Property and equipment, net of accumulated depreciation | |||||||||||||||||||
| Total leased assets | $ | $ | ||||||||||||||||||
| Liabilities | ||||||||||||||||||||
| Current | ||||||||||||||||||||
| Operating | Current operating lease liabilities | $ | $ | |||||||||||||||||
| Financing | ||||||||||||||||||||
| Noncurrent | ||||||||||||||||||||
| Operating | Operating lease liabilities | |||||||||||||||||||
| Financing | ||||||||||||||||||||
| Total lease liabilities | $ | $ | ||||||||||||||||||
(a)Finance lease assets are recorded net of accumulated amortization of $1.4 million and $1.2 million as of January 31, 2024 and 2023, respectively.
Maturities of lease liabilities as of January 31, 2024 are as follows:
| Operating | Finance | |||||||||||||||||||
| Leases | Leases | Total | ||||||||||||||||||
| Fiscal Year Ending January 31, | (in thousands) | |||||||||||||||||||
| 2025 | $ | $ | $ | |||||||||||||||||
| 2026 | ||||||||||||||||||||
| 2027 | ||||||||||||||||||||
| 2028 | ||||||||||||||||||||
| 2029 | ||||||||||||||||||||
| Thereafter | ||||||||||||||||||||
| Total lease payments | ||||||||||||||||||||
| Less: Interest | ||||||||||||||||||||
| Present value of lease liabilities | $ | $ | $ | |||||||||||||||||
The weighted-average lease term and discount rate as of January 31, 2024 and 2023 are as follows:
| January 31, 2024 | January 31, 2023 | |||||||||||||
| Weighted-average remaining lease term (years): | ||||||||||||||
| Operating leases | ||||||||||||||
| Financing leases | ||||||||||||||
| Weighted-average discount rate: | ||||||||||||||
| Operating leases | ||||||||||||||
| Financing leases | ||||||||||||||
73
Other lease information is as follows:
| Year Ended January 31, | ||||||||||||||||||||
| 2024 | 2023 | 2022 | ||||||||||||||||||
| (in thousands) | ||||||||||||||||||||
| Cash paid for amounts included in the measurement of lease liabilities | ||||||||||||||||||||
| Operating cash flows from operating leases | $ | $ | $ | |||||||||||||||||
| Operating cash flow from finance leases | ||||||||||||||||||||
| Financing cash flows from finance leases | ||||||||||||||||||||
| Operating lease assets obtained in exchange for new operating lease liabilities | ||||||||||||||||||||
| Finance lease assets obtained in exchange for new finance lease liabilities | ||||||||||||||||||||
As Lessor
The Company rents equipment to customers, primarily in the Construction segment, on a short-term basis. Our rental arrangements generally do not include minimum, noncancellable periods as the lessee is entitled to cancel the arrangement at any time. Most often, our rental arrangements extend for periods ranging from a few days to a few months. We maintain a fleet of dedicated rental assets within our Construction segment and, within all segments, may also provide short-term rentals of certain equipment inventory assets. Certain rental arrangements may include rent-to-purchase options whereby customers are given a period of time to exercise an option to purchase the related equipment at an established price with any rental payments paid applied to reduce the purchase price.
All of the Company's leasing arrangements as lessor are classified as operating leases. Rental revenue is recognized on a straight-line basis over the rental period. Rental revenue includes amounts charged for loss and damage insurance on rented equipment. In most cases, our rental arrangements include non-lease components, including delivery and pick-up services. The Company accounts for these non-lease components separate from the rental arrangement and recognizes the revenue associated with these components when the service is performed. The Company has elected to exclude from rental revenue all sales, value added and other taxes collected from our customers concurrent with our rental activities. Rental billings most often occur on a monthly basis and may be billed in advance or in arrears, thus creating unbilled rental receivables or deferred rental revenue amounts. The Company manages the residual value risk of its rented assets by (i) monitoring the quality, aging and anticipated retail market value of our rental fleet assets to determine the optimal period to remove an asset from the rental fleet, (ii) maintaining the quality of our assets through on-site parts and service support and (iii) requiring physical damage insurance of our lessee customers. We primarily dispose of our rental assets through the sale of the asset by our retail sales force.
Revenue generated from leasing activities is disclosed, by segment, in Note 3. The following is the balance of our dedicated rental fleet assets of our Construction segment as of January 31, 2024 and 2023, respectively:
| January 31, 2024 | January 31, 2023 | |||||||||||||
| (in thousands) | ||||||||||||||
| Rental fleet equipment | $ | $ | ||||||||||||
| Less accumulated depreciation | ||||||||||||||
| $ | $ | |||||||||||||
74
NOTE 14 - INCOME TAXES
The components of income before income taxes for the years ended January 31, 2024, 2023 and 2022 consist of the following:
| 2024 | 2023 | 2022 | |||||||||||||||
| (in thousands) | |||||||||||||||||
| U.S. | $ | $ | $ | ||||||||||||||
| Foreign | |||||||||||||||||
| Total | $ | $ | $ | ||||||||||||||
The provision for (benefit from) income taxes charged to income for the years ended January 31, 2024, 2023 and 2022 consists of the following:
| 2024 | 2023 | 2022 | |||||||||||||||
| (in thousands) | |||||||||||||||||
| Current | |||||||||||||||||
| Federal | $ | $ | $ | ||||||||||||||
| State | |||||||||||||||||
| Foreign | |||||||||||||||||
| Total current taxes | |||||||||||||||||
| Deferred | |||||||||||||||||
| Federal | |||||||||||||||||
| State | |||||||||||||||||
| Foreign | ( | ||||||||||||||||
| Total deferred taxes | |||||||||||||||||
| Total | $ | $ | $ | ||||||||||||||
The reconciliation of the statutory federal income tax rate to the Company's effective rate is as follows:
| 2024 | 2023 | 2022 | |||||||||||||||
| U.S. statutory rate | % | % | % | ||||||||||||||
| Foreign statutory rates | ( | % | ( | % | ( | % | |||||||||||
| State taxes on income net of federal tax benefit | % | % | % | ||||||||||||||
| Valuation allowances | % | % | % | ||||||||||||||
| All other, net | % | ( | % | % | |||||||||||||
| % | % | % | |||||||||||||||
75
Deferred tax assets and liabilities consist of the following as of January 31, 2024 and 2023:
| 2024 | 2023 | ||||||||||
| (in thousands) | |||||||||||
| Deferred tax assets: | |||||||||||
| Inventory allowances | $ | $ | |||||||||
| Intangible assets | |||||||||||
| Net operating losses | |||||||||||
| Accrued liabilities and other | |||||||||||
| Receivables | |||||||||||
| Stock-based compensation | |||||||||||
| Right of use lease liability | |||||||||||
| Other | |||||||||||
| Total deferred tax assets | |||||||||||
| Valuation allowances | ( | ( | |||||||||
| Deferred tax assets, net of valuation allowances | $ | $ | |||||||||
| Deferred tax liabilities: | |||||||||||
| Property and equipment | $ | ( | $ | ( | |||||||
| Right of use lease asset | ( | ( | |||||||||
| Intangible assets | ( | ||||||||||
| Total deferred tax liabilities | $ | ( | $ | ( | |||||||
| Net deferred tax asset (liability) | $ | ( | $ | ( | |||||||
As of January 31, 2024, the Company has recorded $29.5 million of net operating loss carryforwards within certain of its foreign jurisdictions; $24.5 million of net operating loss carryforwards are within foreign jurisdictions with unlimited carryforward periods, and $5.0 million are within foreign jurisdictions that expire at various dates between the Company's fiscal years 2037 and 2038.
In assessing the foreign deferred tax assets as of January 31, 2024 and 2023, the Company concluded that a full valuation allowance is continued to be warranted in the Company's Ukrainian subsidiary, due to geopolitical concerns in the area. The Company also concluded a full valuation allowance on the Company's German and Luxembourg subsidiaries continued to be warranted based on the presence of historical losses and the Company’s expected future sources of taxable income. The Company has recorded valuation allowances of $7.5 million and $6.5 million for the international entities as of January 31, 2024 and 2023, respectively.
The Company files income tax returns in the U.S. federal jurisdiction and various states and foreign countries. It is no longer subject to income tax examinations by U.S. federal tax authorities for fiscal years ended prior to January 31, 2021 and state tax authorities for fiscal years ended prior to January 31, 2020. Certain foreign jurisdictions are subject to income tax examinations for the calendar year periods ranging between 2017 and 2023, depending on the jurisdiction of the entity.
As of January 31, 2024, the Company had accumulated undistributed earnings in non-U.S. subsidiaries of approximately $47.0 million. Upon repatriation of such earnings the Company could be subject to additional U.S. or foreign taxes. The Company has not recorded a deferred tax liability associated with these undistributed earnings as such earnings are to be reinvested outside of the U.S. indefinitely. It is not practicable to estimate the amount of additional tax that might be payable if such earnings were repatriated.
NOTE 15 - CAPITAL STRUCTURE
The Company's certificate of incorporation provides it with the authority to issue 50,000,000 shares of $0.00001 par value stock, consisting of 45,000,000 shares of common stock and 5,000,000 shares classified as undesignated.
76
NOTE 16 - STOCK-BASED COMPENSATION
Stock-Based Compensation Plans
The Company has one stock-based compensation plan, the Amended and Restated Titan Machinery Inc. 2014 Equity Incentive Plan (the "2014 Equity Incentive Plan"), to provide incentive compensation to participants for services that have been or will be performed for continuing as employees or members of the Board of Directors of the Company. Under the 2014 Equity Incentive Plan, which has been approved by the stockholders of the Company, the Company may grant stock-based awards for up to a maximum number of shares of common stock set forth in the 2014 Equity Incentive Plan under specified forms of equity award types. Shares issued for stock-based awards consist of authorized but unissued shares. During the year ended January 31, 2021, the 2014 Equity Incentive Plan was amended to increase the shares available for equity awards from 1,650,000 shares to 2,200,000 shares. As of January 31, 2024, the Company had 390,479 shares authorized and available for future equity awards under the 2014 Equity Incentive Plan.
Compensation cost arising from stock-based compensation and charged to operations was $3.3 million, $3.3 million and $2.8 million for the years ended January 31, 2024, 2023 and 2022, respectively. The related income tax benefit (net) was $1.1 million, $1.3 million and $1.3 million for the years ended January 31, 2024, 2023 and 2022, respectively.
Restricted Stock Awards ("RSAs")
The Company grants RSAs as part of its long-term incentive compensation to employees and members of the Board of Directors of the Company. The fair value of these awards is determined based on the closing market price of the Company's stock on the date of grant. The RSAs primarily vest over a period of approximately years for employees and over year for members of the Board of Directors. The Company recognizes compensation expense ratably over the vesting period of the award. The restricted common stock underlying these awards are deemed issued and outstanding upon grant and carry the same voting and dividend rights of unrestricted outstanding common stock; provided, however, any dividends paid shall be subject to a right of forfeiture until the underlying rule of forfeiture of the RSA has lapsed.
The following table summarizes RSA activity for the year ended January 31, 2024:
| Shares | Weighted Average Grant Date Fair Value | ||||||||||
| (in thousands) | |||||||||||
| Nonvested at January 31, 2023 | $ | ||||||||||
| Granted | |||||||||||
| Forfeited | ( | ||||||||||
| Vested | ( | ||||||||||
| Nonvested at January 31, 2024 | $ | ||||||||||
The weighted-average grant date fair value of RSAs granted was $26.48 , $27.06 and $34.24 during the years ended January 31, 2024, 2023 and 2022, respectively. The total fair value of RSAs vested was $3.7 million, $4.6 million and $5.0 million during the years ended January 31, 2024, 2023 and 2022, respectively. As of January 31, 2024, there was $6.3 million of unrecognized compensation cost related to nonvested RSAs that is expected to be recognized over a weighted-average period of 2.3 years.
Restricted Stock Units ("RSUs")
The Company grants RSUs as part of its long-term incentive compensation to certain employees of the Company in our European operations. The fair value of these awards is determined based on the closing market price of the Company's common stock on the date of grant. The RSUs primarily vest over a period of approximately years. The Company recognizes compensation expense ratably over the vesting period of the award. The common stock underlying these awards are not deemed issued or outstanding upon grant, and do not carry any voting or dividend rights.
77
The following table summarizes RSU activity for the year ended January 31, 2024:
| Shares | Weighted Average Grant Date Fair Value | ||||||||||
| (in thousands) | |||||||||||
| Nonvested at January 31, 2023 | $ | ||||||||||
| Granted | |||||||||||
| Vested | ( | ||||||||||
| Nonvested at January 31, 2024 | $ | ||||||||||
The weighted-average grant date fair value of RSUs granted was $26.47 , $26.23 , and $34.59 for the fiscal years ended January 31, 2024, 2023, and 2022, respectively. As of January 31, 2024, there was $0.2 million of unrecognized compensation cost related to nonvested RSUs that is expected to be recognized over a weighted-average period of years.
Long-Term Cash Incentive Awards
The Company grants long-term cash incentive awards as part of its long-term incentive compensation to certain international employees of the Company. The awards vest over a period of approximately four years and entitle the award recipient to a cash payment on the vesting date equal to the number of vested shares multiplied by the stock price of the Company on the date of vesting. These awards are liability-classified share-based payment awards in which fair value of the award is remeasured at each period until the liability is settled. Fair value of these awards is determined based on the closing price of the Company's stock as of the end of each reporting period. Changes in the fair value of the liability are recognized as compensation cost over the requisite service period. The percentage of the fair value that is accrued as compensation cost at the end of each period is equal to the percentage of the requisite service that has been rendered at that date.
The following table summarizes activity for long-term cash incentive awards for the year ended January 31, 2024:
| Shares | Weighted Average Grant Date Fair Value | ||||||||||
| (in thousands) | |||||||||||
| Nonvested at January 31, 2023 | $ | ||||||||||
| Granted | |||||||||||
| Forfeited | ( | ||||||||||
| Vested | ( | ||||||||||
| Nonvested at January 31, 2024 | $ | ||||||||||
The weighted-average grant date fair value of long-term cash incentive awards granted was $26.40 during the year ended January 31, 2024. As of January 31, 2024, based on the Company's stock price on that day, there was $0.5 million of unrecognized compensation cost related to nonvested awards that is expected to be recognized over a weighted-average period of 1.2 years.
78
NOTE 17 - ACCUMULATED OTHER COMPREHENSIVE INCOME (LOSS)
The following is a summary of the changes in accumulated other comprehensive income (loss), by component, for the fiscal years ended January 31, 2024, 2023 and 2022:
| Foreign Currency Translation Adjustment | Net Investment Hedging Instruments, Unrealized Gain | Total Accumulated Other Comprehensive Income (Loss) | |||||||||||||||
| (in thousands) | |||||||||||||||||
| Balance, January 31, 2021 | $ | ( | $ | $ | |||||||||||||
| Total other comprehensive loss | ( | ( | |||||||||||||||
| Balance, January 31, 2022 | ( | ( | |||||||||||||||
| Total other comprehensive income | ( | — | ( | ||||||||||||||
| Balance, January 31, 2023 | ( | ( | |||||||||||||||
| Total other comprehensive loss | — | ||||||||||||||||
| Balance, January 31, 2024 | $ | ( | $ | $ | |||||||||||||
NOTE 18 - EMPLOYEE BENEFIT PLANS
The Company has a 401(k) profit-sharing plan ("401(k) Plan") for all U.S. employees at least 19 years of age. Effective January 1, 2022, the Company amended the 401(k) Plan to increase the Company match from 50% of the first 6% of the participating employee's contribution to 50 % of the first 8 % of the participating employee's contributions. In addition, the Company may make a discretionary contribution to the 401(k) Plan as determined by the Board of Directors, with a maximum amount equal to the amount allowed under the IRS regulations. The Company recognized expense for contributions made to the 401(k) Plan totaling $7.0 million, $5.4 million and $3.8 million for the years ended January 31, 2024, 2023 and 2022, respectively. All amounts contributed during these years reflected matching contributions, as no discretionary contributions were made by the Company to the 401(k) Plan.
NOTE 19 - BUSINESS COMBINATIONS
Fiscal 2024
On October 2, 2023, we acquired all of the outstanding equity interests of O’Connors. The acquired business consisted of 15 Case IH dealership locations and one parts center in the states of New South Wales, South Australia, and Victoria in Southeastern Australia. O'Connors has been a successful Case IH complex, and our acquisition of O'Connors provides the Company the opportunity to expand our international presence into the large, well-established Australian agricultural market. Total cash consideration paid for O'Connors was $66.5 million, which was financed through available cash resources and line of credit availability. The 15 O’Connors stores locations are included within our new Australia segment. In the most recently completed fiscal year, O'Connors generated revenue of approximately $258.0 million. The results of operations for O’Connors from the October 2, 2023 acquisition closing date through January 31, 2024 were approximately $69.8 million of revenue and $4.1 million of pre-tax income. The Company incurred $1.1 million in acquisition related expenses in connection with this acquisition, which are included in operating expenses in the consolidated statements of operations for the year ended January 31, 2024.
The Company has completed acquisitions that were not considered material, individually or collectively, to the overall consolidated financial statements during the year ended January 31, 2024. These acquisitions included five locations of Pioneer Farm Equipment Co. on February 1, 2023, in the state of Idaho, one location of Midwest Truck Parts Inc. on June 1, 2023, in the state Minnesota and one location of Scott Supply Co. on January 10, 2024, in the state of South Dakota., all of which are included in the Agriculture segment. The Company also acquired MAREP GmbH on May 1, 2023, which included two locations in Germany and is included in the Europe segment. These acquisitions have been included in the consolidated financial statements from the date of the respective acquisition.
79
Fiscal 2023
On August 1, 2022, the Company acquired all outstanding equity interests of three entities, Heartland Agriculture, LLC, Heartland Solutions, LLC, and Heartland Leveraged Lender, LLC, (collectively referred to as the "Heartland Companies") for $94.4 million in cash consideration. The Heartland Companies consist of 12 CaseIH commercial application agriculture locations, in the states of Idaho, Iowa, Kansas, Minnesota, Missouri, Montana, Nebraska, North Dakota, South Dakota, Washington, and Wisconsin. The Heartland Companies have been a successful CaseIH commercial application dealer group and our acquisition of these entities provides the Company the opportunity for synergies due to the overlap of our footprints, which allows us to package deals that will include both commercial application equipment as well as other agricultural and construction equipment to commercial customers within our core footprint. These locations are included in the Company's Agriculture segment. In the most recently completed fiscal year, prior to acquisition, the Heartland Companies generated revenue of approximately $214 million. The results of operations for the Heartland Companies from the August 1, 2022 acquisition closing date through January 31, 2023, were approximately $103.2 million of revenue and $4.6 million of pre-tax income. The Company incurred $1.1 million in acquisition related expenses in connection with this acquisition, which are included in operating expenses in the consolidated statements of operations for the year ended January 31, 2023.
The Company has completed another acquisition that was not considered material to the overall consolidated financial statements during the year ended January 31, 2023. This acquisition included the two locations of Mark's Machinery, Inc. on April 1, 2022, in the state of South Dakota, which is included in the Agriculture segment. This acquisition has been included in the consolidated financial statements from the date of the acquisition.
Fiscal 2022
The Company completed an acquisition that was not considered material to the overall consolidated financial statements during the year ended January 31, 2022. This acquisition included the three locations of Jaycox Implement, Inc. on December 1, 2021, in the states of Iowa and Minnesota. These locations are included in the Agriculture segment. This acquisition has been included in the consolidated financial statements from the date of the acquisition.
80
Purchase Price Allocation
Each of the above acquisitions has been accounted for under the acquisition method of accounting, which requires the Company to estimate the acquisition date fair value of the assets acquired and liabilities assumed. As of January 31, 2024, all business combinations from fiscal year 2024 are completed with the exception of the O'Connors acquisition for which we are still finalizing the closing tax balances and intangible asset valuations. All business combinations from fiscal years 2023 and prior are complete. The following summarizes the acquisition date fair value of consideration transferred and the acquisition date fair value of the identifiable assets acquired and liabilities assumed, including an amount for goodwill (in thousands):
O’Connors | Heartland Companies | ||||||||||
| October 2, 2023 | August 1, 2022 | ||||||||||
| Assets acquired: | |||||||||||
| Cash | $ | $ | |||||||||
| Receivables | |||||||||||
| Inventories | |||||||||||
| Prepaid expenses and other | |||||||||||
| Property and equipment | |||||||||||
| Operating lease assets | |||||||||||
| Intangible assets: | |||||||||||
| Non-Competition | |||||||||||
| Customer Relationships | |||||||||||
| Distribution Rights | |||||||||||
| Goodwill | |||||||||||
| Total assets | |||||||||||
| Liabilities Assumed: | |||||||||||
| Accounts payable | |||||||||||
| Floorplan payable | |||||||||||
| Current operating lease liabilities | |||||||||||
| Deferred revenue | |||||||||||
| Accrued expenses and other | |||||||||||
| Long-term debt | |||||||||||
| Operating lease liabilities | |||||||||||
| Other Long-term liabilities | |||||||||||
| Total liabilities | |||||||||||
| Net assets acquired | $ | $ | |||||||||
| Goodwill recognized by segment: | |||||||||||
| Agriculture | $ | — | $ | ||||||||
| Australia | — | ||||||||||
| Goodwill expected to be deductible for tax purposes | |||||||||||
The recognition of goodwill in the above business combinations arose from the acquisition of an assembled workforce and anticipated synergies expected to be realized. The acquired non-competition and customer relationship intangible assets are being amortized on a straight line basis over useful lives ranging from five to seven years. The distribution rights assets are indefinite-lived intangible assets not subject to amortization, but are tested for impairment annually, or more frequently upon the occurrence of certain events or when circumstances indicate that impairment may be present. The Company estimated the fair value of these intangible assets using a multi-period excess earnings model, an income approach.
81
Pro Forma Information
The following summarized unaudited pro forma condensed statement of operations information for the twelve months ended January 31, 2024, 2023 and 2022, assumes that the Heartland Companies acquisition occurred as of February 1, 2021 and O’Connors acquisition occurred as of February 1, 2022. The Company prepared the following summarized unaudited pro forma financial results for comparative purposes only. The summarized unaudited pro forma information may not be indicative of the results that would have occurred had the Company completed the acquisitions as of these dates or that will be attained in the future.
| Year Ended January 31, | |||||||||||||||||
| 2024 | 2023 | 2022 | |||||||||||||||
| (in thousands) | |||||||||||||||||
| Total Revenues | $ | 2,951,697 | $ | 2,595,342 | $ | 1,928,193 | |||||||||||
| Net Income | $ | 122,126 | $ | 120,339 | $ | 77,664 | |||||||||||
NOTE 20 - FAIR VALUE OF FINANCIAL INSTRUMENTS
The Company also estimated the fair value of long-lived assets to be approximately zero in certain instances when no future cash flows were assumed to be generated from the use of such assets and the expected sales values were deemed to be nominal. All such fair value measurements were based on unobservable inputs and thus are Level 3 fair value inputs.
The Company also has financial instruments that are not recorded at fair value in the consolidated balance sheets, including cash, receivables, payables, and long-term debt. The carrying amounts of these financial instruments approximated their fair values as of January 31, 2024 and January 31, 2023. Approximate fair value of these financial instruments was estimated based on Level 2 fair value inputs. The estimated fair value of the Company's Level 2 long-term debt, which is provided for disclosure purposes only, is as follows:
| January 31, 2024 | January 31, 2023 | ||||||||||
| (in thousands) | |||||||||||
| Carrying amount | $ | 99,031 | $ | 81,349 | |||||||
| Fair value | $ | 103,102 | $ | 70,434 | |||||||
NOTE 21 - SEGMENT INFORMATION AND OPERATING RESULTS
The Company has four reportable segments: Agriculture, Construction, Europe and Australia. The Company's segments are determined based on management structure, which is organized based on types of products sold and geographic areas, as described in the following paragraphs. The operating results for each segment are reported separately to the Company's Chief Executive Officer to make decisions regarding the allocation of resources, to assess the Company's operating performance and to make strategic decisions.
The Company's Agriculture segment sells, services, and rents machinery, and related parts and attachments, for uses ranging from large-scale farming to home and garden use in North America. This segment also includes ancillary sales and services related to agricultural activities and products such as equipment transportation, GPS signal subscriptions and finance and insurance products.
The Company's Construction segment sells, services, and rents machinery, and related parts and attachments, for uses ranging from heavy construction to light industrial machinery use to customers in North America. This segment also includes ancillary sales and services related to construction activities such as equipment transportation, GPS signal subscriptions and finance and insurance products.
The Company’s Europe segment sells, services, and rents machinery, and related parts and attachments, for uses ranging from large-scale farming and construction to home and garden use to customers in Eastern Europe and Germany. Similar to the Agriculture segment, this segment also includes ancillary sales and services related to agricultural activities and products such as equipment transportation, GPS signal subscriptions and finance and insurance products.
82
The Company’s Australian segment sells, services, and rents machinery, and related parts and attachments, for uses ranging from large-scale farming and construction to home and garden use to customers in Southeastern Australia. This segment also includes ancillary sales and services related to agricultural activities and products such as equipment transportation, GPS signal subscriptions and finance and insurance products.
Revenue generated from sales to customers in the United States was $2.4 billion, $1.9 billion and $1.4 billion for the years ended January 31, 2024, 2023 and 2022, respectively, no other individual country exceeded ten percent of total revenue. As of January 31, 2024 and 2023, $305.5 million and $254.5 million of the Company's long-lived assets were held in United States, respectively, and the remaining were held in the European and Australian subsidiaries.
The Company retains various unallocated income/(expense) items and assets at the general corporate level, which the Company refers to as "Shared Resources" in the table below. Shared Resource assets primarily consist of cash and property and equipment. Revenue between segments is immaterial.
83
Certain financial information for each of the Company's business segments is set forth below.
| Year Ended January 31, | |||||||||||||||||
| 2024 | 2023 | 2022 | |||||||||||||||
| (in thousands) | |||||||||||||||||
| Revenue | |||||||||||||||||
| Agriculture | $ | $ | $ | ||||||||||||||
| Construction | |||||||||||||||||
| Europe | |||||||||||||||||
| Australia | — | — | |||||||||||||||
| Total | |||||||||||||||||
| Income Before Income Taxes | |||||||||||||||||
| Agriculture | $ | $ | $ | ||||||||||||||
| Construction | |||||||||||||||||
| Europe | |||||||||||||||||
| Australia | |||||||||||||||||
| Segment income before income taxes | |||||||||||||||||
| Shared Resources | ( | ( | ( | ||||||||||||||
| Total | $ | $ | $ | ||||||||||||||
| Total Impairment | |||||||||||||||||
| Europe | |||||||||||||||||
| Total | $ | $ | $ | ||||||||||||||
| Capital Expenditures | |||||||||||||||||
| Agriculture | $ | $ | $ | ||||||||||||||
| Construction | |||||||||||||||||
| Europe | |||||||||||||||||
| Australia | — | — | |||||||||||||||
| Segment capital expenditures | |||||||||||||||||
| Shared Resources | |||||||||||||||||
| Total | $ | $ | $ | ||||||||||||||
| January 31, 2024 | January 31, 2023 | ||||||||||||||||
| Total Assets | (in thousands) | ||||||||||||||||
| Agriculture | $ | $ | |||||||||||||||
| Construction | |||||||||||||||||
| Europe | |||||||||||||||||
| Australia | |||||||||||||||||
| Segment assets | |||||||||||||||||
| Shared Resources | |||||||||||||||||
| Total | $ | $ | |||||||||||||||
84
Schedule II—Valuation and Qualifying Accounts and Reserves
Titan Machinery Inc.
| Classification | Beginning Balance | Additions Charged to Expenses | Deductions for Write-offs, Net of Recoveries | Foreign Currency Translation Adjustments | Ending Balance | |||||||||||||||||||||||||||
| (in thousands) | ||||||||||||||||||||||||||||||||
| Valuation reserve deduction from receivables: | ||||||||||||||||||||||||||||||||
| Year Ended January 31, 2024 | $ | $ | $ | ( | $ | $ | ||||||||||||||||||||||||||
| Year Ended January 31, 2023 | ( | ( | ||||||||||||||||||||||||||||||
| Year Ended January 31, 2022 | ( | ( | ||||||||||||||||||||||||||||||
85
ITEM 9. CHANGES IN AND DISAGREEMENTS WITH ACCOUNTANTS ON ACCOUNTING AND FINANCIAL DISCLOSURE
None.
ITEM 9A. CONTROLS AND PROCEDURES
Evaluation of Disclosure Controls and Procedures. After evaluating the effectiveness of the Company's disclosure controls and procedures pursuant to Rule 13a-15(b) of the Exchange Act as of the end of the period covered by this Form 10-K, our Chief Executive Officer and Chief Financial Officer, with the participation of the Company's management, have concluded that the Company's disclosure controls and procedures (as defined in Exchange Act Rule 13a-15(e)) are effective.
Management's Report on Internal Control Over Financial Reporting. Management is responsible for establishing and maintaining adequate internal control over financial reporting, as such term is defined in Exchange Act Rules 13a-15(f) and 15d-15(f). Under the supervision and with the participation of management, including our Chief Executive Officer and Chief Financial Officer, we conducted an evaluation of the effectiveness of our internal control over financial reporting based on the framework in Internal Control—Integrated Framework (2013) issued by the Committee of Sponsoring Organizations of the Treadway Commission ("COSO"). Based on that evaluation, management has concluded that the Company’s disclosure controls and procedures were effective at January 31, 2024 to ensure that the information required to be disclosed by the Company in this annual report on Form 10-K is recorded, processed, summarized and reported within the time periods specified in the SEC’s rules and forms and is accumulated and communicated to the Company’s management including the principal executive and principal financial officers, as appropriate to allow timely decisions regarding required disclosure.
As previously disclosed, we completed the acquisition of the O'Connors on October 2, 2023, and, as permitted by SEC guidance for newly acquired businesses, we have elected to exclude the acquired operation of the O'Connors from the scope of design and operation of our internal controls over financial reporting and procedures for the year ended January 31, 2024. O'Connors constitute 11.3% of total assets and 2.5% of total revenue of the consolidated financial statement amounts as of and for the year ended January 31, 2024. The Company is in the process of evaluating the existing controls and procedures of O'Connors and integrating O'Connors into its system of internal controls over financial reporting.
Deloitte & Touche LLP, the independent registered public accounting firm that audited the consolidated financial statements included in this Form 10-K, has also audited our internal control over financial reporting as of January 31, 2024, as stated in their report included in Item 8, Financial Statements and Supplementary Data, of this Form 10-K.
Changes in Internal Control over Financial Reporting. There has not been any change in the Company's internal control over financial reporting (as defined in Exchange Act Rule 13a-15(f)) during its most recently completed fiscal quarter ended January 31, 2024 that has materially affected, or is reasonably likely to materially affect, the Company's internal control over financial reporting.
ITEM 9B. OTHER INFORMATION
Securities Trading Plans of Directors and Officers
During the three months ended January 31, 2024, no director or officer of the Company adopted or terminated a “Rule 10b5-1 trading arrangement” or “non-Rule 10b5-1 trading arrangement,” as each term is defined in Item 408(a) of Regulation S-K.
ITEM 9C. DISCLOSURE REGARDING FOREIGN JURISDICTIONS THAT PREVENT INSPECTIONS
Not applicable.
PART III
ITEM 10. DIRECTORS, EXECUTIVE OFFICERS AND CORPORATE GOVERNANCE
Other than the information included in Part I of this Form 10-K under the heading "Information About Our Executive Officers," the information required by this Item 10 is incorporated by reference to the sections labeled "Board of Directors" and "Corporate Governance," all of which will appear in our definitive proxy statement for our 2024 Annual Meeting of Stockholders.
86
ITEM 11. EXECUTIVE COMPENSATION
The information required by this Item 11 is incorporated herein by reference to the sections labeled "Compensation Discussion and Analysis," "Compensation Committee Report," "Compensation Committee Interlocks and Insider Participation," "Executive Compensation (excluding the information under the subheading "Pay Versus Performance")," and "Non-Employee Director Compensation," all of which will appear in our definitive proxy statement for our 2024 Annual Meeting of Stockholders.
ITEM 12. SECURITY OWNERSHIP OF CERTAIN BENEFICIAL OWNERS AND MANAGEMENT AND RELATED STOCKHOLDER MATTERS
The information required by this Item 12 is incorporated herein by reference to the sections entitled "Security Ownership of Principal Stockholders and Management" and "Executive Compensation - Equity Compensation Plan Information," both of which will appear in our definitive proxy statement for our 2024 Annual Meeting of Stockholders.
ITEM 13. CERTAIN RELATIONSHIPS AND RELATED TRANSACTIONS, AND DIRECTOR INDEPENDENCE
The information required by this Item 13 is incorporated herein by reference to the sections entitled "Corporate Governance—Independence" and "Certain Relationships and Related Transactions," both of which will appear in our definitive proxy statement for our 2024 Annual Meeting of Stockholders.
ITEM 14. PRINCIPAL ACCOUNTING FEES AND SERVICES
The information required by this Item 14 is incorporated herein by reference to the section entitled "Fees of the Independent Registered Public Accounting Firm," which will appear in our definitive proxy statement for our 2024 Annual Meeting of Stockholders.
PART IV
ITEM 15. EXHIBIT AND FINANCIAL STATEMENT SCHEDULES
(a)Documents filed as part of this report.
(1)Financial Statements. The following financial statements are included in Part II, Item 8 of this Annual Report on Form 10-K:
Report of Deloitte & Touche LLP on Consolidated Financial Statements as of January 31, 2024 and 2023 and for each of the three years in the period ended January 31, 2024
Report of Deloitte & Touche LLP on Internal Control Over Financial Reporting as of January 31, 2024
Consolidated Balance Sheets as of January 31, 2024 and 2023
Consolidated Statements of Operations for each of the three years in the period ended January 31, 2024
Consolidated Statements of Comprehensive Income for each of the three years in the period ended January 31, 2024
Consolidated Statements of Stockholders' Equity for each of the three years in the period ended January 31, 2024
Consolidated Statements of Cash Flows for each of the three years in the period ended January 31, 2024
Notes to Consolidated Financial Statements
(2)Financial Statement Schedules. The following consolidated financial statement schedule should be read in conjunction with the consolidated financial statements and Report of Deloitte & Touche LLP on the consolidated financial statements included in Part II, Item 8 of this annual report on Form 10-K:
Schedule II—Valuation and Qualifying Accounts and Reserves
All other financial statement schedules have been omitted, because they are not applicable, are not required, or the information is included in the Financial Statements or Notes thereto
(3)Exhibits. See the Exhibit Index to our Form 10-K immediately following below:
87
EXHIBIT INDEX
TITAN MACHINERY INC.
FORM 10-K
| No. | Description | |||||||
Securities Purchase Agreement, dated as of July 8, 2022, by and among Titan Machinery Inc.; Heartland Agriculture, LLC; Gordon Glade, Jeff Keller, Robert Caldwell and Michael Stopkotte; Michael Anderson, Barb Anderson, David Clare, Scott Reins, Shawn Sterling, The Constance Kent Revocable Trust and Lenco Enterprises, LLC; and Robert Caldwell, solely in his capacity as Seller Representative (incorporated herein by reference to Exhibit 2.1 of the registrant's Current Report on Form 8-K filed with the Commission on July 14, 2022). | ||||||||
Amendment No. 1 to Securities Purchase Agreement, dated as of July 28, 2022, by and among Titan Machinery Inc.; Heartland Agriculture, LLC; Gordon Glade, Jeff Keller, Robert Caldwell and Michael Stopkotte; Michael Anderson, Barb Anderson, David Clare, Scott Reins, Shawn Sterling, The Constance Kent Revocable Trust and Lenco Enterprises, LLC; and Robert Caldwell, solely in his capacity as Seller Representative (incorporated herein by reference to Exhibit 2.1 of the registrant's Quarterly Report on Form 10-Q filed with the Commission on September 9, 2022). | ||||||||
Securities Purchase Agreement, dated as of July 8, 2022, by and among Titan Machinery Inc.; Heartland Solutions, LLC; Oak Hill Capital, LLC, Jeff Keller and Robert Caldwell; Robert Caldwell, solely in his capacity as Seller Representative; and solely for purposes of being bound by Sections 6.07 and 9.13 thereof, Gordon Glade (incorporated herein by reference to Exhibit 2.2 of the registrant's Current Report on Form 8-K filed with the Commission on July 14, 2022). | ||||||||
Securities Purchase Agreement, dated as of July 8, 2022, by and among Titan Machinery Inc.; Heartland Leverage Lender, LLC; Gordon Glade, Jeff Keller and Robert Caldwell; and Robert Caldwell, solely in his capacity as Seller Representative (incorporated herein by reference to Exhibit 2.3 of the registrant's Current Report on Form 8-K filed with the Commission on July 14, 2022). | ||||||||
Amendment No. 1 to Securities Purchase Agreement, dated as of July 29, 2022, by and among Titan Machinery Inc.; Heartland Leverage Lender, LLC; Gordon Glade, Jeff Keller and Robert Caldwell; and Robert Caldwell, solely in his capacity as Seller Representative (incorporated herein by reference to Exhibit 2.2 of the registrant's Quarterly Report on Form 10-Q filed with the Commission on September 9, 2022). | ||||||||
| Certificate of Incorporation of the registrant, as amended (incorporated herein by reference to Exhibit 3.1 of the registrant's Quarterly Report on Form 10-Q filed with the Commission on September 10, 2012, File No. 001-33866). | ||||||||
| Bylaws of the registrant, as amended (incorporated herein by reference to Exhibit 3.2 of the registrant's Annual Report on Form 10-K filed with the Commission on April 16, 2009, File No. 001-33866). | ||||||||
| Specimen Certificate representing shares of common stock of Titan Machinery Inc. (incorporated by reference to Exhibit 4.1 of the registrant's Amendment No. 6 to Registration Statement on Form S-1, Reg. No. 333-145526, filed with the Commission on December 3, 2007). | ||||||||
| Description of Securities of Titan Machinery registered under Section 12 of the Exchange Act of 1934, as amended (incorporated herein by reference to Exhibit 4.3 of the registrant's Annual Report on Form 10-K filed with the Commission on April 7, 2020). | ||||||||
| Amended and Restated Employment Agreement, dated March 6, 2013, between David Meyer and the registrant (incorporated herein by reference to Exhibit 10.2 of the registrant's Annual Report on Form 10-K filed with the Commission on April 10, 2013, File No. 001-33866).** | ||||||||
| Amendment dated March 1, 2014 to the Amended and Restated Employment Agreement, dated March 6, 2013, between David Meyer and the registrant (incorporated herein by reference to Exhibit 10.54 of the registrant's Annual Report on Form 10-K filed with the Commission on April 11, 2014).** | ||||||||
Amendment dated October 17, 2023 to the Amended and Restated Employment Agreement, dated March 6, 2013, between David Meyer and the registrant (incorporated herein by reference to Exhibit 10.1 of the registrant's Quarterly Report on Form 10-Q filed with the Commission on December 7, 2023) | ||||||||
| Executive Employment Agreement, dated October 17, 2023, between Bryan J. Knutson and the registrant (incorporated herein by reference to Exhibit 10.2 of the registrant's Quarterly Report on Form 10-Q filed with the Commission on December 7, 2023).** | ||||||||
Executive Employment Agreement, dated September 29, 2022, between Robert Larsen and the Company (incorporated herein by reference to Exhibit 10.1 of the registrant's Current Report on Form 8-K filed with the Commission on September 30, 2022).** | ||||||||
88
| No. | Description | |||||||
| Agricultural Equipment Sales & Service Agreement, dated May 31, 2017, between CNH Industrial America LLC and the registrant (incorporated herein by reference to Exhibit 10.3 of the registrant's Quarterly Report on Form 10-Q filed with the Commission on June 2, 2017). | ||||||||
| Amendment to the Agricultural Equipment Sales & Service Agreement, dated May 31, 2017, between CNH Industrial America LLC and the registrant (incorporated herein by reference to Exhibit 10.4 of the registrant's Quarterly Report on Form 10-Q filed with the Commission on June 2, 2017). | ||||||||
Form of CaseIH Agriculture Equipment Sales and Service Agreement between CNH Industrial America LLC and Titan Machinery Inc. (incorporated herein by reference to Exhibit 10.3 of the registrant’s Quarterly Report on Form 10-Q filed with the Commission on September 9, 2022). | ||||||||
Revision 1 to the Case IH Agricultural Equipment Sales and Service Agreement between CNH Industrial America LLC and Titan Machinery Inc. (incorporated herein by reference to Exhibit 10.4 of the registrant’s Quarterly Report on Form 10-Q filed with the Commission on September 9, 2022). | ||||||||
| Construction Equipment Sales & Service Agreement, dated May 31, 2017, between CNH Industrial America LLC and the registrant (incorporated herein by reference to Exhibit 10.1 of the registrant's Quarterly Report on Form 10-Q filed with the Commission on June 2, 2017). | ||||||||
| Amendment to the Construction Equipment Sales & Service Agreement, dated May 31, 2017, between CNH Industrial America LLC and the registrant (incorporated herein by reference to Exhibit 10.2 of the registrant's Quarterly Report on Form 10-Q filed with the Commission on June 2, 2017). | ||||||||
| New Holland Equipment Sales & Service Agreement, dated May 31, 2017, between CNH Industrial America LLC and the registrant (incorporated herein by reference to Exhibit 10.5 of the registrant's Quarterly Report on Form 10-Q filed with the Commission on June 2, 2017). | ||||||||
| Amendment to the New Holland Equipment Sales & Service Agreement, dated May 31, 2017, between CNH Industrial America LLC and the registrant (incorporated herein by reference to Exhibit 10.6 of the registrant's Quarterly Report on Form 10-Q filed with the Commission on June 2, 2017). | ||||||||
| Dealer Security Agreement dated April 14, 2003 between New Holland North America, Inc. and the registrant (incorporated herein by reference to Exhibit 10.14 of the registrant's Amendment No. 2 to Registration Statement on Form S-1, Reg. No. 333-145526, filed with the Commission on October 10, 2007). | ||||||||
| Dealer Security Agreements between CNH America LLC and the registrant (incorporated herein by reference to Exhibit 10.15 of the registrant's Amendment No. 2 to Registration Statement on Form S-1, Reg. No. 333-145526, filed with the Commission on October 10, 2007). | ||||||||
Agreement to Grant Commercial Application Equipment Distribution Rights, dated as of August 1, 2022, by and between CNH Industrial America LLC and Titan Machinery Inc. (incorporated herein by reference to Exhibit 10.2 of the registrant’s Quarterly Report on Form 10-Q filed with the Commission on September 9, 2022). | ||||||||
| Amended and Restated Wholesale Floorplan Credit Facility and Security Agreement, dated November 13, 2007, between CNH Capital America LLC and the registrant (incorporated herein by reference to Exhibit 10.25 of the registrant's Amendment No. 5 to Registration Statement on Form S-1, Reg. No. 333-145526, filed with the Commission on November 27, 2007). | ||||||||
| Letter Agreement with CNH Capital America, LLC dated September 30, 2011, amending the November 13, 2007 Amended and Restated Wholesale Floorplan Credit Facility and Security Agreement (incorporated herein by reference to Exhibit 10.3 of the registrant's Quarterly Report on Form 10-Q filed with the Commission on December 9, 2011, File No. 001-33866). | ||||||||
| Letter Agreement with CNH Capital America, LLC dated November 20, 2012, amending the November 13, 2007 Amended and Restated Wholesale Floorplan Credit Facility and Security Agreement (incorporated herein by reference to Exhibit 10.1 of the registrant's Quarterly Report on Form 10-Q filed with the Commission on December 6, 2012, File No. 001-33866). | ||||||||
| Letter Agreement with CNH Capital America, LLC dated February 15, 2013, amending the November 13, 2007 Amended and Restated Wholesale Floorplan Credit Facility and Security Agreement (incorporated herein by reference to Exhibit 10.49 of the registrant's Annual Report on Form 10-K filed with the Commission on April 10, 2013, File No. 001-33866). | ||||||||
| Amendment dated December 8, 2014 to the Amended and Restated Wholesale Floor Plan Credit Facility and Security Agreement dated November 13, 2007 by and between the registrant and CNH Industrial Capital America LLC (incorporated herein by reference to Exhibit 10.2 of the registrant's Quarterly Report on Form 10-Q filed with the Commission on December 10, 2014, File No. 001-33866). | ||||||||
89
| No. | Description | |||||||
| Letter Agreement, dated December 6, 2023, to the Amended and Restated Wholesale Floor Plan Credit Facility and Security Agreement and Inventory Finance Agreement, dated November 13, 2007 and December 17, 2018 respectively, by and between Titan Machinery Inc. and CNH Industrial Capital America LLC (incorporated herein by reference to Exhibit 10.4 of the registrant’s Quarterly Report on Form 10-Q filed with the Commission on December 7, 2023). | ||||||||
| Inventory Finance Agreement, dated December 17, 2018, between CNH Industrial Capital Australia Pty Limited and J.J. O'Connor & Sons Pty Ltd. (incorporated herein by reference to Exhibit 10.4 of the registrant’s Quarterly Report on Form 10-Q filed with the Commission on December 7, 2023). | ||||||||
| Third Amendment, dated January 31, 2023, to the Amended and Restated Third Revolving Credit Agreement dated November 13, 2007 by and between the registrant and CNH Industrial Capital America LLC. | ||||||||
| Third Amended and Restated Credit Agreement, dated as of April 3, 2020, by and among the registrant, as Borrower, the financial institutions party thereto, as lenders, Bank of America, N.A., as Administrative Agent, Bank of American, N.A., Wells Fargo Bank N.A., and Regions Bank, as Joint Lead Arrangers and Joint Book Runners, Wells Fargo Bank, N.A., and Regions Bank, as Joint Syndication Agents, and BBVA USE as Documentation Agent (incorporated by reference to Exhibit 10.1 of the registrant's Quarterly Report on Form 10-Q filed with the Commission on June 4, 2020). | ||||||||
| Amendment dated June 4, 2021 to the Third Amended and Restated Credit Agreement, dated as of April 3, 2020, by and among the registrant, as Borrower, the financial institutions party thereto, as lenders, Bank of America, N.A., as Administrative Agent, Bank of American, N.A., Wells Fargo Bank N.A., and Regions Bank, as Joint Lead Arrangers and Joint Book Runners, Wells Fargo Bank, N.A., and Regions Bank, as Joint Syndication Agents, and BBVA USE as Documentation Agent (incorporated by reference to Exhibit 10.1 of the registrant's Quarterly Report on Form 10-Q filed with the Commission on September 3, 2021). | ||||||||
| Amendment No. 2 to Third Amended and Restated Credit Agreement, dated October 31, 2022, by and among Titan Machinery Inc., Heartland Agriculture, LLC, Heartland Ag Kansas, LLC and Bank of America, N.A. (incorporated herein by reference to Exhibit 10.1 of the registrant's Quarterly Report on Form 10-Q filed with the Commission on December 8, 2022). | ||||||||
| Amendment No. 3 to Third Amended and Restated Credit Agreement, dated September 1, 2023, by and among Titan Machinery Inc., Heartland Agriculture, LLC, Heartland Ag Kansas, LLC and Bank of America, N.A. (incorporated herein by reference to Exhibit 10.1 of the registrant's Quarterly Report on Form 10-Q filed with the Commission on September 7, 2023). | ||||||||
Joinder to Third Amended and Restated Credit Agreement, dated as of August 31, 2022, by and among Titan Machinery Inc., Heartland Agriculture, LLC, Heartland Ag Kansas, LLC and Bank of America, N.A. (incorporated herein by reference to Exhibit 10.5 of the registrant’s Quarterly Report on Form 10-Q filed with the Commission on September 9, 2022). | ||||||||
Joinder to Third Amended and Restated Guaranty and Security Agreement, dated as of August 31, 2022, by and among Titan Machinery Inc., Heartland Agriculture, LLC, Heartland Ag Kansas, LLC and Bank of America, N.A. (incorporated herein by reference to Exhibit 10.6 of the registrant’s Quarterly Report on Form 10-Q filed with the Commission on September 9, 2022). | ||||||||
| Amended and Restated Titan Machinery Inc. 2014 Equity Incentive Plan (incorporated herein by reference to Exhibit 10.1 to the registrant's Current Report on Form 8-K filed with the Commission on June 9, 2020).** | ||||||||
| Form of Titan Machinery Inc. Restricted Stock Agreement (for non-employee directors) under the Amended and Restated Titan Machinery Inc. 2014 Equity Incentive Plan (incorporated herein by reference to Exhibit 10.12.2 of the registrant's Quarterly Report on Form 10-K filed with the Commission on April 1, 2022).** | ||||||||
| Form of Titan Machinery Inc. Restricted Stock Agreement under the Amended and Restated Titan Machinery Inc. 2014 Equity Incentive Plan (incorporated herein by reference to Exhibit 10.3 of the registrant's Quarterly Report on Form 10-Q filed with the Commission on June 4, 2020).** | ||||||||
| Form of Titan Machinery Inc. Restricted Stock Unit Agreement under the Amended and Restated Titan Machinery Inc. 2014 Equity Incentive Plan (incorporated herein by reference to Exhibit 10.4 of the registrant's Quarterly Report on Form 10-Q filed with the Commission on June 4, 2020).** | ||||||||
| Form of Director and Officer Indemnification Agreement (incorporated herein by reference to Exhibit 10.19 of the registrant's Annual Report on Form 10-K with the Commission on April 5, 2019). | ||||||||
Titan Machinery Inc. Non-Employee Director Compensation Plan (incorporated herein by reference to Exhibit 10.20 of the registrant's Annual Report on Form 10-K with the Commission on April 1, 2022).** | ||||||||
90
| No. | Description | |||||||
| Description of Titan Machinery Inc.’s Executive Cash Bonus Plan (incorporated herein by reference to Exhibit 10.34 of the registrant’s Annual Report on Form 10-K filed with the Commission on April 15, 2015). ** | ||||||||
| Subsidiaries of Titan Machinery Inc. | ||||||||
| Consent of Deloitte & Touche LLP | ||||||||
| Power of Attorney | ||||||||
| Certification of Chief Executive Officer Pursuant to Section 302 of the Sarbanes-Oxley Act of 2002 | ||||||||
| Certification of Chief Financial Officer Pursuant to Section 302 of the Sarbanes-Oxley Act of 2002 | ||||||||
| Certification of Chief Executive Officer Pursuant to Section 906 of the Sarbanes-Oxley Act of 2002 | ||||||||
| Certification of Chief Financial Officer Pursuant to Section 906 of the Sarbanes-Oxley Act of 2002 | ||||||||
| Clawback Policy, dated as of September 7, 2023 | ||||||||
| 101* | The following materials from Titan Machinery Inc.'s Annual Report on Form 10-K for the year ended January 31, 2024 formatted in XBRL (Extensible Business Reporting Language): (i) the Consolidated Balance Sheets as of January 31, 2024 and 2023, (ii) the Consolidated Statements of Operations for the fiscal years ended January 31, 2024, 2023 and 2022, (iii) the Consolidated Statements of Comprehensive Income for the fiscal years ended January 31, 2024, 2023 and 2022, (iv) the Consolidated Statements of Stockholders' Equity for the fiscal years ended January 31, 2024, 2023 and 2022, (v) the Consolidated Statements of Cash Flows for the fiscal years ended January 31, 2024, 2023 and 2022, and (vi) the Notes to the Consolidated Financial Statements. | |||||||
| 101.SCH* | Inline XBRL Taxonomy Extension Schema Document | |||||||
| 101.CAL* | Inline XBRL Taxonomy Extension Calculation Linkbase Document | |||||||
| 101.LAB* | Inline XBRL Taxonomy Extension Label Linkbase Document | |||||||
| 101.PRE* | Inline XBRL Taxonomy Extension Presentation Linkbase Document | |||||||
| 101.DEF* | Inline XBRL Taxonomy Extension Definition Linkbase Document | |||||||
| 104 | Cover Page Interactive Data File (formatted as Inline XBRL and contained in Exhibit 101) | |||||||
______________________________________________________
* Filed herewith
** Indicates management contract or compensatory plan or arrangement.
ITEM 16. FORM 10-K SUMMARY
Not applicable.
91
SIGNATURES
Pursuant to the requirements of Section 13 or 15(d) of the Securities Exchange Act of 1934, the registrant has duly caused this report to be signed on its behalf by the undersigned, thereunto duly authorized.
Dated: April 3, 2024
TITAN MACHINERY INC.
| By | /s/BRYAN KNUTSON | By | /s/ ROBERT LARSEN | |||||||||||||||||
Bryan Knutson, President and Chief Executive Officer | Robert Larsen, Chief Financial Officer | |||||||||||||||||||
Pursuant to the requirements of the Securities Exchange Act of 1934, this report has been signed below by the following persons on behalf of the registrant and in the capacities and on the dates indicated:
| Signature | Title | Date | |||||||||
| /s/ BRYAN KNUTSON | President, Chief Executive Officer (principal executive officer) and Director | April 3, 2024 | |||||||||
| Bryan Knutson | |||||||||||
| /s/ ROBERT LARSEN | Chief Financial Officer (principal financial officer and principal accounting officer) | April 3, 2024 | |||||||||
| Robert Larsen | |||||||||||
| * | Executive Chairman of the Board of Directors | April 3, 2024 | |||||||||
| David J. Meyer | |||||||||||
| * | Director | ||||||||||
| Frank Anglin III | April 3, 2024 | ||||||||||
| * | Director | ||||||||||
| Tony Christianson | April 3, 2024 | ||||||||||
| * | Director | ||||||||||
| Stan Erickson | April 3, 2024 | ||||||||||
| * | Director | ||||||||||
| Christine Hamilton | April 3, 2024 | ||||||||||
| * | Director | ||||||||||
| Jody Horner | April 3, 2024 | ||||||||||
| * | Director | ||||||||||
Richard Lewis | April 3, 2024 | ||||||||||
| * | Director | ||||||||||
| Richard Mack | April 3, 2024 | ||||||||||
| *By | /s/ ROBERT LARSEN | ||||||||||
| Robert Larsen, Attorney-in-Fact | |||||||||||
92